Humboldt, IA Map & Demographics
Humboldt Map

Humboldt Overview
$37,378
PER CAPITA INCOME
$81,761
AVG FAMILY INCOME
$68,085
AVG HOUSEHOLD INCOME
40.1%
WAGE / INCOME GAP [ % ]
59.9¢/ $1
WAGE / INCOME GAP [ $ ]
0.44
INEQUALITY / GINI INDEX
4,774
TOTAL POPULATION
2,425
MALE POPULATION
2,349
FEMALE POPULATION
103.24
MALES / 100 FEMALES
96.87
FEMALES / 100 MALES
41.9
MEDIAN AGE
2.8
AVG FAMILY SIZE
2.1
AVG HOUSEHOLD SIZE
2,271
LABOR FORCE [ PEOPLE ]
60.6%
PERCENT IN LABOR FORCE
0.7%
UNEMPLOYMENT RATE
Humboldt Zip Codes
Humboldt Area Codes
Income in Humboldt
Income Overview in Humboldt
Per Capita Income in Humboldt is $37,378, while median incomes of families and households are $81,761 and $68,085 respectively.
| Characteristic | Number | Measure |
| Per Capita Income | 4,774 | $37,378 |
| Median Family Income | 1,226 | $81,761 |
| Mean Family Income | 1,226 | $104,872 |
| Median Household Income | 2,172 | $68,085 |
| Mean Household Income | 2,172 | $81,409 |
| Income Deficit | 1,226 | $0 |
| Wage / Income Gap (%) | 4,774 | 40.12% |
| Wage / Income Gap ($) | 4,774 | 59.88¢ per $1 |
| Gini / Inequality Index | 4,774 | 0.44 |
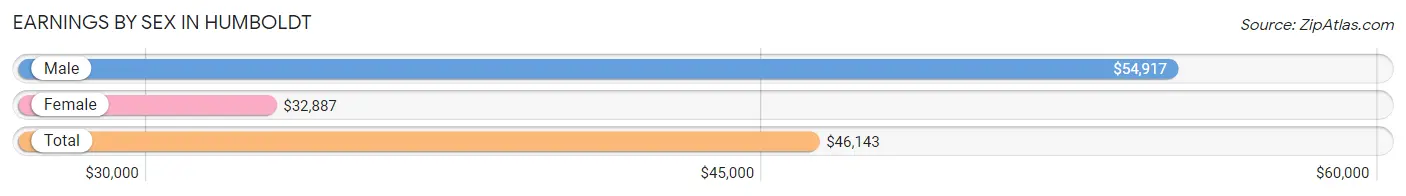
Earnings by Sex in Humboldt
Average Earnings in Humboldt are $46,143, $54,917 for men and $32,887 for women, a difference of 40.1%.
| Sex | Number | Average Earnings |
| Male | 1,287 (53.6%) | $54,917 |
| Female | 1,113 (46.4%) | $32,887 |
| Total | 2,400 (100.0%) | $46,143 |
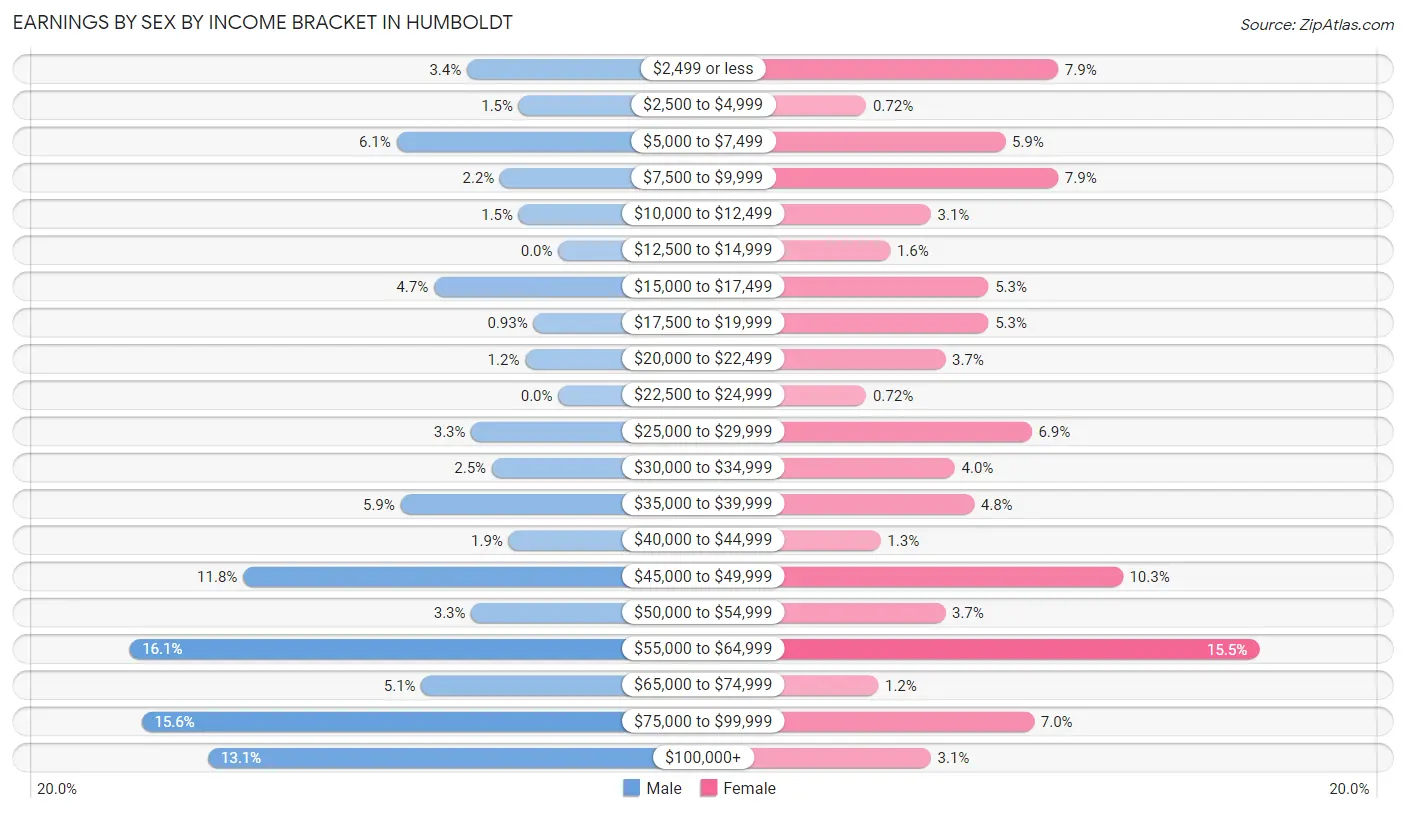
Earnings by Sex by Income Bracket in Humboldt
The most common earnings brackets in Humboldt are $55,000 to $64,999 for men (207 | 16.1%) and $55,000 to $64,999 for women (172 | 15.4%).
| Income | Male | Female |
| $2,499 or less | 44 (3.4%) | 88 (7.9%) |
| $2,500 to $4,999 | 19 (1.5%) | 8 (0.7%) |
| $5,000 to $7,499 | 78 (6.1%) | 66 (5.9%) |
| $7,500 to $9,999 | 28 (2.2%) | 88 (7.9%) |
| $10,000 to $12,499 | 19 (1.5%) | 35 (3.1%) |
| $12,500 to $14,999 | 0 (0.0%) | 18 (1.6%) |
| $15,000 to $17,499 | 60 (4.7%) | 59 (5.3%) |
| $17,500 to $19,999 | 12 (0.9%) | 59 (5.3%) |
| $20,000 to $22,499 | 16 (1.2%) | 41 (3.7%) |
| $22,500 to $24,999 | 0 (0.0%) | 8 (0.7%) |
| $25,000 to $29,999 | 42 (3.3%) | 77 (6.9%) |
| $30,000 to $34,999 | 32 (2.5%) | 45 (4.0%) |
| $35,000 to $39,999 | 76 (5.9%) | 53 (4.8%) |
| $40,000 to $44,999 | 24 (1.9%) | 14 (1.3%) |
| $45,000 to $49,999 | 152 (11.8%) | 115 (10.3%) |
| $50,000 to $54,999 | 42 (3.3%) | 41 (3.7%) |
| $55,000 to $64,999 | 207 (16.1%) | 172 (15.4%) |
| $65,000 to $74,999 | 66 (5.1%) | 13 (1.2%) |
| $75,000 to $99,999 | 201 (15.6%) | 78 (7.0%) |
| $100,000+ | 169 (13.1%) | 35 (3.1%) |
| Total | 1,287 (100.0%) | 1,113 (100.0%) |
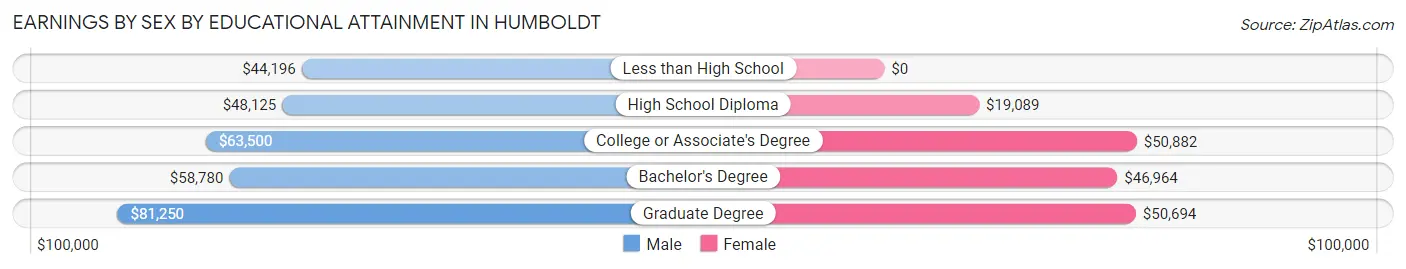
Earnings by Sex by Educational Attainment in Humboldt
Average earnings in Humboldt are $56,530 for men and $34,256 for women, a difference of 39.4%. Men with an educational attainment of graduate degree enjoy the highest average annual earnings of $81,250, while those with less than high school education earn the least with $44,196. Women with an educational attainment of college or associate's degree earn the most with the average annual earnings of $50,882, while those with high school diploma education have the smallest earnings of $19,089.
| Educational Attainment | Male Income | Female Income |
| Less than High School | $44,196 | $0 |
| High School Diploma | $48,125 | $19,089 |
| College or Associate's Degree | $63,500 | $50,882 |
| Bachelor's Degree | $58,780 | $46,964 |
| Graduate Degree | $81,250 | $50,694 |
| Total | $56,530 | $34,256 |
Family Income in Humboldt
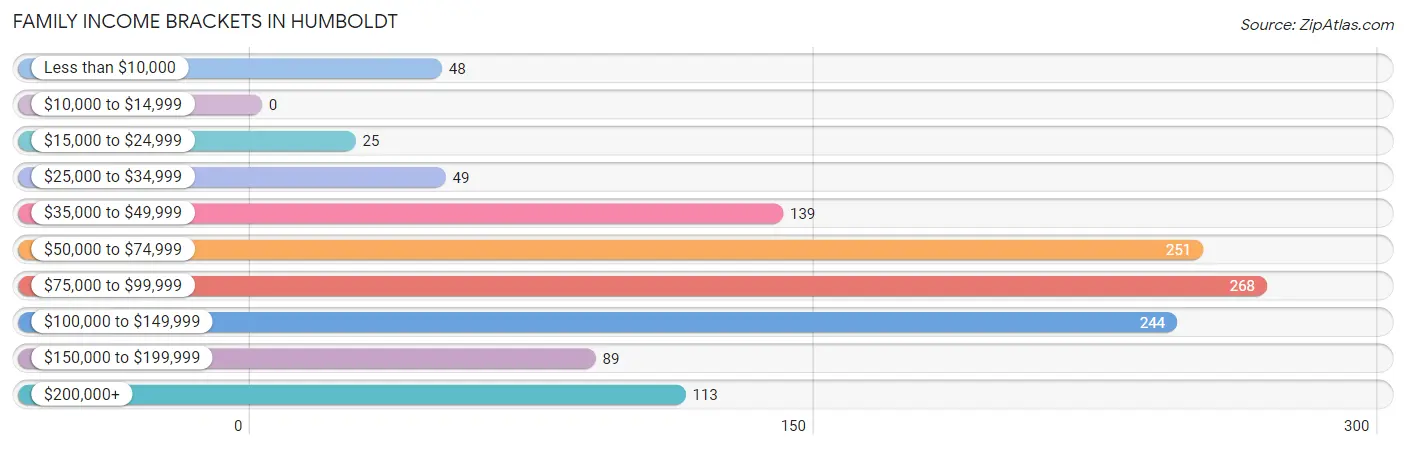
Family Income Brackets in Humboldt
According to the Humboldt family income data, there are 268 families falling into the $75,000 to $99,999 income range, which is the most common income bracket and makes up 21.9% of all families.
| Income Bracket | # Families | % Families |
| Less than $10,000 | 48 | 3.9% |
| $10,000 to $14,999 | 0 | 0.0% |
| $15,000 to $24,999 | 25 | 2.0% |
| $25,000 to $34,999 | 49 | 4.0% |
| $35,000 to $49,999 | 139 | 11.3% |
| $50,000 to $74,999 | 251 | 20.5% |
| $75,000 to $99,999 | 268 | 21.9% |
| $100,000 to $149,999 | 244 | 19.9% |
| $150,000 to $199,999 | 89 | 7.3% |
| $200,000+ | 113 | 9.2% |
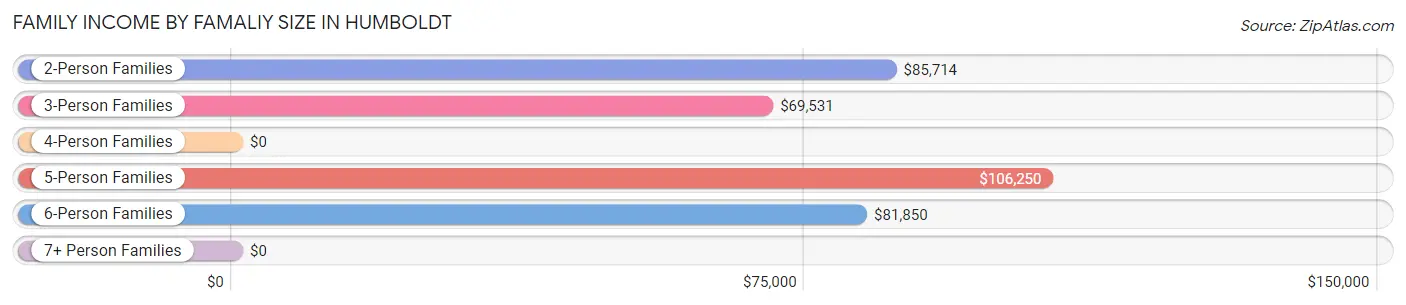
Family Income by Famaliy Size in Humboldt
5-person families (137 | 11.2%) account for the highest median family income in Humboldt with $106,250 per family, while 2-person families (738 | 60.2%) have the highest median income of $42,857 per family member.
| Income Bracket | # Families | Median Income |
| 2-Person Families | 738 (60.2%) | $85,714 |
| 3-Person Families | 218 (17.8%) | $69,531 |
| 4-Person Families | 96 (7.8%) | $0 |
| 5-Person Families | 137 (11.2%) | $106,250 |
| 6-Person Families | 37 (3.0%) | $81,850 |
| 7+ Person Families | 0 (0.0%) | $0 |
| Total | 1,226 (100.0%) | $81,761 |
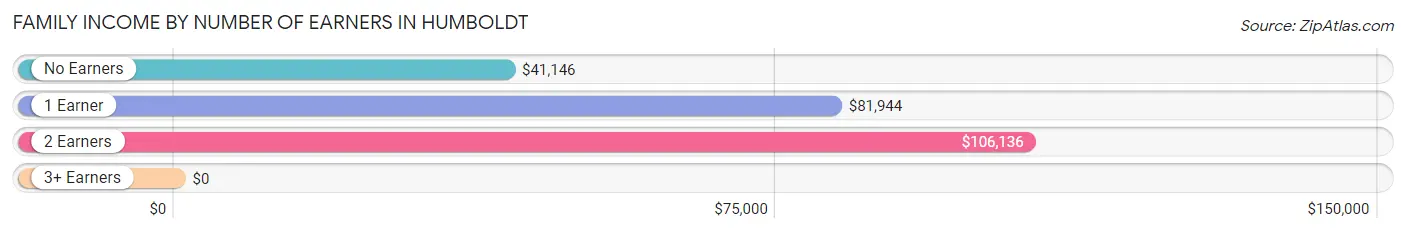
Family Income by Number of Earners in Humboldt
| Number of Earners | # Families | Median Income |
| No Earners | 244 (19.9%) | $41,146 |
| 1 Earner | 442 (36.0%) | $81,944 |
| 2 Earners | 494 (40.3%) | $106,136 |
| 3+ Earners | 46 (3.7%) | $0 |
| Total | 1,226 (100.0%) | $81,761 |
Household Income in Humboldt
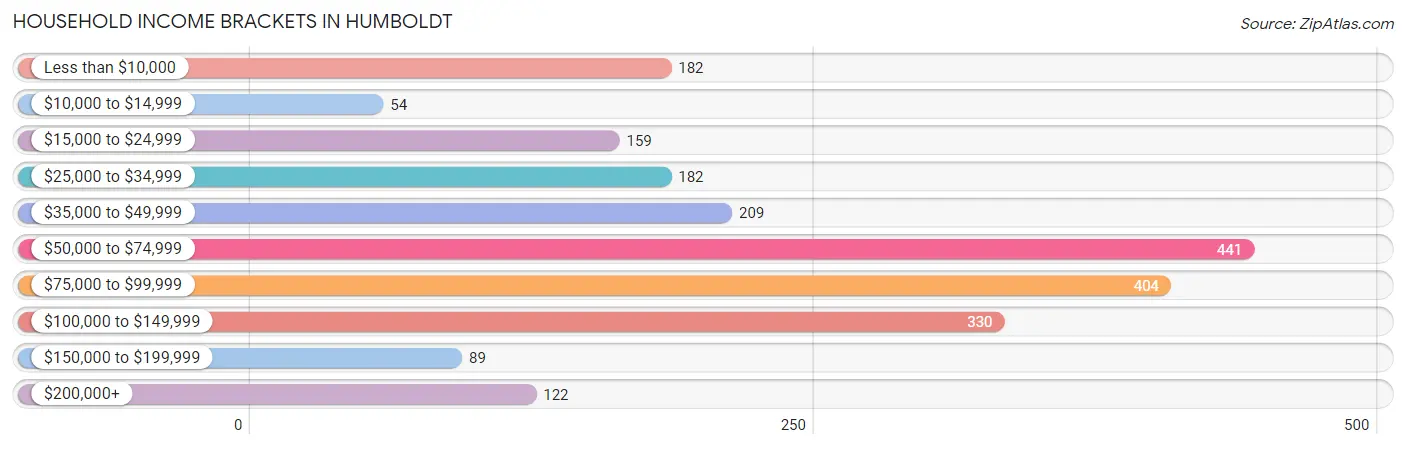
Household Income Brackets in Humboldt
With 441 households falling in the category, the $50,000 to $74,999 income range is the most frequent in Humboldt, accounting for 20.3% of all households. In contrast, only 54 households (2.5%) fall into the $10,000 to $14,999 income bracket, making it the least populous group.
| Income Bracket | # Households | % Households |
| Less than $10,000 | 182 | 8.4% |
| $10,000 to $14,999 | 54 | 2.5% |
| $15,000 to $24,999 | 159 | 7.3% |
| $25,000 to $34,999 | 182 | 8.4% |
| $35,000 to $49,999 | 209 | 9.6% |
| $50,000 to $74,999 | 441 | 20.3% |
| $75,000 to $99,999 | 404 | 18.6% |
| $100,000 to $149,999 | 330 | 15.2% |
| $150,000 to $199,999 | 89 | 4.1% |
| $200,000+ | 122 | 5.6% |
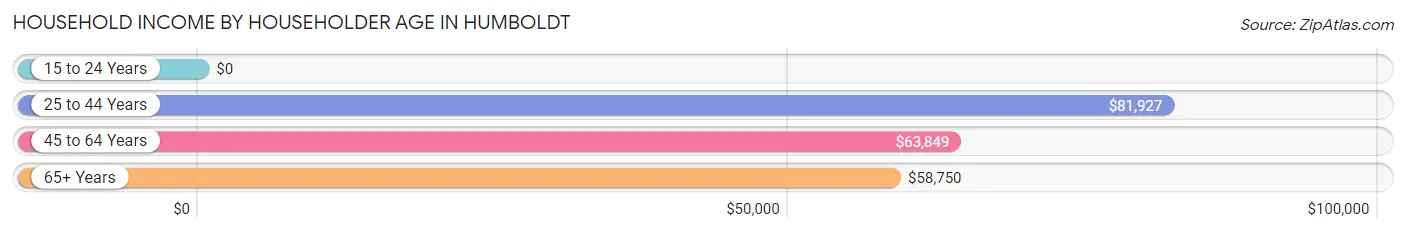
Household Income by Householder Age in Humboldt
The median household income in Humboldt is $68,085, with the highest median household income of $81,927 found in the 25 to 44 years age bracket for the primary householder. A total of 676 households (31.1%) fall into this category. Meanwhile, the 15 to 24 years age bracket for the primary householder has the lowest median household income of $0, with 124 households (5.7%) in this group.
| Income Bracket | # Households | Median Income |
| 15 to 24 Years | 124 (5.7%) | $0 |
| 25 to 44 Years | 676 (31.1%) | $81,927 |
| 45 to 64 Years | 681 (31.4%) | $63,849 |
| 65+ Years | 691 (31.8%) | $58,750 |
| Total | 2,172 (100.0%) | $68,085 |
Poverty in Humboldt
Income Below Poverty by Sex and Age in Humboldt
With 12.3% poverty level for males and 14.2% for females among the residents of Humboldt, 16 and 17 year old males and 6 to 11 year old females are the most vulnerable to poverty, with 1 males (100.0%) and 84 females (43.1%) in their respective age groups living below the poverty level.
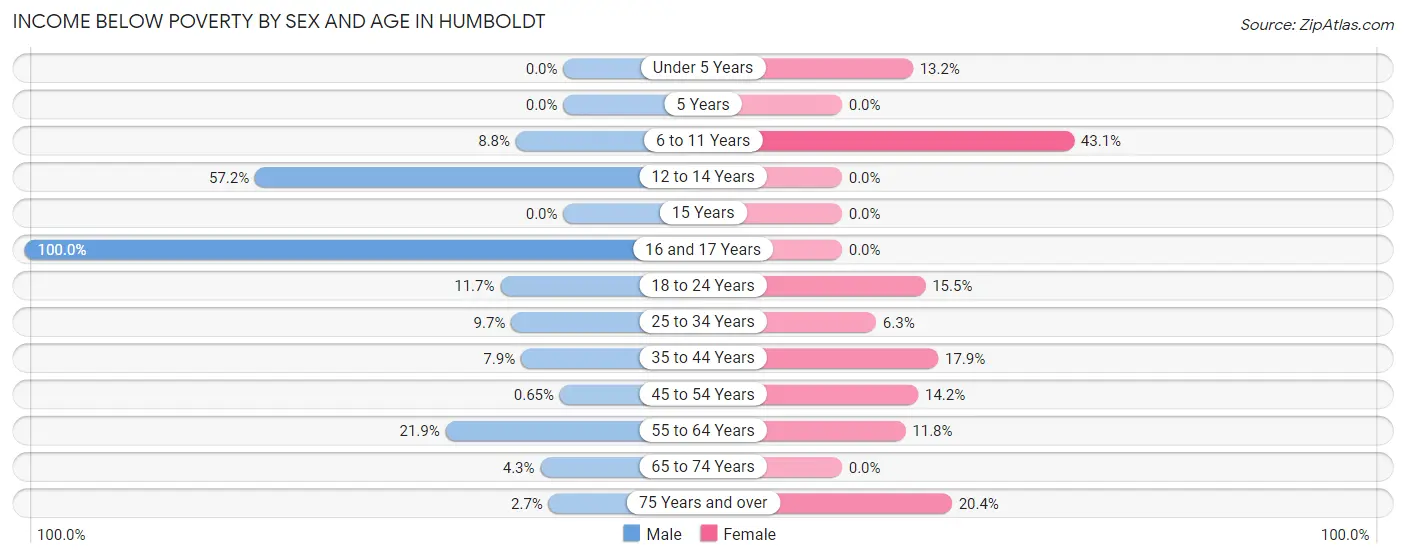
| Age Bracket | Male | Female |
| Under 5 Years | 0 (0.0%) | 15 (13.2%) |
| 5 Years | 0 (0.0%) | 0 (0.0%) |
| 6 to 11 Years | 18 (8.8%) | 84 (43.1%) |
| 12 to 14 Years | 99 (57.2%) | 0 (0.0%) |
| 15 Years | 0 (0.0%) | 0 (0.0%) |
| 16 and 17 Years | 1 (100.0%) | 0 (0.0%) |
| 18 to 24 Years | 22 (11.7%) | 22 (15.5%) |
| 25 to 34 Years | 29 (9.7%) | 15 (6.3%) |
| 35 to 44 Years | 22 (7.9%) | 50 (17.9%) |
| 45 to 54 Years | 1 (0.6%) | 30 (14.1%) |
| 55 to 64 Years | 82 (21.9%) | 40 (11.8%) |
| 65 to 74 Years | 12 (4.3%) | 0 (0.0%) |
| 75 Years and over | 5 (2.7%) | 71 (20.4%) |
| Total | 291 (12.3%) | 327 (14.2%) |
Income Above Poverty by Sex and Age in Humboldt
According to the poverty statistics in Humboldt, males aged under 5 years and females aged 5 years are the age groups that are most secure financially, with 100.0% of males and 100.0% of females in these age groups living above the poverty line.
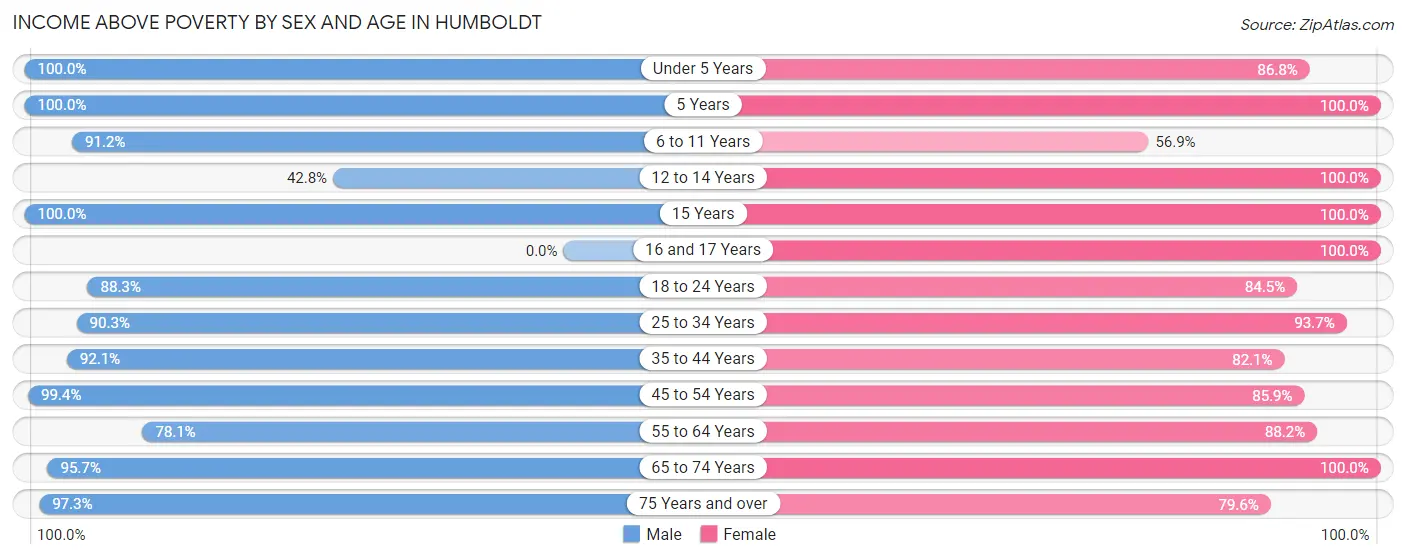
| Age Bracket | Male | Female |
| Under 5 Years | 152 (100.0%) | 99 (86.8%) |
| 5 Years | 30 (100.0%) | 25 (100.0%) |
| 6 to 11 Years | 186 (91.2%) | 111 (56.9%) |
| 12 to 14 Years | 74 (42.8%) | 59 (100.0%) |
| 15 Years | 38 (100.0%) | 35 (100.0%) |
| 16 and 17 Years | 0 (0.0%) | 40 (100.0%) |
| 18 to 24 Years | 166 (88.3%) | 120 (84.5%) |
| 25 to 34 Years | 271 (90.3%) | 222 (93.7%) |
| 35 to 44 Years | 258 (92.1%) | 230 (82.1%) |
| 45 to 54 Years | 154 (99.4%) | 182 (85.9%) |
| 55 to 64 Years | 293 (78.1%) | 299 (88.2%) |
| 65 to 74 Years | 270 (95.7%) | 283 (100.0%) |
| 75 Years and over | 179 (97.3%) | 277 (79.6%) |
| Total | 2,071 (87.7%) | 1,982 (85.8%) |
Income Below Poverty Among Married-Couple Families in Humboldt
The poverty statistics for married-couple families in Humboldt show that 0.7% or 6 of the total 895 families live below the poverty line. Families with no children have the highest poverty rate of 1.0%, comprising of 6 families. On the other hand, families with 1 or 2 children have the lowest poverty rate of 0.0%, which includes 0 families.
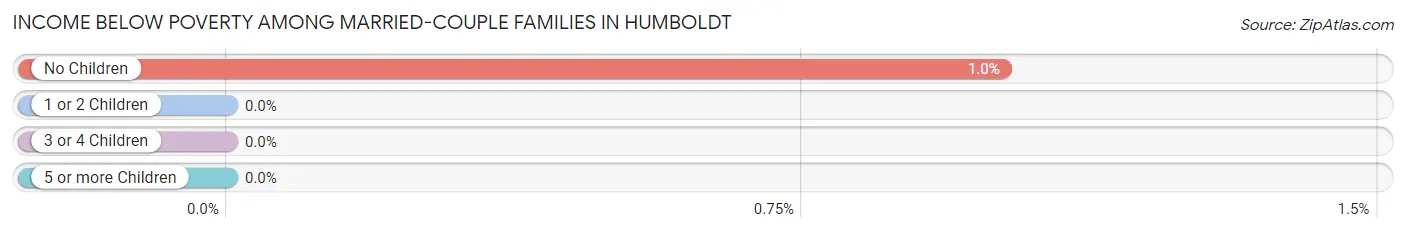
| Children | Above Poverty | Below Poverty |
| No Children | 590 (99.0%) | 6 (1.0%) |
| 1 or 2 Children | 193 (100.0%) | 0 (0.0%) |
| 3 or 4 Children | 106 (100.0%) | 0 (0.0%) |
| 5 or more Children | 0 (0.0%) | 0 (0.0%) |
| Total | 889 (99.3%) | 6 (0.7%) |
Income Below Poverty Among Single-Parent Households in Humboldt
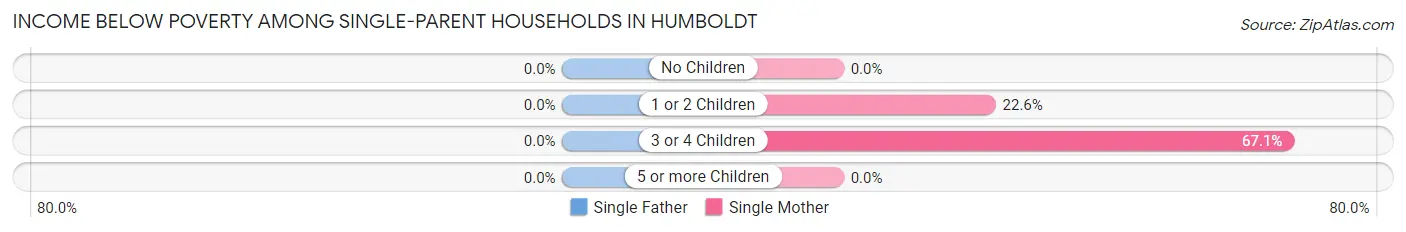
| Children | Single Father | Single Mother |
| No Children | 0 (0.0%) | 0 (0.0%) |
| 1 or 2 Children | 0 (0.0%) | 12 (22.6%) |
| 3 or 4 Children | 0 (0.0%) | 49 (67.1%) |
| 5 or more Children | 0 (0.0%) | 0 (0.0%) |
| Total | 0 (0.0%) | 61 (32.5%) |
Income Below Poverty Among Married-Couple vs Single-Parent Households in Humboldt
The poverty data for Humboldt shows that 6 of the married-couple family households (0.7%) and 61 of the single-parent households (18.4%) are living below the poverty level. Within the married-couple family households, those with no children have the highest poverty rate, with 6 households (1.0%) falling below the poverty line. Among the single-parent households, those with 3 or 4 children have the highest poverty rate, with 49 household (51.0%) living below poverty.
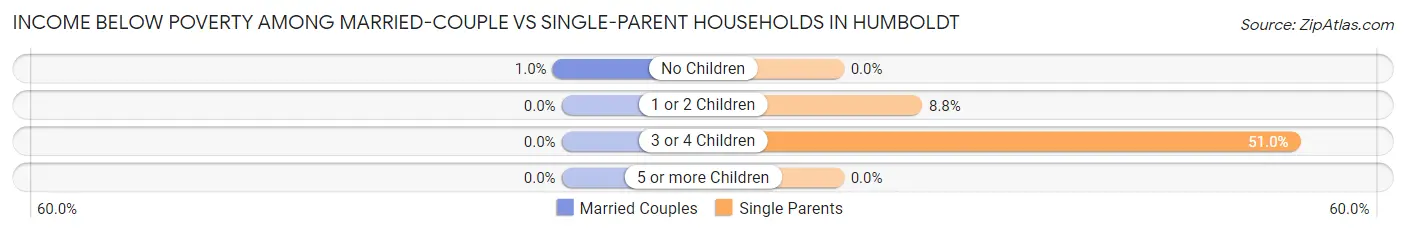
| Children | Married-Couple Families | Single-Parent Households |
| No Children | 6 (1.0%) | 0 (0.0%) |
| 1 or 2 Children | 0 (0.0%) | 12 (8.8%) |
| 3 or 4 Children | 0 (0.0%) | 49 (51.0%) |
| 5 or more Children | 0 (0.0%) | 0 (0.0%) |
| Total | 6 (0.7%) | 61 (18.4%) |
Race in Humboldt
The most populous races in Humboldt are White / Caucasian (4,596 | 96.3%), Hispanic or Latino (210 | 4.4%), and Two or more Races (108 | 2.3%).
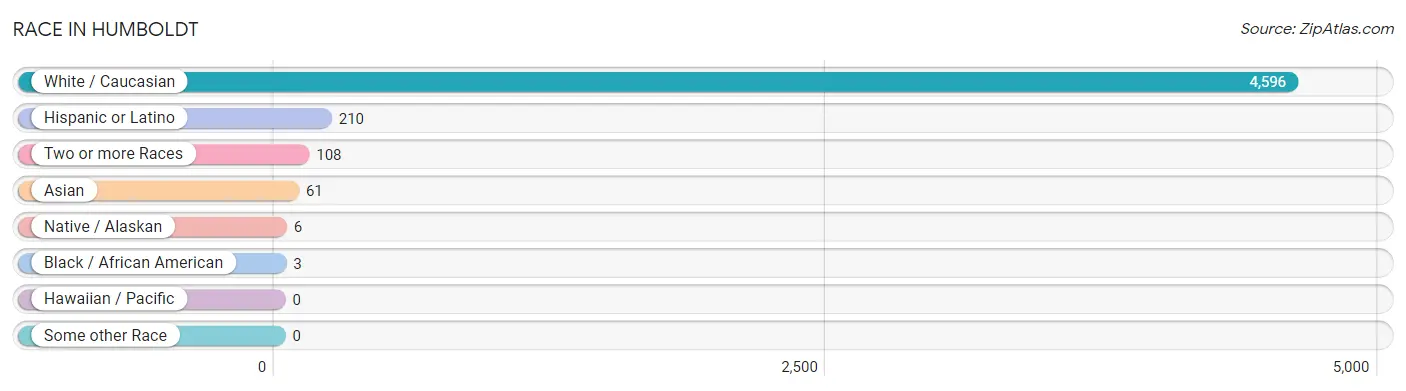
| Race | # Population | % Population |
| Asian | 61 | 1.3% |
| Black / African American | 3 | 0.1% |
| Hawaiian / Pacific | 0 | 0.0% |
| Hispanic or Latino | 210 | 4.4% |
| Native / Alaskan | 6 | 0.1% |
| White / Caucasian | 4,596 | 96.3% |
| Two or more Races | 108 | 2.3% |
| Some other Race | 0 | 0.0% |
| Total | 4,774 | 100.0% |
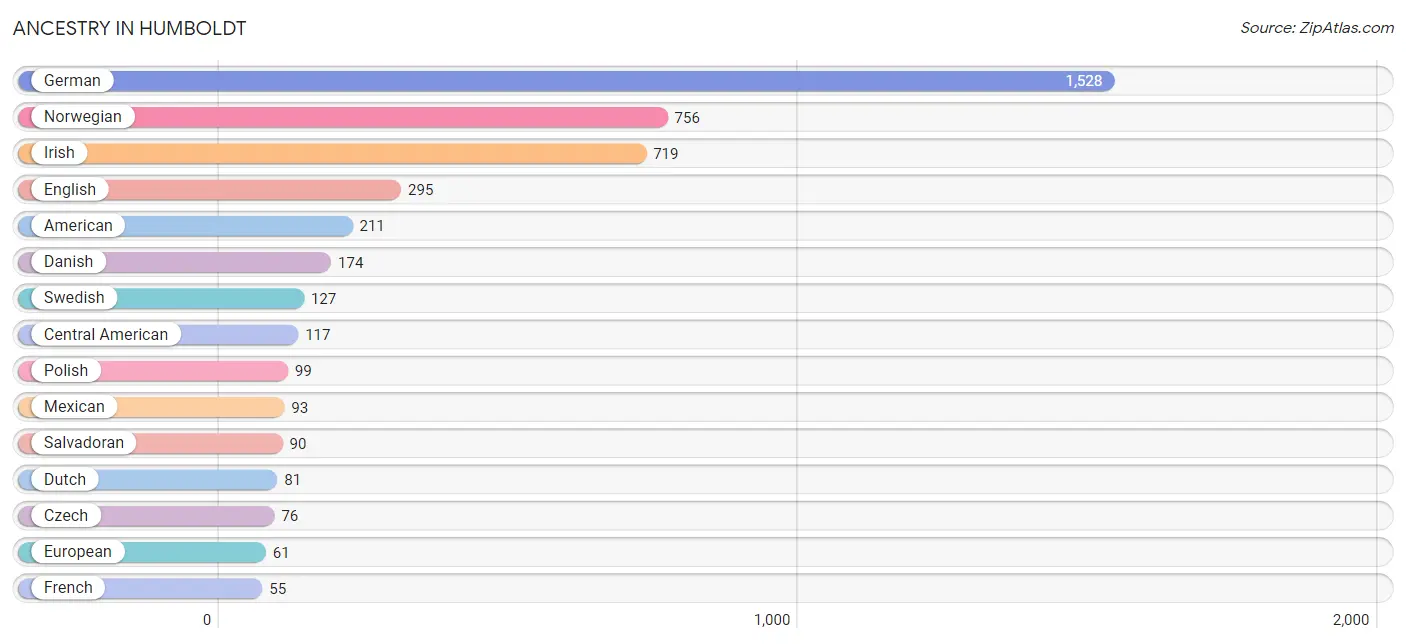
Ancestry in Humboldt
The most populous ancestries reported in Humboldt are German (1,528 | 32.0%), Norwegian (756 | 15.8%), Irish (719 | 15.1%), English (295 | 6.2%), and American (211 | 4.4%), together accounting for 73.5% of all Humboldt residents.
| Ancestry | # Population | % Population |
| African | 1 | 0.0% |
| American | 211 | 4.4% |
| Burmese | 30 | 0.6% |
| Central American | 117 | 2.5% |
| Czech | 76 | 1.6% |
| Danish | 174 | 3.6% |
| Dutch | 81 | 1.7% |
| Eastern European | 8 | 0.2% |
| English | 295 | 6.2% |
| European | 61 | 1.3% |
| French | 55 | 1.1% |
| German | 1,528 | 32.0% |
| Guatemalan | 27 | 0.6% |
| Irish | 719 | 15.1% |
| Italian | 17 | 0.4% |
| Luxembourger | 30 | 0.6% |
| Malaysian | 14 | 0.3% |
| Mexican | 93 | 1.9% |
| Navajo | 1 | 0.0% |
| Norwegian | 756 | 15.8% |
| Polish | 99 | 2.1% |
| Russian | 18 | 0.4% |
| Salvadoran | 90 | 1.9% |
| Scandinavian | 29 | 0.6% |
| Scottish | 29 | 0.6% |
| Subsaharan African | 1 | 0.0% |
| Swedish | 127 | 2.7% |
| Swiss | 17 | 0.4% |
| Welsh | 54 | 1.1% | View All 29 Rows |
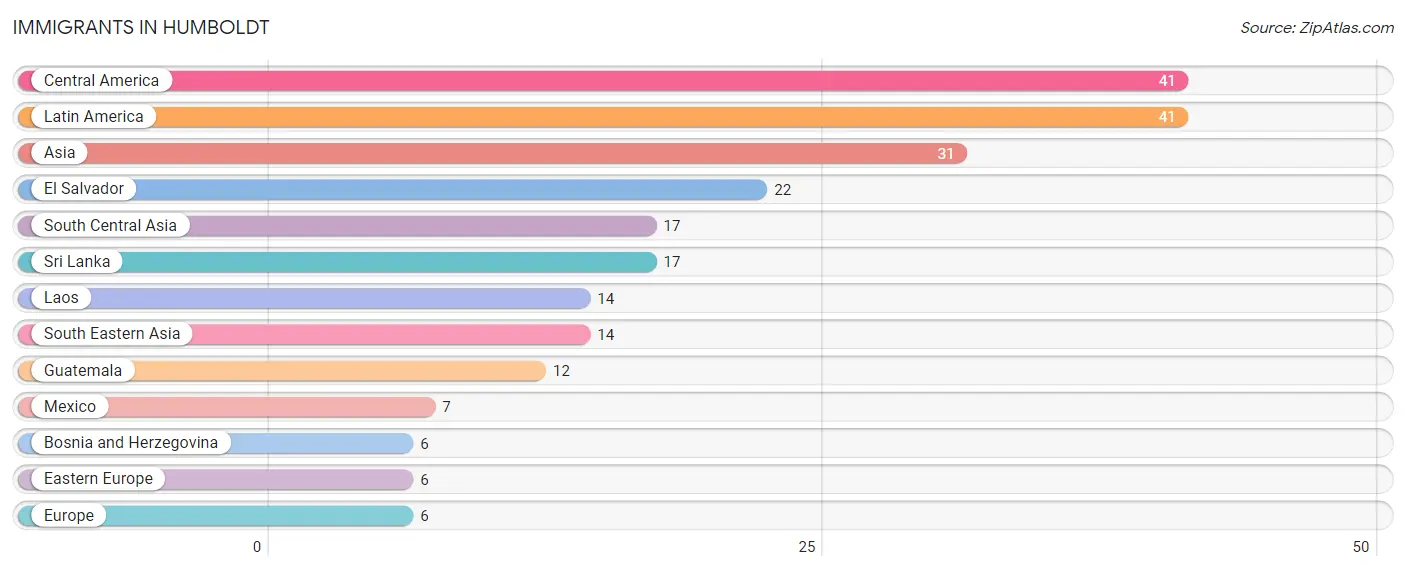
Immigrants in Humboldt
The most numerous immigrant groups reported in Humboldt came from Central America (41 | 0.9%), Latin America (41 | 0.9%), Asia (31 | 0.6%), El Salvador (22 | 0.5%), and South Central Asia (17 | 0.4%), together accounting for 3.2% of all Humboldt residents.
| Immigration Origin | # Population | % Population |
| Asia | 31 | 0.6% |
| Bosnia and Herzegovina | 6 | 0.1% |
| Central America | 41 | 0.9% |
| Eastern Europe | 6 | 0.1% |
| El Salvador | 22 | 0.5% |
| Europe | 6 | 0.1% |
| Guatemala | 12 | 0.3% |
| Laos | 14 | 0.3% |
| Latin America | 41 | 0.9% |
| Mexico | 7 | 0.2% |
| South Central Asia | 17 | 0.4% |
| South Eastern Asia | 14 | 0.3% |
| Sri Lanka | 17 | 0.4% | View All 13 Rows |
Sex and Age in Humboldt
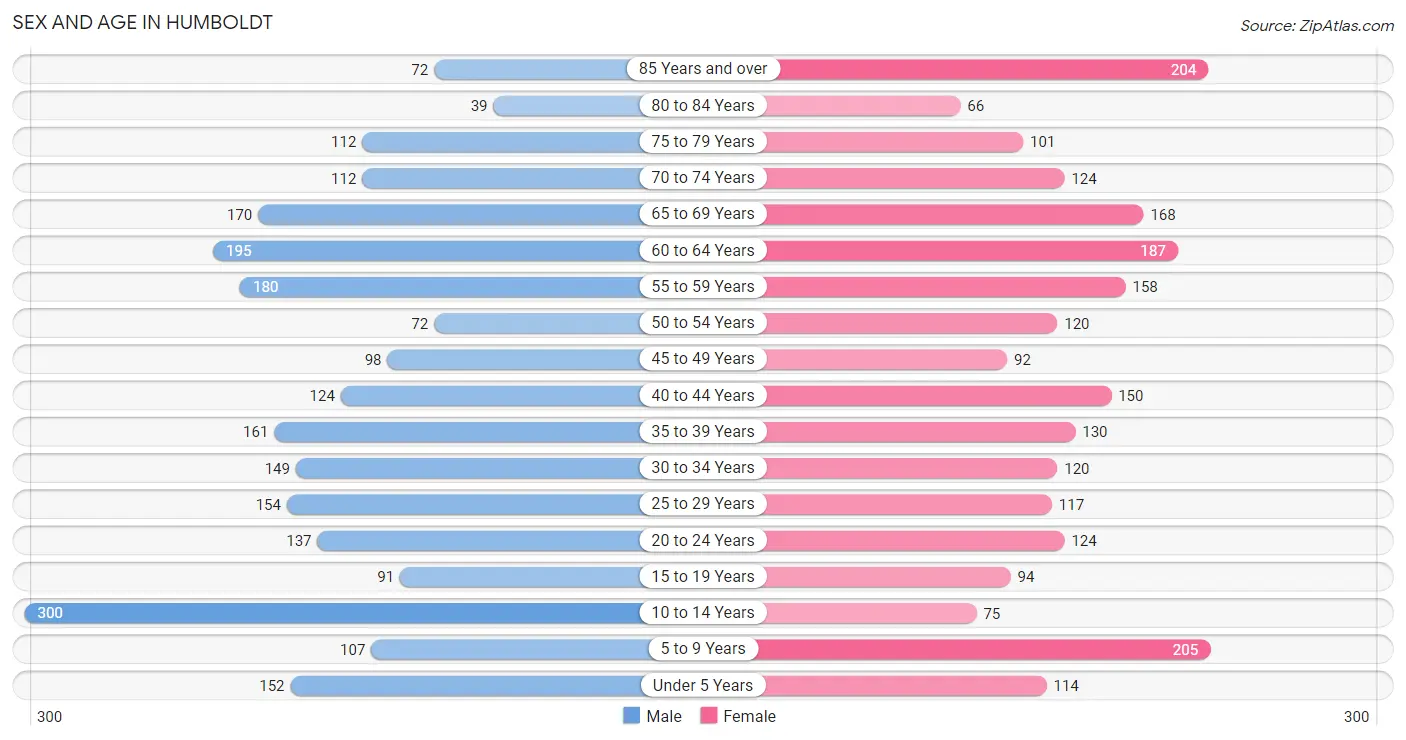
Sex and Age in Humboldt
The most populous age groups in Humboldt are 10 to 14 Years (300 | 12.4%) for men and 5 to 9 Years (205 | 8.7%) for women.
| Age Bracket | Male | Female |
| Under 5 Years | 152 (6.3%) | 114 (4.9%) |
| 5 to 9 Years | 107 (4.4%) | 205 (8.7%) |
| 10 to 14 Years | 300 (12.4%) | 75 (3.2%) |
| 15 to 19 Years | 91 (3.7%) | 94 (4.0%) |
| 20 to 24 Years | 137 (5.7%) | 124 (5.3%) |
| 25 to 29 Years | 154 (6.4%) | 117 (5.0%) |
| 30 to 34 Years | 149 (6.1%) | 120 (5.1%) |
| 35 to 39 Years | 161 (6.6%) | 130 (5.5%) |
| 40 to 44 Years | 124 (5.1%) | 150 (6.4%) |
| 45 to 49 Years | 98 (4.0%) | 92 (3.9%) |
| 50 to 54 Years | 72 (3.0%) | 120 (5.1%) |
| 55 to 59 Years | 180 (7.4%) | 158 (6.7%) |
| 60 to 64 Years | 195 (8.0%) | 187 (8.0%) |
| 65 to 69 Years | 170 (7.0%) | 168 (7.1%) |
| 70 to 74 Years | 112 (4.6%) | 124 (5.3%) |
| 75 to 79 Years | 112 (4.6%) | 101 (4.3%) |
| 80 to 84 Years | 39 (1.6%) | 66 (2.8%) |
| 85 Years and over | 72 (3.0%) | 204 (8.7%) |
| Total | 2,425 (100.0%) | 2,349 (100.0%) |
Families and Households in Humboldt
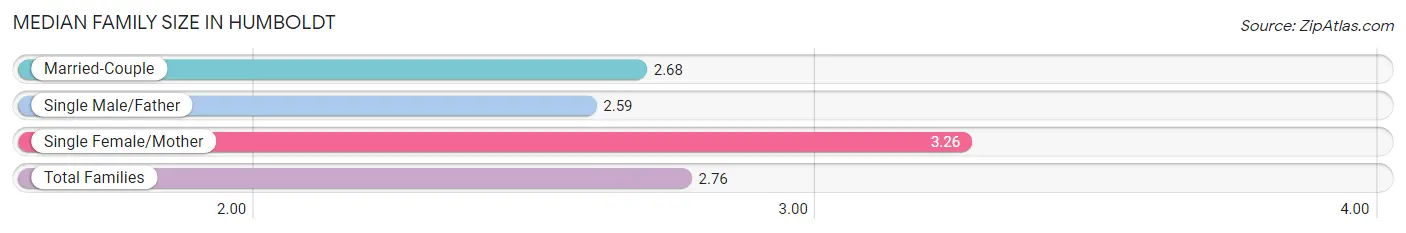
Median Family Size in Humboldt
The median family size in Humboldt is 2.76 persons per family, with single female/mother families (188 | 15.3%) accounting for the largest median family size of 3.26 persons per family. On the other hand, single male/father families (143 | 11.7%) represent the smallest median family size with 2.59 persons per family.
| Family Type | # Families | Family Size |
| Married-Couple | 895 (73.0%) | 2.68 |
| Single Male/Father | 143 (11.7%) | 2.59 |
| Single Female/Mother | 188 (15.3%) | 3.26 |
| Total Families | 1,226 (100.0%) | 2.76 |
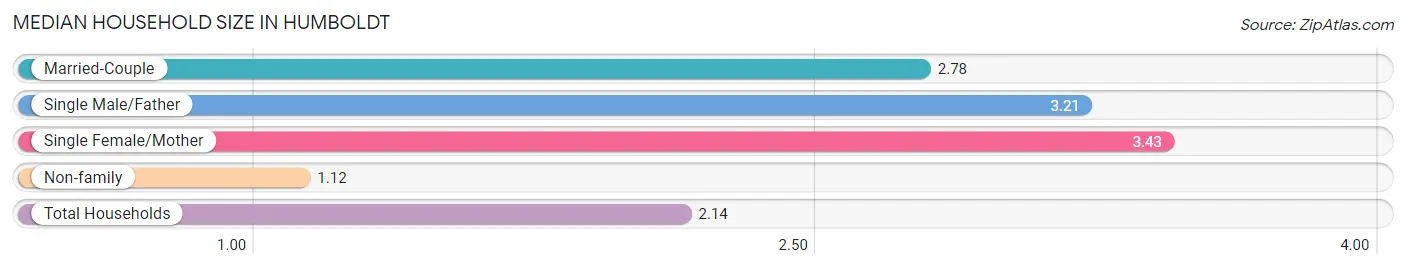
Median Household Size in Humboldt
The median household size in Humboldt is 2.14 persons per household, with single female/mother households (188 | 8.7%) accounting for the largest median household size of 3.43 persons per household. non-family households (946 | 43.5%) represent the smallest median household size with 1.12 persons per household.
| Household Type | # Households | Household Size |
| Married-Couple | 895 (41.2%) | 2.78 |
| Single Male/Father | 143 (6.6%) | 3.21 |
| Single Female/Mother | 188 (8.7%) | 3.43 |
| Non-family | 946 (43.5%) | 1.12 |
| Total Households | 2,172 (100.0%) | 2.14 |
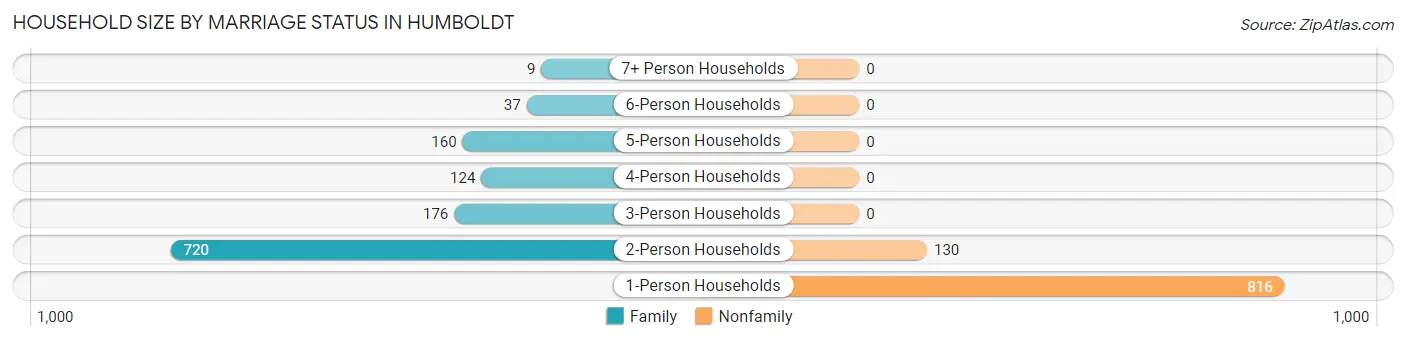
Household Size by Marriage Status in Humboldt
Out of a total of 2,172 households in Humboldt, 1,226 (56.5%) are family households, while 946 (43.5%) are nonfamily households. The most numerous type of family households are 2-person households, comprising 720, and the most common type of nonfamily households are 1-person households, comprising 816.
| Household Size | Family Households | Nonfamily Households |
| 1-Person Households | - | 816 (37.6%) |
| 2-Person Households | 720 (33.2%) | 130 (6.0%) |
| 3-Person Households | 176 (8.1%) | 0 (0.0%) |
| 4-Person Households | 124 (5.7%) | 0 (0.0%) |
| 5-Person Households | 160 (7.4%) | 0 (0.0%) |
| 6-Person Households | 37 (1.7%) | 0 (0.0%) |
| 7+ Person Households | 9 (0.4%) | 0 (0.0%) |
| Total | 1,226 (56.5%) | 946 (43.5%) |
Female Fertility in Humboldt
Fertility by Age in Humboldt
Average fertility rate in Humboldt is 80.0 births per 1,000 women. Women in the age bracket of 35 to 50 years have the highest fertility rate with 104.0 births per 1,000 women. Women in the age bracket of 35 to 50 years acount for 60.3% of all women with births.
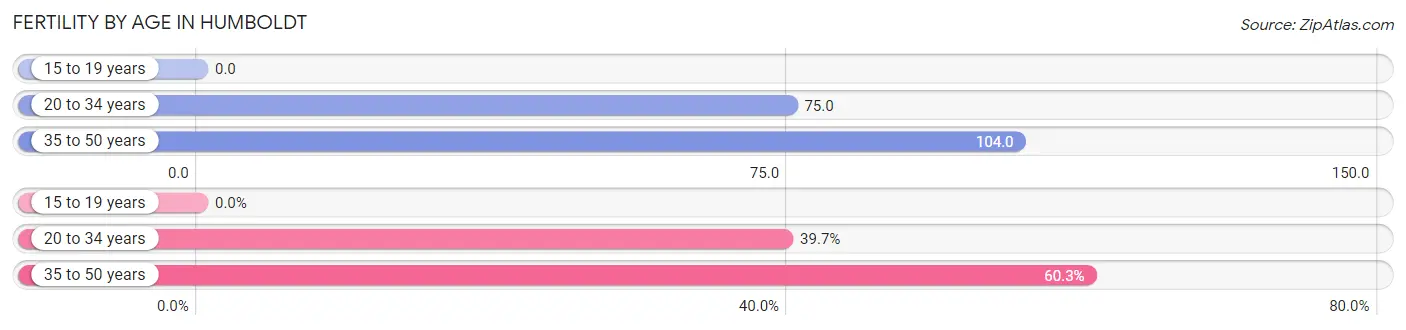
| Age Bracket | Women with Births | Births / 1,000 Women |
| 15 to 19 years | 0 (0.0%) | 0.0 |
| 20 to 34 years | 27 (39.7%) | 75.0 |
| 35 to 50 years | 41 (60.3%) | 104.0 |
| Total | 68 (100.0%) | 80.0 |
Fertility by Age by Marriage Status in Humboldt
39.7% of women with births (68) in Humboldt are married. The highest percentage of unmarried women with births falls into 35 to 50 years age bracket with 100.0% of them unmarried at the time of birth, while the lowest percentage of unmarried women with births belong to 20 to 34 years age bracket with 0.0% of them unmarried.
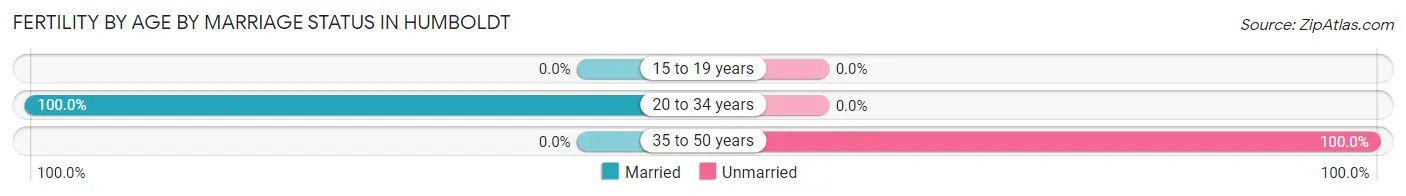
| Age Bracket | Married | Unmarried |
| 15 to 19 years | 0 (0.0%) | 0 (0.0%) |
| 20 to 34 years | 27 (100.0%) | 0 (0.0%) |
| 35 to 50 years | 0 (0.0%) | 41 (100.0%) |
| Total | 27 (39.7%) | 41 (60.3%) |
Fertility by Education in Humboldt
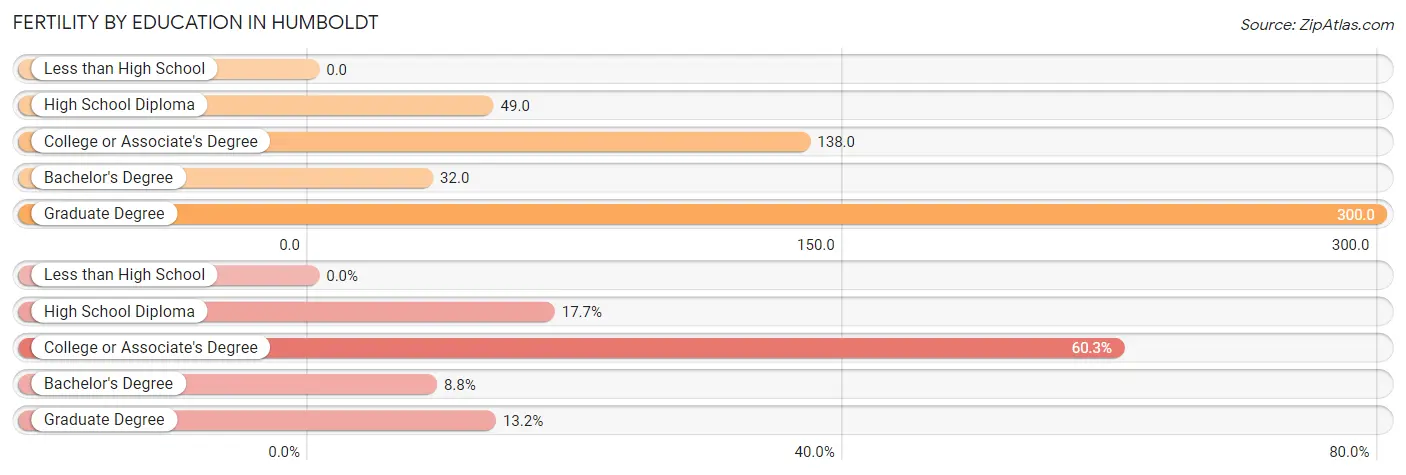
| Educational Attainment | Women with Births | Births / 1,000 Women |
| Less than High School | 0 (0.0%) | 0.0 |
| High School Diploma | 12 (17.6%) | 49.0 |
| College or Associate's Degree | 41 (60.3%) | 138.0 |
| Bachelor's Degree | 6 (8.8%) | 32.0 |
| Graduate Degree | 9 (13.2%) | 300.0 |
| Total | 68 (100.0%) | 80.0 |
Fertility by Education by Marriage Status in Humboldt
60.3% of women with births in Humboldt are unmarried. Women with the educational attainment of high school diploma are most likely to be married with 100.0% of them married at childbirth, while women with the educational attainment of college or associate's degree are least likely to be married with 100.0% of them unmarried at childbirth.
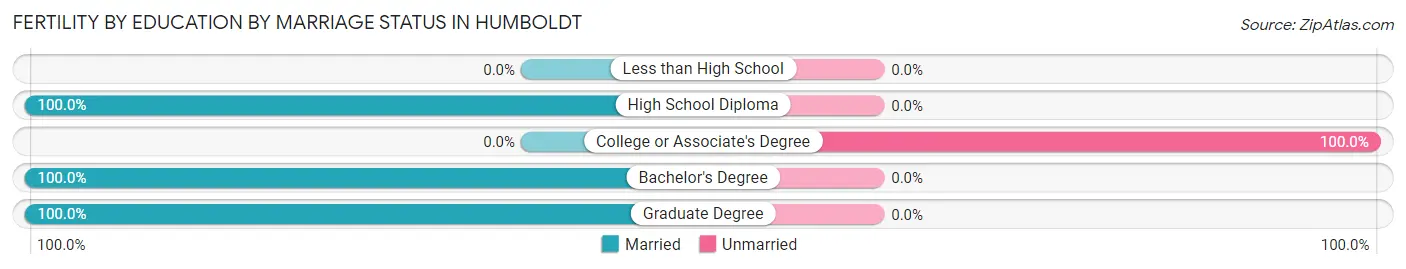
| Educational Attainment | Married | Unmarried |
| Less than High School | 0 (0.0%) | 0 (0.0%) |
| High School Diploma | 12 (100.0%) | 0 (0.0%) |
| College or Associate's Degree | 0 (0.0%) | 41 (100.0%) |
| Bachelor's Degree | 6 (100.0%) | 0 (0.0%) |
| Graduate Degree | 9 (100.0%) | 0 (0.0%) |
| Total | 27 (39.7%) | 41 (60.3%) |
Employment Characteristics in Humboldt
Employment by Class of Employer in Humboldt
Among the 2,252 employed individuals in Humboldt, private company employees (1,538 | 68.3%), local government employees (234 | 10.4%), and self-employed (not incorporated) (209 | 9.3%) make up the most common classes of employment.
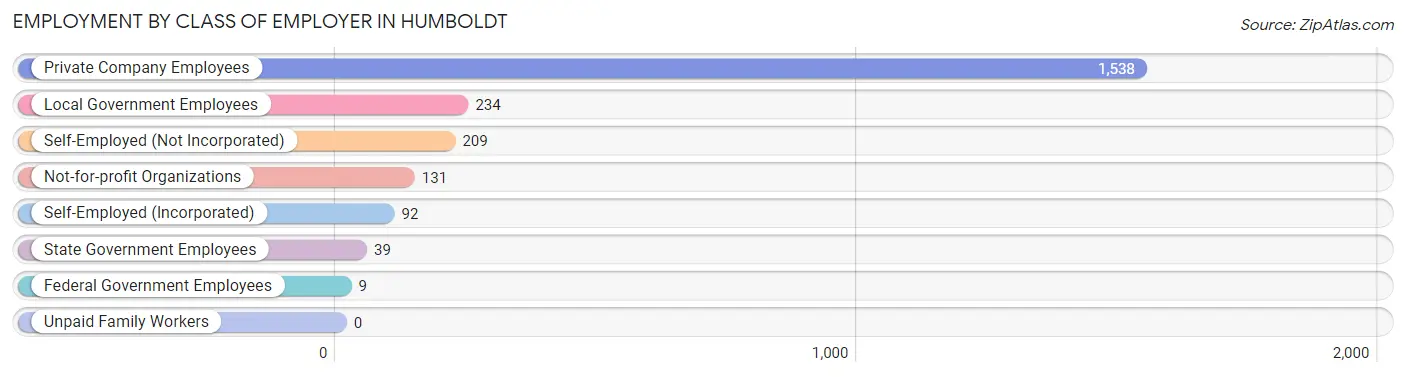
| Employer Class | # Employees | % Employees |
| Private Company Employees | 1,538 | 68.3% |
| Self-Employed (Incorporated) | 92 | 4.1% |
| Self-Employed (Not Incorporated) | 209 | 9.3% |
| Not-for-profit Organizations | 131 | 5.8% |
| Local Government Employees | 234 | 10.4% |
| State Government Employees | 39 | 1.7% |
| Federal Government Employees | 9 | 0.4% |
| Unpaid Family Workers | 0 | 0.0% |
| Total | 2,252 | 100.0% |
Employment Status by Age in Humboldt
According to the labor force statistics for Humboldt, out of the total population over 16 years of age (3,748), 60.6% or 2,271 individuals are in the labor force, with 0.7% or 16 of them unemployed. The age group with the highest labor force participation rate is 25 to 29 years, with 96.3% or 261 individuals in the labor force. Within the labor force, the 35 to 44 years age range has the highest percentage of unemployed individuals, with 2.4% or 12 of them being unemployed.
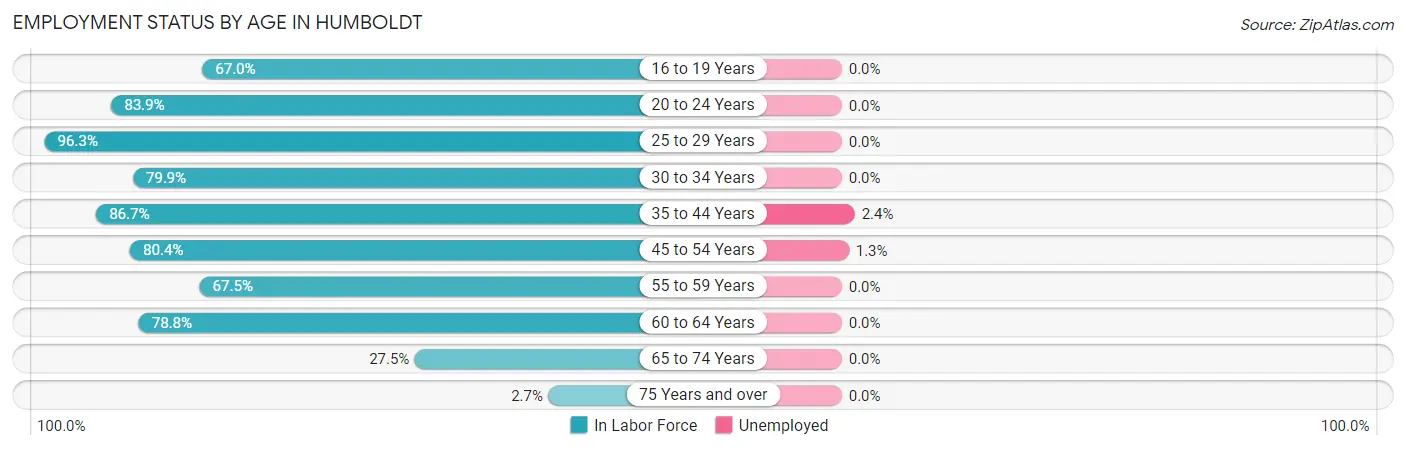
| Age Bracket | In Labor Force | Unemployed |
| 16 to 19 Years | 75 (67.0%) | 0 (0.0%) |
| 20 to 24 Years | 219 (83.9%) | 0 (0.0%) |
| 25 to 29 Years | 261 (96.3%) | 0 (0.0%) |
| 30 to 34 Years | 215 (79.9%) | 0 (0.0%) |
| 35 to 44 Years | 490 (86.7%) | 12 (2.4%) |
| 45 to 54 Years | 307 (80.4%) | 4 (1.3%) |
| 55 to 59 Years | 228 (67.5%) | 0 (0.0%) |
| 60 to 64 Years | 301 (78.8%) | 0 (0.0%) |
| 65 to 74 Years | 158 (27.5%) | 0 (0.0%) |
| 75 Years and over | 16 (2.7%) | 0 (0.0%) |
| Total | 2,271 (60.6%) | 16 (0.7%) |
Employment Status by Educational Attainment in Humboldt
According to labor force statistics for Humboldt, 81.6% of individuals (1,801) out of the total population between 25 and 64 years of age (2,207) are in the labor force, with 0.9% or 16 of them being unemployed. The group with the highest labor force participation rate are those with the educational attainment of bachelor's degree or higher, with 90.9% or 497 individuals in the labor force. Within the labor force, individuals with college / associate degree education have the highest percentage of unemployment, with 1.3% or 10 of them being unemployed.
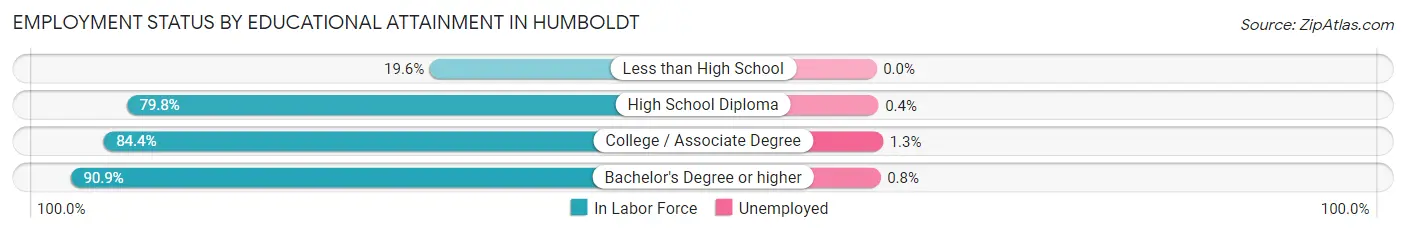
| Educational Attainment | In Labor Force | Unemployed |
| Less than High School | 20 (19.6%) | 0 (0.0%) |
| High School Diploma | 517 (79.8%) | 3 (0.4%) |
| College / Associate Degree | 768 (84.4%) | 12 (1.3%) |
| Bachelor's Degree or higher | 497 (90.9%) | 4 (0.8%) |
| Total | 1,801 (81.6%) | 20 (0.9%) |
Employment Occupations by Sex in Humboldt
Management, Business, Science and Arts Occupations
The most common Management, Business, Science and Arts occupations in Humboldt are Management (316 | 14.0%), Community & Social Service (264 | 11.7%), Education Instruction & Library (200 | 8.9%), Business & Financial (108 | 4.8%), and Computers, Engineering & Science (72 | 3.2%).
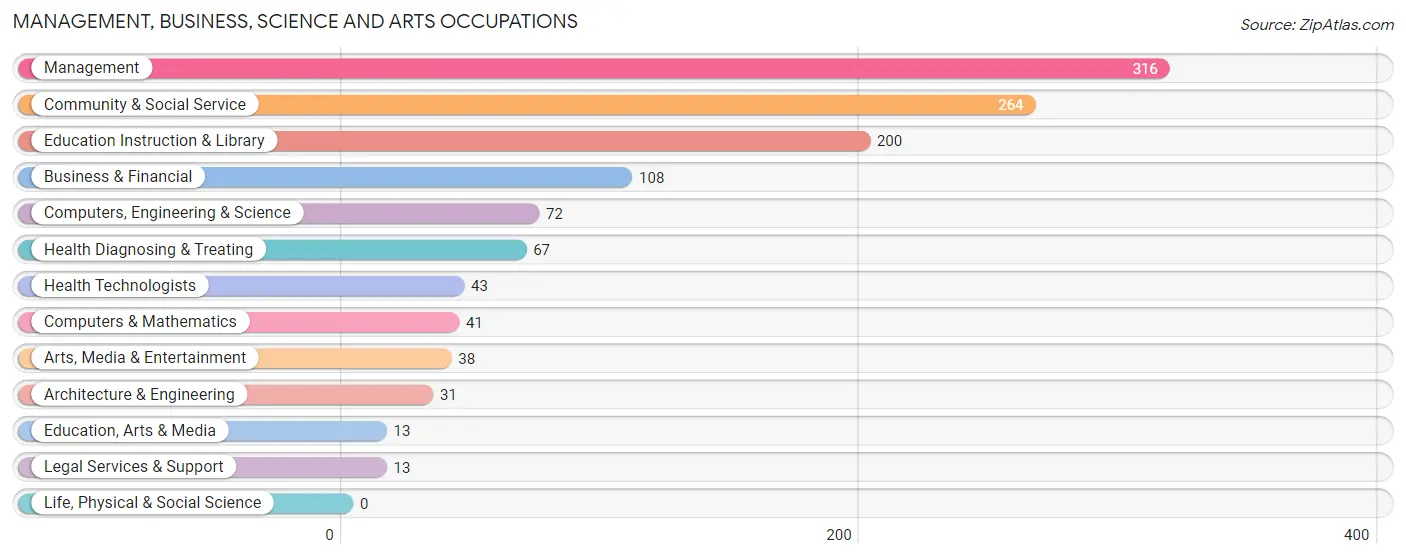
Management, Business, Science and Arts Occupations by Sex
Within the Management, Business, Science and Arts occupations in Humboldt, the most male-oriented occupations are Computers, Engineering & Science (100.0%), Computers & Mathematics (100.0%), and Architecture & Engineering (100.0%), while the most female-oriented occupations are Education, Arts & Media (100.0%), Legal Services & Support (100.0%), and Health Diagnosing & Treating (100.0%).
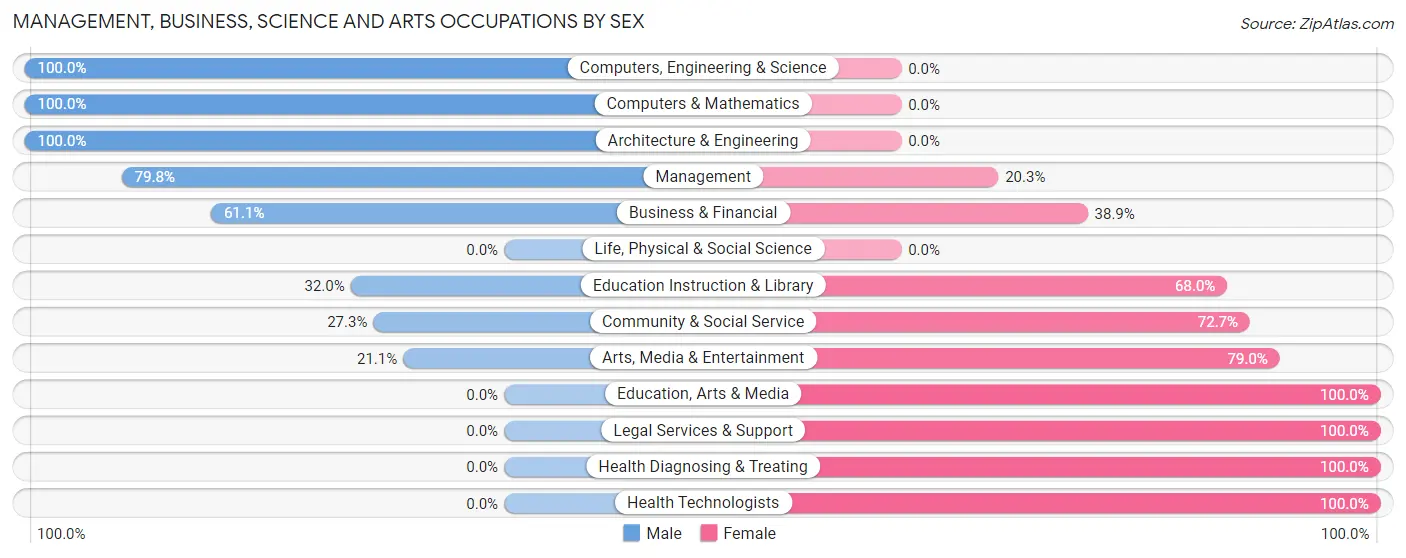
| Occupation | Male | Female |
| Management | 252 (79.7%) | 64 (20.3%) |
| Business & Financial | 66 (61.1%) | 42 (38.9%) |
| Computers, Engineering & Science | 72 (100.0%) | 0 (0.0%) |
| Computers & Mathematics | 41 (100.0%) | 0 (0.0%) |
| Architecture & Engineering | 31 (100.0%) | 0 (0.0%) |
| Life, Physical & Social Science | 0 (0.0%) | 0 (0.0%) |
| Community & Social Service | 72 (27.3%) | 192 (72.7%) |
| Education, Arts & Media | 0 (0.0%) | 13 (100.0%) |
| Legal Services & Support | 0 (0.0%) | 13 (100.0%) |
| Education Instruction & Library | 64 (32.0%) | 136 (68.0%) |
| Arts, Media & Entertainment | 8 (21.0%) | 30 (78.9%) |
| Health Diagnosing & Treating | 0 (0.0%) | 67 (100.0%) |
| Health Technologists | 0 (0.0%) | 43 (100.0%) |
| Total (Category) | 462 (55.9%) | 365 (44.1%) |
| Total (Overall) | 1,209 (53.6%) | 1,045 (46.4%) |
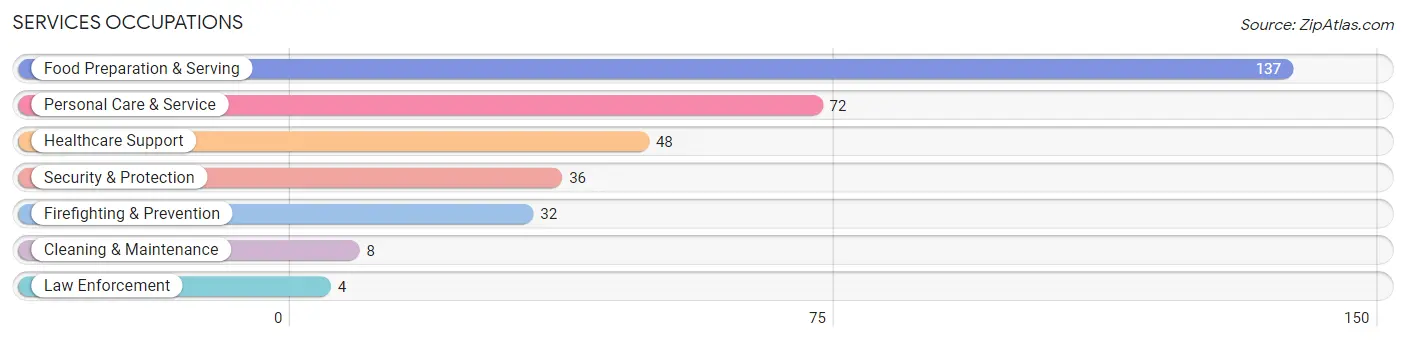
Services Occupations
The most common Services occupations in Humboldt are Food Preparation & Serving (137 | 6.1%), Personal Care & Service (72 | 3.2%), Healthcare Support (48 | 2.1%), Security & Protection (36 | 1.6%), and Firefighting & Prevention (32 | 1.4%).
Services Occupations by Sex
Within the Services occupations in Humboldt, the most male-oriented occupations are Firefighting & Prevention (100.0%), Security & Protection (88.9%), and Cleaning & Maintenance (50.0%), while the most female-oriented occupations are Law Enforcement (100.0%), Personal Care & Service (100.0%), and Food Preparation & Serving (97.8%).
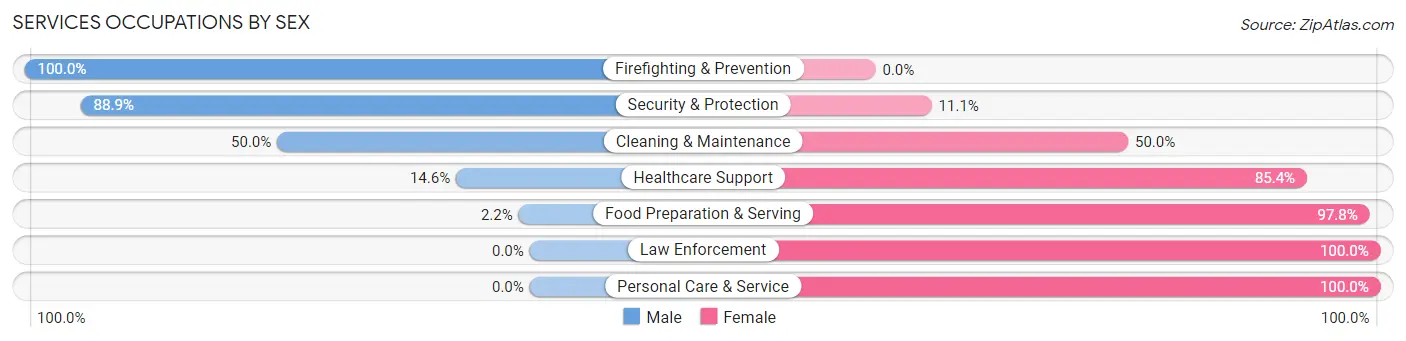
| Occupation | Male | Female |
| Healthcare Support | 7 (14.6%) | 41 (85.4%) |
| Security & Protection | 32 (88.9%) | 4 (11.1%) |
| Firefighting & Prevention | 32 (100.0%) | 0 (0.0%) |
| Law Enforcement | 0 (0.0%) | 4 (100.0%) |
| Food Preparation & Serving | 3 (2.2%) | 134 (97.8%) |
| Cleaning & Maintenance | 4 (50.0%) | 4 (50.0%) |
| Personal Care & Service | 0 (0.0%) | 72 (100.0%) |
| Total (Category) | 46 (15.3%) | 255 (84.7%) |
| Total (Overall) | 1,209 (53.6%) | 1,045 (46.4%) |
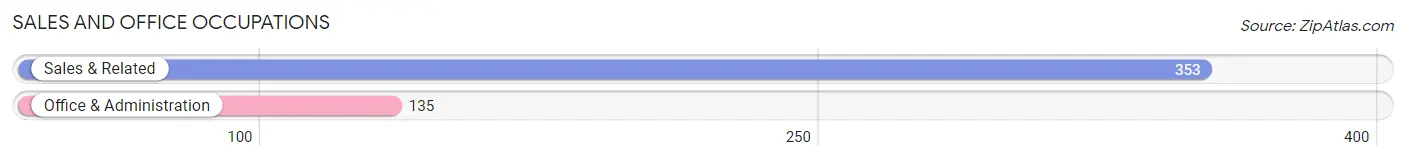
Sales and Office Occupations
The most common Sales and Office occupations in Humboldt are Sales & Related (353 | 15.7%), and Office & Administration (135 | 6.0%).
Sales and Office Occupations by Sex
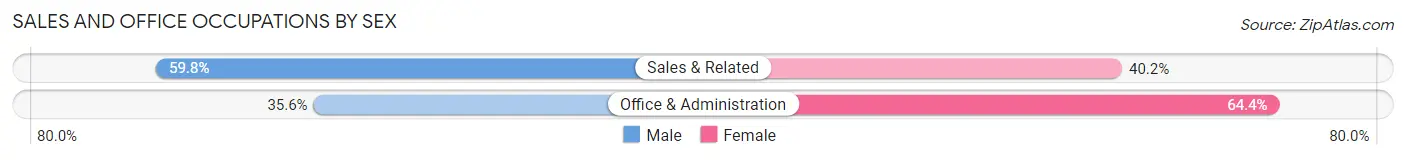
| Occupation | Male | Female |
| Sales & Related | 211 (59.8%) | 142 (40.2%) |
| Office & Administration | 48 (35.6%) | 87 (64.4%) |
| Total (Category) | 259 (53.1%) | 229 (46.9%) |
| Total (Overall) | 1,209 (53.6%) | 1,045 (46.4%) |
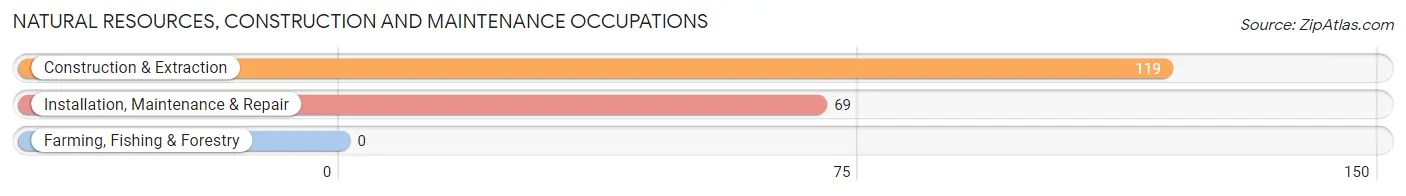
Natural Resources, Construction and Maintenance Occupations
The most common Natural Resources, Construction and Maintenance occupations in Humboldt are Construction & Extraction (119 | 5.3%), and Installation, Maintenance & Repair (69 | 3.1%).
Natural Resources, Construction and Maintenance Occupations by Sex
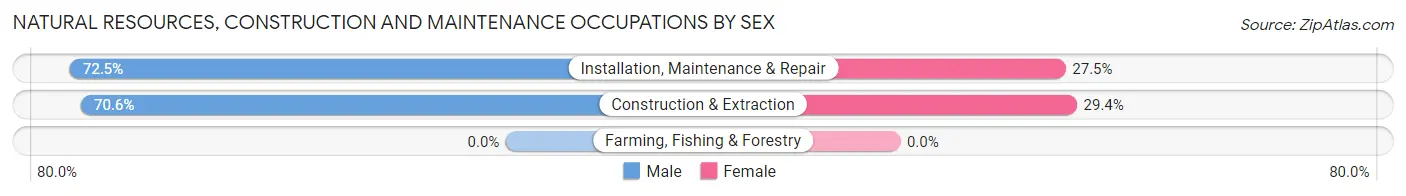
| Occupation | Male | Female |
| Farming, Fishing & Forestry | 0 (0.0%) | 0 (0.0%) |
| Construction & Extraction | 84 (70.6%) | 35 (29.4%) |
| Installation, Maintenance & Repair | 50 (72.5%) | 19 (27.5%) |
| Total (Category) | 134 (71.3%) | 54 (28.7%) |
| Total (Overall) | 1,209 (53.6%) | 1,045 (46.4%) |
Production, Transportation and Moving Occupations
The most common Production, Transportation and Moving occupations in Humboldt are Production (248 | 11.0%), Material Moving (126 | 5.6%), and Transportation (76 | 3.4%).
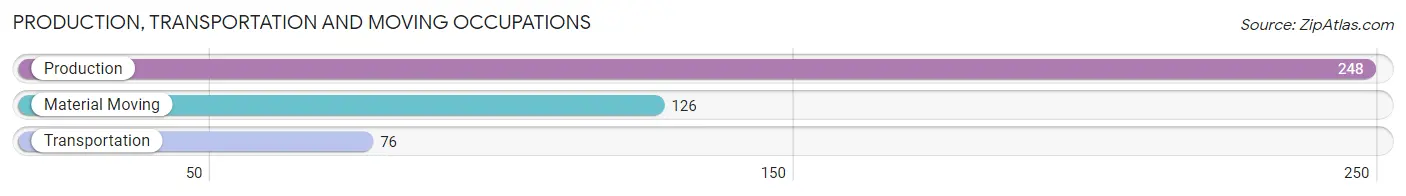
Production, Transportation and Moving Occupations by Sex
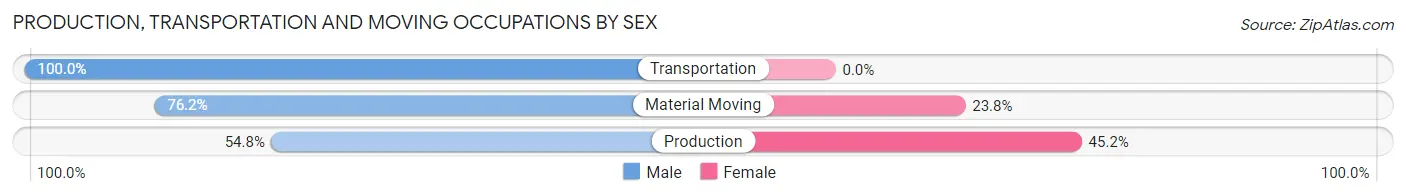
| Occupation | Male | Female |
| Production | 136 (54.8%) | 112 (45.2%) |
| Transportation | 76 (100.0%) | 0 (0.0%) |
| Material Moving | 96 (76.2%) | 30 (23.8%) |
| Total (Category) | 308 (68.4%) | 142 (31.6%) |
| Total (Overall) | 1,209 (53.6%) | 1,045 (46.4%) |
Employment Industries by Sex in Humboldt
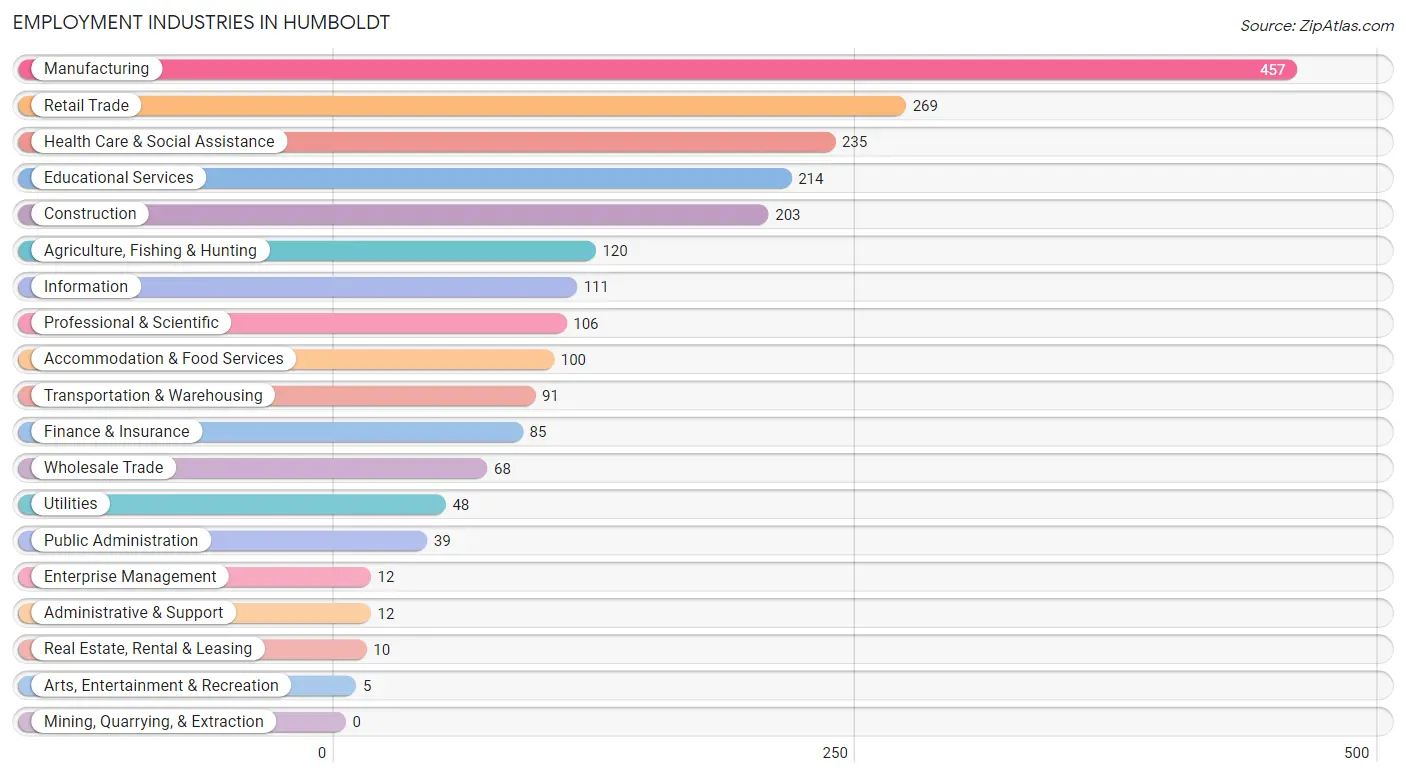
Employment Industries in Humboldt
The major employment industries in Humboldt include Manufacturing (457 | 20.3%), Retail Trade (269 | 11.9%), Health Care & Social Assistance (235 | 10.4%), Educational Services (214 | 9.5%), and Construction (203 | 9.0%).
Employment Industries by Sex in Humboldt
The Humboldt industries that see more men than women are Construction (100.0%), Wholesale Trade (100.0%), and Real Estate, Rental & Leasing (100.0%), whereas the industries that tend to have a higher number of women are Enterprise Management (100.0%), Health Care & Social Assistance (95.3%), and Finance & Insurance (95.3%).
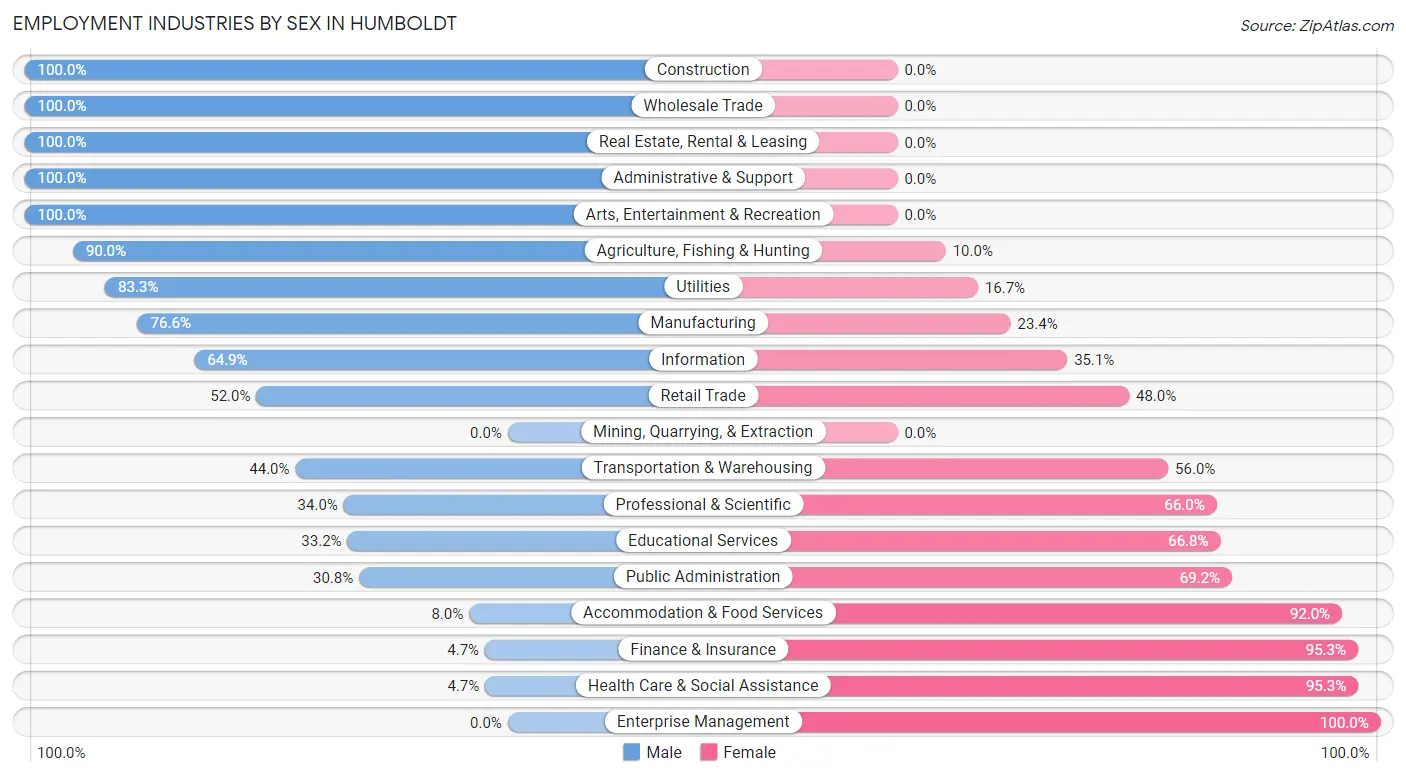
| Industry | Male | Female |
| Agriculture, Fishing & Hunting | 108 (90.0%) | 12 (10.0%) |
| Mining, Quarrying, & Extraction | 0 (0.0%) | 0 (0.0%) |
| Construction | 203 (100.0%) | 0 (0.0%) |
| Manufacturing | 350 (76.6%) | 107 (23.4%) |
| Wholesale Trade | 68 (100.0%) | 0 (0.0%) |
| Retail Trade | 140 (52.0%) | 129 (48.0%) |
| Transportation & Warehousing | 40 (44.0%) | 51 (56.0%) |
| Utilities | 40 (83.3%) | 8 (16.7%) |
| Information | 72 (64.9%) | 39 (35.1%) |
| Finance & Insurance | 4 (4.7%) | 81 (95.3%) |
| Real Estate, Rental & Leasing | 10 (100.0%) | 0 (0.0%) |
| Professional & Scientific | 36 (34.0%) | 70 (66.0%) |
| Enterprise Management | 0 (0.0%) | 12 (100.0%) |
| Administrative & Support | 12 (100.0%) | 0 (0.0%) |
| Educational Services | 71 (33.2%) | 143 (66.8%) |
| Health Care & Social Assistance | 11 (4.7%) | 224 (95.3%) |
| Arts, Entertainment & Recreation | 5 (100.0%) | 0 (0.0%) |
| Accommodation & Food Services | 8 (8.0%) | 92 (92.0%) |
| Public Administration | 12 (30.8%) | 27 (69.2%) |
| Total | 1,209 (53.6%) | 1,045 (46.4%) |
Education in Humboldt
School Enrollment in Humboldt
The most common levels of schooling among the 927 students in Humboldt are elementary school (281 | 30.3%), middle school (246 | 26.5%), and high school (207 | 22.3%).
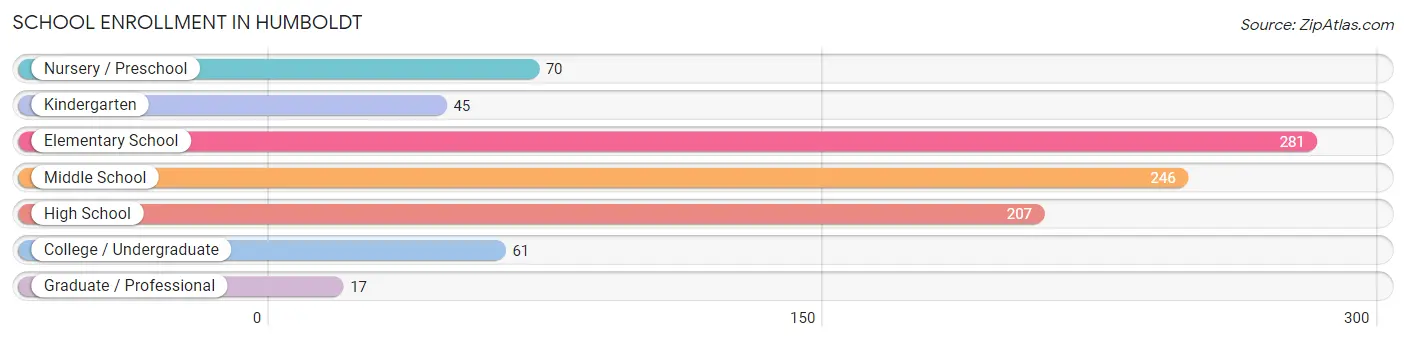
| School Level | # Students | % Students |
| Nursery / Preschool | 70 | 7.5% |
| Kindergarten | 45 | 4.9% |
| Elementary School | 281 | 30.3% |
| Middle School | 246 | 26.5% |
| High School | 207 | 22.3% |
| College / Undergraduate | 61 | 6.6% |
| Graduate / Professional | 17 | 1.8% |
| Total | 927 | 100.0% |
School Enrollment by Age by Funding Source in Humboldt
Out of a total of 927 students who are enrolled in schools in Humboldt, 220 (23.7%) attend a private institution, while the remaining 707 (76.3%) are enrolled in public schools. The age group of 25 to 34 year olds has the highest likelihood of being enrolled in private schools, with 17 (100.0% in the age bracket) enrolled. Conversely, the age group of 15 to 17 year olds has the lowest likelihood of being enrolled in a private school, with 114 (99.1% in the age bracket) attending a public institution.
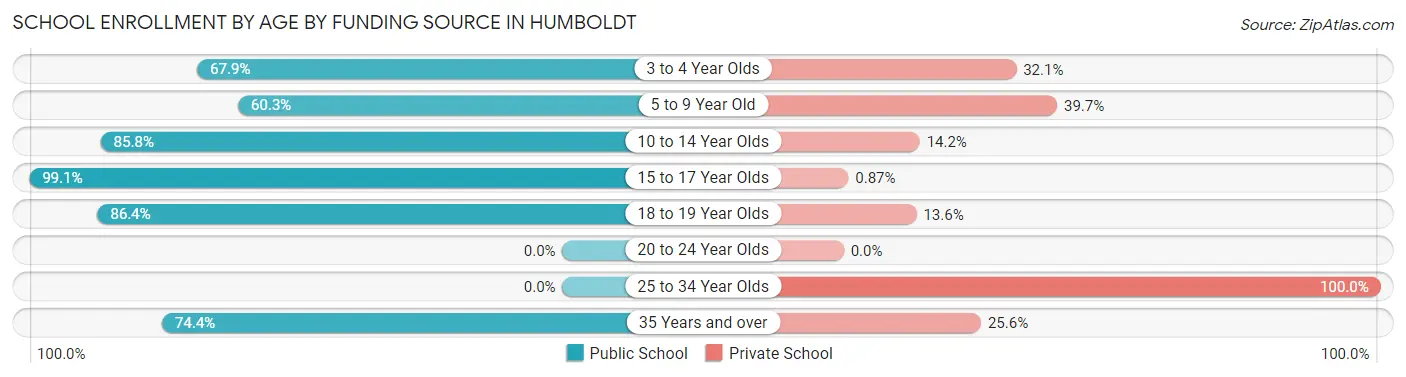
| Age Bracket | Public School | Private School |
| 3 to 4 Year Olds | 19 (67.9%) | 9 (32.1%) |
| 5 to 9 Year Old | 188 (60.3%) | 124 (39.7%) |
| 10 to 14 Year Olds | 303 (85.8%) | 50 (14.2%) |
| 15 to 17 Year Olds | 114 (99.1%) | 1 (0.9%) |
| 18 to 19 Year Olds | 51 (86.4%) | 8 (13.6%) |
| 20 to 24 Year Olds | 0 (0.0%) | 0 (0.0%) |
| 25 to 34 Year Olds | 0 (0.0%) | 17 (100.0%) |
| 35 Years and over | 32 (74.4%) | 11 (25.6%) |
| Total | 707 (76.3%) | 220 (23.7%) |
Educational Attainment by Field of Study in Humboldt
Education (209 | 25.7%), business (179 | 22.0%), bio, nature & agricultural (113 | 13.9%), arts & humanities (98 | 12.0%), and engineering (47 | 5.8%) are the most common fields of study among 814 individuals in Humboldt who have obtained a bachelor's degree or higher.
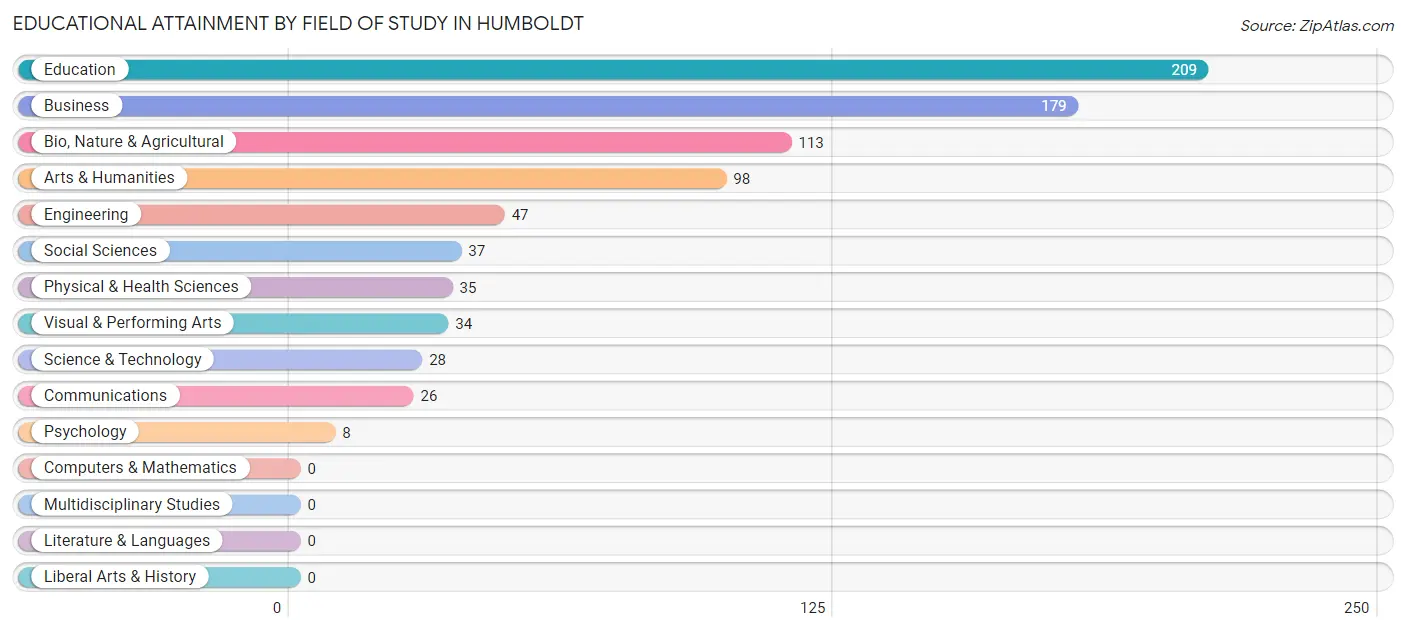
| Field of Study | # Graduates | % Graduates |
| Computers & Mathematics | 0 | 0.0% |
| Bio, Nature & Agricultural | 113 | 13.9% |
| Physical & Health Sciences | 35 | 4.3% |
| Psychology | 8 | 1.0% |
| Social Sciences | 37 | 4.5% |
| Engineering | 47 | 5.8% |
| Multidisciplinary Studies | 0 | 0.0% |
| Science & Technology | 28 | 3.4% |
| Business | 179 | 22.0% |
| Education | 209 | 25.7% |
| Literature & Languages | 0 | 0.0% |
| Liberal Arts & History | 0 | 0.0% |
| Visual & Performing Arts | 34 | 4.2% |
| Communications | 26 | 3.2% |
| Arts & Humanities | 98 | 12.0% |
| Total | 814 | 100.0% |
Transportation & Commute in Humboldt
Vehicle Availability by Sex in Humboldt
The most prevalent vehicle ownership categories in Humboldt are males with 2 vehicles (695, accounting for 57.7%) and females with 2 vehicles (514, making up 66.6%).
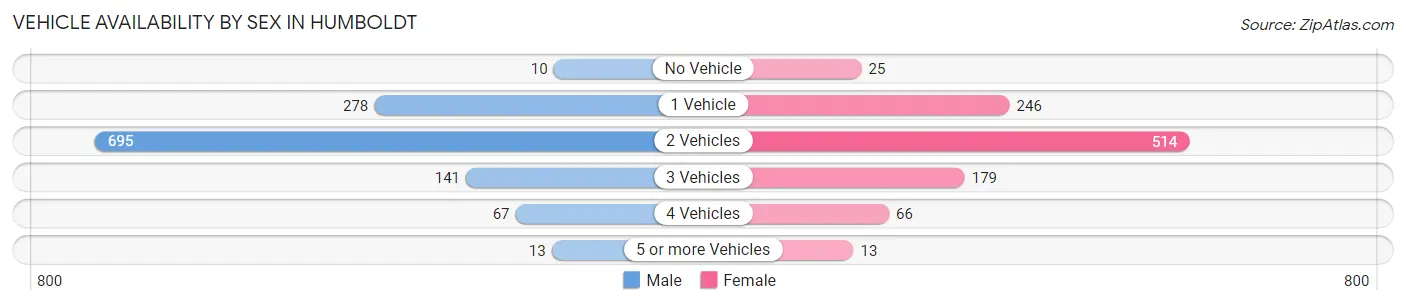
| Vehicles Available | Male | Female |
| No Vehicle | 10 (0.8%) | 25 (2.4%) |
| 1 Vehicle | 278 (23.1%) | 246 (23.6%) |
| 2 Vehicles | 695 (57.7%) | 514 (49.3%) |
| 3 Vehicles | 141 (11.7%) | 179 (17.2%) |
| 4 Vehicles | 67 (5.6%) | 66 (6.3%) |
| 5 or more Vehicles | 13 (1.1%) | 13 (1.3%) |
| Total | 1,204 (100.0%) | 1,043 (100.0%) |
Commute Time in Humboldt
The most frequently occuring commute durations in Humboldt are 5 to 9 minutes (701 commuters, 35.5%), 10 to 14 minutes (341 commuters, 17.3%), and less than 5 minutes (258 commuters, 13.1%).
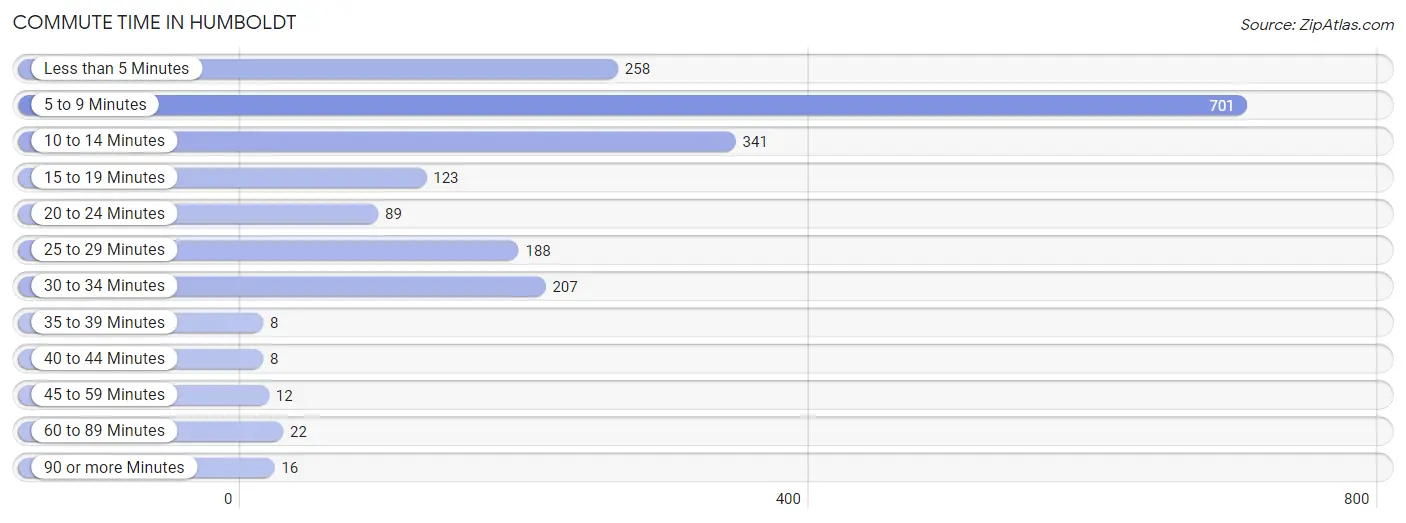
| Commute Time | # Commuters | % Commuters |
| Less than 5 Minutes | 258 | 13.1% |
| 5 to 9 Minutes | 701 | 35.5% |
| 10 to 14 Minutes | 341 | 17.3% |
| 15 to 19 Minutes | 123 | 6.2% |
| 20 to 24 Minutes | 89 | 4.5% |
| 25 to 29 Minutes | 188 | 9.5% |
| 30 to 34 Minutes | 207 | 10.5% |
| 35 to 39 Minutes | 8 | 0.4% |
| 40 to 44 Minutes | 8 | 0.4% |
| 45 to 59 Minutes | 12 | 0.6% |
| 60 to 89 Minutes | 22 | 1.1% |
| 90 or more Minutes | 16 | 0.8% |
Commute Time by Sex in Humboldt
The most common commute times in Humboldt are 5 to 9 minutes (390 commuters, 34.6%) for males and 5 to 9 minutes (311 commuters, 36.7%) for females.
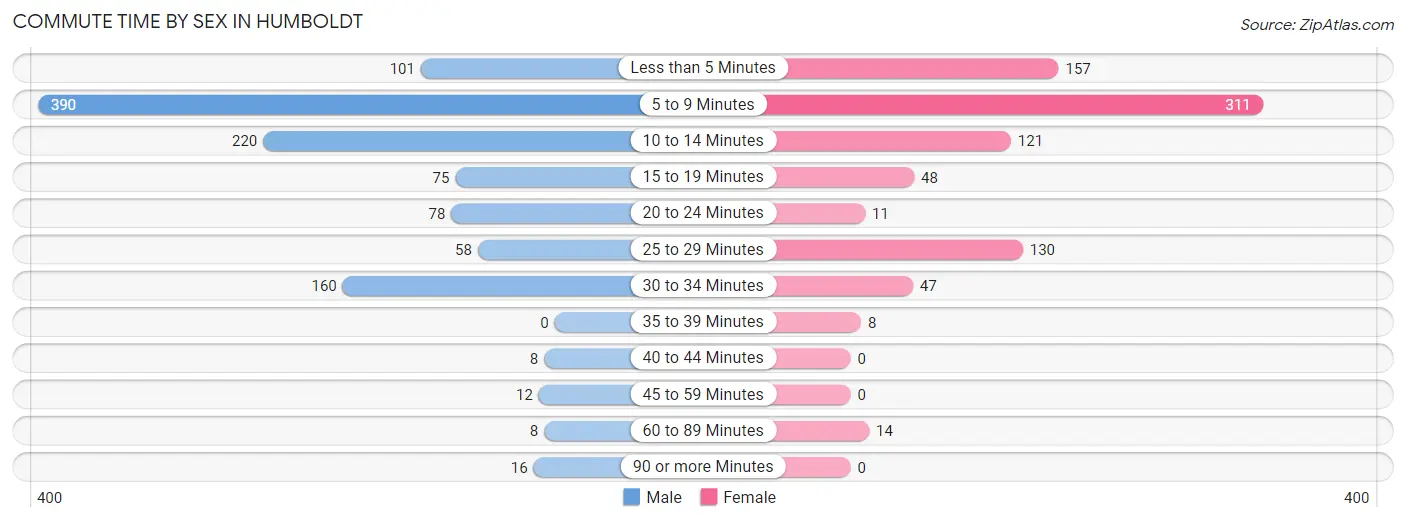
| Commute Time | Male | Female |
| Less than 5 Minutes | 101 (9.0%) | 157 (18.5%) |
| 5 to 9 Minutes | 390 (34.6%) | 311 (36.7%) |
| 10 to 14 Minutes | 220 (19.5%) | 121 (14.3%) |
| 15 to 19 Minutes | 75 (6.7%) | 48 (5.7%) |
| 20 to 24 Minutes | 78 (6.9%) | 11 (1.3%) |
| 25 to 29 Minutes | 58 (5.1%) | 130 (15.3%) |
| 30 to 34 Minutes | 160 (14.2%) | 47 (5.6%) |
| 35 to 39 Minutes | 0 (0.0%) | 8 (0.9%) |
| 40 to 44 Minutes | 8 (0.7%) | 0 (0.0%) |
| 45 to 59 Minutes | 12 (1.1%) | 0 (0.0%) |
| 60 to 89 Minutes | 8 (0.7%) | 14 (1.7%) |
| 90 or more Minutes | 16 (1.4%) | 0 (0.0%) |
Time of Departure to Work by Sex in Humboldt
The most frequent times of departure to work in Humboldt are 7:00 AM to 7:29 AM (251, 22.3%) for males and 7:30 AM to 7:59 AM (239, 28.2%) for females.
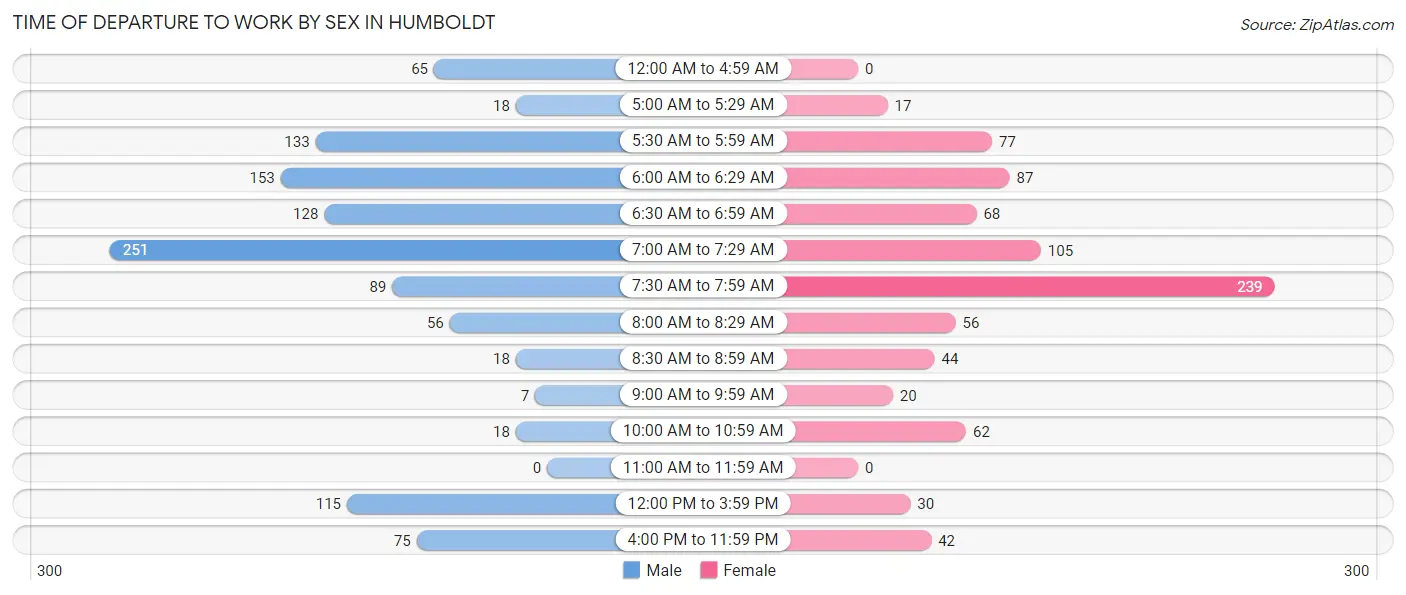
| Time of Departure | Male | Female |
| 12:00 AM to 4:59 AM | 65 (5.8%) | 0 (0.0%) |
| 5:00 AM to 5:29 AM | 18 (1.6%) | 17 (2.0%) |
| 5:30 AM to 5:59 AM | 133 (11.8%) | 77 (9.1%) |
| 6:00 AM to 6:29 AM | 153 (13.6%) | 87 (10.3%) |
| 6:30 AM to 6:59 AM | 128 (11.4%) | 68 (8.0%) |
| 7:00 AM to 7:29 AM | 251 (22.3%) | 105 (12.4%) |
| 7:30 AM to 7:59 AM | 89 (7.9%) | 239 (28.2%) |
| 8:00 AM to 8:29 AM | 56 (5.0%) | 56 (6.6%) |
| 8:30 AM to 8:59 AM | 18 (1.6%) | 44 (5.2%) |
| 9:00 AM to 9:59 AM | 7 (0.6%) | 20 (2.4%) |
| 10:00 AM to 10:59 AM | 18 (1.6%) | 62 (7.3%) |
| 11:00 AM to 11:59 AM | 0 (0.0%) | 0 (0.0%) |
| 12:00 PM to 3:59 PM | 115 (10.2%) | 30 (3.5%) |
| 4:00 PM to 11:59 PM | 75 (6.7%) | 42 (5.0%) |
| Total | 1,126 (100.0%) | 847 (100.0%) |
Housing Occupancy in Humboldt
Occupancy by Ownership in Humboldt
Of the total 2,172 dwellings in Humboldt, owner-occupied units account for 1,448 (66.7%), while renter-occupied units make up 724 (33.3%).
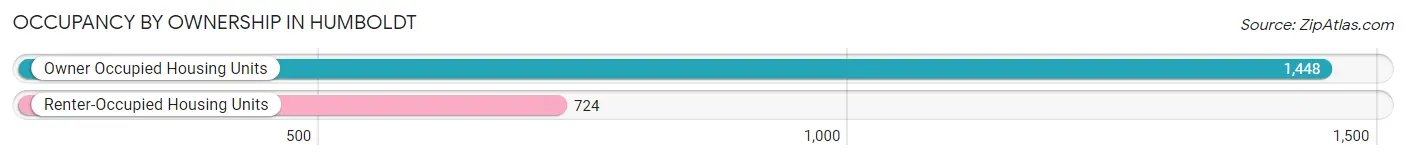
| Occupancy | # Housing Units | % Housing Units |
| Owner Occupied Housing Units | 1,448 | 66.7% |
| Renter-Occupied Housing Units | 724 | 33.3% |
| Total Occupied Housing Units | 2,172 | 100.0% |
Occupancy by Household Size in Humboldt
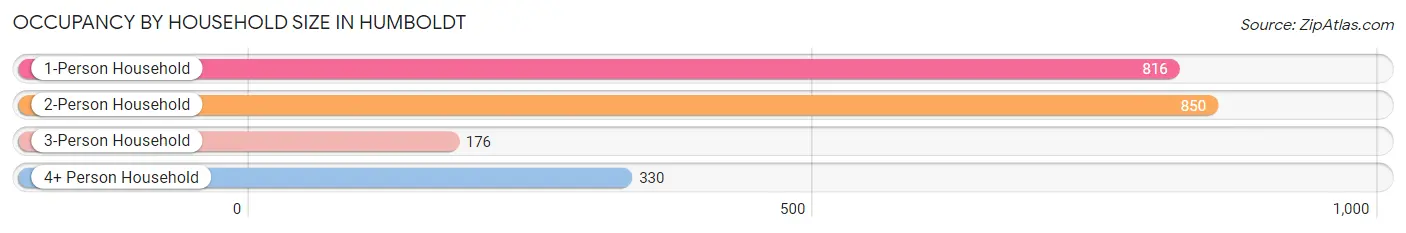
| Household Size | # Housing Units | % Housing Units |
| 1-Person Household | 816 | 37.6% |
| 2-Person Household | 850 | 39.1% |
| 3-Person Household | 176 | 8.1% |
| 4+ Person Household | 330 | 15.2% |
| Total Housing Units | 2,172 | 100.0% |
Occupancy by Ownership by Household Size in Humboldt
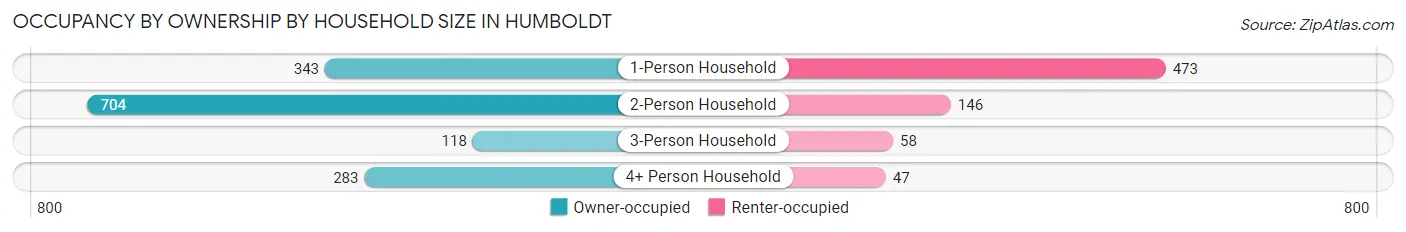
| Household Size | Owner-occupied | Renter-occupied |
| 1-Person Household | 343 (42.0%) | 473 (58.0%) |
| 2-Person Household | 704 (82.8%) | 146 (17.2%) |
| 3-Person Household | 118 (67.0%) | 58 (33.0%) |
| 4+ Person Household | 283 (85.8%) | 47 (14.2%) |
| Total Housing Units | 1,448 (66.7%) | 724 (33.3%) |
Occupancy by Educational Attainment in Humboldt
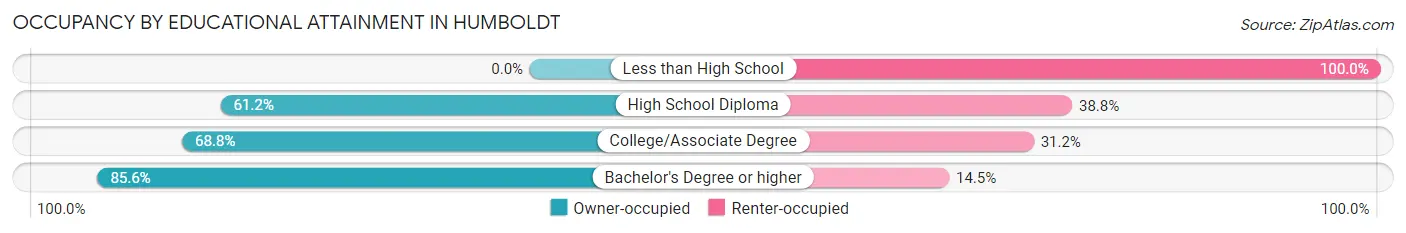
| Household Size | Owner-occupied | Renter-occupied |
| Less than High School | 0 (0.0%) | 117 (100.0%) |
| High School Diploma | 411 (61.2%) | 261 (38.8%) |
| College/Associate Degree | 599 (68.8%) | 272 (31.2%) |
| Bachelor's Degree or higher | 438 (85.6%) | 74 (14.4%) |
Occupancy by Age of Householder in Humboldt
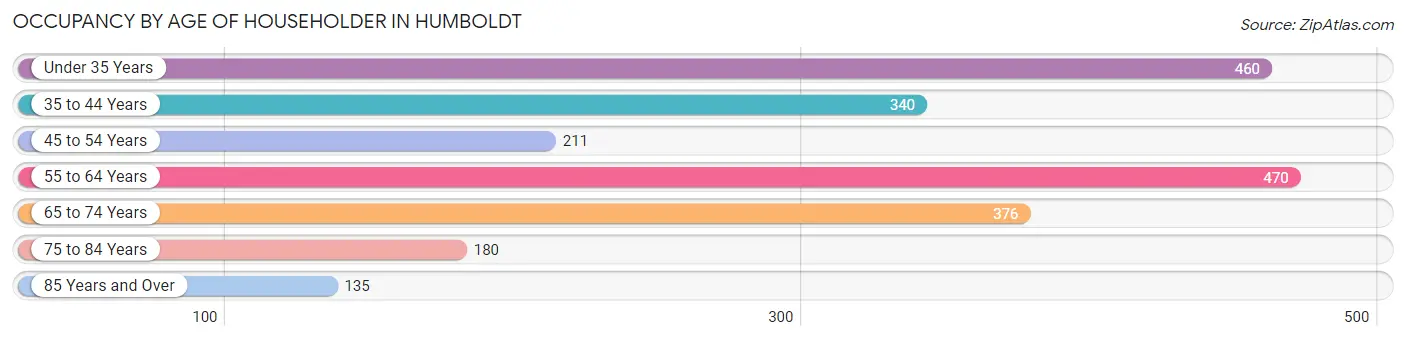
| Age Bracket | # Households | % Households |
| Under 35 Years | 460 | 21.2% |
| 35 to 44 Years | 340 | 15.7% |
| 45 to 54 Years | 211 | 9.7% |
| 55 to 64 Years | 470 | 21.6% |
| 65 to 74 Years | 376 | 17.3% |
| 75 to 84 Years | 180 | 8.3% |
| 85 Years and Over | 135 | 6.2% |
| Total | 2,172 | 100.0% |
Housing Finances in Humboldt
Median Income by Occupancy in Humboldt
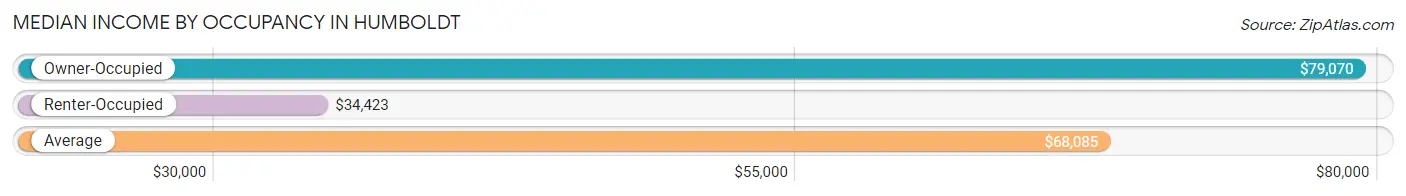
| Occupancy Type | # Households | Median Income |
| Owner-Occupied | 1,448 (66.7%) | $79,070 |
| Renter-Occupied | 724 (33.3%) | $34,423 |
| Average | 2,172 (100.0%) | $68,085 |
Occupancy by Householder Income Bracket in Humboldt
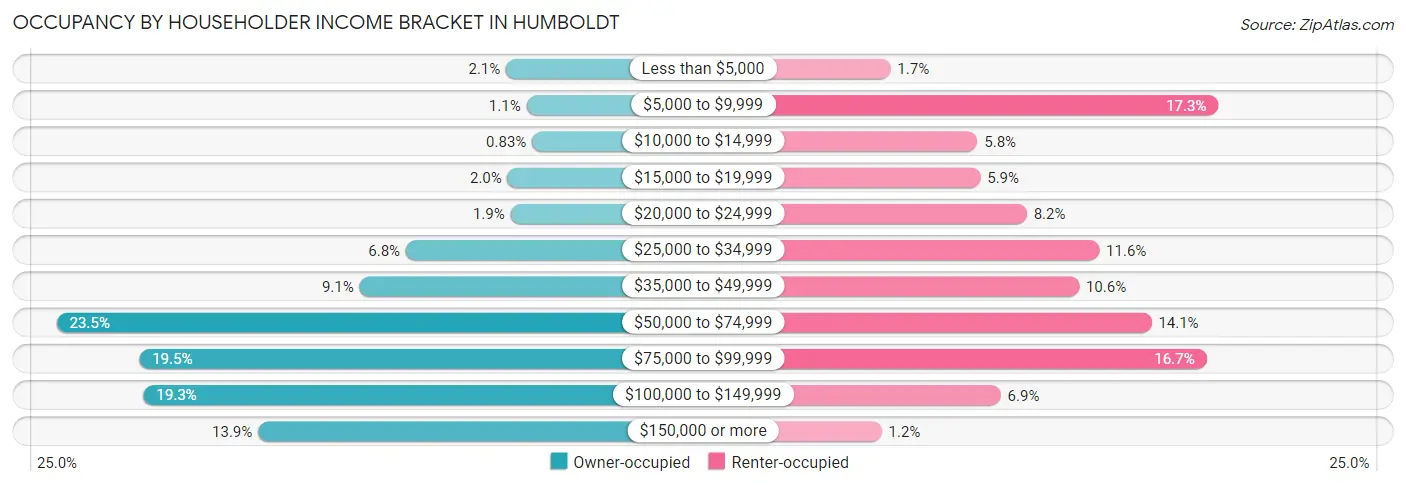
| Income Bracket | Owner-occupied | Renter-occupied |
| Less than $5,000 | 30 (2.1%) | 12 (1.7%) |
| $5,000 to $9,999 | 16 (1.1%) | 125 (17.3%) |
| $10,000 to $14,999 | 12 (0.8%) | 42 (5.8%) |
| $15,000 to $19,999 | 29 (2.0%) | 43 (5.9%) |
| $20,000 to $24,999 | 27 (1.9%) | 59 (8.2%) |
| $25,000 to $34,999 | 99 (6.8%) | 84 (11.6%) |
| $35,000 to $49,999 | 131 (9.0%) | 77 (10.6%) |
| $50,000 to $74,999 | 340 (23.5%) | 102 (14.1%) |
| $75,000 to $99,999 | 283 (19.5%) | 121 (16.7%) |
| $100,000 to $149,999 | 280 (19.3%) | 50 (6.9%) |
| $150,000 or more | 201 (13.9%) | 9 (1.2%) |
| Total | 1,448 (100.0%) | 724 (100.0%) |
Monthly Housing Cost Tiers in Humboldt
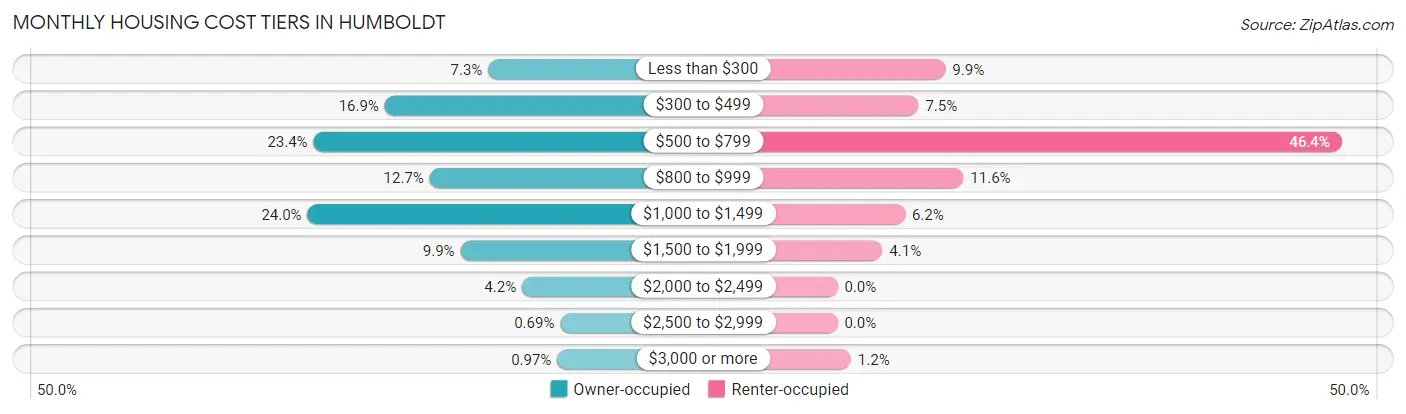
| Monthly Cost | Owner-occupied | Renter-occupied |
| Less than $300 | 106 (7.3%) | 72 (9.9%) |
| $300 to $499 | 244 (16.9%) | 54 (7.5%) |
| $500 to $799 | 339 (23.4%) | 336 (46.4%) |
| $800 to $999 | 184 (12.7%) | 84 (11.6%) |
| $1,000 to $1,499 | 347 (24.0%) | 45 (6.2%) |
| $1,500 to $1,999 | 143 (9.9%) | 30 (4.1%) |
| $2,000 to $2,499 | 61 (4.2%) | 0 (0.0%) |
| $2,500 to $2,999 | 10 (0.7%) | 0 (0.0%) |
| $3,000 or more | 14 (1.0%) | 9 (1.2%) |
| Total | 1,448 (100.0%) | 724 (100.0%) |
Physical Housing Characteristics in Humboldt
Housing Structures in Humboldt
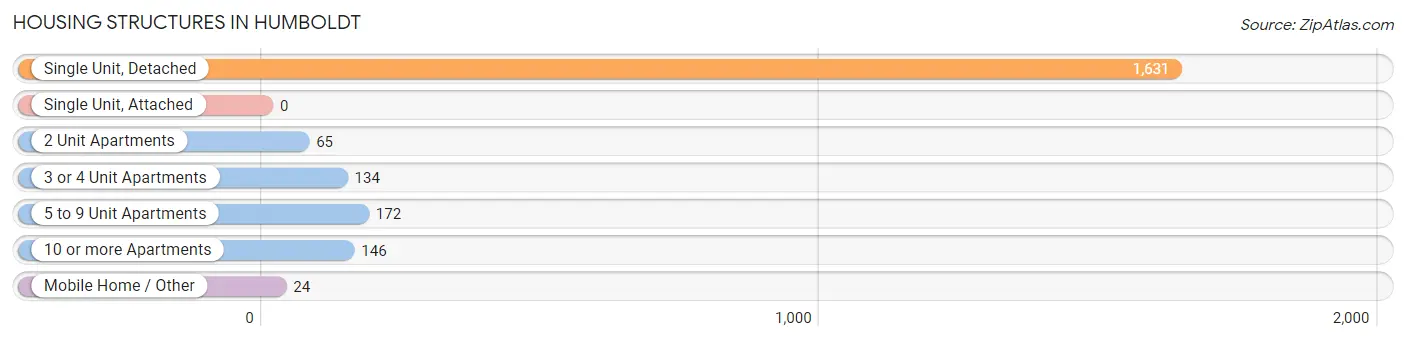
| Structure Type | # Housing Units | % Housing Units |
| Single Unit, Detached | 1,631 | 75.1% |
| Single Unit, Attached | 0 | 0.0% |
| 2 Unit Apartments | 65 | 3.0% |
| 3 or 4 Unit Apartments | 134 | 6.2% |
| 5 to 9 Unit Apartments | 172 | 7.9% |
| 10 or more Apartments | 146 | 6.7% |
| Mobile Home / Other | 24 | 1.1% |
| Total | 2,172 | 100.0% |
Housing Structures by Occupancy in Humboldt
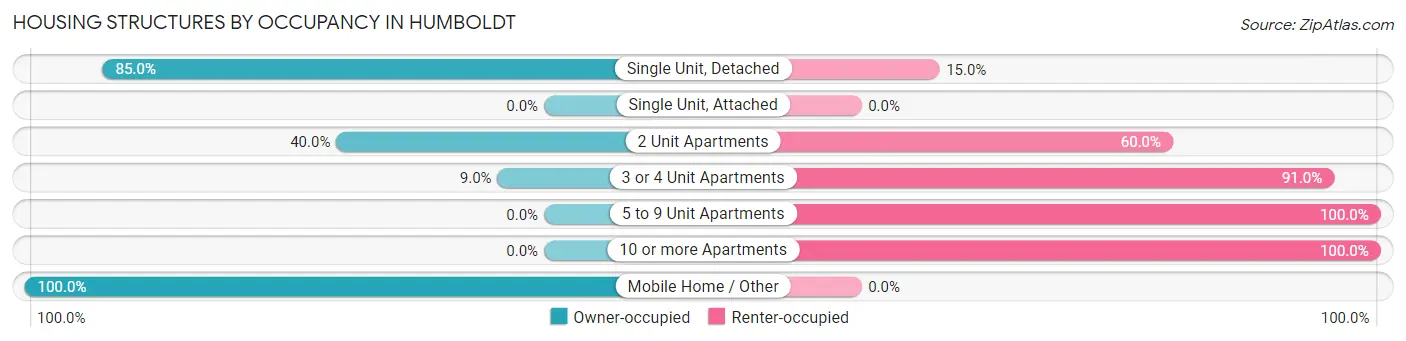
| Structure Type | Owner-occupied | Renter-occupied |
| Single Unit, Detached | 1,386 (85.0%) | 245 (15.0%) |
| Single Unit, Attached | 0 (0.0%) | 0 (0.0%) |
| 2 Unit Apartments | 26 (40.0%) | 39 (60.0%) |
| 3 or 4 Unit Apartments | 12 (9.0%) | 122 (91.0%) |
| 5 to 9 Unit Apartments | 0 (0.0%) | 172 (100.0%) |
| 10 or more Apartments | 0 (0.0%) | 146 (100.0%) |
| Mobile Home / Other | 24 (100.0%) | 0 (0.0%) |
| Total | 1,448 (66.7%) | 724 (33.3%) |
Housing Structures by Number of Rooms in Humboldt
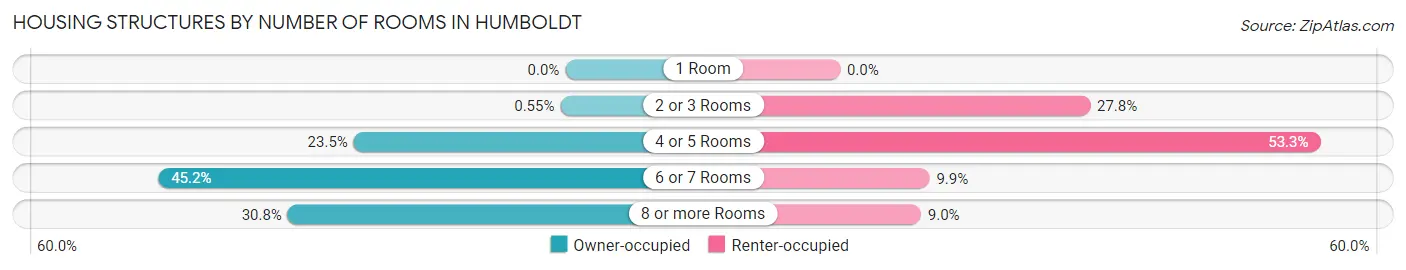
| Number of Rooms | Owner-occupied | Renter-occupied |
| 1 Room | 0 (0.0%) | 0 (0.0%) |
| 2 or 3 Rooms | 8 (0.5%) | 201 (27.8%) |
| 4 or 5 Rooms | 340 (23.5%) | 386 (53.3%) |
| 6 or 7 Rooms | 654 (45.2%) | 72 (9.9%) |
| 8 or more Rooms | 446 (30.8%) | 65 (9.0%) |
| Total | 1,448 (100.0%) | 724 (100.0%) |
Housing Structure by Heating Type in Humboldt
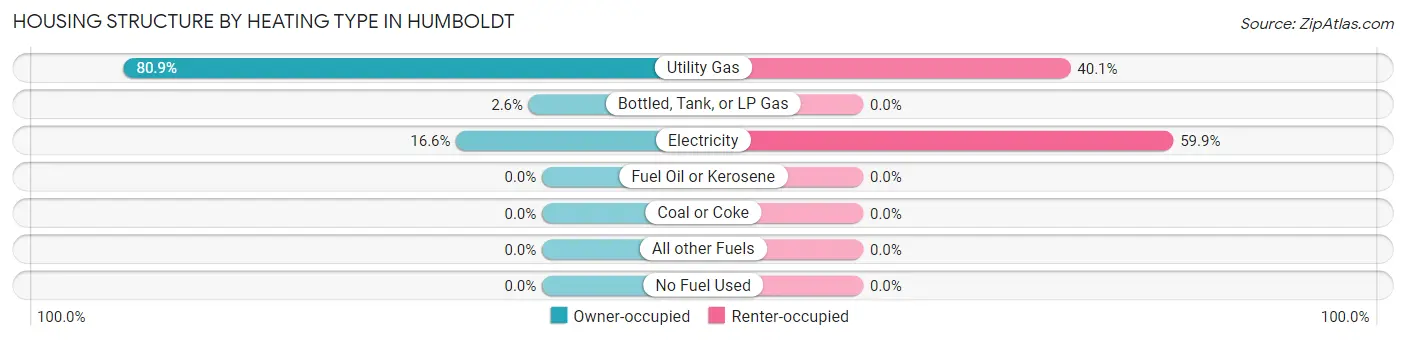
| Heating Type | Owner-occupied | Renter-occupied |
| Utility Gas | 1,171 (80.9%) | 290 (40.1%) |
| Bottled, Tank, or LP Gas | 37 (2.6%) | 0 (0.0%) |
| Electricity | 240 (16.6%) | 434 (59.9%) |
| Fuel Oil or Kerosene | 0 (0.0%) | 0 (0.0%) |
| Coal or Coke | 0 (0.0%) | 0 (0.0%) |
| All other Fuels | 0 (0.0%) | 0 (0.0%) |
| No Fuel Used | 0 (0.0%) | 0 (0.0%) |
| Total | 1,448 (100.0%) | 724 (100.0%) |
Household Vehicle Usage in Humboldt
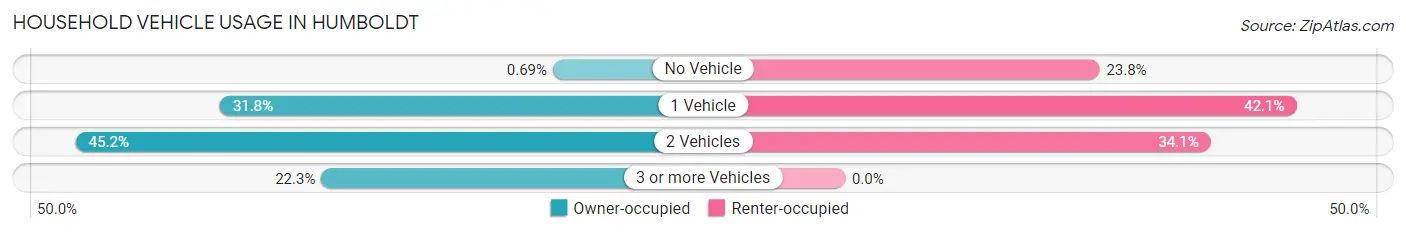
| Vehicles per Household | Owner-occupied | Renter-occupied |
| No Vehicle | 10 (0.7%) | 172 (23.8%) |
| 1 Vehicle | 460 (31.8%) | 305 (42.1%) |
| 2 Vehicles | 655 (45.2%) | 247 (34.1%) |
| 3 or more Vehicles | 323 (22.3%) | 0 (0.0%) |
| Total | 1,448 (100.0%) | 724 (100.0%) |
Real Estate & Mortgages in Humboldt
Real Estate and Mortgage Overview in Humboldt
| Characteristic | Without Mortgage | With Mortgage |
| Housing Units | 692 | 756 |
| Median Property Value | $150,300 | $141,200 |
| Median Household Income | $69,951 | $124 |
| Monthly Housing Costs | $509 | $14 |
| Real Estate Taxes | $2,367 | $16 |
Property Value by Mortgage Status in Humboldt
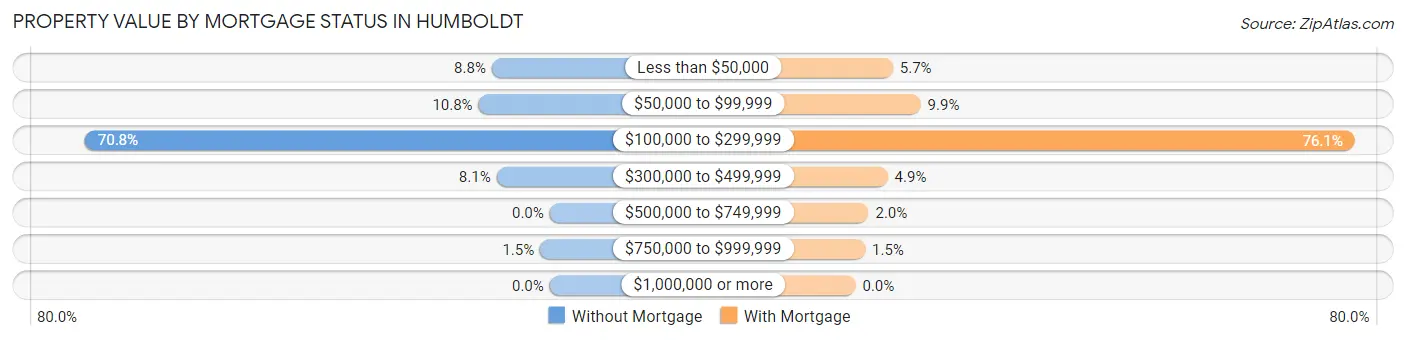
| Property Value | Without Mortgage | With Mortgage |
| Less than $50,000 | 61 (8.8%) | 43 (5.7%) |
| $50,000 to $99,999 | 75 (10.8%) | 75 (9.9%) |
| $100,000 to $299,999 | 490 (70.8%) | 575 (76.1%) |
| $300,000 to $499,999 | 56 (8.1%) | 37 (4.9%) |
| $500,000 to $749,999 | 0 (0.0%) | 15 (2.0%) |
| $750,000 to $999,999 | 10 (1.5%) | 11 (1.5%) |
| $1,000,000 or more | 0 (0.0%) | 0 (0.0%) |
| Total | 692 (100.0%) | 756 (100.0%) |
Household Income by Mortgage Status in Humboldt
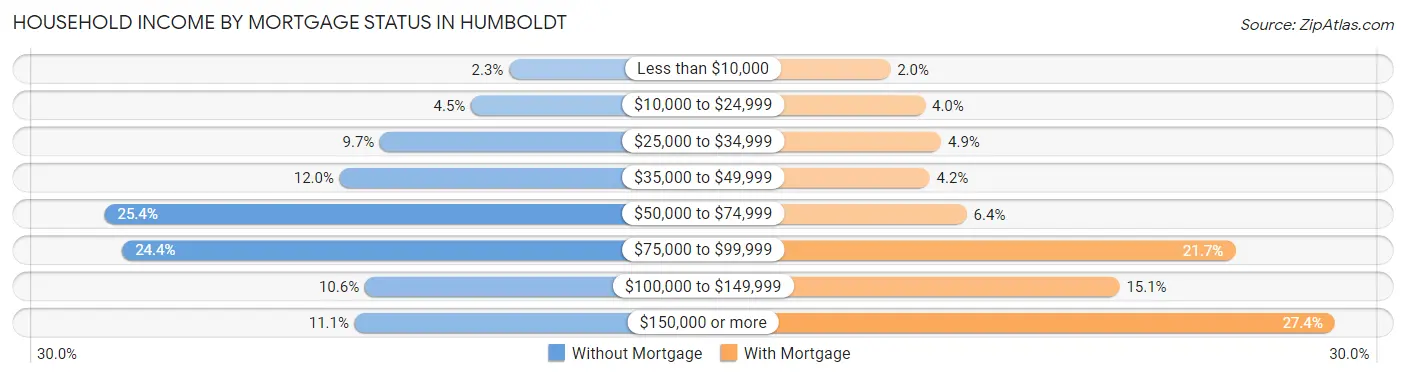
| Household Income | Without Mortgage | With Mortgage |
| Less than $10,000 | 16 (2.3%) | 15 (2.0%) |
| $10,000 to $24,999 | 31 (4.5%) | 30 (4.0%) |
| $25,000 to $34,999 | 67 (9.7%) | 37 (4.9%) |
| $35,000 to $49,999 | 83 (12.0%) | 32 (4.2%) |
| $50,000 to $74,999 | 176 (25.4%) | 48 (6.4%) |
| $75,000 to $99,999 | 169 (24.4%) | 164 (21.7%) |
| $100,000 to $149,999 | 73 (10.5%) | 114 (15.1%) |
| $150,000 or more | 77 (11.1%) | 207 (27.4%) |
| Total | 692 (100.0%) | 756 (100.0%) |
Property Value to Household Income Ratio in Humboldt
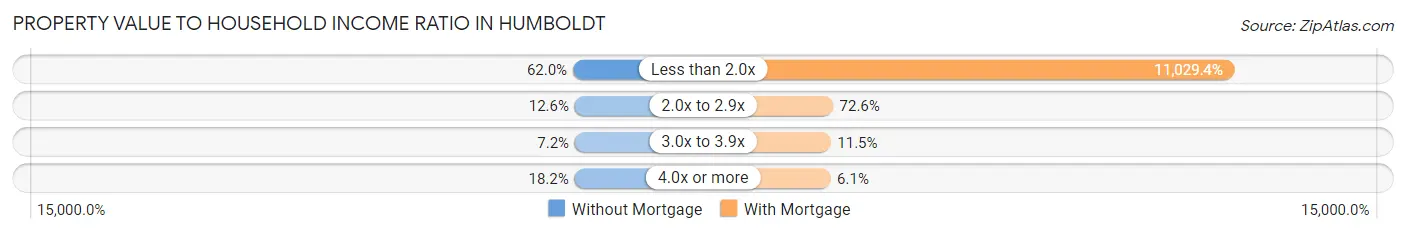
| Value-to-Income Ratio | Without Mortgage | With Mortgage |
| Less than 2.0x | 429 (62.0%) | 83,382 (11,029.4%) |
| 2.0x to 2.9x | 87 (12.6%) | 549 (72.6%) |
| 3.0x to 3.9x | 50 (7.2%) | 87 (11.5%) |
| 4.0x or more | 126 (18.2%) | 46 (6.1%) |
| Total | 692 (100.0%) | 756 (100.0%) |
Real Estate Taxes by Mortgage Status in Humboldt
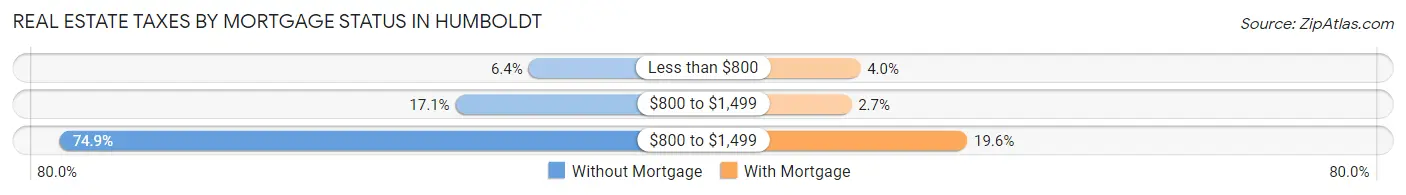
| Property Taxes | Without Mortgage | With Mortgage |
| Less than $800 | 44 (6.4%) | 30 (4.0%) |
| $800 to $1,499 | 118 (17.1%) | 20 (2.6%) |
| $800 to $1,499 | 518 (74.9%) | 148 (19.6%) |
| Total | 692 (100.0%) | 756 (100.0%) |
Health & Disability in Humboldt
Health Insurance Coverage by Age in Humboldt
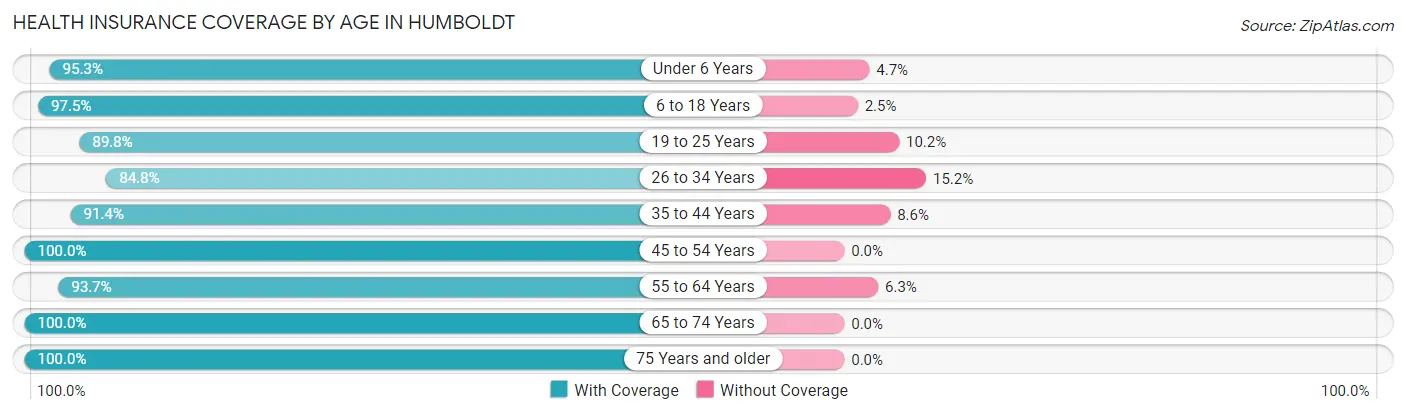
| Age Bracket | With Coverage | Without Coverage |
| Under 6 Years | 306 (95.3%) | 15 (4.7%) |
| 6 to 18 Years | 780 (97.5%) | 20 (2.5%) |
| 19 to 25 Years | 299 (89.8%) | 34 (10.2%) |
| 26 to 34 Years | 406 (84.8%) | 73 (15.2%) |
| 35 to 44 Years | 512 (91.4%) | 48 (8.6%) |
| 45 to 54 Years | 367 (100.0%) | 0 (0.0%) |
| 55 to 64 Years | 669 (93.7%) | 45 (6.3%) |
| 65 to 74 Years | 565 (100.0%) | 0 (0.0%) |
| 75 Years and older | 532 (100.0%) | 0 (0.0%) |
| Total | 4,436 (95.0%) | 235 (5.0%) |
Health Insurance Coverage by Citizenship Status in Humboldt
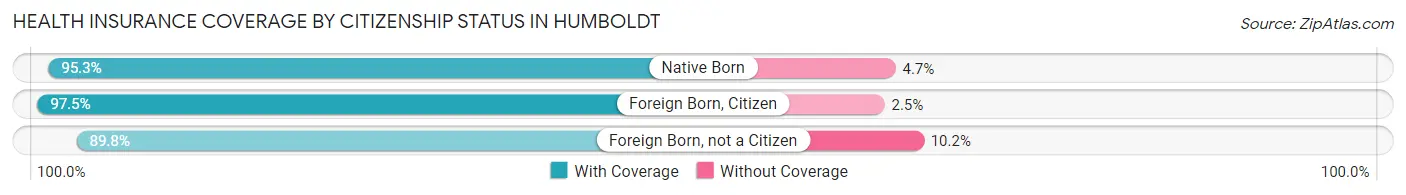
| Citizenship Status | With Coverage | Without Coverage |
| Native Born | 306 (95.3%) | 15 (4.7%) |
| Foreign Born, Citizen | 780 (97.5%) | 20 (2.5%) |
| Foreign Born, not a Citizen | 299 (89.8%) | 34 (10.2%) |
Health Insurance Coverage by Household Income in Humboldt
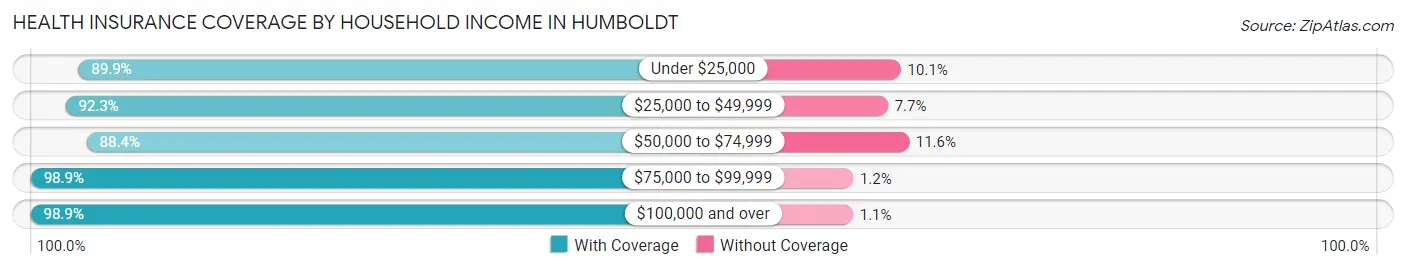
| Household Income | With Coverage | Without Coverage |
| Under $25,000 | 579 (89.9%) | 65 (10.1%) |
| $25,000 to $49,999 | 627 (92.3%) | 52 (7.7%) |
| $50,000 to $74,999 | 677 (88.4%) | 89 (11.6%) |
| $75,000 to $99,999 | 1,036 (98.9%) | 12 (1.1%) |
| $100,000 and over | 1,498 (98.9%) | 17 (1.1%) |
Public vs Private Health Insurance Coverage by Age in Humboldt
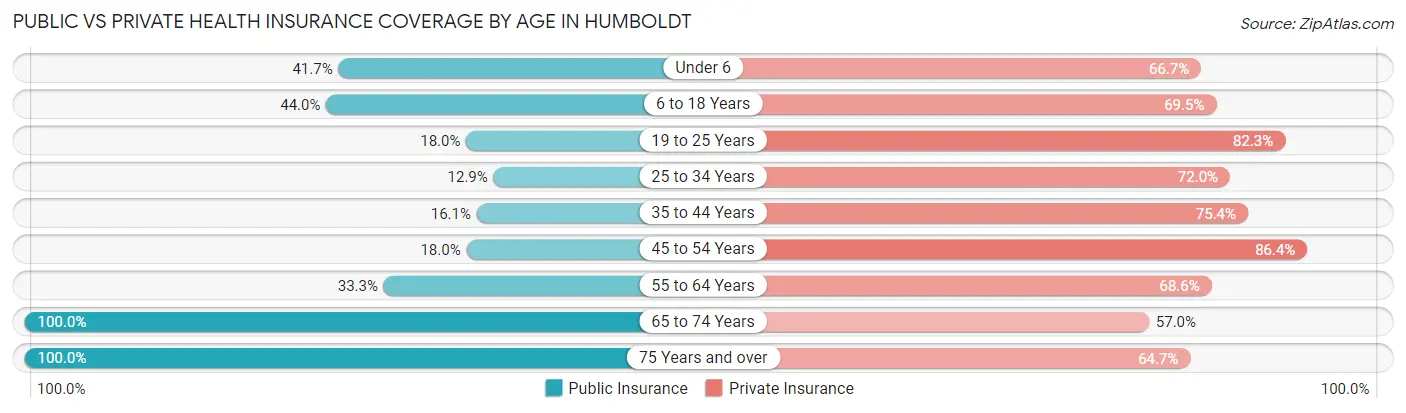
| Age Bracket | Public Insurance | Private Insurance |
| Under 6 | 134 (41.7%) | 214 (66.7%) |
| 6 to 18 Years | 352 (44.0%) | 556 (69.5%) |
| 19 to 25 Years | 60 (18.0%) | 274 (82.3%) |
| 25 to 34 Years | 62 (12.9%) | 345 (72.0%) |
| 35 to 44 Years | 90 (16.1%) | 422 (75.4%) |
| 45 to 54 Years | 66 (18.0%) | 317 (86.4%) |
| 55 to 64 Years | 238 (33.3%) | 490 (68.6%) |
| 65 to 74 Years | 565 (100.0%) | 322 (57.0%) |
| 75 Years and over | 532 (100.0%) | 344 (64.7%) |
| Total | 2,099 (44.9%) | 3,284 (70.3%) |
Disability Status by Sex by Age in Humboldt
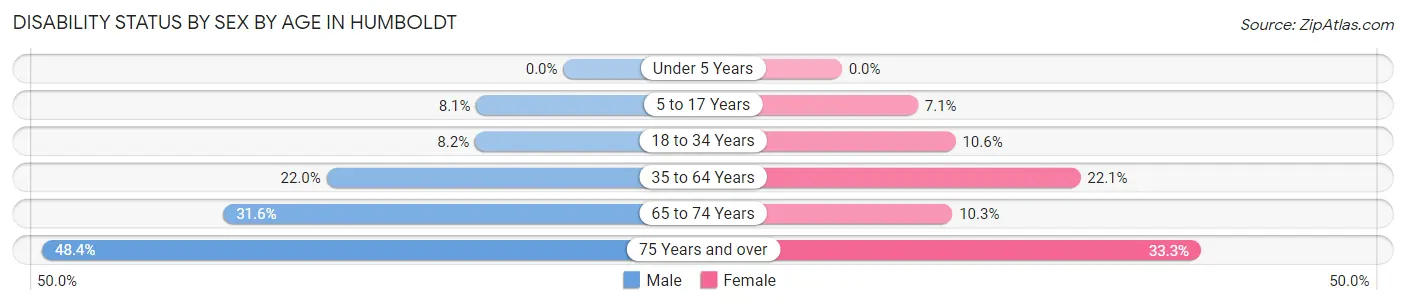
| Age Bracket | Male | Female |
| Under 5 Years | 0 (0.0%) | 0 (0.0%) |
| 5 to 17 Years | 36 (8.1%) | 25 (7.1%) |
| 18 to 34 Years | 40 (8.2%) | 40 (10.5%) |
| 35 to 64 Years | 178 (22.0%) | 184 (22.1%) |
| 65 to 74 Years | 89 (31.6%) | 29 (10.2%) |
| 75 Years and over | 89 (48.4%) | 116 (33.3%) |
Disability Class by Sex by Age in Humboldt
Disability Class: Hearing Difficulty
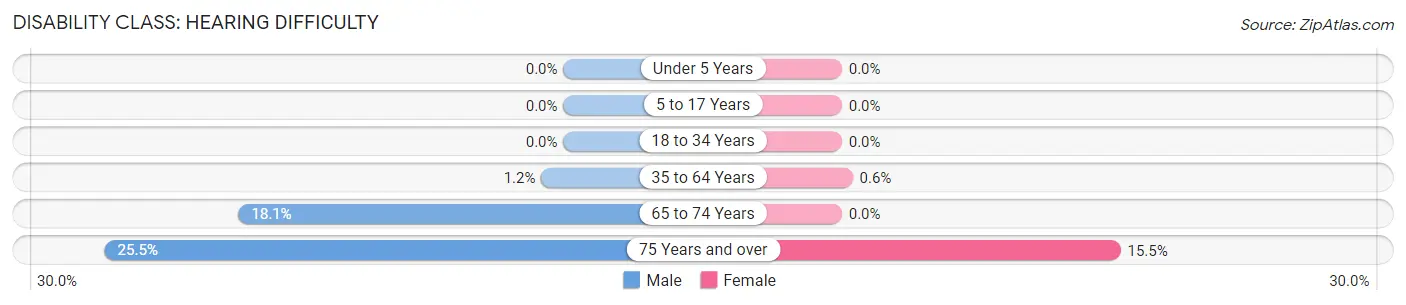
| Age Bracket | Male | Female |
| Under 5 Years | 0 (0.0%) | 0 (0.0%) |
| 5 to 17 Years | 0 (0.0%) | 0 (0.0%) |
| 18 to 34 Years | 0 (0.0%) | 0 (0.0%) |
| 35 to 64 Years | 10 (1.2%) | 5 (0.6%) |
| 65 to 74 Years | 51 (18.1%) | 0 (0.0%) |
| 75 Years and over | 47 (25.5%) | 54 (15.5%) |
Disability Class: Vision Difficulty
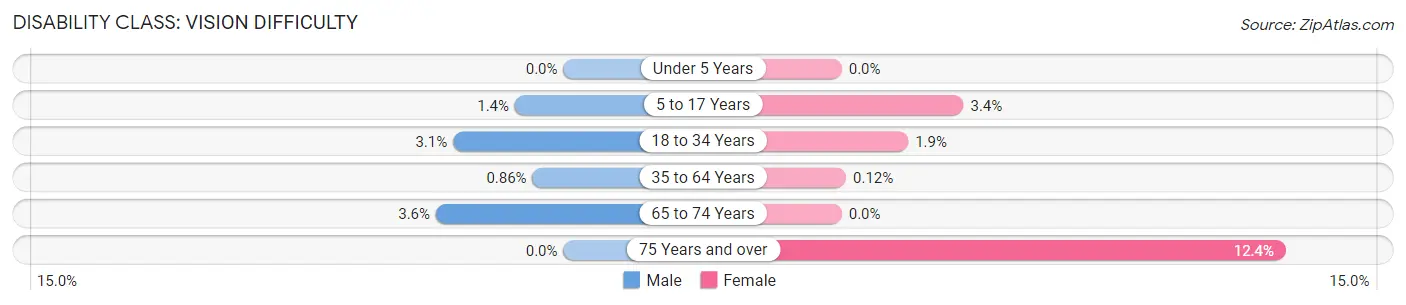
| Age Bracket | Male | Female |
| Under 5 Years | 0 (0.0%) | 0 (0.0%) |
| 5 to 17 Years | 6 (1.3%) | 12 (3.4%) |
| 18 to 34 Years | 15 (3.1%) | 7 (1.8%) |
| 35 to 64 Years | 7 (0.9%) | 1 (0.1%) |
| 65 to 74 Years | 10 (3.5%) | 0 (0.0%) |
| 75 Years and over | 0 (0.0%) | 43 (12.4%) |
Disability Class: Cognitive Difficulty
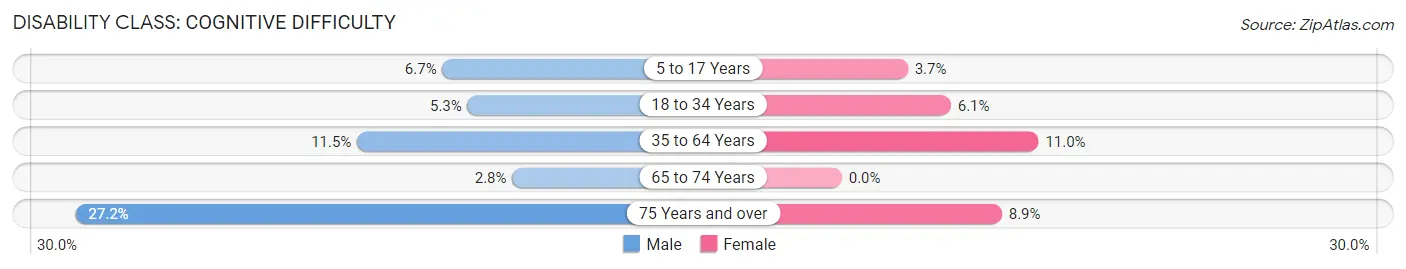
| Age Bracket | Male | Female |
| 5 to 17 Years | 30 (6.7%) | 13 (3.7%) |
| 18 to 34 Years | 26 (5.3%) | 23 (6.1%) |
| 35 to 64 Years | 93 (11.5%) | 91 (11.0%) |
| 65 to 74 Years | 8 (2.8%) | 0 (0.0%) |
| 75 Years and over | 50 (27.2%) | 31 (8.9%) |
Disability Class: Ambulatory Difficulty
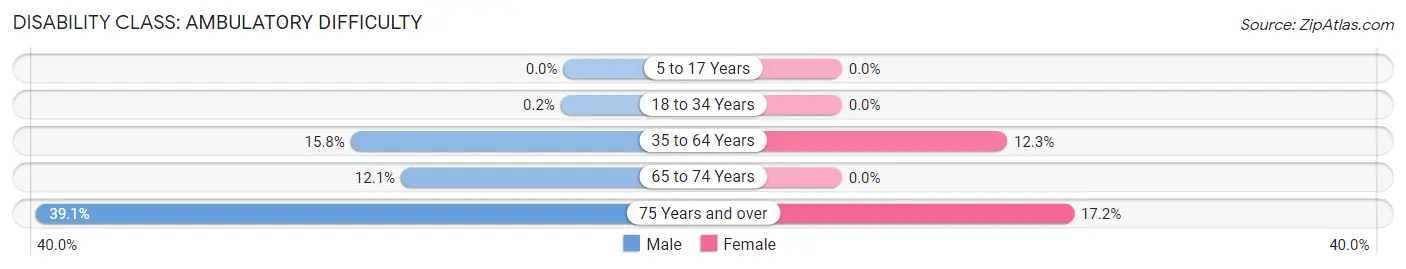
| Age Bracket | Male | Female |
| 5 to 17 Years | 0 (0.0%) | 0 (0.0%) |
| 18 to 34 Years | 1 (0.2%) | 0 (0.0%) |
| 35 to 64 Years | 128 (15.8%) | 102 (12.3%) |
| 65 to 74 Years | 34 (12.1%) | 0 (0.0%) |
| 75 Years and over | 72 (39.1%) | 60 (17.2%) |
Disability Class: Self-Care Difficulty
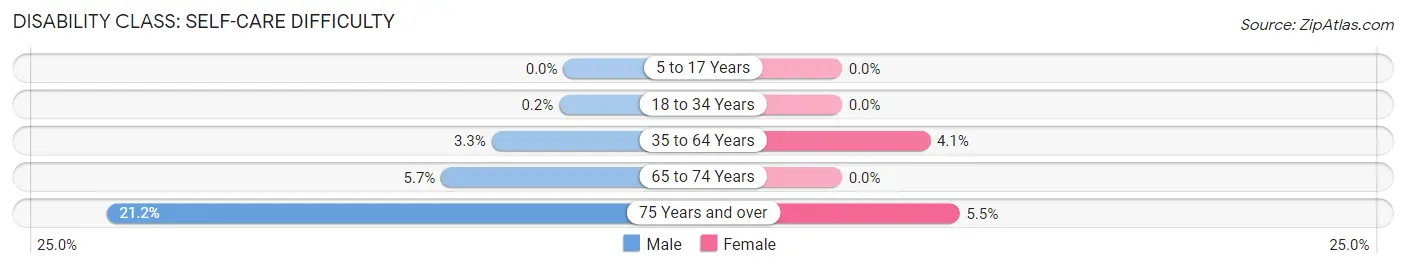
| Age Bracket | Male | Female |
| 5 to 17 Years | 0 (0.0%) | 0 (0.0%) |
| 18 to 34 Years | 1 (0.2%) | 0 (0.0%) |
| 35 to 64 Years | 27 (3.3%) | 34 (4.1%) |
| 65 to 74 Years | 16 (5.7%) | 0 (0.0%) |
| 75 Years and over | 39 (21.2%) | 19 (5.5%) |
Technology Access in Humboldt
Computing Device Access in Humboldt
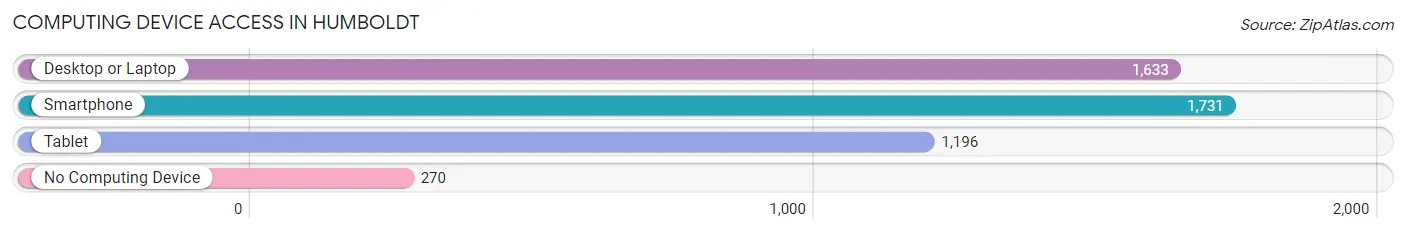
| Device Type | # Households | % Households |
| Desktop or Laptop | 1,633 | 75.2% |
| Smartphone | 1,731 | 79.7% |
| Tablet | 1,196 | 55.1% |
| No Computing Device | 270 | 12.4% |
| Total | 2,172 | 100.0% |
Internet Access in Humboldt
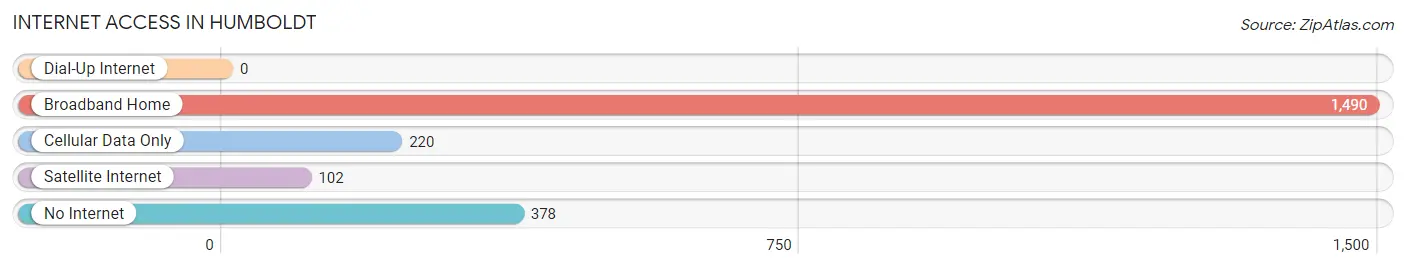
| Internet Type | # Households | % Households |
| Dial-Up Internet | 0 | 0.0% |
| Broadband Home | 1,490 | 68.6% |
| Cellular Data Only | 220 | 10.1% |
| Satellite Internet | 102 | 4.7% |
| No Internet | 378 | 17.4% |
| Total | 2,172 | 100.0% |
Humboldt Summary
Humboldt, Iowa is a small city located in the northern part of the state, in Humboldt County. It is situated on the banks of the Des Moines River, and is the county seat of Humboldt County. The city has a population of approximately 5,000 people, and is the largest city in the county.
History
Humboldt was founded in 1854 by a group of settlers from Germany. The city was named after the German naturalist and explorer Alexander von Humboldt. The city was incorporated in 1858, and the first mayor was elected in 1859.
The city grew rapidly in the late 19th century, and by the early 20th century, it had become a major agricultural center. The city was also home to several manufacturing companies, including a flour mill, a brickyard, and a furniture factory.
In the 1950s, the city began to experience a decline in population, as many of its residents moved away to larger cities. However, in recent years, the city has seen a resurgence in population, as people have moved back to the area to take advantage of the city's low cost of living and its proximity to larger cities.
Geography
Humboldt is located in the northern part of Iowa, in Humboldt County. The city is situated on the banks of the Des Moines River, and is surrounded by rolling hills and farmland. The city is located approximately 50 miles north of Des Moines, and is about a two-hour drive from Minneapolis, Minnesota.
The city has a total area of 4.2 square miles, of which 4.1 square miles is land and 0.1 square miles is water. The city has a humid continental climate, with hot summers and cold winters.
Economy
Humboldt's economy is largely based on agriculture and manufacturing. The city is home to several large agricultural companies, including Humboldt Seed Company, which produces a variety of vegetable and flower seeds. The city is also home to several manufacturing companies, including a furniture factory, a flour mill, and a brickyard.
The city is also home to several retail stores, restaurants, and other businesses. The city is served by the Humboldt Municipal Airport, which provides air service to the city and the surrounding area.
Demographics
As of the 2010 census, the population of Humboldt was 5,000 people. The racial makeup of the city was 95.2% White, 0.7% African American, 0.3% Native American, 0.7% Asian, 0.1% Pacific Islander, 1.2% from other races, and 1.7% from two or more races. Hispanic or Latino of any race were 3.2% of the population.
The median income for a household in the city was $41,250, and the median income for a family was $50,000. The per capita income for the city was $20,845. About 11.2% of families and 14.2% of the population were below the poverty line, including 18.2% of those under age 18 and 8.2% of those age 65 or over.
Common Questions
What is Per Capita Income in Humboldt?
Per Capita income in Humboldt is $37,378.
What is the Median Family Income in Humboldt?
Median Family Income in Humboldt is $81,761.
What is the Median Household income in Humboldt?
Median Household Income in Humboldt is $68,085.
What is Income or Wage Gap in Humboldt?
Income or Wage Gap in Humboldt is 40.1%.
Women in Humboldt earn 59.9 cents for every dollar earned by a man.
What is Inequality or Gini Index in Humboldt?
Inequality or Gini Index in Humboldt is 0.44.
What is the Total Population of Humboldt?
Total Population of Humboldt is 4,774.
What is the Total Male Population of Humboldt?
Total Male Population of Humboldt is 2,425.
What is the Total Female Population of Humboldt?
Total Female Population of Humboldt is 2,349.
What is the Ratio of Males per 100 Females in Humboldt?
There are 103.24 Males per 100 Females in Humboldt.
What is the Ratio of Females per 100 Males in Humboldt?
There are 96.87 Females per 100 Males in Humboldt.
What is the Median Population Age in Humboldt?
Median Population Age in Humboldt is 41.9 Years.
What is the Average Family Size in Humboldt
Average Family Size in Humboldt is 2.8 People.
What is the Average Household Size in Humboldt
Average Household Size in Humboldt is 2.1 People.
How Large is the Labor Force in Humboldt?
There are 2,271 People in the Labor Forcein in Humboldt.
What is the Percentage of People in the Labor Force in Humboldt?
60.6% of People are in the Labor Force in Humboldt.
What is the Unemployment Rate in Humboldt?
Unemployment Rate in Humboldt is 0.7%.