Hull, IA Map & Demographics
Hull Map
Hull Overview
$39,431
PER CAPITA INCOME
$78,000
AVG FAMILY INCOME
$69,583
AVG HOUSEHOLD INCOME
58.2%
WAGE / INCOME GAP [ % ]
41.8¢/ $1
WAGE / INCOME GAP [ $ ]
0.45
INEQUALITY / GINI INDEX
2,340
TOTAL POPULATION
1,159
MALE POPULATION
1,181
FEMALE POPULATION
98.14
MALES / 100 FEMALES
101.90
FEMALES / 100 MALES
35.3
MEDIAN AGE
3.1
AVG FAMILY SIZE
2.8
AVG HOUSEHOLD SIZE
1,372
LABOR FORCE [ PEOPLE ]
74.9%
PERCENT IN LABOR FORCE
3.4%
UNEMPLOYMENT RATE
Hull Zip Codes
Hull Area Codes
Income in Hull
Income Overview in Hull
Per Capita Income in Hull is $39,431, while median incomes of families and households are $78,000 and $69,583 respectively.
| Characteristic | Number | Measure |
| Per Capita Income | 2,340 | $39,431 |
| Median Family Income | 618 | $78,000 |
| Mean Family Income | 618 | $115,330 |
| Median Household Income | 826 | $69,583 |
| Mean Household Income | 826 | $100,745 |
| Income Deficit | 618 | $0 |
| Wage / Income Gap (%) | 2,340 | 58.18% |
| Wage / Income Gap ($) | 2,340 | 41.82¢ per $1 |
| Gini / Inequality Index | 2,340 | 0.45 |
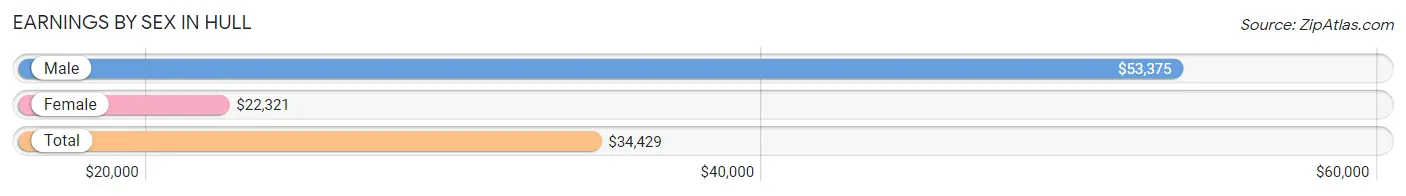
Earnings by Sex in Hull
Average Earnings in Hull are $34,429, $53,375 for men and $22,321 for women, a difference of 58.2%.
| Sex | Number | Average Earnings |
| Male | 770 (53.5%) | $53,375 |
| Female | 668 (46.5%) | $22,321 |
| Total | 1,438 (100.0%) | $34,429 |
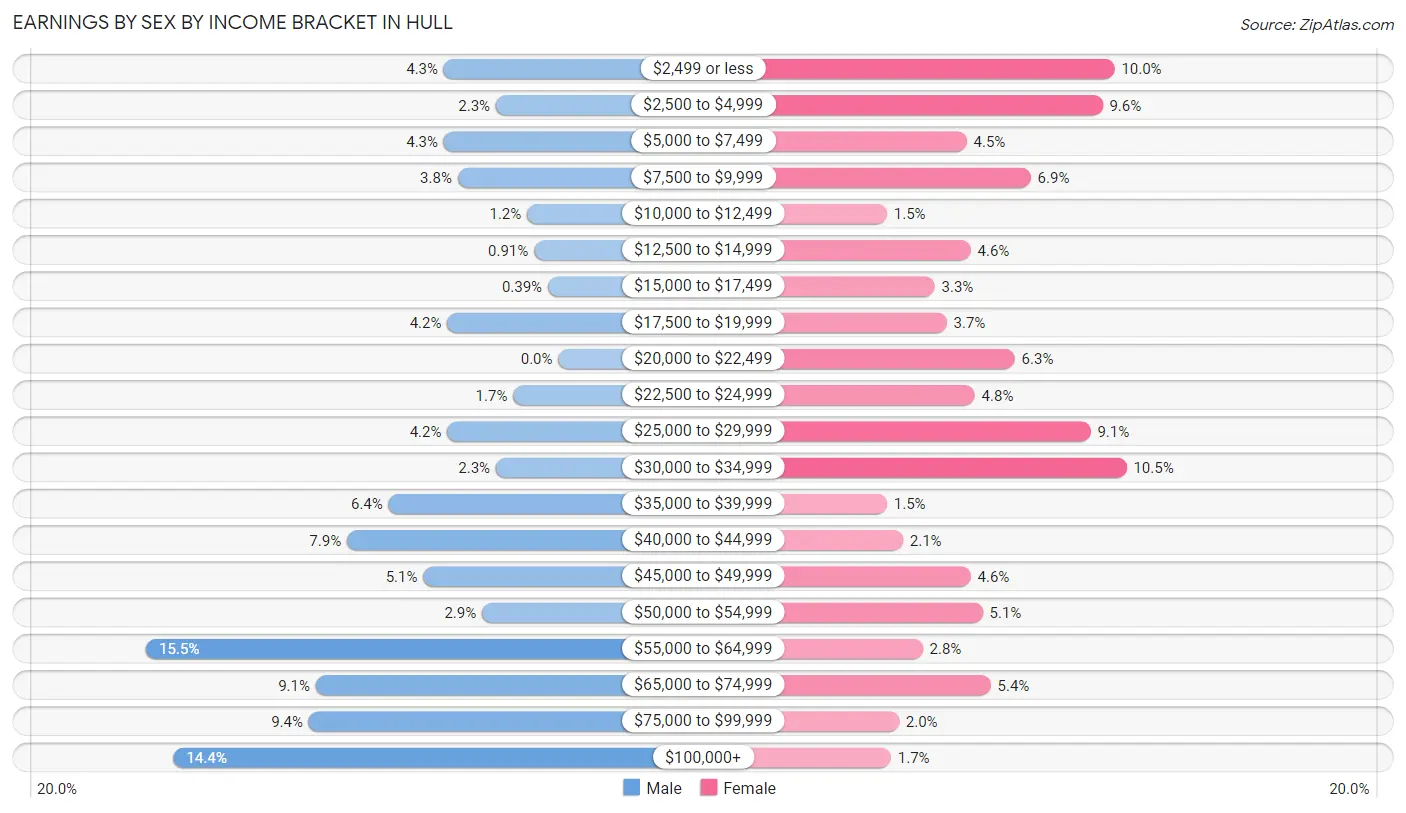
Earnings by Sex by Income Bracket in Hull
The most common earnings brackets in Hull are $55,000 to $64,999 for men (119 | 15.4%) and $30,000 to $34,999 for women (70 | 10.5%).
| Income | Male | Female |
| $2,499 or less | 33 (4.3%) | 67 (10.0%) |
| $2,500 to $4,999 | 18 (2.3%) | 64 (9.6%) |
| $5,000 to $7,499 | 33 (4.3%) | 30 (4.5%) |
| $7,500 to $9,999 | 29 (3.8%) | 46 (6.9%) |
| $10,000 to $12,499 | 9 (1.2%) | 10 (1.5%) |
| $12,500 to $14,999 | 7 (0.9%) | 31 (4.6%) |
| $15,000 to $17,499 | 3 (0.4%) | 22 (3.3%) |
| $17,500 to $19,999 | 32 (4.2%) | 25 (3.7%) |
| $20,000 to $22,499 | 0 (0.0%) | 42 (6.3%) |
| $22,500 to $24,999 | 13 (1.7%) | 32 (4.8%) |
| $25,000 to $29,999 | 32 (4.2%) | 61 (9.1%) |
| $30,000 to $34,999 | 18 (2.3%) | 70 (10.5%) |
| $35,000 to $39,999 | 49 (6.4%) | 10 (1.5%) |
| $40,000 to $44,999 | 61 (7.9%) | 14 (2.1%) |
| $45,000 to $49,999 | 39 (5.1%) | 31 (4.6%) |
| $50,000 to $54,999 | 22 (2.9%) | 34 (5.1%) |
| $55,000 to $64,999 | 119 (15.4%) | 19 (2.8%) |
| $65,000 to $74,999 | 70 (9.1%) | 36 (5.4%) |
| $75,000 to $99,999 | 72 (9.3%) | 13 (1.9%) |
| $100,000+ | 111 (14.4%) | 11 (1.7%) |
| Total | 770 (100.0%) | 668 (100.0%) |
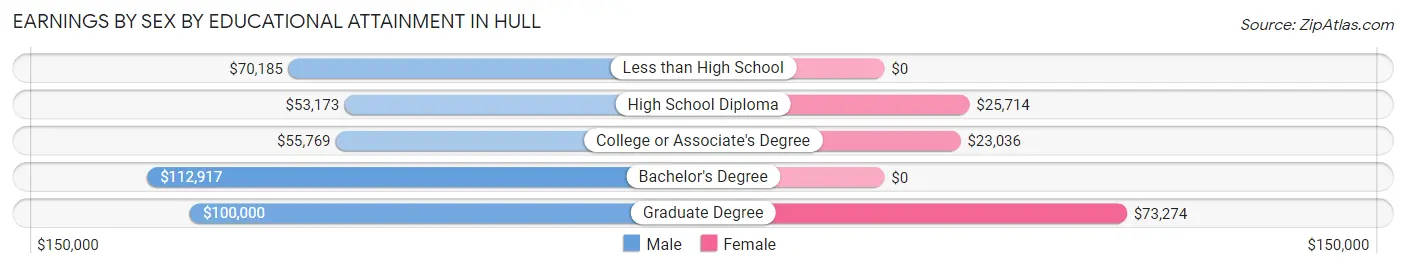
Earnings by Sex by Educational Attainment in Hull
Average earnings in Hull are $57,288 for men and $27,813 for women, a difference of 51.4%. Men with an educational attainment of bachelor's degree enjoy the highest average annual earnings of $112,917, while those with high school diploma education earn the least with $53,173. Women with an educational attainment of graduate degree earn the most with the average annual earnings of $73,274, while those with college or associate's degree education have the smallest earnings of $23,036.
| Educational Attainment | Male Income | Female Income |
| Less than High School | $70,185 | $0 |
| High School Diploma | $53,173 | $25,714 |
| College or Associate's Degree | $55,769 | $23,036 |
| Bachelor's Degree | $112,917 | $0 |
| Graduate Degree | $100,000 | $73,274 |
| Total | $57,288 | $27,813 |
Family Income in Hull
Family Income Brackets in Hull
According to the Hull family income data, there are 145 families falling into the $50,000 to $74,999 income range, which is the most common income bracket and makes up 23.5% of all families.
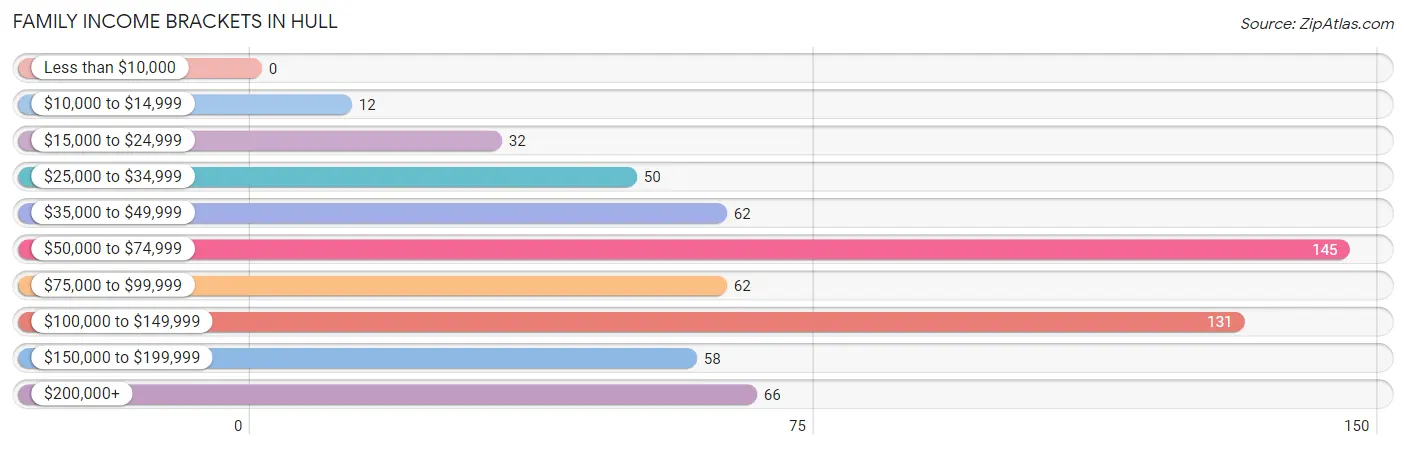
| Income Bracket | # Families | % Families |
| Less than $10,000 | 0 | 0.0% |
| $10,000 to $14,999 | 12 | 1.9% |
| $15,000 to $24,999 | 32 | 5.2% |
| $25,000 to $34,999 | 50 | 8.1% |
| $35,000 to $49,999 | 62 | 10.0% |
| $50,000 to $74,999 | 145 | 23.5% |
| $75,000 to $99,999 | 62 | 10.0% |
| $100,000 to $149,999 | 131 | 21.2% |
| $150,000 to $199,999 | 58 | 9.4% |
| $200,000+ | 66 | 10.7% |
Family Income by Famaliy Size in Hull
6-person families (32 | 5.2%) account for the highest median family income in Hull with $143,000 per family, while 2-person families (309 | 50.0%) have the highest median income of $38,875 per family member.
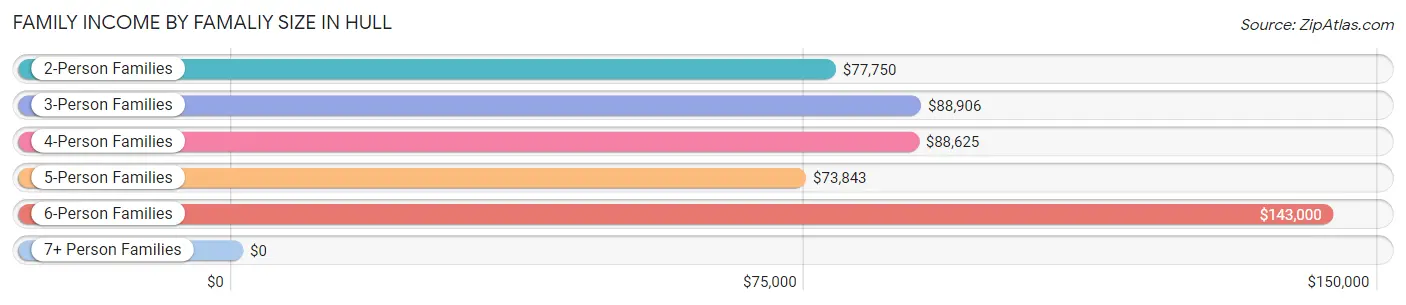
| Income Bracket | # Families | Median Income |
| 2-Person Families | 309 (50.0%) | $77,750 |
| 3-Person Families | 117 (18.9%) | $88,906 |
| 4-Person Families | 65 (10.5%) | $88,625 |
| 5-Person Families | 95 (15.4%) | $73,843 |
| 6-Person Families | 32 (5.2%) | $143,000 |
| 7+ Person Families | 0 (0.0%) | $0 |
| Total | 618 (100.0%) | $78,000 |
Family Income by Number of Earners in Hull
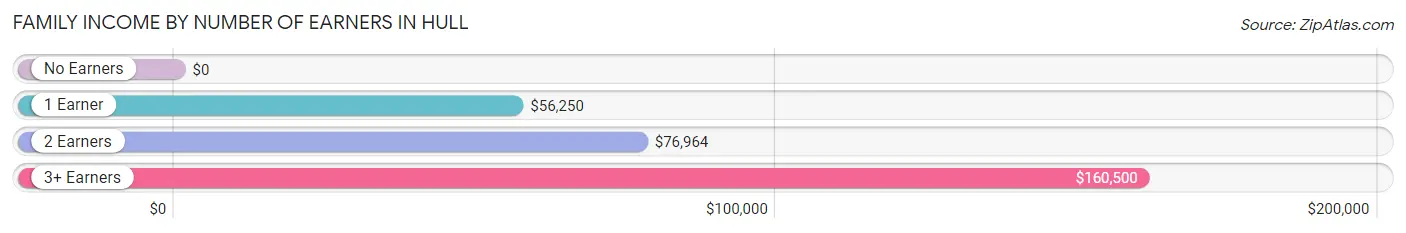
| Number of Earners | # Families | Median Income |
| No Earners | 73 (11.8%) | $0 |
| 1 Earner | 90 (14.6%) | $56,250 |
| 2 Earners | 363 (58.7%) | $76,964 |
| 3+ Earners | 92 (14.9%) | $160,500 |
| Total | 618 (100.0%) | $78,000 |
Household Income in Hull
Household Income Brackets in Hull
With 194 households falling in the category, the $50,000 to $74,999 income range is the most frequent in Hull, accounting for 23.5% of all households. In contrast, only 4 households (0.5%) fall into the less than $10,000 income bracket, making it the least populous group.
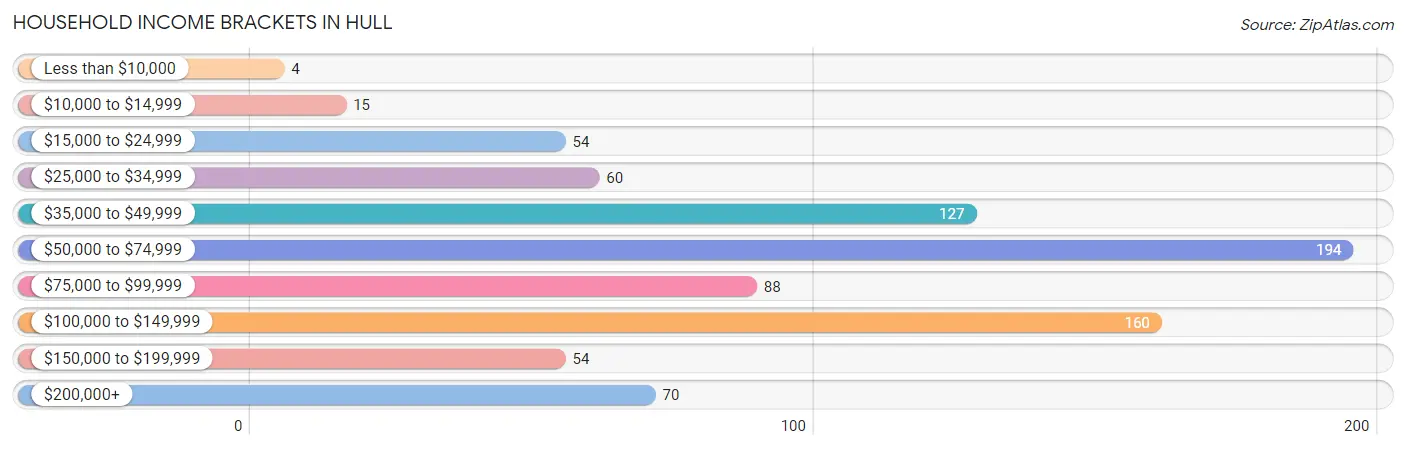
| Income Bracket | # Households | % Households |
| Less than $10,000 | 4 | 0.5% |
| $10,000 to $14,999 | 15 | 1.8% |
| $15,000 to $24,999 | 54 | 6.5% |
| $25,000 to $34,999 | 60 | 7.3% |
| $35,000 to $49,999 | 127 | 15.4% |
| $50,000 to $74,999 | 194 | 23.5% |
| $75,000 to $99,999 | 88 | 10.7% |
| $100,000 to $149,999 | 160 | 19.4% |
| $150,000 to $199,999 | 54 | 6.5% |
| $200,000+ | 70 | 8.5% |
Household Income by Householder Age in Hull
The median household income in Hull is $69,583, with the highest median household income of $88,958 found in the 45 to 64 years age bracket for the primary householder. A total of 301 households (36.4%) fall into this category. Meanwhile, the 15 to 24 years age bracket for the primary householder has the lowest median household income of $0, with 66 households (8.0%) in this group.
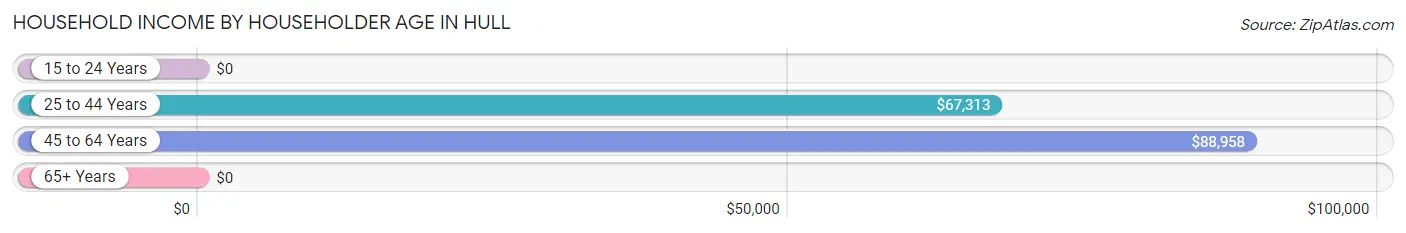
| Income Bracket | # Households | Median Income |
| 15 to 24 Years | 66 (8.0%) | $0 |
| 25 to 44 Years | 253 (30.6%) | $67,313 |
| 45 to 64 Years | 301 (36.4%) | $88,958 |
| 65+ Years | 206 (24.9%) | $0 |
| Total | 826 (100.0%) | $69,583 |
Poverty in Hull
Income Below Poverty by Sex and Age in Hull
With 8.6% poverty level for males and 8.6% for females among the residents of Hull, 6 to 11 year old males and 15 year old females are the most vulnerable to poverty, with 26 males (34.7%) and 11 females (39.3%) in their respective age groups living below the poverty level.
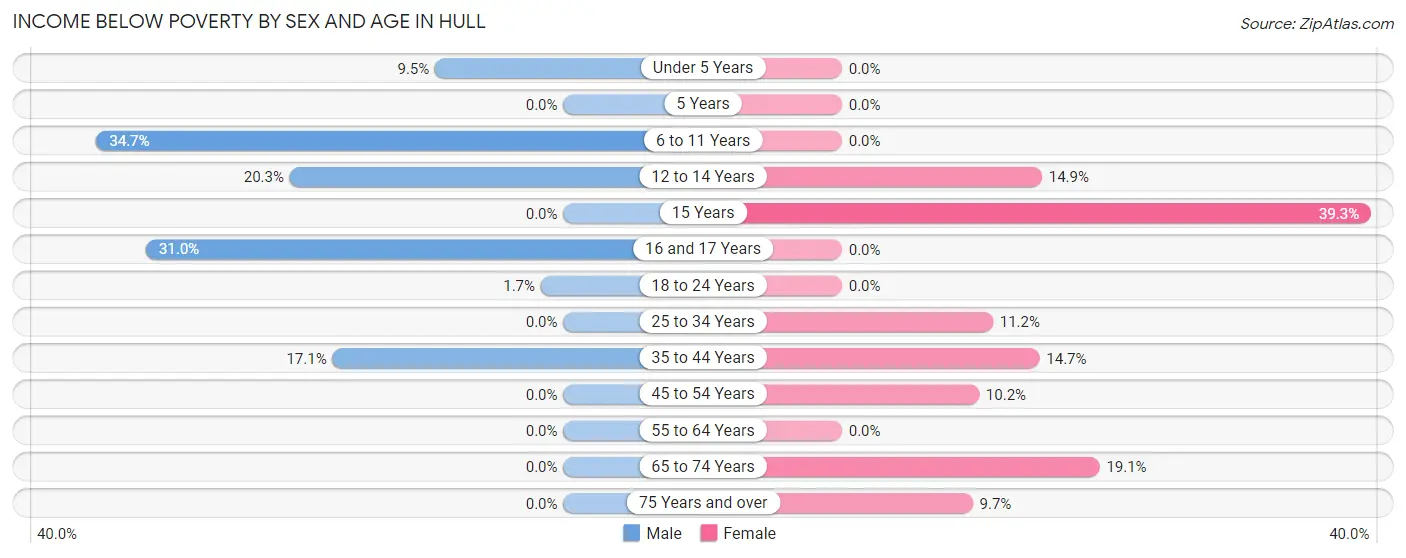
| Age Bracket | Male | Female |
| Under 5 Years | 12 (9.5%) | 0 (0.0%) |
| 5 Years | 0 (0.0%) | 0 (0.0%) |
| 6 to 11 Years | 26 (34.7%) | 0 (0.0%) |
| 12 to 14 Years | 13 (20.3%) | 15 (14.8%) |
| 15 Years | 0 (0.0%) | 11 (39.3%) |
| 16 and 17 Years | 22 (31.0%) | 0 (0.0%) |
| 18 to 24 Years | 2 (1.7%) | 0 (0.0%) |
| 25 to 34 Years | 0 (0.0%) | 12 (11.2%) |
| 35 to 44 Years | 24 (17.1%) | 11 (14.7%) |
| 45 to 54 Years | 0 (0.0%) | 17 (10.2%) |
| 55 to 64 Years | 0 (0.0%) | 0 (0.0%) |
| 65 to 74 Years | 0 (0.0%) | 22 (19.1%) |
| 75 Years and over | 0 (0.0%) | 10 (9.7%) |
| Total | 99 (8.6%) | 98 (8.6%) |
Income Above Poverty by Sex and Age in Hull
According to the poverty statistics in Hull, males aged 5 years and females aged under 5 years are the age groups that are most secure financially, with 100.0% of males and 100.0% of females in these age groups living above the poverty line.
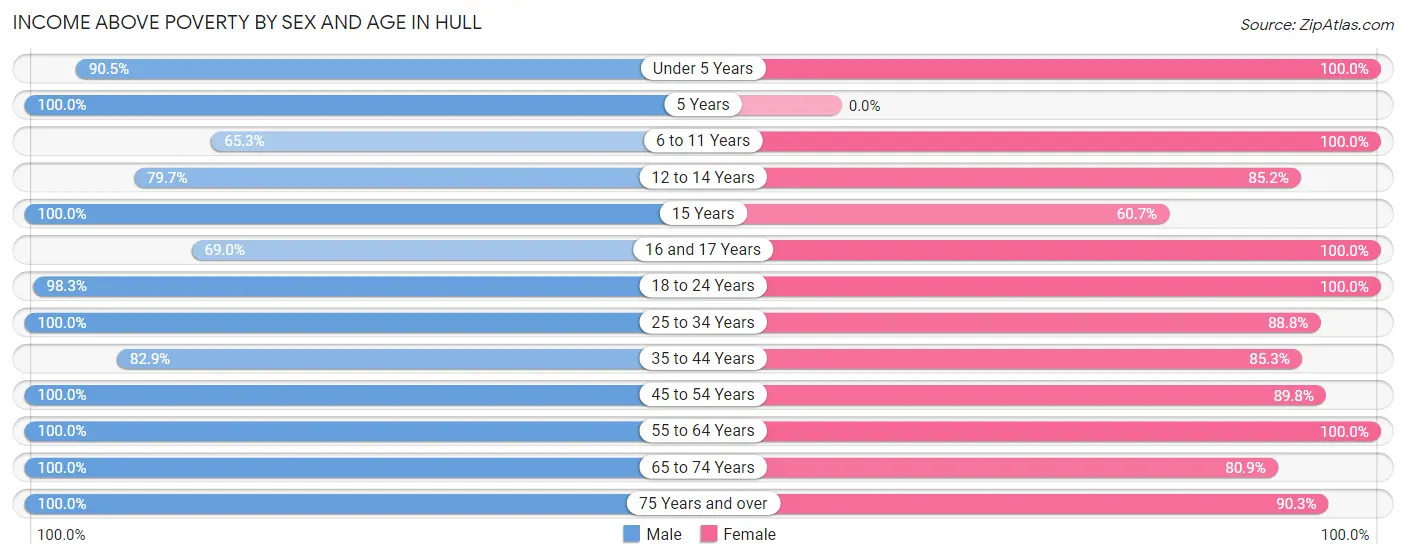
| Age Bracket | Male | Female |
| Under 5 Years | 114 (90.5%) | 28 (100.0%) |
| 5 Years | 7 (100.0%) | 0 (0.0%) |
| 6 to 11 Years | 49 (65.3%) | 61 (100.0%) |
| 12 to 14 Years | 51 (79.7%) | 86 (85.2%) |
| 15 Years | 10 (100.0%) | 17 (60.7%) |
| 16 and 17 Years | 49 (69.0%) | 38 (100.0%) |
| 18 to 24 Years | 118 (98.3%) | 178 (100.0%) |
| 25 to 34 Years | 144 (100.0%) | 95 (88.8%) |
| 35 to 44 Years | 116 (82.9%) | 64 (85.3%) |
| 45 to 54 Years | 131 (100.0%) | 150 (89.8%) |
| 55 to 64 Years | 150 (100.0%) | 134 (100.0%) |
| 65 to 74 Years | 63 (100.0%) | 93 (80.9%) |
| 75 Years and over | 51 (100.0%) | 93 (90.3%) |
| Total | 1,053 (91.4%) | 1,037 (91.4%) |
Income Below Poverty Among Married-Couple Families in Hull
The poverty statistics for married-couple families in Hull show that 2.2% or 12 of the total 540 families live below the poverty line. Families with 3 or 4 children have the highest poverty rate of 20.7%, comprising of 12 families. On the other hand, families with no children have the lowest poverty rate of 0.0%, which includes 0 families.
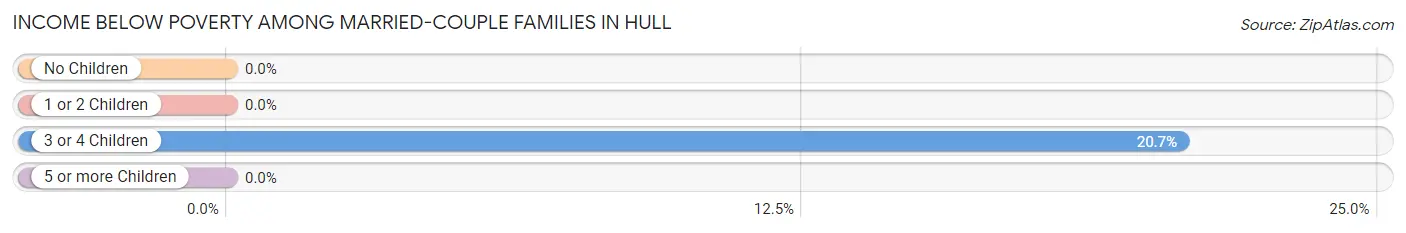
| Children | Above Poverty | Below Poverty |
| No Children | 306 (100.0%) | 0 (0.0%) |
| 1 or 2 Children | 176 (100.0%) | 0 (0.0%) |
| 3 or 4 Children | 46 (79.3%) | 12 (20.7%) |
| 5 or more Children | 0 (0.0%) | 0 (0.0%) |
| Total | 528 (97.8%) | 12 (2.2%) |
Income Below Poverty Among Single-Parent Households in Hull
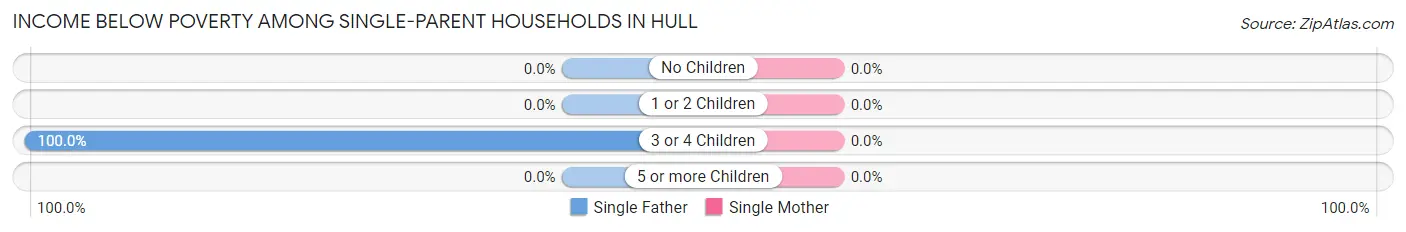
| Children | Single Father | Single Mother |
| No Children | 0 (0.0%) | 0 (0.0%) |
| 1 or 2 Children | 0 (0.0%) | 0 (0.0%) |
| 3 or 4 Children | 12 (100.0%) | 0 (0.0%) |
| 5 or more Children | 0 (0.0%) | 0 (0.0%) |
| Total | 12 (27.9%) | 0 (0.0%) |
Income Below Poverty Among Married-Couple vs Single-Parent Households in Hull
The poverty data for Hull shows that 12 of the married-couple family households (2.2%) and 12 of the single-parent households (15.4%) are living below the poverty level. Within the married-couple family households, those with 3 or 4 children have the highest poverty rate, with 12 households (20.7%) falling below the poverty line. Among the single-parent households, those with 3 or 4 children have the highest poverty rate, with 12 household (100.0%) living below poverty.
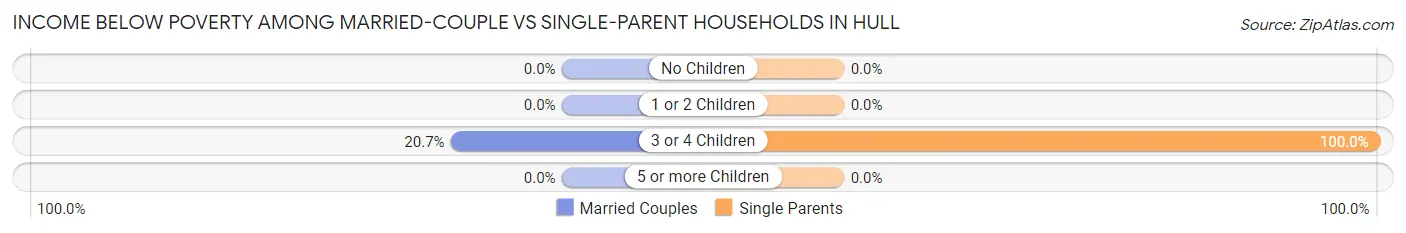
| Children | Married-Couple Families | Single-Parent Households |
| No Children | 0 (0.0%) | 0 (0.0%) |
| 1 or 2 Children | 0 (0.0%) | 0 (0.0%) |
| 3 or 4 Children | 12 (20.7%) | 12 (100.0%) |
| 5 or more Children | 0 (0.0%) | 0 (0.0%) |
| Total | 12 (2.2%) | 12 (15.4%) |
Race in Hull
The most populous races in Hull are White / Caucasian (2,056 | 87.9%), Hispanic or Latino (317 | 13.6%), and Some other Race (187 | 8.0%).
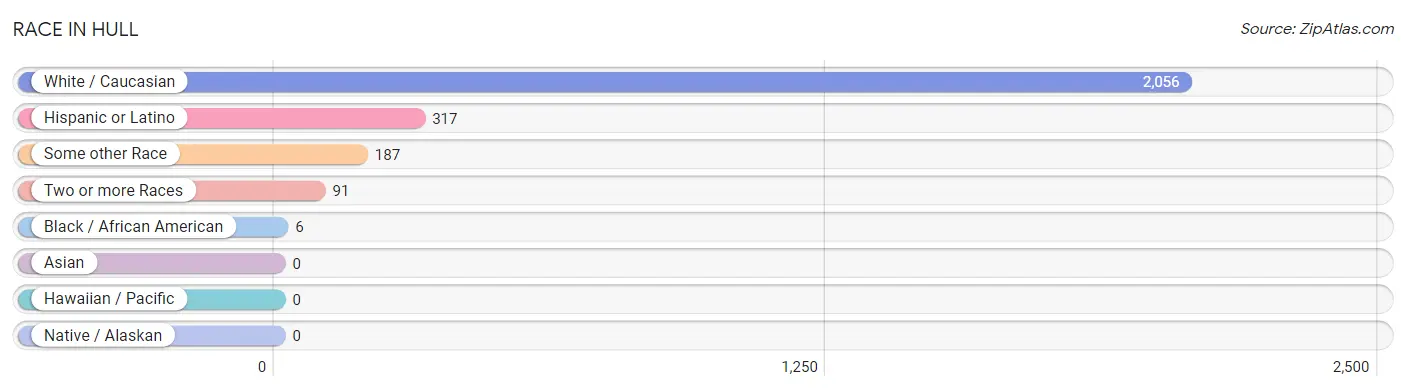
| Race | # Population | % Population |
| Asian | 0 | 0.0% |
| Black / African American | 6 | 0.3% |
| Hawaiian / Pacific | 0 | 0.0% |
| Hispanic or Latino | 317 | 13.6% |
| Native / Alaskan | 0 | 0.0% |
| White / Caucasian | 2,056 | 87.9% |
| Two or more Races | 91 | 3.9% |
| Some other Race | 187 | 8.0% |
| Total | 2,340 | 100.0% |
Ancestry in Hull
The most populous ancestries reported in Hull are Dutch (1,080 | 46.2%), German (391 | 16.7%), Mexican (290 | 12.4%), Norwegian (117 | 5.0%), and American (107 | 4.6%), together accounting for 84.8% of all Hull residents.
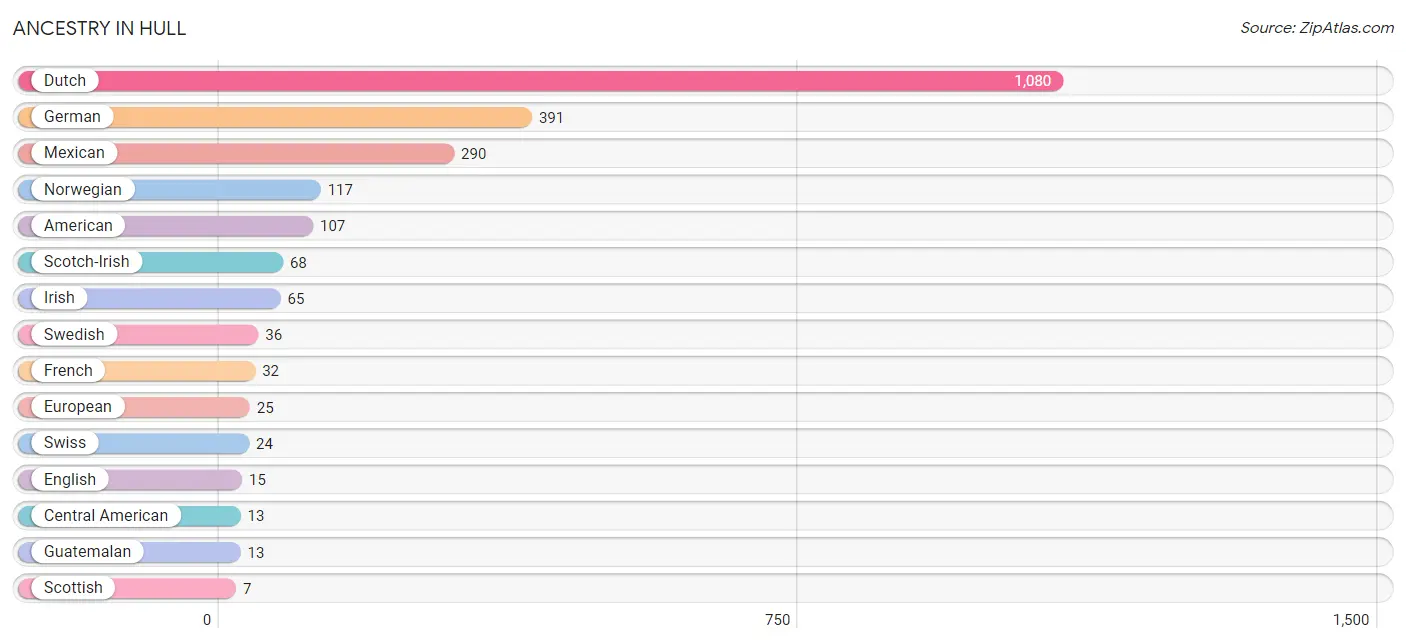
| Ancestry | # Population | % Population |
| American | 107 | 4.6% |
| Central American | 13 | 0.6% |
| Czechoslovakian | 5 | 0.2% |
| Danish | 5 | 0.2% |
| Dutch | 1,080 | 46.2% |
| English | 15 | 0.6% |
| European | 25 | 1.1% |
| French | 32 | 1.4% |
| German | 391 | 16.7% |
| Guatemalan | 13 | 0.6% |
| Irish | 65 | 2.8% |
| Mexican | 290 | 12.4% |
| Northern European | 2 | 0.1% |
| Norwegian | 117 | 5.0% |
| Scotch-Irish | 68 | 2.9% |
| Scottish | 7 | 0.3% |
| Swedish | 36 | 1.5% |
| Swiss | 24 | 1.0% | View All 18 Rows |
Immigrants in Hull
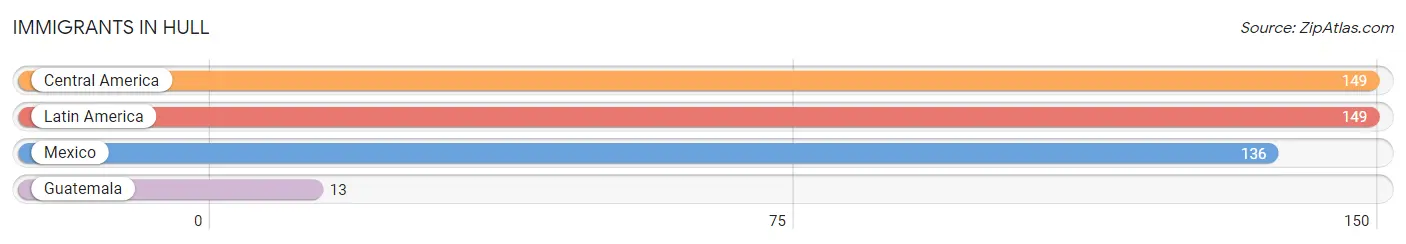
The most numerous immigrant groups reported in Hull came from Central America (149 | 6.4%), Latin America (149 | 6.4%), Mexico (136 | 5.8%), and Guatemala (13 | 0.6%), together accounting for 19.1% of all Hull residents.
| Immigration Origin | # Population | % Population |
| Central America | 149 | 6.4% |
| Guatemala | 13 | 0.6% |
| Latin America | 149 | 6.4% |
| Mexico | 136 | 5.8% | View All 4 Rows |
Sex and Age in Hull
Sex and Age in Hull
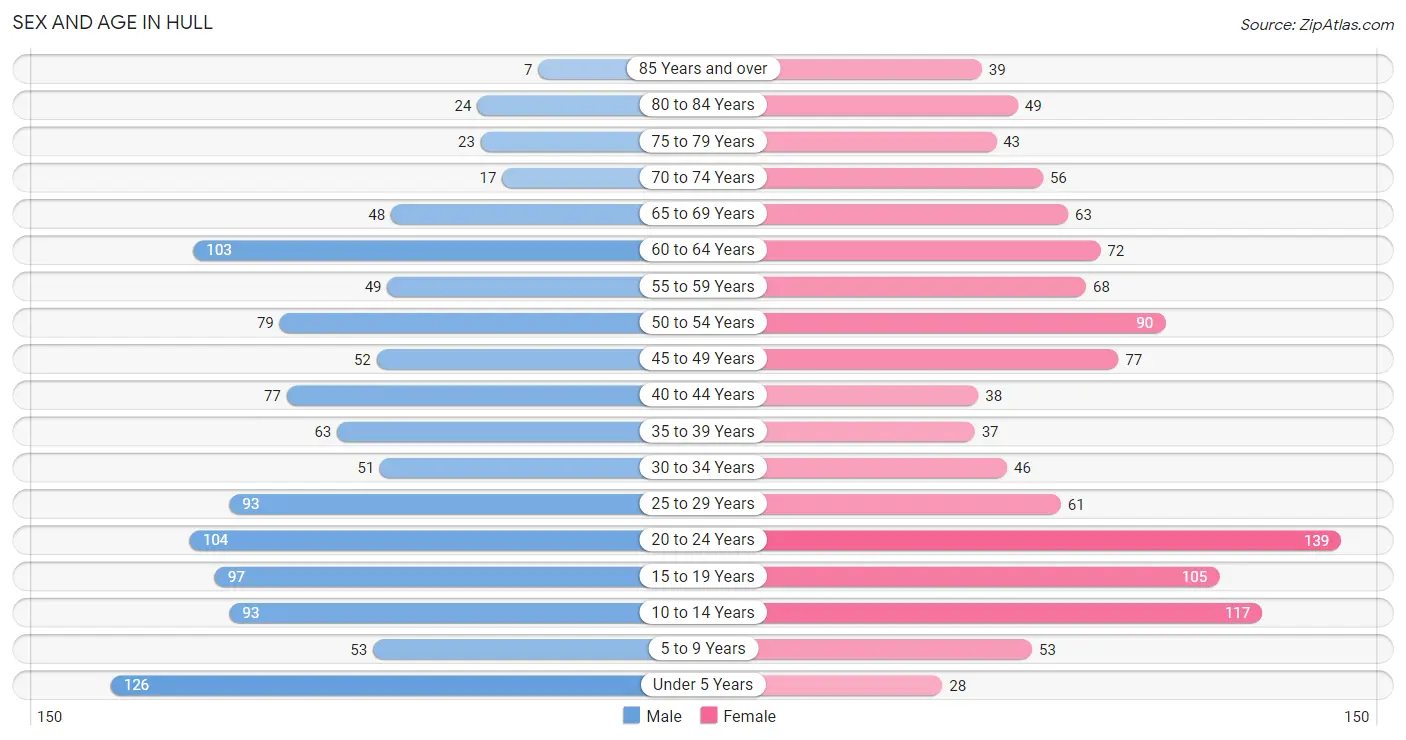
The most populous age groups in Hull are Under 5 Years (126 | 10.9%) for men and 20 to 24 Years (139 | 11.8%) for women.
| Age Bracket | Male | Female |
| Under 5 Years | 126 (10.9%) | 28 (2.4%) |
| 5 to 9 Years | 53 (4.6%) | 53 (4.5%) |
| 10 to 14 Years | 93 (8.0%) | 117 (9.9%) |
| 15 to 19 Years | 97 (8.4%) | 105 (8.9%) |
| 20 to 24 Years | 104 (9.0%) | 139 (11.8%) |
| 25 to 29 Years | 93 (8.0%) | 61 (5.2%) |
| 30 to 34 Years | 51 (4.4%) | 46 (3.9%) |
| 35 to 39 Years | 63 (5.4%) | 37 (3.1%) |
| 40 to 44 Years | 77 (6.6%) | 38 (3.2%) |
| 45 to 49 Years | 52 (4.5%) | 77 (6.5%) |
| 50 to 54 Years | 79 (6.8%) | 90 (7.6%) |
| 55 to 59 Years | 49 (4.2%) | 68 (5.8%) |
| 60 to 64 Years | 103 (8.9%) | 72 (6.1%) |
| 65 to 69 Years | 48 (4.1%) | 63 (5.3%) |
| 70 to 74 Years | 17 (1.5%) | 56 (4.7%) |
| 75 to 79 Years | 23 (2.0%) | 43 (3.6%) |
| 80 to 84 Years | 24 (2.1%) | 49 (4.2%) |
| 85 Years and over | 7 (0.6%) | 39 (3.3%) |
| Total | 1,159 (100.0%) | 1,181 (100.0%) |
Families and Households in Hull
Median Family Size in Hull
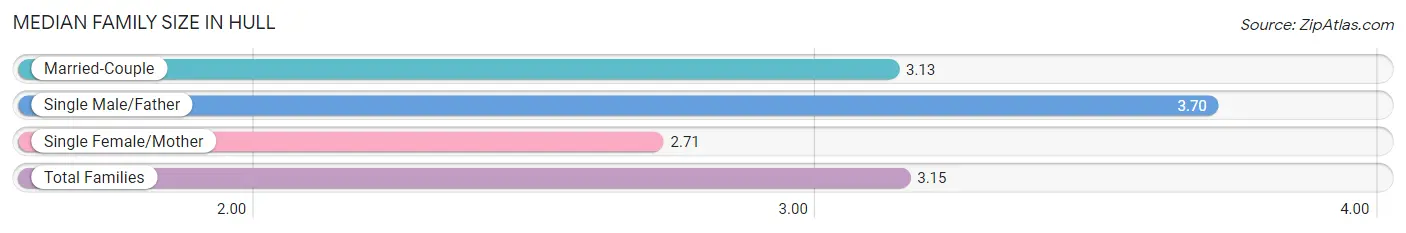
The median family size in Hull is 3.15 persons per family, with single male/father families (43 | 7.0%) accounting for the largest median family size of 3.7 persons per family. On the other hand, single female/mother families (35 | 5.7%) represent the smallest median family size with 2.71 persons per family.
| Family Type | # Families | Family Size |
| Married-Couple | 540 (87.4%) | 3.13 |
| Single Male/Father | 43 (7.0%) | 3.70 |
| Single Female/Mother | 35 (5.7%) | 2.71 |
| Total Families | 618 (100.0%) | 3.15 |
Median Household Size in Hull
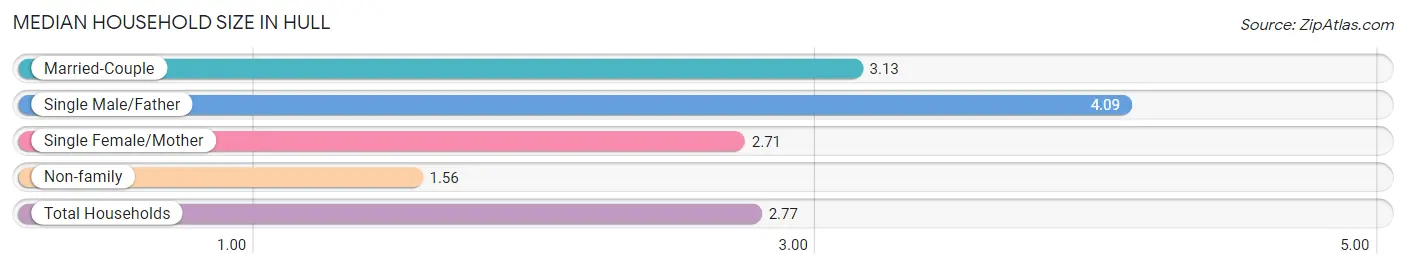
The median household size in Hull is 2.77 persons per household, with single male/father households (43 | 5.2%) accounting for the largest median household size of 4.09 persons per household. non-family households (208 | 25.2%) represent the smallest median household size with 1.56 persons per household.
| Household Type | # Households | Household Size |
| Married-Couple | 540 (65.4%) | 3.13 |
| Single Male/Father | 43 (5.2%) | 4.09 |
| Single Female/Mother | 35 (4.2%) | 2.71 |
| Non-family | 208 (25.2%) | 1.56 |
| Total Households | 826 (100.0%) | 2.77 |
Household Size by Marriage Status in Hull
Out of a total of 826 households in Hull, 618 (74.8%) are family households, while 208 (25.2%) are nonfamily households. The most numerous type of family households are 2-person households, comprising 309, and the most common type of nonfamily households are 1-person households, comprising 137.
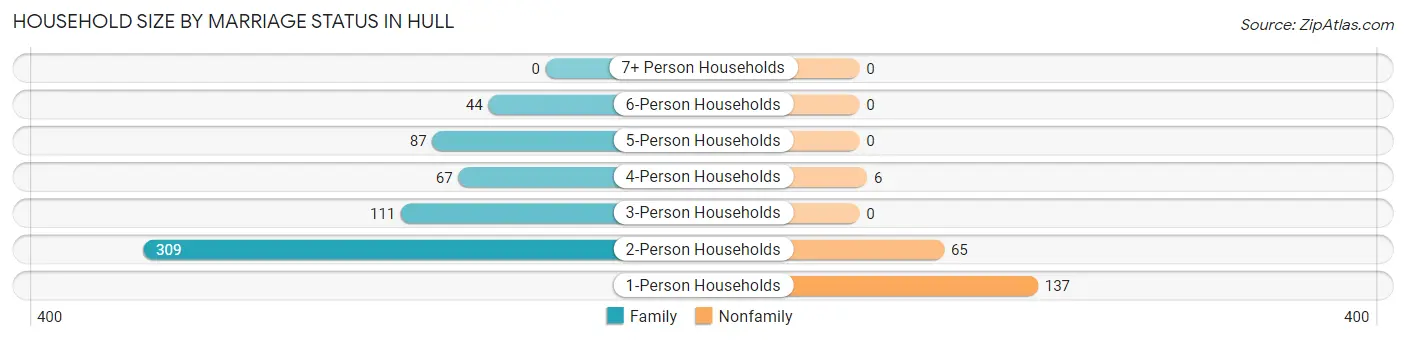
| Household Size | Family Households | Nonfamily Households |
| 1-Person Households | - | 137 (16.6%) |
| 2-Person Households | 309 (37.4%) | 65 (7.9%) |
| 3-Person Households | 111 (13.4%) | 0 (0.0%) |
| 4-Person Households | 67 (8.1%) | 6 (0.7%) |
| 5-Person Households | 87 (10.5%) | 0 (0.0%) |
| 6-Person Households | 44 (5.3%) | 0 (0.0%) |
| 7+ Person Households | 0 (0.0%) | 0 (0.0%) |
| Total | 618 (74.8%) | 208 (25.2%) |
Female Fertility in Hull
Fertility by Age in Hull
Average fertility rate in Hull is 49.0 births per 1,000 women. Women in the age bracket of 20 to 34 years have the highest fertility rate with 98.0 births per 1,000 women. Women in the age bracket of 20 to 34 years acount for 88.9% of all women with births.
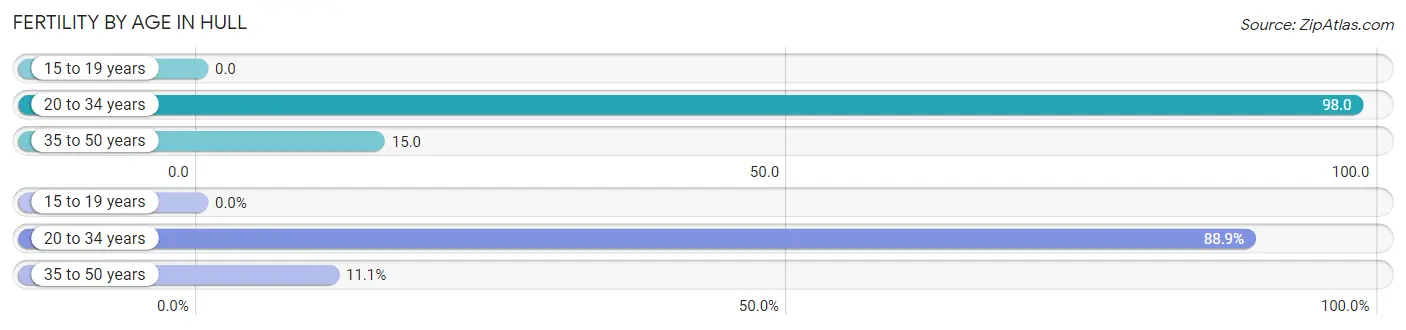
| Age Bracket | Women with Births | Births / 1,000 Women |
| 15 to 19 years | 0 (0.0%) | 0.0 |
| 20 to 34 years | 24 (88.9%) | 98.0 |
| 35 to 50 years | 3 (11.1%) | 15.0 |
| Total | 27 (100.0%) | 49.0 |
Fertility by Age by Marriage Status in Hull
77.8% of women with births (27) in Hull are married. The highest percentage of unmarried women with births falls into 20 to 34 years age bracket with 25.0% of them unmarried at the time of birth, while the lowest percentage of unmarried women with births belong to 35 to 50 years age bracket with 0.0% of them unmarried.
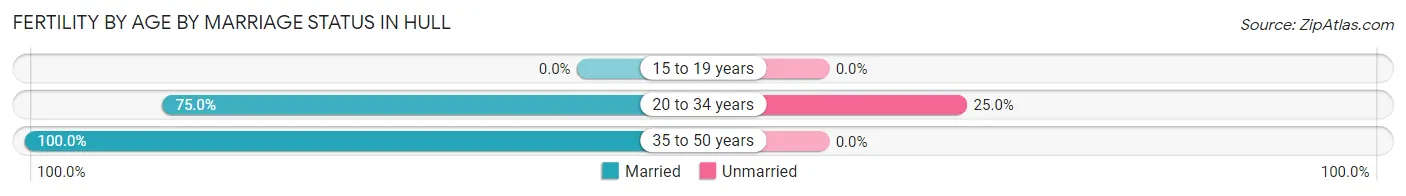
| Age Bracket | Married | Unmarried |
| 15 to 19 years | 0 (0.0%) | 0 (0.0%) |
| 20 to 34 years | 18 (75.0%) | 6 (25.0%) |
| 35 to 50 years | 3 (100.0%) | 0 (0.0%) |
| Total | 21 (77.8%) | 6 (22.2%) |
Fertility by Education in Hull
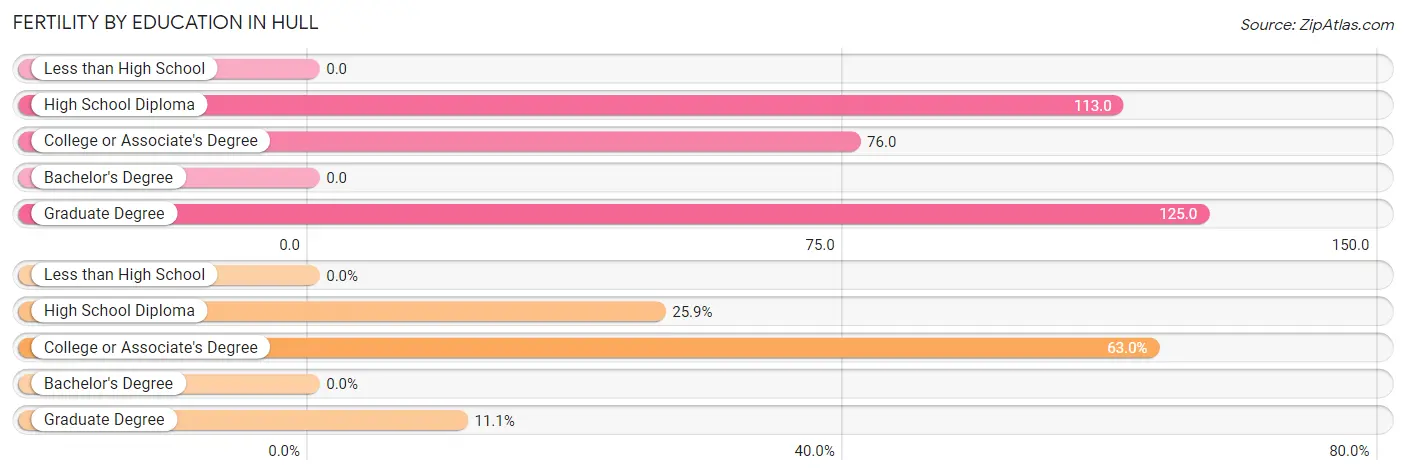
| Educational Attainment | Women with Births | Births / 1,000 Women |
| Less than High School | 0 (0.0%) | 0.0 |
| High School Diploma | 7 (25.9%) | 113.0 |
| College or Associate's Degree | 17 (63.0%) | 76.0 |
| Bachelor's Degree | 0 (0.0%) | 0.0 |
| Graduate Degree | 3 (11.1%) | 125.0 |
| Total | 27 (100.0%) | 49.0 |
Fertility by Education by Marriage Status in Hull
22.2% of women with births in Hull are unmarried. Women with the educational attainment of high school diploma are most likely to be married with 100.0% of them married at childbirth, while women with the educational attainment of college or associate's degree are least likely to be married with 35.3% of them unmarried at childbirth.
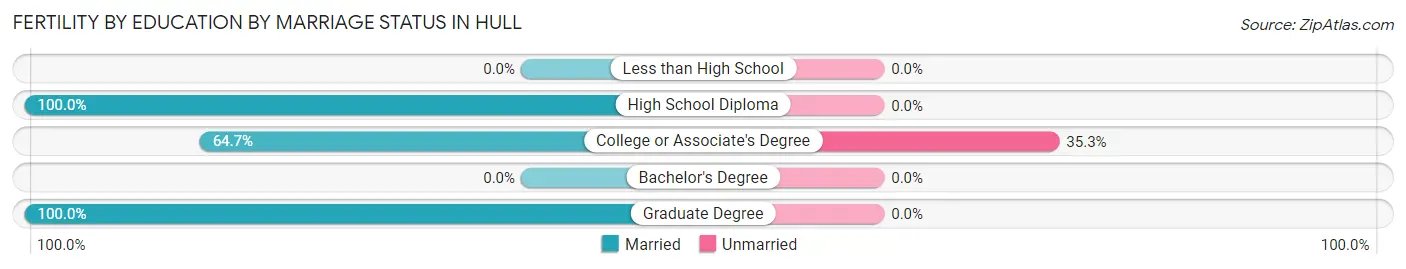
| Educational Attainment | Married | Unmarried |
| Less than High School | 0 (0.0%) | 0 (0.0%) |
| High School Diploma | 7 (100.0%) | 0 (0.0%) |
| College or Associate's Degree | 11 (64.7%) | 6 (35.3%) |
| Bachelor's Degree | 0 (0.0%) | 0 (0.0%) |
| Graduate Degree | 3 (100.0%) | 0 (0.0%) |
| Total | 21 (77.8%) | 6 (22.2%) |
Employment Characteristics in Hull
Employment by Class of Employer in Hull
Among the 1,286 employed individuals in Hull, private company employees (713 | 55.4%), not-for-profit organizations (216 | 16.8%), and self-employed (not incorporated) (142 | 11.0%) make up the most common classes of employment.
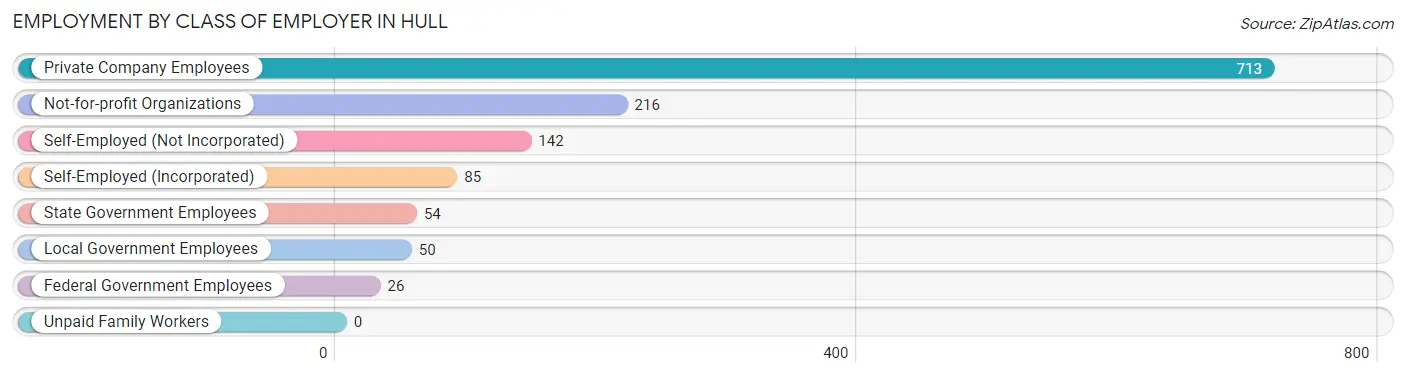
| Employer Class | # Employees | % Employees |
| Private Company Employees | 713 | 55.4% |
| Self-Employed (Incorporated) | 85 | 6.6% |
| Self-Employed (Not Incorporated) | 142 | 11.0% |
| Not-for-profit Organizations | 216 | 16.8% |
| Local Government Employees | 50 | 3.9% |
| State Government Employees | 54 | 4.2% |
| Federal Government Employees | 26 | 2.0% |
| Unpaid Family Workers | 0 | 0.0% |
| Total | 1,286 | 100.0% |
Employment Status by Age in Hull
According to the labor force statistics for Hull, out of the total population over 16 years of age (1,832), 74.9% or 1,372 individuals are in the labor force, with 3.4% or 47 of them unemployed. The age group with the highest labor force participation rate is 30 to 34 years, with 100.0% or 97 individuals in the labor force. Within the labor force, the 16 to 19 years age range has the highest percentage of unemployed individuals, with 29.8% or 31 of them being unemployed.
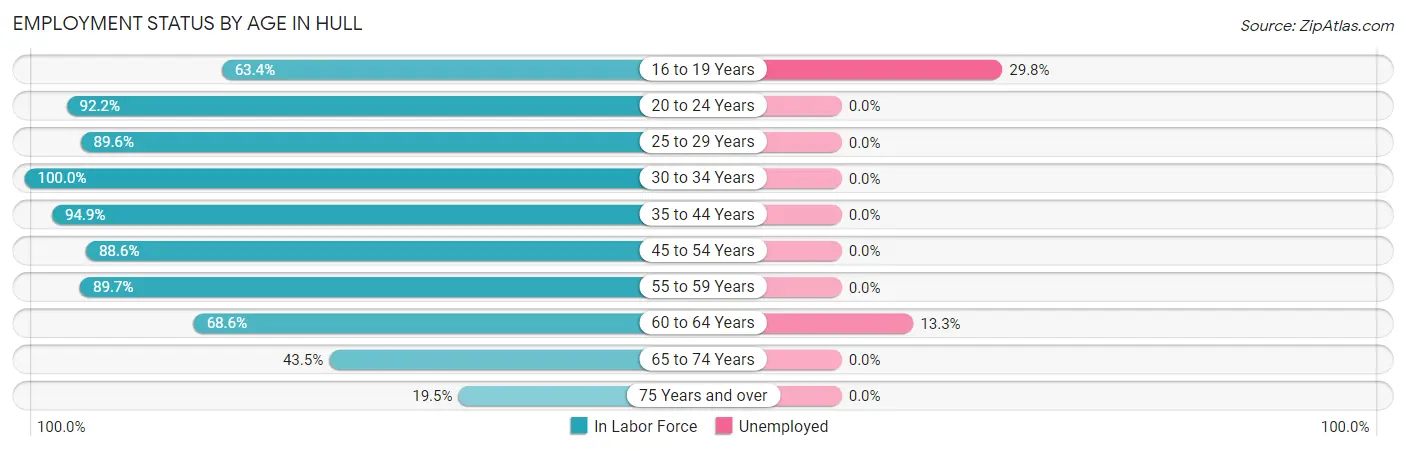
| Age Bracket | In Labor Force | Unemployed |
| 16 to 19 Years | 104 (63.4%) | 31 (29.8%) |
| 20 to 24 Years | 224 (92.2%) | 0 (0.0%) |
| 25 to 29 Years | 138 (89.6%) | 0 (0.0%) |
| 30 to 34 Years | 97 (100.0%) | 0 (0.0%) |
| 35 to 44 Years | 204 (94.9%) | 0 (0.0%) |
| 45 to 54 Years | 264 (88.6%) | 0 (0.0%) |
| 55 to 59 Years | 105 (89.7%) | 0 (0.0%) |
| 60 to 64 Years | 120 (68.6%) | 16 (13.3%) |
| 65 to 74 Years | 80 (43.5%) | 0 (0.0%) |
| 75 Years and over | 36 (19.5%) | 0 (0.0%) |
| Total | 1,372 (74.9%) | 47 (3.4%) |
Employment Status by Educational Attainment in Hull
According to labor force statistics for Hull, 87.9% of individuals (928) out of the total population between 25 and 64 years of age (1,056) are in the labor force, with 1.7% or 16 of them being unemployed. The group with the highest labor force participation rate are those with the educational attainment of bachelor's degree or higher, with 95.2% or 238 individuals in the labor force. Within the labor force, individuals with college / associate degree education have the highest percentage of unemployment, with 4.6% or 16 of them being unemployed.
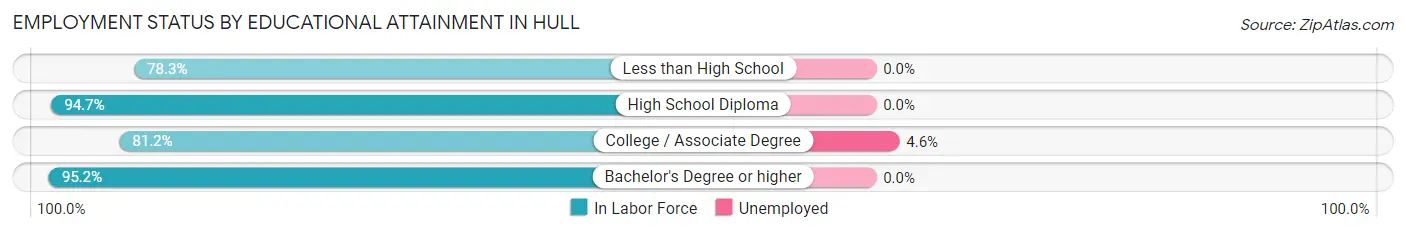
| Educational Attainment | In Labor Force | Unemployed |
| Less than High School | 72 (78.3%) | 0 (0.0%) |
| High School Diploma | 268 (94.7%) | 0 (0.0%) |
| College / Associate Degree | 350 (81.2%) | 20 (4.6%) |
| Bachelor's Degree or higher | 238 (95.2%) | 0 (0.0%) |
| Total | 928 (87.9%) | 18 (1.7%) |
Employment Occupations by Sex in Hull
Management, Business, Science and Arts Occupations
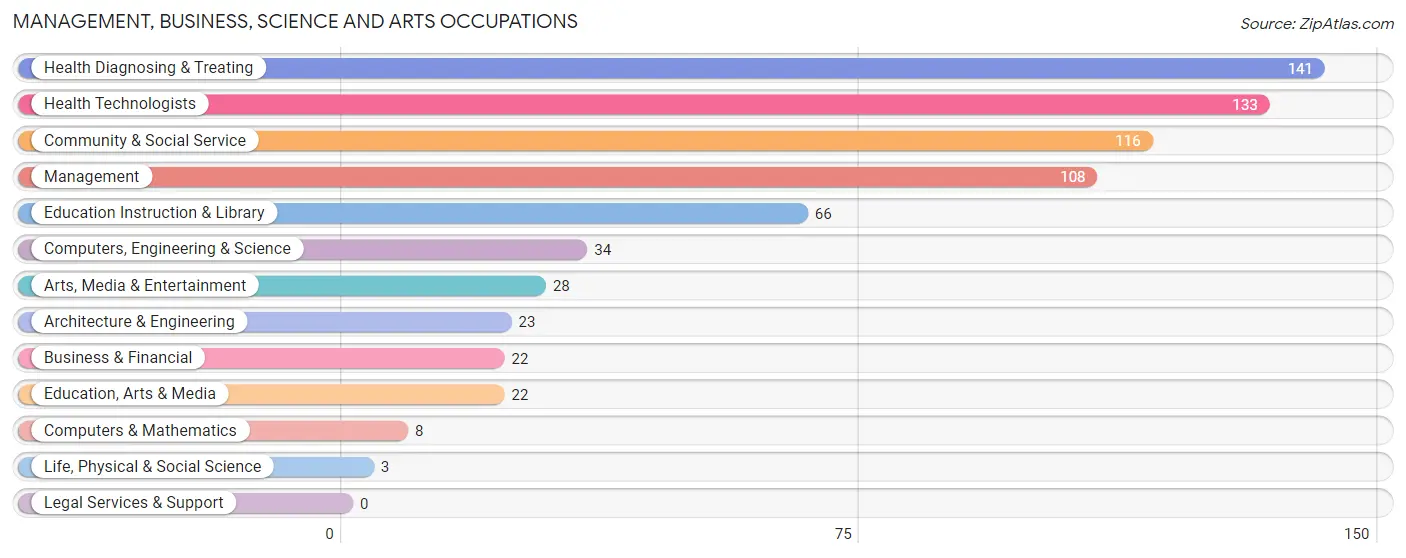
The most common Management, Business, Science and Arts occupations in Hull are Health Diagnosing & Treating (141 | 10.6%), Health Technologists (133 | 10.0%), Community & Social Service (116 | 8.7%), Management (108 | 8.2%), and Education Instruction & Library (66 | 5.0%).
Management, Business, Science and Arts Occupations by Sex
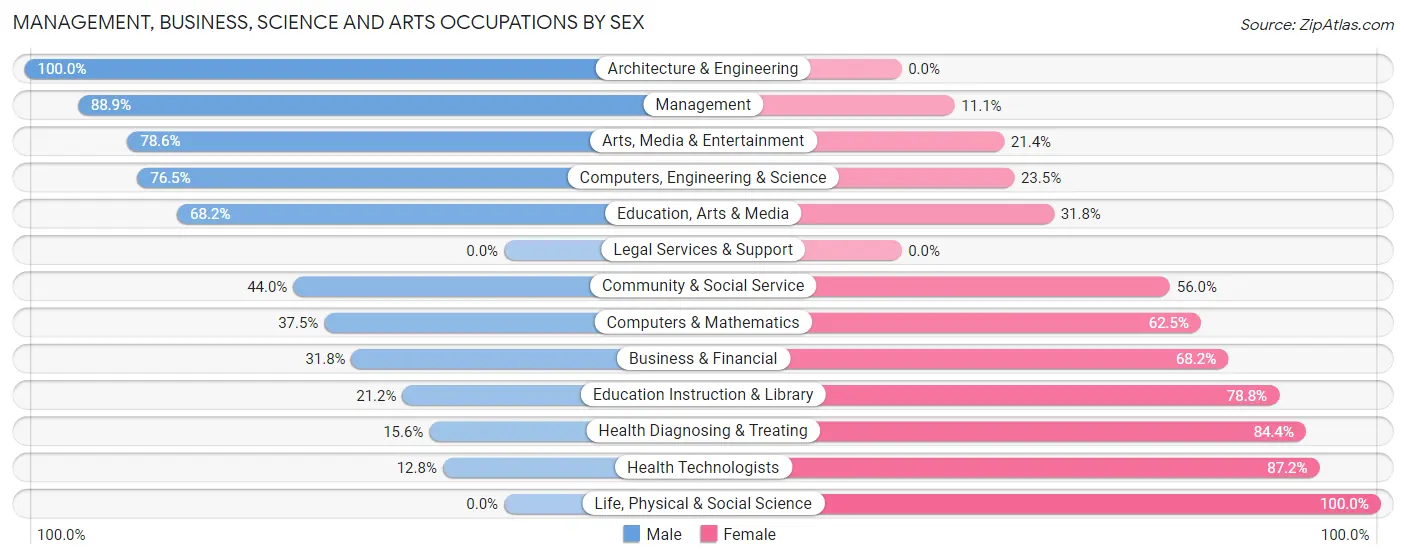
Within the Management, Business, Science and Arts occupations in Hull, the most male-oriented occupations are Architecture & Engineering (100.0%), Management (88.9%), and Arts, Media & Entertainment (78.6%), while the most female-oriented occupations are Life, Physical & Social Science (100.0%), Health Technologists (87.2%), and Health Diagnosing & Treating (84.4%).
| Occupation | Male | Female |
| Management | 96 (88.9%) | 12 (11.1%) |
| Business & Financial | 7 (31.8%) | 15 (68.2%) |
| Computers, Engineering & Science | 26 (76.5%) | 8 (23.5%) |
| Computers & Mathematics | 3 (37.5%) | 5 (62.5%) |
| Architecture & Engineering | 23 (100.0%) | 0 (0.0%) |
| Life, Physical & Social Science | 0 (0.0%) | 3 (100.0%) |
| Community & Social Service | 51 (44.0%) | 65 (56.0%) |
| Education, Arts & Media | 15 (68.2%) | 7 (31.8%) |
| Legal Services & Support | 0 (0.0%) | 0 (0.0%) |
| Education Instruction & Library | 14 (21.2%) | 52 (78.8%) |
| Arts, Media & Entertainment | 22 (78.6%) | 6 (21.4%) |
| Health Diagnosing & Treating | 22 (15.6%) | 119 (84.4%) |
| Health Technologists | 17 (12.8%) | 116 (87.2%) |
| Total (Category) | 202 (48.0%) | 219 (52.0%) |
| Total (Overall) | 724 (54.6%) | 601 (45.4%) |
Services Occupations
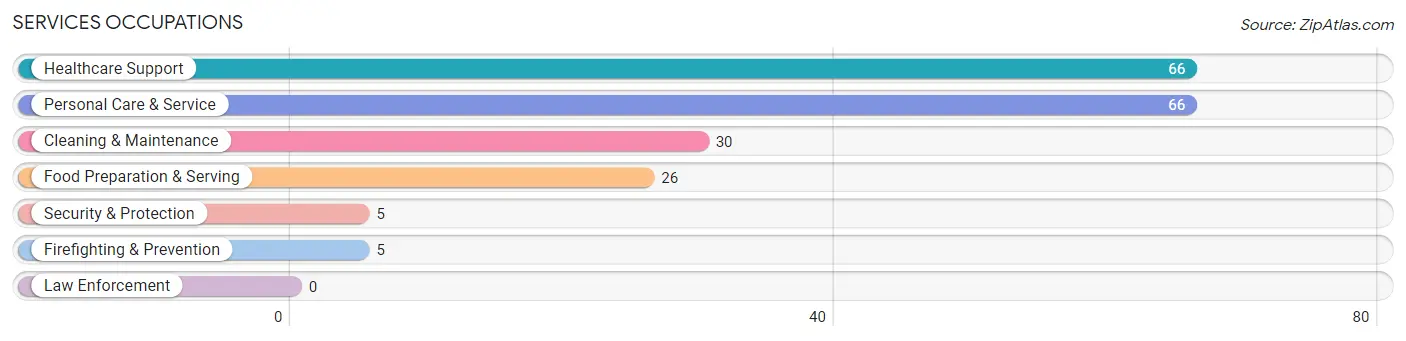
The most common Services occupations in Hull are Healthcare Support (66 | 5.0%), Personal Care & Service (66 | 5.0%), Cleaning & Maintenance (30 | 2.3%), Food Preparation & Serving (26 | 2.0%), and Security & Protection (5 | 0.4%).
Services Occupations by Sex
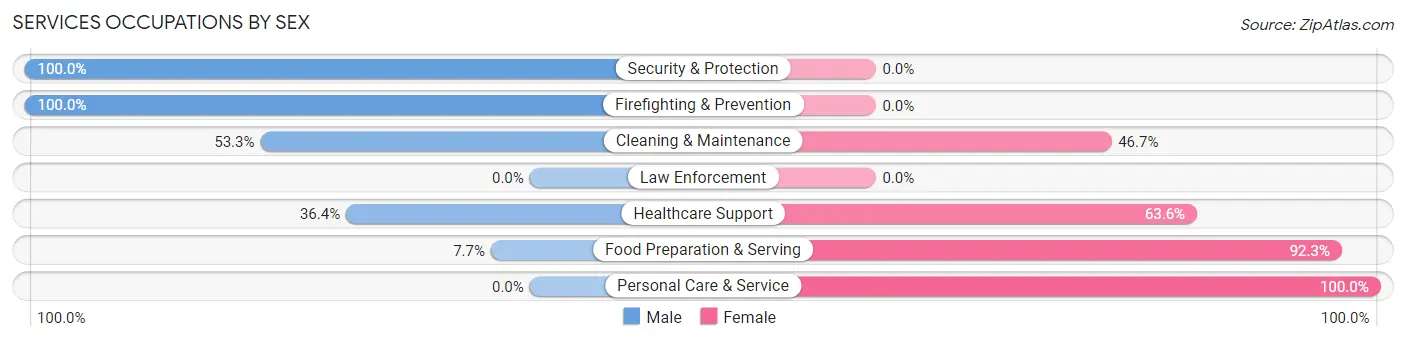
Within the Services occupations in Hull, the most male-oriented occupations are Security & Protection (100.0%), Firefighting & Prevention (100.0%), and Cleaning & Maintenance (53.3%), while the most female-oriented occupations are Personal Care & Service (100.0%), Food Preparation & Serving (92.3%), and Healthcare Support (63.6%).
| Occupation | Male | Female |
| Healthcare Support | 24 (36.4%) | 42 (63.6%) |
| Security & Protection | 5 (100.0%) | 0 (0.0%) |
| Firefighting & Prevention | 5 (100.0%) | 0 (0.0%) |
| Law Enforcement | 0 (0.0%) | 0 (0.0%) |
| Food Preparation & Serving | 2 (7.7%) | 24 (92.3%) |
| Cleaning & Maintenance | 16 (53.3%) | 14 (46.7%) |
| Personal Care & Service | 0 (0.0%) | 66 (100.0%) |
| Total (Category) | 47 (24.3%) | 146 (75.6%) |
| Total (Overall) | 724 (54.6%) | 601 (45.4%) |
Sales and Office Occupations
The most common Sales and Office occupations in Hull are Office & Administration (155 | 11.7%), and Sales & Related (61 | 4.6%).

Sales and Office Occupations by Sex
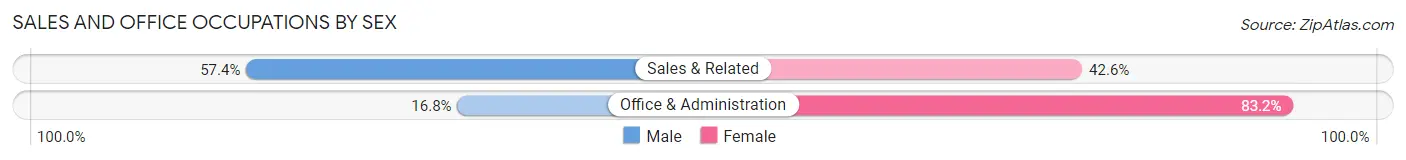
| Occupation | Male | Female |
| Sales & Related | 35 (57.4%) | 26 (42.6%) |
| Office & Administration | 26 (16.8%) | 129 (83.2%) |
| Total (Category) | 61 (28.2%) | 155 (71.8%) |
| Total (Overall) | 724 (54.6%) | 601 (45.4%) |
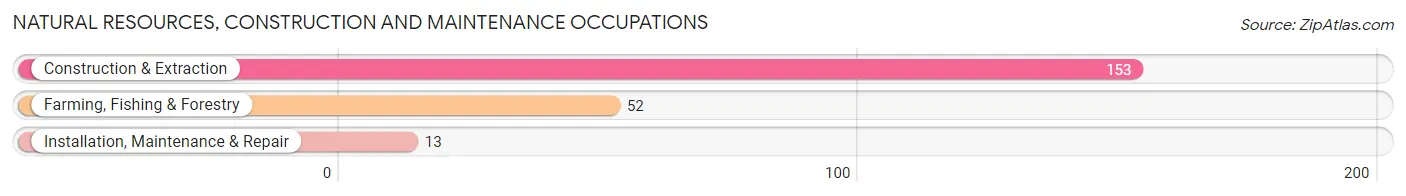
Natural Resources, Construction and Maintenance Occupations
The most common Natural Resources, Construction and Maintenance occupations in Hull are Construction & Extraction (153 | 11.6%), Farming, Fishing & Forestry (52 | 3.9%), and Installation, Maintenance & Repair (13 | 1.0%).
Natural Resources, Construction and Maintenance Occupations by Sex
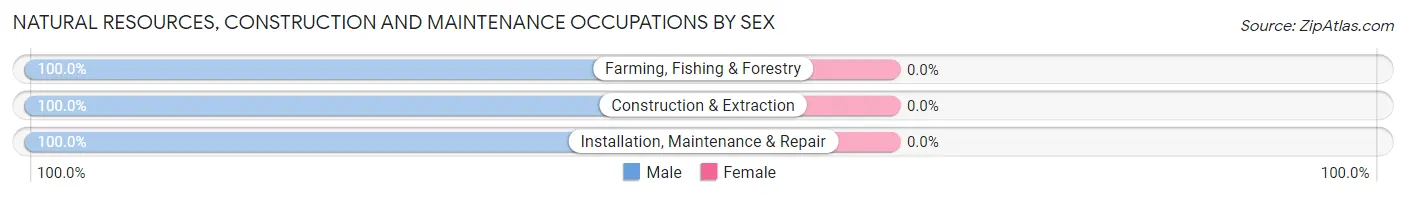
| Occupation | Male | Female |
| Farming, Fishing & Forestry | 52 (100.0%) | 0 (0.0%) |
| Construction & Extraction | 153 (100.0%) | 0 (0.0%) |
| Installation, Maintenance & Repair | 13 (100.0%) | 0 (0.0%) |
| Total (Category) | 218 (100.0%) | 0 (0.0%) |
| Total (Overall) | 724 (54.6%) | 601 (45.4%) |
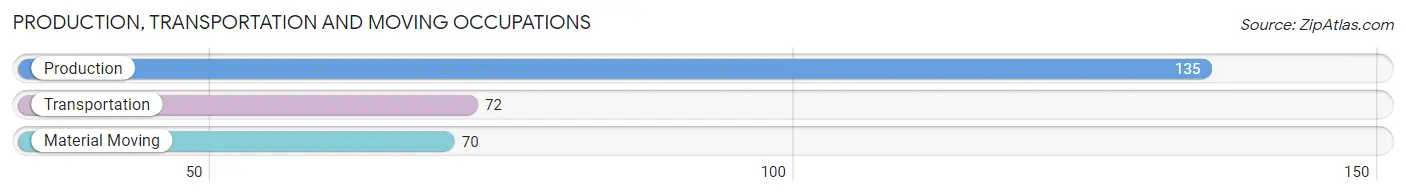
Production, Transportation and Moving Occupations
The most common Production, Transportation and Moving occupations in Hull are Production (135 | 10.2%), Transportation (72 | 5.4%), and Material Moving (70 | 5.3%).
Production, Transportation and Moving Occupations by Sex
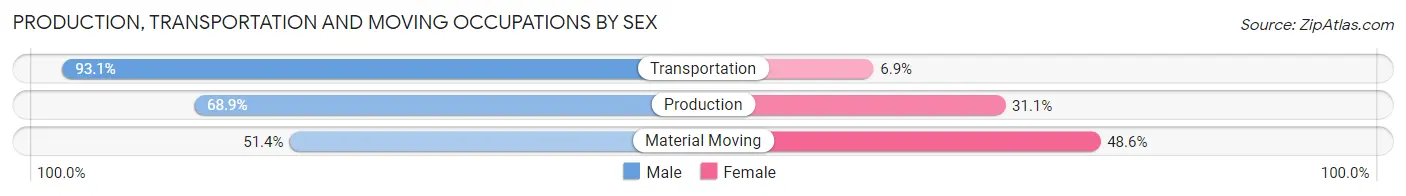
| Occupation | Male | Female |
| Production | 93 (68.9%) | 42 (31.1%) |
| Transportation | 67 (93.1%) | 5 (6.9%) |
| Material Moving | 36 (51.4%) | 34 (48.6%) |
| Total (Category) | 196 (70.8%) | 81 (29.2%) |
| Total (Overall) | 724 (54.6%) | 601 (45.4%) |
Employment Industries by Sex in Hull
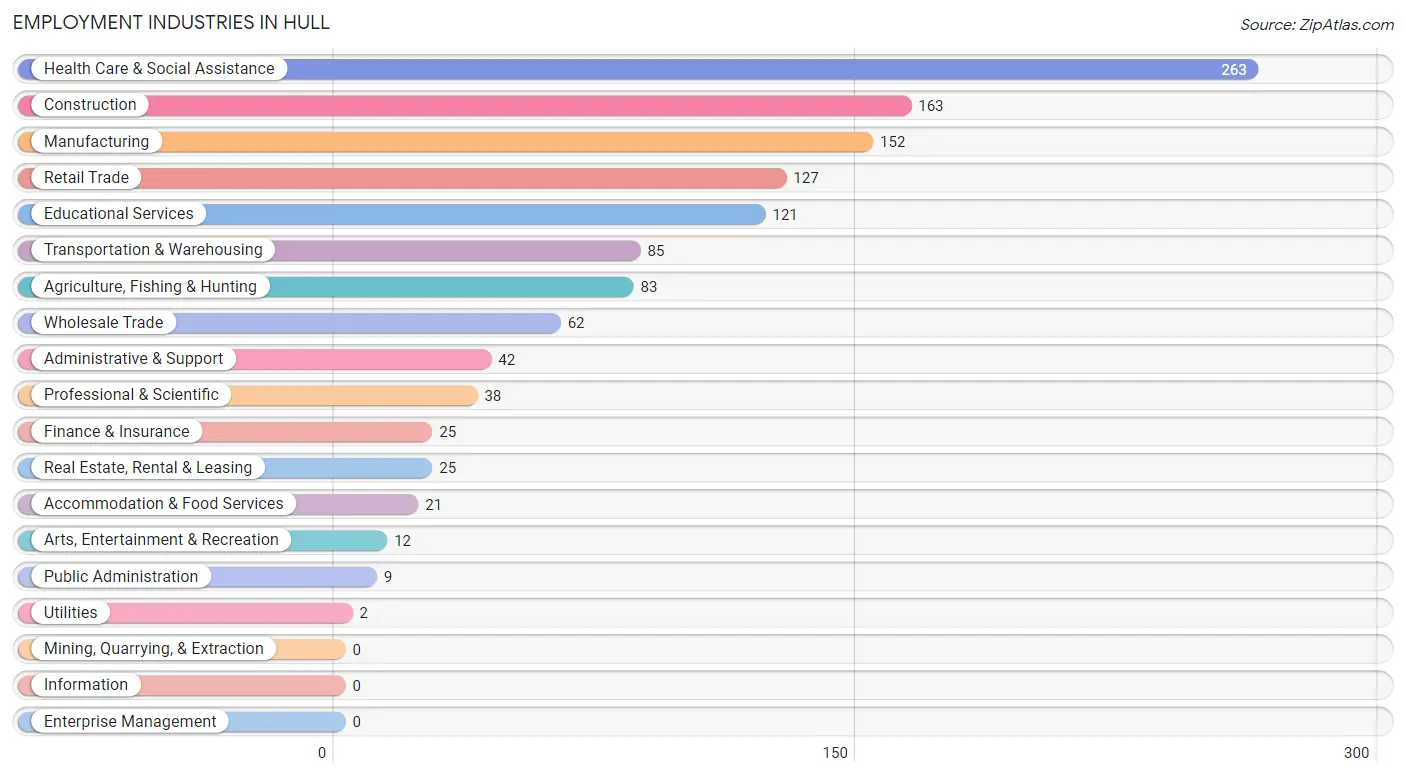
Employment Industries in Hull
The major employment industries in Hull include Health Care & Social Assistance (263 | 19.9%), Construction (163 | 12.3%), Manufacturing (152 | 11.5%), Retail Trade (127 | 9.6%), and Educational Services (121 | 9.1%).
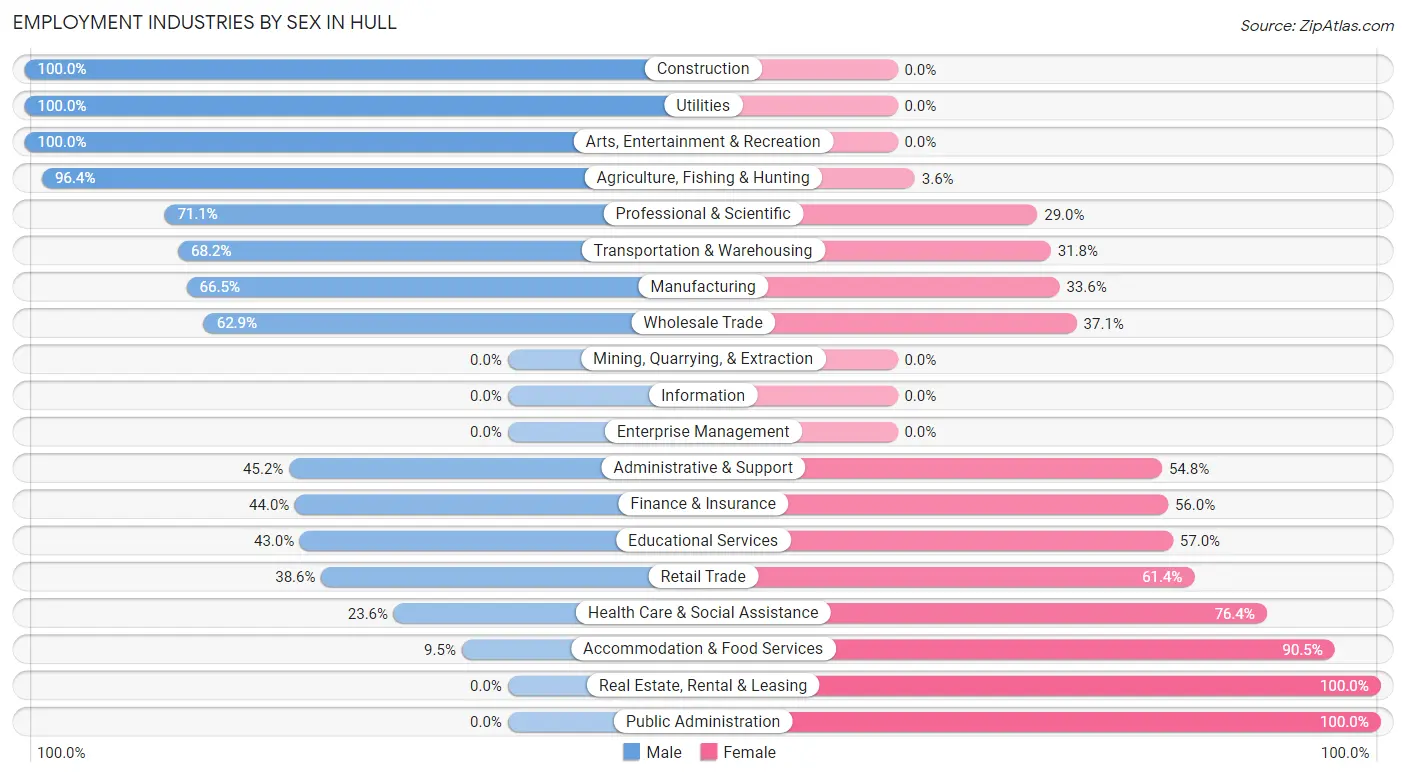
Employment Industries by Sex in Hull
The Hull industries that see more men than women are Construction (100.0%), Utilities (100.0%), and Arts, Entertainment & Recreation (100.0%), whereas the industries that tend to have a higher number of women are Real Estate, Rental & Leasing (100.0%), Public Administration (100.0%), and Accommodation & Food Services (90.5%).
| Industry | Male | Female |
| Agriculture, Fishing & Hunting | 80 (96.4%) | 3 (3.6%) |
| Mining, Quarrying, & Extraction | 0 (0.0%) | 0 (0.0%) |
| Construction | 163 (100.0%) | 0 (0.0%) |
| Manufacturing | 101 (66.4%) | 51 (33.6%) |
| Wholesale Trade | 39 (62.9%) | 23 (37.1%) |
| Retail Trade | 49 (38.6%) | 78 (61.4%) |
| Transportation & Warehousing | 58 (68.2%) | 27 (31.8%) |
| Utilities | 2 (100.0%) | 0 (0.0%) |
| Information | 0 (0.0%) | 0 (0.0%) |
| Finance & Insurance | 11 (44.0%) | 14 (56.0%) |
| Real Estate, Rental & Leasing | 0 (0.0%) | 25 (100.0%) |
| Professional & Scientific | 27 (71.1%) | 11 (28.9%) |
| Enterprise Management | 0 (0.0%) | 0 (0.0%) |
| Administrative & Support | 19 (45.2%) | 23 (54.8%) |
| Educational Services | 52 (43.0%) | 69 (57.0%) |
| Health Care & Social Assistance | 62 (23.6%) | 201 (76.4%) |
| Arts, Entertainment & Recreation | 12 (100.0%) | 0 (0.0%) |
| Accommodation & Food Services | 2 (9.5%) | 19 (90.5%) |
| Public Administration | 0 (0.0%) | 9 (100.0%) |
| Total | 724 (54.6%) | 601 (45.4%) |
Education in Hull
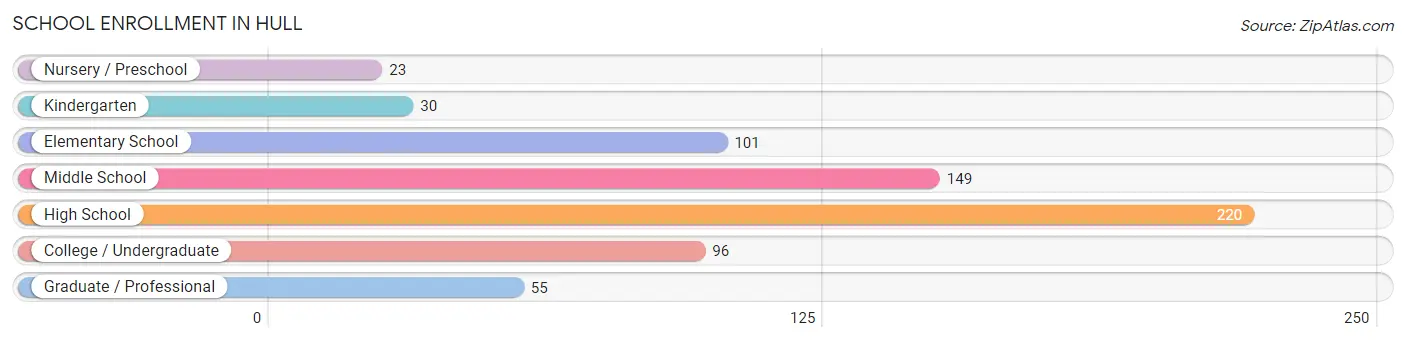
School Enrollment in Hull
The most common levels of schooling among the 674 students in Hull are high school (220 | 32.6%), middle school (149 | 22.1%), and elementary school (101 | 15.0%).
| School Level | # Students | % Students |
| Nursery / Preschool | 23 | 3.4% |
| Kindergarten | 30 | 4.4% |
| Elementary School | 101 | 15.0% |
| Middle School | 149 | 22.1% |
| High School | 220 | 32.6% |
| College / Undergraduate | 96 | 14.2% |
| Graduate / Professional | 55 | 8.2% |
| Total | 674 | 100.0% |
School Enrollment by Age by Funding Source in Hull
Out of a total of 674 students who are enrolled in schools in Hull, 239 (35.5%) attend a private institution, while the remaining 435 (64.5%) are enrolled in public schools. The age group of 3 to 4 year olds has the highest likelihood of being enrolled in private schools, with 13 (68.4% in the age bracket) enrolled. Conversely, the age group of 35 years and over has the lowest likelihood of being enrolled in a private school, with 12 (100.0% in the age bracket) attending a public institution.
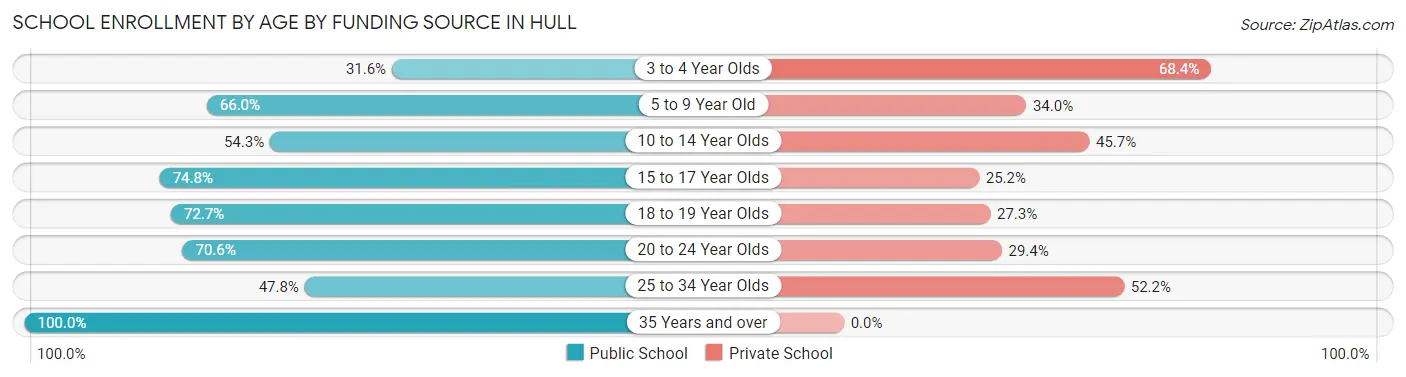
| Age Bracket | Public School | Private School |
| 3 to 4 Year Olds | 6 (31.6%) | 13 (68.4%) |
| 5 to 9 Year Old | 70 (66.0%) | 36 (34.0%) |
| 10 to 14 Year Olds | 114 (54.3%) | 96 (45.7%) |
| 15 to 17 Year Olds | 110 (74.8%) | 37 (25.2%) |
| 18 to 19 Year Olds | 40 (72.7%) | 15 (27.3%) |
| 20 to 24 Year Olds | 72 (70.6%) | 30 (29.4%) |
| 25 to 34 Year Olds | 11 (47.8%) | 12 (52.2%) |
| 35 Years and over | 12 (100.0%) | 0 (0.0%) |
| Total | 435 (64.5%) | 239 (35.5%) |
Educational Attainment by Field of Study in Hull
Education (118 | 36.8%), science & technology (55 | 17.1%), bio, nature & agricultural (33 | 10.3%), arts & humanities (33 | 10.3%), and business (21 | 6.5%) are the most common fields of study among 321 individuals in Hull who have obtained a bachelor's degree or higher.
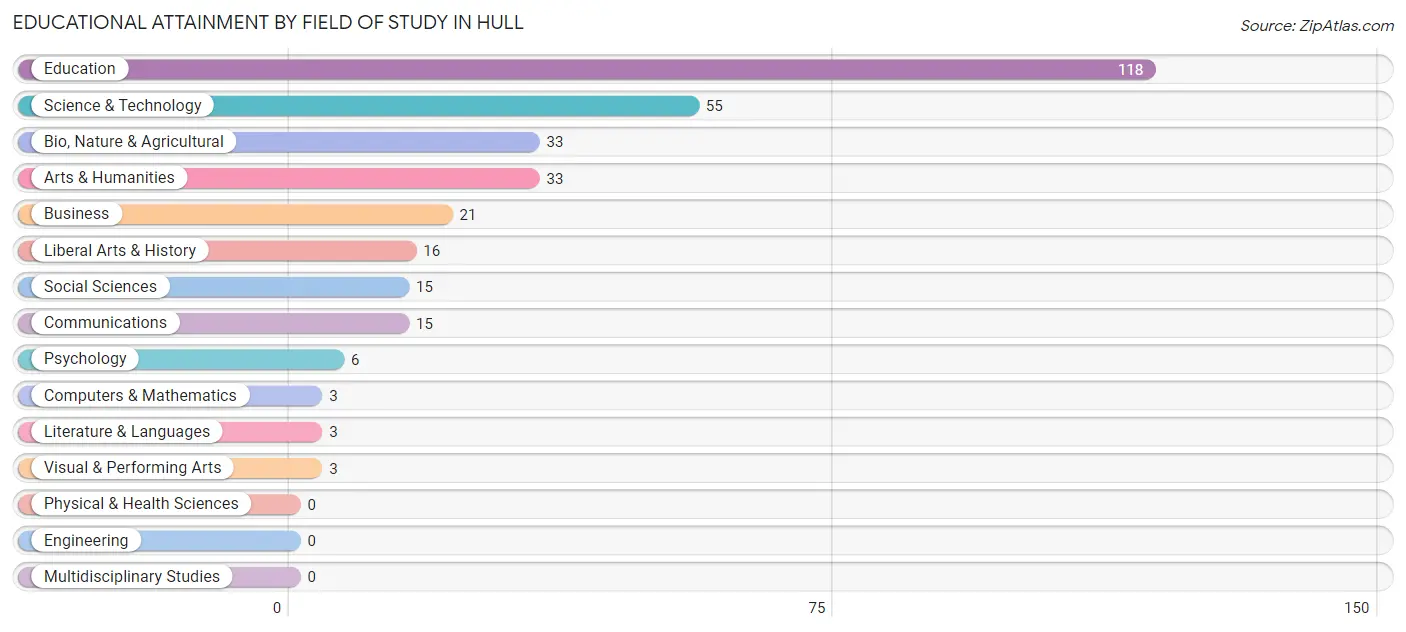
| Field of Study | # Graduates | % Graduates |
| Computers & Mathematics | 3 | 0.9% |
| Bio, Nature & Agricultural | 33 | 10.3% |
| Physical & Health Sciences | 0 | 0.0% |
| Psychology | 6 | 1.9% |
| Social Sciences | 15 | 4.7% |
| Engineering | 0 | 0.0% |
| Multidisciplinary Studies | 0 | 0.0% |
| Science & Technology | 55 | 17.1% |
| Business | 21 | 6.5% |
| Education | 118 | 36.8% |
| Literature & Languages | 3 | 0.9% |
| Liberal Arts & History | 16 | 5.0% |
| Visual & Performing Arts | 3 | 0.9% |
| Communications | 15 | 4.7% |
| Arts & Humanities | 33 | 10.3% |
| Total | 321 | 100.0% |
Transportation & Commute in Hull
Vehicle Availability by Sex in Hull
The most prevalent vehicle ownership categories in Hull are males with 2 vehicles (334, accounting for 48.9%) and females with 2 vehicles (280, making up 55.6%).
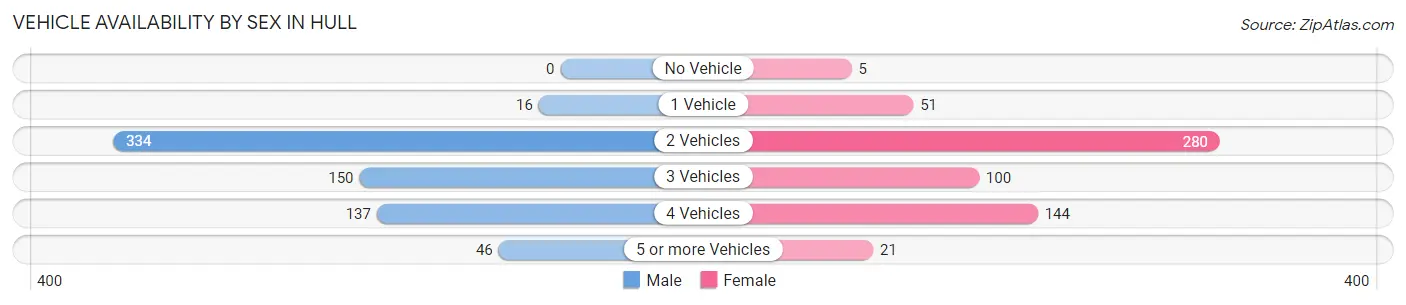
| Vehicles Available | Male | Female |
| No Vehicle | 0 (0.0%) | 5 (0.8%) |
| 1 Vehicle | 16 (2.3%) | 51 (8.5%) |
| 2 Vehicles | 334 (48.9%) | 280 (46.6%) |
| 3 Vehicles | 150 (22.0%) | 100 (16.6%) |
| 4 Vehicles | 137 (20.1%) | 144 (24.0%) |
| 5 or more Vehicles | 46 (6.7%) | 21 (3.5%) |
| Total | 683 (100.0%) | 601 (100.0%) |
Commute Time in Hull
The most frequently occuring commute durations in Hull are 15 to 19 minutes (308 commuters, 25.2%), 10 to 14 minutes (254 commuters, 20.8%), and less than 5 minutes (223 commuters, 18.2%).
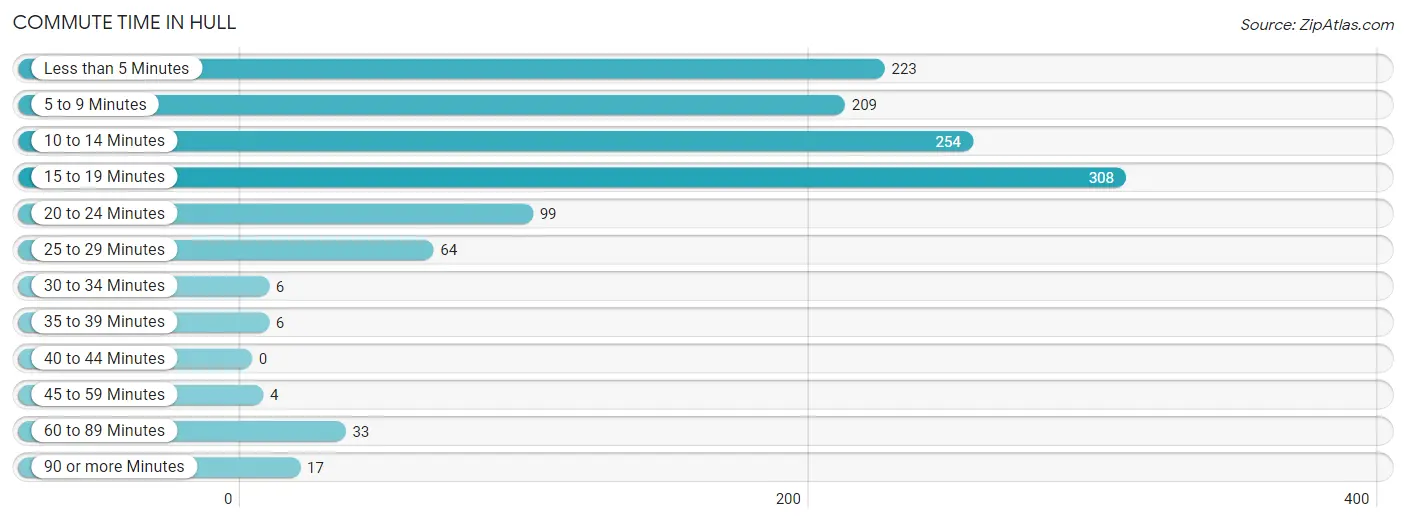
| Commute Time | # Commuters | % Commuters |
| Less than 5 Minutes | 223 | 18.2% |
| 5 to 9 Minutes | 209 | 17.1% |
| 10 to 14 Minutes | 254 | 20.8% |
| 15 to 19 Minutes | 308 | 25.2% |
| 20 to 24 Minutes | 99 | 8.1% |
| 25 to 29 Minutes | 64 | 5.2% |
| 30 to 34 Minutes | 6 | 0.5% |
| 35 to 39 Minutes | 6 | 0.5% |
| 40 to 44 Minutes | 0 | 0.0% |
| 45 to 59 Minutes | 4 | 0.3% |
| 60 to 89 Minutes | 33 | 2.7% |
| 90 or more Minutes | 17 | 1.4% |
Commute Time by Sex in Hull
The most common commute times in Hull are 10 to 14 minutes (167 commuters, 24.4%) for males and 15 to 19 minutes (188 commuters, 34.9%) for females.
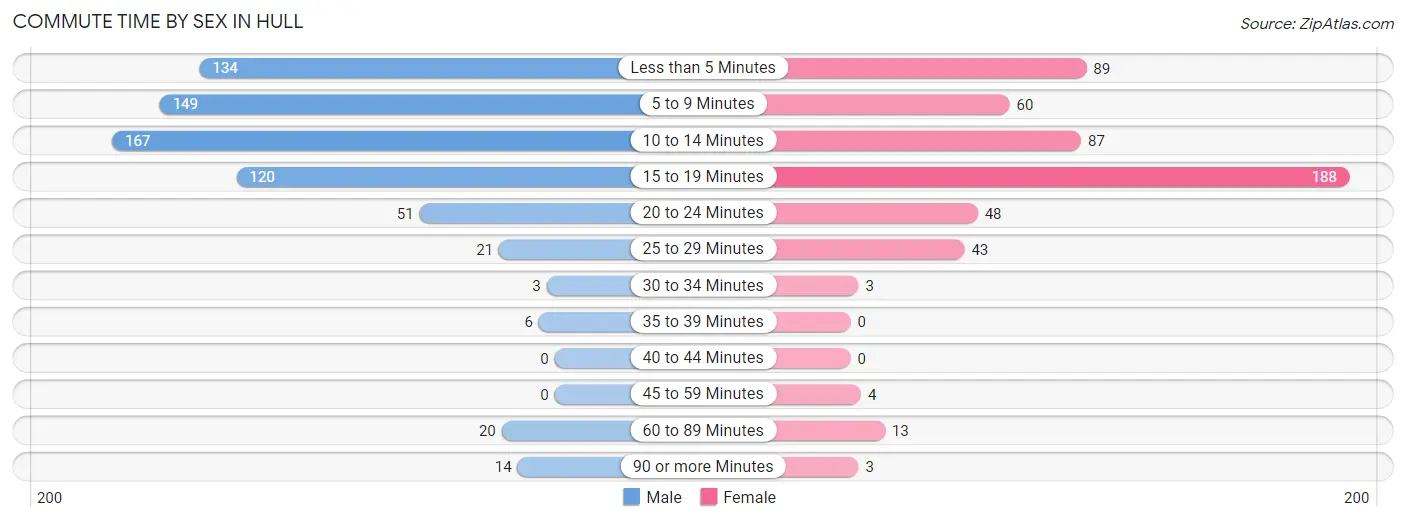
| Commute Time | Male | Female |
| Less than 5 Minutes | 134 (19.6%) | 89 (16.5%) |
| 5 to 9 Minutes | 149 (21.7%) | 60 (11.2%) |
| 10 to 14 Minutes | 167 (24.4%) | 87 (16.2%) |
| 15 to 19 Minutes | 120 (17.5%) | 188 (34.9%) |
| 20 to 24 Minutes | 51 (7.4%) | 48 (8.9%) |
| 25 to 29 Minutes | 21 (3.1%) | 43 (8.0%) |
| 30 to 34 Minutes | 3 (0.4%) | 3 (0.6%) |
| 35 to 39 Minutes | 6 (0.9%) | 0 (0.0%) |
| 40 to 44 Minutes | 0 (0.0%) | 0 (0.0%) |
| 45 to 59 Minutes | 0 (0.0%) | 4 (0.7%) |
| 60 to 89 Minutes | 20 (2.9%) | 13 (2.4%) |
| 90 or more Minutes | 14 (2.0%) | 3 (0.6%) |
Time of Departure to Work by Sex in Hull
The most frequent times of departure to work in Hull are 6:30 AM to 6:59 AM (154, 22.5%) for males and 7:30 AM to 7:59 AM (128, 23.8%) for females.
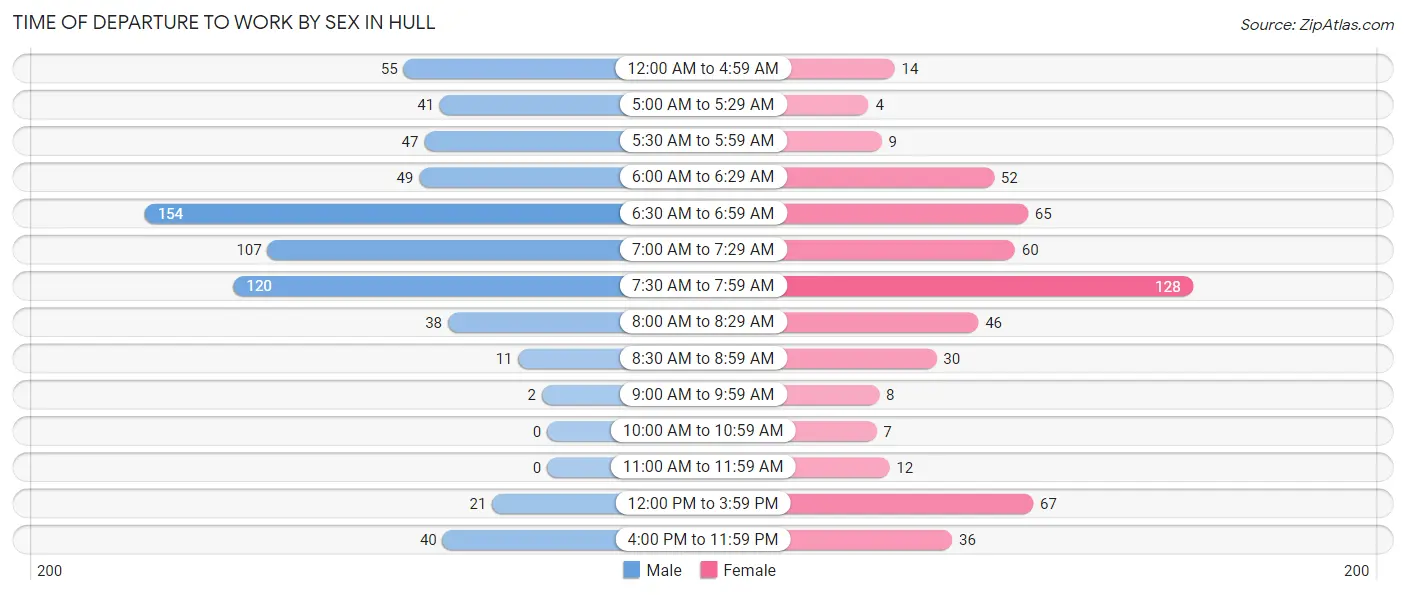
| Time of Departure | Male | Female |
| 12:00 AM to 4:59 AM | 55 (8.0%) | 14 (2.6%) |
| 5:00 AM to 5:29 AM | 41 (6.0%) | 4 (0.7%) |
| 5:30 AM to 5:59 AM | 47 (6.9%) | 9 (1.7%) |
| 6:00 AM to 6:29 AM | 49 (7.1%) | 52 (9.7%) |
| 6:30 AM to 6:59 AM | 154 (22.5%) | 65 (12.1%) |
| 7:00 AM to 7:29 AM | 107 (15.6%) | 60 (11.2%) |
| 7:30 AM to 7:59 AM | 120 (17.5%) | 128 (23.8%) |
| 8:00 AM to 8:29 AM | 38 (5.6%) | 46 (8.6%) |
| 8:30 AM to 8:59 AM | 11 (1.6%) | 30 (5.6%) |
| 9:00 AM to 9:59 AM | 2 (0.3%) | 8 (1.5%) |
| 10:00 AM to 10:59 AM | 0 (0.0%) | 7 (1.3%) |
| 11:00 AM to 11:59 AM | 0 (0.0%) | 12 (2.2%) |
| 12:00 PM to 3:59 PM | 21 (3.1%) | 67 (12.4%) |
| 4:00 PM to 11:59 PM | 40 (5.8%) | 36 (6.7%) |
| Total | 685 (100.0%) | 538 (100.0%) |
Housing Occupancy in Hull
Occupancy by Ownership in Hull
Of the total 826 dwellings in Hull, owner-occupied units account for 729 (88.3%), while renter-occupied units make up 97 (11.7%).
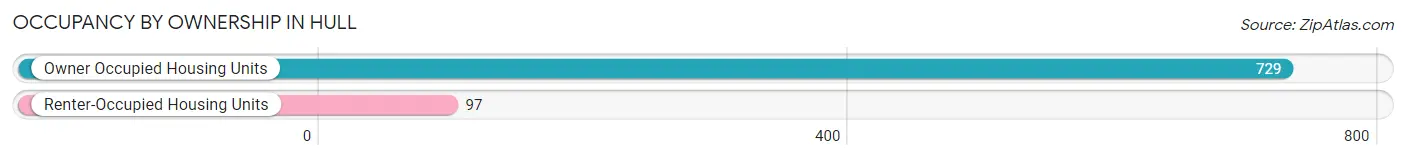
| Occupancy | # Housing Units | % Housing Units |
| Owner Occupied Housing Units | 729 | 88.3% |
| Renter-Occupied Housing Units | 97 | 11.7% |
| Total Occupied Housing Units | 826 | 100.0% |
Occupancy by Household Size in Hull
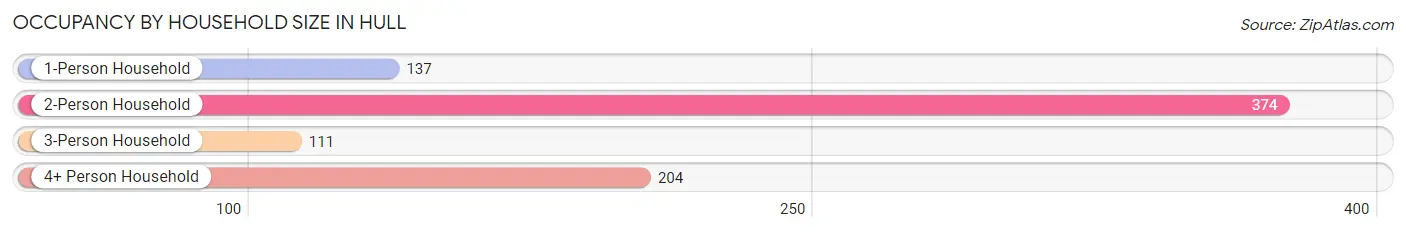
| Household Size | # Housing Units | % Housing Units |
| 1-Person Household | 137 | 16.6% |
| 2-Person Household | 374 | 45.3% |
| 3-Person Household | 111 | 13.4% |
| 4+ Person Household | 204 | 24.7% |
| Total Housing Units | 826 | 100.0% |
Occupancy by Ownership by Household Size in Hull
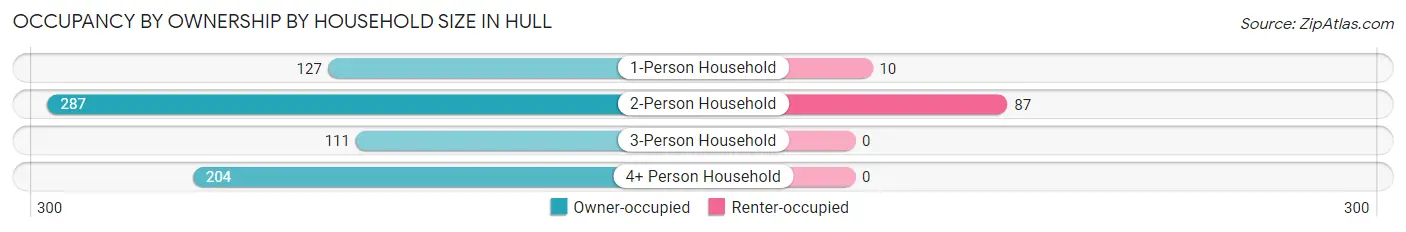
| Household Size | Owner-occupied | Renter-occupied |
| 1-Person Household | 127 (92.7%) | 10 (7.3%) |
| 2-Person Household | 287 (76.7%) | 87 (23.3%) |
| 3-Person Household | 111 (100.0%) | 0 (0.0%) |
| 4+ Person Household | 204 (100.0%) | 0 (0.0%) |
| Total Housing Units | 729 (88.3%) | 97 (11.7%) |
Occupancy by Educational Attainment in Hull
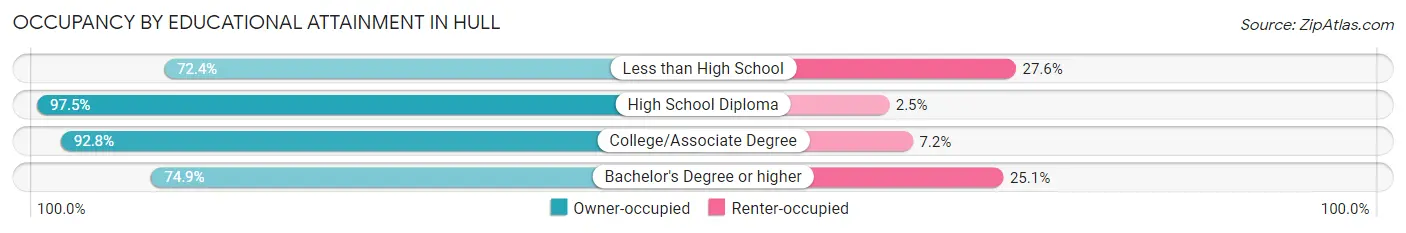
| Household Size | Owner-occupied | Renter-occupied |
| Less than High School | 55 (72.4%) | 21 (27.6%) |
| High School Diploma | 195 (97.5%) | 5 (2.5%) |
| College/Associate Degree | 348 (92.8%) | 27 (7.2%) |
| Bachelor's Degree or higher | 131 (74.9%) | 44 (25.1%) |
Occupancy by Age of Householder in Hull
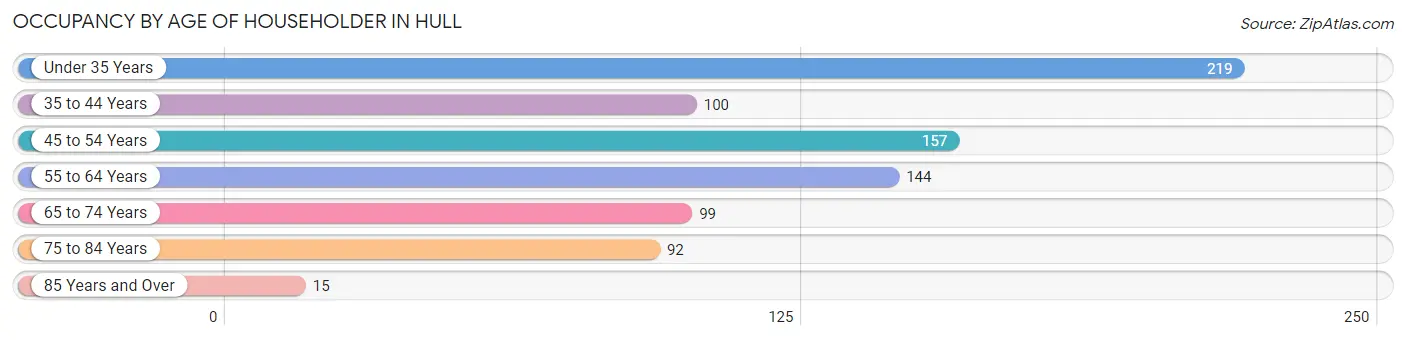
| Age Bracket | # Households | % Households |
| Under 35 Years | 219 | 26.5% |
| 35 to 44 Years | 100 | 12.1% |
| 45 to 54 Years | 157 | 19.0% |
| 55 to 64 Years | 144 | 17.4% |
| 65 to 74 Years | 99 | 12.0% |
| 75 to 84 Years | 92 | 11.1% |
| 85 Years and Over | 15 | 1.8% |
| Total | 826 | 100.0% |
Housing Finances in Hull
Median Income by Occupancy in Hull
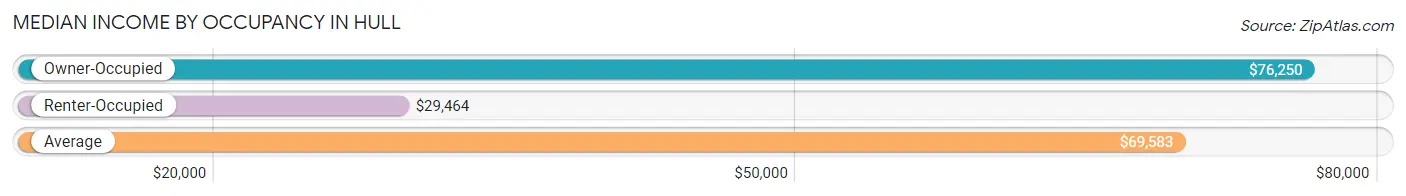
| Occupancy Type | # Households | Median Income |
| Owner-Occupied | 729 (88.3%) | $76,250 |
| Renter-Occupied | 97 (11.7%) | $29,464 |
| Average | 826 (100.0%) | $69,583 |
Occupancy by Householder Income Bracket in Hull
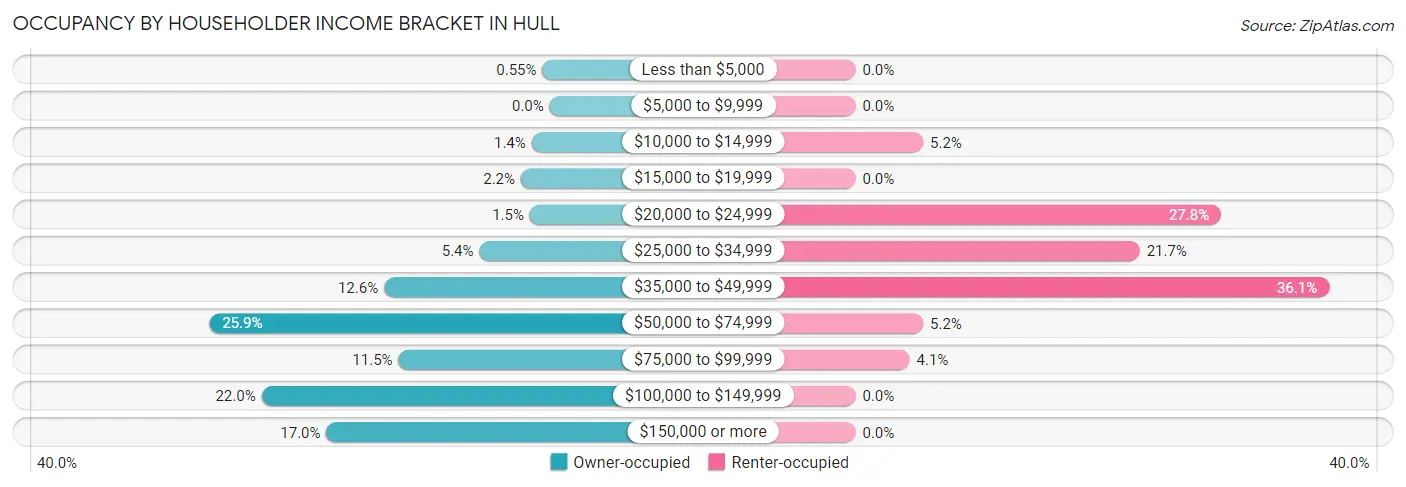
| Income Bracket | Owner-occupied | Renter-occupied |
| Less than $5,000 | 4 (0.5%) | 0 (0.0%) |
| $5,000 to $9,999 | 0 (0.0%) | 0 (0.0%) |
| $10,000 to $14,999 | 10 (1.4%) | 5 (5.1%) |
| $15,000 to $19,999 | 16 (2.2%) | 0 (0.0%) |
| $20,000 to $24,999 | 11 (1.5%) | 27 (27.8%) |
| $25,000 to $34,999 | 39 (5.3%) | 21 (21.6%) |
| $35,000 to $49,999 | 92 (12.6%) | 35 (36.1%) |
| $50,000 to $74,999 | 189 (25.9%) | 5 (5.1%) |
| $75,000 to $99,999 | 84 (11.5%) | 4 (4.1%) |
| $100,000 to $149,999 | 160 (22.0%) | 0 (0.0%) |
| $150,000 or more | 124 (17.0%) | 0 (0.0%) |
| Total | 729 (100.0%) | 97 (100.0%) |
Monthly Housing Cost Tiers in Hull
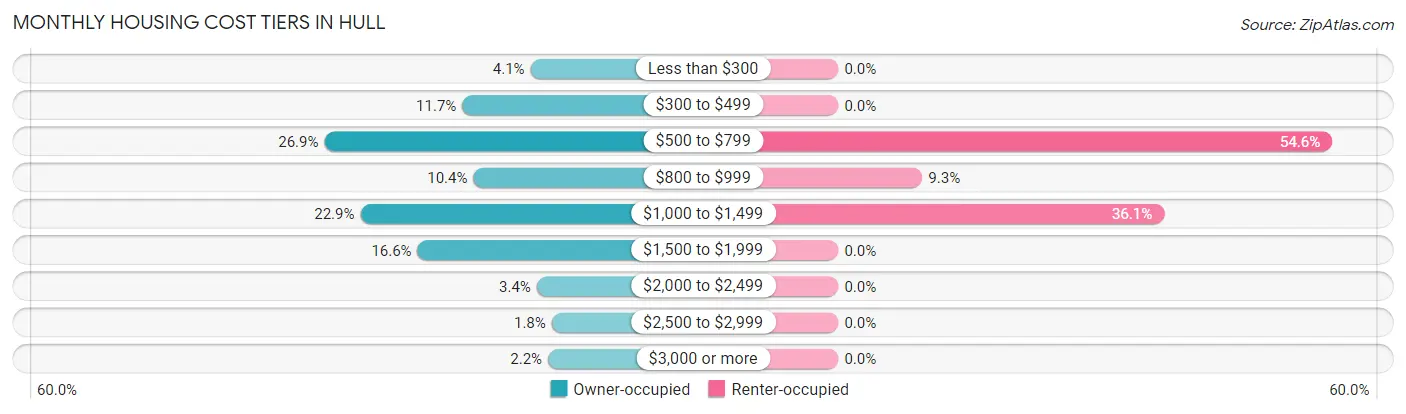
| Monthly Cost | Owner-occupied | Renter-occupied |
| Less than $300 | 30 (4.1%) | 0 (0.0%) |
| $300 to $499 | 85 (11.7%) | 0 (0.0%) |
| $500 to $799 | 196 (26.9%) | 53 (54.6%) |
| $800 to $999 | 76 (10.4%) | 9 (9.3%) |
| $1,000 to $1,499 | 167 (22.9%) | 35 (36.1%) |
| $1,500 to $1,999 | 121 (16.6%) | 0 (0.0%) |
| $2,000 to $2,499 | 25 (3.4%) | 0 (0.0%) |
| $2,500 to $2,999 | 13 (1.8%) | 0 (0.0%) |
| $3,000 or more | 16 (2.2%) | 0 (0.0%) |
| Total | 729 (100.0%) | 97 (100.0%) |
Physical Housing Characteristics in Hull
Housing Structures in Hull
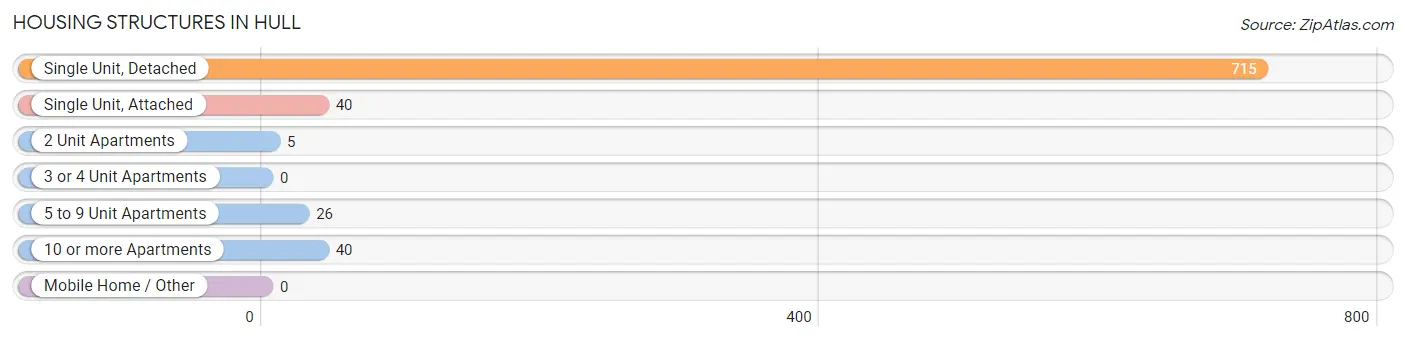
| Structure Type | # Housing Units | % Housing Units |
| Single Unit, Detached | 715 | 86.6% |
| Single Unit, Attached | 40 | 4.8% |
| 2 Unit Apartments | 5 | 0.6% |
| 3 or 4 Unit Apartments | 0 | 0.0% |
| 5 to 9 Unit Apartments | 26 | 3.2% |
| 10 or more Apartments | 40 | 4.8% |
| Mobile Home / Other | 0 | 0.0% |
| Total | 826 | 100.0% |
Housing Structures by Occupancy in Hull
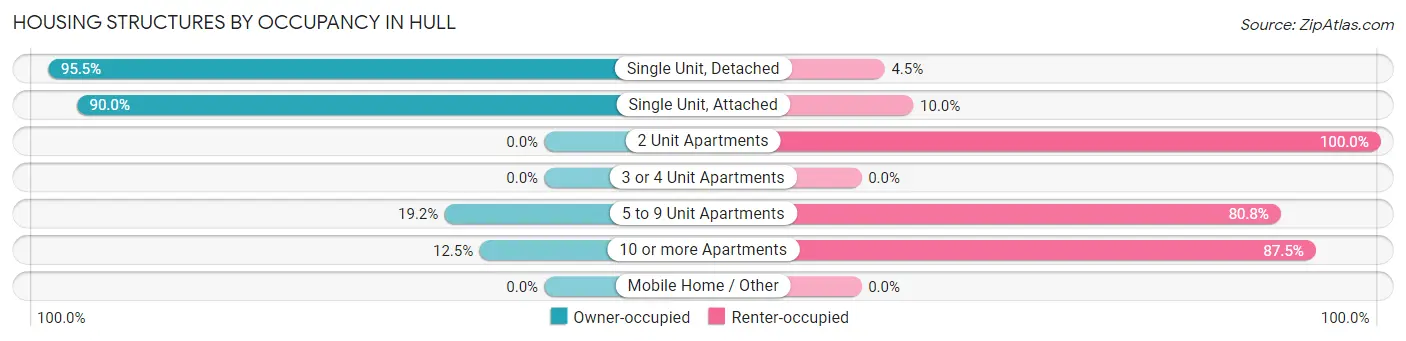
| Structure Type | Owner-occupied | Renter-occupied |
| Single Unit, Detached | 683 (95.5%) | 32 (4.5%) |
| Single Unit, Attached | 36 (90.0%) | 4 (10.0%) |
| 2 Unit Apartments | 0 (0.0%) | 5 (100.0%) |
| 3 or 4 Unit Apartments | 0 (0.0%) | 0 (0.0%) |
| 5 to 9 Unit Apartments | 5 (19.2%) | 21 (80.8%) |
| 10 or more Apartments | 5 (12.5%) | 35 (87.5%) |
| Mobile Home / Other | 0 (0.0%) | 0 (0.0%) |
| Total | 729 (88.3%) | 97 (11.7%) |
Housing Structures by Number of Rooms in Hull
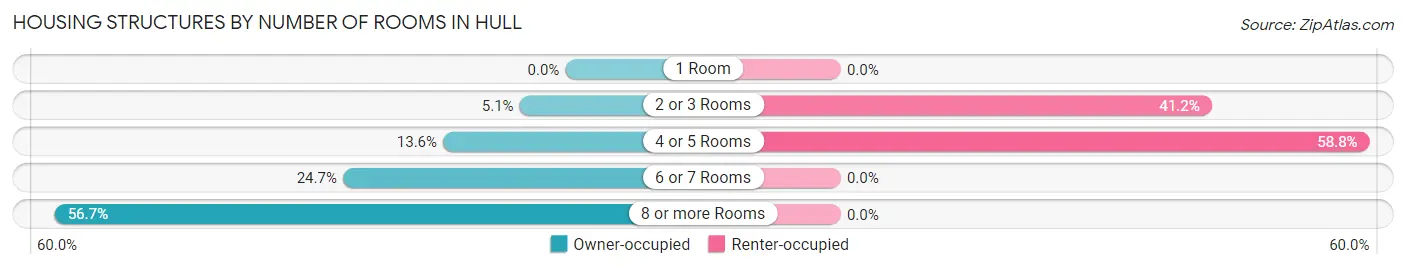
| Number of Rooms | Owner-occupied | Renter-occupied |
| 1 Room | 0 (0.0%) | 0 (0.0%) |
| 2 or 3 Rooms | 37 (5.1%) | 40 (41.2%) |
| 4 or 5 Rooms | 99 (13.6%) | 57 (58.8%) |
| 6 or 7 Rooms | 180 (24.7%) | 0 (0.0%) |
| 8 or more Rooms | 413 (56.7%) | 0 (0.0%) |
| Total | 729 (100.0%) | 97 (100.0%) |
Housing Structure by Heating Type in Hull
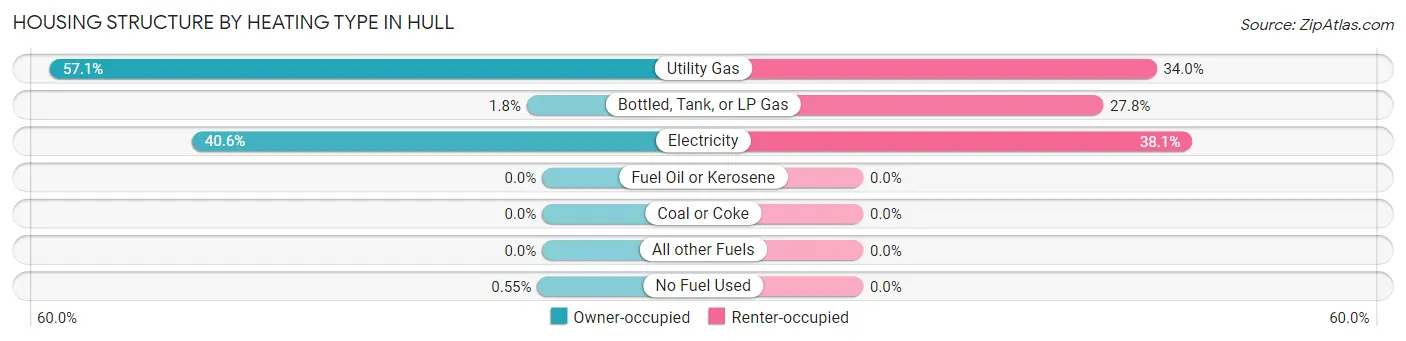
| Heating Type | Owner-occupied | Renter-occupied |
| Utility Gas | 416 (57.1%) | 33 (34.0%) |
| Bottled, Tank, or LP Gas | 13 (1.8%) | 27 (27.8%) |
| Electricity | 296 (40.6%) | 37 (38.1%) |
| Fuel Oil or Kerosene | 0 (0.0%) | 0 (0.0%) |
| Coal or Coke | 0 (0.0%) | 0 (0.0%) |
| All other Fuels | 0 (0.0%) | 0 (0.0%) |
| No Fuel Used | 4 (0.5%) | 0 (0.0%) |
| Total | 729 (100.0%) | 97 (100.0%) |
Household Vehicle Usage in Hull
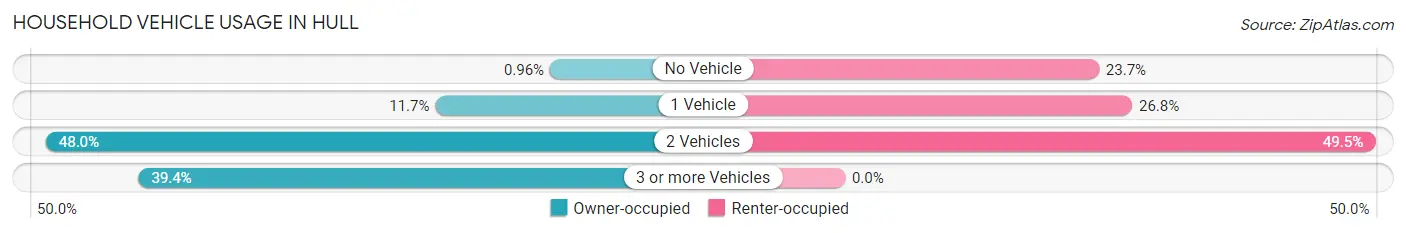
| Vehicles per Household | Owner-occupied | Renter-occupied |
| No Vehicle | 7 (1.0%) | 23 (23.7%) |
| 1 Vehicle | 85 (11.7%) | 26 (26.8%) |
| 2 Vehicles | 350 (48.0%) | 48 (49.5%) |
| 3 or more Vehicles | 287 (39.4%) | 0 (0.0%) |
| Total | 729 (100.0%) | 97 (100.0%) |
Real Estate & Mortgages in Hull
Real Estate and Mortgage Overview in Hull
| Characteristic | Without Mortgage | With Mortgage |
| Housing Units | 308 | 421 |
| Median Property Value | $204,500 | $222,700 |
| Median Household Income | $66,875 | $98 |
| Monthly Housing Costs | $546 | $16 |
| Real Estate Taxes | $2,564 | $0 |
Property Value by Mortgage Status in Hull
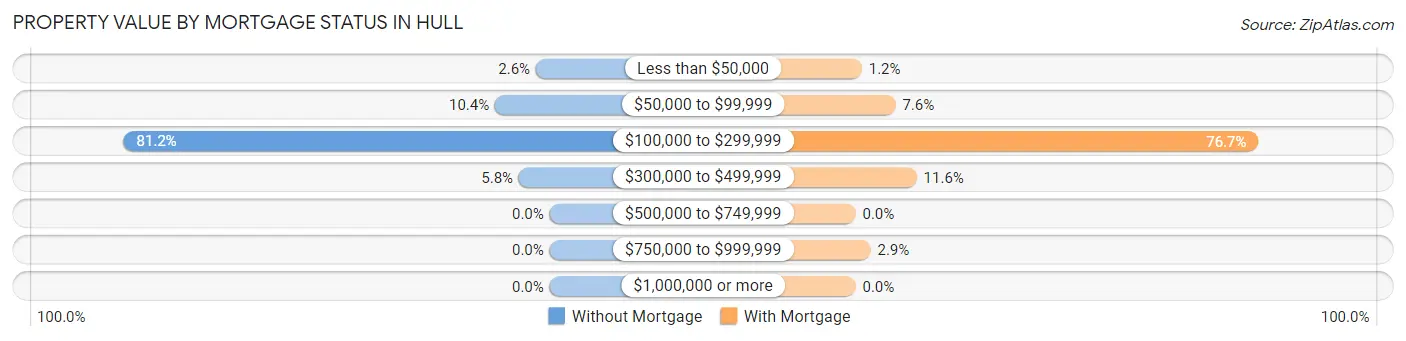
| Property Value | Without Mortgage | With Mortgage |
| Less than $50,000 | 8 (2.6%) | 5 (1.2%) |
| $50,000 to $99,999 | 32 (10.4%) | 32 (7.6%) |
| $100,000 to $299,999 | 250 (81.2%) | 323 (76.7%) |
| $300,000 to $499,999 | 18 (5.8%) | 49 (11.6%) |
| $500,000 to $749,999 | 0 (0.0%) | 0 (0.0%) |
| $750,000 to $999,999 | 0 (0.0%) | 12 (2.9%) |
| $1,000,000 or more | 0 (0.0%) | 0 (0.0%) |
| Total | 308 (100.0%) | 421 (100.0%) |
Household Income by Mortgage Status in Hull
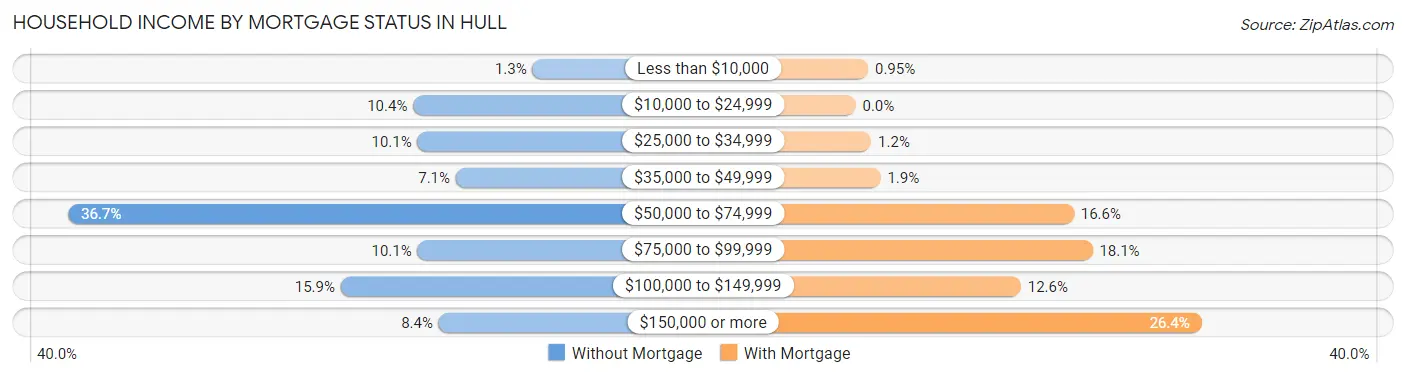
| Household Income | Without Mortgage | With Mortgage |
| Less than $10,000 | 4 (1.3%) | 4 (0.9%) |
| $10,000 to $24,999 | 32 (10.4%) | 0 (0.0%) |
| $25,000 to $34,999 | 31 (10.1%) | 5 (1.2%) |
| $35,000 to $49,999 | 22 (7.1%) | 8 (1.9%) |
| $50,000 to $74,999 | 113 (36.7%) | 70 (16.6%) |
| $75,000 to $99,999 | 31 (10.1%) | 76 (18.0%) |
| $100,000 to $149,999 | 49 (15.9%) | 53 (12.6%) |
| $150,000 or more | 26 (8.4%) | 111 (26.4%) |
| Total | 308 (100.0%) | 421 (100.0%) |
Property Value to Household Income Ratio in Hull
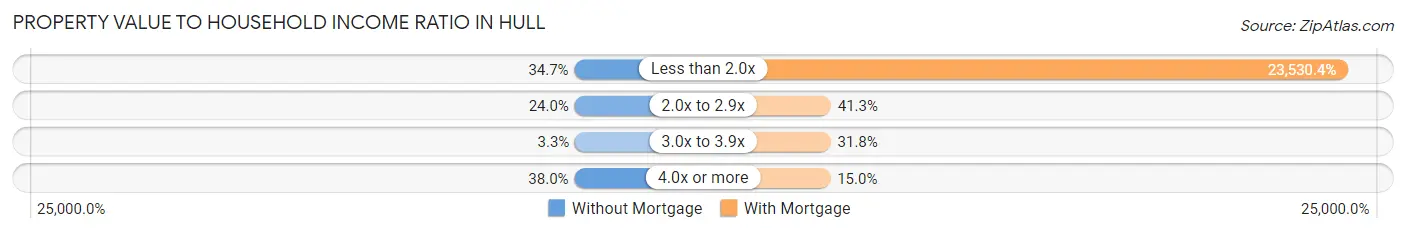
| Value-to-Income Ratio | Without Mortgage | With Mortgage |
| Less than 2.0x | 107 (34.7%) | 99,063 (23,530.4%) |
| 2.0x to 2.9x | 74 (24.0%) | 174 (41.3%) |
| 3.0x to 3.9x | 10 (3.3%) | 134 (31.8%) |
| 4.0x or more | 117 (38.0%) | 63 (15.0%) |
| Total | 308 (100.0%) | 421 (100.0%) |
Real Estate Taxes by Mortgage Status in Hull
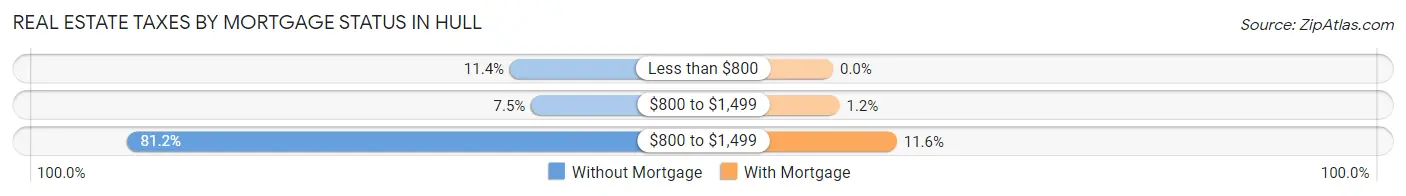
| Property Taxes | Without Mortgage | With Mortgage |
| Less than $800 | 35 (11.4%) | 0 (0.0%) |
| $800 to $1,499 | 23 (7.5%) | 5 (1.2%) |
| $800 to $1,499 | 250 (81.2%) | 49 (11.6%) |
| Total | 308 (100.0%) | 421 (100.0%) |
Health & Disability in Hull
Health Insurance Coverage by Age in Hull
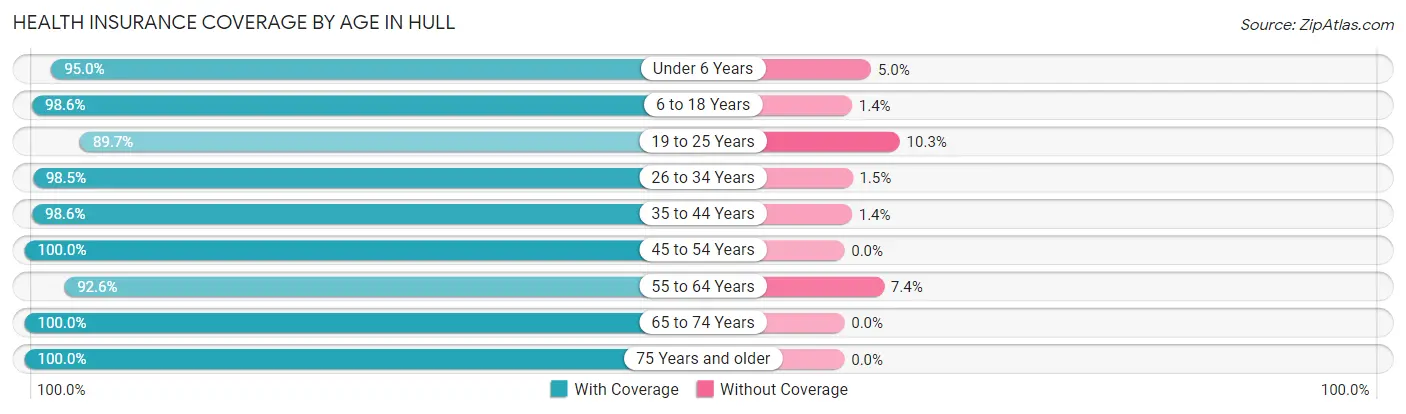
| Age Bracket | With Coverage | Without Coverage |
| Under 6 Years | 153 (95.0%) | 8 (5.0%) |
| 6 to 18 Years | 490 (98.6%) | 7 (1.4%) |
| 19 to 25 Years | 278 (89.7%) | 32 (10.3%) |
| 26 to 34 Years | 195 (98.5%) | 3 (1.5%) |
| 35 to 44 Years | 212 (98.6%) | 3 (1.4%) |
| 45 to 54 Years | 298 (100.0%) | 0 (0.0%) |
| 55 to 64 Years | 263 (92.6%) | 21 (7.4%) |
| 65 to 74 Years | 178 (100.0%) | 0 (0.0%) |
| 75 Years and older | 154 (100.0%) | 0 (0.0%) |
| Total | 2,221 (96.8%) | 74 (3.2%) |
Health Insurance Coverage by Citizenship Status in Hull
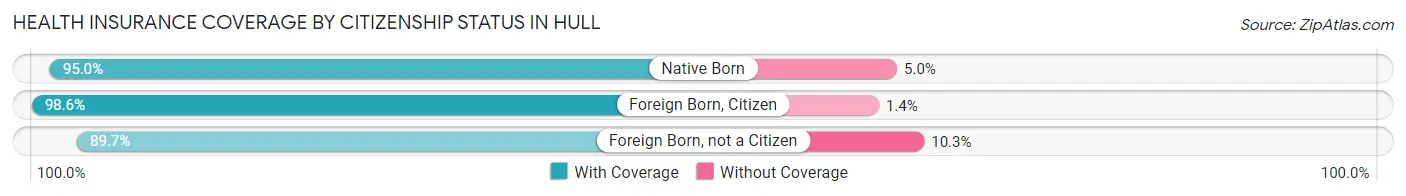
| Citizenship Status | With Coverage | Without Coverage |
| Native Born | 153 (95.0%) | 8 (5.0%) |
| Foreign Born, Citizen | 490 (98.6%) | 7 (1.4%) |
| Foreign Born, not a Citizen | 278 (89.7%) | 32 (10.3%) |
Health Insurance Coverage by Household Income in Hull
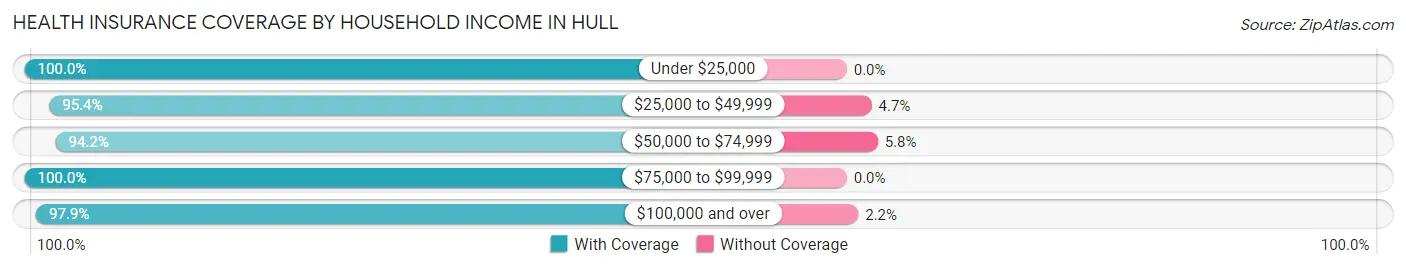
| Household Income | With Coverage | Without Coverage |
| Under $25,000 | 100 (100.0%) | 0 (0.0%) |
| $25,000 to $49,999 | 431 (95.4%) | 21 (4.6%) |
| $50,000 to $74,999 | 535 (94.2%) | 33 (5.8%) |
| $75,000 to $99,999 | 235 (100.0%) | 0 (0.0%) |
| $100,000 and over | 912 (97.9%) | 20 (2.1%) |
Public vs Private Health Insurance Coverage by Age in Hull
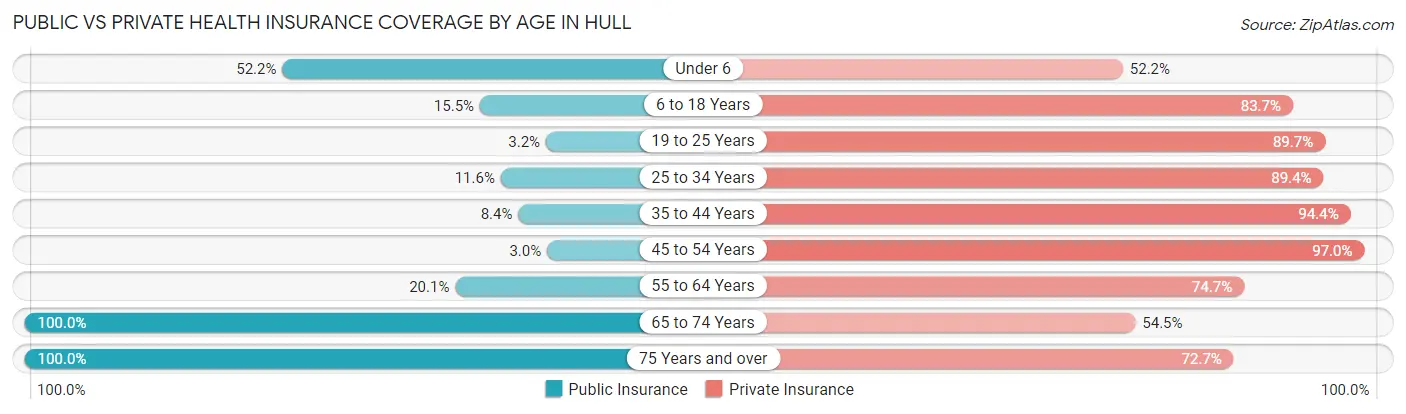
| Age Bracket | Public Insurance | Private Insurance |
| Under 6 | 84 (52.2%) | 84 (52.2%) |
| 6 to 18 Years | 77 (15.5%) | 416 (83.7%) |
| 19 to 25 Years | 10 (3.2%) | 278 (89.7%) |
| 25 to 34 Years | 23 (11.6%) | 177 (89.4%) |
| 35 to 44 Years | 18 (8.4%) | 203 (94.4%) |
| 45 to 54 Years | 9 (3.0%) | 289 (97.0%) |
| 55 to 64 Years | 57 (20.1%) | 212 (74.7%) |
| 65 to 74 Years | 178 (100.0%) | 97 (54.5%) |
| 75 Years and over | 154 (100.0%) | 112 (72.7%) |
| Total | 610 (26.6%) | 1,868 (81.4%) |
Disability Status by Sex by Age in Hull
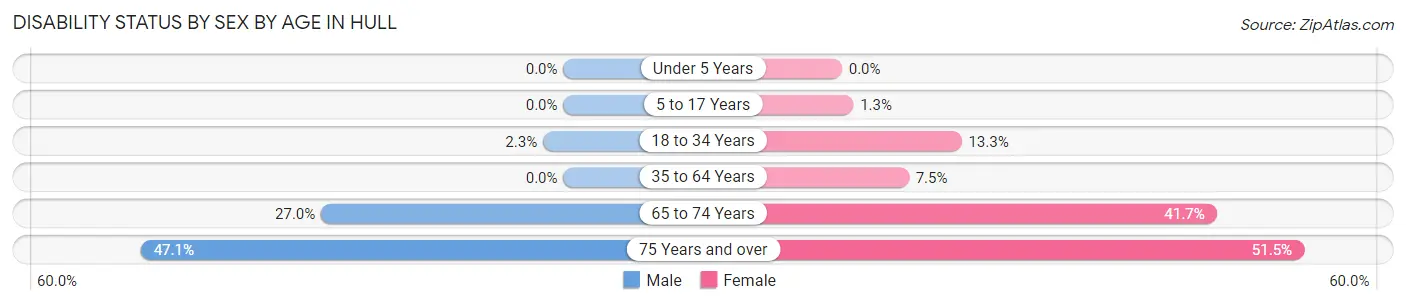
| Age Bracket | Male | Female |
| Under 5 Years | 0 (0.0%) | 0 (0.0%) |
| 5 to 17 Years | 0 (0.0%) | 3 (1.3%) |
| 18 to 34 Years | 6 (2.3%) | 38 (13.3%) |
| 35 to 64 Years | 0 (0.0%) | 28 (7.4%) |
| 65 to 74 Years | 17 (27.0%) | 48 (41.7%) |
| 75 Years and over | 24 (47.1%) | 53 (51.5%) |
Disability Class by Sex by Age in Hull
Disability Class: Hearing Difficulty
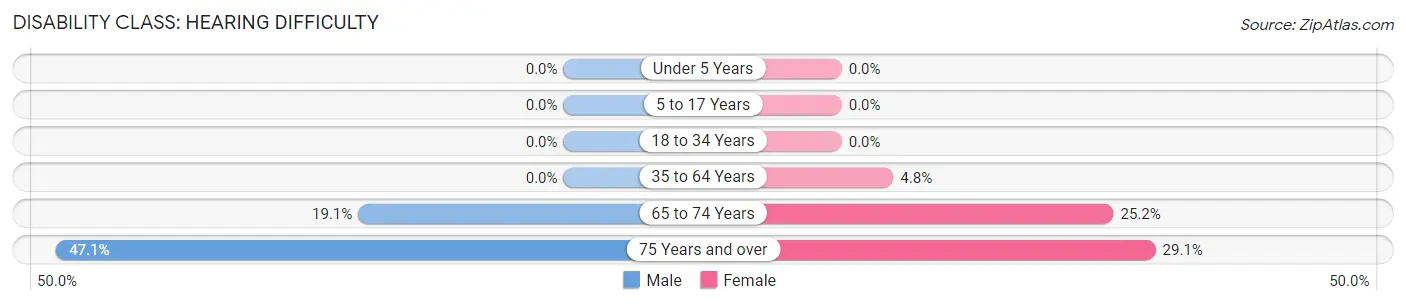
| Age Bracket | Male | Female |
| Under 5 Years | 0 (0.0%) | 0 (0.0%) |
| 5 to 17 Years | 0 (0.0%) | 0 (0.0%) |
| 18 to 34 Years | 0 (0.0%) | 0 (0.0%) |
| 35 to 64 Years | 0 (0.0%) | 18 (4.8%) |
| 65 to 74 Years | 12 (19.1%) | 29 (25.2%) |
| 75 Years and over | 24 (47.1%) | 30 (29.1%) |
Disability Class: Vision Difficulty
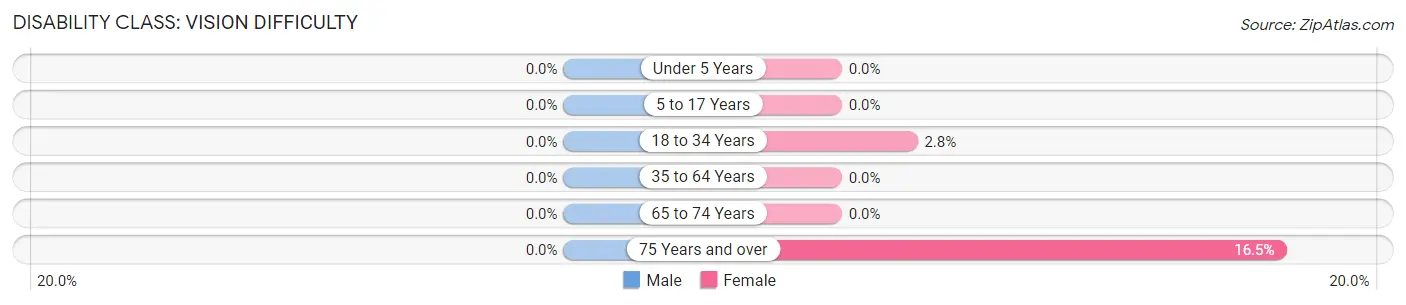
| Age Bracket | Male | Female |
| Under 5 Years | 0 (0.0%) | 0 (0.0%) |
| 5 to 17 Years | 0 (0.0%) | 0 (0.0%) |
| 18 to 34 Years | 0 (0.0%) | 8 (2.8%) |
| 35 to 64 Years | 0 (0.0%) | 0 (0.0%) |
| 65 to 74 Years | 0 (0.0%) | 0 (0.0%) |
| 75 Years and over | 0 (0.0%) | 17 (16.5%) |
Disability Class: Cognitive Difficulty
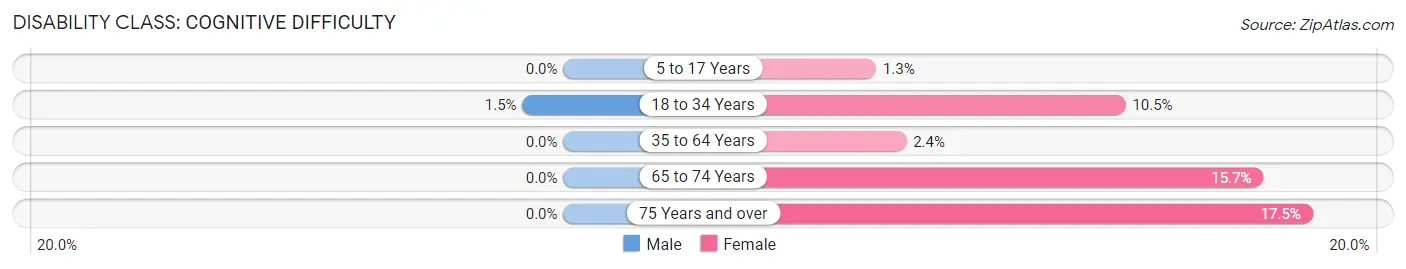
| Age Bracket | Male | Female |
| 5 to 17 Years | 0 (0.0%) | 3 (1.3%) |
| 18 to 34 Years | 4 (1.5%) | 30 (10.5%) |
| 35 to 64 Years | 0 (0.0%) | 9 (2.4%) |
| 65 to 74 Years | 0 (0.0%) | 18 (15.7%) |
| 75 Years and over | 0 (0.0%) | 18 (17.5%) |
Disability Class: Ambulatory Difficulty
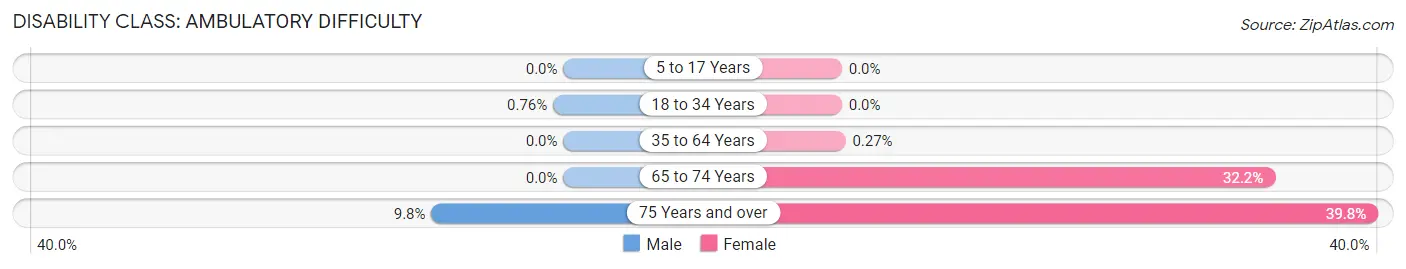
| Age Bracket | Male | Female |
| 5 to 17 Years | 0 (0.0%) | 0 (0.0%) |
| 18 to 34 Years | 2 (0.8%) | 0 (0.0%) |
| 35 to 64 Years | 0 (0.0%) | 1 (0.3%) |
| 65 to 74 Years | 0 (0.0%) | 37 (32.2%) |
| 75 Years and over | 5 (9.8%) | 41 (39.8%) |
Disability Class: Self-Care Difficulty
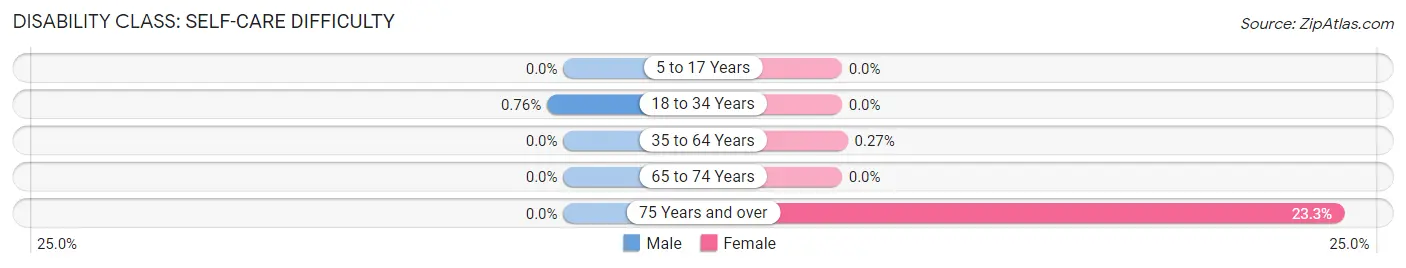
| Age Bracket | Male | Female |
| 5 to 17 Years | 0 (0.0%) | 0 (0.0%) |
| 18 to 34 Years | 2 (0.8%) | 0 (0.0%) |
| 35 to 64 Years | 0 (0.0%) | 1 (0.3%) |
| 65 to 74 Years | 0 (0.0%) | 0 (0.0%) |
| 75 Years and over | 0 (0.0%) | 24 (23.3%) |
Technology Access in Hull
Computing Device Access in Hull
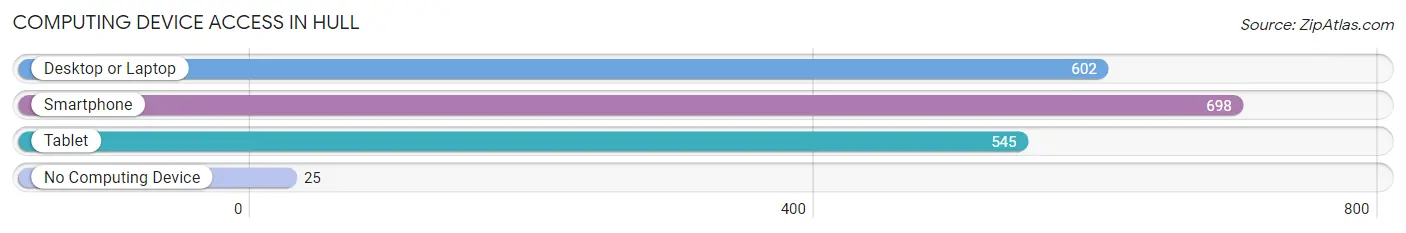
| Device Type | # Households | % Households |
| Desktop or Laptop | 602 | 72.9% |
| Smartphone | 698 | 84.5% |
| Tablet | 545 | 66.0% |
| No Computing Device | 25 | 3.0% |
| Total | 826 | 100.0% |
Internet Access in Hull
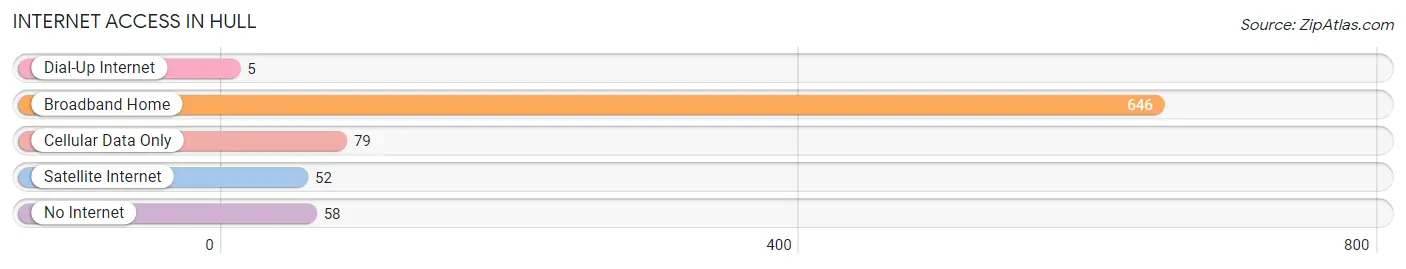
| Internet Type | # Households | % Households |
| Dial-Up Internet | 5 | 0.6% |
| Broadband Home | 646 | 78.2% |
| Cellular Data Only | 79 | 9.6% |
| Satellite Internet | 52 | 6.3% |
| No Internet | 58 | 7.0% |
| Total | 826 | 100.0% |
Hull Summary
Hull, Iowa is a small city located in Sioux County, Iowa, United States. It is situated on the Big Sioux River, near the Iowa-Minnesota border. The city has a population of 3,743 as of the 2010 census.
History
Hull was founded in 1871 by a group of Dutch settlers who had recently arrived in the area. The city was named after the Dutch city of Hull, which is now part of the United Kingdom. The settlers were attracted to the area due to its fertile soil and abundant natural resources.
The city was incorporated in 1882 and quickly grew to become a major agricultural center. The city was home to several large grain elevators, a creamery, and a number of other businesses.
In the early 1900s, Hull was a major stop on the Chicago, Milwaukee, St. Paul and Pacific Railroad. The railroad brought in many new residents and businesses, and the city continued to grow.
Geography
Hull is located at 42°45'45" North, 96°17'45" West (42.7625, -96.2958). The city is situated on the Big Sioux River, near the Iowa-Minnesota border.
The city has a total area of 2.2 square miles, all of which is land. The terrain is mostly flat, with some rolling hills in the area.
Economy
Hull's economy is largely based on agriculture. The city is home to several large grain elevators, a creamery, and a number of other businesses.
The city is also home to several manufacturing companies, including a plastics manufacturer, a metal fabrication company, and a printing company.
Demographics
As of the 2010 census, Hull had a population of 3,743. The racial makeup of the city was 97.2% White, 0.3% African American, 0.2% Native American, 0.3% Asian, 0.1% Pacific Islander, 0.7% from other races, and 1.2% from two or more races. Hispanic or Latino of any race were 2.2% of the population.
The median income for a household in the city was $41,944, and the median income for a family was $50,938. The per capita income for the city was $19,945. About 6.2% of families and 8.2% of the population were below the poverty line, including 10.2% of those under age 18 and 8.3% of those age 65 or over.
Common Questions
What is Per Capita Income in Hull?
Per Capita income in Hull is $39,431.
What is the Median Family Income in Hull?
Median Family Income in Hull is $78,000.
What is the Median Household income in Hull?
Median Household Income in Hull is $69,583.
What is Income or Wage Gap in Hull?
Income or Wage Gap in Hull is 58.2%.
Women in Hull earn 41.8 cents for every dollar earned by a man.
What is Inequality or Gini Index in Hull?
Inequality or Gini Index in Hull is 0.45.
What is the Total Population of Hull?
Total Population of Hull is 2,340.
What is the Total Male Population of Hull?
Total Male Population of Hull is 1,159.
What is the Total Female Population of Hull?
Total Female Population of Hull is 1,181.
What is the Ratio of Males per 100 Females in Hull?
There are 98.14 Males per 100 Females in Hull.
What is the Ratio of Females per 100 Males in Hull?
There are 101.90 Females per 100 Males in Hull.
What is the Median Population Age in Hull?
Median Population Age in Hull is 35.3 Years.
What is the Average Family Size in Hull
Average Family Size in Hull is 3.1 People.
What is the Average Household Size in Hull
Average Household Size in Hull is 2.8 People.
How Large is the Labor Force in Hull?
There are 1,372 People in the Labor Forcein in Hull.
What is the Percentage of People in the Labor Force in Hull?
74.9% of People are in the Labor Force in Hull.
What is the Unemployment Rate in Hull?
Unemployment Rate in Hull is 3.4%.