Hamburg, IA Map & Demographics
Hamburg Map
Hamburg Overview
$30,295
PER CAPITA INCOME
$78,393
AVG FAMILY INCOME
$54,597
AVG HOUSEHOLD INCOME
15.8%
WAGE / INCOME GAP [ % ]
84.2¢/ $1
WAGE / INCOME GAP [ $ ]
0.37
INEQUALITY / GINI INDEX
1,087
TOTAL POPULATION
585
MALE POPULATION
502
FEMALE POPULATION
116.53
MALES / 100 FEMALES
85.81
FEMALES / 100 MALES
42.5
MEDIAN AGE
3.0
AVG FAMILY SIZE
2.3
AVG HOUSEHOLD SIZE
521
LABOR FORCE [ PEOPLE ]
59.4%
PERCENT IN LABOR FORCE
2.7%
UNEMPLOYMENT RATE
Hamburg Zip Codes
Hamburg Area Codes
Income in Hamburg
Income Overview in Hamburg
Per Capita Income in Hamburg is $30,295, while median incomes of families and households are $78,393 and $54,597 respectively.
| Characteristic | Number | Measure |
| Per Capita Income | 1,087 | $30,295 |
| Median Family Income | 285 | $78,393 |
| Mean Family Income | 285 | $85,212 |
| Median Household Income | 480 | $54,597 |
| Mean Household Income | 480 | $68,847 |
| Income Deficit | 285 | $0 |
| Wage / Income Gap (%) | 1,087 | 15.83% |
| Wage / Income Gap ($) | 1,087 | 84.17¢ per $1 |
| Gini / Inequality Index | 1,087 | 0.37 |
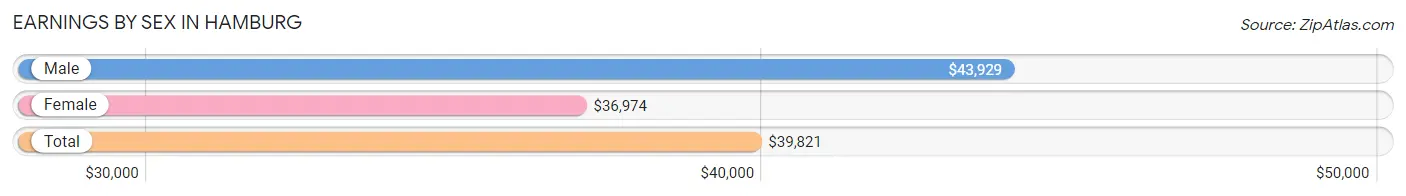
Earnings by Sex in Hamburg
Average Earnings in Hamburg are $39,821, $43,929 for men and $36,974 for women, a difference of 15.8%.
| Sex | Number | Average Earnings |
| Male | 298 (54.4%) | $43,929 |
| Female | 250 (45.6%) | $36,974 |
| Total | 548 (100.0%) | $39,821 |
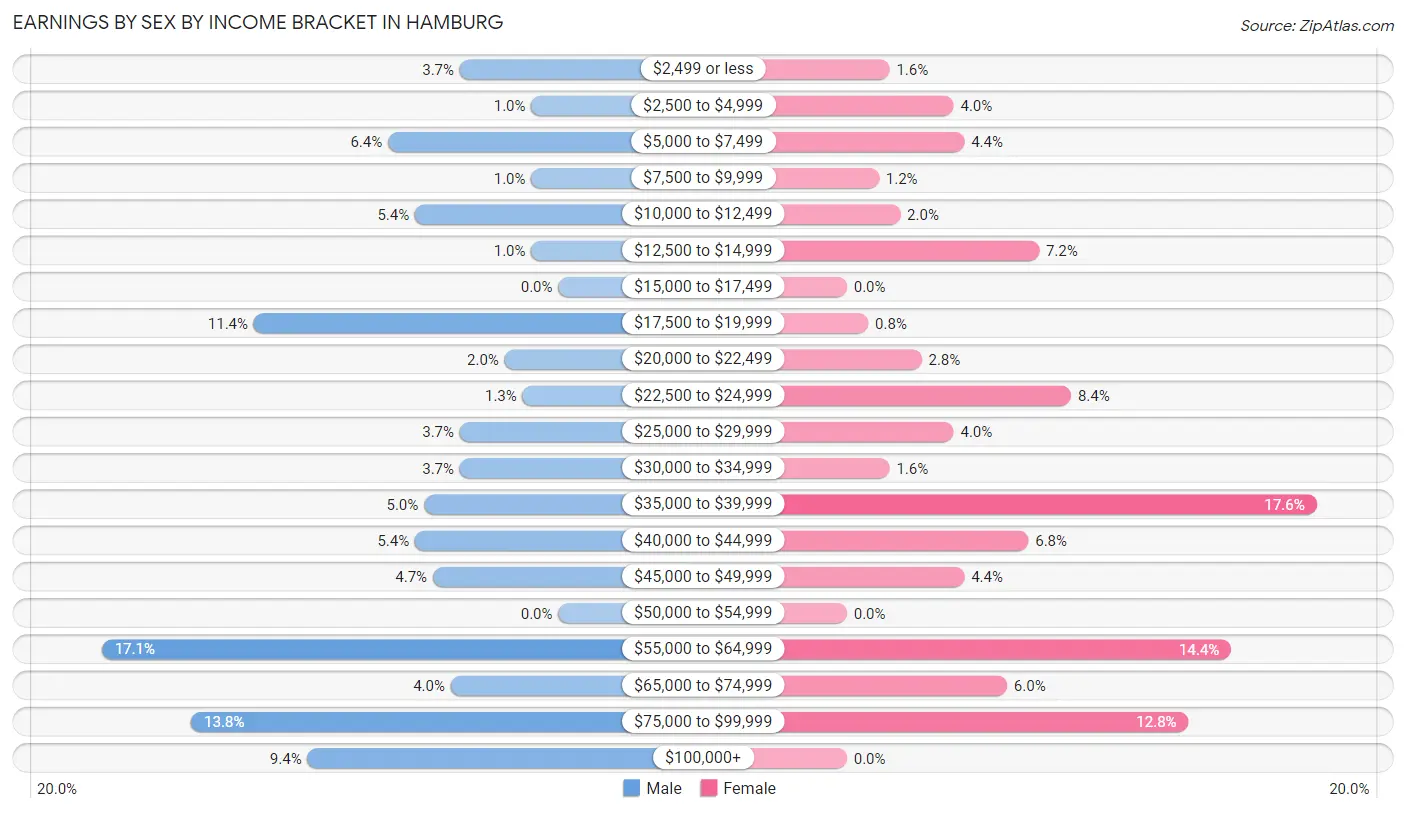
Earnings by Sex by Income Bracket in Hamburg
The most common earnings brackets in Hamburg are $55,000 to $64,999 for men (51 | 17.1%) and $35,000 to $39,999 for women (44 | 17.6%).
| Income | Male | Female |
| $2,499 or less | 11 (3.7%) | 4 (1.6%) |
| $2,500 to $4,999 | 3 (1.0%) | 10 (4.0%) |
| $5,000 to $7,499 | 19 (6.4%) | 11 (4.4%) |
| $7,500 to $9,999 | 3 (1.0%) | 3 (1.2%) |
| $10,000 to $12,499 | 16 (5.4%) | 5 (2.0%) |
| $12,500 to $14,999 | 3 (1.0%) | 18 (7.2%) |
| $15,000 to $17,499 | 0 (0.0%) | 0 (0.0%) |
| $17,500 to $19,999 | 34 (11.4%) | 2 (0.8%) |
| $20,000 to $22,499 | 6 (2.0%) | 7 (2.8%) |
| $22,500 to $24,999 | 4 (1.3%) | 21 (8.4%) |
| $25,000 to $29,999 | 11 (3.7%) | 10 (4.0%) |
| $30,000 to $34,999 | 11 (3.7%) | 4 (1.6%) |
| $35,000 to $39,999 | 15 (5.0%) | 44 (17.6%) |
| $40,000 to $44,999 | 16 (5.4%) | 17 (6.8%) |
| $45,000 to $49,999 | 14 (4.7%) | 11 (4.4%) |
| $50,000 to $54,999 | 0 (0.0%) | 0 (0.0%) |
| $55,000 to $64,999 | 51 (17.1%) | 36 (14.4%) |
| $65,000 to $74,999 | 12 (4.0%) | 15 (6.0%) |
| $75,000 to $99,999 | 41 (13.8%) | 32 (12.8%) |
| $100,000+ | 28 (9.4%) | 0 (0.0%) |
| Total | 298 (100.0%) | 250 (100.0%) |
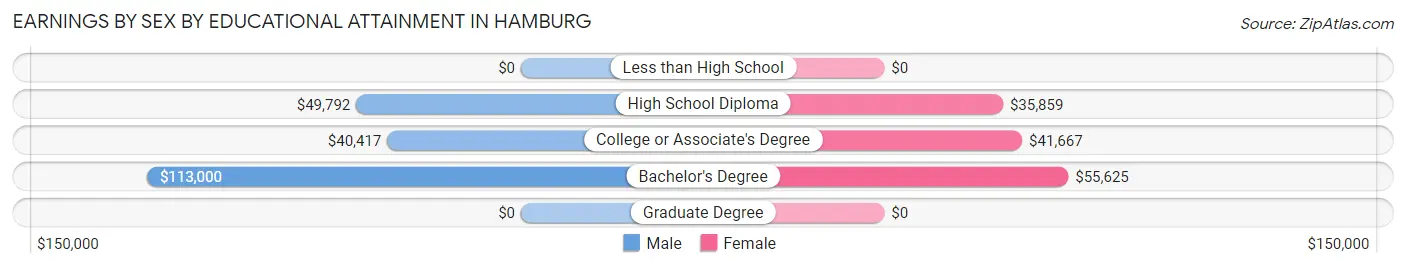
Earnings by Sex by Educational Attainment in Hamburg
Average earnings in Hamburg are $49,063 for men and $37,401 for women, a difference of 23.8%. Men with an educational attainment of bachelor's degree enjoy the highest average annual earnings of $113,000, while those with college or associate's degree education earn the least with $40,417. Women with an educational attainment of bachelor's degree earn the most with the average annual earnings of $55,625, while those with high school diploma education have the smallest earnings of $35,859.
| Educational Attainment | Male Income | Female Income |
| Less than High School | - | - |
| High School Diploma | $49,792 | $35,859 |
| College or Associate's Degree | $40,417 | $41,667 |
| Bachelor's Degree | $113,000 | $55,625 |
| Graduate Degree | - | - |
| Total | $49,063 | $37,401 |
Family Income in Hamburg
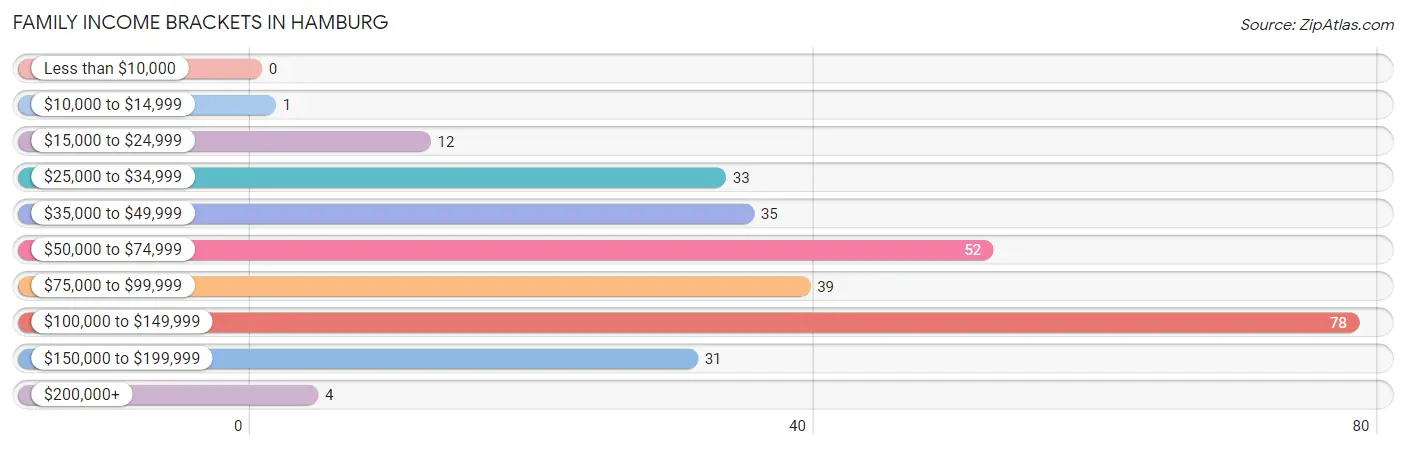
Family Income Brackets in Hamburg
According to the Hamburg family income data, there are 78 families falling into the $100,000 to $149,999 income range, which is the most common income bracket and makes up 27.4% of all families.
| Income Bracket | # Families | % Families |
| Less than $10,000 | 0 | 0.0% |
| $10,000 to $14,999 | 1 | 0.4% |
| $15,000 to $24,999 | 12 | 4.2% |
| $25,000 to $34,999 | 33 | 11.6% |
| $35,000 to $49,999 | 35 | 12.3% |
| $50,000 to $74,999 | 52 | 18.2% |
| $75,000 to $99,999 | 39 | 13.7% |
| $100,000 to $149,999 | 78 | 27.4% |
| $150,000 to $199,999 | 31 | 10.9% |
| $200,000+ | 4 | 1.4% |
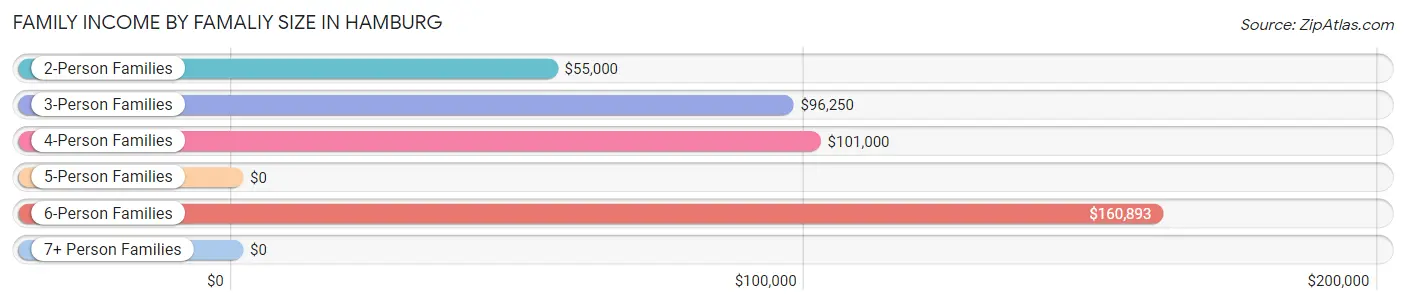
Family Income by Famaliy Size in Hamburg
6-person families (33 | 11.6%) account for the highest median family income in Hamburg with $160,893 per family, while 3-person families (38 | 13.3%) have the highest median income of $32,083 per family member.
| Income Bracket | # Families | Median Income |
| 2-Person Families | 164 (57.5%) | $55,000 |
| 3-Person Families | 38 (13.3%) | $96,250 |
| 4-Person Families | 44 (15.4%) | $101,000 |
| 5-Person Families | 6 (2.1%) | $0 |
| 6-Person Families | 33 (11.6%) | $160,893 |
| 7+ Person Families | 0 (0.0%) | $0 |
| Total | 285 (100.0%) | $78,393 |
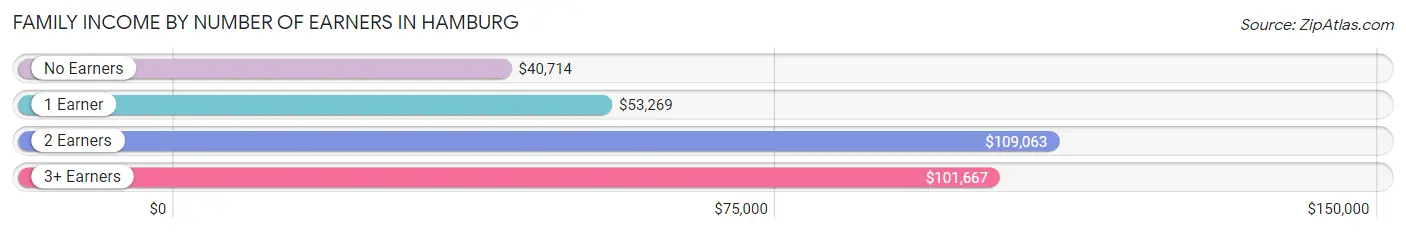
Family Income by Number of Earners in Hamburg
The median family income in Hamburg is $78,393, with families comprising 2 earners (123) having the highest median family income of $109,063, while families with no earners (46) have the lowest median family income of $40,714, accounting for 43.2% and 16.1% of families, respectively.
| Number of Earners | # Families | Median Income |
| No Earners | 46 (16.1%) | $40,714 |
| 1 Earner | 94 (33.0%) | $53,269 |
| 2 Earners | 123 (43.2%) | $109,063 |
| 3+ Earners | 22 (7.7%) | $101,667 |
| Total | 285 (100.0%) | $78,393 |
Household Income in Hamburg
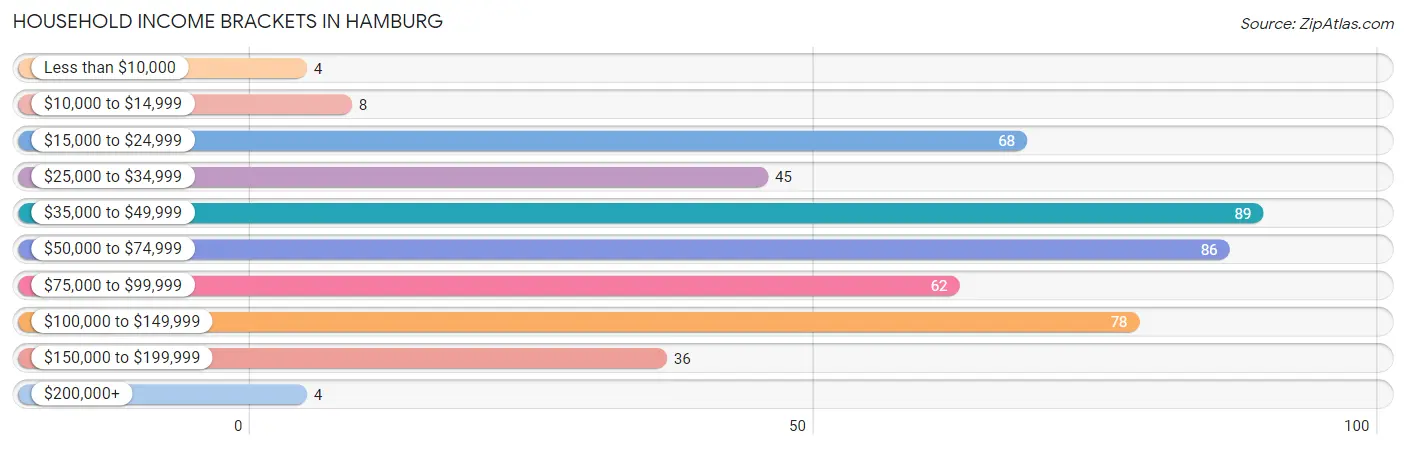
Household Income Brackets in Hamburg
With 89 households falling in the category, the $35,000 to $49,999 income range is the most frequent in Hamburg, accounting for 18.5% of all households. In contrast, only 4 households (0.8%) fall into the less than $10,000 income bracket, making it the least populous group.
| Income Bracket | # Households | % Households |
| Less than $10,000 | 4 | 0.8% |
| $10,000 to $14,999 | 8 | 1.7% |
| $15,000 to $24,999 | 68 | 14.2% |
| $25,000 to $34,999 | 45 | 9.4% |
| $35,000 to $49,999 | 89 | 18.5% |
| $50,000 to $74,999 | 86 | 17.9% |
| $75,000 to $99,999 | 62 | 12.9% |
| $100,000 to $149,999 | 78 | 16.3% |
| $150,000 to $199,999 | 36 | 7.5% |
| $200,000+ | 4 | 0.8% |
Household Income by Householder Age in Hamburg
The median household income in Hamburg is $54,597, with the highest median household income of $98,125 found in the 25 to 44 years age bracket for the primary householder. A total of 131 households (27.3%) fall into this category. Meanwhile, the 65+ years age bracket for the primary householder has the lowest median household income of $44,531, with 137 households (28.5%) in this group.
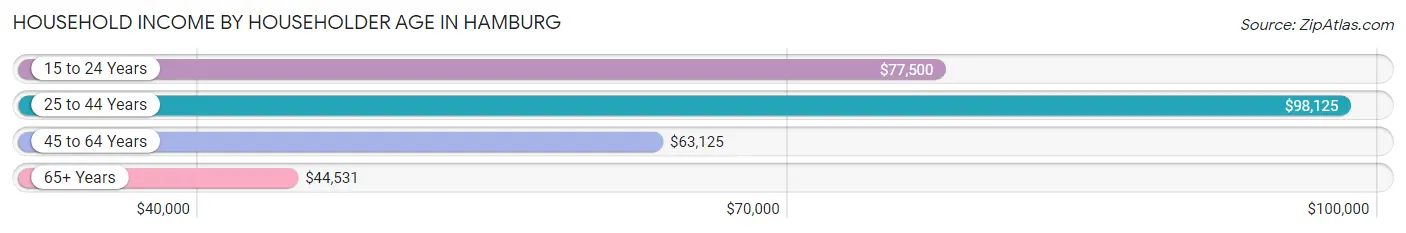
| Income Bracket | # Households | Median Income |
| 15 to 24 Years | 18 (3.7%) | $77,500 |
| 25 to 44 Years | 131 (27.3%) | $98,125 |
| 45 to 64 Years | 194 (40.4%) | $63,125 |
| 65+ Years | 137 (28.5%) | $44,531 |
| Total | 480 (100.0%) | $54,597 |
Poverty in Hamburg
Income Below Poverty by Sex and Age in Hamburg
With 6.8% poverty level for males and 10.0% for females among the residents of Hamburg, 12 to 14 year old males and 12 to 14 year old females are the most vulnerable to poverty, with 6 males (40.0%) and 5 females (35.7%) in their respective age groups living below the poverty level.
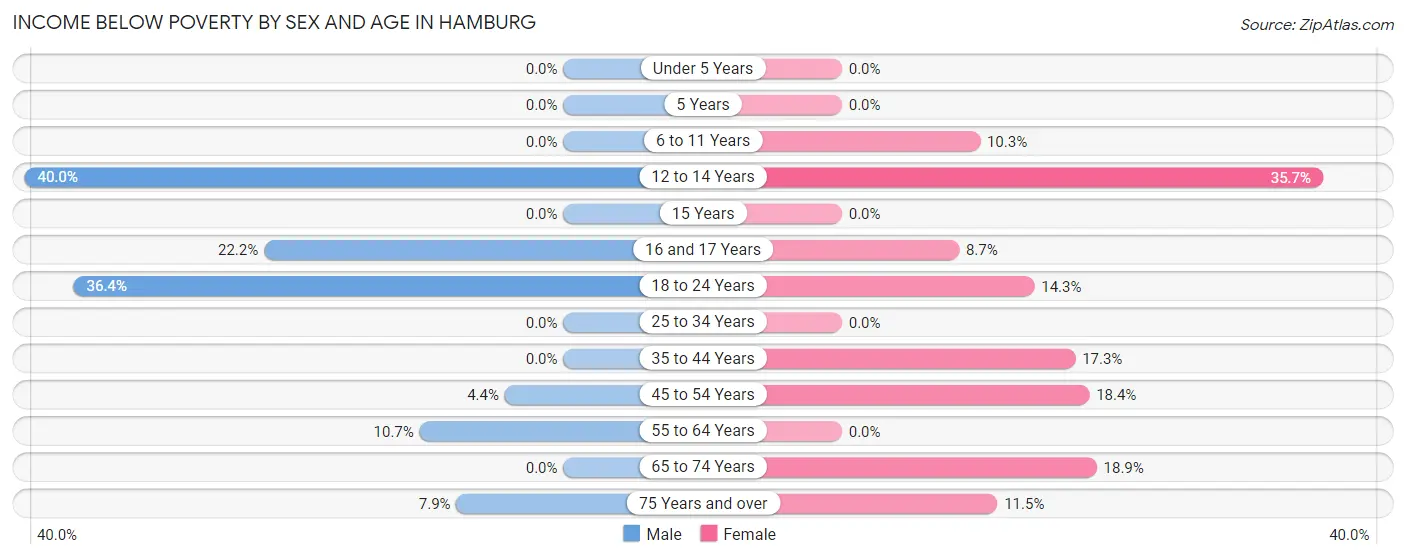
| Age Bracket | Male | Female |
| Under 5 Years | 0 (0.0%) | 0 (0.0%) |
| 5 Years | 0 (0.0%) | 0 (0.0%) |
| 6 to 11 Years | 0 (0.0%) | 4 (10.3%) |
| 12 to 14 Years | 6 (40.0%) | 5 (35.7%) |
| 15 Years | 0 (0.0%) | 0 (0.0%) |
| 16 and 17 Years | 6 (22.2%) | 2 (8.7%) |
| 18 to 24 Years | 12 (36.4%) | 4 (14.3%) |
| 25 to 34 Years | 0 (0.0%) | 0 (0.0%) |
| 35 to 44 Years | 0 (0.0%) | 13 (17.3%) |
| 45 to 54 Years | 3 (4.3%) | 9 (18.4%) |
| 55 to 64 Years | 8 (10.7%) | 0 (0.0%) |
| 65 to 74 Years | 0 (0.0%) | 7 (18.9%) |
| 75 Years and over | 5 (7.9%) | 6 (11.5%) |
| Total | 40 (6.8%) | 50 (10.0%) |
Income Above Poverty by Sex and Age in Hamburg
According to the poverty statistics in Hamburg, males aged under 5 years and females aged under 5 years are the age groups that are most secure financially, with 100.0% of males and 100.0% of females in these age groups living above the poverty line.
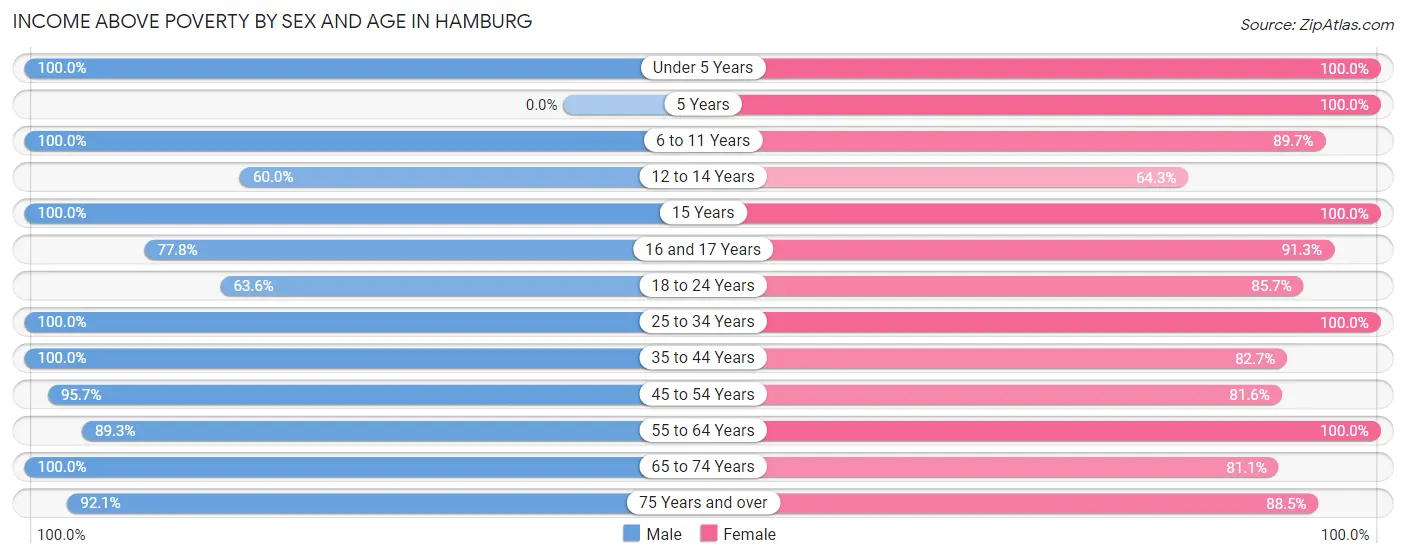
| Age Bracket | Male | Female |
| Under 5 Years | 11 (100.0%) | 6 (100.0%) |
| 5 Years | 0 (0.0%) | 12 (100.0%) |
| 6 to 11 Years | 98 (100.0%) | 35 (89.7%) |
| 12 to 14 Years | 9 (60.0%) | 9 (64.3%) |
| 15 Years | 10 (100.0%) | 3 (100.0%) |
| 16 and 17 Years | 21 (77.8%) | 21 (91.3%) |
| 18 to 24 Years | 21 (63.6%) | 24 (85.7%) |
| 25 to 34 Years | 45 (100.0%) | 62 (100.0%) |
| 35 to 44 Years | 79 (100.0%) | 62 (82.7%) |
| 45 to 54 Years | 66 (95.7%) | 40 (81.6%) |
| 55 to 64 Years | 67 (89.3%) | 100 (100.0%) |
| 65 to 74 Years | 60 (100.0%) | 30 (81.1%) |
| 75 Years and over | 58 (92.1%) | 46 (88.5%) |
| Total | 545 (93.2%) | 450 (90.0%) |
Income Below Poverty Among Married-Couple Families in Hamburg
The poverty statistics for married-couple families in Hamburg show that 0.9% or 2 of the total 225 families live below the poverty line. Families with no children have the highest poverty rate of 1.3%, comprising of 2 families. On the other hand, families with 1 or 2 children have the lowest poverty rate of 0.0%, which includes 0 families.
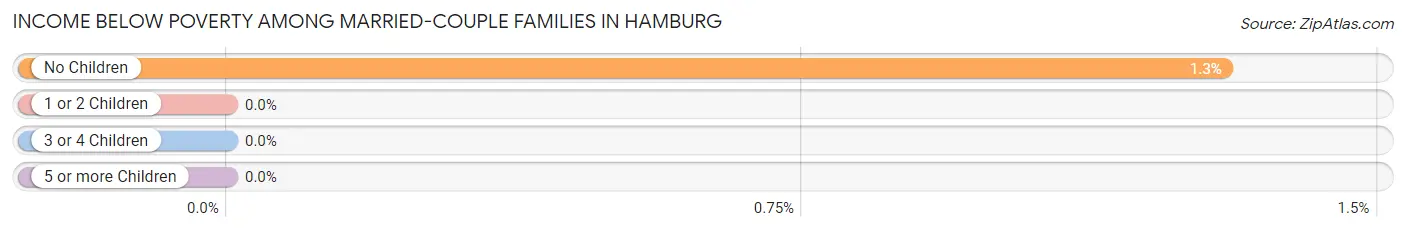
| Children | Above Poverty | Below Poverty |
| No Children | 152 (98.7%) | 2 (1.3%) |
| 1 or 2 Children | 50 (100.0%) | 0 (0.0%) |
| 3 or 4 Children | 21 (100.0%) | 0 (0.0%) |
| 5 or more Children | 0 (0.0%) | 0 (0.0%) |
| Total | 223 (99.1%) | 2 (0.9%) |
Income Below Poverty Among Single-Parent Households in Hamburg
According to the poverty data in Hamburg, 31.6% or 6 single-father households and 4.9% or 2 single-mother households are living below the poverty line. Among single-father households, those with 3 or 4 children have the highest poverty rate, with 6 households (60.0%) experiencing poverty. Likewise, among single-mother households, those with 1 or 2 children have the highest poverty rate, with 2 households (5.6%) falling below the poverty line.
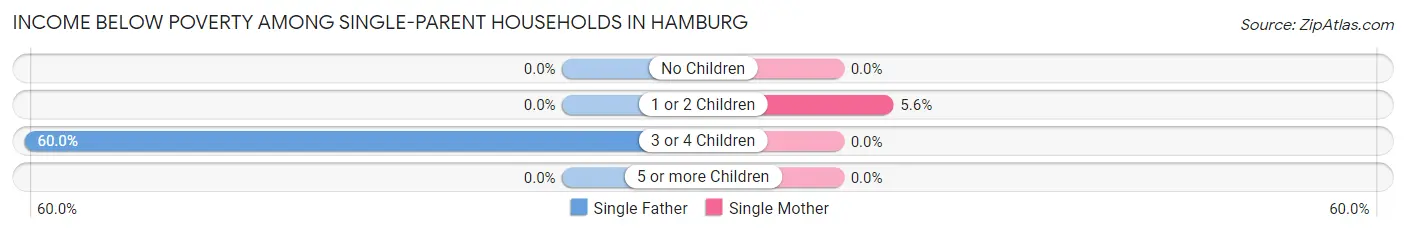
| Children | Single Father | Single Mother |
| No Children | 0 (0.0%) | 0 (0.0%) |
| 1 or 2 Children | 0 (0.0%) | 2 (5.6%) |
| 3 or 4 Children | 6 (60.0%) | 0 (0.0%) |
| 5 or more Children | 0 (0.0%) | 0 (0.0%) |
| Total | 6 (31.6%) | 2 (4.9%) |
Income Below Poverty Among Married-Couple vs Single-Parent Households in Hamburg
The poverty data for Hamburg shows that 2 of the married-couple family households (0.9%) and 8 of the single-parent households (13.3%) are living below the poverty level. Within the married-couple family households, those with no children have the highest poverty rate, with 2 households (1.3%) falling below the poverty line. Among the single-parent households, those with 3 or 4 children have the highest poverty rate, with 6 household (60.0%) living below poverty.
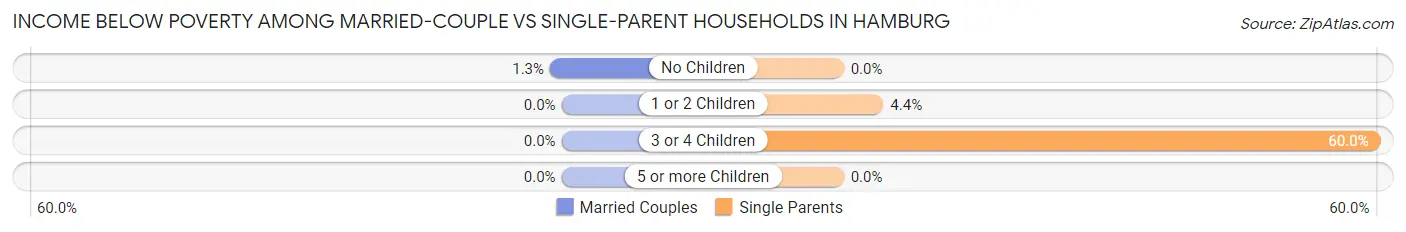
| Children | Married-Couple Families | Single-Parent Households |
| No Children | 2 (1.3%) | 0 (0.0%) |
| 1 or 2 Children | 0 (0.0%) | 2 (4.4%) |
| 3 or 4 Children | 0 (0.0%) | 6 (60.0%) |
| 5 or more Children | 0 (0.0%) | 0 (0.0%) |
| Total | 2 (0.9%) | 8 (13.3%) |
Race in Hamburg
The most populous races in Hamburg are White / Caucasian (1,036 | 95.3%), Two or more Races (38 | 3.5%), and Hispanic or Latino (33 | 3.0%).
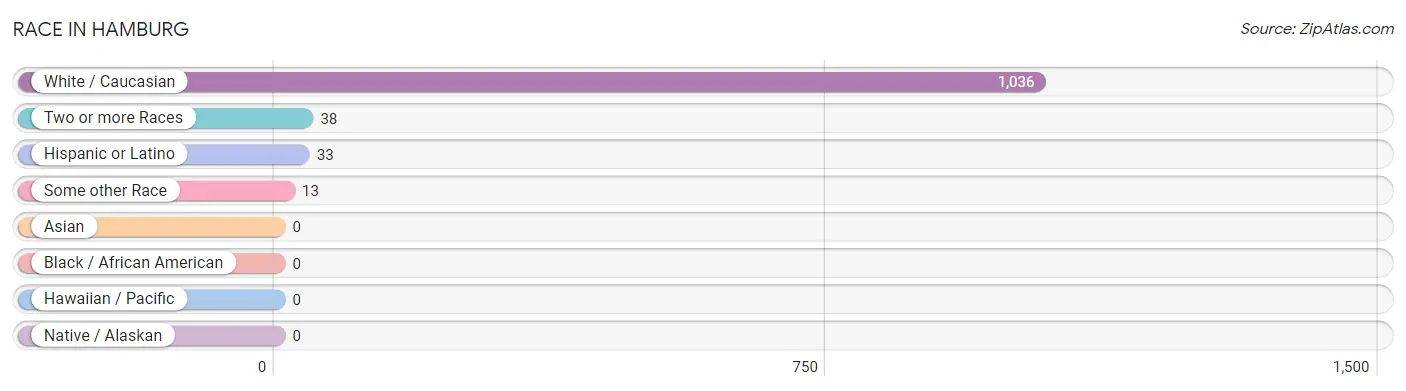
| Race | # Population | % Population |
| Asian | 0 | 0.0% |
| Black / African American | 0 | 0.0% |
| Hawaiian / Pacific | 0 | 0.0% |
| Hispanic or Latino | 33 | 3.0% |
| Native / Alaskan | 0 | 0.0% |
| White / Caucasian | 1,036 | 95.3% |
| Two or more Races | 38 | 3.5% |
| Some other Race | 13 | 1.2% |
| Total | 1,087 | 100.0% |
Ancestry in Hamburg
The most populous ancestries reported in Hamburg are German (420 | 38.6%), Irish (144 | 13.3%), American (108 | 9.9%), English (93 | 8.6%), and Italian (31 | 2.9%), together accounting for 73.2% of all Hamburg residents.
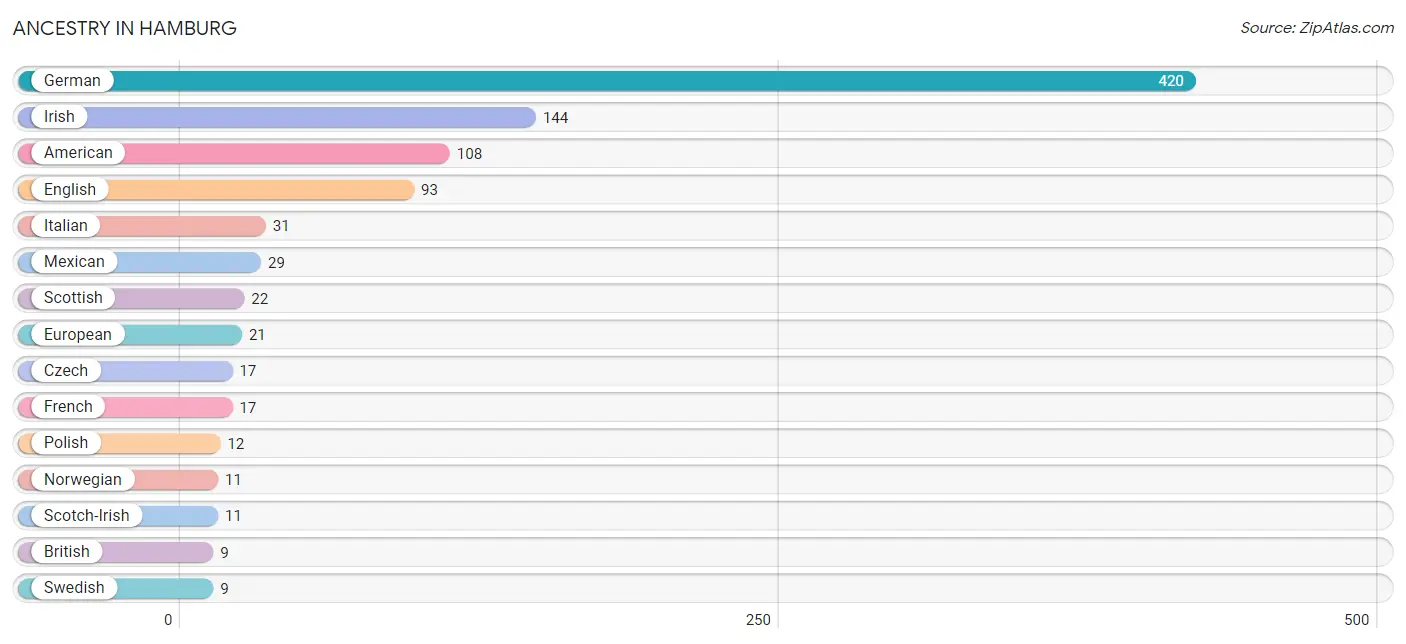
| Ancestry | # Population | % Population |
| American | 108 | 9.9% |
| British | 9 | 0.8% |
| Cherokee | 1 | 0.1% |
| Czech | 17 | 1.6% |
| Czechoslovakian | 2 | 0.2% |
| Dutch | 2 | 0.2% |
| Eastern European | 8 | 0.7% |
| English | 93 | 8.6% |
| European | 21 | 1.9% |
| French | 17 | 1.6% |
| French Canadian | 7 | 0.6% |
| German | 420 | 38.6% |
| Greek | 3 | 0.3% |
| Irish | 144 | 13.3% |
| Italian | 31 | 2.9% |
| Mexican | 29 | 2.7% |
| Norwegian | 11 | 1.0% |
| Polish | 12 | 1.1% |
| Russian | 5 | 0.5% |
| Scotch-Irish | 11 | 1.0% |
| Scottish | 22 | 2.0% |
| Spanish | 4 | 0.4% |
| Swedish | 9 | 0.8% | View All 23 Rows |
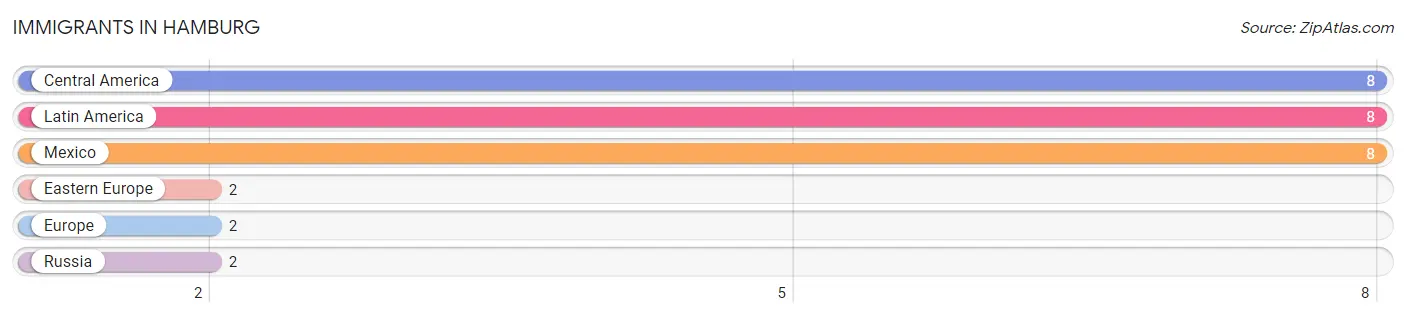
Immigrants in Hamburg
The most numerous immigrant groups reported in Hamburg came from Central America (8 | 0.7%), Latin America (8 | 0.7%), Mexico (8 | 0.7%), Eastern Europe (2 | 0.2%), and Europe (2 | 0.2%), together accounting for 2.6% of all Hamburg residents.
| Immigration Origin | # Population | % Population |
| Central America | 8 | 0.7% |
| Eastern Europe | 2 | 0.2% |
| Europe | 2 | 0.2% |
| Latin America | 8 | 0.7% |
| Mexico | 8 | 0.7% |
| Russia | 2 | 0.2% | View All 6 Rows |
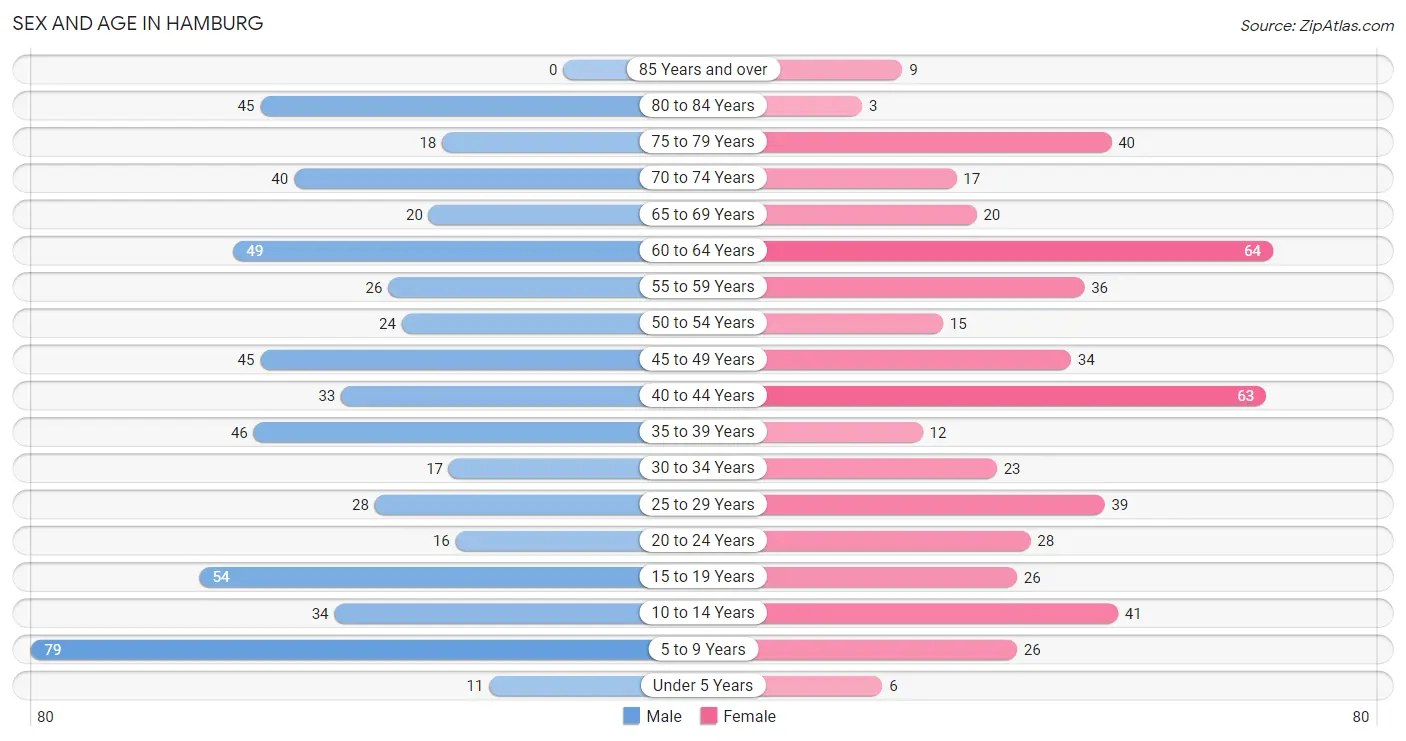
Sex and Age in Hamburg
Sex and Age in Hamburg
The most populous age groups in Hamburg are 5 to 9 Years (79 | 13.5%) for men and 60 to 64 Years (64 | 12.8%) for women.
| Age Bracket | Male | Female |
| Under 5 Years | 11 (1.9%) | 6 (1.2%) |
| 5 to 9 Years | 79 (13.5%) | 26 (5.2%) |
| 10 to 14 Years | 34 (5.8%) | 41 (8.2%) |
| 15 to 19 Years | 54 (9.2%) | 26 (5.2%) |
| 20 to 24 Years | 16 (2.7%) | 28 (5.6%) |
| 25 to 29 Years | 28 (4.8%) | 39 (7.8%) |
| 30 to 34 Years | 17 (2.9%) | 23 (4.6%) |
| 35 to 39 Years | 46 (7.9%) | 12 (2.4%) |
| 40 to 44 Years | 33 (5.6%) | 63 (12.6%) |
| 45 to 49 Years | 45 (7.7%) | 34 (6.8%) |
| 50 to 54 Years | 24 (4.1%) | 15 (3.0%) |
| 55 to 59 Years | 26 (4.4%) | 36 (7.2%) |
| 60 to 64 Years | 49 (8.4%) | 64 (12.8%) |
| 65 to 69 Years | 20 (3.4%) | 20 (4.0%) |
| 70 to 74 Years | 40 (6.8%) | 17 (3.4%) |
| 75 to 79 Years | 18 (3.1%) | 40 (8.0%) |
| 80 to 84 Years | 45 (7.7%) | 3 (0.6%) |
| 85 Years and over | 0 (0.0%) | 9 (1.8%) |
| Total | 585 (100.0%) | 502 (100.0%) |
Families and Households in Hamburg
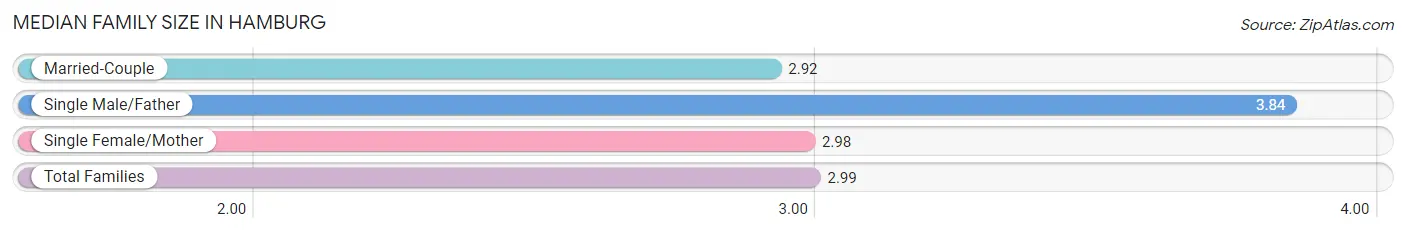
Median Family Size in Hamburg
The median family size in Hamburg is 2.99 persons per family, with single male/father families (19 | 6.7%) accounting for the largest median family size of 3.84 persons per family. On the other hand, married-couple families (225 | 78.9%) represent the smallest median family size with 2.92 persons per family.
| Family Type | # Families | Family Size |
| Married-Couple | 225 (78.9%) | 2.92 |
| Single Male/Father | 19 (6.7%) | 3.84 |
| Single Female/Mother | 41 (14.4%) | 2.98 |
| Total Families | 285 (100.0%) | 2.99 |
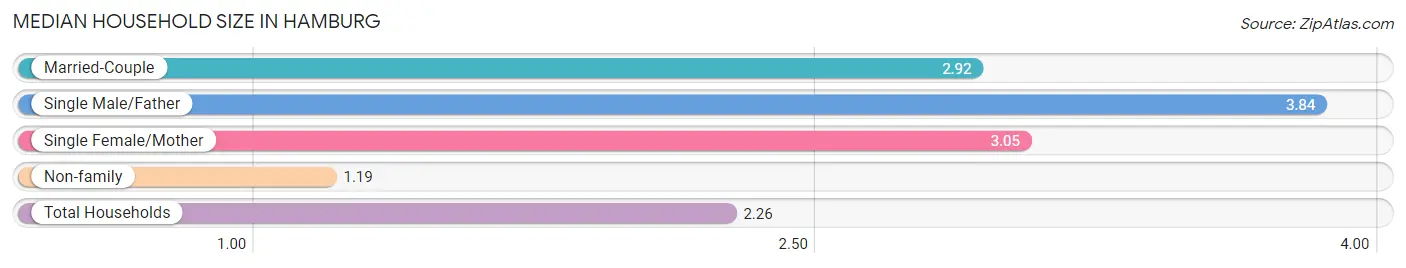
Median Household Size in Hamburg
The median household size in Hamburg is 2.26 persons per household, with single male/father households (19 | 4.0%) accounting for the largest median household size of 3.84 persons per household. non-family households (195 | 40.6%) represent the smallest median household size with 1.19 persons per household.
| Household Type | # Households | Household Size |
| Married-Couple | 225 (46.9%) | 2.92 |
| Single Male/Father | 19 (4.0%) | 3.84 |
| Single Female/Mother | 41 (8.5%) | 3.05 |
| Non-family | 195 (40.6%) | 1.19 |
| Total Households | 480 (100.0%) | 2.26 |
Household Size by Marriage Status in Hamburg
Out of a total of 480 households in Hamburg, 285 (59.4%) are family households, while 195 (40.6%) are nonfamily households. The most numerous type of family households are 2-person households, comprising 164, and the most common type of nonfamily households are 1-person households, comprising 159.
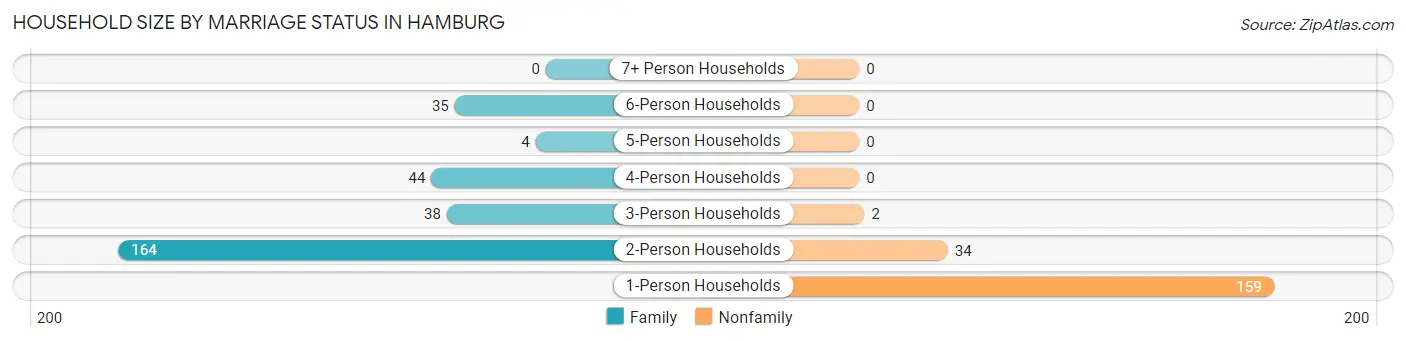
| Household Size | Family Households | Nonfamily Households |
| 1-Person Households | - | 159 (33.1%) |
| 2-Person Households | 164 (34.2%) | 34 (7.1%) |
| 3-Person Households | 38 (7.9%) | 2 (0.4%) |
| 4-Person Households | 44 (9.2%) | 0 (0.0%) |
| 5-Person Households | 4 (0.8%) | 0 (0.0%) |
| 6-Person Households | 35 (7.3%) | 0 (0.0%) |
| 7+ Person Households | 0 (0.0%) | 0 (0.0%) |
| Total | 285 (59.4%) | 195 (40.6%) |
Female Fertility in Hamburg
Fertility by Age in Hamburg
| Age Bracket | Women with Births | Births / 1,000 Women |
| 15 to 19 years | 0 (0.0%) | 0.0 |
| 20 to 34 years | 0 (0.0%) | 0.0 |
| 35 to 50 years | 0 (0.0%) | 0.0 |
| Total | 0 (0.0%) | 0.0 |
Fertility by Age by Marriage Status in Hamburg
| Age Bracket | Married | Unmarried |
| 15 to 19 years | 0 (0.0%) | 0 (0.0%) |
| 20 to 34 years | 0 (0.0%) | 0 (0.0%) |
| 35 to 50 years | 0 (0.0%) | 0 (0.0%) |
| Total | 0 (0.0%) | 0 (0.0%) |
Fertility by Education in Hamburg
| Educational Attainment | Women with Births | Births / 1,000 Women |
| Less than High School | 0 (0.0%) | 0.0 |
| High School Diploma | 0 (0.0%) | 0.0 |
| College or Associate's Degree | 0 (0.0%) | 0.0 |
| Bachelor's Degree | 0 (0.0%) | 0.0 |
| Graduate Degree | 0 (0.0%) | 0.0 |
| Total | 0 (0.0%) | 0.0 |
Fertility by Education by Marriage Status in Hamburg
| Educational Attainment | Married | Unmarried |
| Less than High School | 0 (0.0%) | 0 (0.0%) |
| High School Diploma | 0 (0.0%) | 0 (0.0%) |
| College or Associate's Degree | 0 (0.0%) | 0 (0.0%) |
| Bachelor's Degree | 0 (0.0%) | 0 (0.0%) |
| Graduate Degree | 0 (0.0%) | 0 (0.0%) |
| Total | 0 (0.0%) | 0 (0.0%) |
Employment Characteristics in Hamburg
Employment by Class of Employer in Hamburg
Among the 504 employed individuals in Hamburg, private company employees (315 | 62.5%), local government employees (73 | 14.5%), and not-for-profit organizations (56 | 11.1%) make up the most common classes of employment.
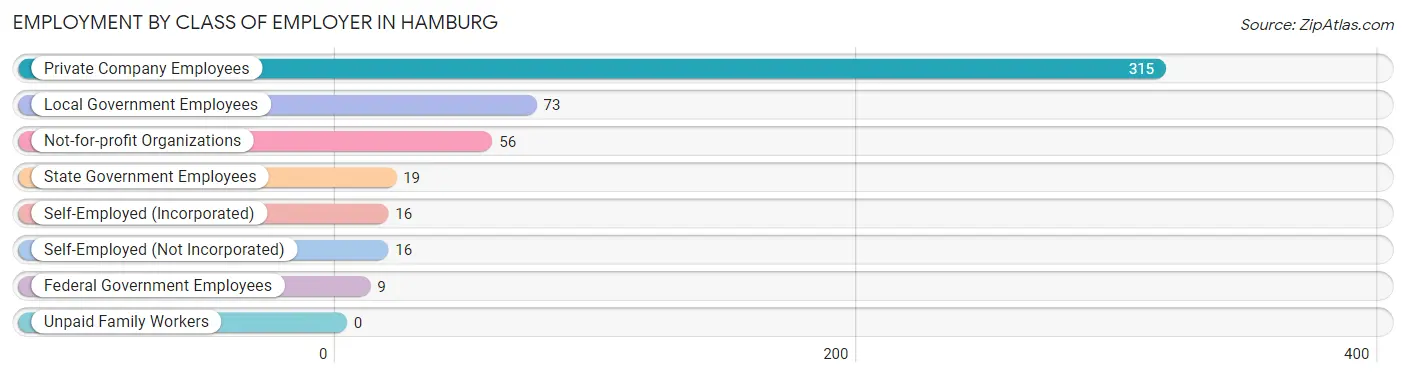
| Employer Class | # Employees | % Employees |
| Private Company Employees | 315 | 62.5% |
| Self-Employed (Incorporated) | 16 | 3.2% |
| Self-Employed (Not Incorporated) | 16 | 3.2% |
| Not-for-profit Organizations | 56 | 11.1% |
| Local Government Employees | 73 | 14.5% |
| State Government Employees | 19 | 3.8% |
| Federal Government Employees | 9 | 1.8% |
| Unpaid Family Workers | 0 | 0.0% |
| Total | 504 | 100.0% |
Employment Status by Age in Hamburg
According to the labor force statistics for Hamburg, out of the total population over 16 years of age (877), 59.4% or 521 individuals are in the labor force, with 2.7% or 14 of them unemployed. The age group with the highest labor force participation rate is 30 to 34 years, with 95.0% or 38 individuals in the labor force. Within the labor force, the 45 to 54 years age range has the highest percentage of unemployed individuals, with 10.8% or 9 of them being unemployed.
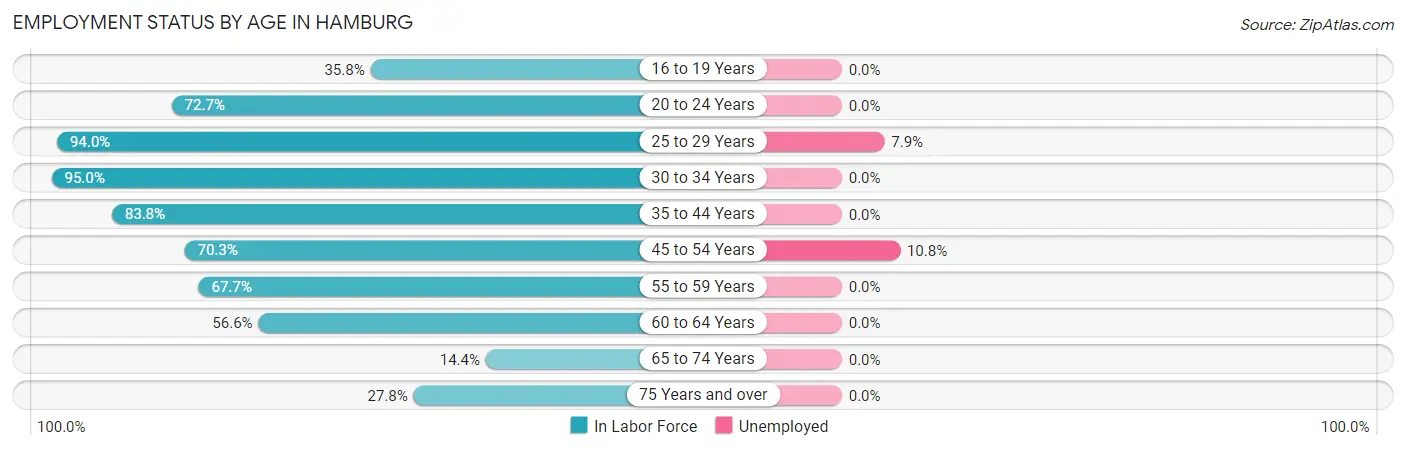
| Age Bracket | In Labor Force | Unemployed |
| 16 to 19 Years | 24 (35.8%) | 0 (0.0%) |
| 20 to 24 Years | 32 (72.7%) | 0 (0.0%) |
| 25 to 29 Years | 63 (94.0%) | 5 (7.9%) |
| 30 to 34 Years | 38 (95.0%) | 0 (0.0%) |
| 35 to 44 Years | 129 (83.8%) | 0 (0.0%) |
| 45 to 54 Years | 83 (70.3%) | 9 (10.8%) |
| 55 to 59 Years | 42 (67.7%) | 0 (0.0%) |
| 60 to 64 Years | 64 (56.6%) | 0 (0.0%) |
| 65 to 74 Years | 14 (14.4%) | 0 (0.0%) |
| 75 Years and over | 32 (27.8%) | 0 (0.0%) |
| Total | 521 (59.4%) | 14 (2.7%) |
Employment Status by Educational Attainment in Hamburg
According to labor force statistics for Hamburg, 75.6% of individuals (419) out of the total population between 25 and 64 years of age (554) are in the labor force, with 3.3% or 14 of them being unemployed. The group with the highest labor force participation rate are those with the educational attainment of bachelor's degree or higher, with 91.2% or 62 individuals in the labor force. Within the labor force, individuals with less than high school education have the highest percentage of unemployment, with 81.8% or 9 of them being unemployed.
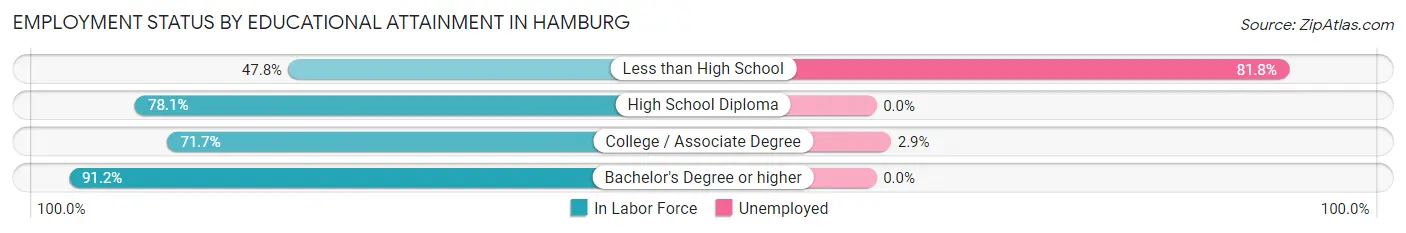
| Educational Attainment | In Labor Force | Unemployed |
| Less than High School | 11 (47.8%) | 19 (81.8%) |
| High School Diploma | 171 (78.1%) | 0 (0.0%) |
| College / Associate Degree | 175 (71.7%) | 7 (2.9%) |
| Bachelor's Degree or higher | 62 (91.2%) | 0 (0.0%) |
| Total | 419 (75.6%) | 18 (3.3%) |
Employment Occupations by Sex in Hamburg
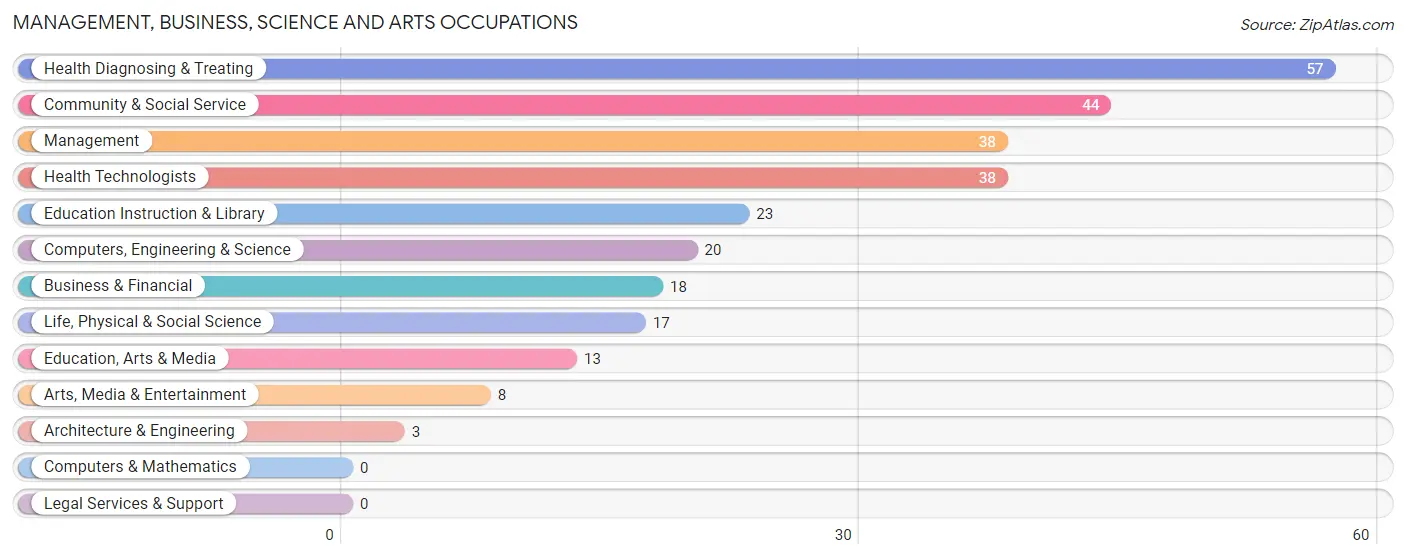
Management, Business, Science and Arts Occupations
The most common Management, Business, Science and Arts occupations in Hamburg are Health Diagnosing & Treating (57 | 11.2%), Community & Social Service (44 | 8.7%), Management (38 | 7.5%), Health Technologists (38 | 7.5%), and Education Instruction & Library (23 | 4.5%).
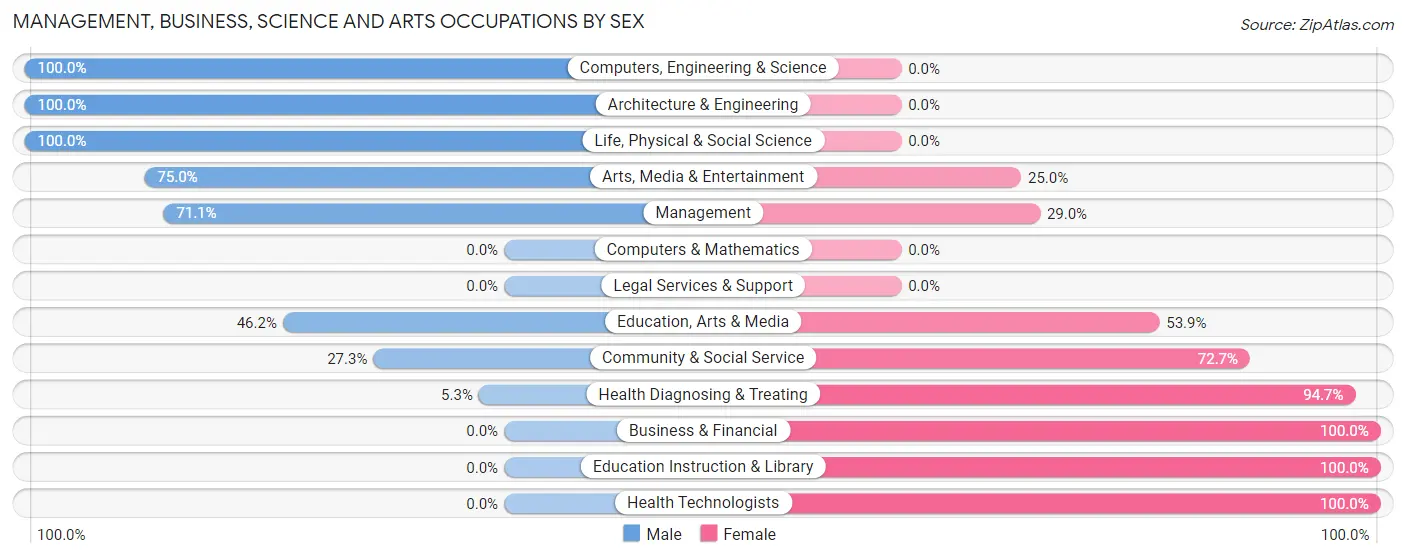
Management, Business, Science and Arts Occupations by Sex
Within the Management, Business, Science and Arts occupations in Hamburg, the most male-oriented occupations are Computers, Engineering & Science (100.0%), Architecture & Engineering (100.0%), and Life, Physical & Social Science (100.0%), while the most female-oriented occupations are Business & Financial (100.0%), Education Instruction & Library (100.0%), and Health Technologists (100.0%).
| Occupation | Male | Female |
| Management | 27 (71.1%) | 11 (28.9%) |
| Business & Financial | 0 (0.0%) | 18 (100.0%) |
| Computers, Engineering & Science | 20 (100.0%) | 0 (0.0%) |
| Computers & Mathematics | 0 (0.0%) | 0 (0.0%) |
| Architecture & Engineering | 3 (100.0%) | 0 (0.0%) |
| Life, Physical & Social Science | 17 (100.0%) | 0 (0.0%) |
| Community & Social Service | 12 (27.3%) | 32 (72.7%) |
| Education, Arts & Media | 6 (46.2%) | 7 (53.8%) |
| Legal Services & Support | 0 (0.0%) | 0 (0.0%) |
| Education Instruction & Library | 0 (0.0%) | 23 (100.0%) |
| Arts, Media & Entertainment | 6 (75.0%) | 2 (25.0%) |
| Health Diagnosing & Treating | 3 (5.3%) | 54 (94.7%) |
| Health Technologists | 0 (0.0%) | 38 (100.0%) |
| Total (Category) | 62 (35.0%) | 115 (65.0%) |
| Total (Overall) | 276 (54.4%) | 231 (45.6%) |
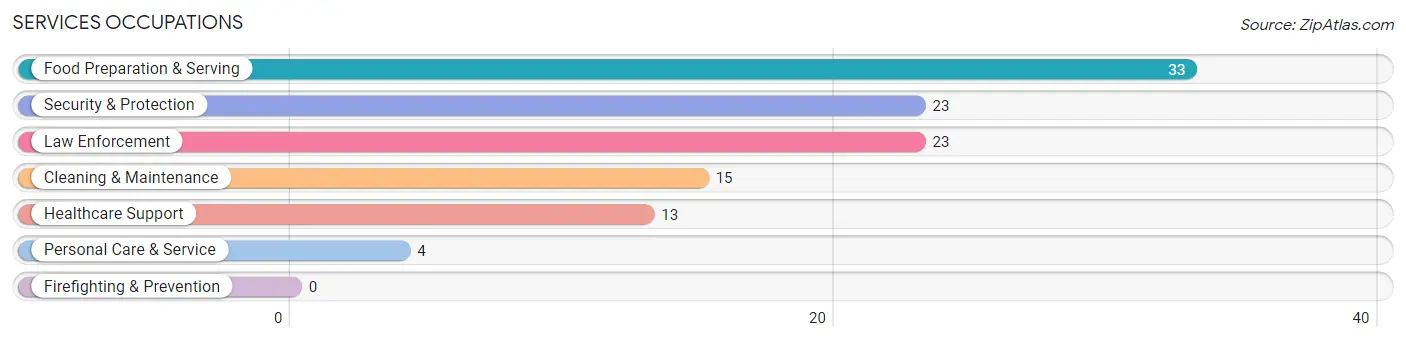
Services Occupations
The most common Services occupations in Hamburg are Food Preparation & Serving (33 | 6.5%), Security & Protection (23 | 4.5%), Law Enforcement (23 | 4.5%), Cleaning & Maintenance (15 | 3.0%), and Healthcare Support (13 | 2.6%).
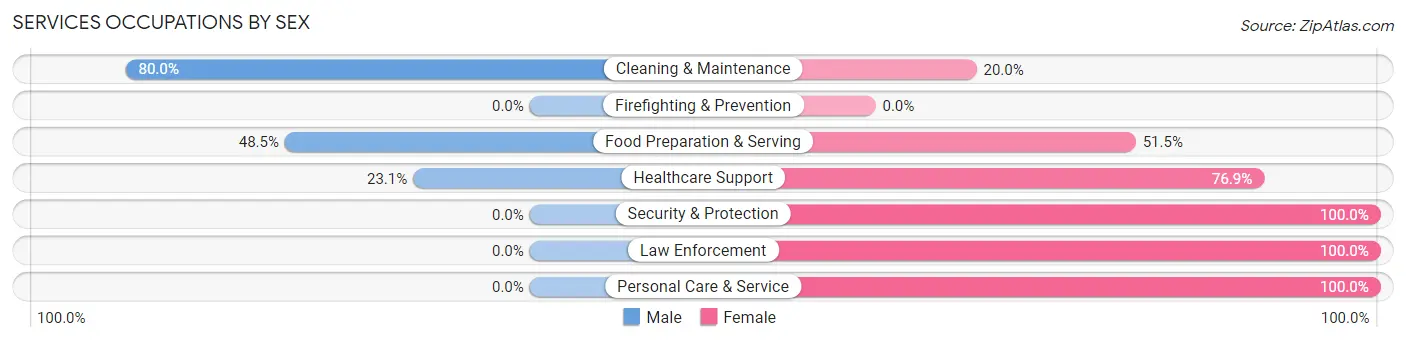
Services Occupations by Sex
Within the Services occupations in Hamburg, the most male-oriented occupations are Cleaning & Maintenance (80.0%), Food Preparation & Serving (48.5%), and Healthcare Support (23.1%), while the most female-oriented occupations are Security & Protection (100.0%), Law Enforcement (100.0%), and Personal Care & Service (100.0%).
| Occupation | Male | Female |
| Healthcare Support | 3 (23.1%) | 10 (76.9%) |
| Security & Protection | 0 (0.0%) | 23 (100.0%) |
| Firefighting & Prevention | 0 (0.0%) | 0 (0.0%) |
| Law Enforcement | 0 (0.0%) | 23 (100.0%) |
| Food Preparation & Serving | 16 (48.5%) | 17 (51.5%) |
| Cleaning & Maintenance | 12 (80.0%) | 3 (20.0%) |
| Personal Care & Service | 0 (0.0%) | 4 (100.0%) |
| Total (Category) | 31 (35.2%) | 57 (64.8%) |
| Total (Overall) | 276 (54.4%) | 231 (45.6%) |
Sales and Office Occupations
The most common Sales and Office occupations in Hamburg are Office & Administration (38 | 7.5%), and Sales & Related (15 | 3.0%).
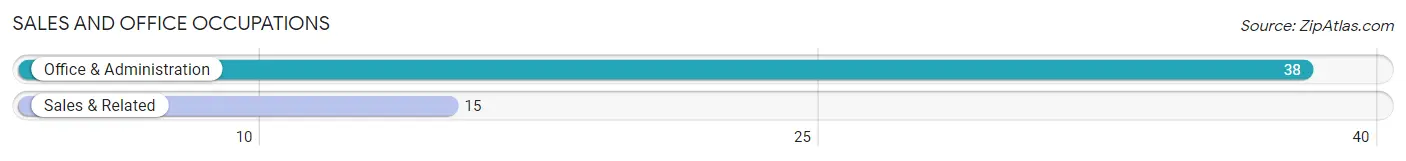
Sales and Office Occupations by Sex
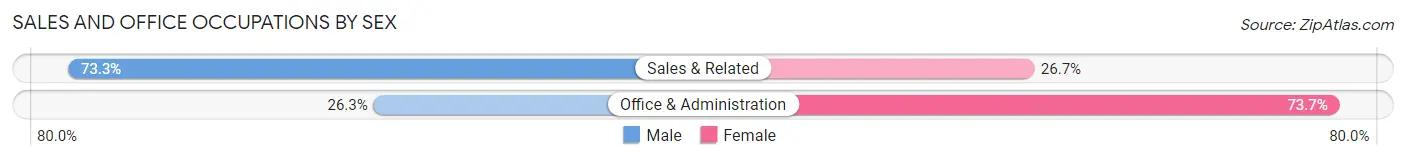
| Occupation | Male | Female |
| Sales & Related | 11 (73.3%) | 4 (26.7%) |
| Office & Administration | 10 (26.3%) | 28 (73.7%) |
| Total (Category) | 21 (39.6%) | 32 (60.4%) |
| Total (Overall) | 276 (54.4%) | 231 (45.6%) |
Natural Resources, Construction and Maintenance Occupations
The most common Natural Resources, Construction and Maintenance occupations in Hamburg are Construction & Extraction (32 | 6.3%), Installation, Maintenance & Repair (6 | 1.2%), and Farming, Fishing & Forestry (5 | 1.0%).
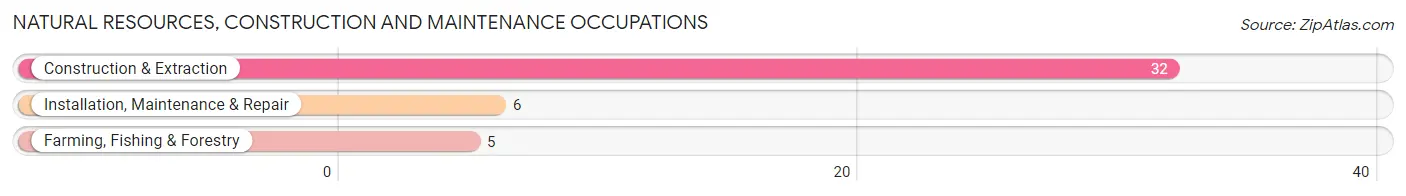
Natural Resources, Construction and Maintenance Occupations by Sex
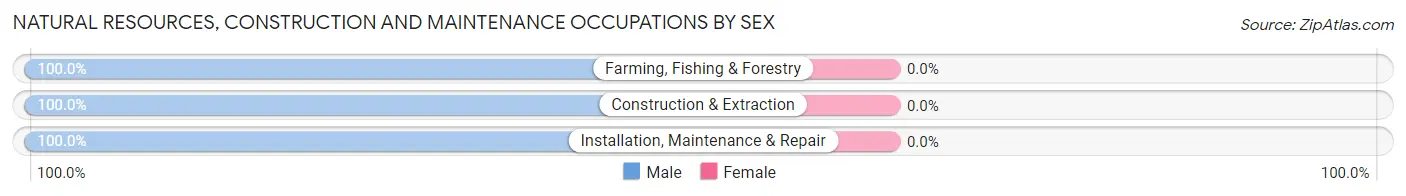
| Occupation | Male | Female |
| Farming, Fishing & Forestry | 5 (100.0%) | 0 (0.0%) |
| Construction & Extraction | 32 (100.0%) | 0 (0.0%) |
| Installation, Maintenance & Repair | 6 (100.0%) | 0 (0.0%) |
| Total (Category) | 43 (100.0%) | 0 (0.0%) |
| Total (Overall) | 276 (54.4%) | 231 (45.6%) |
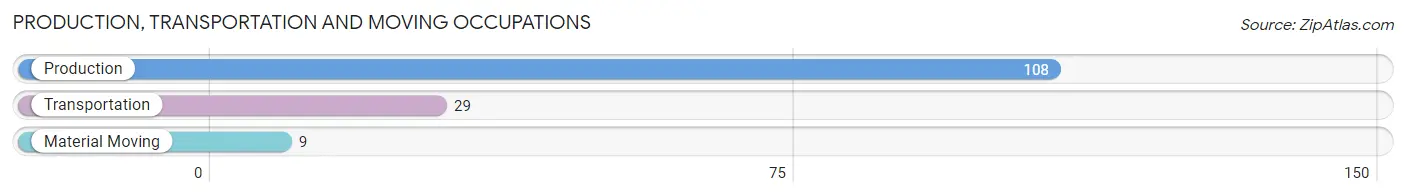
Production, Transportation and Moving Occupations
The most common Production, Transportation and Moving occupations in Hamburg are Production (108 | 21.3%), Transportation (29 | 5.7%), and Material Moving (9 | 1.8%).
Production, Transportation and Moving Occupations by Sex
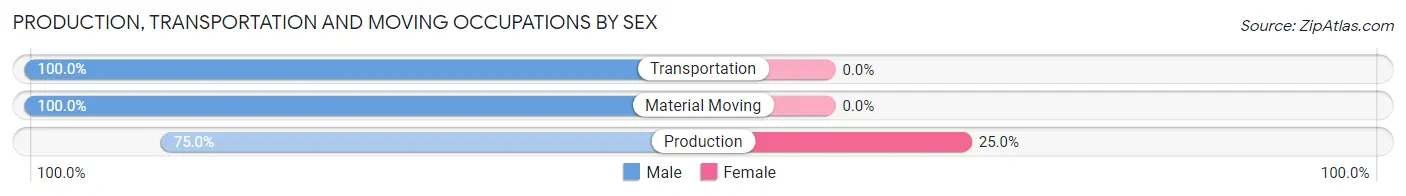
| Occupation | Male | Female |
| Production | 81 (75.0%) | 27 (25.0%) |
| Transportation | 29 (100.0%) | 0 (0.0%) |
| Material Moving | 9 (100.0%) | 0 (0.0%) |
| Total (Category) | 119 (81.5%) | 27 (18.5%) |
| Total (Overall) | 276 (54.4%) | 231 (45.6%) |
Employment Industries by Sex in Hamburg
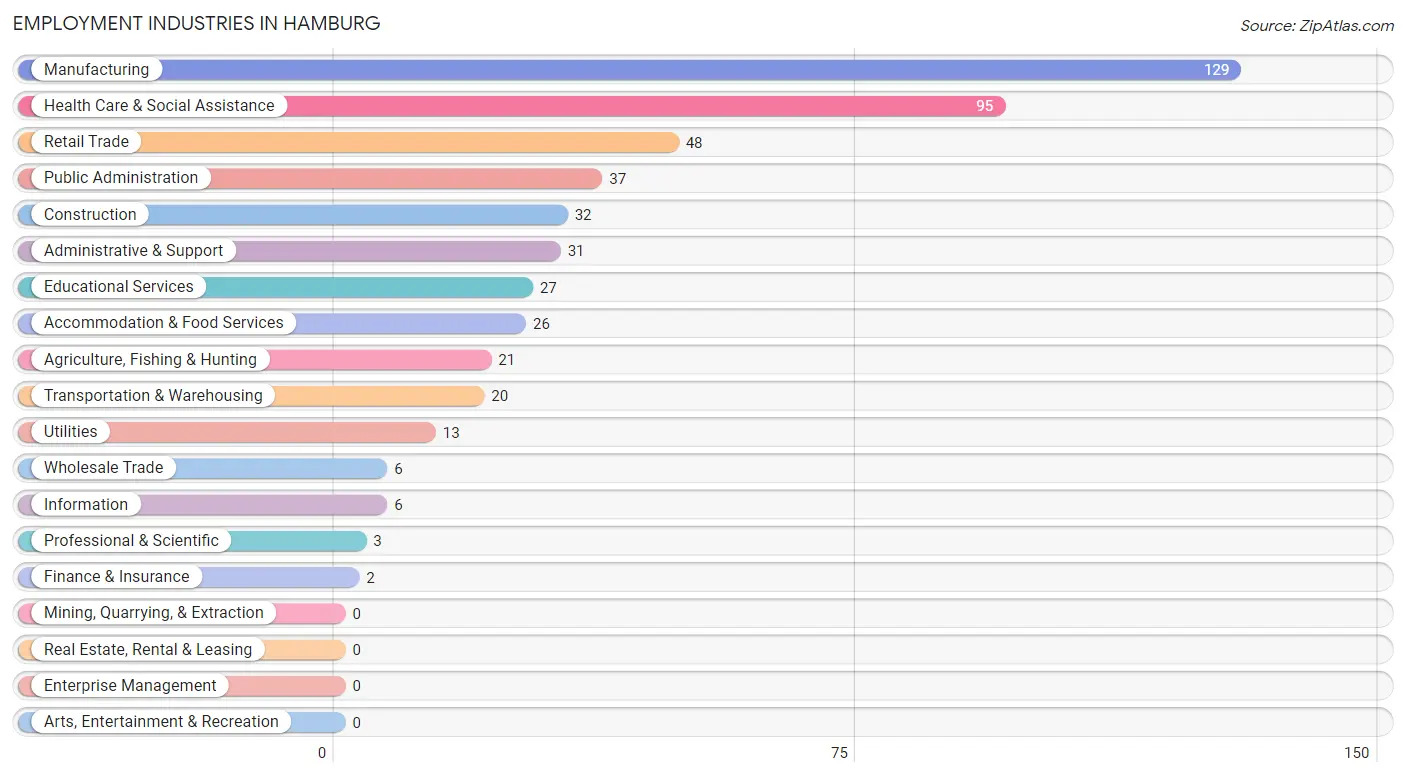
Employment Industries in Hamburg
The major employment industries in Hamburg include Manufacturing (129 | 25.4%), Health Care & Social Assistance (95 | 18.7%), Retail Trade (48 | 9.5%), Public Administration (37 | 7.3%), and Construction (32 | 6.3%).
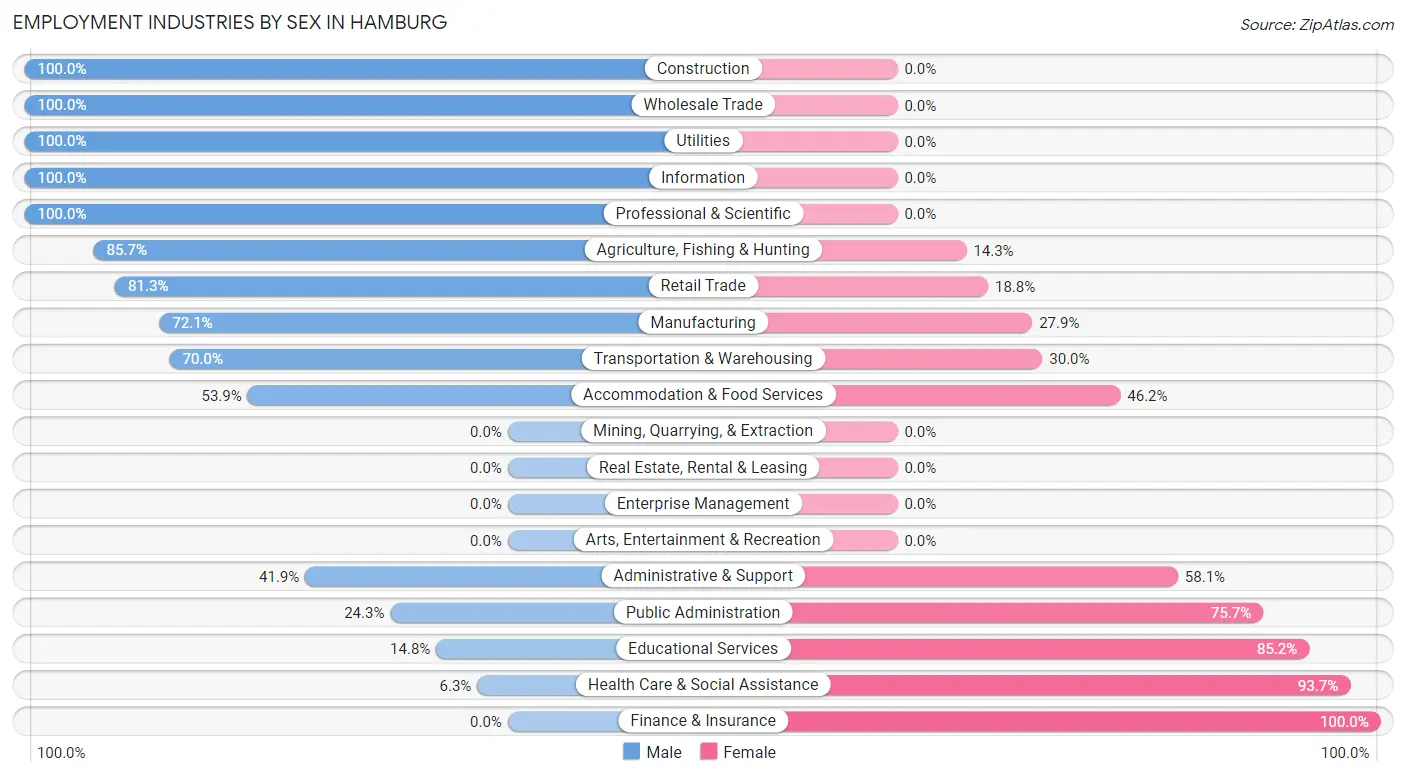
Employment Industries by Sex in Hamburg
The Hamburg industries that see more men than women are Construction (100.0%), Wholesale Trade (100.0%), and Utilities (100.0%), whereas the industries that tend to have a higher number of women are Finance & Insurance (100.0%), Health Care & Social Assistance (93.7%), and Educational Services (85.2%).
| Industry | Male | Female |
| Agriculture, Fishing & Hunting | 18 (85.7%) | 3 (14.3%) |
| Mining, Quarrying, & Extraction | 0 (0.0%) | 0 (0.0%) |
| Construction | 32 (100.0%) | 0 (0.0%) |
| Manufacturing | 93 (72.1%) | 36 (27.9%) |
| Wholesale Trade | 6 (100.0%) | 0 (0.0%) |
| Retail Trade | 39 (81.2%) | 9 (18.8%) |
| Transportation & Warehousing | 14 (70.0%) | 6 (30.0%) |
| Utilities | 13 (100.0%) | 0 (0.0%) |
| Information | 6 (100.0%) | 0 (0.0%) |
| Finance & Insurance | 0 (0.0%) | 2 (100.0%) |
| Real Estate, Rental & Leasing | 0 (0.0%) | 0 (0.0%) |
| Professional & Scientific | 3 (100.0%) | 0 (0.0%) |
| Enterprise Management | 0 (0.0%) | 0 (0.0%) |
| Administrative & Support | 13 (41.9%) | 18 (58.1%) |
| Educational Services | 4 (14.8%) | 23 (85.2%) |
| Health Care & Social Assistance | 6 (6.3%) | 89 (93.7%) |
| Arts, Entertainment & Recreation | 0 (0.0%) | 0 (0.0%) |
| Accommodation & Food Services | 14 (53.8%) | 12 (46.2%) |
| Public Administration | 9 (24.3%) | 28 (75.7%) |
| Total | 276 (54.4%) | 231 (45.6%) |
Education in Hamburg
School Enrollment in Hamburg
The most common levels of schooling among the 186 students in Hamburg are high school (76 | 40.9%), middle school (49 | 26.3%), and elementary school (25 | 13.4%).
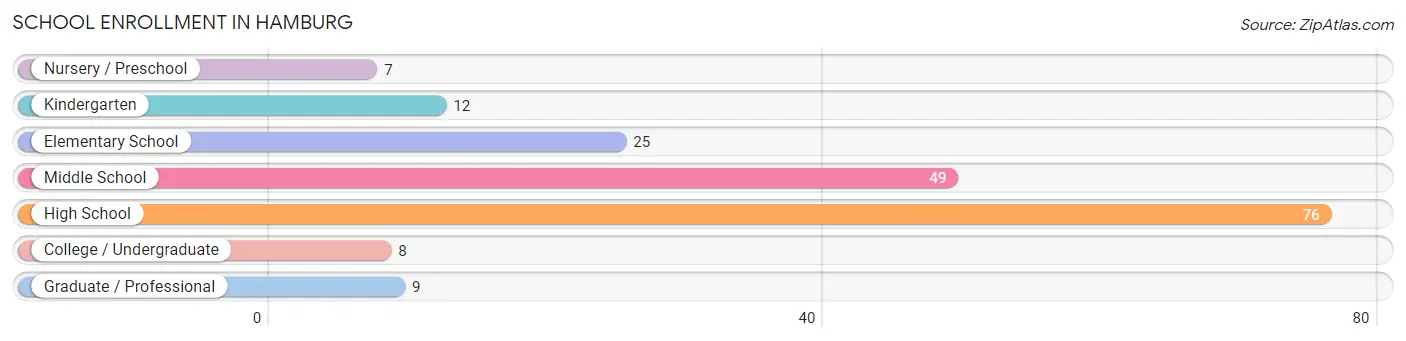
| School Level | # Students | % Students |
| Nursery / Preschool | 7 | 3.8% |
| Kindergarten | 12 | 6.5% |
| Elementary School | 25 | 13.4% |
| Middle School | 49 | 26.3% |
| High School | 76 | 40.9% |
| College / Undergraduate | 8 | 4.3% |
| Graduate / Professional | 9 | 4.8% |
| Total | 186 | 100.0% |
School Enrollment by Age by Funding Source in Hamburg
Out of a total of 186 students who are enrolled in schools in Hamburg, 13 (7.0%) attend a private institution, while the remaining 173 (93.0%) are enrolled in public schools. The age group of 35 years and over has the highest likelihood of being enrolled in private schools, with 5 (71.4% in the age bracket) enrolled. Conversely, the age group of 3 to 4 year olds has the lowest likelihood of being enrolled in a private school, with 7 (100.0% in the age bracket) attending a public institution.
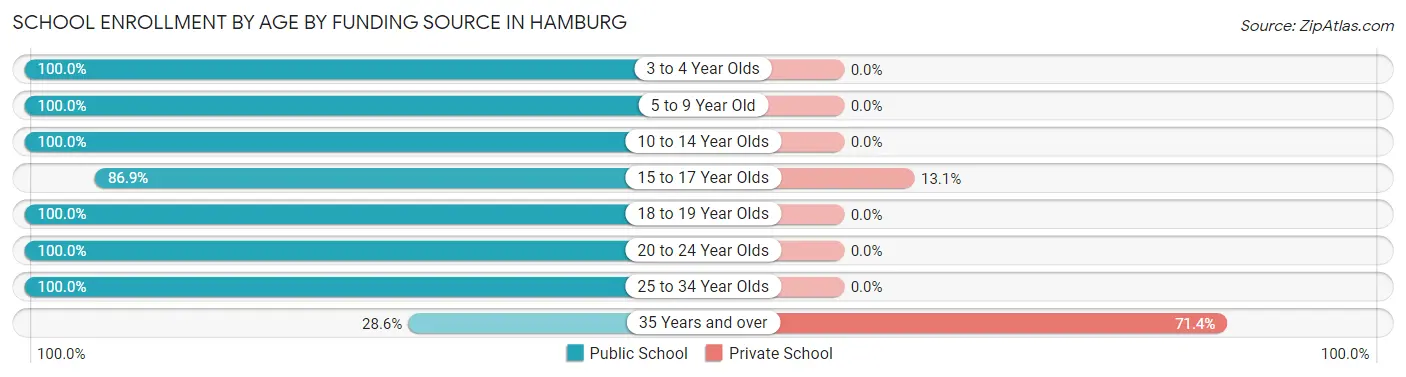
| Age Bracket | Public School | Private School |
| 3 to 4 Year Olds | 7 (100.0%) | 0 (0.0%) |
| 5 to 9 Year Old | 35 (100.0%) | 0 (0.0%) |
| 10 to 14 Year Olds | 52 (100.0%) | 0 (0.0%) |
| 15 to 17 Year Olds | 53 (86.9%) | 8 (13.1%) |
| 18 to 19 Year Olds | 14 (100.0%) | 0 (0.0%) |
| 20 to 24 Year Olds | 3 (100.0%) | 0 (0.0%) |
| 25 to 34 Year Olds | 7 (100.0%) | 0 (0.0%) |
| 35 Years and over | 2 (28.6%) | 5 (71.4%) |
| Total | 173 (93.0%) | 13 (7.0%) |
Educational Attainment by Field of Study in Hamburg
Education (26 | 29.5%), business (16 | 18.2%), science & technology (15 | 17.1%), bio, nature & agricultural (7 | 8.0%), and arts & humanities (6 | 6.8%) are the most common fields of study among 88 individuals in Hamburg who have obtained a bachelor's degree or higher.
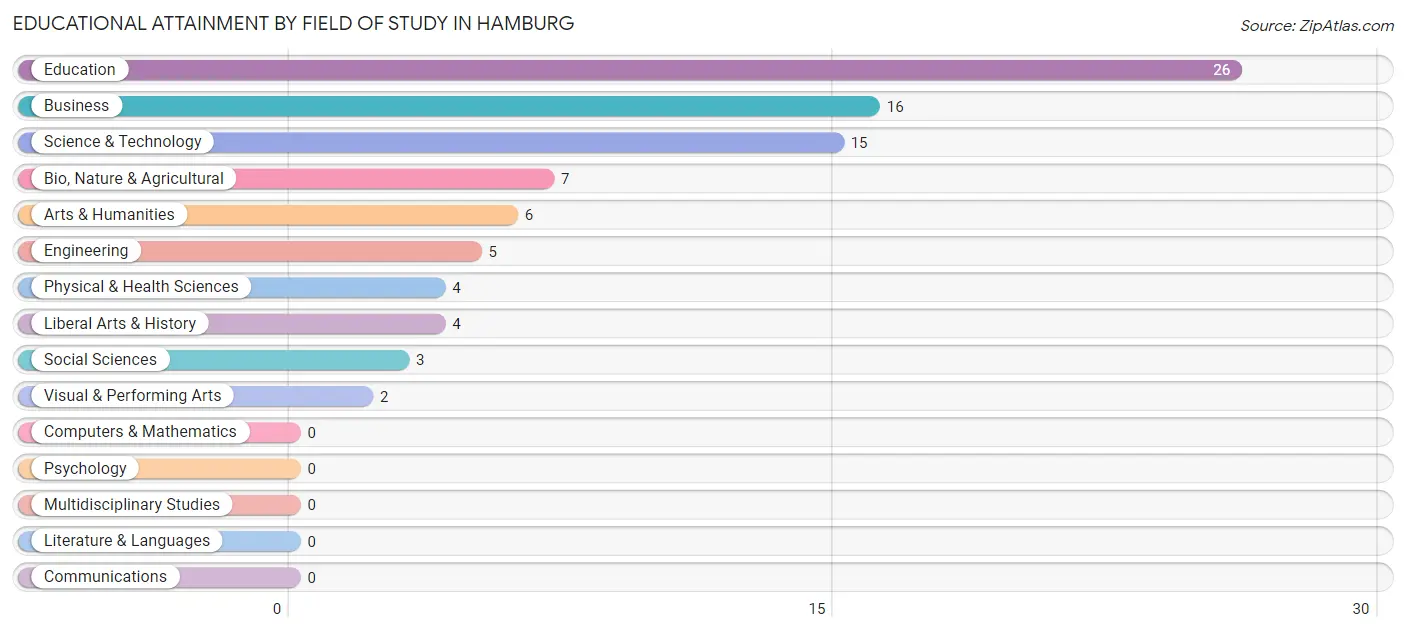
| Field of Study | # Graduates | % Graduates |
| Computers & Mathematics | 0 | 0.0% |
| Bio, Nature & Agricultural | 7 | 8.0% |
| Physical & Health Sciences | 4 | 4.5% |
| Psychology | 0 | 0.0% |
| Social Sciences | 3 | 3.4% |
| Engineering | 5 | 5.7% |
| Multidisciplinary Studies | 0 | 0.0% |
| Science & Technology | 15 | 17.1% |
| Business | 16 | 18.2% |
| Education | 26 | 29.5% |
| Literature & Languages | 0 | 0.0% |
| Liberal Arts & History | 4 | 4.5% |
| Visual & Performing Arts | 2 | 2.3% |
| Communications | 0 | 0.0% |
| Arts & Humanities | 6 | 6.8% |
| Total | 88 | 100.0% |
Transportation & Commute in Hamburg
Vehicle Availability by Sex in Hamburg
The most prevalent vehicle ownership categories in Hamburg are males with 2 vehicles (116, accounting for 42.0%) and females with 2 vehicles (109, making up 50.9%).
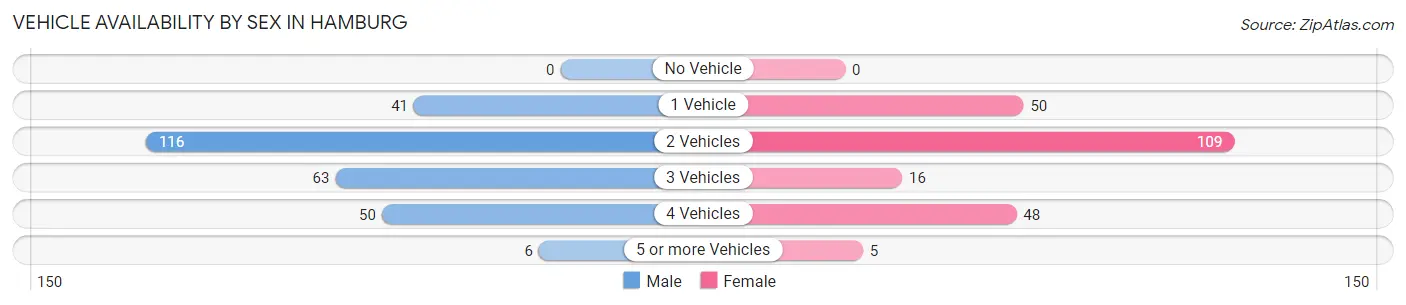
| Vehicles Available | Male | Female |
| No Vehicle | 0 (0.0%) | 0 (0.0%) |
| 1 Vehicle | 41 (14.9%) | 50 (21.9%) |
| 2 Vehicles | 116 (42.0%) | 109 (47.8%) |
| 3 Vehicles | 63 (22.8%) | 16 (7.0%) |
| 4 Vehicles | 50 (18.1%) | 48 (21.0%) |
| 5 or more Vehicles | 6 (2.2%) | 5 (2.2%) |
| Total | 276 (100.0%) | 228 (100.0%) |
Commute Time in Hamburg
The most frequently occuring commute durations in Hamburg are less than 5 minutes (108 commuters, 21.6%), 5 to 9 minutes (89 commuters, 17.8%), and 20 to 24 minutes (73 commuters, 14.6%).
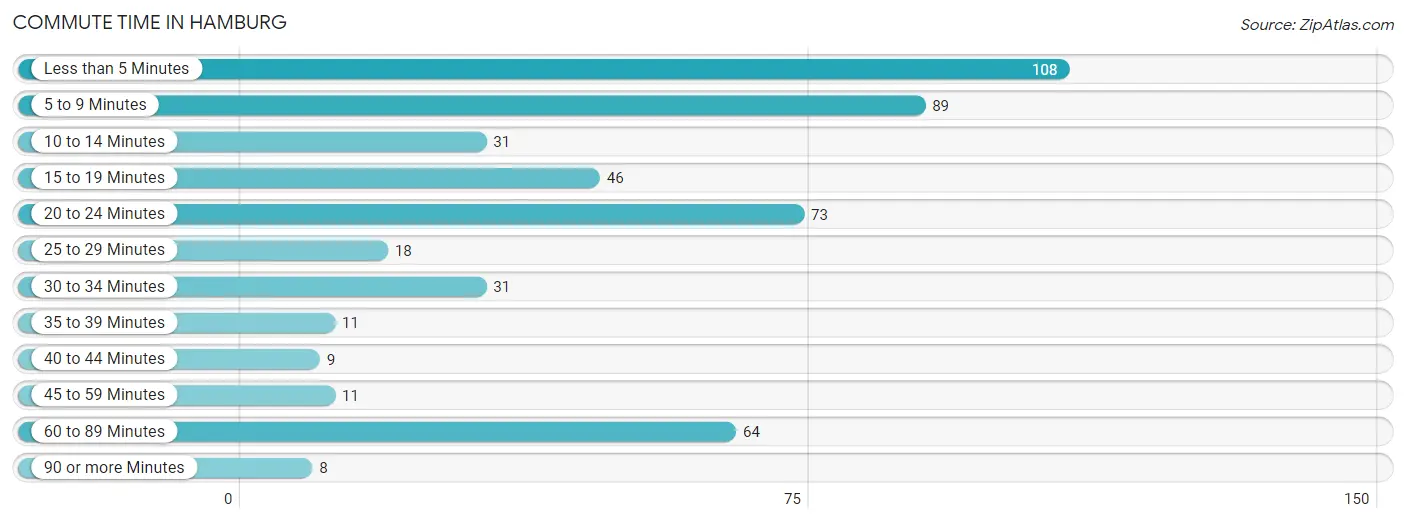
| Commute Time | # Commuters | % Commuters |
| Less than 5 Minutes | 108 | 21.6% |
| 5 to 9 Minutes | 89 | 17.8% |
| 10 to 14 Minutes | 31 | 6.2% |
| 15 to 19 Minutes | 46 | 9.2% |
| 20 to 24 Minutes | 73 | 14.6% |
| 25 to 29 Minutes | 18 | 3.6% |
| 30 to 34 Minutes | 31 | 6.2% |
| 35 to 39 Minutes | 11 | 2.2% |
| 40 to 44 Minutes | 9 | 1.8% |
| 45 to 59 Minutes | 11 | 2.2% |
| 60 to 89 Minutes | 64 | 12.8% |
| 90 or more Minutes | 8 | 1.6% |
Commute Time by Sex in Hamburg
The most common commute times in Hamburg are less than 5 minutes (73 commuters, 26.5%) for males and 60 to 89 minutes (47 commuters, 21.1%) for females.
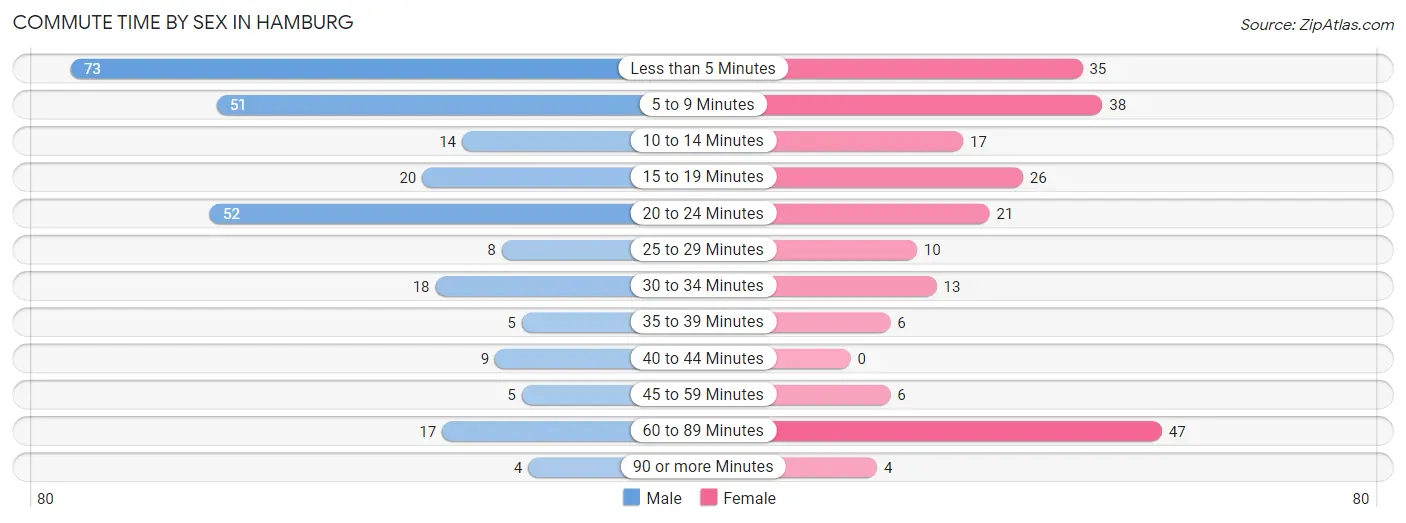
| Commute Time | Male | Female |
| Less than 5 Minutes | 73 (26.5%) | 35 (15.7%) |
| 5 to 9 Minutes | 51 (18.5%) | 38 (17.0%) |
| 10 to 14 Minutes | 14 (5.1%) | 17 (7.6%) |
| 15 to 19 Minutes | 20 (7.2%) | 26 (11.7%) |
| 20 to 24 Minutes | 52 (18.8%) | 21 (9.4%) |
| 25 to 29 Minutes | 8 (2.9%) | 10 (4.5%) |
| 30 to 34 Minutes | 18 (6.5%) | 13 (5.8%) |
| 35 to 39 Minutes | 5 (1.8%) | 6 (2.7%) |
| 40 to 44 Minutes | 9 (3.3%) | 0 (0.0%) |
| 45 to 59 Minutes | 5 (1.8%) | 6 (2.7%) |
| 60 to 89 Minutes | 17 (6.2%) | 47 (21.1%) |
| 90 or more Minutes | 4 (1.5%) | 4 (1.8%) |
Time of Departure to Work by Sex in Hamburg
The most frequent times of departure to work in Hamburg are 12:00 AM to 4:59 AM (62, 22.5%) for males and 5:30 AM to 5:59 AM (48, 21.5%) for females.
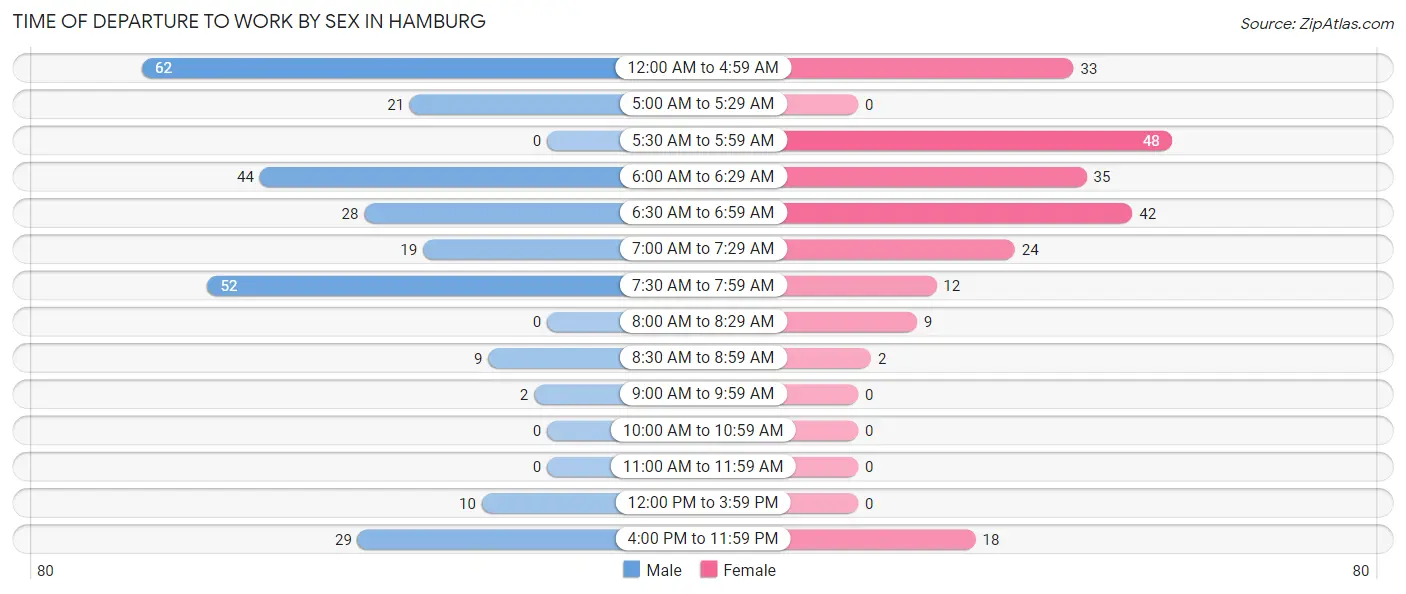
| Time of Departure | Male | Female |
| 12:00 AM to 4:59 AM | 62 (22.5%) | 33 (14.8%) |
| 5:00 AM to 5:29 AM | 21 (7.6%) | 0 (0.0%) |
| 5:30 AM to 5:59 AM | 0 (0.0%) | 48 (21.5%) |
| 6:00 AM to 6:29 AM | 44 (15.9%) | 35 (15.7%) |
| 6:30 AM to 6:59 AM | 28 (10.1%) | 42 (18.8%) |
| 7:00 AM to 7:29 AM | 19 (6.9%) | 24 (10.8%) |
| 7:30 AM to 7:59 AM | 52 (18.8%) | 12 (5.4%) |
| 8:00 AM to 8:29 AM | 0 (0.0%) | 9 (4.0%) |
| 8:30 AM to 8:59 AM | 9 (3.3%) | 2 (0.9%) |
| 9:00 AM to 9:59 AM | 2 (0.7%) | 0 (0.0%) |
| 10:00 AM to 10:59 AM | 0 (0.0%) | 0 (0.0%) |
| 11:00 AM to 11:59 AM | 0 (0.0%) | 0 (0.0%) |
| 12:00 PM to 3:59 PM | 10 (3.6%) | 0 (0.0%) |
| 4:00 PM to 11:59 PM | 29 (10.5%) | 18 (8.1%) |
| Total | 276 (100.0%) | 223 (100.0%) |
Housing Occupancy in Hamburg
Occupancy by Ownership in Hamburg
Of the total 480 dwellings in Hamburg, owner-occupied units account for 369 (76.9%), while renter-occupied units make up 111 (23.1%).
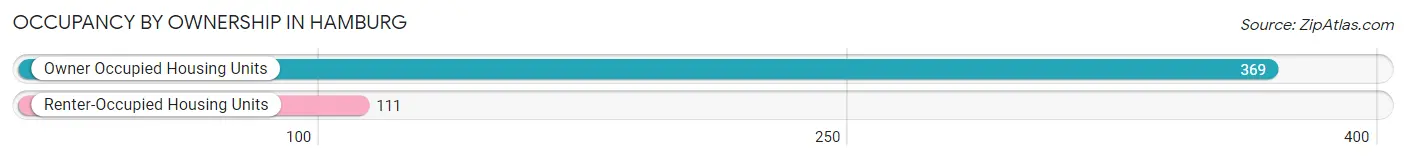
| Occupancy | # Housing Units | % Housing Units |
| Owner Occupied Housing Units | 369 | 76.9% |
| Renter-Occupied Housing Units | 111 | 23.1% |
| Total Occupied Housing Units | 480 | 100.0% |
Occupancy by Household Size in Hamburg
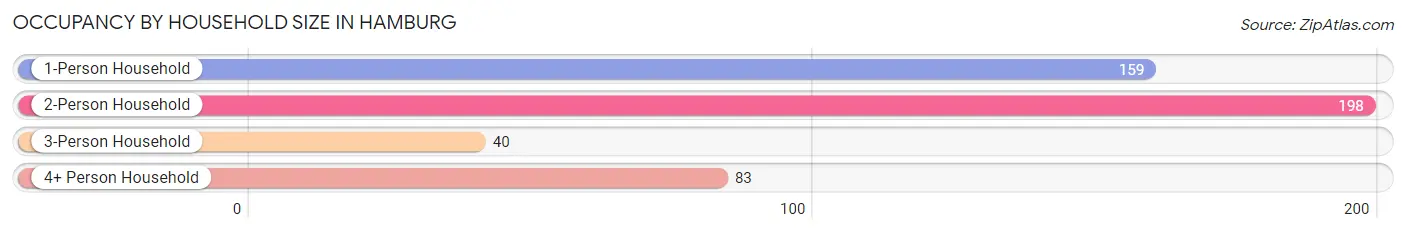
| Household Size | # Housing Units | % Housing Units |
| 1-Person Household | 159 | 33.1% |
| 2-Person Household | 198 | 41.2% |
| 3-Person Household | 40 | 8.3% |
| 4+ Person Household | 83 | 17.3% |
| Total Housing Units | 480 | 100.0% |
Occupancy by Ownership by Household Size in Hamburg
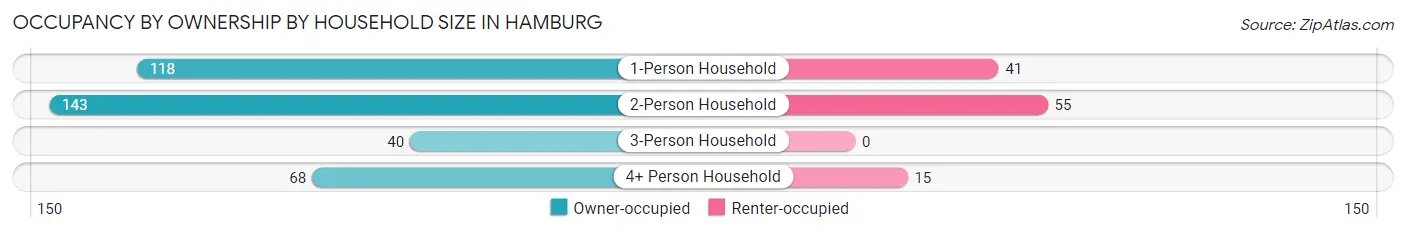
| Household Size | Owner-occupied | Renter-occupied |
| 1-Person Household | 118 (74.2%) | 41 (25.8%) |
| 2-Person Household | 143 (72.2%) | 55 (27.8%) |
| 3-Person Household | 40 (100.0%) | 0 (0.0%) |
| 4+ Person Household | 68 (81.9%) | 15 (18.1%) |
| Total Housing Units | 369 (76.9%) | 111 (23.1%) |
Occupancy by Educational Attainment in Hamburg
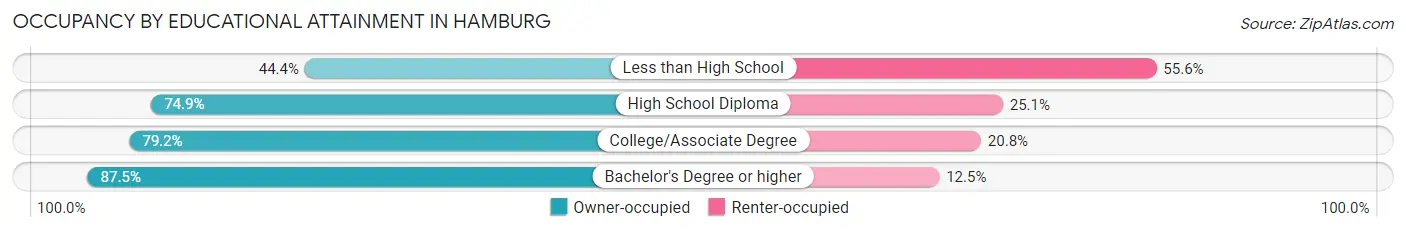
| Household Size | Owner-occupied | Renter-occupied |
| Less than High School | 8 (44.4%) | 10 (55.6%) |
| High School Diploma | 167 (74.9%) | 56 (25.1%) |
| College/Associate Degree | 145 (79.2%) | 38 (20.8%) |
| Bachelor's Degree or higher | 49 (87.5%) | 7 (12.5%) |
Occupancy by Age of Householder in Hamburg
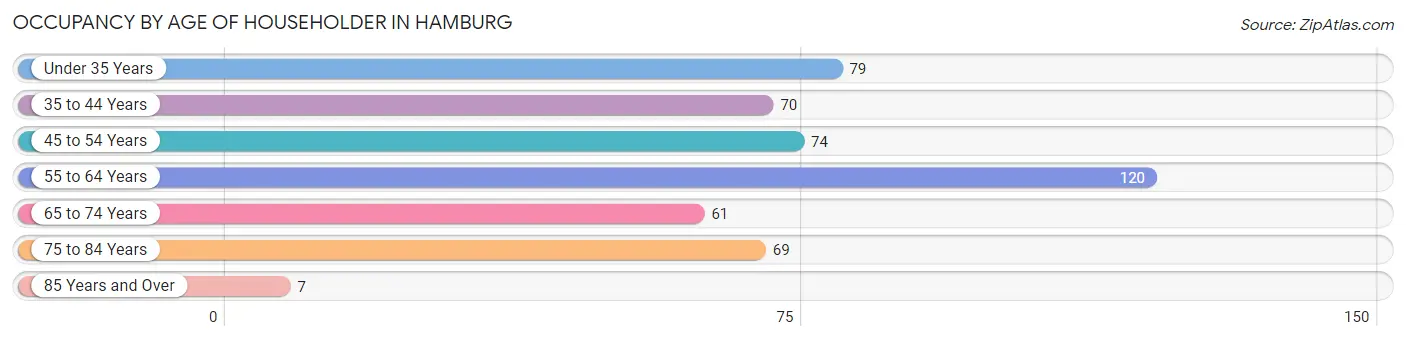
| Age Bracket | # Households | % Households |
| Under 35 Years | 79 | 16.5% |
| 35 to 44 Years | 70 | 14.6% |
| 45 to 54 Years | 74 | 15.4% |
| 55 to 64 Years | 120 | 25.0% |
| 65 to 74 Years | 61 | 12.7% |
| 75 to 84 Years | 69 | 14.4% |
| 85 Years and Over | 7 | 1.5% |
| Total | 480 | 100.0% |
Housing Finances in Hamburg
Median Income by Occupancy in Hamburg
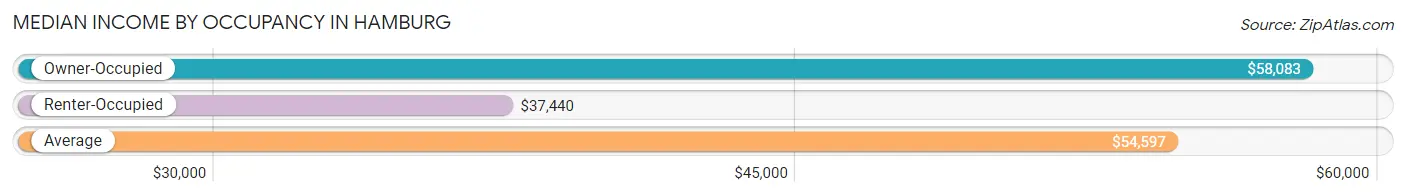
| Occupancy Type | # Households | Median Income |
| Owner-Occupied | 369 (76.9%) | $58,083 |
| Renter-Occupied | 111 (23.1%) | $37,440 |
| Average | 480 (100.0%) | $54,597 |
Occupancy by Householder Income Bracket in Hamburg
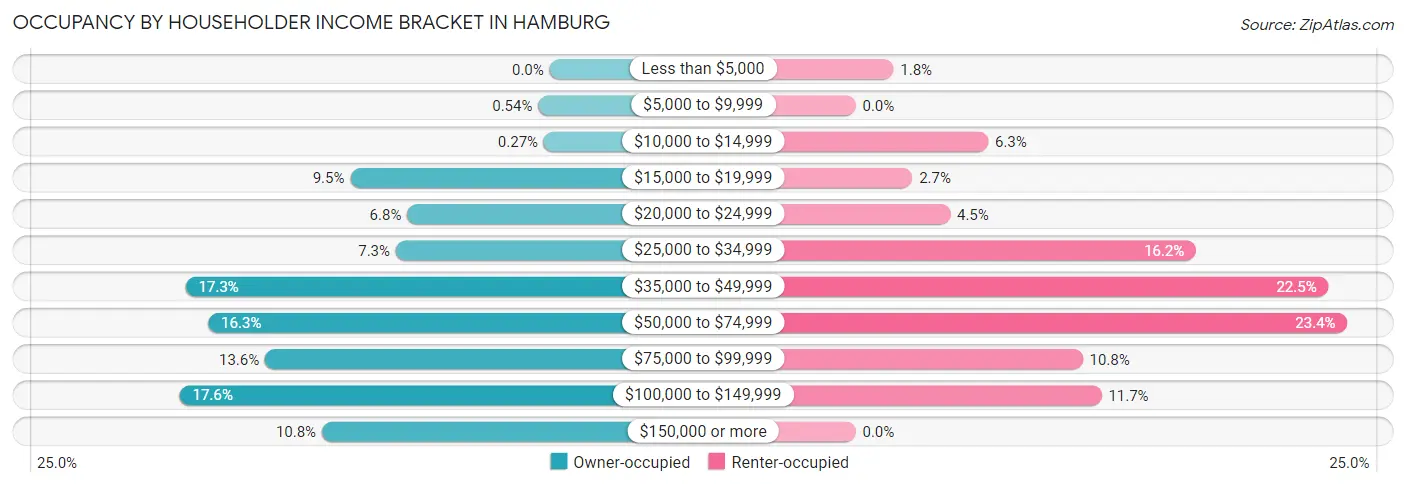
| Income Bracket | Owner-occupied | Renter-occupied |
| Less than $5,000 | 0 (0.0%) | 2 (1.8%) |
| $5,000 to $9,999 | 2 (0.5%) | 0 (0.0%) |
| $10,000 to $14,999 | 1 (0.3%) | 7 (6.3%) |
| $15,000 to $19,999 | 35 (9.5%) | 3 (2.7%) |
| $20,000 to $24,999 | 25 (6.8%) | 5 (4.5%) |
| $25,000 to $34,999 | 27 (7.3%) | 18 (16.2%) |
| $35,000 to $49,999 | 64 (17.3%) | 25 (22.5%) |
| $50,000 to $74,999 | 60 (16.3%) | 26 (23.4%) |
| $75,000 to $99,999 | 50 (13.6%) | 12 (10.8%) |
| $100,000 to $149,999 | 65 (17.6%) | 13 (11.7%) |
| $150,000 or more | 40 (10.8%) | 0 (0.0%) |
| Total | 369 (100.0%) | 111 (100.0%) |
Monthly Housing Cost Tiers in Hamburg
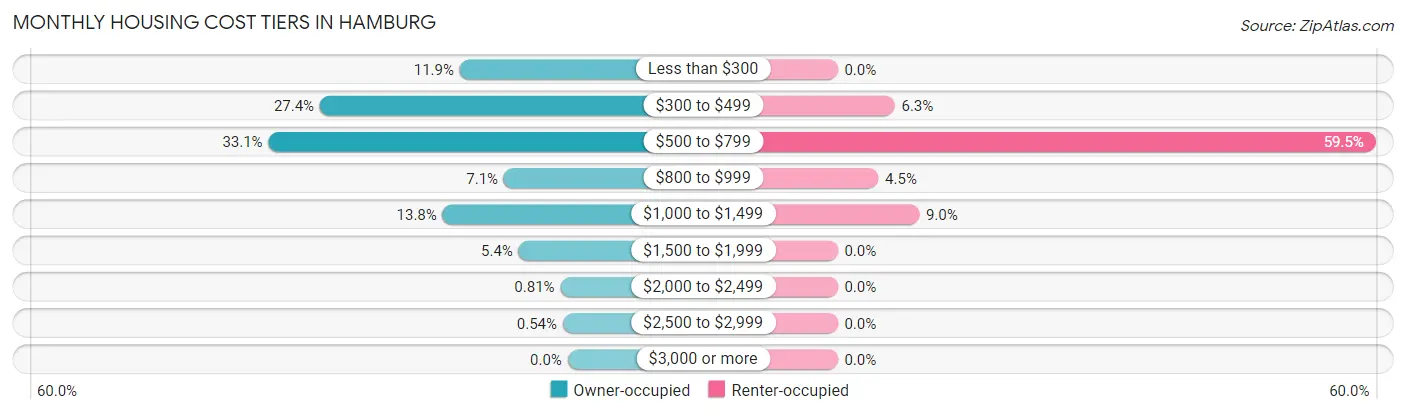
| Monthly Cost | Owner-occupied | Renter-occupied |
| Less than $300 | 44 (11.9%) | 0 (0.0%) |
| $300 to $499 | 101 (27.4%) | 7 (6.3%) |
| $500 to $799 | 122 (33.1%) | 66 (59.5%) |
| $800 to $999 | 26 (7.0%) | 5 (4.5%) |
| $1,000 to $1,499 | 51 (13.8%) | 10 (9.0%) |
| $1,500 to $1,999 | 20 (5.4%) | 0 (0.0%) |
| $2,000 to $2,499 | 3 (0.8%) | 0 (0.0%) |
| $2,500 to $2,999 | 2 (0.5%) | 0 (0.0%) |
| $3,000 or more | 0 (0.0%) | 0 (0.0%) |
| Total | 369 (100.0%) | 111 (100.0%) |
Physical Housing Characteristics in Hamburg
Housing Structures in Hamburg
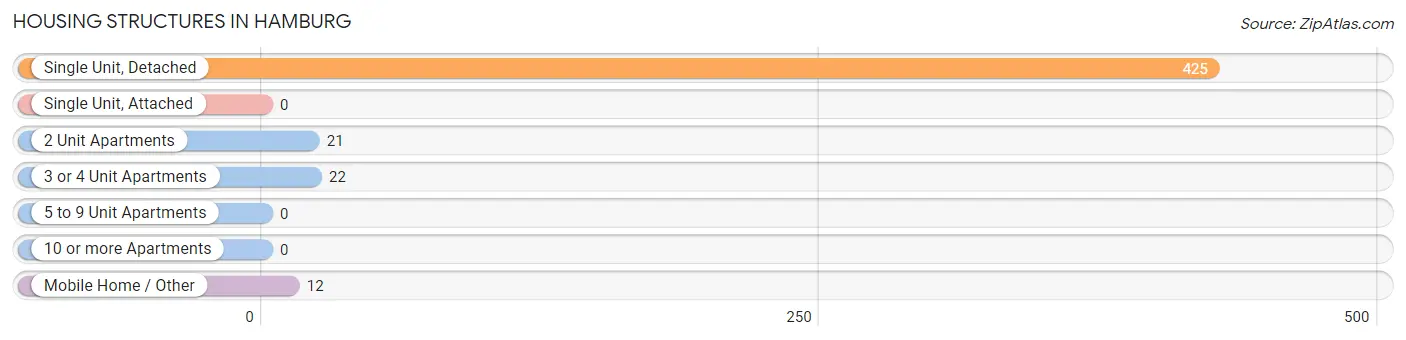
| Structure Type | # Housing Units | % Housing Units |
| Single Unit, Detached | 425 | 88.5% |
| Single Unit, Attached | 0 | 0.0% |
| 2 Unit Apartments | 21 | 4.4% |
| 3 or 4 Unit Apartments | 22 | 4.6% |
| 5 to 9 Unit Apartments | 0 | 0.0% |
| 10 or more Apartments | 0 | 0.0% |
| Mobile Home / Other | 12 | 2.5% |
| Total | 480 | 100.0% |
Housing Structures by Occupancy in Hamburg
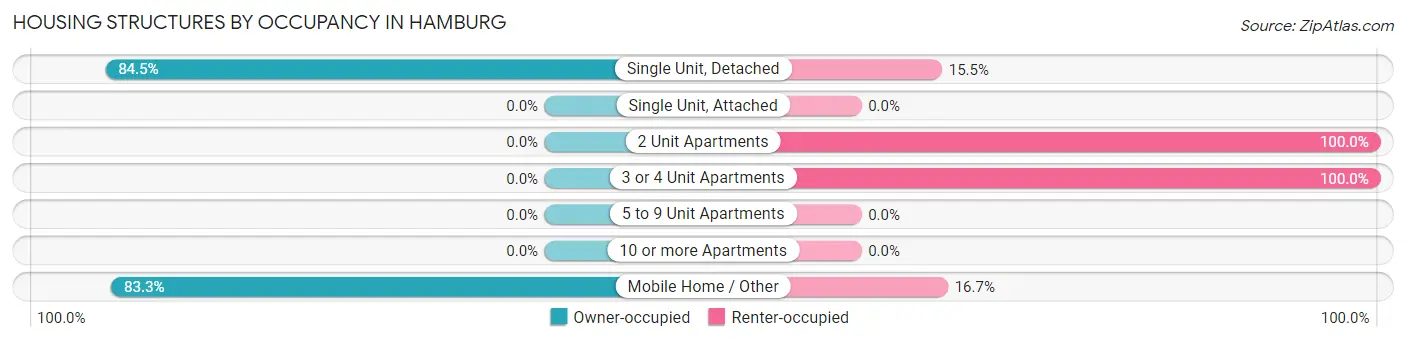
| Structure Type | Owner-occupied | Renter-occupied |
| Single Unit, Detached | 359 (84.5%) | 66 (15.5%) |
| Single Unit, Attached | 0 (0.0%) | 0 (0.0%) |
| 2 Unit Apartments | 0 (0.0%) | 21 (100.0%) |
| 3 or 4 Unit Apartments | 0 (0.0%) | 22 (100.0%) |
| 5 to 9 Unit Apartments | 0 (0.0%) | 0 (0.0%) |
| 10 or more Apartments | 0 (0.0%) | 0 (0.0%) |
| Mobile Home / Other | 10 (83.3%) | 2 (16.7%) |
| Total | 369 (76.9%) | 111 (23.1%) |
Housing Structures by Number of Rooms in Hamburg
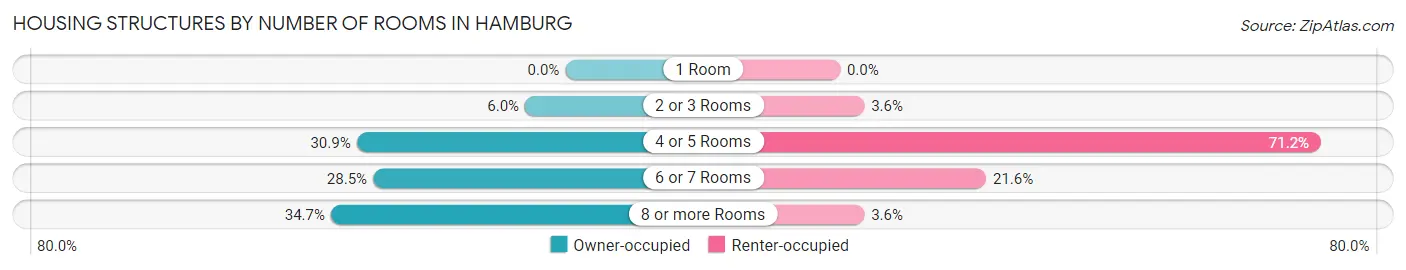
| Number of Rooms | Owner-occupied | Renter-occupied |
| 1 Room | 0 (0.0%) | 0 (0.0%) |
| 2 or 3 Rooms | 22 (6.0%) | 4 (3.6%) |
| 4 or 5 Rooms | 114 (30.9%) | 79 (71.2%) |
| 6 or 7 Rooms | 105 (28.5%) | 24 (21.6%) |
| 8 or more Rooms | 128 (34.7%) | 4 (3.6%) |
| Total | 369 (100.0%) | 111 (100.0%) |
Housing Structure by Heating Type in Hamburg
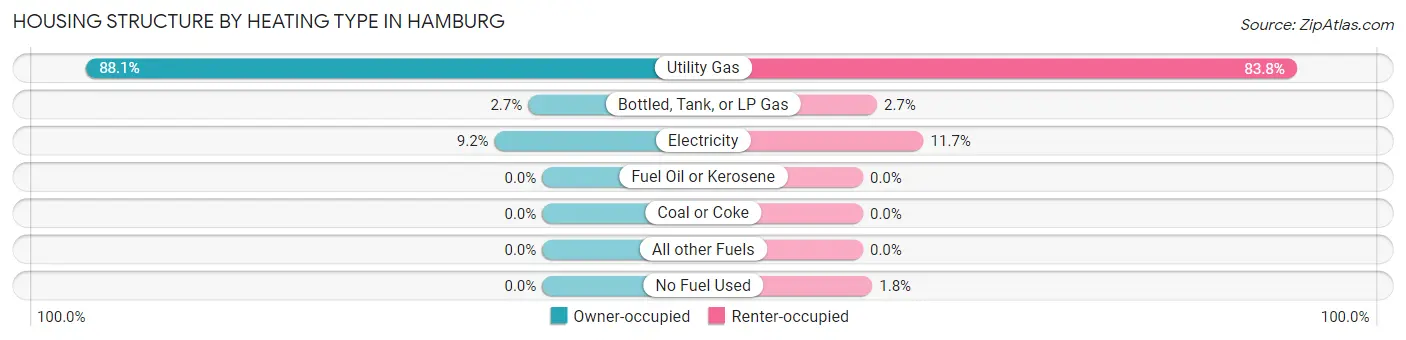
| Heating Type | Owner-occupied | Renter-occupied |
| Utility Gas | 325 (88.1%) | 93 (83.8%) |
| Bottled, Tank, or LP Gas | 10 (2.7%) | 3 (2.7%) |
| Electricity | 34 (9.2%) | 13 (11.7%) |
| Fuel Oil or Kerosene | 0 (0.0%) | 0 (0.0%) |
| Coal or Coke | 0 (0.0%) | 0 (0.0%) |
| All other Fuels | 0 (0.0%) | 0 (0.0%) |
| No Fuel Used | 0 (0.0%) | 2 (1.8%) |
| Total | 369 (100.0%) | 111 (100.0%) |
Household Vehicle Usage in Hamburg
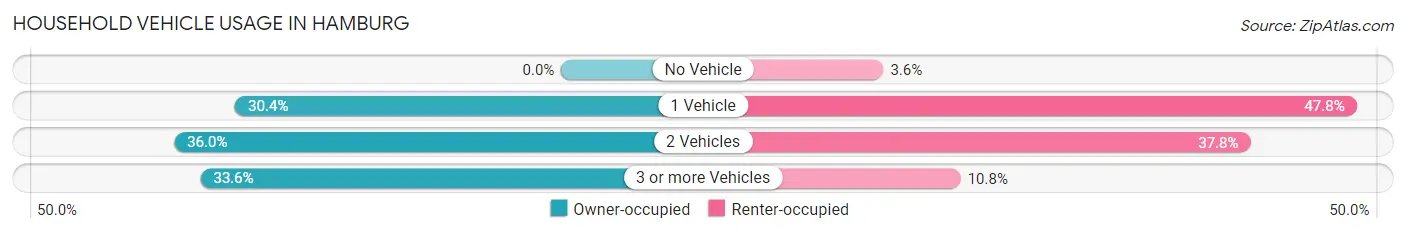
| Vehicles per Household | Owner-occupied | Renter-occupied |
| No Vehicle | 0 (0.0%) | 4 (3.6%) |
| 1 Vehicle | 112 (30.3%) | 53 (47.7%) |
| 2 Vehicles | 133 (36.0%) | 42 (37.8%) |
| 3 or more Vehicles | 124 (33.6%) | 12 (10.8%) |
| Total | 369 (100.0%) | 111 (100.0%) |
Real Estate & Mortgages in Hamburg
Real Estate and Mortgage Overview in Hamburg
| Characteristic | Without Mortgage | With Mortgage |
| Housing Units | 204 | 165 |
| Median Property Value | $100,500 | $113,400 |
| Median Household Income | $53,558 | $36 |
| Monthly Housing Costs | $405 | $0 |
| Real Estate Taxes | $1,190 | $0 |
Property Value by Mortgage Status in Hamburg
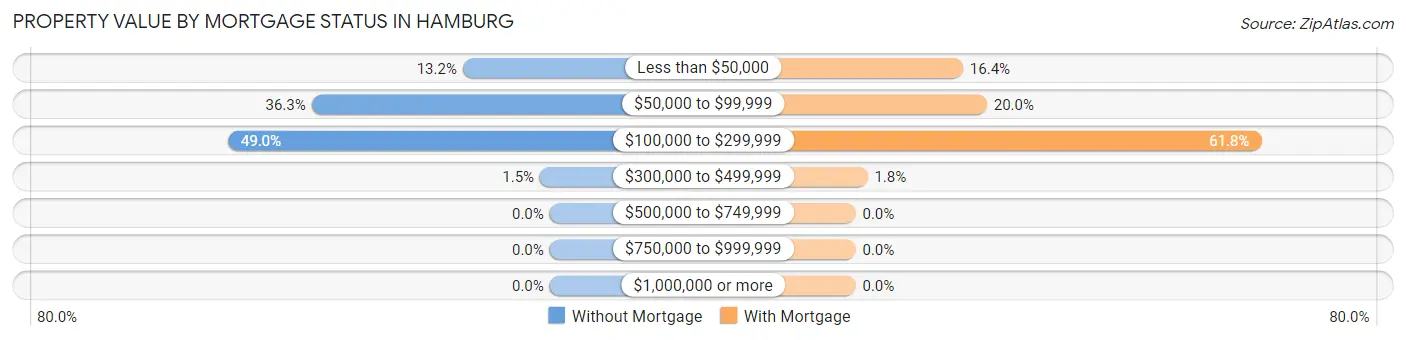
| Property Value | Without Mortgage | With Mortgage |
| Less than $50,000 | 27 (13.2%) | 27 (16.4%) |
| $50,000 to $99,999 | 74 (36.3%) | 33 (20.0%) |
| $100,000 to $299,999 | 100 (49.0%) | 102 (61.8%) |
| $300,000 to $499,999 | 3 (1.5%) | 3 (1.8%) |
| $500,000 to $749,999 | 0 (0.0%) | 0 (0.0%) |
| $750,000 to $999,999 | 0 (0.0%) | 0 (0.0%) |
| $1,000,000 or more | 0 (0.0%) | 0 (0.0%) |
| Total | 204 (100.0%) | 165 (100.0%) |
Household Income by Mortgage Status in Hamburg
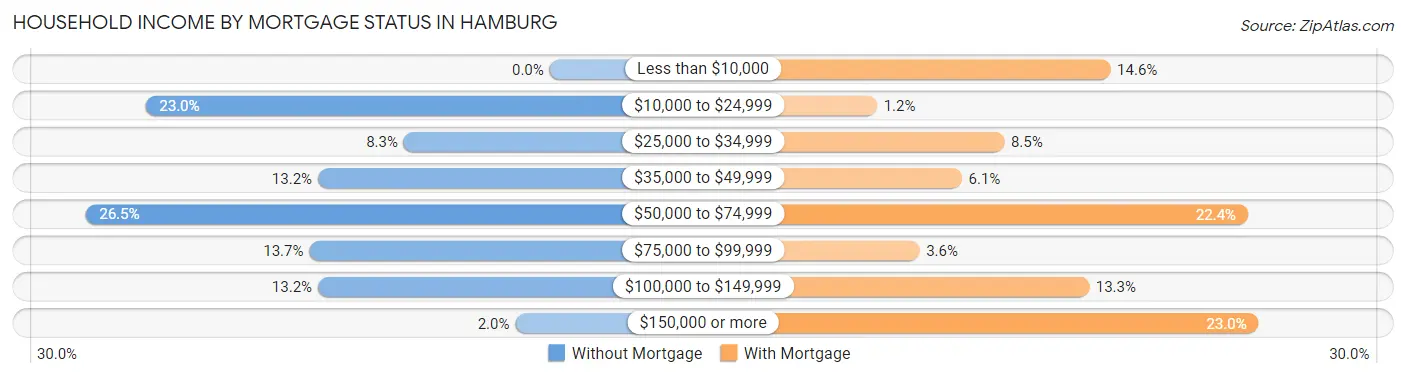
| Household Income | Without Mortgage | With Mortgage |
| Less than $10,000 | 0 (0.0%) | 24 (14.5%) |
| $10,000 to $24,999 | 47 (23.0%) | 2 (1.2%) |
| $25,000 to $34,999 | 17 (8.3%) | 14 (8.5%) |
| $35,000 to $49,999 | 27 (13.2%) | 10 (6.1%) |
| $50,000 to $74,999 | 54 (26.5%) | 37 (22.4%) |
| $75,000 to $99,999 | 28 (13.7%) | 6 (3.6%) |
| $100,000 to $149,999 | 27 (13.2%) | 22 (13.3%) |
| $150,000 or more | 4 (2.0%) | 38 (23.0%) |
| Total | 204 (100.0%) | 165 (100.0%) |
Property Value to Household Income Ratio in Hamburg
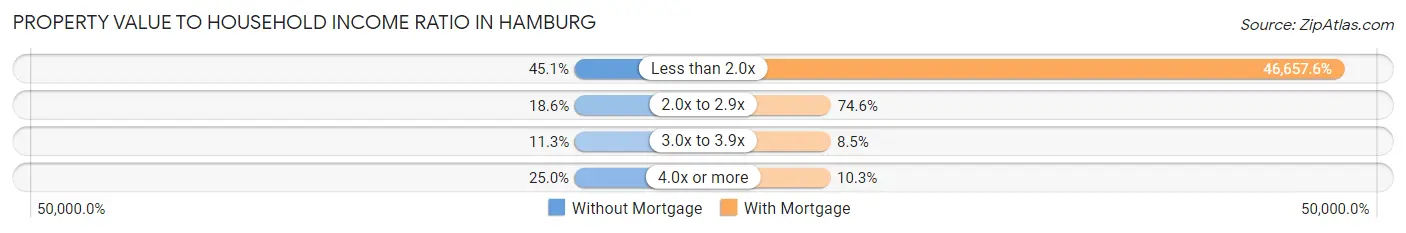
| Value-to-Income Ratio | Without Mortgage | With Mortgage |
| Less than 2.0x | 92 (45.1%) | 76,985 (46,657.6%) |
| 2.0x to 2.9x | 38 (18.6%) | 123 (74.6%) |
| 3.0x to 3.9x | 23 (11.3%) | 14 (8.5%) |
| 4.0x or more | 51 (25.0%) | 17 (10.3%) |
| Total | 204 (100.0%) | 165 (100.0%) |
Real Estate Taxes by Mortgage Status in Hamburg
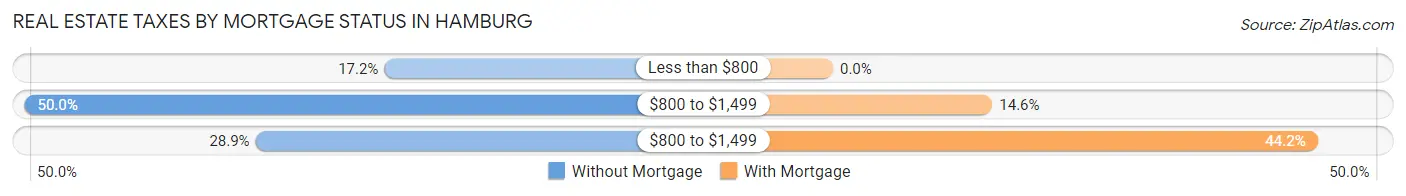
| Property Taxes | Without Mortgage | With Mortgage |
| Less than $800 | 35 (17.2%) | 0 (0.0%) |
| $800 to $1,499 | 102 (50.0%) | 24 (14.5%) |
| $800 to $1,499 | 59 (28.9%) | 73 (44.2%) |
| Total | 204 (100.0%) | 165 (100.0%) |
Health & Disability in Hamburg
Health Insurance Coverage by Age in Hamburg
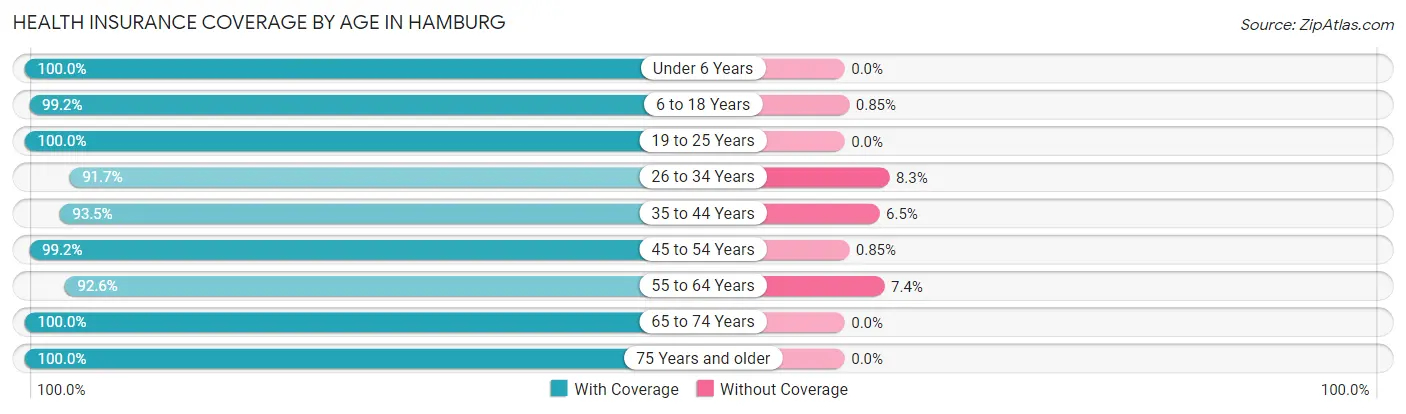
| Age Bracket | With Coverage | Without Coverage |
| Under 6 Years | 29 (100.0%) | 0 (0.0%) |
| 6 to 18 Years | 234 (99.2%) | 2 (0.9%) |
| 19 to 25 Years | 67 (100.0%) | 0 (0.0%) |
| 26 to 34 Years | 88 (91.7%) | 8 (8.3%) |
| 35 to 44 Years | 144 (93.5%) | 10 (6.5%) |
| 45 to 54 Years | 117 (99.2%) | 1 (0.9%) |
| 55 to 64 Years | 162 (92.6%) | 13 (7.4%) |
| 65 to 74 Years | 97 (100.0%) | 0 (0.0%) |
| 75 Years and older | 115 (100.0%) | 0 (0.0%) |
| Total | 1,053 (96.9%) | 34 (3.1%) |
Health Insurance Coverage by Citizenship Status in Hamburg
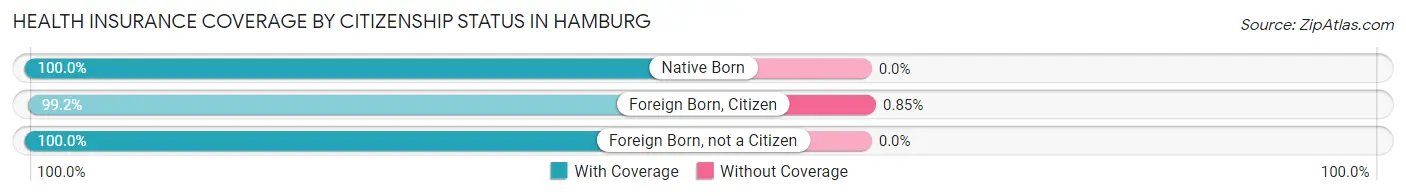
| Citizenship Status | With Coverage | Without Coverage |
| Native Born | 29 (100.0%) | 0 (0.0%) |
| Foreign Born, Citizen | 234 (99.2%) | 2 (0.9%) |
| Foreign Born, not a Citizen | 67 (100.0%) | 0 (0.0%) |
Health Insurance Coverage by Household Income in Hamburg
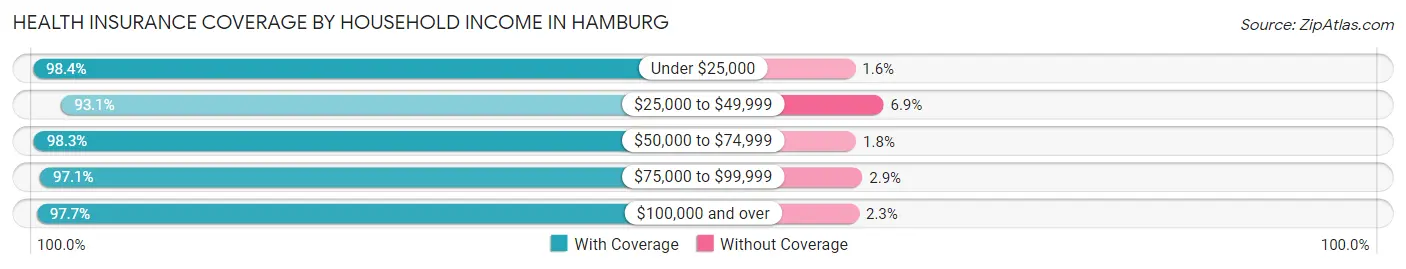
| Household Income | With Coverage | Without Coverage |
| Under $25,000 | 123 (98.4%) | 2 (1.6%) |
| $25,000 to $49,999 | 203 (93.1%) | 15 (6.9%) |
| $50,000 to $74,999 | 168 (98.3%) | 3 (1.8%) |
| $75,000 to $99,999 | 133 (97.1%) | 4 (2.9%) |
| $100,000 and over | 426 (97.7%) | 10 (2.3%) |
Public vs Private Health Insurance Coverage by Age in Hamburg
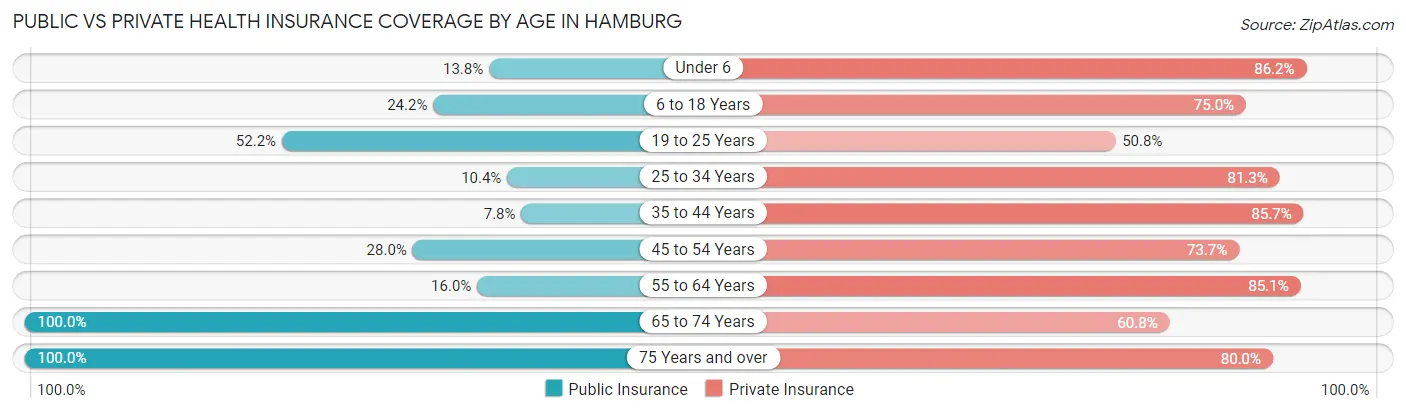
| Age Bracket | Public Insurance | Private Insurance |
| Under 6 | 4 (13.8%) | 25 (86.2%) |
| 6 to 18 Years | 57 (24.1%) | 177 (75.0%) |
| 19 to 25 Years | 35 (52.2%) | 34 (50.7%) |
| 25 to 34 Years | 10 (10.4%) | 78 (81.2%) |
| 35 to 44 Years | 12 (7.8%) | 132 (85.7%) |
| 45 to 54 Years | 33 (28.0%) | 87 (73.7%) |
| 55 to 64 Years | 28 (16.0%) | 149 (85.1%) |
| 65 to 74 Years | 97 (100.0%) | 59 (60.8%) |
| 75 Years and over | 115 (100.0%) | 92 (80.0%) |
| Total | 391 (36.0%) | 833 (76.6%) |
Disability Status by Sex by Age in Hamburg
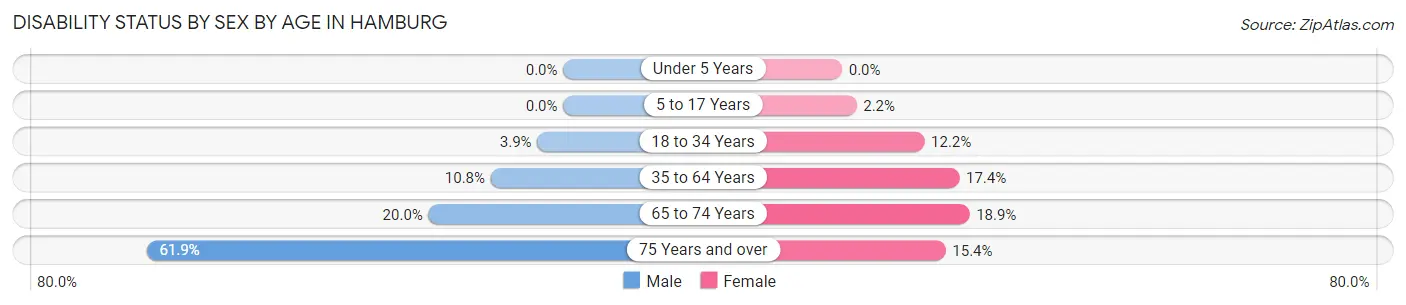
| Age Bracket | Male | Female |
| Under 5 Years | 0 (0.0%) | 0 (0.0%) |
| 5 to 17 Years | 0 (0.0%) | 2 (2.1%) |
| 18 to 34 Years | 3 (3.8%) | 11 (12.2%) |
| 35 to 64 Years | 24 (10.8%) | 39 (17.4%) |
| 65 to 74 Years | 12 (20.0%) | 7 (18.9%) |
| 75 Years and over | 39 (61.9%) | 8 (15.4%) |
Disability Class by Sex by Age in Hamburg
Disability Class: Hearing Difficulty
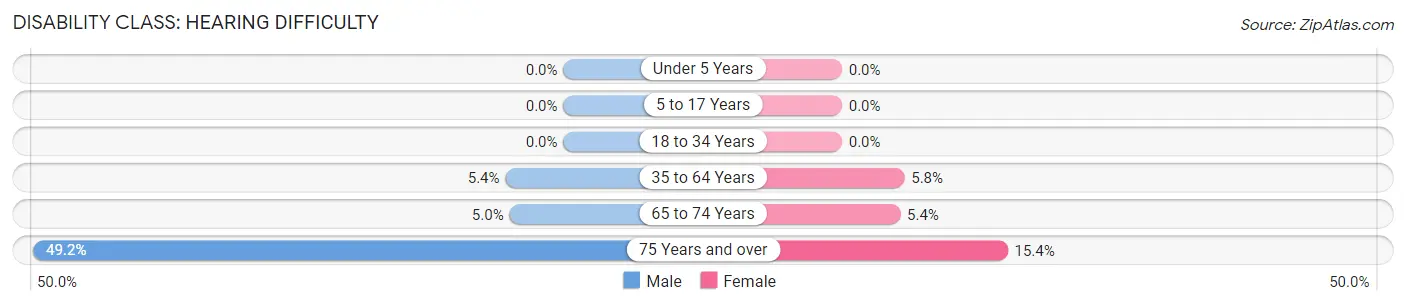
| Age Bracket | Male | Female |
| Under 5 Years | 0 (0.0%) | 0 (0.0%) |
| 5 to 17 Years | 0 (0.0%) | 0 (0.0%) |
| 18 to 34 Years | 0 (0.0%) | 0 (0.0%) |
| 35 to 64 Years | 12 (5.4%) | 13 (5.8%) |
| 65 to 74 Years | 3 (5.0%) | 2 (5.4%) |
| 75 Years and over | 31 (49.2%) | 8 (15.4%) |
Disability Class: Vision Difficulty
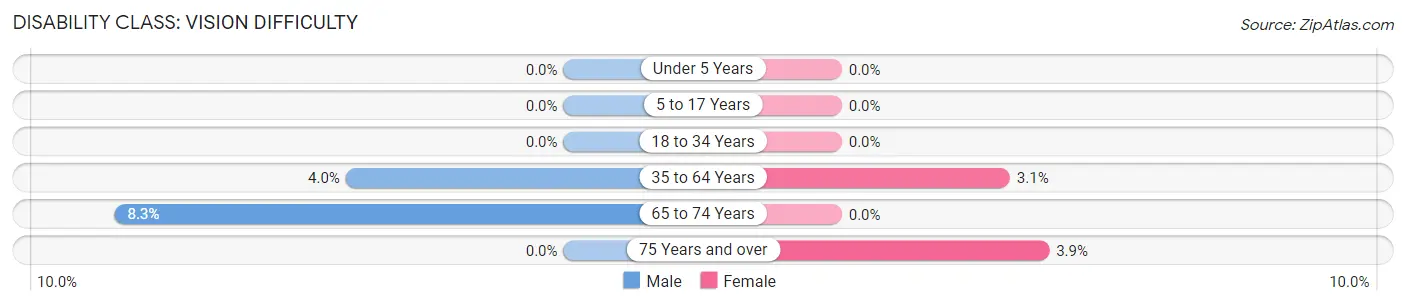
| Age Bracket | Male | Female |
| Under 5 Years | 0 (0.0%) | 0 (0.0%) |
| 5 to 17 Years | 0 (0.0%) | 0 (0.0%) |
| 18 to 34 Years | 0 (0.0%) | 0 (0.0%) |
| 35 to 64 Years | 9 (4.0%) | 7 (3.1%) |
| 65 to 74 Years | 5 (8.3%) | 0 (0.0%) |
| 75 Years and over | 0 (0.0%) | 2 (3.8%) |
Disability Class: Cognitive Difficulty
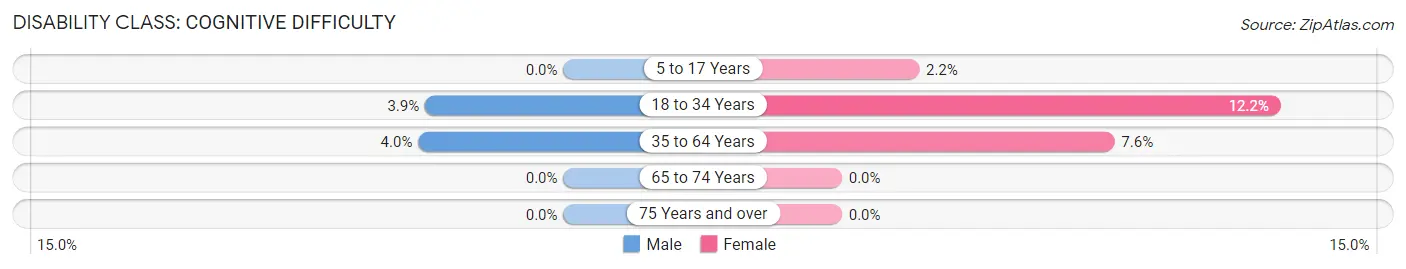
| Age Bracket | Male | Female |
| 5 to 17 Years | 0 (0.0%) | 2 (2.1%) |
| 18 to 34 Years | 3 (3.8%) | 11 (12.2%) |
| 35 to 64 Years | 9 (4.0%) | 17 (7.6%) |
| 65 to 74 Years | 0 (0.0%) | 0 (0.0%) |
| 75 Years and over | 0 (0.0%) | 0 (0.0%) |
Disability Class: Ambulatory Difficulty
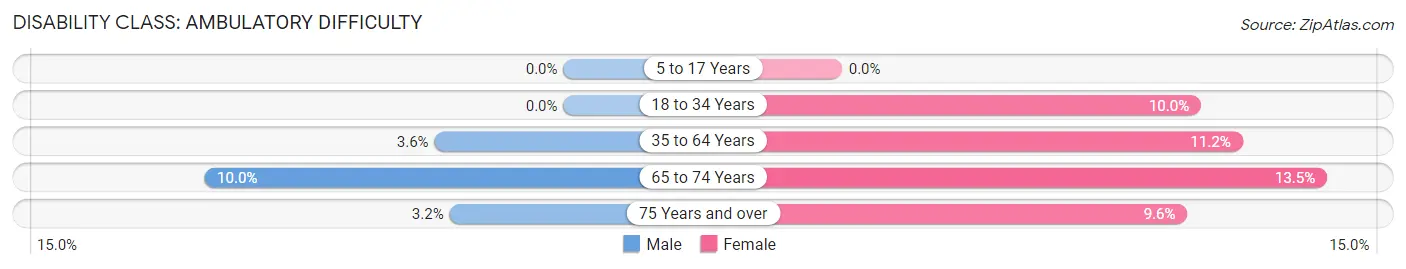
| Age Bracket | Male | Female |
| 5 to 17 Years | 0 (0.0%) | 0 (0.0%) |
| 18 to 34 Years | 0 (0.0%) | 9 (10.0%) |
| 35 to 64 Years | 8 (3.6%) | 25 (11.2%) |
| 65 to 74 Years | 6 (10.0%) | 5 (13.5%) |
| 75 Years and over | 2 (3.2%) | 5 (9.6%) |
Disability Class: Self-Care Difficulty
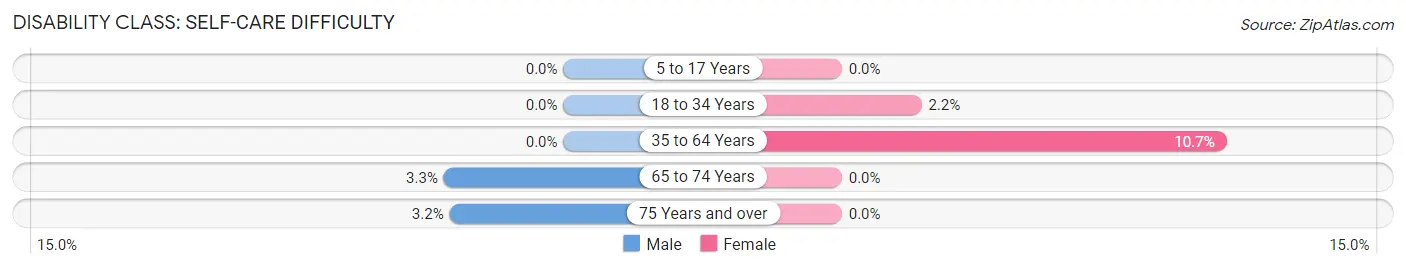
| Age Bracket | Male | Female |
| 5 to 17 Years | 0 (0.0%) | 0 (0.0%) |
| 18 to 34 Years | 0 (0.0%) | 2 (2.2%) |
| 35 to 64 Years | 0 (0.0%) | 24 (10.7%) |
| 65 to 74 Years | 2 (3.3%) | 0 (0.0%) |
| 75 Years and over | 2 (3.2%) | 0 (0.0%) |
Technology Access in Hamburg
Computing Device Access in Hamburg
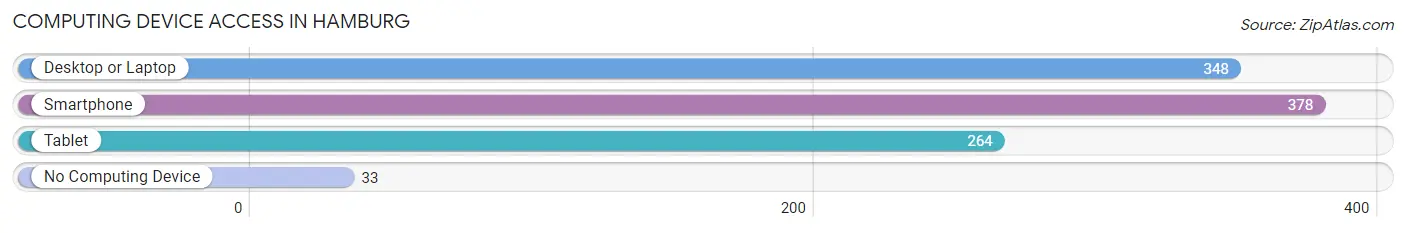
| Device Type | # Households | % Households |
| Desktop or Laptop | 348 | 72.5% |
| Smartphone | 378 | 78.7% |
| Tablet | 264 | 55.0% |
| No Computing Device | 33 | 6.9% |
| Total | 480 | 100.0% |
Internet Access in Hamburg
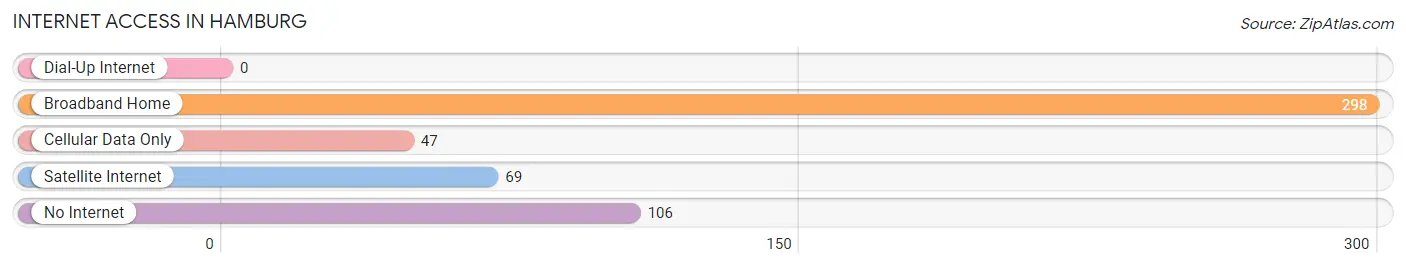
| Internet Type | # Households | % Households |
| Dial-Up Internet | 0 | 0.0% |
| Broadband Home | 298 | 62.1% |
| Cellular Data Only | 47 | 9.8% |
| Satellite Internet | 69 | 14.4% |
| No Internet | 106 | 22.1% |
| Total | 480 | 100.0% |
Hamburg Summary
Hamburg, Iowa is a small town located in Fremont County in the southwestern corner of the state. It is situated on the banks of the Missouri River, and is the county seat of Fremont County. The town was founded in 1856 and has a population of approximately 1,000 people.
Geography
Hamburg is located in the Loess Hills region of Iowa, which is characterized by rolling hills and deep ravines. The town is situated on the banks of the Missouri River, and is surrounded by farmland. The town is located approximately 30 miles south of Omaha, Nebraska, and is accessible by Interstate 29.
Climate
Hamburg has a humid continental climate, with hot summers and cold winters. The average temperature in the summer is around 80 degrees Fahrenheit, and the average temperature in the winter is around 20 degrees Fahrenheit. The town receives an average of 36 inches of precipitation per year, with most of it falling in the spring and summer months.
Economy
Hamburg’s economy is largely based on agriculture. The town is home to several large farms, as well as a number of smaller family-owned farms. The town also has a few small businesses, including a grocery store, a hardware store, and a few restaurants.
Demographics
As of the 2010 census, the population of Hamburg was 1,039. The town is predominantly white, with a small Hispanic population. The median household income is $37,500, and the median age is 44.
History
Hamburg was founded in 1856 by a group of settlers from Germany. The town was named after the city of Hamburg in Germany, and was originally intended to be a trading post for the local Native American tribes. The town quickly grew, and by the late 19th century, it had become a thriving agricultural center.
In the early 20th century, the town was hit hard by the Great Depression, and many of the businesses in town closed. However, the town was able to recover, and by the 1950s, it had become a popular tourist destination. Today, Hamburg is a quiet, rural town, and is a popular destination for outdoor enthusiasts.
Hamburg is a small town with a rich history and a bright future. The town is home to a diverse population, and is a great place to live and work. The town is surrounded by beautiful scenery, and is a great place to explore and enjoy the outdoors.
Common Questions
What is Per Capita Income in Hamburg?
Per Capita income in Hamburg is $30,295.
What is the Median Family Income in Hamburg?
Median Family Income in Hamburg is $78,393.
What is the Median Household income in Hamburg?
Median Household Income in Hamburg is $54,597.
What is Income or Wage Gap in Hamburg?
Income or Wage Gap in Hamburg is 15.8%.
Women in Hamburg earn 84.2 cents for every dollar earned by a man.
What is Inequality or Gini Index in Hamburg?
Inequality or Gini Index in Hamburg is 0.37.
What is the Total Population of Hamburg?
Total Population of Hamburg is 1,087.
What is the Total Male Population of Hamburg?
Total Male Population of Hamburg is 585.
What is the Total Female Population of Hamburg?
Total Female Population of Hamburg is 502.
What is the Ratio of Males per 100 Females in Hamburg?
There are 116.53 Males per 100 Females in Hamburg.
What is the Ratio of Females per 100 Males in Hamburg?
There are 85.81 Females per 100 Males in Hamburg.
What is the Median Population Age in Hamburg?
Median Population Age in Hamburg is 42.5 Years.
What is the Average Family Size in Hamburg
Average Family Size in Hamburg is 3.0 People.
What is the Average Household Size in Hamburg
Average Household Size in Hamburg is 2.3 People.
How Large is the Labor Force in Hamburg?
There are 521 People in the Labor Forcein in Hamburg.
What is the Percentage of People in the Labor Force in Hamburg?
59.4% of People are in the Labor Force in Hamburg.
What is the Unemployment Rate in Hamburg?
Unemployment Rate in Hamburg is 2.7%.