Goldfield, IA Map & Demographics
Goldfield Map
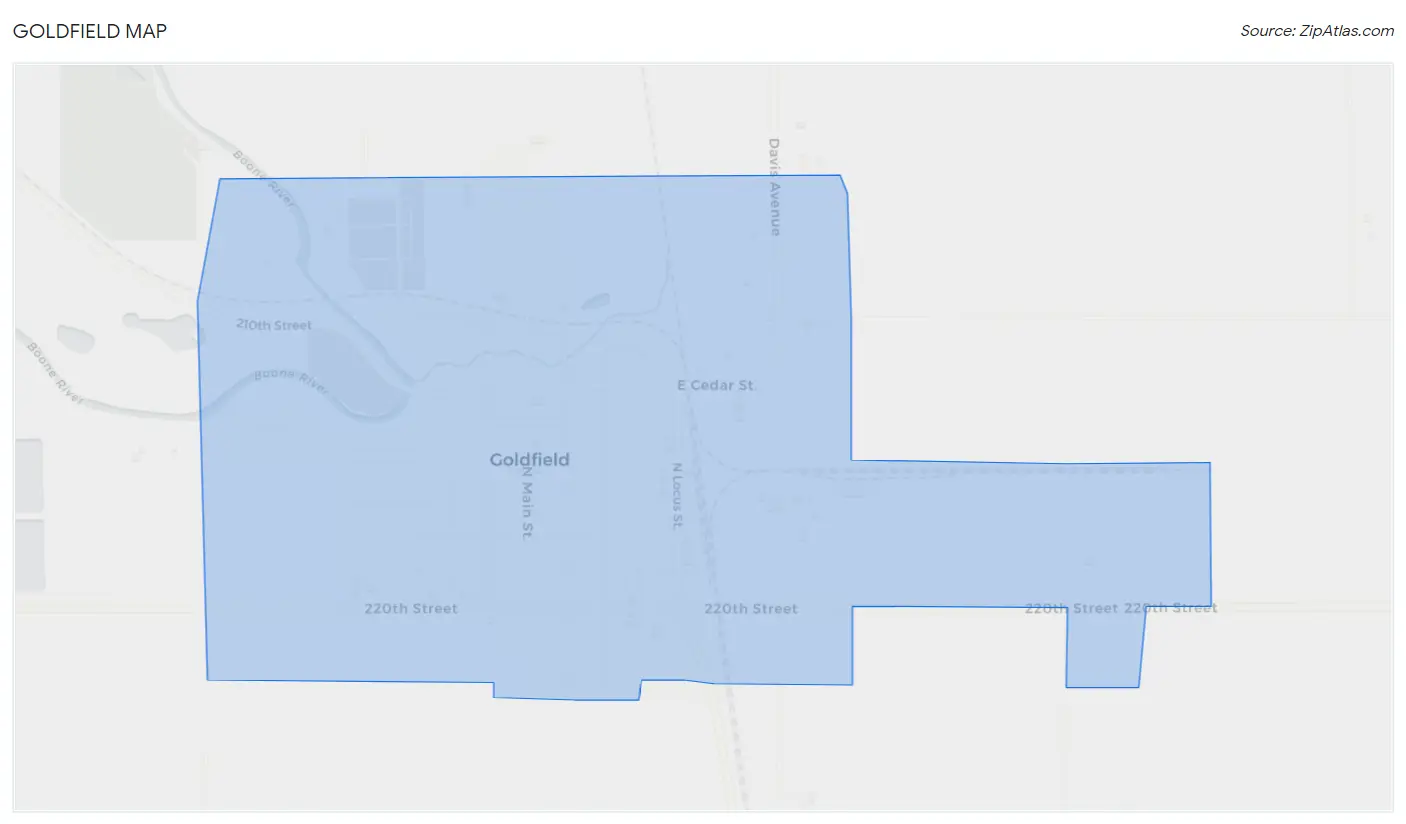
Goldfield Overview
$33,074
PER CAPITA INCOME
$81,042
AVG FAMILY INCOME
$57,656
AVG HOUSEHOLD INCOME
41.5%
WAGE / INCOME GAP [ % ]
58.5¢/ $1
WAGE / INCOME GAP [ $ ]
0.37
INEQUALITY / GINI INDEX
665
TOTAL POPULATION
350
MALE POPULATION
315
FEMALE POPULATION
111.11
MALES / 100 FEMALES
90.00
FEMALES / 100 MALES
43.8
MEDIAN AGE
3.0
AVG FAMILY SIZE
2.3
AVG HOUSEHOLD SIZE
341
LABOR FORCE [ PEOPLE ]
57.4%
PERCENT IN LABOR FORCE
1.5%
UNEMPLOYMENT RATE
Goldfield Zip Codes
Goldfield Area Codes
Income in Goldfield
Income Overview in Goldfield
Per Capita Income in Goldfield is $33,074, while median incomes of families and households are $81,042 and $57,656 respectively.
| Characteristic | Number | Measure |
| Per Capita Income | 665 | $33,074 |
| Median Family Income | 171 | $81,042 |
| Mean Family Income | 171 | $88,102 |
| Median Household Income | 287 | $57,656 |
| Mean Household Income | 287 | $71,252 |
| Income Deficit | 171 | $0 |
| Wage / Income Gap (%) | 665 | 41.55% |
| Wage / Income Gap ($) | 665 | 58.45¢ per $1 |
| Gini / Inequality Index | 665 | 0.37 |
Earnings by Sex in Goldfield
Average Earnings in Goldfield are $57,083, $59,879 for men and $35,000 for women, a difference of 41.5%.
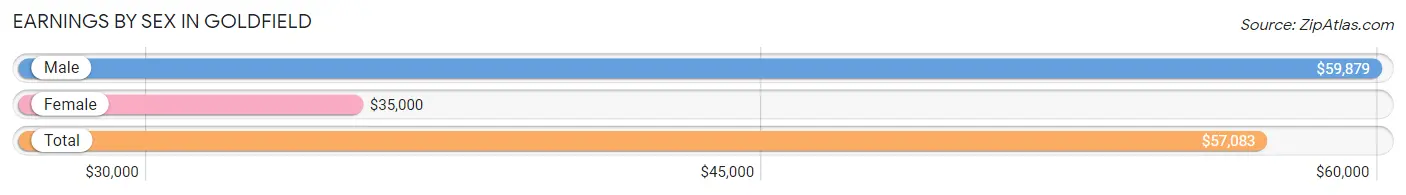
| Sex | Number | Average Earnings |
| Male | 223 (64.3%) | $59,879 |
| Female | 124 (35.7%) | $35,000 |
| Total | 347 (100.0%) | $57,083 |
Earnings by Sex by Income Bracket in Goldfield
The most common earnings brackets in Goldfield are $55,000 to $64,999 for men (71 | 31.8%) and $12,500 to $14,999 for women (19 | 15.3%).
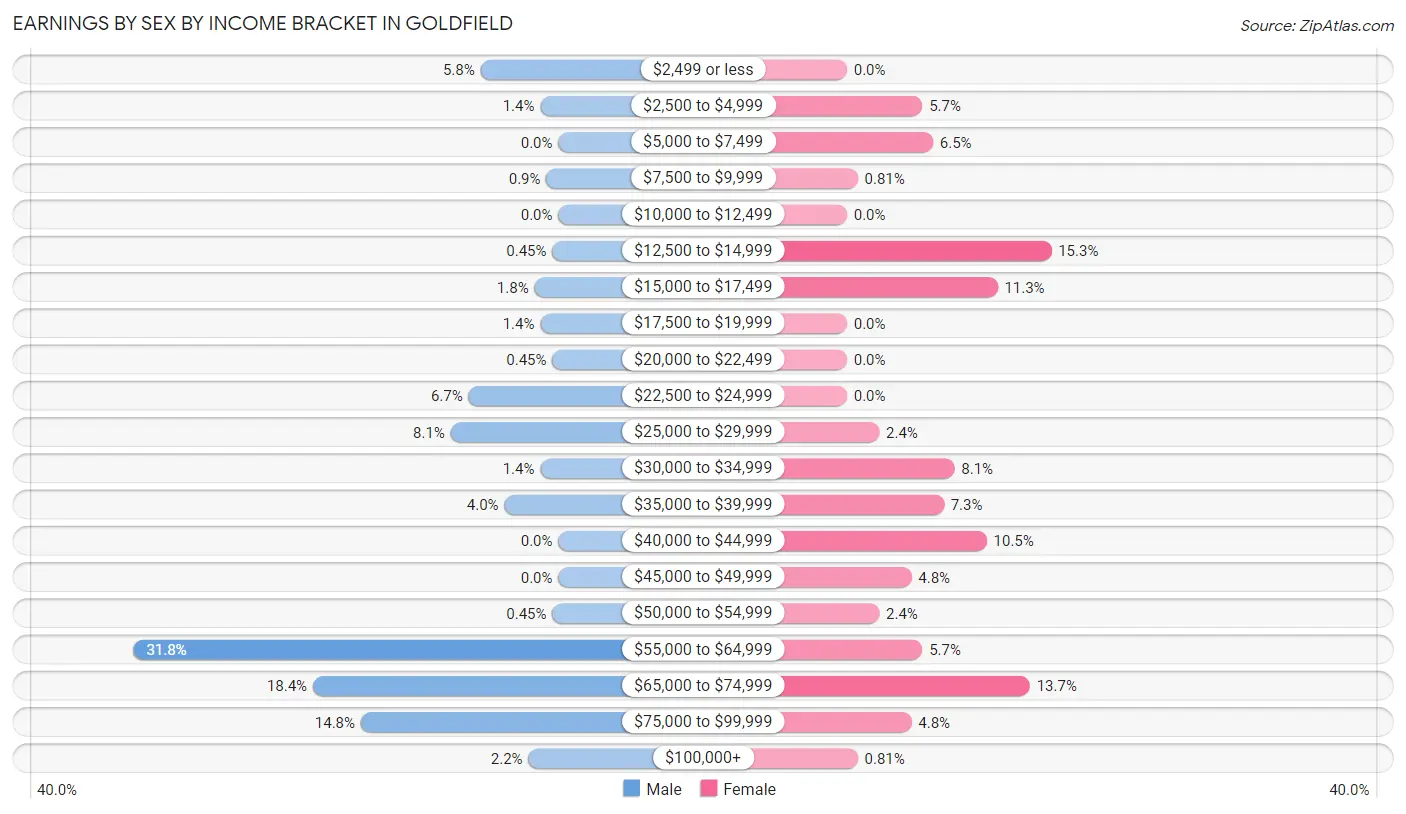
| Income | Male | Female |
| $2,499 or less | 13 (5.8%) | 0 (0.0%) |
| $2,500 to $4,999 | 3 (1.3%) | 7 (5.7%) |
| $5,000 to $7,499 | 0 (0.0%) | 8 (6.5%) |
| $7,500 to $9,999 | 2 (0.9%) | 1 (0.8%) |
| $10,000 to $12,499 | 0 (0.0%) | 0 (0.0%) |
| $12,500 to $14,999 | 1 (0.4%) | 19 (15.3%) |
| $15,000 to $17,499 | 4 (1.8%) | 14 (11.3%) |
| $17,500 to $19,999 | 3 (1.3%) | 0 (0.0%) |
| $20,000 to $22,499 | 1 (0.4%) | 0 (0.0%) |
| $22,500 to $24,999 | 15 (6.7%) | 0 (0.0%) |
| $25,000 to $29,999 | 18 (8.1%) | 3 (2.4%) |
| $30,000 to $34,999 | 3 (1.3%) | 10 (8.1%) |
| $35,000 to $39,999 | 9 (4.0%) | 9 (7.3%) |
| $40,000 to $44,999 | 0 (0.0%) | 13 (10.5%) |
| $45,000 to $49,999 | 0 (0.0%) | 6 (4.8%) |
| $50,000 to $54,999 | 1 (0.4%) | 3 (2.4%) |
| $55,000 to $64,999 | 71 (31.8%) | 7 (5.7%) |
| $65,000 to $74,999 | 41 (18.4%) | 17 (13.7%) |
| $75,000 to $99,999 | 33 (14.8%) | 6 (4.8%) |
| $100,000+ | 5 (2.2%) | 1 (0.8%) |
| Total | 223 (100.0%) | 124 (100.0%) |
Earnings by Sex by Educational Attainment in Goldfield
Average earnings in Goldfield are $63,077 for men and $38,125 for women, a difference of 39.6%. Men with an educational attainment of bachelor's degree enjoy the highest average annual earnings of $70,357, while those with college or associate's degree education earn the least with $62,656. Women with an educational attainment of high school diploma earn the most with the average annual earnings of $60,500, while those with graduate degree education have the smallest earnings of $31,250.
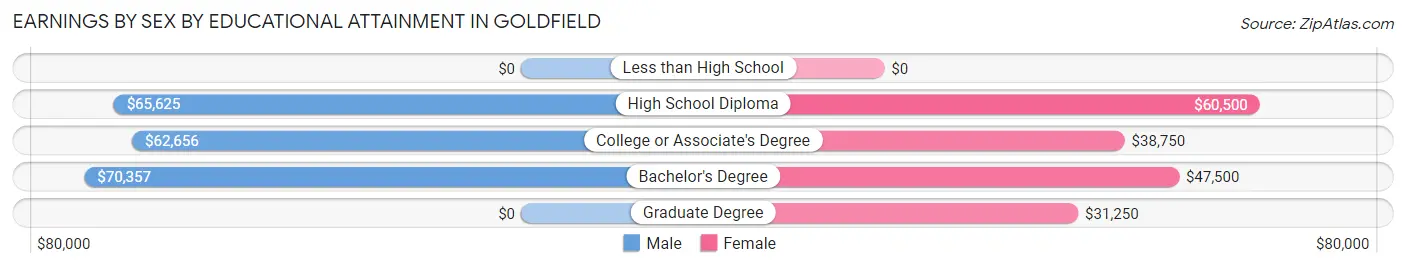
| Educational Attainment | Male Income | Female Income |
| Less than High School | - | - |
| High School Diploma | $65,625 | $60,500 |
| College or Associate's Degree | $62,656 | $38,750 |
| Bachelor's Degree | $70,357 | $47,500 |
| Graduate Degree | - | - |
| Total | $63,077 | $38,125 |
Family Income in Goldfield
Family Income Brackets in Goldfield
According to the Goldfield family income data, there are 50 families falling into the $100,000 to $149,999 income range, which is the most common income bracket and makes up 29.2% of all families. Conversely, the $10,000 to $14,999 income bracket is the least frequent group with only 2 families (1.2%) belonging to this category.
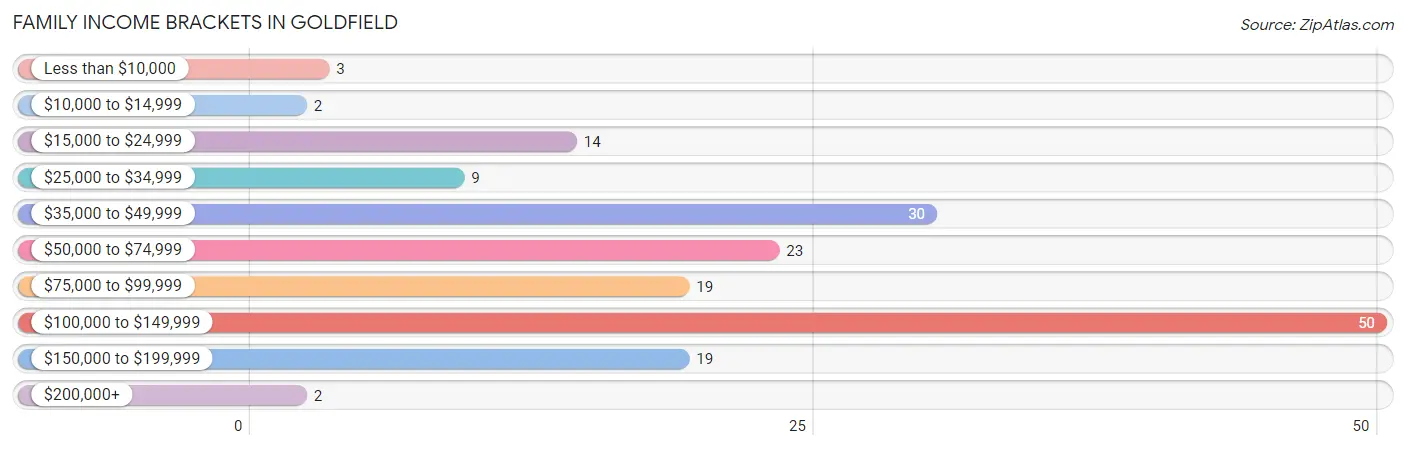
| Income Bracket | # Families | % Families |
| Less than $10,000 | 3 | 1.8% |
| $10,000 to $14,999 | 2 | 1.2% |
| $15,000 to $24,999 | 14 | 8.2% |
| $25,000 to $34,999 | 9 | 5.3% |
| $35,000 to $49,999 | 30 | 17.5% |
| $50,000 to $74,999 | 23 | 13.5% |
| $75,000 to $99,999 | 19 | 11.1% |
| $100,000 to $149,999 | 50 | 29.2% |
| $150,000 to $199,999 | 19 | 11.1% |
| $200,000+ | 2 | 1.2% |
Family Income by Famaliy Size in Goldfield
3-person families (26 | 15.2%) account for the highest median family income in Goldfield with $138,056 per family, while 3-person families (26 | 15.2%) have the highest median income of $46,019 per family member.
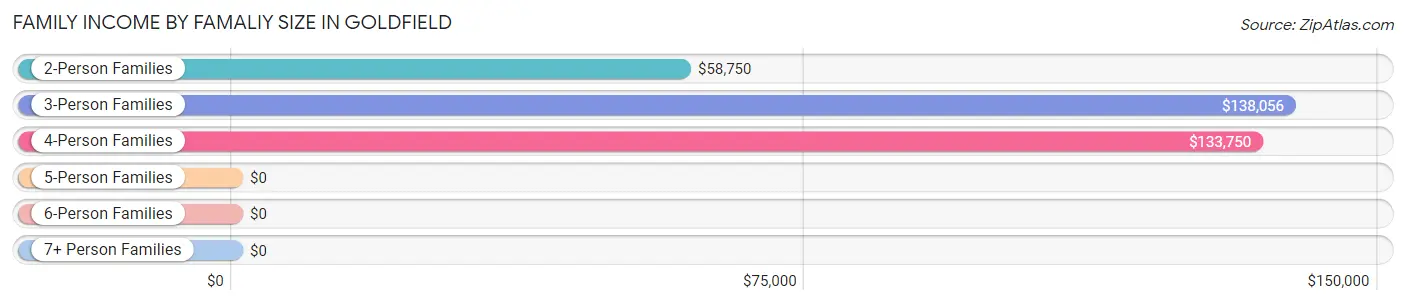
| Income Bracket | # Families | Median Income |
| 2-Person Families | 111 (64.9%) | $58,750 |
| 3-Person Families | 26 (15.2%) | $138,056 |
| 4-Person Families | 16 (9.4%) | $133,750 |
| 5-Person Families | 6 (3.5%) | $0 |
| 6-Person Families | 12 (7.0%) | $0 |
| 7+ Person Families | 0 (0.0%) | $0 |
| Total | 171 (100.0%) | $81,042 |
Family Income by Number of Earners in Goldfield
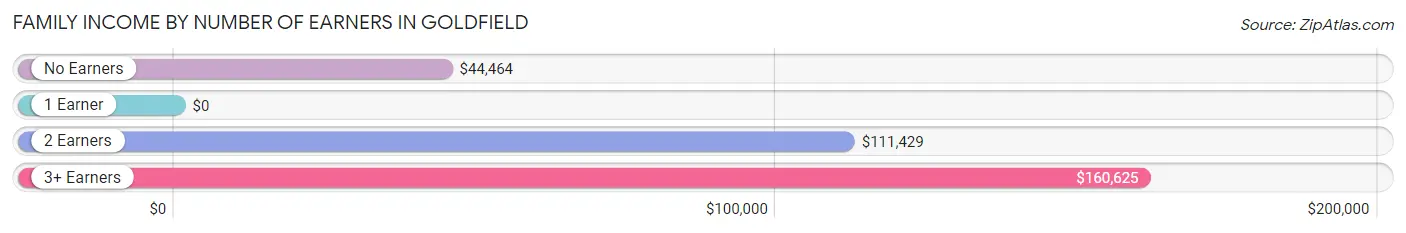
| Number of Earners | # Families | Median Income |
| No Earners | 53 (31.0%) | $44,464 |
| 1 Earner | 33 (19.3%) | $0 |
| 2 Earners | 66 (38.6%) | $111,429 |
| 3+ Earners | 19 (11.1%) | $160,625 |
| Total | 171 (100.0%) | $81,042 |
Household Income in Goldfield
Household Income Brackets in Goldfield
With 71 households falling in the category, the $50,000 to $74,999 income range is the most frequent in Goldfield, accounting for 24.7% of all households. In contrast, only 2 households (0.7%) fall into the $200,000+ income bracket, making it the least populous group.
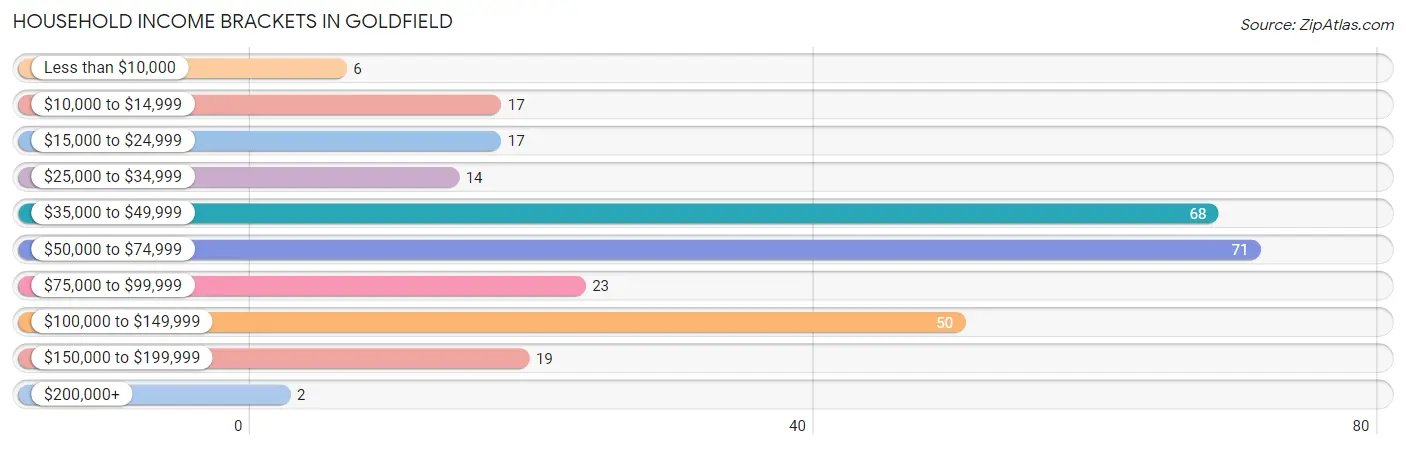
| Income Bracket | # Households | % Households |
| Less than $10,000 | 6 | 2.1% |
| $10,000 to $14,999 | 17 | 5.9% |
| $15,000 to $24,999 | 17 | 5.9% |
| $25,000 to $34,999 | 14 | 4.9% |
| $35,000 to $49,999 | 68 | 23.7% |
| $50,000 to $74,999 | 71 | 24.7% |
| $75,000 to $99,999 | 23 | 8.0% |
| $100,000 to $149,999 | 50 | 17.4% |
| $150,000 to $199,999 | 19 | 6.6% |
| $200,000+ | 2 | 0.7% |
Household Income by Householder Age in Goldfield
The median household income in Goldfield is $57,656, with the highest median household income of $80,625 found in the 45 to 64 years age bracket for the primary householder. A total of 81 households (28.2%) fall into this category. Meanwhile, the 65+ years age bracket for the primary householder has the lowest median household income of $37,279, with 97 households (33.8%) in this group.
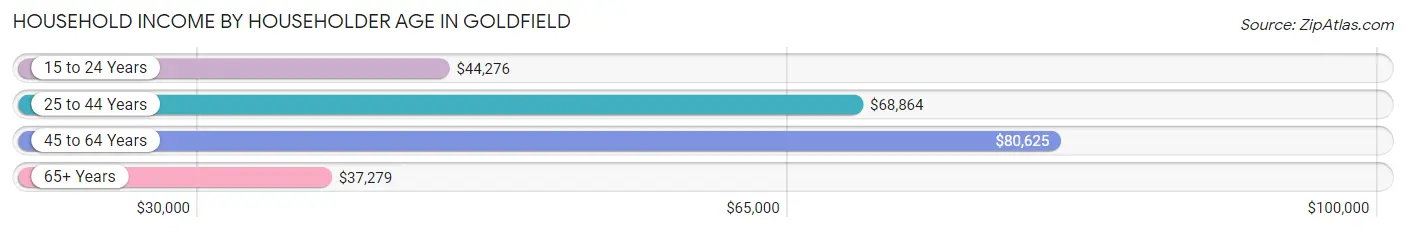
| Income Bracket | # Households | Median Income |
| 15 to 24 Years | 27 (9.4%) | $44,276 |
| 25 to 44 Years | 82 (28.6%) | $68,864 |
| 45 to 64 Years | 81 (28.2%) | $80,625 |
| 65+ Years | 97 (33.8%) | $37,279 |
| Total | 287 (100.0%) | $57,656 |
Poverty in Goldfield
Income Below Poverty by Sex and Age in Goldfield
With 7.1% poverty level for males and 20.9% for females among the residents of Goldfield, 12 to 14 year old males and 18 to 24 year old females are the most vulnerable to poverty, with 3 males (21.4%) and 26 females (48.1%) in their respective age groups living below the poverty level.
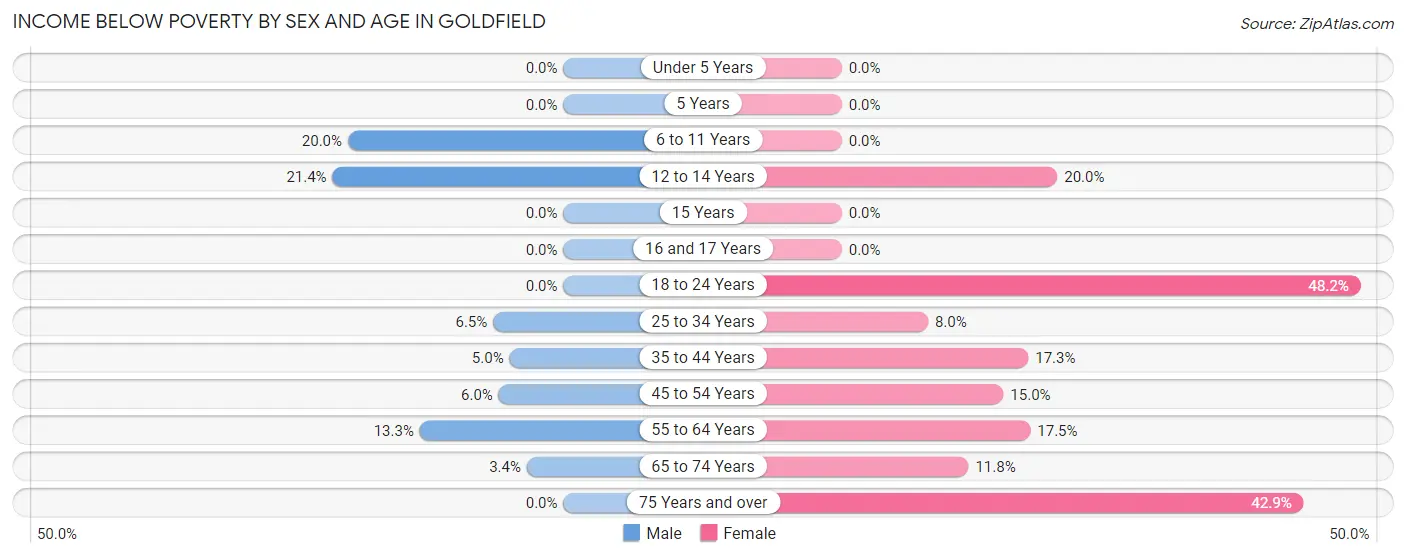
| Age Bracket | Male | Female |
| Under 5 Years | 0 (0.0%) | 0 (0.0%) |
| 5 Years | 0 (0.0%) | 0 (0.0%) |
| 6 to 11 Years | 4 (20.0%) | 0 (0.0%) |
| 12 to 14 Years | 3 (21.4%) | 2 (20.0%) |
| 15 Years | 0 (0.0%) | 0 (0.0%) |
| 16 and 17 Years | 0 (0.0%) | 0 (0.0%) |
| 18 to 24 Years | 0 (0.0%) | 26 (48.1%) |
| 25 to 34 Years | 3 (6.5%) | 2 (8.0%) |
| 35 to 44 Years | 2 (5.0%) | 9 (17.3%) |
| 45 to 54 Years | 3 (6.0%) | 3 (15.0%) |
| 55 to 64 Years | 8 (13.3%) | 7 (17.5%) |
| 65 to 74 Years | 2 (3.4%) | 8 (11.8%) |
| 75 Years and over | 0 (0.0%) | 9 (42.9%) |
| Total | 25 (7.1%) | 66 (20.9%) |
Income Above Poverty by Sex and Age in Goldfield
According to the poverty statistics in Goldfield, males aged under 5 years and females aged under 5 years are the age groups that are most secure financially, with 100.0% of males and 100.0% of females in these age groups living above the poverty line.
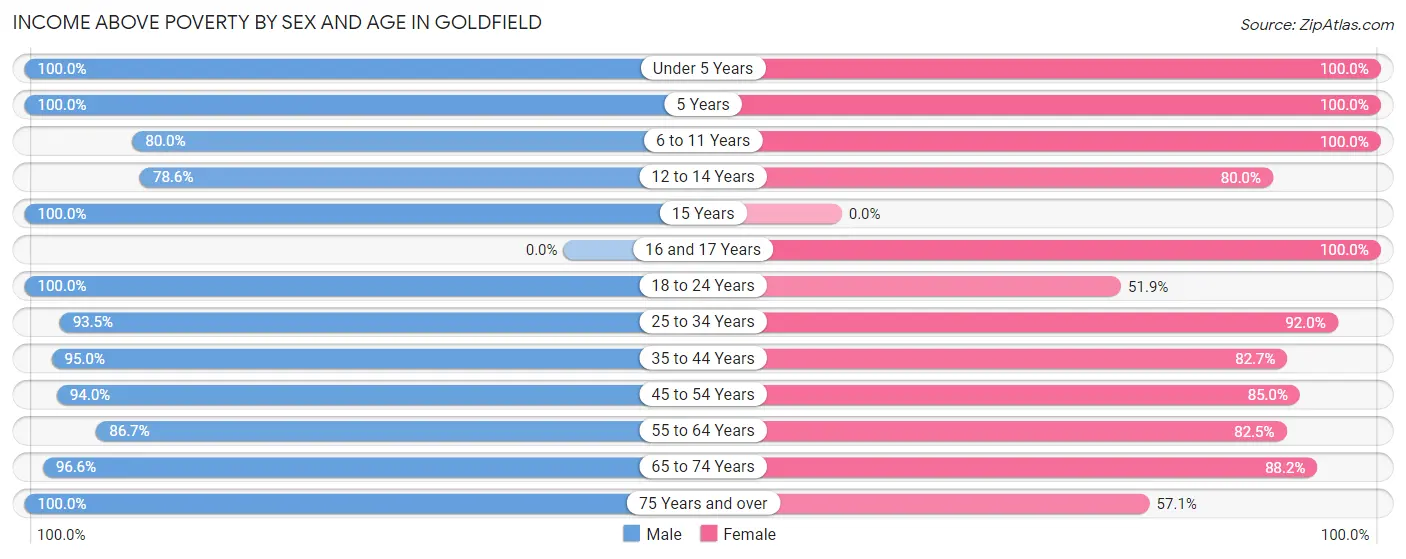
| Age Bracket | Male | Female |
| Under 5 Years | 2 (100.0%) | 9 (100.0%) |
| 5 Years | 1 (100.0%) | 2 (100.0%) |
| 6 to 11 Years | 16 (80.0%) | 9 (100.0%) |
| 12 to 14 Years | 11 (78.6%) | 8 (80.0%) |
| 15 Years | 4 (100.0%) | 0 (0.0%) |
| 16 and 17 Years | 0 (0.0%) | 5 (100.0%) |
| 18 to 24 Years | 45 (100.0%) | 28 (51.8%) |
| 25 to 34 Years | 43 (93.5%) | 23 (92.0%) |
| 35 to 44 Years | 38 (95.0%) | 43 (82.7%) |
| 45 to 54 Years | 47 (94.0%) | 17 (85.0%) |
| 55 to 64 Years | 52 (86.7%) | 33 (82.5%) |
| 65 to 74 Years | 57 (96.6%) | 60 (88.2%) |
| 75 Years and over | 9 (100.0%) | 12 (57.1%) |
| Total | 325 (92.9%) | 249 (79.0%) |
Income Below Poverty Among Married-Couple Families in Goldfield
The poverty statistics for married-couple families in Goldfield show that 4.6% or 7 of the total 152 families live below the poverty line. Families with 1 or 2 children have the highest poverty rate of 15.6%, comprising of 5 families. On the other hand, families with 3 or 4 children have the lowest poverty rate of 0.0%, which includes 0 families.
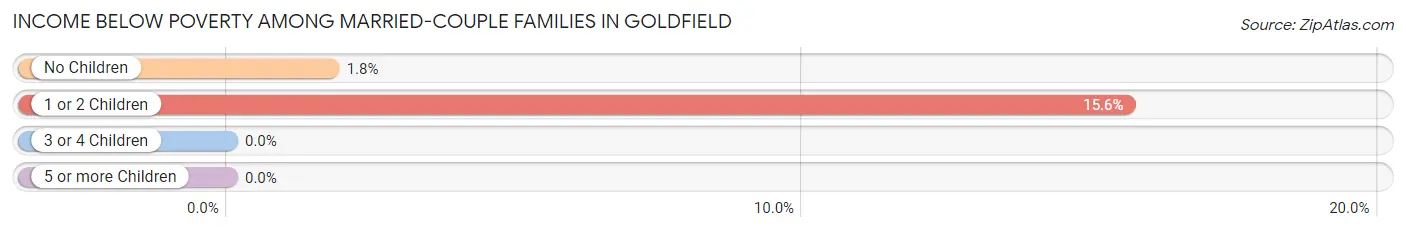
| Children | Above Poverty | Below Poverty |
| No Children | 111 (98.2%) | 2 (1.8%) |
| 1 or 2 Children | 27 (84.4%) | 5 (15.6%) |
| 3 or 4 Children | 7 (100.0%) | 0 (0.0%) |
| 5 or more Children | 0 (0.0%) | 0 (0.0%) |
| Total | 145 (95.4%) | 7 (4.6%) |
Income Below Poverty Among Single-Parent Households in Goldfield
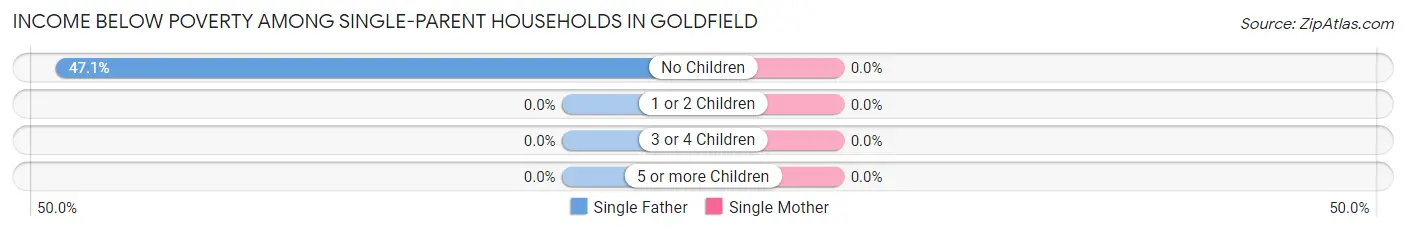
| Children | Single Father | Single Mother |
| No Children | 8 (47.1%) | 0 (0.0%) |
| 1 or 2 Children | 0 (0.0%) | 0 (0.0%) |
| 3 or 4 Children | 0 (0.0%) | 0 (0.0%) |
| 5 or more Children | 0 (0.0%) | 0 (0.0%) |
| Total | 8 (47.1%) | 0 (0.0%) |
Income Below Poverty Among Married-Couple vs Single-Parent Households in Goldfield
The poverty data for Goldfield shows that 7 of the married-couple family households (4.6%) and 8 of the single-parent households (42.1%) are living below the poverty level. Within the married-couple family households, those with 1 or 2 children have the highest poverty rate, with 5 households (15.6%) falling below the poverty line. Among the single-parent households, those with no children have the highest poverty rate, with 8 household (44.4%) living below poverty.
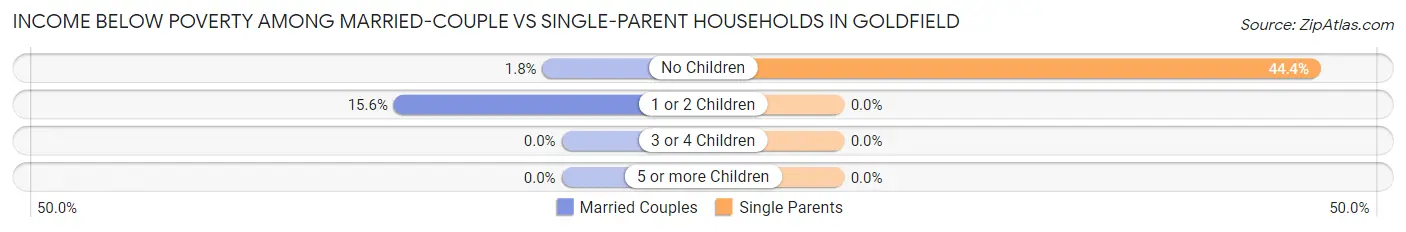
| Children | Married-Couple Families | Single-Parent Households |
| No Children | 2 (1.8%) | 8 (44.4%) |
| 1 or 2 Children | 5 (15.6%) | 0 (0.0%) |
| 3 or 4 Children | 0 (0.0%) | 0 (0.0%) |
| 5 or more Children | 0 (0.0%) | 0 (0.0%) |
| Total | 7 (4.6%) | 8 (42.1%) |
Race in Goldfield
The most populous races in Goldfield are White / Caucasian (629 | 94.6%), Two or more Races (30 | 4.5%), and Hispanic or Latino (13 | 1.9%).
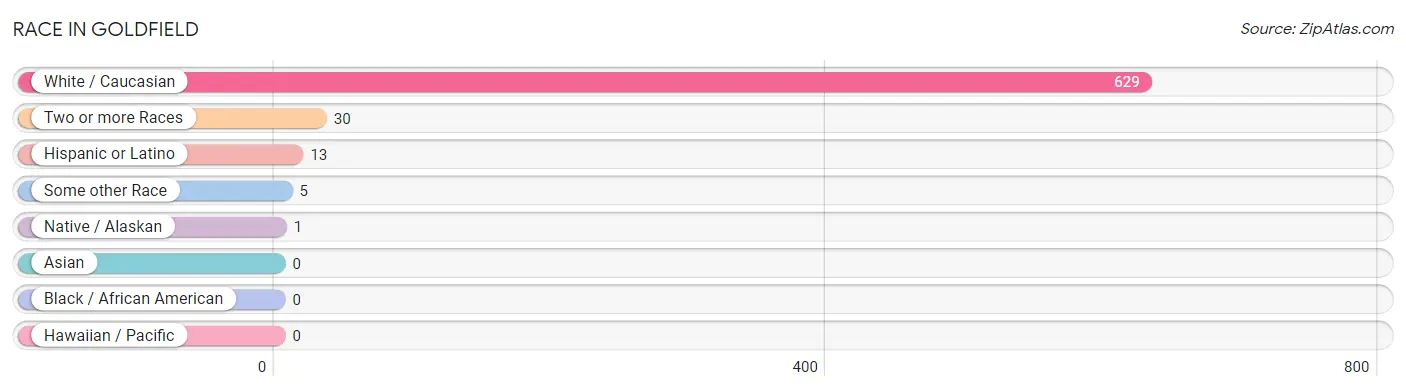
| Race | # Population | % Population |
| Asian | 0 | 0.0% |
| Black / African American | 0 | 0.0% |
| Hawaiian / Pacific | 0 | 0.0% |
| Hispanic or Latino | 13 | 1.9% |
| Native / Alaskan | 1 | 0.2% |
| White / Caucasian | 629 | 94.6% |
| Two or more Races | 30 | 4.5% |
| Some other Race | 5 | 0.7% |
| Total | 665 | 100.0% |
Ancestry in Goldfield
The most populous ancestries reported in Goldfield are German (228 | 34.3%), English (75 | 11.3%), Norwegian (66 | 9.9%), Irish (31 | 4.7%), and Scottish (30 | 4.5%), together accounting for 64.7% of all Goldfield residents.
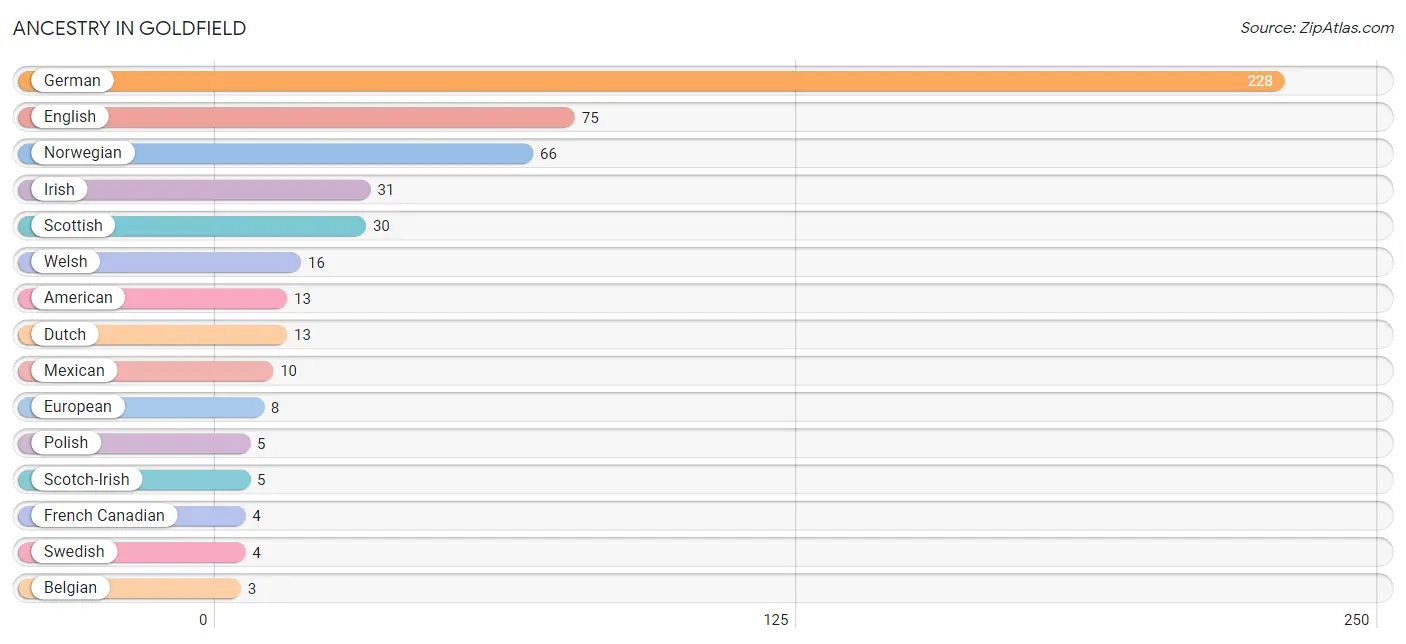
| Ancestry | # Population | % Population |
| American | 13 | 1.9% |
| Apache | 1 | 0.2% |
| Belgian | 3 | 0.4% |
| Czech | 1 | 0.2% |
| Danish | 3 | 0.4% |
| Dutch | 13 | 1.9% |
| English | 75 | 11.3% |
| European | 8 | 1.2% |
| French | 2 | 0.3% |
| French Canadian | 4 | 0.6% |
| German | 228 | 34.3% |
| Greek | 1 | 0.2% |
| Irish | 31 | 4.7% |
| Luxembourger | 2 | 0.3% |
| Mexican | 10 | 1.5% |
| Norwegian | 66 | 9.9% |
| Polish | 5 | 0.7% |
| Puerto Rican | 3 | 0.4% |
| Scandinavian | 2 | 0.3% |
| Scotch-Irish | 5 | 0.7% |
| Scottish | 30 | 4.5% |
| Swedish | 4 | 0.6% |
| Swiss | 2 | 0.3% |
| Welsh | 16 | 2.4% | View All 24 Rows |
Immigrants in Goldfield
The most numerous immigrant groups reported in Goldfield came from Central America (1 | 0.2%), Latin America (1 | 0.2%), and Mexico (1 | 0.2%), together accounting for 0.5% of all Goldfield residents.
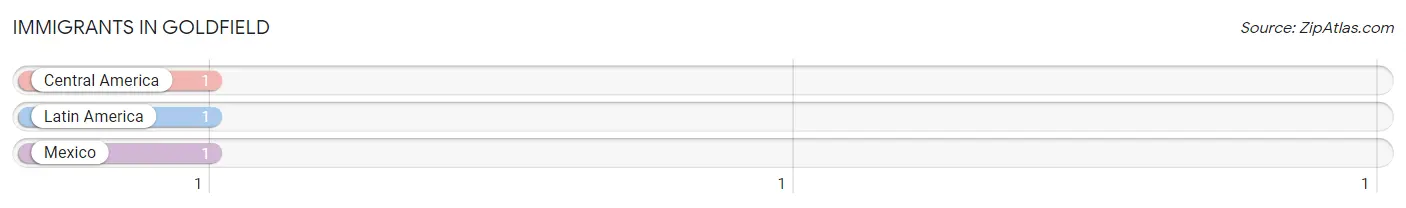
| Immigration Origin | # Population | % Population |
| Central America | 1 | 0.2% |
| Latin America | 1 | 0.2% |
| Mexico | 1 | 0.2% | View All 3 Rows |
Sex and Age in Goldfield
Sex and Age in Goldfield
The most populous age groups in Goldfield are 20 to 24 Years (41 | 11.7%) for men and 65 to 69 Years (38 | 12.1%) for women.
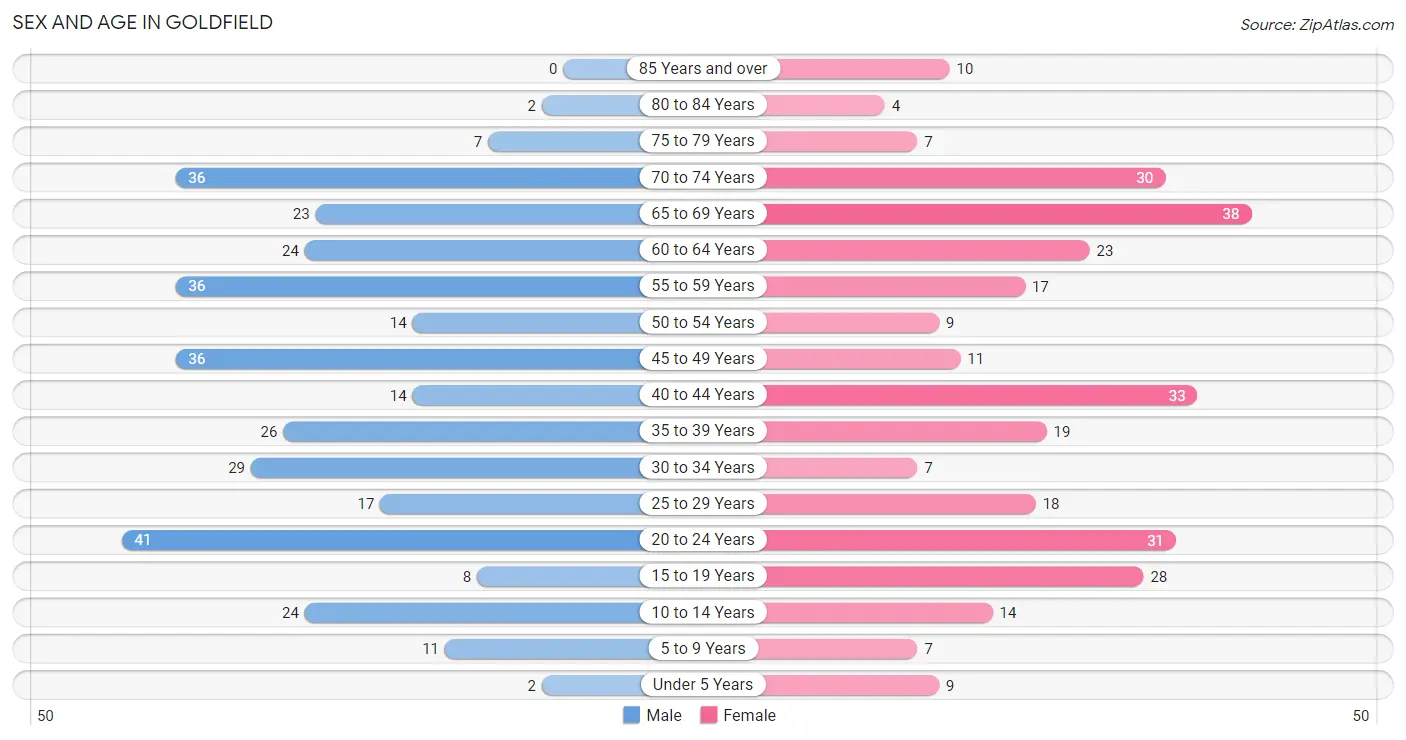
| Age Bracket | Male | Female |
| Under 5 Years | 2 (0.6%) | 9 (2.9%) |
| 5 to 9 Years | 11 (3.1%) | 7 (2.2%) |
| 10 to 14 Years | 24 (6.9%) | 14 (4.4%) |
| 15 to 19 Years | 8 (2.3%) | 28 (8.9%) |
| 20 to 24 Years | 41 (11.7%) | 31 (9.8%) |
| 25 to 29 Years | 17 (4.9%) | 18 (5.7%) |
| 30 to 34 Years | 29 (8.3%) | 7 (2.2%) |
| 35 to 39 Years | 26 (7.4%) | 19 (6.0%) |
| 40 to 44 Years | 14 (4.0%) | 33 (10.5%) |
| 45 to 49 Years | 36 (10.3%) | 11 (3.5%) |
| 50 to 54 Years | 14 (4.0%) | 9 (2.9%) |
| 55 to 59 Years | 36 (10.3%) | 17 (5.4%) |
| 60 to 64 Years | 24 (6.9%) | 23 (7.3%) |
| 65 to 69 Years | 23 (6.6%) | 38 (12.1%) |
| 70 to 74 Years | 36 (10.3%) | 30 (9.5%) |
| 75 to 79 Years | 7 (2.0%) | 7 (2.2%) |
| 80 to 84 Years | 2 (0.6%) | 4 (1.3%) |
| 85 Years and over | 0 (0.0%) | 10 (3.2%) |
| Total | 350 (100.0%) | 315 (100.0%) |
Families and Households in Goldfield
Median Family Size in Goldfield
The median family size in Goldfield is 2.99 persons per family, with married-couple families (152 | 88.9%) accounting for the largest median family size of 3.01 persons per family. On the other hand, single female/mother families (2 | 1.2%) represent the smallest median family size with 2.00 persons per family.
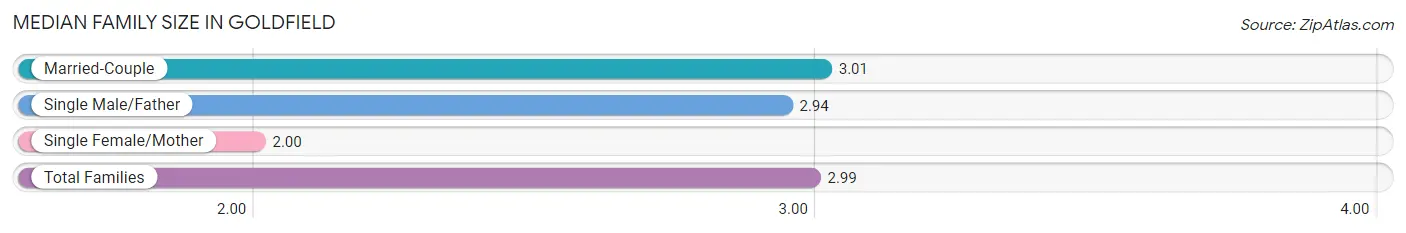
| Family Type | # Families | Family Size |
| Married-Couple | 152 (88.9%) | 3.01 |
| Single Male/Father | 17 (9.9%) | 2.94 |
| Single Female/Mother | 2 (1.2%) | 2.00 |
| Total Families | 171 (100.0%) | 2.99 |
Median Household Size in Goldfield
The median household size in Goldfield is 2.32 persons per household, with married-couple households (152 | 53.0%) accounting for the largest median household size of 3.03 persons per household. non-family households (116 | 40.4%) represent the smallest median household size with 1.29 persons per household.
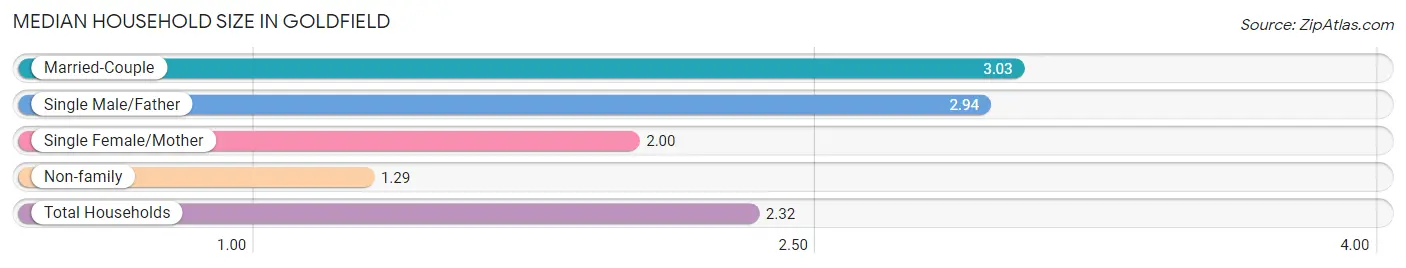
| Household Type | # Households | Household Size |
| Married-Couple | 152 (53.0%) | 3.03 |
| Single Male/Father | 17 (5.9%) | 2.94 |
| Single Female/Mother | 2 (0.7%) | 2.00 |
| Non-family | 116 (40.4%) | 1.29 |
| Total Households | 287 (100.0%) | 2.32 |
Household Size by Marriage Status in Goldfield
Out of a total of 287 households in Goldfield, 171 (59.6%) are family households, while 116 (40.4%) are nonfamily households. The most numerous type of family households are 2-person households, comprising 111, and the most common type of nonfamily households are 1-person households, comprising 80.
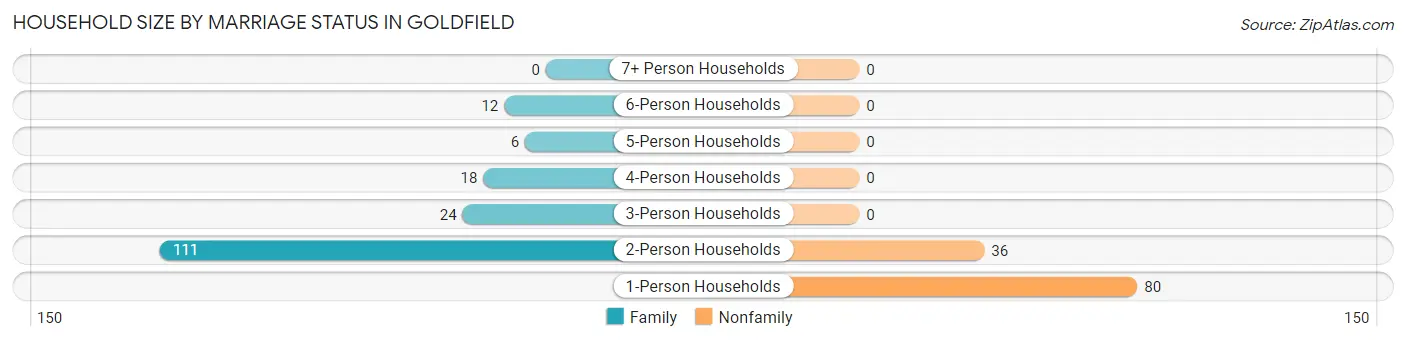
| Household Size | Family Households | Nonfamily Households |
| 1-Person Households | - | 80 (27.9%) |
| 2-Person Households | 111 (38.7%) | 36 (12.5%) |
| 3-Person Households | 24 (8.4%) | 0 (0.0%) |
| 4-Person Households | 18 (6.3%) | 0 (0.0%) |
| 5-Person Households | 6 (2.1%) | 0 (0.0%) |
| 6-Person Households | 12 (4.2%) | 0 (0.0%) |
| 7+ Person Households | 0 (0.0%) | 0 (0.0%) |
| Total | 171 (59.6%) | 116 (40.4%) |
Female Fertility in Goldfield
Fertility by Age in Goldfield
| Age Bracket | Women with Births | Births / 1,000 Women |
| 15 to 19 years | 0 (0.0%) | 0.0 |
| 20 to 34 years | 0 (0.0%) | 0.0 |
| 35 to 50 years | 0 (0.0%) | 0.0 |
| Total | 0 (0.0%) | 0.0 |
Fertility by Age by Marriage Status in Goldfield
| Age Bracket | Married | Unmarried |
| 15 to 19 years | 0 (0.0%) | 0 (0.0%) |
| 20 to 34 years | 0 (0.0%) | 0 (0.0%) |
| 35 to 50 years | 0 (0.0%) | 0 (0.0%) |
| Total | 0 (0.0%) | 0 (0.0%) |
Fertility by Education in Goldfield
| Educational Attainment | Women with Births | Births / 1,000 Women |
| Less than High School | 0 (0.0%) | 0.0 |
| High School Diploma | 0 (0.0%) | 0.0 |
| College or Associate's Degree | 0 (0.0%) | 0.0 |
| Bachelor's Degree | 0 (0.0%) | 0.0 |
| Graduate Degree | 0 (0.0%) | 0.0 |
| Total | 0 (0.0%) | 0.0 |
Fertility by Education by Marriage Status in Goldfield
| Educational Attainment | Married | Unmarried |
| Less than High School | 0 (0.0%) | 0 (0.0%) |
| High School Diploma | 0 (0.0%) | 0 (0.0%) |
| College or Associate's Degree | 0 (0.0%) | 0 (0.0%) |
| Bachelor's Degree | 0 (0.0%) | 0 (0.0%) |
| Graduate Degree | 0 (0.0%) | 0 (0.0%) |
| Total | 0 (0.0%) | 0 (0.0%) |
Employment Characteristics in Goldfield
Employment by Class of Employer in Goldfield
Among the 336 employed individuals in Goldfield, private company employees (250 | 74.4%), local government employees (22 | 6.6%), and self-employed (not incorporated) (21 | 6.2%) make up the most common classes of employment.
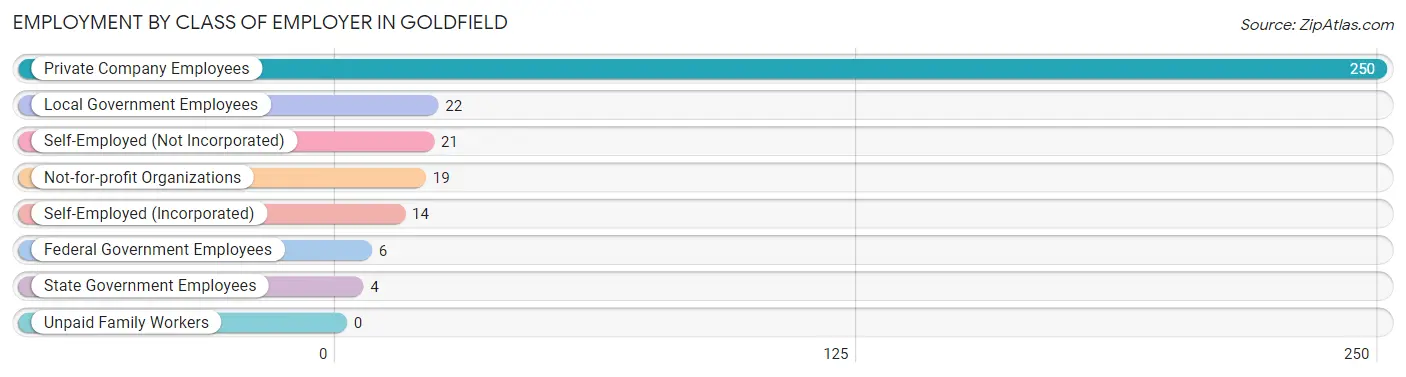
| Employer Class | # Employees | % Employees |
| Private Company Employees | 250 | 74.4% |
| Self-Employed (Incorporated) | 14 | 4.2% |
| Self-Employed (Not Incorporated) | 21 | 6.2% |
| Not-for-profit Organizations | 19 | 5.7% |
| Local Government Employees | 22 | 6.6% |
| State Government Employees | 4 | 1.2% |
| Federal Government Employees | 6 | 1.8% |
| Unpaid Family Workers | 0 | 0.0% |
| Total | 336 | 100.0% |
Employment Status by Age in Goldfield
According to the labor force statistics for Goldfield, out of the total population over 16 years of age (594), 57.4% or 341 individuals are in the labor force, with 1.5% or 5 of them unemployed. The age group with the highest labor force participation rate is 20 to 24 years, with 100.0% or 72 individuals in the labor force. Within the labor force, the 45 to 54 years age range has the highest percentage of unemployed individuals, with 8.6% or 5 of them being unemployed.
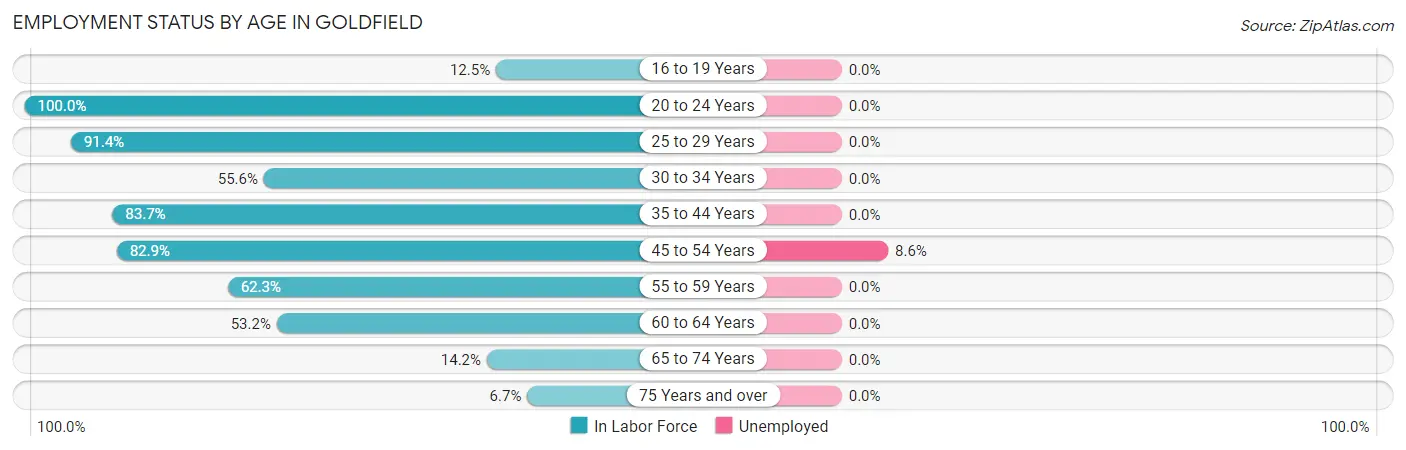
| Age Bracket | In Labor Force | Unemployed |
| 16 to 19 Years | 4 (12.5%) | 0 (0.0%) |
| 20 to 24 Years | 72 (100.0%) | 0 (0.0%) |
| 25 to 29 Years | 32 (91.4%) | 0 (0.0%) |
| 30 to 34 Years | 20 (55.6%) | 0 (0.0%) |
| 35 to 44 Years | 77 (83.7%) | 0 (0.0%) |
| 45 to 54 Years | 58 (82.9%) | 5 (8.6%) |
| 55 to 59 Years | 33 (62.3%) | 0 (0.0%) |
| 60 to 64 Years | 25 (53.2%) | 0 (0.0%) |
| 65 to 74 Years | 18 (14.2%) | 0 (0.0%) |
| 75 Years and over | 2 (6.7%) | 0 (0.0%) |
| Total | 341 (57.4%) | 5 (1.5%) |
Employment Status by Educational Attainment in Goldfield
According to labor force statistics for Goldfield, 73.6% of individuals (245) out of the total population between 25 and 64 years of age (333) are in the labor force, with 2.0% or 5 of them being unemployed. The group with the highest labor force participation rate are those with the educational attainment of college / associate degree, with 82.4% or 117 individuals in the labor force. Within the labor force, individuals with high school diploma education have the highest percentage of unemployment, with 7.4% or 5 of them being unemployed.
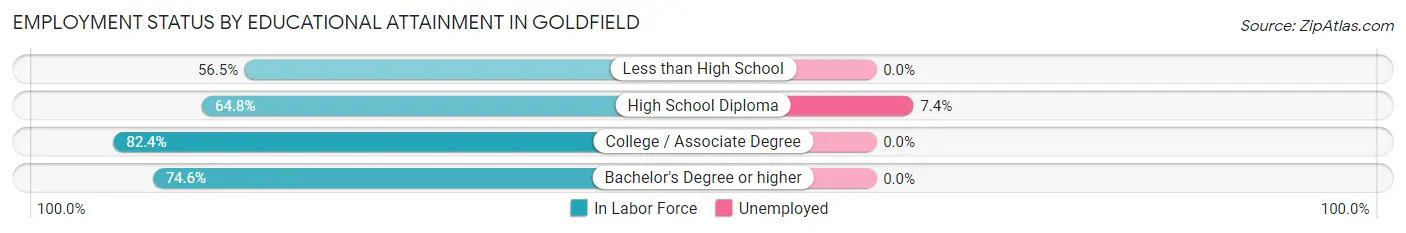
| Educational Attainment | In Labor Force | Unemployed |
| Less than High School | 13 (56.5%) | 0 (0.0%) |
| High School Diploma | 68 (64.8%) | 8 (7.4%) |
| College / Associate Degree | 117 (82.4%) | 0 (0.0%) |
| Bachelor's Degree or higher | 47 (74.6%) | 0 (0.0%) |
| Total | 245 (73.6%) | 7 (2.0%) |
Employment Occupations by Sex in Goldfield
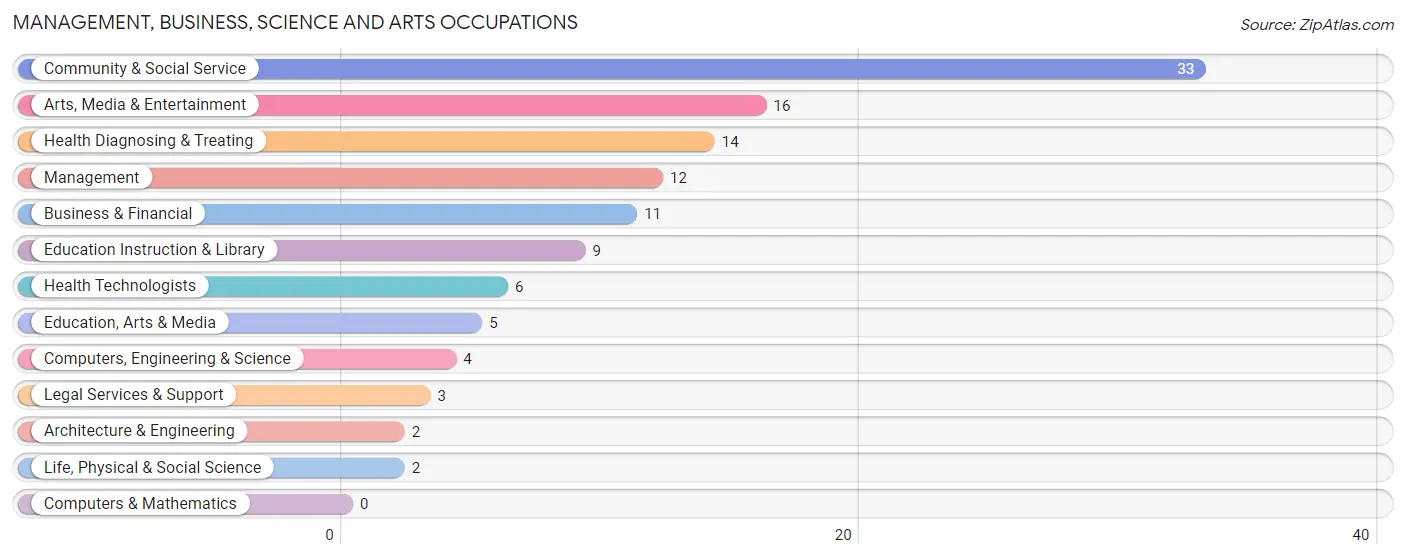
Management, Business, Science and Arts Occupations
The most common Management, Business, Science and Arts occupations in Goldfield are Community & Social Service (33 | 9.8%), Arts, Media & Entertainment (16 | 4.8%), Health Diagnosing & Treating (14 | 4.2%), Management (12 | 3.6%), and Business & Financial (11 | 3.3%).
Management, Business, Science and Arts Occupations by Sex
Within the Management, Business, Science and Arts occupations in Goldfield, the most male-oriented occupations are Computers, Engineering & Science (100.0%), Architecture & Engineering (100.0%), and Life, Physical & Social Science (100.0%), while the most female-oriented occupations are Education, Arts & Media (100.0%), Business & Financial (90.9%), and Health Diagnosing & Treating (78.6%).
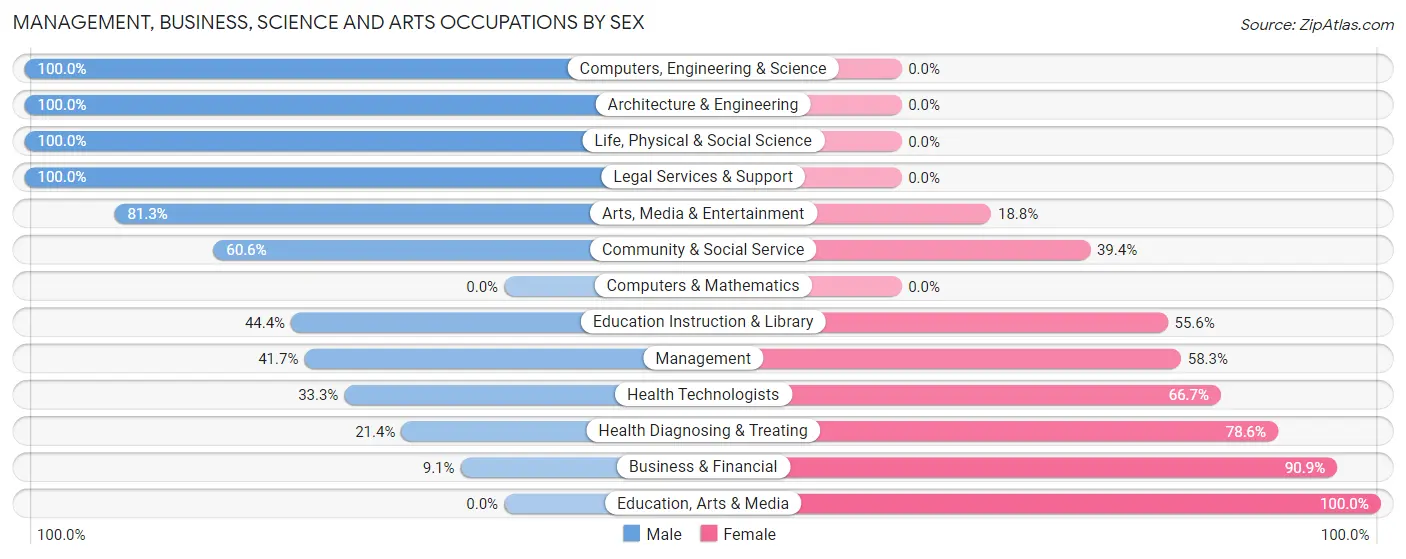
| Occupation | Male | Female |
| Management | 5 (41.7%) | 7 (58.3%) |
| Business & Financial | 1 (9.1%) | 10 (90.9%) |
| Computers, Engineering & Science | 4 (100.0%) | 0 (0.0%) |
| Computers & Mathematics | 0 (0.0%) | 0 (0.0%) |
| Architecture & Engineering | 2 (100.0%) | 0 (0.0%) |
| Life, Physical & Social Science | 2 (100.0%) | 0 (0.0%) |
| Community & Social Service | 20 (60.6%) | 13 (39.4%) |
| Education, Arts & Media | 0 (0.0%) | 5 (100.0%) |
| Legal Services & Support | 3 (100.0%) | 0 (0.0%) |
| Education Instruction & Library | 4 (44.4%) | 5 (55.6%) |
| Arts, Media & Entertainment | 13 (81.2%) | 3 (18.8%) |
| Health Diagnosing & Treating | 3 (21.4%) | 11 (78.6%) |
| Health Technologists | 2 (33.3%) | 4 (66.7%) |
| Total (Category) | 33 (44.6%) | 41 (55.4%) |
| Total (Overall) | 212 (63.1%) | 124 (36.9%) |
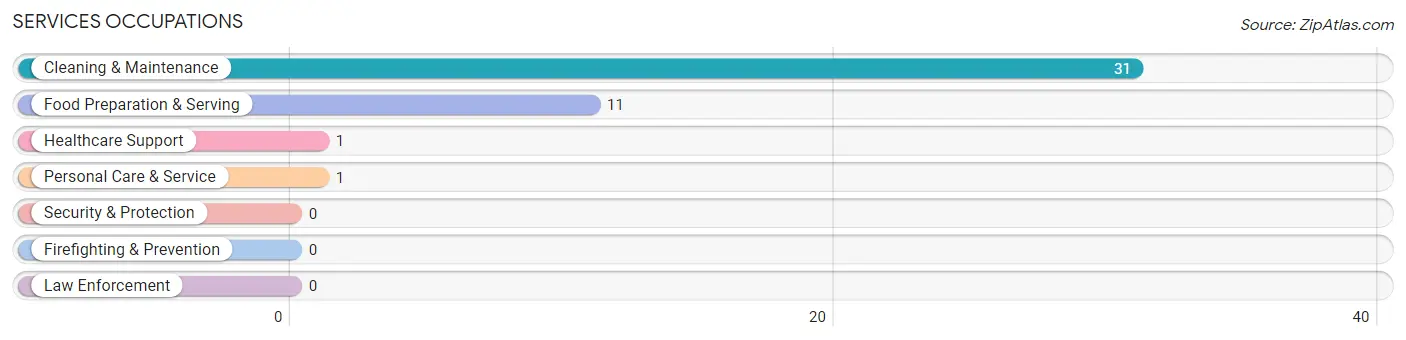
Services Occupations
The most common Services occupations in Goldfield are Cleaning & Maintenance (31 | 9.2%), Food Preparation & Serving (11 | 3.3%), Healthcare Support (1 | 0.3%), and Personal Care & Service (1 | 0.3%).
Services Occupations by Sex
Within the Services occupations in Goldfield, the most male-oriented occupations are Food Preparation & Serving (100.0%), Personal Care & Service (100.0%), and Cleaning & Maintenance (38.7%), while the most female-oriented occupations are Healthcare Support (100.0%), and Cleaning & Maintenance (61.3%).
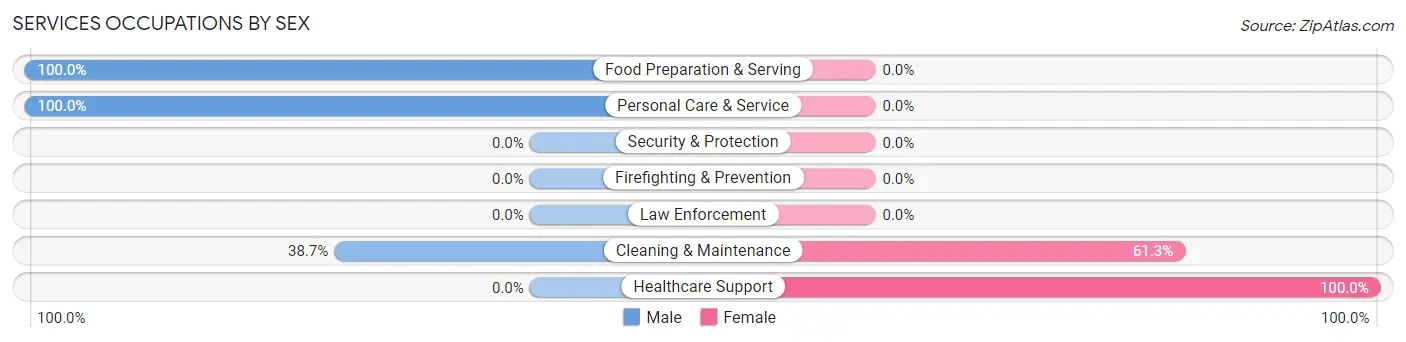
| Occupation | Male | Female |
| Healthcare Support | 0 (0.0%) | 1 (100.0%) |
| Security & Protection | 0 (0.0%) | 0 (0.0%) |
| Firefighting & Prevention | 0 (0.0%) | 0 (0.0%) |
| Law Enforcement | 0 (0.0%) | 0 (0.0%) |
| Food Preparation & Serving | 11 (100.0%) | 0 (0.0%) |
| Cleaning & Maintenance | 12 (38.7%) | 19 (61.3%) |
| Personal Care & Service | 1 (100.0%) | 0 (0.0%) |
| Total (Category) | 24 (54.5%) | 20 (45.5%) |
| Total (Overall) | 212 (63.1%) | 124 (36.9%) |
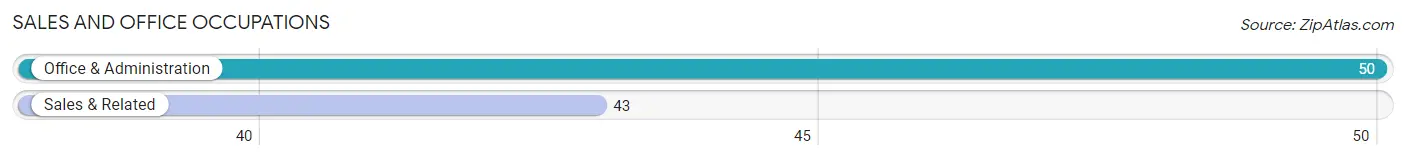
Sales and Office Occupations
The most common Sales and Office occupations in Goldfield are Office & Administration (50 | 14.9%), and Sales & Related (43 | 12.8%).
Sales and Office Occupations by Sex
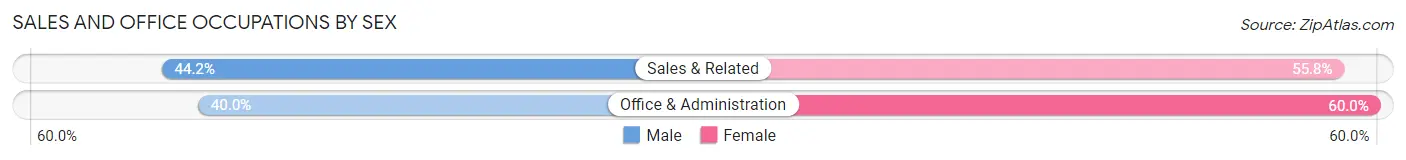
| Occupation | Male | Female |
| Sales & Related | 19 (44.2%) | 24 (55.8%) |
| Office & Administration | 20 (40.0%) | 30 (60.0%) |
| Total (Category) | 39 (41.9%) | 54 (58.1%) |
| Total (Overall) | 212 (63.1%) | 124 (36.9%) |
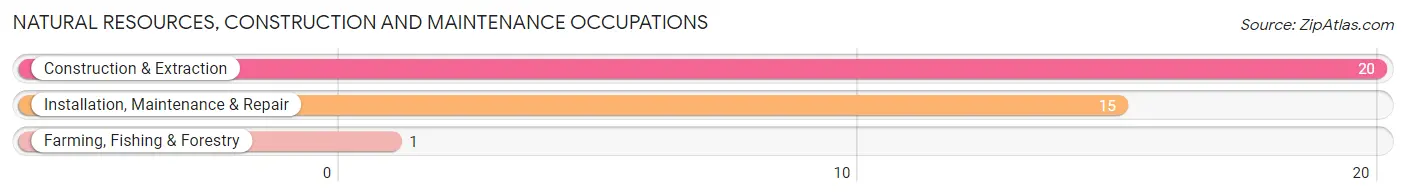
Natural Resources, Construction and Maintenance Occupations
The most common Natural Resources, Construction and Maintenance occupations in Goldfield are Construction & Extraction (20 | 5.9%), Installation, Maintenance & Repair (15 | 4.5%), and Farming, Fishing & Forestry (1 | 0.3%).
Natural Resources, Construction and Maintenance Occupations by Sex
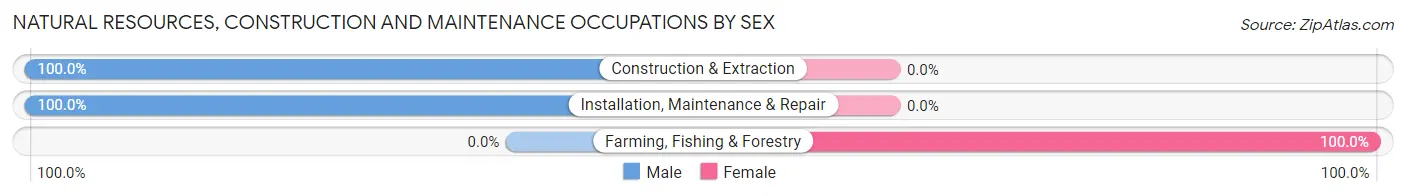
| Occupation | Male | Female |
| Farming, Fishing & Forestry | 0 (0.0%) | 1 (100.0%) |
| Construction & Extraction | 20 (100.0%) | 0 (0.0%) |
| Installation, Maintenance & Repair | 15 (100.0%) | 0 (0.0%) |
| Total (Category) | 35 (97.2%) | 1 (2.8%) |
| Total (Overall) | 212 (63.1%) | 124 (36.9%) |
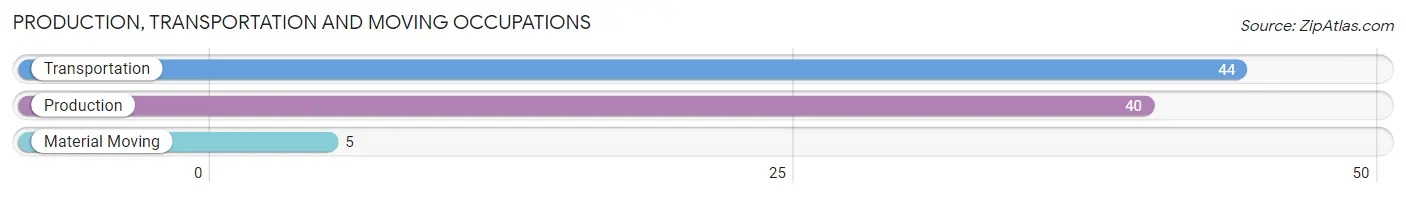
Production, Transportation and Moving Occupations
The most common Production, Transportation and Moving occupations in Goldfield are Transportation (44 | 13.1%), Production (40 | 11.9%), and Material Moving (5 | 1.5%).
Production, Transportation and Moving Occupations by Sex
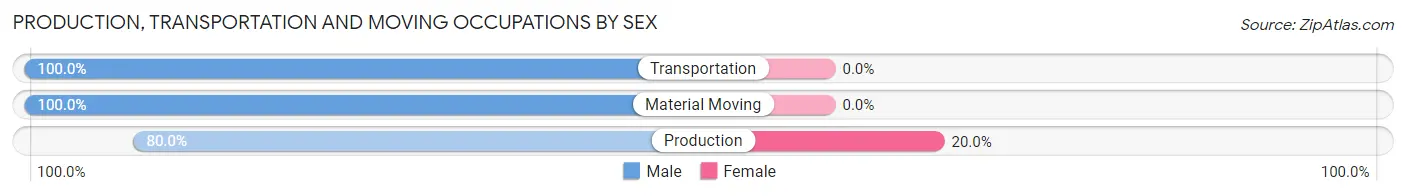
| Occupation | Male | Female |
| Production | 32 (80.0%) | 8 (20.0%) |
| Transportation | 44 (100.0%) | 0 (0.0%) |
| Material Moving | 5 (100.0%) | 0 (0.0%) |
| Total (Category) | 81 (91.0%) | 8 (9.0%) |
| Total (Overall) | 212 (63.1%) | 124 (36.9%) |
Employment Industries by Sex in Goldfield
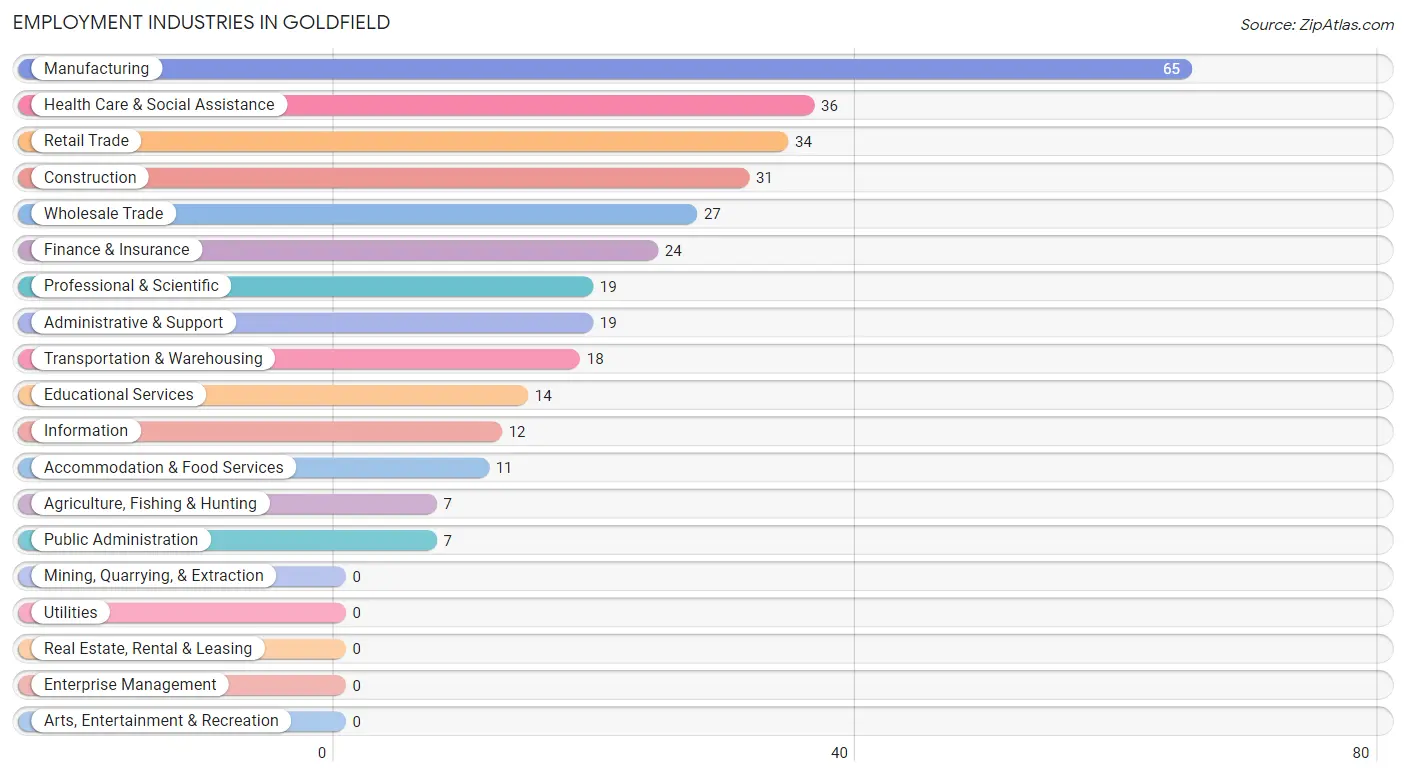
Employment Industries in Goldfield
The major employment industries in Goldfield include Manufacturing (65 | 19.4%), Health Care & Social Assistance (36 | 10.7%), Retail Trade (34 | 10.1%), Construction (31 | 9.2%), and Wholesale Trade (27 | 8.0%).
Employment Industries by Sex in Goldfield
The Goldfield industries that see more men than women are Construction (100.0%), Administrative & Support (100.0%), and Accommodation & Food Services (100.0%), whereas the industries that tend to have a higher number of women are Health Care & Social Assistance (94.4%), Public Administration (85.7%), and Finance & Insurance (75.0%).
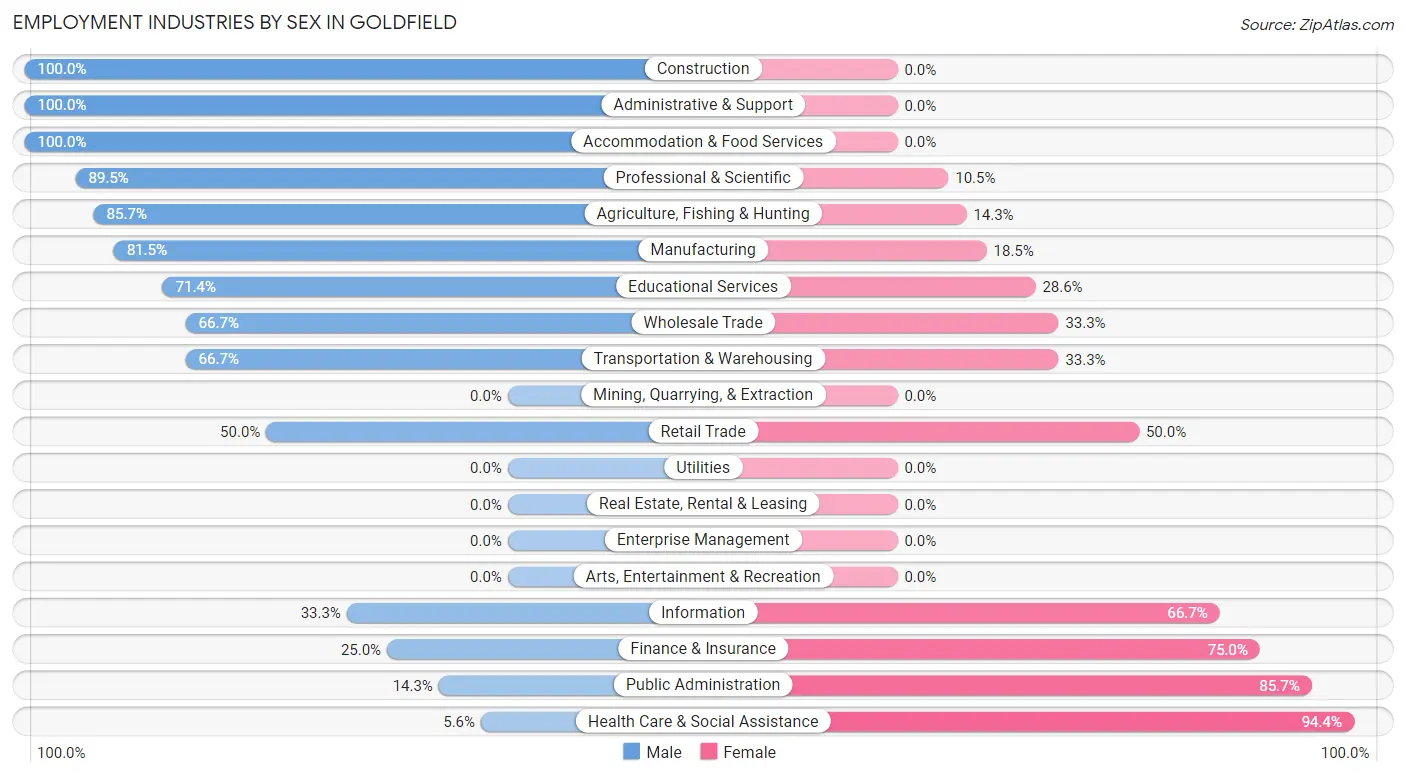
| Industry | Male | Female |
| Agriculture, Fishing & Hunting | 6 (85.7%) | 1 (14.3%) |
| Mining, Quarrying, & Extraction | 0 (0.0%) | 0 (0.0%) |
| Construction | 31 (100.0%) | 0 (0.0%) |
| Manufacturing | 53 (81.5%) | 12 (18.5%) |
| Wholesale Trade | 18 (66.7%) | 9 (33.3%) |
| Retail Trade | 17 (50.0%) | 17 (50.0%) |
| Transportation & Warehousing | 12 (66.7%) | 6 (33.3%) |
| Utilities | 0 (0.0%) | 0 (0.0%) |
| Information | 4 (33.3%) | 8 (66.7%) |
| Finance & Insurance | 6 (25.0%) | 18 (75.0%) |
| Real Estate, Rental & Leasing | 0 (0.0%) | 0 (0.0%) |
| Professional & Scientific | 17 (89.5%) | 2 (10.5%) |
| Enterprise Management | 0 (0.0%) | 0 (0.0%) |
| Administrative & Support | 19 (100.0%) | 0 (0.0%) |
| Educational Services | 10 (71.4%) | 4 (28.6%) |
| Health Care & Social Assistance | 2 (5.6%) | 34 (94.4%) |
| Arts, Entertainment & Recreation | 0 (0.0%) | 0 (0.0%) |
| Accommodation & Food Services | 11 (100.0%) | 0 (0.0%) |
| Public Administration | 1 (14.3%) | 6 (85.7%) |
| Total | 212 (63.1%) | 124 (36.9%) |
Education in Goldfield
School Enrollment in Goldfield
The most common levels of schooling among the 96 students in Goldfield are middle school (34 | 35.4%), high school (32 | 33.3%), and elementary school (19 | 19.8%).
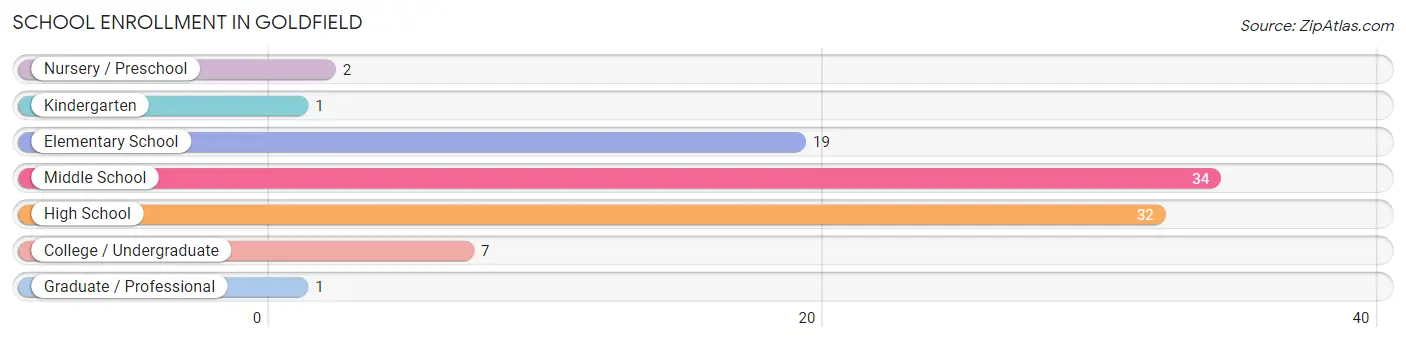
| School Level | # Students | % Students |
| Nursery / Preschool | 2 | 2.1% |
| Kindergarten | 1 | 1.0% |
| Elementary School | 19 | 19.8% |
| Middle School | 34 | 35.4% |
| High School | 32 | 33.3% |
| College / Undergraduate | 7 | 7.3% |
| Graduate / Professional | 1 | 1.0% |
| Total | 96 | 100.0% |
School Enrollment by Age by Funding Source in Goldfield
Out of a total of 96 students who are enrolled in schools in Goldfield, 7 (7.3%) attend a private institution, while the remaining 89 (92.7%) are enrolled in public schools. The age group of 5 to 9 year old has the highest likelihood of being enrolled in private schools, with 6 (37.5% in the age bracket) enrolled. Conversely, the age group of 3 to 4 year olds has the lowest likelihood of being enrolled in a private school, with 2 (100.0% in the age bracket) attending a public institution.
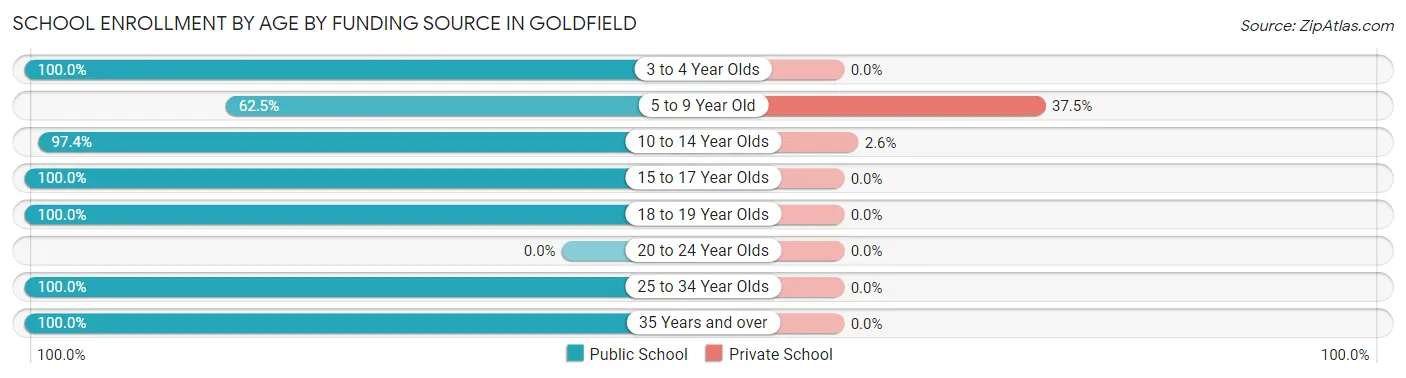
| Age Bracket | Public School | Private School |
| 3 to 4 Year Olds | 2 (100.0%) | 0 (0.0%) |
| 5 to 9 Year Old | 10 (62.5%) | 6 (37.5%) |
| 10 to 14 Year Olds | 37 (97.4%) | 1 (2.6%) |
| 15 to 17 Year Olds | 9 (100.0%) | 0 (0.0%) |
| 18 to 19 Year Olds | 23 (100.0%) | 0 (0.0%) |
| 20 to 24 Year Olds | 0 (0.0%) | 0 (0.0%) |
| 25 to 34 Year Olds | 2 (100.0%) | 0 (0.0%) |
| 35 Years and over | 6 (100.0%) | 0 (0.0%) |
| Total | 89 (92.7%) | 7 (7.3%) |
Educational Attainment by Field of Study in Goldfield
Business (35 | 41.7%), education (17 | 20.2%), literature & languages (7 | 8.3%), arts & humanities (7 | 8.3%), and liberal arts & history (6 | 7.1%) are the most common fields of study among 84 individuals in Goldfield who have obtained a bachelor's degree or higher.
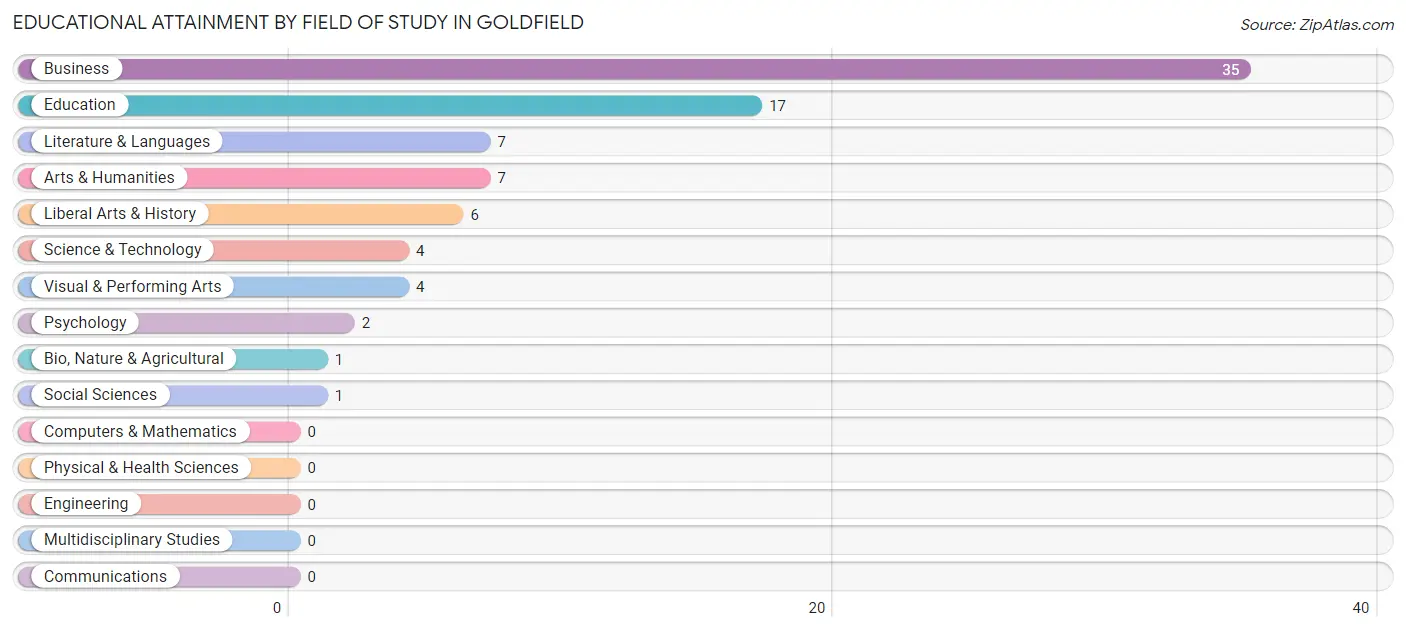
| Field of Study | # Graduates | % Graduates |
| Computers & Mathematics | 0 | 0.0% |
| Bio, Nature & Agricultural | 1 | 1.2% |
| Physical & Health Sciences | 0 | 0.0% |
| Psychology | 2 | 2.4% |
| Social Sciences | 1 | 1.2% |
| Engineering | 0 | 0.0% |
| Multidisciplinary Studies | 0 | 0.0% |
| Science & Technology | 4 | 4.8% |
| Business | 35 | 41.7% |
| Education | 17 | 20.2% |
| Literature & Languages | 7 | 8.3% |
| Liberal Arts & History | 6 | 7.1% |
| Visual & Performing Arts | 4 | 4.8% |
| Communications | 0 | 0.0% |
| Arts & Humanities | 7 | 8.3% |
| Total | 84 | 100.0% |
Transportation & Commute in Goldfield
Vehicle Availability by Sex in Goldfield
The most prevalent vehicle ownership categories in Goldfield are males with 2 vehicles (113, accounting for 53.3%) and females with 2 vehicles (84, making up 91.1%).
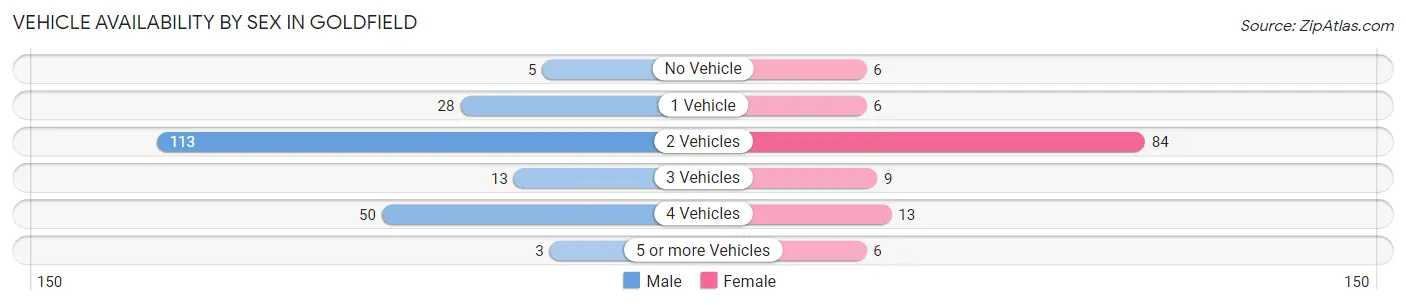
| Vehicles Available | Male | Female |
| No Vehicle | 5 (2.4%) | 6 (4.8%) |
| 1 Vehicle | 28 (13.2%) | 6 (4.8%) |
| 2 Vehicles | 113 (53.3%) | 84 (67.7%) |
| 3 Vehicles | 13 (6.1%) | 9 (7.3%) |
| 4 Vehicles | 50 (23.6%) | 13 (10.5%) |
| 5 or more Vehicles | 3 (1.4%) | 6 (4.8%) |
| Total | 212 (100.0%) | 124 (100.0%) |
Commute Time in Goldfield
The most frequently occuring commute durations in Goldfield are 10 to 14 minutes (84 commuters, 26.1%), 15 to 19 minutes (69 commuters, 21.4%), and less than 5 minutes (65 commuters, 20.2%).
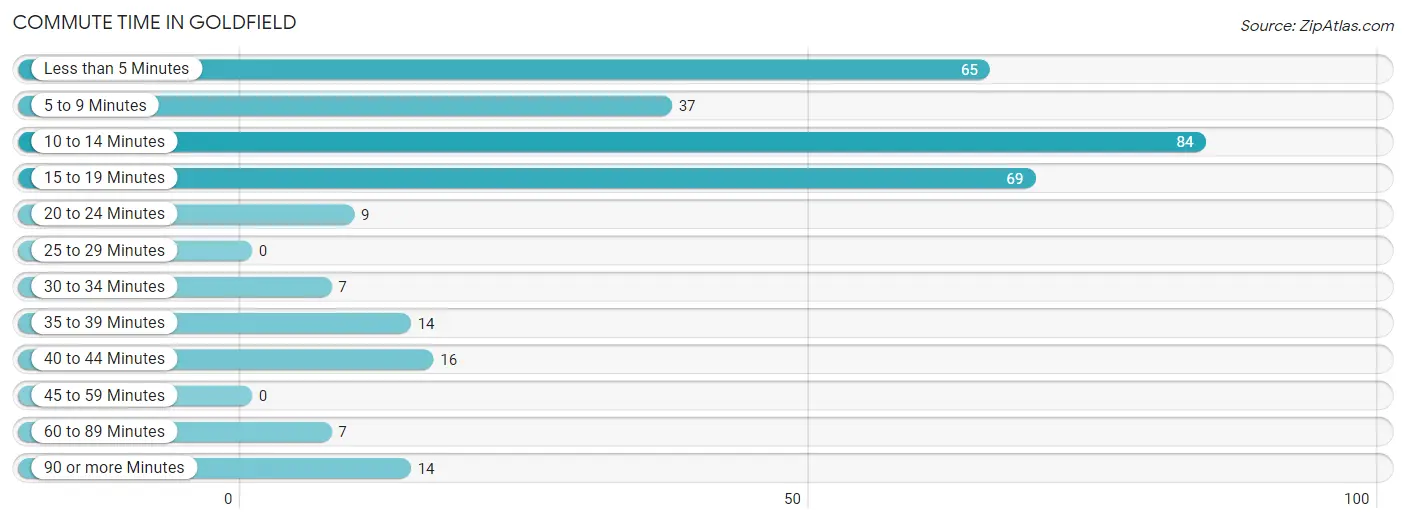
| Commute Time | # Commuters | % Commuters |
| Less than 5 Minutes | 65 | 20.2% |
| 5 to 9 Minutes | 37 | 11.5% |
| 10 to 14 Minutes | 84 | 26.1% |
| 15 to 19 Minutes | 69 | 21.4% |
| 20 to 24 Minutes | 9 | 2.8% |
| 25 to 29 Minutes | 0 | 0.0% |
| 30 to 34 Minutes | 7 | 2.2% |
| 35 to 39 Minutes | 14 | 4.3% |
| 40 to 44 Minutes | 16 | 5.0% |
| 45 to 59 Minutes | 0 | 0.0% |
| 60 to 89 Minutes | 7 | 2.2% |
| 90 or more Minutes | 14 | 4.3% |
Commute Time by Sex in Goldfield
The most common commute times in Goldfield are 10 to 14 minutes (51 commuters, 25.6%) for males and 10 to 14 minutes (33 commuters, 26.8%) for females.
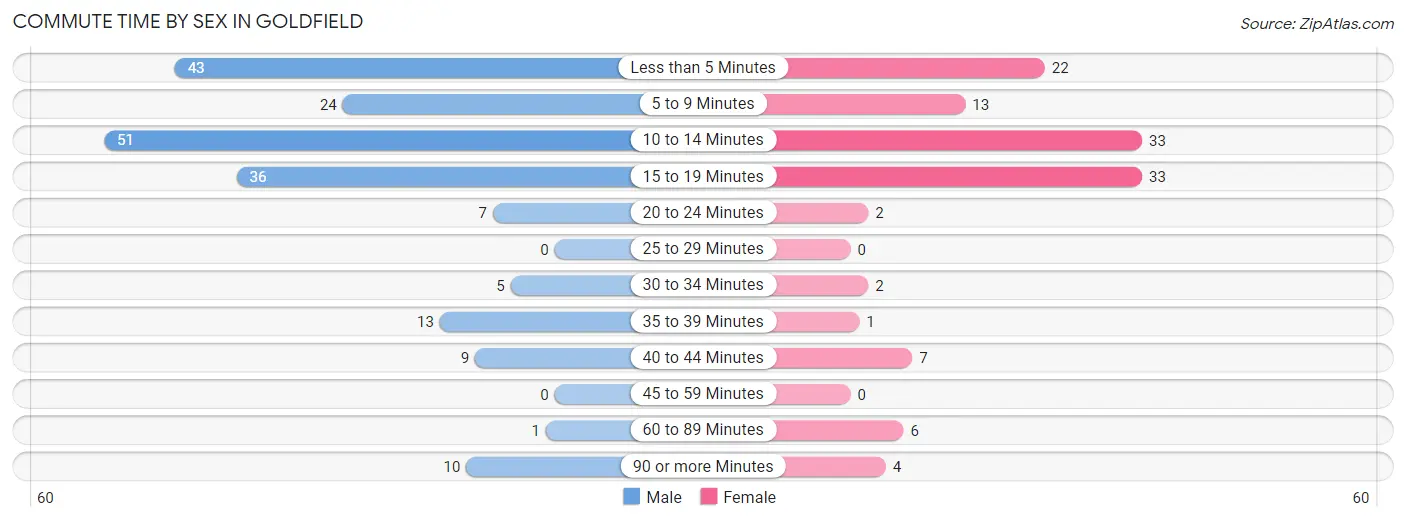
| Commute Time | Male | Female |
| Less than 5 Minutes | 43 (21.6%) | 22 (17.9%) |
| 5 to 9 Minutes | 24 (12.1%) | 13 (10.6%) |
| 10 to 14 Minutes | 51 (25.6%) | 33 (26.8%) |
| 15 to 19 Minutes | 36 (18.1%) | 33 (26.8%) |
| 20 to 24 Minutes | 7 (3.5%) | 2 (1.6%) |
| 25 to 29 Minutes | 0 (0.0%) | 0 (0.0%) |
| 30 to 34 Minutes | 5 (2.5%) | 2 (1.6%) |
| 35 to 39 Minutes | 13 (6.5%) | 1 (0.8%) |
| 40 to 44 Minutes | 9 (4.5%) | 7 (5.7%) |
| 45 to 59 Minutes | 0 (0.0%) | 0 (0.0%) |
| 60 to 89 Minutes | 1 (0.5%) | 6 (4.9%) |
| 90 or more Minutes | 10 (5.0%) | 4 (3.3%) |
Time of Departure to Work by Sex in Goldfield
The most frequent times of departure to work in Goldfield are 6:30 AM to 6:59 AM (52, 26.1%) for males and 12:00 PM to 3:59 PM (27, 22.0%) for females.
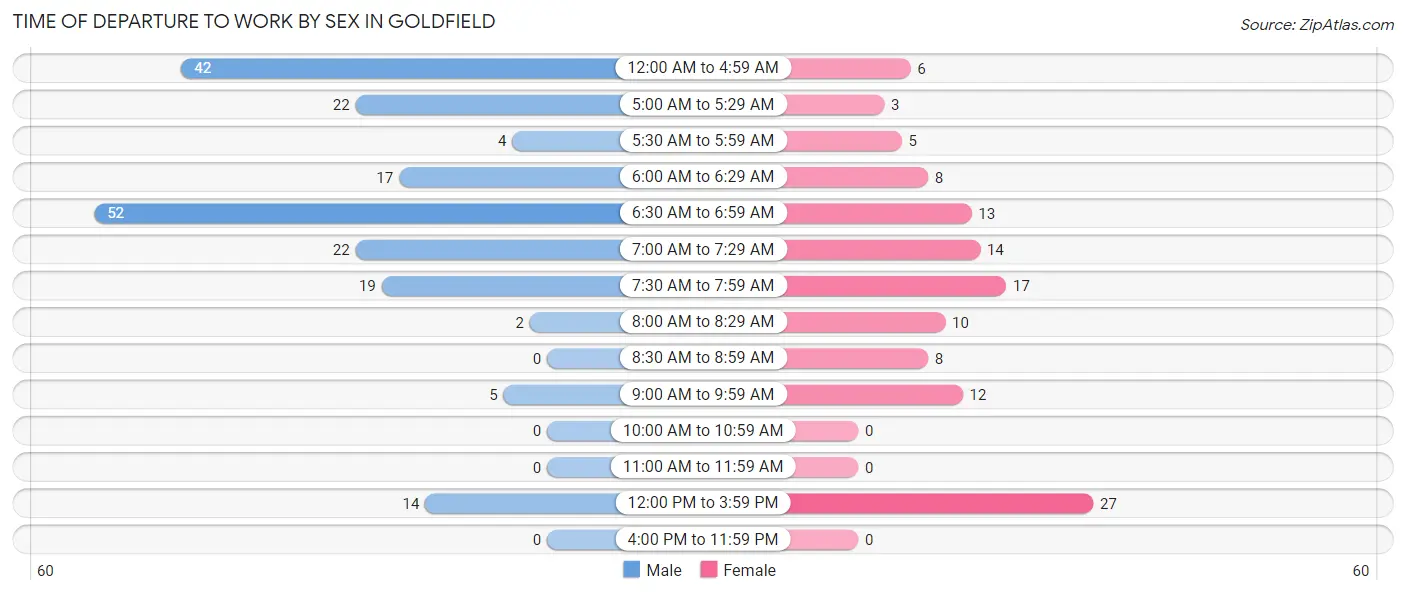
| Time of Departure | Male | Female |
| 12:00 AM to 4:59 AM | 42 (21.1%) | 6 (4.9%) |
| 5:00 AM to 5:29 AM | 22 (11.1%) | 3 (2.4%) |
| 5:30 AM to 5:59 AM | 4 (2.0%) | 5 (4.1%) |
| 6:00 AM to 6:29 AM | 17 (8.5%) | 8 (6.5%) |
| 6:30 AM to 6:59 AM | 52 (26.1%) | 13 (10.6%) |
| 7:00 AM to 7:29 AM | 22 (11.1%) | 14 (11.4%) |
| 7:30 AM to 7:59 AM | 19 (9.6%) | 17 (13.8%) |
| 8:00 AM to 8:29 AM | 2 (1.0%) | 10 (8.1%) |
| 8:30 AM to 8:59 AM | 0 (0.0%) | 8 (6.5%) |
| 9:00 AM to 9:59 AM | 5 (2.5%) | 12 (9.8%) |
| 10:00 AM to 10:59 AM | 0 (0.0%) | 0 (0.0%) |
| 11:00 AM to 11:59 AM | 0 (0.0%) | 0 (0.0%) |
| 12:00 PM to 3:59 PM | 14 (7.0%) | 27 (22.0%) |
| 4:00 PM to 11:59 PM | 0 (0.0%) | 0 (0.0%) |
| Total | 199 (100.0%) | 123 (100.0%) |
Housing Occupancy in Goldfield
Occupancy by Ownership in Goldfield
Of the total 287 dwellings in Goldfield, owner-occupied units account for 251 (87.5%), while renter-occupied units make up 36 (12.5%).
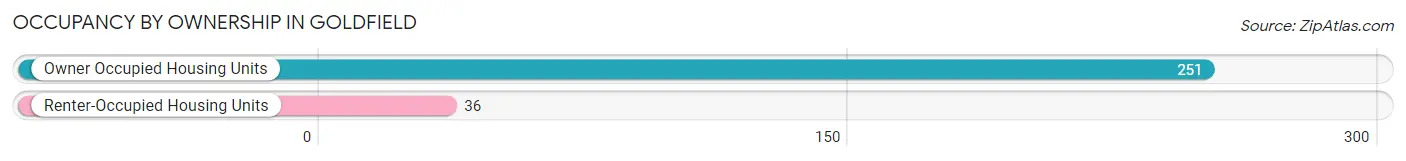
| Occupancy | # Housing Units | % Housing Units |
| Owner Occupied Housing Units | 251 | 87.5% |
| Renter-Occupied Housing Units | 36 | 12.5% |
| Total Occupied Housing Units | 287 | 100.0% |
Occupancy by Household Size in Goldfield
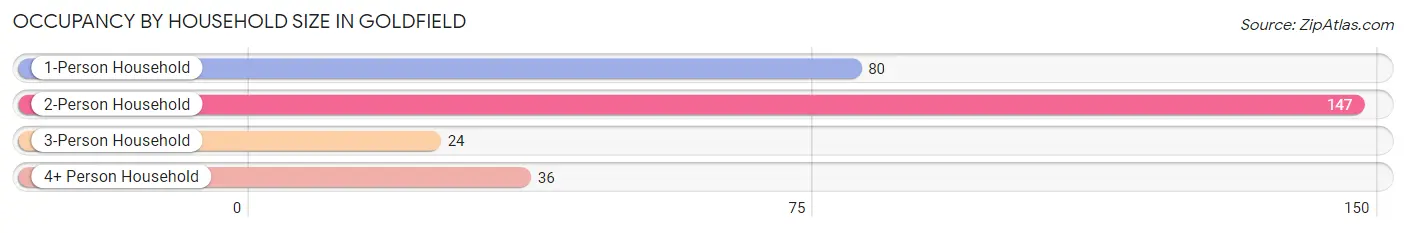
| Household Size | # Housing Units | % Housing Units |
| 1-Person Household | 80 | 27.9% |
| 2-Person Household | 147 | 51.2% |
| 3-Person Household | 24 | 8.4% |
| 4+ Person Household | 36 | 12.5% |
| Total Housing Units | 287 | 100.0% |
Occupancy by Ownership by Household Size in Goldfield
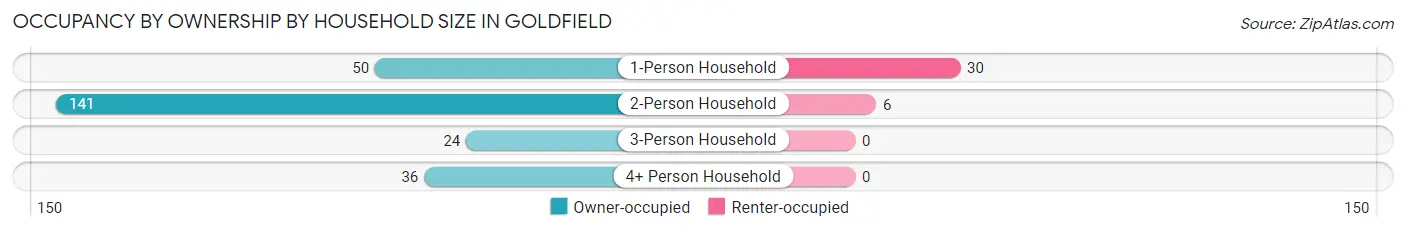
| Household Size | Owner-occupied | Renter-occupied |
| 1-Person Household | 50 (62.5%) | 30 (37.5%) |
| 2-Person Household | 141 (95.9%) | 6 (4.1%) |
| 3-Person Household | 24 (100.0%) | 0 (0.0%) |
| 4+ Person Household | 36 (100.0%) | 0 (0.0%) |
| Total Housing Units | 251 (87.5%) | 36 (12.5%) |
Occupancy by Educational Attainment in Goldfield
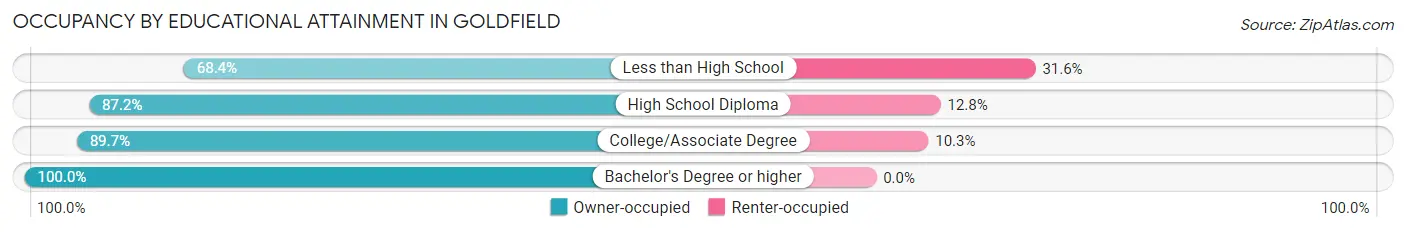
| Household Size | Owner-occupied | Renter-occupied |
| Less than High School | 26 (68.4%) | 12 (31.6%) |
| High School Diploma | 82 (87.2%) | 12 (12.8%) |
| College/Associate Degree | 104 (89.7%) | 12 (10.3%) |
| Bachelor's Degree or higher | 39 (100.0%) | 0 (0.0%) |
Occupancy by Age of Householder in Goldfield
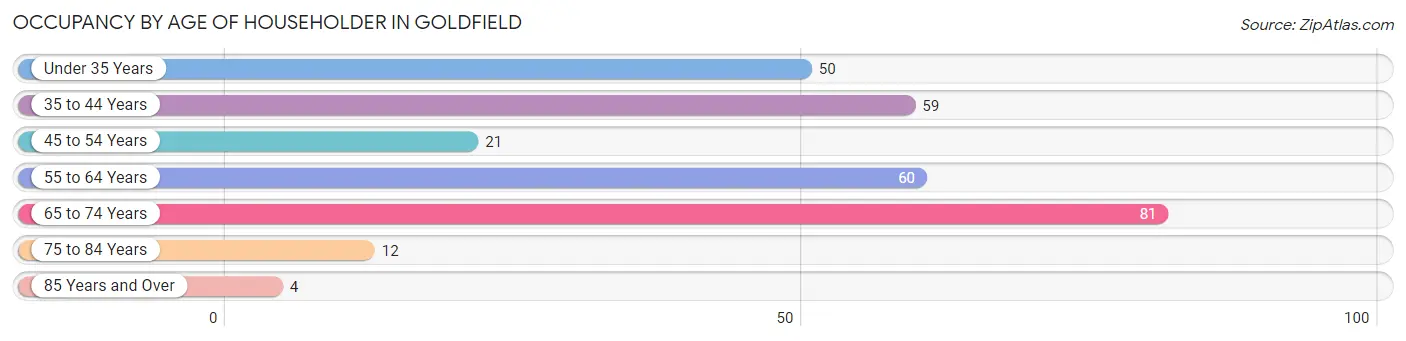
| Age Bracket | # Households | % Households |
| Under 35 Years | 50 | 17.4% |
| 35 to 44 Years | 59 | 20.6% |
| 45 to 54 Years | 21 | 7.3% |
| 55 to 64 Years | 60 | 20.9% |
| 65 to 74 Years | 81 | 28.2% |
| 75 to 84 Years | 12 | 4.2% |
| 85 Years and Over | 4 | 1.4% |
| Total | 287 | 100.0% |
Housing Finances in Goldfield
Median Income by Occupancy in Goldfield
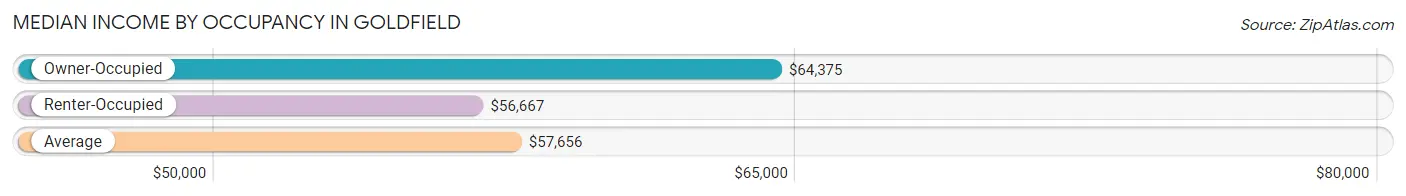
| Occupancy Type | # Households | Median Income |
| Owner-Occupied | 251 (87.5%) | $64,375 |
| Renter-Occupied | 36 (12.5%) | $56,667 |
| Average | 287 (100.0%) | $57,656 |
Occupancy by Householder Income Bracket in Goldfield
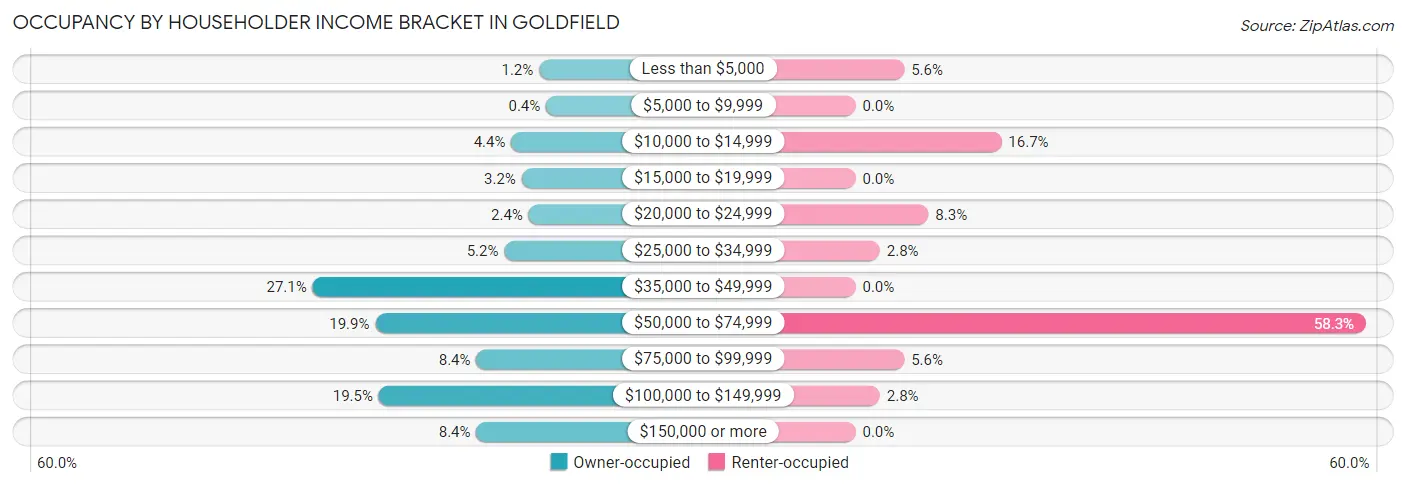
| Income Bracket | Owner-occupied | Renter-occupied |
| Less than $5,000 | 3 (1.2%) | 2 (5.6%) |
| $5,000 to $9,999 | 1 (0.4%) | 0 (0.0%) |
| $10,000 to $14,999 | 11 (4.4%) | 6 (16.7%) |
| $15,000 to $19,999 | 8 (3.2%) | 0 (0.0%) |
| $20,000 to $24,999 | 6 (2.4%) | 3 (8.3%) |
| $25,000 to $34,999 | 13 (5.2%) | 1 (2.8%) |
| $35,000 to $49,999 | 68 (27.1%) | 0 (0.0%) |
| $50,000 to $74,999 | 50 (19.9%) | 21 (58.3%) |
| $75,000 to $99,999 | 21 (8.4%) | 2 (5.6%) |
| $100,000 to $149,999 | 49 (19.5%) | 1 (2.8%) |
| $150,000 or more | 21 (8.4%) | 0 (0.0%) |
| Total | 251 (100.0%) | 36 (100.0%) |
Monthly Housing Cost Tiers in Goldfield
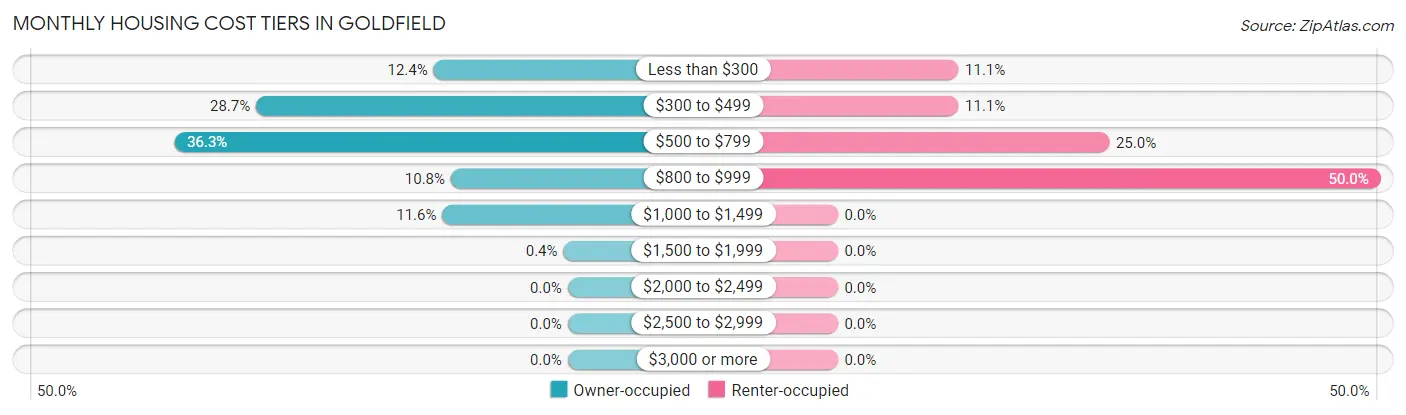
| Monthly Cost | Owner-occupied | Renter-occupied |
| Less than $300 | 31 (12.3%) | 4 (11.1%) |
| $300 to $499 | 72 (28.7%) | 4 (11.1%) |
| $500 to $799 | 91 (36.2%) | 9 (25.0%) |
| $800 to $999 | 27 (10.8%) | 18 (50.0%) |
| $1,000 to $1,499 | 29 (11.6%) | 0 (0.0%) |
| $1,500 to $1,999 | 1 (0.4%) | 0 (0.0%) |
| $2,000 to $2,499 | 0 (0.0%) | 0 (0.0%) |
| $2,500 to $2,999 | 0 (0.0%) | 0 (0.0%) |
| $3,000 or more | 0 (0.0%) | 0 (0.0%) |
| Total | 251 (100.0%) | 36 (100.0%) |
Physical Housing Characteristics in Goldfield
Housing Structures in Goldfield
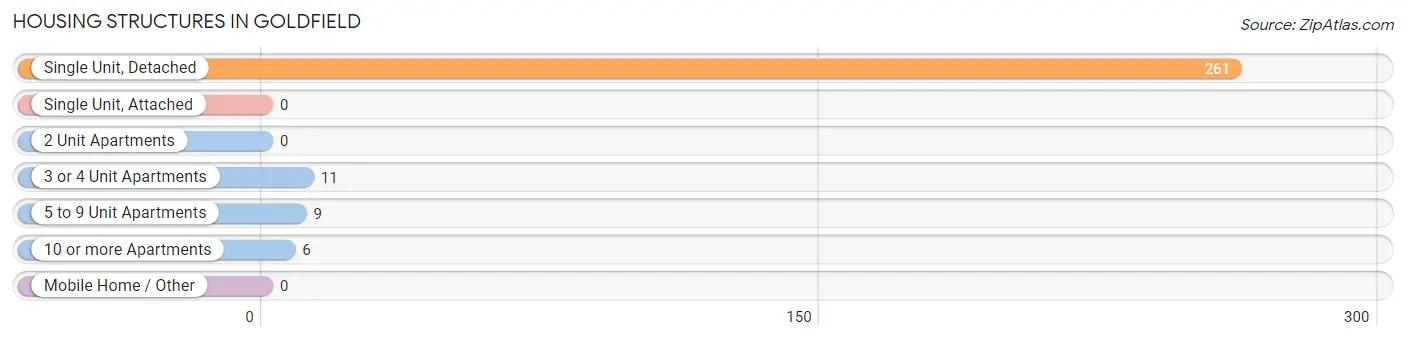
| Structure Type | # Housing Units | % Housing Units |
| Single Unit, Detached | 261 | 90.9% |
| Single Unit, Attached | 0 | 0.0% |
| 2 Unit Apartments | 0 | 0.0% |
| 3 or 4 Unit Apartments | 11 | 3.8% |
| 5 to 9 Unit Apartments | 9 | 3.1% |
| 10 or more Apartments | 6 | 2.1% |
| Mobile Home / Other | 0 | 0.0% |
| Total | 287 | 100.0% |
Housing Structures by Occupancy in Goldfield
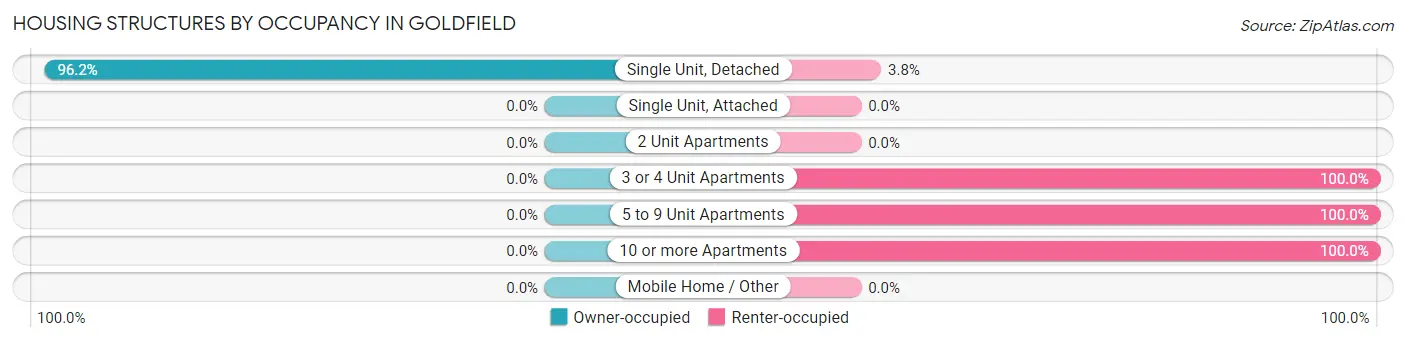
| Structure Type | Owner-occupied | Renter-occupied |
| Single Unit, Detached | 251 (96.2%) | 10 (3.8%) |
| Single Unit, Attached | 0 (0.0%) | 0 (0.0%) |
| 2 Unit Apartments | 0 (0.0%) | 0 (0.0%) |
| 3 or 4 Unit Apartments | 0 (0.0%) | 11 (100.0%) |
| 5 to 9 Unit Apartments | 0 (0.0%) | 9 (100.0%) |
| 10 or more Apartments | 0 (0.0%) | 6 (100.0%) |
| Mobile Home / Other | 0 (0.0%) | 0 (0.0%) |
| Total | 251 (87.5%) | 36 (12.5%) |
Housing Structures by Number of Rooms in Goldfield
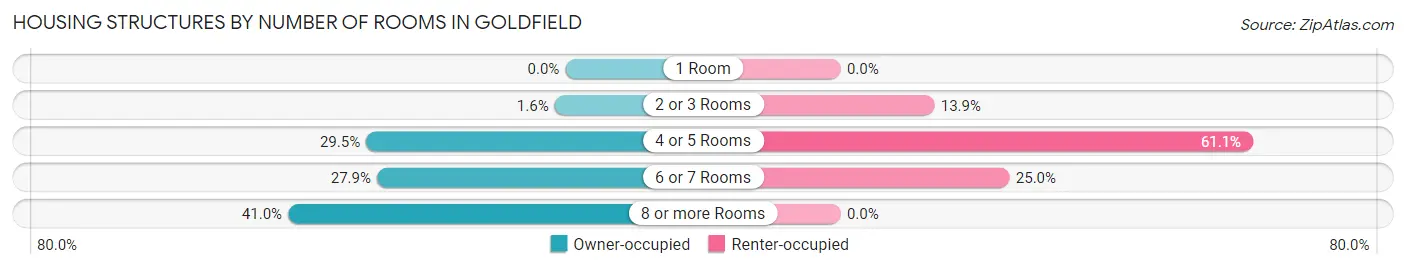
| Number of Rooms | Owner-occupied | Renter-occupied |
| 1 Room | 0 (0.0%) | 0 (0.0%) |
| 2 or 3 Rooms | 4 (1.6%) | 5 (13.9%) |
| 4 or 5 Rooms | 74 (29.5%) | 22 (61.1%) |
| 6 or 7 Rooms | 70 (27.9%) | 9 (25.0%) |
| 8 or more Rooms | 103 (41.0%) | 0 (0.0%) |
| Total | 251 (100.0%) | 36 (100.0%) |
Housing Structure by Heating Type in Goldfield
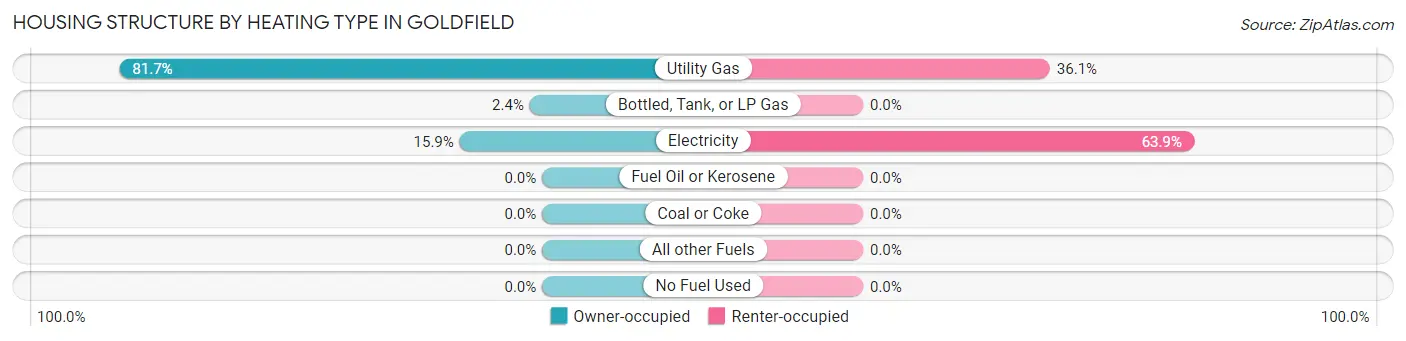
| Heating Type | Owner-occupied | Renter-occupied |
| Utility Gas | 205 (81.7%) | 13 (36.1%) |
| Bottled, Tank, or LP Gas | 6 (2.4%) | 0 (0.0%) |
| Electricity | 40 (15.9%) | 23 (63.9%) |
| Fuel Oil or Kerosene | 0 (0.0%) | 0 (0.0%) |
| Coal or Coke | 0 (0.0%) | 0 (0.0%) |
| All other Fuels | 0 (0.0%) | 0 (0.0%) |
| No Fuel Used | 0 (0.0%) | 0 (0.0%) |
| Total | 251 (100.0%) | 36 (100.0%) |
Household Vehicle Usage in Goldfield
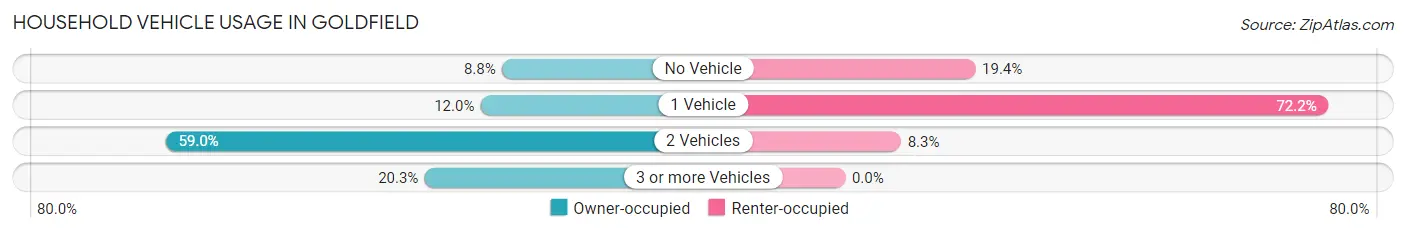
| Vehicles per Household | Owner-occupied | Renter-occupied |
| No Vehicle | 22 (8.8%) | 7 (19.4%) |
| 1 Vehicle | 30 (11.9%) | 26 (72.2%) |
| 2 Vehicles | 148 (59.0%) | 3 (8.3%) |
| 3 or more Vehicles | 51 (20.3%) | 0 (0.0%) |
| Total | 251 (100.0%) | 36 (100.0%) |
Real Estate & Mortgages in Goldfield
Real Estate and Mortgage Overview in Goldfield
| Characteristic | Without Mortgage | With Mortgage |
| Housing Units | 138 | 113 |
| Median Property Value | $79,600 | $74,200 |
| Median Household Income | $46,250 | $12 |
| Monthly Housing Costs | $393 | $0 |
| Real Estate Taxes | $1,154 | $8 |
Property Value by Mortgage Status in Goldfield
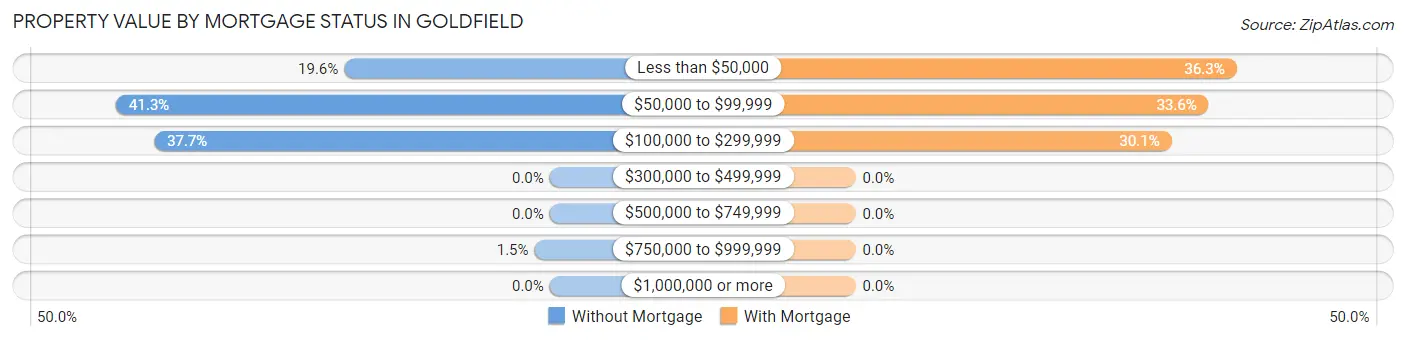
| Property Value | Without Mortgage | With Mortgage |
| Less than $50,000 | 27 (19.6%) | 41 (36.3%) |
| $50,000 to $99,999 | 57 (41.3%) | 38 (33.6%) |
| $100,000 to $299,999 | 52 (37.7%) | 34 (30.1%) |
| $300,000 to $499,999 | 0 (0.0%) | 0 (0.0%) |
| $500,000 to $749,999 | 0 (0.0%) | 0 (0.0%) |
| $750,000 to $999,999 | 2 (1.5%) | 0 (0.0%) |
| $1,000,000 or more | 0 (0.0%) | 0 (0.0%) |
| Total | 138 (100.0%) | 113 (100.0%) |
Household Income by Mortgage Status in Goldfield
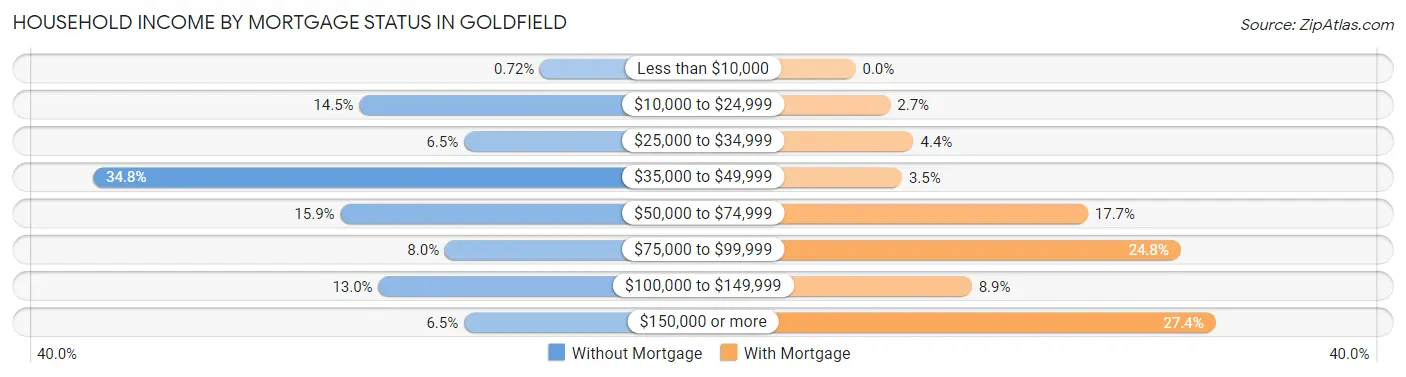
| Household Income | Without Mortgage | With Mortgage |
| Less than $10,000 | 1 (0.7%) | 0 (0.0%) |
| $10,000 to $24,999 | 20 (14.5%) | 3 (2.6%) |
| $25,000 to $34,999 | 9 (6.5%) | 5 (4.4%) |
| $35,000 to $49,999 | 48 (34.8%) | 4 (3.5%) |
| $50,000 to $74,999 | 22 (15.9%) | 20 (17.7%) |
| $75,000 to $99,999 | 11 (8.0%) | 28 (24.8%) |
| $100,000 to $149,999 | 18 (13.0%) | 10 (8.8%) |
| $150,000 or more | 9 (6.5%) | 31 (27.4%) |
| Total | 138 (100.0%) | 113 (100.0%) |
Property Value to Household Income Ratio in Goldfield
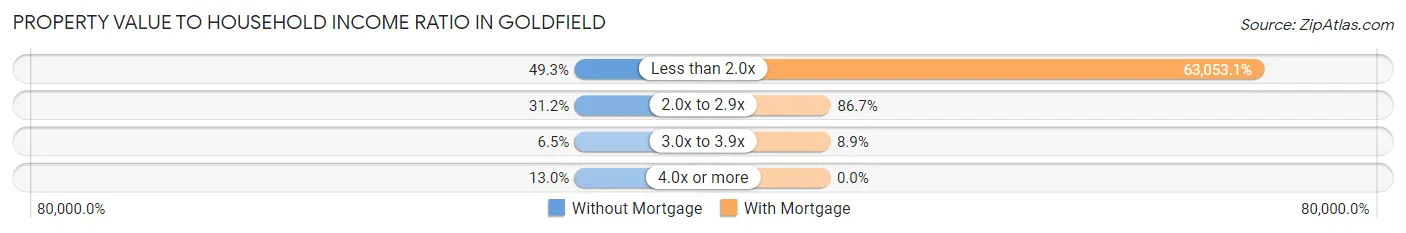
| Value-to-Income Ratio | Without Mortgage | With Mortgage |
| Less than 2.0x | 68 (49.3%) | 71,250 (63,053.1%) |
| 2.0x to 2.9x | 43 (31.2%) | 98 (86.7%) |
| 3.0x to 3.9x | 9 (6.5%) | 10 (8.8%) |
| 4.0x or more | 18 (13.0%) | 0 (0.0%) |
| Total | 138 (100.0%) | 113 (100.0%) |
Real Estate Taxes by Mortgage Status in Goldfield
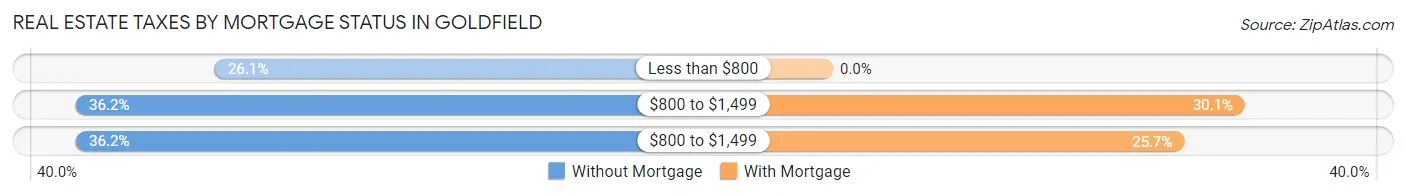
| Property Taxes | Without Mortgage | With Mortgage |
| Less than $800 | 36 (26.1%) | 0 (0.0%) |
| $800 to $1,499 | 50 (36.2%) | 34 (30.1%) |
| $800 to $1,499 | 50 (36.2%) | 29 (25.7%) |
| Total | 138 (100.0%) | 113 (100.0%) |
Health & Disability in Goldfield
Health Insurance Coverage by Age in Goldfield
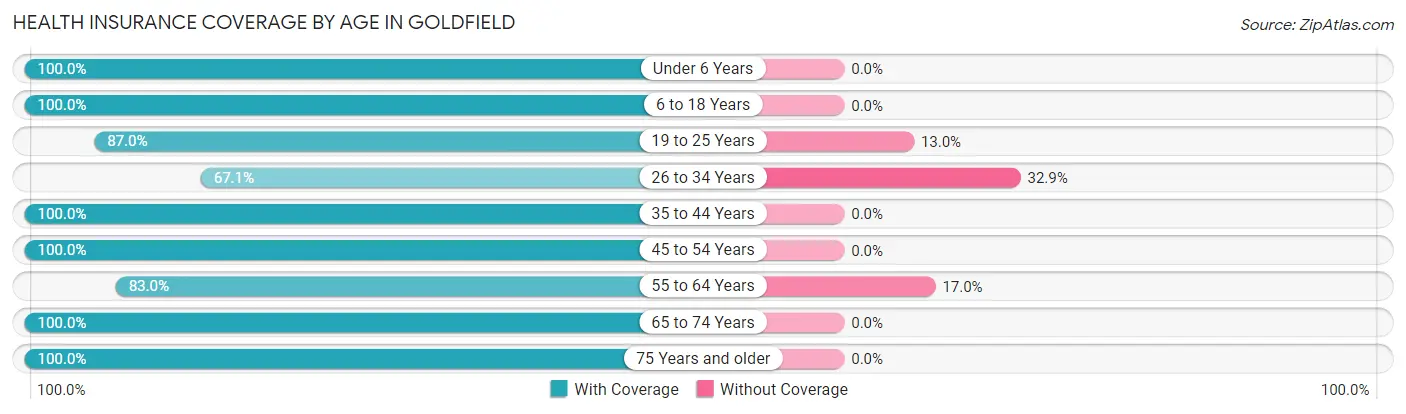
| Age Bracket | With Coverage | Without Coverage |
| Under 6 Years | 14 (100.0%) | 0 (0.0%) |
| 6 to 18 Years | 85 (100.0%) | 0 (0.0%) |
| 19 to 25 Years | 67 (87.0%) | 10 (13.0%) |
| 26 to 34 Years | 47 (67.1%) | 23 (32.9%) |
| 35 to 44 Years | 92 (100.0%) | 0 (0.0%) |
| 45 to 54 Years | 70 (100.0%) | 0 (0.0%) |
| 55 to 64 Years | 83 (83.0%) | 17 (17.0%) |
| 65 to 74 Years | 127 (100.0%) | 0 (0.0%) |
| 75 Years and older | 30 (100.0%) | 0 (0.0%) |
| Total | 615 (92.5%) | 50 (7.5%) |
Health Insurance Coverage by Citizenship Status in Goldfield
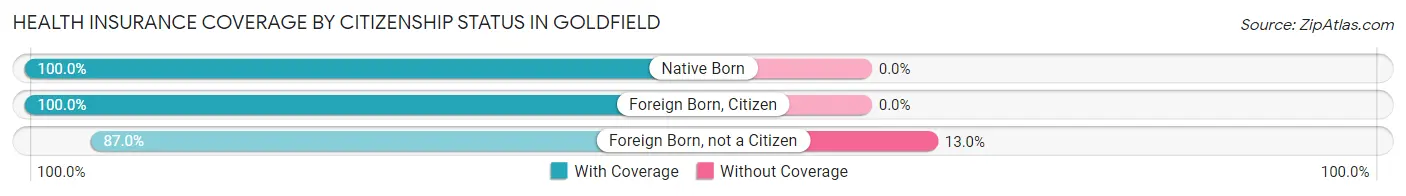
| Citizenship Status | With Coverage | Without Coverage |
| Native Born | 14 (100.0%) | 0 (0.0%) |
| Foreign Born, Citizen | 85 (100.0%) | 0 (0.0%) |
| Foreign Born, not a Citizen | 67 (87.0%) | 10 (13.0%) |
Health Insurance Coverage by Household Income in Goldfield
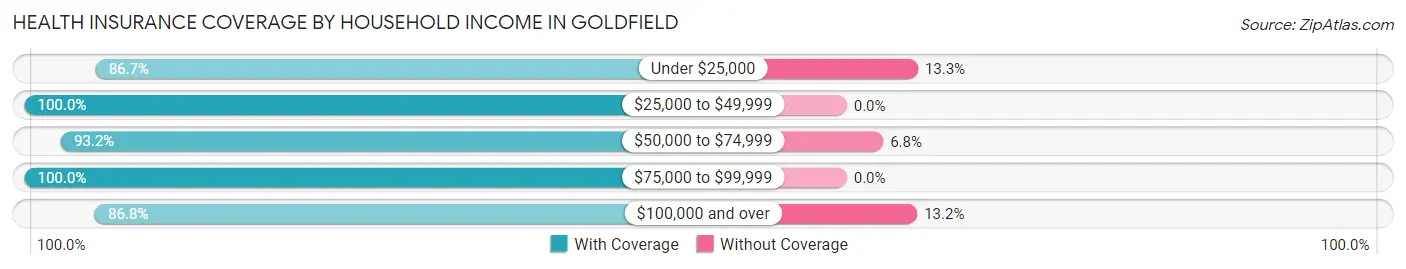
| Household Income | With Coverage | Without Coverage |
| Under $25,000 | 52 (86.7%) | 8 (13.3%) |
| $25,000 to $49,999 | 175 (100.0%) | 0 (0.0%) |
| $50,000 to $74,999 | 123 (93.2%) | 9 (6.8%) |
| $75,000 to $99,999 | 48 (100.0%) | 0 (0.0%) |
| $100,000 and over | 217 (86.8%) | 33 (13.2%) |
Public vs Private Health Insurance Coverage by Age in Goldfield
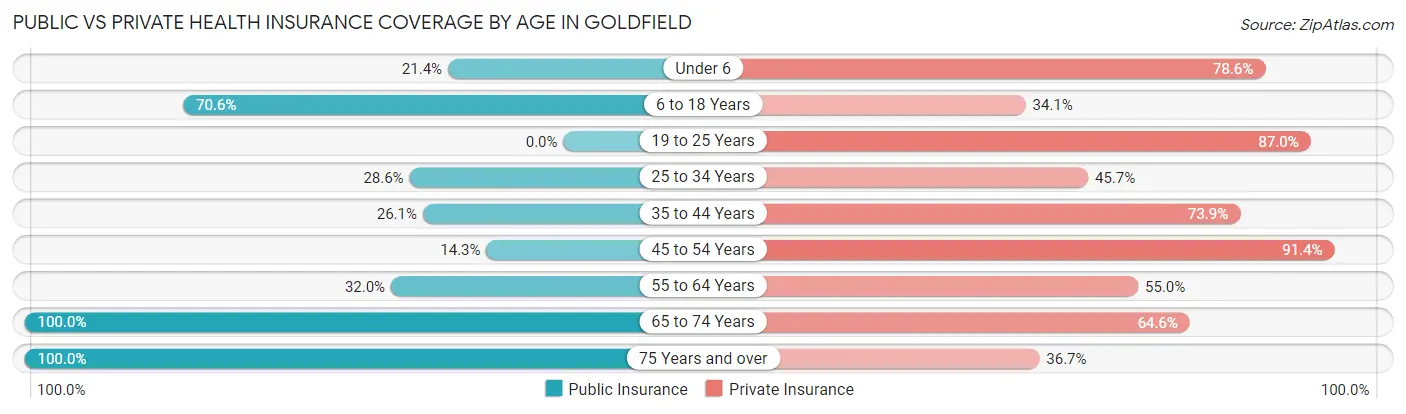
| Age Bracket | Public Insurance | Private Insurance |
| Under 6 | 3 (21.4%) | 11 (78.6%) |
| 6 to 18 Years | 60 (70.6%) | 29 (34.1%) |
| 19 to 25 Years | 0 (0.0%) | 67 (87.0%) |
| 25 to 34 Years | 20 (28.6%) | 32 (45.7%) |
| 35 to 44 Years | 24 (26.1%) | 68 (73.9%) |
| 45 to 54 Years | 10 (14.3%) | 64 (91.4%) |
| 55 to 64 Years | 32 (32.0%) | 55 (55.0%) |
| 65 to 74 Years | 127 (100.0%) | 82 (64.6%) |
| 75 Years and over | 30 (100.0%) | 11 (36.7%) |
| Total | 306 (46.0%) | 419 (63.0%) |
Disability Status by Sex by Age in Goldfield
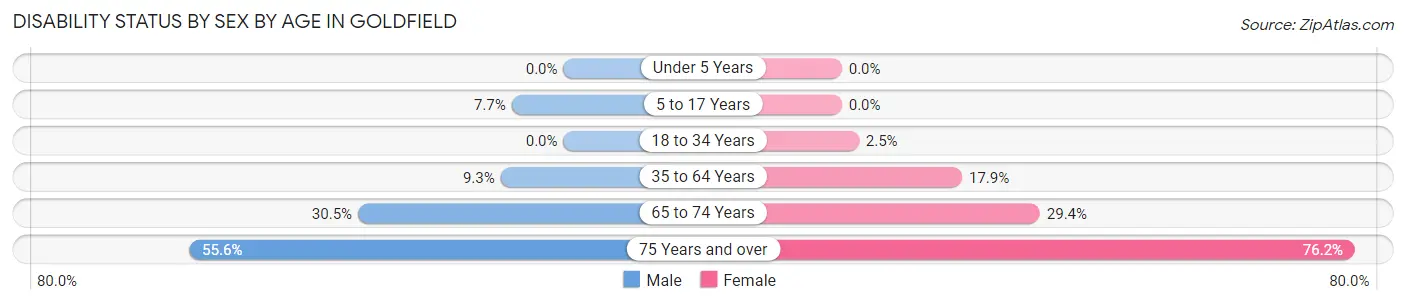
| Age Bracket | Male | Female |
| Under 5 Years | 0 (0.0%) | 0 (0.0%) |
| 5 to 17 Years | 3 (7.7%) | 0 (0.0%) |
| 18 to 34 Years | 0 (0.0%) | 2 (2.5%) |
| 35 to 64 Years | 14 (9.3%) | 20 (17.9%) |
| 65 to 74 Years | 18 (30.5%) | 20 (29.4%) |
| 75 Years and over | 5 (55.6%) | 16 (76.2%) |
Disability Class by Sex by Age in Goldfield
Disability Class: Hearing Difficulty
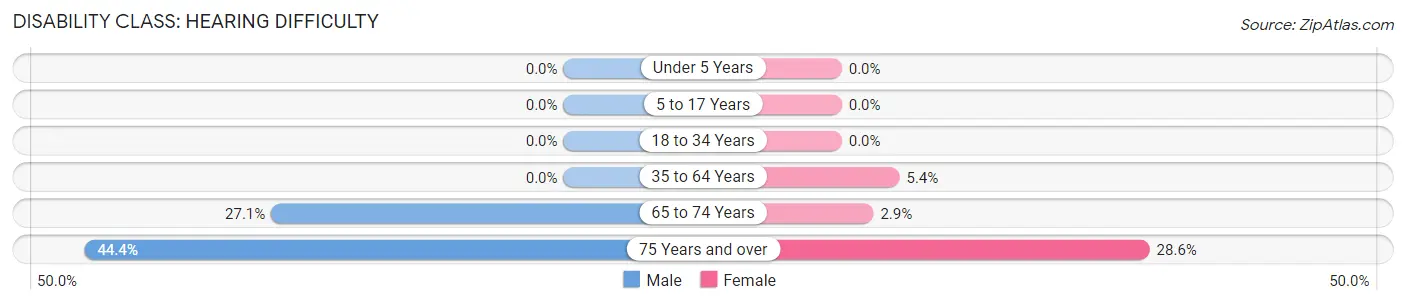
| Age Bracket | Male | Female |
| Under 5 Years | 0 (0.0%) | 0 (0.0%) |
| 5 to 17 Years | 0 (0.0%) | 0 (0.0%) |
| 18 to 34 Years | 0 (0.0%) | 0 (0.0%) |
| 35 to 64 Years | 0 (0.0%) | 6 (5.4%) |
| 65 to 74 Years | 16 (27.1%) | 2 (2.9%) |
| 75 Years and over | 4 (44.4%) | 6 (28.6%) |
Disability Class: Vision Difficulty
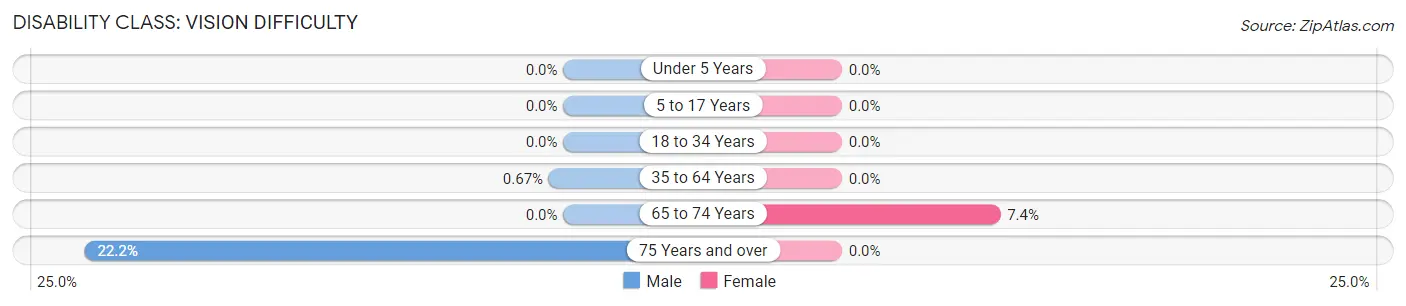
| Age Bracket | Male | Female |
| Under 5 Years | 0 (0.0%) | 0 (0.0%) |
| 5 to 17 Years | 0 (0.0%) | 0 (0.0%) |
| 18 to 34 Years | 0 (0.0%) | 0 (0.0%) |
| 35 to 64 Years | 1 (0.7%) | 0 (0.0%) |
| 65 to 74 Years | 0 (0.0%) | 5 (7.3%) |
| 75 Years and over | 2 (22.2%) | 0 (0.0%) |
Disability Class: Cognitive Difficulty
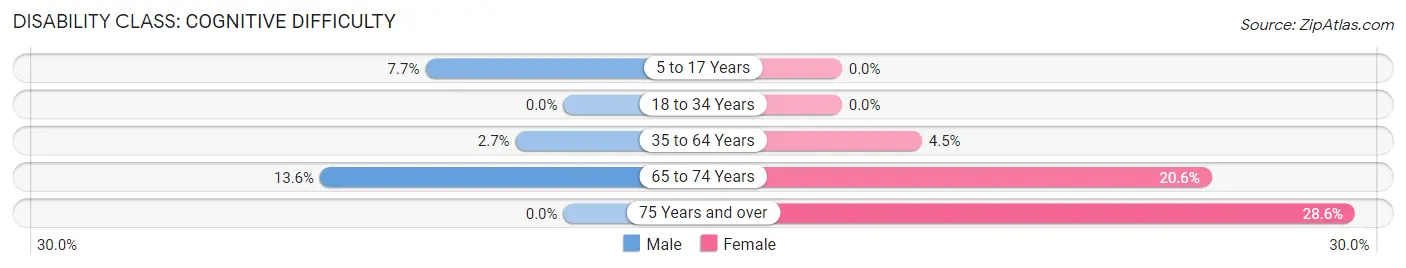
| Age Bracket | Male | Female |
| 5 to 17 Years | 3 (7.7%) | 0 (0.0%) |
| 18 to 34 Years | 0 (0.0%) | 0 (0.0%) |
| 35 to 64 Years | 4 (2.7%) | 5 (4.5%) |
| 65 to 74 Years | 8 (13.6%) | 14 (20.6%) |
| 75 Years and over | 0 (0.0%) | 6 (28.6%) |
Disability Class: Ambulatory Difficulty
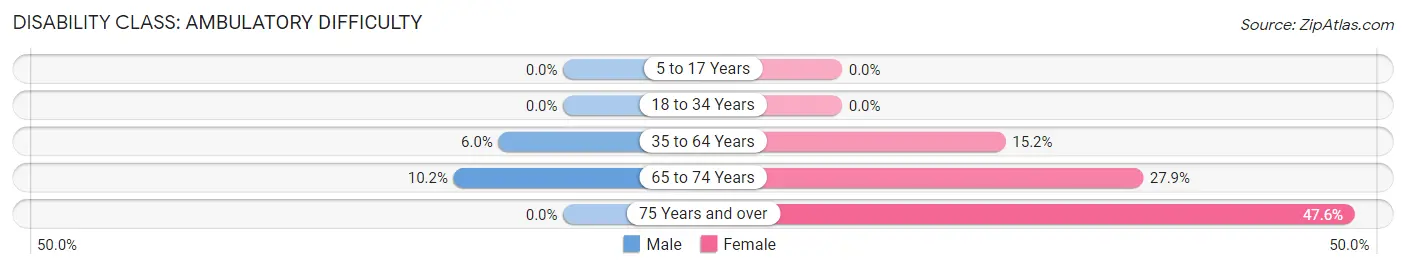
| Age Bracket | Male | Female |
| 5 to 17 Years | 0 (0.0%) | 0 (0.0%) |
| 18 to 34 Years | 0 (0.0%) | 0 (0.0%) |
| 35 to 64 Years | 9 (6.0%) | 17 (15.2%) |
| 65 to 74 Years | 6 (10.2%) | 19 (27.9%) |
| 75 Years and over | 0 (0.0%) | 10 (47.6%) |
Disability Class: Self-Care Difficulty
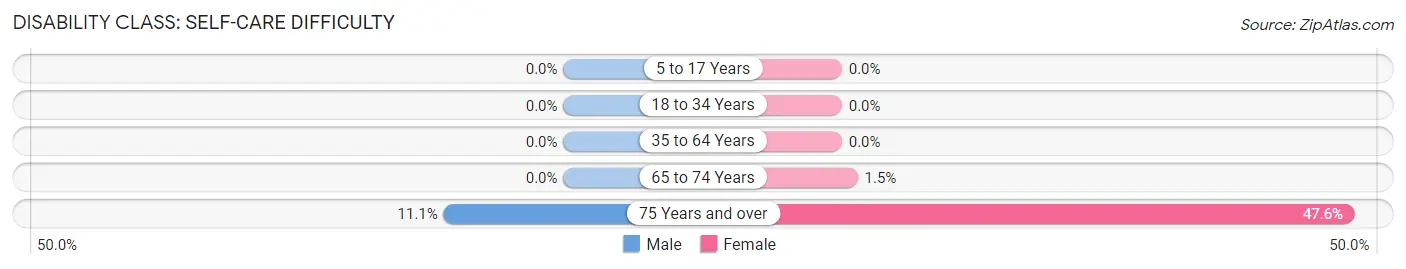
| Age Bracket | Male | Female |
| 5 to 17 Years | 0 (0.0%) | 0 (0.0%) |
| 18 to 34 Years | 0 (0.0%) | 0 (0.0%) |
| 35 to 64 Years | 0 (0.0%) | 0 (0.0%) |
| 65 to 74 Years | 0 (0.0%) | 1 (1.5%) |
| 75 Years and over | 1 (11.1%) | 10 (47.6%) |
Technology Access in Goldfield
Computing Device Access in Goldfield
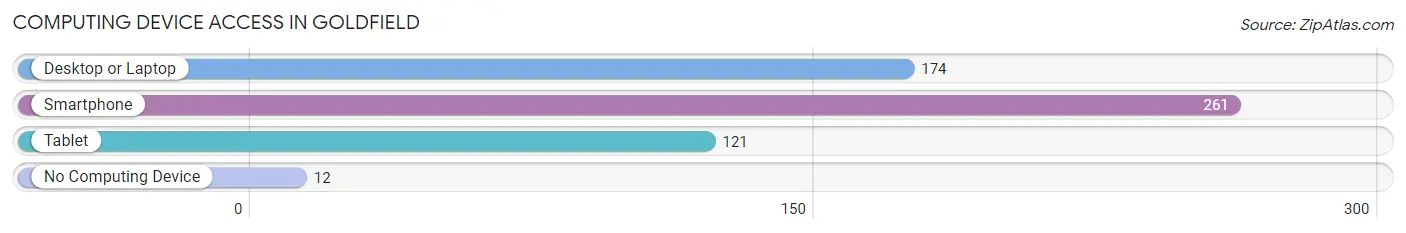
| Device Type | # Households | % Households |
| Desktop or Laptop | 174 | 60.6% |
| Smartphone | 261 | 90.9% |
| Tablet | 121 | 42.2% |
| No Computing Device | 12 | 4.2% |
| Total | 287 | 100.0% |
Internet Access in Goldfield
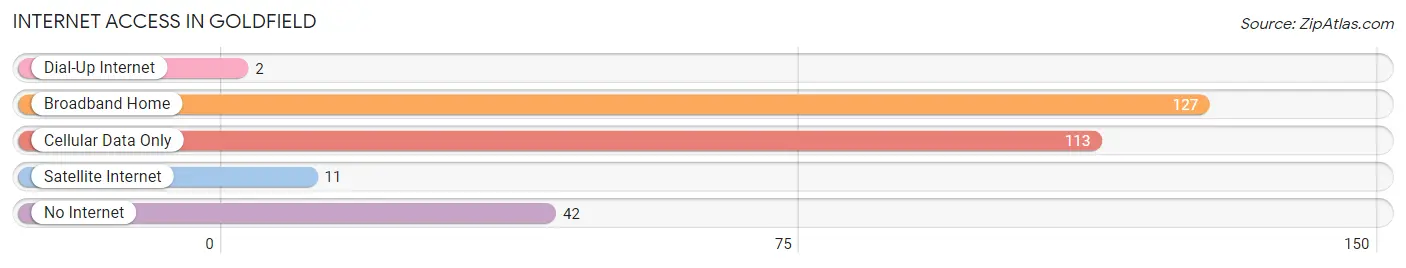
| Internet Type | # Households | % Households |
| Dial-Up Internet | 2 | 0.7% |
| Broadband Home | 127 | 44.3% |
| Cellular Data Only | 113 | 39.4% |
| Satellite Internet | 11 | 3.8% |
| No Internet | 42 | 14.6% |
| Total | 287 | 100.0% |
Goldfield Summary
Goldfield, Iowa is a small town located in Wright County, Iowa. It is situated in the north-central part of the state, about 25 miles northwest of Mason City. The town was founded in 1881 and has a population of approximately 500 people.
Geography
Goldfield is located in the rolling hills of northern Iowa, with an elevation of 1,068 feet above sea level. The town is situated on the banks of the Shell Rock River, which flows through the town and provides a source of recreation for the locals. The town is surrounded by farmland, with corn and soybeans being the main crops grown in the area.
Economy
The economy of Goldfield is largely based on agriculture. The town is home to several grain elevators, which are used to store and transport grain from the local farms. In addition, there are several small businesses in the town, including a grocery store, a hardware store, and a few restaurants.
Demographics
As of the 2010 census, Goldfield had a population of 498 people. The racial makeup of the town was 97.2% White, 0.2% African American, 0.2% Native American, 0.2% Asian, 0.2% from other races, and 1.8% from two or more races. The median age of the population was 43.7 years. The median household income was $45,000, and the median family income was $50,000.
History
Goldfield was founded in 1881 by a group of settlers from the nearby town of Clarion. The town was named after the gold rush that had taken place in the area in the late 19th century. The town quickly grew and by the early 20th century, it had become a thriving agricultural center. The town was also home to several churches, a bank, and a post office.
In the late 20th century, Goldfield began to decline as the local economy shifted away from agriculture. The town’s population began to decline, and many of the businesses in the town closed. However, in recent years, the town has seen a resurgence in population and economic activity. The town is now home to several small businesses, including a grocery store, a hardware store, and a few restaurants.
Goldfield is a small town with a rich history and a bright future. The town is home to a diverse population and a thriving economy. With its close proximity to Mason City, Goldfield is an ideal place to live and work.
Common Questions
What is Per Capita Income in Goldfield?
Per Capita income in Goldfield is $33,074.
What is the Median Family Income in Goldfield?
Median Family Income in Goldfield is $81,042.
What is the Median Household income in Goldfield?
Median Household Income in Goldfield is $57,656.
What is Income or Wage Gap in Goldfield?
Income or Wage Gap in Goldfield is 41.5%.
Women in Goldfield earn 58.5 cents for every dollar earned by a man.
What is Inequality or Gini Index in Goldfield?
Inequality or Gini Index in Goldfield is 0.37.
What is the Total Population of Goldfield?
Total Population of Goldfield is 665.
What is the Total Male Population of Goldfield?
Total Male Population of Goldfield is 350.
What is the Total Female Population of Goldfield?
Total Female Population of Goldfield is 315.
What is the Ratio of Males per 100 Females in Goldfield?
There are 111.11 Males per 100 Females in Goldfield.
What is the Ratio of Females per 100 Males in Goldfield?
There are 90.00 Females per 100 Males in Goldfield.
What is the Median Population Age in Goldfield?
Median Population Age in Goldfield is 43.8 Years.
What is the Average Family Size in Goldfield
Average Family Size in Goldfield is 3.0 People.
What is the Average Household Size in Goldfield
Average Household Size in Goldfield is 2.3 People.
How Large is the Labor Force in Goldfield?
There are 341 People in the Labor Forcein in Goldfield.
What is the Percentage of People in the Labor Force in Goldfield?
57.4% of People are in the Labor Force in Goldfield.
What is the Unemployment Rate in Goldfield?
Unemployment Rate in Goldfield is 1.5%.