Farnhamville, IA Map & Demographics
Farnhamville Map
Farnhamville Overview
$23,363
PER CAPITA INCOME
$59,318
AVG FAMILY INCOME
$48,750
AVG HOUSEHOLD INCOME
57.1%
WAGE / INCOME GAP [ % ]
42.9¢/ $1
WAGE / INCOME GAP [ $ ]
$10,656
FAMILY INCOME DEFICIT
0.41
INEQUALITY / GINI INDEX
448
TOTAL POPULATION
241
MALE POPULATION
207
FEMALE POPULATION
116.43
MALES / 100 FEMALES
85.89
FEMALES / 100 MALES
34.2
MEDIAN AGE
3.2
AVG FAMILY SIZE
2.5
AVG HOUSEHOLD SIZE
189
LABOR FORCE [ PEOPLE ]
60.8%
PERCENT IN LABOR FORCE
1.1%
UNEMPLOYMENT RATE
Farnhamville Zip Codes
Farnhamville Area Codes
Income in Farnhamville
Income Overview in Farnhamville
Per Capita Income in Farnhamville is $23,363, while median incomes of families and households are $59,318 and $48,750 respectively.
| Characteristic | Number | Measure |
| Per Capita Income | 448 | $23,363 |
| Median Family Income | 114 | $59,318 |
| Mean Family Income | 114 | $62,896 |
| Median Household Income | 181 | $48,750 |
| Mean Household Income | 181 | $54,674 |
| Income Deficit | 114 | $10,656 |
| Wage / Income Gap (%) | 448 | 57.07% |
| Wage / Income Gap ($) | 448 | 42.93¢ per $1 |
| Gini / Inequality Index | 448 | 0.41 |
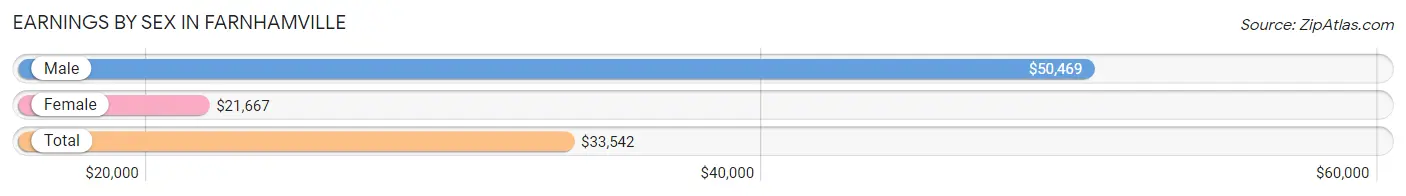
Earnings by Sex in Farnhamville
Average Earnings in Farnhamville are $33,542, $50,469 for men and $21,667 for women, a difference of 57.1%.
| Sex | Number | Average Earnings |
| Male | 115 (56.1%) | $50,469 |
| Female | 90 (43.9%) | $21,667 |
| Total | 205 (100.0%) | $33,542 |
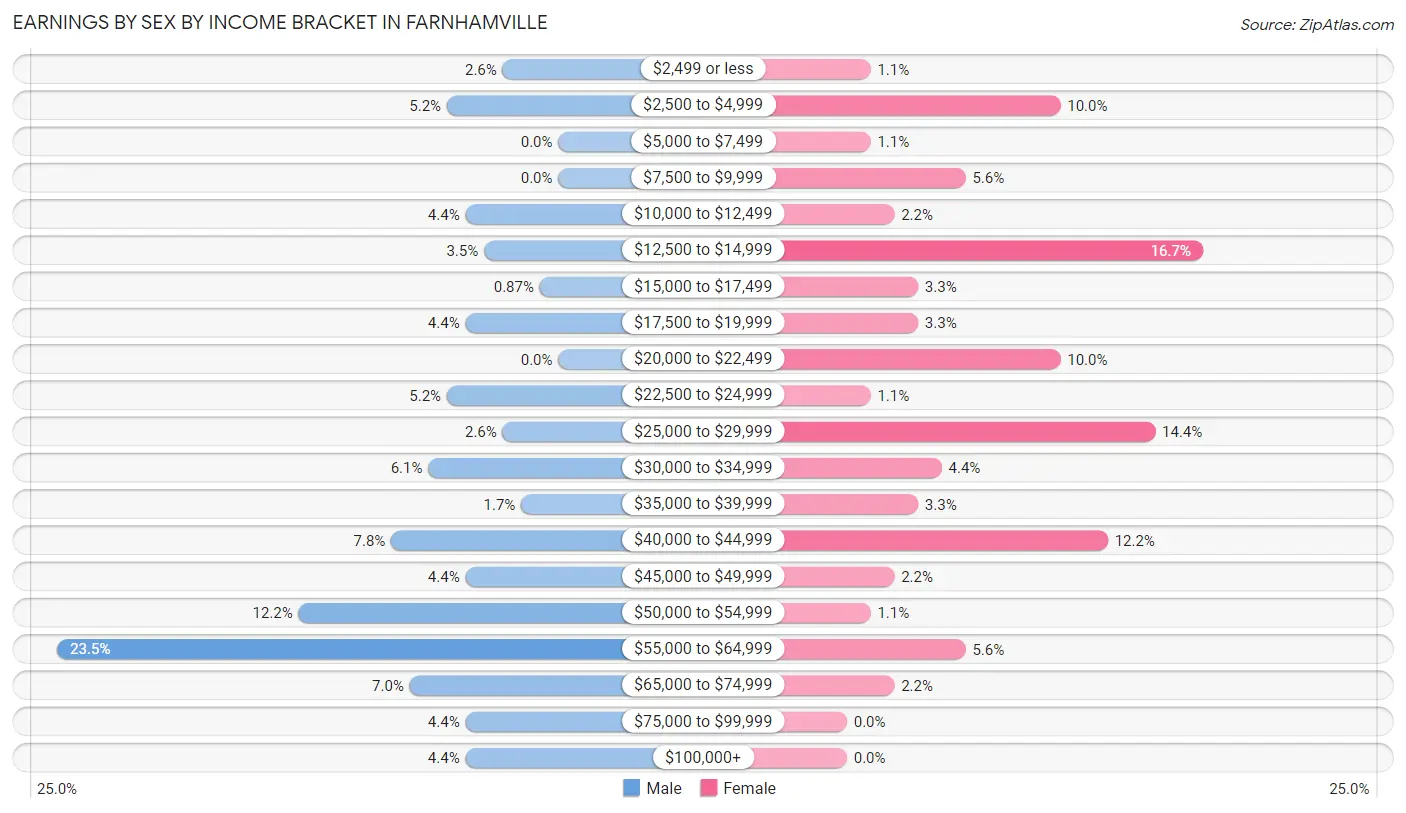
Earnings by Sex by Income Bracket in Farnhamville
The most common earnings brackets in Farnhamville are $55,000 to $64,999 for men (27 | 23.5%) and $12,500 to $14,999 for women (15 | 16.7%).
| Income | Male | Female |
| $2,499 or less | 3 (2.6%) | 1 (1.1%) |
| $2,500 to $4,999 | 6 (5.2%) | 9 (10.0%) |
| $5,000 to $7,499 | 0 (0.0%) | 1 (1.1%) |
| $7,500 to $9,999 | 0 (0.0%) | 5 (5.6%) |
| $10,000 to $12,499 | 5 (4.3%) | 2 (2.2%) |
| $12,500 to $14,999 | 4 (3.5%) | 15 (16.7%) |
| $15,000 to $17,499 | 1 (0.9%) | 3 (3.3%) |
| $17,500 to $19,999 | 5 (4.3%) | 3 (3.3%) |
| $20,000 to $22,499 | 0 (0.0%) | 9 (10.0%) |
| $22,500 to $24,999 | 6 (5.2%) | 1 (1.1%) |
| $25,000 to $29,999 | 3 (2.6%) | 13 (14.4%) |
| $30,000 to $34,999 | 7 (6.1%) | 4 (4.4%) |
| $35,000 to $39,999 | 2 (1.7%) | 3 (3.3%) |
| $40,000 to $44,999 | 9 (7.8%) | 11 (12.2%) |
| $45,000 to $49,999 | 5 (4.3%) | 2 (2.2%) |
| $50,000 to $54,999 | 14 (12.2%) | 1 (1.1%) |
| $55,000 to $64,999 | 27 (23.5%) | 5 (5.6%) |
| $65,000 to $74,999 | 8 (7.0%) | 2 (2.2%) |
| $75,000 to $99,999 | 5 (4.3%) | 0 (0.0%) |
| $100,000+ | 5 (4.3%) | 0 (0.0%) |
| Total | 115 (100.0%) | 90 (100.0%) |
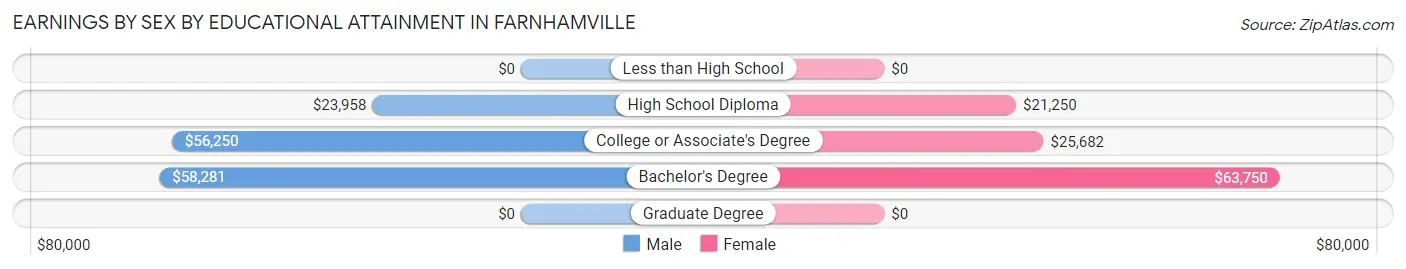
Earnings by Sex by Educational Attainment in Farnhamville
Average earnings in Farnhamville are $52,031 for men and $25,341 for women, a difference of 51.3%. Men with an educational attainment of bachelor's degree enjoy the highest average annual earnings of $58,281, while those with high school diploma education earn the least with $23,958. Women with an educational attainment of bachelor's degree earn the most with the average annual earnings of $63,750, while those with high school diploma education have the smallest earnings of $21,250.
| Educational Attainment | Male Income | Female Income |
| Less than High School | - | - |
| High School Diploma | $23,958 | $21,250 |
| College or Associate's Degree | $56,250 | $25,682 |
| Bachelor's Degree | $58,281 | $63,750 |
| Graduate Degree | - | - |
| Total | $52,031 | $25,341 |
Family Income in Farnhamville
Family Income Brackets in Farnhamville
According to the Farnhamville family income data, there are 28 families falling into the $75,000 to $99,999 income range, which is the most common income bracket and makes up 24.6% of all families.
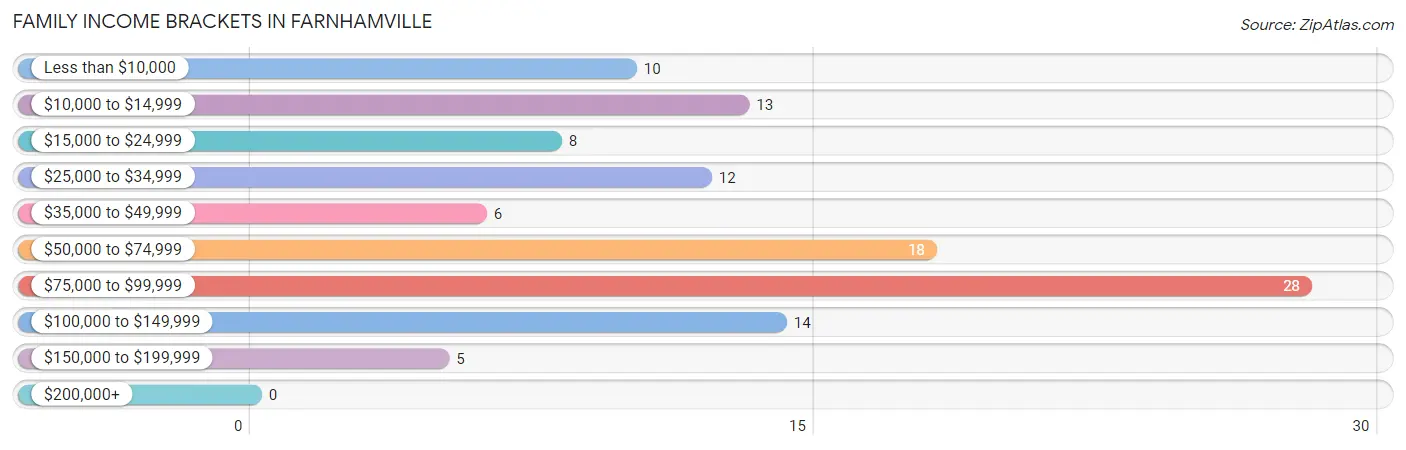
| Income Bracket | # Families | % Families |
| Less than $10,000 | 10 | 8.8% |
| $10,000 to $14,999 | 13 | 11.4% |
| $15,000 to $24,999 | 8 | 7.0% |
| $25,000 to $34,999 | 12 | 10.5% |
| $35,000 to $49,999 | 6 | 5.3% |
| $50,000 to $74,999 | 18 | 15.8% |
| $75,000 to $99,999 | 28 | 24.6% |
| $100,000 to $149,999 | 14 | 12.3% |
| $150,000 to $199,999 | 5 | 4.4% |
| $200,000+ | 0 | 0.0% |
Family Income by Famaliy Size in Farnhamville
5-person families (15 | 13.2%) account for the highest median family income in Farnhamville with $96,406 per family, while 3-person families (19 | 16.7%) have the highest median income of $24,792 per family member.
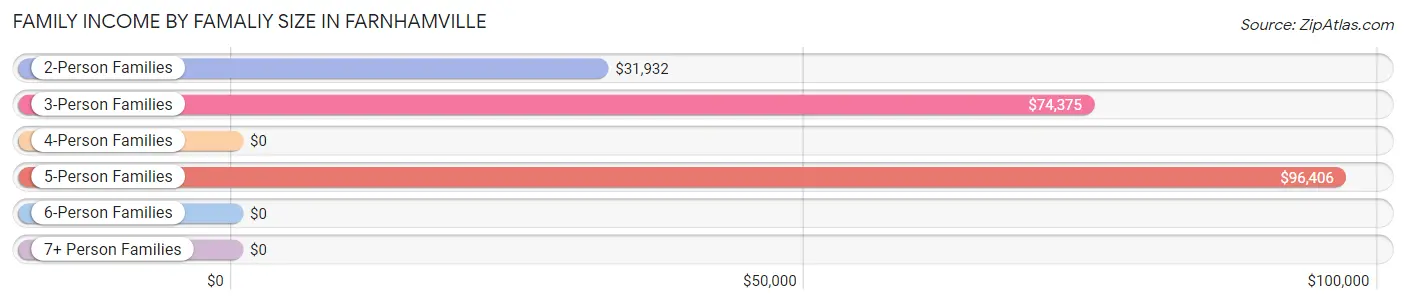
| Income Bracket | # Families | Median Income |
| 2-Person Families | 59 (51.7%) | $31,932 |
| 3-Person Families | 19 (16.7%) | $74,375 |
| 4-Person Families | 5 (4.4%) | $0 |
| 5-Person Families | 15 (13.2%) | $96,406 |
| 6-Person Families | 16 (14.0%) | $0 |
| 7+ Person Families | 0 (0.0%) | $0 |
| Total | 114 (100.0%) | $59,318 |
Family Income by Number of Earners in Farnhamville
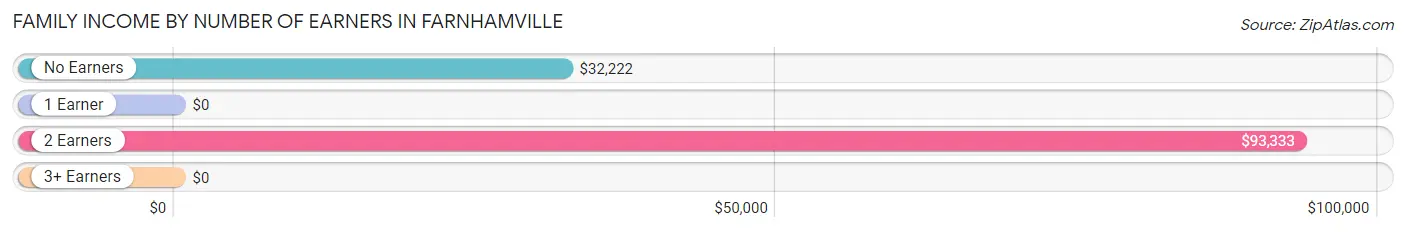
| Number of Earners | # Families | Median Income |
| No Earners | 16 (14.0%) | $32,222 |
| 1 Earner | 55 (48.2%) | $0 |
| 2 Earners | 38 (33.3%) | $93,333 |
| 3+ Earners | 5 (4.4%) | $0 |
| Total | 114 (100.0%) | $59,318 |
Household Income in Farnhamville
Household Income Brackets in Farnhamville
With 36 households falling in the category, the $50,000 to $74,999 income range is the most frequent in Farnhamville, accounting for 19.9% of all households.
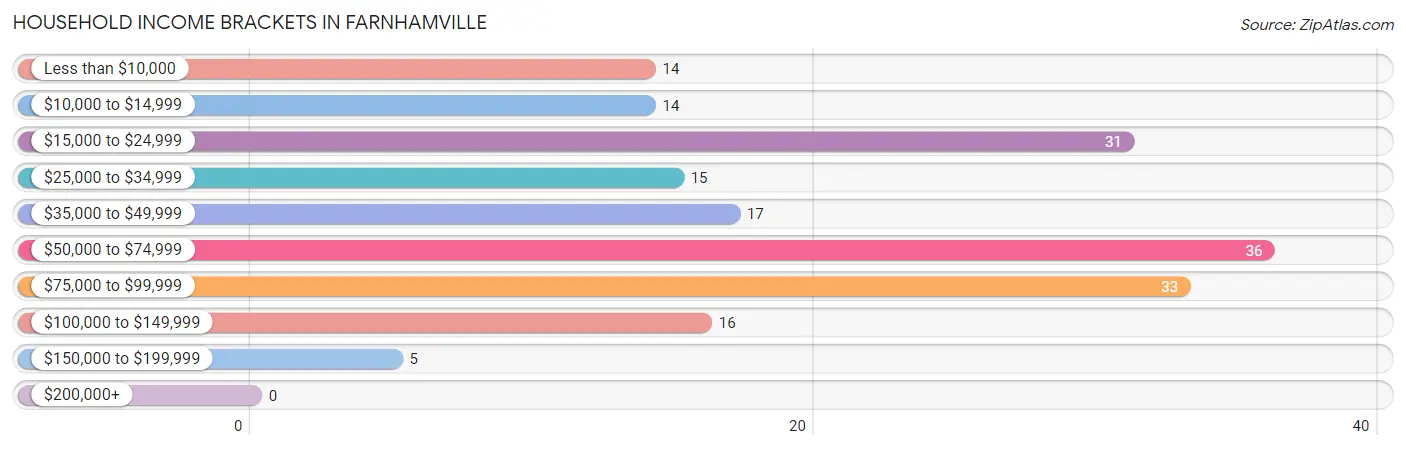
| Income Bracket | # Households | % Households |
| Less than $10,000 | 14 | 7.7% |
| $10,000 to $14,999 | 14 | 7.7% |
| $15,000 to $24,999 | 31 | 17.1% |
| $25,000 to $34,999 | 15 | 8.3% |
| $35,000 to $49,999 | 17 | 9.4% |
| $50,000 to $74,999 | 36 | 19.9% |
| $75,000 to $99,999 | 33 | 18.2% |
| $100,000 to $149,999 | 16 | 8.8% |
| $150,000 to $199,999 | 5 | 2.8% |
| $200,000+ | 0 | 0.0% |
Household Income by Householder Age in Farnhamville
The median household income in Farnhamville is $48,750, with the highest median household income of $64,000 found in the 45 to 64 years age bracket for the primary householder. A total of 52 households (28.7%) fall into this category. Meanwhile, the 15 to 24 years age bracket for the primary householder has the lowest median household income of $0, with 16 households (8.8%) in this group.
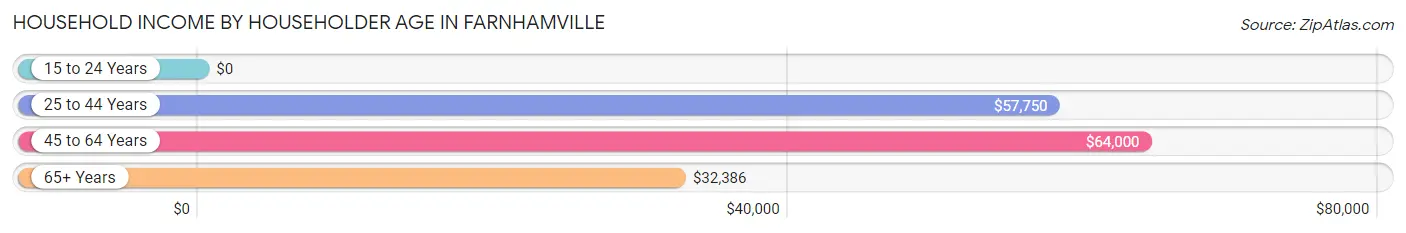
| Income Bracket | # Households | Median Income |
| 15 to 24 Years | 16 (8.8%) | $0 |
| 25 to 44 Years | 56 (30.9%) | $57,750 |
| 45 to 64 Years | 52 (28.7%) | $64,000 |
| 65+ Years | 57 (31.5%) | $32,386 |
| Total | 181 (100.0%) | $48,750 |
Poverty in Farnhamville
Income Below Poverty by Sex and Age in Farnhamville
With 12.0% poverty level for males and 20.3% for females among the residents of Farnhamville, 18 to 24 year old males and 18 to 24 year old females are the most vulnerable to poverty, with 8 males (61.5%) and 14 females (82.4%) in their respective age groups living below the poverty level.
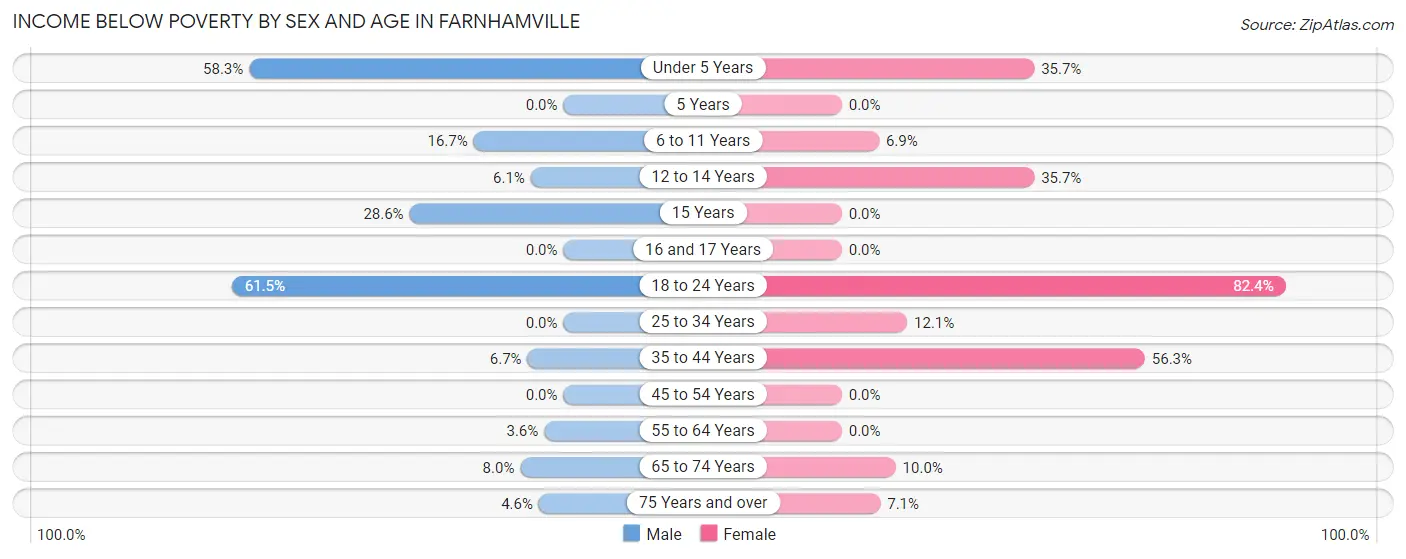
| Age Bracket | Male | Female |
| Under 5 Years | 7 (58.3%) | 5 (35.7%) |
| 5 Years | 0 (0.0%) | 0 (0.0%) |
| 6 to 11 Years | 4 (16.7%) | 2 (6.9%) |
| 12 to 14 Years | 2 (6.1%) | 5 (35.7%) |
| 15 Years | 2 (28.6%) | 0 (0.0%) |
| 16 and 17 Years | 0 (0.0%) | 0 (0.0%) |
| 18 to 24 Years | 8 (61.5%) | 14 (82.4%) |
| 25 to 34 Years | 0 (0.0%) | 4 (12.1%) |
| 35 to 44 Years | 2 (6.7%) | 9 (56.2%) |
| 45 to 54 Years | 0 (0.0%) | 0 (0.0%) |
| 55 to 64 Years | 1 (3.6%) | 0 (0.0%) |
| 65 to 74 Years | 2 (8.0%) | 2 (10.0%) |
| 75 Years and over | 1 (4.5%) | 1 (7.1%) |
| Total | 29 (12.0%) | 42 (20.3%) |
Income Above Poverty by Sex and Age in Farnhamville
According to the poverty statistics in Farnhamville, males aged 16 and 17 years and females aged 5 years are the age groups that are most secure financially, with 100.0% of males and 100.0% of females in these age groups living above the poverty line.
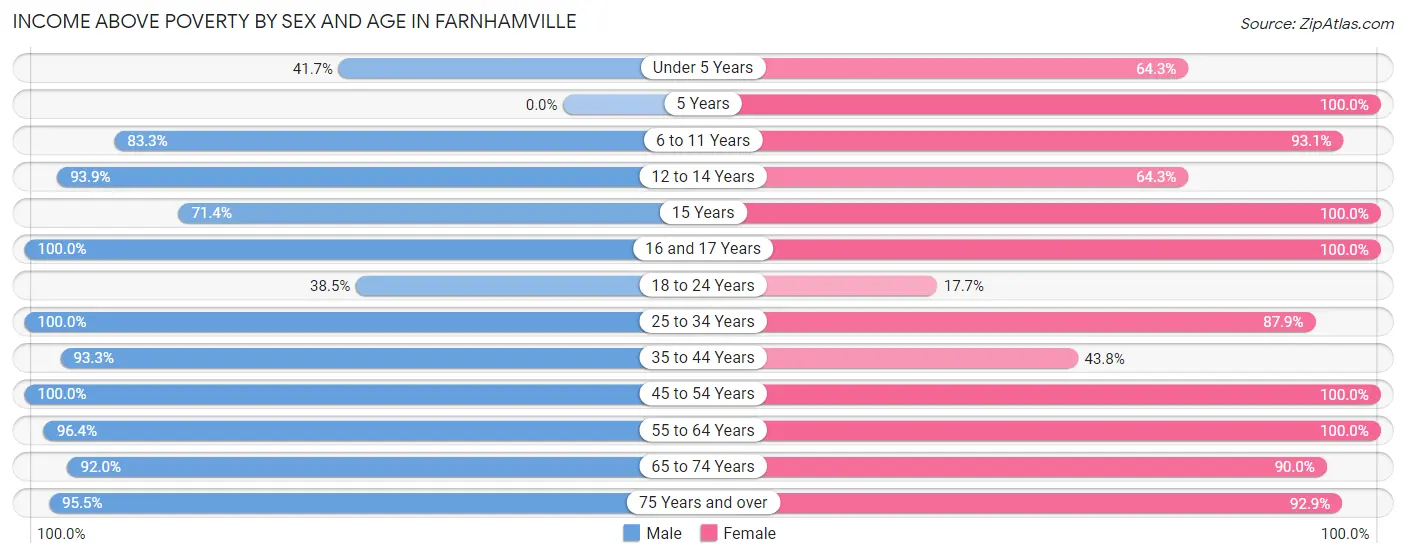
| Age Bracket | Male | Female |
| Under 5 Years | 5 (41.7%) | 9 (64.3%) |
| 5 Years | 0 (0.0%) | 2 (100.0%) |
| 6 to 11 Years | 20 (83.3%) | 27 (93.1%) |
| 12 to 14 Years | 31 (93.9%) | 9 (64.3%) |
| 15 Years | 5 (71.4%) | 2 (100.0%) |
| 16 and 17 Years | 10 (100.0%) | 5 (100.0%) |
| 18 to 24 Years | 5 (38.5%) | 3 (17.6%) |
| 25 to 34 Years | 20 (100.0%) | 29 (87.9%) |
| 35 to 44 Years | 28 (93.3%) | 7 (43.8%) |
| 45 to 54 Years | 17 (100.0%) | 23 (100.0%) |
| 55 to 64 Years | 27 (96.4%) | 18 (100.0%) |
| 65 to 74 Years | 23 (92.0%) | 18 (90.0%) |
| 75 Years and over | 21 (95.5%) | 13 (92.9%) |
| Total | 212 (88.0%) | 165 (79.7%) |
Income Below Poverty Among Married-Couple Families in Farnhamville
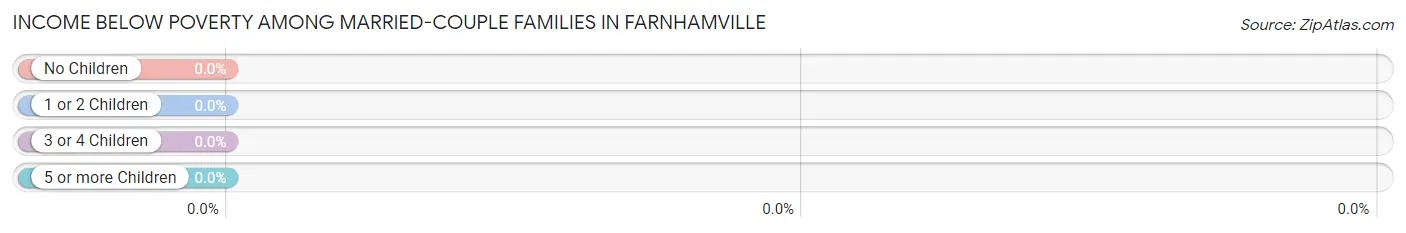
| Children | Above Poverty | Below Poverty |
| No Children | 40 (100.0%) | 0 (0.0%) |
| 1 or 2 Children | 12 (100.0%) | 0 (0.0%) |
| 3 or 4 Children | 30 (100.0%) | 0 (0.0%) |
| 5 or more Children | 0 (0.0%) | 0 (0.0%) |
| Total | 82 (100.0%) | 0 (0.0%) |
Income Below Poverty Among Single-Parent Households in Farnhamville
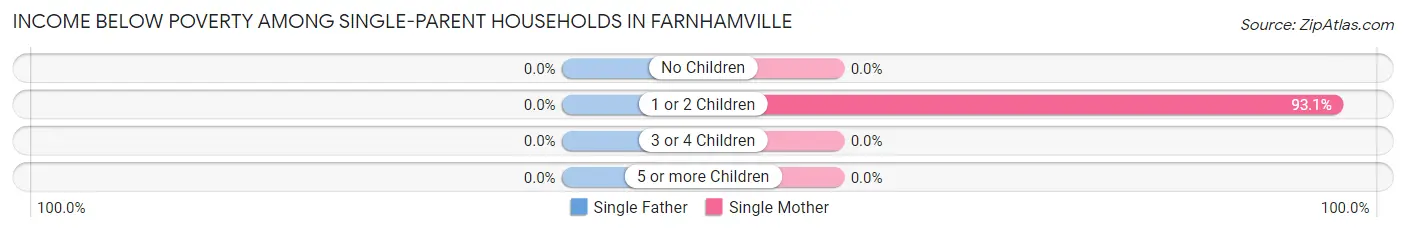
| Children | Single Father | Single Mother |
| No Children | 0 (0.0%) | 0 (0.0%) |
| 1 or 2 Children | 0 (0.0%) | 27 (93.1%) |
| 3 or 4 Children | 0 (0.0%) | 0 (0.0%) |
| 5 or more Children | 0 (0.0%) | 0 (0.0%) |
| Total | 0 (0.0%) | 27 (90.0%) |
Income Below Poverty Among Married-Couple vs Single-Parent Households in Farnhamville
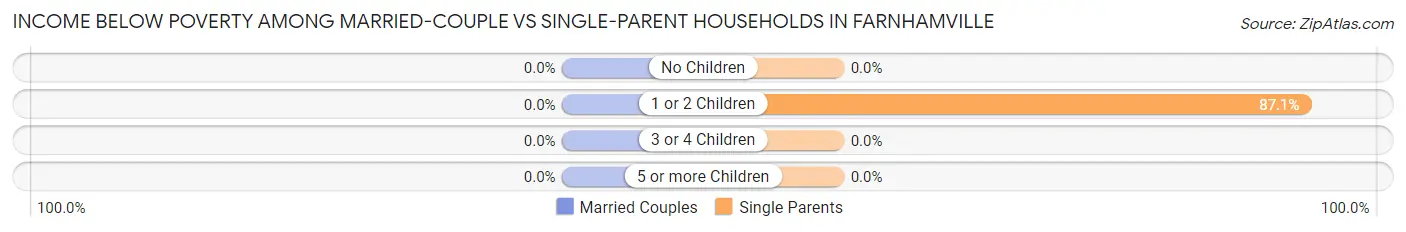
| Children | Married-Couple Families | Single-Parent Households |
| No Children | 0 (0.0%) | 0 (0.0%) |
| 1 or 2 Children | 0 (0.0%) | 27 (87.1%) |
| 3 or 4 Children | 0 (0.0%) | 0 (0.0%) |
| 5 or more Children | 0 (0.0%) | 0 (0.0%) |
| Total | 0 (0.0%) | 27 (84.4%) |
Race in Farnhamville
The most populous races in Farnhamville are White / Caucasian (402 | 89.7%), Black / African American (36 | 8.0%), and Two or more Races (10 | 2.2%).
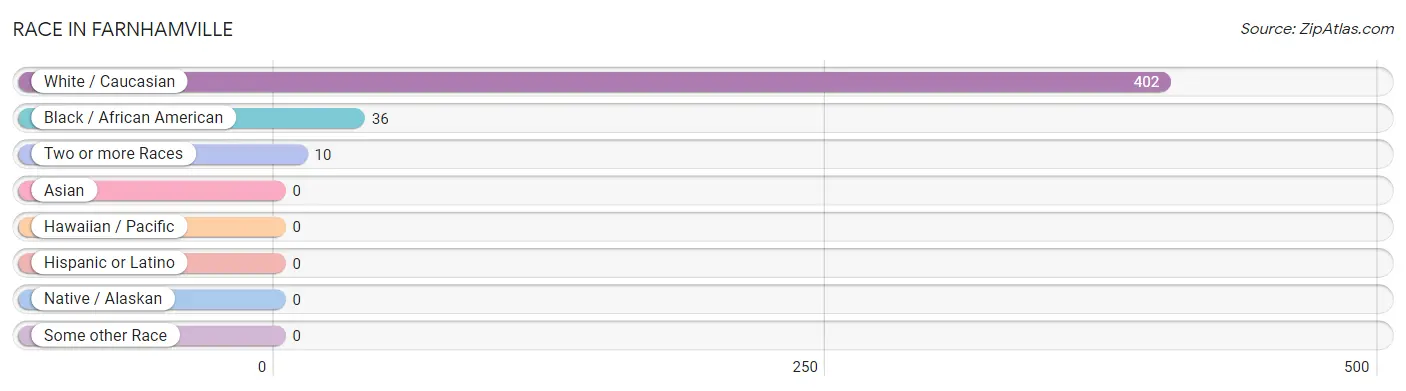
| Race | # Population | % Population |
| Asian | 0 | 0.0% |
| Black / African American | 36 | 8.0% |
| Hawaiian / Pacific | 0 | 0.0% |
| Hispanic or Latino | 0 | 0.0% |
| Native / Alaskan | 0 | 0.0% |
| White / Caucasian | 402 | 89.7% |
| Two or more Races | 10 | 2.2% |
| Some other Race | 0 | 0.0% |
| Total | 448 | 100.0% |
Ancestry in Farnhamville
The most populous ancestries reported in Farnhamville are German (82 | 18.3%), Irish (40 | 8.9%), English (33 | 7.4%), Norwegian (18 | 4.0%), and Swedish (17 | 3.8%), together accounting for 42.4% of all Farnhamville residents.
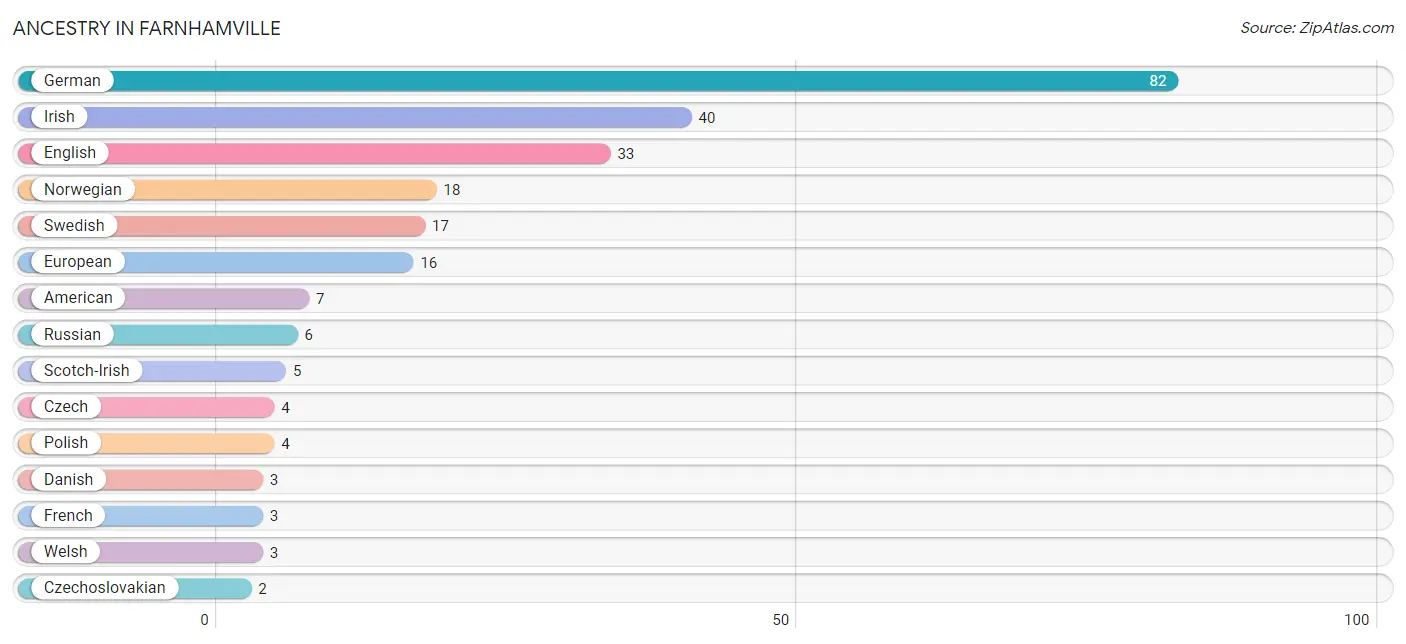
| Ancestry | # Population | % Population |
| American | 7 | 1.6% |
| Czech | 4 | 0.9% |
| Czechoslovakian | 2 | 0.4% |
| Danish | 3 | 0.7% |
| Dutch | 1 | 0.2% |
| English | 33 | 7.4% |
| European | 16 | 3.6% |
| Finnish | 1 | 0.2% |
| French | 3 | 0.7% |
| German | 82 | 18.3% |
| Irish | 40 | 8.9% |
| Norwegian | 18 | 4.0% |
| Pennsylvania German | 2 | 0.4% |
| Polish | 4 | 0.9% |
| Russian | 6 | 1.3% |
| Scotch-Irish | 5 | 1.1% |
| Swedish | 17 | 3.8% |
| Welsh | 3 | 0.7% | View All 18 Rows |
Immigrants in Farnhamville

| Immigration Origin | # Population | % Population | View All 0 Rows |
Sex and Age in Farnhamville
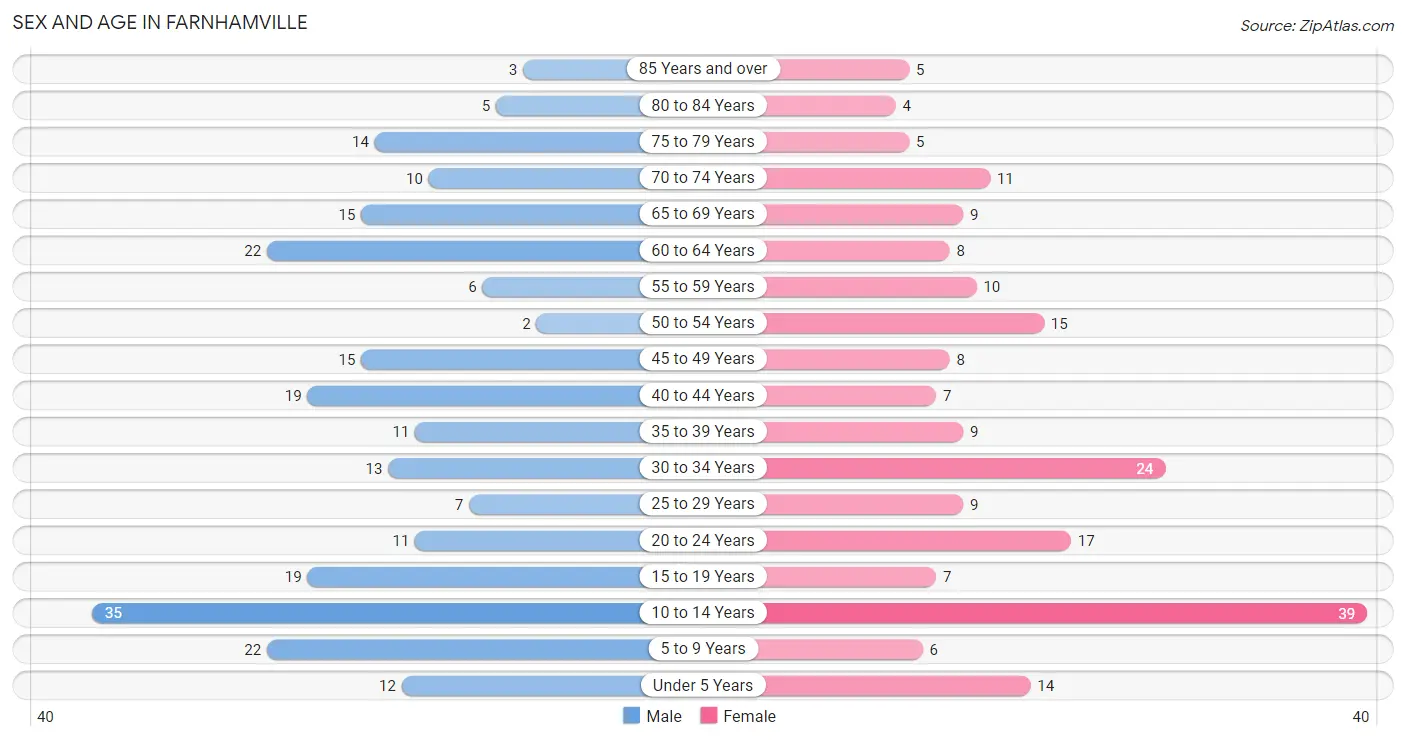
Sex and Age in Farnhamville
The most populous age groups in Farnhamville are 10 to 14 Years (35 | 14.5%) for men and 10 to 14 Years (39 | 18.8%) for women.
| Age Bracket | Male | Female |
| Under 5 Years | 12 (5.0%) | 14 (6.8%) |
| 5 to 9 Years | 22 (9.1%) | 6 (2.9%) |
| 10 to 14 Years | 35 (14.5%) | 39 (18.8%) |
| 15 to 19 Years | 19 (7.9%) | 7 (3.4%) |
| 20 to 24 Years | 11 (4.6%) | 17 (8.2%) |
| 25 to 29 Years | 7 (2.9%) | 9 (4.3%) |
| 30 to 34 Years | 13 (5.4%) | 24 (11.6%) |
| 35 to 39 Years | 11 (4.6%) | 9 (4.3%) |
| 40 to 44 Years | 19 (7.9%) | 7 (3.4%) |
| 45 to 49 Years | 15 (6.2%) | 8 (3.9%) |
| 50 to 54 Years | 2 (0.8%) | 15 (7.2%) |
| 55 to 59 Years | 6 (2.5%) | 10 (4.8%) |
| 60 to 64 Years | 22 (9.1%) | 8 (3.9%) |
| 65 to 69 Years | 15 (6.2%) | 9 (4.3%) |
| 70 to 74 Years | 10 (4.2%) | 11 (5.3%) |
| 75 to 79 Years | 14 (5.8%) | 5 (2.4%) |
| 80 to 84 Years | 5 (2.1%) | 4 (1.9%) |
| 85 Years and over | 3 (1.2%) | 5 (2.4%) |
| Total | 241 (100.0%) | 207 (100.0%) |
Families and Households in Farnhamville
Median Family Size in Farnhamville
The median family size in Farnhamville is 3.22 persons per family, with married-couple families (82 | 71.9%) accounting for the largest median family size of 3.6 persons per family. On the other hand, single male/father families (2 | 1.8%) represent the smallest median family size with 2.00 persons per family.
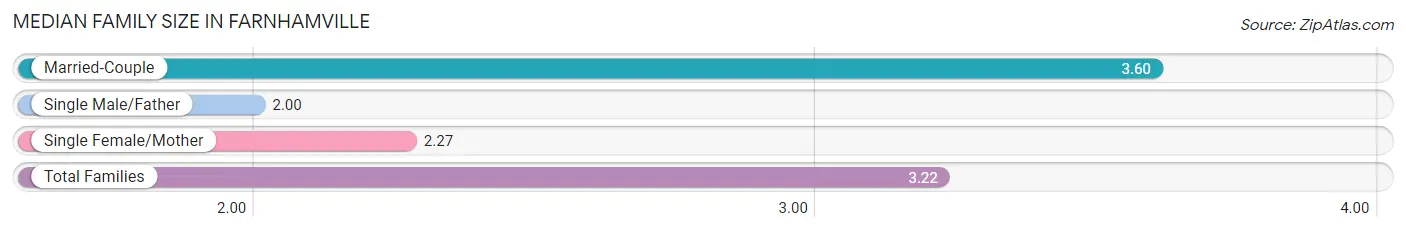
| Family Type | # Families | Family Size |
| Married-Couple | 82 (71.9%) | 3.60 |
| Single Male/Father | 2 (1.8%) | 2.00 |
| Single Female/Mother | 30 (26.3%) | 2.27 |
| Total Families | 114 (100.0%) | 3.22 |
Median Household Size in Farnhamville
The median household size in Farnhamville is 2.48 persons per household, with married-couple households (82 | 45.3%) accounting for the largest median household size of 3.62 persons per household. non-family households (67 | 37.0%) represent the smallest median household size with 1.06 persons per household.
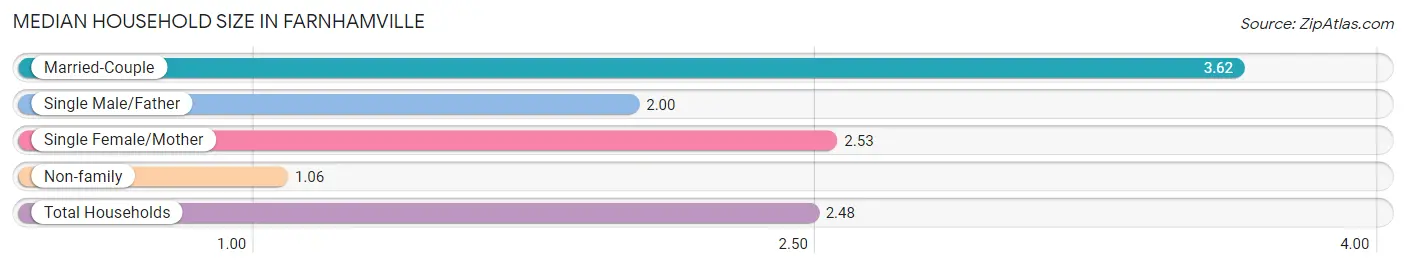
| Household Type | # Households | Household Size |
| Married-Couple | 82 (45.3%) | 3.62 |
| Single Male/Father | 2 (1.1%) | 2.00 |
| Single Female/Mother | 30 (16.6%) | 2.53 |
| Non-family | 67 (37.0%) | 1.06 |
| Total Households | 181 (100.0%) | 2.48 |
Household Size by Marriage Status in Farnhamville
Out of a total of 181 households in Farnhamville, 114 (63.0%) are family households, while 67 (37.0%) are nonfamily households. The most numerous type of family households are 2-person households, comprising 53, and the most common type of nonfamily households are 1-person households, comprising 62.
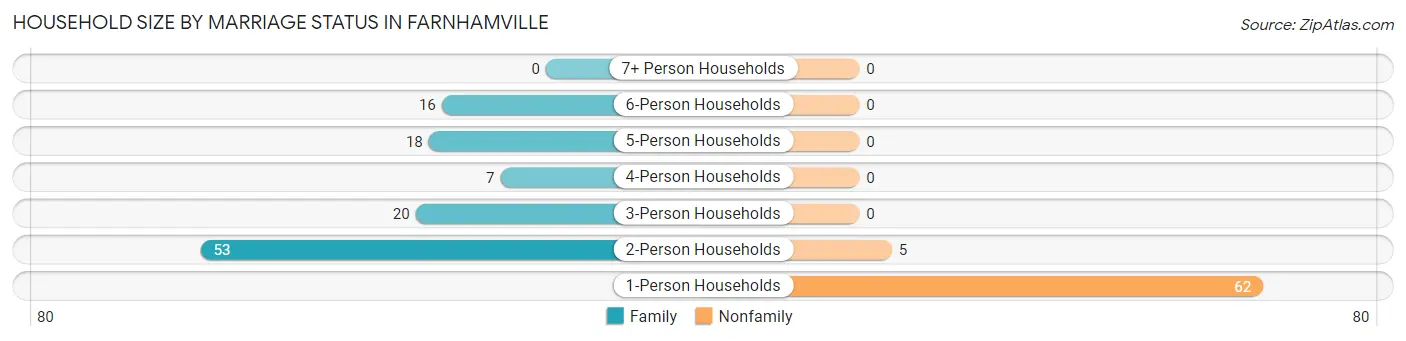
| Household Size | Family Households | Nonfamily Households |
| 1-Person Households | - | 62 (34.3%) |
| 2-Person Households | 53 (29.3%) | 5 (2.8%) |
| 3-Person Households | 20 (11.1%) | 0 (0.0%) |
| 4-Person Households | 7 (3.9%) | 0 (0.0%) |
| 5-Person Households | 18 (9.9%) | 0 (0.0%) |
| 6-Person Households | 16 (8.8%) | 0 (0.0%) |
| 7+ Person Households | 0 (0.0%) | 0 (0.0%) |
| Total | 114 (63.0%) | 67 (37.0%) |
Female Fertility in Farnhamville
Fertility by Age in Farnhamville
Average fertility rate in Farnhamville is 96.0 births per 1,000 women. Women in the age bracket of 20 to 34 years have the highest fertility rate with 160.0 births per 1,000 women. Women in the age bracket of 20 to 34 years acount for 100.0% of all women with births.
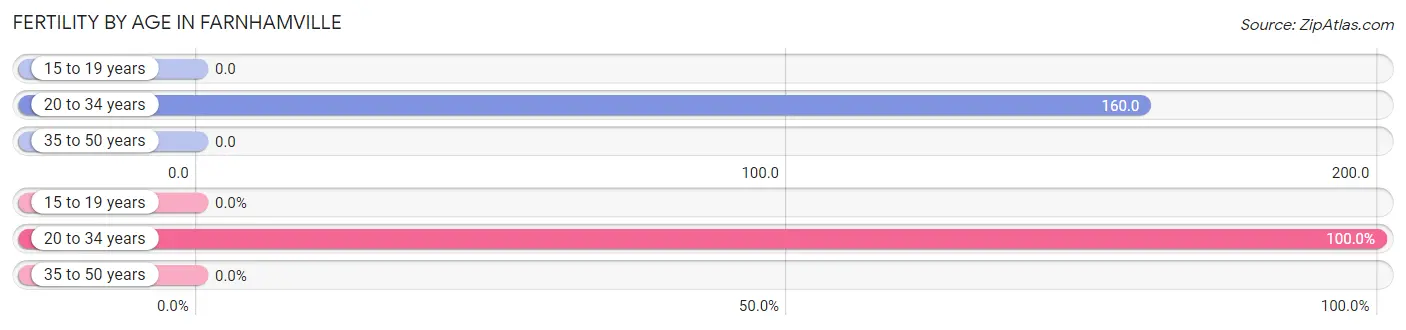
| Age Bracket | Women with Births | Births / 1,000 Women |
| 15 to 19 years | 0 (0.0%) | 0.0 |
| 20 to 34 years | 8 (100.0%) | 160.0 |
| 35 to 50 years | 0 (0.0%) | 0.0 |
| Total | 8 (100.0%) | 96.0 |
Fertility by Age by Marriage Status in Farnhamville
37.5% of women with births (8) in Farnhamville are married. The highest percentage of unmarried women with births falls into 20 to 34 years age bracket with 62.5% of them unmarried at the time of birth, while the lowest percentage of unmarried women with births belong to 20 to 34 years age bracket with 62.5% of them unmarried.
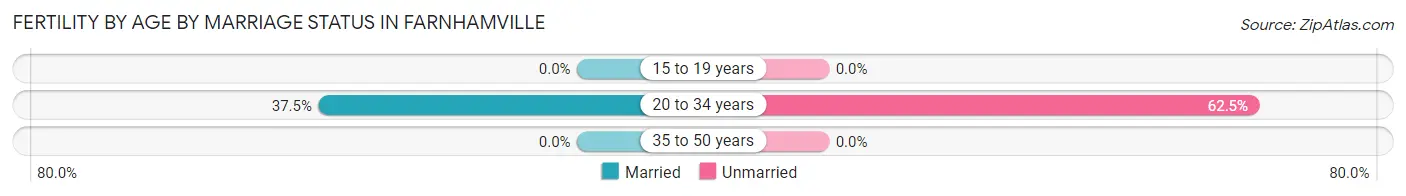
| Age Bracket | Married | Unmarried |
| 15 to 19 years | 0 (0.0%) | 0 (0.0%) |
| 20 to 34 years | 3 (37.5%) | 5 (62.5%) |
| 35 to 50 years | 0 (0.0%) | 0 (0.0%) |
| Total | 3 (37.5%) | 5 (62.5%) |
Fertility by Education in Farnhamville
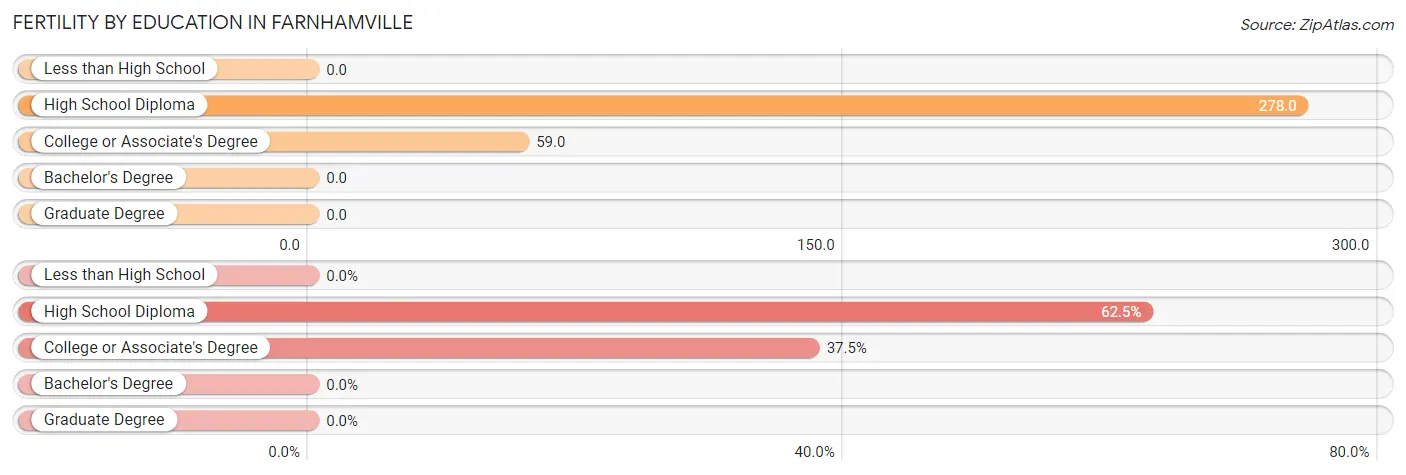
| Educational Attainment | Women with Births | Births / 1,000 Women |
| Less than High School | 0 (0.0%) | 0.0 |
| High School Diploma | 5 (62.5%) | 278.0 |
| College or Associate's Degree | 3 (37.5%) | 59.0 |
| Bachelor's Degree | 0 (0.0%) | 0.0 |
| Graduate Degree | 0 (0.0%) | 0.0 |
| Total | 8 (100.0%) | 96.0 |
Fertility by Education by Marriage Status in Farnhamville
62.5% of women with births in Farnhamville are unmarried. Women with the educational attainment of college or associate's degree are most likely to be married with 100.0% of them married at childbirth, while women with the educational attainment of high school diploma are least likely to be married with 100.0% of them unmarried at childbirth.
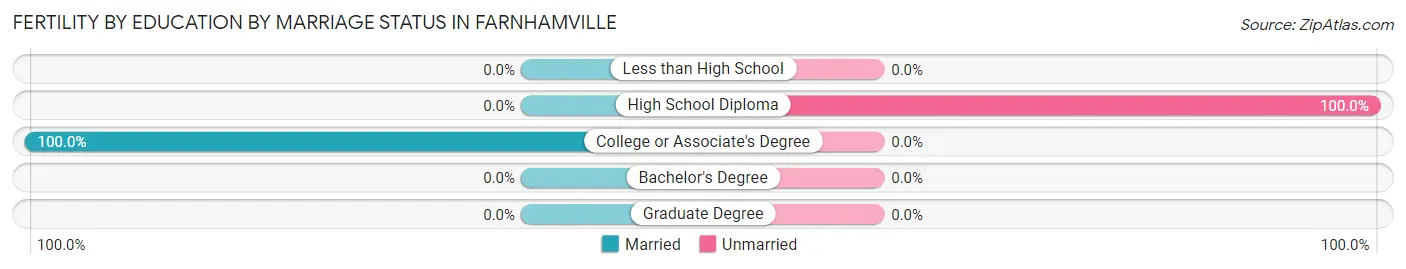
| Educational Attainment | Married | Unmarried |
| Less than High School | 0 (0.0%) | 0 (0.0%) |
| High School Diploma | 0 (0.0%) | 5 (100.0%) |
| College or Associate's Degree | 3 (100.0%) | 0 (0.0%) |
| Bachelor's Degree | 0 (0.0%) | 0 (0.0%) |
| Graduate Degree | 0 (0.0%) | 0 (0.0%) |
| Total | 3 (37.5%) | 5 (62.5%) |
Employment Characteristics in Farnhamville
Employment by Class of Employer in Farnhamville
Among the 182 employed individuals in Farnhamville, private company employees (110 | 60.4%), not-for-profit organizations (27 | 14.8%), and self-employed (not incorporated) (22 | 12.1%) make up the most common classes of employment.
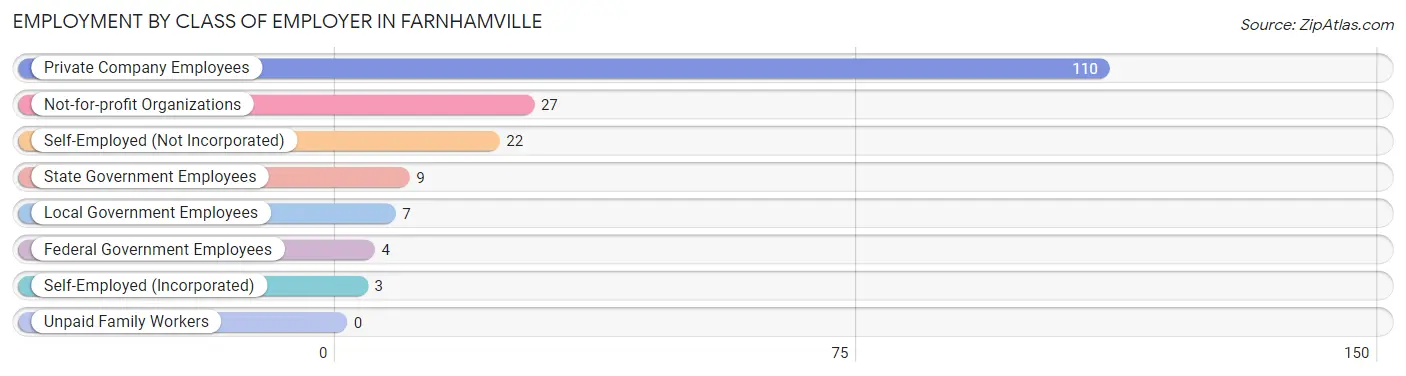
| Employer Class | # Employees | % Employees |
| Private Company Employees | 110 | 60.4% |
| Self-Employed (Incorporated) | 3 | 1.7% |
| Self-Employed (Not Incorporated) | 22 | 12.1% |
| Not-for-profit Organizations | 27 | 14.8% |
| Local Government Employees | 7 | 3.8% |
| State Government Employees | 9 | 5.0% |
| Federal Government Employees | 4 | 2.2% |
| Unpaid Family Workers | 0 | 0.0% |
| Total | 182 | 100.0% |
Employment Status by Age in Farnhamville
According to the labor force statistics for Farnhamville, out of the total population over 16 years of age (311), 60.8% or 189 individuals are in the labor force, with 1.1% or 2 of them unemployed. The age group with the highest labor force participation rate is 25 to 29 years, with 100.0% or 16 individuals in the labor force. Within the labor force, the 65 to 74 years age range has the highest percentage of unemployed individuals, with 20.0% or 2 of them being unemployed.
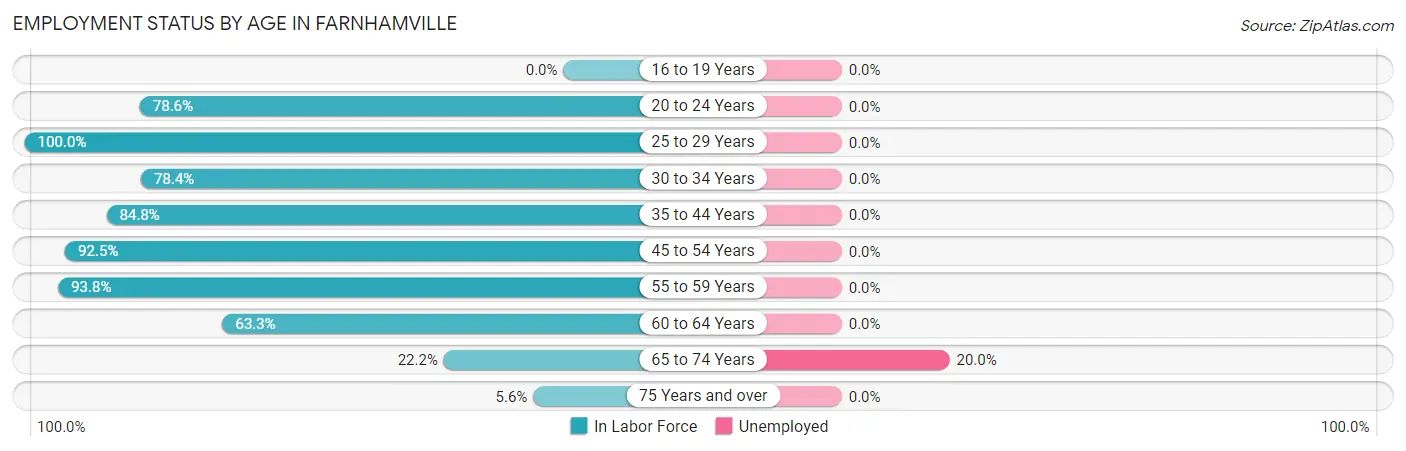
| Age Bracket | In Labor Force | Unemployed |
| 16 to 19 Years | 0 (0.0%) | 0 (0.0%) |
| 20 to 24 Years | 22 (78.6%) | 0 (0.0%) |
| 25 to 29 Years | 16 (100.0%) | 0 (0.0%) |
| 30 to 34 Years | 29 (78.4%) | 0 (0.0%) |
| 35 to 44 Years | 39 (84.8%) | 0 (0.0%) |
| 45 to 54 Years | 37 (92.5%) | 0 (0.0%) |
| 55 to 59 Years | 15 (93.8%) | 0 (0.0%) |
| 60 to 64 Years | 19 (63.3%) | 0 (0.0%) |
| 65 to 74 Years | 10 (22.2%) | 2 (20.0%) |
| 75 Years and over | 2 (5.6%) | 0 (0.0%) |
| Total | 189 (60.8%) | 2 (1.1%) |
Employment Status by Educational Attainment in Farnhamville
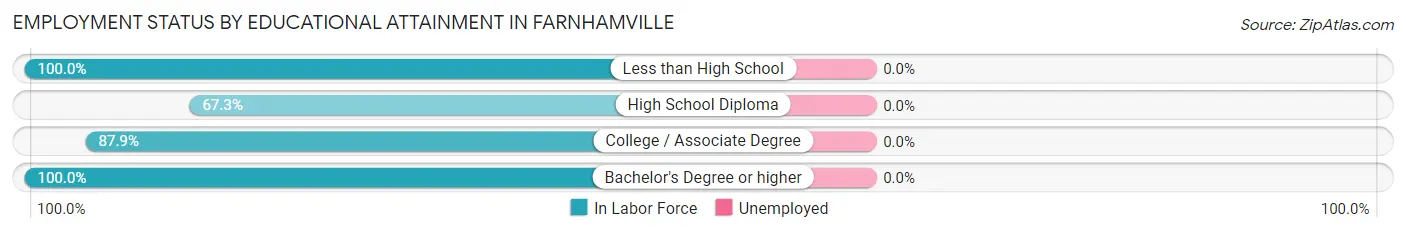
| Educational Attainment | In Labor Force | Unemployed |
| Less than High School | 1 (100.0%) | 0 (0.0%) |
| High School Diploma | 35 (67.3%) | 0 (0.0%) |
| College / Associate Degree | 94 (87.9%) | 0 (0.0%) |
| Bachelor's Degree or higher | 25 (100.0%) | 0 (0.0%) |
| Total | 155 (83.8%) | 0 (0.0%) |
Employment Occupations by Sex in Farnhamville
Management, Business, Science and Arts Occupations
The most common Management, Business, Science and Arts occupations in Farnhamville are Community & Social Service (29 | 15.5%), Management (20 | 10.7%), Education, Arts & Media (16 | 8.6%), Education Instruction & Library (12 | 6.4%), and Health Diagnosing & Treating (12 | 6.4%).
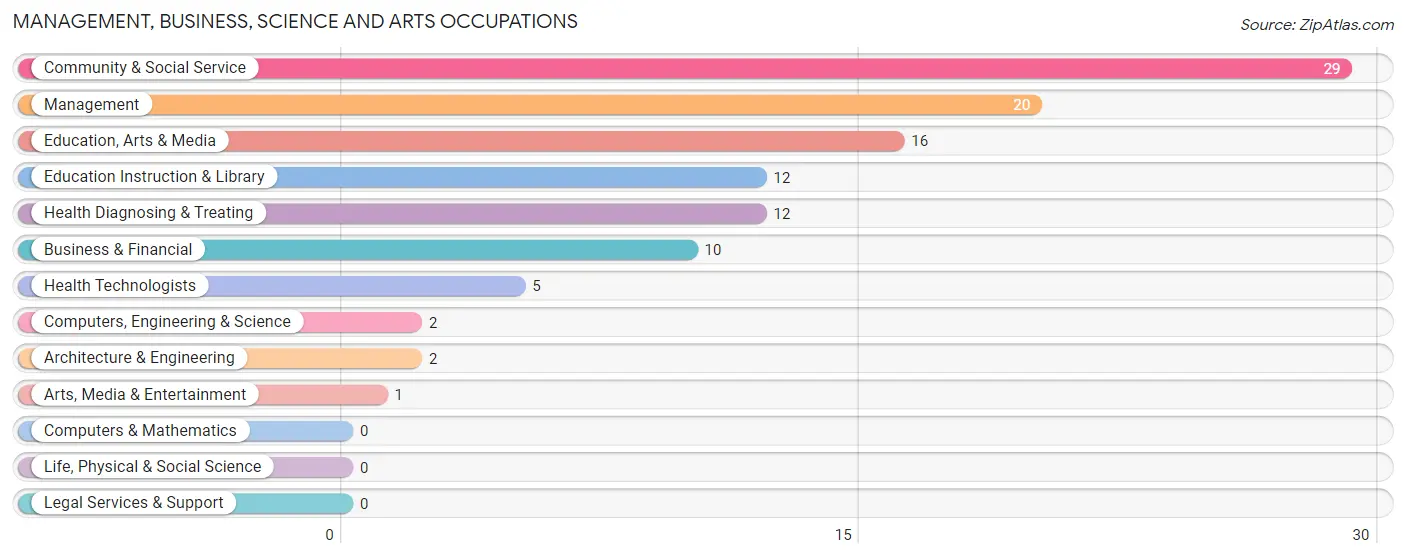
Management, Business, Science and Arts Occupations by Sex
Within the Management, Business, Science and Arts occupations in Farnhamville, the most male-oriented occupations are Computers, Engineering & Science (100.0%), Architecture & Engineering (100.0%), and Education, Arts & Media (50.0%), while the most female-oriented occupations are Arts, Media & Entertainment (100.0%), Health Technologists (100.0%), and Education Instruction & Library (83.3%).
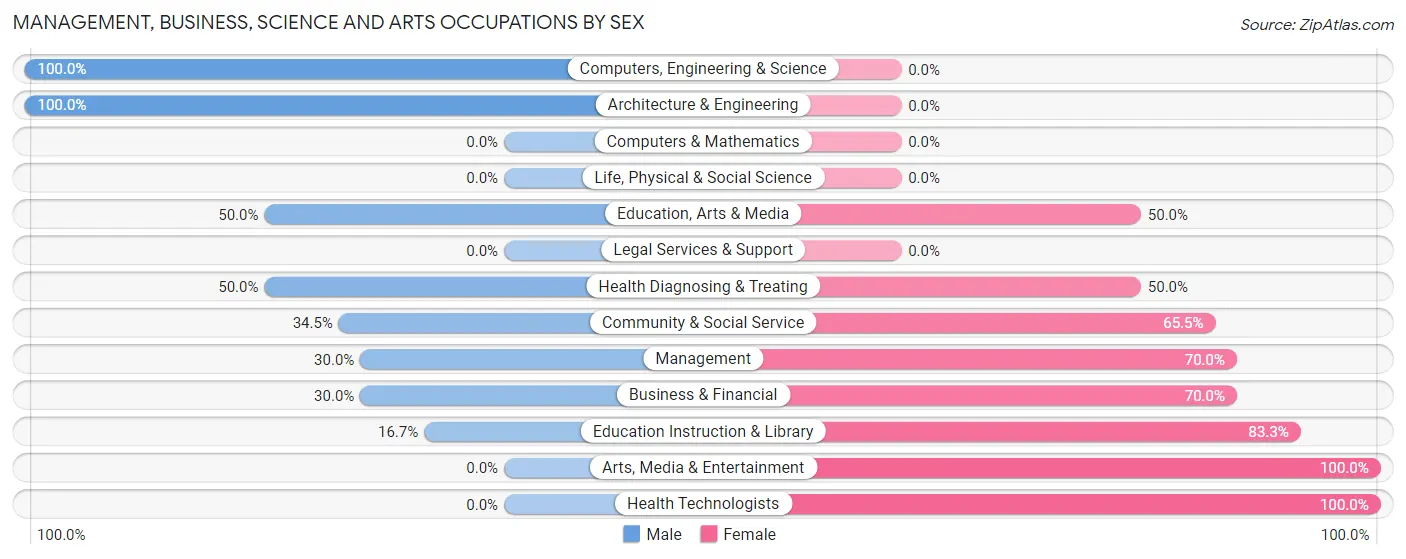
| Occupation | Male | Female |
| Management | 6 (30.0%) | 14 (70.0%) |
| Business & Financial | 3 (30.0%) | 7 (70.0%) |
| Computers, Engineering & Science | 2 (100.0%) | 0 (0.0%) |
| Computers & Mathematics | 0 (0.0%) | 0 (0.0%) |
| Architecture & Engineering | 2 (100.0%) | 0 (0.0%) |
| Life, Physical & Social Science | 0 (0.0%) | 0 (0.0%) |
| Community & Social Service | 10 (34.5%) | 19 (65.5%) |
| Education, Arts & Media | 8 (50.0%) | 8 (50.0%) |
| Legal Services & Support | 0 (0.0%) | 0 (0.0%) |
| Education Instruction & Library | 2 (16.7%) | 10 (83.3%) |
| Arts, Media & Entertainment | 0 (0.0%) | 1 (100.0%) |
| Health Diagnosing & Treating | 6 (50.0%) | 6 (50.0%) |
| Health Technologists | 0 (0.0%) | 5 (100.0%) |
| Total (Category) | 27 (37.0%) | 46 (63.0%) |
| Total (Overall) | 101 (54.0%) | 86 (46.0%) |
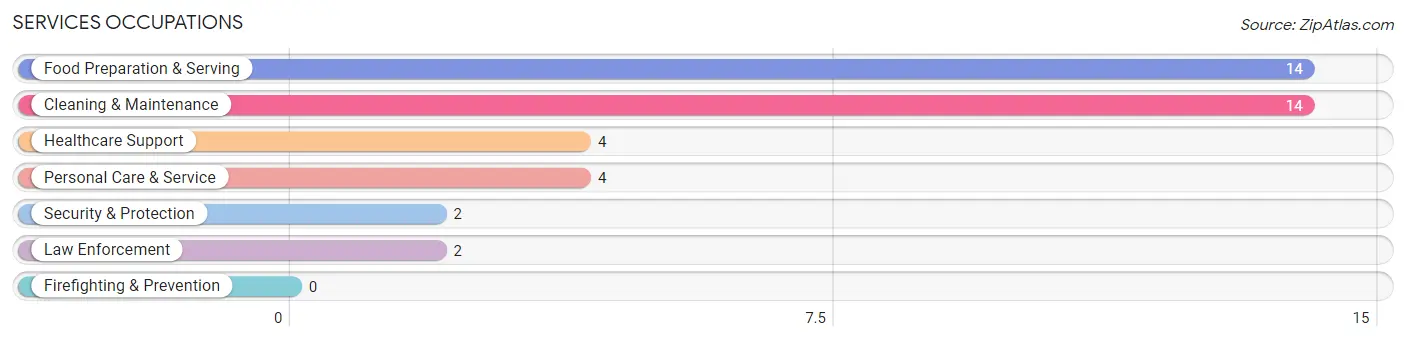
Services Occupations
The most common Services occupations in Farnhamville are Food Preparation & Serving (14 | 7.5%), Cleaning & Maintenance (14 | 7.5%), Healthcare Support (4 | 2.1%), Personal Care & Service (4 | 2.1%), and Security & Protection (2 | 1.1%).
Services Occupations by Sex
Within the Services occupations in Farnhamville, the most male-oriented occupations are Security & Protection (100.0%), Law Enforcement (100.0%), and Cleaning & Maintenance (85.7%), while the most female-oriented occupations are Personal Care & Service (100.0%), Healthcare Support (75.0%), and Food Preparation & Serving (64.3%).
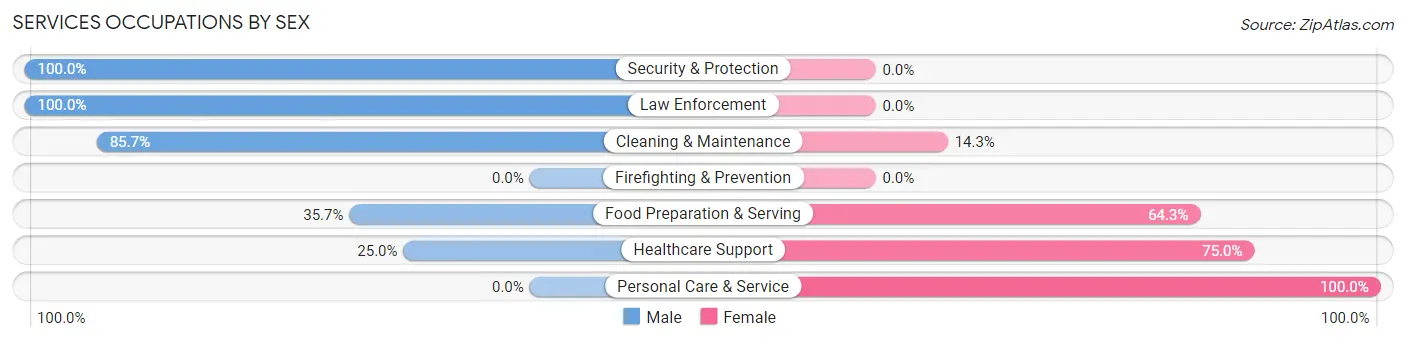
| Occupation | Male | Female |
| Healthcare Support | 1 (25.0%) | 3 (75.0%) |
| Security & Protection | 2 (100.0%) | 0 (0.0%) |
| Firefighting & Prevention | 0 (0.0%) | 0 (0.0%) |
| Law Enforcement | 2 (100.0%) | 0 (0.0%) |
| Food Preparation & Serving | 5 (35.7%) | 9 (64.3%) |
| Cleaning & Maintenance | 12 (85.7%) | 2 (14.3%) |
| Personal Care & Service | 0 (0.0%) | 4 (100.0%) |
| Total (Category) | 20 (52.6%) | 18 (47.4%) |
| Total (Overall) | 101 (54.0%) | 86 (46.0%) |
Sales and Office Occupations
The most common Sales and Office occupations in Farnhamville are Office & Administration (12 | 6.4%), and Sales & Related (4 | 2.1%).
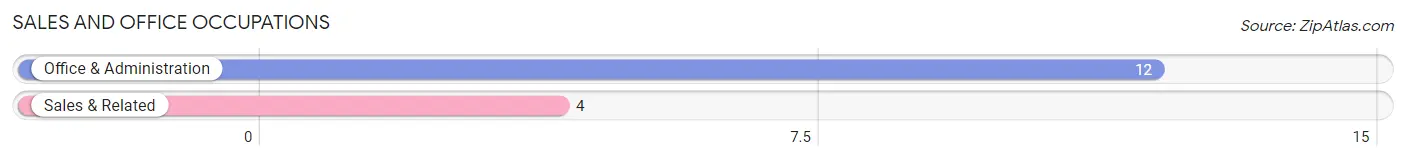
Sales and Office Occupations by Sex

| Occupation | Male | Female |
| Sales & Related | 4 (100.0%) | 0 (0.0%) |
| Office & Administration | 1 (8.3%) | 11 (91.7%) |
| Total (Category) | 5 (31.2%) | 11 (68.8%) |
| Total (Overall) | 101 (54.0%) | 86 (46.0%) |
Natural Resources, Construction and Maintenance Occupations
The most common Natural Resources, Construction and Maintenance occupations in Farnhamville are Installation, Maintenance & Repair (25 | 13.4%), Construction & Extraction (16 | 8.6%), and Farming, Fishing & Forestry (7 | 3.7%).
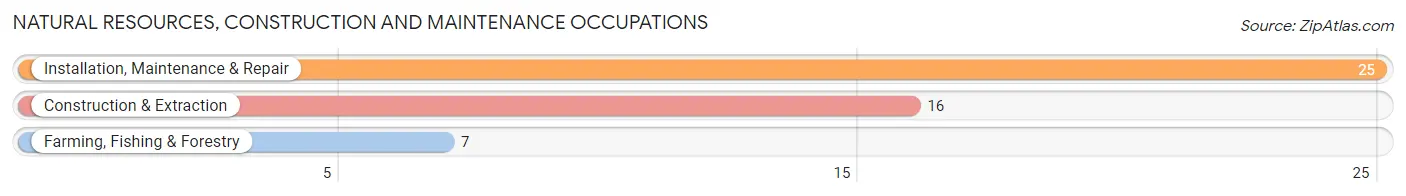
Natural Resources, Construction and Maintenance Occupations by Sex
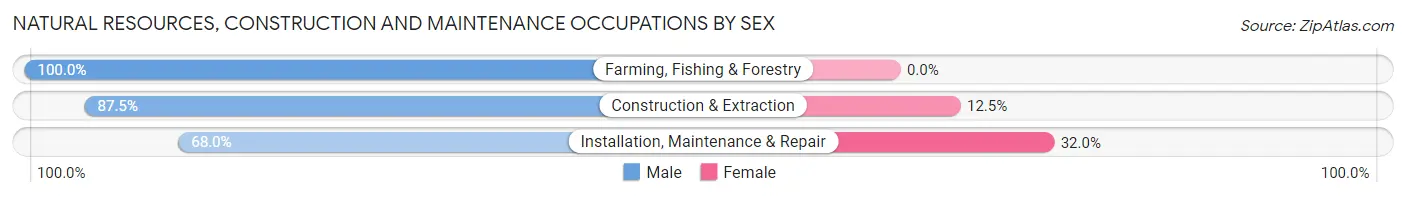
| Occupation | Male | Female |
| Farming, Fishing & Forestry | 7 (100.0%) | 0 (0.0%) |
| Construction & Extraction | 14 (87.5%) | 2 (12.5%) |
| Installation, Maintenance & Repair | 17 (68.0%) | 8 (32.0%) |
| Total (Category) | 38 (79.2%) | 10 (20.8%) |
| Total (Overall) | 101 (54.0%) | 86 (46.0%) |
Production, Transportation and Moving Occupations
The most common Production, Transportation and Moving occupations in Farnhamville are Production (7 | 3.7%), Material Moving (3 | 1.6%), and Transportation (2 | 1.1%).
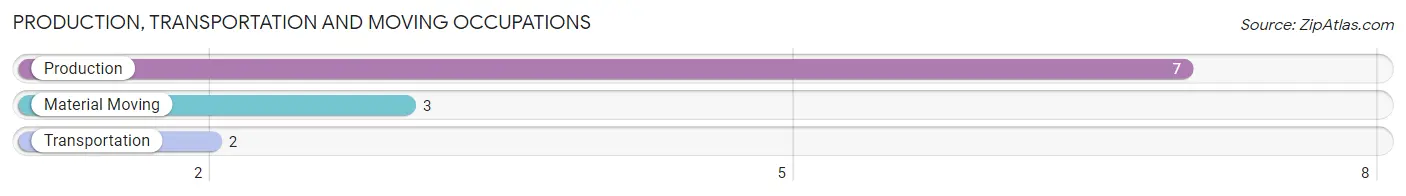
Production, Transportation and Moving Occupations by Sex
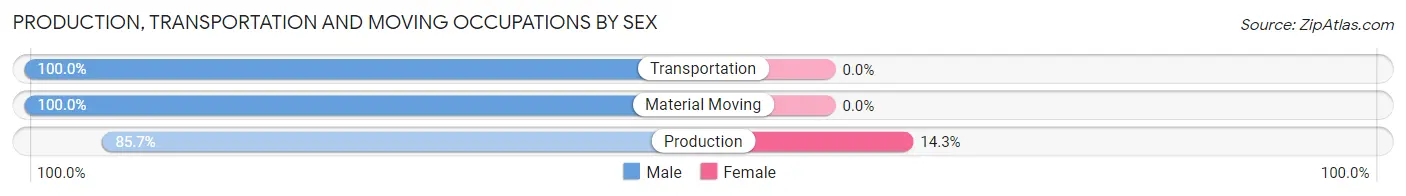
| Occupation | Male | Female |
| Production | 6 (85.7%) | 1 (14.3%) |
| Transportation | 2 (100.0%) | 0 (0.0%) |
| Material Moving | 3 (100.0%) | 0 (0.0%) |
| Total (Category) | 11 (91.7%) | 1 (8.3%) |
| Total (Overall) | 101 (54.0%) | 86 (46.0%) |
Employment Industries by Sex in Farnhamville
Employment Industries in Farnhamville
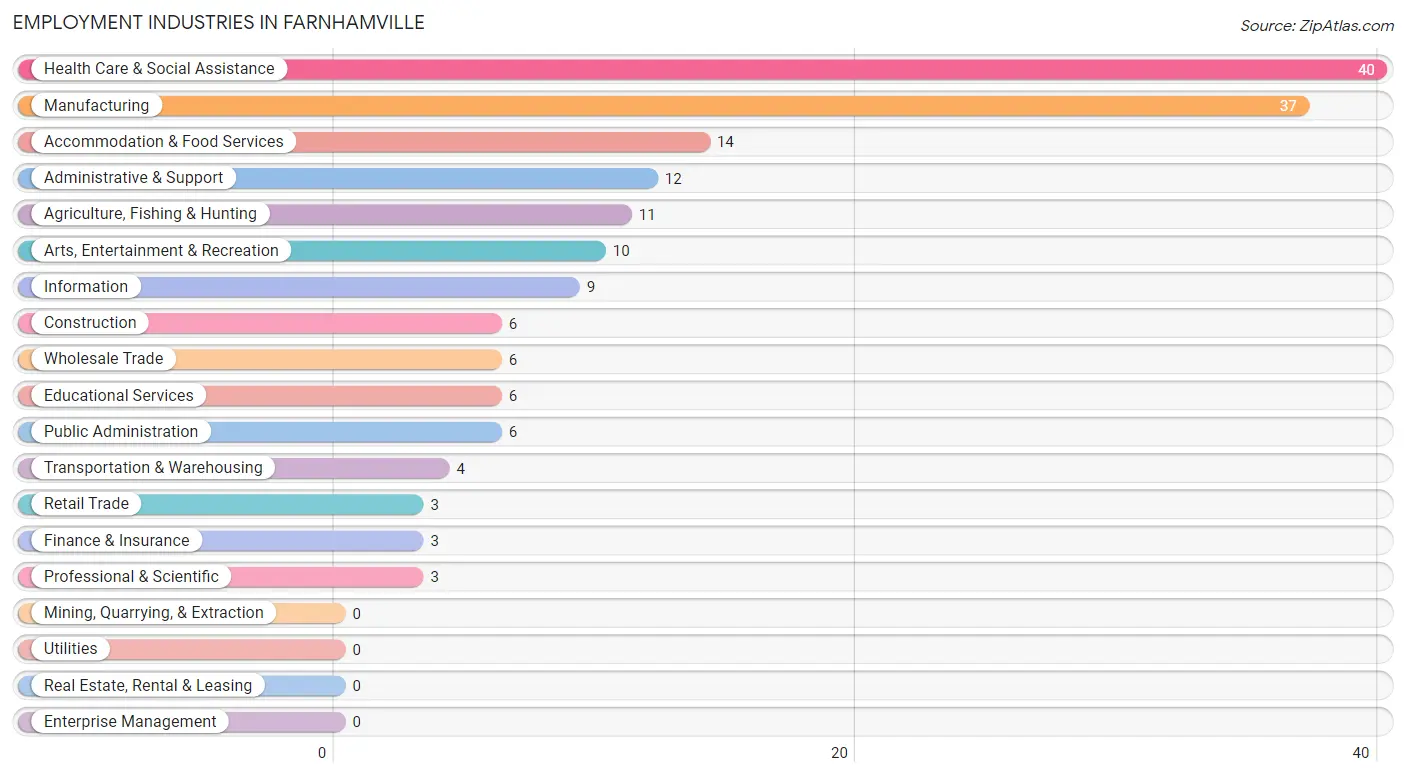
The major employment industries in Farnhamville include Health Care & Social Assistance (40 | 21.4%), Manufacturing (37 | 19.8%), Accommodation & Food Services (14 | 7.5%), Administrative & Support (12 | 6.4%), and Agriculture, Fishing & Hunting (11 | 5.9%).
Employment Industries by Sex in Farnhamville
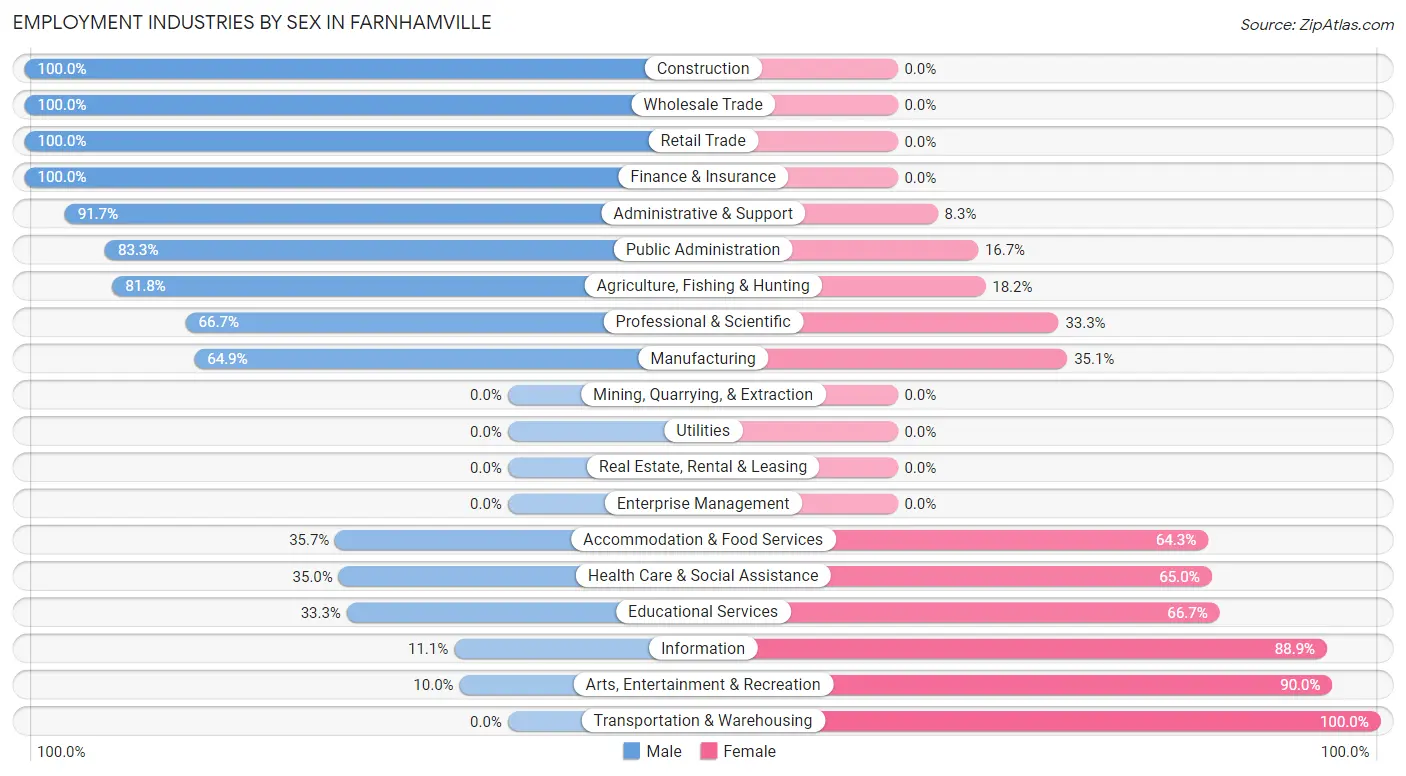
The Farnhamville industries that see more men than women are Construction (100.0%), Wholesale Trade (100.0%), and Retail Trade (100.0%), whereas the industries that tend to have a higher number of women are Transportation & Warehousing (100.0%), Arts, Entertainment & Recreation (90.0%), and Information (88.9%).
| Industry | Male | Female |
| Agriculture, Fishing & Hunting | 9 (81.8%) | 2 (18.2%) |
| Mining, Quarrying, & Extraction | 0 (0.0%) | 0 (0.0%) |
| Construction | 6 (100.0%) | 0 (0.0%) |
| Manufacturing | 24 (64.9%) | 13 (35.1%) |
| Wholesale Trade | 6 (100.0%) | 0 (0.0%) |
| Retail Trade | 3 (100.0%) | 0 (0.0%) |
| Transportation & Warehousing | 0 (0.0%) | 4 (100.0%) |
| Utilities | 0 (0.0%) | 0 (0.0%) |
| Information | 1 (11.1%) | 8 (88.9%) |
| Finance & Insurance | 3 (100.0%) | 0 (0.0%) |
| Real Estate, Rental & Leasing | 0 (0.0%) | 0 (0.0%) |
| Professional & Scientific | 2 (66.7%) | 1 (33.3%) |
| Enterprise Management | 0 (0.0%) | 0 (0.0%) |
| Administrative & Support | 11 (91.7%) | 1 (8.3%) |
| Educational Services | 2 (33.3%) | 4 (66.7%) |
| Health Care & Social Assistance | 14 (35.0%) | 26 (65.0%) |
| Arts, Entertainment & Recreation | 1 (10.0%) | 9 (90.0%) |
| Accommodation & Food Services | 5 (35.7%) | 9 (64.3%) |
| Public Administration | 5 (83.3%) | 1 (16.7%) |
| Total | 101 (54.0%) | 86 (46.0%) |
Education in Farnhamville
School Enrollment in Farnhamville
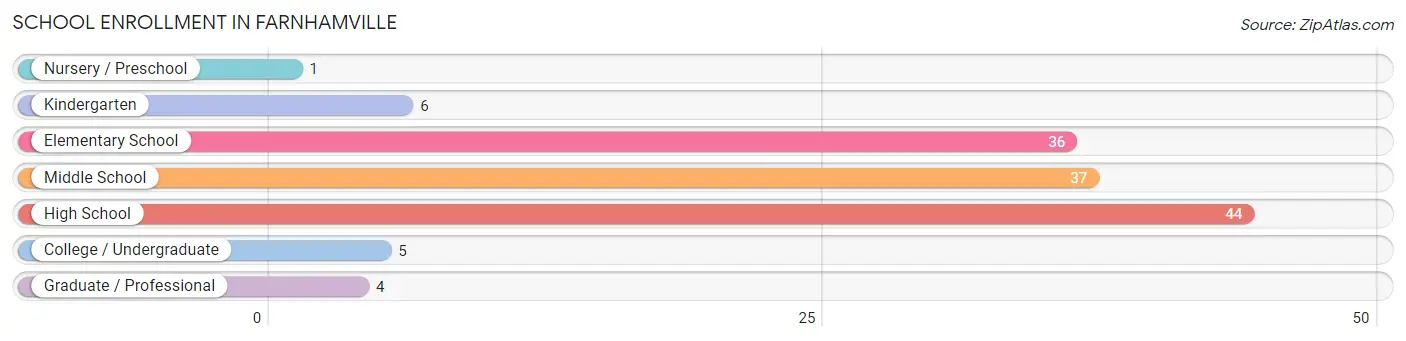
The most common levels of schooling among the 133 students in Farnhamville are high school (44 | 33.1%), middle school (37 | 27.8%), and elementary school (36 | 27.1%).
| School Level | # Students | % Students |
| Nursery / Preschool | 1 | 0.7% |
| Kindergarten | 6 | 4.5% |
| Elementary School | 36 | 27.1% |
| Middle School | 37 | 27.8% |
| High School | 44 | 33.1% |
| College / Undergraduate | 5 | 3.8% |
| Graduate / Professional | 4 | 3.0% |
| Total | 133 | 100.0% |
School Enrollment by Age by Funding Source in Farnhamville
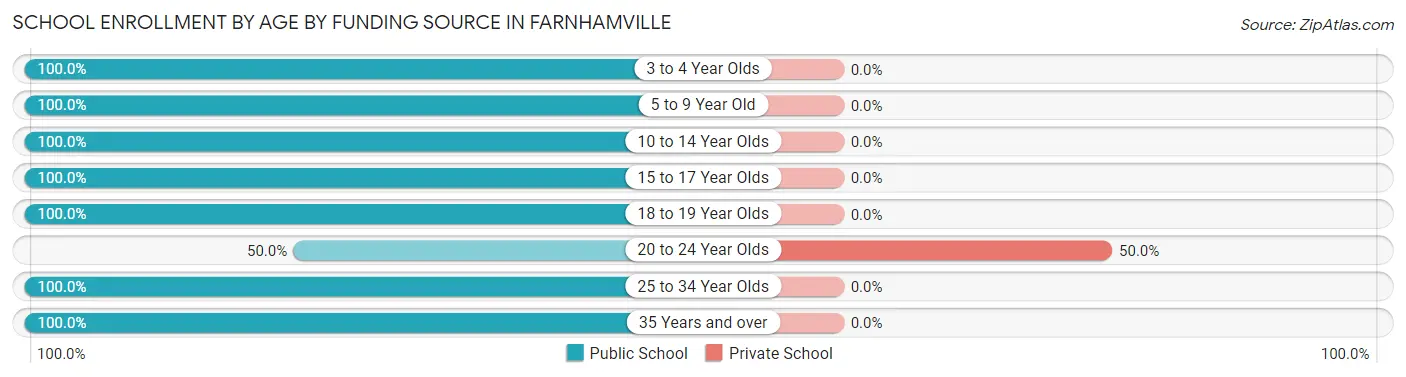
Out of a total of 133 students who are enrolled in schools in Farnhamville, 4 (3.0%) attend a private institution, while the remaining 129 (97.0%) are enrolled in public schools. The age group of 20 to 24 year olds has the highest likelihood of being enrolled in private schools, with 4 (50.0% in the age bracket) enrolled. Conversely, the age group of 3 to 4 year olds has the lowest likelihood of being enrolled in a private school, with 3 (100.0% in the age bracket) attending a public institution.
| Age Bracket | Public School | Private School |
| 3 to 4 Year Olds | 3 (100.0%) | 0 (0.0%) |
| 5 to 9 Year Old | 28 (100.0%) | 0 (0.0%) |
| 10 to 14 Year Olds | 64 (100.0%) | 0 (0.0%) |
| 15 to 17 Year Olds | 24 (100.0%) | 0 (0.0%) |
| 18 to 19 Year Olds | 2 (100.0%) | 0 (0.0%) |
| 20 to 24 Year Olds | 4 (50.0%) | 4 (50.0%) |
| 25 to 34 Year Olds | 1 (100.0%) | 0 (0.0%) |
| 35 Years and over | 3 (100.0%) | 0 (0.0%) |
| Total | 129 (97.0%) | 4 (3.0%) |
Educational Attainment by Field of Study in Farnhamville
Communications (9 | 26.5%), science & technology (7 | 20.6%), education (7 | 20.6%), business (5 | 14.7%), and social sciences (2 | 5.9%) are the most common fields of study among 34 individuals in Farnhamville who have obtained a bachelor's degree or higher.
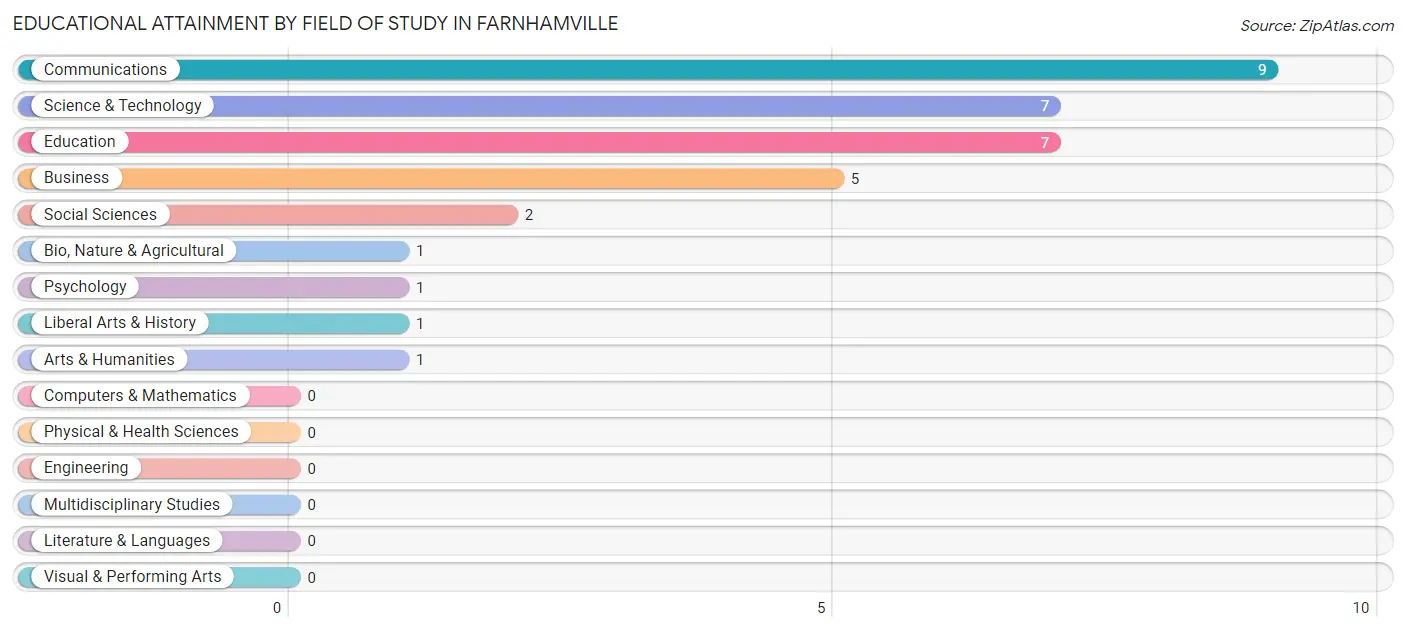
| Field of Study | # Graduates | % Graduates |
| Computers & Mathematics | 0 | 0.0% |
| Bio, Nature & Agricultural | 1 | 2.9% |
| Physical & Health Sciences | 0 | 0.0% |
| Psychology | 1 | 2.9% |
| Social Sciences | 2 | 5.9% |
| Engineering | 0 | 0.0% |
| Multidisciplinary Studies | 0 | 0.0% |
| Science & Technology | 7 | 20.6% |
| Business | 5 | 14.7% |
| Education | 7 | 20.6% |
| Literature & Languages | 0 | 0.0% |
| Liberal Arts & History | 1 | 2.9% |
| Visual & Performing Arts | 0 | 0.0% |
| Communications | 9 | 26.5% |
| Arts & Humanities | 1 | 2.9% |
| Total | 34 | 100.0% |
Transportation & Commute in Farnhamville
Vehicle Availability by Sex in Farnhamville
The most prevalent vehicle ownership categories in Farnhamville are males with 2 vehicles (39, accounting for 40.2%) and females with 2 vehicles (44, making up 45.9%).
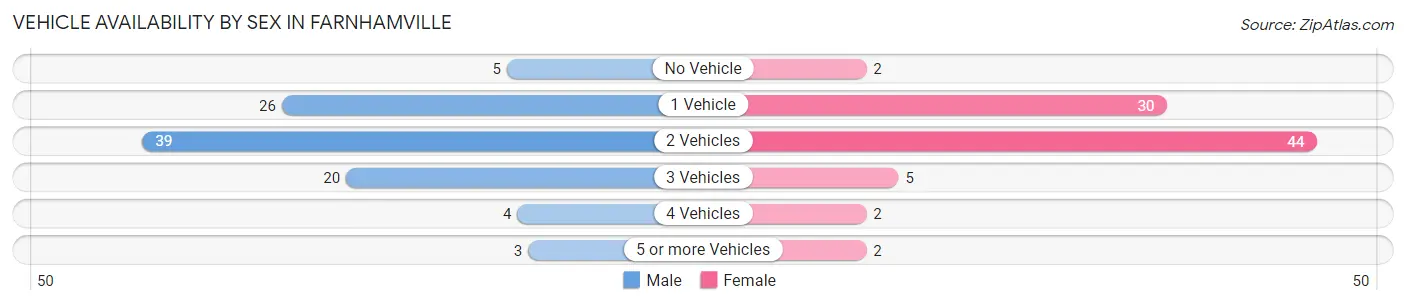
| Vehicles Available | Male | Female |
| No Vehicle | 5 (5.1%) | 2 (2.4%) |
| 1 Vehicle | 26 (26.8%) | 30 (35.3%) |
| 2 Vehicles | 39 (40.2%) | 44 (51.8%) |
| 3 Vehicles | 20 (20.6%) | 5 (5.9%) |
| 4 Vehicles | 4 (4.1%) | 2 (2.4%) |
| 5 or more Vehicles | 3 (3.1%) | 2 (2.4%) |
| Total | 97 (100.0%) | 85 (100.0%) |
Commute Time in Farnhamville
The most frequently occuring commute durations in Farnhamville are 30 to 34 minutes (32 commuters, 18.6%), 10 to 14 minutes (29 commuters, 16.9%), and 15 to 19 minutes (29 commuters, 16.9%).
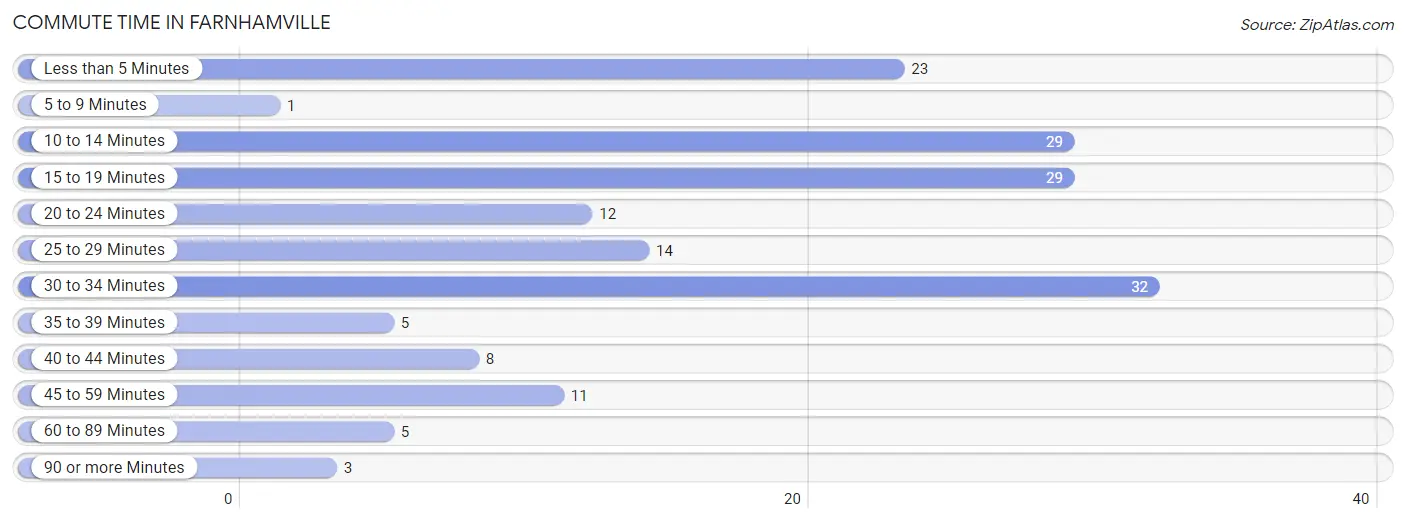
| Commute Time | # Commuters | % Commuters |
| Less than 5 Minutes | 23 | 13.4% |
| 5 to 9 Minutes | 1 | 0.6% |
| 10 to 14 Minutes | 29 | 16.9% |
| 15 to 19 Minutes | 29 | 16.9% |
| 20 to 24 Minutes | 12 | 7.0% |
| 25 to 29 Minutes | 14 | 8.1% |
| 30 to 34 Minutes | 32 | 18.6% |
| 35 to 39 Minutes | 5 | 2.9% |
| 40 to 44 Minutes | 8 | 4.6% |
| 45 to 59 Minutes | 11 | 6.4% |
| 60 to 89 Minutes | 5 | 2.9% |
| 90 or more Minutes | 3 | 1.7% |
Commute Time by Sex in Farnhamville
The most common commute times in Farnhamville are less than 5 minutes (22 commuters, 23.2%) for males and 10 to 14 minutes (20 commuters, 26.0%) for females.
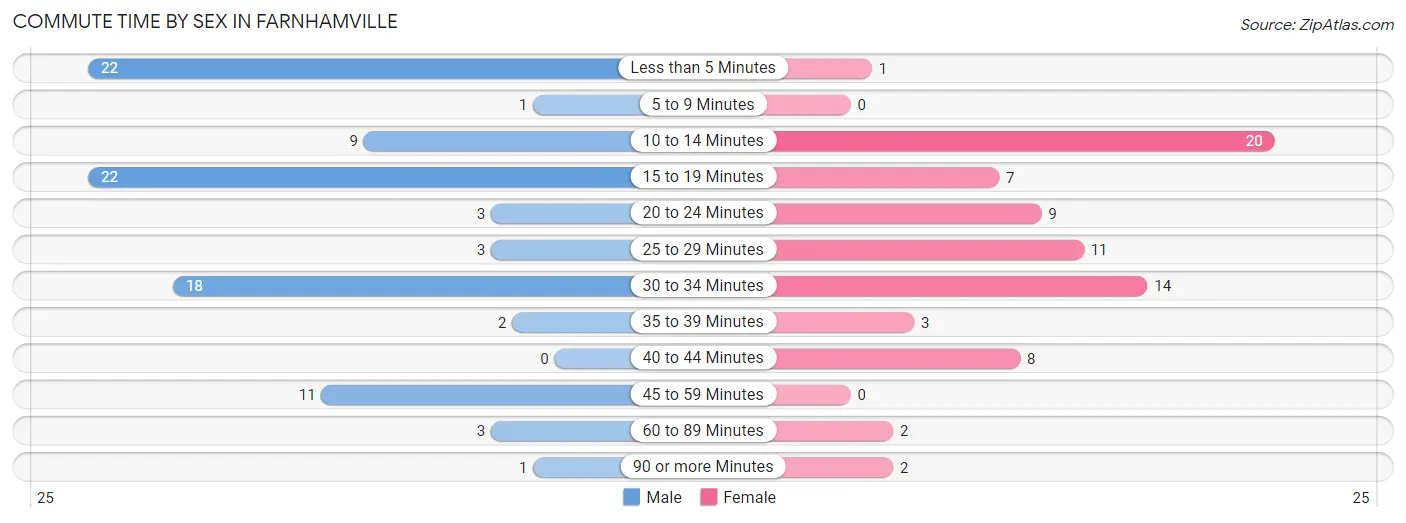
| Commute Time | Male | Female |
| Less than 5 Minutes | 22 (23.2%) | 1 (1.3%) |
| 5 to 9 Minutes | 1 (1.1%) | 0 (0.0%) |
| 10 to 14 Minutes | 9 (9.5%) | 20 (26.0%) |
| 15 to 19 Minutes | 22 (23.2%) | 7 (9.1%) |
| 20 to 24 Minutes | 3 (3.2%) | 9 (11.7%) |
| 25 to 29 Minutes | 3 (3.2%) | 11 (14.3%) |
| 30 to 34 Minutes | 18 (19.0%) | 14 (18.2%) |
| 35 to 39 Minutes | 2 (2.1%) | 3 (3.9%) |
| 40 to 44 Minutes | 0 (0.0%) | 8 (10.4%) |
| 45 to 59 Minutes | 11 (11.6%) | 0 (0.0%) |
| 60 to 89 Minutes | 3 (3.2%) | 2 (2.6%) |
| 90 or more Minutes | 1 (1.1%) | 2 (2.6%) |
Time of Departure to Work by Sex in Farnhamville
The most frequent times of departure to work in Farnhamville are 6:30 AM to 6:59 AM (23, 24.2%) for males and 7:30 AM to 7:59 AM (17, 22.1%) for females.
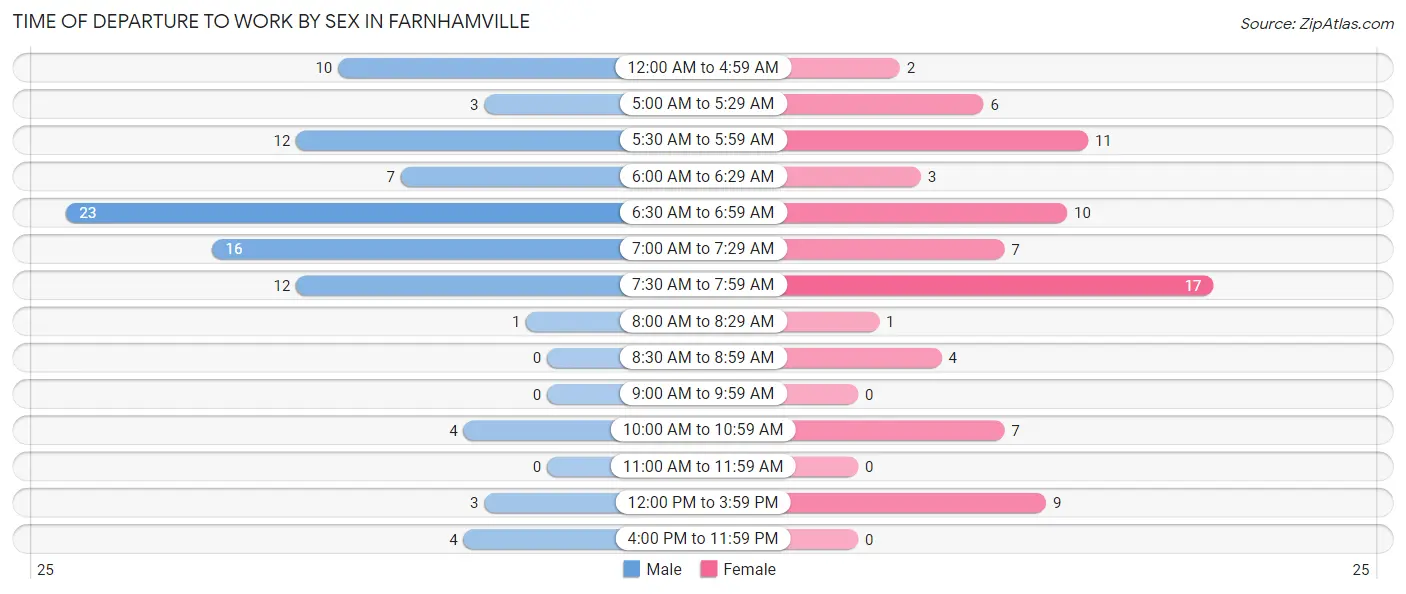
| Time of Departure | Male | Female |
| 12:00 AM to 4:59 AM | 10 (10.5%) | 2 (2.6%) |
| 5:00 AM to 5:29 AM | 3 (3.2%) | 6 (7.8%) |
| 5:30 AM to 5:59 AM | 12 (12.6%) | 11 (14.3%) |
| 6:00 AM to 6:29 AM | 7 (7.4%) | 3 (3.9%) |
| 6:30 AM to 6:59 AM | 23 (24.2%) | 10 (13.0%) |
| 7:00 AM to 7:29 AM | 16 (16.8%) | 7 (9.1%) |
| 7:30 AM to 7:59 AM | 12 (12.6%) | 17 (22.1%) |
| 8:00 AM to 8:29 AM | 1 (1.1%) | 1 (1.3%) |
| 8:30 AM to 8:59 AM | 0 (0.0%) | 4 (5.2%) |
| 9:00 AM to 9:59 AM | 0 (0.0%) | 0 (0.0%) |
| 10:00 AM to 10:59 AM | 4 (4.2%) | 7 (9.1%) |
| 11:00 AM to 11:59 AM | 0 (0.0%) | 0 (0.0%) |
| 12:00 PM to 3:59 PM | 3 (3.2%) | 9 (11.7%) |
| 4:00 PM to 11:59 PM | 4 (4.2%) | 0 (0.0%) |
| Total | 95 (100.0%) | 77 (100.0%) |
Housing Occupancy in Farnhamville
Occupancy by Ownership in Farnhamville
Of the total 181 dwellings in Farnhamville, owner-occupied units account for 122 (67.4%), while renter-occupied units make up 59 (32.6%).
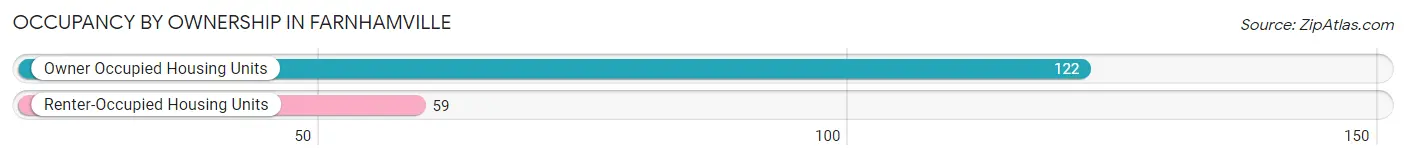
| Occupancy | # Housing Units | % Housing Units |
| Owner Occupied Housing Units | 122 | 67.4% |
| Renter-Occupied Housing Units | 59 | 32.6% |
| Total Occupied Housing Units | 181 | 100.0% |
Occupancy by Household Size in Farnhamville
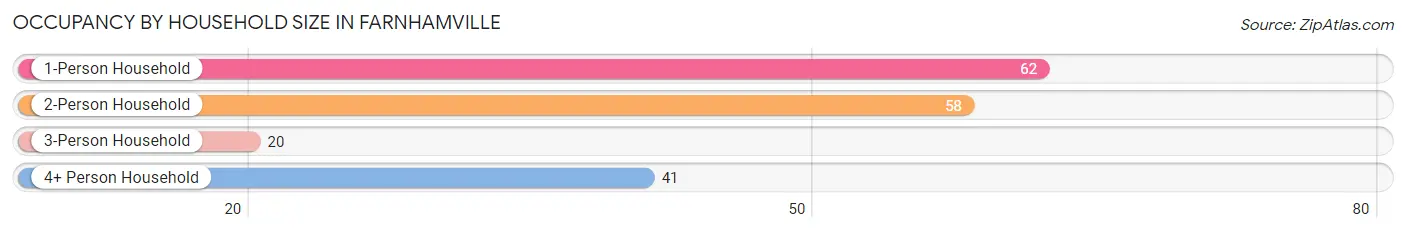
| Household Size | # Housing Units | % Housing Units |
| 1-Person Household | 62 | 34.3% |
| 2-Person Household | 58 | 32.0% |
| 3-Person Household | 20 | 11.1% |
| 4+ Person Household | 41 | 22.7% |
| Total Housing Units | 181 | 100.0% |
Occupancy by Ownership by Household Size in Farnhamville
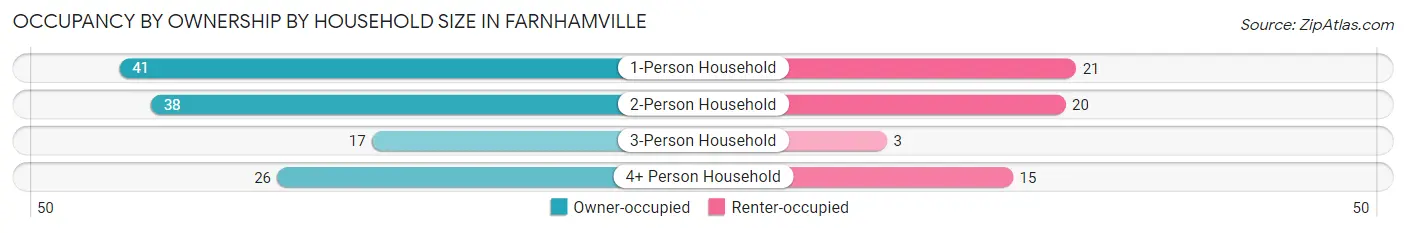
| Household Size | Owner-occupied | Renter-occupied |
| 1-Person Household | 41 (66.1%) | 21 (33.9%) |
| 2-Person Household | 38 (65.5%) | 20 (34.5%) |
| 3-Person Household | 17 (85.0%) | 3 (15.0%) |
| 4+ Person Household | 26 (63.4%) | 15 (36.6%) |
| Total Housing Units | 122 (67.4%) | 59 (32.6%) |
Occupancy by Educational Attainment in Farnhamville
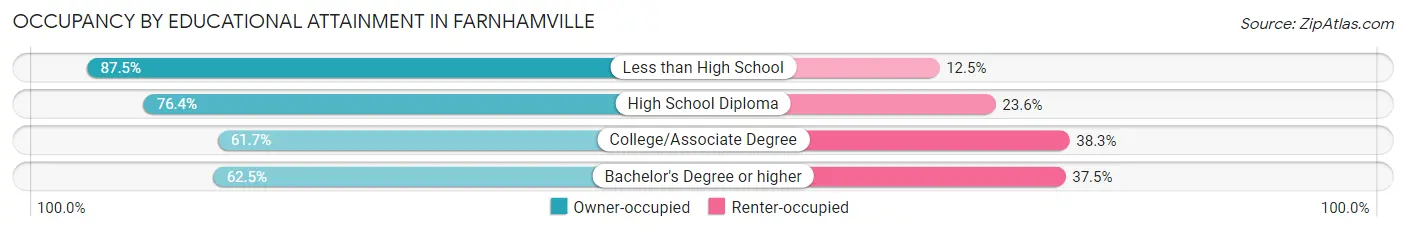
| Household Size | Owner-occupied | Renter-occupied |
| Less than High School | 7 (87.5%) | 1 (12.5%) |
| High School Diploma | 42 (76.4%) | 13 (23.6%) |
| College/Associate Degree | 58 (61.7%) | 36 (38.3%) |
| Bachelor's Degree or higher | 15 (62.5%) | 9 (37.5%) |
Occupancy by Age of Householder in Farnhamville
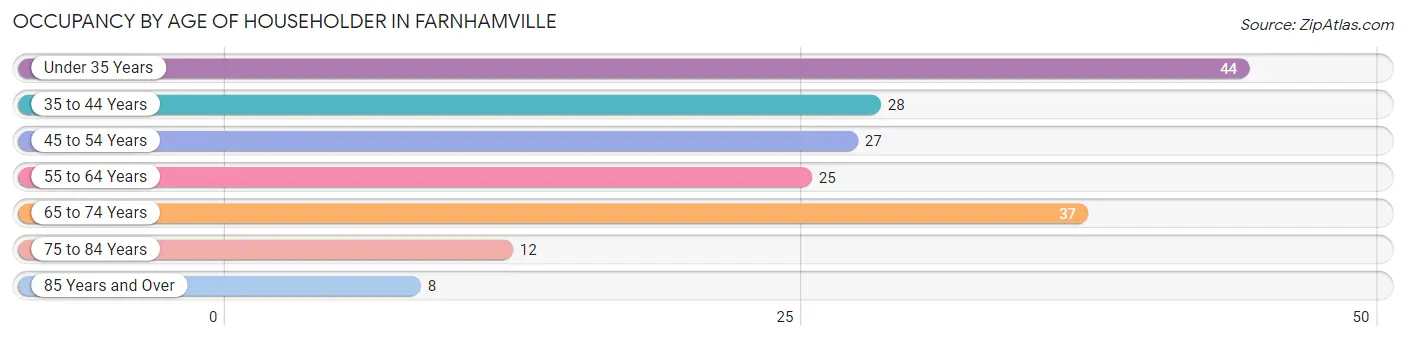
| Age Bracket | # Households | % Households |
| Under 35 Years | 44 | 24.3% |
| 35 to 44 Years | 28 | 15.5% |
| 45 to 54 Years | 27 | 14.9% |
| 55 to 64 Years | 25 | 13.8% |
| 65 to 74 Years | 37 | 20.4% |
| 75 to 84 Years | 12 | 6.6% |
| 85 Years and Over | 8 | 4.4% |
| Total | 181 | 100.0% |
Housing Finances in Farnhamville
Median Income by Occupancy in Farnhamville
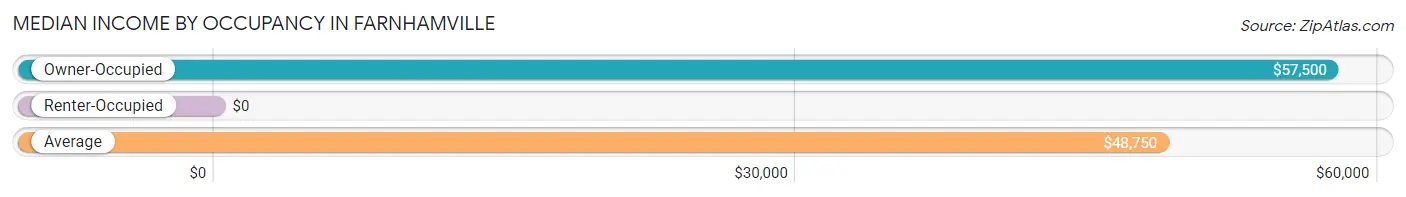
| Occupancy Type | # Households | Median Income |
| Owner-Occupied | 122 (67.4%) | $57,500 |
| Renter-Occupied | 59 (32.6%) | $0 |
| Average | 181 (100.0%) | $48,750 |
Occupancy by Householder Income Bracket in Farnhamville
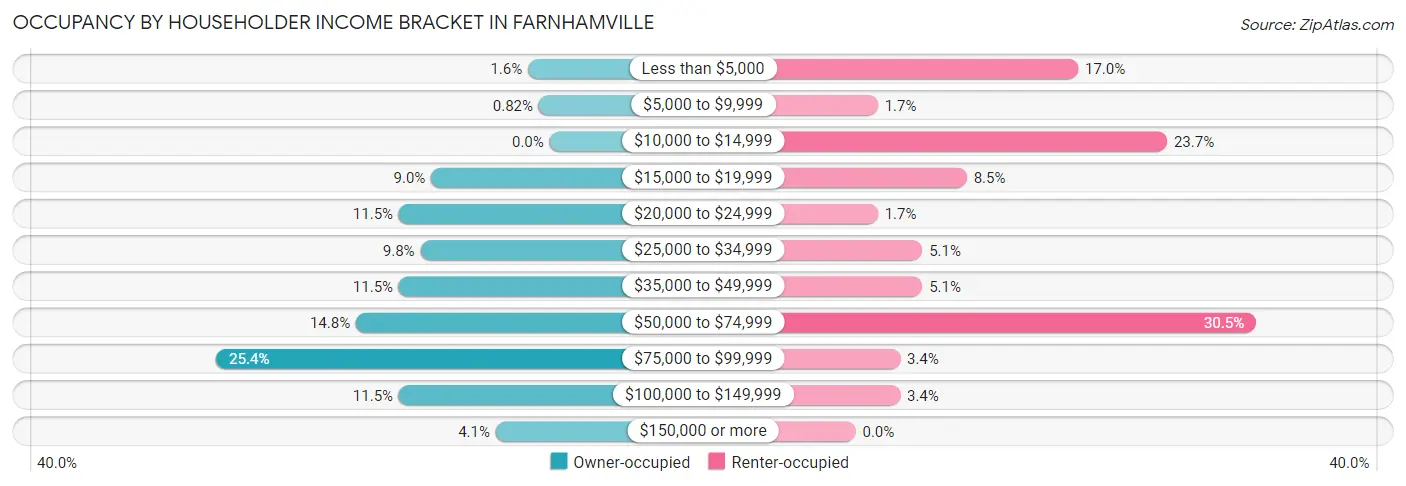
| Income Bracket | Owner-occupied | Renter-occupied |
| Less than $5,000 | 2 (1.6%) | 10 (17.0%) |
| $5,000 to $9,999 | 1 (0.8%) | 1 (1.7%) |
| $10,000 to $14,999 | 0 (0.0%) | 14 (23.7%) |
| $15,000 to $19,999 | 11 (9.0%) | 5 (8.5%) |
| $20,000 to $24,999 | 14 (11.5%) | 1 (1.7%) |
| $25,000 to $34,999 | 12 (9.8%) | 3 (5.1%) |
| $35,000 to $49,999 | 14 (11.5%) | 3 (5.1%) |
| $50,000 to $74,999 | 18 (14.7%) | 18 (30.5%) |
| $75,000 to $99,999 | 31 (25.4%) | 2 (3.4%) |
| $100,000 to $149,999 | 14 (11.5%) | 2 (3.4%) |
| $150,000 or more | 5 (4.1%) | 0 (0.0%) |
| Total | 122 (100.0%) | 59 (100.0%) |
Monthly Housing Cost Tiers in Farnhamville
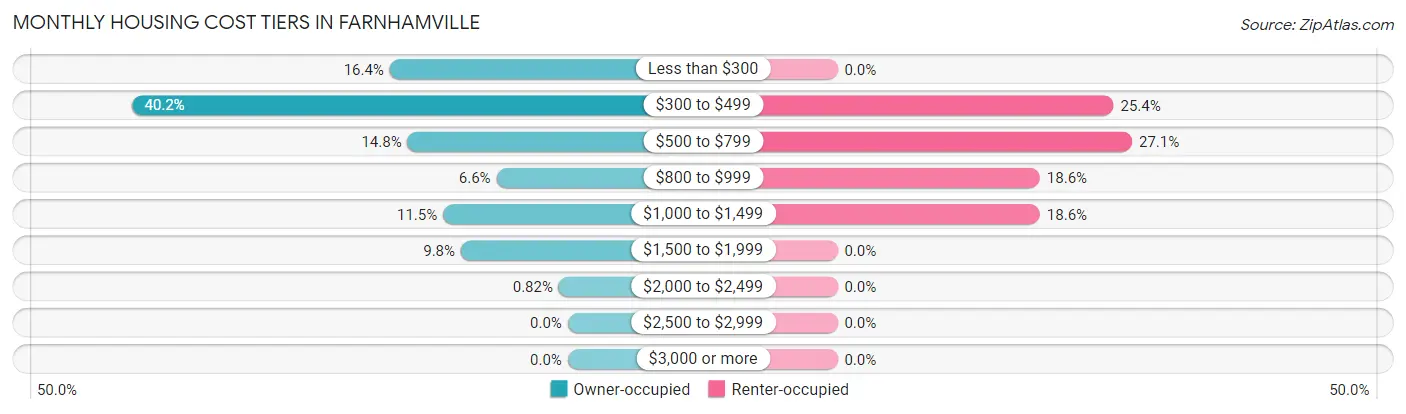
| Monthly Cost | Owner-occupied | Renter-occupied |
| Less than $300 | 20 (16.4%) | 0 (0.0%) |
| $300 to $499 | 49 (40.2%) | 15 (25.4%) |
| $500 to $799 | 18 (14.7%) | 16 (27.1%) |
| $800 to $999 | 8 (6.6%) | 11 (18.6%) |
| $1,000 to $1,499 | 14 (11.5%) | 11 (18.6%) |
| $1,500 to $1,999 | 12 (9.8%) | 0 (0.0%) |
| $2,000 to $2,499 | 1 (0.8%) | 0 (0.0%) |
| $2,500 to $2,999 | 0 (0.0%) | 0 (0.0%) |
| $3,000 or more | 0 (0.0%) | 0 (0.0%) |
| Total | 122 (100.0%) | 59 (100.0%) |
Physical Housing Characteristics in Farnhamville
Housing Structures in Farnhamville
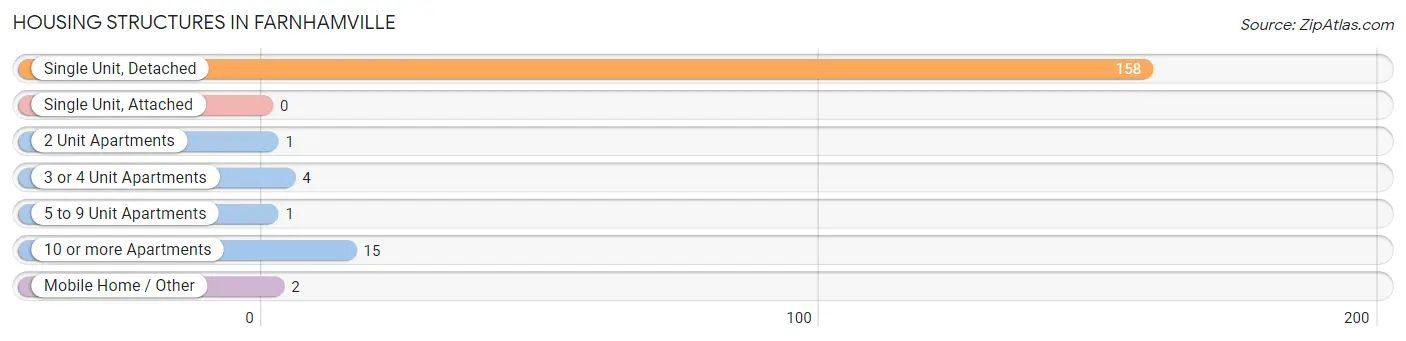
| Structure Type | # Housing Units | % Housing Units |
| Single Unit, Detached | 158 | 87.3% |
| Single Unit, Attached | 0 | 0.0% |
| 2 Unit Apartments | 1 | 0.5% |
| 3 or 4 Unit Apartments | 4 | 2.2% |
| 5 to 9 Unit Apartments | 1 | 0.5% |
| 10 or more Apartments | 15 | 8.3% |
| Mobile Home / Other | 2 | 1.1% |
| Total | 181 | 100.0% |
Housing Structures by Occupancy in Farnhamville
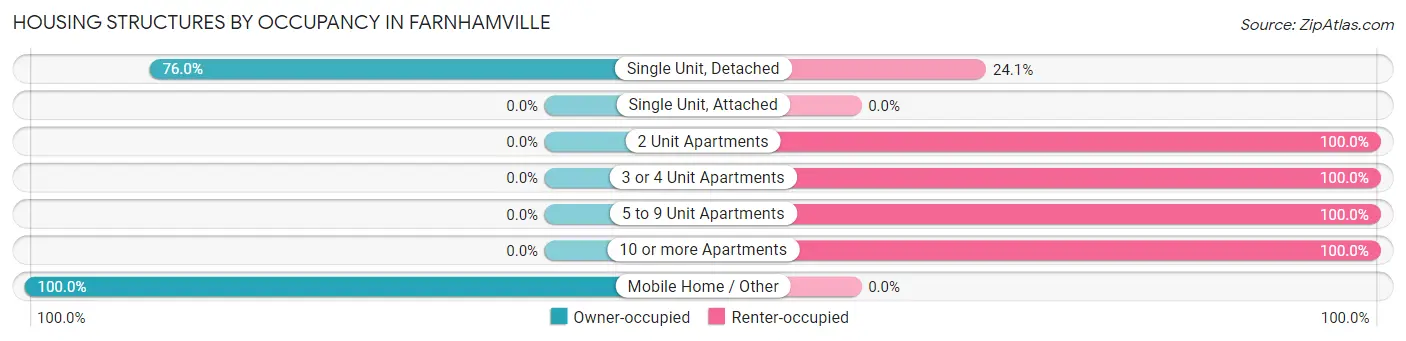
| Structure Type | Owner-occupied | Renter-occupied |
| Single Unit, Detached | 120 (75.9%) | 38 (24.0%) |
| Single Unit, Attached | 0 (0.0%) | 0 (0.0%) |
| 2 Unit Apartments | 0 (0.0%) | 1 (100.0%) |
| 3 or 4 Unit Apartments | 0 (0.0%) | 4 (100.0%) |
| 5 to 9 Unit Apartments | 0 (0.0%) | 1 (100.0%) |
| 10 or more Apartments | 0 (0.0%) | 15 (100.0%) |
| Mobile Home / Other | 2 (100.0%) | 0 (0.0%) |
| Total | 122 (67.4%) | 59 (32.6%) |
Housing Structures by Number of Rooms in Farnhamville
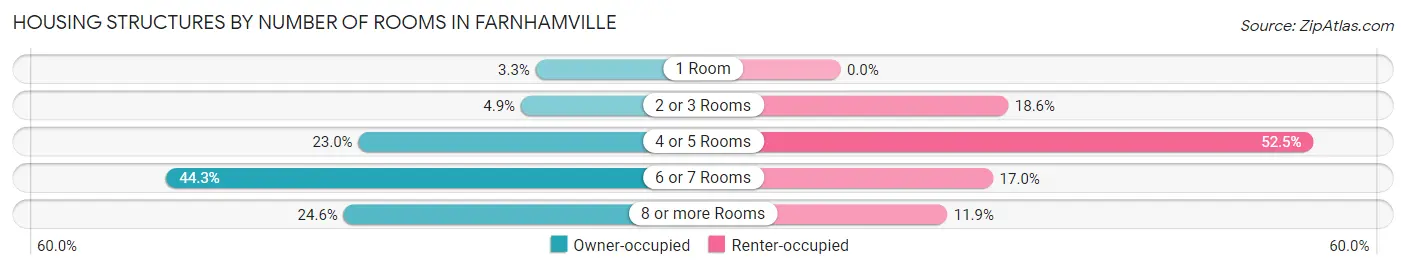
| Number of Rooms | Owner-occupied | Renter-occupied |
| 1 Room | 4 (3.3%) | 0 (0.0%) |
| 2 or 3 Rooms | 6 (4.9%) | 11 (18.6%) |
| 4 or 5 Rooms | 28 (23.0%) | 31 (52.5%) |
| 6 or 7 Rooms | 54 (44.3%) | 10 (17.0%) |
| 8 or more Rooms | 30 (24.6%) | 7 (11.9%) |
| Total | 122 (100.0%) | 59 (100.0%) |
Housing Structure by Heating Type in Farnhamville
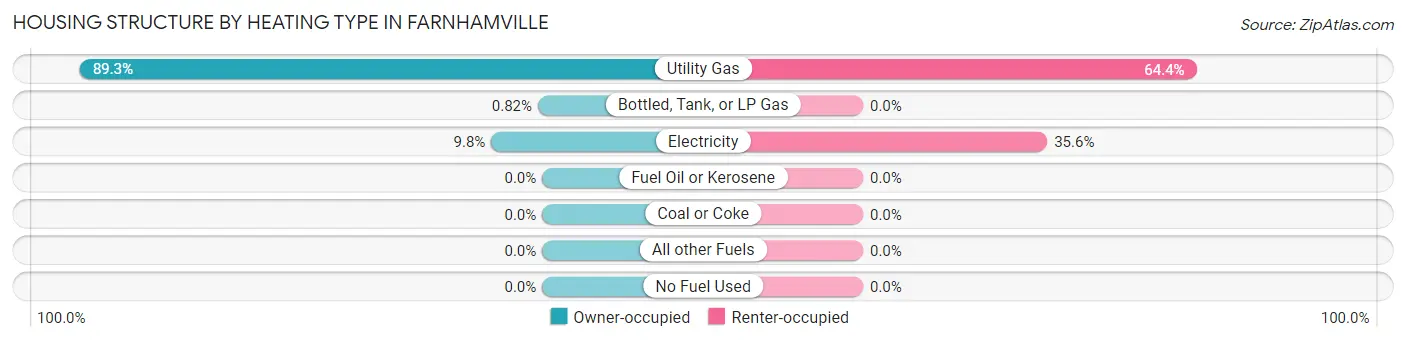
| Heating Type | Owner-occupied | Renter-occupied |
| Utility Gas | 109 (89.3%) | 38 (64.4%) |
| Bottled, Tank, or LP Gas | 1 (0.8%) | 0 (0.0%) |
| Electricity | 12 (9.8%) | 21 (35.6%) |
| Fuel Oil or Kerosene | 0 (0.0%) | 0 (0.0%) |
| Coal or Coke | 0 (0.0%) | 0 (0.0%) |
| All other Fuels | 0 (0.0%) | 0 (0.0%) |
| No Fuel Used | 0 (0.0%) | 0 (0.0%) |
| Total | 122 (100.0%) | 59 (100.0%) |
Household Vehicle Usage in Farnhamville
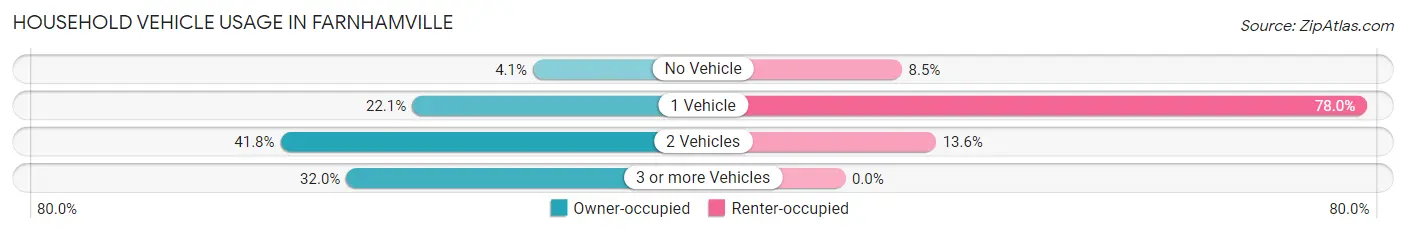
| Vehicles per Household | Owner-occupied | Renter-occupied |
| No Vehicle | 5 (4.1%) | 5 (8.5%) |
| 1 Vehicle | 27 (22.1%) | 46 (78.0%) |
| 2 Vehicles | 51 (41.8%) | 8 (13.6%) |
| 3 or more Vehicles | 39 (32.0%) | 0 (0.0%) |
| Total | 122 (100.0%) | 59 (100.0%) |
Real Estate & Mortgages in Farnhamville
Real Estate and Mortgage Overview in Farnhamville
| Characteristic | Without Mortgage | With Mortgage |
| Housing Units | 82 | 40 |
| Median Property Value | $55,700 | $93,300 |
| Median Household Income | $43,750 | $4 |
| Monthly Housing Costs | $416 | $0 |
| Real Estate Taxes | $600 | $2 |
Property Value by Mortgage Status in Farnhamville
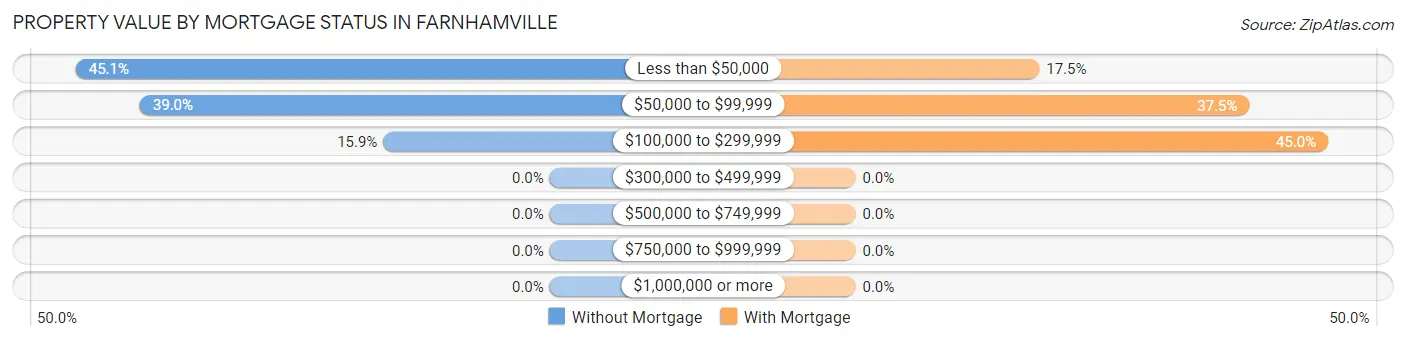
| Property Value | Without Mortgage | With Mortgage |
| Less than $50,000 | 37 (45.1%) | 7 (17.5%) |
| $50,000 to $99,999 | 32 (39.0%) | 15 (37.5%) |
| $100,000 to $299,999 | 13 (15.9%) | 18 (45.0%) |
| $300,000 to $499,999 | 0 (0.0%) | 0 (0.0%) |
| $500,000 to $749,999 | 0 (0.0%) | 0 (0.0%) |
| $750,000 to $999,999 | 0 (0.0%) | 0 (0.0%) |
| $1,000,000 or more | 0 (0.0%) | 0 (0.0%) |
| Total | 82 (100.0%) | 40 (100.0%) |
Household Income by Mortgage Status in Farnhamville
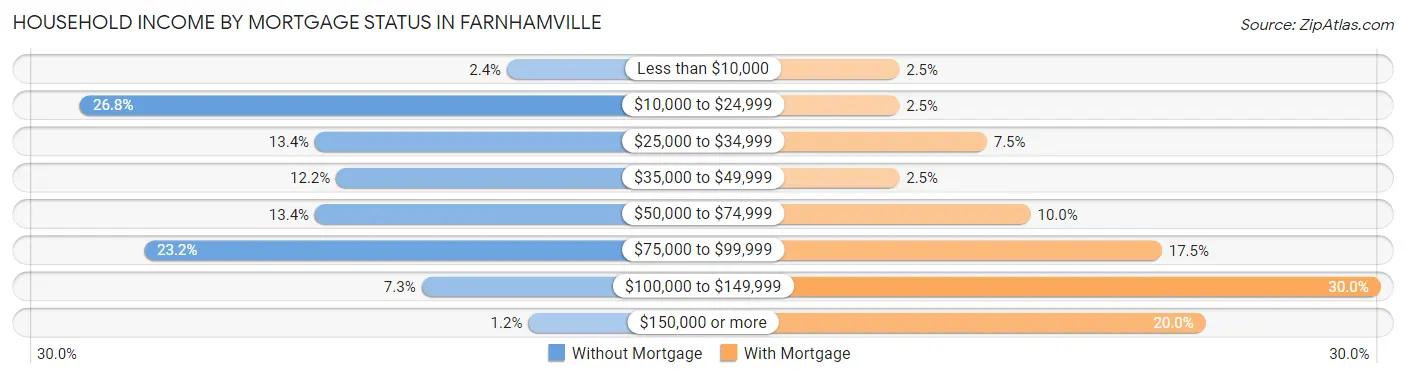
| Household Income | Without Mortgage | With Mortgage |
| Less than $10,000 | 2 (2.4%) | 1 (2.5%) |
| $10,000 to $24,999 | 22 (26.8%) | 1 (2.5%) |
| $25,000 to $34,999 | 11 (13.4%) | 3 (7.5%) |
| $35,000 to $49,999 | 10 (12.2%) | 1 (2.5%) |
| $50,000 to $74,999 | 11 (13.4%) | 4 (10.0%) |
| $75,000 to $99,999 | 19 (23.2%) | 7 (17.5%) |
| $100,000 to $149,999 | 6 (7.3%) | 12 (30.0%) |
| $150,000 or more | 1 (1.2%) | 8 (20.0%) |
| Total | 82 (100.0%) | 40 (100.0%) |
Property Value to Household Income Ratio in Farnhamville
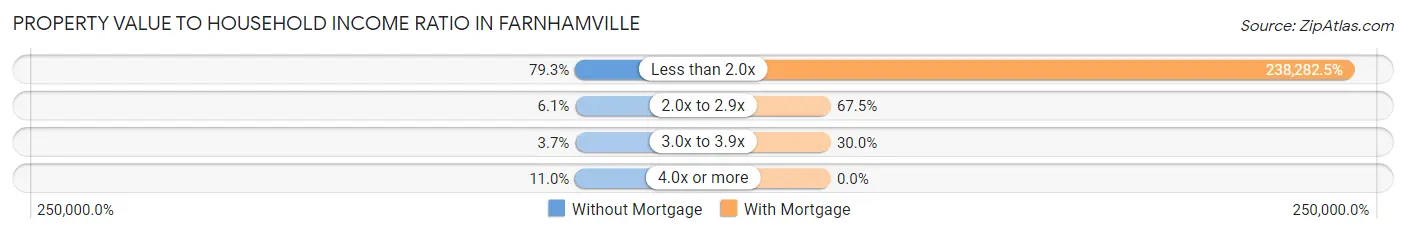
| Value-to-Income Ratio | Without Mortgage | With Mortgage |
| Less than 2.0x | 65 (79.3%) | 95,313 (238,282.5%) |
| 2.0x to 2.9x | 5 (6.1%) | 27 (67.5%) |
| 3.0x to 3.9x | 3 (3.7%) | 12 (30.0%) |
| 4.0x or more | 9 (11.0%) | 0 (0.0%) |
| Total | 82 (100.0%) | 40 (100.0%) |
Real Estate Taxes by Mortgage Status in Farnhamville
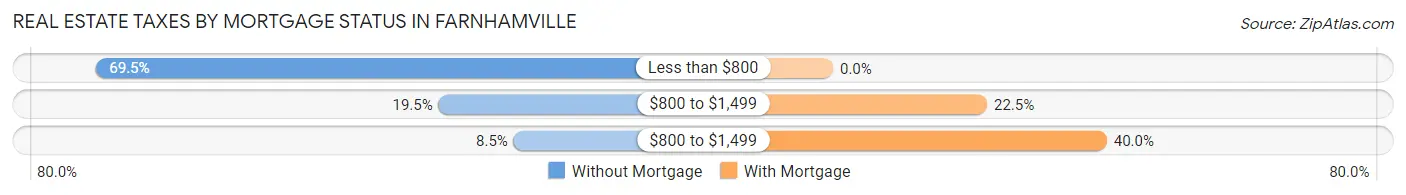
| Property Taxes | Without Mortgage | With Mortgage |
| Less than $800 | 57 (69.5%) | 0 (0.0%) |
| $800 to $1,499 | 16 (19.5%) | 9 (22.5%) |
| $800 to $1,499 | 7 (8.5%) | 16 (40.0%) |
| Total | 82 (100.0%) | 40 (100.0%) |
Health & Disability in Farnhamville
Health Insurance Coverage by Age in Farnhamville
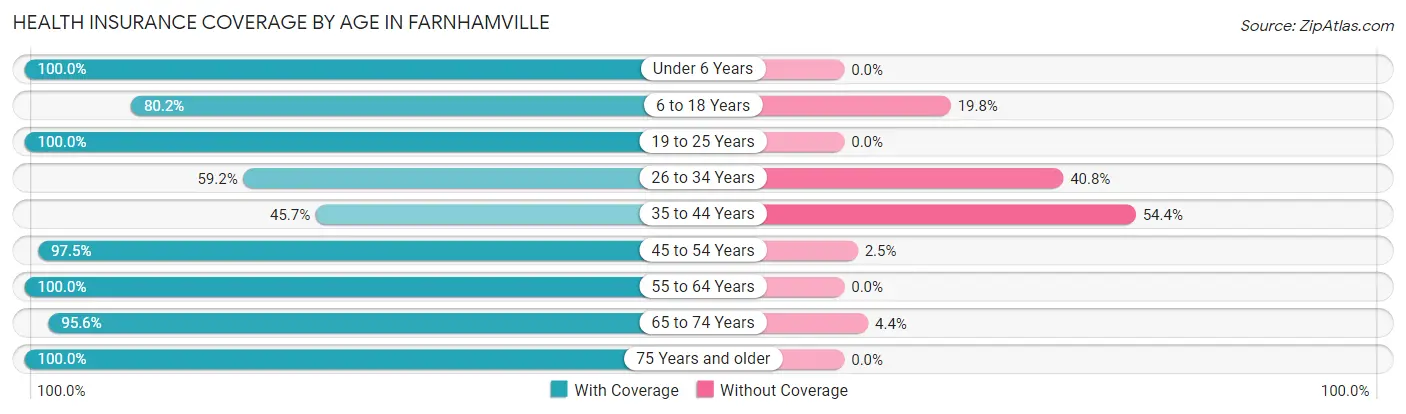
| Age Bracket | With Coverage | Without Coverage |
| Under 6 Years | 28 (100.0%) | 0 (0.0%) |
| 6 to 18 Years | 101 (80.2%) | 25 (19.8%) |
| 19 to 25 Years | 32 (100.0%) | 0 (0.0%) |
| 26 to 34 Years | 29 (59.2%) | 20 (40.8%) |
| 35 to 44 Years | 21 (45.7%) | 25 (54.3%) |
| 45 to 54 Years | 39 (97.5%) | 1 (2.5%) |
| 55 to 64 Years | 46 (100.0%) | 0 (0.0%) |
| 65 to 74 Years | 43 (95.6%) | 2 (4.4%) |
| 75 Years and older | 36 (100.0%) | 0 (0.0%) |
| Total | 375 (83.7%) | 73 (16.3%) |
Health Insurance Coverage by Citizenship Status in Farnhamville
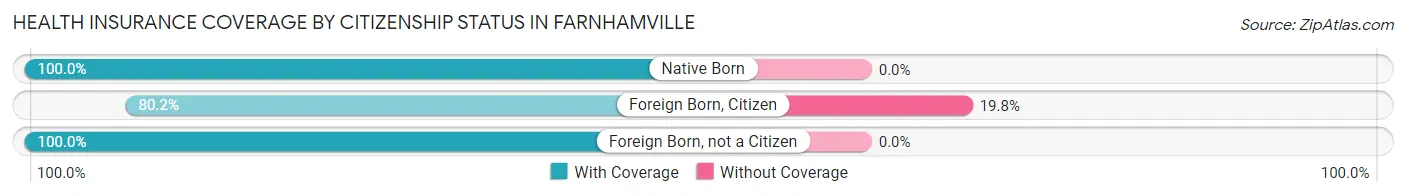
| Citizenship Status | With Coverage | Without Coverage |
| Native Born | 28 (100.0%) | 0 (0.0%) |
| Foreign Born, Citizen | 101 (80.2%) | 25 (19.8%) |
| Foreign Born, not a Citizen | 32 (100.0%) | 0 (0.0%) |
Health Insurance Coverage by Household Income in Farnhamville
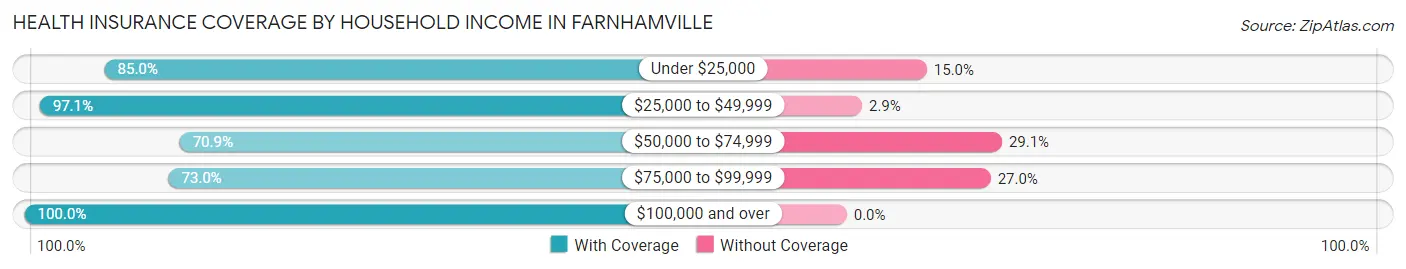
| Household Income | With Coverage | Without Coverage |
| Under $25,000 | 85 (85.0%) | 15 (15.0%) |
| $25,000 to $49,999 | 68 (97.1%) | 2 (2.9%) |
| $50,000 to $74,999 | 61 (70.9%) | 25 (29.1%) |
| $75,000 to $99,999 | 84 (73.0%) | 31 (27.0%) |
| $100,000 and over | 77 (100.0%) | 0 (0.0%) |
Public vs Private Health Insurance Coverage by Age in Farnhamville
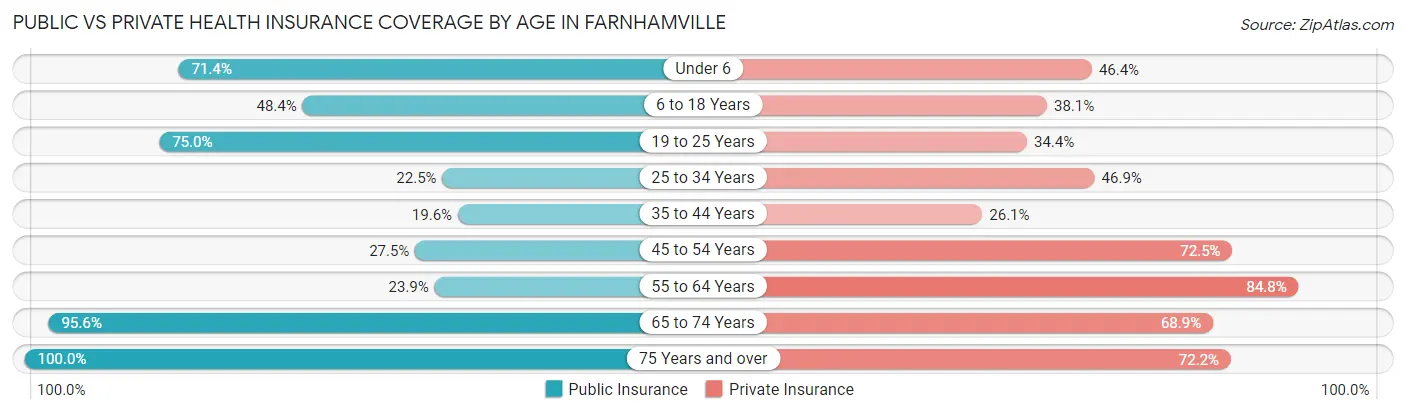
| Age Bracket | Public Insurance | Private Insurance |
| Under 6 | 20 (71.4%) | 13 (46.4%) |
| 6 to 18 Years | 61 (48.4%) | 48 (38.1%) |
| 19 to 25 Years | 24 (75.0%) | 11 (34.4%) |
| 25 to 34 Years | 11 (22.5%) | 23 (46.9%) |
| 35 to 44 Years | 9 (19.6%) | 12 (26.1%) |
| 45 to 54 Years | 11 (27.5%) | 29 (72.5%) |
| 55 to 64 Years | 11 (23.9%) | 39 (84.8%) |
| 65 to 74 Years | 43 (95.6%) | 31 (68.9%) |
| 75 Years and over | 36 (100.0%) | 26 (72.2%) |
| Total | 226 (50.4%) | 232 (51.8%) |
Disability Status by Sex by Age in Farnhamville
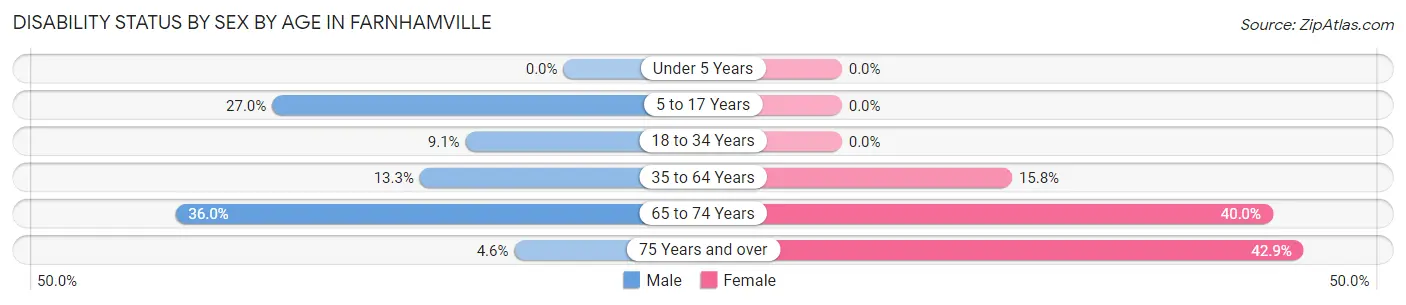
| Age Bracket | Male | Female |
| Under 5 Years | 0 (0.0%) | 0 (0.0%) |
| 5 to 17 Years | 20 (27.0%) | 0 (0.0%) |
| 18 to 34 Years | 3 (9.1%) | 0 (0.0%) |
| 35 to 64 Years | 10 (13.3%) | 9 (15.8%) |
| 65 to 74 Years | 9 (36.0%) | 8 (40.0%) |
| 75 Years and over | 1 (4.5%) | 6 (42.9%) |
Disability Class by Sex by Age in Farnhamville
Disability Class: Hearing Difficulty
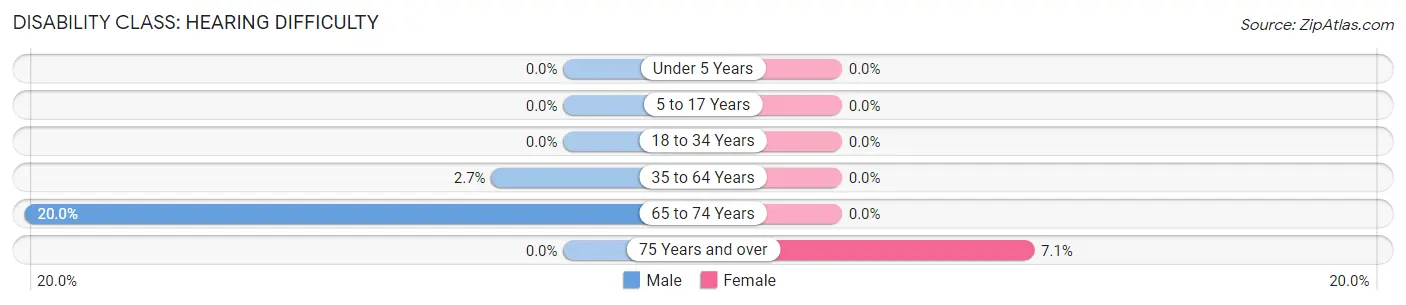
| Age Bracket | Male | Female |
| Under 5 Years | 0 (0.0%) | 0 (0.0%) |
| 5 to 17 Years | 0 (0.0%) | 0 (0.0%) |
| 18 to 34 Years | 0 (0.0%) | 0 (0.0%) |
| 35 to 64 Years | 2 (2.7%) | 0 (0.0%) |
| 65 to 74 Years | 5 (20.0%) | 0 (0.0%) |
| 75 Years and over | 0 (0.0%) | 1 (7.1%) |
Disability Class: Vision Difficulty
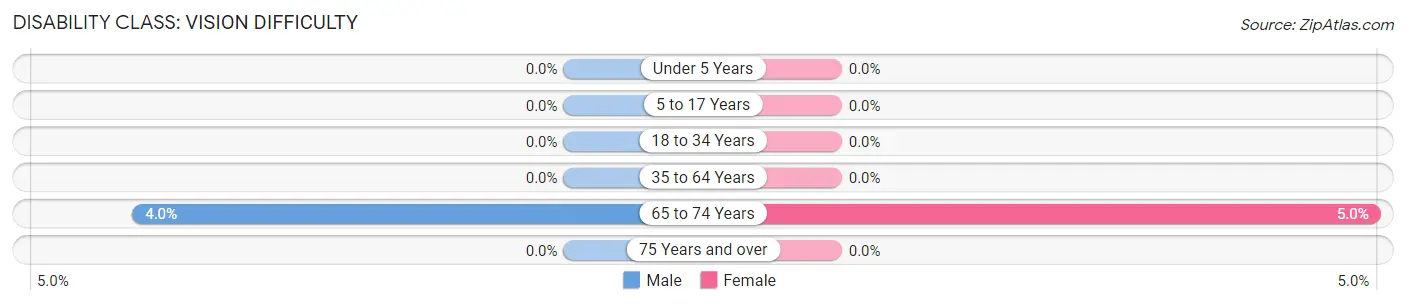
| Age Bracket | Male | Female |
| Under 5 Years | 0 (0.0%) | 0 (0.0%) |
| 5 to 17 Years | 0 (0.0%) | 0 (0.0%) |
| 18 to 34 Years | 0 (0.0%) | 0 (0.0%) |
| 35 to 64 Years | 0 (0.0%) | 0 (0.0%) |
| 65 to 74 Years | 1 (4.0%) | 1 (5.0%) |
| 75 Years and over | 0 (0.0%) | 0 (0.0%) |
Disability Class: Cognitive Difficulty
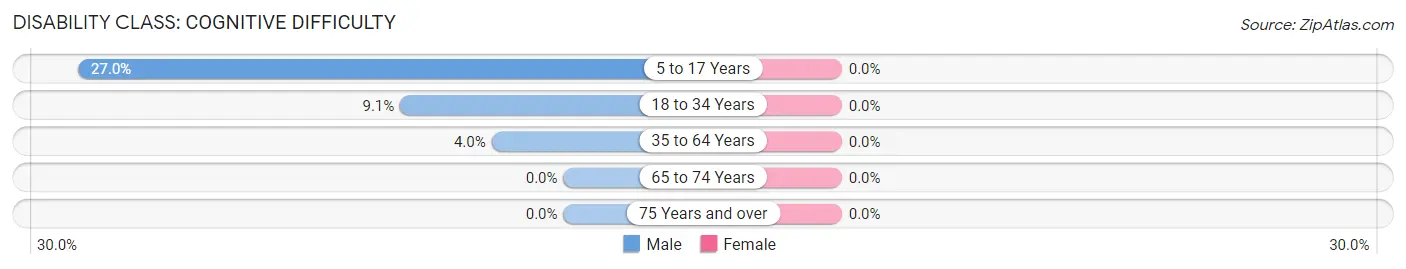
| Age Bracket | Male | Female |
| 5 to 17 Years | 20 (27.0%) | 0 (0.0%) |
| 18 to 34 Years | 3 (9.1%) | 0 (0.0%) |
| 35 to 64 Years | 3 (4.0%) | 0 (0.0%) |
| 65 to 74 Years | 0 (0.0%) | 0 (0.0%) |
| 75 Years and over | 0 (0.0%) | 0 (0.0%) |
Disability Class: Ambulatory Difficulty
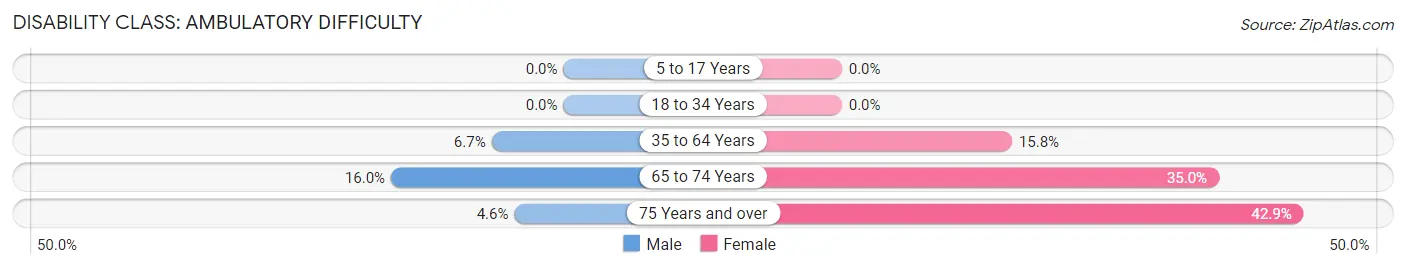
| Age Bracket | Male | Female |
| 5 to 17 Years | 0 (0.0%) | 0 (0.0%) |
| 18 to 34 Years | 0 (0.0%) | 0 (0.0%) |
| 35 to 64 Years | 5 (6.7%) | 9 (15.8%) |
| 65 to 74 Years | 4 (16.0%) | 7 (35.0%) |
| 75 Years and over | 1 (4.5%) | 6 (42.9%) |
Disability Class: Self-Care Difficulty
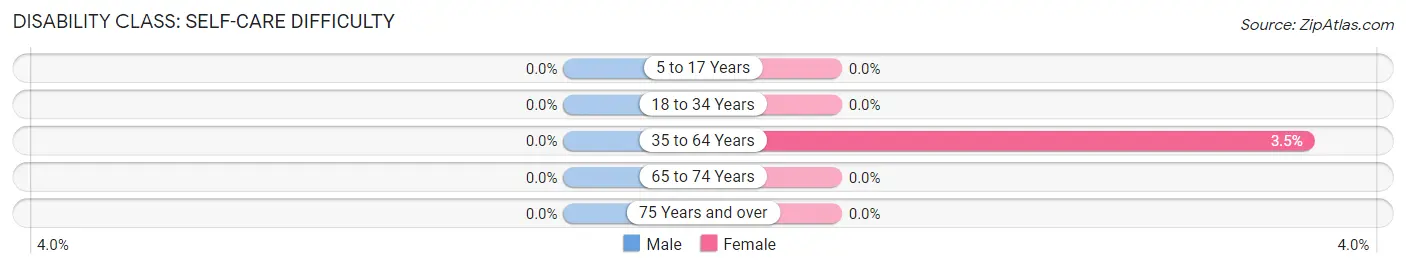
| Age Bracket | Male | Female |
| 5 to 17 Years | 0 (0.0%) | 0 (0.0%) |
| 18 to 34 Years | 0 (0.0%) | 0 (0.0%) |
| 35 to 64 Years | 0 (0.0%) | 2 (3.5%) |
| 65 to 74 Years | 0 (0.0%) | 0 (0.0%) |
| 75 Years and over | 0 (0.0%) | 0 (0.0%) |
Technology Access in Farnhamville
Computing Device Access in Farnhamville
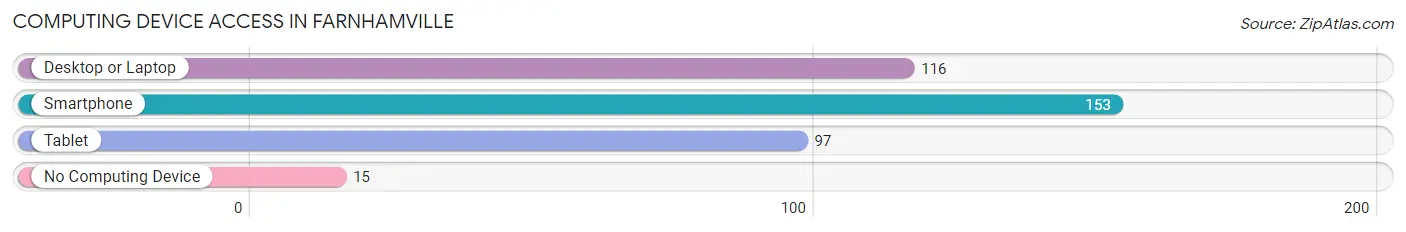
| Device Type | # Households | % Households |
| Desktop or Laptop | 116 | 64.1% |
| Smartphone | 153 | 84.5% |
| Tablet | 97 | 53.6% |
| No Computing Device | 15 | 8.3% |
| Total | 181 | 100.0% |
Internet Access in Farnhamville
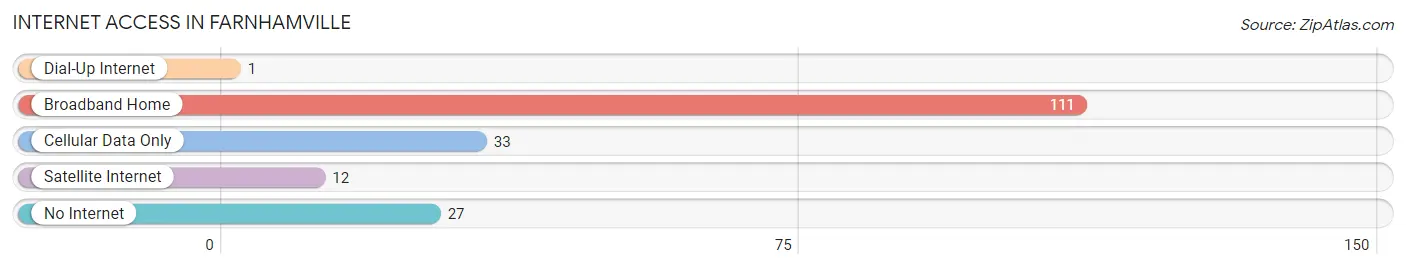
| Internet Type | # Households | % Households |
| Dial-Up Internet | 1 | 0.5% |
| Broadband Home | 111 | 61.3% |
| Cellular Data Only | 33 | 18.2% |
| Satellite Internet | 12 | 6.6% |
| No Internet | 27 | 14.9% |
| Total | 181 | 100.0% |
Farnhamville Summary
Farnhamville is a small city located in Calhoun County, Iowa, United States. The population was 545 at the 2010 census. It is part of the Fort Dodge, IA Metropolitan Statistical Area.
History
Farnhamville was founded in 1856 by William Farnham, a settler from New York. The town was originally called Farnhamville, but the name was changed to Farnham in 1858. The name was changed back to Farnhamville in 1871.
The town was incorporated in 1876 and has remained a small, rural community ever since. The town was home to a number of businesses, including a bank, a hotel, a general store, a blacksmith shop, a livery stable, a creamery, and a grain elevator.
Geography
Farnhamville is located at 42 25 17 N 94 37 17 W 42 421445 94 621445
According to the United States Census Bureau, the city has a total area of 0.62 square miles (1.60 km2), all of it land.
Economy
Farnhamville is a small, rural community with a limited economy. The town is home to a few small businesses, including a grocery store, a hardware store, a restaurant, and a gas station. The town also has a post office and a bank.
The town is also home to a number of farms which produce corn soybeans and other crops
Demographics
As of the census of 2010, there were 545 people, 221 households, and 149 families residing in the city. The population density was 877.4 people per square mile (339.2/km2). There were 241 housing units at an average density of 388.7 per square mile (150.2/km2). The racial makeup of the city was 98.2% White, 0.2% African American, 0.2% Native American, 0.2% Asian, 0.2% from other races, and 0.9% from two or more races. Hispanic or Latino of any race were 0.7% of the population.
There were 221 households, out of which 28.4% had children under the age of 18 living with them, 54.0% were married couples living together, 8.6% had a female householder with no husband present, and 33.3% were non-families. 29.9% of all households were made up of individuals, and 15.4% had someone living alone who was 65 years of age or older. The average household size was 2.46 and the average family size was 3.06.
In the city, the population was spread out, with 25.7% under the age of 18, 7.2% from 18 to 24, 24.2% from 25 to 44, 24.2% from 45 to 64, and 18.7% who were 65 years of age or older. The median age was 40 years. For every 100 females, there were 97.3 males. For every 100 females age 18 and over, there were 94.2 males.
The median income for a household in the city was $35,000, and the median income for a family was $41,250. Males had a median income of $30,000 versus $20,000 for females. The per capita income for the city was $17,845. About 6.3% of families and 8.2% of the population were below the poverty line, including 10.2% of those under age 18 and 8.3% of those age 65 or over.
Common Questions
What is Per Capita Income in Farnhamville?
Per Capita income in Farnhamville is $23,363.
What is the Median Family Income in Farnhamville?
Median Family Income in Farnhamville is $59,318.
What is the Median Household income in Farnhamville?
Median Household Income in Farnhamville is $48,750.
What is Income or Wage Gap in Farnhamville?
Income or Wage Gap in Farnhamville is 57.1%.
Women in Farnhamville earn 42.9 cents for every dollar earned by a man.
What is Family Income Deficit in Farnhamville?
Family Income Deficit in Farnhamville is $10,656.
Families that are below poverty line in Farnhamville earn $10,656 less on average than the poverty threshold level.
What is Inequality or Gini Index in Farnhamville?
Inequality or Gini Index in Farnhamville is 0.41.
What is the Total Population of Farnhamville?
Total Population of Farnhamville is 448.
What is the Total Male Population of Farnhamville?
Total Male Population of Farnhamville is 241.
What is the Total Female Population of Farnhamville?
Total Female Population of Farnhamville is 207.
What is the Ratio of Males per 100 Females in Farnhamville?
There are 116.43 Males per 100 Females in Farnhamville.
What is the Ratio of Females per 100 Males in Farnhamville?
There are 85.89 Females per 100 Males in Farnhamville.
What is the Median Population Age in Farnhamville?
Median Population Age in Farnhamville is 34.2 Years.
What is the Average Family Size in Farnhamville
Average Family Size in Farnhamville is 3.2 People.
What is the Average Household Size in Farnhamville
Average Household Size in Farnhamville is 2.5 People.
How Large is the Labor Force in Farnhamville?
There are 189 People in the Labor Forcein in Farnhamville.
What is the Percentage of People in the Labor Force in Farnhamville?
60.8% of People are in the Labor Force in Farnhamville.
What is the Unemployment Rate in Farnhamville?
Unemployment Rate in Farnhamville is 1.1%.