Early, IA Map & Demographics
Early Map
Early Overview
$37,353
PER CAPITA INCOME
$89,286
AVG FAMILY INCOME
$85,357
AVG HOUSEHOLD INCOME
46.5%
WAGE / INCOME GAP [ % ]
53.5¢/ $1
WAGE / INCOME GAP [ $ ]
$9,090
FAMILY INCOME DEFICIT
0.32
INEQUALITY / GINI INDEX
787
TOTAL POPULATION
495
MALE POPULATION
292
FEMALE POPULATION
169.52
MALES / 100 FEMALES
58.99
FEMALES / 100 MALES
42.1
MEDIAN AGE
3.0
AVG FAMILY SIZE
2.3
AVG HOUSEHOLD SIZE
490
LABOR FORCE [ PEOPLE ]
80.2%
PERCENT IN LABOR FORCE
9.6%
UNEMPLOYMENT RATE
Early Zip Codes
Early Area Codes
Income in Early
Income Overview in Early
Per Capita Income in Early is $37,353, while median incomes of families and households are $89,286 and $85,357 respectively.
| Characteristic | Number | Measure |
| Per Capita Income | 787 | $37,353 |
| Median Family Income | 182 | $89,286 |
| Mean Family Income | 182 | $91,051 |
| Median Household Income | 340 | $85,357 |
| Mean Household Income | 340 | $84,236 |
| Income Deficit | 182 | $9,090 |
| Wage / Income Gap (%) | 787 | 46.54% |
| Wage / Income Gap ($) | 787 | 53.46¢ per $1 |
| Gini / Inequality Index | 787 | 0.32 |
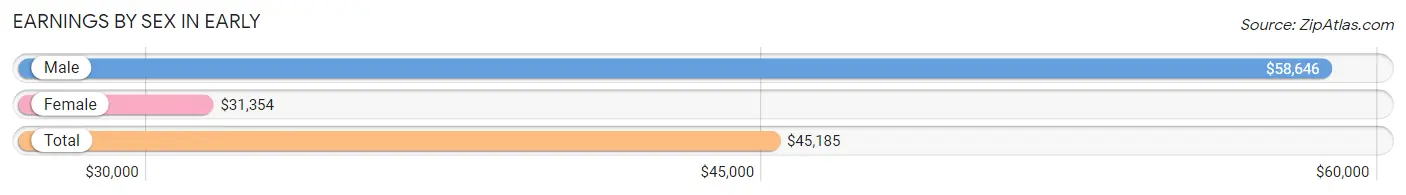
Earnings by Sex in Early
Average Earnings in Early are $45,185, $58,646 for men and $31,354 for women, a difference of 46.5%.
| Sex | Number | Average Earnings |
| Male | 311 (62.7%) | $58,646 |
| Female | 185 (37.3%) | $31,354 |
| Total | 496 (100.0%) | $45,185 |
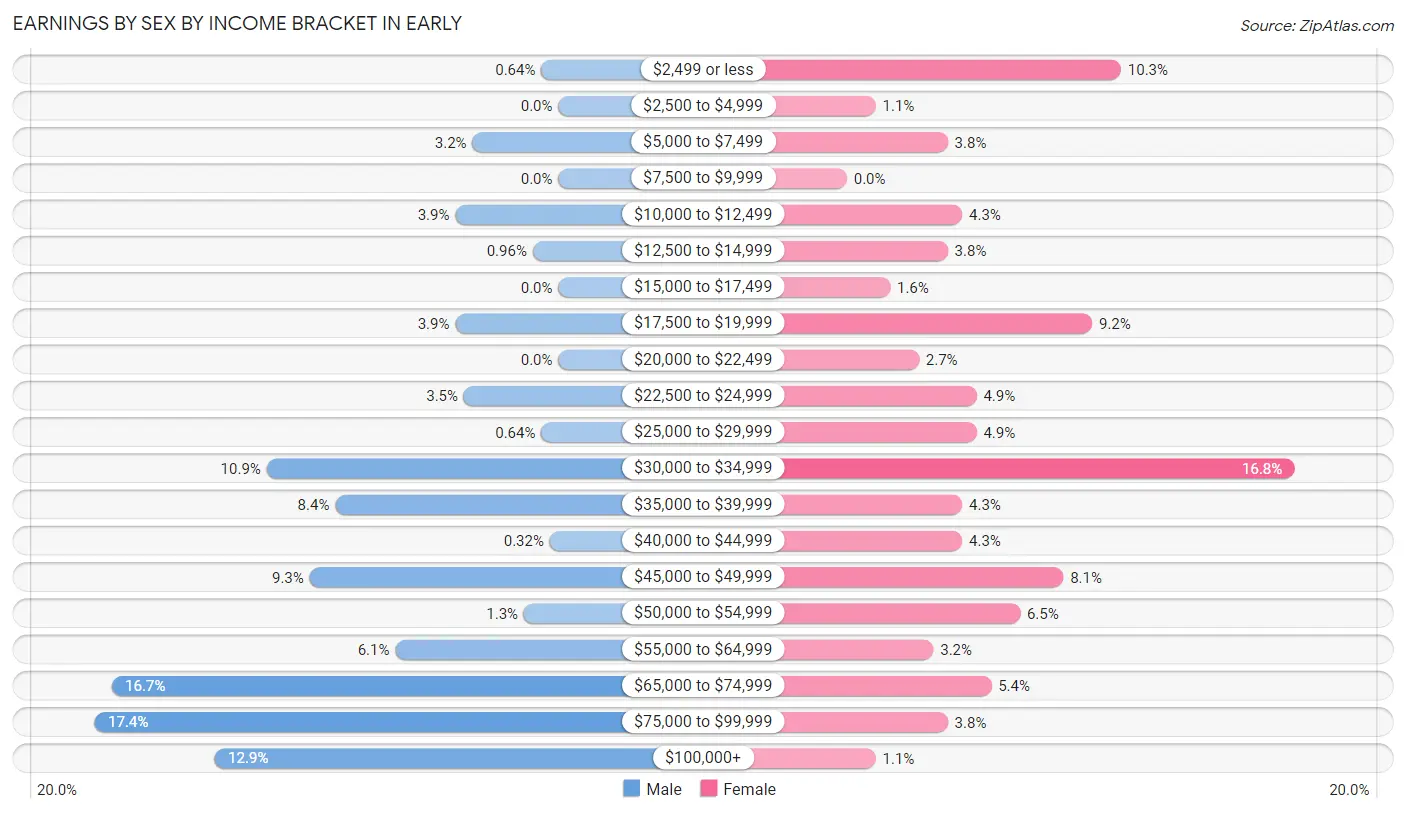
Earnings by Sex by Income Bracket in Early
The most common earnings brackets in Early are $75,000 to $99,999 for men (54 | 17.4%) and $30,000 to $34,999 for women (31 | 16.8%).
| Income | Male | Female |
| $2,499 or less | 2 (0.6%) | 19 (10.3%) |
| $2,500 to $4,999 | 0 (0.0%) | 2 (1.1%) |
| $5,000 to $7,499 | 10 (3.2%) | 7 (3.8%) |
| $7,500 to $9,999 | 0 (0.0%) | 0 (0.0%) |
| $10,000 to $12,499 | 12 (3.9%) | 8 (4.3%) |
| $12,500 to $14,999 | 3 (1.0%) | 7 (3.8%) |
| $15,000 to $17,499 | 0 (0.0%) | 3 (1.6%) |
| $17,500 to $19,999 | 12 (3.9%) | 17 (9.2%) |
| $20,000 to $22,499 | 0 (0.0%) | 5 (2.7%) |
| $22,500 to $24,999 | 11 (3.5%) | 9 (4.9%) |
| $25,000 to $29,999 | 2 (0.6%) | 9 (4.9%) |
| $30,000 to $34,999 | 34 (10.9%) | 31 (16.8%) |
| $35,000 to $39,999 | 26 (8.4%) | 8 (4.3%) |
| $40,000 to $44,999 | 1 (0.3%) | 8 (4.3%) |
| $45,000 to $49,999 | 29 (9.3%) | 15 (8.1%) |
| $50,000 to $54,999 | 4 (1.3%) | 12 (6.5%) |
| $55,000 to $64,999 | 19 (6.1%) | 6 (3.2%) |
| $65,000 to $74,999 | 52 (16.7%) | 10 (5.4%) |
| $75,000 to $99,999 | 54 (17.4%) | 7 (3.8%) |
| $100,000+ | 40 (12.9%) | 2 (1.1%) |
| Total | 311 (100.0%) | 185 (100.0%) |
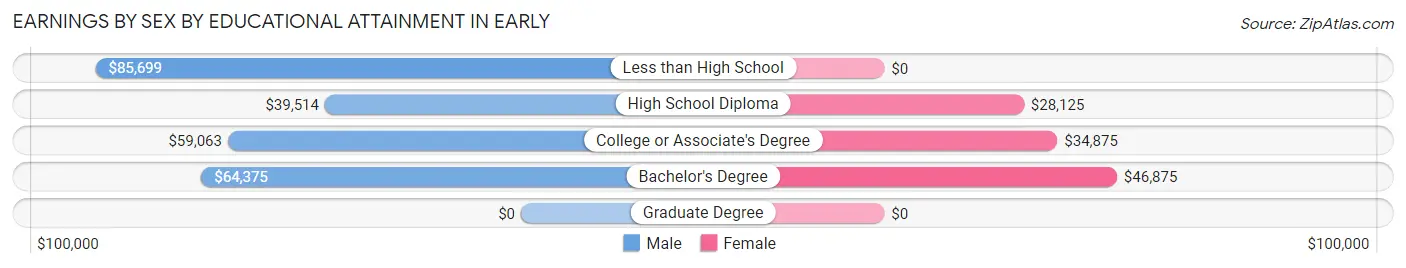
Earnings by Sex by Educational Attainment in Early
Average earnings in Early are $58,542 for men and $33,417 for women, a difference of 42.9%. Men with an educational attainment of less than high school enjoy the highest average annual earnings of $85,699, while those with high school diploma education earn the least with $39,514. Women with an educational attainment of bachelor's degree earn the most with the average annual earnings of $46,875, while those with high school diploma education have the smallest earnings of $28,125.
| Educational Attainment | Male Income | Female Income |
| Less than High School | $85,699 | $0 |
| High School Diploma | $39,514 | $28,125 |
| College or Associate's Degree | $59,063 | $34,875 |
| Bachelor's Degree | $64,375 | $46,875 |
| Graduate Degree | - | - |
| Total | $58,542 | $33,417 |
Family Income in Early
Family Income Brackets in Early
According to the Early family income data, there are 59 families falling into the $100,000 to $149,999 income range, which is the most common income bracket and makes up 32.4% of all families.
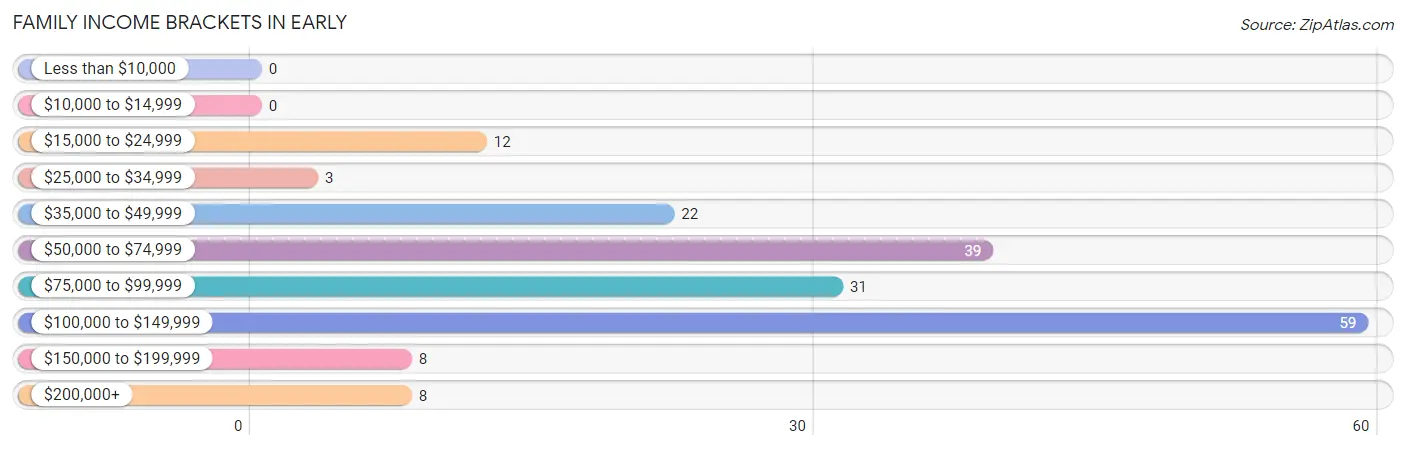
| Income Bracket | # Families | % Families |
| Less than $10,000 | 0 | 0.0% |
| $10,000 to $14,999 | 0 | 0.0% |
| $15,000 to $24,999 | 12 | 6.6% |
| $25,000 to $34,999 | 3 | 1.6% |
| $35,000 to $49,999 | 22 | 12.1% |
| $50,000 to $74,999 | 39 | 21.4% |
| $75,000 to $99,999 | 31 | 17.0% |
| $100,000 to $149,999 | 59 | 32.4% |
| $150,000 to $199,999 | 8 | 4.4% |
| $200,000+ | 8 | 4.4% |
Family Income by Famaliy Size in Early
3-person families (46 | 25.3%) account for the highest median family income in Early with $96,786 per family, while 2-person families (82 | 45.1%) have the highest median income of $44,107 per family member.
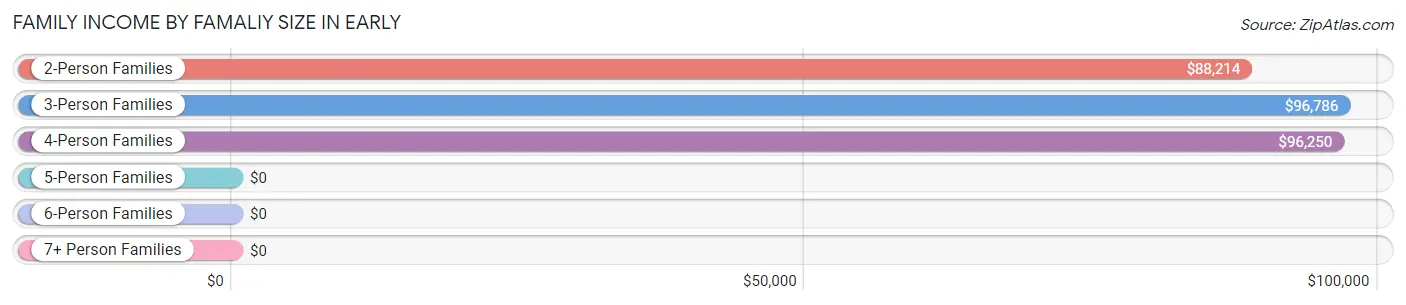
| Income Bracket | # Families | Median Income |
| 2-Person Families | 82 (45.1%) | $88,214 |
| 3-Person Families | 46 (25.3%) | $96,786 |
| 4-Person Families | 40 (22.0%) | $96,250 |
| 5-Person Families | 8 (4.4%) | $0 |
| 6-Person Families | 6 (3.3%) | $0 |
| 7+ Person Families | 0 (0.0%) | $0 |
| Total | 182 (100.0%) | $89,286 |
Family Income by Number of Earners in Early
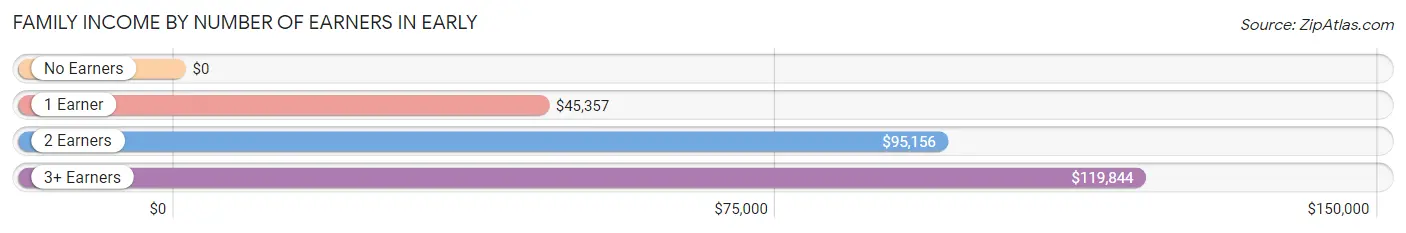
| Number of Earners | # Families | Median Income |
| No Earners | 16 (8.8%) | $0 |
| 1 Earner | 26 (14.3%) | $45,357 |
| 2 Earners | 121 (66.5%) | $95,156 |
| 3+ Earners | 19 (10.4%) | $119,844 |
| Total | 182 (100.0%) | $89,286 |
Household Income in Early
Household Income Brackets in Early
With 75 households falling in the category, the $75,000 to $99,999 income range is the most frequent in Early, accounting for 22.1% of all households. In contrast, only 4 households (1.2%) fall into the less than $10,000 income bracket, making it the least populous group.
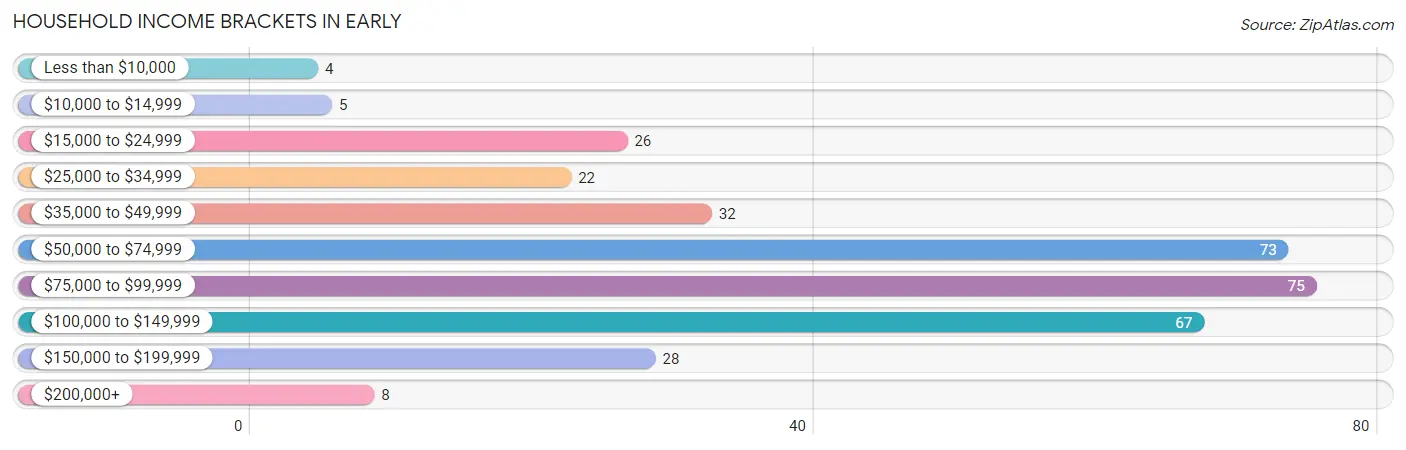
| Income Bracket | # Households | % Households |
| Less than $10,000 | 4 | 1.2% |
| $10,000 to $14,999 | 5 | 1.5% |
| $15,000 to $24,999 | 26 | 7.6% |
| $25,000 to $34,999 | 22 | 6.5% |
| $35,000 to $49,999 | 32 | 9.4% |
| $50,000 to $74,999 | 73 | 21.5% |
| $75,000 to $99,999 | 75 | 22.1% |
| $100,000 to $149,999 | 67 | 19.7% |
| $150,000 to $199,999 | 28 | 8.2% |
| $200,000+ | 8 | 2.4% |
Household Income by Householder Age in Early
The median household income in Early is $85,357, with the highest median household income of $85,857 found in the 45 to 64 years age bracket for the primary householder. A total of 180 households (52.9%) fall into this category. Meanwhile, the 15 to 24 years age bracket for the primary householder has the lowest median household income of $0, with 24 households (7.1%) in this group.
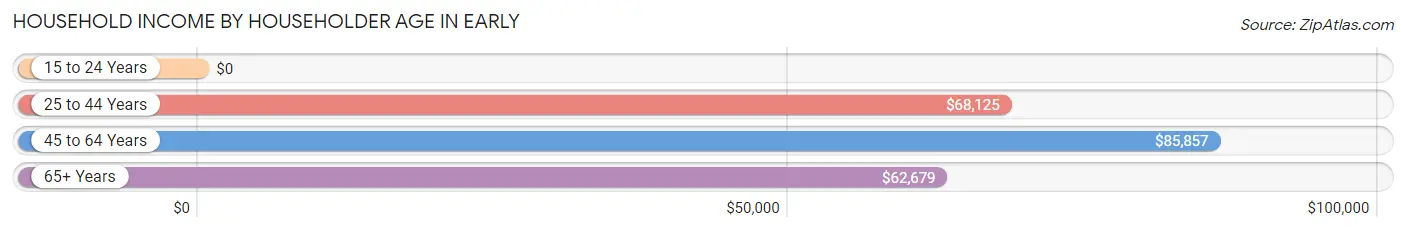
| Income Bracket | # Households | Median Income |
| 15 to 24 Years | 24 (7.1%) | $0 |
| 25 to 44 Years | 79 (23.2%) | $68,125 |
| 45 to 64 Years | 180 (52.9%) | $85,857 |
| 65+ Years | 57 (16.8%) | $62,679 |
| Total | 340 (100.0%) | $85,357 |
Poverty in Early
Income Below Poverty by Sex and Age in Early
With 12.8% poverty level for males and 9.2% for females among the residents of Early, 15 year old males and 5 year old females are the most vulnerable to poverty, with 10 males (90.9%) and 2 females (100.0%) in their respective age groups living below the poverty level.
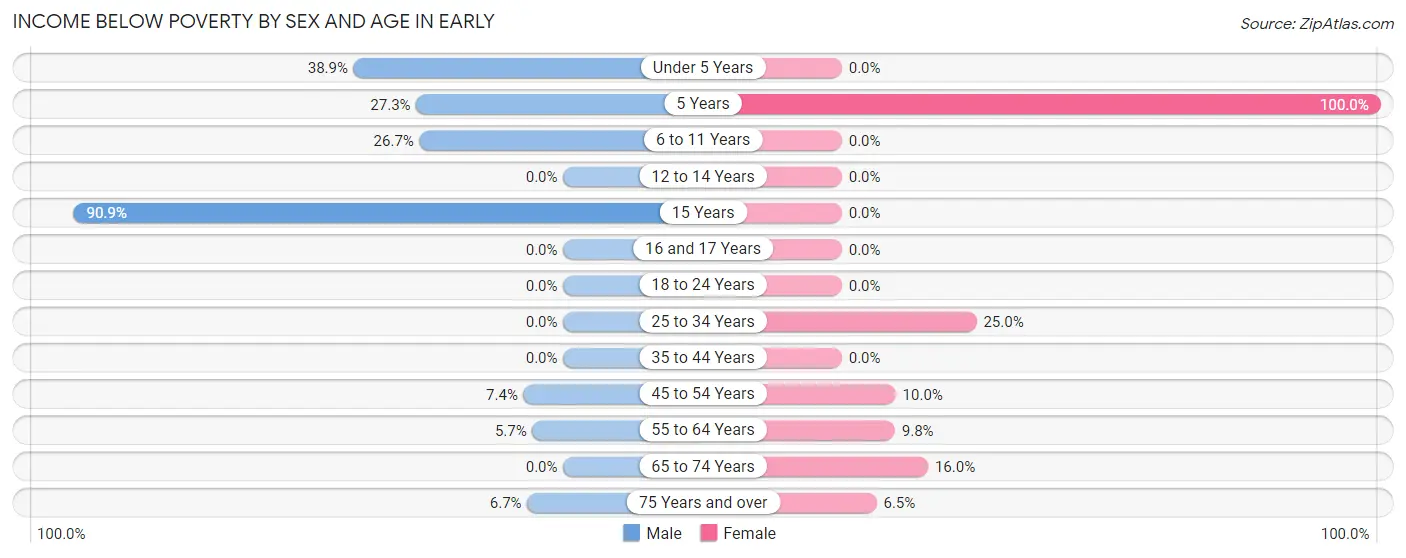
| Age Bracket | Male | Female |
| Under 5 Years | 28 (38.9%) | 0 (0.0%) |
| 5 Years | 3 (27.3%) | 2 (100.0%) |
| 6 to 11 Years | 8 (26.7%) | 0 (0.0%) |
| 12 to 14 Years | 0 (0.0%) | 0 (0.0%) |
| 15 Years | 10 (90.9%) | 0 (0.0%) |
| 16 and 17 Years | 0 (0.0%) | 0 (0.0%) |
| 18 to 24 Years | 0 (0.0%) | 0 (0.0%) |
| 25 to 34 Years | 0 (0.0%) | 9 (25.0%) |
| 35 to 44 Years | 0 (0.0%) | 0 (0.0%) |
| 45 to 54 Years | 5 (7.3%) | 4 (10.0%) |
| 55 to 64 Years | 6 (5.7%) | 6 (9.8%) |
| 65 to 74 Years | 0 (0.0%) | 4 (16.0%) |
| 75 Years and over | 2 (6.7%) | 2 (6.5%) |
| Total | 62 (12.8%) | 27 (9.2%) |
Income Above Poverty by Sex and Age in Early
According to the poverty statistics in Early, males aged 12 to 14 years and females aged under 5 years are the age groups that are most secure financially, with 100.0% of males and 100.0% of females in these age groups living above the poverty line.
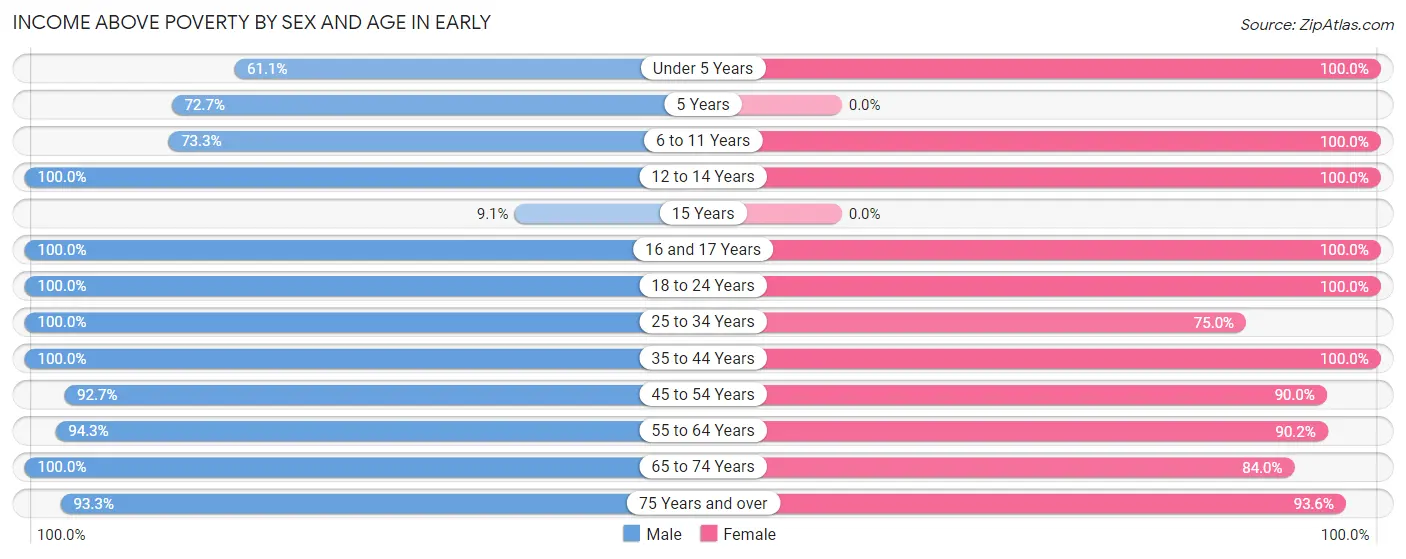
| Age Bracket | Male | Female |
| Under 5 Years | 44 (61.1%) | 3 (100.0%) |
| 5 Years | 8 (72.7%) | 0 (0.0%) |
| 6 to 11 Years | 22 (73.3%) | 18 (100.0%) |
| 12 to 14 Years | 8 (100.0%) | 9 (100.0%) |
| 15 Years | 1 (9.1%) | 0 (0.0%) |
| 16 and 17 Years | 2 (100.0%) | 18 (100.0%) |
| 18 to 24 Years | 55 (100.0%) | 22 (100.0%) |
| 25 to 34 Years | 55 (100.0%) | 27 (75.0%) |
| 35 to 44 Years | 22 (100.0%) | 27 (100.0%) |
| 45 to 54 Years | 63 (92.6%) | 36 (90.0%) |
| 55 to 64 Years | 99 (94.3%) | 55 (90.2%) |
| 65 to 74 Years | 14 (100.0%) | 21 (84.0%) |
| 75 Years and over | 28 (93.3%) | 29 (93.5%) |
| Total | 421 (87.2%) | 265 (90.7%) |
Income Below Poverty Among Married-Couple Families in Early
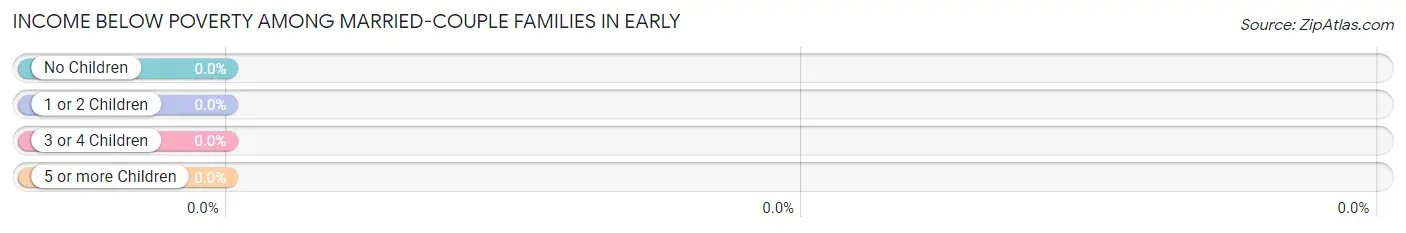
| Children | Above Poverty | Below Poverty |
| No Children | 80 (100.0%) | 0 (0.0%) |
| 1 or 2 Children | 47 (100.0%) | 0 (0.0%) |
| 3 or 4 Children | 7 (100.0%) | 0 (0.0%) |
| 5 or more Children | 0 (0.0%) | 0 (0.0%) |
| Total | 134 (100.0%) | 0 (0.0%) |
Income Below Poverty Among Single-Parent Households in Early
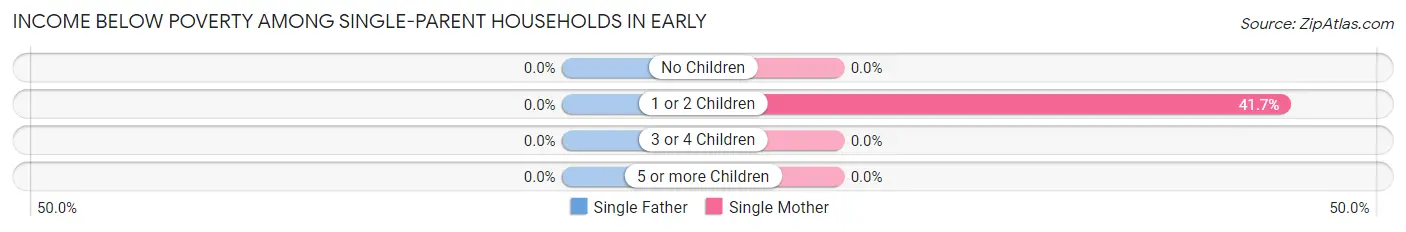
| Children | Single Father | Single Mother |
| No Children | 0 (0.0%) | 0 (0.0%) |
| 1 or 2 Children | 0 (0.0%) | 10 (41.7%) |
| 3 or 4 Children | 0 (0.0%) | 0 (0.0%) |
| 5 or more Children | 0 (0.0%) | 0 (0.0%) |
| Total | 0 (0.0%) | 10 (34.5%) |
Income Below Poverty Among Married-Couple vs Single-Parent Households in Early
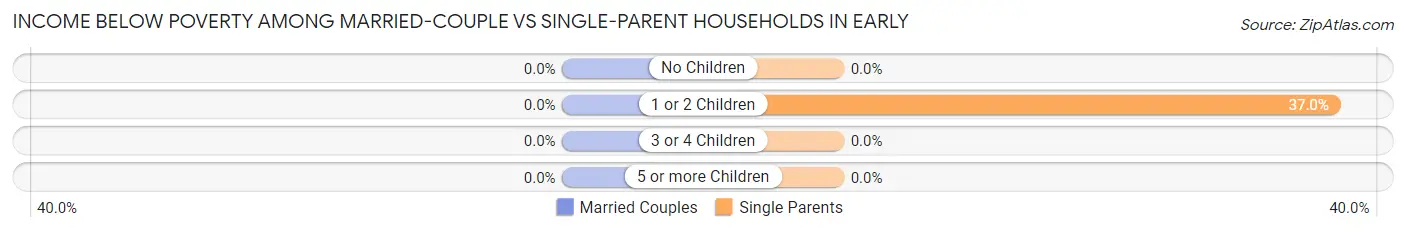
| Children | Married-Couple Families | Single-Parent Households |
| No Children | 0 (0.0%) | 0 (0.0%) |
| 1 or 2 Children | 0 (0.0%) | 10 (37.0%) |
| 3 or 4 Children | 0 (0.0%) | 0 (0.0%) |
| 5 or more Children | 0 (0.0%) | 0 (0.0%) |
| Total | 0 (0.0%) | 10 (20.8%) |
Race in Early
The most populous races in Early are White / Caucasian (731 | 92.9%), Hispanic or Latino (71 | 9.0%), and Some other Race (28 | 3.6%).
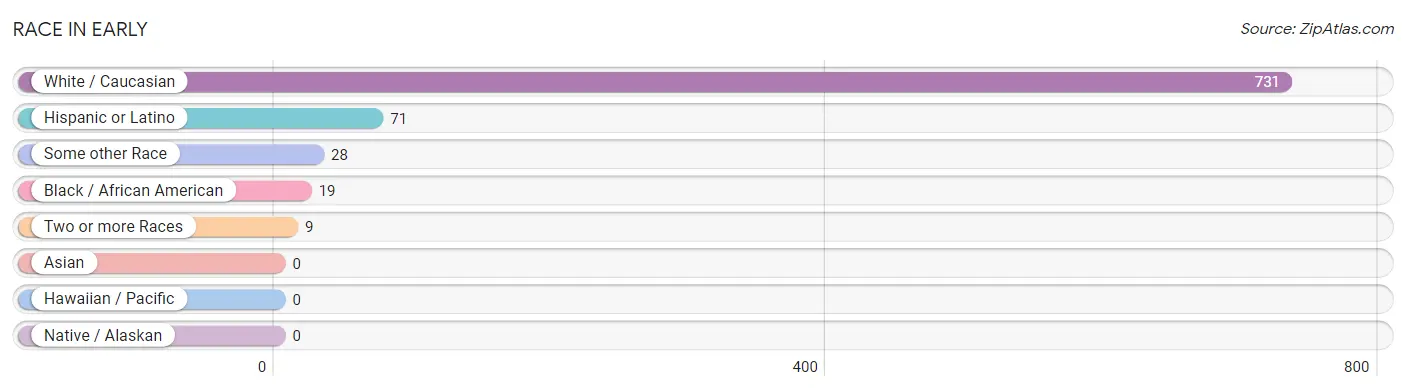
| Race | # Population | % Population |
| Asian | 0 | 0.0% |
| Black / African American | 19 | 2.4% |
| Hawaiian / Pacific | 0 | 0.0% |
| Hispanic or Latino | 71 | 9.0% |
| Native / Alaskan | 0 | 0.0% |
| White / Caucasian | 731 | 92.9% |
| Two or more Races | 9 | 1.1% |
| Some other Race | 28 | 3.6% |
| Total | 787 | 100.0% |
Ancestry in Early
The most populous ancestries reported in Early are German (334 | 42.4%), Mexican (68 | 8.6%), American (39 | 5.0%), English (35 | 4.4%), and British (21 | 2.7%), together accounting for 63.2% of all Early residents.
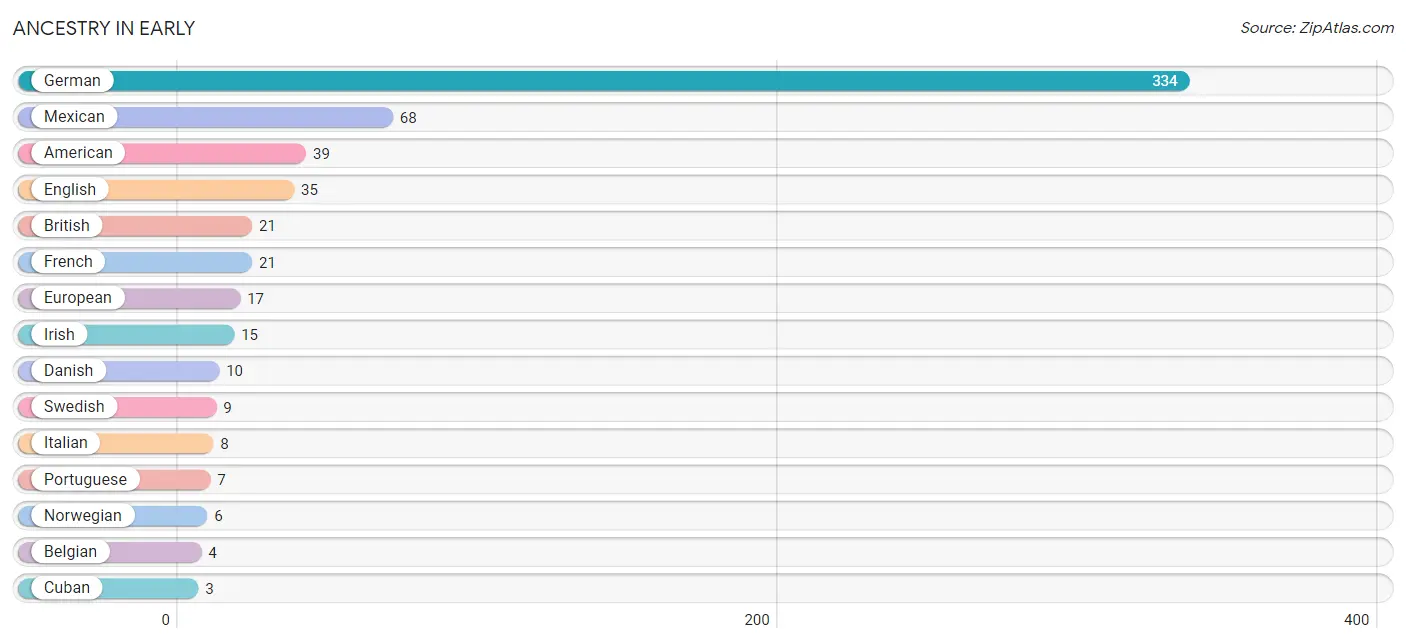
| Ancestry | # Population | % Population |
| American | 39 | 5.0% |
| Belgian | 4 | 0.5% |
| British | 21 | 2.7% |
| Cuban | 3 | 0.4% |
| Czech | 1 | 0.1% |
| Danish | 10 | 1.3% |
| English | 35 | 4.4% |
| European | 17 | 2.2% |
| French | 21 | 2.7% |
| German | 334 | 42.4% |
| Greek | 3 | 0.4% |
| Irish | 15 | 1.9% |
| Italian | 8 | 1.0% |
| Mexican | 68 | 8.6% |
| Norwegian | 6 | 0.8% |
| Portuguese | 7 | 0.9% |
| Scotch-Irish | 2 | 0.3% |
| Scottish | 3 | 0.4% |
| Swedish | 9 | 1.1% |
| Welsh | 2 | 0.3% | View All 20 Rows |
Immigrants in Early
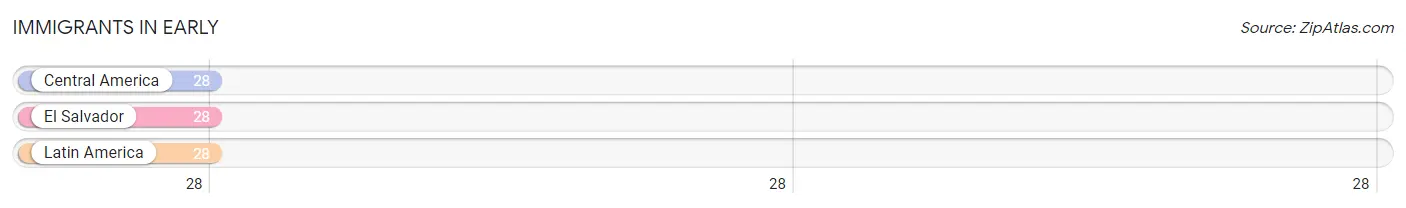
The most numerous immigrant groups reported in Early came from Central America (28 | 3.6%), El Salvador (28 | 3.6%), and Latin America (28 | 3.6%), together accounting for 10.7% of all Early residents.
| Immigration Origin | # Population | % Population |
| Central America | 28 | 3.6% |
| El Salvador | 28 | 3.6% |
| Latin America | 28 | 3.6% | View All 3 Rows |
Sex and Age in Early
Sex and Age in Early
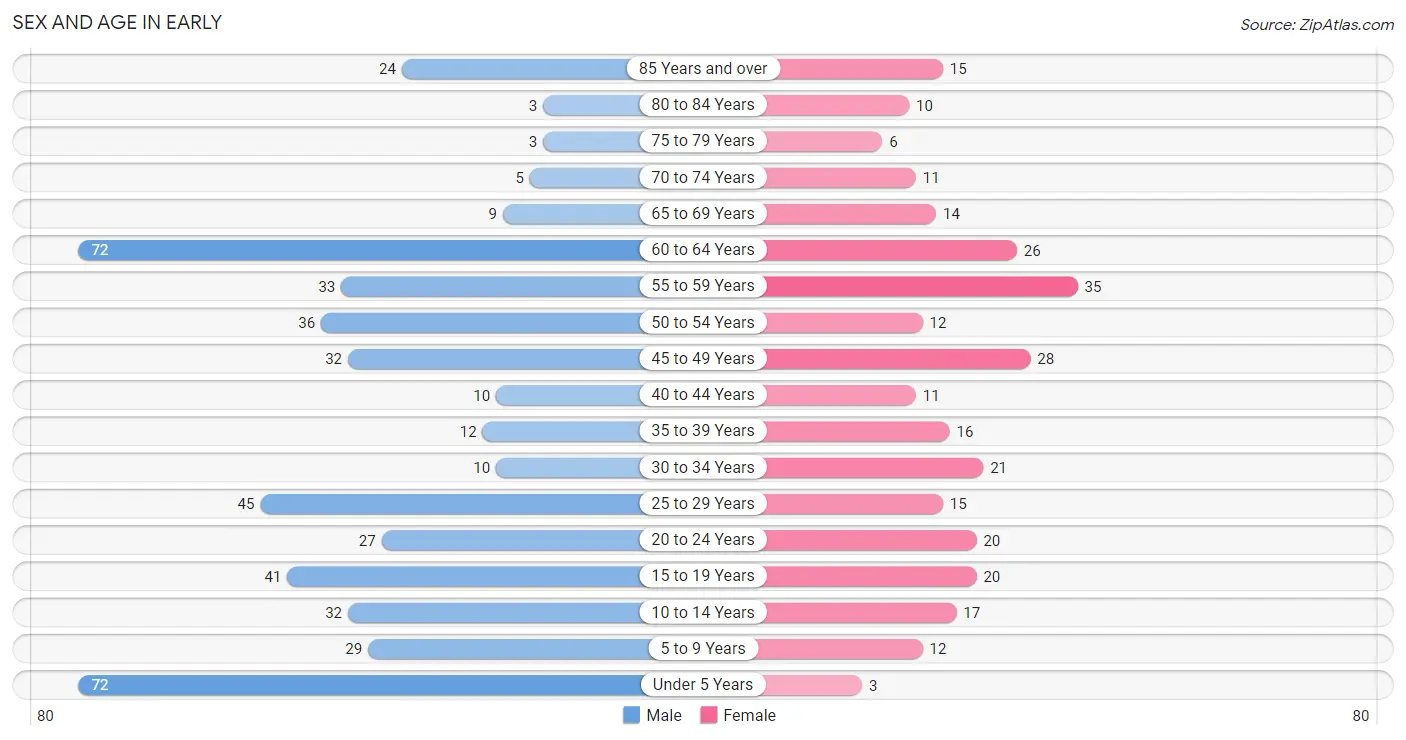
The most populous age groups in Early are Under 5 Years (72 | 14.5%) for men and 55 to 59 Years (35 | 12.0%) for women.
| Age Bracket | Male | Female |
| Under 5 Years | 72 (14.5%) | 3 (1.0%) |
| 5 to 9 Years | 29 (5.9%) | 12 (4.1%) |
| 10 to 14 Years | 32 (6.5%) | 17 (5.8%) |
| 15 to 19 Years | 41 (8.3%) | 20 (6.9%) |
| 20 to 24 Years | 27 (5.4%) | 20 (6.9%) |
| 25 to 29 Years | 45 (9.1%) | 15 (5.1%) |
| 30 to 34 Years | 10 (2.0%) | 21 (7.2%) |
| 35 to 39 Years | 12 (2.4%) | 16 (5.5%) |
| 40 to 44 Years | 10 (2.0%) | 11 (3.8%) |
| 45 to 49 Years | 32 (6.5%) | 28 (9.6%) |
| 50 to 54 Years | 36 (7.3%) | 12 (4.1%) |
| 55 to 59 Years | 33 (6.7%) | 35 (12.0%) |
| 60 to 64 Years | 72 (14.5%) | 26 (8.9%) |
| 65 to 69 Years | 9 (1.8%) | 14 (4.8%) |
| 70 to 74 Years | 5 (1.0%) | 11 (3.8%) |
| 75 to 79 Years | 3 (0.6%) | 6 (2.1%) |
| 80 to 84 Years | 3 (0.6%) | 10 (3.4%) |
| 85 Years and over | 24 (4.9%) | 15 (5.1%) |
| Total | 495 (100.0%) | 292 (100.0%) |
Families and Households in Early
Median Family Size in Early
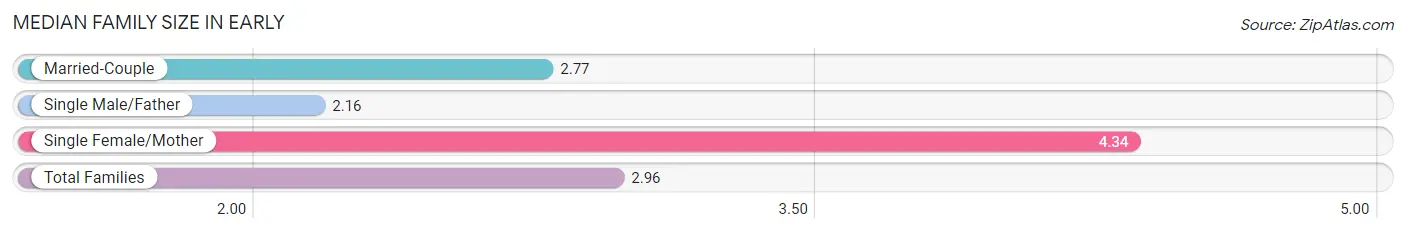
The median family size in Early is 2.96 persons per family, with single female/mother families (29 | 15.9%) accounting for the largest median family size of 4.34 persons per family. On the other hand, single male/father families (19 | 10.4%) represent the smallest median family size with 2.16 persons per family.
| Family Type | # Families | Family Size |
| Married-Couple | 134 (73.6%) | 2.77 |
| Single Male/Father | 19 (10.4%) | 2.16 |
| Single Female/Mother | 29 (15.9%) | 4.34 |
| Total Families | 182 (100.0%) | 2.96 |
Median Household Size in Early
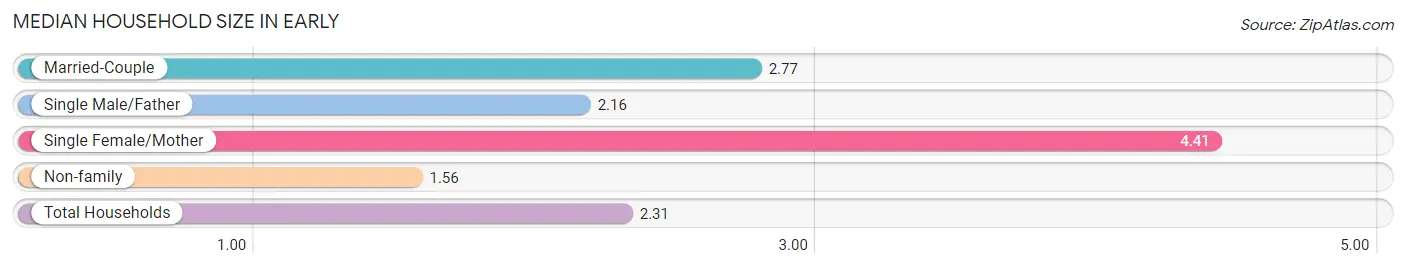
The median household size in Early is 2.31 persons per household, with single female/mother households (29 | 8.5%) accounting for the largest median household size of 4.41 persons per household. non-family households (158 | 46.5%) represent the smallest median household size with 1.56 persons per household.
| Household Type | # Households | Household Size |
| Married-Couple | 134 (39.4%) | 2.77 |
| Single Male/Father | 19 (5.6%) | 2.16 |
| Single Female/Mother | 29 (8.5%) | 4.41 |
| Non-family | 158 (46.5%) | 1.56 |
| Total Households | 340 (100.0%) | 2.31 |
Household Size by Marriage Status in Early
Out of a total of 340 households in Early, 182 (53.5%) are family households, while 158 (46.5%) are nonfamily households. The most numerous type of family households are 2-person households, comprising 82, and the most common type of nonfamily households are 1-person households, comprising 100.
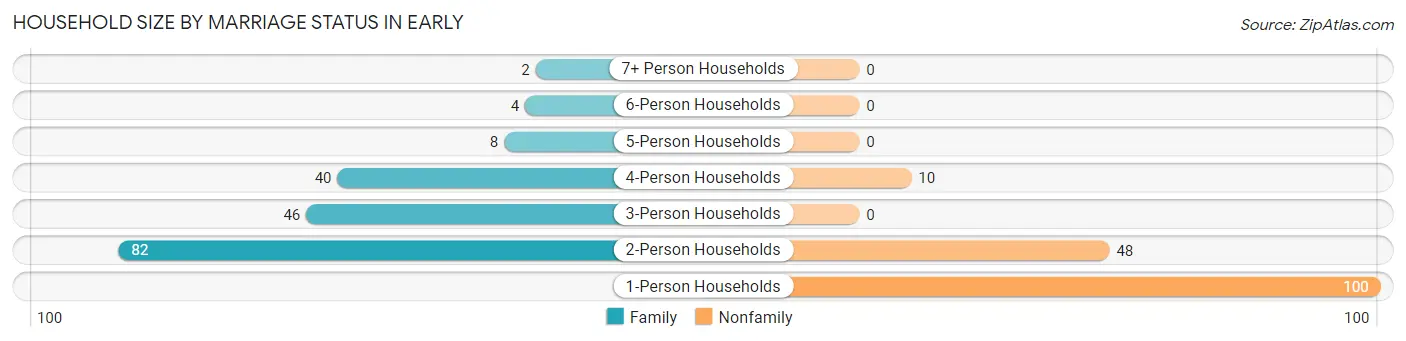
| Household Size | Family Households | Nonfamily Households |
| 1-Person Households | - | 100 (29.4%) |
| 2-Person Households | 82 (24.1%) | 48 (14.1%) |
| 3-Person Households | 46 (13.5%) | 0 (0.0%) |
| 4-Person Households | 40 (11.8%) | 10 (2.9%) |
| 5-Person Households | 8 (2.4%) | 0 (0.0%) |
| 6-Person Households | 4 (1.2%) | 0 (0.0%) |
| 7+ Person Households | 2 (0.6%) | 0 (0.0%) |
| Total | 182 (53.5%) | 158 (46.5%) |
Female Fertility in Early
Fertility by Age in Early
Average fertility rate in Early is 133.0 births per 1,000 women. Women in the age bracket of 20 to 34 years have the highest fertility rate with 321.0 births per 1,000 women. Women in the age bracket of 20 to 34 years acount for 100.0% of all women with births.
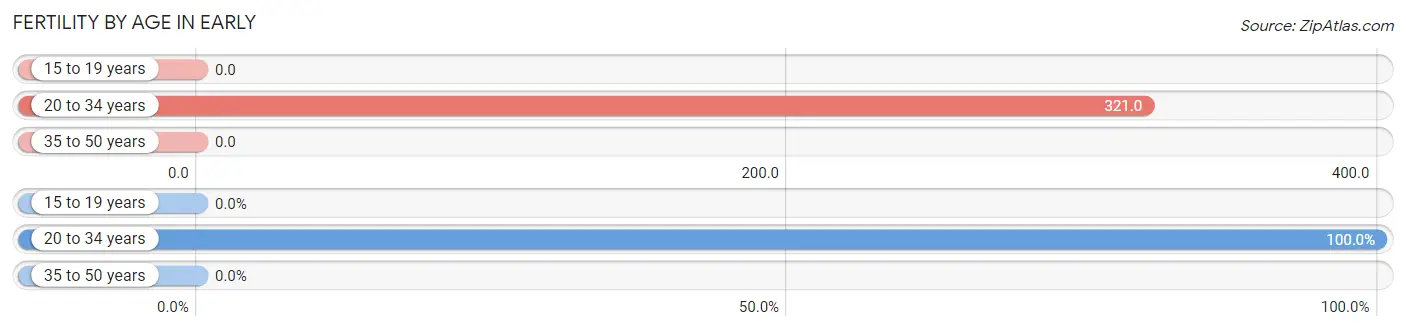
| Age Bracket | Women with Births | Births / 1,000 Women |
| 15 to 19 years | 0 (0.0%) | 0.0 |
| 20 to 34 years | 18 (100.0%) | 321.0 |
| 35 to 50 years | 0 (0.0%) | 0.0 |
| Total | 18 (100.0%) | 133.0 |
Fertility by Age by Marriage Status in Early
77.8% of women with births (18) in Early are married. The highest percentage of unmarried women with births falls into 20 to 34 years age bracket with 22.2% of them unmarried at the time of birth, while the lowest percentage of unmarried women with births belong to 20 to 34 years age bracket with 22.2% of them unmarried.
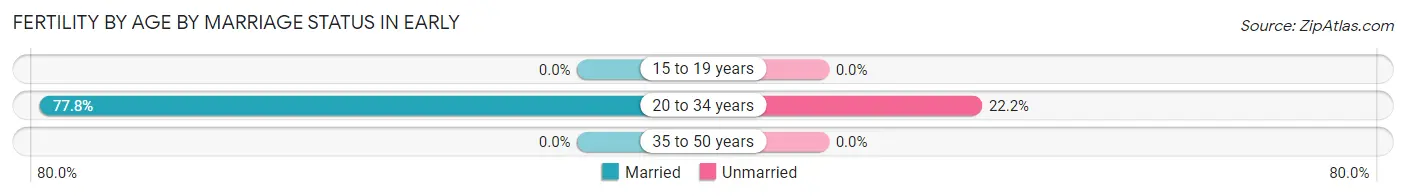
| Age Bracket | Married | Unmarried |
| 15 to 19 years | 0 (0.0%) | 0 (0.0%) |
| 20 to 34 years | 14 (77.8%) | 4 (22.2%) |
| 35 to 50 years | 0 (0.0%) | 0 (0.0%) |
| Total | 14 (77.8%) | 4 (22.2%) |
Fertility by Education in Early
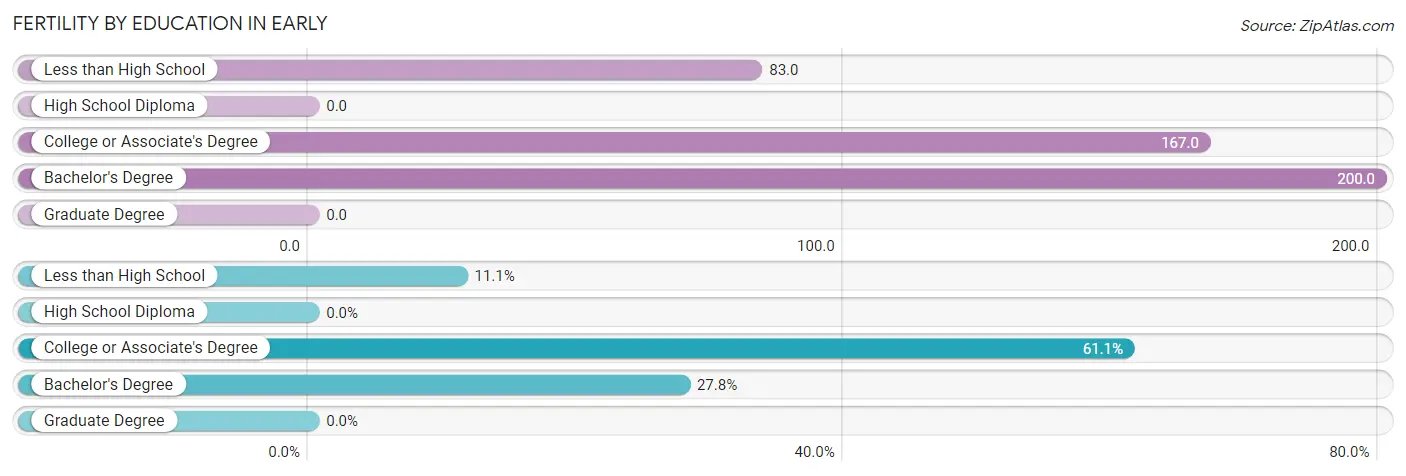
| Educational Attainment | Women with Births | Births / 1,000 Women |
| Less than High School | 2 (11.1%) | 83.0 |
| High School Diploma | 0 (0.0%) | 0.0 |
| College or Associate's Degree | 11 (61.1%) | 167.0 |
| Bachelor's Degree | 5 (27.8%) | 200.0 |
| Graduate Degree | 0 (0.0%) | 0.0 |
| Total | 18 (100.0%) | 133.0 |
Fertility by Education by Marriage Status in Early
22.2% of women with births in Early are unmarried. Women with the educational attainment of bachelor's degree are most likely to be married with 100.0% of them married at childbirth, while women with the educational attainment of less than high school are least likely to be married with 100.0% of them unmarried at childbirth.
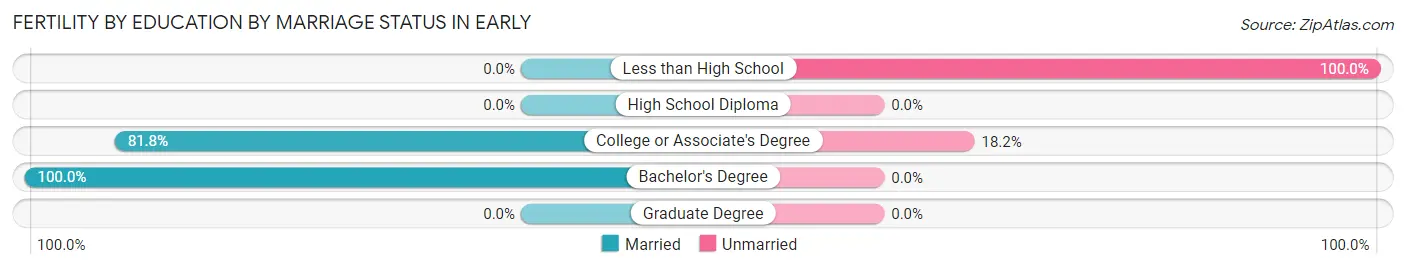
| Educational Attainment | Married | Unmarried |
| Less than High School | 0 (0.0%) | 2 (100.0%) |
| High School Diploma | 0 (0.0%) | 0 (0.0%) |
| College or Associate's Degree | 9 (81.8%) | 2 (18.2%) |
| Bachelor's Degree | 5 (100.0%) | 0 (0.0%) |
| Graduate Degree | 0 (0.0%) | 0 (0.0%) |
| Total | 14 (77.8%) | 4 (22.2%) |
Employment Characteristics in Early
Employment by Class of Employer in Early
Among the 436 employed individuals in Early, private company employees (264 | 60.6%), self-employed (not incorporated) (72 | 16.5%), and local government employees (56 | 12.8%) make up the most common classes of employment.
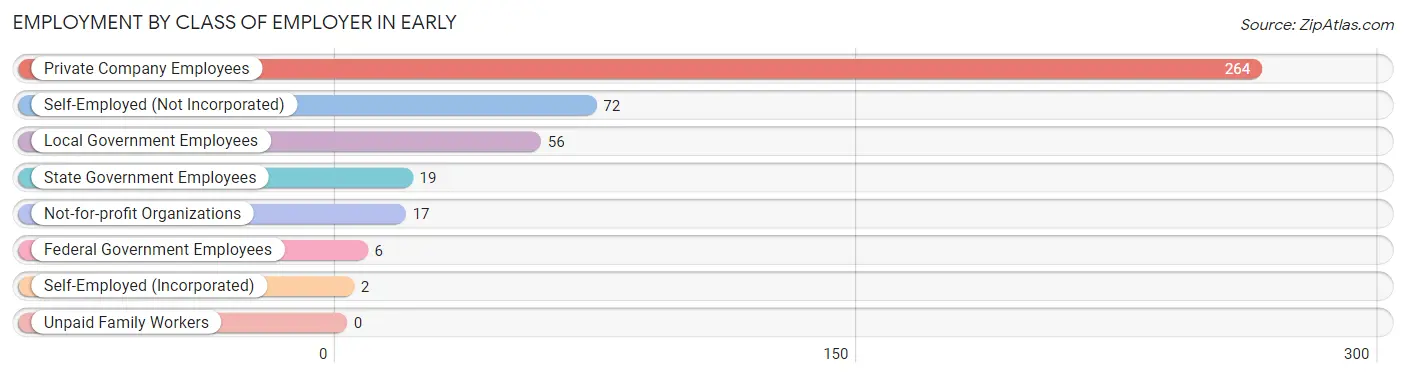
| Employer Class | # Employees | % Employees |
| Private Company Employees | 264 | 60.6% |
| Self-Employed (Incorporated) | 2 | 0.5% |
| Self-Employed (Not Incorporated) | 72 | 16.5% |
| Not-for-profit Organizations | 17 | 3.9% |
| Local Government Employees | 56 | 12.8% |
| State Government Employees | 19 | 4.4% |
| Federal Government Employees | 6 | 1.4% |
| Unpaid Family Workers | 0 | 0.0% |
| Total | 436 | 100.0% |
Employment Status by Age in Early
According to the labor force statistics for Early, out of the total population over 16 years of age (611), 80.2% or 490 individuals are in the labor force, with 9.6% or 47 of them unemployed. The age group with the highest labor force participation rate is 20 to 24 years, with 100.0% or 47 individuals in the labor force. Within the labor force, the 16 to 19 years age range has the highest percentage of unemployed individuals, with 88.1% or 37 of them being unemployed.
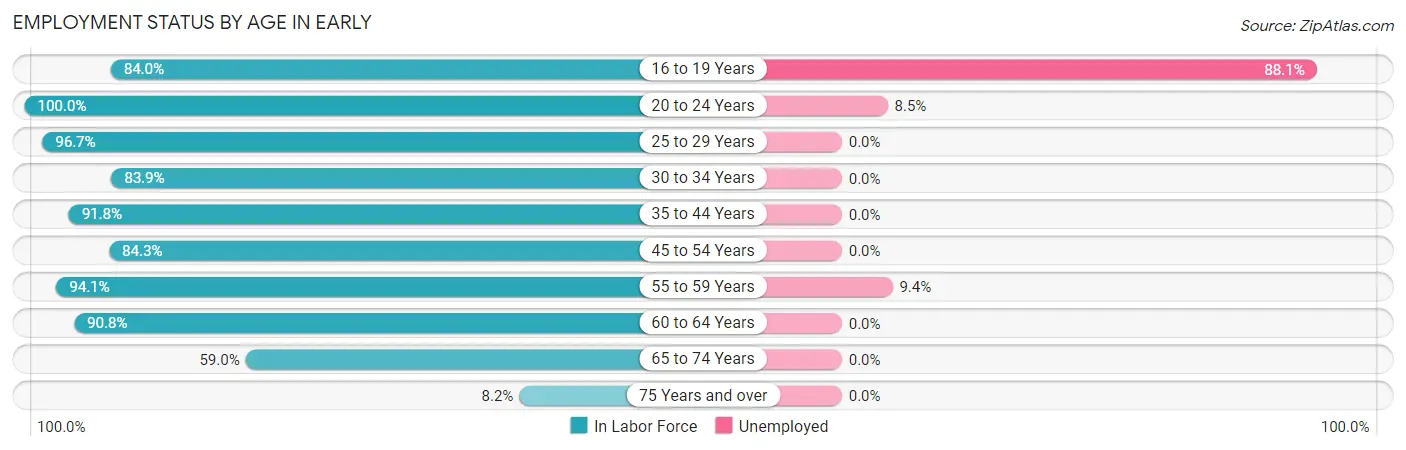
| Age Bracket | In Labor Force | Unemployed |
| 16 to 19 Years | 42 (84.0%) | 37 (88.1%) |
| 20 to 24 Years | 47 (100.0%) | 4 (8.5%) |
| 25 to 29 Years | 58 (96.7%) | 0 (0.0%) |
| 30 to 34 Years | 26 (83.9%) | 0 (0.0%) |
| 35 to 44 Years | 45 (91.8%) | 0 (0.0%) |
| 45 to 54 Years | 91 (84.3%) | 0 (0.0%) |
| 55 to 59 Years | 64 (94.1%) | 6 (9.4%) |
| 60 to 64 Years | 89 (90.8%) | 0 (0.0%) |
| 65 to 74 Years | 23 (59.0%) | 0 (0.0%) |
| 75 Years and over | 5 (8.2%) | 0 (0.0%) |
| Total | 490 (80.2%) | 47 (9.6%) |
Employment Status by Educational Attainment in Early
According to labor force statistics for Early, 90.1% of individuals (373) out of the total population between 25 and 64 years of age (414) are in the labor force, with 1.6% or 6 of them being unemployed. The group with the highest labor force participation rate are those with the educational attainment of college / associate degree, with 91.1% or 175 individuals in the labor force. Within the labor force, individuals with college / associate degree education have the highest percentage of unemployment, with 3.4% or 6 of them being unemployed.
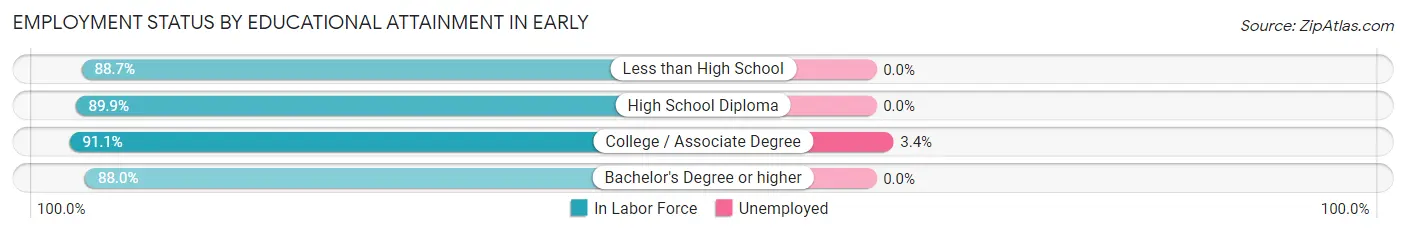
| Educational Attainment | In Labor Force | Unemployed |
| Less than High School | 47 (88.7%) | 0 (0.0%) |
| High School Diploma | 107 (89.9%) | 0 (0.0%) |
| College / Associate Degree | 175 (91.1%) | 7 (3.4%) |
| Bachelor's Degree or higher | 44 (88.0%) | 0 (0.0%) |
| Total | 373 (90.1%) | 7 (1.6%) |
Employment Occupations by Sex in Early
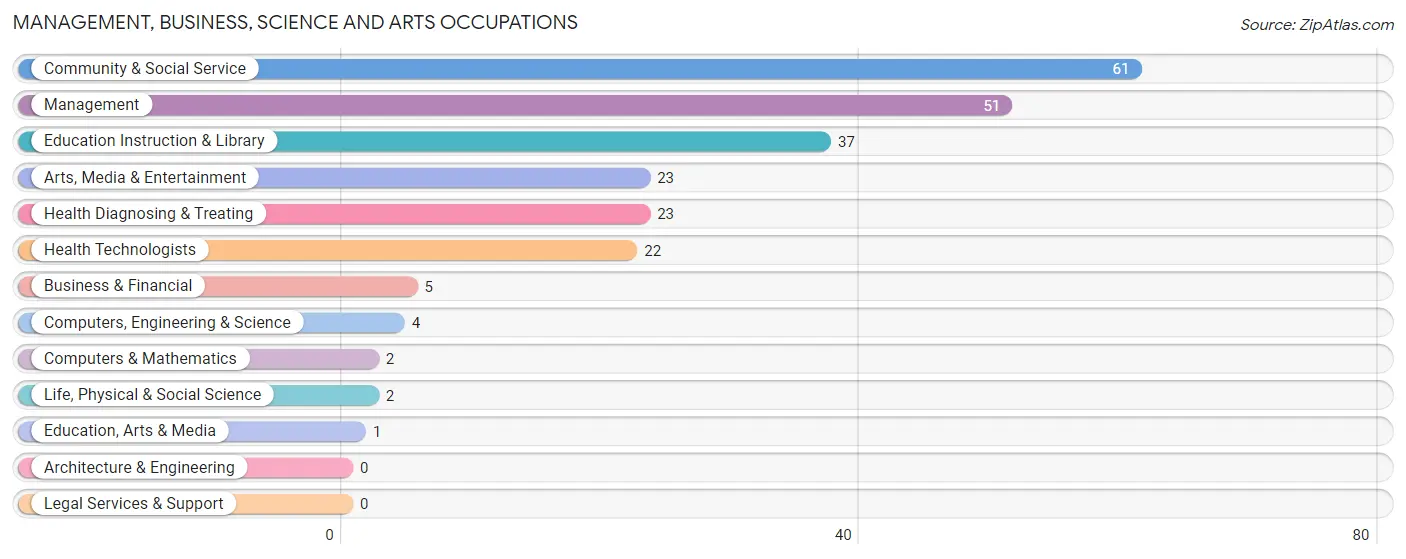
Management, Business, Science and Arts Occupations
The most common Management, Business, Science and Arts occupations in Early are Community & Social Service (61 | 13.8%), Management (51 | 11.5%), Education Instruction & Library (37 | 8.4%), Arts, Media & Entertainment (23 | 5.2%), and Health Diagnosing & Treating (23 | 5.2%).
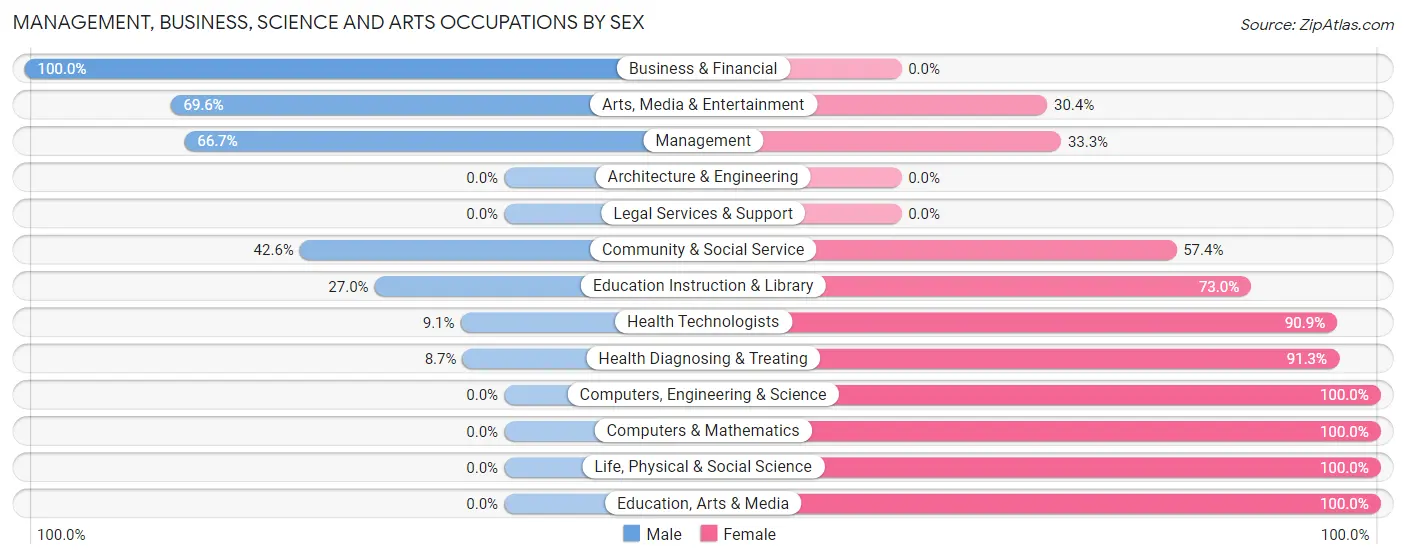
Management, Business, Science and Arts Occupations by Sex
Within the Management, Business, Science and Arts occupations in Early, the most male-oriented occupations are Business & Financial (100.0%), Arts, Media & Entertainment (69.6%), and Management (66.7%), while the most female-oriented occupations are Computers, Engineering & Science (100.0%), Computers & Mathematics (100.0%), and Life, Physical & Social Science (100.0%).
| Occupation | Male | Female |
| Management | 34 (66.7%) | 17 (33.3%) |
| Business & Financial | 5 (100.0%) | 0 (0.0%) |
| Computers, Engineering & Science | 0 (0.0%) | 4 (100.0%) |
| Computers & Mathematics | 0 (0.0%) | 2 (100.0%) |
| Architecture & Engineering | 0 (0.0%) | 0 (0.0%) |
| Life, Physical & Social Science | 0 (0.0%) | 2 (100.0%) |
| Community & Social Service | 26 (42.6%) | 35 (57.4%) |
| Education, Arts & Media | 0 (0.0%) | 1 (100.0%) |
| Legal Services & Support | 0 (0.0%) | 0 (0.0%) |
| Education Instruction & Library | 10 (27.0%) | 27 (73.0%) |
| Arts, Media & Entertainment | 16 (69.6%) | 7 (30.4%) |
| Health Diagnosing & Treating | 2 (8.7%) | 21 (91.3%) |
| Health Technologists | 2 (9.1%) | 20 (90.9%) |
| Total (Category) | 67 (46.5%) | 77 (53.5%) |
| Total (Overall) | 281 (63.4%) | 162 (36.6%) |
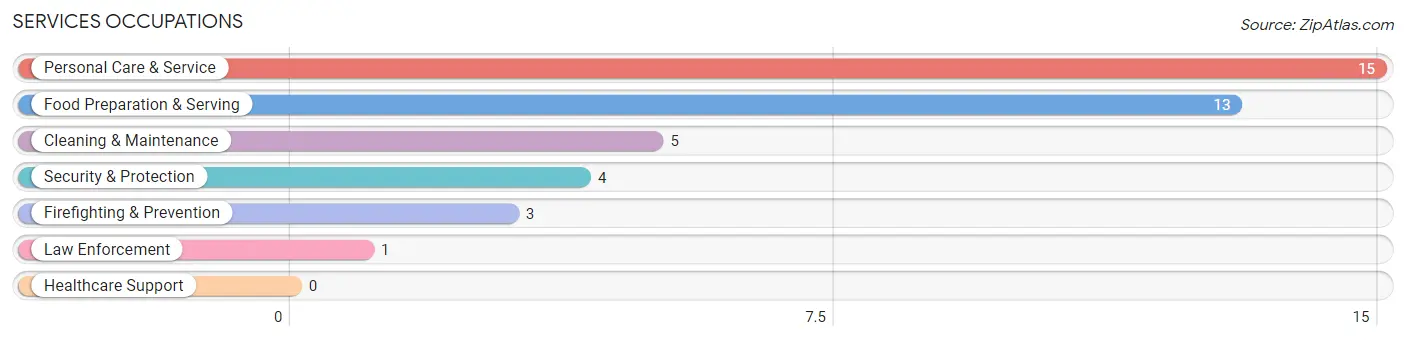
Services Occupations
The most common Services occupations in Early are Personal Care & Service (15 | 3.4%), Food Preparation & Serving (13 | 2.9%), Cleaning & Maintenance (5 | 1.1%), Security & Protection (4 | 0.9%), and Firefighting & Prevention (3 | 0.7%).
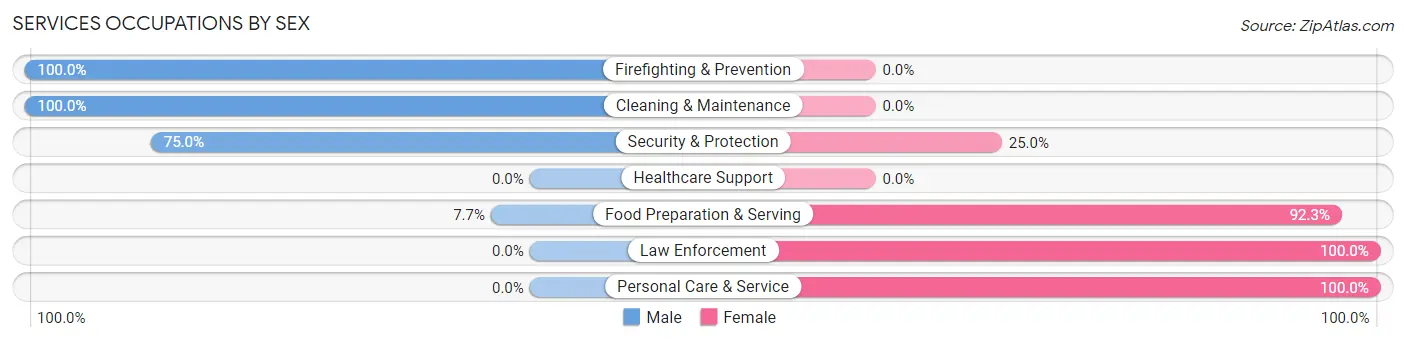
Services Occupations by Sex
Within the Services occupations in Early, the most male-oriented occupations are Firefighting & Prevention (100.0%), Cleaning & Maintenance (100.0%), and Security & Protection (75.0%), while the most female-oriented occupations are Law Enforcement (100.0%), Personal Care & Service (100.0%), and Food Preparation & Serving (92.3%).
| Occupation | Male | Female |
| Healthcare Support | 0 (0.0%) | 0 (0.0%) |
| Security & Protection | 3 (75.0%) | 1 (25.0%) |
| Firefighting & Prevention | 3 (100.0%) | 0 (0.0%) |
| Law Enforcement | 0 (0.0%) | 1 (100.0%) |
| Food Preparation & Serving | 1 (7.7%) | 12 (92.3%) |
| Cleaning & Maintenance | 5 (100.0%) | 0 (0.0%) |
| Personal Care & Service | 0 (0.0%) | 15 (100.0%) |
| Total (Category) | 9 (24.3%) | 28 (75.7%) |
| Total (Overall) | 281 (63.4%) | 162 (36.6%) |
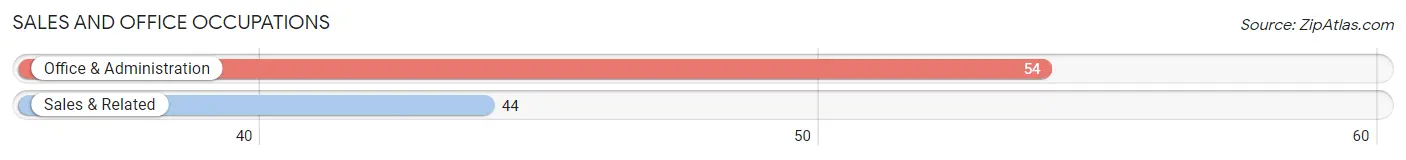
Sales and Office Occupations
The most common Sales and Office occupations in Early are Office & Administration (54 | 12.2%), and Sales & Related (44 | 9.9%).
Sales and Office Occupations by Sex
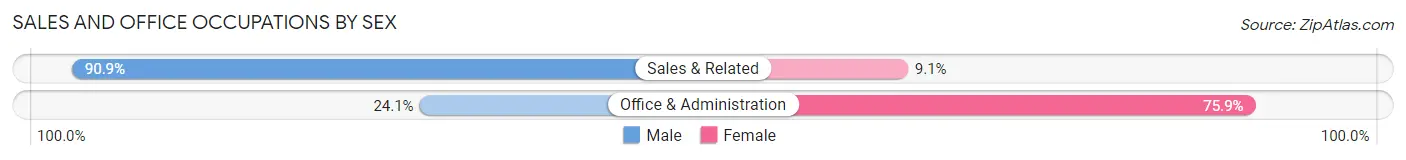
| Occupation | Male | Female |
| Sales & Related | 40 (90.9%) | 4 (9.1%) |
| Office & Administration | 13 (24.1%) | 41 (75.9%) |
| Total (Category) | 53 (54.1%) | 45 (45.9%) |
| Total (Overall) | 281 (63.4%) | 162 (36.6%) |
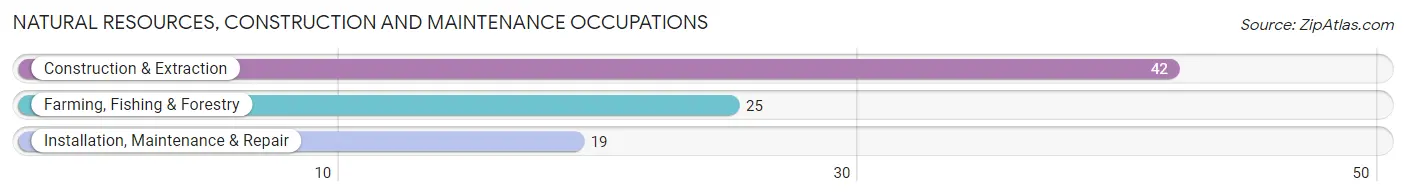
Natural Resources, Construction and Maintenance Occupations
The most common Natural Resources, Construction and Maintenance occupations in Early are Construction & Extraction (42 | 9.5%), Farming, Fishing & Forestry (25 | 5.6%), and Installation, Maintenance & Repair (19 | 4.3%).
Natural Resources, Construction and Maintenance Occupations by Sex
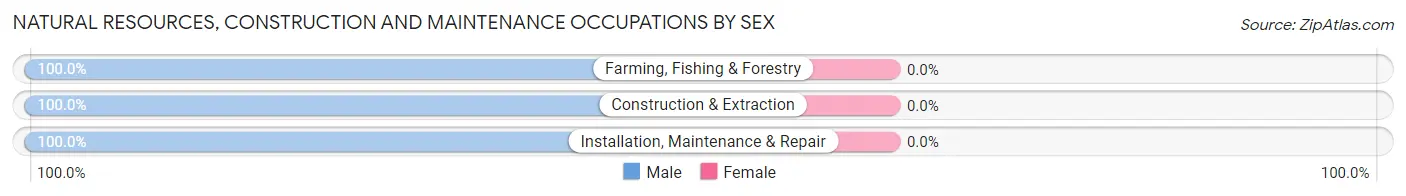
| Occupation | Male | Female |
| Farming, Fishing & Forestry | 25 (100.0%) | 0 (0.0%) |
| Construction & Extraction | 42 (100.0%) | 0 (0.0%) |
| Installation, Maintenance & Repair | 19 (100.0%) | 0 (0.0%) |
| Total (Category) | 86 (100.0%) | 0 (0.0%) |
| Total (Overall) | 281 (63.4%) | 162 (36.6%) |
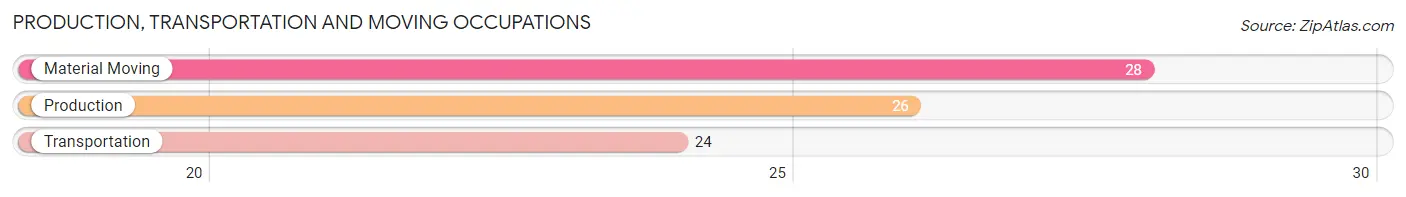
Production, Transportation and Moving Occupations
The most common Production, Transportation and Moving occupations in Early are Material Moving (28 | 6.3%), Production (26 | 5.9%), and Transportation (24 | 5.4%).
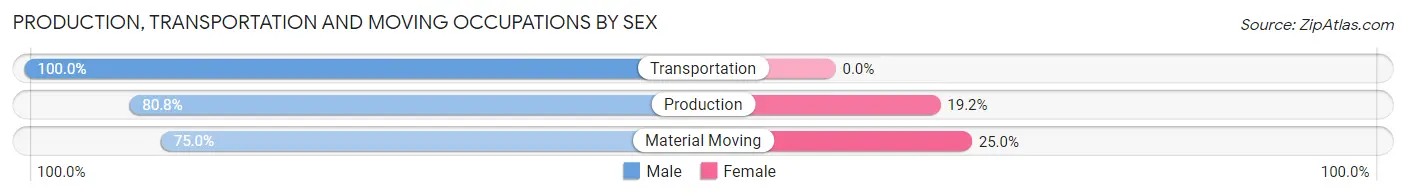
Production, Transportation and Moving Occupations by Sex
| Occupation | Male | Female |
| Production | 21 (80.8%) | 5 (19.2%) |
| Transportation | 24 (100.0%) | 0 (0.0%) |
| Material Moving | 21 (75.0%) | 7 (25.0%) |
| Total (Category) | 66 (84.6%) | 12 (15.4%) |
| Total (Overall) | 281 (63.4%) | 162 (36.6%) |
Employment Industries by Sex in Early
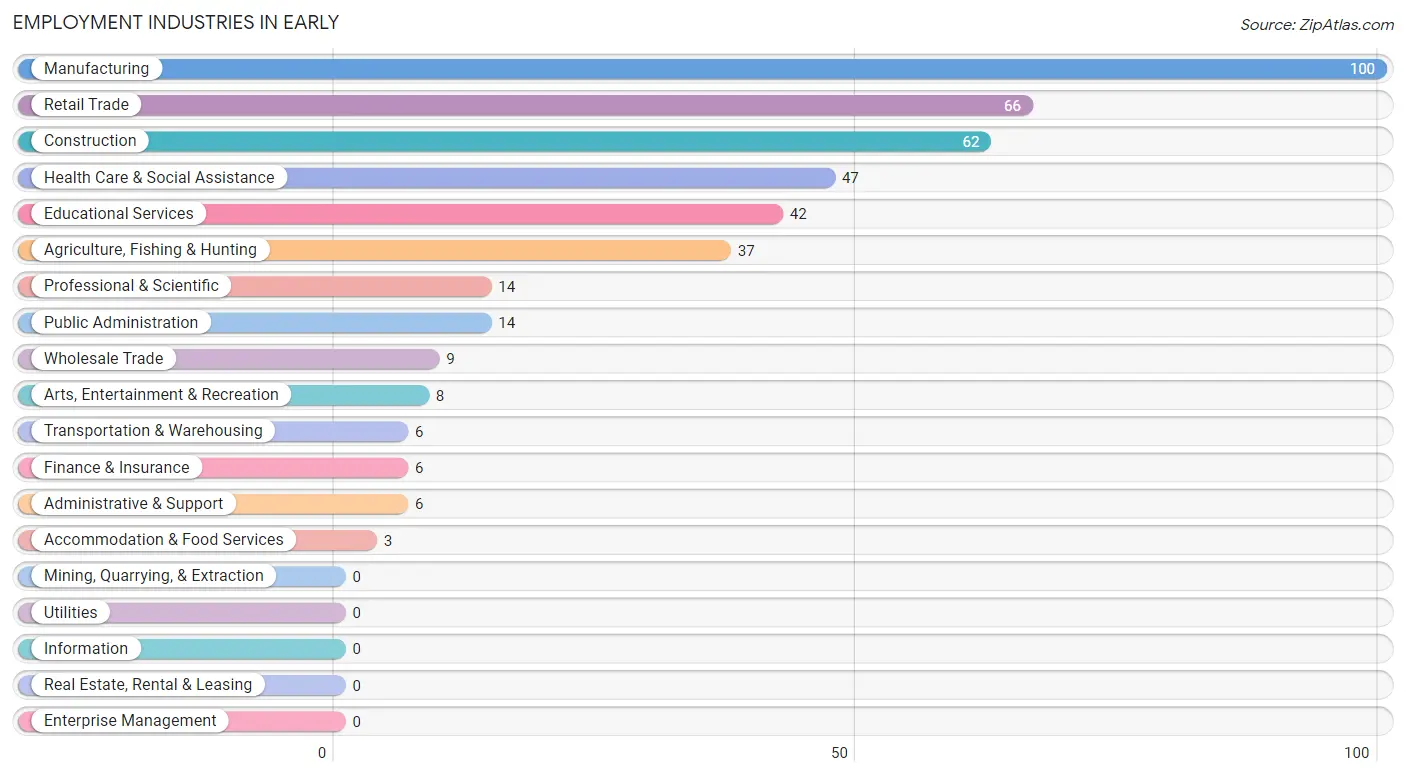
Employment Industries in Early
The major employment industries in Early include Manufacturing (100 | 22.6%), Retail Trade (66 | 14.9%), Construction (62 | 14.0%), Health Care & Social Assistance (47 | 10.6%), and Educational Services (42 | 9.5%).
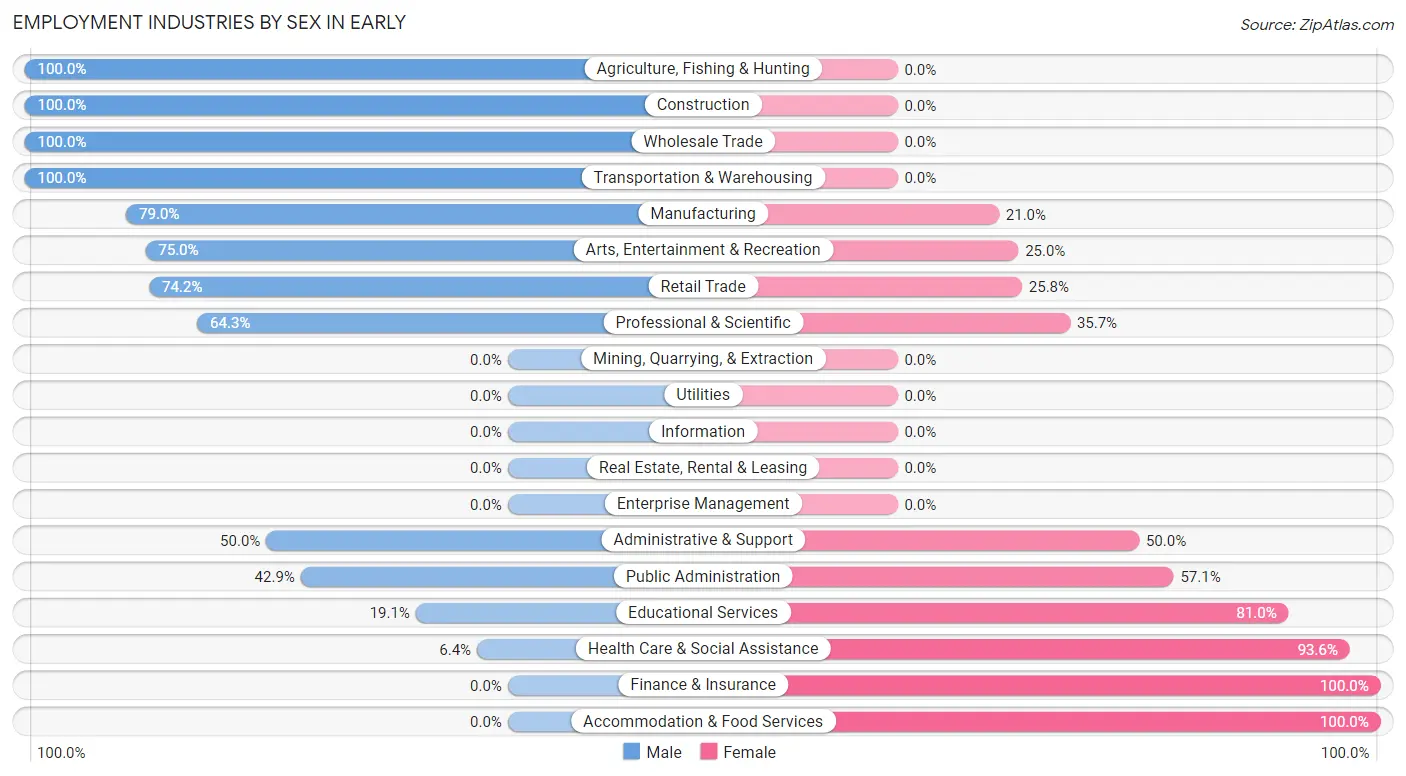
Employment Industries by Sex in Early
The Early industries that see more men than women are Agriculture, Fishing & Hunting (100.0%), Construction (100.0%), and Wholesale Trade (100.0%), whereas the industries that tend to have a higher number of women are Finance & Insurance (100.0%), Accommodation & Food Services (100.0%), and Health Care & Social Assistance (93.6%).
| Industry | Male | Female |
| Agriculture, Fishing & Hunting | 37 (100.0%) | 0 (0.0%) |
| Mining, Quarrying, & Extraction | 0 (0.0%) | 0 (0.0%) |
| Construction | 62 (100.0%) | 0 (0.0%) |
| Manufacturing | 79 (79.0%) | 21 (21.0%) |
| Wholesale Trade | 9 (100.0%) | 0 (0.0%) |
| Retail Trade | 49 (74.2%) | 17 (25.8%) |
| Transportation & Warehousing | 6 (100.0%) | 0 (0.0%) |
| Utilities | 0 (0.0%) | 0 (0.0%) |
| Information | 0 (0.0%) | 0 (0.0%) |
| Finance & Insurance | 0 (0.0%) | 6 (100.0%) |
| Real Estate, Rental & Leasing | 0 (0.0%) | 0 (0.0%) |
| Professional & Scientific | 9 (64.3%) | 5 (35.7%) |
| Enterprise Management | 0 (0.0%) | 0 (0.0%) |
| Administrative & Support | 3 (50.0%) | 3 (50.0%) |
| Educational Services | 8 (19.1%) | 34 (80.9%) |
| Health Care & Social Assistance | 3 (6.4%) | 44 (93.6%) |
| Arts, Entertainment & Recreation | 6 (75.0%) | 2 (25.0%) |
| Accommodation & Food Services | 0 (0.0%) | 3 (100.0%) |
| Public Administration | 6 (42.9%) | 8 (57.1%) |
| Total | 281 (63.4%) | 162 (36.6%) |
Education in Early
School Enrollment in Early
The most common levels of schooling among the 165 students in Early are middle school (42 | 25.5%), nursery / preschool (39 | 23.6%), and elementary school (32 | 19.4%).
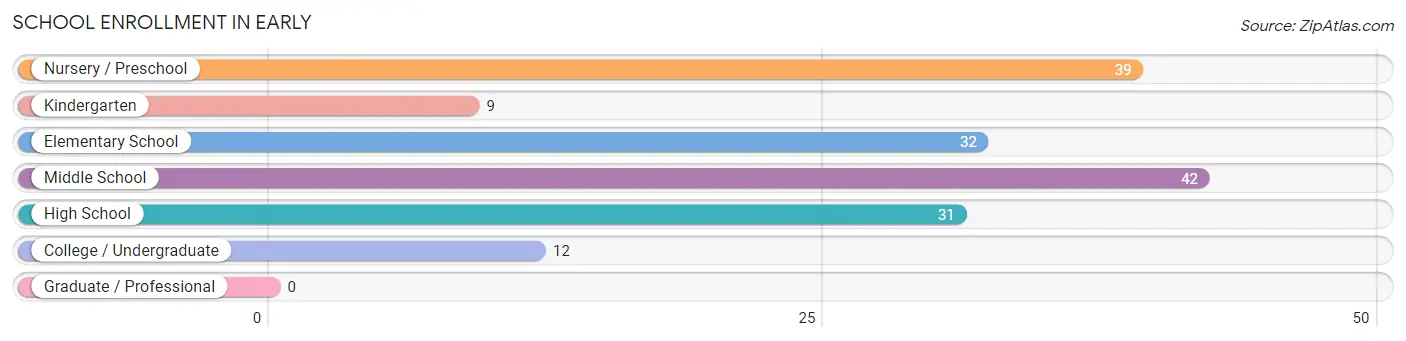
| School Level | # Students | % Students |
| Nursery / Preschool | 39 | 23.6% |
| Kindergarten | 9 | 5.4% |
| Elementary School | 32 | 19.4% |
| Middle School | 42 | 25.5% |
| High School | 31 | 18.8% |
| College / Undergraduate | 12 | 7.3% |
| Graduate / Professional | 0 | 0.0% |
| Total | 165 | 100.0% |
School Enrollment by Age by Funding Source in Early
Out of a total of 165 students who are enrolled in schools in Early, 8 (4.8%) attend a private institution, while the remaining 157 (95.2%) are enrolled in public schools. The age group of 25 to 34 year olds has the highest likelihood of being enrolled in private schools, with 1 (100.0% in the age bracket) enrolled. Conversely, the age group of 3 to 4 year olds has the lowest likelihood of being enrolled in a private school, with 32 (100.0% in the age bracket) attending a public institution.
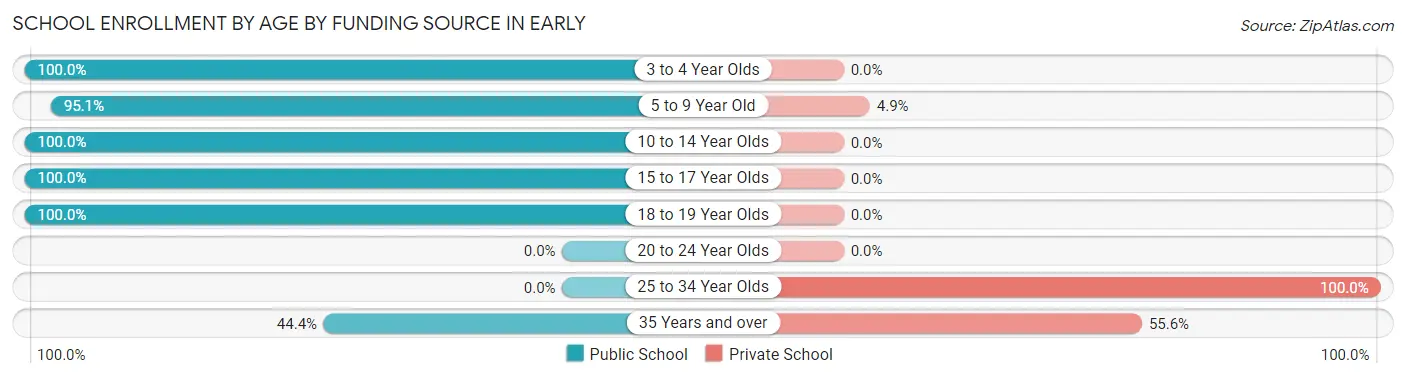
| Age Bracket | Public School | Private School |
| 3 to 4 Year Olds | 32 (100.0%) | 0 (0.0%) |
| 5 to 9 Year Old | 39 (95.1%) | 2 (4.9%) |
| 10 to 14 Year Olds | 49 (100.0%) | 0 (0.0%) |
| 15 to 17 Year Olds | 31 (100.0%) | 0 (0.0%) |
| 18 to 19 Year Olds | 2 (100.0%) | 0 (0.0%) |
| 20 to 24 Year Olds | 0 (0.0%) | 0 (0.0%) |
| 25 to 34 Year Olds | 0 (0.0%) | 1 (100.0%) |
| 35 Years and over | 4 (44.4%) | 5 (55.6%) |
| Total | 157 (95.2%) | 8 (4.8%) |
Educational Attainment by Field of Study in Early
Business (22 | 28.6%), education (19 | 24.7%), science & technology (12 | 15.6%), bio, nature & agricultural (10 | 13.0%), and liberal arts & history (5 | 6.5%) are the most common fields of study among 77 individuals in Early who have obtained a bachelor's degree or higher.
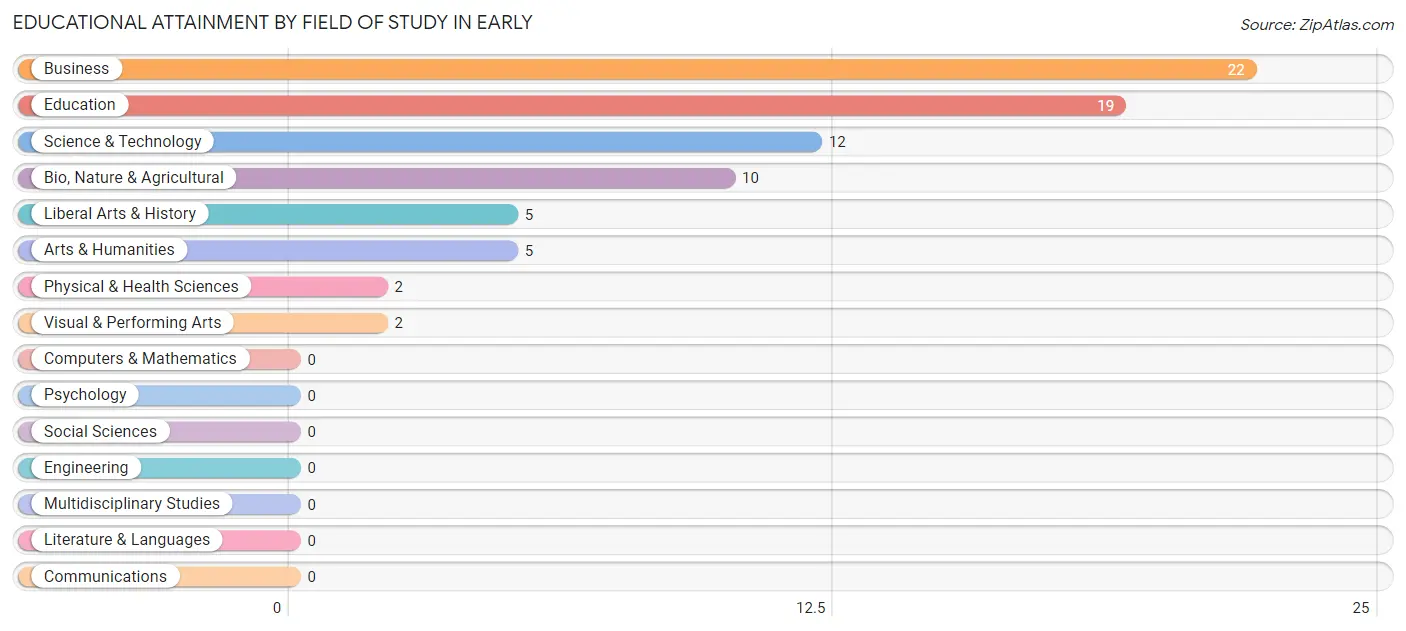
| Field of Study | # Graduates | % Graduates |
| Computers & Mathematics | 0 | 0.0% |
| Bio, Nature & Agricultural | 10 | 13.0% |
| Physical & Health Sciences | 2 | 2.6% |
| Psychology | 0 | 0.0% |
| Social Sciences | 0 | 0.0% |
| Engineering | 0 | 0.0% |
| Multidisciplinary Studies | 0 | 0.0% |
| Science & Technology | 12 | 15.6% |
| Business | 22 | 28.6% |
| Education | 19 | 24.7% |
| Literature & Languages | 0 | 0.0% |
| Liberal Arts & History | 5 | 6.5% |
| Visual & Performing Arts | 2 | 2.6% |
| Communications | 0 | 0.0% |
| Arts & Humanities | 5 | 6.5% |
| Total | 77 | 100.0% |
Transportation & Commute in Early
Vehicle Availability by Sex in Early
The most prevalent vehicle ownership categories in Early are males with 2 vehicles (113, accounting for 40.5%) and females with 2 vehicles (56, making up 72.0%).
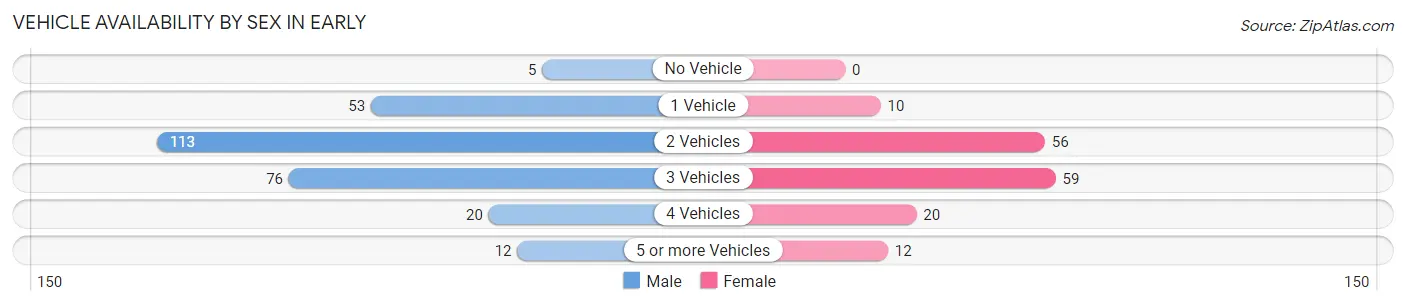
| Vehicles Available | Male | Female |
| No Vehicle | 5 (1.8%) | 0 (0.0%) |
| 1 Vehicle | 53 (19.0%) | 10 (6.4%) |
| 2 Vehicles | 113 (40.5%) | 56 (35.7%) |
| 3 Vehicles | 76 (27.2%) | 59 (37.6%) |
| 4 Vehicles | 20 (7.2%) | 20 (12.7%) |
| 5 or more Vehicles | 12 (4.3%) | 12 (7.6%) |
| Total | 279 (100.0%) | 157 (100.0%) |
Commute Time in Early
The most frequently occuring commute durations in Early are 20 to 24 minutes (133 commuters, 31.6%), 15 to 19 minutes (103 commuters, 24.5%), and 25 to 29 minutes (56 commuters, 13.3%).
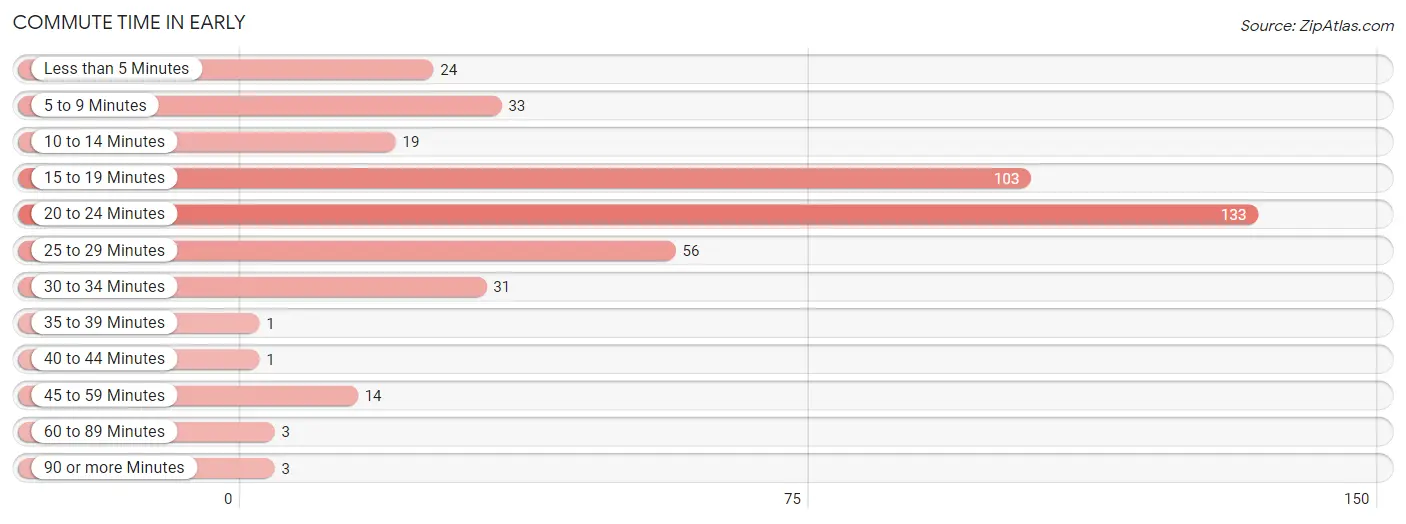
| Commute Time | # Commuters | % Commuters |
| Less than 5 Minutes | 24 | 5.7% |
| 5 to 9 Minutes | 33 | 7.8% |
| 10 to 14 Minutes | 19 | 4.5% |
| 15 to 19 Minutes | 103 | 24.5% |
| 20 to 24 Minutes | 133 | 31.6% |
| 25 to 29 Minutes | 56 | 13.3% |
| 30 to 34 Minutes | 31 | 7.4% |
| 35 to 39 Minutes | 1 | 0.2% |
| 40 to 44 Minutes | 1 | 0.2% |
| 45 to 59 Minutes | 14 | 3.3% |
| 60 to 89 Minutes | 3 | 0.7% |
| 90 or more Minutes | 3 | 0.7% |
Commute Time by Sex in Early
The most common commute times in Early are 15 to 19 minutes (79 commuters, 28.9%) for males and 20 to 24 minutes (63 commuters, 42.6%) for females.
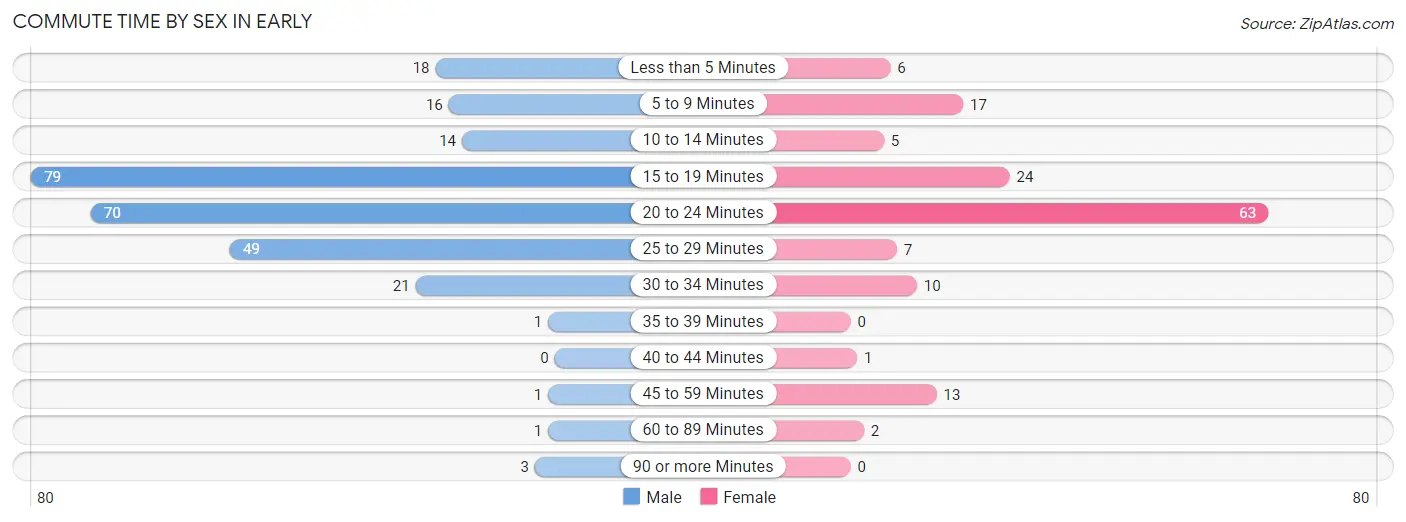
| Commute Time | Male | Female |
| Less than 5 Minutes | 18 (6.6%) | 6 (4.1%) |
| 5 to 9 Minutes | 16 (5.9%) | 17 (11.5%) |
| 10 to 14 Minutes | 14 (5.1%) | 5 (3.4%) |
| 15 to 19 Minutes | 79 (28.9%) | 24 (16.2%) |
| 20 to 24 Minutes | 70 (25.6%) | 63 (42.6%) |
| 25 to 29 Minutes | 49 (17.9%) | 7 (4.7%) |
| 30 to 34 Minutes | 21 (7.7%) | 10 (6.8%) |
| 35 to 39 Minutes | 1 (0.4%) | 0 (0.0%) |
| 40 to 44 Minutes | 0 (0.0%) | 1 (0.7%) |
| 45 to 59 Minutes | 1 (0.4%) | 13 (8.8%) |
| 60 to 89 Minutes | 1 (0.4%) | 2 (1.3%) |
| 90 or more Minutes | 3 (1.1%) | 0 (0.0%) |
Time of Departure to Work by Sex in Early
The most frequent times of departure to work in Early are 6:00 AM to 6:29 AM (67, 24.5%) for males and 7:00 AM to 7:29 AM (48, 32.4%) for females.
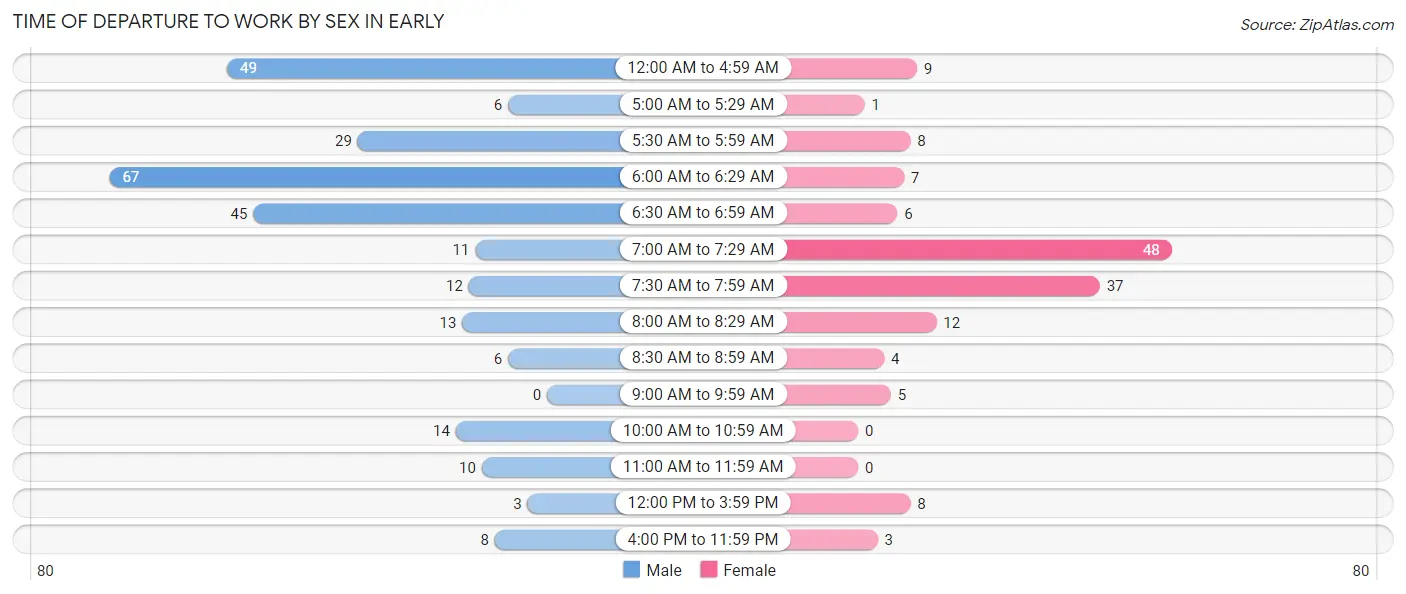
| Time of Departure | Male | Female |
| 12:00 AM to 4:59 AM | 49 (17.9%) | 9 (6.1%) |
| 5:00 AM to 5:29 AM | 6 (2.2%) | 1 (0.7%) |
| 5:30 AM to 5:59 AM | 29 (10.6%) | 8 (5.4%) |
| 6:00 AM to 6:29 AM | 67 (24.5%) | 7 (4.7%) |
| 6:30 AM to 6:59 AM | 45 (16.5%) | 6 (4.1%) |
| 7:00 AM to 7:29 AM | 11 (4.0%) | 48 (32.4%) |
| 7:30 AM to 7:59 AM | 12 (4.4%) | 37 (25.0%) |
| 8:00 AM to 8:29 AM | 13 (4.8%) | 12 (8.1%) |
| 8:30 AM to 8:59 AM | 6 (2.2%) | 4 (2.7%) |
| 9:00 AM to 9:59 AM | 0 (0.0%) | 5 (3.4%) |
| 10:00 AM to 10:59 AM | 14 (5.1%) | 0 (0.0%) |
| 11:00 AM to 11:59 AM | 10 (3.7%) | 0 (0.0%) |
| 12:00 PM to 3:59 PM | 3 (1.1%) | 8 (5.4%) |
| 4:00 PM to 11:59 PM | 8 (2.9%) | 3 (2.0%) |
| Total | 273 (100.0%) | 148 (100.0%) |
Housing Occupancy in Early
Occupancy by Ownership in Early
Of the total 340 dwellings in Early, owner-occupied units account for 242 (71.2%), while renter-occupied units make up 98 (28.8%).
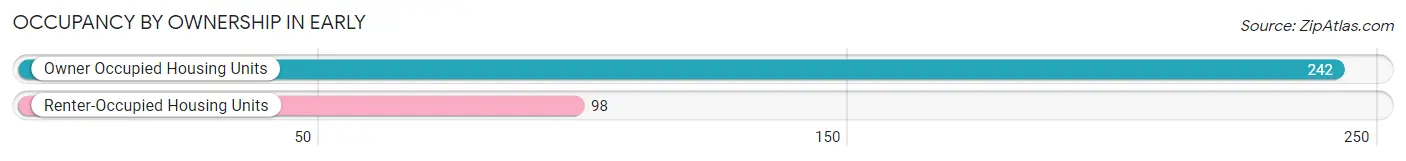
| Occupancy | # Housing Units | % Housing Units |
| Owner Occupied Housing Units | 242 | 71.2% |
| Renter-Occupied Housing Units | 98 | 28.8% |
| Total Occupied Housing Units | 340 | 100.0% |
Occupancy by Household Size in Early
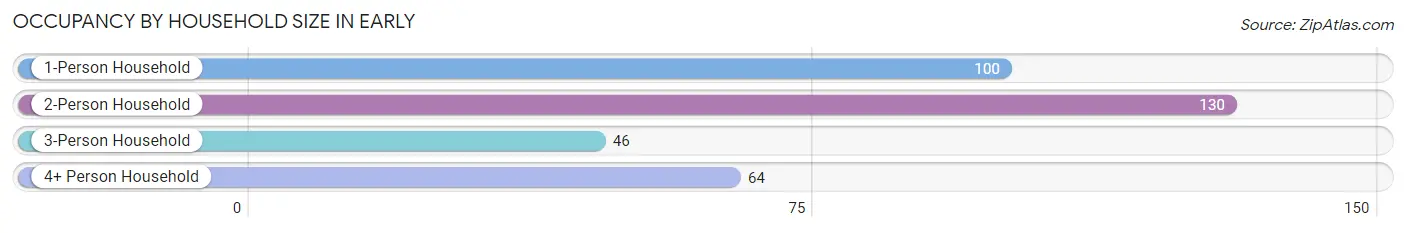
| Household Size | # Housing Units | % Housing Units |
| 1-Person Household | 100 | 29.4% |
| 2-Person Household | 130 | 38.2% |
| 3-Person Household | 46 | 13.5% |
| 4+ Person Household | 64 | 18.8% |
| Total Housing Units | 340 | 100.0% |
Occupancy by Ownership by Household Size in Early
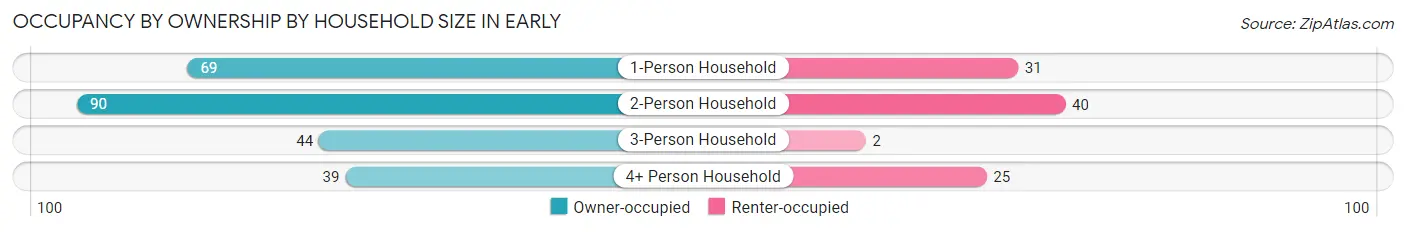
| Household Size | Owner-occupied | Renter-occupied |
| 1-Person Household | 69 (69.0%) | 31 (31.0%) |
| 2-Person Household | 90 (69.2%) | 40 (30.8%) |
| 3-Person Household | 44 (95.7%) | 2 (4.3%) |
| 4+ Person Household | 39 (60.9%) | 25 (39.1%) |
| Total Housing Units | 242 (71.2%) | 98 (28.8%) |
Occupancy by Educational Attainment in Early
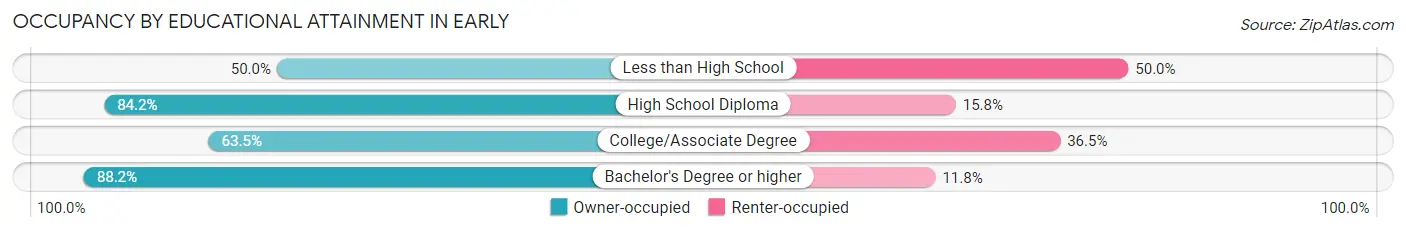
| Household Size | Owner-occupied | Renter-occupied |
| Less than High School | 22 (50.0%) | 22 (50.0%) |
| High School Diploma | 96 (84.2%) | 18 (15.8%) |
| College/Associate Degree | 94 (63.5%) | 54 (36.5%) |
| Bachelor's Degree or higher | 30 (88.2%) | 4 (11.8%) |
Occupancy by Age of Householder in Early
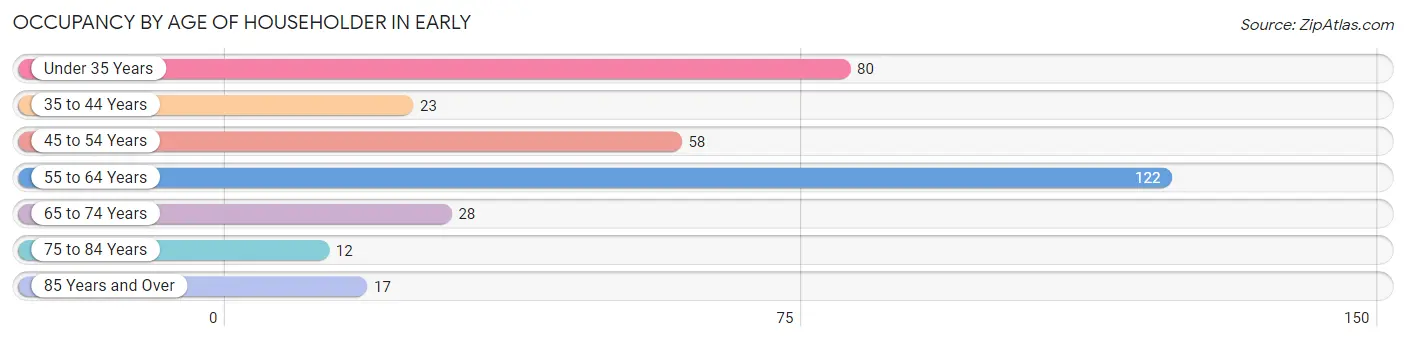
| Age Bracket | # Households | % Households |
| Under 35 Years | 80 | 23.5% |
| 35 to 44 Years | 23 | 6.8% |
| 45 to 54 Years | 58 | 17.1% |
| 55 to 64 Years | 122 | 35.9% |
| 65 to 74 Years | 28 | 8.2% |
| 75 to 84 Years | 12 | 3.5% |
| 85 Years and Over | 17 | 5.0% |
| Total | 340 | 100.0% |
Housing Finances in Early
Median Income by Occupancy in Early
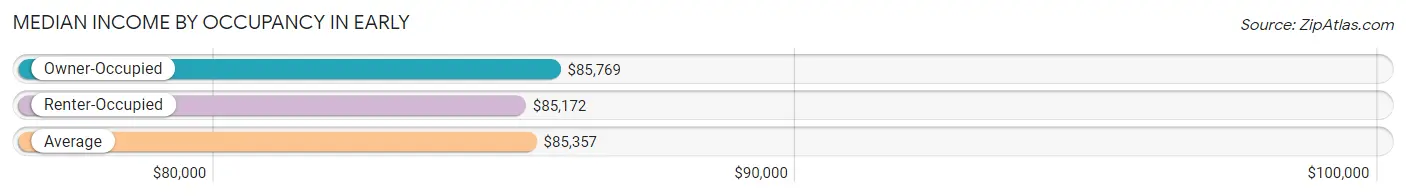
| Occupancy Type | # Households | Median Income |
| Owner-Occupied | 242 (71.2%) | $85,769 |
| Renter-Occupied | 98 (28.8%) | $85,172 |
| Average | 340 (100.0%) | $85,357 |
Occupancy by Householder Income Bracket in Early
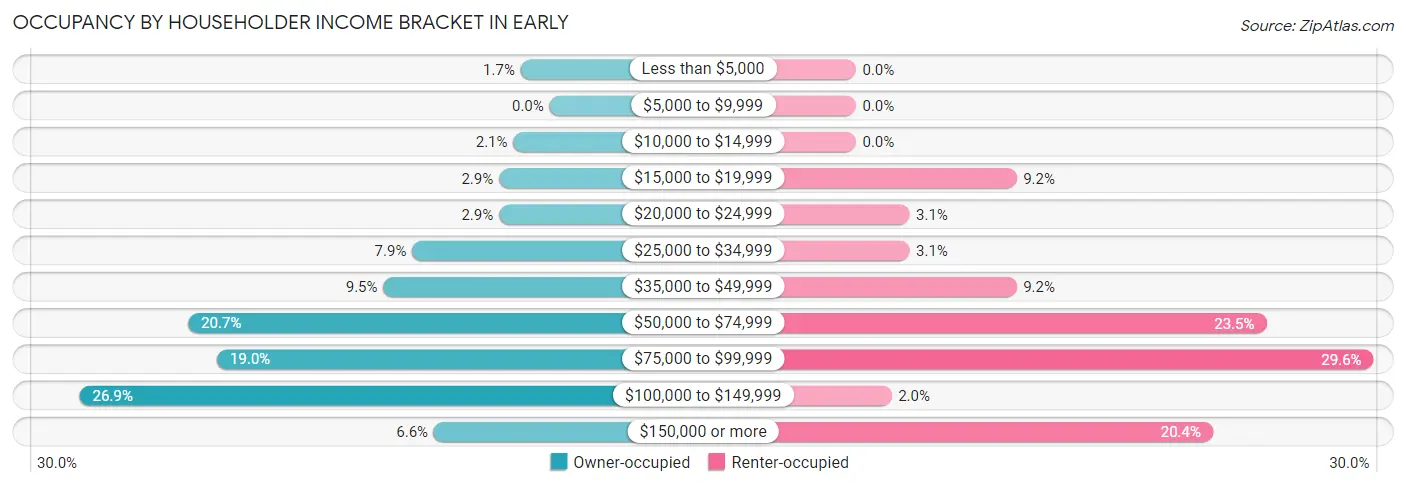
| Income Bracket | Owner-occupied | Renter-occupied |
| Less than $5,000 | 4 (1.7%) | 0 (0.0%) |
| $5,000 to $9,999 | 0 (0.0%) | 0 (0.0%) |
| $10,000 to $14,999 | 5 (2.1%) | 0 (0.0%) |
| $15,000 to $19,999 | 7 (2.9%) | 9 (9.2%) |
| $20,000 to $24,999 | 7 (2.9%) | 3 (3.1%) |
| $25,000 to $34,999 | 19 (7.9%) | 3 (3.1%) |
| $35,000 to $49,999 | 23 (9.5%) | 9 (9.2%) |
| $50,000 to $74,999 | 50 (20.7%) | 23 (23.5%) |
| $75,000 to $99,999 | 46 (19.0%) | 29 (29.6%) |
| $100,000 to $149,999 | 65 (26.9%) | 2 (2.0%) |
| $150,000 or more | 16 (6.6%) | 20 (20.4%) |
| Total | 242 (100.0%) | 98 (100.0%) |
Monthly Housing Cost Tiers in Early
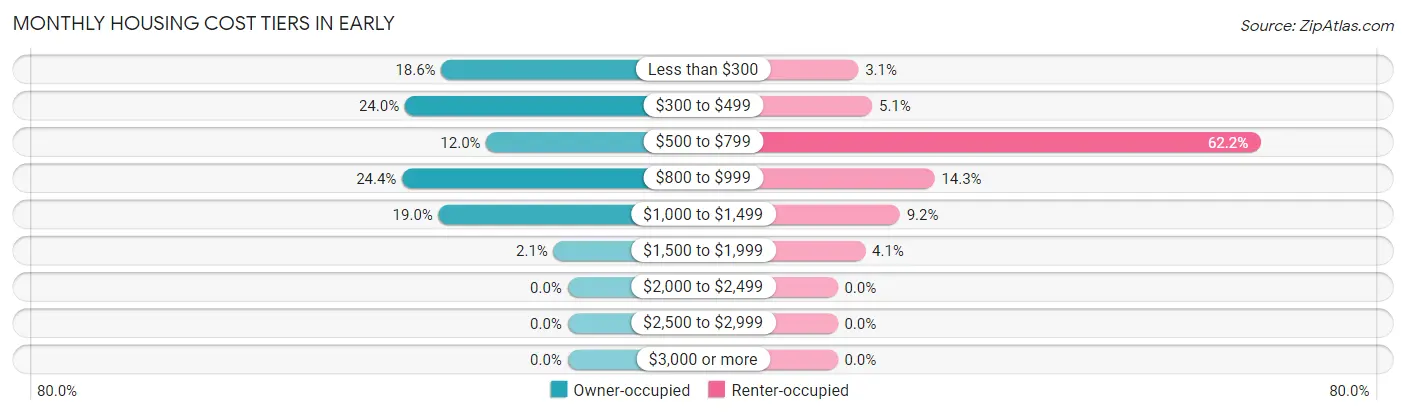
| Monthly Cost | Owner-occupied | Renter-occupied |
| Less than $300 | 45 (18.6%) | 3 (3.1%) |
| $300 to $499 | 58 (24.0%) | 5 (5.1%) |
| $500 to $799 | 29 (12.0%) | 61 (62.2%) |
| $800 to $999 | 59 (24.4%) | 14 (14.3%) |
| $1,000 to $1,499 | 46 (19.0%) | 9 (9.2%) |
| $1,500 to $1,999 | 5 (2.1%) | 4 (4.1%) |
| $2,000 to $2,499 | 0 (0.0%) | 0 (0.0%) |
| $2,500 to $2,999 | 0 (0.0%) | 0 (0.0%) |
| $3,000 or more | 0 (0.0%) | 0 (0.0%) |
| Total | 242 (100.0%) | 98 (100.0%) |
Physical Housing Characteristics in Early
Housing Structures in Early
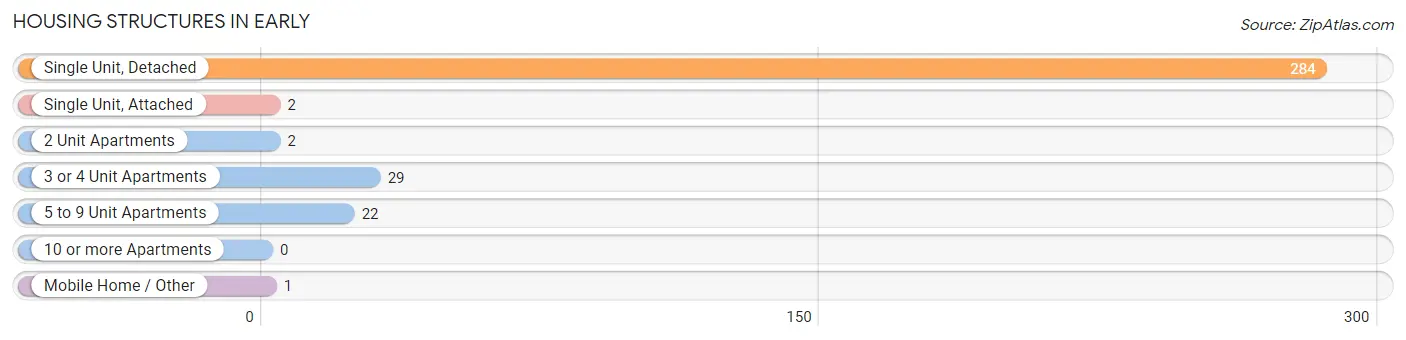
| Structure Type | # Housing Units | % Housing Units |
| Single Unit, Detached | 284 | 83.5% |
| Single Unit, Attached | 2 | 0.6% |
| 2 Unit Apartments | 2 | 0.6% |
| 3 or 4 Unit Apartments | 29 | 8.5% |
| 5 to 9 Unit Apartments | 22 | 6.5% |
| 10 or more Apartments | 0 | 0.0% |
| Mobile Home / Other | 1 | 0.3% |
| Total | 340 | 100.0% |
Housing Structures by Occupancy in Early
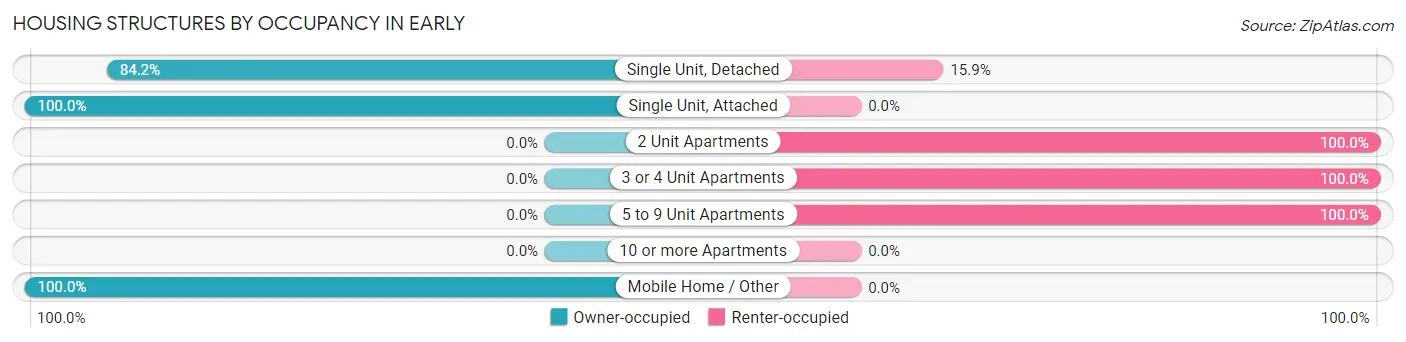
| Structure Type | Owner-occupied | Renter-occupied |
| Single Unit, Detached | 239 (84.2%) | 45 (15.9%) |
| Single Unit, Attached | 2 (100.0%) | 0 (0.0%) |
| 2 Unit Apartments | 0 (0.0%) | 2 (100.0%) |
| 3 or 4 Unit Apartments | 0 (0.0%) | 29 (100.0%) |
| 5 to 9 Unit Apartments | 0 (0.0%) | 22 (100.0%) |
| 10 or more Apartments | 0 (0.0%) | 0 (0.0%) |
| Mobile Home / Other | 1 (100.0%) | 0 (0.0%) |
| Total | 242 (71.2%) | 98 (28.8%) |
Housing Structures by Number of Rooms in Early
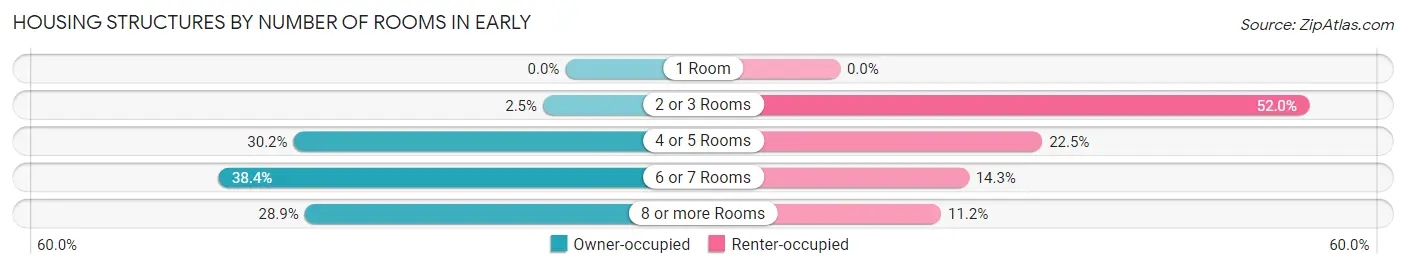
| Number of Rooms | Owner-occupied | Renter-occupied |
| 1 Room | 0 (0.0%) | 0 (0.0%) |
| 2 or 3 Rooms | 6 (2.5%) | 51 (52.0%) |
| 4 or 5 Rooms | 73 (30.2%) | 22 (22.5%) |
| 6 or 7 Rooms | 93 (38.4%) | 14 (14.3%) |
| 8 or more Rooms | 70 (28.9%) | 11 (11.2%) |
| Total | 242 (100.0%) | 98 (100.0%) |
Housing Structure by Heating Type in Early
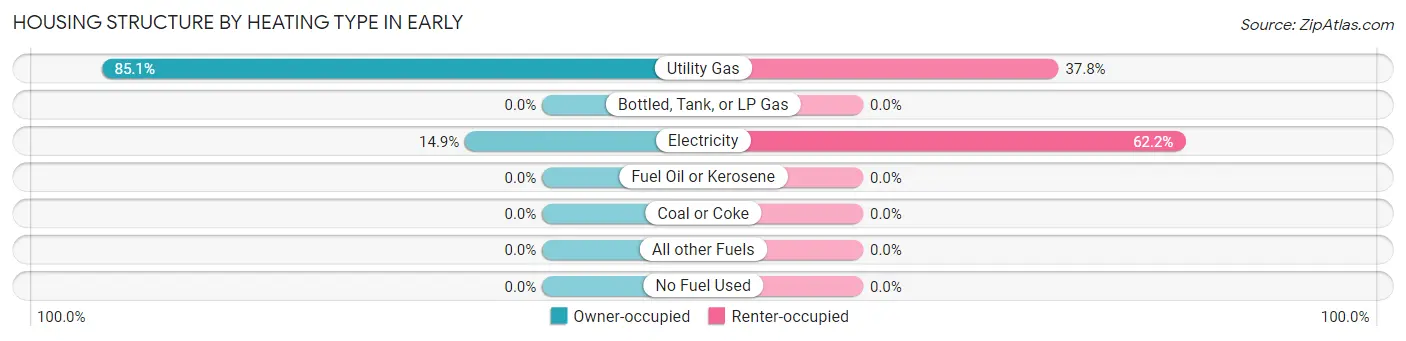
| Heating Type | Owner-occupied | Renter-occupied |
| Utility Gas | 206 (85.1%) | 37 (37.8%) |
| Bottled, Tank, or LP Gas | 0 (0.0%) | 0 (0.0%) |
| Electricity | 36 (14.9%) | 61 (62.2%) |
| Fuel Oil or Kerosene | 0 (0.0%) | 0 (0.0%) |
| Coal or Coke | 0 (0.0%) | 0 (0.0%) |
| All other Fuels | 0 (0.0%) | 0 (0.0%) |
| No Fuel Used | 0 (0.0%) | 0 (0.0%) |
| Total | 242 (100.0%) | 98 (100.0%) |
Household Vehicle Usage in Early
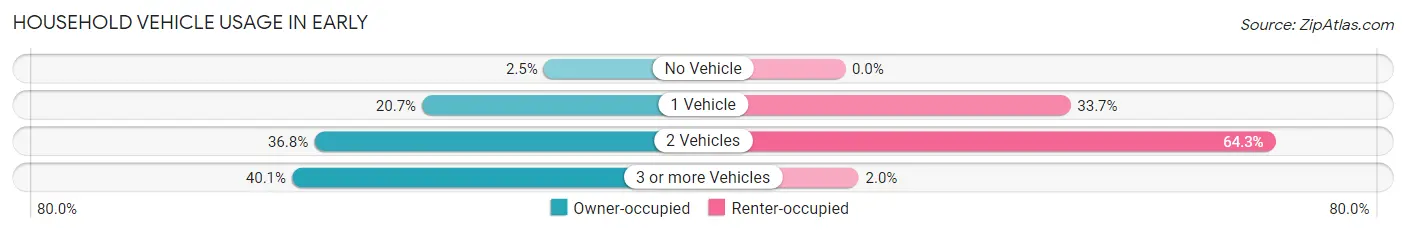
| Vehicles per Household | Owner-occupied | Renter-occupied |
| No Vehicle | 6 (2.5%) | 0 (0.0%) |
| 1 Vehicle | 50 (20.7%) | 33 (33.7%) |
| 2 Vehicles | 89 (36.8%) | 63 (64.3%) |
| 3 or more Vehicles | 97 (40.1%) | 2 (2.0%) |
| Total | 242 (100.0%) | 98 (100.0%) |
Real Estate & Mortgages in Early
Real Estate and Mortgage Overview in Early
| Characteristic | Without Mortgage | With Mortgage |
| Housing Units | 124 | 118 |
| Median Property Value | $53,800 | $91,700 |
| Median Household Income | $56,071 | $11 |
| Monthly Housing Costs | $352 | $0 |
| Real Estate Taxes | $694 | $2 |
Property Value by Mortgage Status in Early
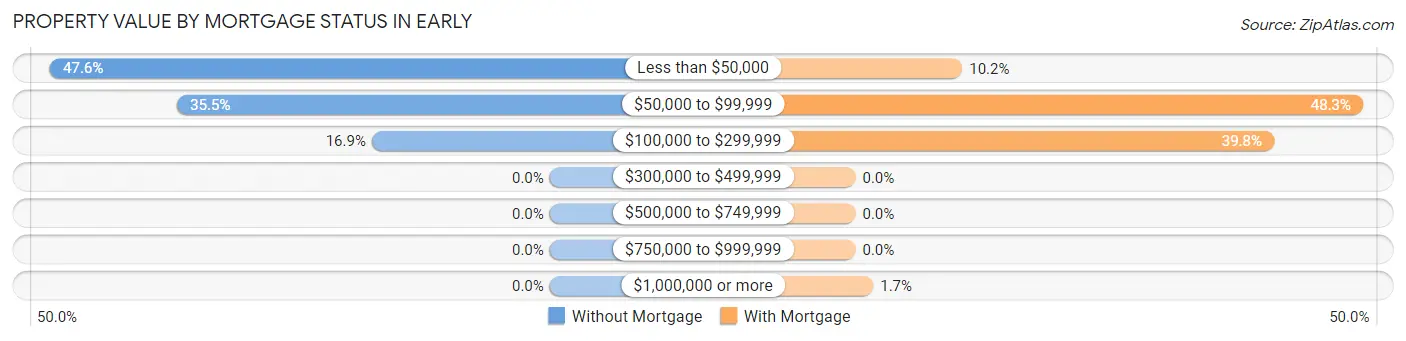
| Property Value | Without Mortgage | With Mortgage |
| Less than $50,000 | 59 (47.6%) | 12 (10.2%) |
| $50,000 to $99,999 | 44 (35.5%) | 57 (48.3%) |
| $100,000 to $299,999 | 21 (16.9%) | 47 (39.8%) |
| $300,000 to $499,999 | 0 (0.0%) | 0 (0.0%) |
| $500,000 to $749,999 | 0 (0.0%) | 0 (0.0%) |
| $750,000 to $999,999 | 0 (0.0%) | 0 (0.0%) |
| $1,000,000 or more | 0 (0.0%) | 2 (1.7%) |
| Total | 124 (100.0%) | 118 (100.0%) |
Household Income by Mortgage Status in Early
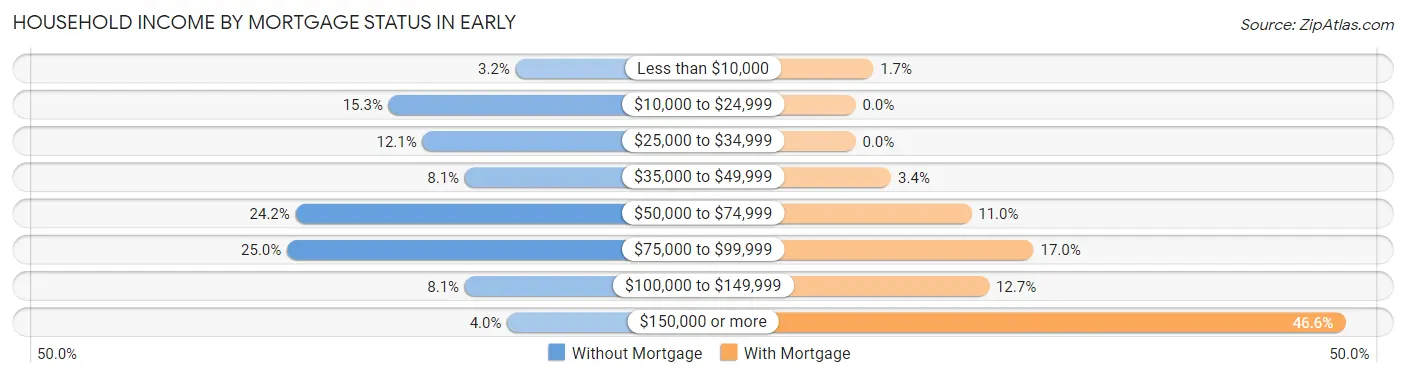
| Household Income | Without Mortgage | With Mortgage |
| Less than $10,000 | 4 (3.2%) | 2 (1.7%) |
| $10,000 to $24,999 | 19 (15.3%) | 0 (0.0%) |
| $25,000 to $34,999 | 15 (12.1%) | 0 (0.0%) |
| $35,000 to $49,999 | 10 (8.1%) | 4 (3.4%) |
| $50,000 to $74,999 | 30 (24.2%) | 13 (11.0%) |
| $75,000 to $99,999 | 31 (25.0%) | 20 (17.0%) |
| $100,000 to $149,999 | 10 (8.1%) | 15 (12.7%) |
| $150,000 or more | 5 (4.0%) | 55 (46.6%) |
| Total | 124 (100.0%) | 118 (100.0%) |
Property Value to Household Income Ratio in Early
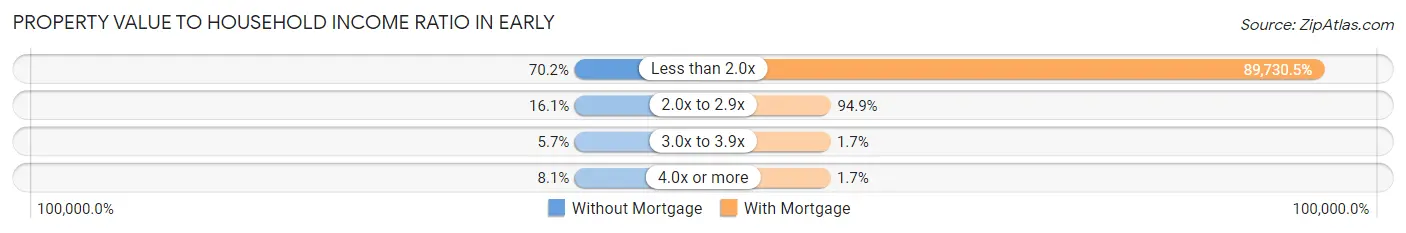
| Value-to-Income Ratio | Without Mortgage | With Mortgage |
| Less than 2.0x | 87 (70.2%) | 105,882 (89,730.5%) |
| 2.0x to 2.9x | 20 (16.1%) | 112 (94.9%) |
| 3.0x to 3.9x | 7 (5.7%) | 2 (1.7%) |
| 4.0x or more | 10 (8.1%) | 2 (1.7%) |
| Total | 124 (100.0%) | 118 (100.0%) |
Real Estate Taxes by Mortgage Status in Early
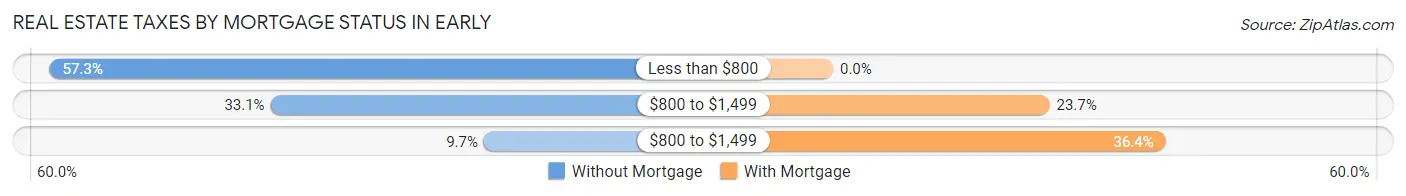
| Property Taxes | Without Mortgage | With Mortgage |
| Less than $800 | 71 (57.3%) | 0 (0.0%) |
| $800 to $1,499 | 41 (33.1%) | 28 (23.7%) |
| $800 to $1,499 | 12 (9.7%) | 43 (36.4%) |
| Total | 124 (100.0%) | 118 (100.0%) |
Health & Disability in Early
Health Insurance Coverage by Age in Early
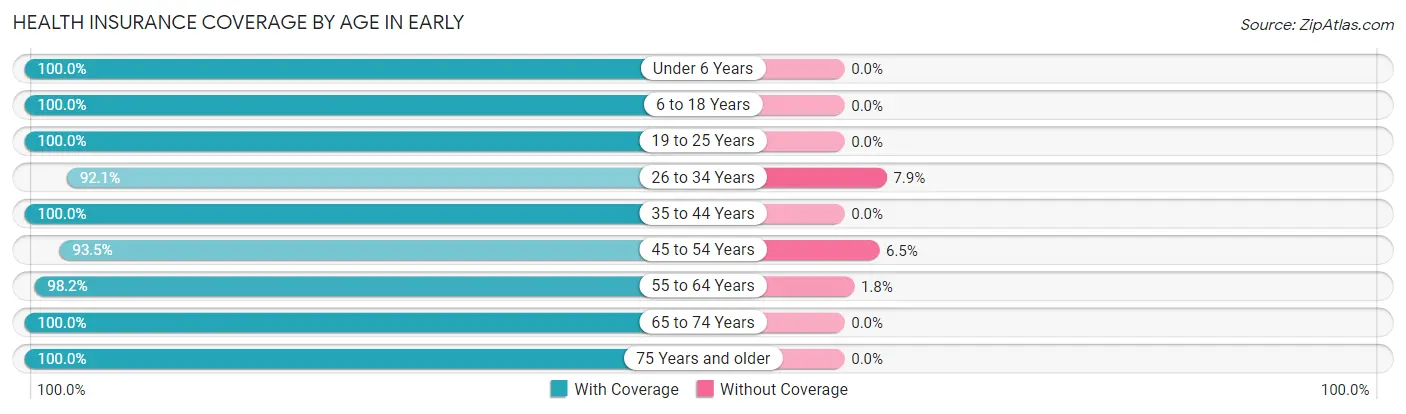
| Age Bracket | With Coverage | Without Coverage |
| Under 6 Years | 88 (100.0%) | 0 (0.0%) |
| 6 to 18 Years | 110 (100.0%) | 0 (0.0%) |
| 19 to 25 Years | 77 (100.0%) | 0 (0.0%) |
| 26 to 34 Years | 82 (92.1%) | 7 (7.9%) |
| 35 to 44 Years | 49 (100.0%) | 0 (0.0%) |
| 45 to 54 Years | 101 (93.5%) | 7 (6.5%) |
| 55 to 64 Years | 163 (98.2%) | 3 (1.8%) |
| 65 to 74 Years | 39 (100.0%) | 0 (0.0%) |
| 75 Years and older | 61 (100.0%) | 0 (0.0%) |
| Total | 770 (97.8%) | 17 (2.2%) |
Health Insurance Coverage by Citizenship Status in Early
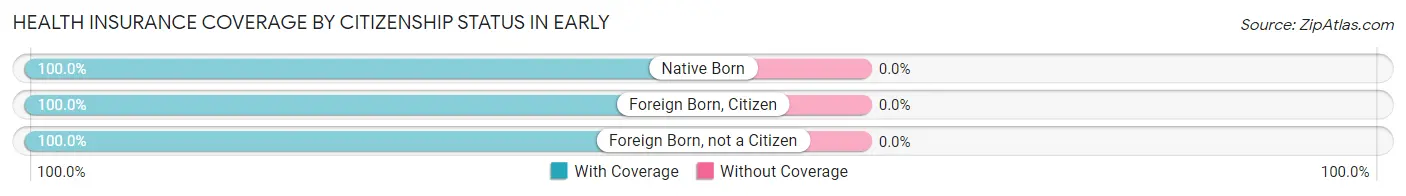
| Citizenship Status | With Coverage | Without Coverage |
| Native Born | 88 (100.0%) | 0 (0.0%) |
| Foreign Born, Citizen | 110 (100.0%) | 0 (0.0%) |
| Foreign Born, not a Citizen | 77 (100.0%) | 0 (0.0%) |
Health Insurance Coverage by Household Income in Early
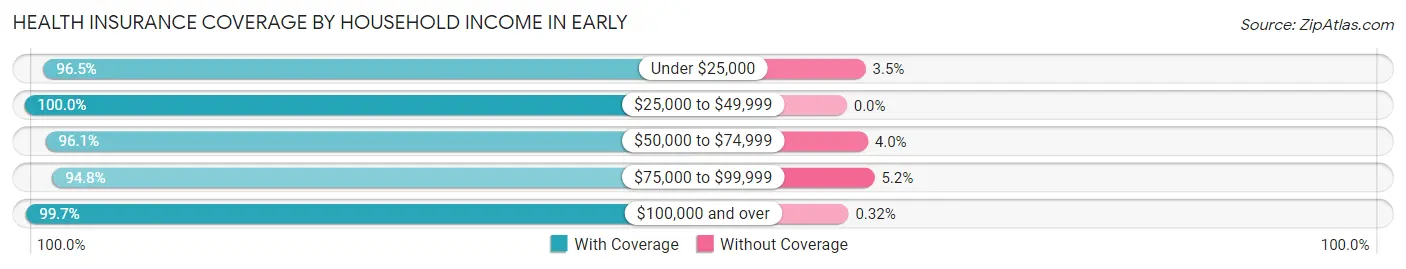
| Household Income | With Coverage | Without Coverage |
| Under $25,000 | 82 (96.5%) | 3 (3.5%) |
| $25,000 to $49,999 | 102 (100.0%) | 0 (0.0%) |
| $50,000 to $74,999 | 146 (96.1%) | 6 (4.0%) |
| $75,000 to $99,999 | 128 (94.8%) | 7 (5.2%) |
| $100,000 and over | 312 (99.7%) | 1 (0.3%) |
Public vs Private Health Insurance Coverage by Age in Early
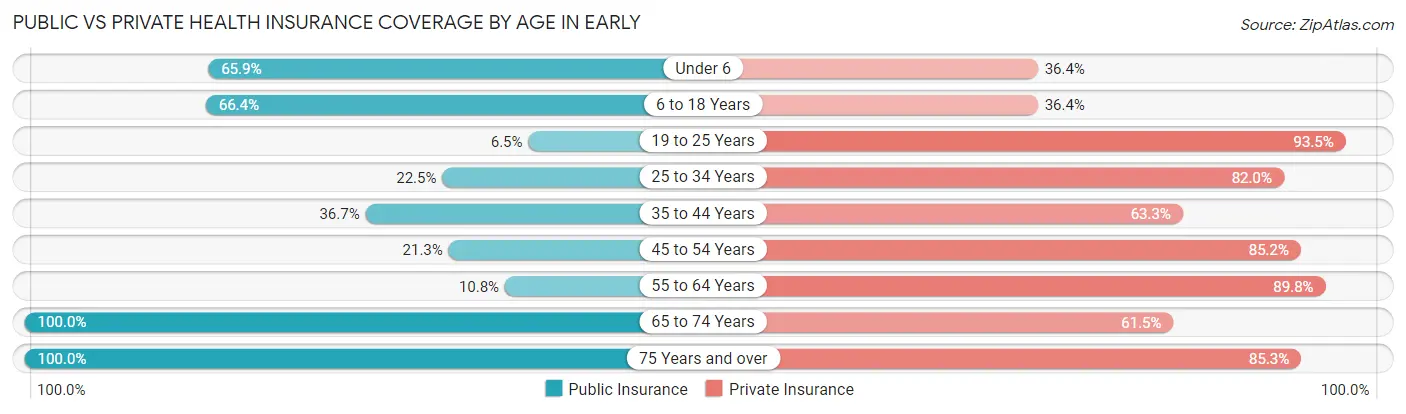
| Age Bracket | Public Insurance | Private Insurance |
| Under 6 | 58 (65.9%) | 32 (36.4%) |
| 6 to 18 Years | 73 (66.4%) | 40 (36.4%) |
| 19 to 25 Years | 5 (6.5%) | 72 (93.5%) |
| 25 to 34 Years | 20 (22.5%) | 73 (82.0%) |
| 35 to 44 Years | 18 (36.7%) | 31 (63.3%) |
| 45 to 54 Years | 23 (21.3%) | 92 (85.2%) |
| 55 to 64 Years | 18 (10.8%) | 149 (89.8%) |
| 65 to 74 Years | 39 (100.0%) | 24 (61.5%) |
| 75 Years and over | 61 (100.0%) | 52 (85.3%) |
| Total | 315 (40.0%) | 565 (71.8%) |
Disability Status by Sex by Age in Early
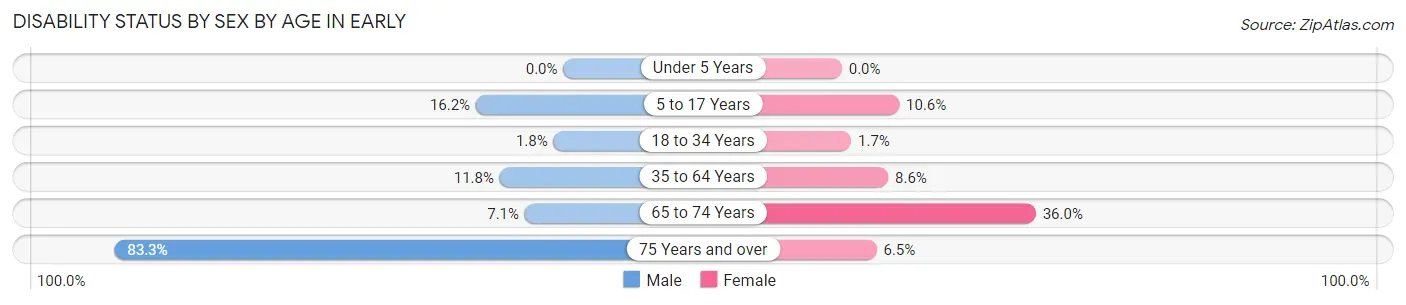
| Age Bracket | Male | Female |
| Under 5 Years | 0 (0.0%) | 0 (0.0%) |
| 5 to 17 Years | 12 (16.2%) | 5 (10.6%) |
| 18 to 34 Years | 2 (1.8%) | 1 (1.7%) |
| 35 to 64 Years | 23 (11.8%) | 11 (8.6%) |
| 65 to 74 Years | 1 (7.1%) | 9 (36.0%) |
| 75 Years and over | 25 (83.3%) | 2 (6.5%) |
Disability Class by Sex by Age in Early
Disability Class: Hearing Difficulty
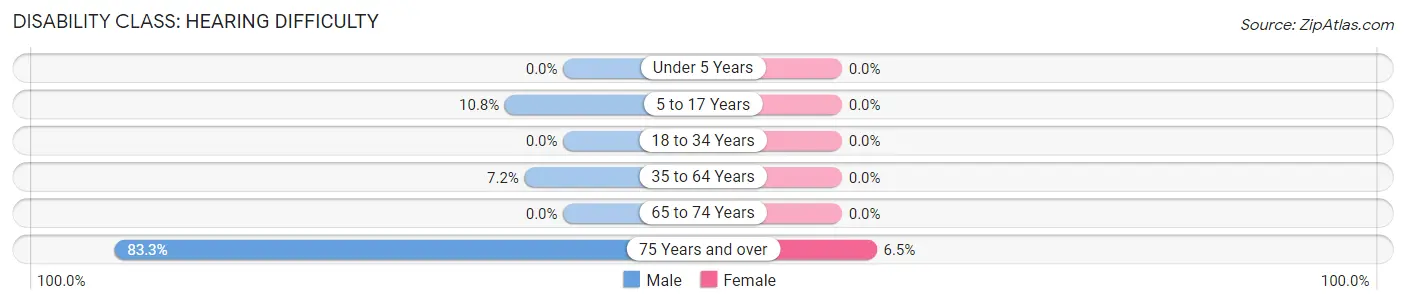
| Age Bracket | Male | Female |
| Under 5 Years | 0 (0.0%) | 0 (0.0%) |
| 5 to 17 Years | 8 (10.8%) | 0 (0.0%) |
| 18 to 34 Years | 0 (0.0%) | 0 (0.0%) |
| 35 to 64 Years | 14 (7.2%) | 0 (0.0%) |
| 65 to 74 Years | 0 (0.0%) | 0 (0.0%) |
| 75 Years and over | 25 (83.3%) | 2 (6.5%) |
Disability Class: Vision Difficulty
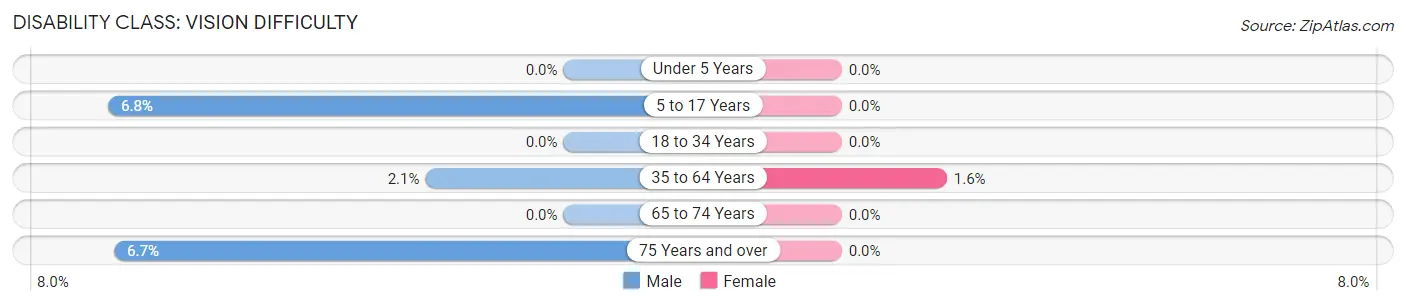
| Age Bracket | Male | Female |
| Under 5 Years | 0 (0.0%) | 0 (0.0%) |
| 5 to 17 Years | 5 (6.8%) | 0 (0.0%) |
| 18 to 34 Years | 0 (0.0%) | 0 (0.0%) |
| 35 to 64 Years | 4 (2.1%) | 2 (1.6%) |
| 65 to 74 Years | 0 (0.0%) | 0 (0.0%) |
| 75 Years and over | 2 (6.7%) | 0 (0.0%) |
Disability Class: Cognitive Difficulty
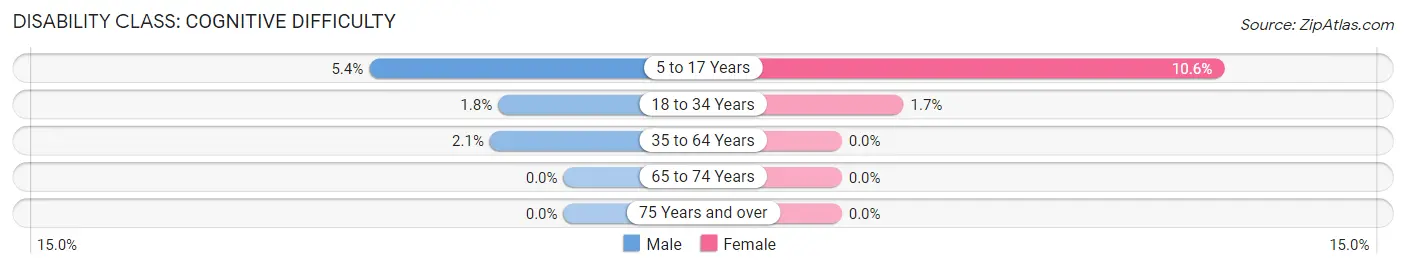
| Age Bracket | Male | Female |
| 5 to 17 Years | 4 (5.4%) | 5 (10.6%) |
| 18 to 34 Years | 2 (1.8%) | 1 (1.7%) |
| 35 to 64 Years | 4 (2.1%) | 0 (0.0%) |
| 65 to 74 Years | 0 (0.0%) | 0 (0.0%) |
| 75 Years and over | 0 (0.0%) | 0 (0.0%) |
Disability Class: Ambulatory Difficulty
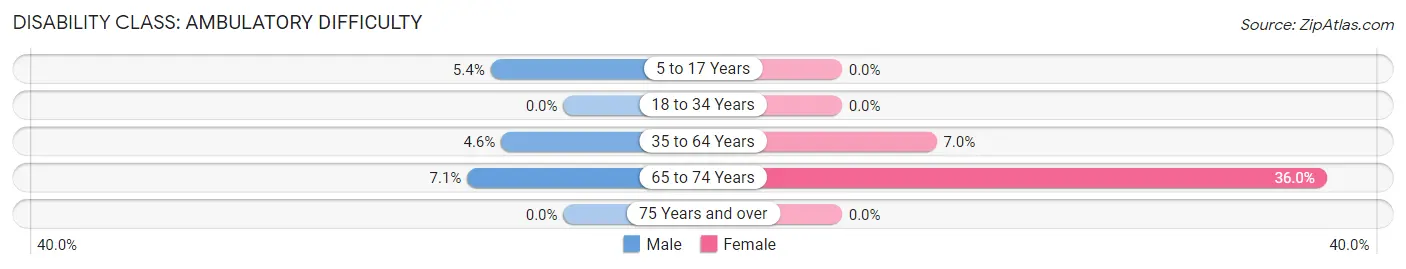
| Age Bracket | Male | Female |
| 5 to 17 Years | 4 (5.4%) | 0 (0.0%) |
| 18 to 34 Years | 0 (0.0%) | 0 (0.0%) |
| 35 to 64 Years | 9 (4.6%) | 9 (7.0%) |
| 65 to 74 Years | 1 (7.1%) | 9 (36.0%) |
| 75 Years and over | 0 (0.0%) | 0 (0.0%) |
Disability Class: Self-Care Difficulty
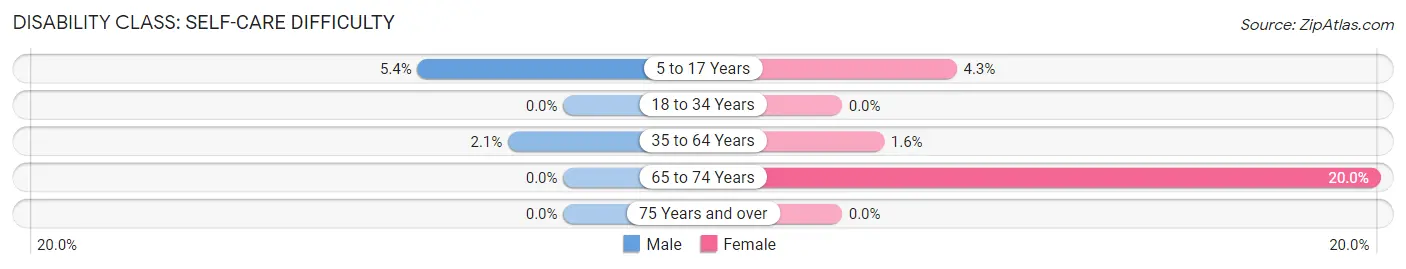
| Age Bracket | Male | Female |
| 5 to 17 Years | 4 (5.4%) | 2 (4.3%) |
| 18 to 34 Years | 0 (0.0%) | 0 (0.0%) |
| 35 to 64 Years | 4 (2.1%) | 2 (1.6%) |
| 65 to 74 Years | 0 (0.0%) | 5 (20.0%) |
| 75 Years and over | 0 (0.0%) | 0 (0.0%) |
Technology Access in Early
Computing Device Access in Early
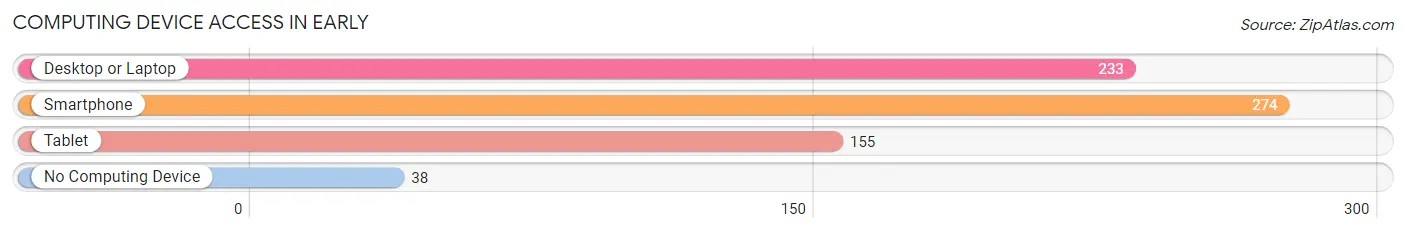
| Device Type | # Households | % Households |
| Desktop or Laptop | 233 | 68.5% |
| Smartphone | 274 | 80.6% |
| Tablet | 155 | 45.6% |
| No Computing Device | 38 | 11.2% |
| Total | 340 | 100.0% |
Internet Access in Early
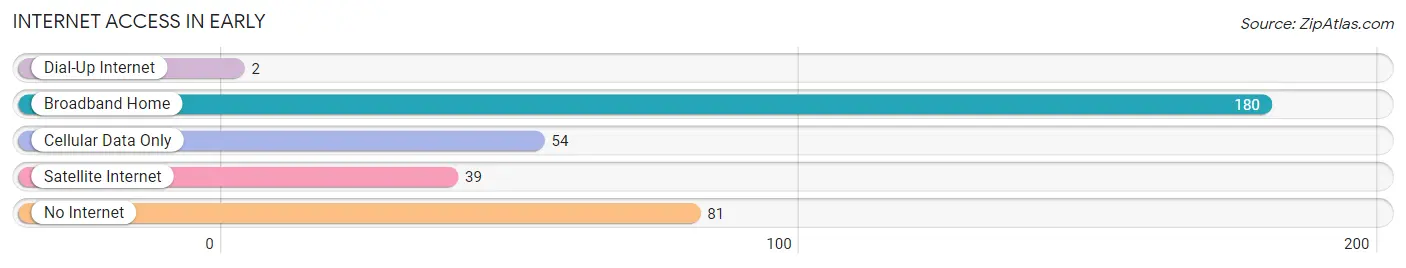
| Internet Type | # Households | % Households |
| Dial-Up Internet | 2 | 0.6% |
| Broadband Home | 180 | 52.9% |
| Cellular Data Only | 54 | 15.9% |
| Satellite Internet | 39 | 11.5% |
| No Internet | 81 | 23.8% |
| Total | 340 | 100.0% |
Early Summary
Early, Iowa is a small town located in the southeastern corner of the state, in Appanoose County. It is situated along the Chariton River, and is home to a population of just over 500 people. The town was founded in 1854, and has a rich history that is deeply rooted in the agricultural industry.
Geography
Early is located in the southeastern corner of Iowa, in Appanoose County. It is situated along the Chariton River, and is surrounded by rolling hills and farmland. The town is located approximately 30 miles from the state capital of Des Moines, and is within a two-hour drive of several major cities, including Omaha, Nebraska and Kansas City, Missouri.
The climate in Early is typical of the Midwest, with hot summers and cold winters. The average temperature in the summer months is around 80 degrees Fahrenheit, while the average temperature in the winter months is around 20 degrees Fahrenheit. The town receives an average of 40 inches of precipitation each year, with most of it falling in the spring and summer months.
Economy
The economy of Early is largely based on agriculture. The town is home to several large farms, which produce a variety of crops, including corn, soybeans, and hay. The town also has a few small businesses, including a grocery store, a hardware store, and a few restaurants.
The town is also home to a few manufacturing companies, which produce a variety of products, including furniture, clothing, and automotive parts. The town is also home to a few small service businesses, such as auto repair shops and hair salons.
Demographics
As of the 2010 census, the population of Early was 514 people. The town is predominantly white, with a small minority population of African Americans, Hispanics, and Native Americans. The median household income in the town is $41,250, and the median age is 43 years old.
The town is home to a few churches, including the First Baptist Church, the United Methodist Church, and the Church of the Nazarene. The town also has a public library, a post office, and a few parks.
Conclusion
Early, Iowa is a small town located in the southeastern corner of the state, in Appanoose County. It is situated along the Chariton River, and is home to a population of just over 500 people. The town was founded in 1854, and has a rich history that is deeply rooted in the agricultural industry. The economy of Early is largely based on agriculture, and the town is home to several large farms, as well as a few small businesses and manufacturing companies. The town is predominantly white, with a small minority population of African Americans, Hispanics, and Native Americans. The town is home to a few churches, a public library, a post office, and a few parks.
Common Questions
What is Per Capita Income in Early?
Per Capita income in Early is $37,353.
What is the Median Family Income in Early?
Median Family Income in Early is $89,286.
What is the Median Household income in Early?
Median Household Income in Early is $85,357.
What is Income or Wage Gap in Early?
Income or Wage Gap in Early is 46.5%.
Women in Early earn 53.5 cents for every dollar earned by a man.
What is Family Income Deficit in Early?
Family Income Deficit in Early is $9,090.
Families that are below poverty line in Early earn $9,090 less on average than the poverty threshold level.
What is Inequality or Gini Index in Early?
Inequality or Gini Index in Early is 0.32.
What is the Total Population of Early?
Total Population of Early is 787.
What is the Total Male Population of Early?
Total Male Population of Early is 495.
What is the Total Female Population of Early?
Total Female Population of Early is 292.
What is the Ratio of Males per 100 Females in Early?
There are 169.52 Males per 100 Females in Early.
What is the Ratio of Females per 100 Males in Early?
There are 58.99 Females per 100 Males in Early.
What is the Median Population Age in Early?
Median Population Age in Early is 42.1 Years.
What is the Average Family Size in Early
Average Family Size in Early is 3.0 People.
What is the Average Household Size in Early
Average Household Size in Early is 2.3 People.
How Large is the Labor Force in Early?
There are 490 People in the Labor Forcein in Early.
What is the Percentage of People in the Labor Force in Early?
80.2% of People are in the Labor Force in Early.
What is the Unemployment Rate in Early?
Unemployment Rate in Early is 9.6%.