Doon, IA Map & Demographics
Doon Map
Doon Overview
$26,550
PER CAPITA INCOME
$81,750
AVG FAMILY INCOME
$60,000
AVG HOUSEHOLD INCOME
49.4%
WAGE / INCOME GAP [ % ]
50.6¢/ $1
WAGE / INCOME GAP [ $ ]
0.36
INEQUALITY / GINI INDEX
575
TOTAL POPULATION
329
MALE POPULATION
246
FEMALE POPULATION
133.74
MALES / 100 FEMALES
74.77
FEMALES / 100 MALES
32.3
MEDIAN AGE
3.6
AVG FAMILY SIZE
2.6
AVG HOUSEHOLD SIZE
283
LABOR FORCE [ PEOPLE ]
70.0%
PERCENT IN LABOR FORCE
2.8%
UNEMPLOYMENT RATE
Doon Zip Codes
Doon Area Codes
Income in Doon
Income Overview in Doon
Per Capita Income in Doon is $26,550, while median incomes of families and households are $81,750 and $60,000 respectively.
| Characteristic | Number | Measure |
| Per Capita Income | 575 | $26,550 |
| Median Family Income | 134 | $81,750 |
| Mean Family Income | 134 | $83,169 |
| Median Household Income | 222 | $60,000 |
| Mean Household Income | 222 | $66,918 |
| Income Deficit | 134 | $0 |
| Wage / Income Gap (%) | 575 | 49.44% |
| Wage / Income Gap ($) | 575 | 50.56¢ per $1 |
| Gini / Inequality Index | 575 | 0.36 |
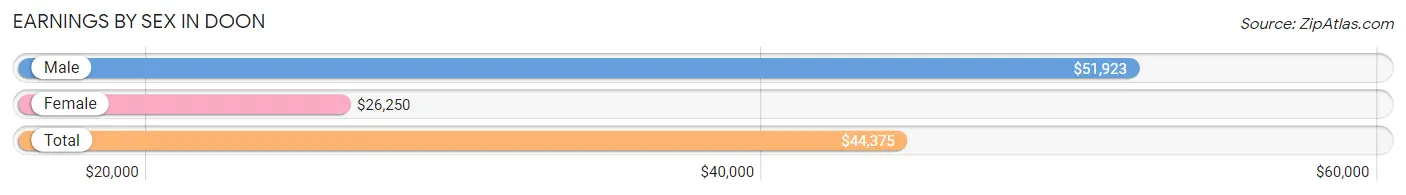
Earnings by Sex in Doon
Average Earnings in Doon are $44,375, $51,923 for men and $26,250 for women, a difference of 49.4%.
| Sex | Number | Average Earnings |
| Male | 186 (63.5%) | $51,923 |
| Female | 107 (36.5%) | $26,250 |
| Total | 293 (100.0%) | $44,375 |
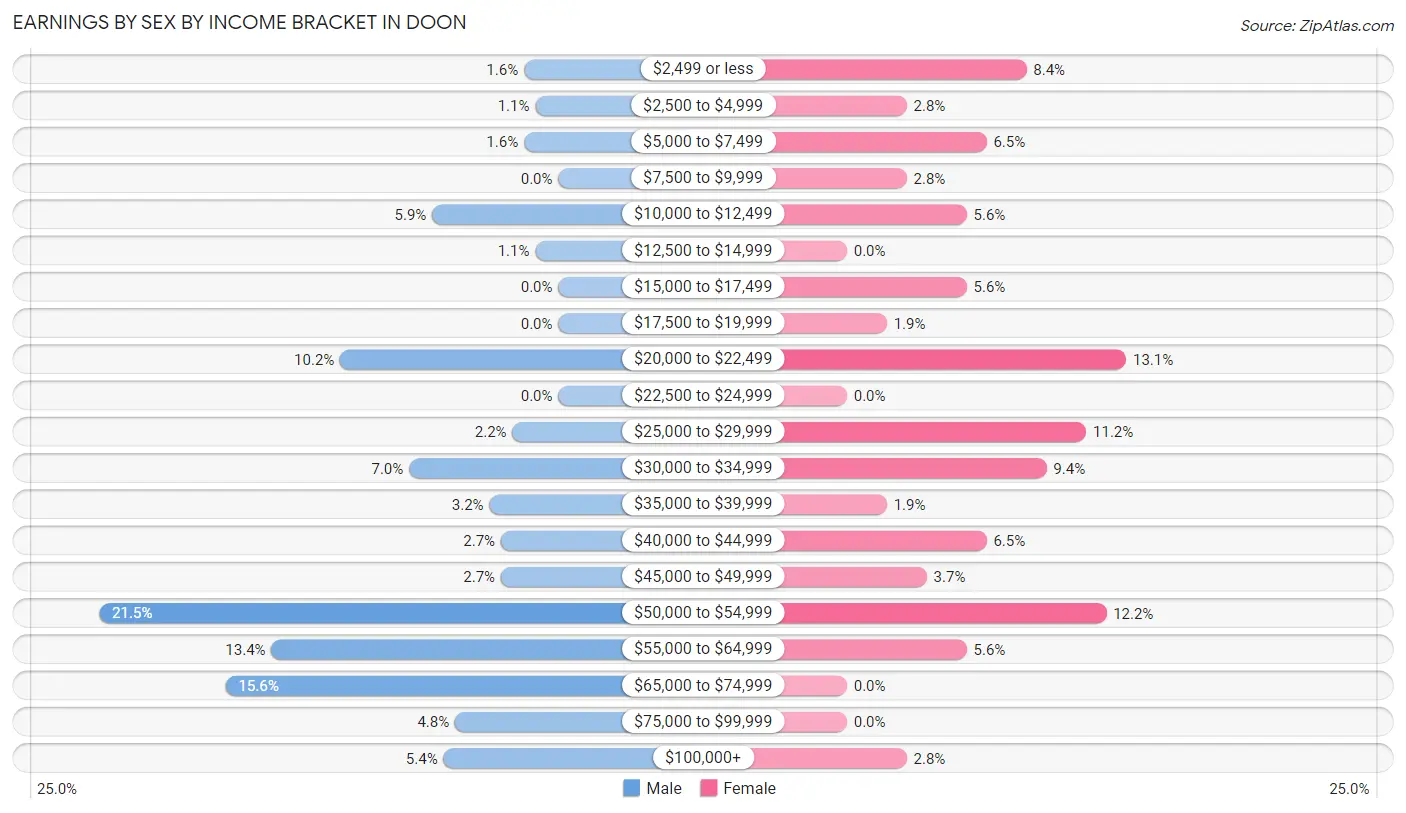
Earnings by Sex by Income Bracket in Doon
The most common earnings brackets in Doon are $50,000 to $54,999 for men (40 | 21.5%) and $20,000 to $22,499 for women (14 | 13.1%).
| Income | Male | Female |
| $2,499 or less | 3 (1.6%) | 9 (8.4%) |
| $2,500 to $4,999 | 2 (1.1%) | 3 (2.8%) |
| $5,000 to $7,499 | 3 (1.6%) | 7 (6.5%) |
| $7,500 to $9,999 | 0 (0.0%) | 3 (2.8%) |
| $10,000 to $12,499 | 11 (5.9%) | 6 (5.6%) |
| $12,500 to $14,999 | 2 (1.1%) | 0 (0.0%) |
| $15,000 to $17,499 | 0 (0.0%) | 6 (5.6%) |
| $17,500 to $19,999 | 0 (0.0%) | 2 (1.9%) |
| $20,000 to $22,499 | 19 (10.2%) | 14 (13.1%) |
| $22,500 to $24,999 | 0 (0.0%) | 0 (0.0%) |
| $25,000 to $29,999 | 4 (2.1%) | 12 (11.2%) |
| $30,000 to $34,999 | 13 (7.0%) | 10 (9.3%) |
| $35,000 to $39,999 | 6 (3.2%) | 2 (1.9%) |
| $40,000 to $44,999 | 5 (2.7%) | 7 (6.5%) |
| $45,000 to $49,999 | 5 (2.7%) | 4 (3.7%) |
| $50,000 to $54,999 | 40 (21.5%) | 13 (12.1%) |
| $55,000 to $64,999 | 25 (13.4%) | 6 (5.6%) |
| $65,000 to $74,999 | 29 (15.6%) | 0 (0.0%) |
| $75,000 to $99,999 | 9 (4.8%) | 0 (0.0%) |
| $100,000+ | 10 (5.4%) | 3 (2.8%) |
| Total | 186 (100.0%) | 107 (100.0%) |
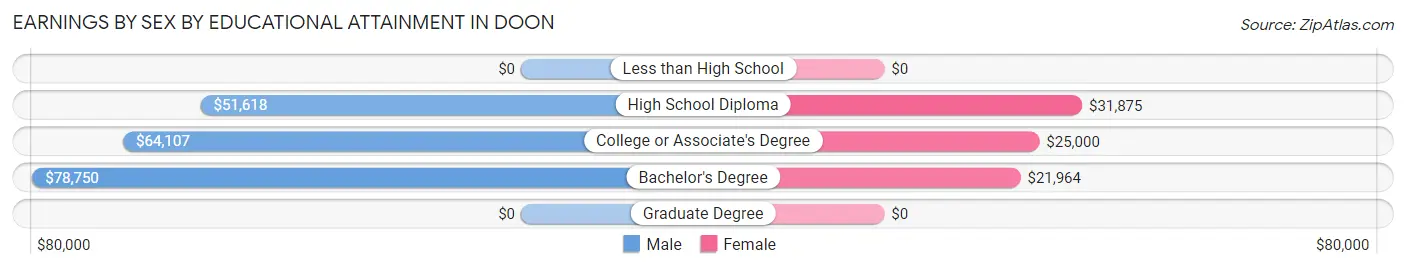
Earnings by Sex by Educational Attainment in Doon
Average earnings in Doon are $54,196 for men and $28,000 for women, a difference of 48.3%. Men with an educational attainment of bachelor's degree enjoy the highest average annual earnings of $78,750, while those with high school diploma education earn the least with $51,618. Women with an educational attainment of high school diploma earn the most with the average annual earnings of $31,875, while those with bachelor's degree education have the smallest earnings of $21,964.
| Educational Attainment | Male Income | Female Income |
| Less than High School | - | - |
| High School Diploma | $51,618 | $31,875 |
| College or Associate's Degree | $64,107 | $25,000 |
| Bachelor's Degree | $78,750 | $21,964 |
| Graduate Degree | - | - |
| Total | $54,196 | $28,000 |
Family Income in Doon
Family Income Brackets in Doon
According to the Doon family income data, there are 37 families falling into the $100,000 to $149,999 income range, which is the most common income bracket and makes up 27.6% of all families. Conversely, the $10,000 to $14,999 income bracket is the least frequent group with only 1 families (0.7%) belonging to this category.
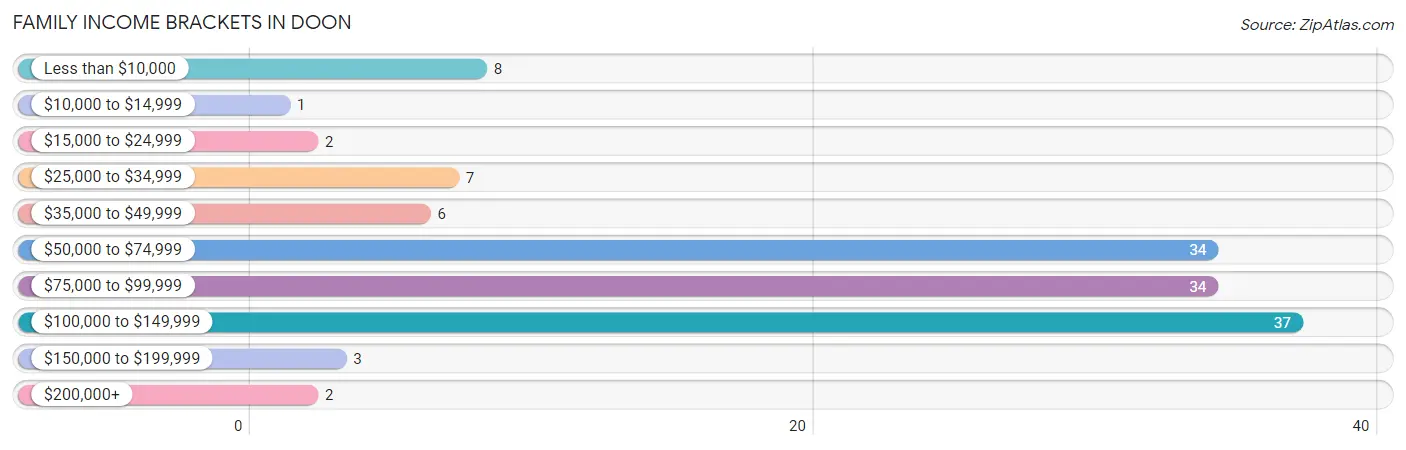
| Income Bracket | # Families | % Families |
| Less than $10,000 | 8 | 6.0% |
| $10,000 to $14,999 | 1 | 0.7% |
| $15,000 to $24,999 | 2 | 1.5% |
| $25,000 to $34,999 | 7 | 5.2% |
| $35,000 to $49,999 | 6 | 4.5% |
| $50,000 to $74,999 | 34 | 25.4% |
| $75,000 to $99,999 | 34 | 25.4% |
| $100,000 to $149,999 | 37 | 27.6% |
| $150,000 to $199,999 | 3 | 2.2% |
| $200,000+ | 2 | 1.5% |
Family Income by Famaliy Size in Doon
7+ person families (9 | 6.7%) account for the highest median family income in Doon with $126,458 per family, while 2-person families (63 | 47.0%) have the highest median income of $34,062 per family member.
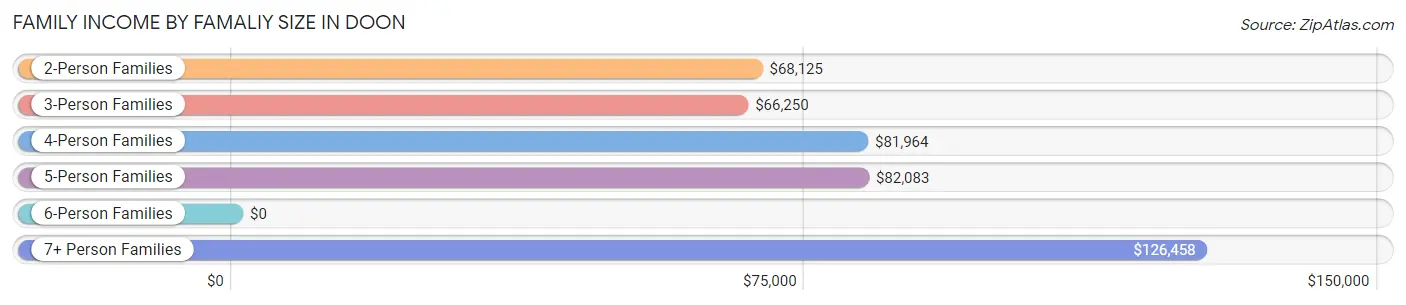
| Income Bracket | # Families | Median Income |
| 2-Person Families | 63 (47.0%) | $68,125 |
| 3-Person Families | 22 (16.4%) | $66,250 |
| 4-Person Families | 21 (15.7%) | $81,964 |
| 5-Person Families | 15 (11.2%) | $82,083 |
| 6-Person Families | 4 (3.0%) | $0 |
| 7+ Person Families | 9 (6.7%) | $126,458 |
| Total | 134 (100.0%) | $81,750 |
Family Income by Number of Earners in Doon
The median family income in Doon is $81,750, with families comprising 3+ earners (17) having the highest median family income of $111,875, while families with no earners (22) have the lowest median family income of $26,250, accounting for 12.7% and 16.4% of families, respectively.
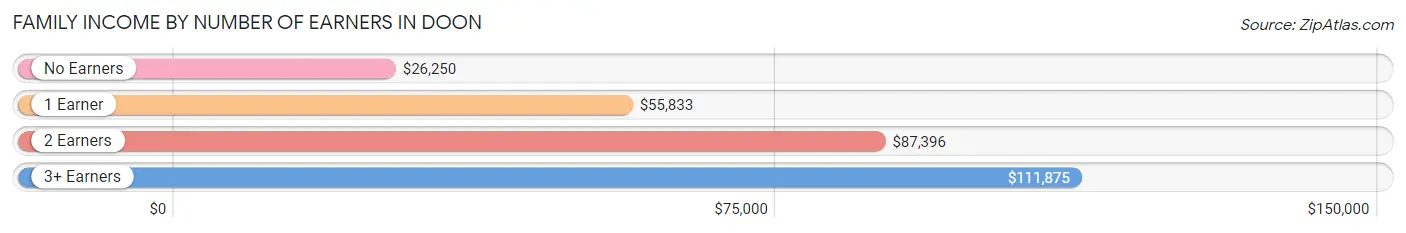
| Number of Earners | # Families | Median Income |
| No Earners | 22 (16.4%) | $26,250 |
| 1 Earner | 20 (14.9%) | $55,833 |
| 2 Earners | 75 (56.0%) | $87,396 |
| 3+ Earners | 17 (12.7%) | $111,875 |
| Total | 134 (100.0%) | $81,750 |
Household Income in Doon
Household Income Brackets in Doon
With 67 households falling in the category, the $50,000 to $74,999 income range is the most frequent in Doon, accounting for 30.2% of all households. In contrast, only 3 households (1.3%) fall into the $150,000 to $199,999 income bracket, making it the least populous group.
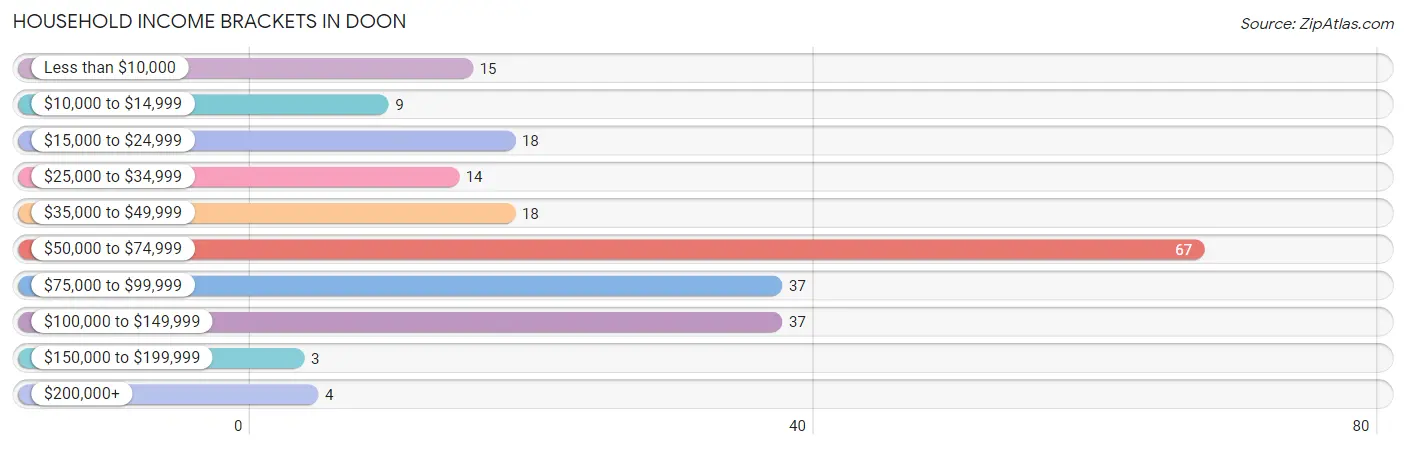
| Income Bracket | # Households | % Households |
| Less than $10,000 | 15 | 6.8% |
| $10,000 to $14,999 | 9 | 4.1% |
| $15,000 to $24,999 | 18 | 8.1% |
| $25,000 to $34,999 | 14 | 6.3% |
| $35,000 to $49,999 | 18 | 8.1% |
| $50,000 to $74,999 | 67 | 30.2% |
| $75,000 to $99,999 | 37 | 16.7% |
| $100,000 to $149,999 | 37 | 16.7% |
| $150,000 to $199,999 | 3 | 1.4% |
| $200,000+ | 4 | 1.8% |
Household Income by Householder Age in Doon
The median household income in Doon is $60,000, with the highest median household income of $86,667 found in the 45 to 64 years age bracket for the primary householder. A total of 54 households (24.3%) fall into this category. Meanwhile, the 15 to 24 years age bracket for the primary householder has the lowest median household income of $0, with 9 households (4.1%) in this group.
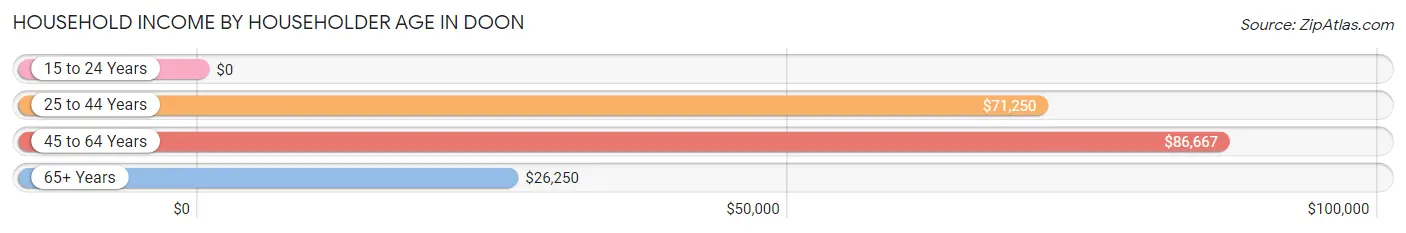
| Income Bracket | # Households | Median Income |
| 15 to 24 Years | 9 (4.1%) | $0 |
| 25 to 44 Years | 85 (38.3%) | $71,250 |
| 45 to 64 Years | 54 (24.3%) | $86,667 |
| 65+ Years | 74 (33.3%) | $26,250 |
| Total | 222 (100.0%) | $60,000 |
Poverty in Doon
Income Below Poverty by Sex and Age in Doon
With 8.2% poverty level for males and 9.3% for females among the residents of Doon, 65 to 74 year old males and 75 year old and over females are the most vulnerable to poverty, with 11 males (47.8%) and 7 females (25.9%) in their respective age groups living below the poverty level.
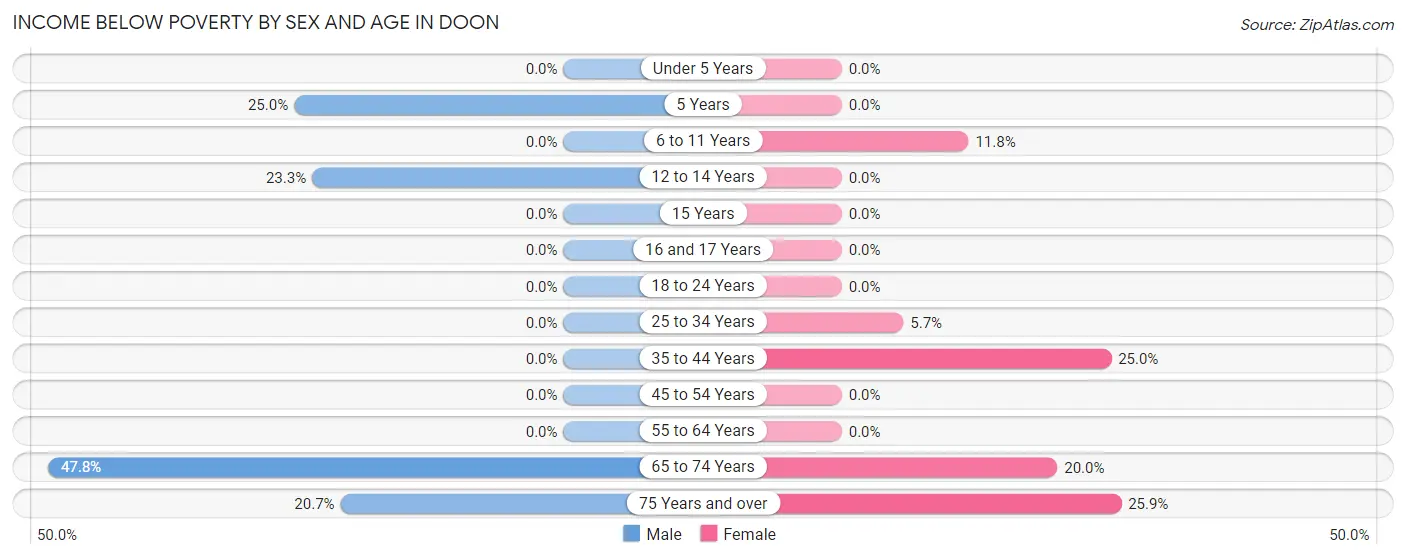
| Age Bracket | Male | Female |
| Under 5 Years | 0 (0.0%) | 0 (0.0%) |
| 5 Years | 3 (25.0%) | 0 (0.0%) |
| 6 to 11 Years | 0 (0.0%) | 4 (11.8%) |
| 12 to 14 Years | 7 (23.3%) | 0 (0.0%) |
| 15 Years | 0 (0.0%) | 0 (0.0%) |
| 16 and 17 Years | 0 (0.0%) | 0 (0.0%) |
| 18 to 24 Years | 0 (0.0%) | 0 (0.0%) |
| 25 to 34 Years | 0 (0.0%) | 2 (5.7%) |
| 35 to 44 Years | 0 (0.0%) | 6 (25.0%) |
| 45 to 54 Years | 0 (0.0%) | 0 (0.0%) |
| 55 to 64 Years | 0 (0.0%) | 0 (0.0%) |
| 65 to 74 Years | 11 (47.8%) | 4 (20.0%) |
| 75 Years and over | 6 (20.7%) | 7 (25.9%) |
| Total | 27 (8.2%) | 23 (9.3%) |
Income Above Poverty by Sex and Age in Doon
According to the poverty statistics in Doon, males aged under 5 years and females aged under 5 years are the age groups that are most secure financially, with 100.0% of males and 100.0% of females in these age groups living above the poverty line.
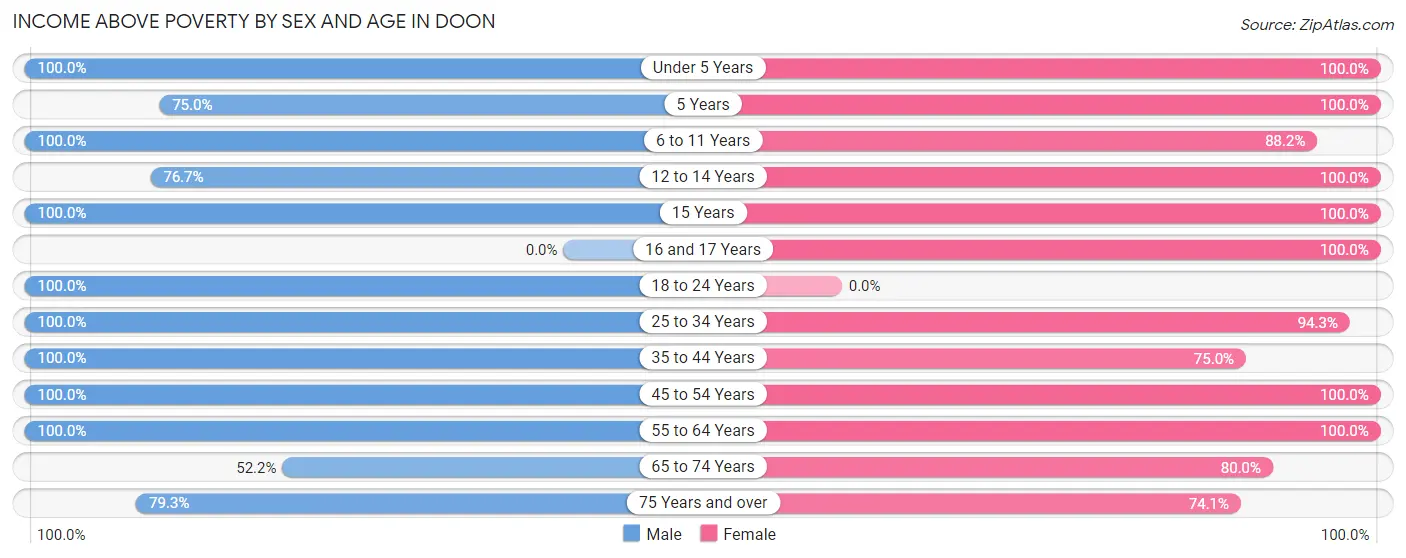
| Age Bracket | Male | Female |
| Under 5 Years | 13 (100.0%) | 21 (100.0%) |
| 5 Years | 9 (75.0%) | 16 (100.0%) |
| 6 to 11 Years | 17 (100.0%) | 30 (88.2%) |
| 12 to 14 Years | 23 (76.7%) | 2 (100.0%) |
| 15 Years | 11 (100.0%) | 15 (100.0%) |
| 16 and 17 Years | 0 (0.0%) | 9 (100.0%) |
| 18 to 24 Years | 31 (100.0%) | 0 (0.0%) |
| 25 to 34 Years | 53 (100.0%) | 33 (94.3%) |
| 35 to 44 Years | 57 (100.0%) | 18 (75.0%) |
| 45 to 54 Years | 25 (100.0%) | 23 (100.0%) |
| 55 to 64 Years | 28 (100.0%) | 20 (100.0%) |
| 65 to 74 Years | 12 (52.2%) | 16 (80.0%) |
| 75 Years and over | 23 (79.3%) | 20 (74.1%) |
| Total | 302 (91.8%) | 223 (90.6%) |
Income Below Poverty Among Married-Couple Families in Doon
The poverty statistics for married-couple families in Doon show that 2.7% or 3 of the total 111 families live below the poverty line. Families with no children have the highest poverty rate of 5.8%, comprising of 3 families. On the other hand, families with 1 or 2 children have the lowest poverty rate of 0.0%, which includes 0 families.
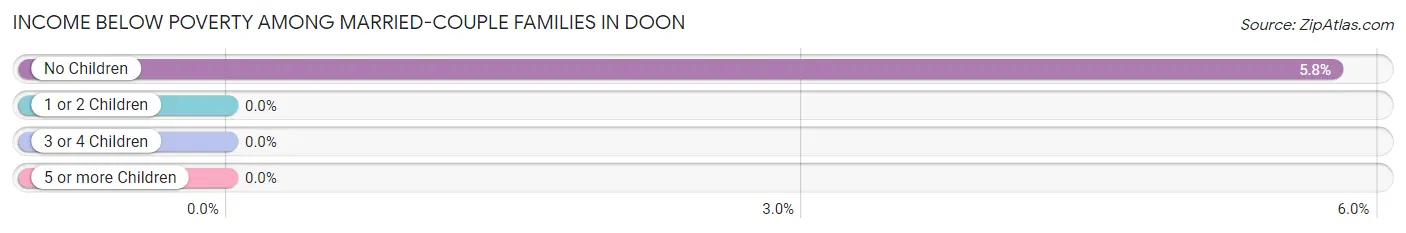
| Children | Above Poverty | Below Poverty |
| No Children | 49 (94.2%) | 3 (5.8%) |
| 1 or 2 Children | 33 (100.0%) | 0 (0.0%) |
| 3 or 4 Children | 19 (100.0%) | 0 (0.0%) |
| 5 or more Children | 7 (100.0%) | 0 (0.0%) |
| Total | 108 (97.3%) | 3 (2.7%) |
Income Below Poverty Among Single-Parent Households in Doon
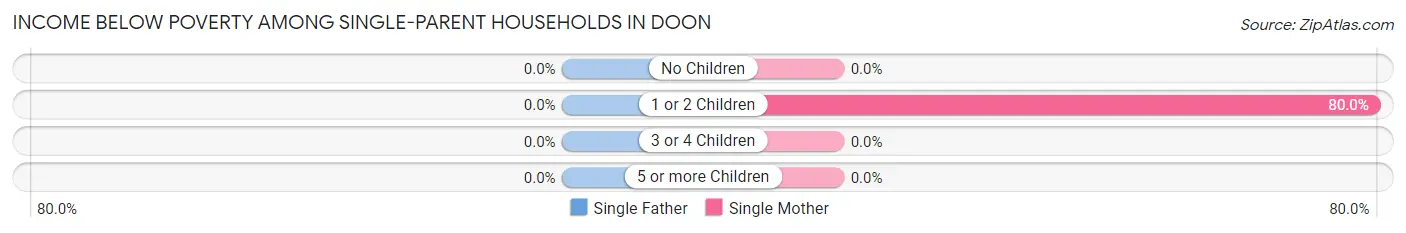
| Children | Single Father | Single Mother |
| No Children | 0 (0.0%) | 0 (0.0%) |
| 1 or 2 Children | 0 (0.0%) | 8 (80.0%) |
| 3 or 4 Children | 0 (0.0%) | 0 (0.0%) |
| 5 or more Children | 0 (0.0%) | 0 (0.0%) |
| Total | 0 (0.0%) | 8 (72.7%) |
Income Below Poverty Among Married-Couple vs Single-Parent Households in Doon
The poverty data for Doon shows that 3 of the married-couple family households (2.7%) and 8 of the single-parent households (34.8%) are living below the poverty level. Within the married-couple family households, those with no children have the highest poverty rate, with 3 households (5.8%) falling below the poverty line. Among the single-parent households, those with 1 or 2 children have the highest poverty rate, with 8 household (80.0%) living below poverty.
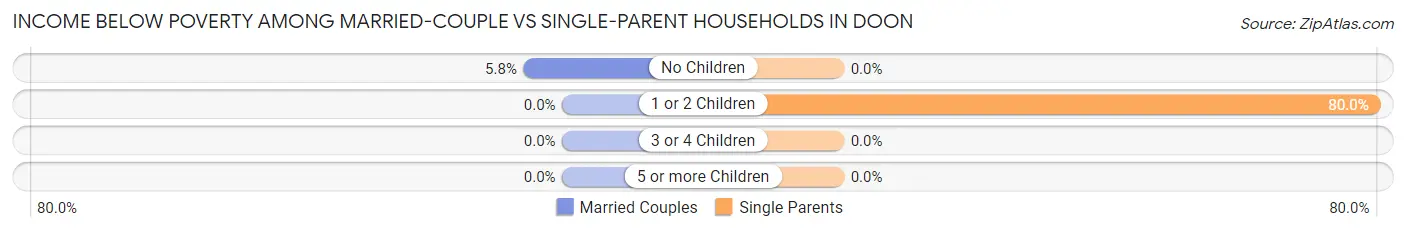
| Children | Married-Couple Families | Single-Parent Households |
| No Children | 3 (5.8%) | 0 (0.0%) |
| 1 or 2 Children | 0 (0.0%) | 8 (80.0%) |
| 3 or 4 Children | 0 (0.0%) | 0 (0.0%) |
| 5 or more Children | 0 (0.0%) | 0 (0.0%) |
| Total | 3 (2.7%) | 8 (34.8%) |
Race in Doon
The most populous races in Doon are White / Caucasian (555 | 96.5%), Some other Race (12 | 2.1%), and Two or more Races (8 | 1.4%).
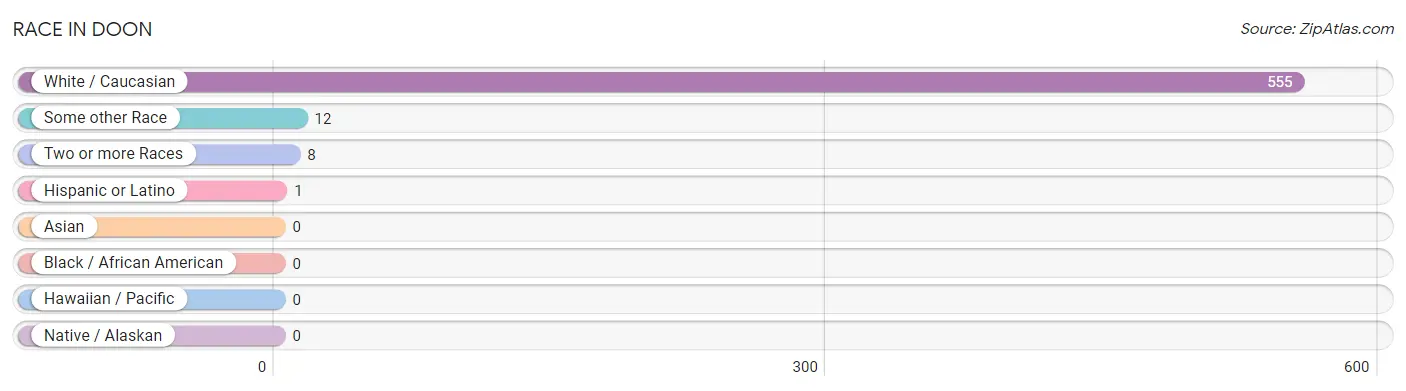
| Race | # Population | % Population |
| Asian | 0 | 0.0% |
| Black / African American | 0 | 0.0% |
| Hawaiian / Pacific | 0 | 0.0% |
| Hispanic or Latino | 1 | 0.2% |
| Native / Alaskan | 0 | 0.0% |
| White / Caucasian | 555 | 96.5% |
| Two or more Races | 8 | 1.4% |
| Some other Race | 12 | 2.1% |
| Total | 575 | 100.0% |
Ancestry in Doon
The most populous ancestries reported in Doon are Dutch (325 | 56.5%), German (104 | 18.1%), Polish (27 | 4.7%), American (14 | 2.4%), and Irish (12 | 2.1%), together accounting for 83.8% of all Doon residents.
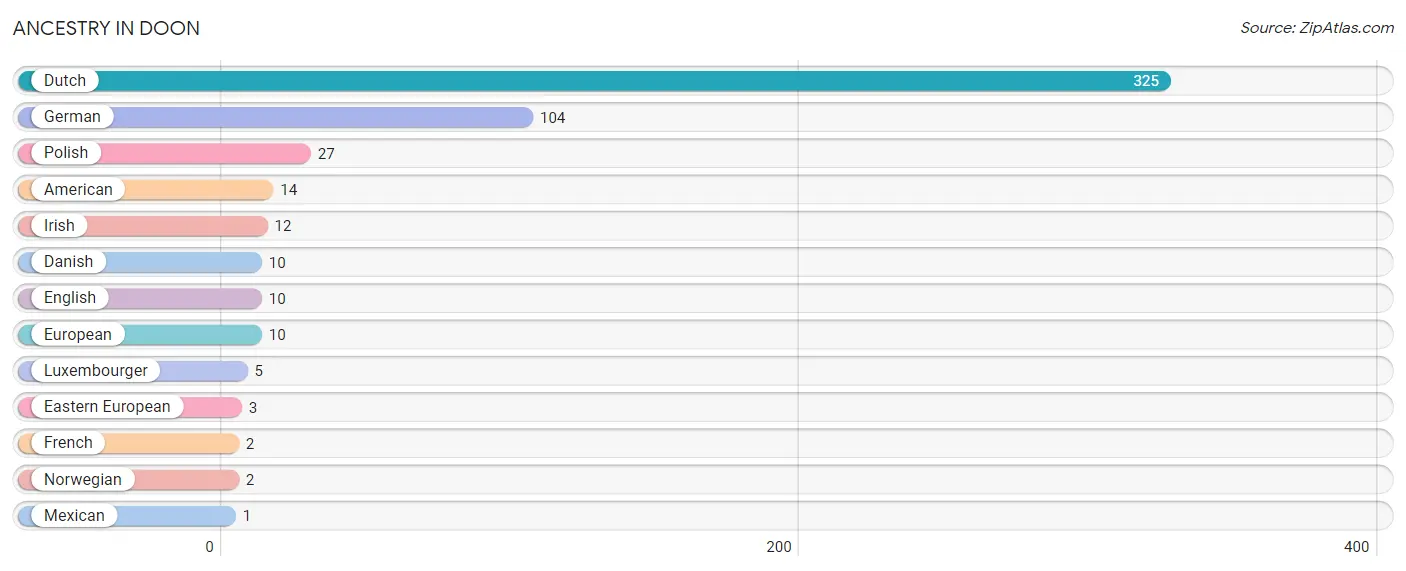
| Ancestry | # Population | % Population |
| American | 14 | 2.4% |
| Danish | 10 | 1.7% |
| Dutch | 325 | 56.5% |
| Eastern European | 3 | 0.5% |
| English | 10 | 1.7% |
| European | 10 | 1.7% |
| French | 2 | 0.4% |
| German | 104 | 18.1% |
| Irish | 12 | 2.1% |
| Luxembourger | 5 | 0.9% |
| Mexican | 1 | 0.2% |
| Norwegian | 2 | 0.4% |
| Polish | 27 | 4.7% | View All 13 Rows |
Immigrants in Doon
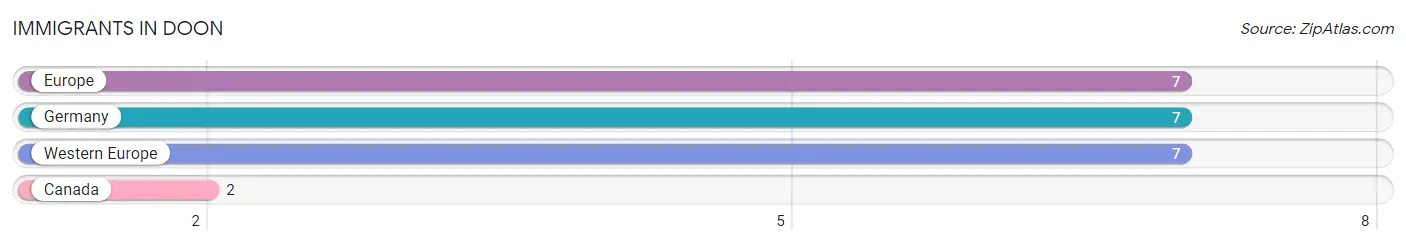
The most numerous immigrant groups reported in Doon came from Europe (7 | 1.2%), Germany (7 | 1.2%), Western Europe (7 | 1.2%), and Canada (2 | 0.4%), together accounting for 4.0% of all Doon residents.
| Immigration Origin | # Population | % Population |
| Canada | 2 | 0.4% |
| Europe | 7 | 1.2% |
| Germany | 7 | 1.2% |
| Western Europe | 7 | 1.2% | View All 4 Rows |
Sex and Age in Doon
Sex and Age in Doon
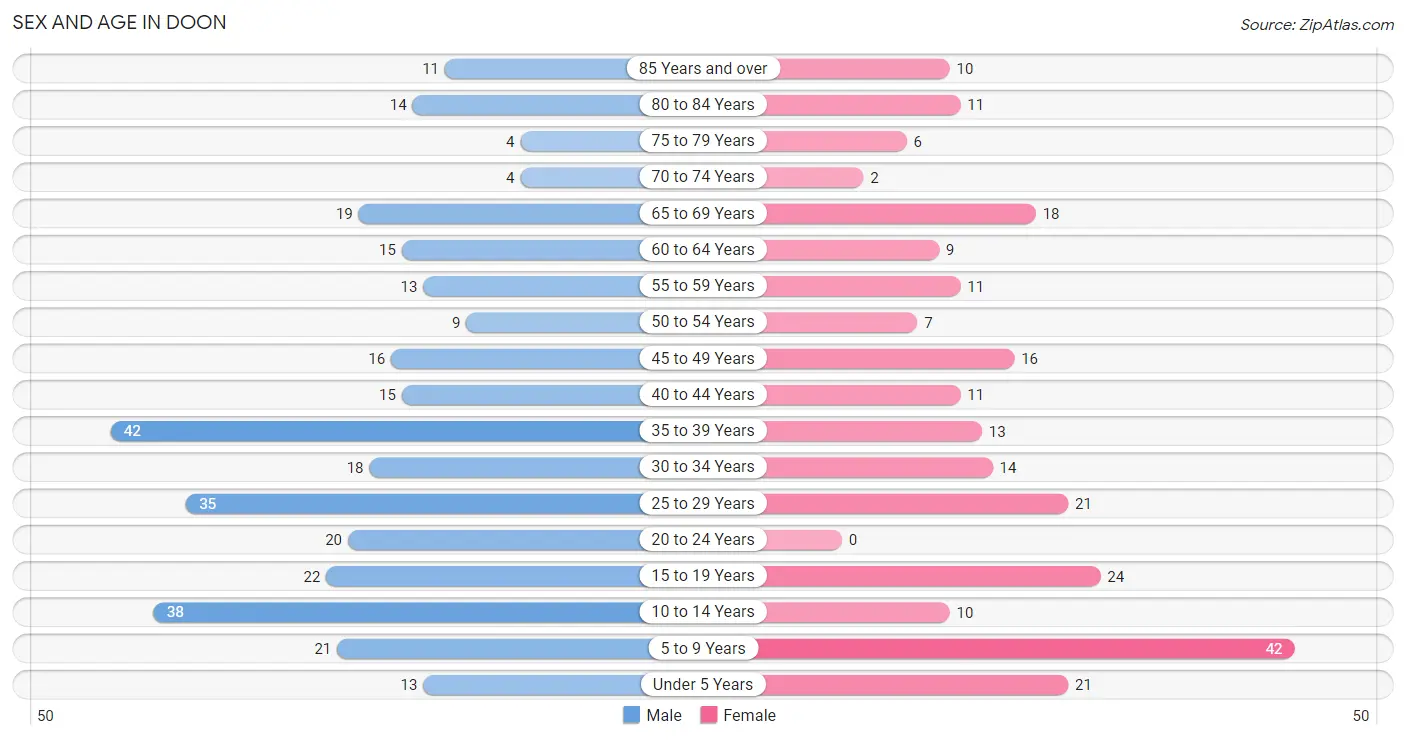
The most populous age groups in Doon are 35 to 39 Years (42 | 12.8%) for men and 5 to 9 Years (42 | 17.1%) for women.
| Age Bracket | Male | Female |
| Under 5 Years | 13 (4.0%) | 21 (8.5%) |
| 5 to 9 Years | 21 (6.4%) | 42 (17.1%) |
| 10 to 14 Years | 38 (11.6%) | 10 (4.1%) |
| 15 to 19 Years | 22 (6.7%) | 24 (9.8%) |
| 20 to 24 Years | 20 (6.1%) | 0 (0.0%) |
| 25 to 29 Years | 35 (10.6%) | 21 (8.5%) |
| 30 to 34 Years | 18 (5.5%) | 14 (5.7%) |
| 35 to 39 Years | 42 (12.8%) | 13 (5.3%) |
| 40 to 44 Years | 15 (4.6%) | 11 (4.5%) |
| 45 to 49 Years | 16 (4.9%) | 16 (6.5%) |
| 50 to 54 Years | 9 (2.7%) | 7 (2.9%) |
| 55 to 59 Years | 13 (4.0%) | 11 (4.5%) |
| 60 to 64 Years | 15 (4.6%) | 9 (3.7%) |
| 65 to 69 Years | 19 (5.8%) | 18 (7.3%) |
| 70 to 74 Years | 4 (1.2%) | 2 (0.8%) |
| 75 to 79 Years | 4 (1.2%) | 6 (2.4%) |
| 80 to 84 Years | 14 (4.3%) | 11 (4.5%) |
| 85 Years and over | 11 (3.3%) | 10 (4.1%) |
| Total | 329 (100.0%) | 246 (100.0%) |
Families and Households in Doon
Median Family Size in Doon
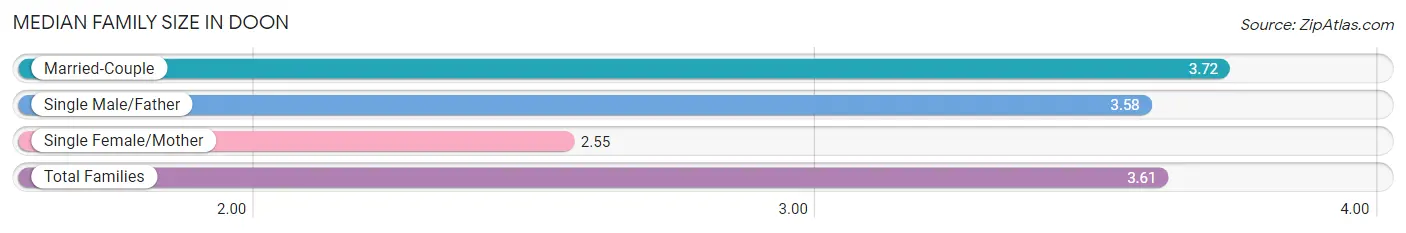
The median family size in Doon is 3.61 persons per family, with married-couple families (111 | 82.8%) accounting for the largest median family size of 3.72 persons per family. On the other hand, single female/mother families (11 | 8.2%) represent the smallest median family size with 2.55 persons per family.
| Family Type | # Families | Family Size |
| Married-Couple | 111 (82.8%) | 3.72 |
| Single Male/Father | 12 (9.0%) | 3.58 |
| Single Female/Mother | 11 (8.2%) | 2.55 |
| Total Families | 134 (100.0%) | 3.61 |
Median Household Size in Doon
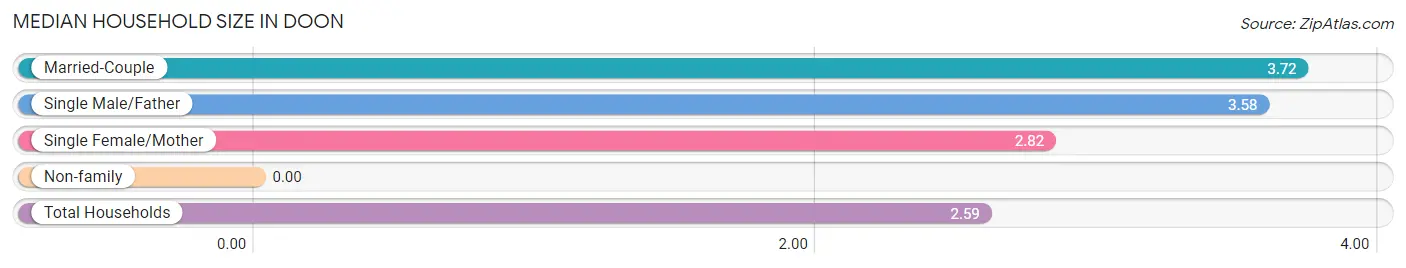
| Household Type | # Households | Household Size |
| Married-Couple | 111 (50.0%) | 3.72 |
| Single Male/Father | 12 (5.4%) | 3.58 |
| Single Female/Mother | 11 (5.0%) | 2.82 |
| Non-family | 88 (39.6%) | - |
| Total Households | 222 (100.0%) | 2.59 |
Household Size by Marriage Status in Doon
Out of a total of 222 households in Doon, 134 (60.4%) are family households, while 88 (39.6%) are nonfamily households. The most numerous type of family households are 2-person households, comprising 63, and the most common type of nonfamily households are 1-person households, comprising 88.
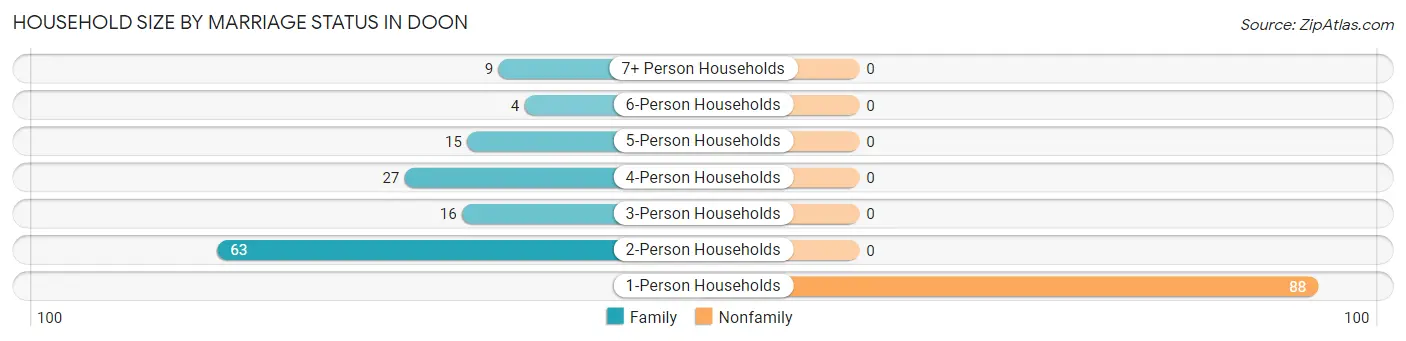
| Household Size | Family Households | Nonfamily Households |
| 1-Person Households | - | 88 (39.6%) |
| 2-Person Households | 63 (28.4%) | 0 (0.0%) |
| 3-Person Households | 16 (7.2%) | 0 (0.0%) |
| 4-Person Households | 27 (12.2%) | 0 (0.0%) |
| 5-Person Households | 15 (6.8%) | 0 (0.0%) |
| 6-Person Households | 4 (1.8%) | 0 (0.0%) |
| 7+ Person Households | 9 (4.1%) | 0 (0.0%) |
| Total | 134 (60.4%) | 88 (39.6%) |
Female Fertility in Doon
Fertility by Age in Doon
Average fertility rate in Doon is 40.0 births per 1,000 women. Women in the age bracket of 20 to 34 years have the highest fertility rate with 114.0 births per 1,000 women. Women in the age bracket of 20 to 34 years acount for 100.0% of all women with births.
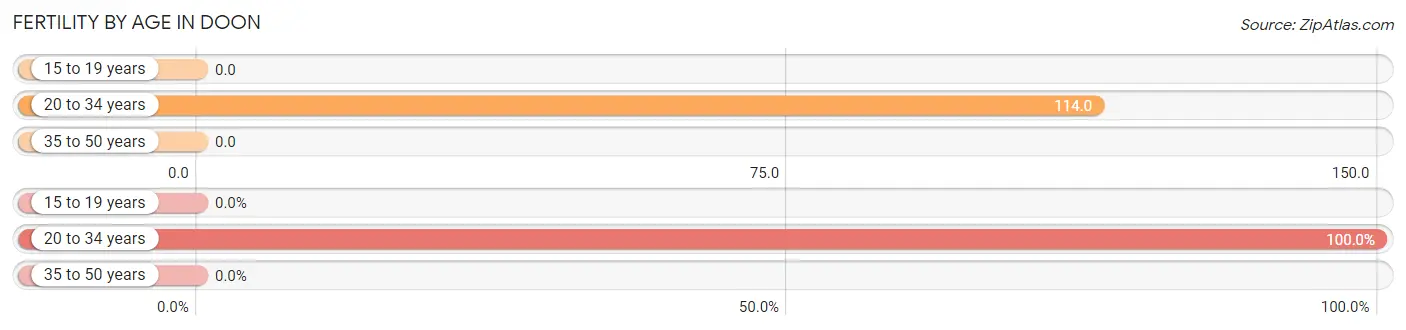
| Age Bracket | Women with Births | Births / 1,000 Women |
| 15 to 19 years | 0 (0.0%) | 0.0 |
| 20 to 34 years | 4 (100.0%) | 114.0 |
| 35 to 50 years | 0 (0.0%) | 0.0 |
| Total | 4 (100.0%) | 40.0 |
Fertility by Age by Marriage Status in Doon
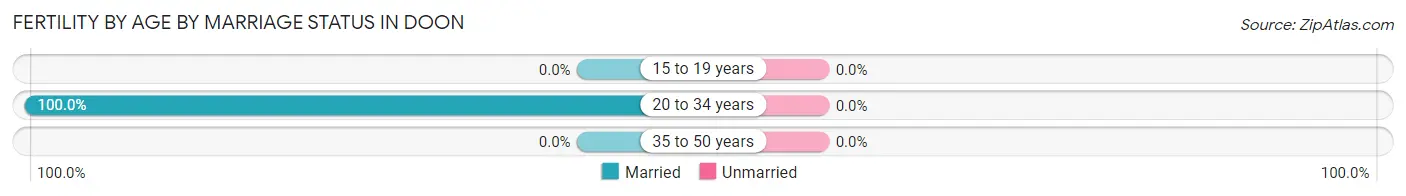
| Age Bracket | Married | Unmarried |
| 15 to 19 years | 0 (0.0%) | 0 (0.0%) |
| 20 to 34 years | 4 (100.0%) | 0 (0.0%) |
| 35 to 50 years | 0 (0.0%) | 0 (0.0%) |
| Total | 4 (100.0%) | 0 (0.0%) |
Fertility by Education in Doon
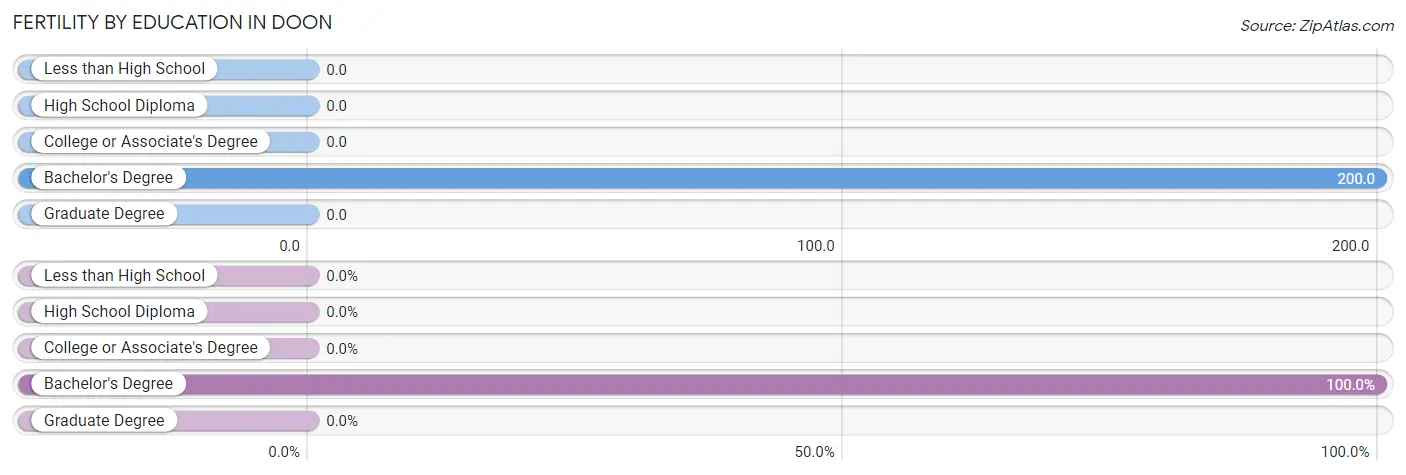
| Educational Attainment | Women with Births | Births / 1,000 Women |
| Less than High School | 0 (0.0%) | 0.0 |
| High School Diploma | 0 (0.0%) | 0.0 |
| College or Associate's Degree | 0 (0.0%) | 0.0 |
| Bachelor's Degree | 4 (100.0%) | 200.0 |
| Graduate Degree | 0 (0.0%) | 0.0 |
| Total | 4 (100.0%) | 40.0 |
Fertility by Education by Marriage Status in Doon
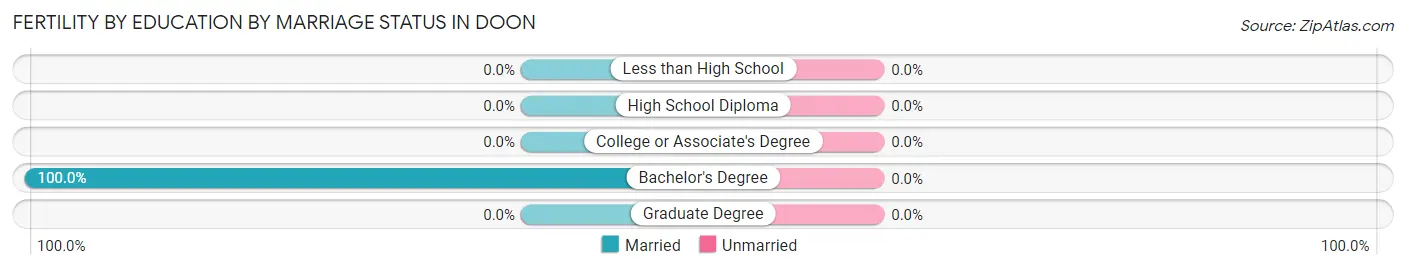
| Educational Attainment | Married | Unmarried |
| Less than High School | 0 (0.0%) | 0 (0.0%) |
| High School Diploma | 0 (0.0%) | 0 (0.0%) |
| College or Associate's Degree | 0 (0.0%) | 0 (0.0%) |
| Bachelor's Degree | 4 (100.0%) | 0 (0.0%) |
| Graduate Degree | 0 (0.0%) | 0 (0.0%) |
| Total | 4 (100.0%) | 0 (0.0%) |
Employment Characteristics in Doon
Employment by Class of Employer in Doon
Among the 273 employed individuals in Doon, private company employees (174 | 63.7%), not-for-profit organizations (40 | 14.6%), and self-employed (not incorporated) (21 | 7.7%) make up the most common classes of employment.
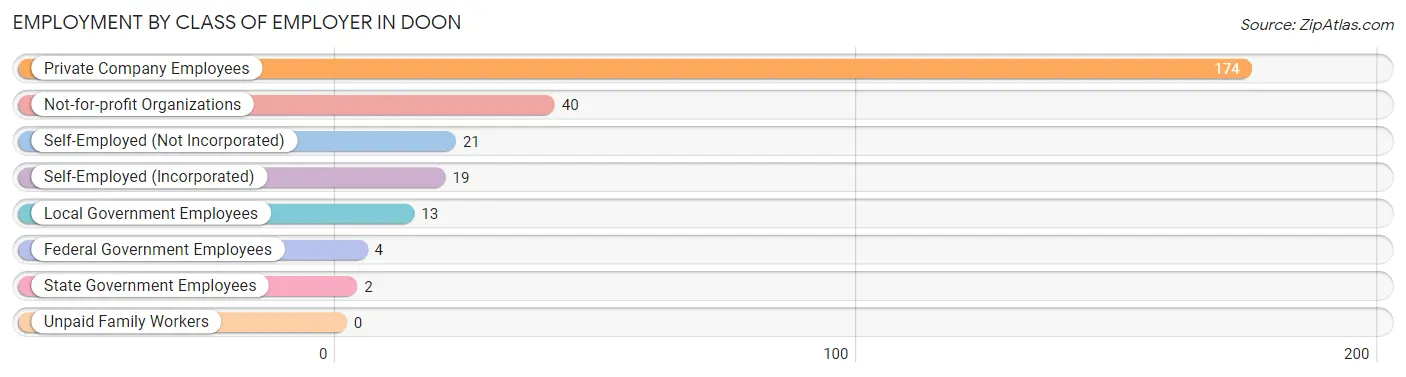
| Employer Class | # Employees | % Employees |
| Private Company Employees | 174 | 63.7% |
| Self-Employed (Incorporated) | 19 | 7.0% |
| Self-Employed (Not Incorporated) | 21 | 7.7% |
| Not-for-profit Organizations | 40 | 14.6% |
| Local Government Employees | 13 | 4.8% |
| State Government Employees | 2 | 0.7% |
| Federal Government Employees | 4 | 1.5% |
| Unpaid Family Workers | 0 | 0.0% |
| Total | 273 | 100.0% |
Employment Status by Age in Doon
According to the labor force statistics for Doon, out of the total population over 16 years of age (404), 70.0% or 283 individuals are in the labor force, with 2.8% or 8 of them unemployed. The age group with the highest labor force participation rate is 20 to 24 years, with 100.0% or 20 individuals in the labor force. Within the labor force, the 25 to 29 years age range has the highest percentage of unemployed individuals, with 9.4% or 5 of them being unemployed.
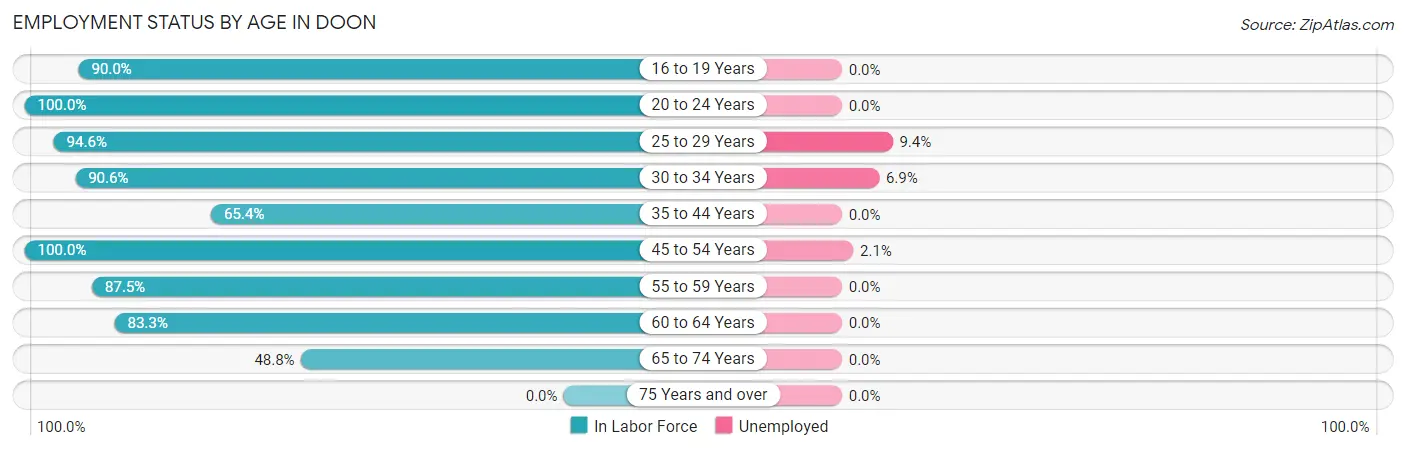
| Age Bracket | In Labor Force | Unemployed |
| 16 to 19 Years | 18 (90.0%) | 0 (0.0%) |
| 20 to 24 Years | 20 (100.0%) | 0 (0.0%) |
| 25 to 29 Years | 53 (94.6%) | 5 (9.4%) |
| 30 to 34 Years | 29 (90.6%) | 2 (6.9%) |
| 35 to 44 Years | 53 (65.4%) | 0 (0.0%) |
| 45 to 54 Years | 48 (100.0%) | 1 (2.1%) |
| 55 to 59 Years | 21 (87.5%) | 0 (0.0%) |
| 60 to 64 Years | 20 (83.3%) | 0 (0.0%) |
| 65 to 74 Years | 21 (48.8%) | 0 (0.0%) |
| 75 Years and over | 0 (0.0%) | 0 (0.0%) |
| Total | 283 (70.0%) | 8 (2.8%) |
Employment Status by Educational Attainment in Doon
According to labor force statistics for Doon, 84.5% of individuals (224) out of the total population between 25 and 64 years of age (265) are in the labor force, with 3.6% or 8 of them being unemployed. The group with the highest labor force participation rate are those with the educational attainment of less than high school, with 100.0% or 2 individuals in the labor force. Within the labor force, individuals with high school diploma education have the highest percentage of unemployment, with 5.0% or 6 of them being unemployed.
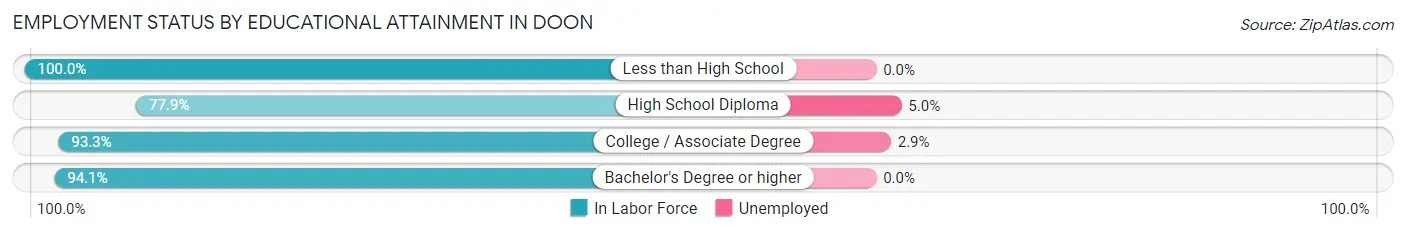
| Educational Attainment | In Labor Force | Unemployed |
| Less than High School | 2 (100.0%) | 0 (0.0%) |
| High School Diploma | 120 (77.9%) | 8 (5.0%) |
| College / Associate Degree | 70 (93.3%) | 2 (2.9%) |
| Bachelor's Degree or higher | 32 (94.1%) | 0 (0.0%) |
| Total | 224 (84.5%) | 10 (3.6%) |
Employment Occupations by Sex in Doon
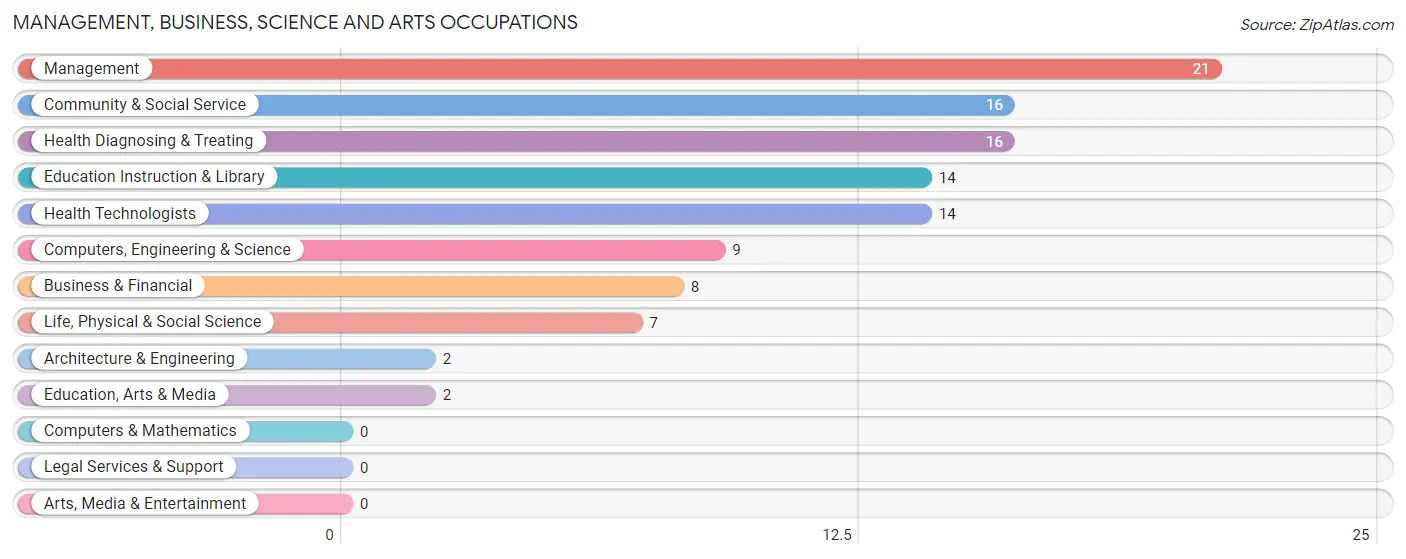
Management, Business, Science and Arts Occupations
The most common Management, Business, Science and Arts occupations in Doon are Management (21 | 7.6%), Community & Social Service (16 | 5.8%), Health Diagnosing & Treating (16 | 5.8%), Education Instruction & Library (14 | 5.1%), and Health Technologists (14 | 5.1%).
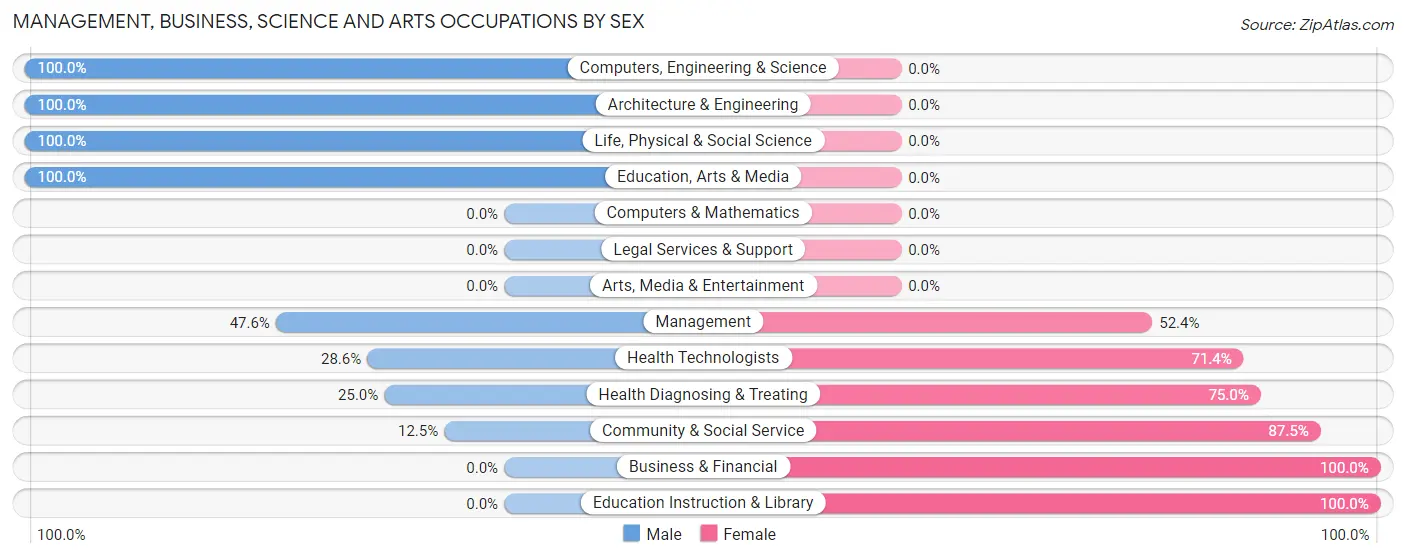
Management, Business, Science and Arts Occupations by Sex
Within the Management, Business, Science and Arts occupations in Doon, the most male-oriented occupations are Computers, Engineering & Science (100.0%), Architecture & Engineering (100.0%), and Life, Physical & Social Science (100.0%), while the most female-oriented occupations are Business & Financial (100.0%), Education Instruction & Library (100.0%), and Community & Social Service (87.5%).
| Occupation | Male | Female |
| Management | 10 (47.6%) | 11 (52.4%) |
| Business & Financial | 0 (0.0%) | 8 (100.0%) |
| Computers, Engineering & Science | 9 (100.0%) | 0 (0.0%) |
| Computers & Mathematics | 0 (0.0%) | 0 (0.0%) |
| Architecture & Engineering | 2 (100.0%) | 0 (0.0%) |
| Life, Physical & Social Science | 7 (100.0%) | 0 (0.0%) |
| Community & Social Service | 2 (12.5%) | 14 (87.5%) |
| Education, Arts & Media | 2 (100.0%) | 0 (0.0%) |
| Legal Services & Support | 0 (0.0%) | 0 (0.0%) |
| Education Instruction & Library | 0 (0.0%) | 14 (100.0%) |
| Arts, Media & Entertainment | 0 (0.0%) | 0 (0.0%) |
| Health Diagnosing & Treating | 4 (25.0%) | 12 (75.0%) |
| Health Technologists | 4 (28.6%) | 10 (71.4%) |
| Total (Category) | 25 (35.7%) | 45 (64.3%) |
| Total (Overall) | 177 (64.4%) | 98 (35.6%) |
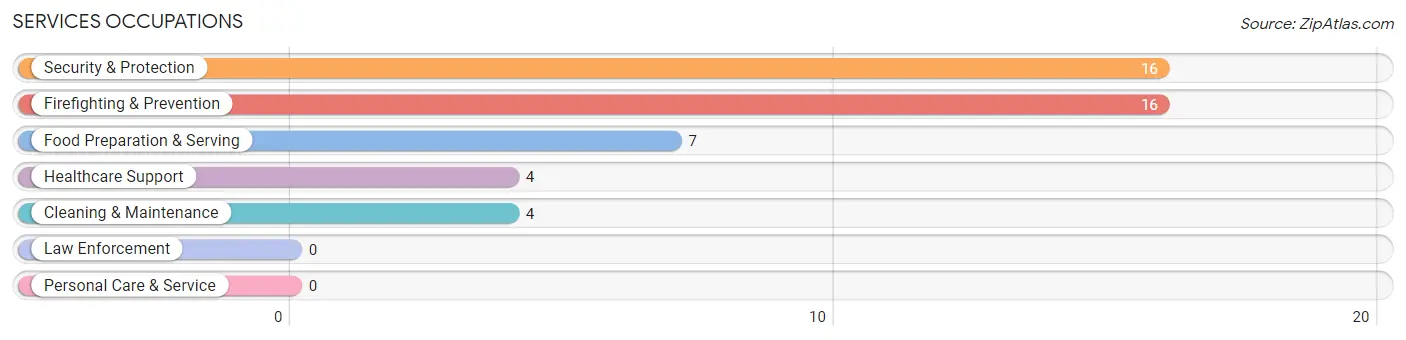
Services Occupations
The most common Services occupations in Doon are Security & Protection (16 | 5.8%), Firefighting & Prevention (16 | 5.8%), Food Preparation & Serving (7 | 2.5%), Healthcare Support (4 | 1.5%), and Cleaning & Maintenance (4 | 1.5%).
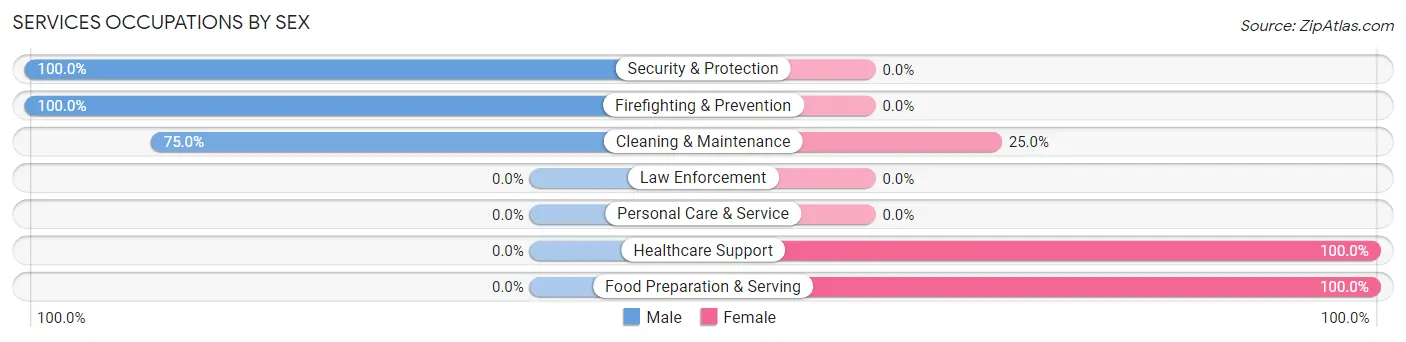
Services Occupations by Sex
Within the Services occupations in Doon, the most male-oriented occupations are Security & Protection (100.0%), Firefighting & Prevention (100.0%), and Cleaning & Maintenance (75.0%), while the most female-oriented occupations are Healthcare Support (100.0%), Food Preparation & Serving (100.0%), and Cleaning & Maintenance (25.0%).
| Occupation | Male | Female |
| Healthcare Support | 0 (0.0%) | 4 (100.0%) |
| Security & Protection | 16 (100.0%) | 0 (0.0%) |
| Firefighting & Prevention | 16 (100.0%) | 0 (0.0%) |
| Law Enforcement | 0 (0.0%) | 0 (0.0%) |
| Food Preparation & Serving | 0 (0.0%) | 7 (100.0%) |
| Cleaning & Maintenance | 3 (75.0%) | 1 (25.0%) |
| Personal Care & Service | 0 (0.0%) | 0 (0.0%) |
| Total (Category) | 19 (61.3%) | 12 (38.7%) |
| Total (Overall) | 177 (64.4%) | 98 (35.6%) |
Sales and Office Occupations
The most common Sales and Office occupations in Doon are Office & Administration (29 | 10.5%), and Sales & Related (22 | 8.0%).
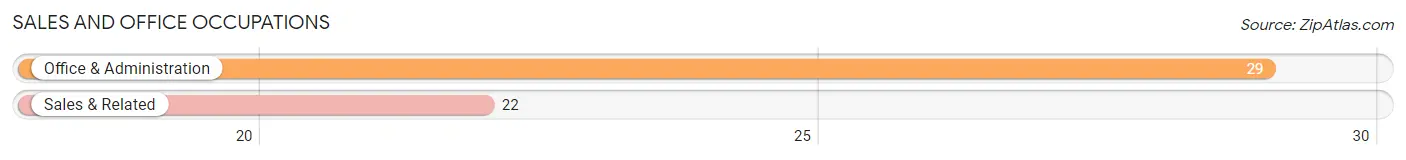
Sales and Office Occupations by Sex
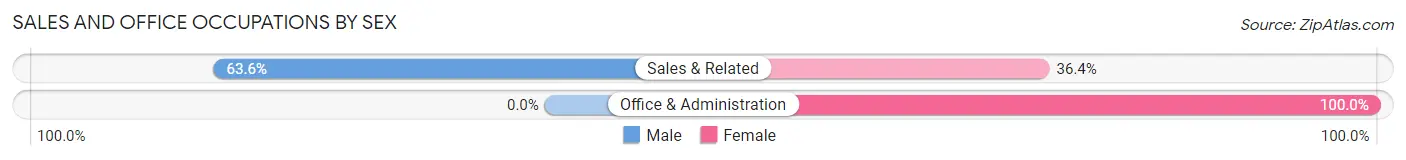
| Occupation | Male | Female |
| Sales & Related | 14 (63.6%) | 8 (36.4%) |
| Office & Administration | 0 (0.0%) | 29 (100.0%) |
| Total (Category) | 14 (27.5%) | 37 (72.6%) |
| Total (Overall) | 177 (64.4%) | 98 (35.6%) |
Natural Resources, Construction and Maintenance Occupations
The most common Natural Resources, Construction and Maintenance occupations in Doon are Construction & Extraction (34 | 12.4%), Installation, Maintenance & Repair (30 | 10.9%), and Farming, Fishing & Forestry (1 | 0.4%).
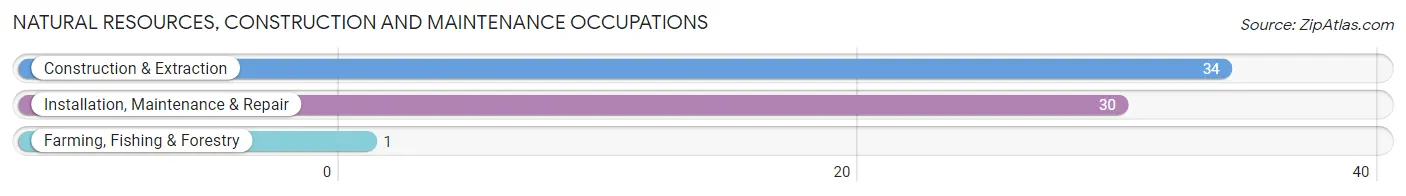
Natural Resources, Construction and Maintenance Occupations by Sex
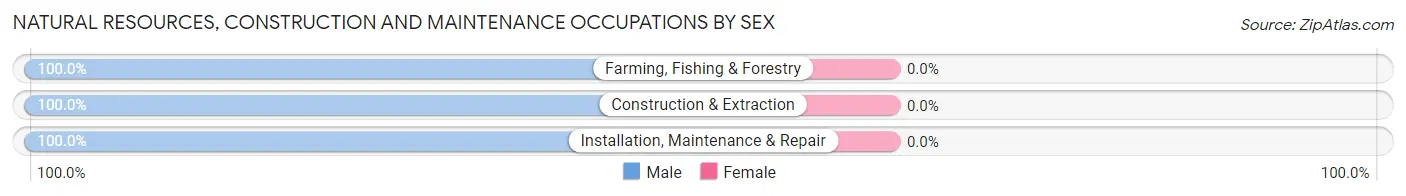
| Occupation | Male | Female |
| Farming, Fishing & Forestry | 1 (100.0%) | 0 (0.0%) |
| Construction & Extraction | 34 (100.0%) | 0 (0.0%) |
| Installation, Maintenance & Repair | 30 (100.0%) | 0 (0.0%) |
| Total (Category) | 65 (100.0%) | 0 (0.0%) |
| Total (Overall) | 177 (64.4%) | 98 (35.6%) |
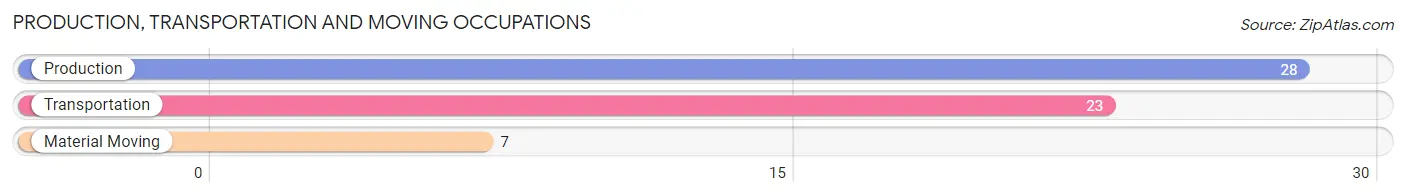
Production, Transportation and Moving Occupations
The most common Production, Transportation and Moving occupations in Doon are Production (28 | 10.2%), Transportation (23 | 8.4%), and Material Moving (7 | 2.5%).
Production, Transportation and Moving Occupations by Sex
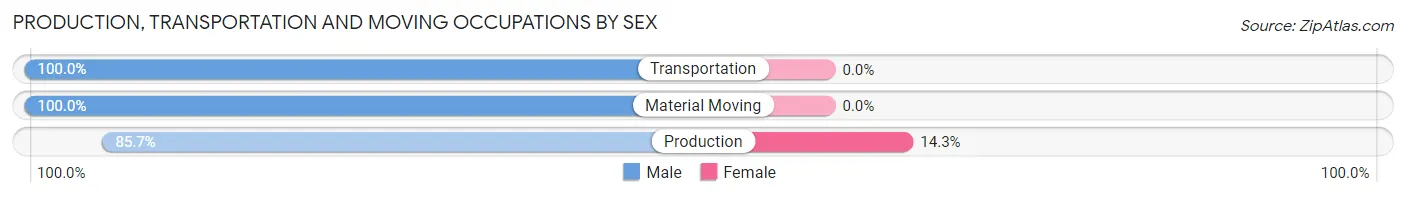
| Occupation | Male | Female |
| Production | 24 (85.7%) | 4 (14.3%) |
| Transportation | 23 (100.0%) | 0 (0.0%) |
| Material Moving | 7 (100.0%) | 0 (0.0%) |
| Total (Category) | 54 (93.1%) | 4 (6.9%) |
| Total (Overall) | 177 (64.4%) | 98 (35.6%) |
Employment Industries by Sex in Doon
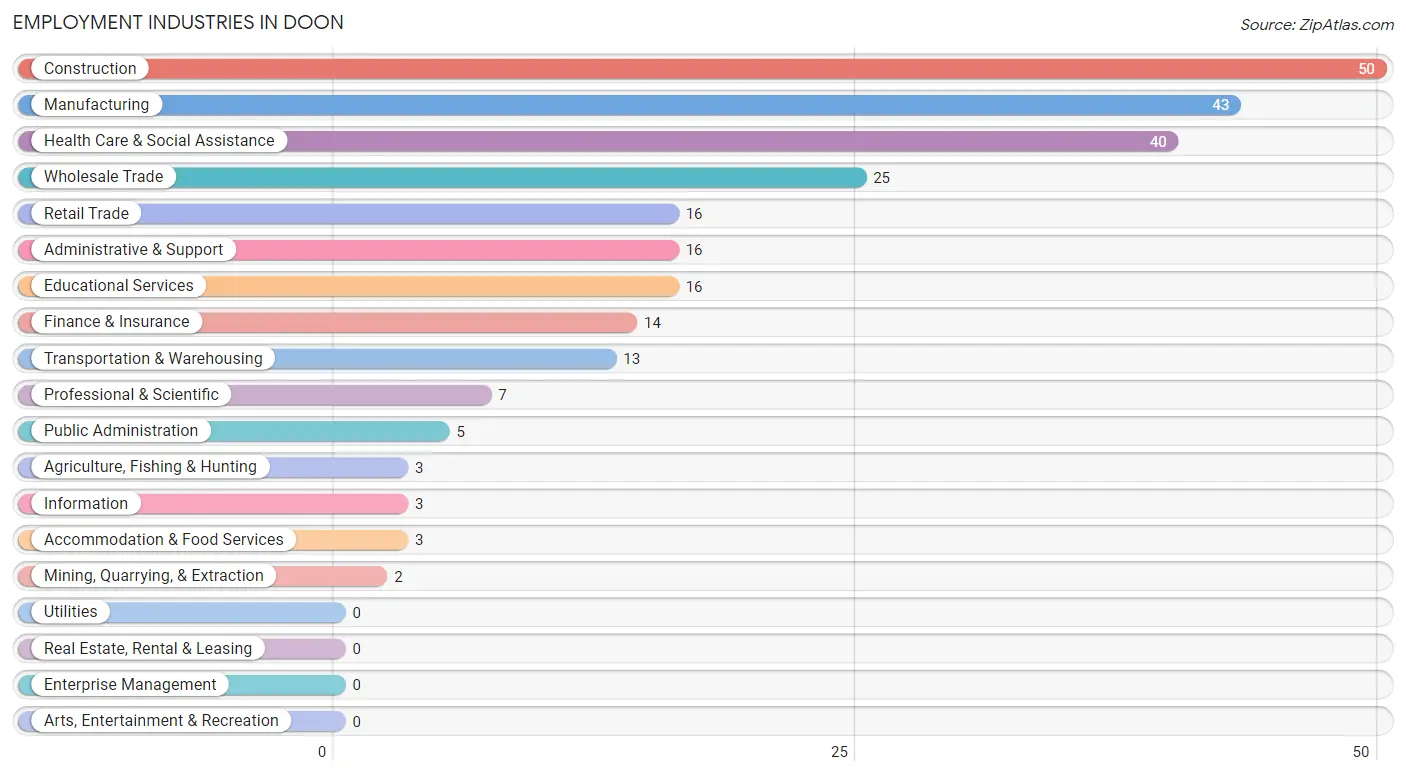
Employment Industries in Doon
The major employment industries in Doon include Construction (50 | 18.2%), Manufacturing (43 | 15.6%), Health Care & Social Assistance (40 | 14.5%), Wholesale Trade (25 | 9.1%), and Retail Trade (16 | 5.8%).
Employment Industries by Sex in Doon
The Doon industries that see more men than women are Agriculture, Fishing & Hunting (100.0%), Mining, Quarrying, & Extraction (100.0%), and Construction (100.0%), whereas the industries that tend to have a higher number of women are Information (100.0%), Finance & Insurance (100.0%), and Educational Services (100.0%).
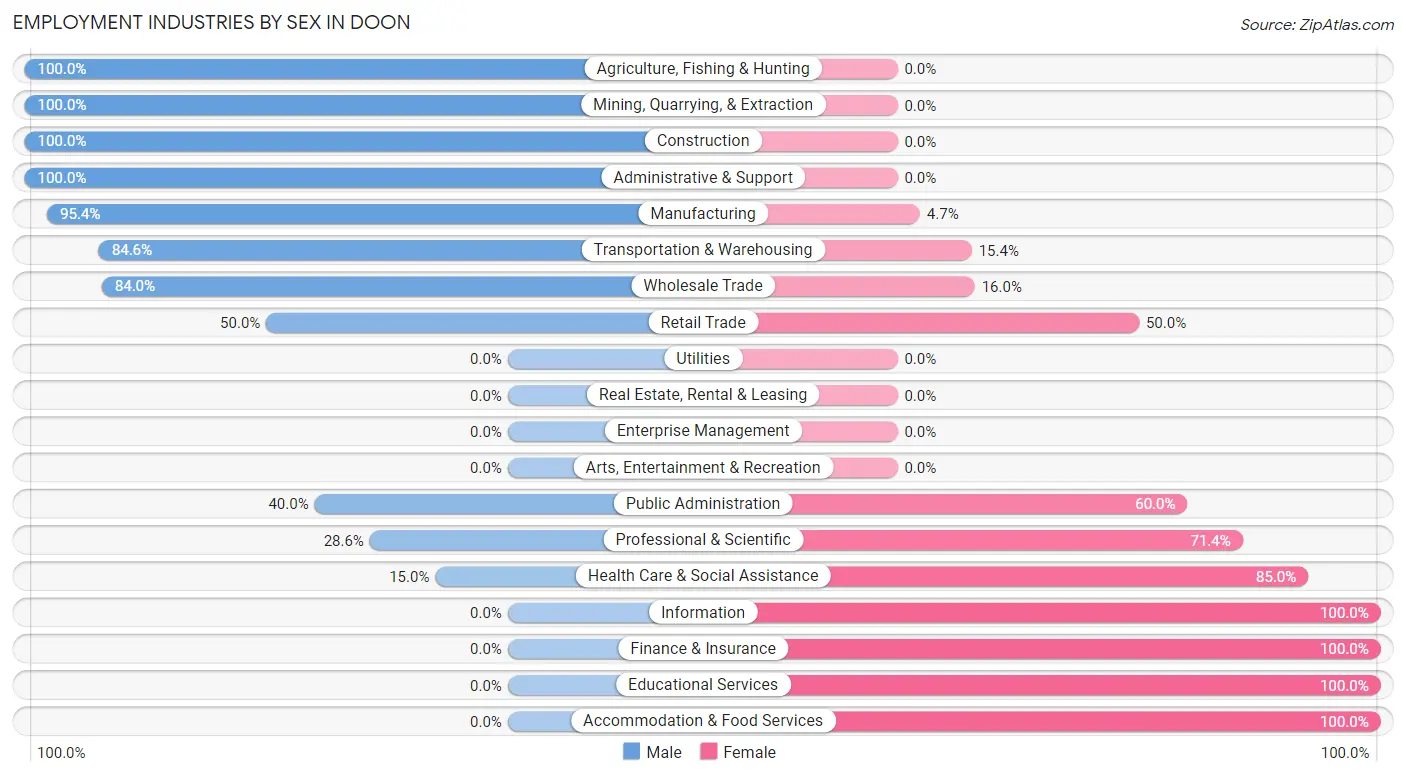
| Industry | Male | Female |
| Agriculture, Fishing & Hunting | 3 (100.0%) | 0 (0.0%) |
| Mining, Quarrying, & Extraction | 2 (100.0%) | 0 (0.0%) |
| Construction | 50 (100.0%) | 0 (0.0%) |
| Manufacturing | 41 (95.4%) | 2 (4.6%) |
| Wholesale Trade | 21 (84.0%) | 4 (16.0%) |
| Retail Trade | 8 (50.0%) | 8 (50.0%) |
| Transportation & Warehousing | 11 (84.6%) | 2 (15.4%) |
| Utilities | 0 (0.0%) | 0 (0.0%) |
| Information | 0 (0.0%) | 3 (100.0%) |
| Finance & Insurance | 0 (0.0%) | 14 (100.0%) |
| Real Estate, Rental & Leasing | 0 (0.0%) | 0 (0.0%) |
| Professional & Scientific | 2 (28.6%) | 5 (71.4%) |
| Enterprise Management | 0 (0.0%) | 0 (0.0%) |
| Administrative & Support | 16 (100.0%) | 0 (0.0%) |
| Educational Services | 0 (0.0%) | 16 (100.0%) |
| Health Care & Social Assistance | 6 (15.0%) | 34 (85.0%) |
| Arts, Entertainment & Recreation | 0 (0.0%) | 0 (0.0%) |
| Accommodation & Food Services | 0 (0.0%) | 3 (100.0%) |
| Public Administration | 2 (40.0%) | 3 (60.0%) |
| Total | 177 (64.4%) | 98 (35.6%) |
Education in Doon
School Enrollment in Doon
The most common levels of schooling among the 157 students in Doon are middle school (42 | 26.8%), elementary school (40 | 25.5%), and high school (39 | 24.8%).
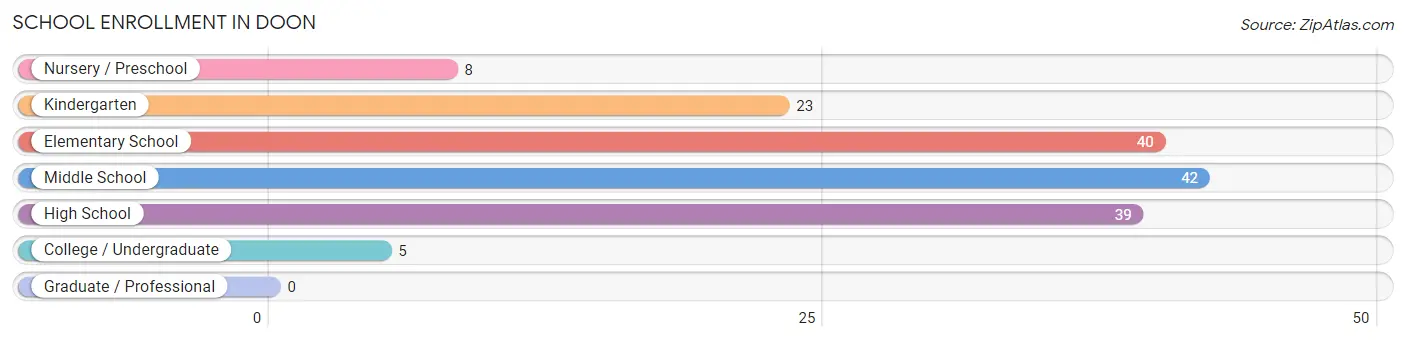
| School Level | # Students | % Students |
| Nursery / Preschool | 8 | 5.1% |
| Kindergarten | 23 | 14.6% |
| Elementary School | 40 | 25.5% |
| Middle School | 42 | 26.8% |
| High School | 39 | 24.8% |
| College / Undergraduate | 5 | 3.2% |
| Graduate / Professional | 0 | 0.0% |
| Total | 157 | 100.0% |
School Enrollment by Age by Funding Source in Doon
Out of a total of 157 students who are enrolled in schools in Doon, 73 (46.5%) attend a private institution, while the remaining 84 (53.5%) are enrolled in public schools. The age group of 3 to 4 year olds has the highest likelihood of being enrolled in private schools, with 3 (100.0% in the age bracket) enrolled. Conversely, the age group of 18 to 19 year olds has the lowest likelihood of being enrolled in a private school, with 5 (62.5% in the age bracket) attending a public institution.
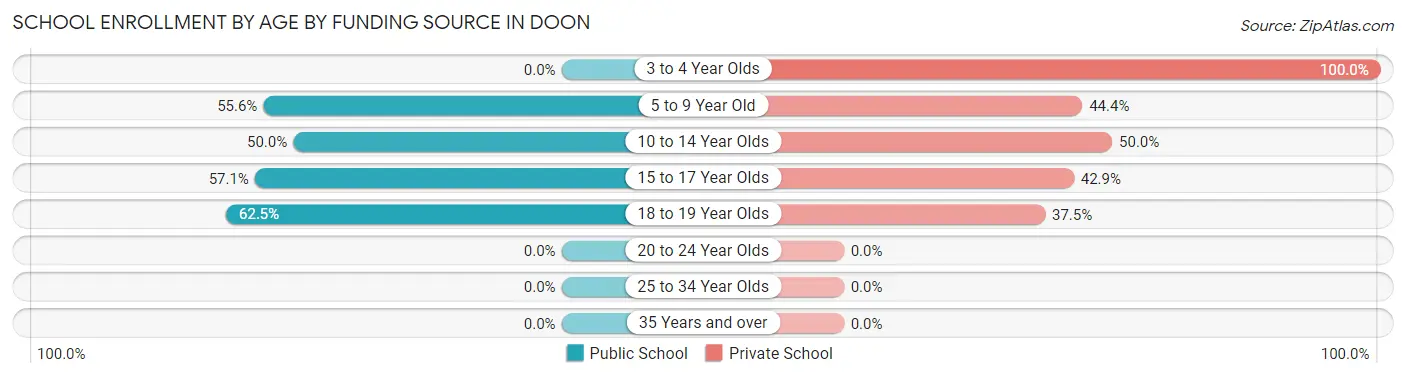
| Age Bracket | Public School | Private School |
| 3 to 4 Year Olds | 0 (0.0%) | 3 (100.0%) |
| 5 to 9 Year Old | 35 (55.6%) | 28 (44.4%) |
| 10 to 14 Year Olds | 24 (50.0%) | 24 (50.0%) |
| 15 to 17 Year Olds | 20 (57.1%) | 15 (42.9%) |
| 18 to 19 Year Olds | 5 (62.5%) | 3 (37.5%) |
| 20 to 24 Year Olds | 0 (0.0%) | 0 (0.0%) |
| 25 to 34 Year Olds | 0 (0.0%) | 0 (0.0%) |
| 35 Years and over | 0 (0.0%) | 0 (0.0%) |
| Total | 84 (53.5%) | 73 (46.5%) |
Educational Attainment by Field of Study in Doon
Education (18 | 40.9%), science & technology (13 | 29.5%), business (5 | 11.4%), arts & humanities (4 | 9.1%), and engineering (2 | 4.5%) are the most common fields of study among 44 individuals in Doon who have obtained a bachelor's degree or higher.
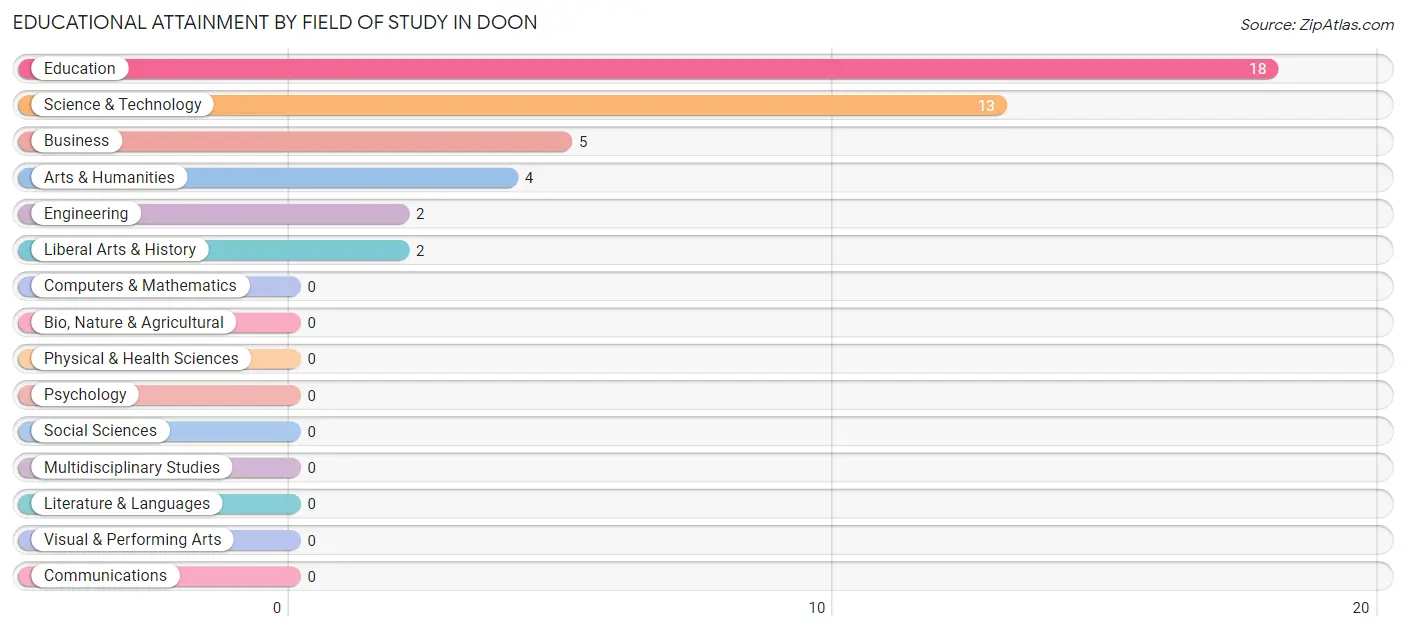
| Field of Study | # Graduates | % Graduates |
| Computers & Mathematics | 0 | 0.0% |
| Bio, Nature & Agricultural | 0 | 0.0% |
| Physical & Health Sciences | 0 | 0.0% |
| Psychology | 0 | 0.0% |
| Social Sciences | 0 | 0.0% |
| Engineering | 2 | 4.5% |
| Multidisciplinary Studies | 0 | 0.0% |
| Science & Technology | 13 | 29.5% |
| Business | 5 | 11.4% |
| Education | 18 | 40.9% |
| Literature & Languages | 0 | 0.0% |
| Liberal Arts & History | 2 | 4.5% |
| Visual & Performing Arts | 0 | 0.0% |
| Communications | 0 | 0.0% |
| Arts & Humanities | 4 | 9.1% |
| Total | 44 | 100.0% |
Transportation & Commute in Doon
Vehicle Availability by Sex in Doon
The most prevalent vehicle ownership categories in Doon are males with 4 vehicles (53, accounting for 29.9%) and females with 4 vehicles (20, making up 55.2%).
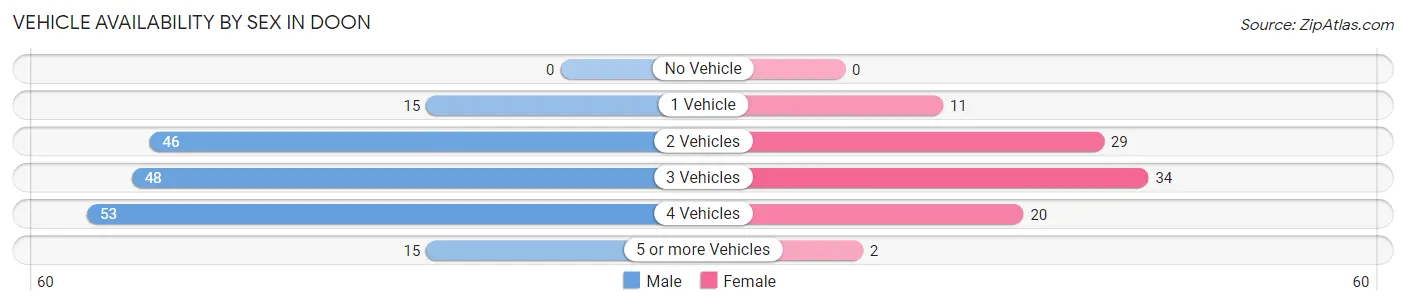
| Vehicles Available | Male | Female |
| No Vehicle | 0 (0.0%) | 0 (0.0%) |
| 1 Vehicle | 15 (8.5%) | 11 (11.5%) |
| 2 Vehicles | 46 (26.0%) | 29 (30.2%) |
| 3 Vehicles | 48 (27.1%) | 34 (35.4%) |
| 4 Vehicles | 53 (29.9%) | 20 (20.8%) |
| 5 or more Vehicles | 15 (8.5%) | 2 (2.1%) |
| Total | 177 (100.0%) | 96 (100.0%) |
Commute Time in Doon
The most frequently occuring commute durations in Doon are less than 5 minutes (62 commuters, 22.9%), 10 to 14 minutes (58 commuters, 21.4%), and 15 to 19 minutes (50 commuters, 18.4%).
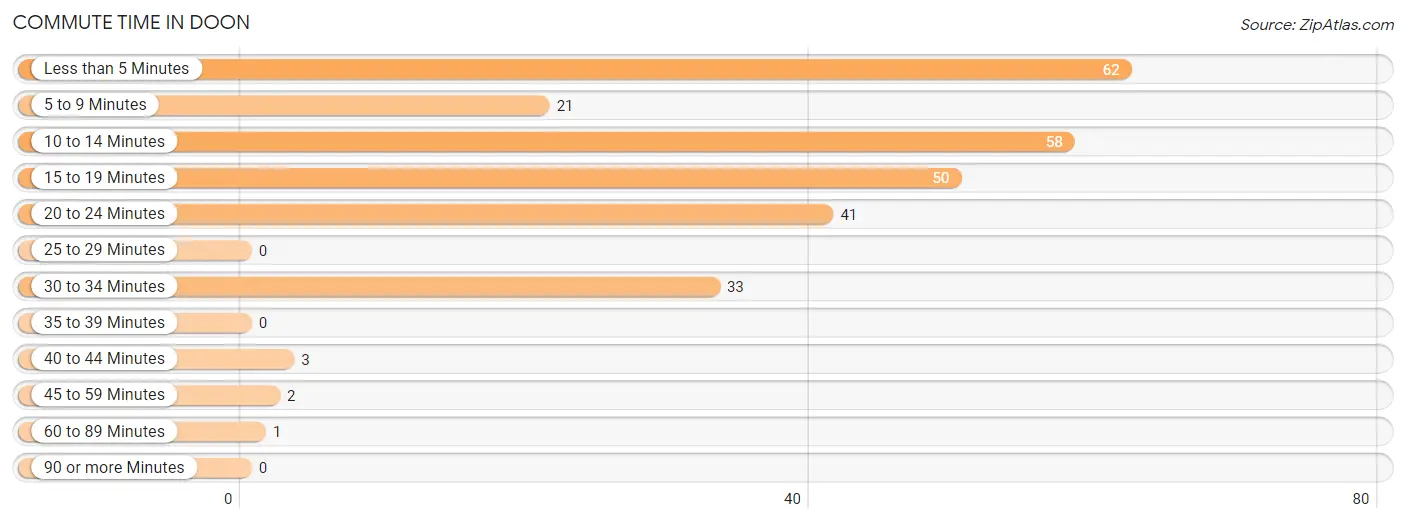
| Commute Time | # Commuters | % Commuters |
| Less than 5 Minutes | 62 | 22.9% |
| 5 to 9 Minutes | 21 | 7.7% |
| 10 to 14 Minutes | 58 | 21.4% |
| 15 to 19 Minutes | 50 | 18.4% |
| 20 to 24 Minutes | 41 | 15.1% |
| 25 to 29 Minutes | 0 | 0.0% |
| 30 to 34 Minutes | 33 | 12.2% |
| 35 to 39 Minutes | 0 | 0.0% |
| 40 to 44 Minutes | 3 | 1.1% |
| 45 to 59 Minutes | 2 | 0.7% |
| 60 to 89 Minutes | 1 | 0.4% |
| 90 or more Minutes | 0 | 0.0% |
Commute Time by Sex in Doon
The most common commute times in Doon are less than 5 minutes (51 commuters, 28.8%) for males and 20 to 24 minutes (25 commuters, 26.6%) for females.
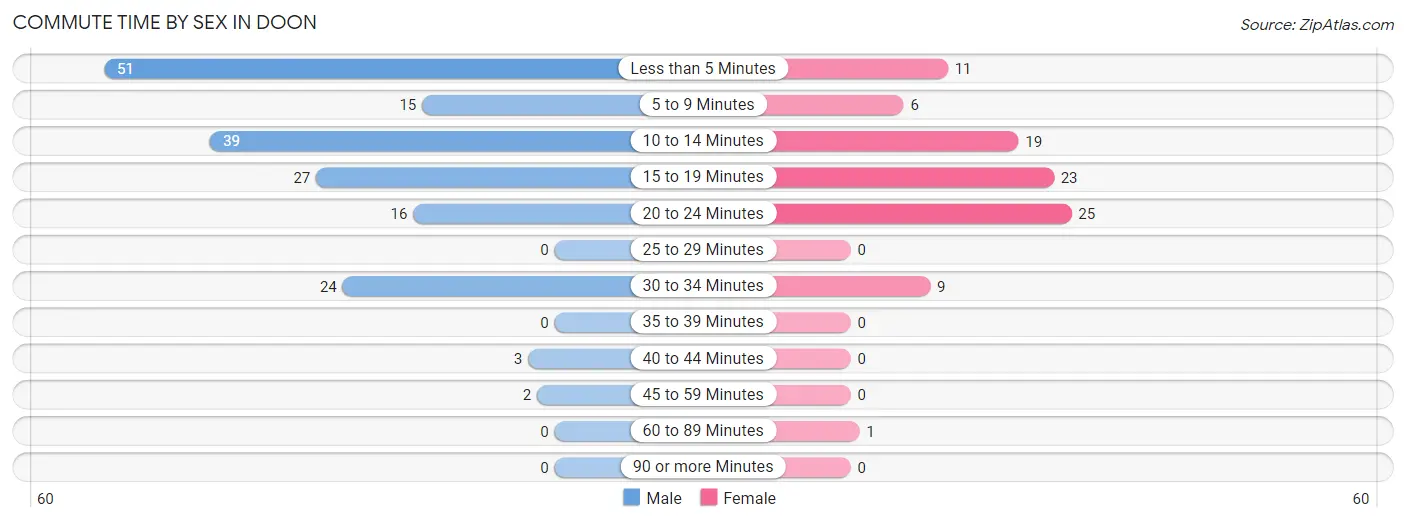
| Commute Time | Male | Female |
| Less than 5 Minutes | 51 (28.8%) | 11 (11.7%) |
| 5 to 9 Minutes | 15 (8.5%) | 6 (6.4%) |
| 10 to 14 Minutes | 39 (22.0%) | 19 (20.2%) |
| 15 to 19 Minutes | 27 (15.2%) | 23 (24.5%) |
| 20 to 24 Minutes | 16 (9.0%) | 25 (26.6%) |
| 25 to 29 Minutes | 0 (0.0%) | 0 (0.0%) |
| 30 to 34 Minutes | 24 (13.6%) | 9 (9.6%) |
| 35 to 39 Minutes | 0 (0.0%) | 0 (0.0%) |
| 40 to 44 Minutes | 3 (1.7%) | 0 (0.0%) |
| 45 to 59 Minutes | 2 (1.1%) | 0 (0.0%) |
| 60 to 89 Minutes | 0 (0.0%) | 1 (1.1%) |
| 90 or more Minutes | 0 (0.0%) | 0 (0.0%) |
Time of Departure to Work by Sex in Doon
The most frequent times of departure to work in Doon are 6:30 AM to 6:59 AM (53, 29.9%) for males and 7:30 AM to 7:59 AM (30, 31.9%) for females.
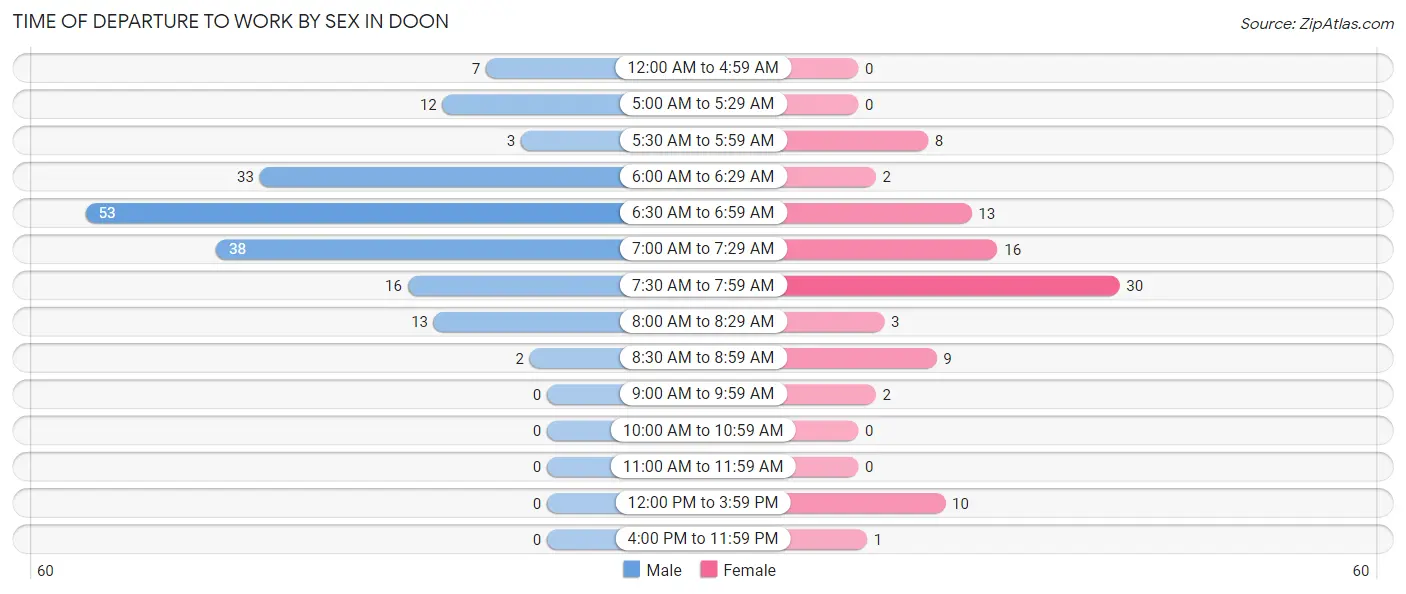
| Time of Departure | Male | Female |
| 12:00 AM to 4:59 AM | 7 (4.0%) | 0 (0.0%) |
| 5:00 AM to 5:29 AM | 12 (6.8%) | 0 (0.0%) |
| 5:30 AM to 5:59 AM | 3 (1.7%) | 8 (8.5%) |
| 6:00 AM to 6:29 AM | 33 (18.6%) | 2 (2.1%) |
| 6:30 AM to 6:59 AM | 53 (29.9%) | 13 (13.8%) |
| 7:00 AM to 7:29 AM | 38 (21.5%) | 16 (17.0%) |
| 7:30 AM to 7:59 AM | 16 (9.0%) | 30 (31.9%) |
| 8:00 AM to 8:29 AM | 13 (7.3%) | 3 (3.2%) |
| 8:30 AM to 8:59 AM | 2 (1.1%) | 9 (9.6%) |
| 9:00 AM to 9:59 AM | 0 (0.0%) | 2 (2.1%) |
| 10:00 AM to 10:59 AM | 0 (0.0%) | 0 (0.0%) |
| 11:00 AM to 11:59 AM | 0 (0.0%) | 0 (0.0%) |
| 12:00 PM to 3:59 PM | 0 (0.0%) | 10 (10.6%) |
| 4:00 PM to 11:59 PM | 0 (0.0%) | 1 (1.1%) |
| Total | 177 (100.0%) | 94 (100.0%) |
Housing Occupancy in Doon
Occupancy by Ownership in Doon
Of the total 222 dwellings in Doon, owner-occupied units account for 202 (91.0%), while renter-occupied units make up 20 (9.0%).
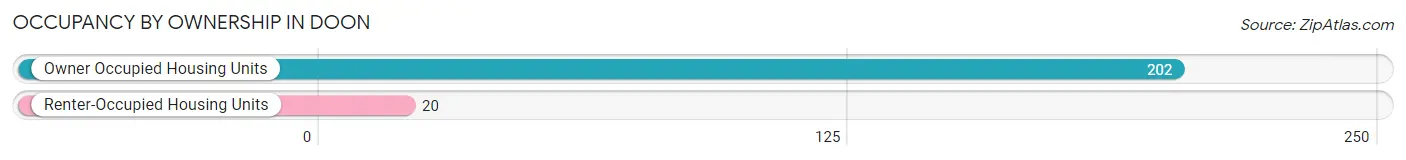
| Occupancy | # Housing Units | % Housing Units |
| Owner Occupied Housing Units | 202 | 91.0% |
| Renter-Occupied Housing Units | 20 | 9.0% |
| Total Occupied Housing Units | 222 | 100.0% |
Occupancy by Household Size in Doon
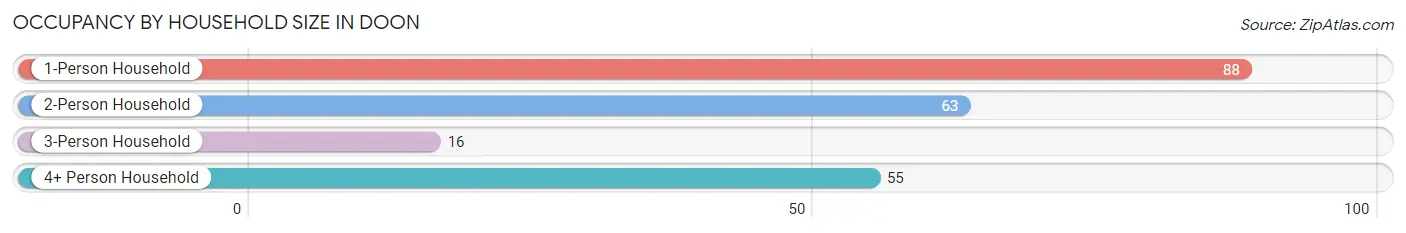
| Household Size | # Housing Units | % Housing Units |
| 1-Person Household | 88 | 39.6% |
| 2-Person Household | 63 | 28.4% |
| 3-Person Household | 16 | 7.2% |
| 4+ Person Household | 55 | 24.8% |
| Total Housing Units | 222 | 100.0% |
Occupancy by Ownership by Household Size in Doon
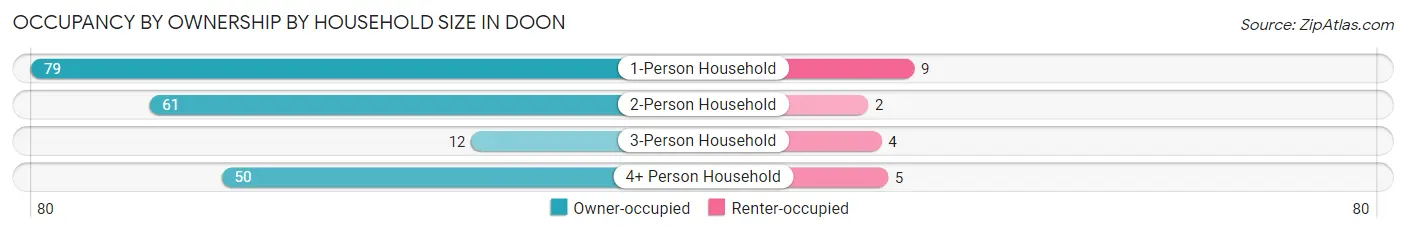
| Household Size | Owner-occupied | Renter-occupied |
| 1-Person Household | 79 (89.8%) | 9 (10.2%) |
| 2-Person Household | 61 (96.8%) | 2 (3.2%) |
| 3-Person Household | 12 (75.0%) | 4 (25.0%) |
| 4+ Person Household | 50 (90.9%) | 5 (9.1%) |
| Total Housing Units | 202 (91.0%) | 20 (9.0%) |
Occupancy by Educational Attainment in Doon
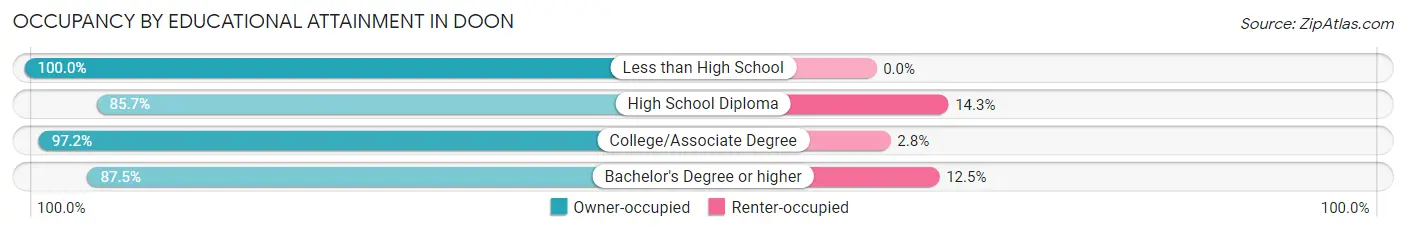
| Household Size | Owner-occupied | Renter-occupied |
| Less than High School | 21 (100.0%) | 0 (0.0%) |
| High School Diploma | 84 (85.7%) | 14 (14.3%) |
| College/Associate Degree | 69 (97.2%) | 2 (2.8%) |
| Bachelor's Degree or higher | 28 (87.5%) | 4 (12.5%) |
Occupancy by Age of Householder in Doon
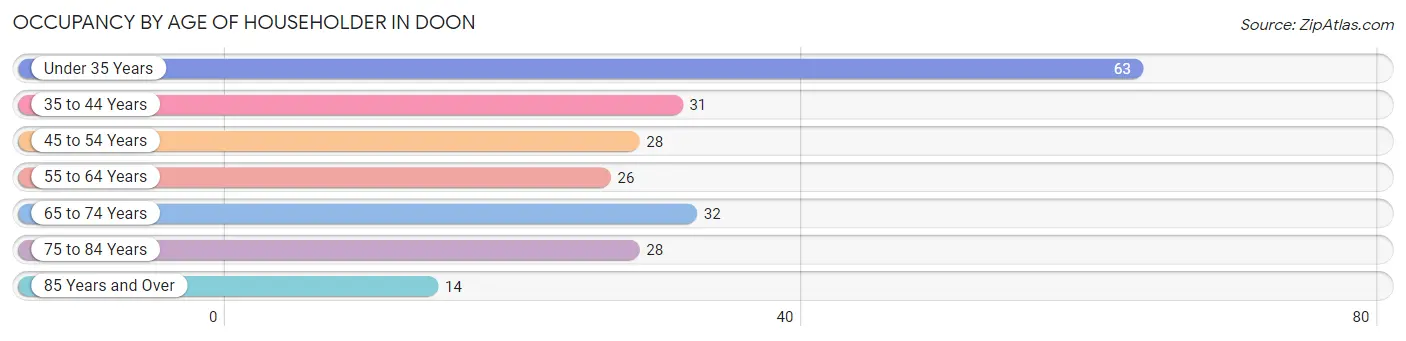
| Age Bracket | # Households | % Households |
| Under 35 Years | 63 | 28.4% |
| 35 to 44 Years | 31 | 14.0% |
| 45 to 54 Years | 28 | 12.6% |
| 55 to 64 Years | 26 | 11.7% |
| 65 to 74 Years | 32 | 14.4% |
| 75 to 84 Years | 28 | 12.6% |
| 85 Years and Over | 14 | 6.3% |
| Total | 222 | 100.0% |
Housing Finances in Doon
Median Income by Occupancy in Doon
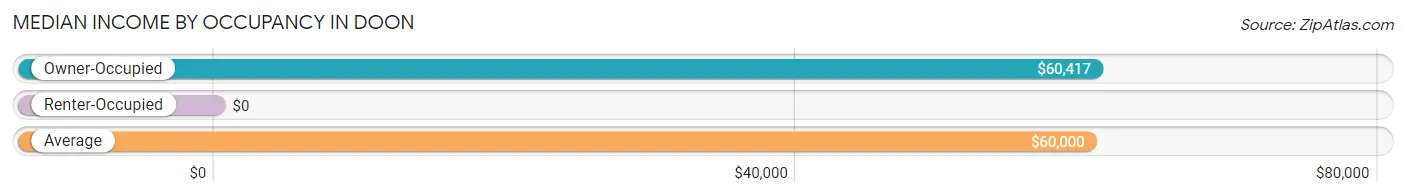
| Occupancy Type | # Households | Median Income |
| Owner-Occupied | 202 (91.0%) | $60,417 |
| Renter-Occupied | 20 (9.0%) | $0 |
| Average | 222 (100.0%) | $60,000 |
Occupancy by Householder Income Bracket in Doon
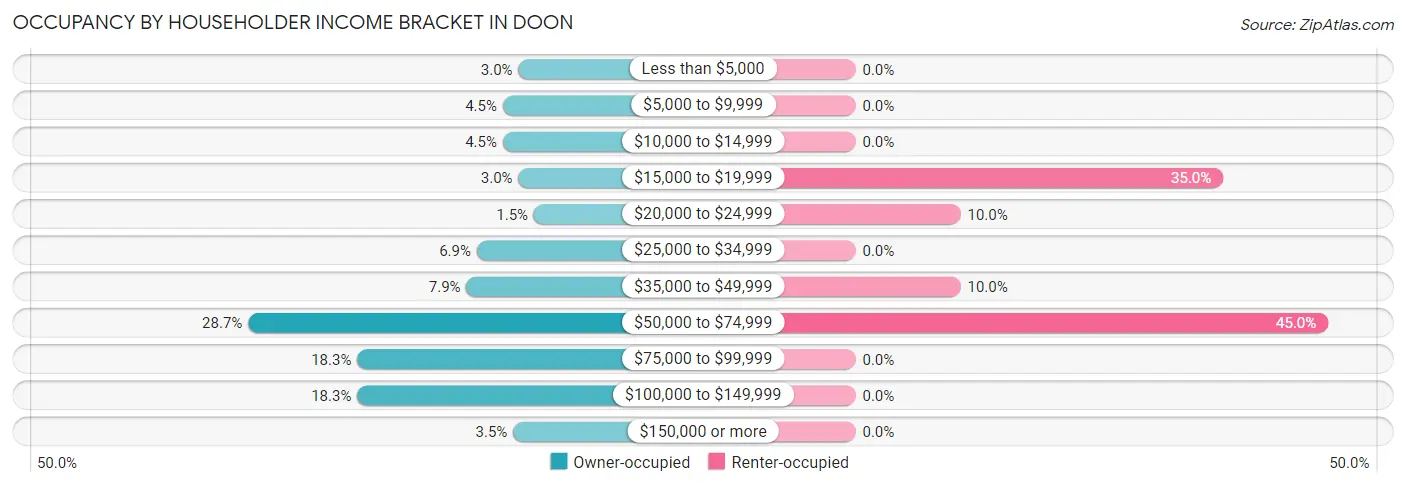
| Income Bracket | Owner-occupied | Renter-occupied |
| Less than $5,000 | 6 (3.0%) | 0 (0.0%) |
| $5,000 to $9,999 | 9 (4.5%) | 0 (0.0%) |
| $10,000 to $14,999 | 9 (4.5%) | 0 (0.0%) |
| $15,000 to $19,999 | 6 (3.0%) | 7 (35.0%) |
| $20,000 to $24,999 | 3 (1.5%) | 2 (10.0%) |
| $25,000 to $34,999 | 14 (6.9%) | 0 (0.0%) |
| $35,000 to $49,999 | 16 (7.9%) | 2 (10.0%) |
| $50,000 to $74,999 | 58 (28.7%) | 9 (45.0%) |
| $75,000 to $99,999 | 37 (18.3%) | 0 (0.0%) |
| $100,000 to $149,999 | 37 (18.3%) | 0 (0.0%) |
| $150,000 or more | 7 (3.5%) | 0 (0.0%) |
| Total | 202 (100.0%) | 20 (100.0%) |
Monthly Housing Cost Tiers in Doon
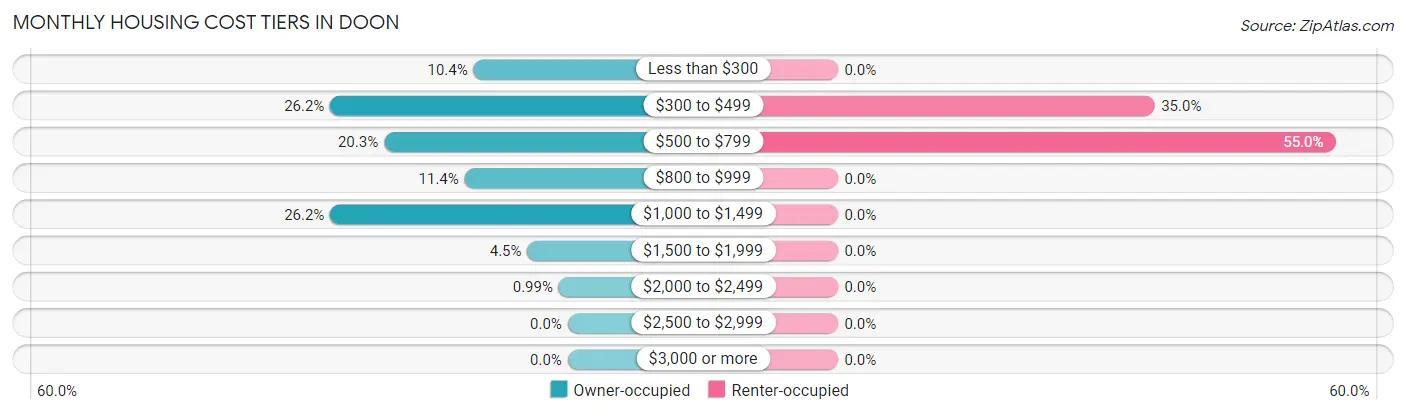
| Monthly Cost | Owner-occupied | Renter-occupied |
| Less than $300 | 21 (10.4%) | 0 (0.0%) |
| $300 to $499 | 53 (26.2%) | 7 (35.0%) |
| $500 to $799 | 41 (20.3%) | 11 (55.0%) |
| $800 to $999 | 23 (11.4%) | 0 (0.0%) |
| $1,000 to $1,499 | 53 (26.2%) | 0 (0.0%) |
| $1,500 to $1,999 | 9 (4.5%) | 0 (0.0%) |
| $2,000 to $2,499 | 2 (1.0%) | 0 (0.0%) |
| $2,500 to $2,999 | 0 (0.0%) | 0 (0.0%) |
| $3,000 or more | 0 (0.0%) | 0 (0.0%) |
| Total | 202 (100.0%) | 20 (100.0%) |
Physical Housing Characteristics in Doon
Housing Structures in Doon
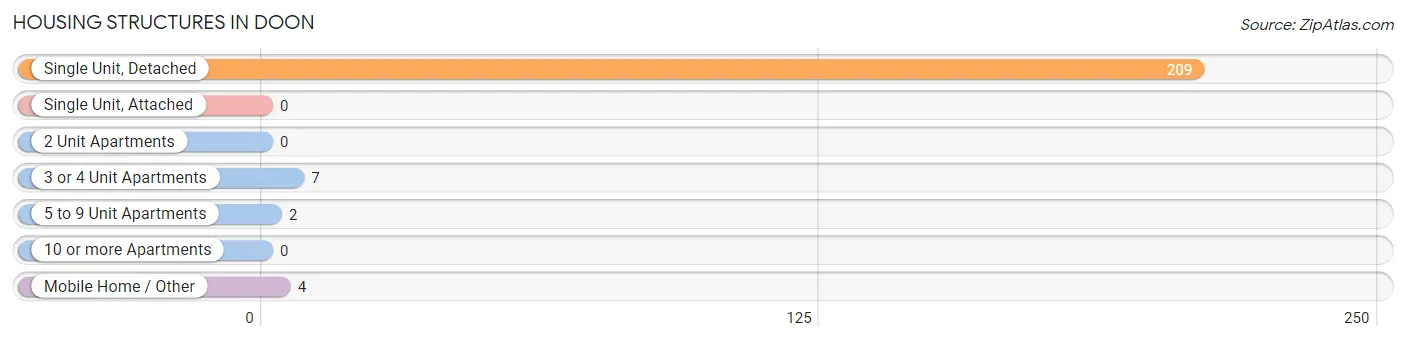
| Structure Type | # Housing Units | % Housing Units |
| Single Unit, Detached | 209 | 94.1% |
| Single Unit, Attached | 0 | 0.0% |
| 2 Unit Apartments | 0 | 0.0% |
| 3 or 4 Unit Apartments | 7 | 3.2% |
| 5 to 9 Unit Apartments | 2 | 0.9% |
| 10 or more Apartments | 0 | 0.0% |
| Mobile Home / Other | 4 | 1.8% |
| Total | 222 | 100.0% |
Housing Structures by Occupancy in Doon
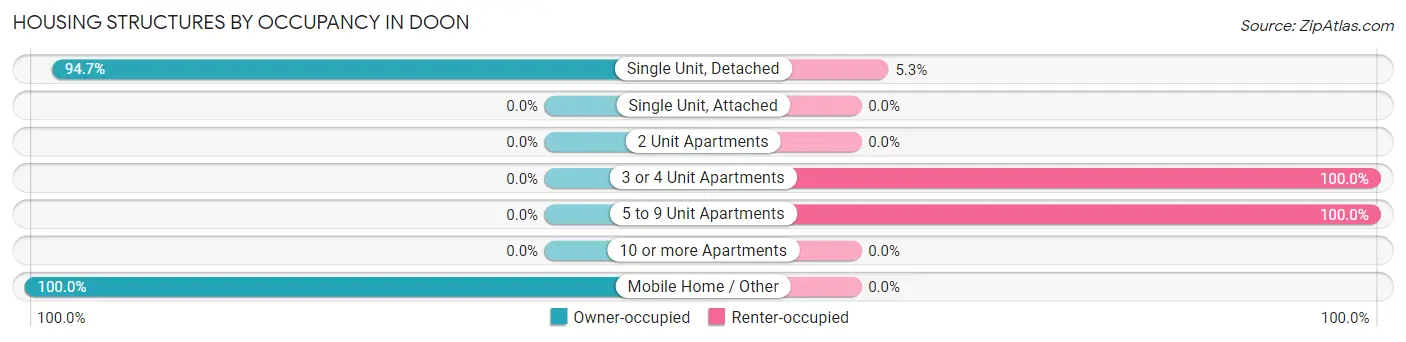
| Structure Type | Owner-occupied | Renter-occupied |
| Single Unit, Detached | 198 (94.7%) | 11 (5.3%) |
| Single Unit, Attached | 0 (0.0%) | 0 (0.0%) |
| 2 Unit Apartments | 0 (0.0%) | 0 (0.0%) |
| 3 or 4 Unit Apartments | 0 (0.0%) | 7 (100.0%) |
| 5 to 9 Unit Apartments | 0 (0.0%) | 2 (100.0%) |
| 10 or more Apartments | 0 (0.0%) | 0 (0.0%) |
| Mobile Home / Other | 4 (100.0%) | 0 (0.0%) |
| Total | 202 (91.0%) | 20 (9.0%) |
Housing Structures by Number of Rooms in Doon
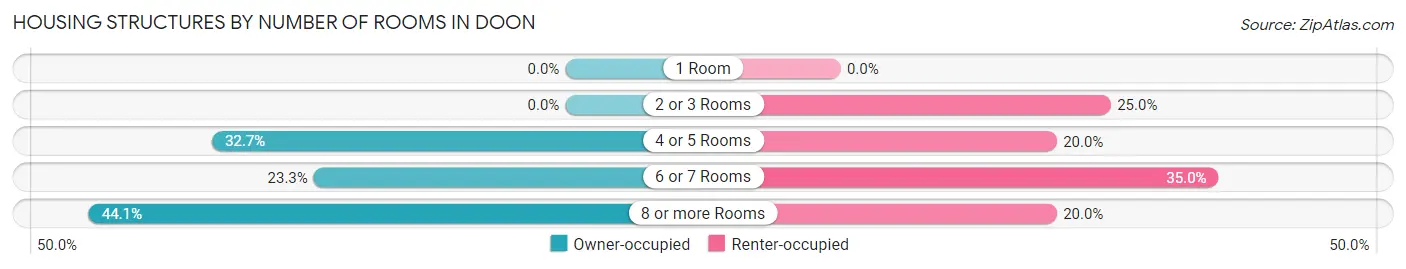
| Number of Rooms | Owner-occupied | Renter-occupied |
| 1 Room | 0 (0.0%) | 0 (0.0%) |
| 2 or 3 Rooms | 0 (0.0%) | 5 (25.0%) |
| 4 or 5 Rooms | 66 (32.7%) | 4 (20.0%) |
| 6 or 7 Rooms | 47 (23.3%) | 7 (35.0%) |
| 8 or more Rooms | 89 (44.1%) | 4 (20.0%) |
| Total | 202 (100.0%) | 20 (100.0%) |
Housing Structure by Heating Type in Doon
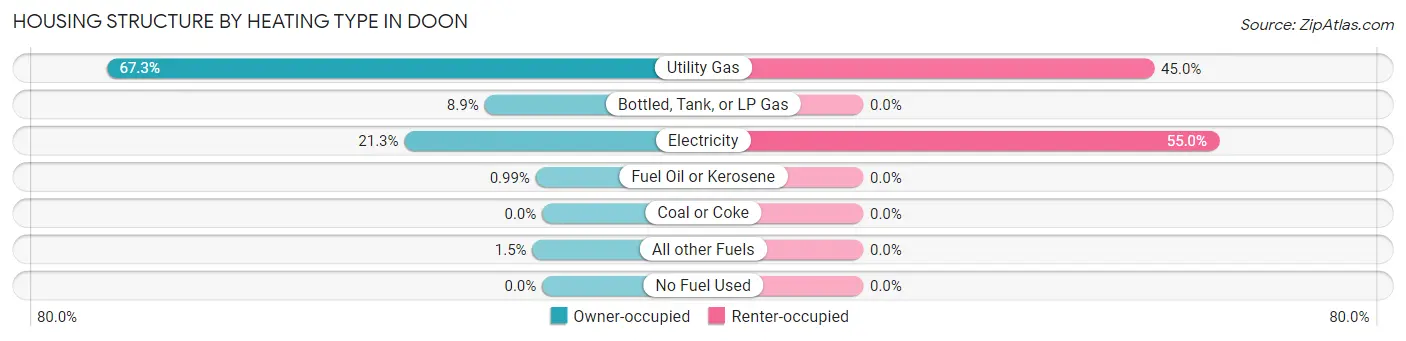
| Heating Type | Owner-occupied | Renter-occupied |
| Utility Gas | 136 (67.3%) | 9 (45.0%) |
| Bottled, Tank, or LP Gas | 18 (8.9%) | 0 (0.0%) |
| Electricity | 43 (21.3%) | 11 (55.0%) |
| Fuel Oil or Kerosene | 2 (1.0%) | 0 (0.0%) |
| Coal or Coke | 0 (0.0%) | 0 (0.0%) |
| All other Fuels | 3 (1.5%) | 0 (0.0%) |
| No Fuel Used | 0 (0.0%) | 0 (0.0%) |
| Total | 202 (100.0%) | 20 (100.0%) |
Household Vehicle Usage in Doon
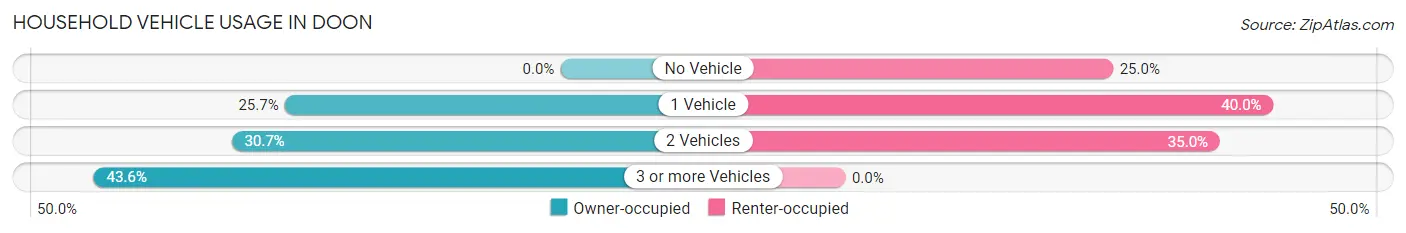
| Vehicles per Household | Owner-occupied | Renter-occupied |
| No Vehicle | 0 (0.0%) | 5 (25.0%) |
| 1 Vehicle | 52 (25.7%) | 8 (40.0%) |
| 2 Vehicles | 62 (30.7%) | 7 (35.0%) |
| 3 or more Vehicles | 88 (43.6%) | 0 (0.0%) |
| Total | 202 (100.0%) | 20 (100.0%) |
Real Estate & Mortgages in Doon
Real Estate and Mortgage Overview in Doon
| Characteristic | Without Mortgage | With Mortgage |
| Housing Units | 102 | 100 |
| Median Property Value | $133,300 | $157,700 |
| Median Household Income | $51,786 | $7 |
| Monthly Housing Costs | $452 | $0 |
| Real Estate Taxes | $1,438 | $1 |
Property Value by Mortgage Status in Doon
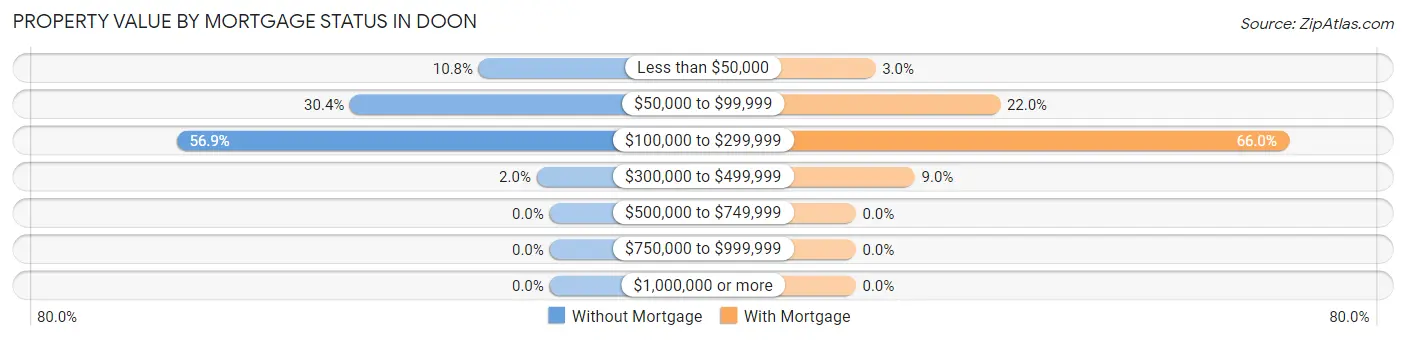
| Property Value | Without Mortgage | With Mortgage |
| Less than $50,000 | 11 (10.8%) | 3 (3.0%) |
| $50,000 to $99,999 | 31 (30.4%) | 22 (22.0%) |
| $100,000 to $299,999 | 58 (56.9%) | 66 (66.0%) |
| $300,000 to $499,999 | 2 (2.0%) | 9 (9.0%) |
| $500,000 to $749,999 | 0 (0.0%) | 0 (0.0%) |
| $750,000 to $999,999 | 0 (0.0%) | 0 (0.0%) |
| $1,000,000 or more | 0 (0.0%) | 0 (0.0%) |
| Total | 102 (100.0%) | 100 (100.0%) |
Household Income by Mortgage Status in Doon
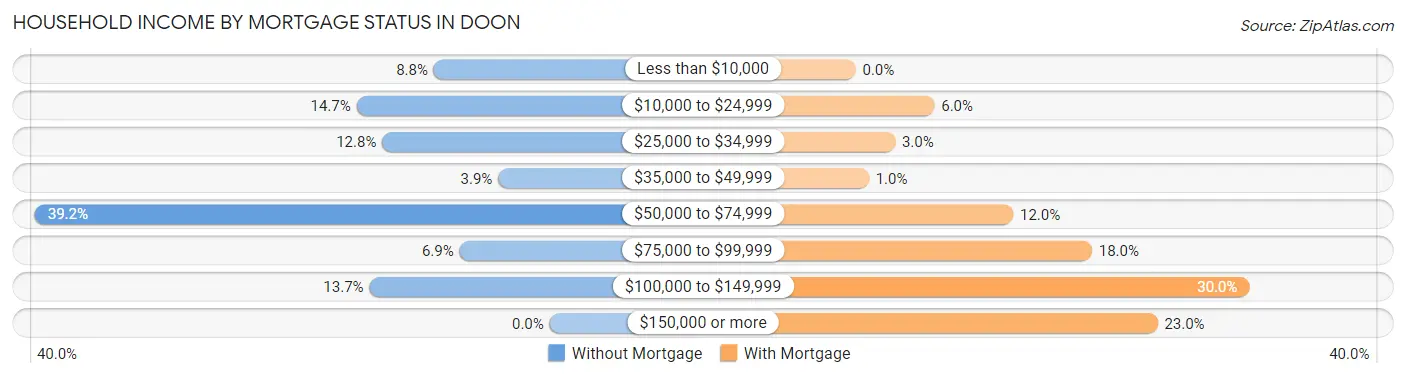
| Household Income | Without Mortgage | With Mortgage |
| Less than $10,000 | 9 (8.8%) | 0 (0.0%) |
| $10,000 to $24,999 | 15 (14.7%) | 6 (6.0%) |
| $25,000 to $34,999 | 13 (12.8%) | 3 (3.0%) |
| $35,000 to $49,999 | 4 (3.9%) | 1 (1.0%) |
| $50,000 to $74,999 | 40 (39.2%) | 12 (12.0%) |
| $75,000 to $99,999 | 7 (6.9%) | 18 (18.0%) |
| $100,000 to $149,999 | 14 (13.7%) | 30 (30.0%) |
| $150,000 or more | 0 (0.0%) | 23 (23.0%) |
| Total | 102 (100.0%) | 100 (100.0%) |
Property Value to Household Income Ratio in Doon
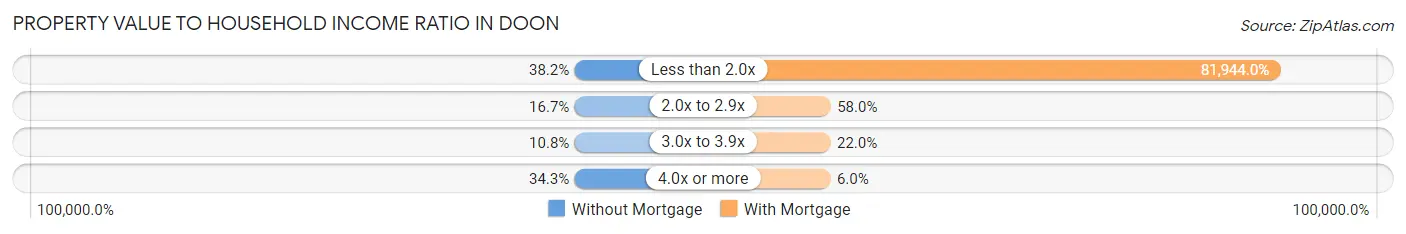
| Value-to-Income Ratio | Without Mortgage | With Mortgage |
| Less than 2.0x | 39 (38.2%) | 81,944 (81,944.0%) |
| 2.0x to 2.9x | 17 (16.7%) | 58 (58.0%) |
| 3.0x to 3.9x | 11 (10.8%) | 22 (22.0%) |
| 4.0x or more | 35 (34.3%) | 6 (6.0%) |
| Total | 102 (100.0%) | 100 (100.0%) |
Real Estate Taxes by Mortgage Status in Doon
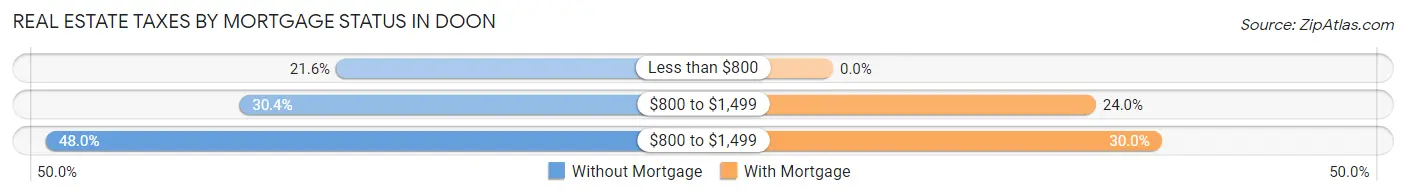
| Property Taxes | Without Mortgage | With Mortgage |
| Less than $800 | 22 (21.6%) | 0 (0.0%) |
| $800 to $1,499 | 31 (30.4%) | 24 (24.0%) |
| $800 to $1,499 | 49 (48.0%) | 30 (30.0%) |
| Total | 102 (100.0%) | 100 (100.0%) |
Health & Disability in Doon
Health Insurance Coverage by Age in Doon
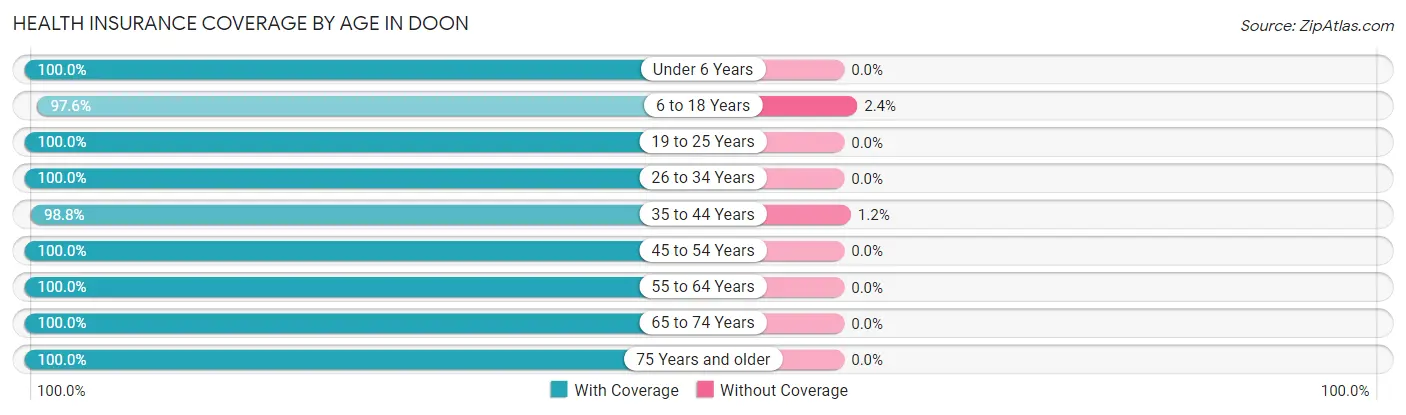
| Age Bracket | With Coverage | Without Coverage |
| Under 6 Years | 62 (100.0%) | 0 (0.0%) |
| 6 to 18 Years | 121 (97.6%) | 3 (2.4%) |
| 19 to 25 Years | 39 (100.0%) | 0 (0.0%) |
| 26 to 34 Years | 74 (100.0%) | 0 (0.0%) |
| 35 to 44 Years | 80 (98.8%) | 1 (1.2%) |
| 45 to 54 Years | 48 (100.0%) | 0 (0.0%) |
| 55 to 64 Years | 48 (100.0%) | 0 (0.0%) |
| 65 to 74 Years | 43 (100.0%) | 0 (0.0%) |
| 75 Years and older | 56 (100.0%) | 0 (0.0%) |
| Total | 571 (99.3%) | 4 (0.7%) |
Health Insurance Coverage by Citizenship Status in Doon
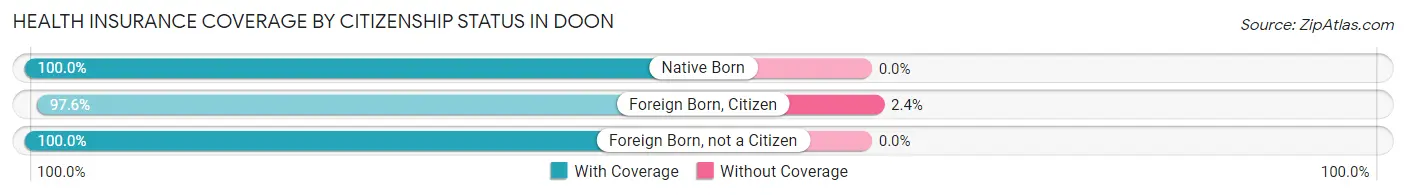
| Citizenship Status | With Coverage | Without Coverage |
| Native Born | 62 (100.0%) | 0 (0.0%) |
| Foreign Born, Citizen | 121 (97.6%) | 3 (2.4%) |
| Foreign Born, not a Citizen | 39 (100.0%) | 0 (0.0%) |
Health Insurance Coverage by Household Income in Doon
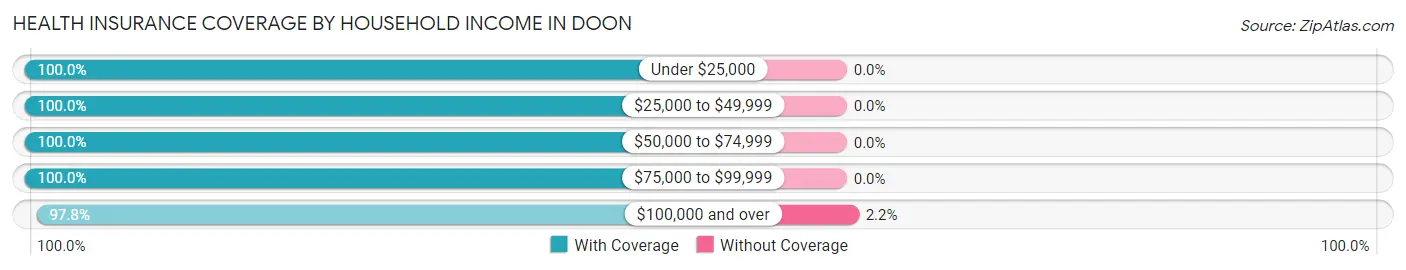
| Household Income | With Coverage | Without Coverage |
| Under $25,000 | 51 (100.0%) | 0 (0.0%) |
| $25,000 to $49,999 | 44 (100.0%) | 0 (0.0%) |
| $50,000 to $74,999 | 170 (100.0%) | 0 (0.0%) |
| $75,000 to $99,999 | 131 (100.0%) | 0 (0.0%) |
| $100,000 and over | 175 (97.8%) | 4 (2.2%) |
Public vs Private Health Insurance Coverage by Age in Doon
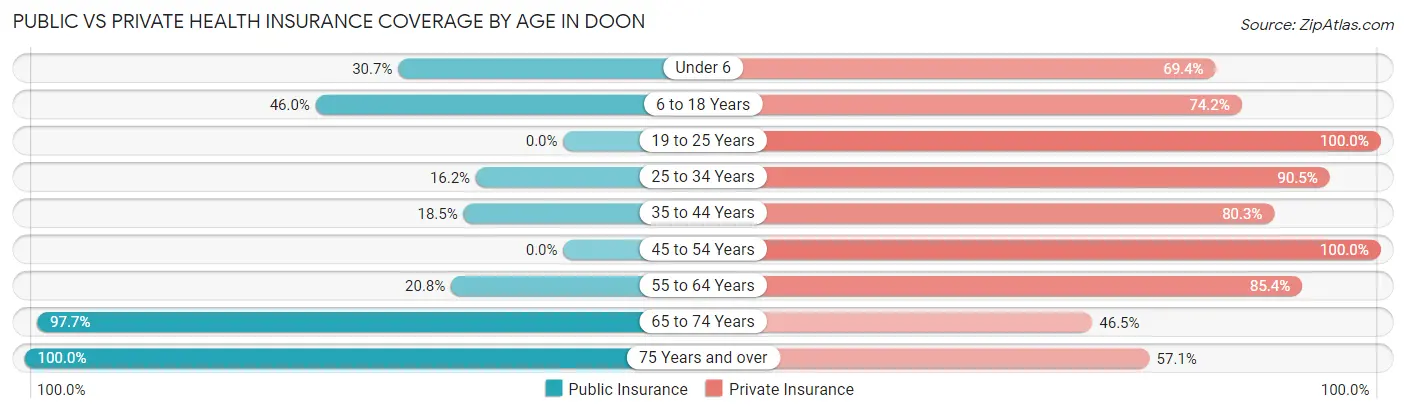
| Age Bracket | Public Insurance | Private Insurance |
| Under 6 | 19 (30.6%) | 43 (69.4%) |
| 6 to 18 Years | 57 (46.0%) | 92 (74.2%) |
| 19 to 25 Years | 0 (0.0%) | 39 (100.0%) |
| 25 to 34 Years | 12 (16.2%) | 67 (90.5%) |
| 35 to 44 Years | 15 (18.5%) | 65 (80.2%) |
| 45 to 54 Years | 0 (0.0%) | 48 (100.0%) |
| 55 to 64 Years | 10 (20.8%) | 41 (85.4%) |
| 65 to 74 Years | 42 (97.7%) | 20 (46.5%) |
| 75 Years and over | 56 (100.0%) | 32 (57.1%) |
| Total | 211 (36.7%) | 447 (77.7%) |
Disability Status by Sex by Age in Doon
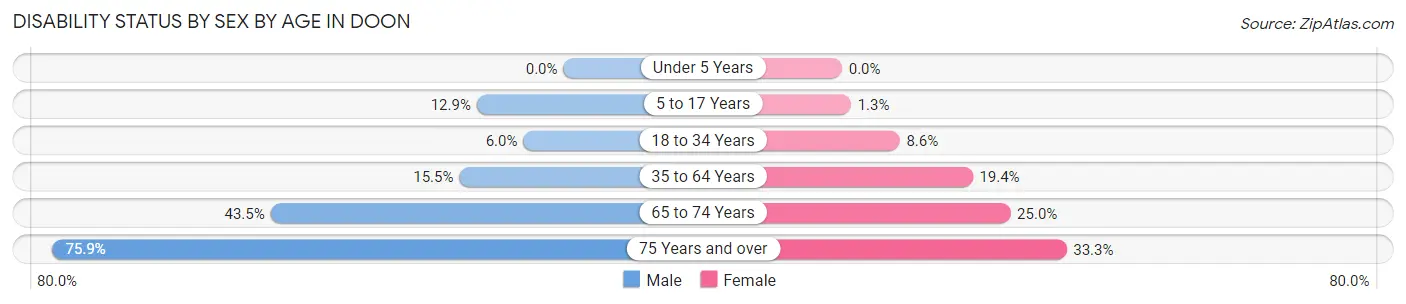
| Age Bracket | Male | Female |
| Under 5 Years | 0 (0.0%) | 0 (0.0%) |
| 5 to 17 Years | 9 (12.9%) | 1 (1.3%) |
| 18 to 34 Years | 5 (5.9%) | 3 (8.6%) |
| 35 to 64 Years | 17 (15.4%) | 13 (19.4%) |
| 65 to 74 Years | 10 (43.5%) | 5 (25.0%) |
| 75 Years and over | 22 (75.9%) | 9 (33.3%) |
Disability Class by Sex by Age in Doon
Disability Class: Hearing Difficulty
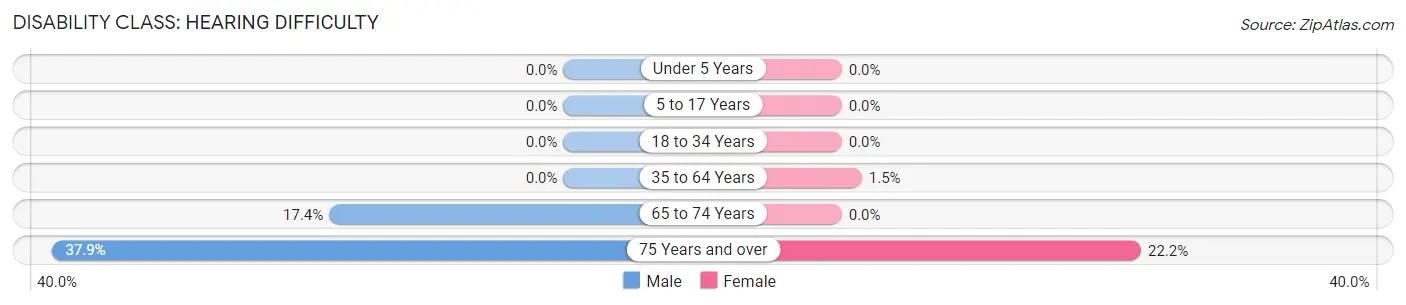
| Age Bracket | Male | Female |
| Under 5 Years | 0 (0.0%) | 0 (0.0%) |
| 5 to 17 Years | 0 (0.0%) | 0 (0.0%) |
| 18 to 34 Years | 0 (0.0%) | 0 (0.0%) |
| 35 to 64 Years | 0 (0.0%) | 1 (1.5%) |
| 65 to 74 Years | 4 (17.4%) | 0 (0.0%) |
| 75 Years and over | 11 (37.9%) | 6 (22.2%) |
Disability Class: Vision Difficulty
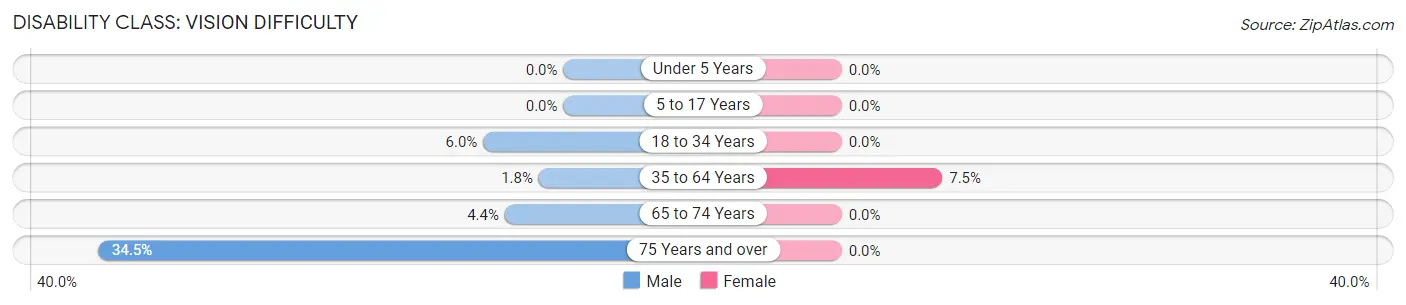
| Age Bracket | Male | Female |
| Under 5 Years | 0 (0.0%) | 0 (0.0%) |
| 5 to 17 Years | 0 (0.0%) | 0 (0.0%) |
| 18 to 34 Years | 5 (5.9%) | 0 (0.0%) |
| 35 to 64 Years | 2 (1.8%) | 5 (7.5%) |
| 65 to 74 Years | 1 (4.3%) | 0 (0.0%) |
| 75 Years and over | 10 (34.5%) | 0 (0.0%) |
Disability Class: Cognitive Difficulty
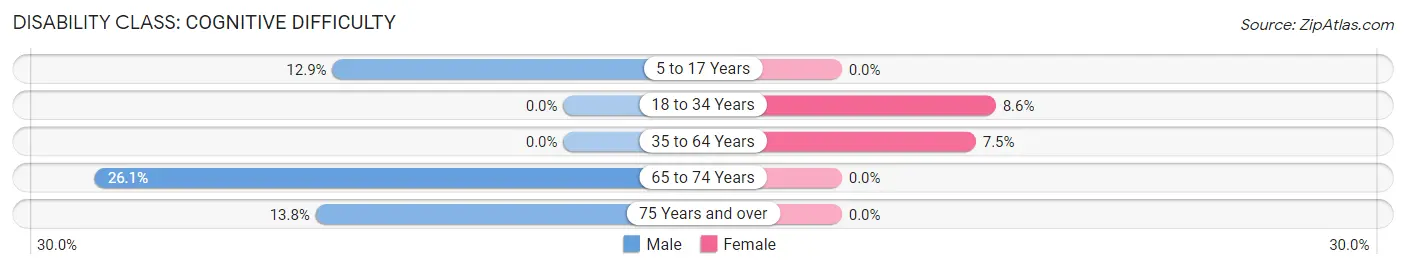
| Age Bracket | Male | Female |
| 5 to 17 Years | 9 (12.9%) | 0 (0.0%) |
| 18 to 34 Years | 0 (0.0%) | 3 (8.6%) |
| 35 to 64 Years | 0 (0.0%) | 5 (7.5%) |
| 65 to 74 Years | 6 (26.1%) | 0 (0.0%) |
| 75 Years and over | 4 (13.8%) | 0 (0.0%) |
Disability Class: Ambulatory Difficulty
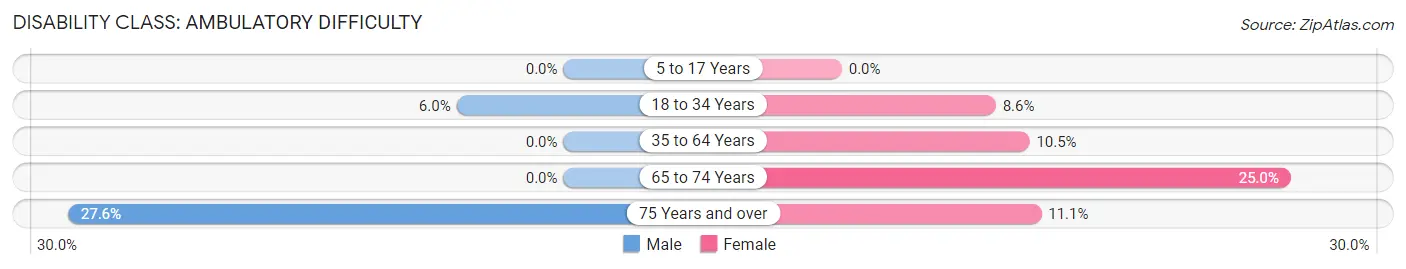
| Age Bracket | Male | Female |
| 5 to 17 Years | 0 (0.0%) | 0 (0.0%) |
| 18 to 34 Years | 5 (5.9%) | 3 (8.6%) |
| 35 to 64 Years | 0 (0.0%) | 7 (10.4%) |
| 65 to 74 Years | 0 (0.0%) | 5 (25.0%) |
| 75 Years and over | 8 (27.6%) | 3 (11.1%) |
Disability Class: Self-Care Difficulty
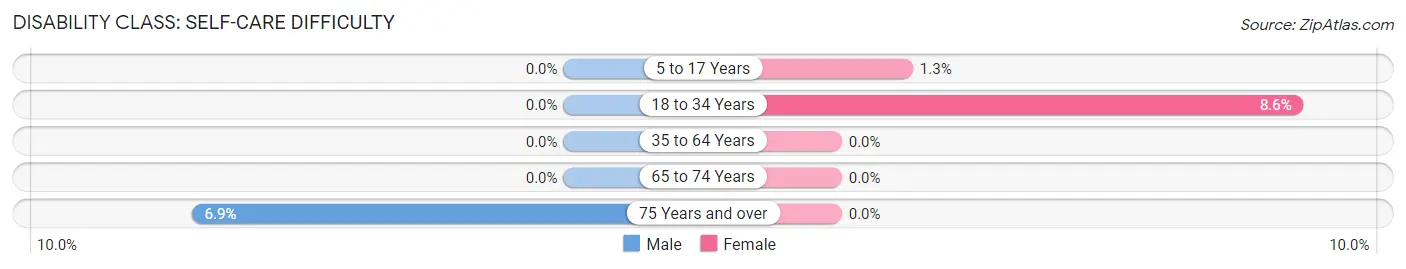
| Age Bracket | Male | Female |
| 5 to 17 Years | 0 (0.0%) | 1 (1.3%) |
| 18 to 34 Years | 0 (0.0%) | 3 (8.6%) |
| 35 to 64 Years | 0 (0.0%) | 0 (0.0%) |
| 65 to 74 Years | 0 (0.0%) | 0 (0.0%) |
| 75 Years and over | 2 (6.9%) | 0 (0.0%) |
Technology Access in Doon
Computing Device Access in Doon
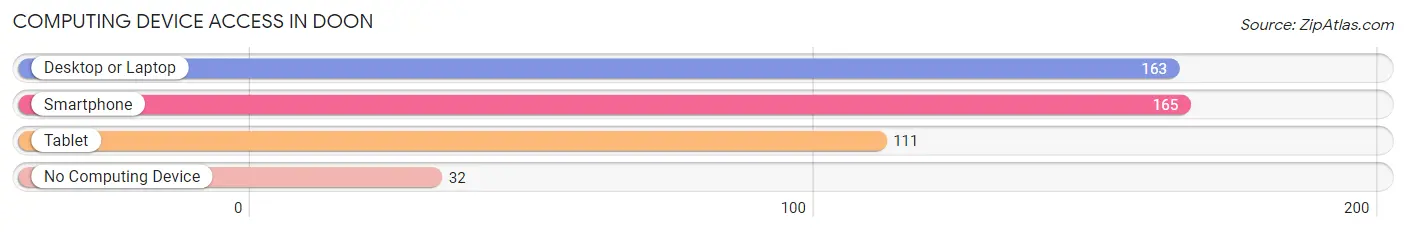
| Device Type | # Households | % Households |
| Desktop or Laptop | 163 | 73.4% |
| Smartphone | 165 | 74.3% |
| Tablet | 111 | 50.0% |
| No Computing Device | 32 | 14.4% |
| Total | 222 | 100.0% |
Internet Access in Doon
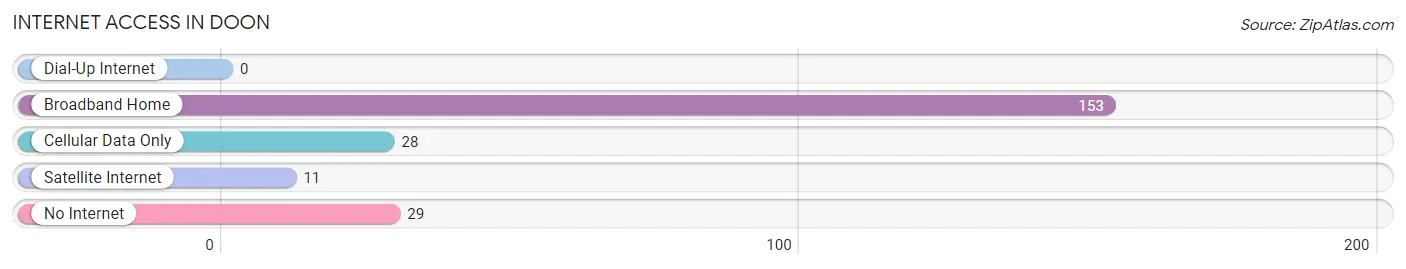
| Internet Type | # Households | % Households |
| Dial-Up Internet | 0 | 0.0% |
| Broadband Home | 153 | 68.9% |
| Cellular Data Only | 28 | 12.6% |
| Satellite Internet | 11 | 5.0% |
| No Internet | 29 | 13.1% |
| Total | 222 | 100.0% |
Doon Summary
Doon, Iowa is a small city located in Lyon County, Iowa. It is situated on the Big Sioux River, and is part of the Sioux City metropolitan area. The city has a population of 1,093 as of the 2010 census.
History
Doon was founded in 1881 by Dutch settlers who had immigrated to the United States from the Netherlands. The city was named after the Dutch word for “valley”, and was originally known as “Doon Valley”. The city was incorporated in 1883, and the first mayor was John Van Der Zee.
The city was originally a farming community, and the main crops grown were corn, oats, and hay. In the early 1900s, the city began to grow and develop, and the first bank was established in 1906. The city also had a hotel, a blacksmith shop, a livery stable, and a general store.
In the 1920s, the city began to experience a population boom, and the population grew from 500 to 1,000. The city also began to attract more businesses, including a creamery, a feed mill, and a lumber yard.
Geography
Doon is located in Lyon County, Iowa, and is situated on the Big Sioux River. The city has a total area of 0.9 square miles, all of which is land. The city is located about 10 miles south of Sioux City, and is part of the Sioux City metropolitan area.
The city has a humid continental climate, with hot summers and cold winters. The average temperature in the summer is around 75 degrees Fahrenheit, and the average temperature in the winter is around 20 degrees Fahrenheit.
Economy
The economy of Doon is largely based on agriculture. The main crops grown in the area are corn, oats, and hay. The city also has a few small businesses, including a feed mill, a lumber yard, and a general store.
The city also has a few manufacturing companies, including a furniture manufacturer and a metal fabrication company. The city also has a few restaurants and bars, as well as a few retail stores.
Demographics
As of the 2010 census, the population of Doon was 1,093. The racial makeup of the city was 97.3% White, 0.7% African American, 0.2% Native American, 0.2% Asian, 0.2% from other races, and 1.4% from two or more races. Hispanic or Latino of any race were 1.2% of the population.
The median income for a household in the city was $41,250, and the median income for a family was $48,750. The per capita income for the city was $19,945. About 8.2% of families and 10.2% of the population were below the poverty line, including 14.3% of those under age 18 and 8.3% of those age 65 or over.
Common Questions
What is Per Capita Income in Doon?
Per Capita income in Doon is $26,550.
What is the Median Family Income in Doon?
Median Family Income in Doon is $81,750.
What is the Median Household income in Doon?
Median Household Income in Doon is $60,000.
What is Income or Wage Gap in Doon?
Income or Wage Gap in Doon is 49.4%.
Women in Doon earn 50.6 cents for every dollar earned by a man.
What is Inequality or Gini Index in Doon?
Inequality or Gini Index in Doon is 0.36.
What is the Total Population of Doon?
Total Population of Doon is 575.
What is the Total Male Population of Doon?
Total Male Population of Doon is 329.
What is the Total Female Population of Doon?
Total Female Population of Doon is 246.
What is the Ratio of Males per 100 Females in Doon?
There are 133.74 Males per 100 Females in Doon.
What is the Ratio of Females per 100 Males in Doon?
There are 74.77 Females per 100 Males in Doon.
What is the Median Population Age in Doon?
Median Population Age in Doon is 32.3 Years.
What is the Average Family Size in Doon
Average Family Size in Doon is 3.6 People.
What is the Average Household Size in Doon
Average Household Size in Doon is 2.6 People.
How Large is the Labor Force in Doon?
There are 283 People in the Labor Forcein in Doon.
What is the Percentage of People in the Labor Force in Doon?
70.0% of People are in the Labor Force in Doon.
What is the Unemployment Rate in Doon?
Unemployment Rate in Doon is 2.8%.