Coon Rapids, IA Map & Demographics
Coon Rapids Map
Coon Rapids Overview
$27,742
PER CAPITA INCOME
$80,104
AVG FAMILY INCOME
$61,058
AVG HOUSEHOLD INCOME
47.7%
WAGE / INCOME GAP [ % ]
52.3¢/ $1
WAGE / INCOME GAP [ $ ]
0.34
INEQUALITY / GINI INDEX
1,324
TOTAL POPULATION
606
MALE POPULATION
718
FEMALE POPULATION
84.40
MALES / 100 FEMALES
118.48
FEMALES / 100 MALES
39.7
MEDIAN AGE
3.3
AVG FAMILY SIZE
2.4
AVG HOUSEHOLD SIZE
654
LABOR FORCE [ PEOPLE ]
64.9%
PERCENT IN LABOR FORCE
1.8%
UNEMPLOYMENT RATE
Coon Rapids Zip Codes
Coon Rapids Area Codes
Income in Coon Rapids
Income Overview in Coon Rapids
Per Capita Income in Coon Rapids is $27,742, while median incomes of families and households are $80,104 and $61,058 respectively.
| Characteristic | Number | Measure |
| Per Capita Income | 1,324 | $27,742 |
| Median Family Income | 312 | $80,104 |
| Mean Family Income | 312 | $81,458 |
| Median Household Income | 529 | $61,058 |
| Mean Household Income | 529 | $67,539 |
| Income Deficit | 312 | $0 |
| Wage / Income Gap (%) | 1,324 | 47.67% |
| Wage / Income Gap ($) | 1,324 | 52.33¢ per $1 |
| Gini / Inequality Index | 1,324 | 0.34 |
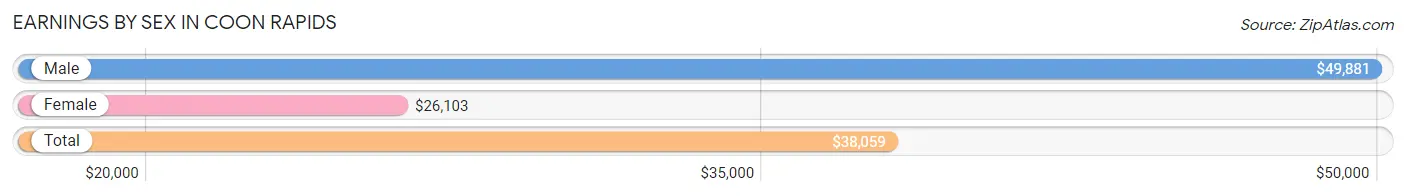
Earnings by Sex in Coon Rapids
Average Earnings in Coon Rapids are $38,059, $49,881 for men and $26,103 for women, a difference of 47.7%.
| Sex | Number | Average Earnings |
| Male | 354 (49.9%) | $49,881 |
| Female | 355 (50.1%) | $26,103 |
| Total | 709 (100.0%) | $38,059 |
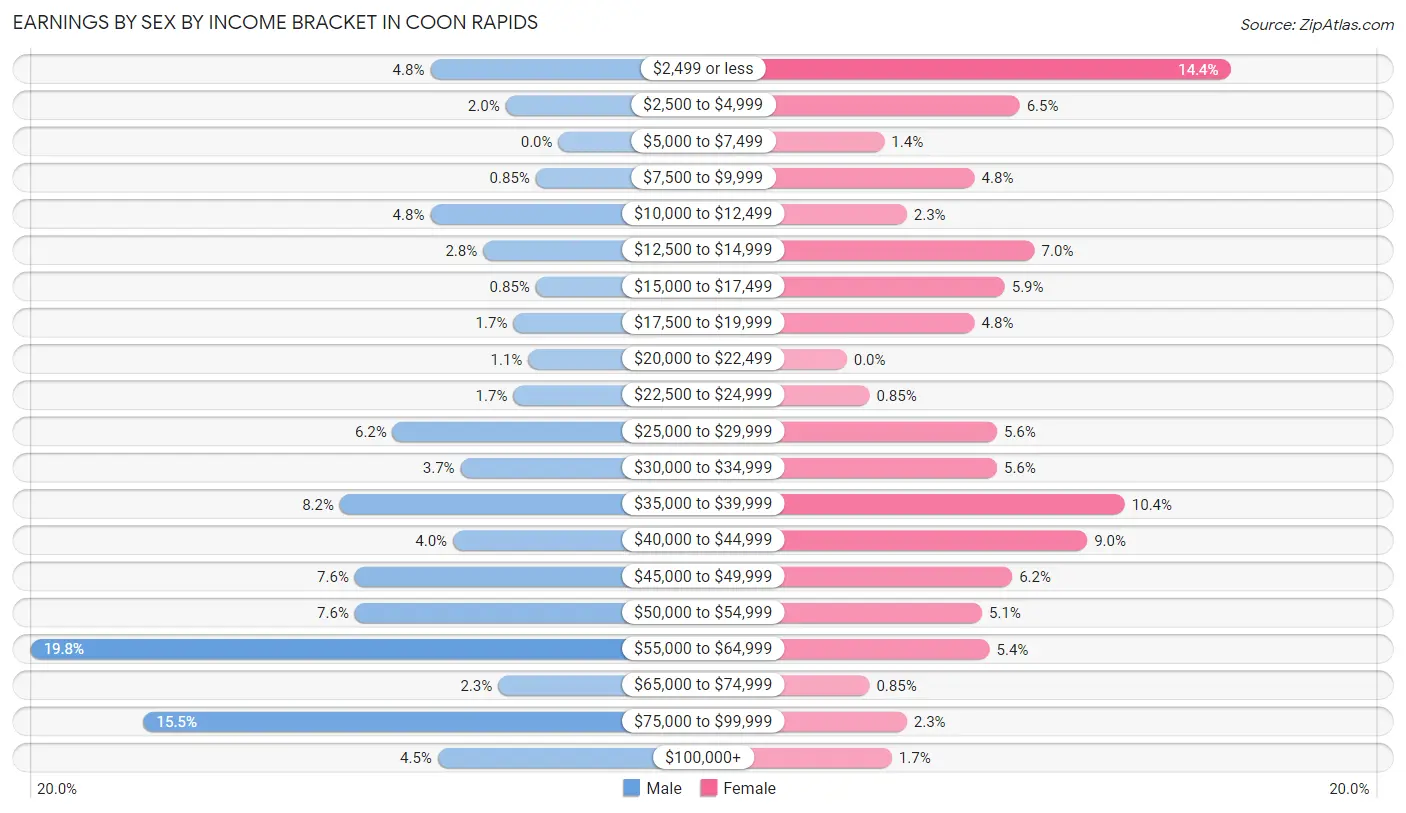
Earnings by Sex by Income Bracket in Coon Rapids
The most common earnings brackets in Coon Rapids are $55,000 to $64,999 for men (70 | 19.8%) and $2,499 or less for women (51 | 14.4%).
| Income | Male | Female |
| $2,499 or less | 17 (4.8%) | 51 (14.4%) |
| $2,500 to $4,999 | 7 (2.0%) | 23 (6.5%) |
| $5,000 to $7,499 | 0 (0.0%) | 5 (1.4%) |
| $7,500 to $9,999 | 3 (0.9%) | 17 (4.8%) |
| $10,000 to $12,499 | 17 (4.8%) | 8 (2.2%) |
| $12,500 to $14,999 | 10 (2.8%) | 25 (7.0%) |
| $15,000 to $17,499 | 3 (0.9%) | 21 (5.9%) |
| $17,500 to $19,999 | 6 (1.7%) | 17 (4.8%) |
| $20,000 to $22,499 | 4 (1.1%) | 0 (0.0%) |
| $22,500 to $24,999 | 6 (1.7%) | 3 (0.9%) |
| $25,000 to $29,999 | 22 (6.2%) | 20 (5.6%) |
| $30,000 to $34,999 | 13 (3.7%) | 20 (5.6%) |
| $35,000 to $39,999 | 29 (8.2%) | 37 (10.4%) |
| $40,000 to $44,999 | 14 (4.0%) | 32 (9.0%) |
| $45,000 to $49,999 | 27 (7.6%) | 22 (6.2%) |
| $50,000 to $54,999 | 27 (7.6%) | 18 (5.1%) |
| $55,000 to $64,999 | 70 (19.8%) | 19 (5.3%) |
| $65,000 to $74,999 | 8 (2.3%) | 3 (0.9%) |
| $75,000 to $99,999 | 55 (15.5%) | 8 (2.2%) |
| $100,000+ | 16 (4.5%) | 6 (1.7%) |
| Total | 354 (100.0%) | 355 (100.0%) |
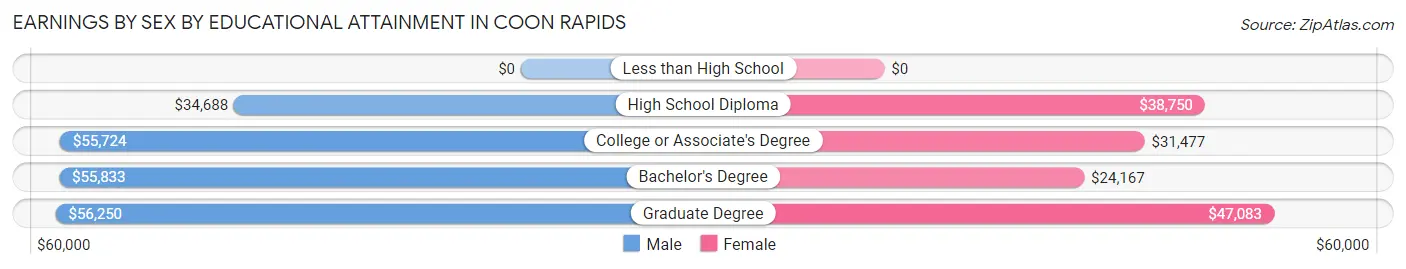
Earnings by Sex by Educational Attainment in Coon Rapids
Average earnings in Coon Rapids are $51,875 for men and $31,964 for women, a difference of 38.4%. Men with an educational attainment of graduate degree enjoy the highest average annual earnings of $56,250, while those with high school diploma education earn the least with $34,688. Women with an educational attainment of graduate degree earn the most with the average annual earnings of $47,083, while those with bachelor's degree education have the smallest earnings of $24,167.
| Educational Attainment | Male Income | Female Income |
| Less than High School | - | - |
| High School Diploma | $34,688 | $38,750 |
| College or Associate's Degree | $55,724 | $31,477 |
| Bachelor's Degree | $55,833 | $24,167 |
| Graduate Degree | $56,250 | $47,083 |
| Total | $51,875 | $31,964 |
Family Income in Coon Rapids
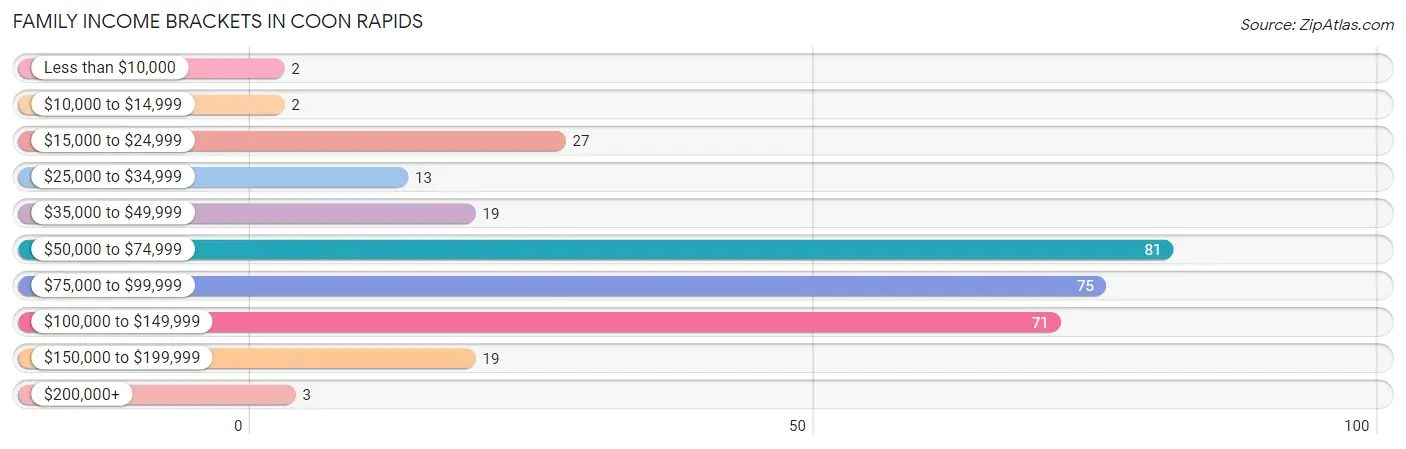
Family Income Brackets in Coon Rapids
According to the Coon Rapids family income data, there are 81 families falling into the $50,000 to $74,999 income range, which is the most common income bracket and makes up 26.0% of all families. Conversely, the less than $10,000 income bracket is the least frequent group with only 2 families (0.6%) belonging to this category.
| Income Bracket | # Families | % Families |
| Less than $10,000 | 2 | 0.6% |
| $10,000 to $14,999 | 2 | 0.6% |
| $15,000 to $24,999 | 27 | 8.7% |
| $25,000 to $34,999 | 13 | 4.2% |
| $35,000 to $49,999 | 19 | 6.1% |
| $50,000 to $74,999 | 81 | 26.0% |
| $75,000 to $99,999 | 75 | 24.0% |
| $100,000 to $149,999 | 71 | 22.8% |
| $150,000 to $199,999 | 19 | 6.1% |
| $200,000+ | 3 | 1.0% |
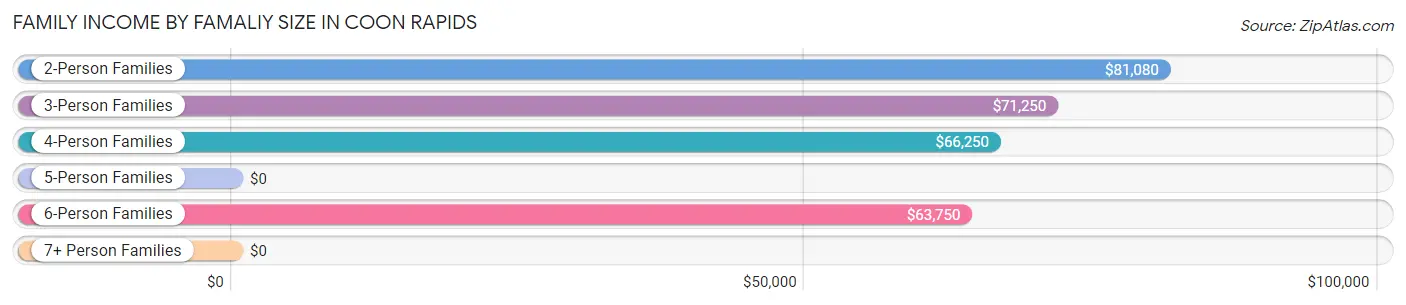
Family Income by Famaliy Size in Coon Rapids
2-person families (183 | 58.7%) account for the highest median family income in Coon Rapids with $81,080 per family, while 2-person families (183 | 58.7%) have the highest median income of $40,540 per family member.
| Income Bracket | # Families | Median Income |
| 2-Person Families | 183 (58.7%) | $81,080 |
| 3-Person Families | 32 (10.3%) | $71,250 |
| 4-Person Families | 26 (8.3%) | $66,250 |
| 5-Person Families | 41 (13.1%) | $0 |
| 6-Person Families | 24 (7.7%) | $63,750 |
| 7+ Person Families | 6 (1.9%) | $0 |
| Total | 312 (100.0%) | $80,104 |
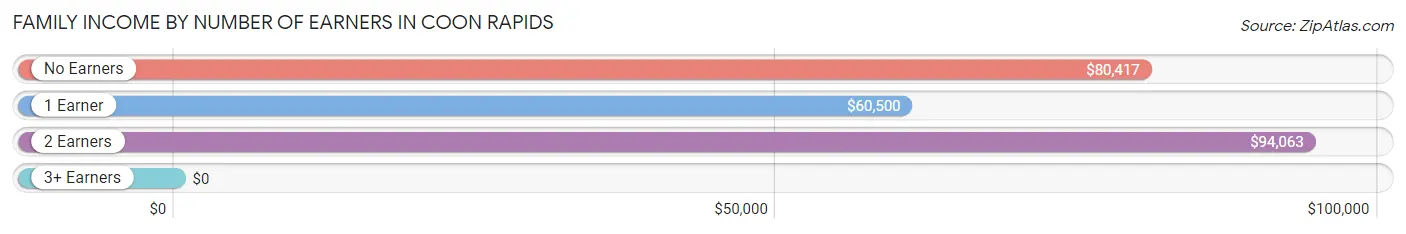
Family Income by Number of Earners in Coon Rapids
| Number of Earners | # Families | Median Income |
| No Earners | 29 (9.3%) | $80,417 |
| 1 Earner | 86 (27.6%) | $60,500 |
| 2 Earners | 157 (50.3%) | $94,063 |
| 3+ Earners | 40 (12.8%) | $0 |
| Total | 312 (100.0%) | $80,104 |
Household Income in Coon Rapids
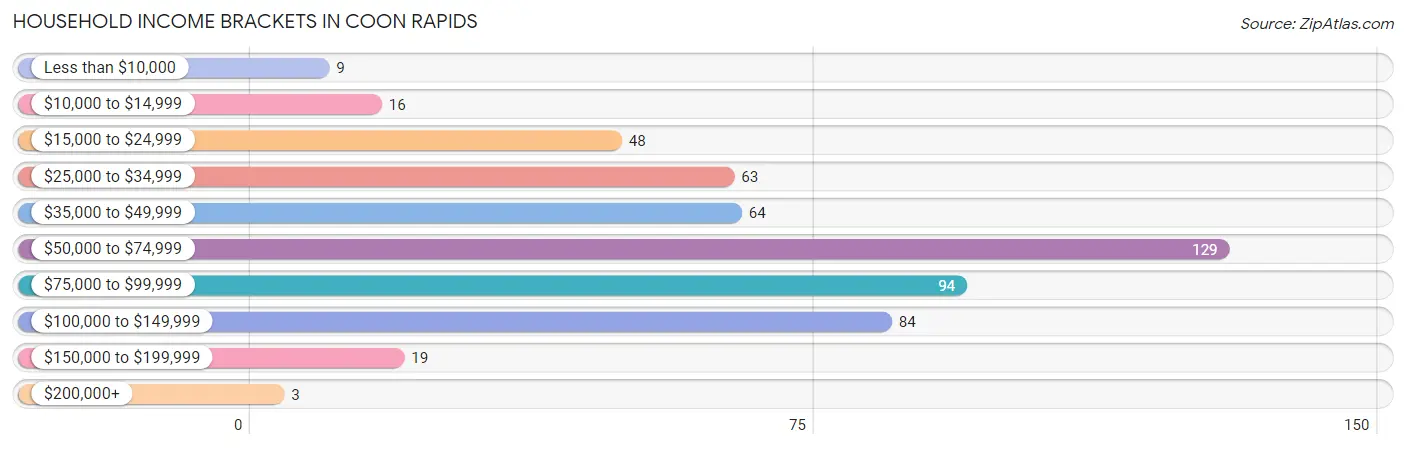
Household Income Brackets in Coon Rapids
With 129 households falling in the category, the $50,000 to $74,999 income range is the most frequent in Coon Rapids, accounting for 24.4% of all households. In contrast, only 3 households (0.6%) fall into the $200,000+ income bracket, making it the least populous group.
| Income Bracket | # Households | % Households |
| Less than $10,000 | 9 | 1.7% |
| $10,000 to $14,999 | 16 | 3.0% |
| $15,000 to $24,999 | 48 | 9.1% |
| $25,000 to $34,999 | 63 | 11.9% |
| $35,000 to $49,999 | 64 | 12.1% |
| $50,000 to $74,999 | 129 | 24.4% |
| $75,000 to $99,999 | 94 | 17.8% |
| $100,000 to $149,999 | 84 | 15.9% |
| $150,000 to $199,999 | 19 | 3.6% |
| $200,000+ | 3 | 0.6% |
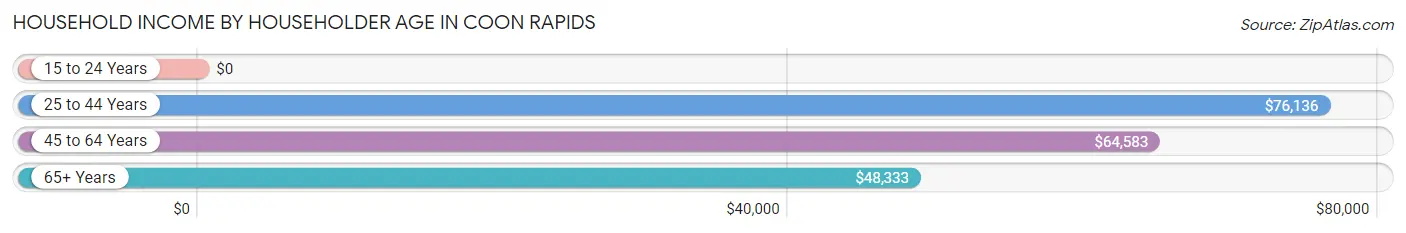
Household Income by Householder Age in Coon Rapids
The median household income in Coon Rapids is $61,058, with the highest median household income of $76,136 found in the 25 to 44 years age bracket for the primary householder. A total of 144 households (27.2%) fall into this category. Meanwhile, the 15 to 24 years age bracket for the primary householder has the lowest median household income of $0, with 28 households (5.3%) in this group.
| Income Bracket | # Households | Median Income |
| 15 to 24 Years | 28 (5.3%) | $0 |
| 25 to 44 Years | 144 (27.2%) | $76,136 |
| 45 to 64 Years | 209 (39.5%) | $64,583 |
| 65+ Years | 148 (28.0%) | $48,333 |
| Total | 529 (100.0%) | $61,058 |
Poverty in Coon Rapids
Income Below Poverty by Sex and Age in Coon Rapids
With 14.7% poverty level for males and 9.6% for females among the residents of Coon Rapids, 5 year old males and 18 to 24 year old females are the most vulnerable to poverty, with 9 males (100.0%) and 5 females (23.8%) in their respective age groups living below the poverty level.
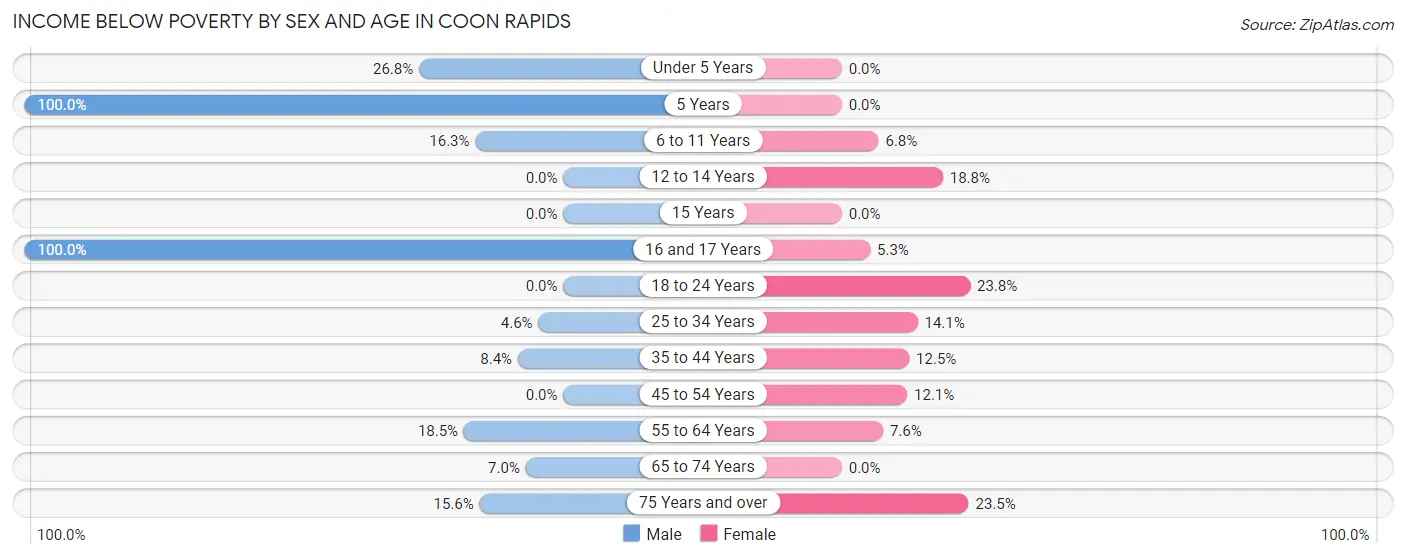
| Age Bracket | Male | Female |
| Under 5 Years | 15 (26.8%) | 0 (0.0%) |
| 5 Years | 9 (100.0%) | 0 (0.0%) |
| 6 to 11 Years | 8 (16.3%) | 6 (6.8%) |
| 12 to 14 Years | 0 (0.0%) | 6 (18.8%) |
| 15 Years | 0 (0.0%) | 0 (0.0%) |
| 16 and 17 Years | 18 (100.0%) | 3 (5.3%) |
| 18 to 24 Years | 0 (0.0%) | 5 (23.8%) |
| 25 to 34 Years | 3 (4.6%) | 9 (14.1%) |
| 35 to 44 Years | 7 (8.4%) | 9 (12.5%) |
| 45 to 54 Years | 0 (0.0%) | 4 (12.1%) |
| 55 to 64 Years | 19 (18.4%) | 11 (7.6%) |
| 65 to 74 Years | 3 (7.0%) | 0 (0.0%) |
| 75 Years and over | 7 (15.6%) | 12 (23.5%) |
| Total | 89 (14.7%) | 65 (9.6%) |
Income Above Poverty by Sex and Age in Coon Rapids
According to the poverty statistics in Coon Rapids, males aged 12 to 14 years and females aged under 5 years are the age groups that are most secure financially, with 100.0% of males and 100.0% of females in these age groups living above the poverty line.
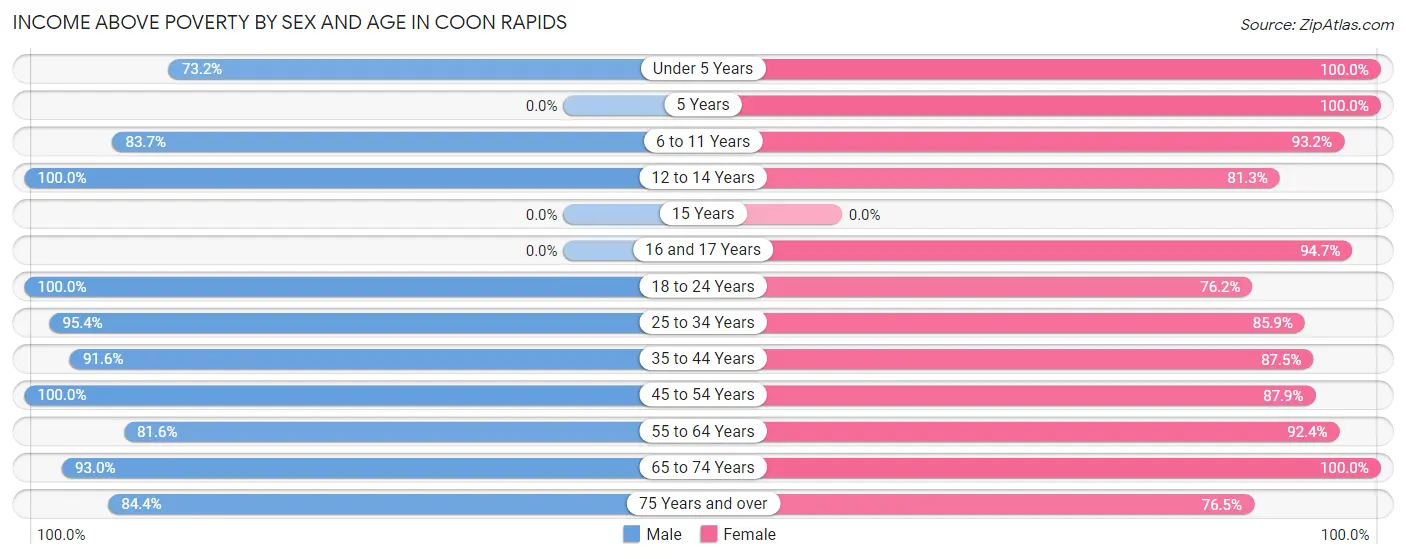
| Age Bracket | Male | Female |
| Under 5 Years | 41 (73.2%) | 33 (100.0%) |
| 5 Years | 0 (0.0%) | 13 (100.0%) |
| 6 to 11 Years | 41 (83.7%) | 82 (93.2%) |
| 12 to 14 Years | 36 (100.0%) | 26 (81.2%) |
| 15 Years | 0 (0.0%) | 0 (0.0%) |
| 16 and 17 Years | 0 (0.0%) | 54 (94.7%) |
| 18 to 24 Years | 36 (100.0%) | 16 (76.2%) |
| 25 to 34 Years | 62 (95.4%) | 55 (85.9%) |
| 35 to 44 Years | 76 (91.6%) | 63 (87.5%) |
| 45 to 54 Years | 63 (100.0%) | 29 (87.9%) |
| 55 to 64 Years | 84 (81.6%) | 133 (92.4%) |
| 65 to 74 Years | 40 (93.0%) | 69 (100.0%) |
| 75 Years and over | 38 (84.4%) | 39 (76.5%) |
| Total | 517 (85.3%) | 612 (90.4%) |
Income Below Poverty Among Married-Couple Families in Coon Rapids
The poverty statistics for married-couple families in Coon Rapids show that 6.3% or 16 of the total 253 families live below the poverty line. Families with 5 or more children have the highest poverty rate of 50.0%, comprising of 3 families. On the other hand, families with 3 or 4 children have the lowest poverty rate of 0.0%, which includes 0 families.
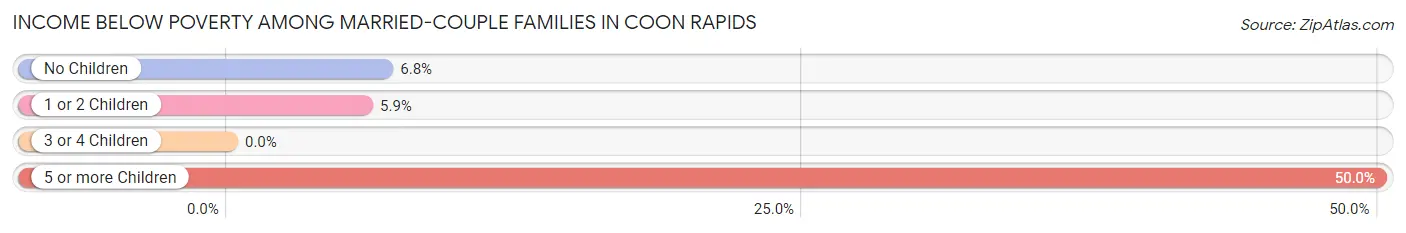
| Children | Above Poverty | Below Poverty |
| No Children | 138 (93.2%) | 10 (6.8%) |
| 1 or 2 Children | 48 (94.1%) | 3 (5.9%) |
| 3 or 4 Children | 48 (100.0%) | 0 (0.0%) |
| 5 or more Children | 3 (50.0%) | 3 (50.0%) |
| Total | 237 (93.7%) | 16 (6.3%) |
Income Below Poverty Among Single-Parent Households in Coon Rapids
According to the poverty data in Coon Rapids, 20.0% or 6 single-father households and 51.7% or 15 single-mother households are living below the poverty line. Among single-father households, those with 3 or 4 children have the highest poverty rate, with 6 households (100.0%) experiencing poverty. Likewise, among single-mother households, those with no children have the highest poverty rate, with 3 households (100.0%) falling below the poverty line.
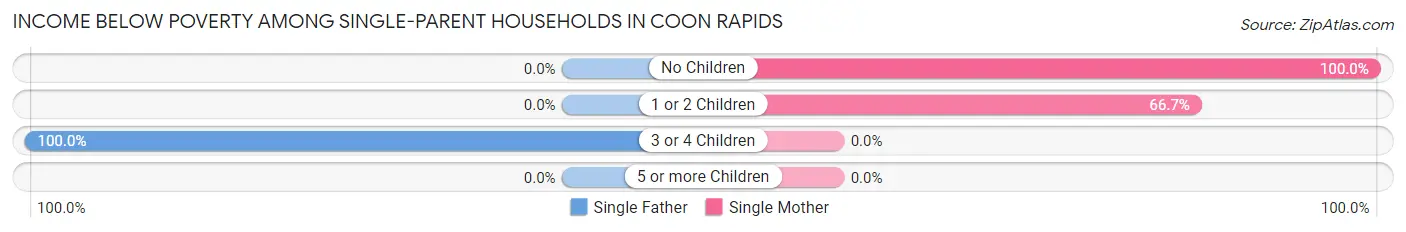
| Children | Single Father | Single Mother |
| No Children | 0 (0.0%) | 3 (100.0%) |
| 1 or 2 Children | 0 (0.0%) | 12 (66.7%) |
| 3 or 4 Children | 6 (100.0%) | 0 (0.0%) |
| 5 or more Children | 0 (0.0%) | 0 (0.0%) |
| Total | 6 (20.0%) | 15 (51.7%) |
Income Below Poverty Among Married-Couple vs Single-Parent Households in Coon Rapids
The poverty data for Coon Rapids shows that 16 of the married-couple family households (6.3%) and 21 of the single-parent households (35.6%) are living below the poverty level. Within the married-couple family households, those with 5 or more children have the highest poverty rate, with 3 households (50.0%) falling below the poverty line. Among the single-parent households, those with 1 or 2 children have the highest poverty rate, with 12 household (44.4%) living below poverty.
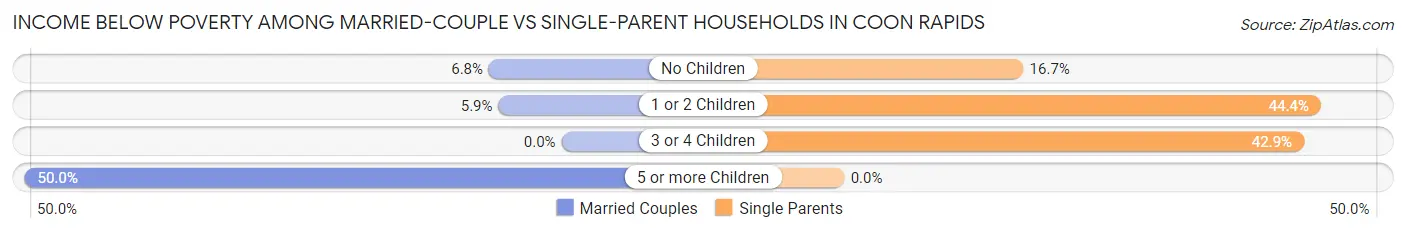
| Children | Married-Couple Families | Single-Parent Households |
| No Children | 10 (6.8%) | 3 (16.7%) |
| 1 or 2 Children | 3 (5.9%) | 12 (44.4%) |
| 3 or 4 Children | 0 (0.0%) | 6 (42.9%) |
| 5 or more Children | 3 (50.0%) | 0 (0.0%) |
| Total | 16 (6.3%) | 21 (35.6%) |
Race in Coon Rapids
The most populous races in Coon Rapids are White / Caucasian (1,246 | 94.1%), Hispanic or Latino (68 | 5.1%), and Two or more Races (64 | 4.8%).
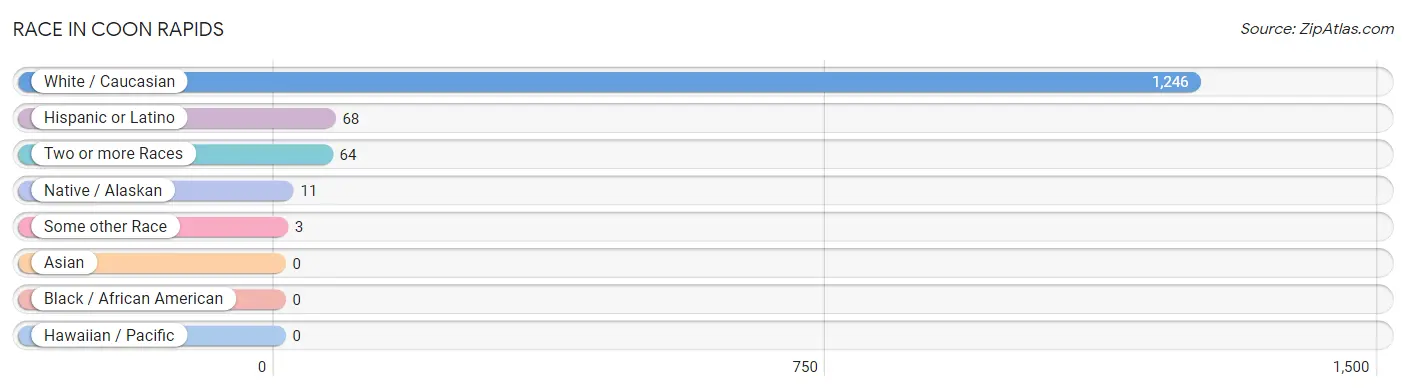
| Race | # Population | % Population |
| Asian | 0 | 0.0% |
| Black / African American | 0 | 0.0% |
| Hawaiian / Pacific | 0 | 0.0% |
| Hispanic or Latino | 68 | 5.1% |
| Native / Alaskan | 11 | 0.8% |
| White / Caucasian | 1,246 | 94.1% |
| Two or more Races | 64 | 4.8% |
| Some other Race | 3 | 0.2% |
| Total | 1,324 | 100.0% |
Ancestry in Coon Rapids
The most populous ancestries reported in Coon Rapids are German (505 | 38.1%), English (244 | 18.4%), Irish (142 | 10.7%), Danish (66 | 5.0%), and Mexican (55 | 4.2%), together accounting for 76.4% of all Coon Rapids residents.
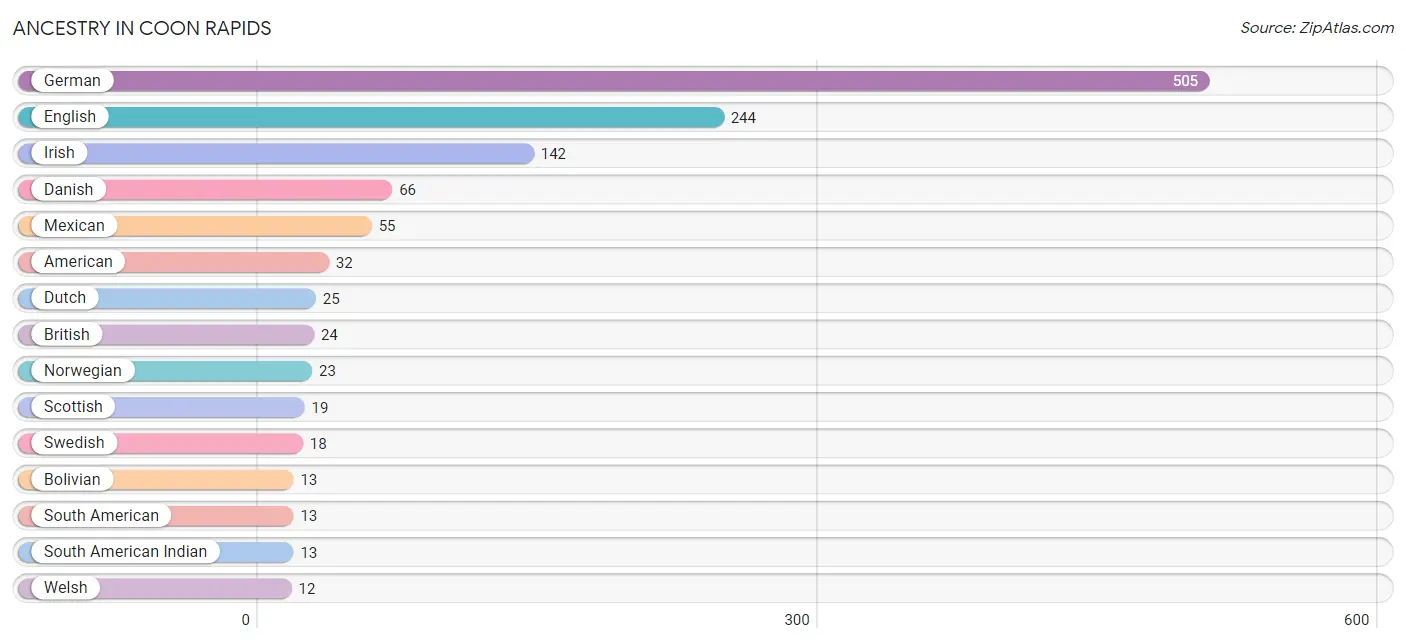
| Ancestry | # Population | % Population |
| American | 32 | 2.4% |
| Austrian | 3 | 0.2% |
| Bolivian | 13 | 1.0% |
| British | 24 | 1.8% |
| Danish | 66 | 5.0% |
| Dutch | 25 | 1.9% |
| English | 244 | 18.4% |
| European | 6 | 0.4% |
| French | 3 | 0.2% |
| French Canadian | 3 | 0.2% |
| German | 505 | 38.1% |
| Irish | 142 | 10.7% |
| Italian | 6 | 0.4% |
| Mexican | 55 | 4.2% |
| Norwegian | 23 | 1.7% |
| Pennsylvania German | 3 | 0.2% |
| Polish | 6 | 0.4% |
| Portuguese | 5 | 0.4% |
| Potawatomi | 3 | 0.2% |
| Scottish | 19 | 1.4% |
| South American | 13 | 1.0% |
| South American Indian | 13 | 1.0% |
| Swedish | 18 | 1.4% |
| Swiss | 9 | 0.7% |
| Welsh | 12 | 0.9% | View All 25 Rows |
Immigrants in Coon Rapids
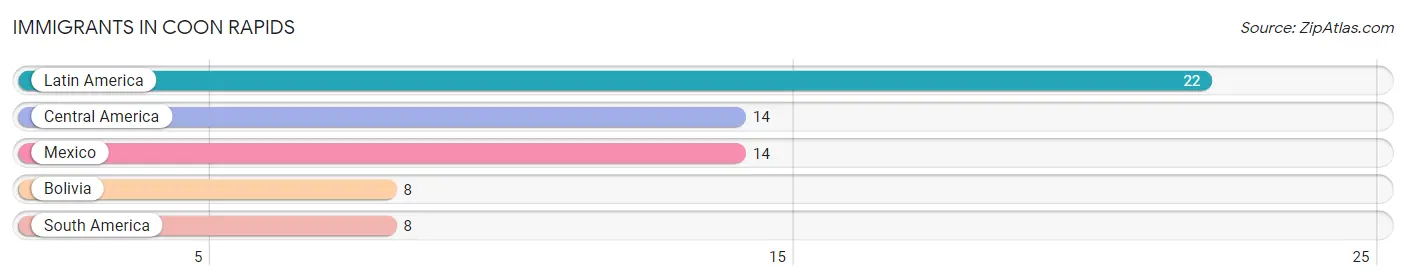
The most numerous immigrant groups reported in Coon Rapids came from Latin America (22 | 1.7%), Central America (14 | 1.1%), Mexico (14 | 1.1%), Bolivia (8 | 0.6%), and South America (8 | 0.6%), together accounting for 5.0% of all Coon Rapids residents.
| Immigration Origin | # Population | % Population |
| Bolivia | 8 | 0.6% |
| Central America | 14 | 1.1% |
| Latin America | 22 | 1.7% |
| Mexico | 14 | 1.1% |
| South America | 8 | 0.6% | View All 5 Rows |
Sex and Age in Coon Rapids
Sex and Age in Coon Rapids
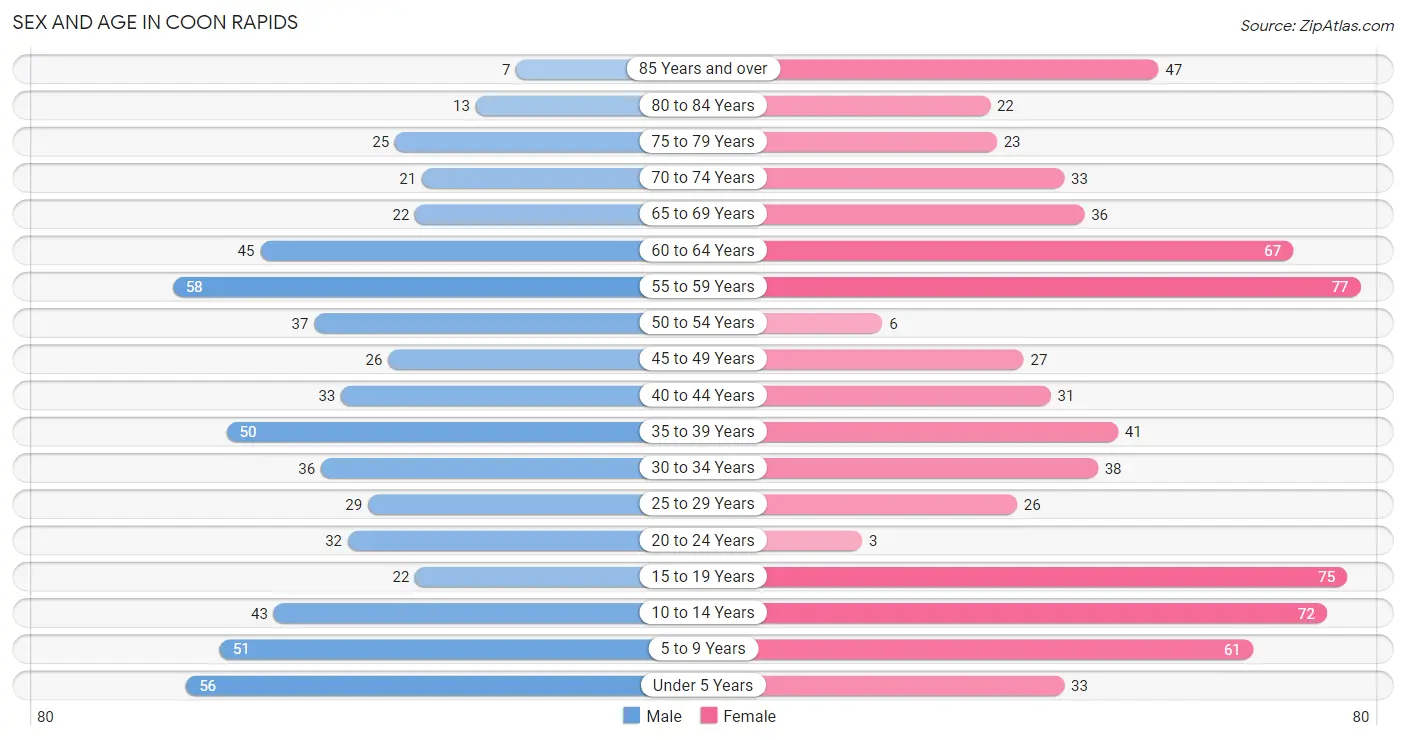
The most populous age groups in Coon Rapids are 55 to 59 Years (58 | 9.6%) for men and 55 to 59 Years (77 | 10.7%) for women.
| Age Bracket | Male | Female |
| Under 5 Years | 56 (9.2%) | 33 (4.6%) |
| 5 to 9 Years | 51 (8.4%) | 61 (8.5%) |
| 10 to 14 Years | 43 (7.1%) | 72 (10.0%) |
| 15 to 19 Years | 22 (3.6%) | 75 (10.4%) |
| 20 to 24 Years | 32 (5.3%) | 3 (0.4%) |
| 25 to 29 Years | 29 (4.8%) | 26 (3.6%) |
| 30 to 34 Years | 36 (5.9%) | 38 (5.3%) |
| 35 to 39 Years | 50 (8.3%) | 41 (5.7%) |
| 40 to 44 Years | 33 (5.4%) | 31 (4.3%) |
| 45 to 49 Years | 26 (4.3%) | 27 (3.8%) |
| 50 to 54 Years | 37 (6.1%) | 6 (0.8%) |
| 55 to 59 Years | 58 (9.6%) | 77 (10.7%) |
| 60 to 64 Years | 45 (7.4%) | 67 (9.3%) |
| 65 to 69 Years | 22 (3.6%) | 36 (5.0%) |
| 70 to 74 Years | 21 (3.5%) | 33 (4.6%) |
| 75 to 79 Years | 25 (4.1%) | 23 (3.2%) |
| 80 to 84 Years | 13 (2.1%) | 22 (3.1%) |
| 85 Years and over | 7 (1.2%) | 47 (6.6%) |
| Total | 606 (100.0%) | 718 (100.0%) |
Families and Households in Coon Rapids
Median Family Size in Coon Rapids
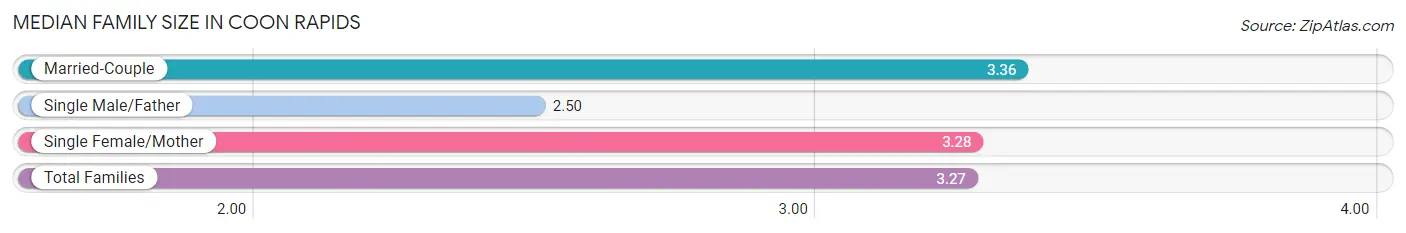
The median family size in Coon Rapids is 3.27 persons per family, with married-couple families (253 | 81.1%) accounting for the largest median family size of 3.36 persons per family. On the other hand, single male/father families (30 | 9.6%) represent the smallest median family size with 2.50 persons per family.
| Family Type | # Families | Family Size |
| Married-Couple | 253 (81.1%) | 3.36 |
| Single Male/Father | 30 (9.6%) | 2.50 |
| Single Female/Mother | 29 (9.3%) | 3.28 |
| Total Families | 312 (100.0%) | 3.27 |
Median Household Size in Coon Rapids
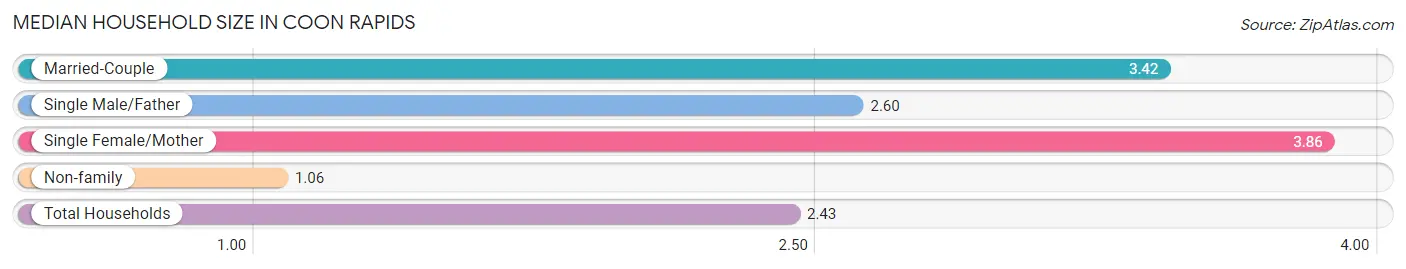
The median household size in Coon Rapids is 2.43 persons per household, with single female/mother households (29 | 5.5%) accounting for the largest median household size of 3.86 persons per household. non-family households (217 | 41.0%) represent the smallest median household size with 1.06 persons per household.
| Household Type | # Households | Household Size |
| Married-Couple | 253 (47.8%) | 3.42 |
| Single Male/Father | 30 (5.7%) | 2.60 |
| Single Female/Mother | 29 (5.5%) | 3.86 |
| Non-family | 217 (41.0%) | 1.06 |
| Total Households | 529 (100.0%) | 2.43 |
Household Size by Marriage Status in Coon Rapids
Out of a total of 529 households in Coon Rapids, 312 (59.0%) are family households, while 217 (41.0%) are nonfamily households. The most numerous type of family households are 2-person households, comprising 173, and the most common type of nonfamily households are 1-person households, comprising 207.
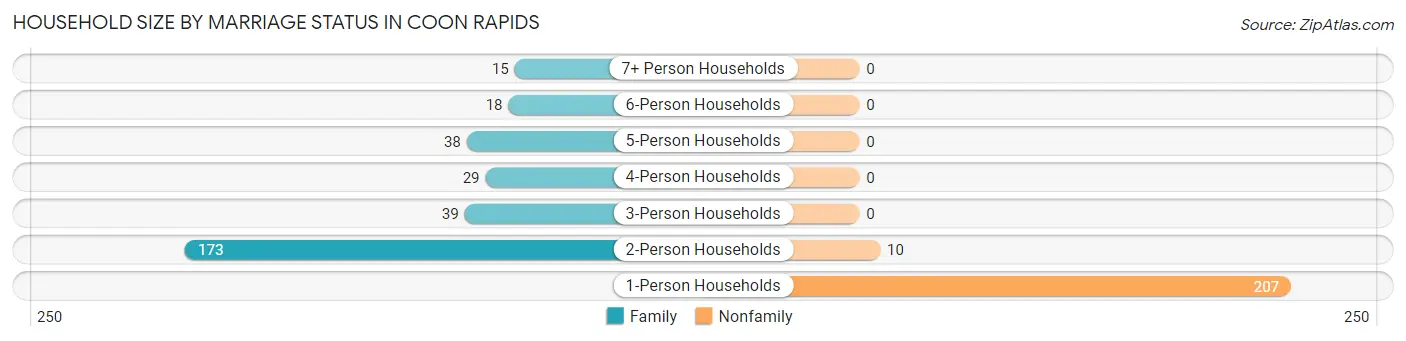
| Household Size | Family Households | Nonfamily Households |
| 1-Person Households | - | 207 (39.1%) |
| 2-Person Households | 173 (32.7%) | 10 (1.9%) |
| 3-Person Households | 39 (7.4%) | 0 (0.0%) |
| 4-Person Households | 29 (5.5%) | 0 (0.0%) |
| 5-Person Households | 38 (7.2%) | 0 (0.0%) |
| 6-Person Households | 18 (3.4%) | 0 (0.0%) |
| 7+ Person Households | 15 (2.8%) | 0 (0.0%) |
| Total | 312 (59.0%) | 217 (41.0%) |
Female Fertility in Coon Rapids
Fertility by Age in Coon Rapids
Average fertility rate in Coon Rapids is 46.0 births per 1,000 women. Women in the age bracket of 20 to 34 years have the highest fertility rate with 119.0 births per 1,000 women. Women in the age bracket of 20 to 34 years acount for 72.7% of all women with births.
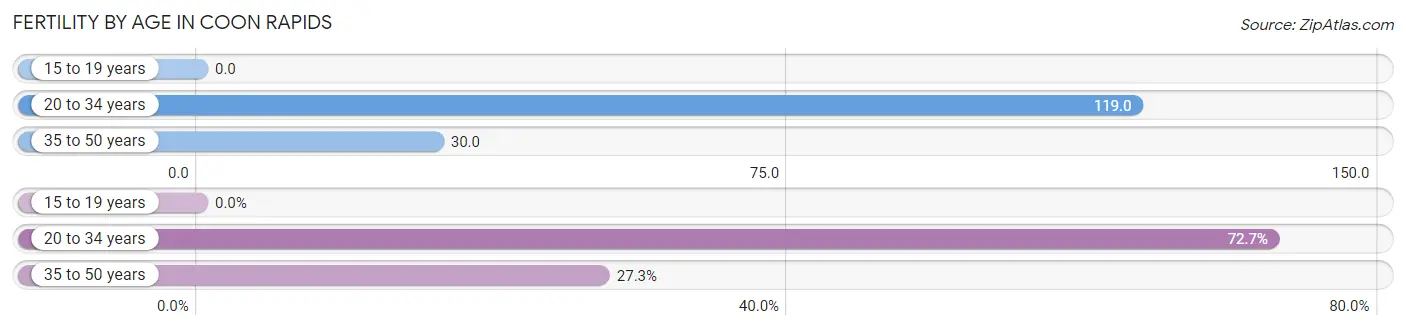
| Age Bracket | Women with Births | Births / 1,000 Women |
| 15 to 19 years | 0 (0.0%) | 0.0 |
| 20 to 34 years | 8 (72.7%) | 119.0 |
| 35 to 50 years | 3 (27.3%) | 30.0 |
| Total | 11 (100.0%) | 46.0 |
Fertility by Age by Marriage Status in Coon Rapids
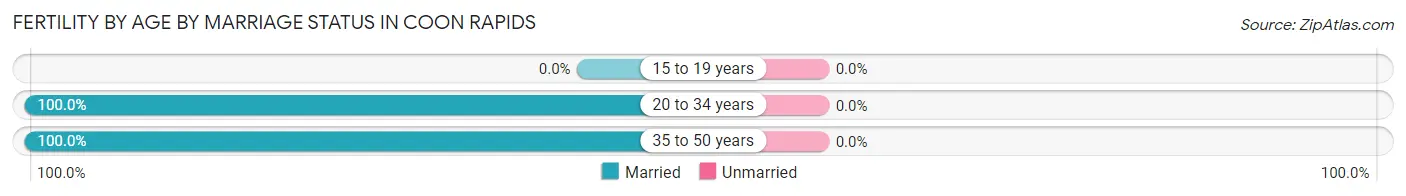
| Age Bracket | Married | Unmarried |
| 15 to 19 years | 0 (0.0%) | 0 (0.0%) |
| 20 to 34 years | 8 (100.0%) | 0 (0.0%) |
| 35 to 50 years | 3 (100.0%) | 0 (0.0%) |
| Total | 11 (100.0%) | 0 (0.0%) |
Fertility by Education in Coon Rapids
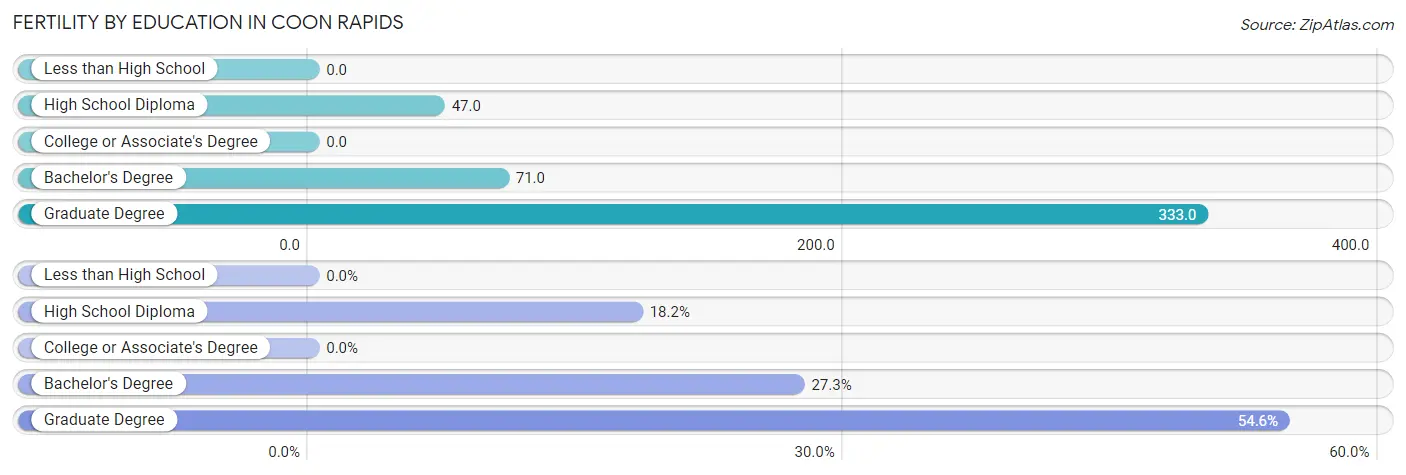
| Educational Attainment | Women with Births | Births / 1,000 Women |
| Less than High School | 0 (0.0%) | 0.0 |
| High School Diploma | 2 (18.2%) | 47.0 |
| College or Associate's Degree | 0 (0.0%) | 0.0 |
| Bachelor's Degree | 3 (27.3%) | 71.0 |
| Graduate Degree | 6 (54.5%) | 333.0 |
| Total | 11 (100.0%) | 46.0 |
Fertility by Education by Marriage Status in Coon Rapids
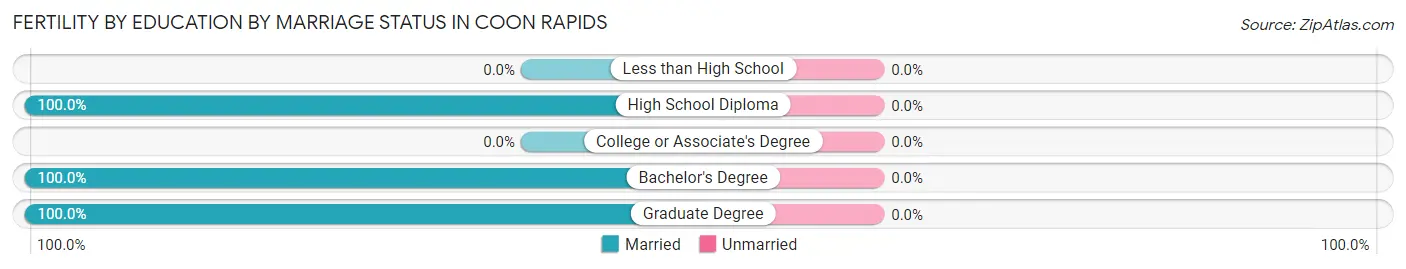
| Educational Attainment | Married | Unmarried |
| Less than High School | 0 (0.0%) | 0 (0.0%) |
| High School Diploma | 2 (100.0%) | 0 (0.0%) |
| College or Associate's Degree | 0 (0.0%) | 0 (0.0%) |
| Bachelor's Degree | 3 (100.0%) | 0 (0.0%) |
| Graduate Degree | 6 (100.0%) | 0 (0.0%) |
| Total | 11 (100.0%) | 0 (0.0%) |
Employment Characteristics in Coon Rapids
Employment by Class of Employer in Coon Rapids
Among the 642 employed individuals in Coon Rapids, private company employees (388 | 60.4%), local government employees (87 | 13.6%), and self-employed (not incorporated) (84 | 13.1%) make up the most common classes of employment.
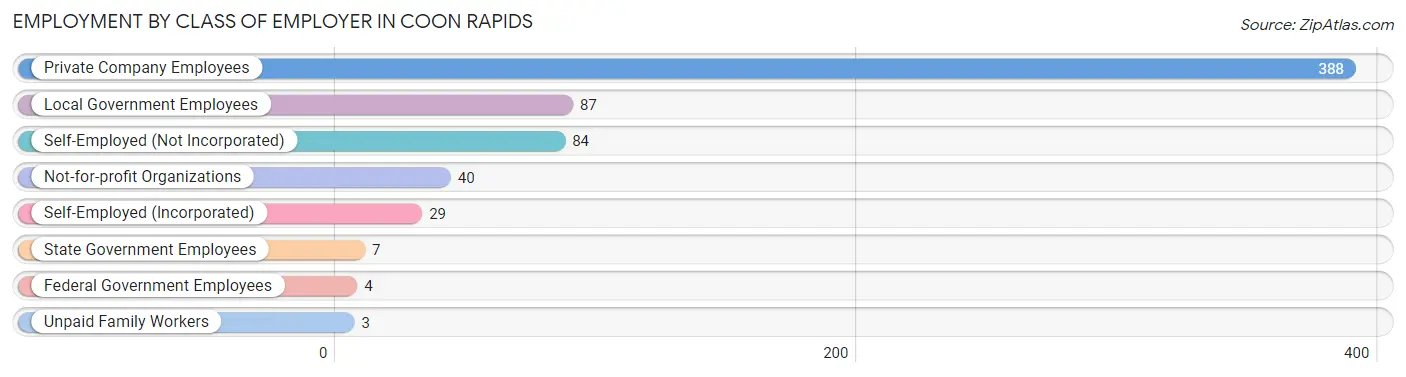
| Employer Class | # Employees | % Employees |
| Private Company Employees | 388 | 60.4% |
| Self-Employed (Incorporated) | 29 | 4.5% |
| Self-Employed (Not Incorporated) | 84 | 13.1% |
| Not-for-profit Organizations | 40 | 6.2% |
| Local Government Employees | 87 | 13.6% |
| State Government Employees | 7 | 1.1% |
| Federal Government Employees | 4 | 0.6% |
| Unpaid Family Workers | 3 | 0.5% |
| Total | 642 | 100.0% |
Employment Status by Age in Coon Rapids
According to the labor force statistics for Coon Rapids, out of the total population over 16 years of age (1,008), 64.9% or 654 individuals are in the labor force, with 1.8% or 12 of them unemployed. The age group with the highest labor force participation rate is 20 to 24 years, with 100.0% or 35 individuals in the labor force. Within the labor force, the 25 to 29 years age range has the highest percentage of unemployed individuals, with 4.2% or 2 of them being unemployed.
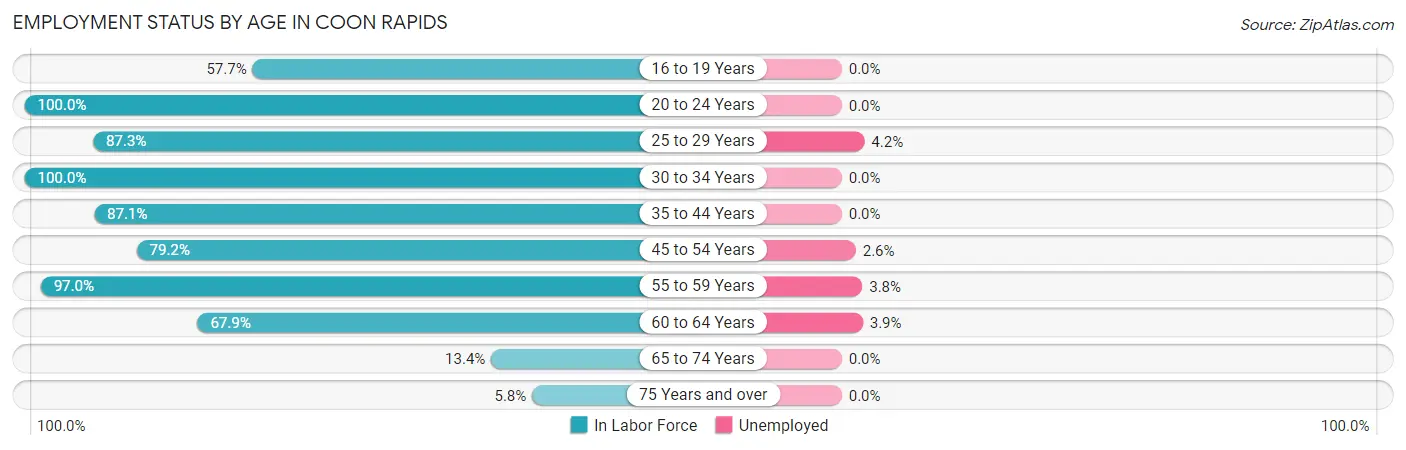
| Age Bracket | In Labor Force | Unemployed |
| 16 to 19 Years | 56 (57.7%) | 0 (0.0%) |
| 20 to 24 Years | 35 (100.0%) | 0 (0.0%) |
| 25 to 29 Years | 48 (87.3%) | 2 (4.2%) |
| 30 to 34 Years | 74 (100.0%) | 0 (0.0%) |
| 35 to 44 Years | 135 (87.1%) | 0 (0.0%) |
| 45 to 54 Years | 76 (79.2%) | 2 (2.6%) |
| 55 to 59 Years | 131 (97.0%) | 5 (3.8%) |
| 60 to 64 Years | 76 (67.9%) | 3 (3.9%) |
| 65 to 74 Years | 15 (13.4%) | 0 (0.0%) |
| 75 Years and over | 8 (5.8%) | 0 (0.0%) |
| Total | 654 (64.9%) | 12 (1.8%) |
Employment Status by Educational Attainment in Coon Rapids
According to labor force statistics for Coon Rapids, 86.1% of individuals (540) out of the total population between 25 and 64 years of age (627) are in the labor force, with 2.2% or 12 of them being unemployed. The group with the highest labor force participation rate are those with the educational attainment of college / associate degree, with 94.5% or 273 individuals in the labor force. Within the labor force, individuals with high school diploma education have the highest percentage of unemployment, with 5.9% or 7 of them being unemployed.
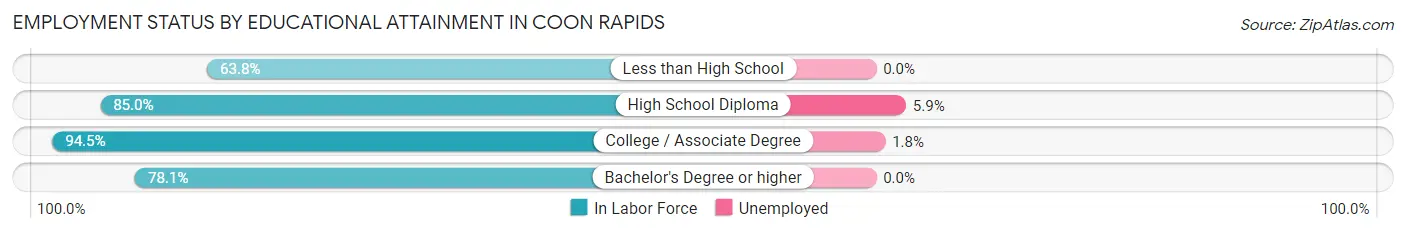
| Educational Attainment | In Labor Force | Unemployed |
| Less than High School | 30 (63.8%) | 0 (0.0%) |
| High School Diploma | 119 (85.0%) | 8 (5.9%) |
| College / Associate Degree | 273 (94.5%) | 5 (1.8%) |
| Bachelor's Degree or higher | 118 (78.1%) | 0 (0.0%) |
| Total | 540 (86.1%) | 14 (2.2%) |
Employment Occupations by Sex in Coon Rapids
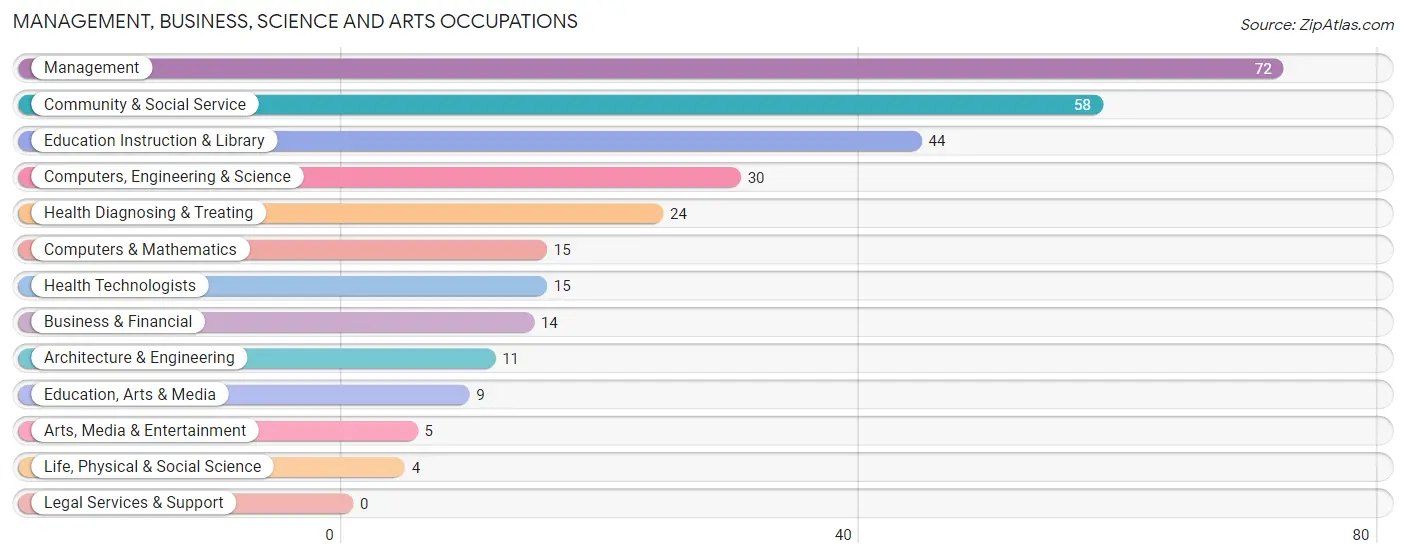
Management, Business, Science and Arts Occupations
The most common Management, Business, Science and Arts occupations in Coon Rapids are Management (72 | 11.2%), Community & Social Service (58 | 9.0%), Education Instruction & Library (44 | 6.9%), Computers, Engineering & Science (30 | 4.7%), and Health Diagnosing & Treating (24 | 3.7%).
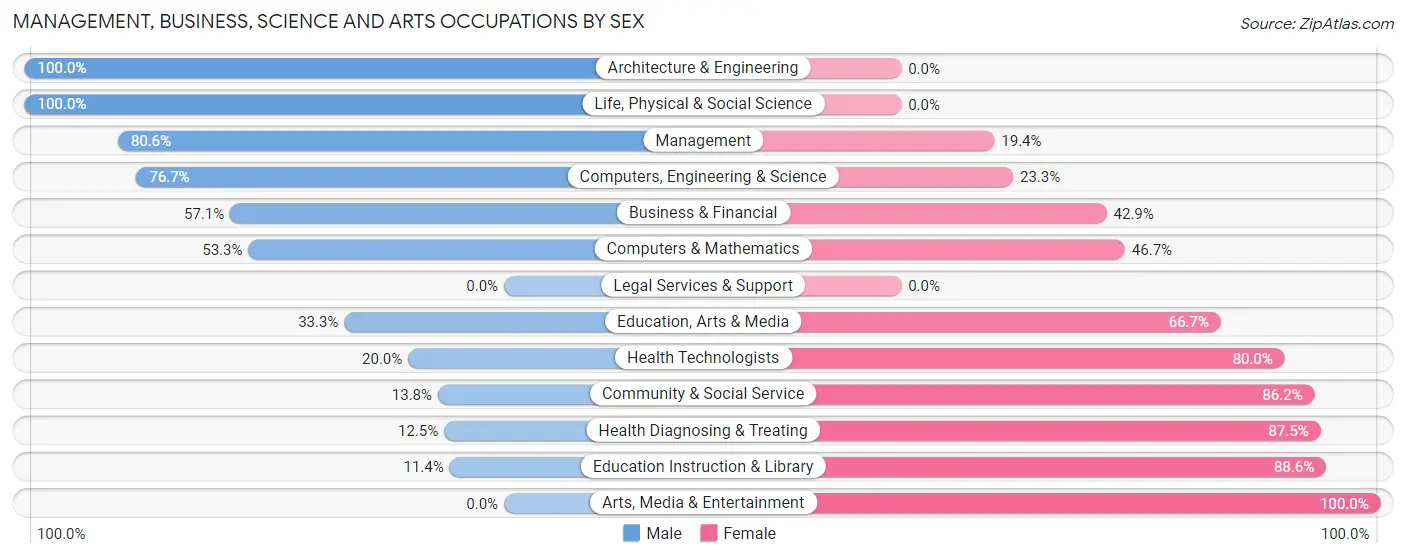
Management, Business, Science and Arts Occupations by Sex
Within the Management, Business, Science and Arts occupations in Coon Rapids, the most male-oriented occupations are Architecture & Engineering (100.0%), Life, Physical & Social Science (100.0%), and Management (80.6%), while the most female-oriented occupations are Arts, Media & Entertainment (100.0%), Education Instruction & Library (88.6%), and Health Diagnosing & Treating (87.5%).
| Occupation | Male | Female |
| Management | 58 (80.6%) | 14 (19.4%) |
| Business & Financial | 8 (57.1%) | 6 (42.9%) |
| Computers, Engineering & Science | 23 (76.7%) | 7 (23.3%) |
| Computers & Mathematics | 8 (53.3%) | 7 (46.7%) |
| Architecture & Engineering | 11 (100.0%) | 0 (0.0%) |
| Life, Physical & Social Science | 4 (100.0%) | 0 (0.0%) |
| Community & Social Service | 8 (13.8%) | 50 (86.2%) |
| Education, Arts & Media | 3 (33.3%) | 6 (66.7%) |
| Legal Services & Support | 0 (0.0%) | 0 (0.0%) |
| Education Instruction & Library | 5 (11.4%) | 39 (88.6%) |
| Arts, Media & Entertainment | 0 (0.0%) | 5 (100.0%) |
| Health Diagnosing & Treating | 3 (12.5%) | 21 (87.5%) |
| Health Technologists | 3 (20.0%) | 12 (80.0%) |
| Total (Category) | 100 (50.5%) | 98 (49.5%) |
| Total (Overall) | 331 (51.6%) | 311 (48.4%) |
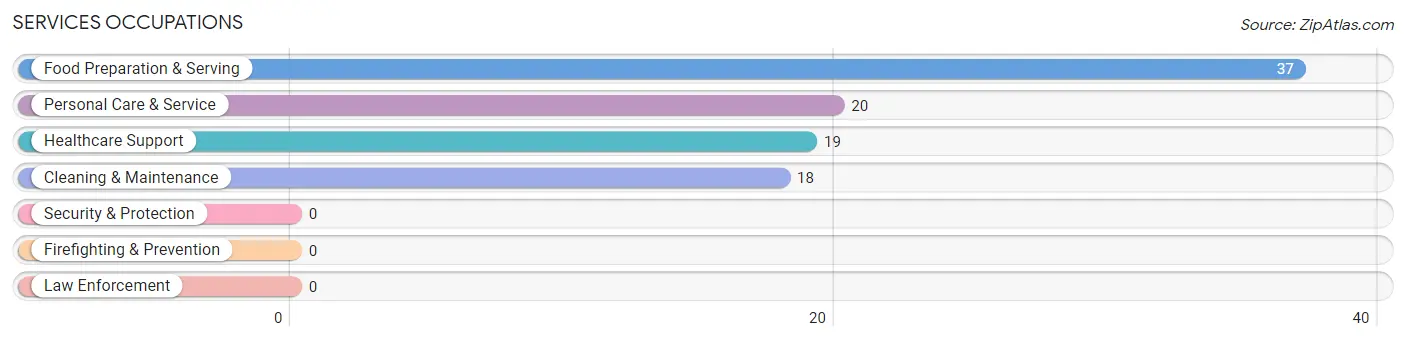
Services Occupations
The most common Services occupations in Coon Rapids are Food Preparation & Serving (37 | 5.8%), Personal Care & Service (20 | 3.1%), Healthcare Support (19 | 3.0%), and Cleaning & Maintenance (18 | 2.8%).
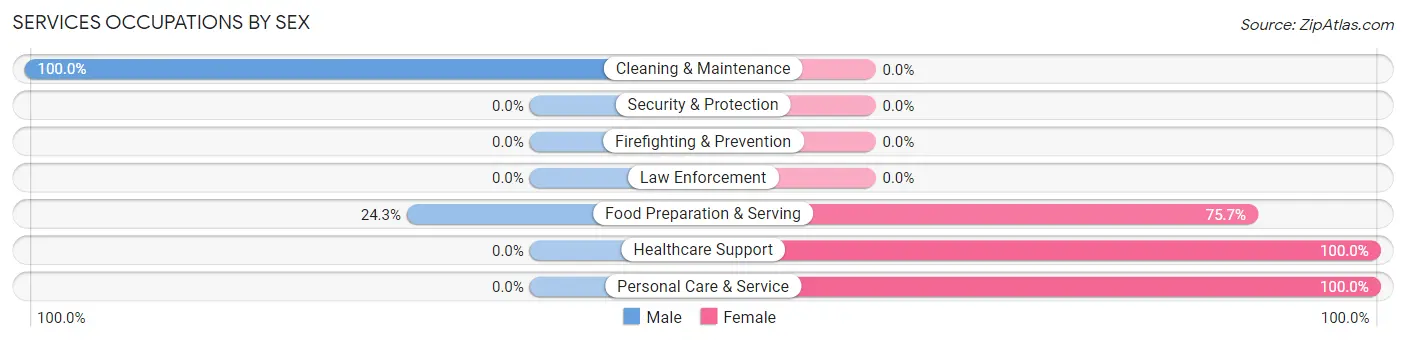
Services Occupations by Sex
Within the Services occupations in Coon Rapids, the most male-oriented occupations are Cleaning & Maintenance (100.0%), and Food Preparation & Serving (24.3%), while the most female-oriented occupations are Healthcare Support (100.0%), Personal Care & Service (100.0%), and Food Preparation & Serving (75.7%).
| Occupation | Male | Female |
| Healthcare Support | 0 (0.0%) | 19 (100.0%) |
| Security & Protection | 0 (0.0%) | 0 (0.0%) |
| Firefighting & Prevention | 0 (0.0%) | 0 (0.0%) |
| Law Enforcement | 0 (0.0%) | 0 (0.0%) |
| Food Preparation & Serving | 9 (24.3%) | 28 (75.7%) |
| Cleaning & Maintenance | 18 (100.0%) | 0 (0.0%) |
| Personal Care & Service | 0 (0.0%) | 20 (100.0%) |
| Total (Category) | 27 (28.7%) | 67 (71.3%) |
| Total (Overall) | 331 (51.6%) | 311 (48.4%) |
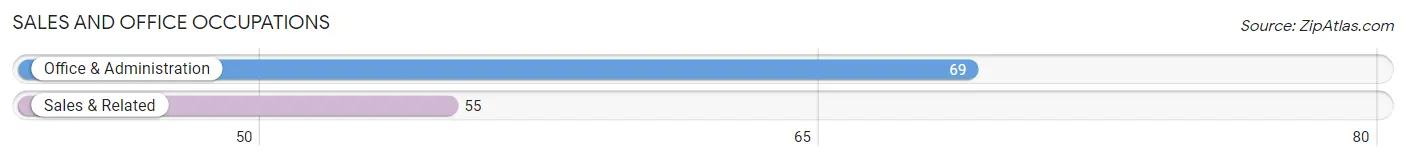
Sales and Office Occupations
The most common Sales and Office occupations in Coon Rapids are Office & Administration (69 | 10.7%), and Sales & Related (55 | 8.6%).
Sales and Office Occupations by Sex
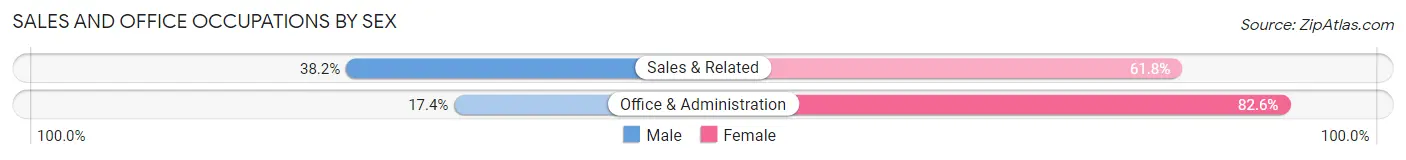
| Occupation | Male | Female |
| Sales & Related | 21 (38.2%) | 34 (61.8%) |
| Office & Administration | 12 (17.4%) | 57 (82.6%) |
| Total (Category) | 33 (26.6%) | 91 (73.4%) |
| Total (Overall) | 331 (51.6%) | 311 (48.4%) |
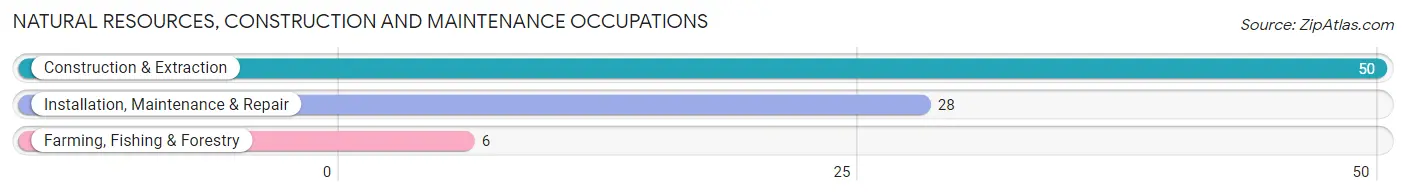
Natural Resources, Construction and Maintenance Occupations
The most common Natural Resources, Construction and Maintenance occupations in Coon Rapids are Construction & Extraction (50 | 7.8%), Installation, Maintenance & Repair (28 | 4.4%), and Farming, Fishing & Forestry (6 | 0.9%).
Natural Resources, Construction and Maintenance Occupations by Sex
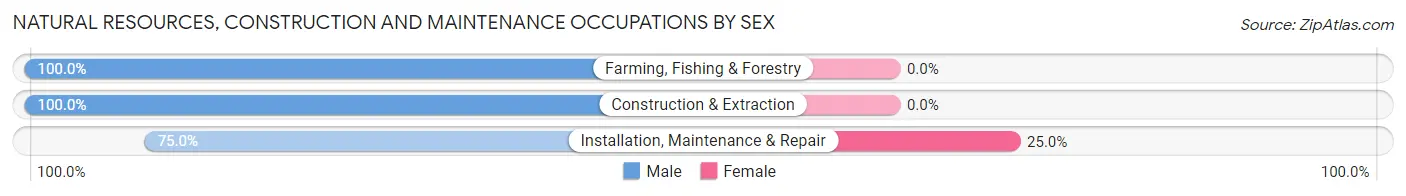
| Occupation | Male | Female |
| Farming, Fishing & Forestry | 6 (100.0%) | 0 (0.0%) |
| Construction & Extraction | 50 (100.0%) | 0 (0.0%) |
| Installation, Maintenance & Repair | 21 (75.0%) | 7 (25.0%) |
| Total (Category) | 77 (91.7%) | 7 (8.3%) |
| Total (Overall) | 331 (51.6%) | 311 (48.4%) |
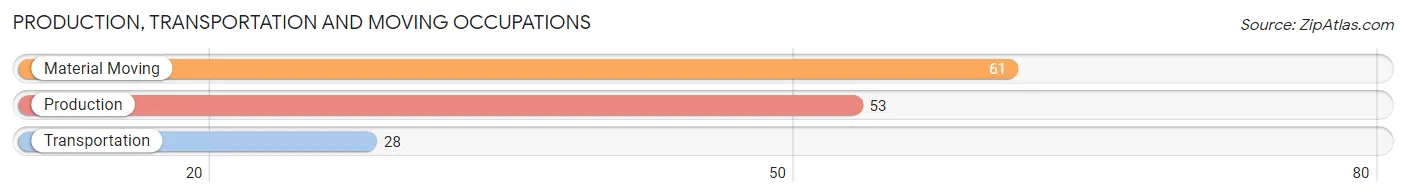
Production, Transportation and Moving Occupations
The most common Production, Transportation and Moving occupations in Coon Rapids are Material Moving (61 | 9.5%), Production (53 | 8.3%), and Transportation (28 | 4.4%).
Production, Transportation and Moving Occupations by Sex
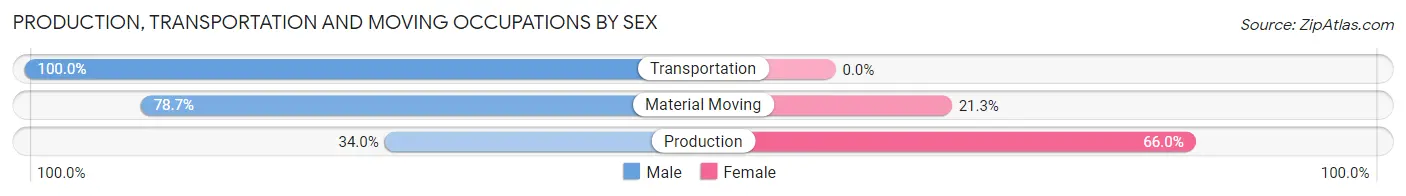
| Occupation | Male | Female |
| Production | 18 (34.0%) | 35 (66.0%) |
| Transportation | 28 (100.0%) | 0 (0.0%) |
| Material Moving | 48 (78.7%) | 13 (21.3%) |
| Total (Category) | 94 (66.2%) | 48 (33.8%) |
| Total (Overall) | 331 (51.6%) | 311 (48.4%) |
Employment Industries by Sex in Coon Rapids
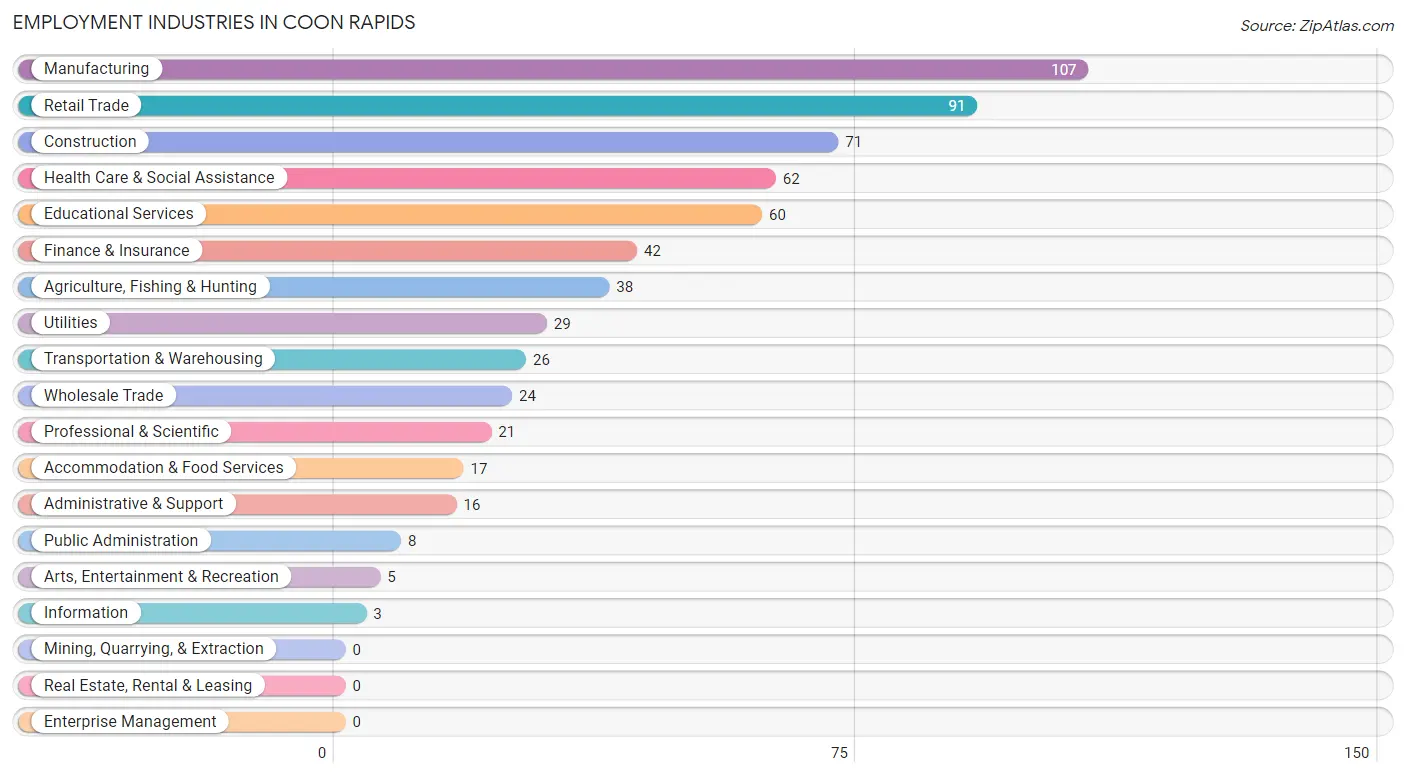
Employment Industries in Coon Rapids
The major employment industries in Coon Rapids include Manufacturing (107 | 16.7%), Retail Trade (91 | 14.2%), Construction (71 | 11.1%), Health Care & Social Assistance (62 | 9.7%), and Educational Services (60 | 9.3%).
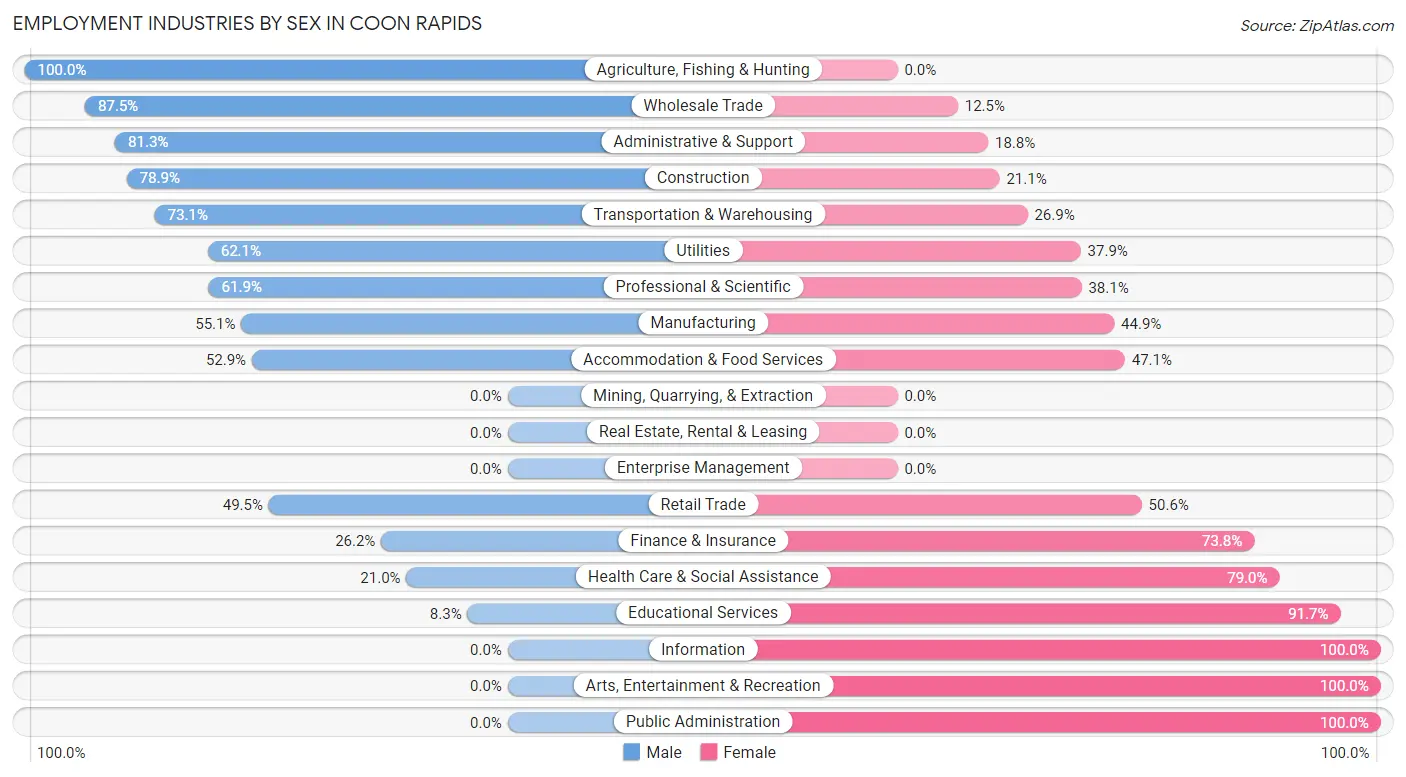
Employment Industries by Sex in Coon Rapids
The Coon Rapids industries that see more men than women are Agriculture, Fishing & Hunting (100.0%), Wholesale Trade (87.5%), and Administrative & Support (81.2%), whereas the industries that tend to have a higher number of women are Information (100.0%), Arts, Entertainment & Recreation (100.0%), and Public Administration (100.0%).
| Industry | Male | Female |
| Agriculture, Fishing & Hunting | 38 (100.0%) | 0 (0.0%) |
| Mining, Quarrying, & Extraction | 0 (0.0%) | 0 (0.0%) |
| Construction | 56 (78.9%) | 15 (21.1%) |
| Manufacturing | 59 (55.1%) | 48 (44.9%) |
| Wholesale Trade | 21 (87.5%) | 3 (12.5%) |
| Retail Trade | 45 (49.4%) | 46 (50.5%) |
| Transportation & Warehousing | 19 (73.1%) | 7 (26.9%) |
| Utilities | 18 (62.1%) | 11 (37.9%) |
| Information | 0 (0.0%) | 3 (100.0%) |
| Finance & Insurance | 11 (26.2%) | 31 (73.8%) |
| Real Estate, Rental & Leasing | 0 (0.0%) | 0 (0.0%) |
| Professional & Scientific | 13 (61.9%) | 8 (38.1%) |
| Enterprise Management | 0 (0.0%) | 0 (0.0%) |
| Administrative & Support | 13 (81.2%) | 3 (18.8%) |
| Educational Services | 5 (8.3%) | 55 (91.7%) |
| Health Care & Social Assistance | 13 (21.0%) | 49 (79.0%) |
| Arts, Entertainment & Recreation | 0 (0.0%) | 5 (100.0%) |
| Accommodation & Food Services | 9 (52.9%) | 8 (47.1%) |
| Public Administration | 0 (0.0%) | 8 (100.0%) |
| Total | 331 (51.6%) | 311 (48.4%) |
Education in Coon Rapids
School Enrollment in Coon Rapids
The most common levels of schooling among the 360 students in Coon Rapids are elementary school (118 | 32.8%), high school (82 | 22.8%), and middle school (81 | 22.5%).
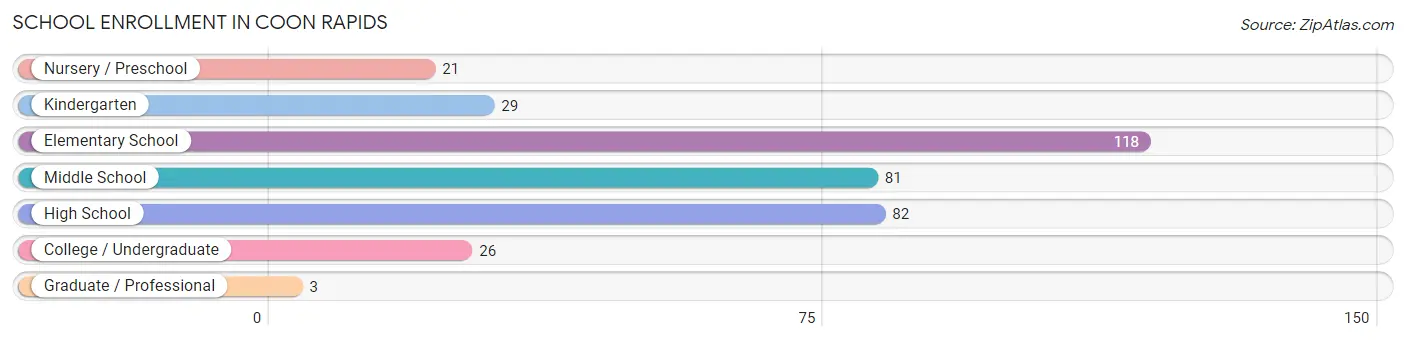
| School Level | # Students | % Students |
| Nursery / Preschool | 21 | 5.8% |
| Kindergarten | 29 | 8.1% |
| Elementary School | 118 | 32.8% |
| Middle School | 81 | 22.5% |
| High School | 82 | 22.8% |
| College / Undergraduate | 26 | 7.2% |
| Graduate / Professional | 3 | 0.8% |
| Total | 360 | 100.0% |
School Enrollment by Age by Funding Source in Coon Rapids
Out of a total of 360 students who are enrolled in schools in Coon Rapids, 23 (6.4%) attend a private institution, while the remaining 337 (93.6%) are enrolled in public schools. The age group of 15 to 17 year olds has the highest likelihood of being enrolled in private schools, with 9 (13.9% in the age bracket) enrolled. Conversely, the age group of 3 to 4 year olds has the lowest likelihood of being enrolled in a private school, with 22 (100.0% in the age bracket) attending a public institution.
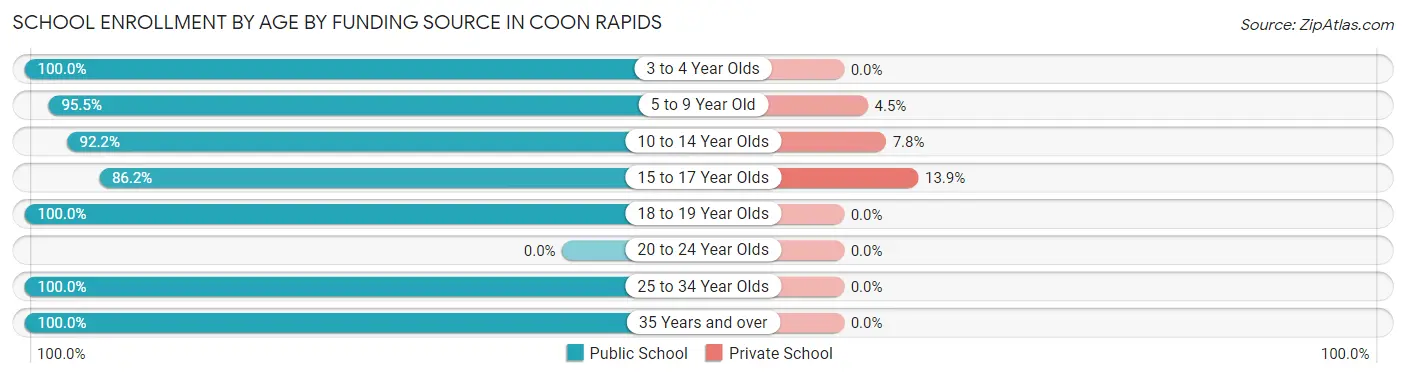
| Age Bracket | Public School | Private School |
| 3 to 4 Year Olds | 22 (100.0%) | 0 (0.0%) |
| 5 to 9 Year Old | 107 (95.5%) | 5 (4.5%) |
| 10 to 14 Year Olds | 106 (92.2%) | 9 (7.8%) |
| 15 to 17 Year Olds | 56 (86.2%) | 9 (13.9%) |
| 18 to 19 Year Olds | 22 (100.0%) | 0 (0.0%) |
| 20 to 24 Year Olds | 0 (0.0%) | 0 (0.0%) |
| 25 to 34 Year Olds | 15 (100.0%) | 0 (0.0%) |
| 35 Years and over | 9 (100.0%) | 0 (0.0%) |
| Total | 337 (93.6%) | 23 (6.4%) |
Educational Attainment by Field of Study in Coon Rapids
Education (50 | 25.1%), business (40 | 20.1%), science & technology (25 | 12.6%), arts & humanities (14 | 7.0%), and psychology (13 | 6.5%) are the most common fields of study among 199 individuals in Coon Rapids who have obtained a bachelor's degree or higher.
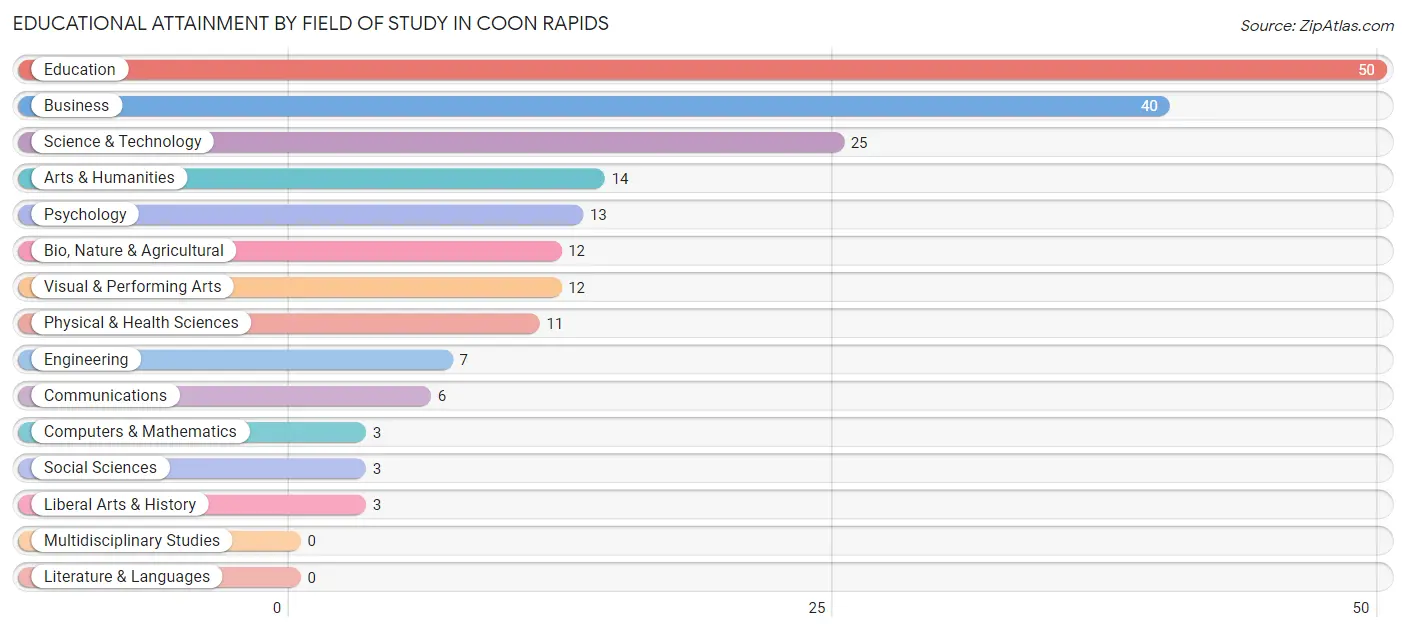
| Field of Study | # Graduates | % Graduates |
| Computers & Mathematics | 3 | 1.5% |
| Bio, Nature & Agricultural | 12 | 6.0% |
| Physical & Health Sciences | 11 | 5.5% |
| Psychology | 13 | 6.5% |
| Social Sciences | 3 | 1.5% |
| Engineering | 7 | 3.5% |
| Multidisciplinary Studies | 0 | 0.0% |
| Science & Technology | 25 | 12.6% |
| Business | 40 | 20.1% |
| Education | 50 | 25.1% |
| Literature & Languages | 0 | 0.0% |
| Liberal Arts & History | 3 | 1.5% |
| Visual & Performing Arts | 12 | 6.0% |
| Communications | 6 | 3.0% |
| Arts & Humanities | 14 | 7.0% |
| Total | 199 | 100.0% |
Transportation & Commute in Coon Rapids
Vehicle Availability by Sex in Coon Rapids
The most prevalent vehicle ownership categories in Coon Rapids are males with 3 vehicles (111, accounting for 33.5%) and females with 3 vehicles (113, making up 35.7%).
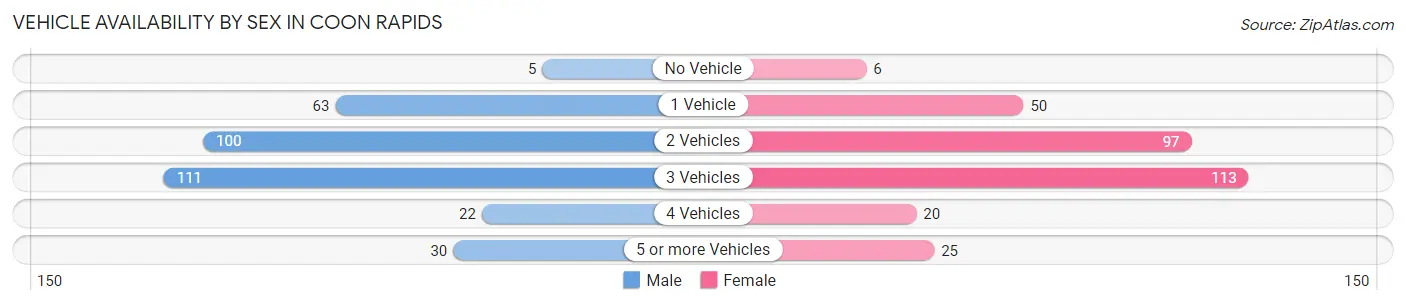
| Vehicles Available | Male | Female |
| No Vehicle | 5 (1.5%) | 6 (1.9%) |
| 1 Vehicle | 63 (19.0%) | 50 (16.1%) |
| 2 Vehicles | 100 (30.2%) | 97 (31.2%) |
| 3 Vehicles | 111 (33.5%) | 113 (36.3%) |
| 4 Vehicles | 22 (6.7%) | 20 (6.4%) |
| 5 or more Vehicles | 30 (9.1%) | 25 (8.0%) |
| Total | 331 (100.0%) | 311 (100.0%) |
Commute Time in Coon Rapids
The most frequently occuring commute durations in Coon Rapids are 5 to 9 minutes (132 commuters, 21.7%), less than 5 minutes (100 commuters, 16.4%), and 25 to 29 minutes (90 commuters, 14.8%).
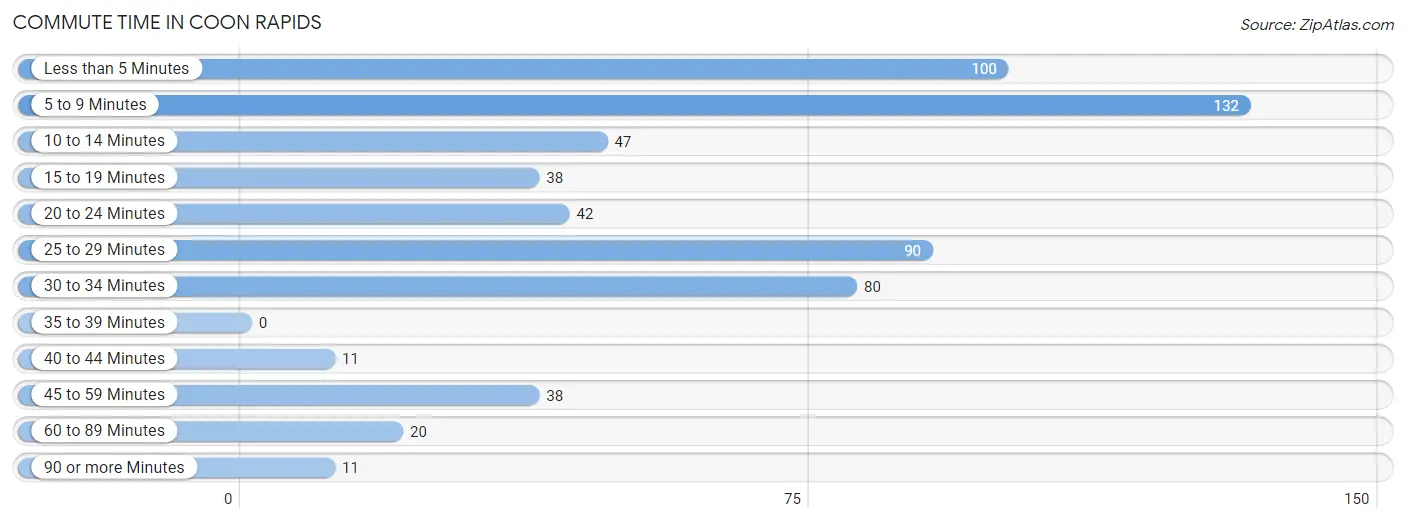
| Commute Time | # Commuters | % Commuters |
| Less than 5 Minutes | 100 | 16.4% |
| 5 to 9 Minutes | 132 | 21.7% |
| 10 to 14 Minutes | 47 | 7.7% |
| 15 to 19 Minutes | 38 | 6.2% |
| 20 to 24 Minutes | 42 | 6.9% |
| 25 to 29 Minutes | 90 | 14.8% |
| 30 to 34 Minutes | 80 | 13.1% |
| 35 to 39 Minutes | 0 | 0.0% |
| 40 to 44 Minutes | 11 | 1.8% |
| 45 to 59 Minutes | 38 | 6.2% |
| 60 to 89 Minutes | 20 | 3.3% |
| 90 or more Minutes | 11 | 1.8% |
Commute Time by Sex in Coon Rapids
The most common commute times in Coon Rapids are 5 to 9 minutes (62 commuters, 19.3%) for males and 5 to 9 minutes (70 commuters, 24.3%) for females.
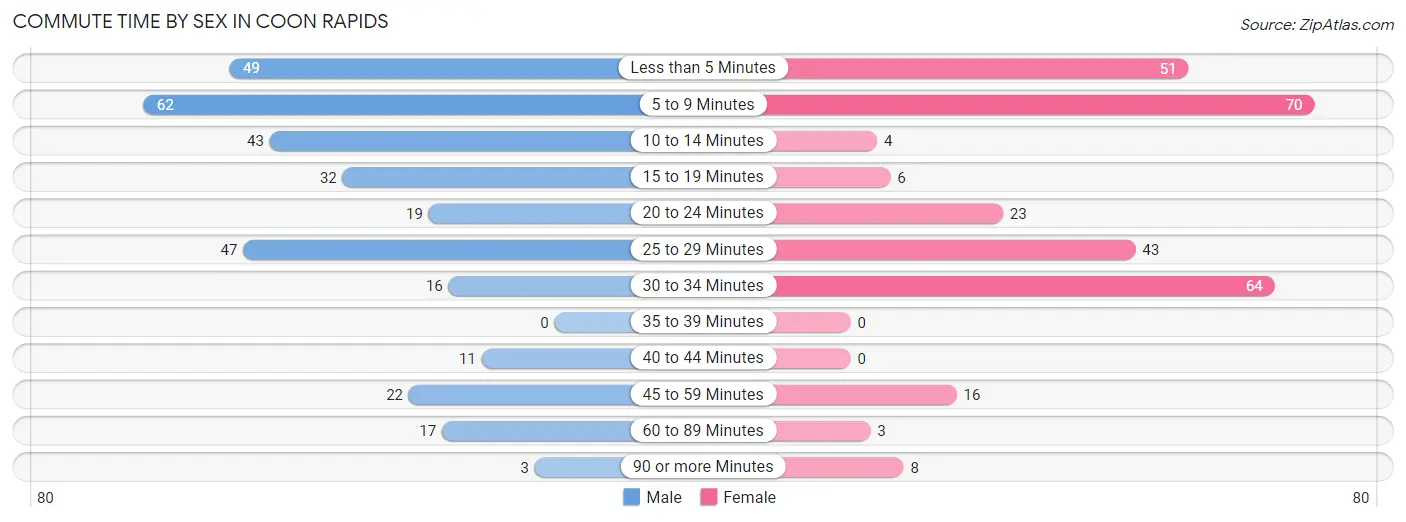
| Commute Time | Male | Female |
| Less than 5 Minutes | 49 (15.3%) | 51 (17.7%) |
| 5 to 9 Minutes | 62 (19.3%) | 70 (24.3%) |
| 10 to 14 Minutes | 43 (13.4%) | 4 (1.4%) |
| 15 to 19 Minutes | 32 (10.0%) | 6 (2.1%) |
| 20 to 24 Minutes | 19 (5.9%) | 23 (8.0%) |
| 25 to 29 Minutes | 47 (14.6%) | 43 (14.9%) |
| 30 to 34 Minutes | 16 (5.0%) | 64 (22.2%) |
| 35 to 39 Minutes | 0 (0.0%) | 0 (0.0%) |
| 40 to 44 Minutes | 11 (3.4%) | 0 (0.0%) |
| 45 to 59 Minutes | 22 (6.9%) | 16 (5.6%) |
| 60 to 89 Minutes | 17 (5.3%) | 3 (1.0%) |
| 90 or more Minutes | 3 (0.9%) | 8 (2.8%) |
Time of Departure to Work by Sex in Coon Rapids
The most frequent times of departure to work in Coon Rapids are 7:00 AM to 7:29 AM (72, 22.4%) for males and 8:00 AM to 8:29 AM (82, 28.5%) for females.
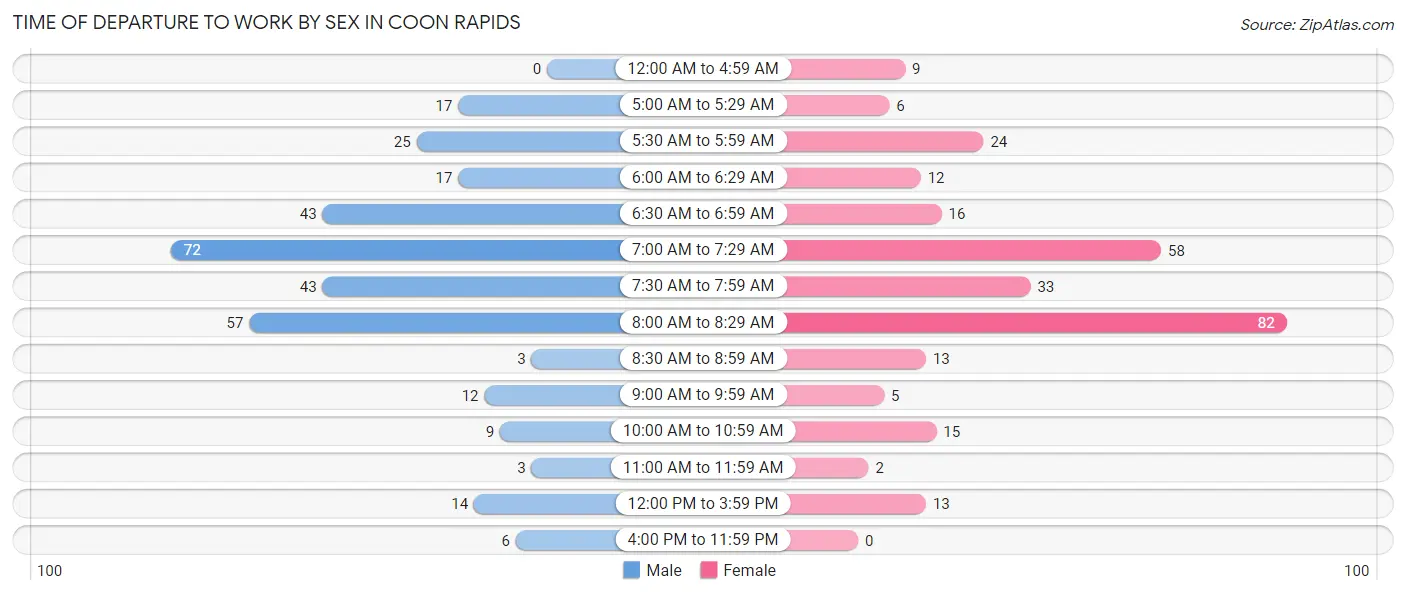
| Time of Departure | Male | Female |
| 12:00 AM to 4:59 AM | 0 (0.0%) | 9 (3.1%) |
| 5:00 AM to 5:29 AM | 17 (5.3%) | 6 (2.1%) |
| 5:30 AM to 5:59 AM | 25 (7.8%) | 24 (8.3%) |
| 6:00 AM to 6:29 AM | 17 (5.3%) | 12 (4.2%) |
| 6:30 AM to 6:59 AM | 43 (13.4%) | 16 (5.6%) |
| 7:00 AM to 7:29 AM | 72 (22.4%) | 58 (20.1%) |
| 7:30 AM to 7:59 AM | 43 (13.4%) | 33 (11.5%) |
| 8:00 AM to 8:29 AM | 57 (17.8%) | 82 (28.5%) |
| 8:30 AM to 8:59 AM | 3 (0.9%) | 13 (4.5%) |
| 9:00 AM to 9:59 AM | 12 (3.7%) | 5 (1.7%) |
| 10:00 AM to 10:59 AM | 9 (2.8%) | 15 (5.2%) |
| 11:00 AM to 11:59 AM | 3 (0.9%) | 2 (0.7%) |
| 12:00 PM to 3:59 PM | 14 (4.4%) | 13 (4.5%) |
| 4:00 PM to 11:59 PM | 6 (1.9%) | 0 (0.0%) |
| Total | 321 (100.0%) | 288 (100.0%) |
Housing Occupancy in Coon Rapids
Occupancy by Ownership in Coon Rapids
Of the total 529 dwellings in Coon Rapids, owner-occupied units account for 403 (76.2%), while renter-occupied units make up 126 (23.8%).
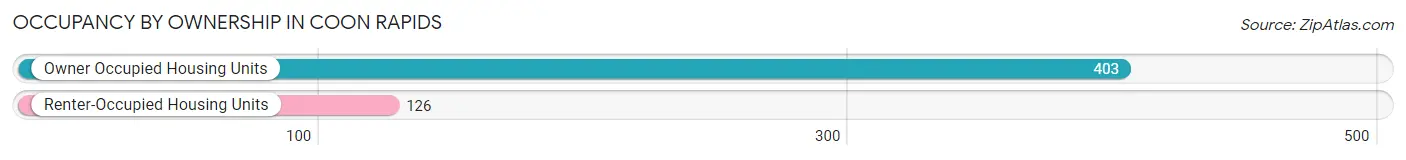
| Occupancy | # Housing Units | % Housing Units |
| Owner Occupied Housing Units | 403 | 76.2% |
| Renter-Occupied Housing Units | 126 | 23.8% |
| Total Occupied Housing Units | 529 | 100.0% |
Occupancy by Household Size in Coon Rapids
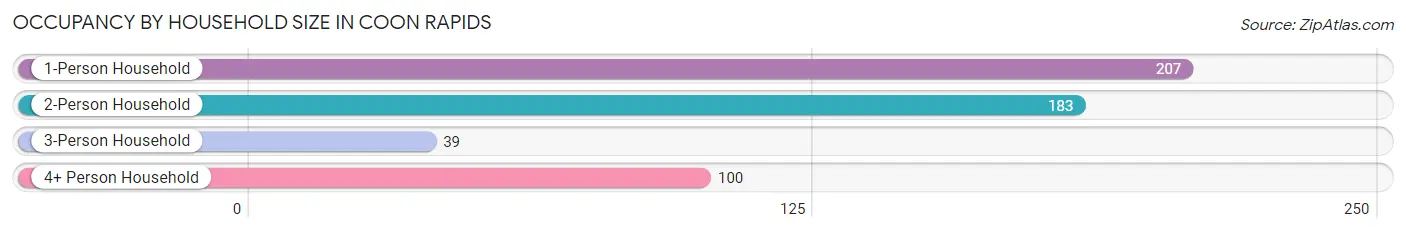
| Household Size | # Housing Units | % Housing Units |
| 1-Person Household | 207 | 39.1% |
| 2-Person Household | 183 | 34.6% |
| 3-Person Household | 39 | 7.4% |
| 4+ Person Household | 100 | 18.9% |
| Total Housing Units | 529 | 100.0% |
Occupancy by Ownership by Household Size in Coon Rapids
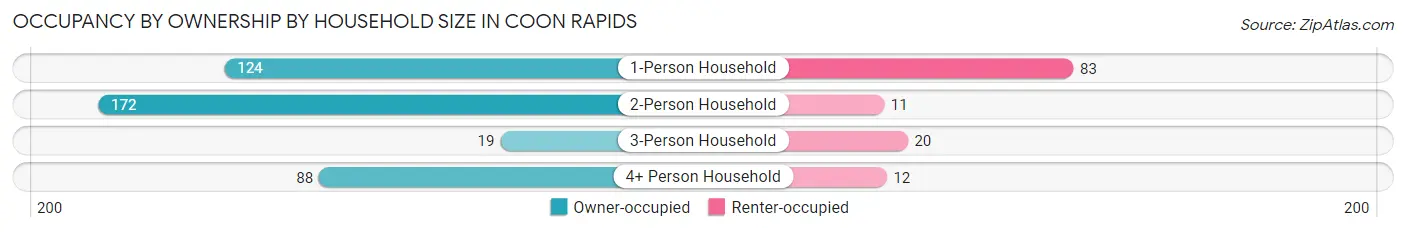
| Household Size | Owner-occupied | Renter-occupied |
| 1-Person Household | 124 (59.9%) | 83 (40.1%) |
| 2-Person Household | 172 (94.0%) | 11 (6.0%) |
| 3-Person Household | 19 (48.7%) | 20 (51.3%) |
| 4+ Person Household | 88 (88.0%) | 12 (12.0%) |
| Total Housing Units | 403 (76.2%) | 126 (23.8%) |
Occupancy by Educational Attainment in Coon Rapids
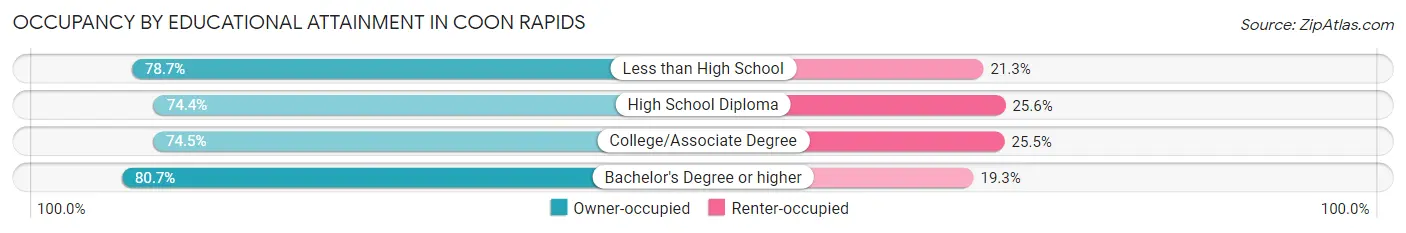
| Household Size | Owner-occupied | Renter-occupied |
| Less than High School | 37 (78.7%) | 10 (21.3%) |
| High School Diploma | 116 (74.4%) | 40 (25.6%) |
| College/Associate Degree | 158 (74.5%) | 54 (25.5%) |
| Bachelor's Degree or higher | 92 (80.7%) | 22 (19.3%) |
Occupancy by Age of Householder in Coon Rapids
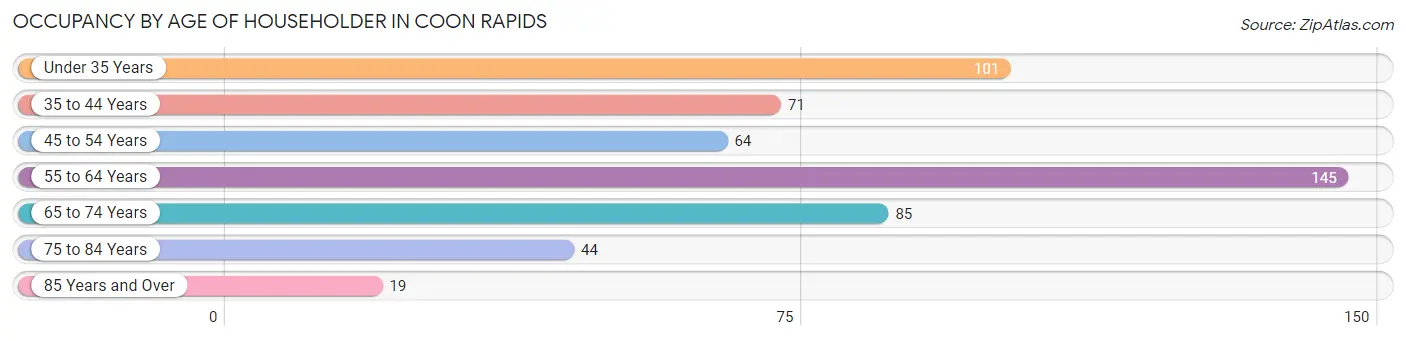
| Age Bracket | # Households | % Households |
| Under 35 Years | 101 | 19.1% |
| 35 to 44 Years | 71 | 13.4% |
| 45 to 54 Years | 64 | 12.1% |
| 55 to 64 Years | 145 | 27.4% |
| 65 to 74 Years | 85 | 16.1% |
| 75 to 84 Years | 44 | 8.3% |
| 85 Years and Over | 19 | 3.6% |
| Total | 529 | 100.0% |
Housing Finances in Coon Rapids
Median Income by Occupancy in Coon Rapids
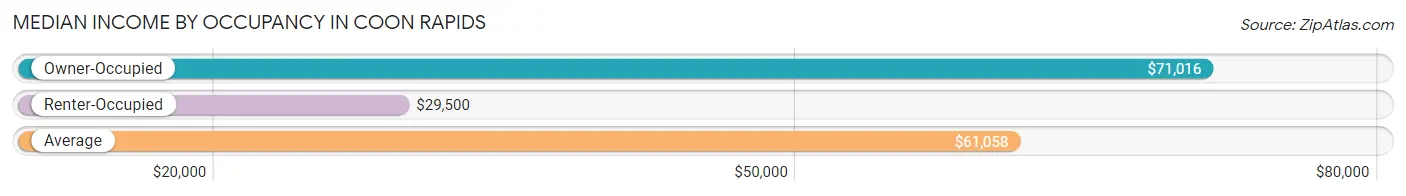
| Occupancy Type | # Households | Median Income |
| Owner-Occupied | 403 (76.2%) | $71,016 |
| Renter-Occupied | 126 (23.8%) | $29,500 |
| Average | 529 (100.0%) | $61,058 |
Occupancy by Householder Income Bracket in Coon Rapids
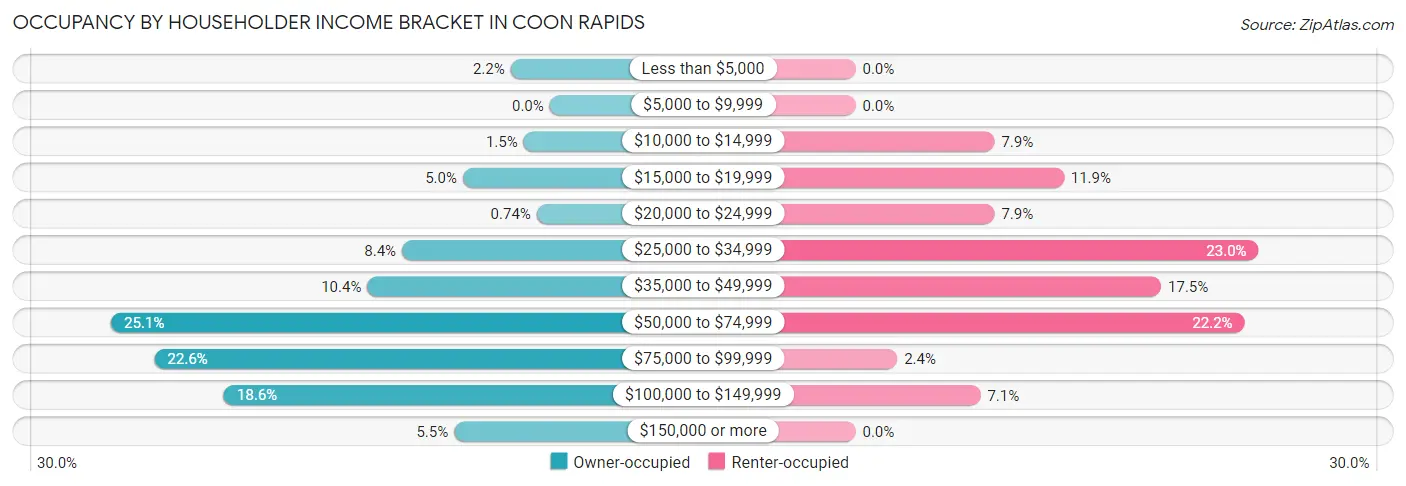
| Income Bracket | Owner-occupied | Renter-occupied |
| Less than $5,000 | 9 (2.2%) | 0 (0.0%) |
| $5,000 to $9,999 | 0 (0.0%) | 0 (0.0%) |
| $10,000 to $14,999 | 6 (1.5%) | 10 (7.9%) |
| $15,000 to $19,999 | 20 (5.0%) | 15 (11.9%) |
| $20,000 to $24,999 | 3 (0.7%) | 10 (7.9%) |
| $25,000 to $34,999 | 34 (8.4%) | 29 (23.0%) |
| $35,000 to $49,999 | 42 (10.4%) | 22 (17.5%) |
| $50,000 to $74,999 | 101 (25.1%) | 28 (22.2%) |
| $75,000 to $99,999 | 91 (22.6%) | 3 (2.4%) |
| $100,000 to $149,999 | 75 (18.6%) | 9 (7.1%) |
| $150,000 or more | 22 (5.5%) | 0 (0.0%) |
| Total | 403 (100.0%) | 126 (100.0%) |
Monthly Housing Cost Tiers in Coon Rapids
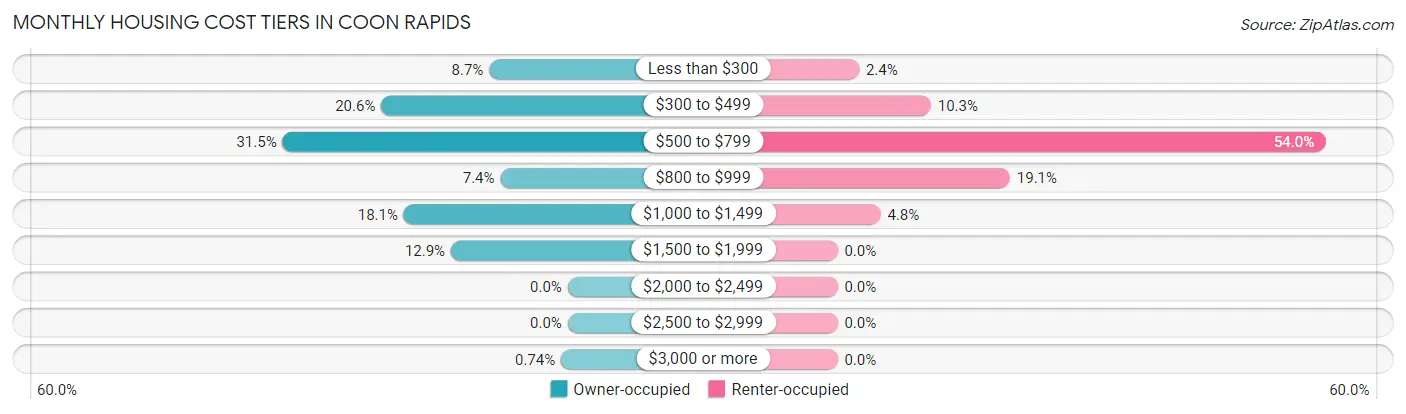
| Monthly Cost | Owner-occupied | Renter-occupied |
| Less than $300 | 35 (8.7%) | 3 (2.4%) |
| $300 to $499 | 83 (20.6%) | 13 (10.3%) |
| $500 to $799 | 127 (31.5%) | 68 (54.0%) |
| $800 to $999 | 30 (7.4%) | 24 (19.1%) |
| $1,000 to $1,499 | 73 (18.1%) | 6 (4.8%) |
| $1,500 to $1,999 | 52 (12.9%) | 0 (0.0%) |
| $2,000 to $2,499 | 0 (0.0%) | 0 (0.0%) |
| $2,500 to $2,999 | 0 (0.0%) | 0 (0.0%) |
| $3,000 or more | 3 (0.7%) | 0 (0.0%) |
| Total | 403 (100.0%) | 126 (100.0%) |
Physical Housing Characteristics in Coon Rapids
Housing Structures in Coon Rapids
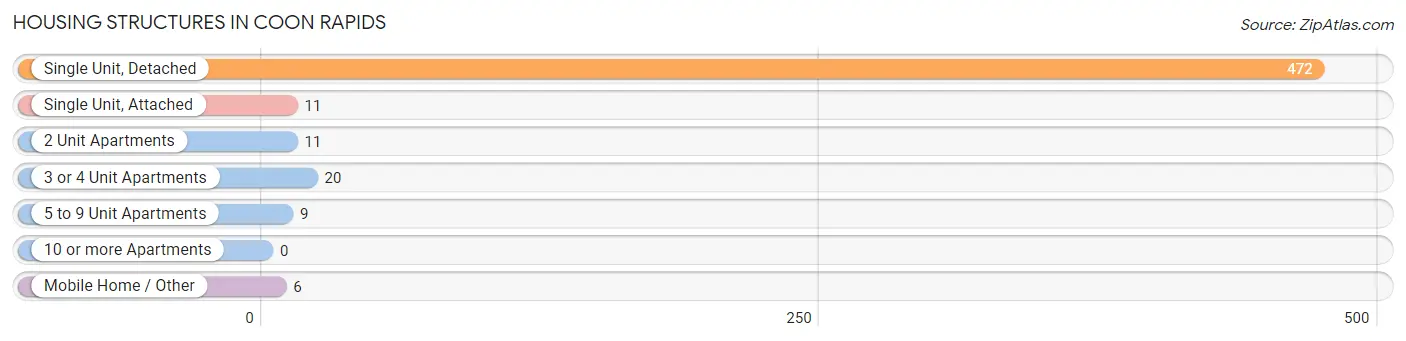
| Structure Type | # Housing Units | % Housing Units |
| Single Unit, Detached | 472 | 89.2% |
| Single Unit, Attached | 11 | 2.1% |
| 2 Unit Apartments | 11 | 2.1% |
| 3 or 4 Unit Apartments | 20 | 3.8% |
| 5 to 9 Unit Apartments | 9 | 1.7% |
| 10 or more Apartments | 0 | 0.0% |
| Mobile Home / Other | 6 | 1.1% |
| Total | 529 | 100.0% |
Housing Structures by Occupancy in Coon Rapids
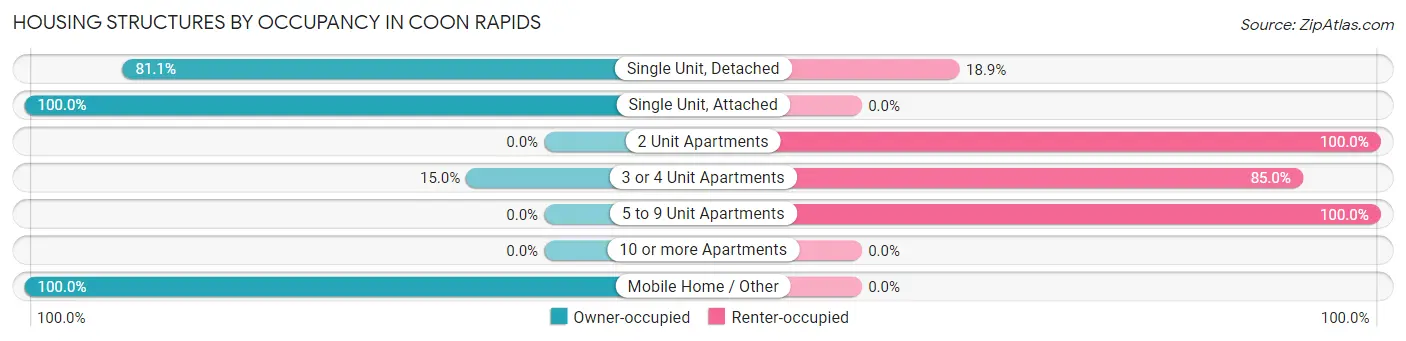
| Structure Type | Owner-occupied | Renter-occupied |
| Single Unit, Detached | 383 (81.1%) | 89 (18.9%) |
| Single Unit, Attached | 11 (100.0%) | 0 (0.0%) |
| 2 Unit Apartments | 0 (0.0%) | 11 (100.0%) |
| 3 or 4 Unit Apartments | 3 (15.0%) | 17 (85.0%) |
| 5 to 9 Unit Apartments | 0 (0.0%) | 9 (100.0%) |
| 10 or more Apartments | 0 (0.0%) | 0 (0.0%) |
| Mobile Home / Other | 6 (100.0%) | 0 (0.0%) |
| Total | 403 (76.2%) | 126 (23.8%) |
Housing Structures by Number of Rooms in Coon Rapids
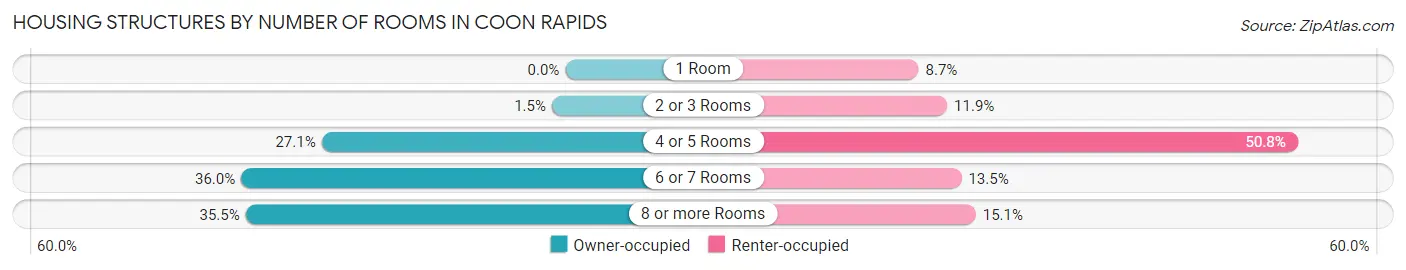
| Number of Rooms | Owner-occupied | Renter-occupied |
| 1 Room | 0 (0.0%) | 11 (8.7%) |
| 2 or 3 Rooms | 6 (1.5%) | 15 (11.9%) |
| 4 or 5 Rooms | 109 (27.1%) | 64 (50.8%) |
| 6 or 7 Rooms | 145 (36.0%) | 17 (13.5%) |
| 8 or more Rooms | 143 (35.5%) | 19 (15.1%) |
| Total | 403 (100.0%) | 126 (100.0%) |
Housing Structure by Heating Type in Coon Rapids
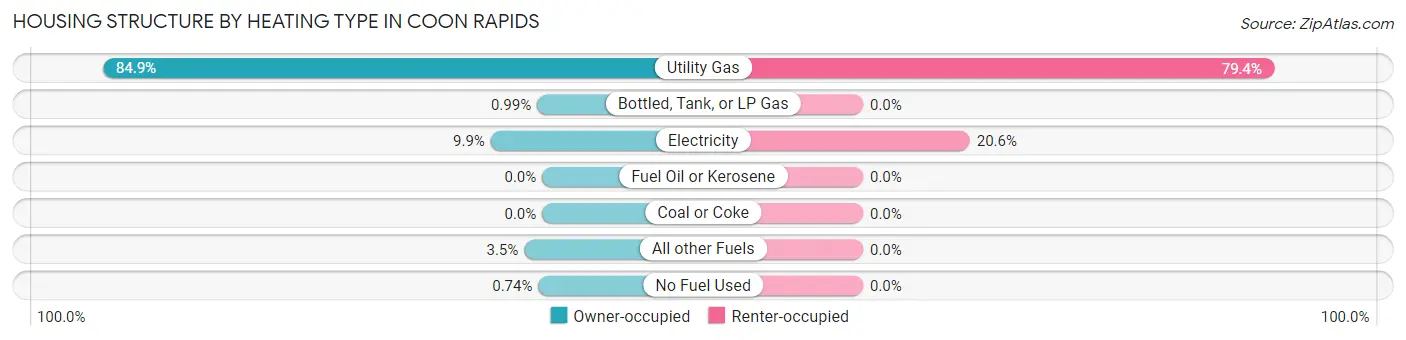
| Heating Type | Owner-occupied | Renter-occupied |
| Utility Gas | 342 (84.9%) | 100 (79.4%) |
| Bottled, Tank, or LP Gas | 4 (1.0%) | 0 (0.0%) |
| Electricity | 40 (9.9%) | 26 (20.6%) |
| Fuel Oil or Kerosene | 0 (0.0%) | 0 (0.0%) |
| Coal or Coke | 0 (0.0%) | 0 (0.0%) |
| All other Fuels | 14 (3.5%) | 0 (0.0%) |
| No Fuel Used | 3 (0.7%) | 0 (0.0%) |
| Total | 403 (100.0%) | 126 (100.0%) |
Household Vehicle Usage in Coon Rapids
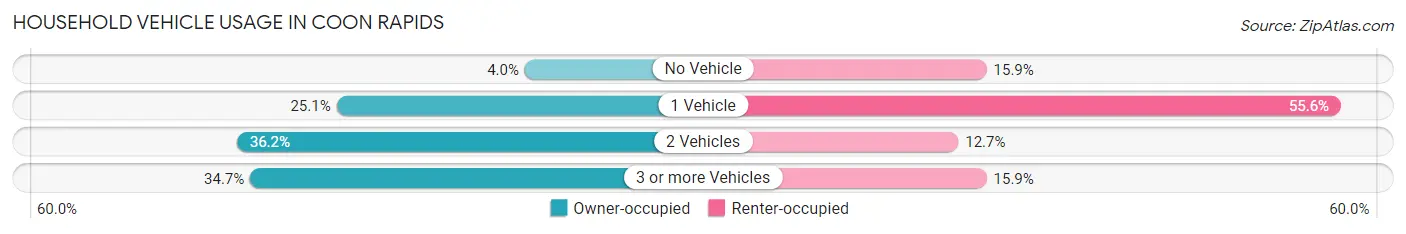
| Vehicles per Household | Owner-occupied | Renter-occupied |
| No Vehicle | 16 (4.0%) | 20 (15.9%) |
| 1 Vehicle | 101 (25.1%) | 70 (55.6%) |
| 2 Vehicles | 146 (36.2%) | 16 (12.7%) |
| 3 or more Vehicles | 140 (34.7%) | 20 (15.9%) |
| Total | 403 (100.0%) | 126 (100.0%) |
Real Estate & Mortgages in Coon Rapids
Real Estate and Mortgage Overview in Coon Rapids
| Characteristic | Without Mortgage | With Mortgage |
| Housing Units | 225 | 178 |
| Median Property Value | $101,300 | $135,000 |
| Median Household Income | $63,393 | $16 |
| Monthly Housing Costs | $485 | $3 |
| Real Estate Taxes | $1,418 | $0 |
Property Value by Mortgage Status in Coon Rapids
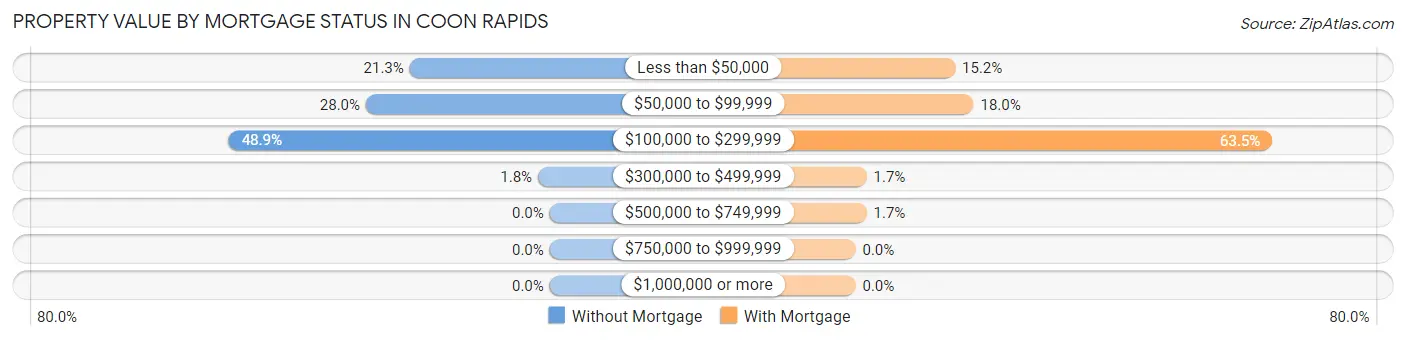
| Property Value | Without Mortgage | With Mortgage |
| Less than $50,000 | 48 (21.3%) | 27 (15.2%) |
| $50,000 to $99,999 | 63 (28.0%) | 32 (18.0%) |
| $100,000 to $299,999 | 110 (48.9%) | 113 (63.5%) |
| $300,000 to $499,999 | 4 (1.8%) | 3 (1.7%) |
| $500,000 to $749,999 | 0 (0.0%) | 3 (1.7%) |
| $750,000 to $999,999 | 0 (0.0%) | 0 (0.0%) |
| $1,000,000 or more | 0 (0.0%) | 0 (0.0%) |
| Total | 225 (100.0%) | 178 (100.0%) |
Household Income by Mortgage Status in Coon Rapids
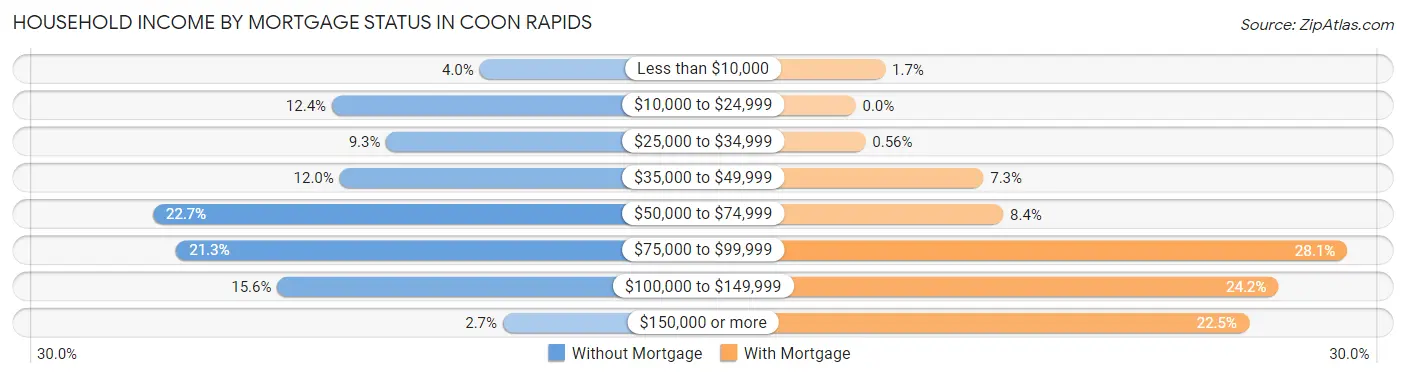
| Household Income | Without Mortgage | With Mortgage |
| Less than $10,000 | 9 (4.0%) | 3 (1.7%) |
| $10,000 to $24,999 | 28 (12.4%) | 0 (0.0%) |
| $25,000 to $34,999 | 21 (9.3%) | 1 (0.6%) |
| $35,000 to $49,999 | 27 (12.0%) | 13 (7.3%) |
| $50,000 to $74,999 | 51 (22.7%) | 15 (8.4%) |
| $75,000 to $99,999 | 48 (21.3%) | 50 (28.1%) |
| $100,000 to $149,999 | 35 (15.6%) | 43 (24.2%) |
| $150,000 or more | 6 (2.7%) | 40 (22.5%) |
| Total | 225 (100.0%) | 178 (100.0%) |
Property Value to Household Income Ratio in Coon Rapids
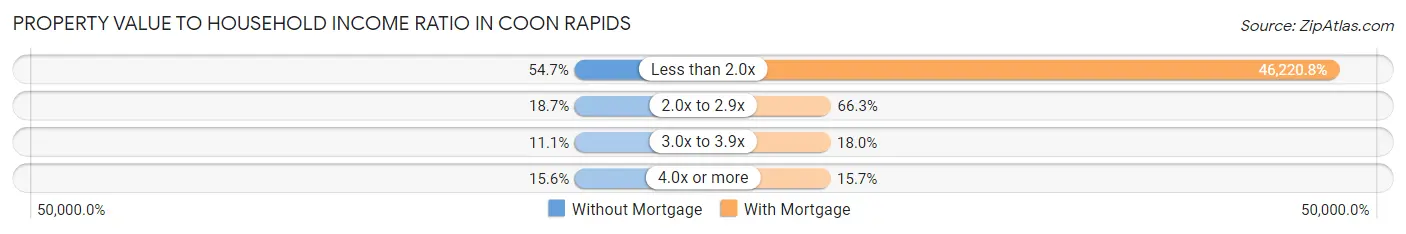
| Value-to-Income Ratio | Without Mortgage | With Mortgage |
| Less than 2.0x | 123 (54.7%) | 82,273 (46,220.8%) |
| 2.0x to 2.9x | 42 (18.7%) | 118 (66.3%) |
| 3.0x to 3.9x | 25 (11.1%) | 32 (18.0%) |
| 4.0x or more | 35 (15.6%) | 28 (15.7%) |
| Total | 225 (100.0%) | 178 (100.0%) |
Real Estate Taxes by Mortgage Status in Coon Rapids
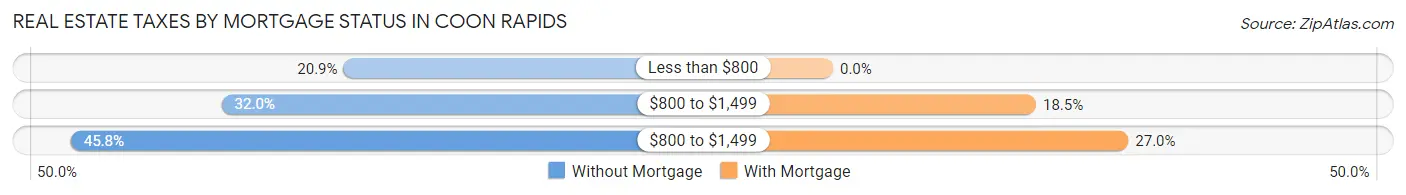
| Property Taxes | Without Mortgage | With Mortgage |
| Less than $800 | 47 (20.9%) | 0 (0.0%) |
| $800 to $1,499 | 72 (32.0%) | 33 (18.5%) |
| $800 to $1,499 | 103 (45.8%) | 48 (27.0%) |
| Total | 225 (100.0%) | 178 (100.0%) |
Health & Disability in Coon Rapids
Health Insurance Coverage by Age in Coon Rapids
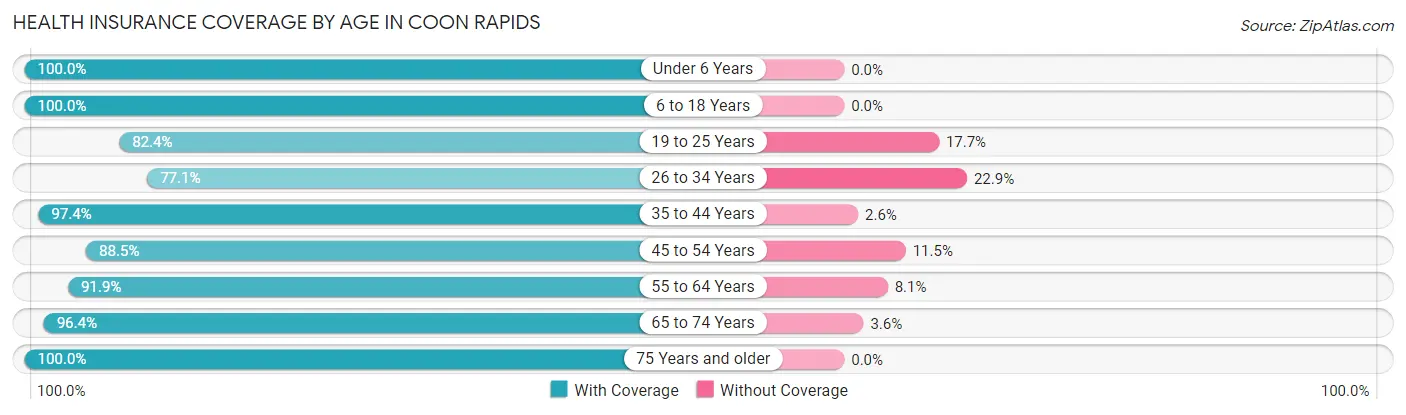
| Age Bracket | With Coverage | Without Coverage |
| Under 6 Years | 111 (100.0%) | 0 (0.0%) |
| 6 to 18 Years | 297 (100.0%) | 0 (0.0%) |
| 19 to 25 Years | 42 (82.4%) | 9 (17.6%) |
| 26 to 34 Years | 91 (77.1%) | 27 (22.9%) |
| 35 to 44 Years | 151 (97.4%) | 4 (2.6%) |
| 45 to 54 Years | 85 (88.5%) | 11 (11.5%) |
| 55 to 64 Years | 227 (91.9%) | 20 (8.1%) |
| 65 to 74 Years | 108 (96.4%) | 4 (3.6%) |
| 75 Years and older | 96 (100.0%) | 0 (0.0%) |
| Total | 1,208 (94.2%) | 75 (5.9%) |
Health Insurance Coverage by Citizenship Status in Coon Rapids
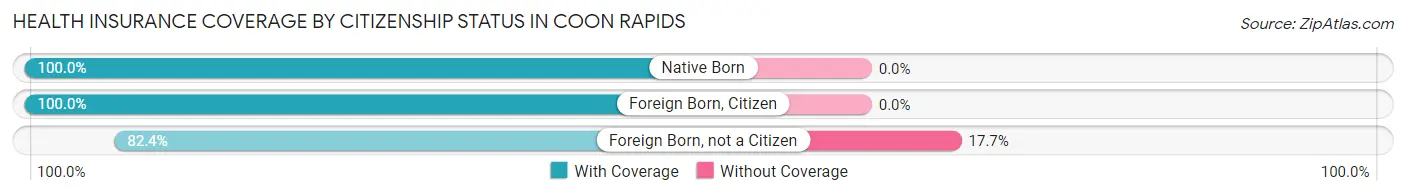
| Citizenship Status | With Coverage | Without Coverage |
| Native Born | 111 (100.0%) | 0 (0.0%) |
| Foreign Born, Citizen | 297 (100.0%) | 0 (0.0%) |
| Foreign Born, not a Citizen | 42 (82.4%) | 9 (17.6%) |
Health Insurance Coverage by Household Income in Coon Rapids
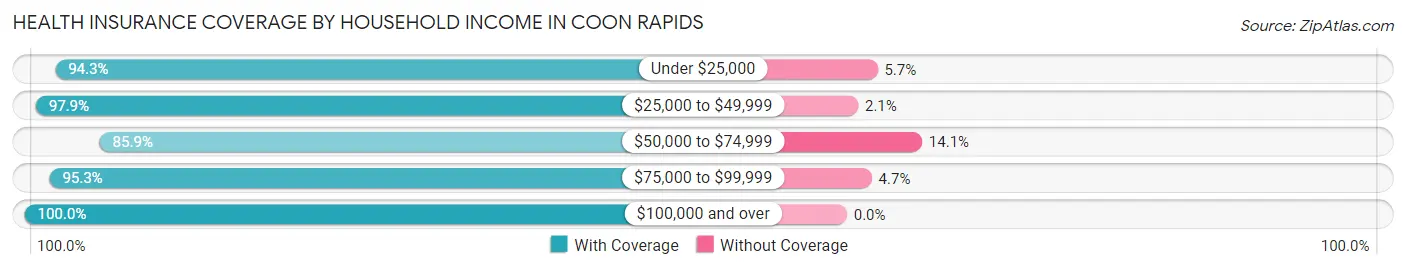
| Household Income | With Coverage | Without Coverage |
| Under $25,000 | 115 (94.3%) | 7 (5.7%) |
| $25,000 to $49,999 | 186 (97.9%) | 4 (2.1%) |
| $50,000 to $74,999 | 336 (85.9%) | 55 (14.1%) |
| $75,000 to $99,999 | 184 (95.3%) | 9 (4.7%) |
| $100,000 and over | 387 (100.0%) | 0 (0.0%) |
Public vs Private Health Insurance Coverage by Age in Coon Rapids
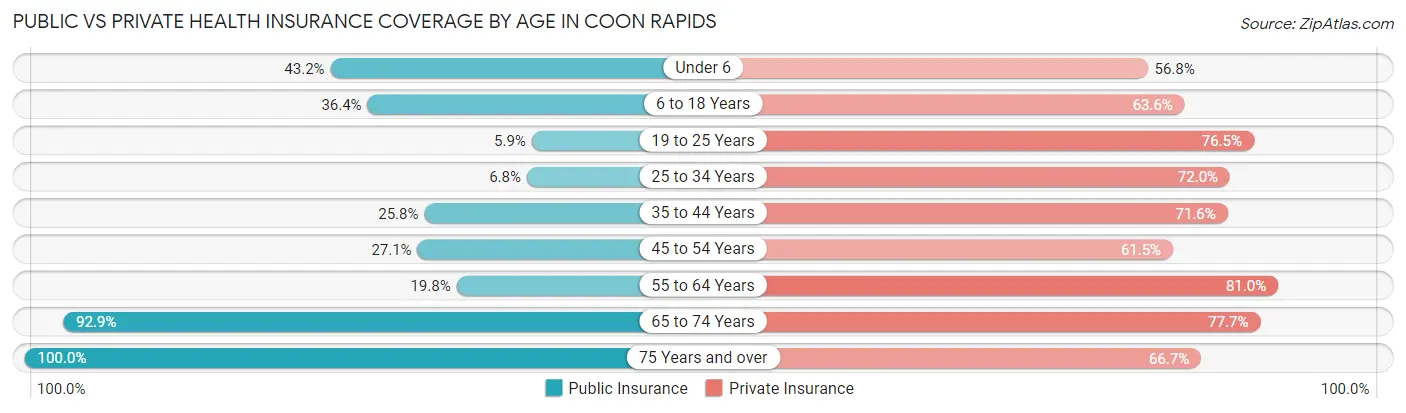
| Age Bracket | Public Insurance | Private Insurance |
| Under 6 | 48 (43.2%) | 63 (56.8%) |
| 6 to 18 Years | 108 (36.4%) | 189 (63.6%) |
| 19 to 25 Years | 3 (5.9%) | 39 (76.5%) |
| 25 to 34 Years | 8 (6.8%) | 85 (72.0%) |
| 35 to 44 Years | 40 (25.8%) | 111 (71.6%) |
| 45 to 54 Years | 26 (27.1%) | 59 (61.5%) |
| 55 to 64 Years | 49 (19.8%) | 200 (81.0%) |
| 65 to 74 Years | 104 (92.9%) | 87 (77.7%) |
| 75 Years and over | 96 (100.0%) | 64 (66.7%) |
| Total | 482 (37.6%) | 897 (69.9%) |
Disability Status by Sex by Age in Coon Rapids
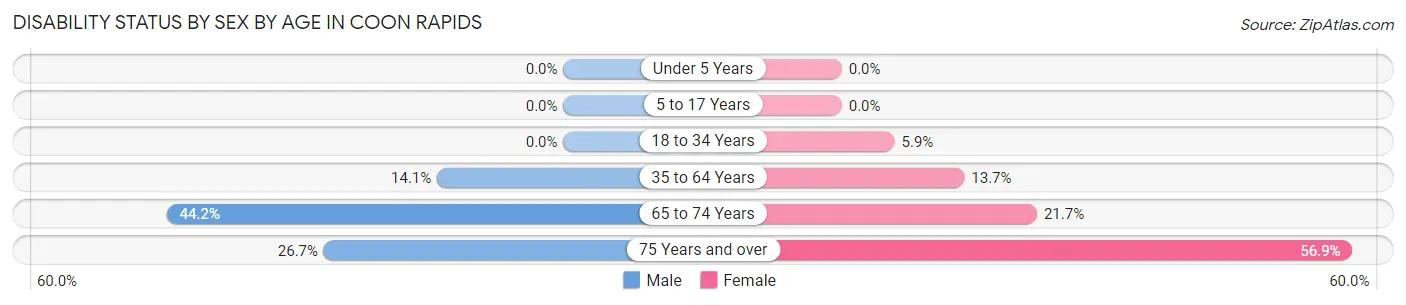
| Age Bracket | Male | Female |
| Under 5 Years | 0 (0.0%) | 0 (0.0%) |
| 5 to 17 Years | 0 (0.0%) | 0 (0.0%) |
| 18 to 34 Years | 0 (0.0%) | 5 (5.9%) |
| 35 to 64 Years | 35 (14.1%) | 34 (13.7%) |
| 65 to 74 Years | 19 (44.2%) | 15 (21.7%) |
| 75 Years and over | 12 (26.7%) | 29 (56.9%) |
Disability Class by Sex by Age in Coon Rapids
Disability Class: Hearing Difficulty
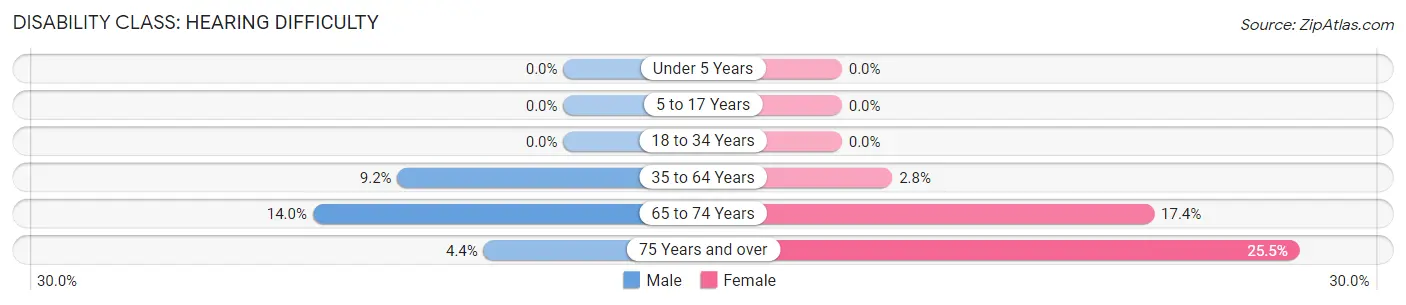
| Age Bracket | Male | Female |
| Under 5 Years | 0 (0.0%) | 0 (0.0%) |
| 5 to 17 Years | 0 (0.0%) | 0 (0.0%) |
| 18 to 34 Years | 0 (0.0%) | 0 (0.0%) |
| 35 to 64 Years | 23 (9.2%) | 7 (2.8%) |
| 65 to 74 Years | 6 (14.0%) | 12 (17.4%) |
| 75 Years and over | 2 (4.4%) | 13 (25.5%) |
Disability Class: Vision Difficulty
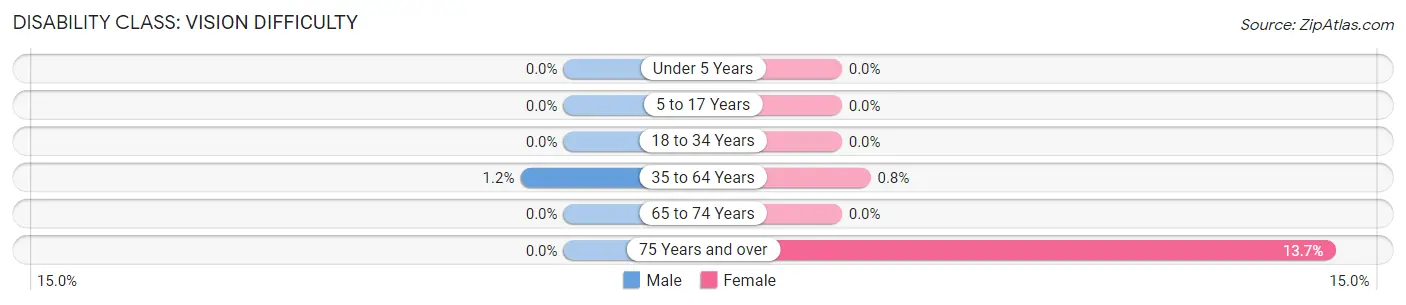
| Age Bracket | Male | Female |
| Under 5 Years | 0 (0.0%) | 0 (0.0%) |
| 5 to 17 Years | 0 (0.0%) | 0 (0.0%) |
| 18 to 34 Years | 0 (0.0%) | 0 (0.0%) |
| 35 to 64 Years | 3 (1.2%) | 2 (0.8%) |
| 65 to 74 Years | 0 (0.0%) | 0 (0.0%) |
| 75 Years and over | 0 (0.0%) | 7 (13.7%) |
Disability Class: Cognitive Difficulty
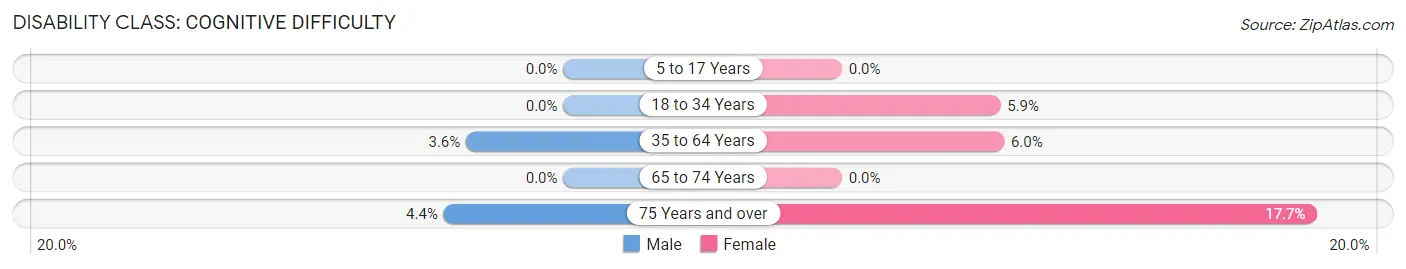
| Age Bracket | Male | Female |
| 5 to 17 Years | 0 (0.0%) | 0 (0.0%) |
| 18 to 34 Years | 0 (0.0%) | 5 (5.9%) |
| 35 to 64 Years | 9 (3.6%) | 15 (6.0%) |
| 65 to 74 Years | 0 (0.0%) | 0 (0.0%) |
| 75 Years and over | 2 (4.4%) | 9 (17.6%) |
Disability Class: Ambulatory Difficulty
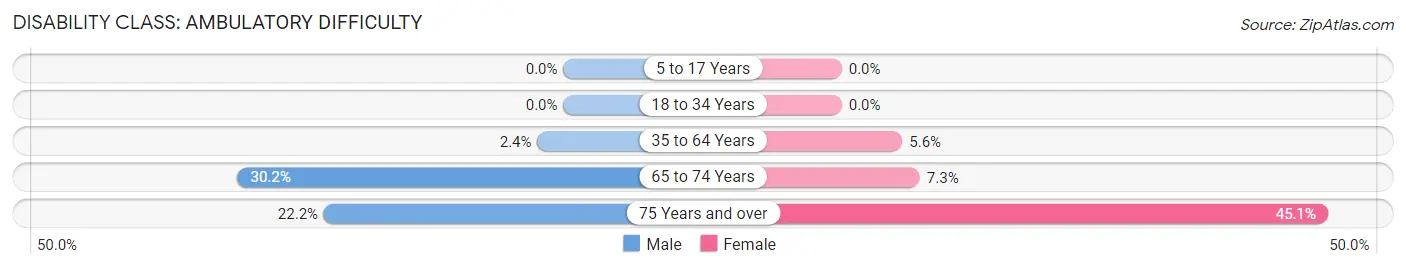
| Age Bracket | Male | Female |
| 5 to 17 Years | 0 (0.0%) | 0 (0.0%) |
| 18 to 34 Years | 0 (0.0%) | 0 (0.0%) |
| 35 to 64 Years | 6 (2.4%) | 14 (5.6%) |
| 65 to 74 Years | 13 (30.2%) | 5 (7.2%) |
| 75 Years and over | 10 (22.2%) | 23 (45.1%) |
Disability Class: Self-Care Difficulty
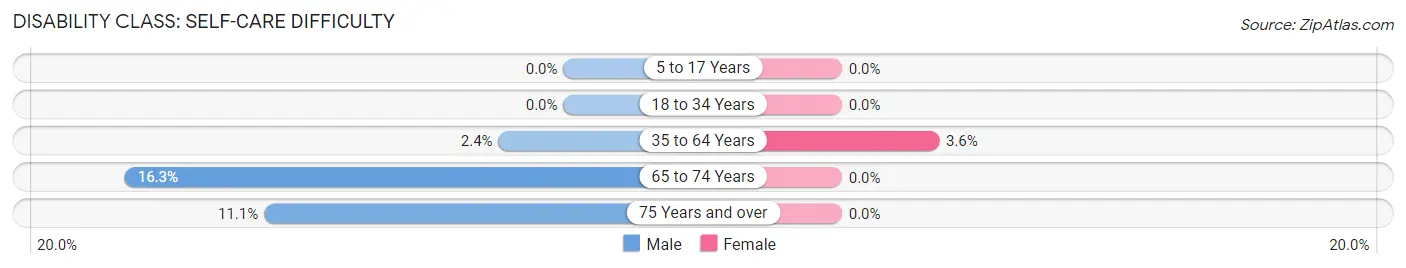
| Age Bracket | Male | Female |
| 5 to 17 Years | 0 (0.0%) | 0 (0.0%) |
| 18 to 34 Years | 0 (0.0%) | 0 (0.0%) |
| 35 to 64 Years | 6 (2.4%) | 9 (3.6%) |
| 65 to 74 Years | 7 (16.3%) | 0 (0.0%) |
| 75 Years and over | 5 (11.1%) | 0 (0.0%) |
Technology Access in Coon Rapids
Computing Device Access in Coon Rapids
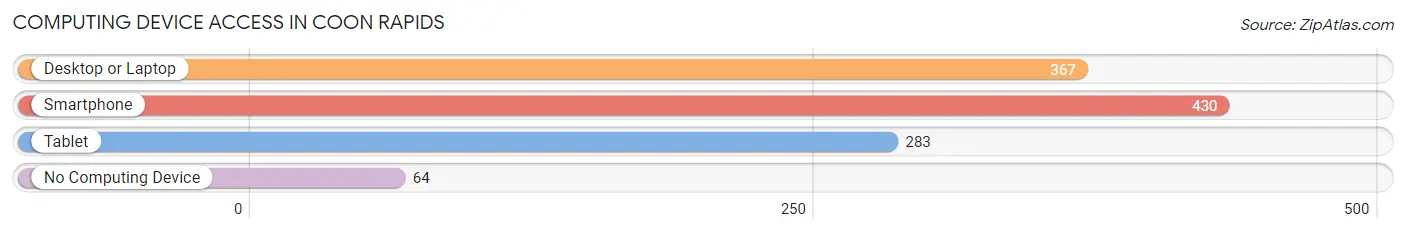
| Device Type | # Households | % Households |
| Desktop or Laptop | 367 | 69.4% |
| Smartphone | 430 | 81.3% |
| Tablet | 283 | 53.5% |
| No Computing Device | 64 | 12.1% |
| Total | 529 | 100.0% |
Internet Access in Coon Rapids
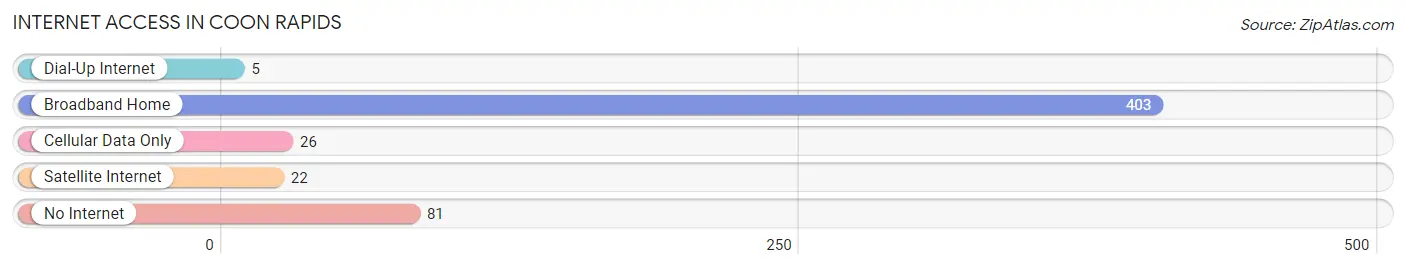
| Internet Type | # Households | % Households |
| Dial-Up Internet | 5 | 0.9% |
| Broadband Home | 403 | 76.2% |
| Cellular Data Only | 26 | 4.9% |
| Satellite Internet | 22 | 4.2% |
| No Internet | 81 | 15.3% |
| Total | 529 | 100.0% |
Coon Rapids Summary
Coon Rapids, Iowa is a small city located in Carroll County, Iowa. It is situated on the banks of the Middle Raccoon River and is home to a population of approximately 1,500 people. The city is known for its rural charm and is a popular destination for outdoor recreation.
History
Coon Rapids was founded in 1856 by a group of settlers from the nearby town of Coonville. The settlers were looking for a place to settle and start a new life. The town was named after the nearby Raccoon River, which was named after the abundance of raccoons in the area. The town was officially incorporated in 1875 and has remained a small, rural community ever since.
Geography
Coon Rapids is located in the rolling hills of Carroll County, Iowa. The city is situated on the banks of the Middle Raccoon River and is surrounded by farmland and wooded areas. The city is located approximately 30 miles northwest of Des Moines and is accessible via Interstate 80.
Economy
Coon Rapids is a small, rural community and the economy is largely based on agriculture. The city is home to several small businesses, including a grocery store, a hardware store, and a few restaurants. The city also has a small manufacturing sector, which produces a variety of products, including furniture, clothing, and automotive parts.
Demographics
As of the 2010 census, the population of Coon Rapids was 1,500. The racial makeup of the city was 97.3% White, 0.7% African American, 0.2% Native American, 0.2% Asian, 0.2% from other races, and 1.6% from two or more races. The median household income was $41,250 and the median family income was $50,000.
Conclusion
Coon Rapids, Iowa is a small, rural community located in Carroll County, Iowa. The city is situated on the banks of the Middle Raccoon River and is home to a population of approximately 1,500 people. The economy is largely based on agriculture and the city is home to several small businesses. The racial makeup of the city is predominantly White and the median household income is $41,250. Coon Rapids is a popular destination for outdoor recreation and is known for its rural charm.
Common Questions
What is Per Capita Income in Coon Rapids?
Per Capita income in Coon Rapids is $27,742.
What is the Median Family Income in Coon Rapids?
Median Family Income in Coon Rapids is $80,104.
What is the Median Household income in Coon Rapids?
Median Household Income in Coon Rapids is $61,058.
What is Income or Wage Gap in Coon Rapids?
Income or Wage Gap in Coon Rapids is 47.7%.
Women in Coon Rapids earn 52.3 cents for every dollar earned by a man.
What is Inequality or Gini Index in Coon Rapids?
Inequality or Gini Index in Coon Rapids is 0.34.
What is the Total Population of Coon Rapids?
Total Population of Coon Rapids is 1,324.
What is the Total Male Population of Coon Rapids?
Total Male Population of Coon Rapids is 606.
What is the Total Female Population of Coon Rapids?
Total Female Population of Coon Rapids is 718.
What is the Ratio of Males per 100 Females in Coon Rapids?
There are 84.40 Males per 100 Females in Coon Rapids.
What is the Ratio of Females per 100 Males in Coon Rapids?
There are 118.48 Females per 100 Males in Coon Rapids.
What is the Median Population Age in Coon Rapids?
Median Population Age in Coon Rapids is 39.7 Years.
What is the Average Family Size in Coon Rapids
Average Family Size in Coon Rapids is 3.3 People.
What is the Average Household Size in Coon Rapids
Average Household Size in Coon Rapids is 2.4 People.
How Large is the Labor Force in Coon Rapids?
There are 654 People in the Labor Forcein in Coon Rapids.
What is the Percentage of People in the Labor Force in Coon Rapids?
64.9% of People are in the Labor Force in Coon Rapids.
What is the Unemployment Rate in Coon Rapids?
Unemployment Rate in Coon Rapids is 1.8%.