Carter Lake, IA Map & Demographics
Carter Lake Map
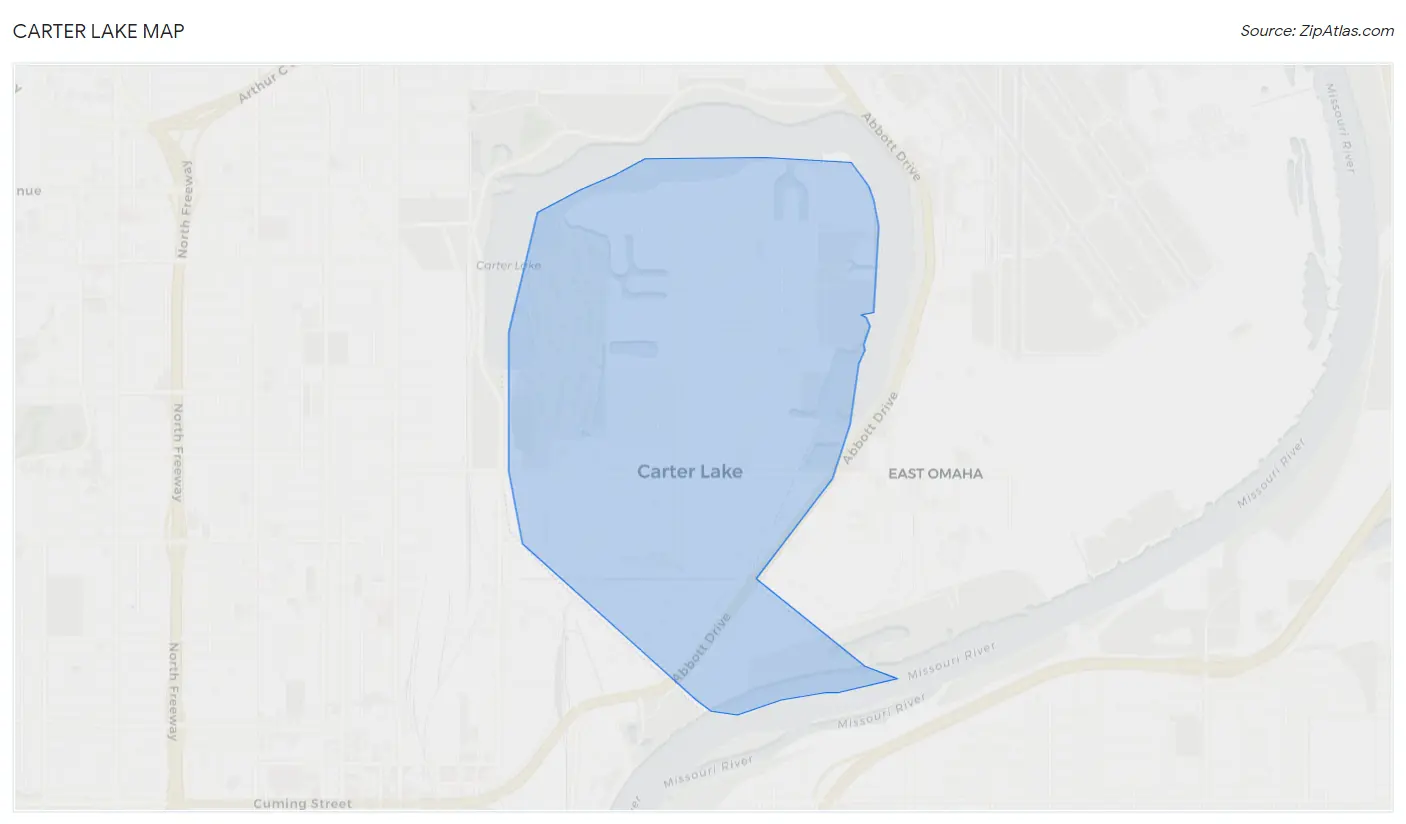
Carter Lake Overview
$32,068
PER CAPITA INCOME
$79,688
AVG FAMILY INCOME
$64,479
AVG HOUSEHOLD INCOME
21.9%
WAGE / INCOME GAP [ % ]
78.1¢/ $1
WAGE / INCOME GAP [ $ ]
0.44
INEQUALITY / GINI INDEX
3,780
TOTAL POPULATION
2,054
MALE POPULATION
1,726
FEMALE POPULATION
119.00
MALES / 100 FEMALES
84.03
FEMALES / 100 MALES
38.0
MEDIAN AGE
3.3
AVG FAMILY SIZE
2.8
AVG HOUSEHOLD SIZE
1,819
LABOR FORCE [ PEOPLE ]
64.4%
PERCENT IN LABOR FORCE
5.9%
UNEMPLOYMENT RATE
Carter Lake Zip Codes
Carter Lake Area Codes
Income in Carter Lake
Income Overview in Carter Lake
Per Capita Income in Carter Lake is $32,068, while median incomes of families and households are $79,688 and $64,479 respectively.
| Characteristic | Number | Measure |
| Per Capita Income | 3,780 | $32,068 |
| Median Family Income | 969 | $79,688 |
| Mean Family Income | 969 | $99,104 |
| Median Household Income | 1,351 | $64,479 |
| Mean Household Income | 1,351 | $86,730 |
| Income Deficit | 969 | $0 |
| Wage / Income Gap (%) | 3,780 | 21.92% |
| Wage / Income Gap ($) | 3,780 | 78.08¢ per $1 |
| Gini / Inequality Index | 3,780 | 0.44 |
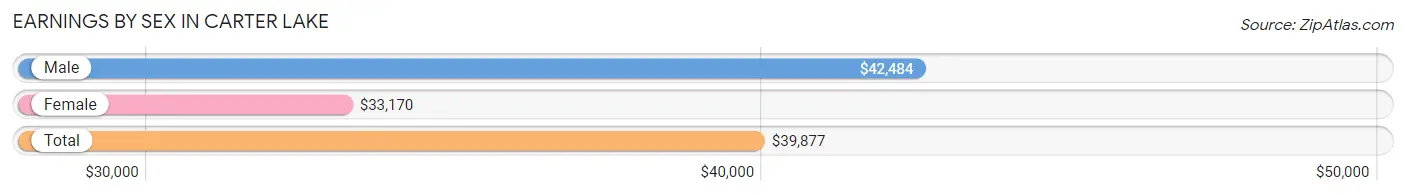
Earnings by Sex in Carter Lake
Average Earnings in Carter Lake are $39,877, $42,484 for men and $33,170 for women, a difference of 21.9%.
| Sex | Number | Average Earnings |
| Male | 993 (55.4%) | $42,484 |
| Female | 799 (44.6%) | $33,170 |
| Total | 1,792 (100.0%) | $39,877 |
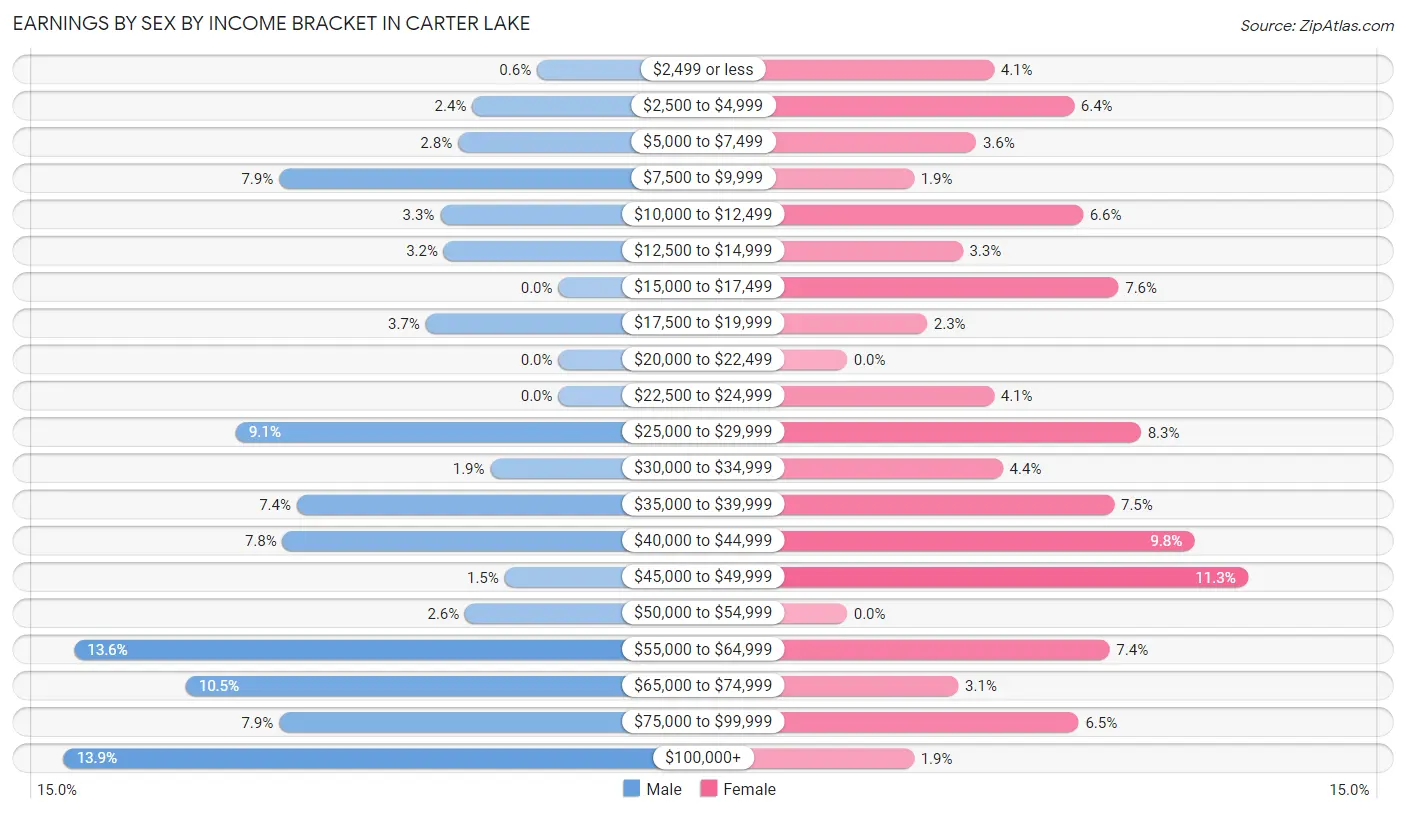
Earnings by Sex by Income Bracket in Carter Lake
The most common earnings brackets in Carter Lake are $100,000+ for men (138 | 13.9%) and $45,000 to $49,999 for women (90 | 11.3%).
| Income | Male | Female |
| $2,499 or less | 6 (0.6%) | 33 (4.1%) |
| $2,500 to $4,999 | 24 (2.4%) | 51 (6.4%) |
| $5,000 to $7,499 | 28 (2.8%) | 29 (3.6%) |
| $7,500 to $9,999 | 78 (7.9%) | 15 (1.9%) |
| $10,000 to $12,499 | 33 (3.3%) | 53 (6.6%) |
| $12,500 to $14,999 | 32 (3.2%) | 26 (3.3%) |
| $15,000 to $17,499 | 0 (0.0%) | 61 (7.6%) |
| $17,500 to $19,999 | 37 (3.7%) | 18 (2.2%) |
| $20,000 to $22,499 | 0 (0.0%) | 0 (0.0%) |
| $22,500 to $24,999 | 0 (0.0%) | 33 (4.1%) |
| $25,000 to $29,999 | 90 (9.1%) | 66 (8.3%) |
| $30,000 to $34,999 | 19 (1.9%) | 35 (4.4%) |
| $35,000 to $39,999 | 73 (7.3%) | 60 (7.5%) |
| $40,000 to $44,999 | 77 (7.7%) | 78 (9.8%) |
| $45,000 to $49,999 | 15 (1.5%) | 90 (11.3%) |
| $50,000 to $54,999 | 26 (2.6%) | 0 (0.0%) |
| $55,000 to $64,999 | 135 (13.6%) | 59 (7.4%) |
| $65,000 to $74,999 | 104 (10.5%) | 25 (3.1%) |
| $75,000 to $99,999 | 78 (7.9%) | 52 (6.5%) |
| $100,000+ | 138 (13.9%) | 15 (1.9%) |
| Total | 993 (100.0%) | 799 (100.0%) |
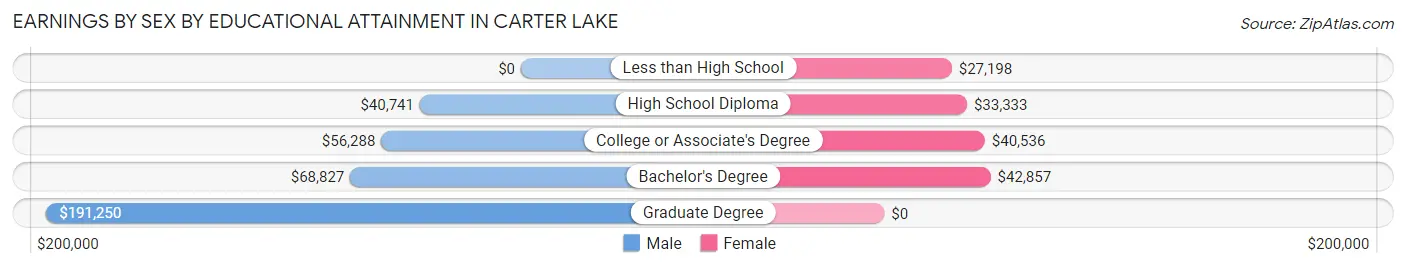
Earnings by Sex by Educational Attainment in Carter Lake
Average earnings in Carter Lake are $55,947 for men and $34,306 for women, a difference of 38.7%. Men with an educational attainment of graduate degree enjoy the highest average annual earnings of $191,250, while those with high school diploma education earn the least with $40,741. Women with an educational attainment of bachelor's degree earn the most with the average annual earnings of $42,857, while those with less than high school education have the smallest earnings of $27,198.
| Educational Attainment | Male Income | Female Income |
| Less than High School | - | - |
| High School Diploma | $40,741 | $33,333 |
| College or Associate's Degree | $56,288 | $40,536 |
| Bachelor's Degree | $68,827 | $42,857 |
| Graduate Degree | $191,250 | $0 |
| Total | $55,947 | $34,306 |
Family Income in Carter Lake
Family Income Brackets in Carter Lake
According to the Carter Lake family income data, there are 299 families falling into the $100,000 to $149,999 income range, which is the most common income bracket and makes up 30.9% of all families. Conversely, the $10,000 to $14,999 income bracket is the least frequent group with only 7 families (0.7%) belonging to this category.
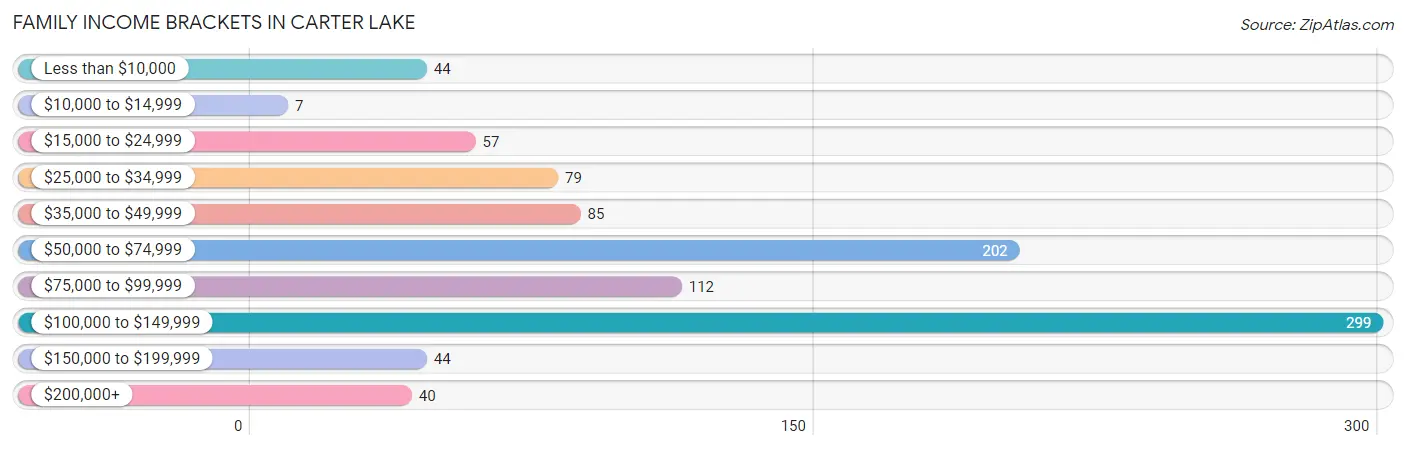
| Income Bracket | # Families | % Families |
| Less than $10,000 | 44 | 4.5% |
| $10,000 to $14,999 | 7 | 0.7% |
| $15,000 to $24,999 | 57 | 5.9% |
| $25,000 to $34,999 | 79 | 8.2% |
| $35,000 to $49,999 | 85 | 8.8% |
| $50,000 to $74,999 | 202 | 20.8% |
| $75,000 to $99,999 | 112 | 11.6% |
| $100,000 to $149,999 | 299 | 30.9% |
| $150,000 to $199,999 | 44 | 4.5% |
| $200,000+ | 40 | 4.1% |
Family Income by Famaliy Size in Carter Lake
2-person families (485 | 50.0%) account for the highest median family income in Carter Lake with $87,366 per family, while 2-person families (485 | 50.0%) have the highest median income of $43,683 per family member.
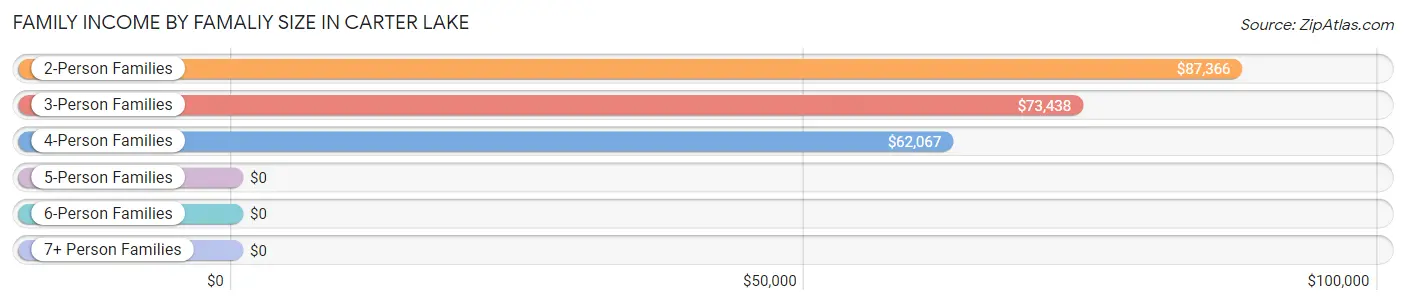
| Income Bracket | # Families | Median Income |
| 2-Person Families | 485 (50.0%) | $87,366 |
| 3-Person Families | 289 (29.8%) | $73,438 |
| 4-Person Families | 87 (9.0%) | $62,067 |
| 5-Person Families | 28 (2.9%) | $0 |
| 6-Person Families | 49 (5.1%) | $0 |
| 7+ Person Families | 31 (3.2%) | $0 |
| Total | 969 (100.0%) | $79,688 |
Family Income by Number of Earners in Carter Lake
The median family income in Carter Lake is $79,688, with families comprising 3+ earners (52) having the highest median family income of $129,500, while families with no earners (145) have the lowest median family income of $55,912, accounting for 5.4% and 15.0% of families, respectively.
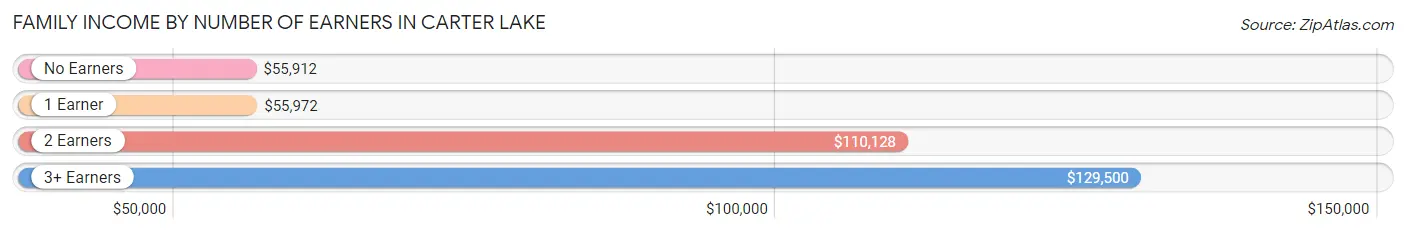
| Number of Earners | # Families | Median Income |
| No Earners | 145 (15.0%) | $55,912 |
| 1 Earner | 341 (35.2%) | $55,972 |
| 2 Earners | 431 (44.5%) | $110,128 |
| 3+ Earners | 52 (5.4%) | $129,500 |
| Total | 969 (100.0%) | $79,688 |
Household Income in Carter Lake
Household Income Brackets in Carter Lake
With 353 households falling in the category, the $100,000 to $149,999 income range is the most frequent in Carter Lake, accounting for 26.1% of all households. In contrast, only 39 households (2.9%) fall into the $10,000 to $14,999 income bracket, making it the least populous group.
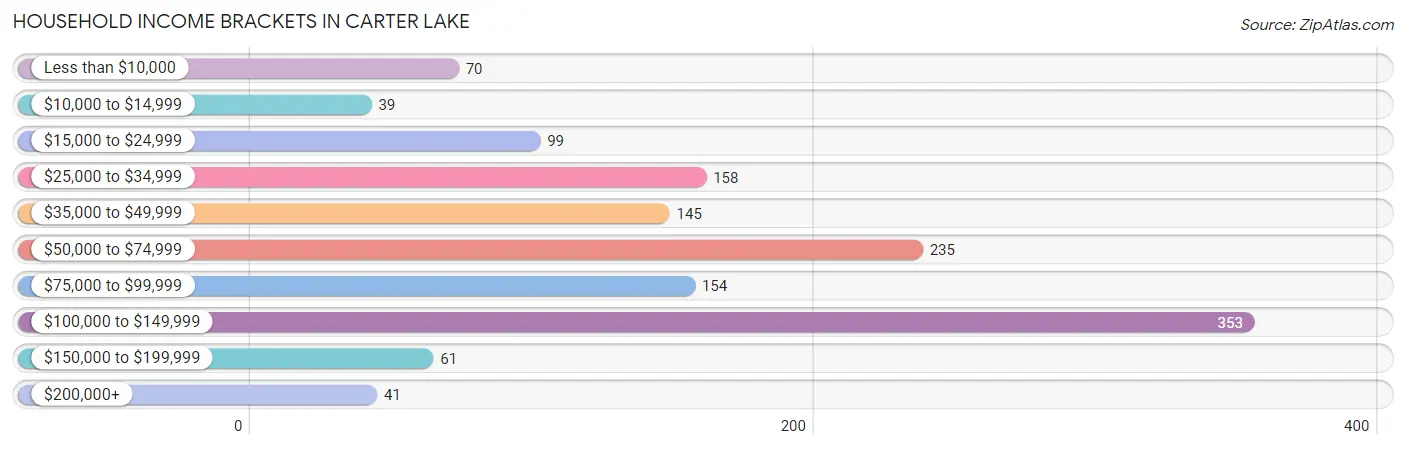
| Income Bracket | # Households | % Households |
| Less than $10,000 | 70 | 5.2% |
| $10,000 to $14,999 | 39 | 2.9% |
| $15,000 to $24,999 | 99 | 7.3% |
| $25,000 to $34,999 | 158 | 11.7% |
| $35,000 to $49,999 | 145 | 10.7% |
| $50,000 to $74,999 | 235 | 17.4% |
| $75,000 to $99,999 | 154 | 11.4% |
| $100,000 to $149,999 | 353 | 26.1% |
| $150,000 to $199,999 | 61 | 4.5% |
| $200,000+ | 41 | 3.0% |
Household Income by Householder Age in Carter Lake
The median household income in Carter Lake is $64,479, with the highest median household income of $96,467 found in the 45 to 64 years age bracket for the primary householder. A total of 511 households (37.8%) fall into this category. Meanwhile, the 15 to 24 years age bracket for the primary householder has the lowest median household income of $0, with 84 households (6.2%) in this group.
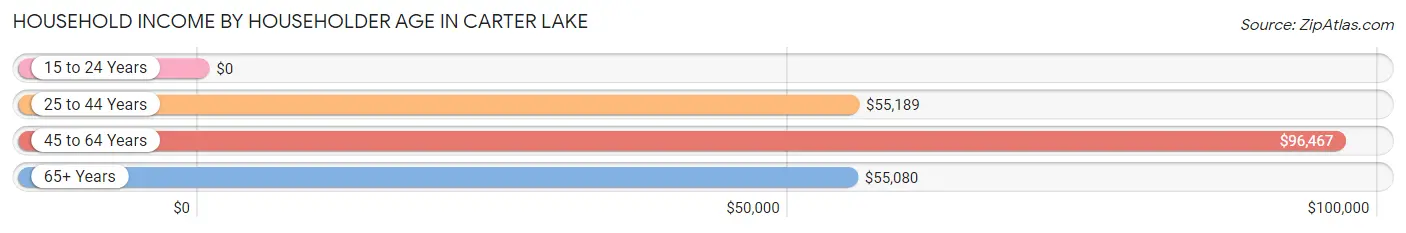
| Income Bracket | # Households | Median Income |
| 15 to 24 Years | 84 (6.2%) | $0 |
| 25 to 44 Years | 377 (27.9%) | $55,189 |
| 45 to 64 Years | 511 (37.8%) | $96,467 |
| 65+ Years | 379 (28.1%) | $55,080 |
| Total | 1,351 (100.0%) | $64,479 |
Poverty in Carter Lake
Income Below Poverty by Sex and Age in Carter Lake
With 16.3% poverty level for males and 20.7% for females among the residents of Carter Lake, 12 to 14 year old males and under 5 year old females are the most vulnerable to poverty, with 39 males (48.1%) and 92 females (59.7%) in their respective age groups living below the poverty level.
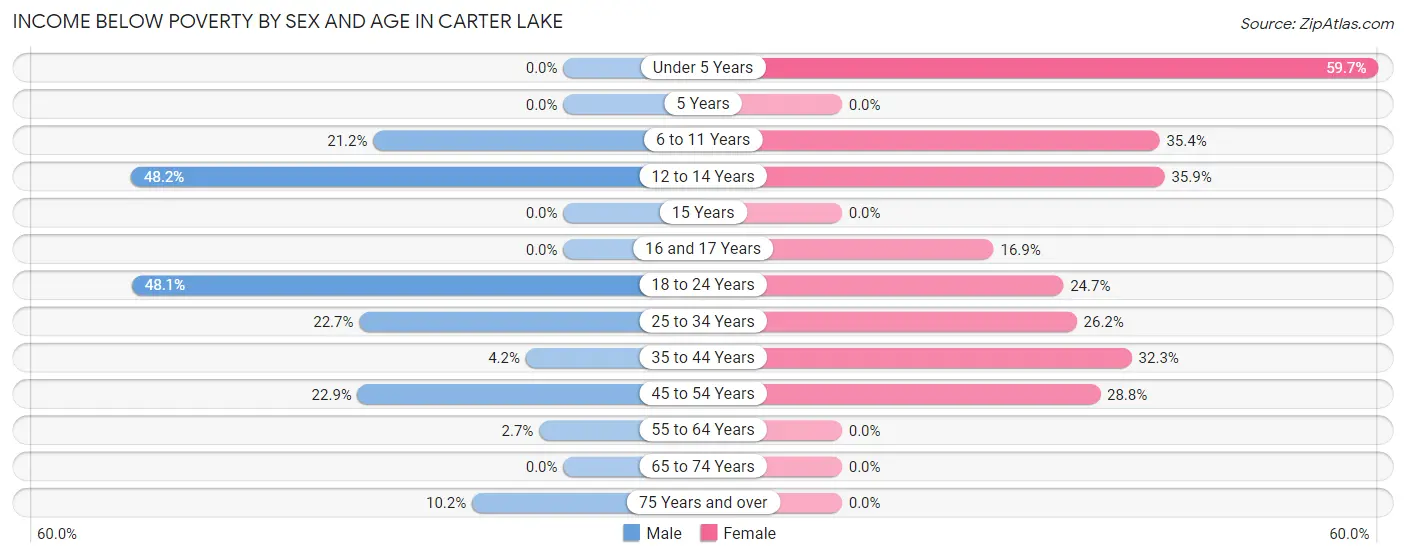
| Age Bracket | Male | Female |
| Under 5 Years | 0 (0.0%) | 92 (59.7%) |
| 5 Years | 0 (0.0%) | 0 (0.0%) |
| 6 to 11 Years | 69 (21.2%) | 46 (35.4%) |
| 12 to 14 Years | 39 (48.1%) | 23 (35.9%) |
| 15 Years | 0 (0.0%) | 0 (0.0%) |
| 16 and 17 Years | 0 (0.0%) | 12 (16.9%) |
| 18 to 24 Years | 111 (48.0%) | 36 (24.7%) |
| 25 to 34 Years | 30 (22.7%) | 51 (26.2%) |
| 35 to 44 Years | 12 (4.2%) | 51 (32.3%) |
| 45 to 54 Years | 52 (22.9%) | 44 (28.8%) |
| 55 to 64 Years | 10 (2.7%) | 0 (0.0%) |
| 65 to 74 Years | 0 (0.0%) | 0 (0.0%) |
| 75 Years and over | 6 (10.2%) | 0 (0.0%) |
| Total | 329 (16.3%) | 355 (20.7%) |
Income Above Poverty by Sex and Age in Carter Lake
According to the poverty statistics in Carter Lake, males aged under 5 years and females aged 5 years are the age groups that are most secure financially, with 100.0% of males and 100.0% of females in these age groups living above the poverty line.
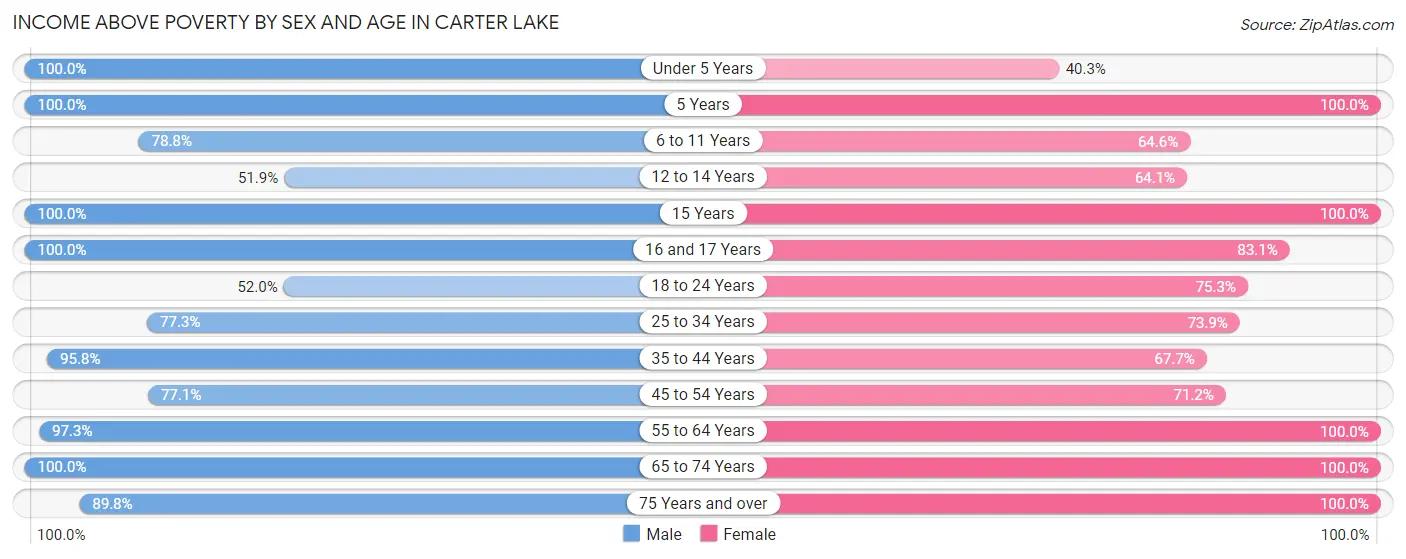
| Age Bracket | Male | Female |
| Under 5 Years | 72 (100.0%) | 62 (40.3%) |
| 5 Years | 27 (100.0%) | 15 (100.0%) |
| 6 to 11 Years | 257 (78.8%) | 84 (64.6%) |
| 12 to 14 Years | 42 (51.8%) | 41 (64.1%) |
| 15 Years | 18 (100.0%) | 19 (100.0%) |
| 16 and 17 Years | 5 (100.0%) | 59 (83.1%) |
| 18 to 24 Years | 120 (51.9%) | 110 (75.3%) |
| 25 to 34 Years | 102 (77.3%) | 144 (73.9%) |
| 35 to 44 Years | 275 (95.8%) | 107 (67.7%) |
| 45 to 54 Years | 175 (77.1%) | 109 (71.2%) |
| 55 to 64 Years | 362 (97.3%) | 258 (100.0%) |
| 65 to 74 Years | 182 (100.0%) | 230 (100.0%) |
| 75 Years and over | 53 (89.8%) | 118 (100.0%) |
| Total | 1,690 (83.7%) | 1,356 (79.2%) |
Income Below Poverty Among Married-Couple Families in Carter Lake
The poverty statistics for married-couple families in Carter Lake show that 4.7% or 29 of the total 621 families live below the poverty line. Families with 5 or more children have the highest poverty rate of 93.5%, comprising of 29 families. On the other hand, families with no children have the lowest poverty rate of 0.0%, which includes 0 families.
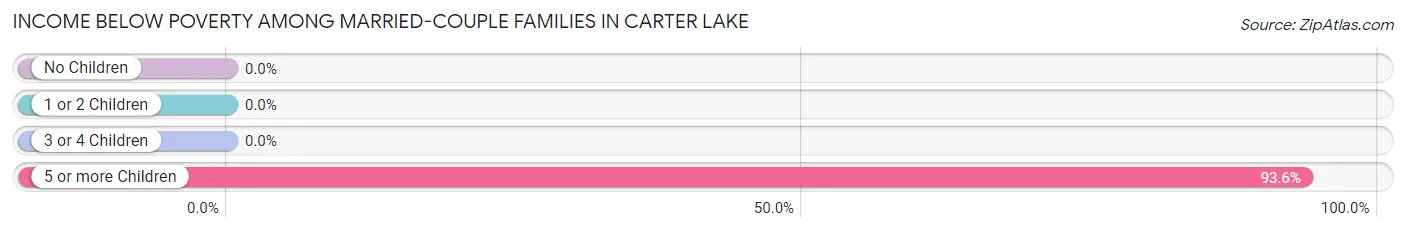
| Children | Above Poverty | Below Poverty |
| No Children | 387 (100.0%) | 0 (0.0%) |
| 1 or 2 Children | 136 (100.0%) | 0 (0.0%) |
| 3 or 4 Children | 67 (100.0%) | 0 (0.0%) |
| 5 or more Children | 2 (6.5%) | 29 (93.5%) |
| Total | 592 (95.3%) | 29 (4.7%) |
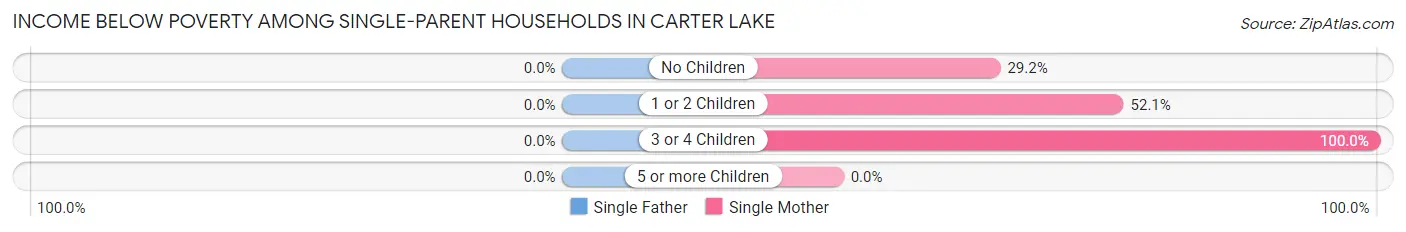
Income Below Poverty Among Single-Parent Households in Carter Lake
| Children | Single Father | Single Mother |
| No Children | 0 (0.0%) | 26 (29.2%) |
| 1 or 2 Children | 0 (0.0%) | 61 (52.1%) |
| 3 or 4 Children | 0 (0.0%) | 12 (100.0%) |
| 5 or more Children | 0 (0.0%) | 0 (0.0%) |
| Total | 0 (0.0%) | 99 (45.4%) |
Income Below Poverty Among Married-Couple vs Single-Parent Households in Carter Lake
The poverty data for Carter Lake shows that 29 of the married-couple family households (4.7%) and 99 of the single-parent households (28.4%) are living below the poverty level. Within the married-couple family households, those with 5 or more children have the highest poverty rate, with 29 households (93.5%) falling below the poverty line. Among the single-parent households, those with 3 or 4 children have the highest poverty rate, with 12 household (100.0%) living below poverty.
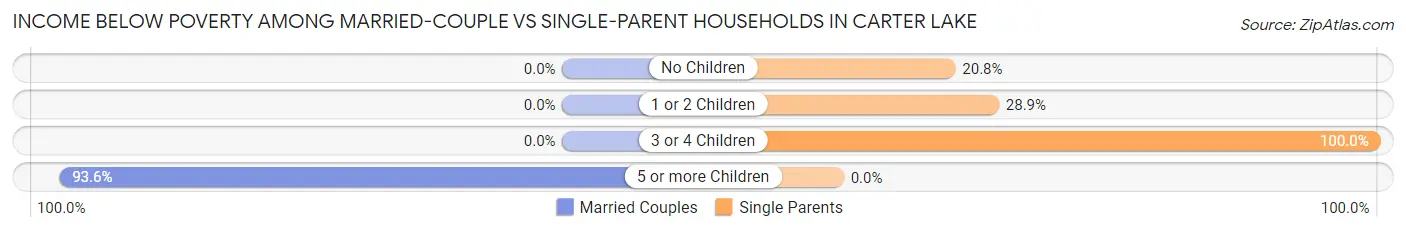
| Children | Married-Couple Families | Single-Parent Households |
| No Children | 0 (0.0%) | 26 (20.8%) |
| 1 or 2 Children | 0 (0.0%) | 61 (28.9%) |
| 3 or 4 Children | 0 (0.0%) | 12 (100.0%) |
| 5 or more Children | 29 (93.5%) | 0 (0.0%) |
| Total | 29 (4.7%) | 99 (28.4%) |
Race in Carter Lake
The most populous races in Carter Lake are White / Caucasian (3,018 | 79.8%), Hispanic or Latino (712 | 18.8%), and Two or more Races (555 | 14.7%).
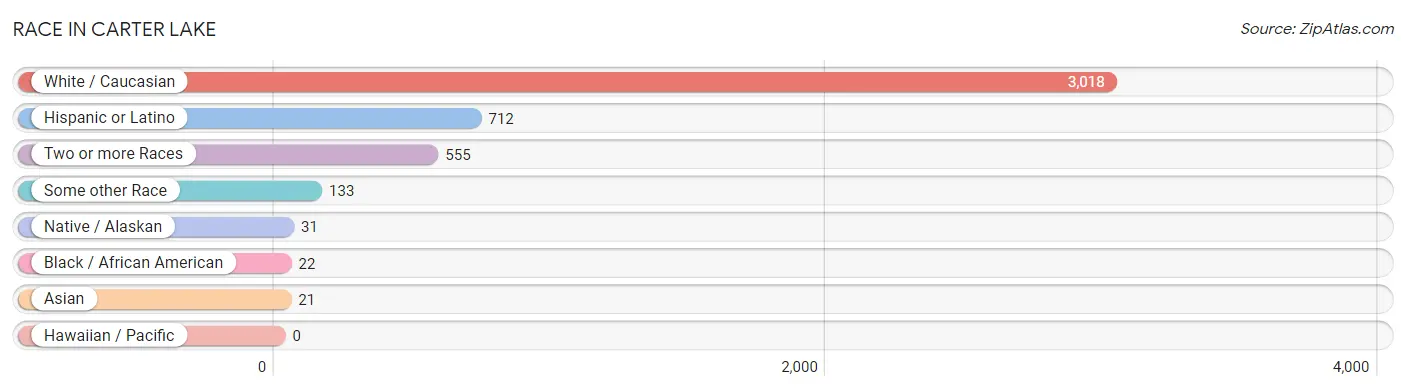
| Race | # Population | % Population |
| Asian | 21 | 0.6% |
| Black / African American | 22 | 0.6% |
| Hawaiian / Pacific | 0 | 0.0% |
| Hispanic or Latino | 712 | 18.8% |
| Native / Alaskan | 31 | 0.8% |
| White / Caucasian | 3,018 | 79.8% |
| Two or more Races | 555 | 14.7% |
| Some other Race | 133 | 3.5% |
| Total | 3,780 | 100.0% |
Ancestry in Carter Lake
The most populous ancestries reported in Carter Lake are German (823 | 21.8%), English (702 | 18.6%), Mexican (651 | 17.2%), Irish (370 | 9.8%), and Polish (133 | 3.5%), together accounting for 70.9% of all Carter Lake residents.
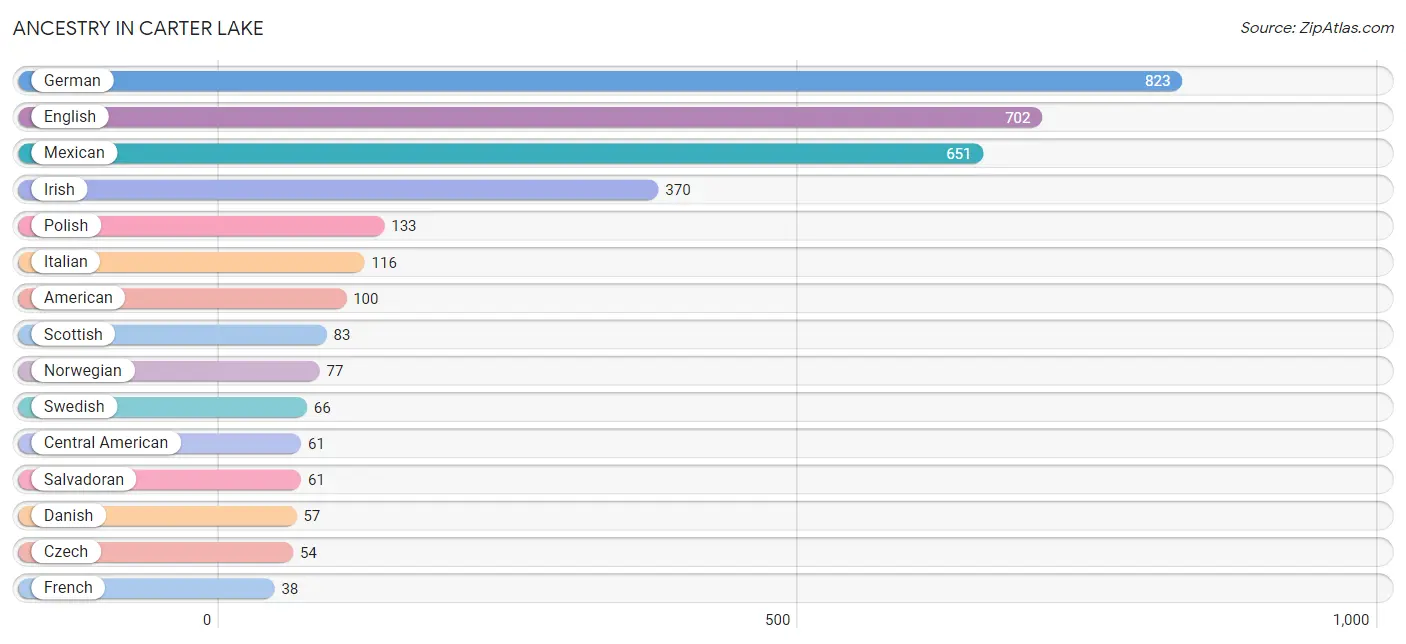
| Ancestry | # Population | % Population |
| American | 100 | 2.6% |
| Central American | 61 | 1.6% |
| Czech | 54 | 1.4% |
| Czechoslovakian | 11 | 0.3% |
| Danish | 57 | 1.5% |
| Dutch | 9 | 0.2% |
| Eastern European | 31 | 0.8% |
| English | 702 | 18.6% |
| European | 11 | 0.3% |
| French | 38 | 1.0% |
| French Canadian | 5 | 0.1% |
| German | 823 | 21.8% |
| Irish | 370 | 9.8% |
| Italian | 116 | 3.1% |
| Mexican | 651 | 17.2% |
| Mexican American Indian | 12 | 0.3% |
| Navajo | 12 | 0.3% |
| Norwegian | 77 | 2.0% |
| Polish | 133 | 3.5% |
| Russian | 15 | 0.4% |
| Salvadoran | 61 | 1.6% |
| Scandinavian | 9 | 0.2% |
| Scotch-Irish | 15 | 0.4% |
| Scottish | 83 | 2.2% |
| Sioux | 19 | 0.5% |
| Swedish | 66 | 1.8% |
| Swiss | 13 | 0.3% |
| Thai | 21 | 0.6% |
| Welsh | 5 | 0.1% | View All 29 Rows |
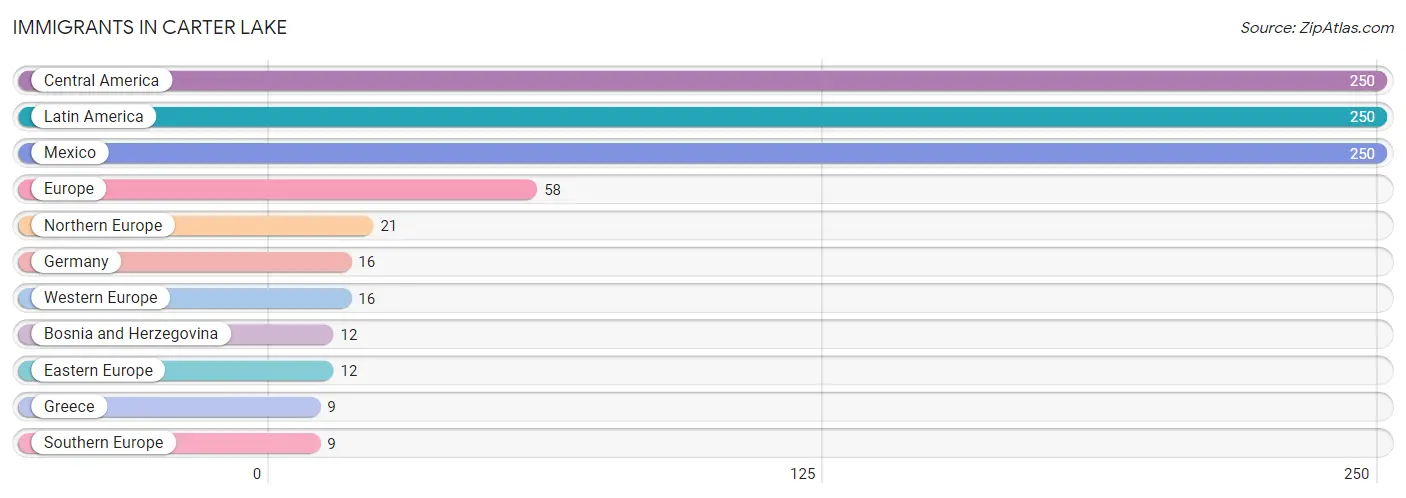
Immigrants in Carter Lake
The most numerous immigrant groups reported in Carter Lake came from Central America (250 | 6.6%), Latin America (250 | 6.6%), Mexico (250 | 6.6%), Europe (58 | 1.5%), and Northern Europe (21 | 0.6%), together accounting for 21.9% of all Carter Lake residents.
| Immigration Origin | # Population | % Population |
| Bosnia and Herzegovina | 12 | 0.3% |
| Central America | 250 | 6.6% |
| Eastern Europe | 12 | 0.3% |
| Europe | 58 | 1.5% |
| Germany | 16 | 0.4% |
| Greece | 9 | 0.2% |
| Latin America | 250 | 6.6% |
| Mexico | 250 | 6.6% |
| Northern Europe | 21 | 0.6% |
| Southern Europe | 9 | 0.2% |
| Western Europe | 16 | 0.4% | View All 11 Rows |
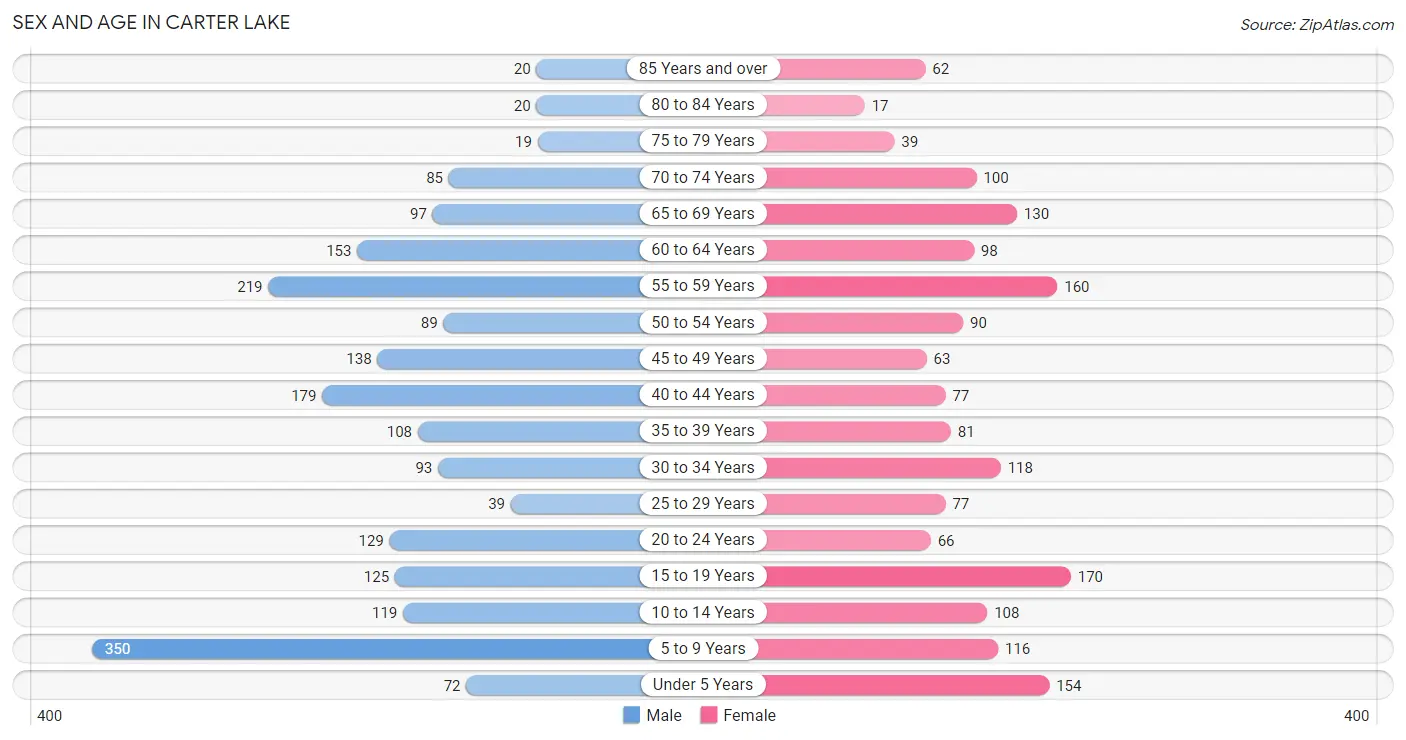
Sex and Age in Carter Lake
Sex and Age in Carter Lake
The most populous age groups in Carter Lake are 5 to 9 Years (350 | 17.0%) for men and 15 to 19 Years (170 | 9.9%) for women.
| Age Bracket | Male | Female |
| Under 5 Years | 72 (3.5%) | 154 (8.9%) |
| 5 to 9 Years | 350 (17.0%) | 116 (6.7%) |
| 10 to 14 Years | 119 (5.8%) | 108 (6.3%) |
| 15 to 19 Years | 125 (6.1%) | 170 (9.9%) |
| 20 to 24 Years | 129 (6.3%) | 66 (3.8%) |
| 25 to 29 Years | 39 (1.9%) | 77 (4.5%) |
| 30 to 34 Years | 93 (4.5%) | 118 (6.8%) |
| 35 to 39 Years | 108 (5.3%) | 81 (4.7%) |
| 40 to 44 Years | 179 (8.7%) | 77 (4.5%) |
| 45 to 49 Years | 138 (6.7%) | 63 (3.6%) |
| 50 to 54 Years | 89 (4.3%) | 90 (5.2%) |
| 55 to 59 Years | 219 (10.7%) | 160 (9.3%) |
| 60 to 64 Years | 153 (7.4%) | 98 (5.7%) |
| 65 to 69 Years | 97 (4.7%) | 130 (7.5%) |
| 70 to 74 Years | 85 (4.1%) | 100 (5.8%) |
| 75 to 79 Years | 19 (0.9%) | 39 (2.3%) |
| 80 to 84 Years | 20 (1.0%) | 17 (1.0%) |
| 85 Years and over | 20 (1.0%) | 62 (3.6%) |
| Total | 2,054 (100.0%) | 1,726 (100.0%) |
Families and Households in Carter Lake
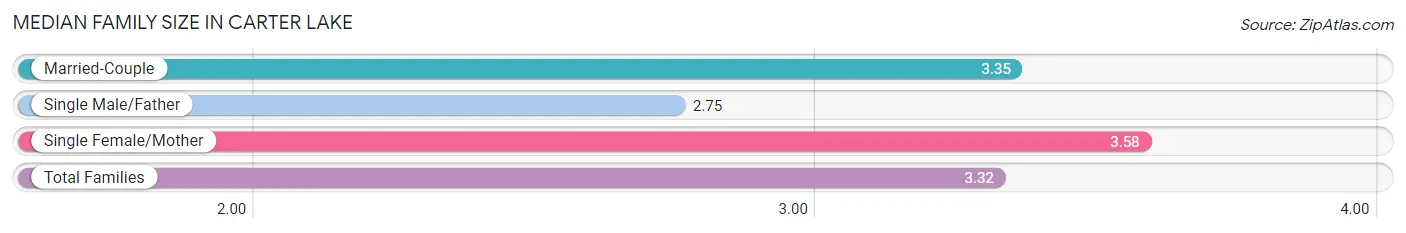
Median Family Size in Carter Lake
The median family size in Carter Lake is 3.32 persons per family, with single female/mother families (218 | 22.5%) accounting for the largest median family size of 3.58 persons per family. On the other hand, single male/father families (130 | 13.4%) represent the smallest median family size with 2.75 persons per family.
| Family Type | # Families | Family Size |
| Married-Couple | 621 (64.1%) | 3.35 |
| Single Male/Father | 130 (13.4%) | 2.75 |
| Single Female/Mother | 218 (22.5%) | 3.58 |
| Total Families | 969 (100.0%) | 3.32 |
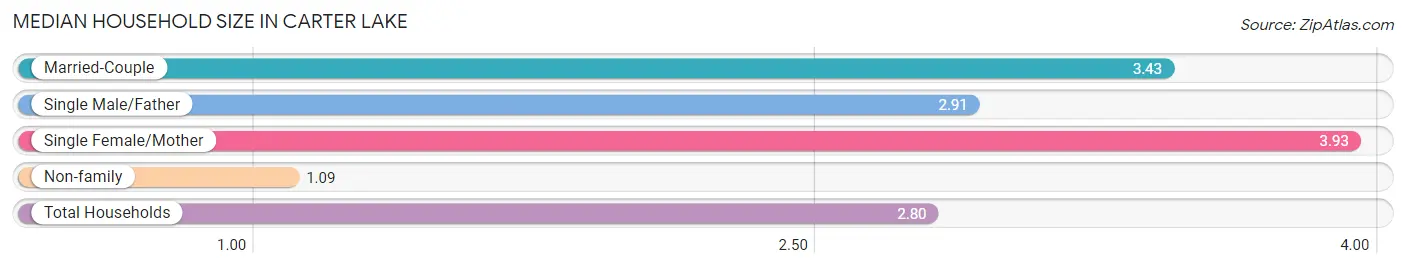
Median Household Size in Carter Lake
The median household size in Carter Lake is 2.80 persons per household, with single female/mother households (218 | 16.1%) accounting for the largest median household size of 3.93 persons per household. non-family households (382 | 28.3%) represent the smallest median household size with 1.09 persons per household.
| Household Type | # Households | Household Size |
| Married-Couple | 621 (46.0%) | 3.43 |
| Single Male/Father | 130 (9.6%) | 2.91 |
| Single Female/Mother | 218 (16.1%) | 3.93 |
| Non-family | 382 (28.3%) | 1.09 |
| Total Households | 1,351 (100.0%) | 2.80 |
Household Size by Marriage Status in Carter Lake
Out of a total of 1,351 households in Carter Lake, 969 (71.7%) are family households, while 382 (28.3%) are nonfamily households. The most numerous type of family households are 2-person households, comprising 426, and the most common type of nonfamily households are 1-person households, comprising 359.
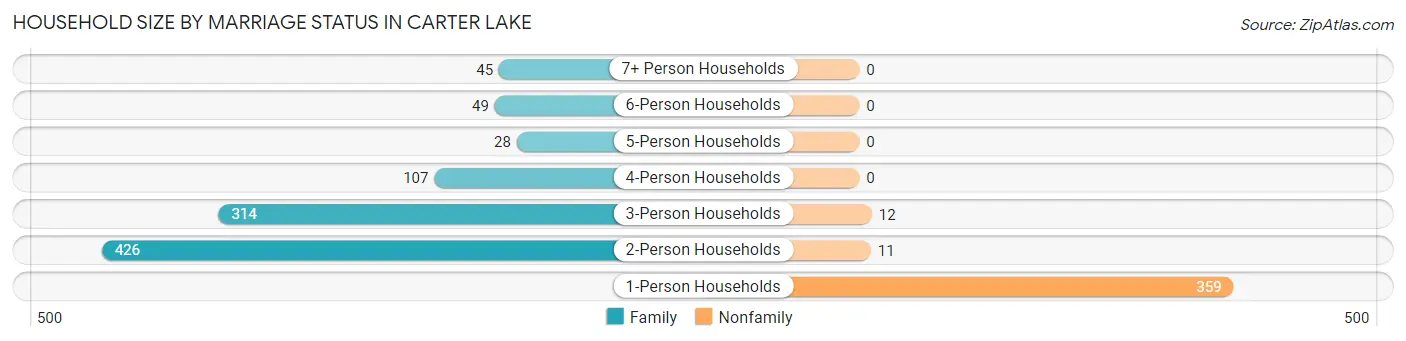
| Household Size | Family Households | Nonfamily Households |
| 1-Person Households | - | 359 (26.6%) |
| 2-Person Households | 426 (31.5%) | 11 (0.8%) |
| 3-Person Households | 314 (23.2%) | 12 (0.9%) |
| 4-Person Households | 107 (7.9%) | 0 (0.0%) |
| 5-Person Households | 28 (2.1%) | 0 (0.0%) |
| 6-Person Households | 49 (3.6%) | 0 (0.0%) |
| 7+ Person Households | 45 (3.3%) | 0 (0.0%) |
| Total | 969 (71.7%) | 382 (28.3%) |
Female Fertility in Carter Lake
Fertility by Age in Carter Lake
Average fertility rate in Carter Lake is 43.0 births per 1,000 women. Women in the age bracket of 35 to 50 years have the highest fertility rate with 121.0 births per 1,000 women. Women in the age bracket of 35 to 50 years acount for 100.0% of all women with births.
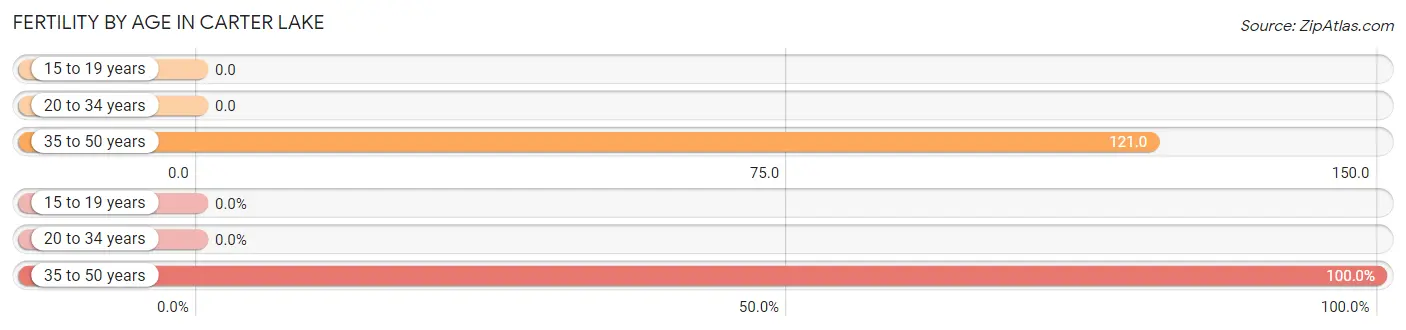
| Age Bracket | Women with Births | Births / 1,000 Women |
| 15 to 19 years | 0 (0.0%) | 0.0 |
| 20 to 34 years | 0 (0.0%) | 0.0 |
| 35 to 50 years | 29 (100.0%) | 121.0 |
| Total | 29 (100.0%) | 43.0 |
Fertility by Age by Marriage Status in Carter Lake
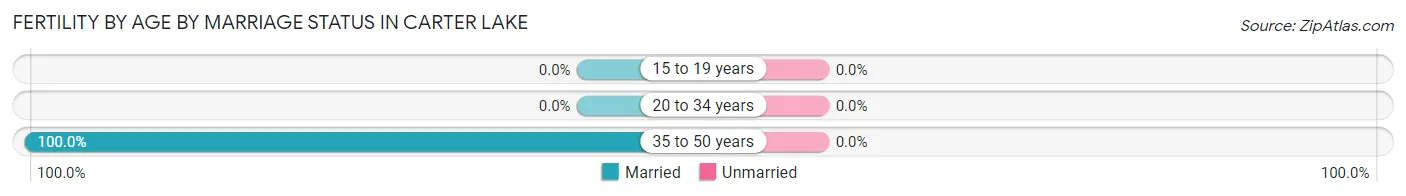
| Age Bracket | Married | Unmarried |
| 15 to 19 years | 0 (0.0%) | 0 (0.0%) |
| 20 to 34 years | 0 (0.0%) | 0 (0.0%) |
| 35 to 50 years | 29 (100.0%) | 0 (0.0%) |
| Total | 29 (100.0%) | 0 (0.0%) |
Fertility by Education in Carter Lake
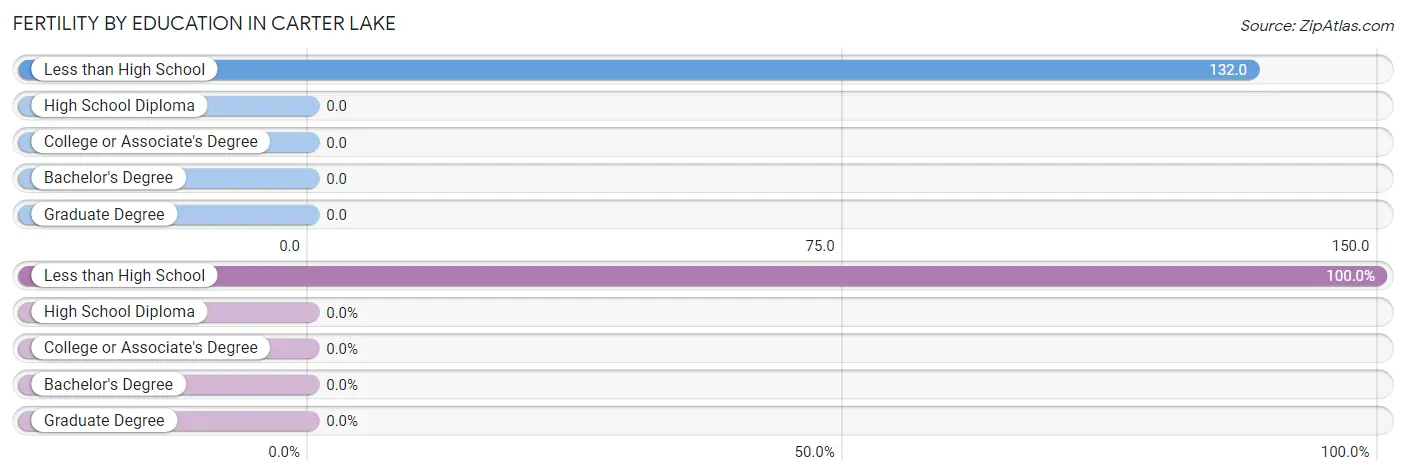
| Educational Attainment | Women with Births | Births / 1,000 Women |
| Less than High School | 29 (100.0%) | 132.0 |
| High School Diploma | 0 (0.0%) | 0.0 |
| College or Associate's Degree | 0 (0.0%) | 0.0 |
| Bachelor's Degree | 0 (0.0%) | 0.0 |
| Graduate Degree | 0 (0.0%) | 0.0 |
| Total | 29 (100.0%) | 43.0 |
Fertility by Education by Marriage Status in Carter Lake
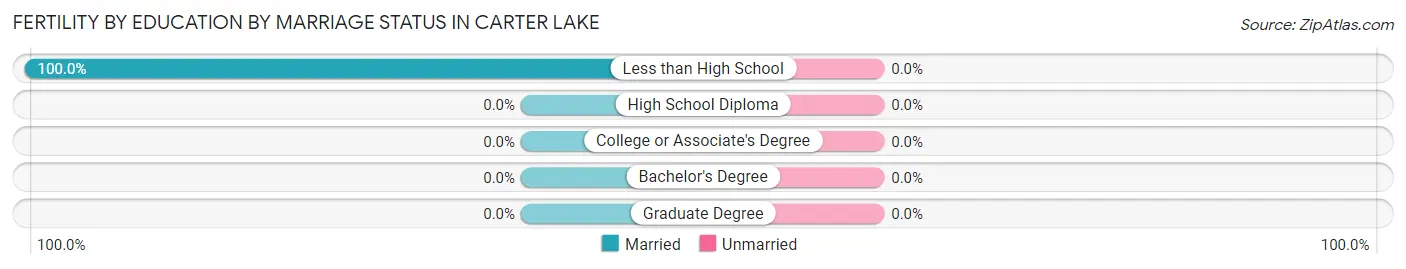
| Educational Attainment | Married | Unmarried |
| Less than High School | 29 (100.0%) | 0 (0.0%) |
| High School Diploma | 0 (0.0%) | 0 (0.0%) |
| College or Associate's Degree | 0 (0.0%) | 0 (0.0%) |
| Bachelor's Degree | 0 (0.0%) | 0 (0.0%) |
| Graduate Degree | 0 (0.0%) | 0 (0.0%) |
| Total | 29 (100.0%) | 0 (0.0%) |
Employment Characteristics in Carter Lake
Employment by Class of Employer in Carter Lake
Among the 1,713 employed individuals in Carter Lake, private company employees (1,289 | 75.2%), not-for-profit organizations (120 | 7.0%), and self-employed (not incorporated) (87 | 5.1%) make up the most common classes of employment.
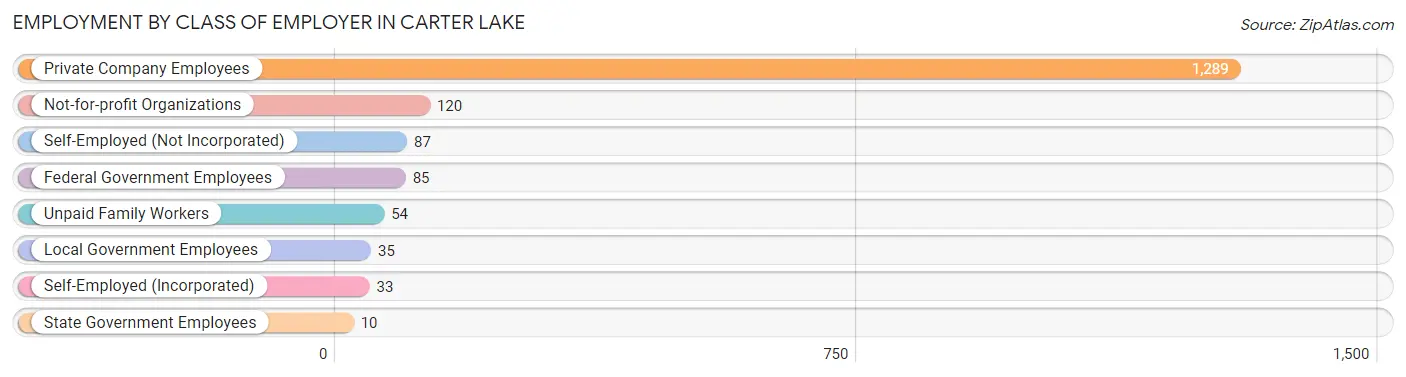
| Employer Class | # Employees | % Employees |
| Private Company Employees | 1,289 | 75.2% |
| Self-Employed (Incorporated) | 33 | 1.9% |
| Self-Employed (Not Incorporated) | 87 | 5.1% |
| Not-for-profit Organizations | 120 | 7.0% |
| Local Government Employees | 35 | 2.0% |
| State Government Employees | 10 | 0.6% |
| Federal Government Employees | 85 | 5.0% |
| Unpaid Family Workers | 54 | 3.2% |
| Total | 1,713 | 100.0% |
Employment Status by Age in Carter Lake
According to the labor force statistics for Carter Lake, out of the total population over 16 years of age (2,824), 64.4% or 1,819 individuals are in the labor force, with 5.9% or 107 of them unemployed. The age group with the highest labor force participation rate is 25 to 29 years, with 91.4% or 106 individuals in the labor force. Within the labor force, the 60 to 64 years age range has the highest percentage of unemployed individuals, with 19.8% or 34 of them being unemployed.
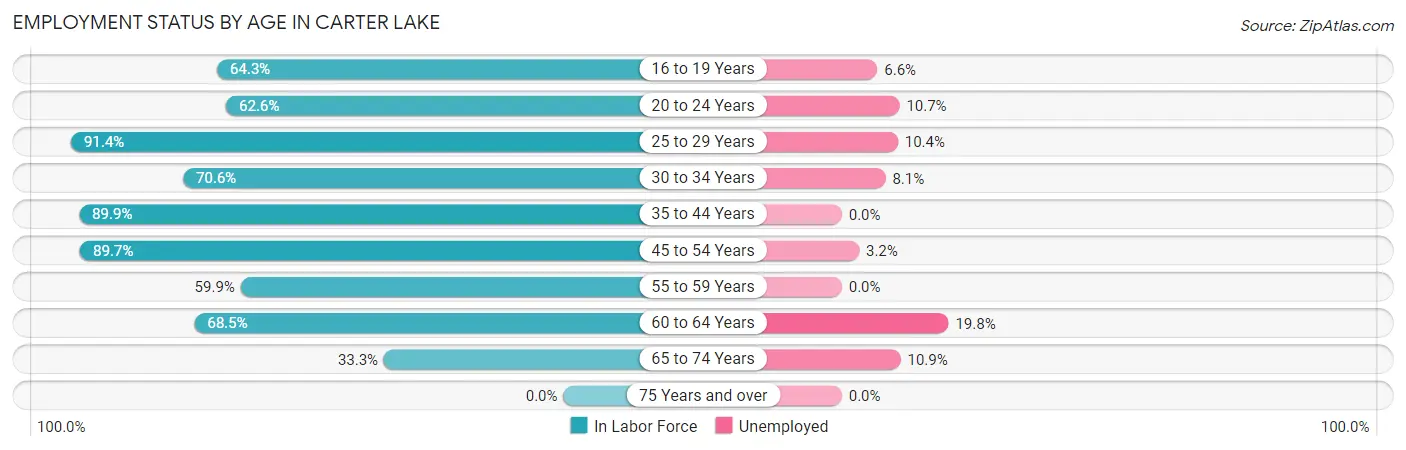
| Age Bracket | In Labor Force | Unemployed |
| 16 to 19 Years | 166 (64.3%) | 11 (6.6%) |
| 20 to 24 Years | 122 (62.6%) | 13 (10.7%) |
| 25 to 29 Years | 106 (91.4%) | 11 (10.4%) |
| 30 to 34 Years | 149 (70.6%) | 12 (8.1%) |
| 35 to 44 Years | 400 (89.9%) | 0 (0.0%) |
| 45 to 54 Years | 341 (89.7%) | 11 (3.2%) |
| 55 to 59 Years | 227 (59.9%) | 0 (0.0%) |
| 60 to 64 Years | 172 (68.5%) | 34 (19.8%) |
| 65 to 74 Years | 137 (33.3%) | 15 (10.9%) |
| 75 Years and over | 0 (0.0%) | 0 (0.0%) |
| Total | 1,819 (64.4%) | 107 (5.9%) |
Employment Status by Educational Attainment in Carter Lake
According to labor force statistics for Carter Lake, 78.3% of individuals (1,395) out of the total population between 25 and 64 years of age (1,782) are in the labor force, with 4.9% or 68 of them being unemployed. The group with the highest labor force participation rate are those with the educational attainment of bachelor's degree or higher, with 91.9% or 203 individuals in the labor force. Within the labor force, individuals with less than high school education have the highest percentage of unemployment, with 23.9% or 34 of them being unemployed.
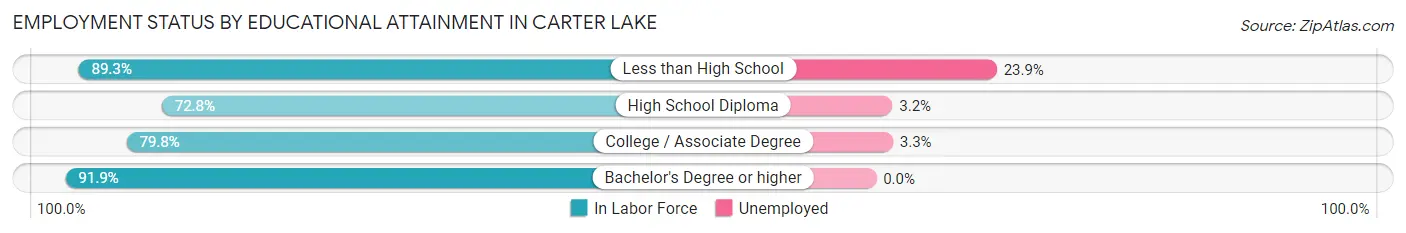
| Educational Attainment | In Labor Force | Unemployed |
| Less than High School | 142 (89.3%) | 38 (23.9%) |
| High School Diploma | 719 (72.8%) | 32 (3.2%) |
| College / Associate Degree | 331 (79.8%) | 14 (3.3%) |
| Bachelor's Degree or higher | 203 (91.9%) | 0 (0.0%) |
| Total | 1,395 (78.3%) | 87 (4.9%) |
Employment Occupations by Sex in Carter Lake
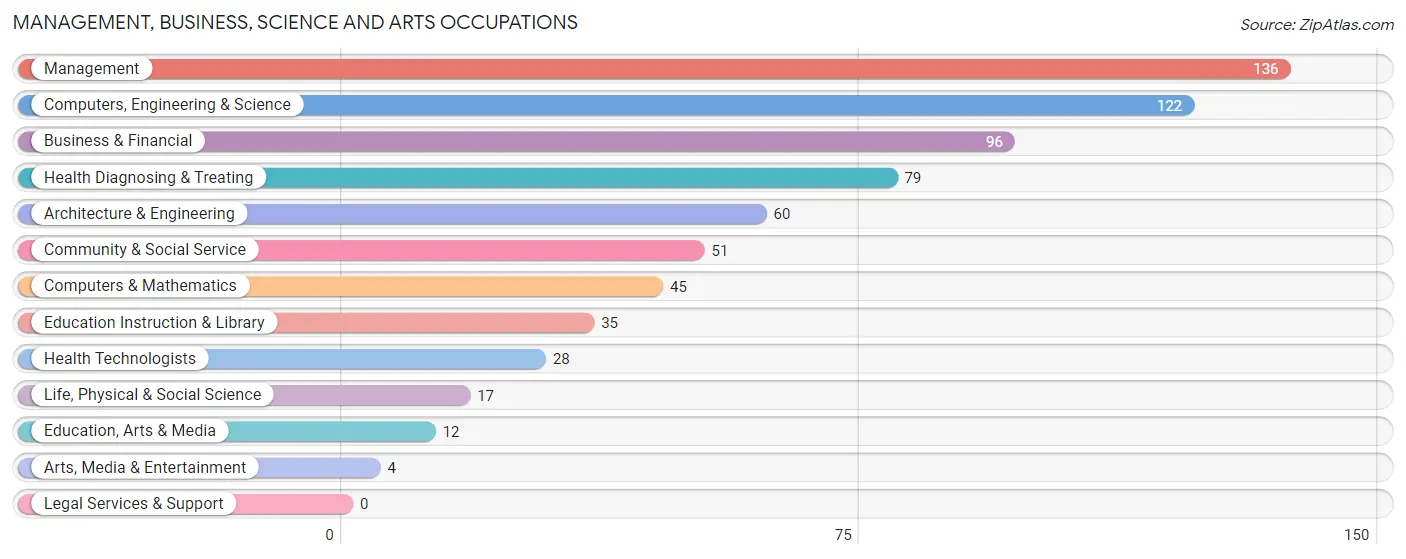
Management, Business, Science and Arts Occupations
The most common Management, Business, Science and Arts occupations in Carter Lake are Management (136 | 7.9%), Computers, Engineering & Science (122 | 7.1%), Business & Financial (96 | 5.6%), Health Diagnosing & Treating (79 | 4.6%), and Architecture & Engineering (60 | 3.5%).
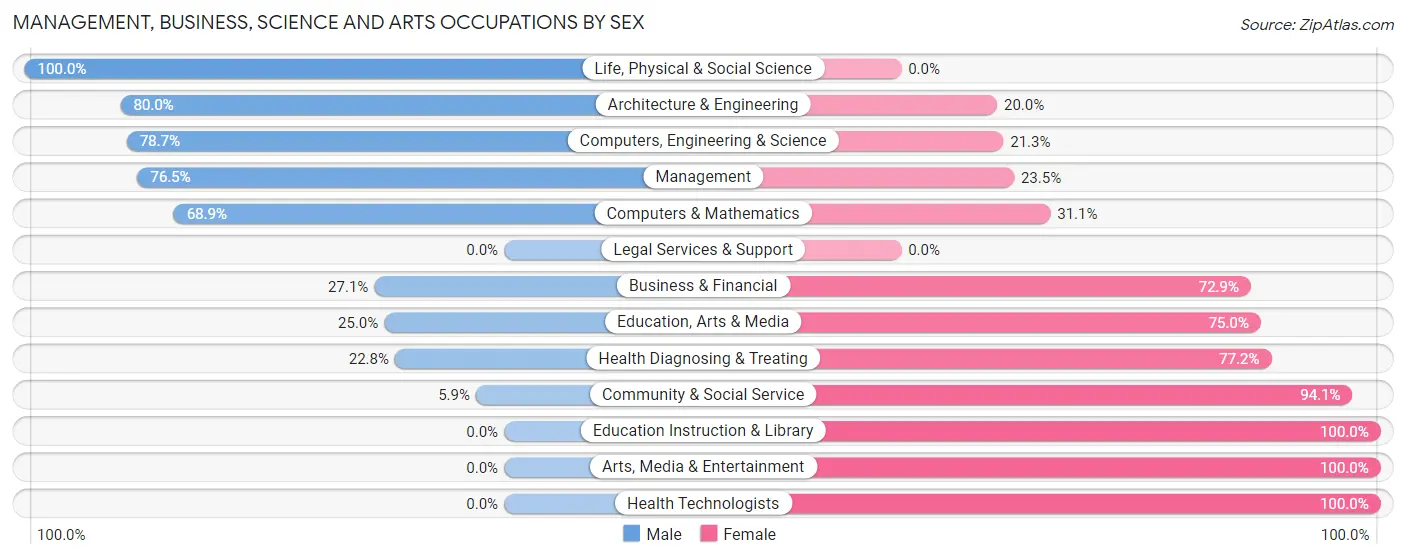
Management, Business, Science and Arts Occupations by Sex
Within the Management, Business, Science and Arts occupations in Carter Lake, the most male-oriented occupations are Life, Physical & Social Science (100.0%), Architecture & Engineering (80.0%), and Computers, Engineering & Science (78.7%), while the most female-oriented occupations are Education Instruction & Library (100.0%), Arts, Media & Entertainment (100.0%), and Health Technologists (100.0%).
| Occupation | Male | Female |
| Management | 104 (76.5%) | 32 (23.5%) |
| Business & Financial | 26 (27.1%) | 70 (72.9%) |
| Computers, Engineering & Science | 96 (78.7%) | 26 (21.3%) |
| Computers & Mathematics | 31 (68.9%) | 14 (31.1%) |
| Architecture & Engineering | 48 (80.0%) | 12 (20.0%) |
| Life, Physical & Social Science | 17 (100.0%) | 0 (0.0%) |
| Community & Social Service | 3 (5.9%) | 48 (94.1%) |
| Education, Arts & Media | 3 (25.0%) | 9 (75.0%) |
| Legal Services & Support | 0 (0.0%) | 0 (0.0%) |
| Education Instruction & Library | 0 (0.0%) | 35 (100.0%) |
| Arts, Media & Entertainment | 0 (0.0%) | 4 (100.0%) |
| Health Diagnosing & Treating | 18 (22.8%) | 61 (77.2%) |
| Health Technologists | 0 (0.0%) | 28 (100.0%) |
| Total (Category) | 247 (51.0%) | 237 (49.0%) |
| Total (Overall) | 948 (55.3%) | 765 (44.7%) |
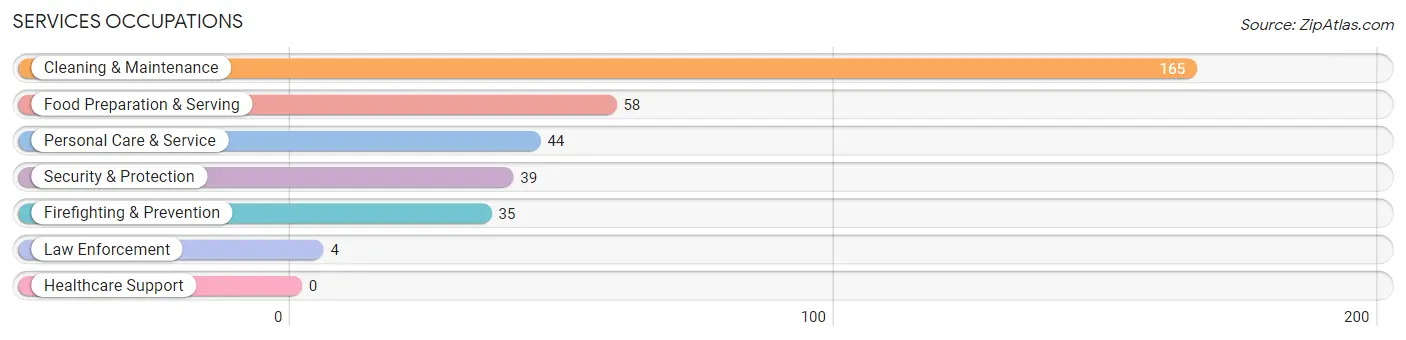
Services Occupations
The most common Services occupations in Carter Lake are Cleaning & Maintenance (165 | 9.6%), Food Preparation & Serving (58 | 3.4%), Personal Care & Service (44 | 2.6%), Security & Protection (39 | 2.3%), and Firefighting & Prevention (35 | 2.0%).
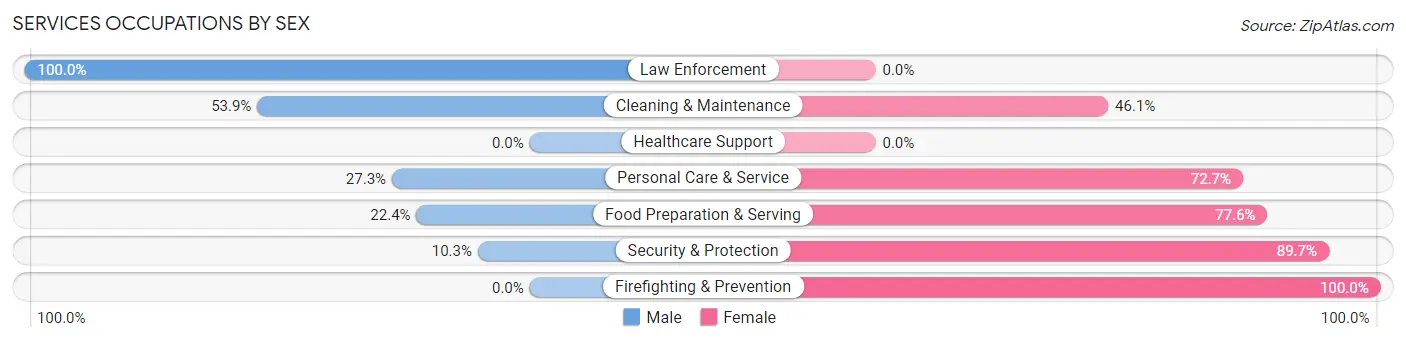
Services Occupations by Sex
Within the Services occupations in Carter Lake, the most male-oriented occupations are Law Enforcement (100.0%), Cleaning & Maintenance (53.9%), and Personal Care & Service (27.3%), while the most female-oriented occupations are Firefighting & Prevention (100.0%), Security & Protection (89.7%), and Food Preparation & Serving (77.6%).
| Occupation | Male | Female |
| Healthcare Support | 0 (0.0%) | 0 (0.0%) |
| Security & Protection | 4 (10.3%) | 35 (89.7%) |
| Firefighting & Prevention | 0 (0.0%) | 35 (100.0%) |
| Law Enforcement | 4 (100.0%) | 0 (0.0%) |
| Food Preparation & Serving | 13 (22.4%) | 45 (77.6%) |
| Cleaning & Maintenance | 89 (53.9%) | 76 (46.1%) |
| Personal Care & Service | 12 (27.3%) | 32 (72.7%) |
| Total (Category) | 118 (38.6%) | 188 (61.4%) |
| Total (Overall) | 948 (55.3%) | 765 (44.7%) |
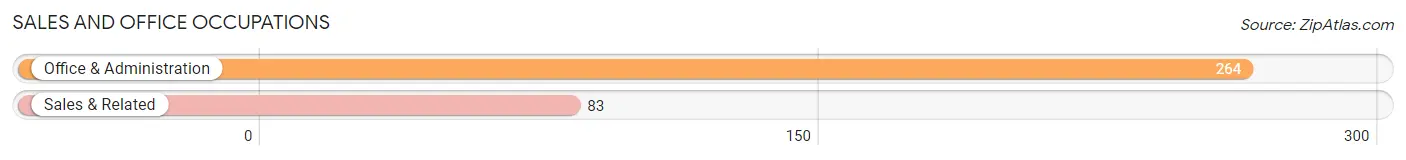
Sales and Office Occupations
The most common Sales and Office occupations in Carter Lake are Office & Administration (264 | 15.4%), and Sales & Related (83 | 4.9%).
Sales and Office Occupations by Sex
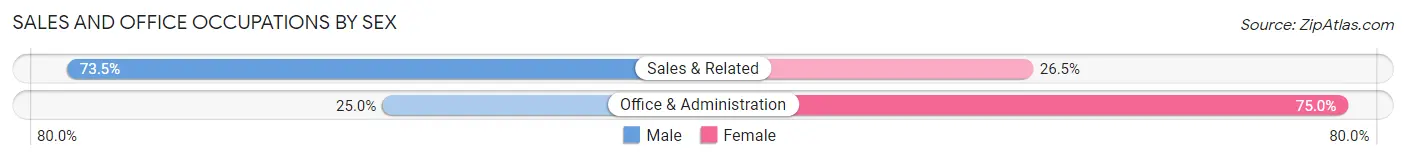
| Occupation | Male | Female |
| Sales & Related | 61 (73.5%) | 22 (26.5%) |
| Office & Administration | 66 (25.0%) | 198 (75.0%) |
| Total (Category) | 127 (36.6%) | 220 (63.4%) |
| Total (Overall) | 948 (55.3%) | 765 (44.7%) |
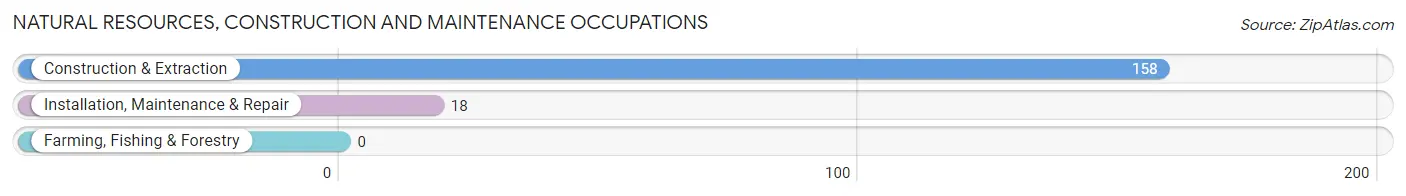
Natural Resources, Construction and Maintenance Occupations
The most common Natural Resources, Construction and Maintenance occupations in Carter Lake are Construction & Extraction (158 | 9.2%), and Installation, Maintenance & Repair (18 | 1.1%).
Natural Resources, Construction and Maintenance Occupations by Sex
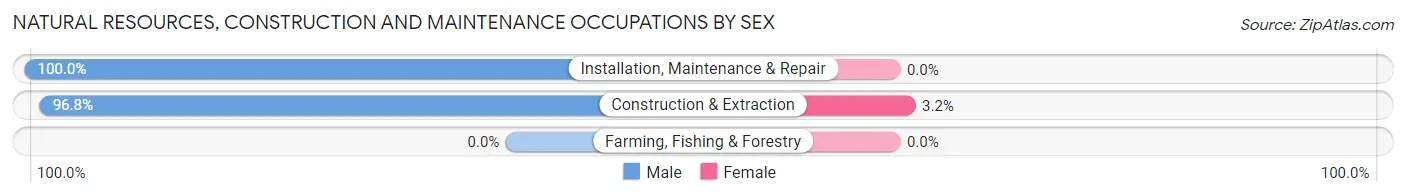
| Occupation | Male | Female |
| Farming, Fishing & Forestry | 0 (0.0%) | 0 (0.0%) |
| Construction & Extraction | 153 (96.8%) | 5 (3.2%) |
| Installation, Maintenance & Repair | 18 (100.0%) | 0 (0.0%) |
| Total (Category) | 171 (97.2%) | 5 (2.8%) |
| Total (Overall) | 948 (55.3%) | 765 (44.7%) |
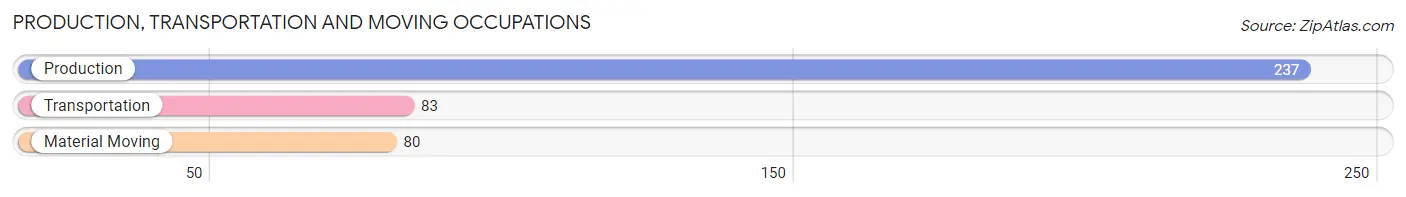
Production, Transportation and Moving Occupations
The most common Production, Transportation and Moving occupations in Carter Lake are Production (237 | 13.8%), Transportation (83 | 4.9%), and Material Moving (80 | 4.7%).
Production, Transportation and Moving Occupations by Sex
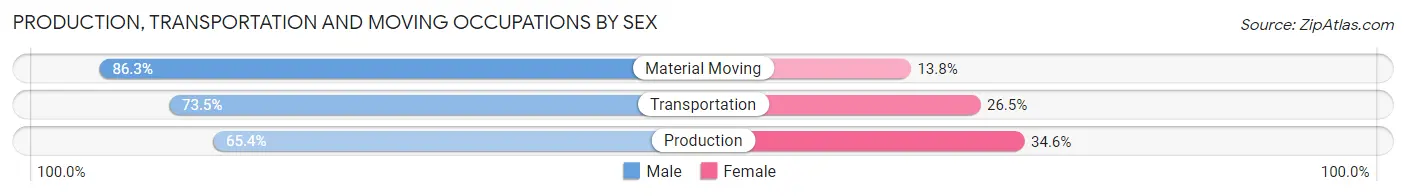
| Occupation | Male | Female |
| Production | 155 (65.4%) | 82 (34.6%) |
| Transportation | 61 (73.5%) | 22 (26.5%) |
| Material Moving | 69 (86.3%) | 11 (13.8%) |
| Total (Category) | 285 (71.3%) | 115 (28.7%) |
| Total (Overall) | 948 (55.3%) | 765 (44.7%) |
Employment Industries by Sex in Carter Lake
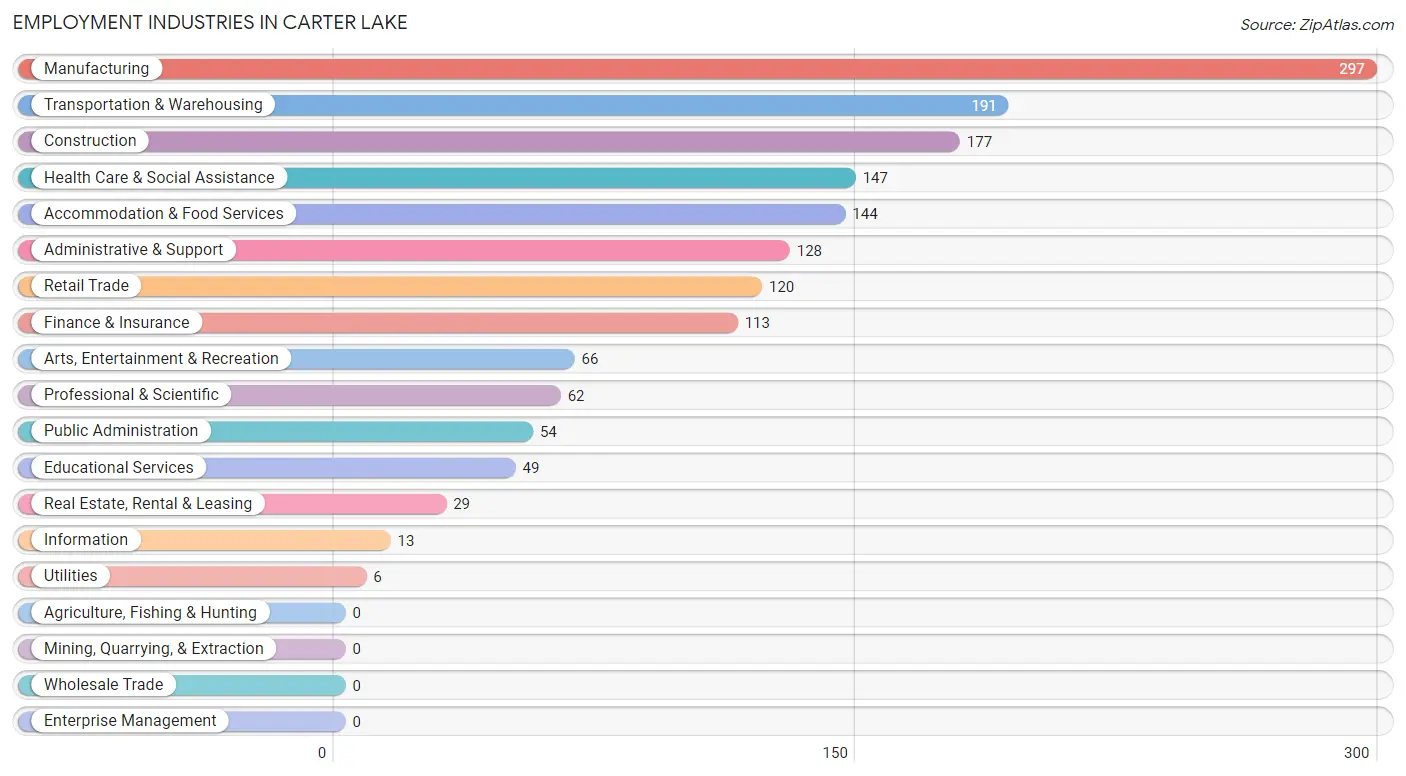
Employment Industries in Carter Lake
The major employment industries in Carter Lake include Manufacturing (297 | 17.3%), Transportation & Warehousing (191 | 11.2%), Construction (177 | 10.3%), Health Care & Social Assistance (147 | 8.6%), and Accommodation & Food Services (144 | 8.4%).
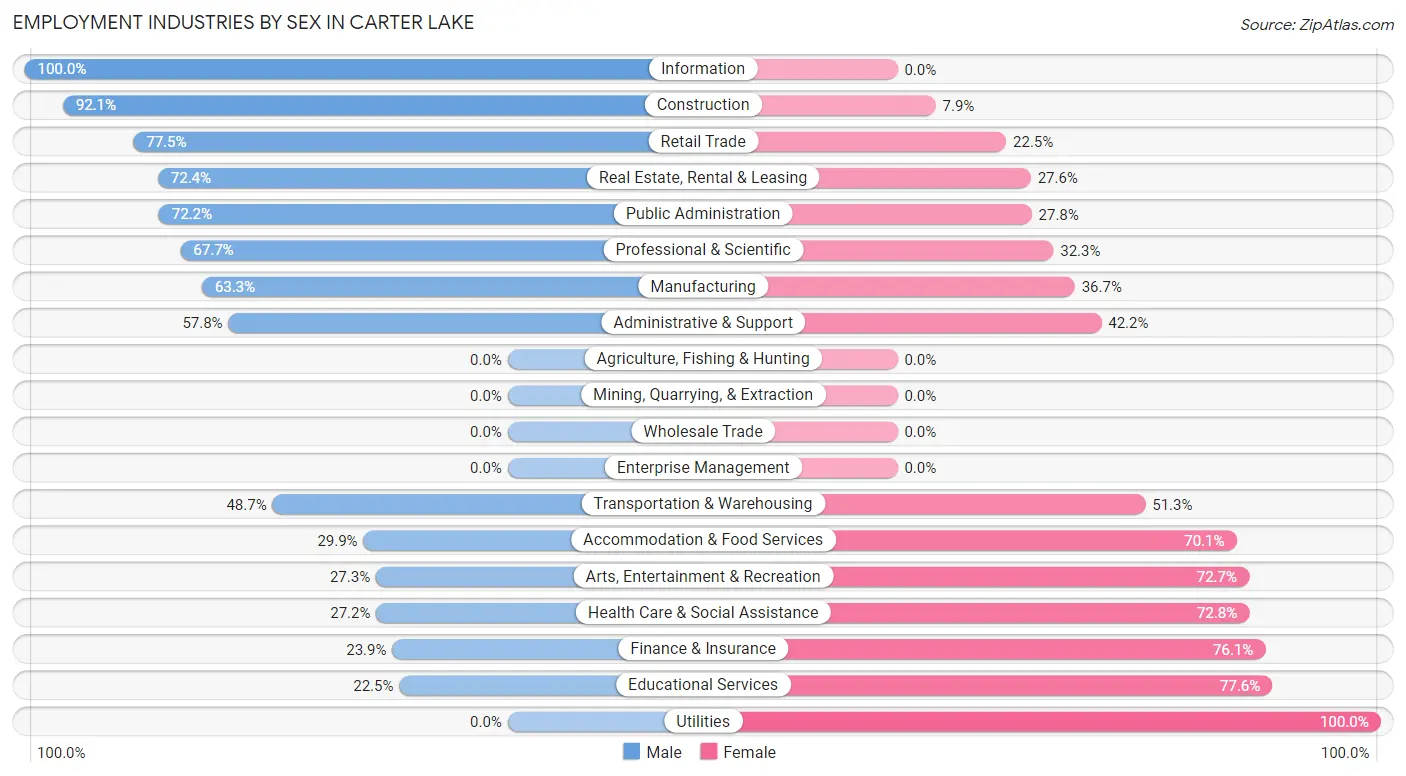
Employment Industries by Sex in Carter Lake
The Carter Lake industries that see more men than women are Information (100.0%), Construction (92.1%), and Retail Trade (77.5%), whereas the industries that tend to have a higher number of women are Utilities (100.0%), Educational Services (77.5%), and Finance & Insurance (76.1%).
| Industry | Male | Female |
| Agriculture, Fishing & Hunting | 0 (0.0%) | 0 (0.0%) |
| Mining, Quarrying, & Extraction | 0 (0.0%) | 0 (0.0%) |
| Construction | 163 (92.1%) | 14 (7.9%) |
| Manufacturing | 188 (63.3%) | 109 (36.7%) |
| Wholesale Trade | 0 (0.0%) | 0 (0.0%) |
| Retail Trade | 93 (77.5%) | 27 (22.5%) |
| Transportation & Warehousing | 93 (48.7%) | 98 (51.3%) |
| Utilities | 0 (0.0%) | 6 (100.0%) |
| Information | 13 (100.0%) | 0 (0.0%) |
| Finance & Insurance | 27 (23.9%) | 86 (76.1%) |
| Real Estate, Rental & Leasing | 21 (72.4%) | 8 (27.6%) |
| Professional & Scientific | 42 (67.7%) | 20 (32.3%) |
| Enterprise Management | 0 (0.0%) | 0 (0.0%) |
| Administrative & Support | 74 (57.8%) | 54 (42.2%) |
| Educational Services | 11 (22.5%) | 38 (77.5%) |
| Health Care & Social Assistance | 40 (27.2%) | 107 (72.8%) |
| Arts, Entertainment & Recreation | 18 (27.3%) | 48 (72.7%) |
| Accommodation & Food Services | 43 (29.9%) | 101 (70.1%) |
| Public Administration | 39 (72.2%) | 15 (27.8%) |
| Total | 948 (55.3%) | 765 (44.7%) |
Education in Carter Lake
School Enrollment in Carter Lake
The most common levels of schooling among the 864 students in Carter Lake are elementary school (404 | 46.8%), high school (184 | 21.3%), and middle school (103 | 11.9%).
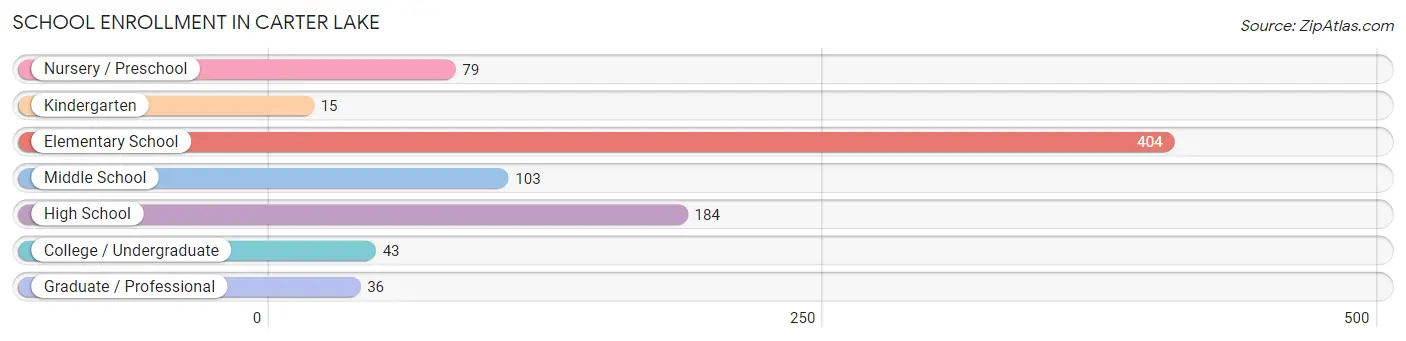
| School Level | # Students | % Students |
| Nursery / Preschool | 79 | 9.1% |
| Kindergarten | 15 | 1.7% |
| Elementary School | 404 | 46.8% |
| Middle School | 103 | 11.9% |
| High School | 184 | 21.3% |
| College / Undergraduate | 43 | 5.0% |
| Graduate / Professional | 36 | 4.2% |
| Total | 864 | 100.0% |
School Enrollment by Age by Funding Source in Carter Lake
Out of a total of 864 students who are enrolled in schools in Carter Lake, 22 (2.5%) attend a private institution, while the remaining 842 (97.5%) are enrolled in public schools. The age group of 15 to 17 year olds has the highest likelihood of being enrolled in private schools, with 10 (8.8% in the age bracket) enrolled. Conversely, the age group of 3 to 4 year olds has the lowest likelihood of being enrolled in a private school, with 31 (100.0% in the age bracket) attending a public institution.
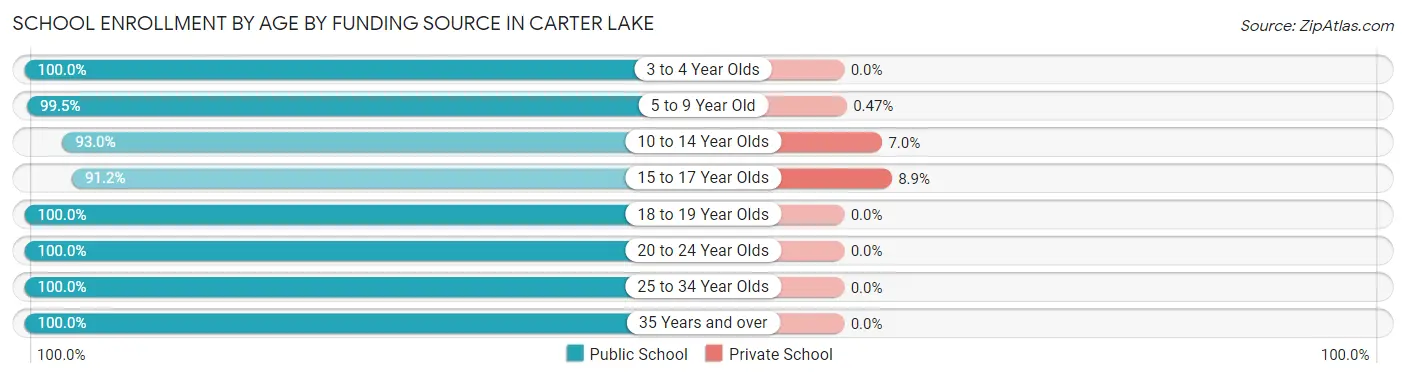
| Age Bracket | Public School | Private School |
| 3 to 4 Year Olds | 31 (100.0%) | 0 (0.0%) |
| 5 to 9 Year Old | 426 (99.5%) | 2 (0.5%) |
| 10 to 14 Year Olds | 132 (93.0%) | 10 (7.0%) |
| 15 to 17 Year Olds | 103 (91.1%) | 10 (8.8%) |
| 18 to 19 Year Olds | 69 (100.0%) | 0 (0.0%) |
| 20 to 24 Year Olds | 55 (100.0%) | 0 (0.0%) |
| 25 to 34 Year Olds | 21 (100.0%) | 0 (0.0%) |
| 35 Years and over | 5 (100.0%) | 0 (0.0%) |
| Total | 842 (97.5%) | 22 (2.5%) |
Educational Attainment by Field of Study in Carter Lake
Education (81 | 25.2%), science & technology (74 | 23.0%), business (49 | 15.2%), arts & humanities (41 | 12.7%), and bio, nature & agricultural (24 | 7.4%) are the most common fields of study among 322 individuals in Carter Lake who have obtained a bachelor's degree or higher.
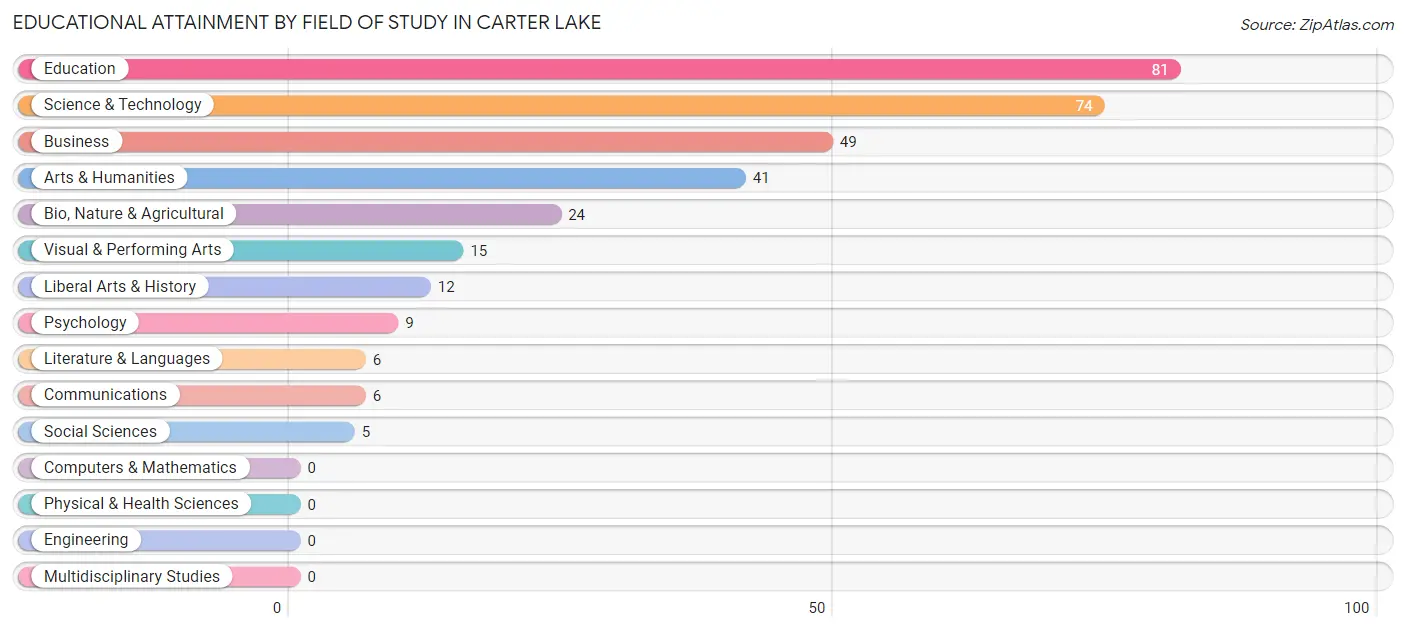
| Field of Study | # Graduates | % Graduates |
| Computers & Mathematics | 0 | 0.0% |
| Bio, Nature & Agricultural | 24 | 7.4% |
| Physical & Health Sciences | 0 | 0.0% |
| Psychology | 9 | 2.8% |
| Social Sciences | 5 | 1.5% |
| Engineering | 0 | 0.0% |
| Multidisciplinary Studies | 0 | 0.0% |
| Science & Technology | 74 | 23.0% |
| Business | 49 | 15.2% |
| Education | 81 | 25.2% |
| Literature & Languages | 6 | 1.9% |
| Liberal Arts & History | 12 | 3.7% |
| Visual & Performing Arts | 15 | 4.7% |
| Communications | 6 | 1.9% |
| Arts & Humanities | 41 | 12.7% |
| Total | 322 | 100.0% |
Transportation & Commute in Carter Lake
Vehicle Availability by Sex in Carter Lake
The most prevalent vehicle ownership categories in Carter Lake are males with 2 vehicles (392, accounting for 41.3%) and females with 2 vehicles (335, making up 51.2%).
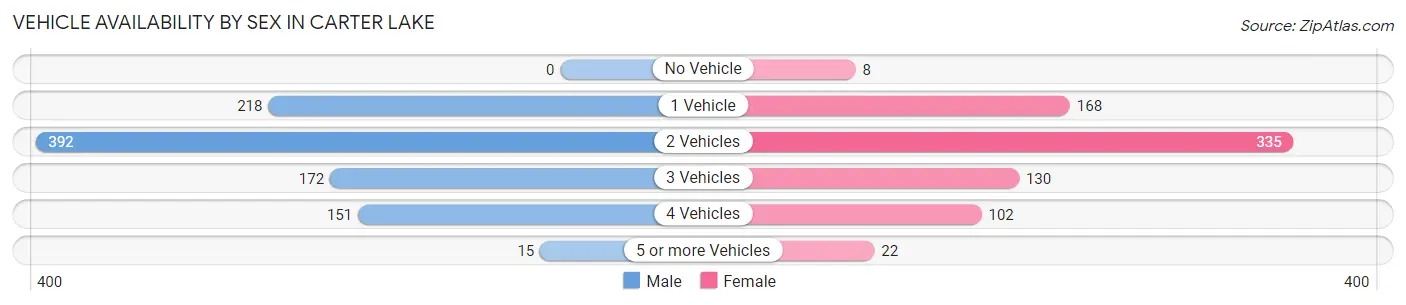
| Vehicles Available | Male | Female |
| No Vehicle | 0 (0.0%) | 8 (1.1%) |
| 1 Vehicle | 218 (23.0%) | 168 (22.0%) |
| 2 Vehicles | 392 (41.3%) | 335 (43.8%) |
| 3 Vehicles | 172 (18.1%) | 130 (17.0%) |
| 4 Vehicles | 151 (15.9%) | 102 (13.3%) |
| 5 or more Vehicles | 15 (1.6%) | 22 (2.9%) |
| Total | 948 (100.0%) | 765 (100.0%) |
Commute Time in Carter Lake
The most frequently occuring commute durations in Carter Lake are 20 to 24 minutes (443 commuters, 28.5%), 15 to 19 minutes (245 commuters, 15.8%), and 30 to 34 minutes (163 commuters, 10.5%).
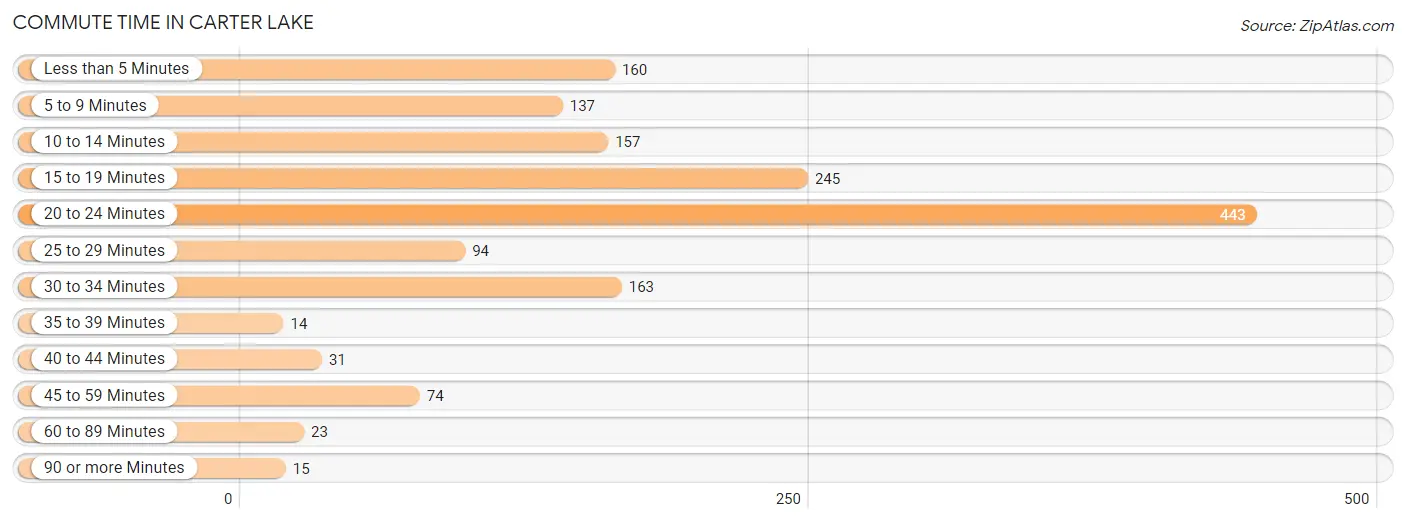
| Commute Time | # Commuters | % Commuters |
| Less than 5 Minutes | 160 | 10.3% |
| 5 to 9 Minutes | 137 | 8.8% |
| 10 to 14 Minutes | 157 | 10.1% |
| 15 to 19 Minutes | 245 | 15.8% |
| 20 to 24 Minutes | 443 | 28.5% |
| 25 to 29 Minutes | 94 | 6.0% |
| 30 to 34 Minutes | 163 | 10.5% |
| 35 to 39 Minutes | 14 | 0.9% |
| 40 to 44 Minutes | 31 | 2.0% |
| 45 to 59 Minutes | 74 | 4.8% |
| 60 to 89 Minutes | 23 | 1.5% |
| 90 or more Minutes | 15 | 1.0% |
Commute Time by Sex in Carter Lake
The most common commute times in Carter Lake are 20 to 24 minutes (243 commuters, 28.4%) for males and 20 to 24 minutes (200 commuters, 28.6%) for females.
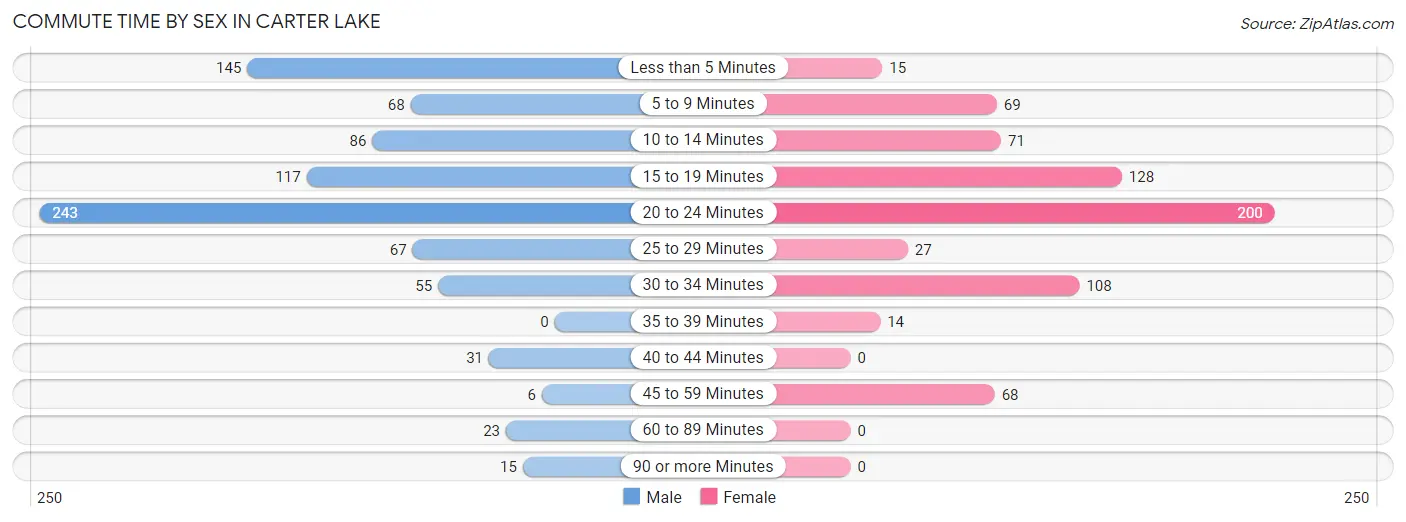
| Commute Time | Male | Female |
| Less than 5 Minutes | 145 (16.9%) | 15 (2.1%) |
| 5 to 9 Minutes | 68 (7.9%) | 69 (9.9%) |
| 10 to 14 Minutes | 86 (10.1%) | 71 (10.1%) |
| 15 to 19 Minutes | 117 (13.7%) | 128 (18.3%) |
| 20 to 24 Minutes | 243 (28.4%) | 200 (28.6%) |
| 25 to 29 Minutes | 67 (7.8%) | 27 (3.9%) |
| 30 to 34 Minutes | 55 (6.4%) | 108 (15.4%) |
| 35 to 39 Minutes | 0 (0.0%) | 14 (2.0%) |
| 40 to 44 Minutes | 31 (3.6%) | 0 (0.0%) |
| 45 to 59 Minutes | 6 (0.7%) | 68 (9.7%) |
| 60 to 89 Minutes | 23 (2.7%) | 0 (0.0%) |
| 90 or more Minutes | 15 (1.8%) | 0 (0.0%) |
Time of Departure to Work by Sex in Carter Lake
The most frequent times of departure to work in Carter Lake are 7:30 AM to 7:59 AM (206, 24.1%) for males and 5:30 AM to 5:59 AM (102, 14.6%) for females.
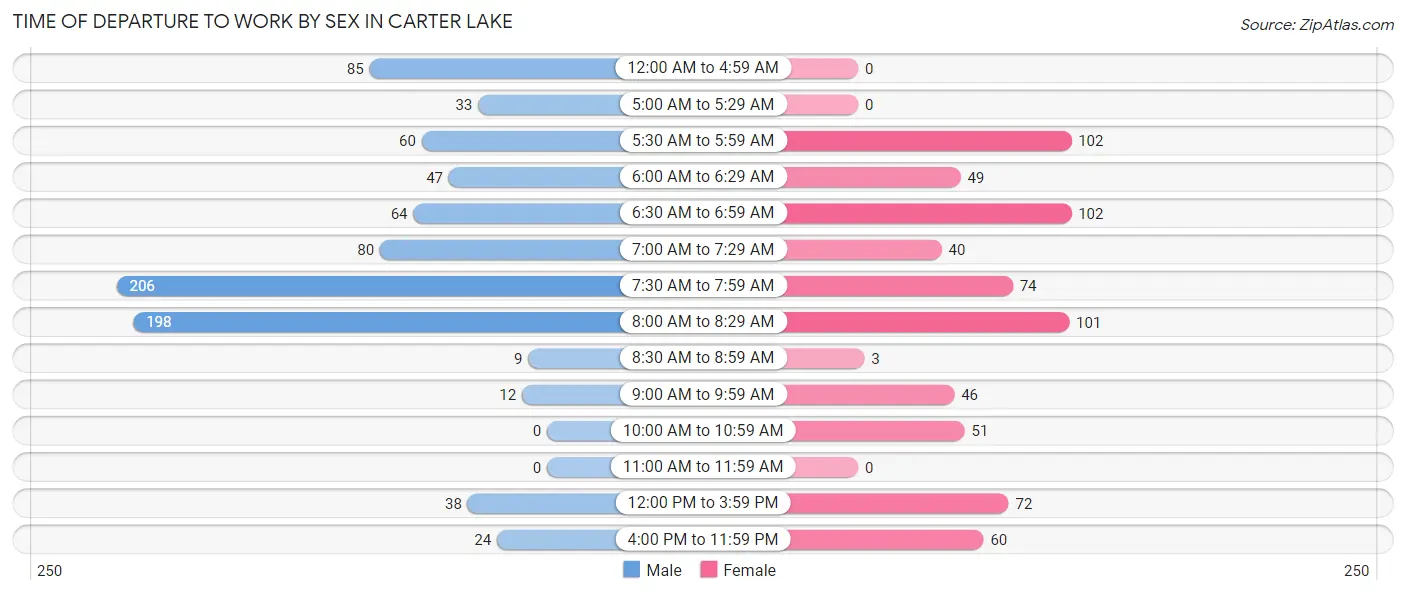
| Time of Departure | Male | Female |
| 12:00 AM to 4:59 AM | 85 (9.9%) | 0 (0.0%) |
| 5:00 AM to 5:29 AM | 33 (3.9%) | 0 (0.0%) |
| 5:30 AM to 5:59 AM | 60 (7.0%) | 102 (14.6%) |
| 6:00 AM to 6:29 AM | 47 (5.5%) | 49 (7.0%) |
| 6:30 AM to 6:59 AM | 64 (7.5%) | 102 (14.6%) |
| 7:00 AM to 7:29 AM | 80 (9.3%) | 40 (5.7%) |
| 7:30 AM to 7:59 AM | 206 (24.1%) | 74 (10.6%) |
| 8:00 AM to 8:29 AM | 198 (23.1%) | 101 (14.4%) |
| 8:30 AM to 8:59 AM | 9 (1.1%) | 3 (0.4%) |
| 9:00 AM to 9:59 AM | 12 (1.4%) | 46 (6.6%) |
| 10:00 AM to 10:59 AM | 0 (0.0%) | 51 (7.3%) |
| 11:00 AM to 11:59 AM | 0 (0.0%) | 0 (0.0%) |
| 12:00 PM to 3:59 PM | 38 (4.4%) | 72 (10.3%) |
| 4:00 PM to 11:59 PM | 24 (2.8%) | 60 (8.6%) |
| Total | 856 (100.0%) | 700 (100.0%) |
Housing Occupancy in Carter Lake
Occupancy by Ownership in Carter Lake
Of the total 1,351 dwellings in Carter Lake, owner-occupied units account for 1,088 (80.5%), while renter-occupied units make up 263 (19.5%).
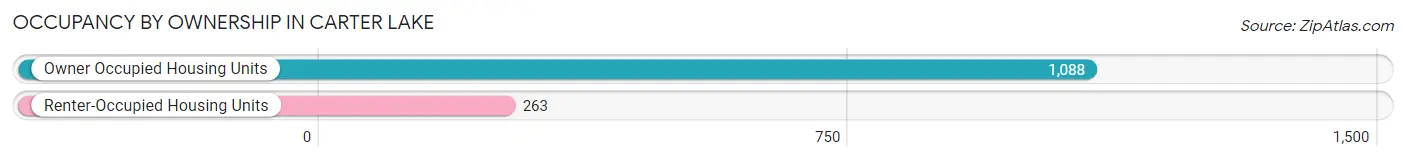
| Occupancy | # Housing Units | % Housing Units |
| Owner Occupied Housing Units | 1,088 | 80.5% |
| Renter-Occupied Housing Units | 263 | 19.5% |
| Total Occupied Housing Units | 1,351 | 100.0% |
Occupancy by Household Size in Carter Lake
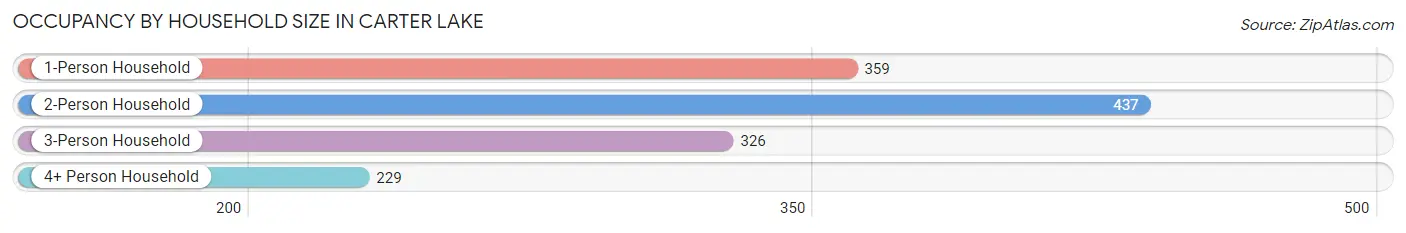
| Household Size | # Housing Units | % Housing Units |
| 1-Person Household | 359 | 26.6% |
| 2-Person Household | 437 | 32.4% |
| 3-Person Household | 326 | 24.1% |
| 4+ Person Household | 229 | 17.0% |
| Total Housing Units | 1,351 | 100.0% |
Occupancy by Ownership by Household Size in Carter Lake
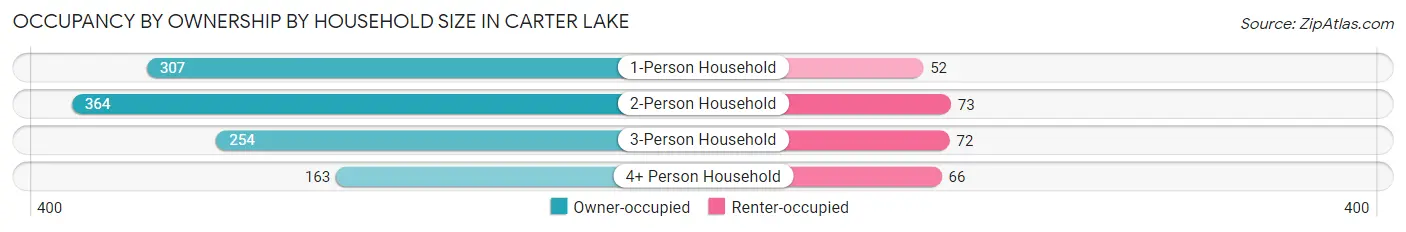
| Household Size | Owner-occupied | Renter-occupied |
| 1-Person Household | 307 (85.5%) | 52 (14.5%) |
| 2-Person Household | 364 (83.3%) | 73 (16.7%) |
| 3-Person Household | 254 (77.9%) | 72 (22.1%) |
| 4+ Person Household | 163 (71.2%) | 66 (28.8%) |
| Total Housing Units | 1,088 (80.5%) | 263 (19.5%) |
Occupancy by Educational Attainment in Carter Lake
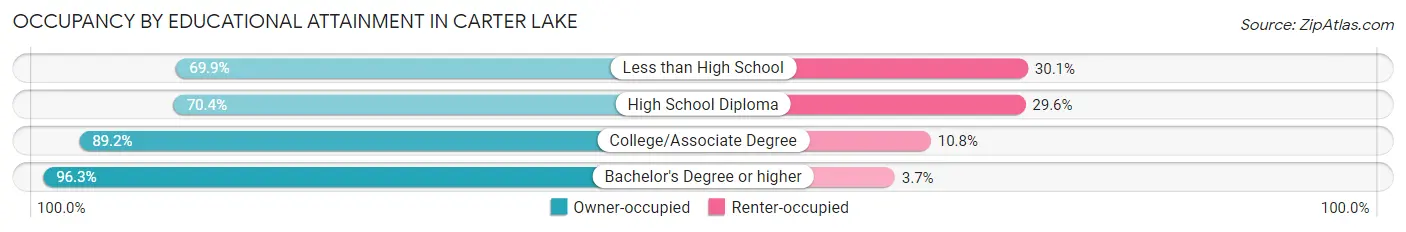
| Household Size | Owner-occupied | Renter-occupied |
| Less than High School | 93 (69.9%) | 40 (30.1%) |
| High School Diploma | 407 (70.4%) | 171 (29.6%) |
| College/Associate Degree | 354 (89.2%) | 43 (10.8%) |
| Bachelor's Degree or higher | 234 (96.3%) | 9 (3.7%) |
Occupancy by Age of Householder in Carter Lake
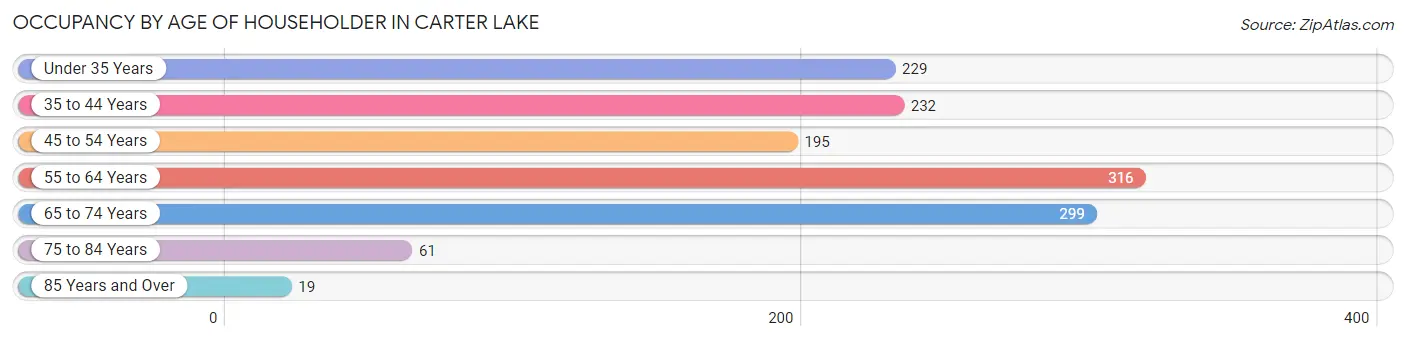
| Age Bracket | # Households | % Households |
| Under 35 Years | 229 | 17.0% |
| 35 to 44 Years | 232 | 17.2% |
| 45 to 54 Years | 195 | 14.4% |
| 55 to 64 Years | 316 | 23.4% |
| 65 to 74 Years | 299 | 22.1% |
| 75 to 84 Years | 61 | 4.5% |
| 85 Years and Over | 19 | 1.4% |
| Total | 1,351 | 100.0% |
Housing Finances in Carter Lake
Median Income by Occupancy in Carter Lake
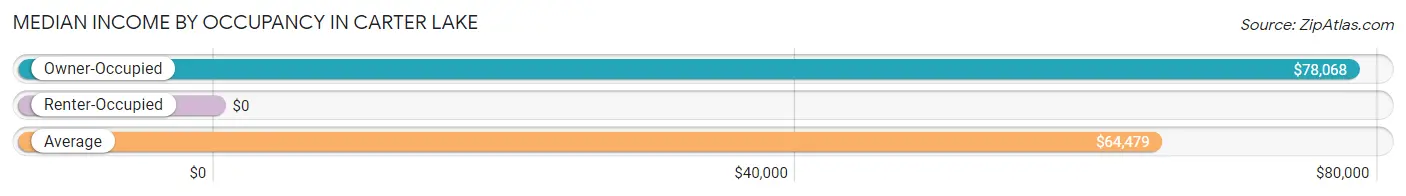
| Occupancy Type | # Households | Median Income |
| Owner-Occupied | 1,088 (80.5%) | $78,068 |
| Renter-Occupied | 263 (19.5%) | $0 |
| Average | 1,351 (100.0%) | $64,479 |
Occupancy by Householder Income Bracket in Carter Lake
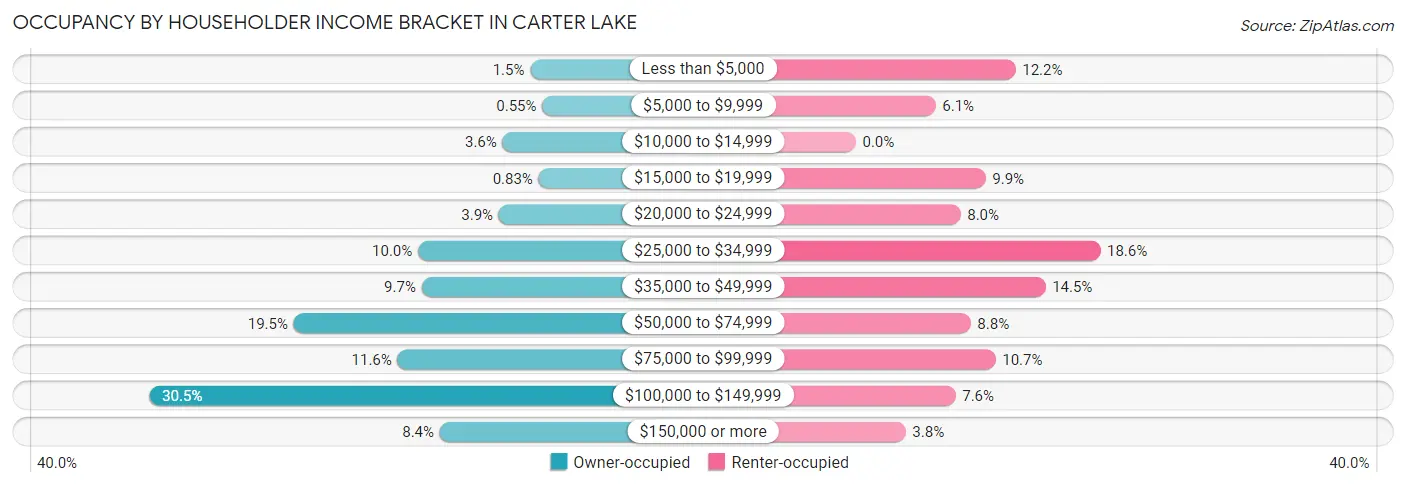
| Income Bracket | Owner-occupied | Renter-occupied |
| Less than $5,000 | 16 (1.5%) | 32 (12.2%) |
| $5,000 to $9,999 | 6 (0.5%) | 16 (6.1%) |
| $10,000 to $14,999 | 39 (3.6%) | 0 (0.0%) |
| $15,000 to $19,999 | 9 (0.8%) | 26 (9.9%) |
| $20,000 to $24,999 | 42 (3.9%) | 21 (8.0%) |
| $25,000 to $34,999 | 109 (10.0%) | 49 (18.6%) |
| $35,000 to $49,999 | 106 (9.7%) | 38 (14.4%) |
| $50,000 to $74,999 | 212 (19.5%) | 23 (8.7%) |
| $75,000 to $99,999 | 126 (11.6%) | 28 (10.6%) |
| $100,000 to $149,999 | 332 (30.5%) | 20 (7.6%) |
| $150,000 or more | 91 (8.4%) | 10 (3.8%) |
| Total | 1,088 (100.0%) | 263 (100.0%) |
Monthly Housing Cost Tiers in Carter Lake
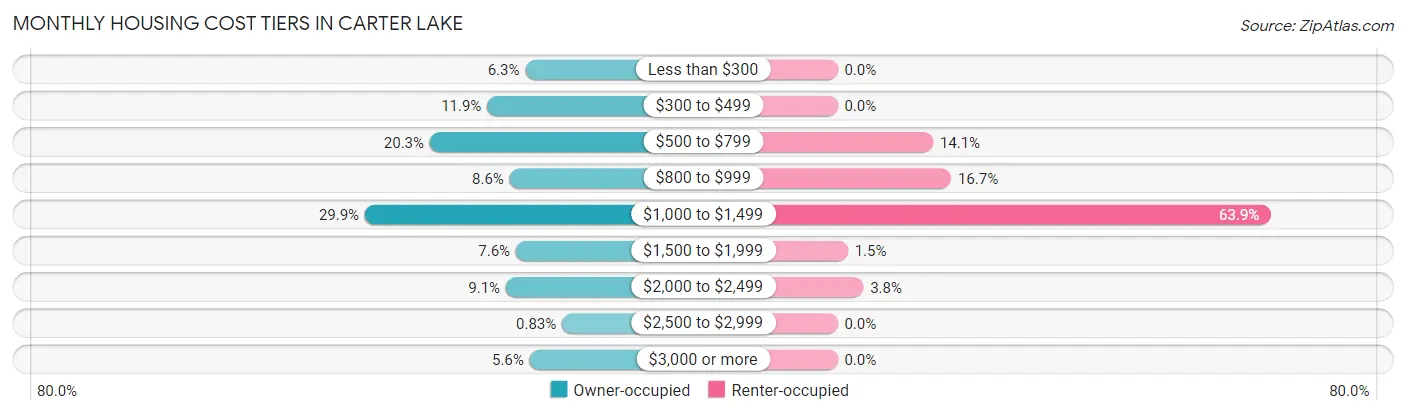
| Monthly Cost | Owner-occupied | Renter-occupied |
| Less than $300 | 68 (6.2%) | 0 (0.0%) |
| $300 to $499 | 129 (11.9%) | 0 (0.0%) |
| $500 to $799 | 221 (20.3%) | 37 (14.1%) |
| $800 to $999 | 93 (8.6%) | 44 (16.7%) |
| $1,000 to $1,499 | 325 (29.9%) | 168 (63.9%) |
| $1,500 to $1,999 | 83 (7.6%) | 4 (1.5%) |
| $2,000 to $2,499 | 99 (9.1%) | 10 (3.8%) |
| $2,500 to $2,999 | 9 (0.8%) | 0 (0.0%) |
| $3,000 or more | 61 (5.6%) | 0 (0.0%) |
| Total | 1,088 (100.0%) | 263 (100.0%) |
Physical Housing Characteristics in Carter Lake
Housing Structures in Carter Lake
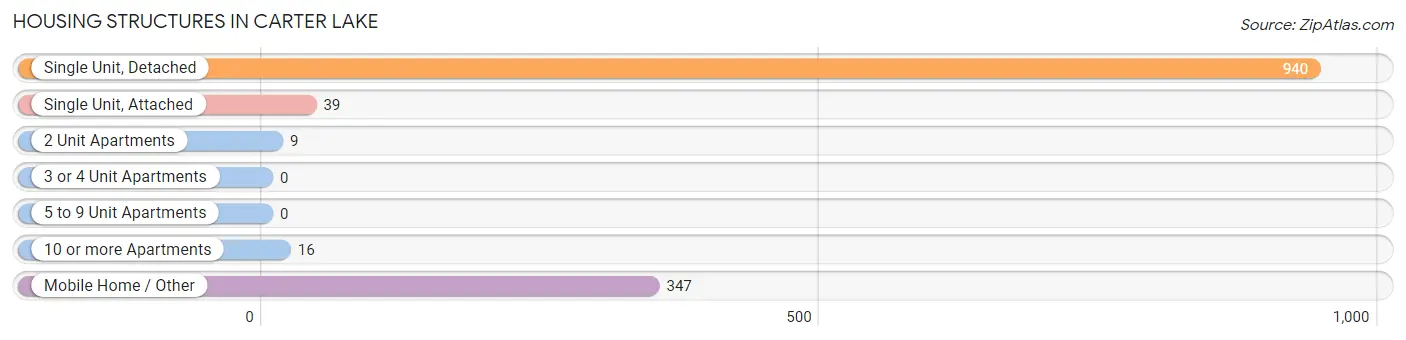
| Structure Type | # Housing Units | % Housing Units |
| Single Unit, Detached | 940 | 69.6% |
| Single Unit, Attached | 39 | 2.9% |
| 2 Unit Apartments | 9 | 0.7% |
| 3 or 4 Unit Apartments | 0 | 0.0% |
| 5 to 9 Unit Apartments | 0 | 0.0% |
| 10 or more Apartments | 16 | 1.2% |
| Mobile Home / Other | 347 | 25.7% |
| Total | 1,351 | 100.0% |
Housing Structures by Occupancy in Carter Lake
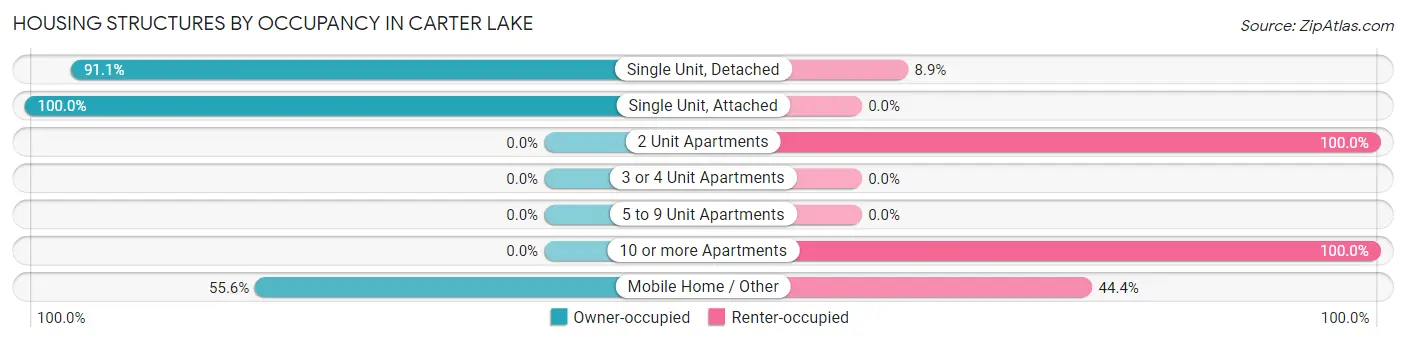
| Structure Type | Owner-occupied | Renter-occupied |
| Single Unit, Detached | 856 (91.1%) | 84 (8.9%) |
| Single Unit, Attached | 39 (100.0%) | 0 (0.0%) |
| 2 Unit Apartments | 0 (0.0%) | 9 (100.0%) |
| 3 or 4 Unit Apartments | 0 (0.0%) | 0 (0.0%) |
| 5 to 9 Unit Apartments | 0 (0.0%) | 0 (0.0%) |
| 10 or more Apartments | 0 (0.0%) | 16 (100.0%) |
| Mobile Home / Other | 193 (55.6%) | 154 (44.4%) |
| Total | 1,088 (80.5%) | 263 (19.5%) |
Housing Structures by Number of Rooms in Carter Lake
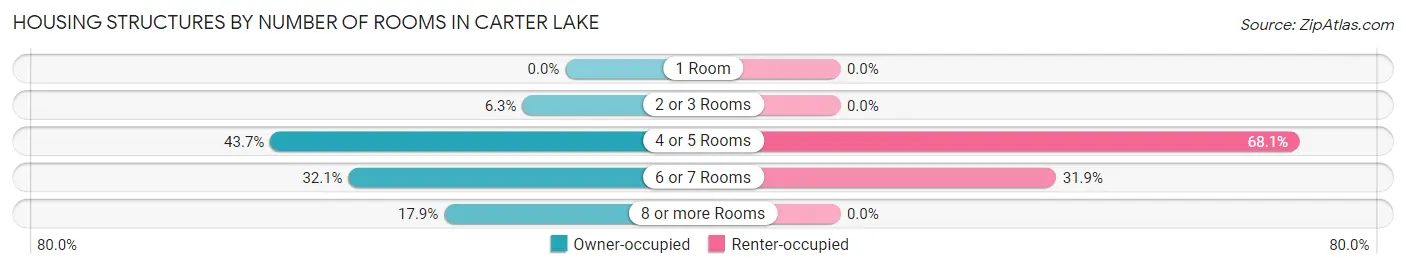
| Number of Rooms | Owner-occupied | Renter-occupied |
| 1 Room | 0 (0.0%) | 0 (0.0%) |
| 2 or 3 Rooms | 69 (6.3%) | 0 (0.0%) |
| 4 or 5 Rooms | 475 (43.7%) | 179 (68.1%) |
| 6 or 7 Rooms | 349 (32.1%) | 84 (31.9%) |
| 8 or more Rooms | 195 (17.9%) | 0 (0.0%) |
| Total | 1,088 (100.0%) | 263 (100.0%) |
Housing Structure by Heating Type in Carter Lake
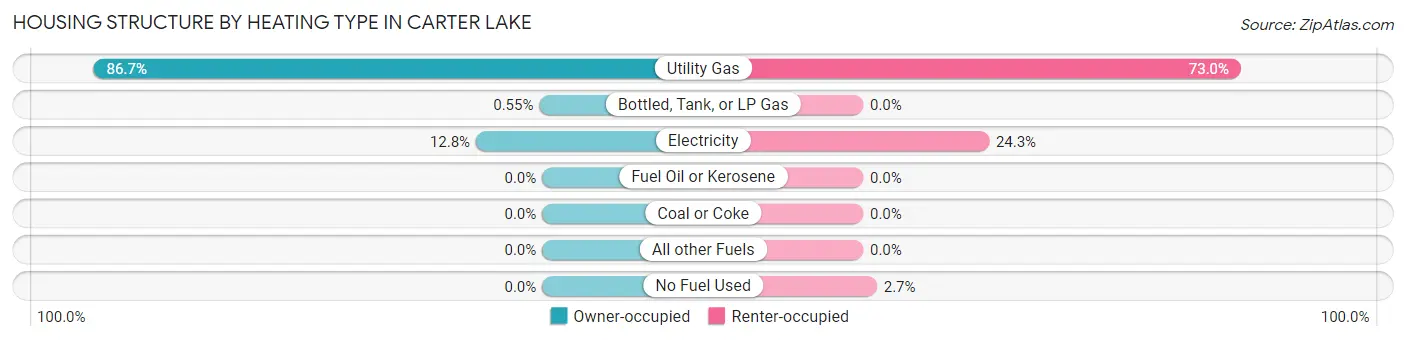
| Heating Type | Owner-occupied | Renter-occupied |
| Utility Gas | 943 (86.7%) | 192 (73.0%) |
| Bottled, Tank, or LP Gas | 6 (0.5%) | 0 (0.0%) |
| Electricity | 139 (12.8%) | 64 (24.3%) |
| Fuel Oil or Kerosene | 0 (0.0%) | 0 (0.0%) |
| Coal or Coke | 0 (0.0%) | 0 (0.0%) |
| All other Fuels | 0 (0.0%) | 0 (0.0%) |
| No Fuel Used | 0 (0.0%) | 7 (2.7%) |
| Total | 1,088 (100.0%) | 263 (100.0%) |
Household Vehicle Usage in Carter Lake
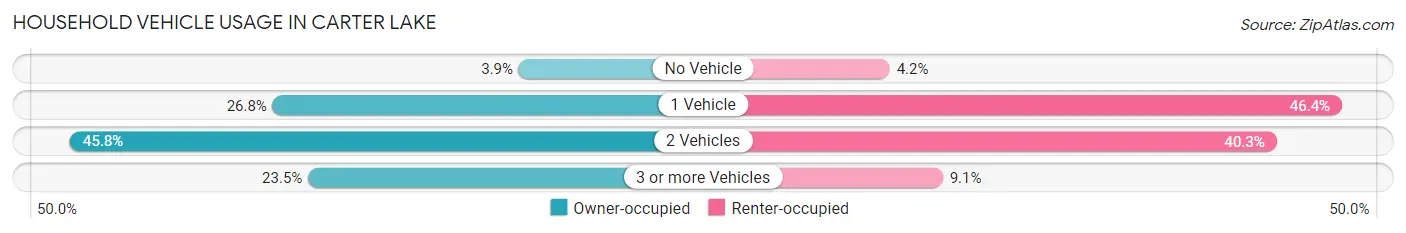
| Vehicles per Household | Owner-occupied | Renter-occupied |
| No Vehicle | 42 (3.9%) | 11 (4.2%) |
| 1 Vehicle | 292 (26.8%) | 122 (46.4%) |
| 2 Vehicles | 498 (45.8%) | 106 (40.3%) |
| 3 or more Vehicles | 256 (23.5%) | 24 (9.1%) |
| Total | 1,088 (100.0%) | 263 (100.0%) |
Real Estate & Mortgages in Carter Lake
Real Estate and Mortgage Overview in Carter Lake
| Characteristic | Without Mortgage | With Mortgage |
| Housing Units | 455 | 633 |
| Median Property Value | $102,100 | $165,400 |
| Median Household Income | $46,797 | $78 |
| Monthly Housing Costs | $553 | $61 |
| Real Estate Taxes | $1,614 | $15 |
Property Value by Mortgage Status in Carter Lake
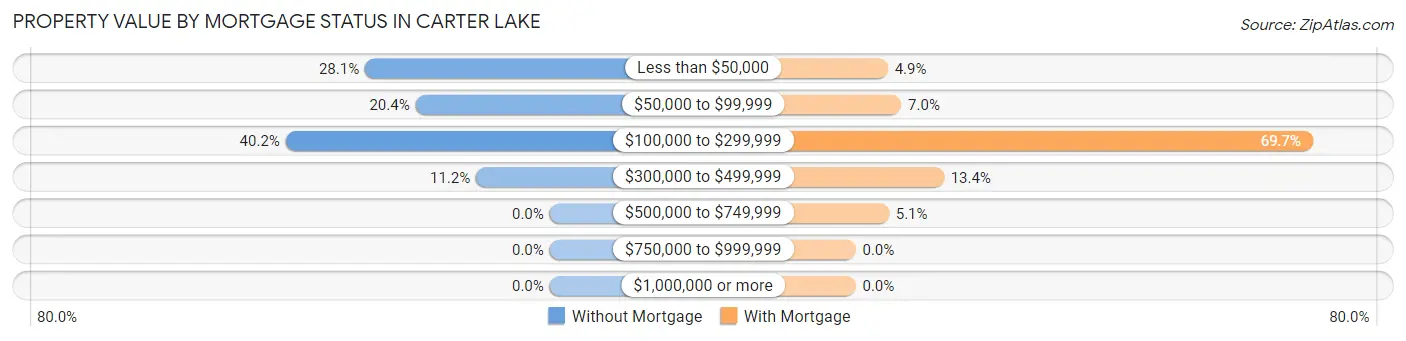
| Property Value | Without Mortgage | With Mortgage |
| Less than $50,000 | 128 (28.1%) | 31 (4.9%) |
| $50,000 to $99,999 | 93 (20.4%) | 44 (7.0%) |
| $100,000 to $299,999 | 183 (40.2%) | 441 (69.7%) |
| $300,000 to $499,999 | 51 (11.2%) | 85 (13.4%) |
| $500,000 to $749,999 | 0 (0.0%) | 32 (5.1%) |
| $750,000 to $999,999 | 0 (0.0%) | 0 (0.0%) |
| $1,000,000 or more | 0 (0.0%) | 0 (0.0%) |
| Total | 455 (100.0%) | 633 (100.0%) |
Household Income by Mortgage Status in Carter Lake
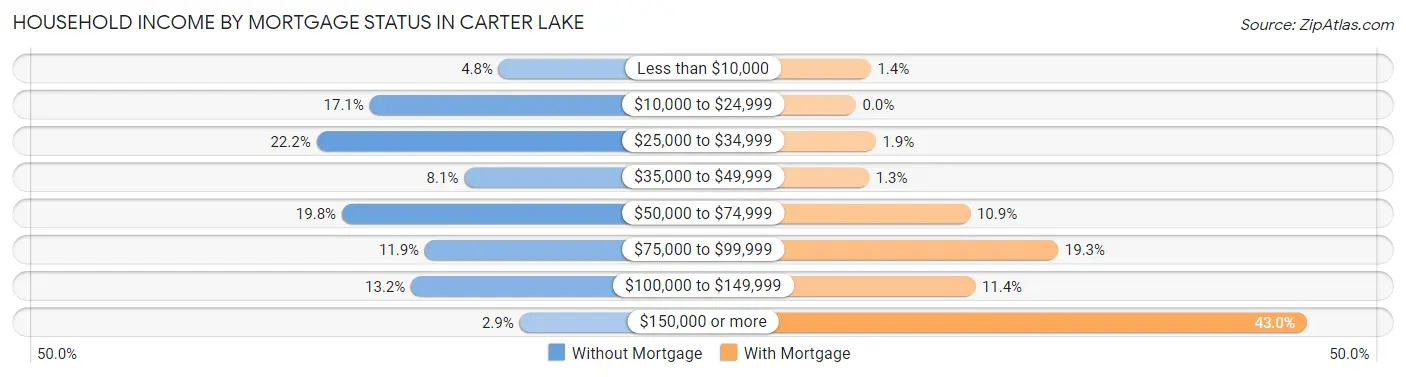
| Household Income | Without Mortgage | With Mortgage |
| Less than $10,000 | 22 (4.8%) | 9 (1.4%) |
| $10,000 to $24,999 | 78 (17.1%) | 0 (0.0%) |
| $25,000 to $34,999 | 101 (22.2%) | 12 (1.9%) |
| $35,000 to $49,999 | 37 (8.1%) | 8 (1.3%) |
| $50,000 to $74,999 | 90 (19.8%) | 69 (10.9%) |
| $75,000 to $99,999 | 54 (11.9%) | 122 (19.3%) |
| $100,000 to $149,999 | 60 (13.2%) | 72 (11.4%) |
| $150,000 or more | 13 (2.9%) | 272 (43.0%) |
| Total | 455 (100.0%) | 633 (100.0%) |
Property Value to Household Income Ratio in Carter Lake
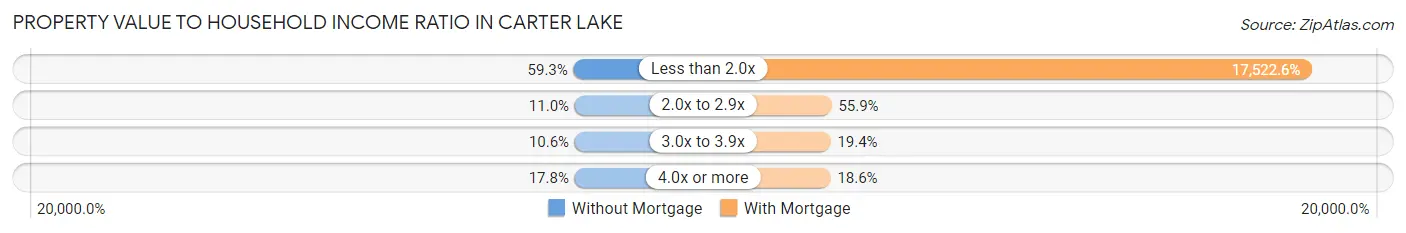
| Value-to-Income Ratio | Without Mortgage | With Mortgage |
| Less than 2.0x | 270 (59.3%) | 110,918 (17,522.6%) |
| 2.0x to 2.9x | 50 (11.0%) | 354 (55.9%) |
| 3.0x to 3.9x | 48 (10.5%) | 123 (19.4%) |
| 4.0x or more | 81 (17.8%) | 118 (18.6%) |
| Total | 455 (100.0%) | 633 (100.0%) |
Real Estate Taxes by Mortgage Status in Carter Lake
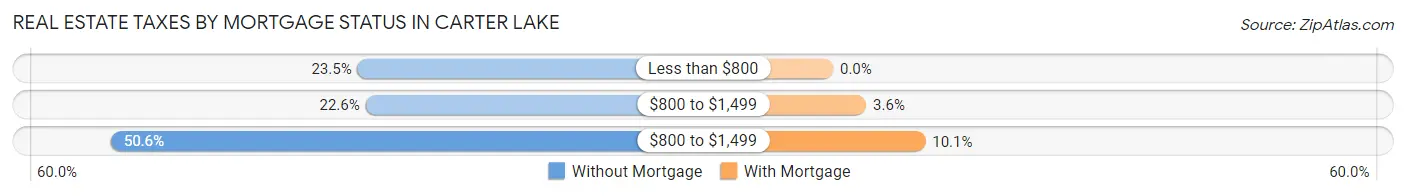
| Property Taxes | Without Mortgage | With Mortgage |
| Less than $800 | 107 (23.5%) | 0 (0.0%) |
| $800 to $1,499 | 103 (22.6%) | 23 (3.6%) |
| $800 to $1,499 | 230 (50.5%) | 64 (10.1%) |
| Total | 455 (100.0%) | 633 (100.0%) |
Health & Disability in Carter Lake
Health Insurance Coverage by Age in Carter Lake
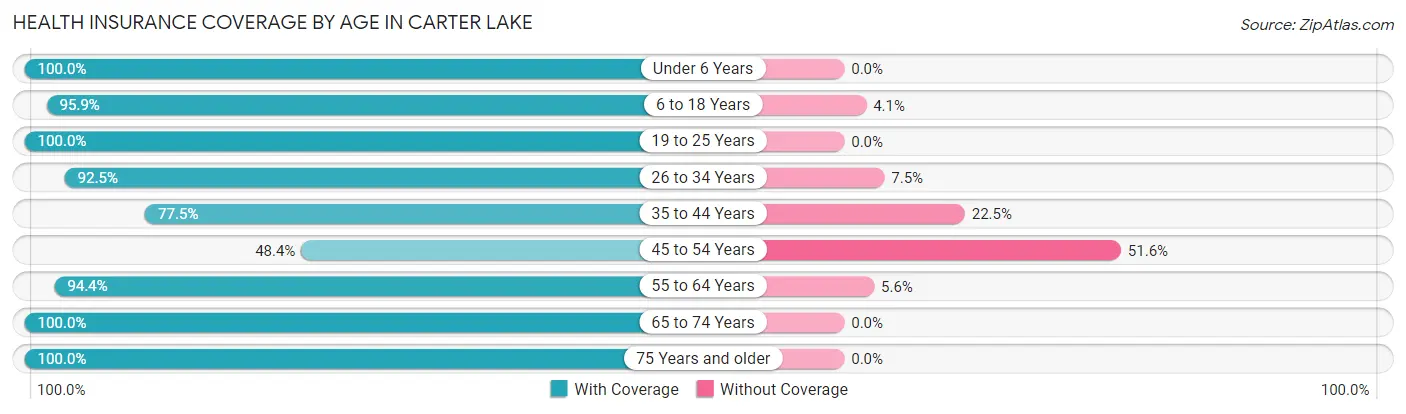
| Age Bracket | With Coverage | Without Coverage |
| Under 6 Years | 284 (100.0%) | 0 (0.0%) |
| 6 to 18 Years | 847 (95.9%) | 36 (4.1%) |
| 19 to 25 Years | 261 (100.0%) | 0 (0.0%) |
| 26 to 34 Years | 285 (92.5%) | 23 (7.5%) |
| 35 to 44 Years | 345 (77.5%) | 100 (22.5%) |
| 45 to 54 Years | 184 (48.4%) | 196 (51.6%) |
| 55 to 64 Years | 595 (94.4%) | 35 (5.6%) |
| 65 to 74 Years | 412 (100.0%) | 0 (0.0%) |
| 75 Years and older | 177 (100.0%) | 0 (0.0%) |
| Total | 3,390 (89.7%) | 390 (10.3%) |
Health Insurance Coverage by Citizenship Status in Carter Lake
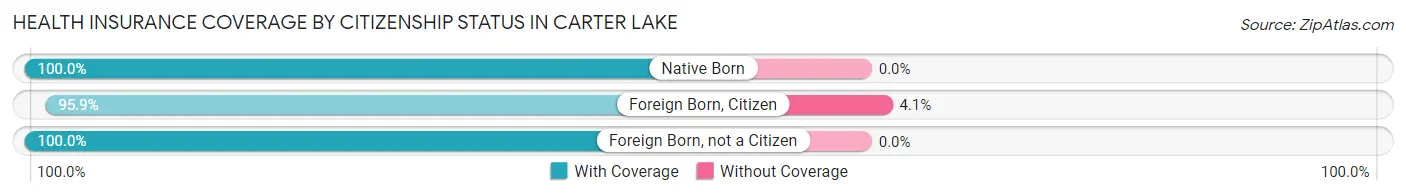
| Citizenship Status | With Coverage | Without Coverage |
| Native Born | 284 (100.0%) | 0 (0.0%) |
| Foreign Born, Citizen | 847 (95.9%) | 36 (4.1%) |
| Foreign Born, not a Citizen | 261 (100.0%) | 0 (0.0%) |
Health Insurance Coverage by Household Income in Carter Lake
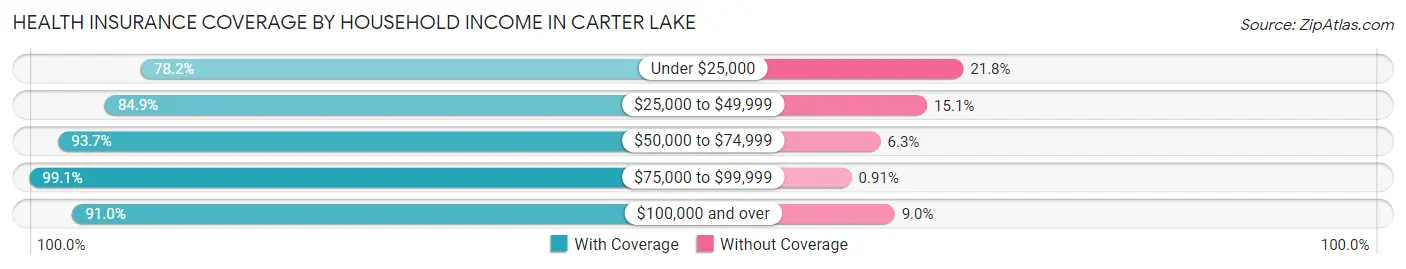
| Household Income | With Coverage | Without Coverage |
| Under $25,000 | 297 (78.2%) | 83 (21.8%) |
| $25,000 to $49,999 | 694 (84.9%) | 123 (15.1%) |
| $50,000 to $74,999 | 755 (93.7%) | 51 (6.3%) |
| $75,000 to $99,999 | 327 (99.1%) | 3 (0.9%) |
| $100,000 and over | 1,317 (91.0%) | 130 (9.0%) |
Public vs Private Health Insurance Coverage by Age in Carter Lake
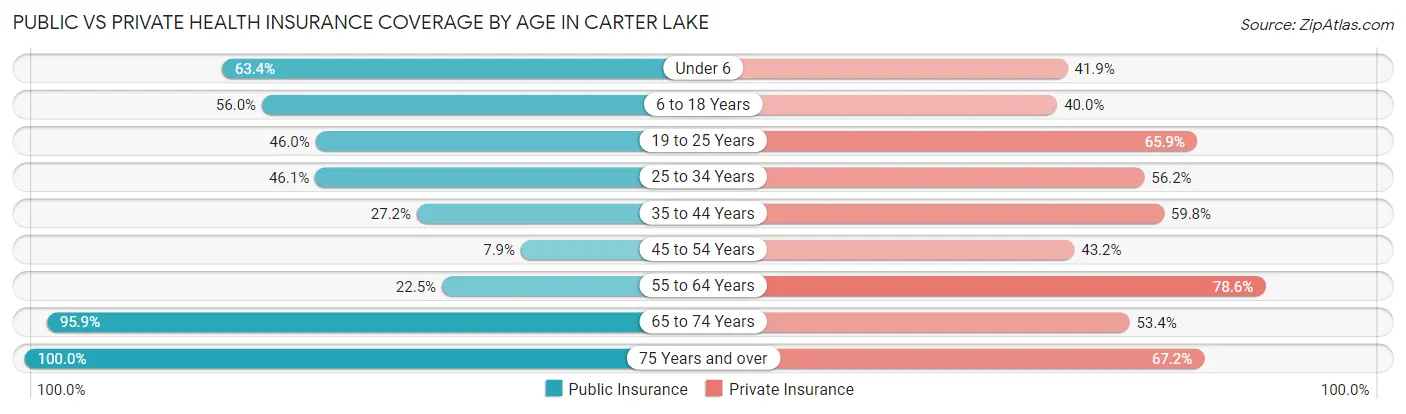
| Age Bracket | Public Insurance | Private Insurance |
| Under 6 | 180 (63.4%) | 119 (41.9%) |
| 6 to 18 Years | 494 (55.9%) | 353 (40.0%) |
| 19 to 25 Years | 120 (46.0%) | 172 (65.9%) |
| 25 to 34 Years | 142 (46.1%) | 173 (56.2%) |
| 35 to 44 Years | 121 (27.2%) | 266 (59.8%) |
| 45 to 54 Years | 30 (7.9%) | 164 (43.2%) |
| 55 to 64 Years | 142 (22.5%) | 495 (78.6%) |
| 65 to 74 Years | 395 (95.9%) | 220 (53.4%) |
| 75 Years and over | 177 (100.0%) | 119 (67.2%) |
| Total | 1,801 (47.6%) | 2,081 (55.0%) |
Disability Status by Sex by Age in Carter Lake
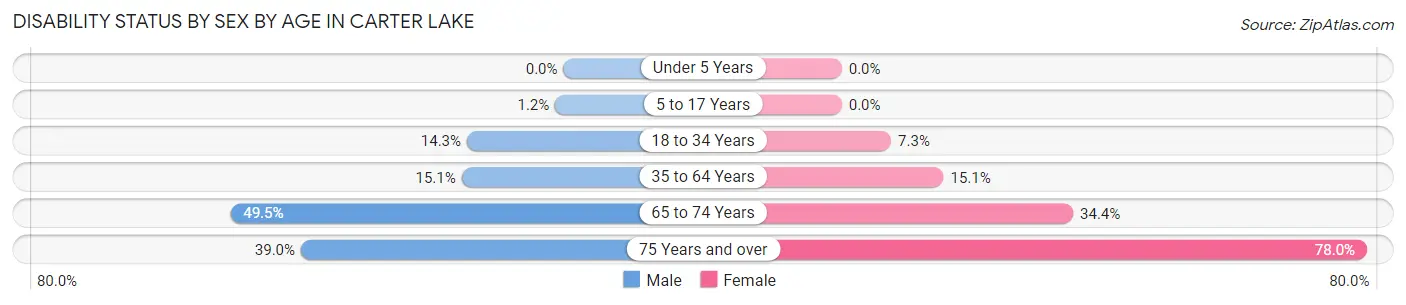
| Age Bracket | Male | Female |
| Under 5 Years | 0 (0.0%) | 0 (0.0%) |
| 5 to 17 Years | 6 (1.2%) | 0 (0.0%) |
| 18 to 34 Years | 52 (14.3%) | 25 (7.3%) |
| 35 to 64 Years | 134 (15.1%) | 86 (15.1%) |
| 65 to 74 Years | 90 (49.4%) | 79 (34.4%) |
| 75 Years and over | 23 (39.0%) | 92 (78.0%) |
Disability Class by Sex by Age in Carter Lake
Disability Class: Hearing Difficulty
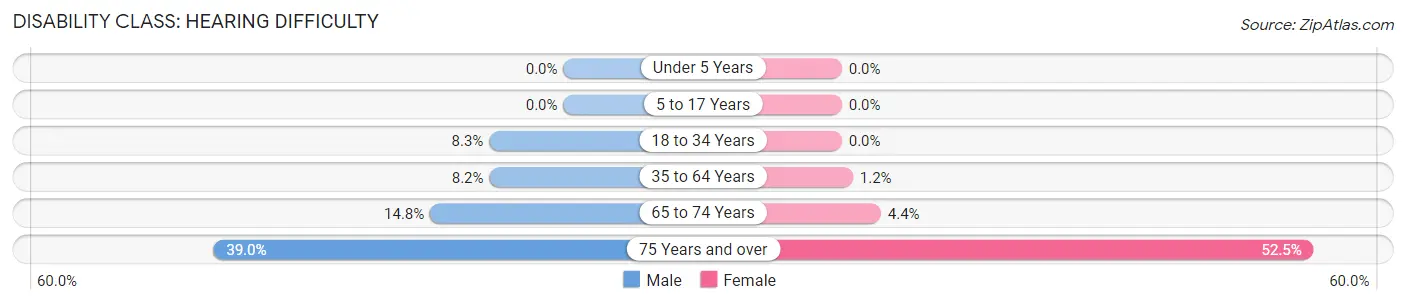
| Age Bracket | Male | Female |
| Under 5 Years | 0 (0.0%) | 0 (0.0%) |
| 5 to 17 Years | 0 (0.0%) | 0 (0.0%) |
| 18 to 34 Years | 30 (8.3%) | 0 (0.0%) |
| 35 to 64 Years | 73 (8.2%) | 7 (1.2%) |
| 65 to 74 Years | 27 (14.8%) | 10 (4.3%) |
| 75 Years and over | 23 (39.0%) | 62 (52.5%) |
Disability Class: Vision Difficulty
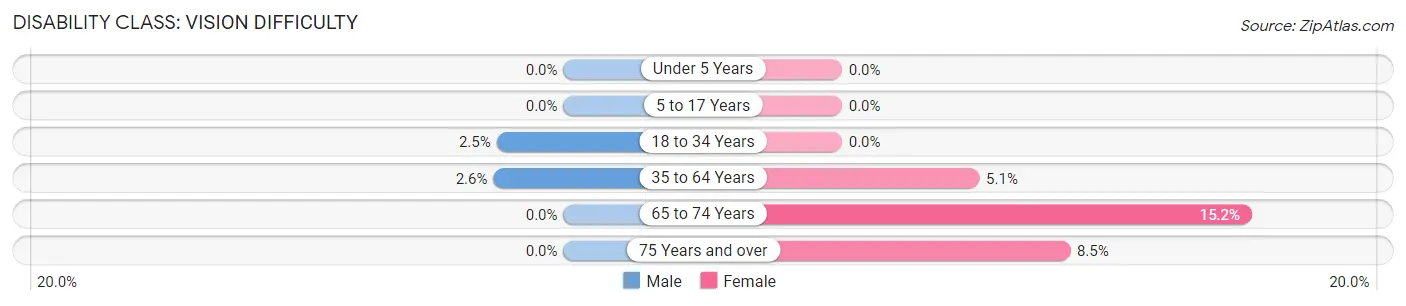
| Age Bracket | Male | Female |
| Under 5 Years | 0 (0.0%) | 0 (0.0%) |
| 5 to 17 Years | 0 (0.0%) | 0 (0.0%) |
| 18 to 34 Years | 9 (2.5%) | 0 (0.0%) |
| 35 to 64 Years | 23 (2.6%) | 29 (5.1%) |
| 65 to 74 Years | 0 (0.0%) | 35 (15.2%) |
| 75 Years and over | 0 (0.0%) | 10 (8.5%) |
Disability Class: Cognitive Difficulty
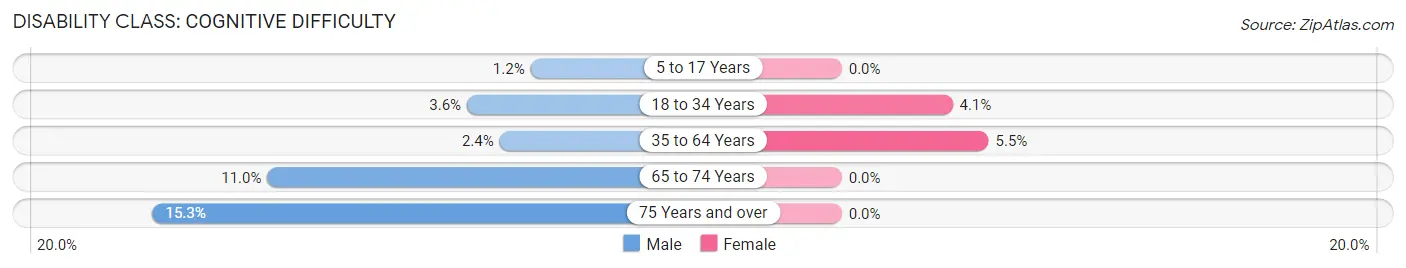
| Age Bracket | Male | Female |
| 5 to 17 Years | 6 (1.2%) | 0 (0.0%) |
| 18 to 34 Years | 13 (3.6%) | 14 (4.1%) |
| 35 to 64 Years | 21 (2.4%) | 31 (5.4%) |
| 65 to 74 Years | 20 (11.0%) | 0 (0.0%) |
| 75 Years and over | 9 (15.2%) | 0 (0.0%) |
Disability Class: Ambulatory Difficulty
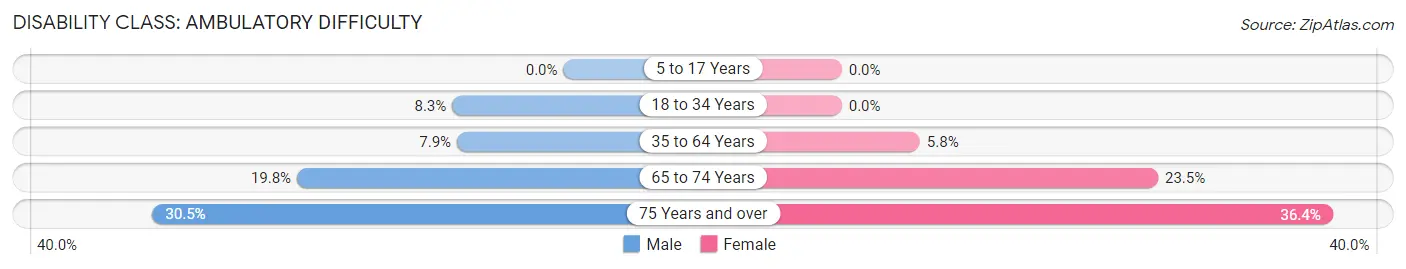
| Age Bracket | Male | Female |
| 5 to 17 Years | 0 (0.0%) | 0 (0.0%) |
| 18 to 34 Years | 30 (8.3%) | 0 (0.0%) |
| 35 to 64 Years | 70 (7.9%) | 33 (5.8%) |
| 65 to 74 Years | 36 (19.8%) | 54 (23.5%) |
| 75 Years and over | 18 (30.5%) | 43 (36.4%) |
Disability Class: Self-Care Difficulty
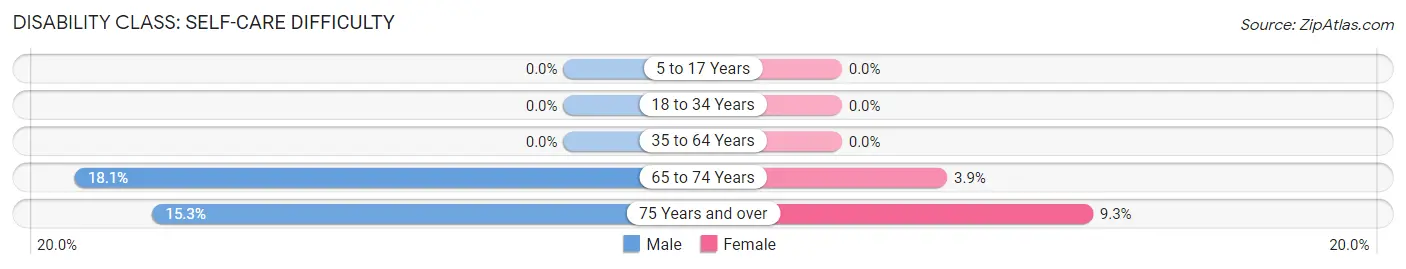
| Age Bracket | Male | Female |
| 5 to 17 Years | 0 (0.0%) | 0 (0.0%) |
| 18 to 34 Years | 0 (0.0%) | 0 (0.0%) |
| 35 to 64 Years | 0 (0.0%) | 0 (0.0%) |
| 65 to 74 Years | 33 (18.1%) | 9 (3.9%) |
| 75 Years and over | 9 (15.2%) | 11 (9.3%) |
Technology Access in Carter Lake
Computing Device Access in Carter Lake
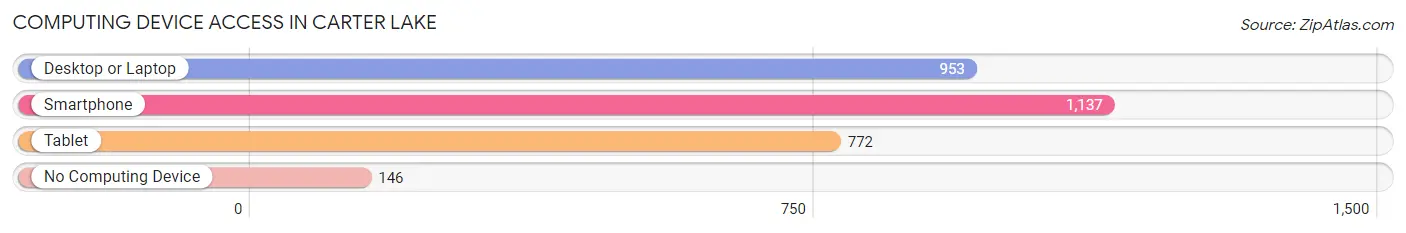
| Device Type | # Households | % Households |
| Desktop or Laptop | 953 | 70.5% |
| Smartphone | 1,137 | 84.2% |
| Tablet | 772 | 57.1% |
| No Computing Device | 146 | 10.8% |
| Total | 1,351 | 100.0% |
Internet Access in Carter Lake
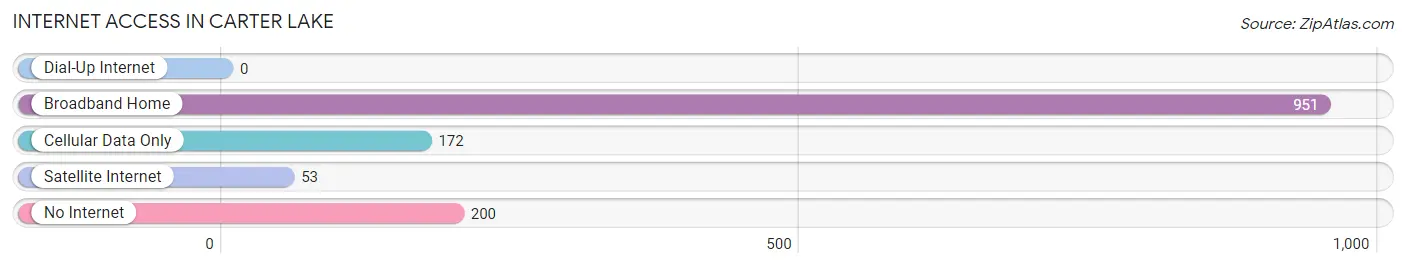
| Internet Type | # Households | % Households |
| Dial-Up Internet | 0 | 0.0% |
| Broadband Home | 951 | 70.4% |
| Cellular Data Only | 172 | 12.7% |
| Satellite Internet | 53 | 3.9% |
| No Internet | 200 | 14.8% |
| Total | 1,351 | 100.0% |
Carter Lake Summary
Carter Lake, Iowa is a small city located in Pottawattamie County, Iowa, United States. It is situated on the east side of the Missouri River, just across from Omaha, Nebraska. The city has a population of 3,785 as of the 2010 census.
History
Carter Lake was originally part of the Omaha Indian Reservation, which was established in 1854. The city was named after William Carter, a local settler who established a trading post in the area in 1856. In 1877, the Omaha Indian Reservation was dissolved and the land was opened up for settlement. The city of Carter Lake was officially incorporated in 1881.
In 1884, the city was flooded by the Missouri River, which caused the city to be cut off from the rest of Iowa. This led to a dispute between Iowa and Nebraska over the city's jurisdiction. The dispute was eventually settled in 1892, when the Supreme Court ruled that Carter Lake was part of Iowa.
Geography
Carter Lake is located at 41°18'17" North, 95°55'45" West (41.304722, -95.929167). According to the United States Census Bureau, the city has a total area of 1.2 square miles (3.1 km2), all of it land.
Economy
The economy of Carter Lake is largely based on tourism and retail. The city is home to several restaurants, bars, and other businesses that cater to tourists. The city also has a number of manufacturing and industrial businesses, including a paper mill and a plastics factory.
Demographics
As of the 2010 census, there were 3,785 people, 1,541 households, and 945 families residing in the city. The population density was 3,093.3 people per square mile (1,192.2/km2). There were 1,717 housing units at an average density of 1,417.5 per square mile (548.3/km2). The racial makeup of the city was 87.2% White, 5.2% African American, 0.3% Native American, 0.7% Asian, 0.1% Pacific Islander, 4.2% from other races, and 2.3% from two or more races. Hispanic or Latino of any race were 8.2% of the population.
There were 1,541 households, out of which 28.2% had children under the age of 18 living with them, 41.2% were married couples living together, 14.2% had a female householder with no husband present, and 38.7% were non-families. 32.2% of all households were made up of individuals, and 11.2% had someone living alone who was 65 years of age or older. The average household size was 2.45 and the average family size was 3.09.
In the city, the population was spread out, with 25.2% under the age of 18, 9.2% from 18 to 24, 28.7% from 25 to 44, 22.7% from 45 to 64, and 14.2% who were 65 years of age or older. The median age was 36 years. For every 100 females, there were 97.2 males. For every 100 females age 18 and over, there were 94.2 males.
The median income for a household in the city was $35,938, and the median income for a family was $41,964. Males had a median income of $31,964 versus $25,000 for females. The per capita income for the city was $17,845. About 8.2% of families and 10.3% of the population were below the poverty line, including 14.2% of those under age 18 and 8.2% of those age 65 or over.
Common Questions
What is Per Capita Income in Carter Lake?
Per Capita income in Carter Lake is $32,068.
What is the Median Family Income in Carter Lake?
Median Family Income in Carter Lake is $79,688.
What is the Median Household income in Carter Lake?
Median Household Income in Carter Lake is $64,479.
What is Income or Wage Gap in Carter Lake?
Income or Wage Gap in Carter Lake is 21.9%.
Women in Carter Lake earn 78.1 cents for every dollar earned by a man.
What is Inequality or Gini Index in Carter Lake?
Inequality or Gini Index in Carter Lake is 0.44.
What is the Total Population of Carter Lake?
Total Population of Carter Lake is 3,780.
What is the Total Male Population of Carter Lake?
Total Male Population of Carter Lake is 2,054.
What is the Total Female Population of Carter Lake?
Total Female Population of Carter Lake is 1,726.
What is the Ratio of Males per 100 Females in Carter Lake?
There are 119.00 Males per 100 Females in Carter Lake.
What is the Ratio of Females per 100 Males in Carter Lake?
There are 84.03 Females per 100 Males in Carter Lake.
What is the Median Population Age in Carter Lake?
Median Population Age in Carter Lake is 38.0 Years.
What is the Average Family Size in Carter Lake
Average Family Size in Carter Lake is 3.3 People.
What is the Average Household Size in Carter Lake
Average Household Size in Carter Lake is 2.8 People.
How Large is the Labor Force in Carter Lake?
There are 1,819 People in the Labor Forcein in Carter Lake.
What is the Percentage of People in the Labor Force in Carter Lake?
64.4% of People are in the Labor Force in Carter Lake.
What is the Unemployment Rate in Carter Lake?
Unemployment Rate in Carter Lake is 5.9%.