Sac County, IA Map & Demographics
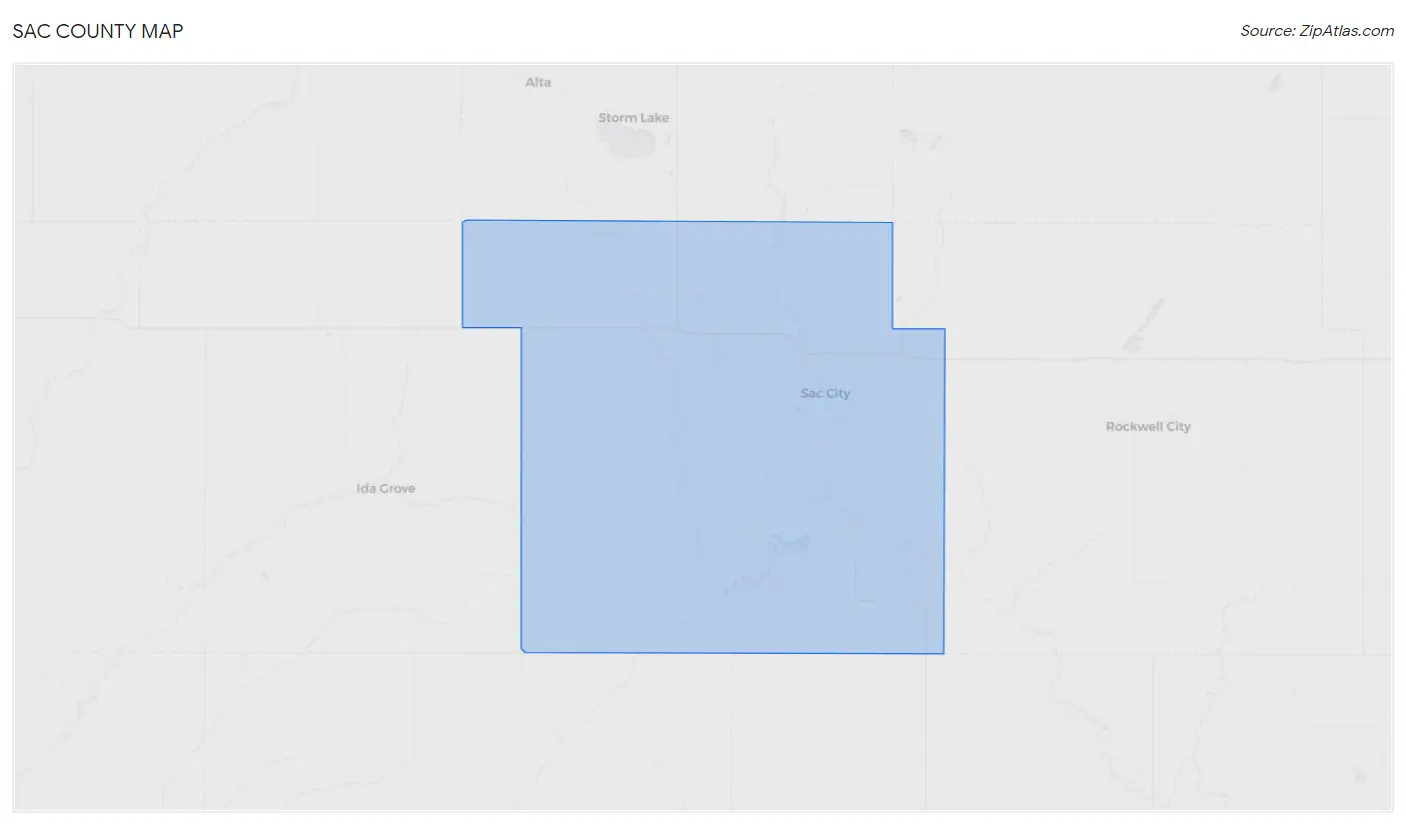
Sac County Map
Sac County Overview
$38,596
PER CAPITA INCOME
$87,162
AVG FAMILY INCOME
$68,778
AVG HOUSEHOLD INCOME
34.0%
WAGE / INCOME GAP [ % ]
66.0¢/ $1
WAGE / INCOME GAP [ $ ]
$8,370
FAMILY INCOME DEFICIT
0.44
INEQUALITY / GINI INDEX
9,778
TOTAL POPULATION
4,938
MALE POPULATION
4,840
FEMALE POPULATION
102.02
MALES / 100 FEMALES
98.02
FEMALES / 100 MALES
45.2
MEDIAN AGE
2.8
AVG FAMILY SIZE
2.3
AVG HOUSEHOLD SIZE
5,117
LABOR FORCE [ PEOPLE ]
65.3%
PERCENT IN LABOR FORCE
3.2%
UNEMPLOYMENT RATE
Sac County Area Codes
Income in Sac County
Income Overview in Sac County
Per Capita Income in Sac County is $38,596, while median incomes of families and households are $87,162 and $68,778 respectively.
| Characteristic | Number | Measure |
| Per Capita Income | 9,778 | $38,596 |
| Median Family Income | 2,728 | $87,162 |
| Mean Family Income | 2,728 | $105,371 |
| Median Household Income | 4,210 | $68,778 |
| Mean Household Income | 4,210 | $88,446 |
| Income Deficit | 2,728 | $8,370 |
| Wage / Income Gap (%) | 9,778 | 34.00% |
| Wage / Income Gap ($) | 9,778 | 66.00¢ per $1 |
| Gini / Inequality Index | 9,778 | 0.44 |
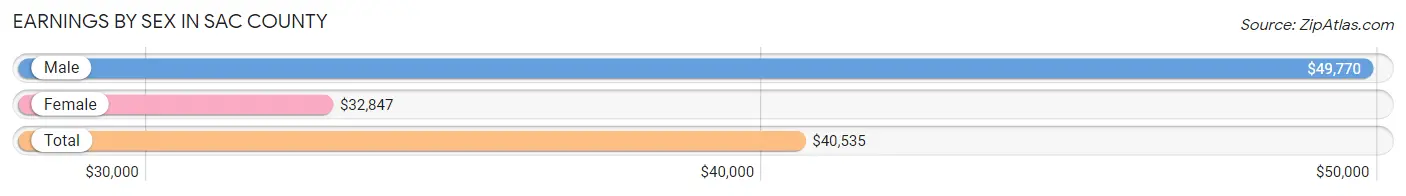
Earnings by Sex in Sac County
Average Earnings in Sac County are $40,535, $49,770 for men and $32,847 for women, a difference of 34.0%.
| Sex | Number | Average Earnings |
| Male | 2,993 (55.1%) | $49,770 |
| Female | 2,435 (44.9%) | $32,847 |
| Total | 5,428 (100.0%) | $40,535 |
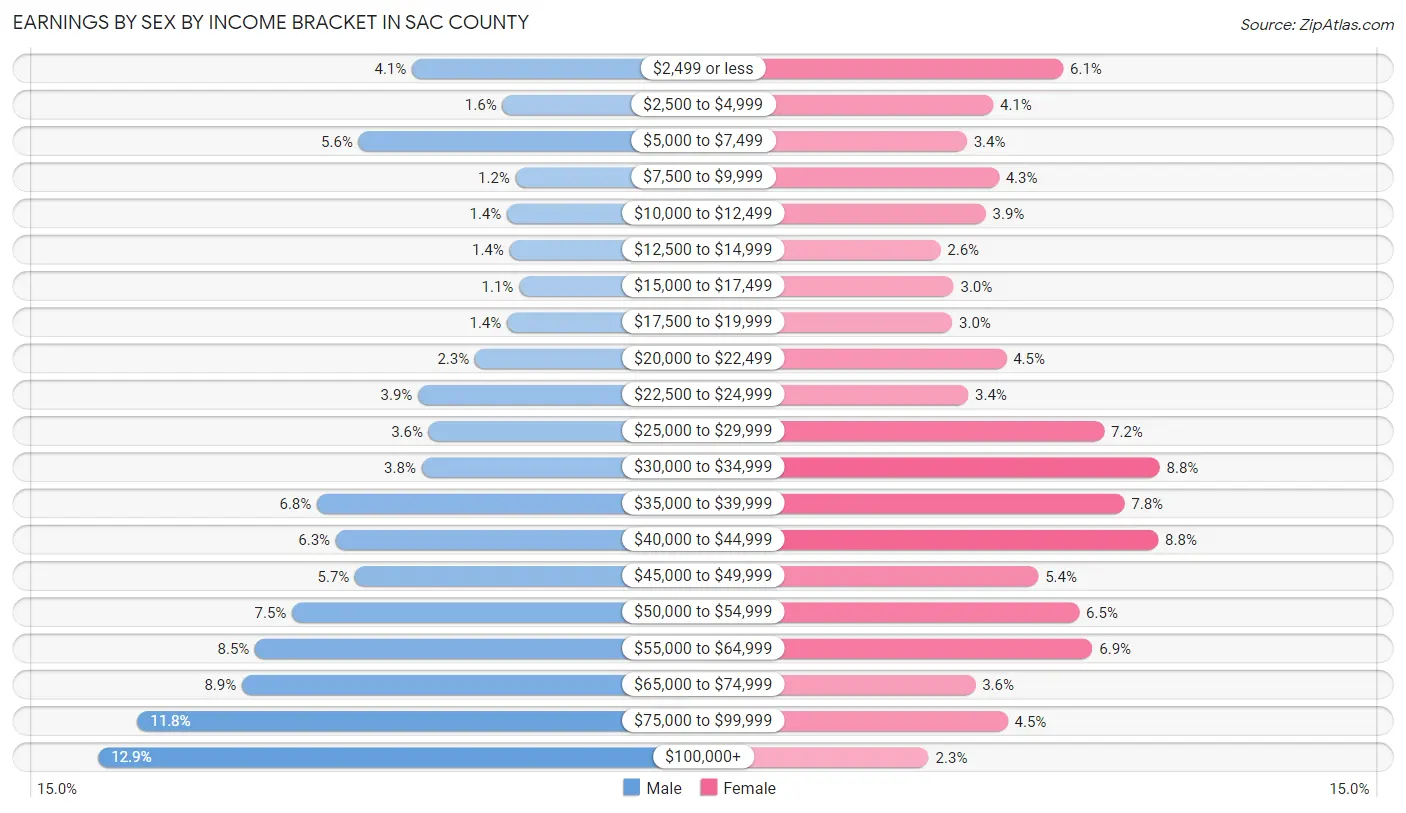
Earnings by Sex by Income Bracket in Sac County
The most common earnings brackets in Sac County are $100,000+ for men (387 | 12.9%) and $30,000 to $34,999 for women (214 | 8.8%).
| Income | Male | Female |
| $2,499 or less | 123 (4.1%) | 148 (6.1%) |
| $2,500 to $4,999 | 47 (1.6%) | 100 (4.1%) |
| $5,000 to $7,499 | 168 (5.6%) | 82 (3.4%) |
| $7,500 to $9,999 | 36 (1.2%) | 104 (4.3%) |
| $10,000 to $12,499 | 43 (1.4%) | 95 (3.9%) |
| $12,500 to $14,999 | 41 (1.4%) | 64 (2.6%) |
| $15,000 to $17,499 | 33 (1.1%) | 73 (3.0%) |
| $17,500 to $19,999 | 43 (1.4%) | 72 (3.0%) |
| $20,000 to $22,499 | 70 (2.3%) | 109 (4.5%) |
| $22,500 to $24,999 | 118 (3.9%) | 83 (3.4%) |
| $25,000 to $29,999 | 109 (3.6%) | 176 (7.2%) |
| $30,000 to $34,999 | 115 (3.8%) | 214 (8.8%) |
| $35,000 to $39,999 | 203 (6.8%) | 190 (7.8%) |
| $40,000 to $44,999 | 187 (6.2%) | 213 (8.7%) |
| $45,000 to $49,999 | 171 (5.7%) | 131 (5.4%) |
| $50,000 to $54,999 | 224 (7.5%) | 159 (6.5%) |
| $55,000 to $64,999 | 255 (8.5%) | 168 (6.9%) |
| $65,000 to $74,999 | 266 (8.9%) | 88 (3.6%) |
| $75,000 to $99,999 | 354 (11.8%) | 110 (4.5%) |
| $100,000+ | 387 (12.9%) | 56 (2.3%) |
| Total | 2,993 (100.0%) | 2,435 (100.0%) |
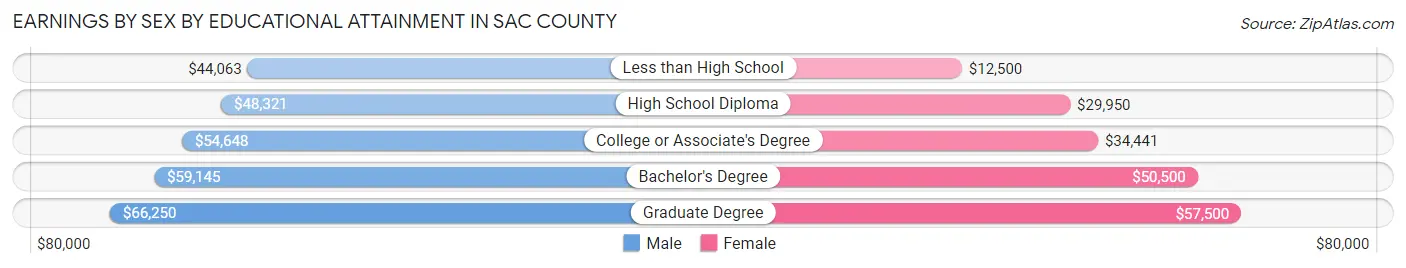
Earnings by Sex by Educational Attainment in Sac County
Average earnings in Sac County are $52,056 for men and $36,210 for women, a difference of 30.4%. Men with an educational attainment of graduate degree enjoy the highest average annual earnings of $66,250, while those with less than high school education earn the least with $44,063. Women with an educational attainment of graduate degree earn the most with the average annual earnings of $57,500, while those with less than high school education have the smallest earnings of $12,500.
| Educational Attainment | Male Income | Female Income |
| Less than High School | $44,063 | $12,500 |
| High School Diploma | $48,321 | $29,950 |
| College or Associate's Degree | $54,648 | $34,441 |
| Bachelor's Degree | $59,145 | $50,500 |
| Graduate Degree | $66,250 | $57,500 |
| Total | $52,056 | $36,210 |
Family Income in Sac County
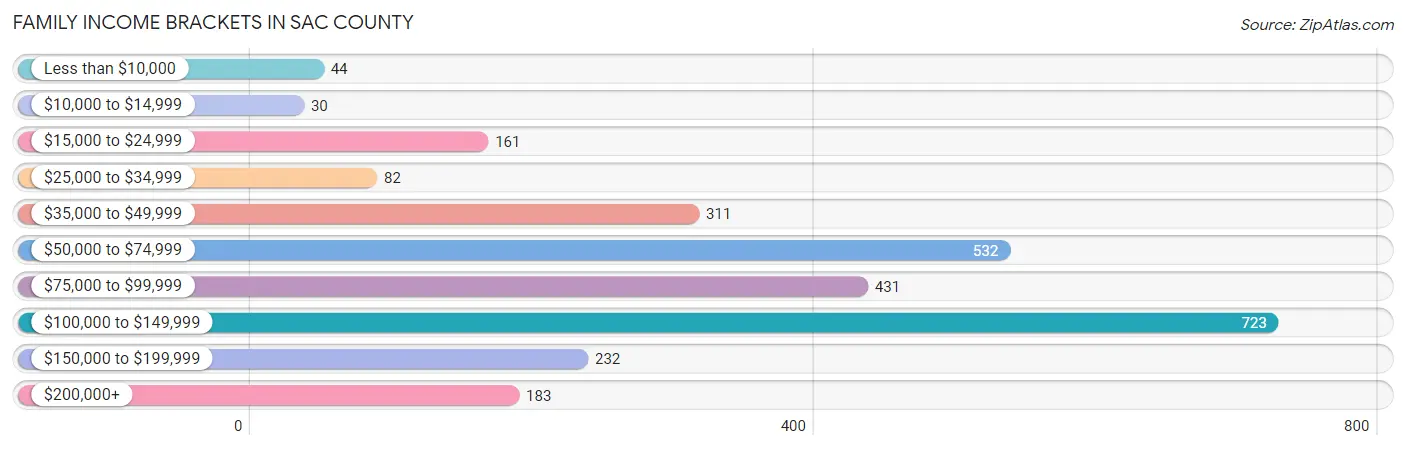
Family Income Brackets in Sac County
According to the Sac County family income data, there are 723 families falling into the $100,000 to $149,999 income range, which is the most common income bracket and makes up 26.5% of all families. Conversely, the $10,000 to $14,999 income bracket is the least frequent group with only 30 families (1.1%) belonging to this category.
| Income Bracket | # Families | % Families |
| Less than $10,000 | 44 | 1.6% |
| $10,000 to $14,999 | 30 | 1.1% |
| $15,000 to $24,999 | 161 | 5.9% |
| $25,000 to $34,999 | 82 | 3.0% |
| $35,000 to $49,999 | 311 | 11.4% |
| $50,000 to $74,999 | 532 | 19.5% |
| $75,000 to $99,999 | 431 | 15.8% |
| $100,000 to $149,999 | 723 | 26.5% |
| $150,000 to $199,999 | 232 | 8.5% |
| $200,000+ | 183 | 6.7% |
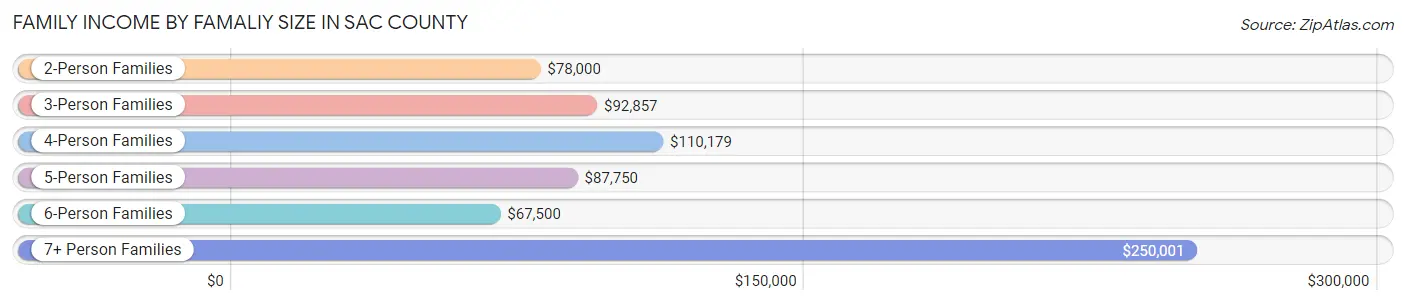
Family Income by Famaliy Size in Sac County
7+ person families (41 | 1.5%) account for the highest median family income in Sac County with $250,001 per family, while 2-person families (1,616 | 59.2%) have the highest median income of $39,000 per family member.
| Income Bracket | # Families | Median Income |
| 2-Person Families | 1,616 (59.2%) | $78,000 |
| 3-Person Families | 422 (15.5%) | $92,857 |
| 4-Person Families | 419 (15.4%) | $110,179 |
| 5-Person Families | 150 (5.5%) | $87,750 |
| 6-Person Families | 80 (2.9%) | $67,500 |
| 7+ Person Families | 41 (1.5%) | $250,001 |
| Total | 2,728 (100.0%) | $87,162 |
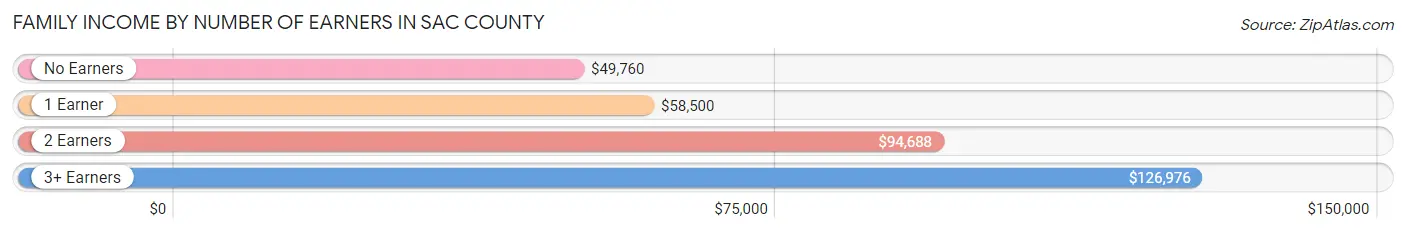
Family Income by Number of Earners in Sac County
The median family income in Sac County is $87,162, with families comprising 3+ earners (275) having the highest median family income of $126,976, while families with no earners (403) have the lowest median family income of $49,760, accounting for 10.1% and 14.8% of families, respectively.
| Number of Earners | # Families | Median Income |
| No Earners | 403 (14.8%) | $49,760 |
| 1 Earner | 720 (26.4%) | $58,500 |
| 2 Earners | 1,330 (48.7%) | $94,688 |
| 3+ Earners | 275 (10.1%) | $126,976 |
| Total | 2,728 (100.0%) | $87,162 |
Household Income in Sac County
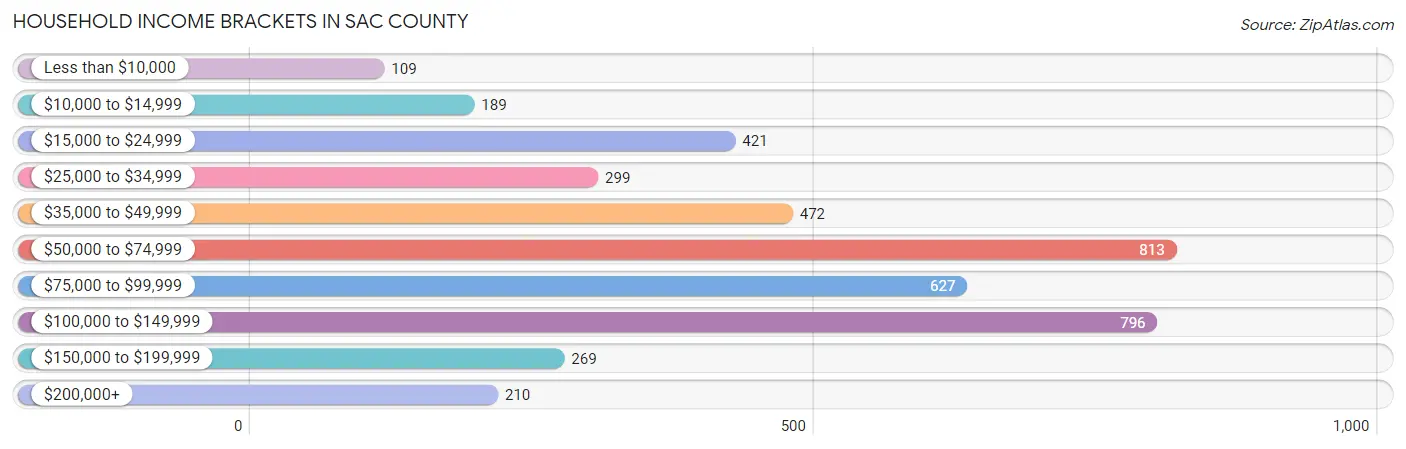
Household Income Brackets in Sac County
With 813 households falling in the category, the $50,000 to $74,999 income range is the most frequent in Sac County, accounting for 19.3% of all households. In contrast, only 109 households (2.6%) fall into the less than $10,000 income bracket, making it the least populous group.
| Income Bracket | # Households | % Households |
| Less than $10,000 | 109 | 2.6% |
| $10,000 to $14,999 | 189 | 4.5% |
| $15,000 to $24,999 | 421 | 10.0% |
| $25,000 to $34,999 | 299 | 7.1% |
| $35,000 to $49,999 | 472 | 11.2% |
| $50,000 to $74,999 | 813 | 19.3% |
| $75,000 to $99,999 | 627 | 14.9% |
| $100,000 to $149,999 | 796 | 18.9% |
| $150,000 to $199,999 | 269 | 6.4% |
| $200,000+ | 210 | 5.0% |
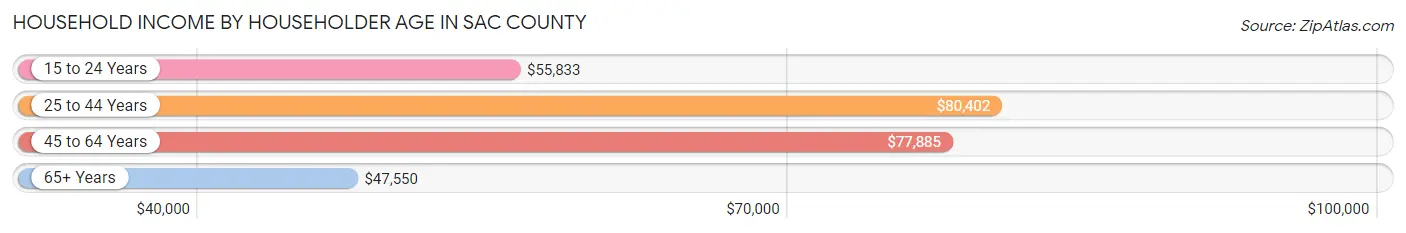
Household Income by Householder Age in Sac County
The median household income in Sac County is $68,778, with the highest median household income of $80,402 found in the 25 to 44 years age bracket for the primary householder. A total of 1,140 households (27.1%) fall into this category. Meanwhile, the 65+ years age bracket for the primary householder has the lowest median household income of $47,550, with 1,402 households (33.3%) in this group.
| Income Bracket | # Households | Median Income |
| 15 to 24 Years | 140 (3.3%) | $55,833 |
| 25 to 44 Years | 1,140 (27.1%) | $80,402 |
| 45 to 64 Years | 1,528 (36.3%) | $77,885 |
| 65+ Years | 1,402 (33.3%) | $47,550 |
| Total | 4,210 (100.0%) | $68,778 |
Poverty in Sac County
Income Below Poverty by Sex and Age in Sac County
With 8.5% poverty level for males and 8.9% for females among the residents of Sac County, under 5 year old males and 15 year old females are the most vulnerable to poverty, with 70 males (21.7%) and 35 females (41.2%) in their respective age groups living below the poverty level.
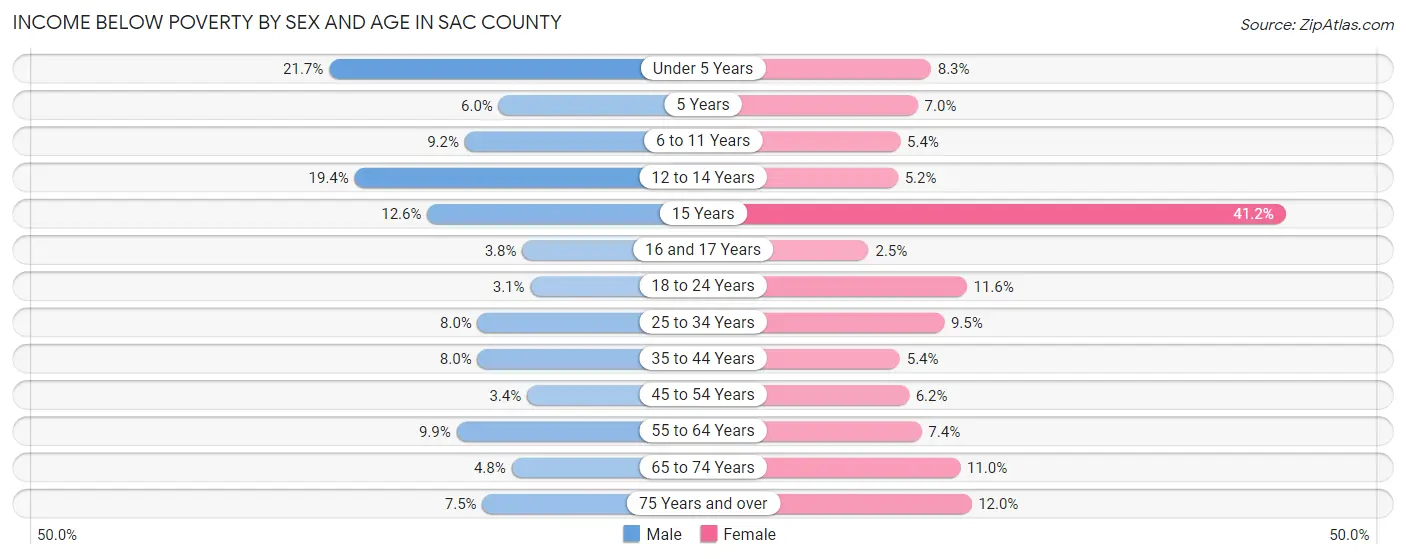
| Age Bracket | Male | Female |
| Under 5 Years | 70 (21.7%) | 20 (8.3%) |
| 5 Years | 3 (6.0%) | 5 (7.0%) |
| 6 to 11 Years | 28 (9.1%) | 19 (5.4%) |
| 12 to 14 Years | 49 (19.4%) | 7 (5.2%) |
| 15 Years | 12 (12.6%) | 35 (41.2%) |
| 16 and 17 Years | 4 (3.8%) | 3 (2.5%) |
| 18 to 24 Years | 12 (3.1%) | 36 (11.6%) |
| 25 to 34 Years | 40 (8.0%) | 47 (9.5%) |
| 35 to 44 Years | 42 (8.0%) | 25 (5.4%) |
| 45 to 54 Years | 18 (3.4%) | 33 (6.2%) |
| 55 to 64 Years | 77 (9.9%) | 55 (7.4%) |
| 65 to 74 Years | 30 (4.8%) | 68 (11.0%) |
| 75 Years and over | 28 (7.5%) | 65 (12.0%) |
| Total | 413 (8.5%) | 418 (8.9%) |
Income Above Poverty by Sex and Age in Sac County
According to the poverty statistics in Sac County, males aged 18 to 24 years and females aged 16 and 17 years are the age groups that are most secure financially, with 96.9% of males and 97.5% of females in these age groups living above the poverty line.
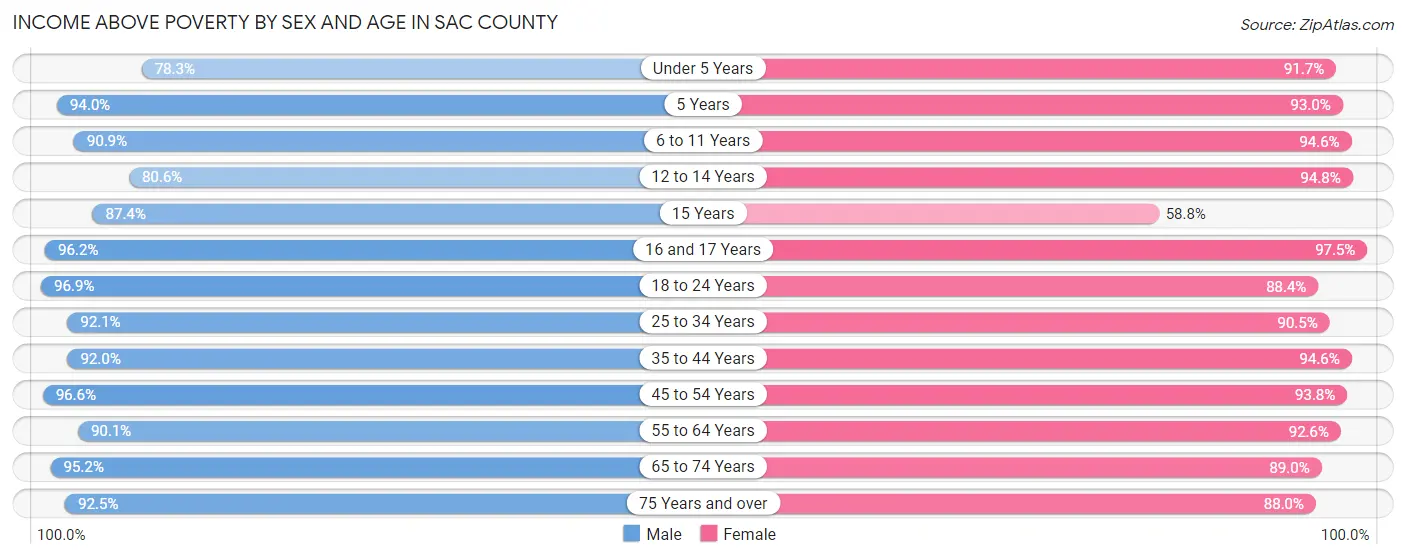
| Age Bracket | Male | Female |
| Under 5 Years | 252 (78.3%) | 222 (91.7%) |
| 5 Years | 47 (94.0%) | 66 (93.0%) |
| 6 to 11 Years | 278 (90.8%) | 332 (94.6%) |
| 12 to 14 Years | 204 (80.6%) | 128 (94.8%) |
| 15 Years | 83 (87.4%) | 50 (58.8%) |
| 16 and 17 Years | 101 (96.2%) | 118 (97.5%) |
| 18 to 24 Years | 380 (96.9%) | 275 (88.4%) |
| 25 to 34 Years | 463 (92.0%) | 449 (90.5%) |
| 35 to 44 Years | 485 (92.0%) | 440 (94.6%) |
| 45 to 54 Years | 516 (96.6%) | 498 (93.8%) |
| 55 to 64 Years | 700 (90.1%) | 689 (92.6%) |
| 65 to 74 Years | 594 (95.2%) | 552 (89.0%) |
| 75 Years and over | 345 (92.5%) | 476 (88.0%) |
| Total | 4,448 (91.5%) | 4,295 (91.1%) |
Income Below Poverty Among Married-Couple Families in Sac County
The poverty statistics for married-couple families in Sac County show that 2.1% or 48 of the total 2,274 families live below the poverty line. Families with 5 or more children have the highest poverty rate of 5.3%, comprising of 2 families. On the other hand, families with 3 or 4 children have the lowest poverty rate of 0.0%, which includes 0 families.
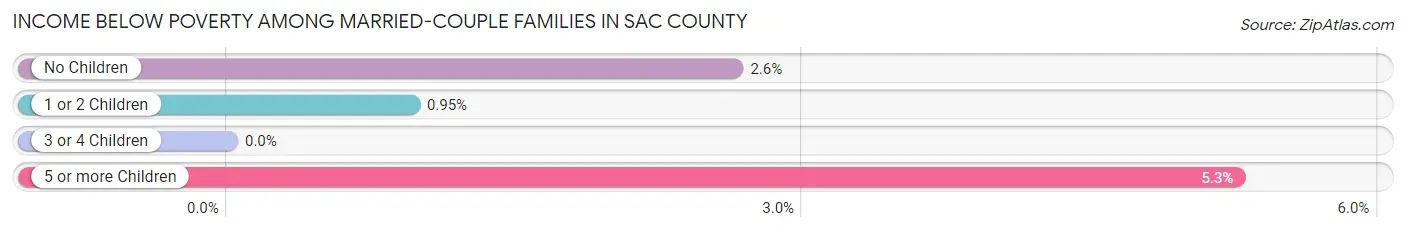
| Children | Above Poverty | Below Poverty |
| No Children | 1,510 (97.4%) | 41 (2.6%) |
| 1 or 2 Children | 521 (99.1%) | 5 (0.9%) |
| 3 or 4 Children | 159 (100.0%) | 0 (0.0%) |
| 5 or more Children | 36 (94.7%) | 2 (5.3%) |
| Total | 2,226 (97.9%) | 48 (2.1%) |
Income Below Poverty Among Single-Parent Households in Sac County
According to the poverty data in Sac County, 20.8% or 41 single-father households and 23.4% or 60 single-mother households are living below the poverty line. Among single-father households, those with 1 or 2 children have the highest poverty rate, with 39 households (48.7%) experiencing poverty. Likewise, among single-mother households, those with 1 or 2 children have the highest poverty rate, with 50 households (31.9%) falling below the poverty line.
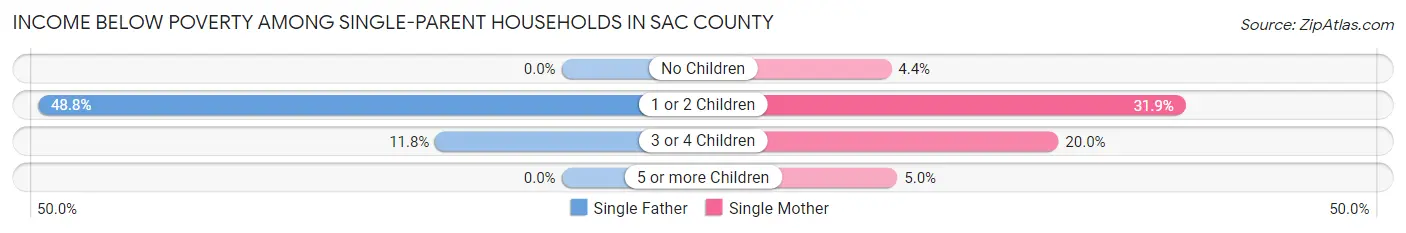
| Children | Single Father | Single Mother |
| No Children | 0 (0.0%) | 2 (4.4%) |
| 1 or 2 Children | 39 (48.7%) | 50 (31.9%) |
| 3 or 4 Children | 2 (11.8%) | 7 (20.0%) |
| 5 or more Children | 0 (0.0%) | 1 (5.0%) |
| Total | 41 (20.8%) | 60 (23.4%) |
Income Below Poverty Among Married-Couple vs Single-Parent Households in Sac County
The poverty data for Sac County shows that 48 of the married-couple family households (2.1%) and 101 of the single-parent households (22.3%) are living below the poverty level. Within the married-couple family households, those with 5 or more children have the highest poverty rate, with 2 households (5.3%) falling below the poverty line. Among the single-parent households, those with 1 or 2 children have the highest poverty rate, with 89 household (37.6%) living below poverty.
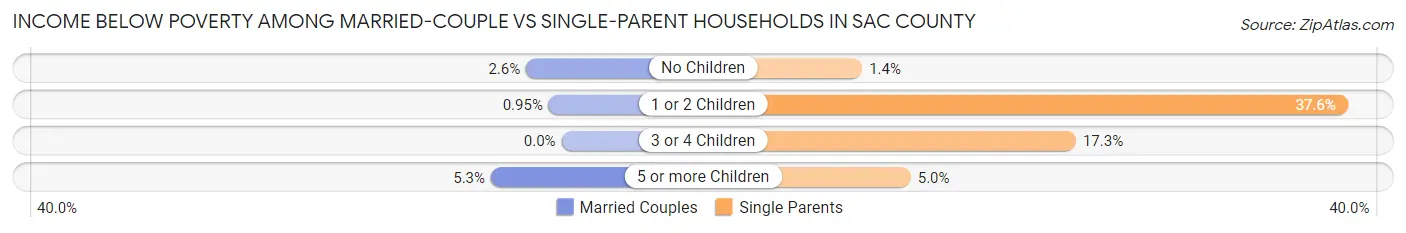
| Children | Married-Couple Families | Single-Parent Households |
| No Children | 41 (2.6%) | 2 (1.4%) |
| 1 or 2 Children | 5 (0.9%) | 89 (37.6%) |
| 3 or 4 Children | 0 (0.0%) | 9 (17.3%) |
| 5 or more Children | 2 (5.3%) | 1 (5.0%) |
| Total | 48 (2.1%) | 101 (22.3%) |
Race in Sac County
The most populous races in Sac County are White / Caucasian (9,359 | 95.7%), Hispanic or Latino (379 | 3.9%), and Two or more Races (166 | 1.7%).
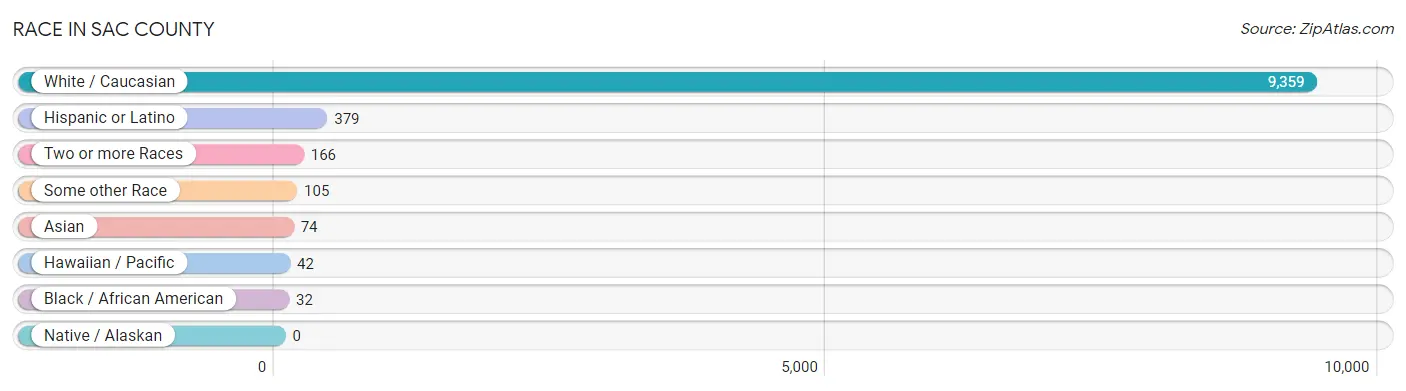
| Race | # Population | % Population |
| Asian | 74 | 0.8% |
| Black / African American | 32 | 0.3% |
| Hawaiian / Pacific | 42 | 0.4% |
| Hispanic or Latino | 379 | 3.9% |
| Native / Alaskan | 0 | 0.0% |
| White / Caucasian | 9,359 | 95.7% |
| Two or more Races | 166 | 1.7% |
| Some other Race | 105 | 1.1% |
| Total | 9,778 | 100.0% |
Ancestry in Sac County
The most populous ancestries reported in Sac County are German (4,318 | 44.2%), Irish (859 | 8.8%), English (799 | 8.2%), Dutch (374 | 3.8%), and American (362 | 3.7%), together accounting for 68.6% of all Sac County residents.
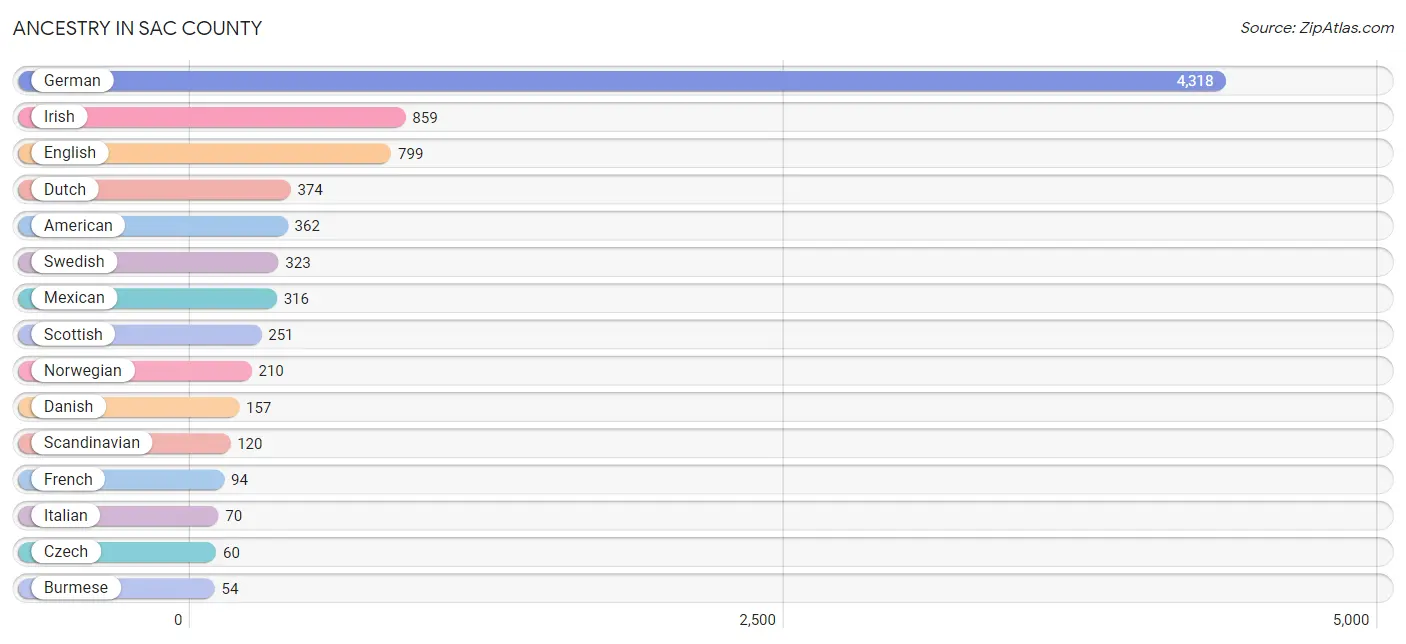
| Ancestry | # Population | % Population |
| American | 362 | 3.7% |
| Arab | 1 | 0.0% |
| Austrian | 31 | 0.3% |
| Belgian | 4 | 0.0% |
| Bhutanese | 4 | 0.0% |
| British | 53 | 0.5% |
| Burmese | 54 | 0.5% |
| Canadian | 21 | 0.2% |
| Cherokee | 3 | 0.0% |
| Cuban | 13 | 0.1% |
| Czech | 60 | 0.6% |
| Czechoslovakian | 10 | 0.1% |
| Danish | 157 | 1.6% |
| Dutch | 374 | 3.8% |
| English | 799 | 8.2% |
| European | 53 | 0.5% |
| Filipino | 7 | 0.1% |
| Finnish | 25 | 0.3% |
| French | 94 | 1.0% |
| French Canadian | 12 | 0.1% |
| German | 4,318 | 44.2% |
| Greek | 8 | 0.1% |
| Indian (Asian) | 5 | 0.1% |
| Irish | 859 | 8.8% |
| Iroquois | 4 | 0.0% |
| Italian | 70 | 0.7% |
| Jamaican | 10 | 0.1% |
| Lebanese | 1 | 0.0% |
| Luxembourger | 2 | 0.0% |
| Malaysian | 4 | 0.0% |
| Mexican | 316 | 3.2% |
| Northern European | 9 | 0.1% |
| Norwegian | 210 | 2.1% |
| Pakistani | 8 | 0.1% |
| Polish | 18 | 0.2% |
| Portuguese | 10 | 0.1% |
| Puerto Rican | 8 | 0.1% |
| Russian | 8 | 0.1% |
| Scandinavian | 120 | 1.2% |
| Scotch-Irish | 54 | 0.5% |
| Scottish | 251 | 2.6% |
| Slavic | 3 | 0.0% |
| Slovak | 2 | 0.0% |
| South American Indian | 4 | 0.0% |
| Spaniard | 14 | 0.1% |
| Sri Lankan | 4 | 0.0% |
| Swedish | 323 | 3.3% |
| Swiss | 14 | 0.1% |
| Ukrainian | 1 | 0.0% |
| Welsh | 50 | 0.5% | View All 50 Rows |
Immigrants in Sac County
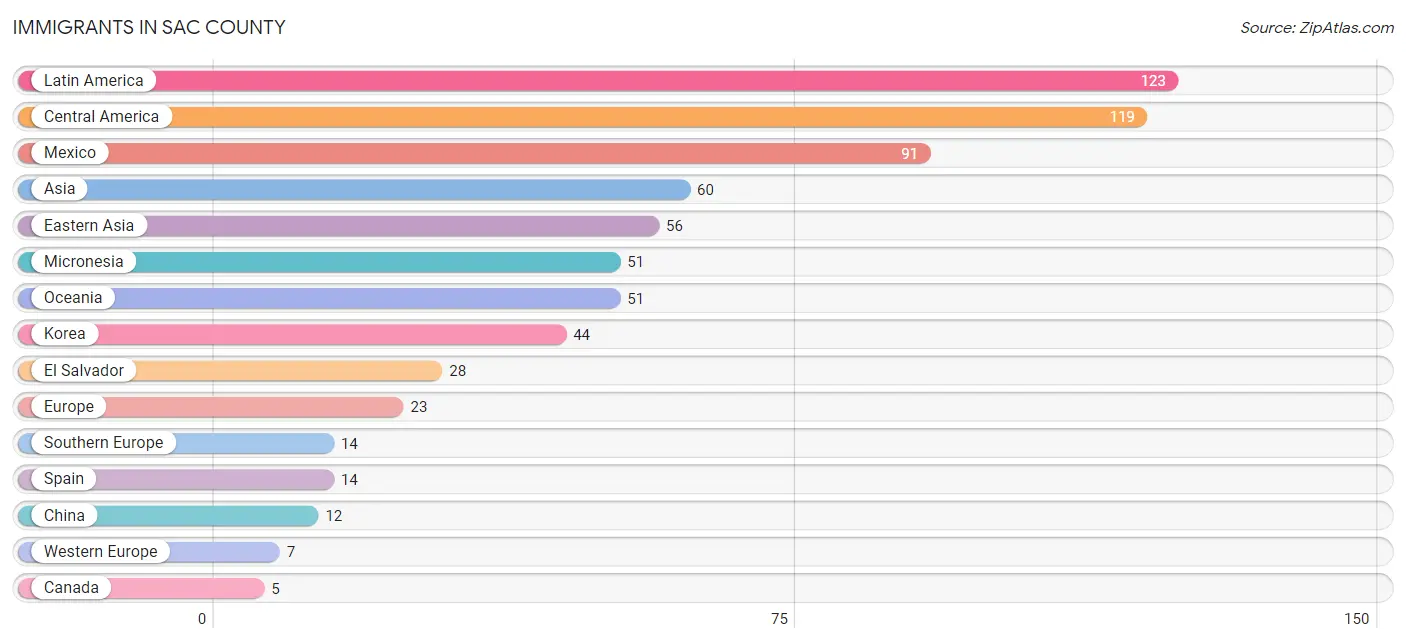
The most numerous immigrant groups reported in Sac County came from Latin America (123 | 1.3%), Central America (119 | 1.2%), Mexico (91 | 0.9%), Asia (60 | 0.6%), and Eastern Asia (56 | 0.6%), together accounting for 4.6% of all Sac County residents.
| Immigration Origin | # Population | % Population |
| Asia | 60 | 0.6% |
| Brazil | 4 | 0.0% |
| Canada | 5 | 0.1% |
| Central America | 119 | 1.2% |
| China | 12 | 0.1% |
| Eastern Asia | 56 | 0.6% |
| El Salvador | 28 | 0.3% |
| England | 2 | 0.0% |
| Europe | 23 | 0.2% |
| Germany | 4 | 0.0% |
| Korea | 44 | 0.4% |
| Latin America | 123 | 1.3% |
| Mexico | 91 | 0.9% |
| Micronesia | 51 | 0.5% |
| Netherlands | 3 | 0.0% |
| Northern Europe | 2 | 0.0% |
| Oceania | 51 | 0.5% |
| South America | 4 | 0.0% |
| South Eastern Asia | 4 | 0.0% |
| Southern Europe | 14 | 0.1% |
| Spain | 14 | 0.1% |
| Vietnam | 4 | 0.0% |
| Western Europe | 7 | 0.1% | View All 23 Rows |
Sex and Age in Sac County
Sex and Age in Sac County
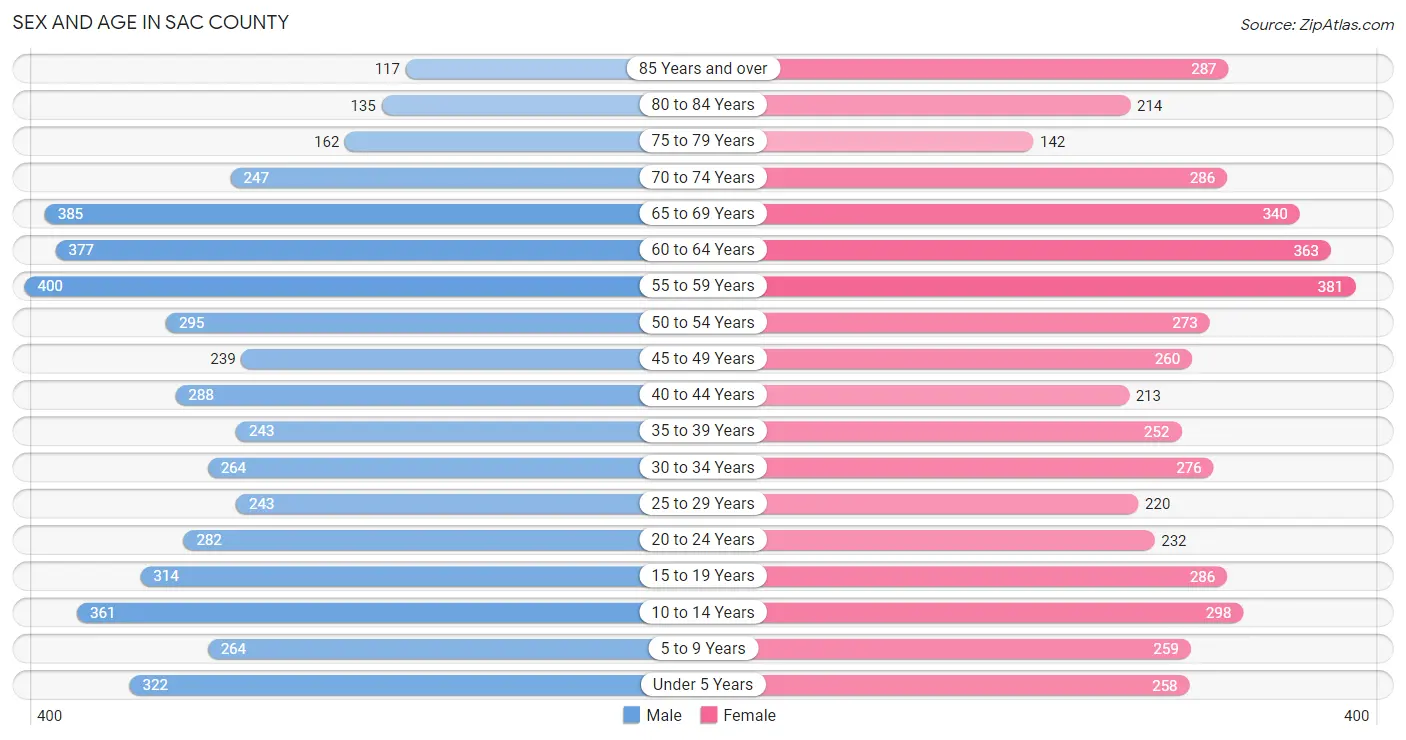
The most populous age groups in Sac County are 55 to 59 Years (400 | 8.1%) for men and 55 to 59 Years (381 | 7.9%) for women.
| Age Bracket | Male | Female |
| Under 5 Years | 322 (6.5%) | 258 (5.3%) |
| 5 to 9 Years | 264 (5.3%) | 259 (5.3%) |
| 10 to 14 Years | 361 (7.3%) | 298 (6.2%) |
| 15 to 19 Years | 314 (6.4%) | 286 (5.9%) |
| 20 to 24 Years | 282 (5.7%) | 232 (4.8%) |
| 25 to 29 Years | 243 (4.9%) | 220 (4.5%) |
| 30 to 34 Years | 264 (5.3%) | 276 (5.7%) |
| 35 to 39 Years | 243 (4.9%) | 252 (5.2%) |
| 40 to 44 Years | 288 (5.8%) | 213 (4.4%) |
| 45 to 49 Years | 239 (4.8%) | 260 (5.4%) |
| 50 to 54 Years | 295 (6.0%) | 273 (5.6%) |
| 55 to 59 Years | 400 (8.1%) | 381 (7.9%) |
| 60 to 64 Years | 377 (7.6%) | 363 (7.5%) |
| 65 to 69 Years | 385 (7.8%) | 340 (7.0%) |
| 70 to 74 Years | 247 (5.0%) | 286 (5.9%) |
| 75 to 79 Years | 162 (3.3%) | 142 (2.9%) |
| 80 to 84 Years | 135 (2.7%) | 214 (4.4%) |
| 85 Years and over | 117 (2.4%) | 287 (5.9%) |
| Total | 4,938 (100.0%) | 4,840 (100.0%) |
Families and Households in Sac County
Median Family Size in Sac County
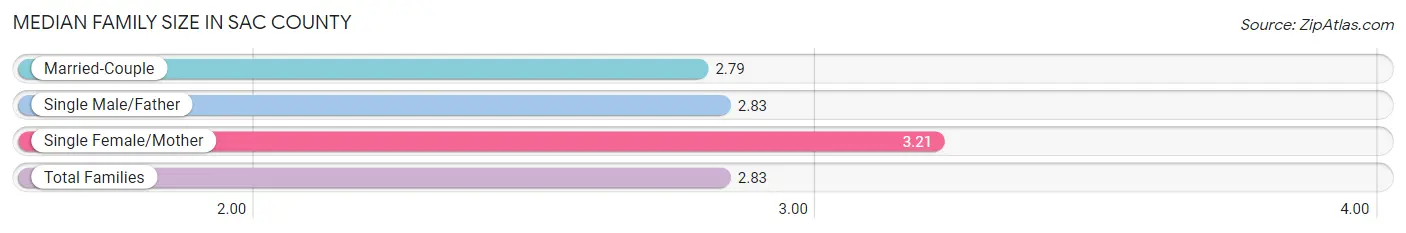
The median family size in Sac County is 2.83 persons per family, with single female/mother families (257 | 9.4%) accounting for the largest median family size of 3.21 persons per family. On the other hand, married-couple families (2,274 | 83.4%) represent the smallest median family size with 2.79 persons per family.
| Family Type | # Families | Family Size |
| Married-Couple | 2,274 (83.4%) | 2.79 |
| Single Male/Father | 197 (7.2%) | 2.83 |
| Single Female/Mother | 257 (9.4%) | 3.21 |
| Total Families | 2,728 (100.0%) | 2.83 |
Median Household Size in Sac County
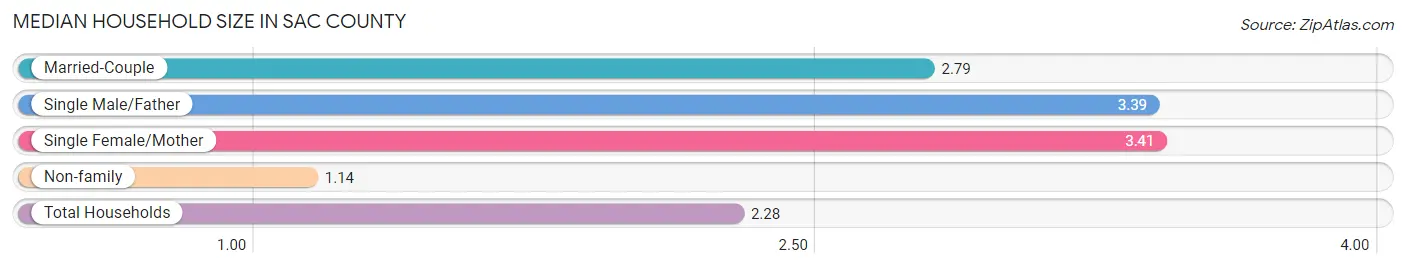
The median household size in Sac County is 2.28 persons per household, with single female/mother households (257 | 6.1%) accounting for the largest median household size of 3.41 persons per household. non-family households (1,482 | 35.2%) represent the smallest median household size with 1.14 persons per household.
| Household Type | # Households | Household Size |
| Married-Couple | 2,274 (54.0%) | 2.79 |
| Single Male/Father | 197 (4.7%) | 3.39 |
| Single Female/Mother | 257 (6.1%) | 3.41 |
| Non-family | 1,482 (35.2%) | 1.14 |
| Total Households | 4,210 (100.0%) | 2.28 |
Household Size by Marriage Status in Sac County
Out of a total of 4,210 households in Sac County, 2,728 (64.8%) are family households, while 1,482 (35.2%) are nonfamily households. The most numerous type of family households are 2-person households, comprising 1,572, and the most common type of nonfamily households are 1-person households, comprising 1,315.
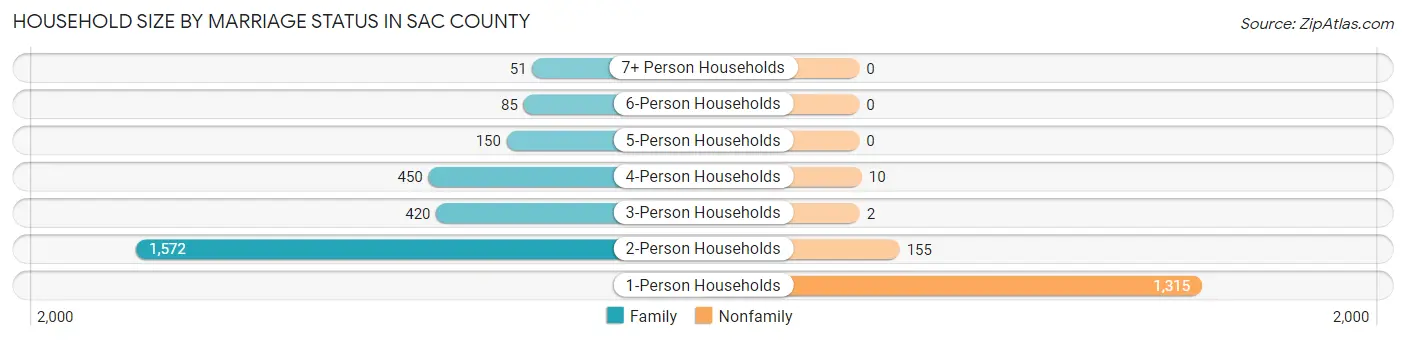
| Household Size | Family Households | Nonfamily Households |
| 1-Person Households | - | 1,315 (31.2%) |
| 2-Person Households | 1,572 (37.3%) | 155 (3.7%) |
| 3-Person Households | 420 (10.0%) | 2 (0.1%) |
| 4-Person Households | 450 (10.7%) | 10 (0.2%) |
| 5-Person Households | 150 (3.6%) | 0 (0.0%) |
| 6-Person Households | 85 (2.0%) | 0 (0.0%) |
| 7+ Person Households | 51 (1.2%) | 0 (0.0%) |
| Total | 2,728 (64.8%) | 1,482 (35.2%) |
Female Fertility in Sac County
Fertility by Age in Sac County
Average fertility rate in Sac County is 76.0 births per 1,000 women. Women in the age bracket of 20 to 34 years have the highest fertility rate with 147.0 births per 1,000 women. Women in the age bracket of 20 to 34 years acount for 77.5% of all women with births.
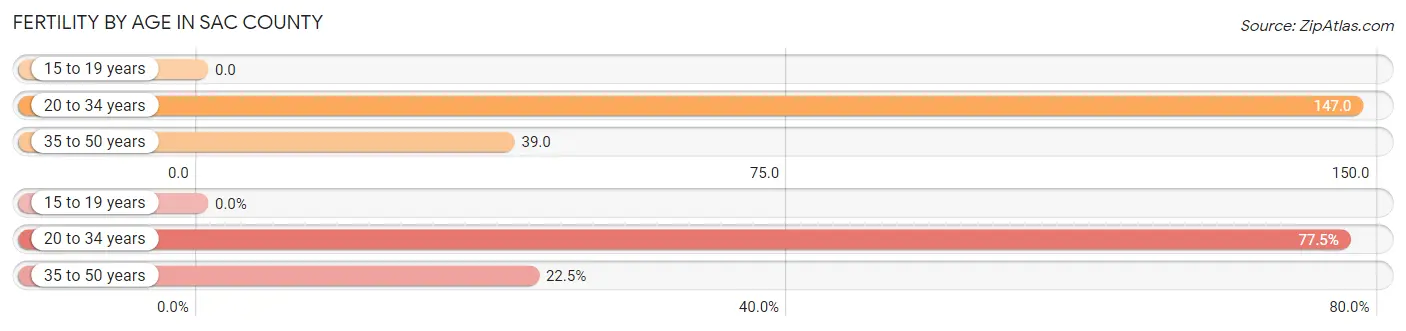
| Age Bracket | Women with Births | Births / 1,000 Women |
| 15 to 19 years | 0 (0.0%) | 0.0 |
| 20 to 34 years | 107 (77.5%) | 147.0 |
| 35 to 50 years | 31 (22.5%) | 39.0 |
| Total | 138 (100.0%) | 76.0 |
Fertility by Age by Marriage Status in Sac County
72.5% of women with births (138) in Sac County are married. The highest percentage of unmarried women with births falls into 20 to 34 years age bracket with 31.8% of them unmarried at the time of birth, while the lowest percentage of unmarried women with births belong to 35 to 50 years age bracket with 12.9% of them unmarried.
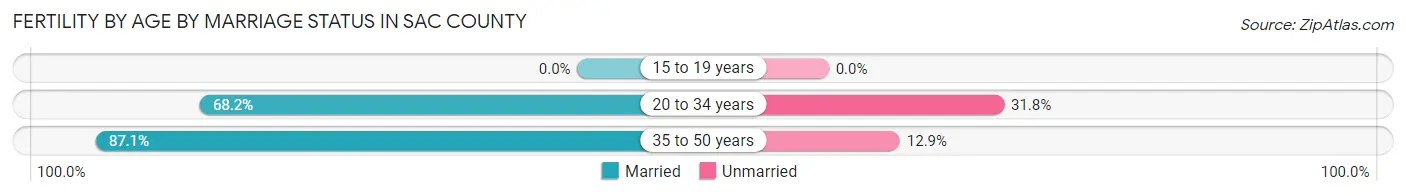
| Age Bracket | Married | Unmarried |
| 15 to 19 years | 0 (0.0%) | 0 (0.0%) |
| 20 to 34 years | 73 (68.2%) | 34 (31.8%) |
| 35 to 50 years | 27 (87.1%) | 4 (12.9%) |
| Total | 100 (72.5%) | 38 (27.5%) |
Fertility by Education in Sac County
Average fertility rate in Sac County is 76.0 births per 1,000 women. Women with the education attainment of bachelor's degree have the highest fertility rate of 123.0 births per 1,000 women, while women with the education attainment of less than high school have the lowest fertility at 10.0 births per 1,000 women. Women with the education attainment of college or associate's degree represent 36.2% of all women with births.
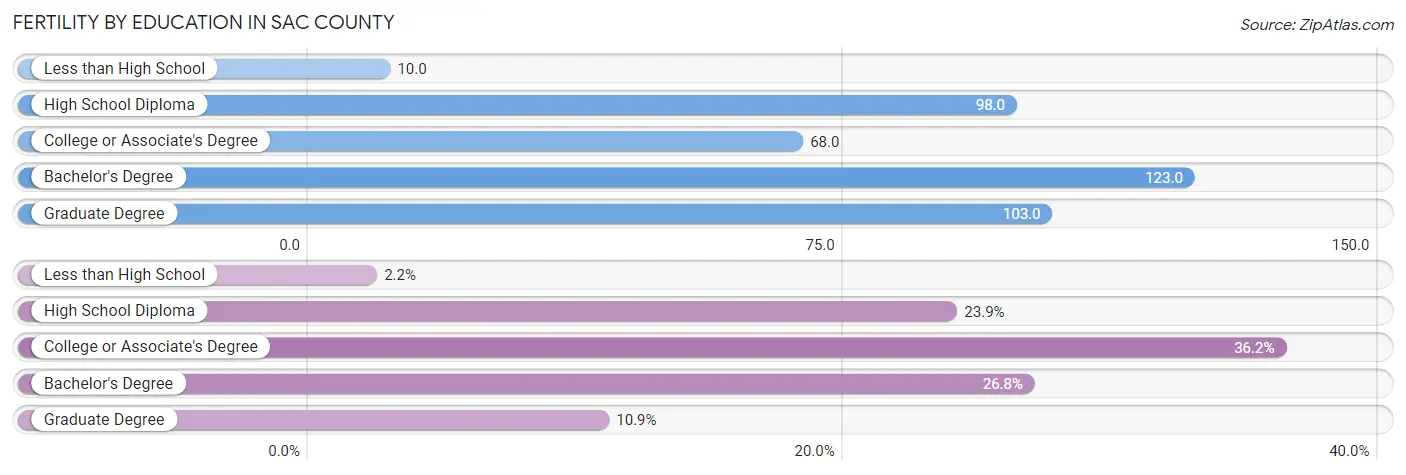
| Educational Attainment | Women with Births | Births / 1,000 Women |
| Less than High School | 3 (2.2%) | 10.0 |
| High School Diploma | 33 (23.9%) | 98.0 |
| College or Associate's Degree | 50 (36.2%) | 68.0 |
| Bachelor's Degree | 37 (26.8%) | 123.0 |
| Graduate Degree | 15 (10.9%) | 103.0 |
| Total | 138 (100.0%) | 76.0 |
Fertility by Education by Marriage Status in Sac County
27.5% of women with births in Sac County are unmarried. Women with the educational attainment of graduate degree are most likely to be married with 100.0% of them married at childbirth, while women with the educational attainment of less than high school are least likely to be married with 100.0% of them unmarried at childbirth.
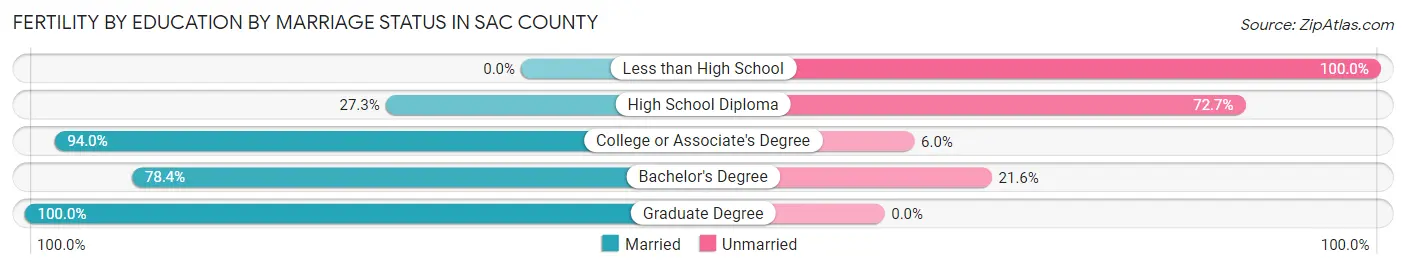
| Educational Attainment | Married | Unmarried |
| Less than High School | 0 (0.0%) | 3 (100.0%) |
| High School Diploma | 9 (27.3%) | 24 (72.7%) |
| College or Associate's Degree | 47 (94.0%) | 3 (6.0%) |
| Bachelor's Degree | 29 (78.4%) | 8 (21.6%) |
| Graduate Degree | 15 (100.0%) | 0 (0.0%) |
| Total | 100 (72.5%) | 38 (27.5%) |
Employment Characteristics in Sac County
Employment by Class of Employer in Sac County
Among the 4,875 employed individuals in Sac County, private company employees (3,133 | 64.3%), self-employed (not incorporated) (600 | 12.3%), and local government employees (381 | 7.8%) make up the most common classes of employment.
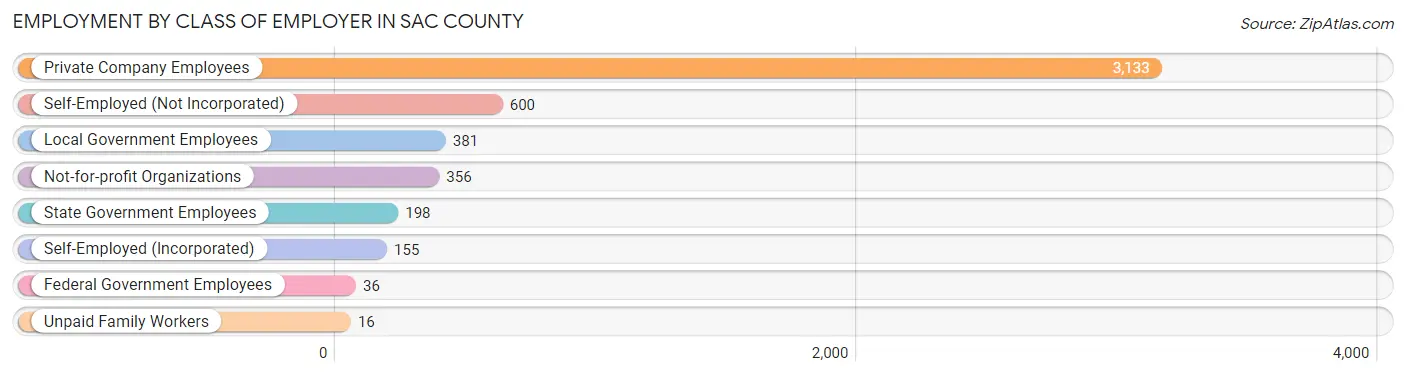
| Employer Class | # Employees | % Employees |
| Private Company Employees | 3,133 | 64.3% |
| Self-Employed (Incorporated) | 155 | 3.2% |
| Self-Employed (Not Incorporated) | 600 | 12.3% |
| Not-for-profit Organizations | 356 | 7.3% |
| Local Government Employees | 381 | 7.8% |
| State Government Employees | 198 | 4.1% |
| Federal Government Employees | 36 | 0.7% |
| Unpaid Family Workers | 16 | 0.3% |
| Total | 4,875 | 100.0% |
Employment Status by Age in Sac County
According to the labor force statistics for Sac County, out of the total population over 16 years of age (7,836), 65.3% or 5,117 individuals are in the labor force, with 3.2% or 164 of them unemployed. The age group with the highest labor force participation rate is 25 to 29 years, with 92.7% or 429 individuals in the labor force. Within the labor force, the 16 to 19 years age range has the highest percentage of unemployed individuals, with 15.2% or 37 of them being unemployed.
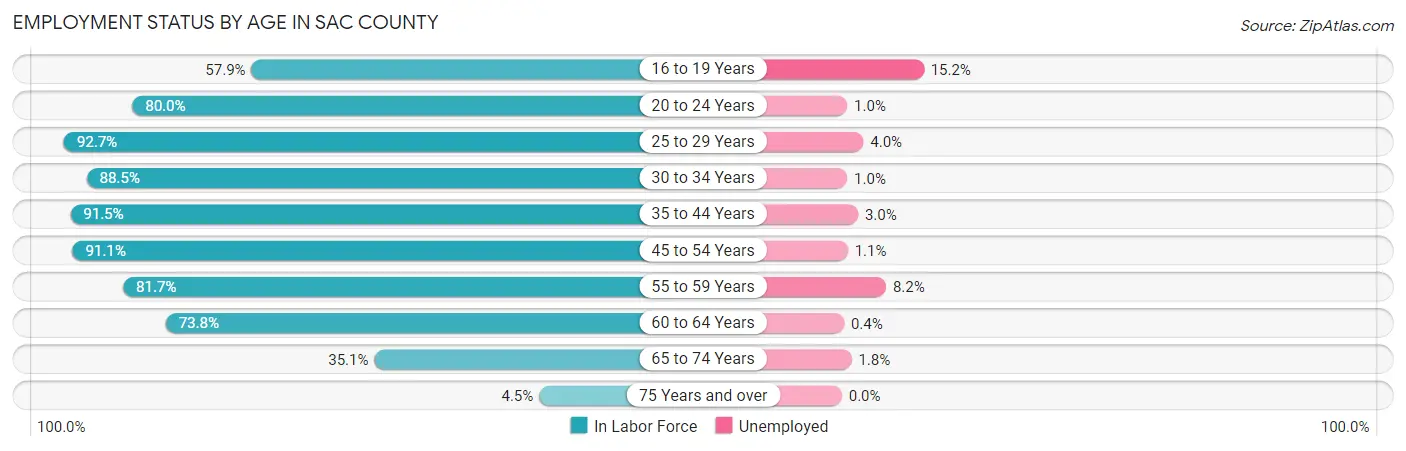
| Age Bracket | In Labor Force | Unemployed |
| 16 to 19 Years | 243 (57.9%) | 37 (15.2%) |
| 20 to 24 Years | 411 (80.0%) | 4 (1.0%) |
| 25 to 29 Years | 429 (92.7%) | 17 (4.0%) |
| 30 to 34 Years | 478 (88.5%) | 5 (1.0%) |
| 35 to 44 Years | 911 (91.5%) | 27 (3.0%) |
| 45 to 54 Years | 972 (91.1%) | 11 (1.1%) |
| 55 to 59 Years | 638 (81.7%) | 52 (8.2%) |
| 60 to 64 Years | 546 (73.8%) | 2 (0.4%) |
| 65 to 74 Years | 442 (35.1%) | 8 (1.8%) |
| 75 Years and over | 48 (4.5%) | 0 (0.0%) |
| Total | 5,117 (65.3%) | 164 (3.2%) |
Employment Status by Educational Attainment in Sac County
According to labor force statistics for Sac County, 86.6% of individuals (3,972) out of the total population between 25 and 64 years of age (4,587) are in the labor force, with 2.9% or 115 of them being unemployed. The group with the highest labor force participation rate are those with the educational attainment of bachelor's degree or higher, with 88.5% or 837 individuals in the labor force. Within the labor force, individuals with college / associate degree education have the highest percentage of unemployment, with 5.0% or 84 of them being unemployed.
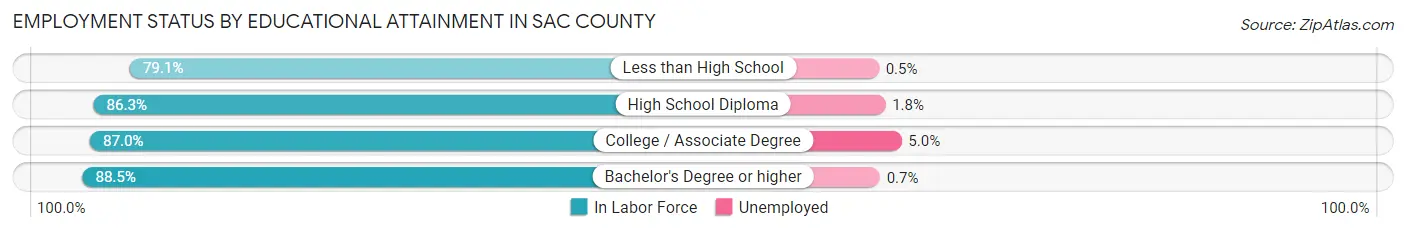
| Educational Attainment | In Labor Force | Unemployed |
| Less than High School | 212 (79.1%) | 1 (0.5%) |
| High School Diploma | 1,250 (86.3%) | 26 (1.8%) |
| College / Associate Degree | 1,675 (87.0%) | 96 (5.0%) |
| Bachelor's Degree or higher | 837 (88.5%) | 7 (0.7%) |
| Total | 3,972 (86.6%) | 133 (2.9%) |
Employment Occupations by Sex in Sac County
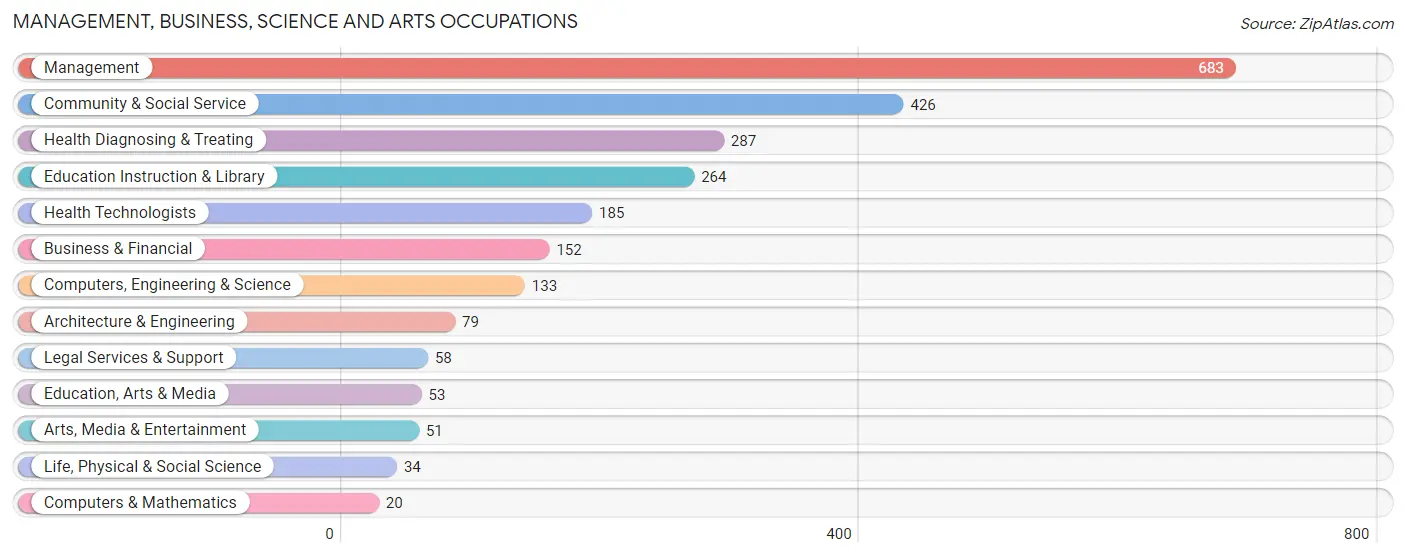
Management, Business, Science and Arts Occupations
The most common Management, Business, Science and Arts occupations in Sac County are Management (683 | 13.8%), Community & Social Service (426 | 8.6%), Health Diagnosing & Treating (287 | 5.8%), Education Instruction & Library (264 | 5.3%), and Health Technologists (185 | 3.7%).
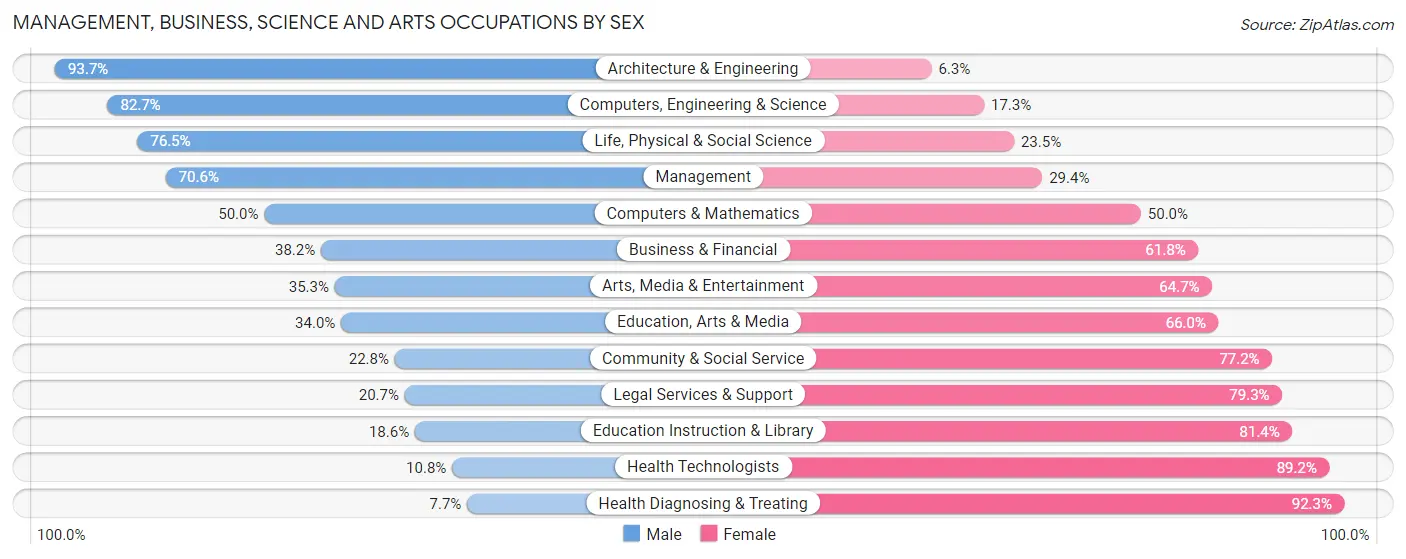
Management, Business, Science and Arts Occupations by Sex
Within the Management, Business, Science and Arts occupations in Sac County, the most male-oriented occupations are Architecture & Engineering (93.7%), Computers, Engineering & Science (82.7%), and Life, Physical & Social Science (76.5%), while the most female-oriented occupations are Health Diagnosing & Treating (92.3%), Health Technologists (89.2%), and Education Instruction & Library (81.4%).
| Occupation | Male | Female |
| Management | 482 (70.6%) | 201 (29.4%) |
| Business & Financial | 58 (38.2%) | 94 (61.8%) |
| Computers, Engineering & Science | 110 (82.7%) | 23 (17.3%) |
| Computers & Mathematics | 10 (50.0%) | 10 (50.0%) |
| Architecture & Engineering | 74 (93.7%) | 5 (6.3%) |
| Life, Physical & Social Science | 26 (76.5%) | 8 (23.5%) |
| Community & Social Service | 97 (22.8%) | 329 (77.2%) |
| Education, Arts & Media | 18 (34.0%) | 35 (66.0%) |
| Legal Services & Support | 12 (20.7%) | 46 (79.3%) |
| Education Instruction & Library | 49 (18.6%) | 215 (81.4%) |
| Arts, Media & Entertainment | 18 (35.3%) | 33 (64.7%) |
| Health Diagnosing & Treating | 22 (7.7%) | 265 (92.3%) |
| Health Technologists | 20 (10.8%) | 165 (89.2%) |
| Total (Category) | 769 (45.8%) | 912 (54.2%) |
| Total (Overall) | 2,734 (55.2%) | 2,221 (44.8%) |
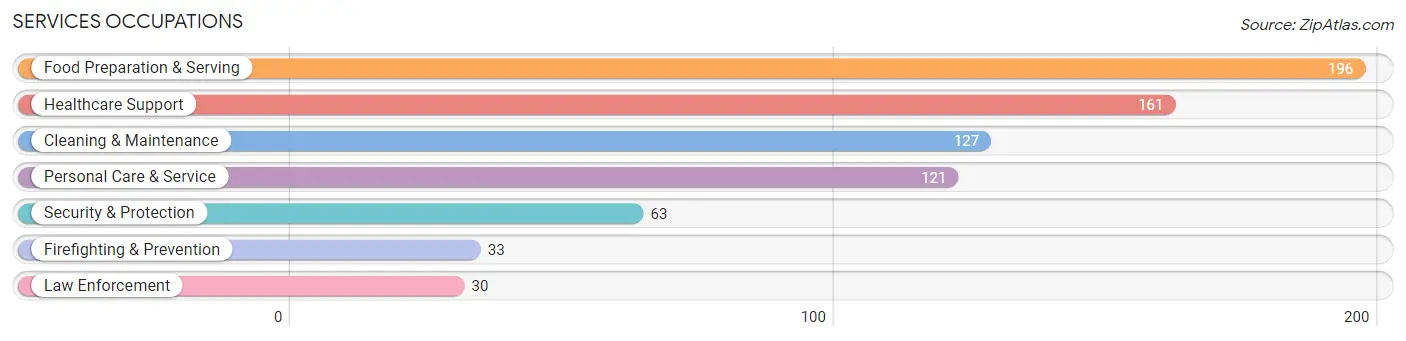
Services Occupations
The most common Services occupations in Sac County are Food Preparation & Serving (196 | 4.0%), Healthcare Support (161 | 3.3%), Cleaning & Maintenance (127 | 2.6%), Personal Care & Service (121 | 2.4%), and Security & Protection (63 | 1.3%).
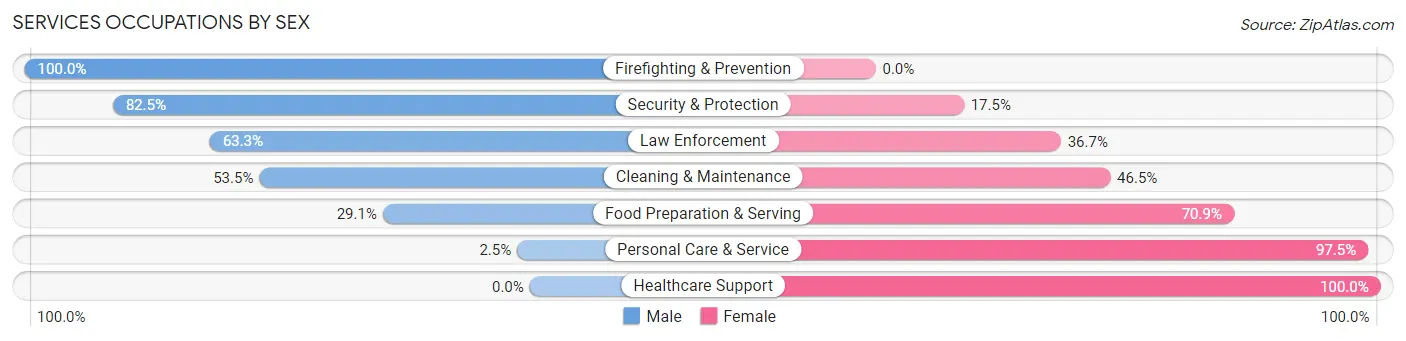
Services Occupations by Sex
Within the Services occupations in Sac County, the most male-oriented occupations are Firefighting & Prevention (100.0%), Security & Protection (82.5%), and Law Enforcement (63.3%), while the most female-oriented occupations are Healthcare Support (100.0%), Personal Care & Service (97.5%), and Food Preparation & Serving (70.9%).
| Occupation | Male | Female |
| Healthcare Support | 0 (0.0%) | 161 (100.0%) |
| Security & Protection | 52 (82.5%) | 11 (17.5%) |
| Firefighting & Prevention | 33 (100.0%) | 0 (0.0%) |
| Law Enforcement | 19 (63.3%) | 11 (36.7%) |
| Food Preparation & Serving | 57 (29.1%) | 139 (70.9%) |
| Cleaning & Maintenance | 68 (53.5%) | 59 (46.5%) |
| Personal Care & Service | 3 (2.5%) | 118 (97.5%) |
| Total (Category) | 180 (27.0%) | 488 (73.1%) |
| Total (Overall) | 2,734 (55.2%) | 2,221 (44.8%) |
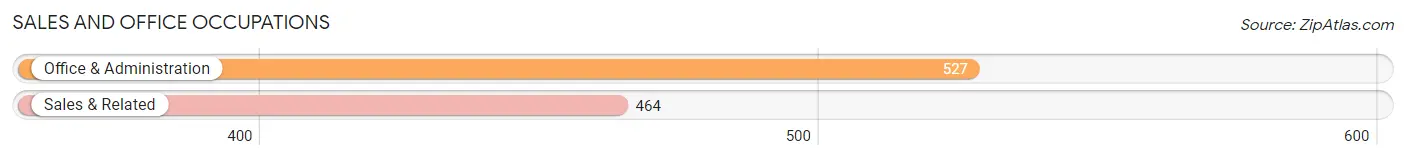
Sales and Office Occupations
The most common Sales and Office occupations in Sac County are Office & Administration (527 | 10.6%), and Sales & Related (464 | 9.4%).
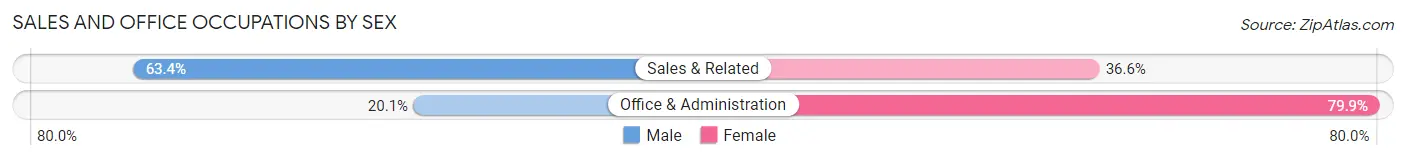
Sales and Office Occupations by Sex
| Occupation | Male | Female |
| Sales & Related | 294 (63.4%) | 170 (36.6%) |
| Office & Administration | 106 (20.1%) | 421 (79.9%) |
| Total (Category) | 400 (40.4%) | 591 (59.6%) |
| Total (Overall) | 2,734 (55.2%) | 2,221 (44.8%) |
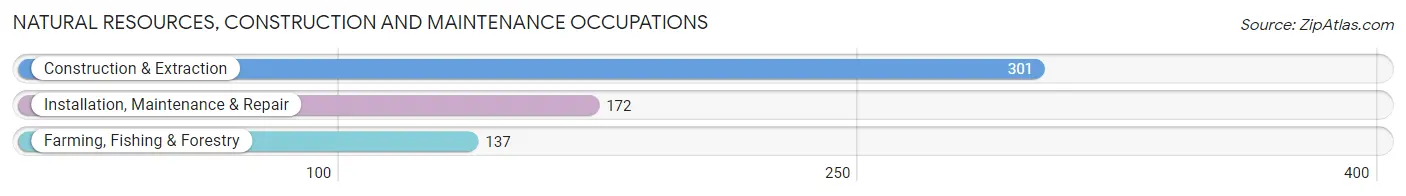
Natural Resources, Construction and Maintenance Occupations
The most common Natural Resources, Construction and Maintenance occupations in Sac County are Construction & Extraction (301 | 6.1%), Installation, Maintenance & Repair (172 | 3.5%), and Farming, Fishing & Forestry (137 | 2.8%).
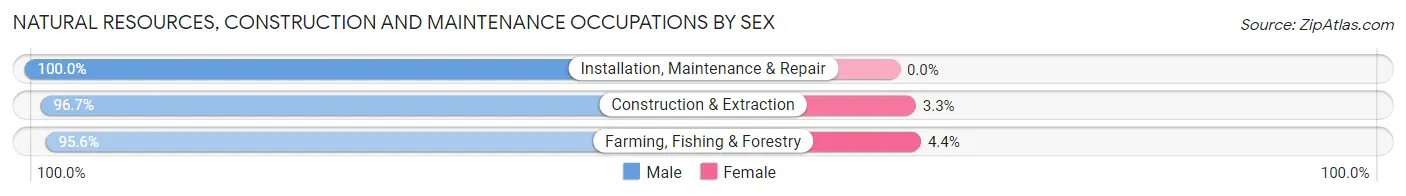
Natural Resources, Construction and Maintenance Occupations by Sex
| Occupation | Male | Female |
| Farming, Fishing & Forestry | 131 (95.6%) | 6 (4.4%) |
| Construction & Extraction | 291 (96.7%) | 10 (3.3%) |
| Installation, Maintenance & Repair | 172 (100.0%) | 0 (0.0%) |
| Total (Category) | 594 (97.4%) | 16 (2.6%) |
| Total (Overall) | 2,734 (55.2%) | 2,221 (44.8%) |
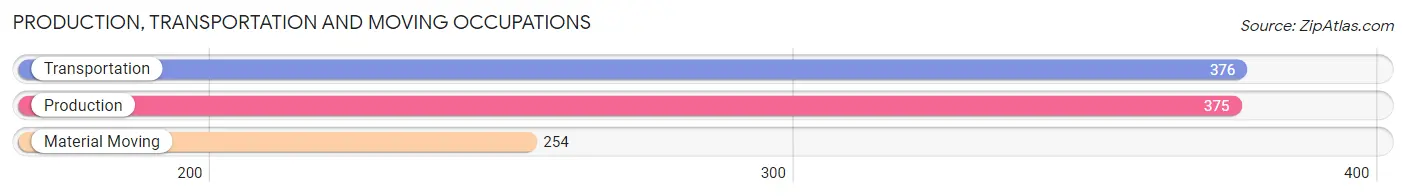
Production, Transportation and Moving Occupations
The most common Production, Transportation and Moving occupations in Sac County are Transportation (376 | 7.6%), Production (375 | 7.6%), and Material Moving (254 | 5.1%).
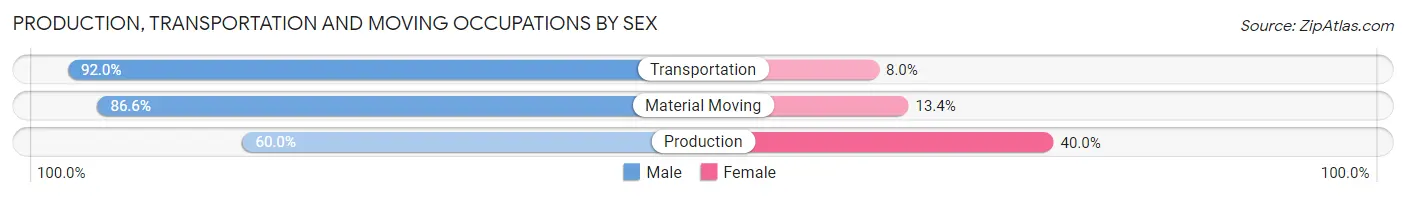
Production, Transportation and Moving Occupations by Sex
| Occupation | Male | Female |
| Production | 225 (60.0%) | 150 (40.0%) |
| Transportation | 346 (92.0%) | 30 (8.0%) |
| Material Moving | 220 (86.6%) | 34 (13.4%) |
| Total (Category) | 791 (78.7%) | 214 (21.3%) |
| Total (Overall) | 2,734 (55.2%) | 2,221 (44.8%) |
Employment Industries by Sex in Sac County
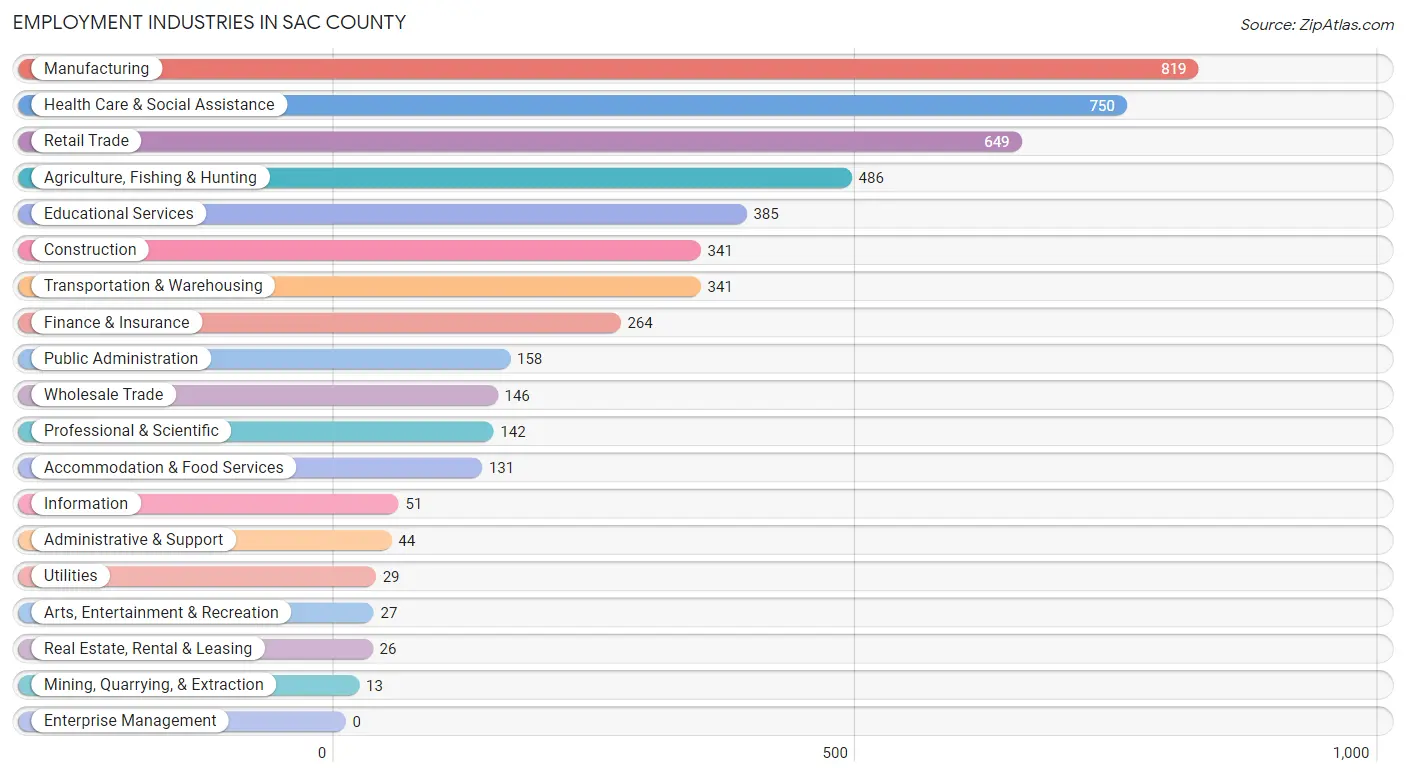
Employment Industries in Sac County
The major employment industries in Sac County include Manufacturing (819 | 16.5%), Health Care & Social Assistance (750 | 15.1%), Retail Trade (649 | 13.1%), Agriculture, Fishing & Hunting (486 | 9.8%), and Educational Services (385 | 7.8%).
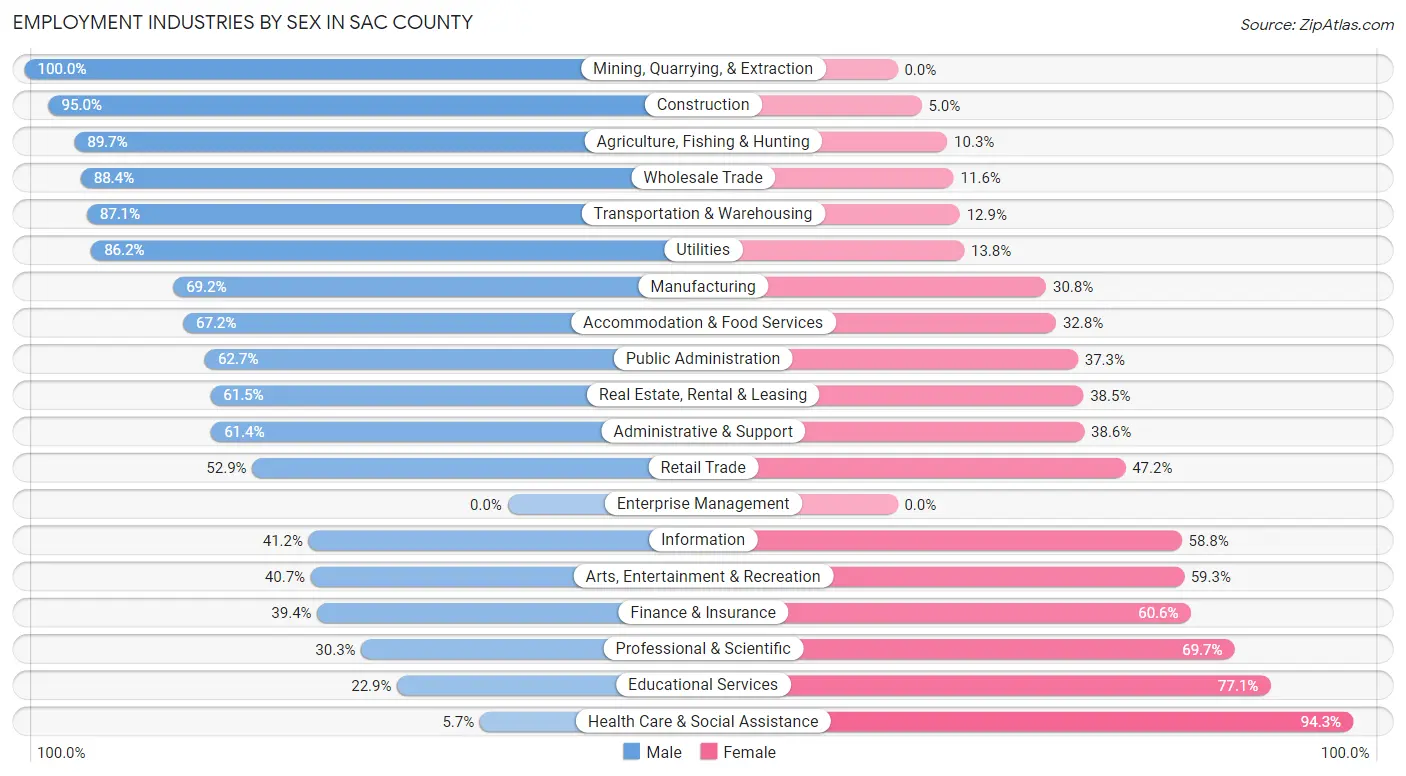
Employment Industries by Sex in Sac County
The Sac County industries that see more men than women are Mining, Quarrying, & Extraction (100.0%), Construction (95.0%), and Agriculture, Fishing & Hunting (89.7%), whereas the industries that tend to have a higher number of women are Health Care & Social Assistance (94.3%), Educational Services (77.1%), and Professional & Scientific (69.7%).
| Industry | Male | Female |
| Agriculture, Fishing & Hunting | 436 (89.7%) | 50 (10.3%) |
| Mining, Quarrying, & Extraction | 13 (100.0%) | 0 (0.0%) |
| Construction | 324 (95.0%) | 17 (5.0%) |
| Manufacturing | 567 (69.2%) | 252 (30.8%) |
| Wholesale Trade | 129 (88.4%) | 17 (11.6%) |
| Retail Trade | 343 (52.8%) | 306 (47.1%) |
| Transportation & Warehousing | 297 (87.1%) | 44 (12.9%) |
| Utilities | 25 (86.2%) | 4 (13.8%) |
| Information | 21 (41.2%) | 30 (58.8%) |
| Finance & Insurance | 104 (39.4%) | 160 (60.6%) |
| Real Estate, Rental & Leasing | 16 (61.5%) | 10 (38.5%) |
| Professional & Scientific | 43 (30.3%) | 99 (69.7%) |
| Enterprise Management | 0 (0.0%) | 0 (0.0%) |
| Administrative & Support | 27 (61.4%) | 17 (38.6%) |
| Educational Services | 88 (22.9%) | 297 (77.1%) |
| Health Care & Social Assistance | 43 (5.7%) | 707 (94.3%) |
| Arts, Entertainment & Recreation | 11 (40.7%) | 16 (59.3%) |
| Accommodation & Food Services | 88 (67.2%) | 43 (32.8%) |
| Public Administration | 99 (62.7%) | 59 (37.3%) |
| Total | 2,734 (55.2%) | 2,221 (44.8%) |
Education in Sac County
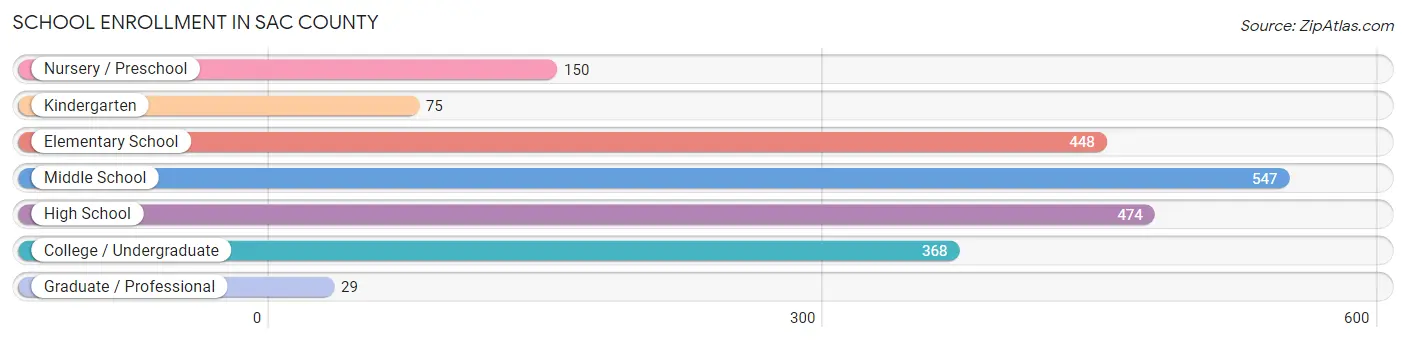
School Enrollment in Sac County
The most common levels of schooling among the 2,091 students in Sac County are middle school (547 | 26.2%), high school (474 | 22.7%), and elementary school (448 | 21.4%).
| School Level | # Students | % Students |
| Nursery / Preschool | 150 | 7.2% |
| Kindergarten | 75 | 3.6% |
| Elementary School | 448 | 21.4% |
| Middle School | 547 | 26.2% |
| High School | 474 | 22.7% |
| College / Undergraduate | 368 | 17.6% |
| Graduate / Professional | 29 | 1.4% |
| Total | 2,091 | 100.0% |
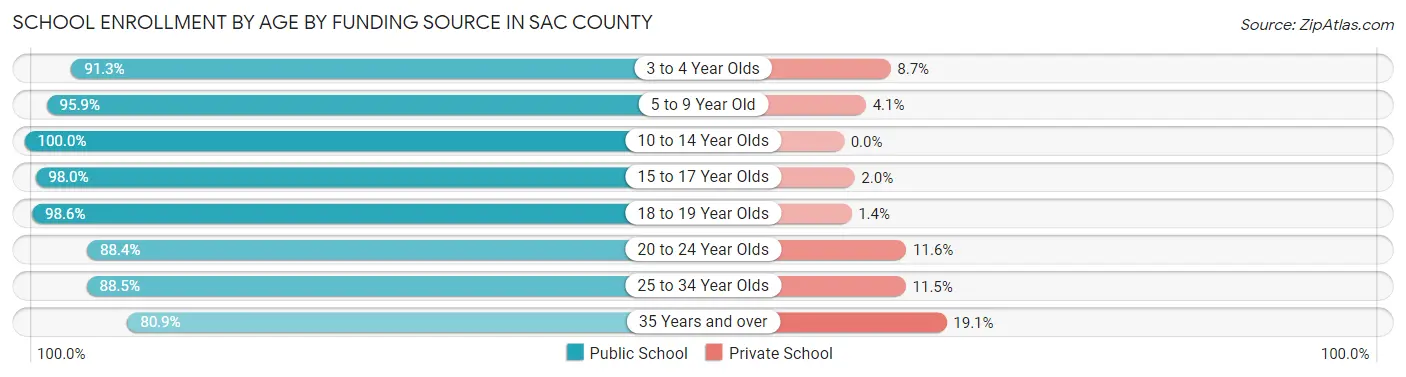
School Enrollment by Age by Funding Source in Sac County
Out of a total of 2,091 students who are enrolled in schools in Sac County, 82 (3.9%) attend a private institution, while the remaining 2,009 (96.1%) are enrolled in public schools. The age group of 35 years and over has the highest likelihood of being enrolled in private schools, with 22 (19.1% in the age bracket) enrolled. Conversely, the age group of 10 to 14 year olds has the lowest likelihood of being enrolled in a private school, with 658 (100.0% in the age bracket) attending a public institution.
| Age Bracket | Public School | Private School |
| 3 to 4 Year Olds | 84 (91.3%) | 8 (8.7%) |
| 5 to 9 Year Old | 491 (95.9%) | 21 (4.1%) |
| 10 to 14 Year Olds | 658 (100.0%) | 0 (0.0%) |
| 15 to 17 Year Olds | 392 (98.0%) | 8 (2.0%) |
| 18 to 19 Year Olds | 140 (98.6%) | 2 (1.4%) |
| 20 to 24 Year Olds | 129 (88.4%) | 17 (11.6%) |
| 25 to 34 Year Olds | 23 (88.5%) | 3 (11.5%) |
| 35 Years and over | 93 (80.9%) | 22 (19.1%) |
| Total | 2,009 (96.1%) | 82 (3.9%) |
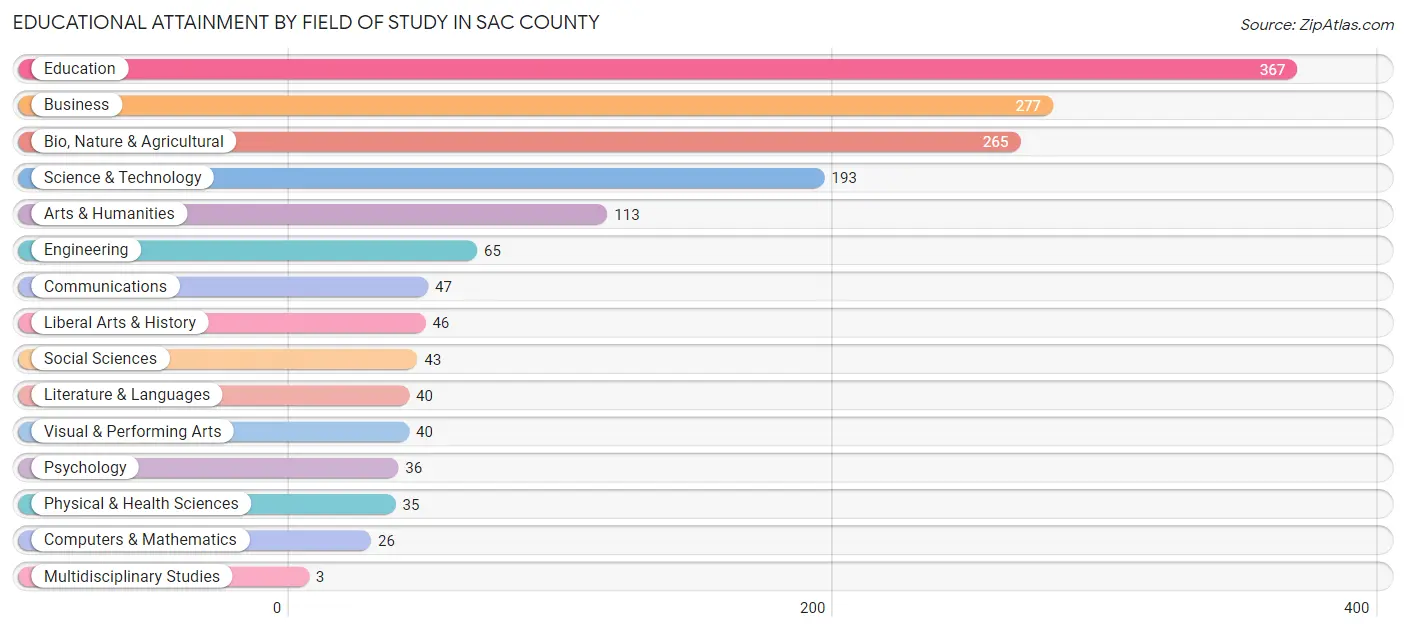
Educational Attainment by Field of Study in Sac County
Education (367 | 23.0%), business (277 | 17.4%), bio, nature & agricultural (265 | 16.6%), science & technology (193 | 12.1%), and arts & humanities (113 | 7.1%) are the most common fields of study among 1,596 individuals in Sac County who have obtained a bachelor's degree or higher.
| Field of Study | # Graduates | % Graduates |
| Computers & Mathematics | 26 | 1.6% |
| Bio, Nature & Agricultural | 265 | 16.6% |
| Physical & Health Sciences | 35 | 2.2% |
| Psychology | 36 | 2.3% |
| Social Sciences | 43 | 2.7% |
| Engineering | 65 | 4.1% |
| Multidisciplinary Studies | 3 | 0.2% |
| Science & Technology | 193 | 12.1% |
| Business | 277 | 17.4% |
| Education | 367 | 23.0% |
| Literature & Languages | 40 | 2.5% |
| Liberal Arts & History | 46 | 2.9% |
| Visual & Performing Arts | 40 | 2.5% |
| Communications | 47 | 2.9% |
| Arts & Humanities | 113 | 7.1% |
| Total | 1,596 | 100.0% |
Transportation & Commute in Sac County
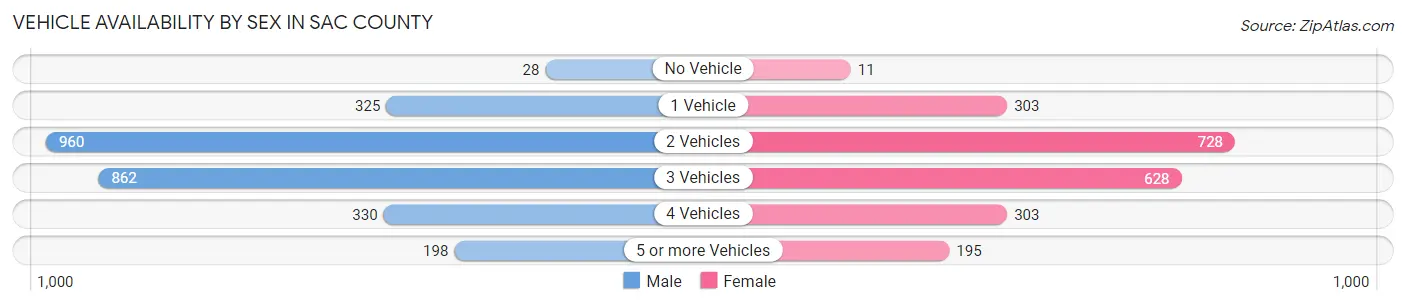
Vehicle Availability by Sex in Sac County
The most prevalent vehicle ownership categories in Sac County are males with 2 vehicles (960, accounting for 35.5%) and females with 2 vehicles (728, making up 44.3%).
| Vehicles Available | Male | Female |
| No Vehicle | 28 (1.0%) | 11 (0.5%) |
| 1 Vehicle | 325 (12.0%) | 303 (14.0%) |
| 2 Vehicles | 960 (35.5%) | 728 (33.6%) |
| 3 Vehicles | 862 (31.9%) | 628 (29.0%) |
| 4 Vehicles | 330 (12.2%) | 303 (14.0%) |
| 5 or more Vehicles | 198 (7.3%) | 195 (9.0%) |
| Total | 2,703 (100.0%) | 2,168 (100.0%) |
Commute Time in Sac County
The most frequently occuring commute durations in Sac County are 5 to 9 minutes (889 commuters, 19.2%), 20 to 24 minutes (705 commuters, 15.2%), and 15 to 19 minutes (579 commuters, 12.5%).
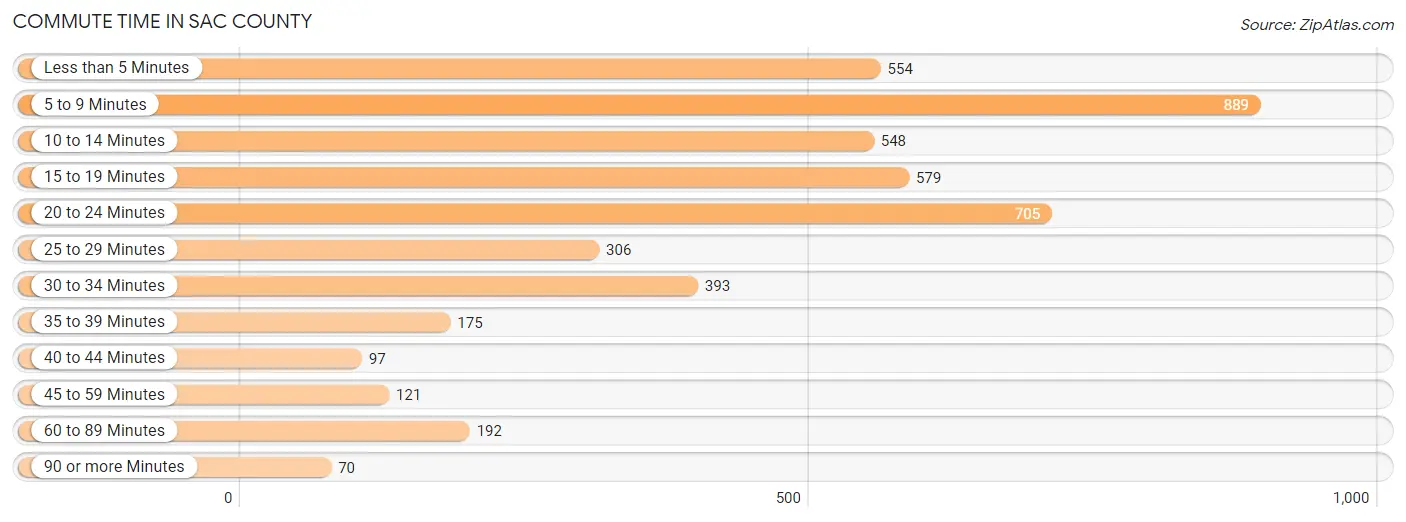
| Commute Time | # Commuters | % Commuters |
| Less than 5 Minutes | 554 | 12.0% |
| 5 to 9 Minutes | 889 | 19.2% |
| 10 to 14 Minutes | 548 | 11.8% |
| 15 to 19 Minutes | 579 | 12.5% |
| 20 to 24 Minutes | 705 | 15.2% |
| 25 to 29 Minutes | 306 | 6.6% |
| 30 to 34 Minutes | 393 | 8.5% |
| 35 to 39 Minutes | 175 | 3.8% |
| 40 to 44 Minutes | 97 | 2.1% |
| 45 to 59 Minutes | 121 | 2.6% |
| 60 to 89 Minutes | 192 | 4.2% |
| 90 or more Minutes | 70 | 1.5% |
Commute Time by Sex in Sac County
The most common commute times in Sac County are 5 to 9 minutes (445 commuters, 17.5%) for males and 5 to 9 minutes (444 commuters, 21.2%) for females.
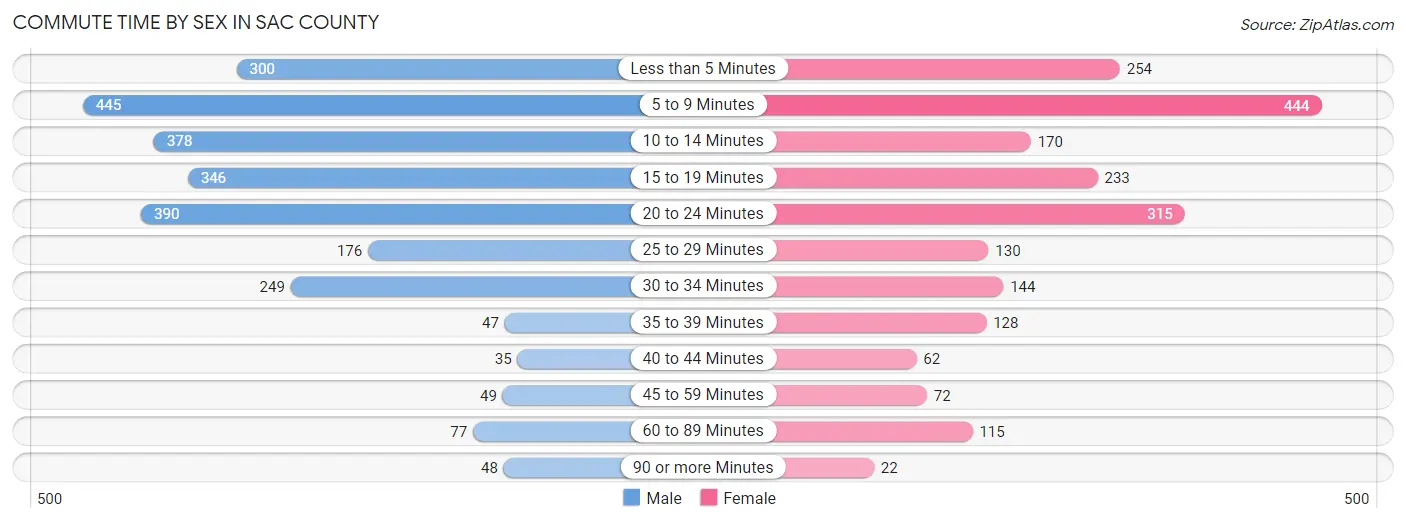
| Commute Time | Male | Female |
| Less than 5 Minutes | 300 (11.8%) | 254 (12.2%) |
| 5 to 9 Minutes | 445 (17.5%) | 444 (21.2%) |
| 10 to 14 Minutes | 378 (14.9%) | 170 (8.1%) |
| 15 to 19 Minutes | 346 (13.6%) | 233 (11.2%) |
| 20 to 24 Minutes | 390 (15.3%) | 315 (15.1%) |
| 25 to 29 Minutes | 176 (6.9%) | 130 (6.2%) |
| 30 to 34 Minutes | 249 (9.8%) | 144 (6.9%) |
| 35 to 39 Minutes | 47 (1.8%) | 128 (6.1%) |
| 40 to 44 Minutes | 35 (1.4%) | 62 (3.0%) |
| 45 to 59 Minutes | 49 (1.9%) | 72 (3.5%) |
| 60 to 89 Minutes | 77 (3.0%) | 115 (5.5%) |
| 90 or more Minutes | 48 (1.9%) | 22 (1.1%) |
Time of Departure to Work by Sex in Sac County
The most frequent times of departure to work in Sac County are 7:00 AM to 7:29 AM (377, 14.8%) for males and 7:30 AM to 7:59 AM (479, 22.9%) for females.
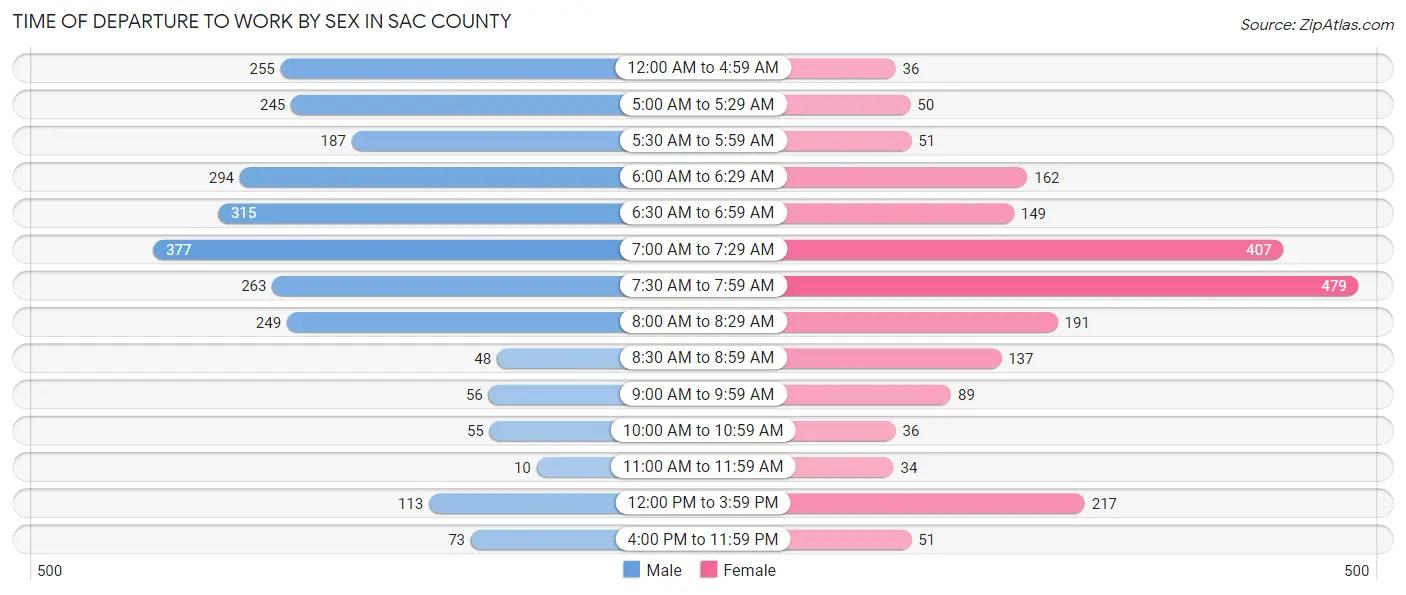
| Time of Departure | Male | Female |
| 12:00 AM to 4:59 AM | 255 (10.0%) | 36 (1.7%) |
| 5:00 AM to 5:29 AM | 245 (9.7%) | 50 (2.4%) |
| 5:30 AM to 5:59 AM | 187 (7.4%) | 51 (2.4%) |
| 6:00 AM to 6:29 AM | 294 (11.6%) | 162 (7.7%) |
| 6:30 AM to 6:59 AM | 315 (12.4%) | 149 (7.1%) |
| 7:00 AM to 7:29 AM | 377 (14.8%) | 407 (19.5%) |
| 7:30 AM to 7:59 AM | 263 (10.3%) | 479 (22.9%) |
| 8:00 AM to 8:29 AM | 249 (9.8%) | 191 (9.1%) |
| 8:30 AM to 8:59 AM | 48 (1.9%) | 137 (6.6%) |
| 9:00 AM to 9:59 AM | 56 (2.2%) | 89 (4.3%) |
| 10:00 AM to 10:59 AM | 55 (2.2%) | 36 (1.7%) |
| 11:00 AM to 11:59 AM | 10 (0.4%) | 34 (1.6%) |
| 12:00 PM to 3:59 PM | 113 (4.4%) | 217 (10.4%) |
| 4:00 PM to 11:59 PM | 73 (2.9%) | 51 (2.4%) |
| Total | 2,540 (100.0%) | 2,089 (100.0%) |
Housing Occupancy in Sac County
Occupancy by Ownership in Sac County
Of the total 4,210 dwellings in Sac County, owner-occupied units account for 3,403 (80.8%), while renter-occupied units make up 807 (19.2%).
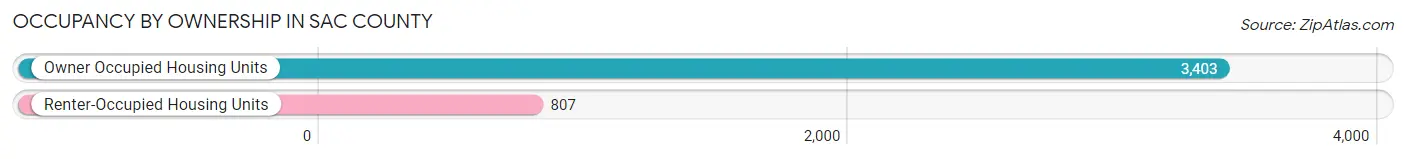
| Occupancy | # Housing Units | % Housing Units |
| Owner Occupied Housing Units | 3,403 | 80.8% |
| Renter-Occupied Housing Units | 807 | 19.2% |
| Total Occupied Housing Units | 4,210 | 100.0% |
Occupancy by Household Size in Sac County
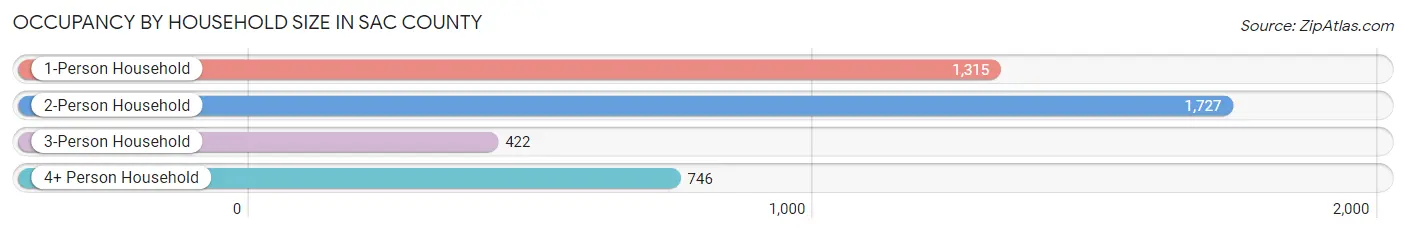
| Household Size | # Housing Units | % Housing Units |
| 1-Person Household | 1,315 | 31.2% |
| 2-Person Household | 1,727 | 41.0% |
| 3-Person Household | 422 | 10.0% |
| 4+ Person Household | 746 | 17.7% |
| Total Housing Units | 4,210 | 100.0% |
Occupancy by Ownership by Household Size in Sac County
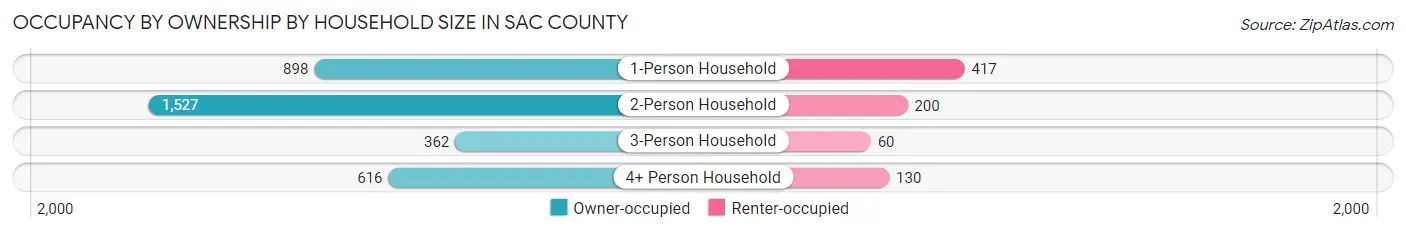
| Household Size | Owner-occupied | Renter-occupied |
| 1-Person Household | 898 (68.3%) | 417 (31.7%) |
| 2-Person Household | 1,527 (88.4%) | 200 (11.6%) |
| 3-Person Household | 362 (85.8%) | 60 (14.2%) |
| 4+ Person Household | 616 (82.6%) | 130 (17.4%) |
| Total Housing Units | 3,403 (80.8%) | 807 (19.2%) |
Occupancy by Educational Attainment in Sac County
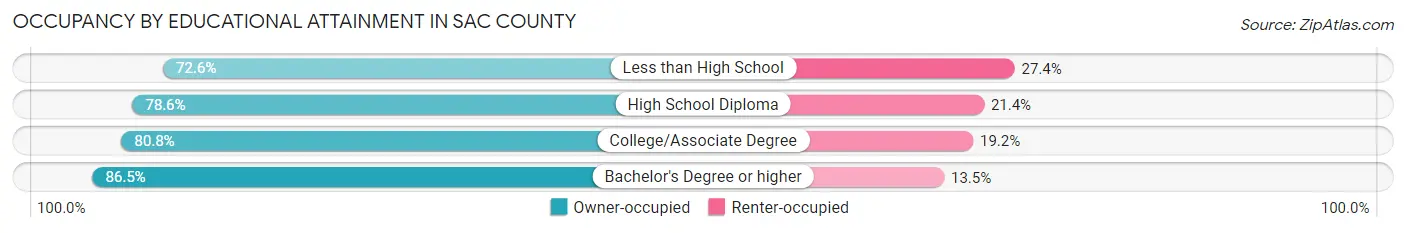
| Household Size | Owner-occupied | Renter-occupied |
| Less than High School | 193 (72.6%) | 73 (27.4%) |
| High School Diploma | 1,089 (78.6%) | 296 (21.4%) |
| College/Associate Degree | 1,317 (80.8%) | 313 (19.2%) |
| Bachelor's Degree or higher | 804 (86.5%) | 125 (13.5%) |
Occupancy by Age of Householder in Sac County
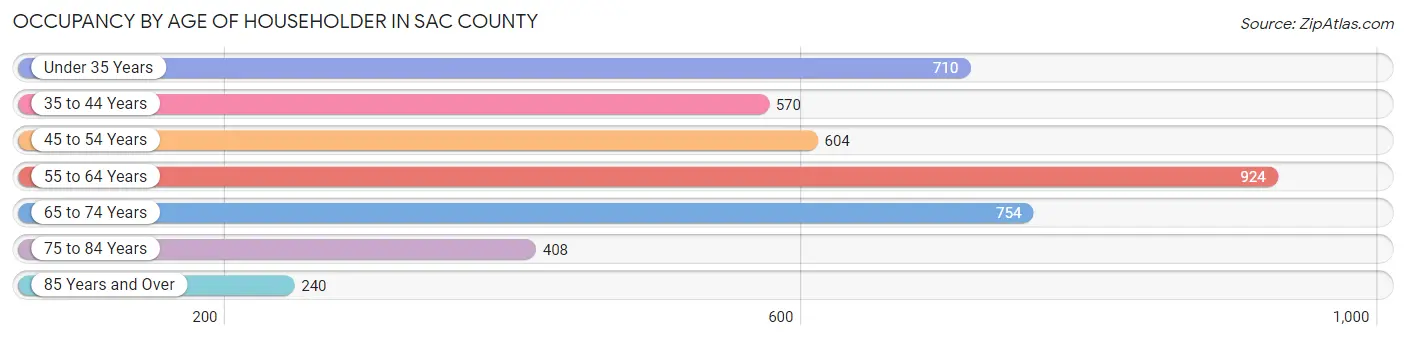
| Age Bracket | # Households | % Households |
| Under 35 Years | 710 | 16.9% |
| 35 to 44 Years | 570 | 13.5% |
| 45 to 54 Years | 604 | 14.3% |
| 55 to 64 Years | 924 | 22.0% |
| 65 to 74 Years | 754 | 17.9% |
| 75 to 84 Years | 408 | 9.7% |
| 85 Years and Over | 240 | 5.7% |
| Total | 4,210 | 100.0% |
Housing Finances in Sac County
Median Income by Occupancy in Sac County
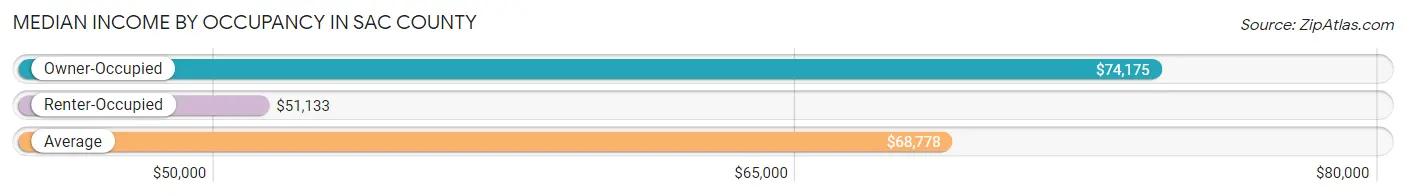
| Occupancy Type | # Households | Median Income |
| Owner-Occupied | 3,403 (80.8%) | $74,175 |
| Renter-Occupied | 807 (19.2%) | $51,133 |
| Average | 4,210 (100.0%) | $68,778 |
Occupancy by Householder Income Bracket in Sac County
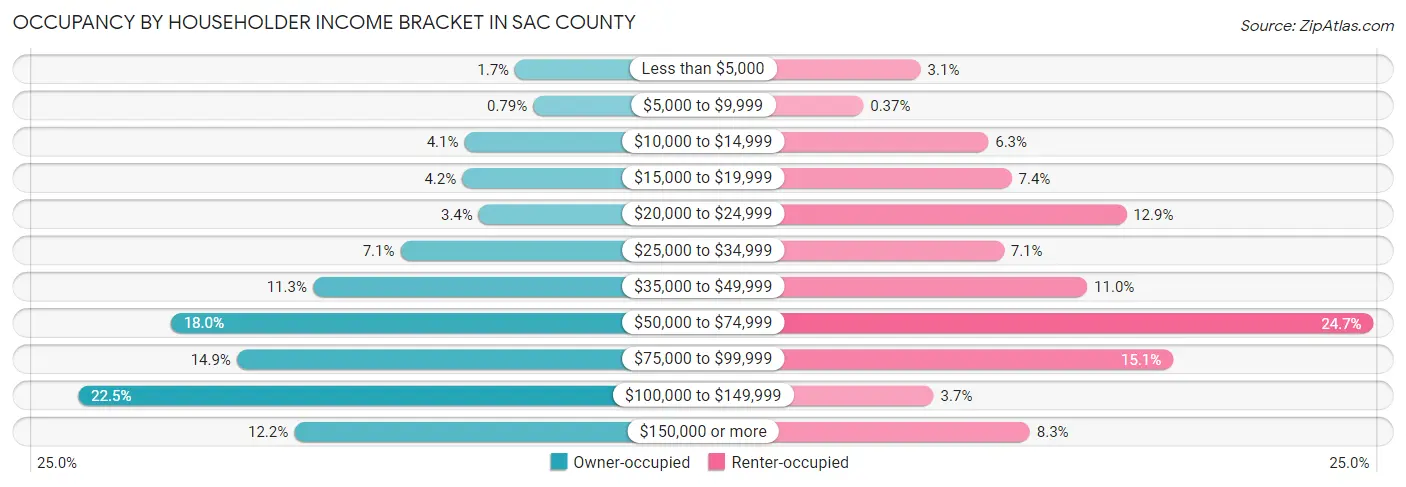
| Income Bracket | Owner-occupied | Renter-occupied |
| Less than $5,000 | 56 (1.7%) | 25 (3.1%) |
| $5,000 to $9,999 | 27 (0.8%) | 3 (0.4%) |
| $10,000 to $14,999 | 138 (4.1%) | 51 (6.3%) |
| $15,000 to $19,999 | 142 (4.2%) | 60 (7.4%) |
| $20,000 to $24,999 | 115 (3.4%) | 104 (12.9%) |
| $25,000 to $34,999 | 242 (7.1%) | 57 (7.1%) |
| $35,000 to $49,999 | 384 (11.3%) | 89 (11.0%) |
| $50,000 to $74,999 | 614 (18.0%) | 199 (24.7%) |
| $75,000 to $99,999 | 507 (14.9%) | 122 (15.1%) |
| $100,000 to $149,999 | 764 (22.5%) | 30 (3.7%) |
| $150,000 or more | 414 (12.2%) | 67 (8.3%) |
| Total | 3,403 (100.0%) | 807 (100.0%) |
Monthly Housing Cost Tiers in Sac County
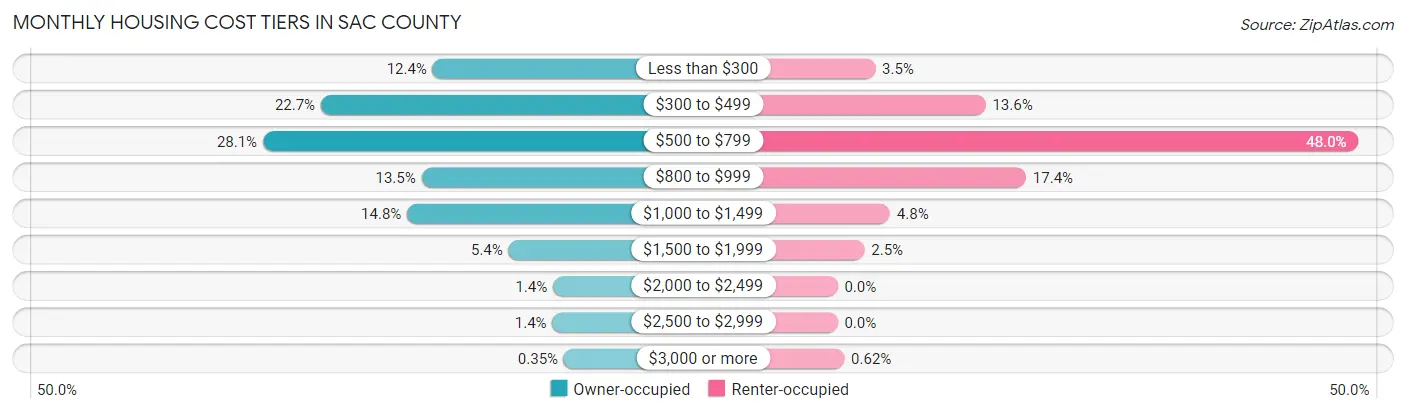
| Monthly Cost | Owner-occupied | Renter-occupied |
| Less than $300 | 423 (12.4%) | 28 (3.5%) |
| $300 to $499 | 773 (22.7%) | 110 (13.6%) |
| $500 to $799 | 955 (28.1%) | 387 (48.0%) |
| $800 to $999 | 458 (13.5%) | 140 (17.3%) |
| $1,000 to $1,499 | 503 (14.8%) | 39 (4.8%) |
| $1,500 to $1,999 | 185 (5.4%) | 20 (2.5%) |
| $2,000 to $2,499 | 46 (1.3%) | 0 (0.0%) |
| $2,500 to $2,999 | 48 (1.4%) | 0 (0.0%) |
| $3,000 or more | 12 (0.4%) | 5 (0.6%) |
| Total | 3,403 (100.0%) | 807 (100.0%) |
Physical Housing Characteristics in Sac County
Housing Structures in Sac County
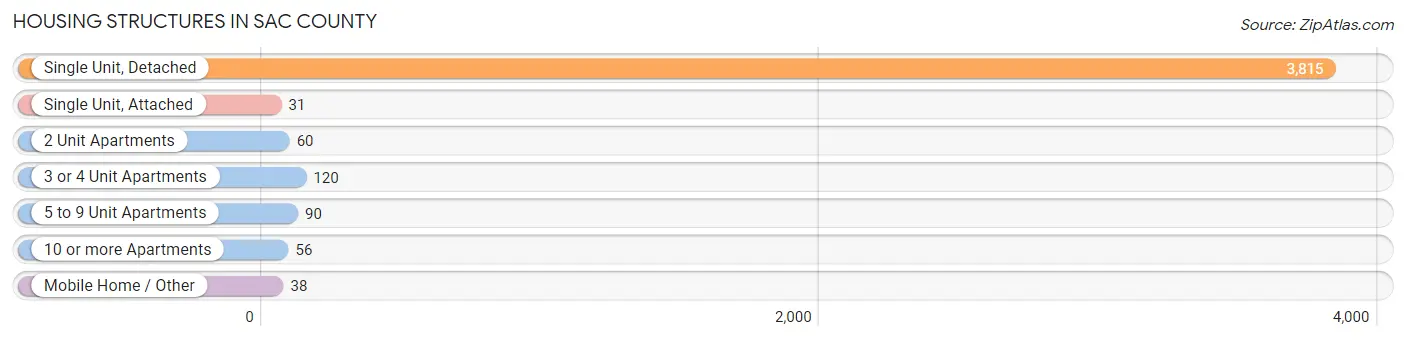
| Structure Type | # Housing Units | % Housing Units |
| Single Unit, Detached | 3,815 | 90.6% |
| Single Unit, Attached | 31 | 0.7% |
| 2 Unit Apartments | 60 | 1.4% |
| 3 or 4 Unit Apartments | 120 | 2.9% |
| 5 to 9 Unit Apartments | 90 | 2.1% |
| 10 or more Apartments | 56 | 1.3% |
| Mobile Home / Other | 38 | 0.9% |
| Total | 4,210 | 100.0% |
Housing Structures by Occupancy in Sac County
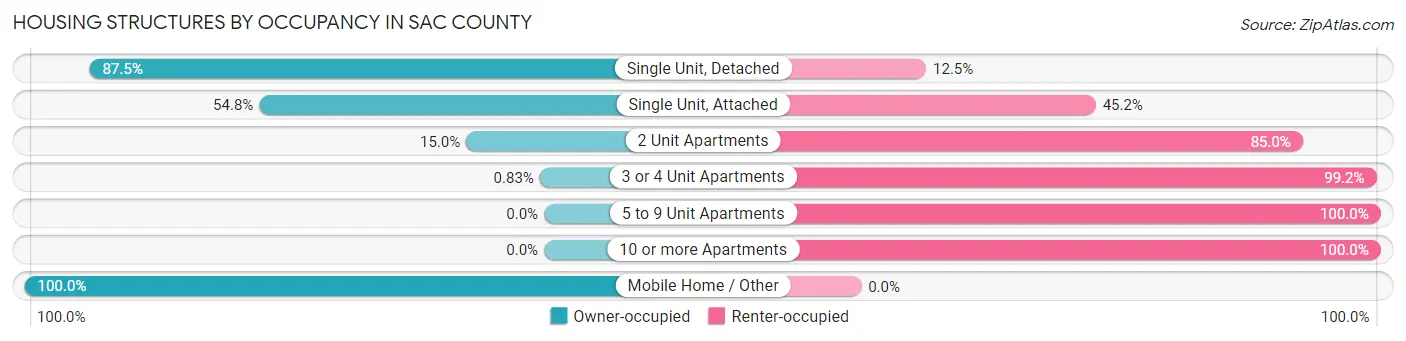
| Structure Type | Owner-occupied | Renter-occupied |
| Single Unit, Detached | 3,338 (87.5%) | 477 (12.5%) |
| Single Unit, Attached | 17 (54.8%) | 14 (45.2%) |
| 2 Unit Apartments | 9 (15.0%) | 51 (85.0%) |
| 3 or 4 Unit Apartments | 1 (0.8%) | 119 (99.2%) |
| 5 to 9 Unit Apartments | 0 (0.0%) | 90 (100.0%) |
| 10 or more Apartments | 0 (0.0%) | 56 (100.0%) |
| Mobile Home / Other | 38 (100.0%) | 0 (0.0%) |
| Total | 3,403 (80.8%) | 807 (19.2%) |
Housing Structures by Number of Rooms in Sac County
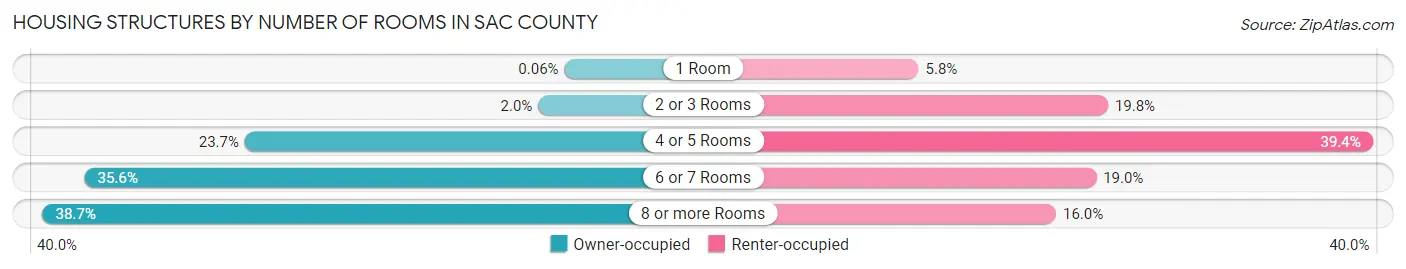
| Number of Rooms | Owner-occupied | Renter-occupied |
| 1 Room | 2 (0.1%) | 47 (5.8%) |
| 2 or 3 Rooms | 68 (2.0%) | 160 (19.8%) |
| 4 or 5 Rooms | 807 (23.7%) | 318 (39.4%) |
| 6 or 7 Rooms | 1,210 (35.6%) | 153 (19.0%) |
| 8 or more Rooms | 1,316 (38.7%) | 129 (16.0%) |
| Total | 3,403 (100.0%) | 807 (100.0%) |
Housing Structure by Heating Type in Sac County
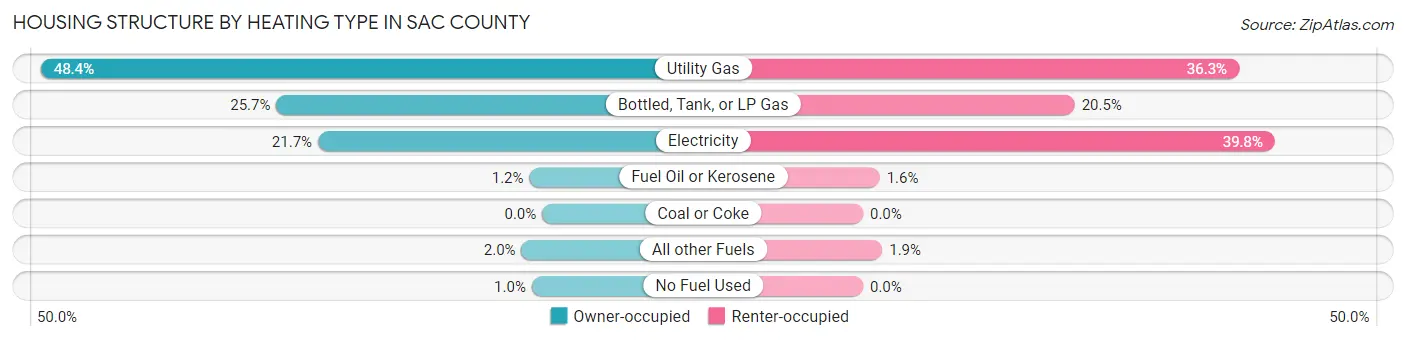
| Heating Type | Owner-occupied | Renter-occupied |
| Utility Gas | 1,648 (48.4%) | 293 (36.3%) |
| Bottled, Tank, or LP Gas | 874 (25.7%) | 165 (20.4%) |
| Electricity | 737 (21.7%) | 321 (39.8%) |
| Fuel Oil or Kerosene | 42 (1.2%) | 13 (1.6%) |
| Coal or Coke | 0 (0.0%) | 0 (0.0%) |
| All other Fuels | 68 (2.0%) | 15 (1.9%) |
| No Fuel Used | 34 (1.0%) | 0 (0.0%) |
| Total | 3,403 (100.0%) | 807 (100.0%) |
Household Vehicle Usage in Sac County
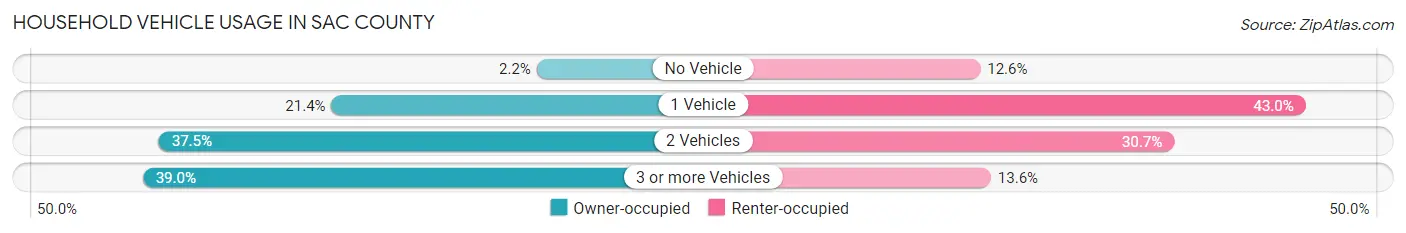
| Vehicles per Household | Owner-occupied | Renter-occupied |
| No Vehicle | 75 (2.2%) | 102 (12.6%) |
| 1 Vehicle | 727 (21.4%) | 347 (43.0%) |
| 2 Vehicles | 1,275 (37.5%) | 248 (30.7%) |
| 3 or more Vehicles | 1,326 (39.0%) | 110 (13.6%) |
| Total | 3,403 (100.0%) | 807 (100.0%) |
Real Estate & Mortgages in Sac County
Real Estate and Mortgage Overview in Sac County
| Characteristic | Without Mortgage | With Mortgage |
| Housing Units | 2,071 | 1,332 |
| Median Property Value | $118,400 | $120,900 |
| Median Household Income | $67,064 | $171 |
| Monthly Housing Costs | $461 | $12 |
| Real Estate Taxes | $1,275 | $13 |
Property Value by Mortgage Status in Sac County
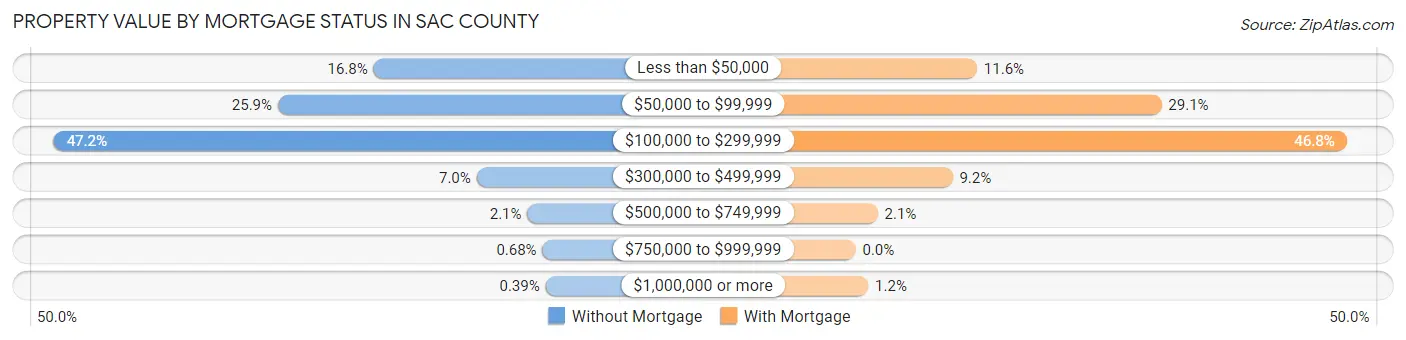
| Property Value | Without Mortgage | With Mortgage |
| Less than $50,000 | 347 (16.8%) | 154 (11.6%) |
| $50,000 to $99,999 | 536 (25.9%) | 388 (29.1%) |
| $100,000 to $299,999 | 978 (47.2%) | 623 (46.8%) |
| $300,000 to $499,999 | 144 (7.0%) | 123 (9.2%) |
| $500,000 to $749,999 | 44 (2.1%) | 28 (2.1%) |
| $750,000 to $999,999 | 14 (0.7%) | 0 (0.0%) |
| $1,000,000 or more | 8 (0.4%) | 16 (1.2%) |
| Total | 2,071 (100.0%) | 1,332 (100.0%) |
Household Income by Mortgage Status in Sac County
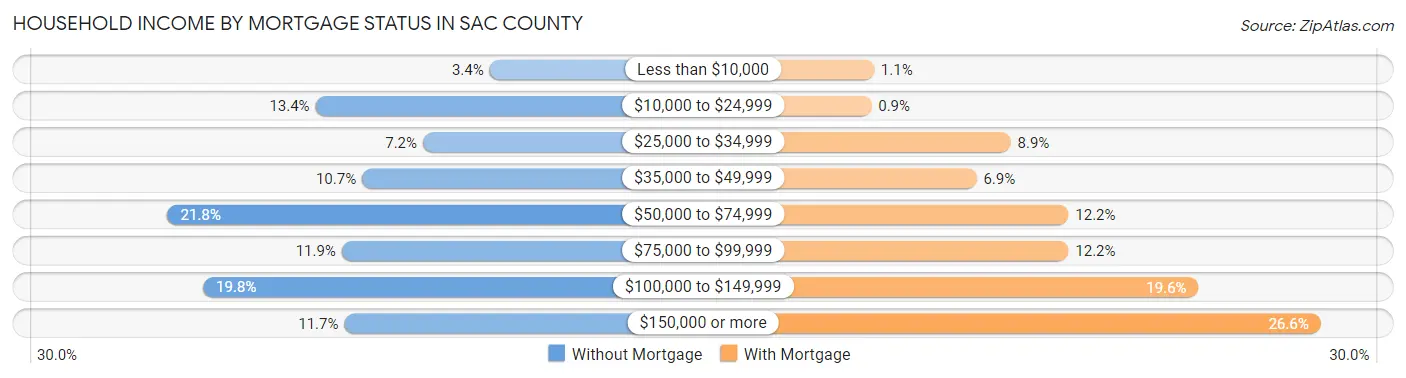
| Household Income | Without Mortgage | With Mortgage |
| Less than $10,000 | 71 (3.4%) | 14 (1.1%) |
| $10,000 to $24,999 | 277 (13.4%) | 12 (0.9%) |
| $25,000 to $34,999 | 150 (7.2%) | 118 (8.9%) |
| $35,000 to $49,999 | 222 (10.7%) | 92 (6.9%) |
| $50,000 to $74,999 | 452 (21.8%) | 162 (12.2%) |
| $75,000 to $99,999 | 246 (11.9%) | 162 (12.2%) |
| $100,000 to $149,999 | 410 (19.8%) | 261 (19.6%) |
| $150,000 or more | 243 (11.7%) | 354 (26.6%) |
| Total | 2,071 (100.0%) | 1,332 (100.0%) |
Property Value to Household Income Ratio in Sac County
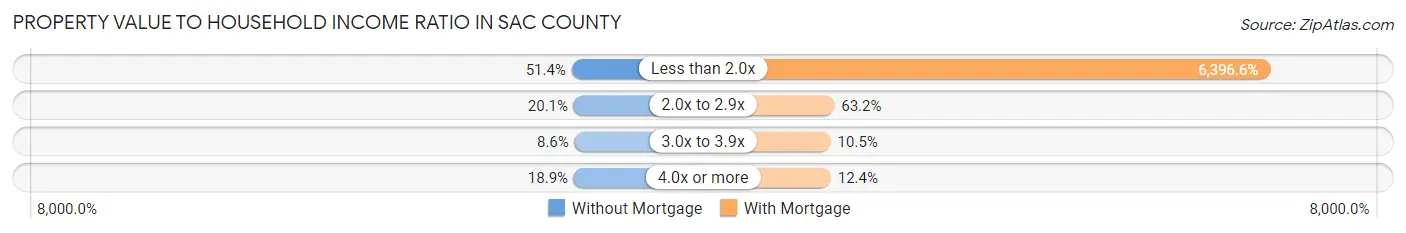
| Value-to-Income Ratio | Without Mortgage | With Mortgage |
| Less than 2.0x | 1,064 (51.4%) | 85,203 (6,396.6%) |
| 2.0x to 2.9x | 417 (20.1%) | 842 (63.2%) |
| 3.0x to 3.9x | 177 (8.6%) | 140 (10.5%) |
| 4.0x or more | 392 (18.9%) | 165 (12.4%) |
| Total | 2,071 (100.0%) | 1,332 (100.0%) |
Real Estate Taxes by Mortgage Status in Sac County
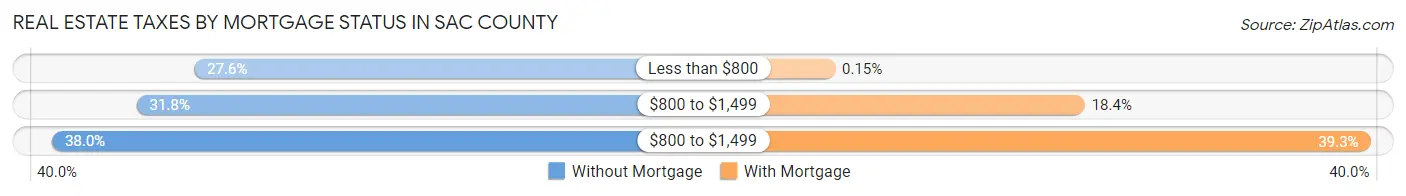
| Property Taxes | Without Mortgage | With Mortgage |
| Less than $800 | 572 (27.6%) | 2 (0.2%) |
| $800 to $1,499 | 659 (31.8%) | 245 (18.4%) |
| $800 to $1,499 | 787 (38.0%) | 523 (39.3%) |
| Total | 2,071 (100.0%) | 1,332 (100.0%) |
Health & Disability in Sac County
Health Insurance Coverage by Age in Sac County
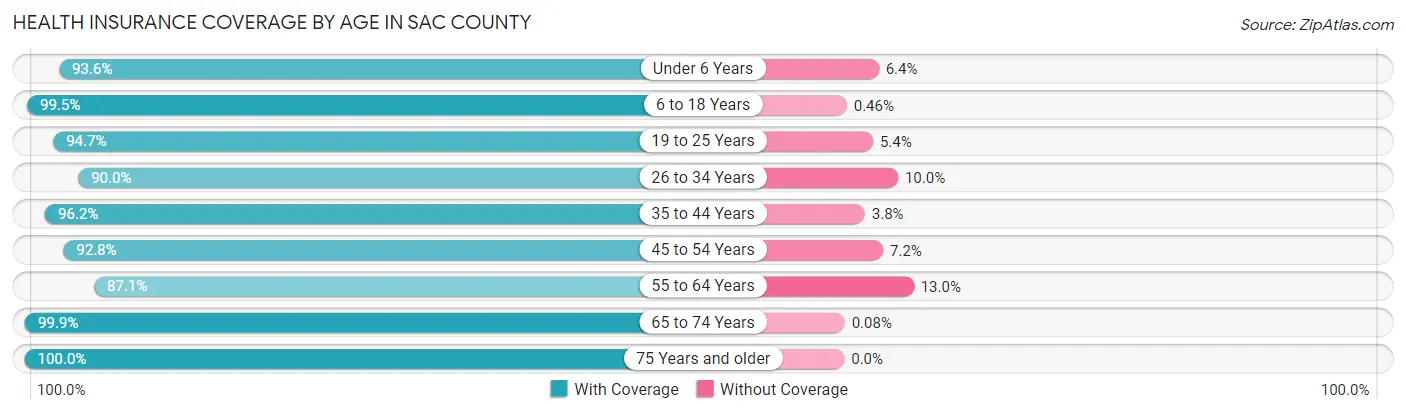
| Age Bracket | With Coverage | Without Coverage |
| Under 6 Years | 656 (93.6%) | 45 (6.4%) |
| 6 to 18 Years | 1,512 (99.5%) | 7 (0.5%) |
| 19 to 25 Years | 654 (94.7%) | 37 (5.3%) |
| 26 to 34 Years | 863 (90.0%) | 96 (10.0%) |
| 35 to 44 Years | 954 (96.2%) | 38 (3.8%) |
| 45 to 54 Years | 988 (92.8%) | 77 (7.2%) |
| 55 to 64 Years | 1,324 (87.1%) | 197 (13.0%) |
| 65 to 74 Years | 1,243 (99.9%) | 1 (0.1%) |
| 75 Years and older | 914 (100.0%) | 0 (0.0%) |
| Total | 9,108 (94.8%) | 498 (5.2%) |
Health Insurance Coverage by Citizenship Status in Sac County
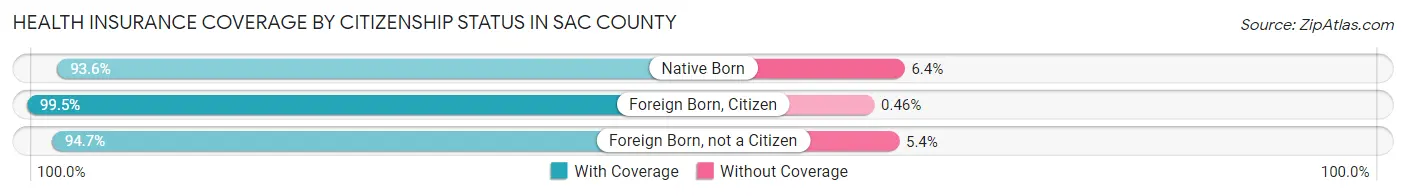
| Citizenship Status | With Coverage | Without Coverage |
| Native Born | 656 (93.6%) | 45 (6.4%) |
| Foreign Born, Citizen | 1,512 (99.5%) | 7 (0.5%) |
| Foreign Born, not a Citizen | 654 (94.7%) | 37 (5.3%) |
Health Insurance Coverage by Household Income in Sac County
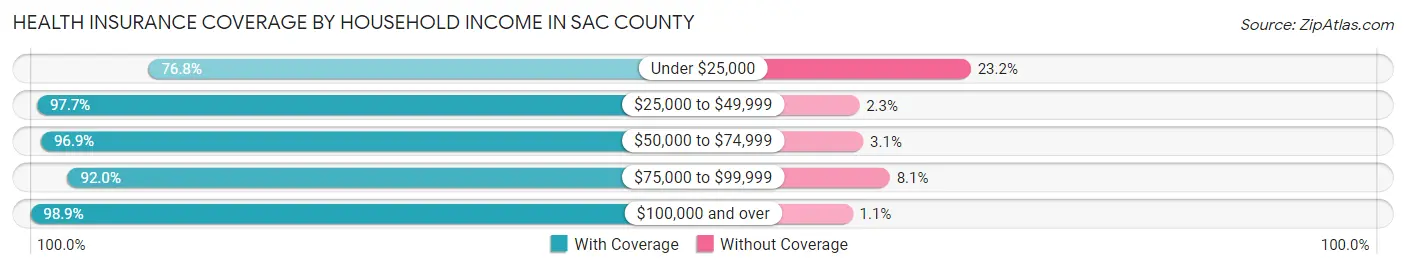
| Household Income | With Coverage | Without Coverage |
| Under $25,000 | 810 (76.8%) | 245 (23.2%) |
| $25,000 to $49,999 | 1,513 (97.7%) | 36 (2.3%) |
| $50,000 to $74,999 | 1,769 (96.9%) | 56 (3.1%) |
| $75,000 to $99,999 | 1,383 (91.9%) | 121 (8.1%) |
| $100,000 and over | 3,616 (98.9%) | 40 (1.1%) |
Public vs Private Health Insurance Coverage by Age in Sac County
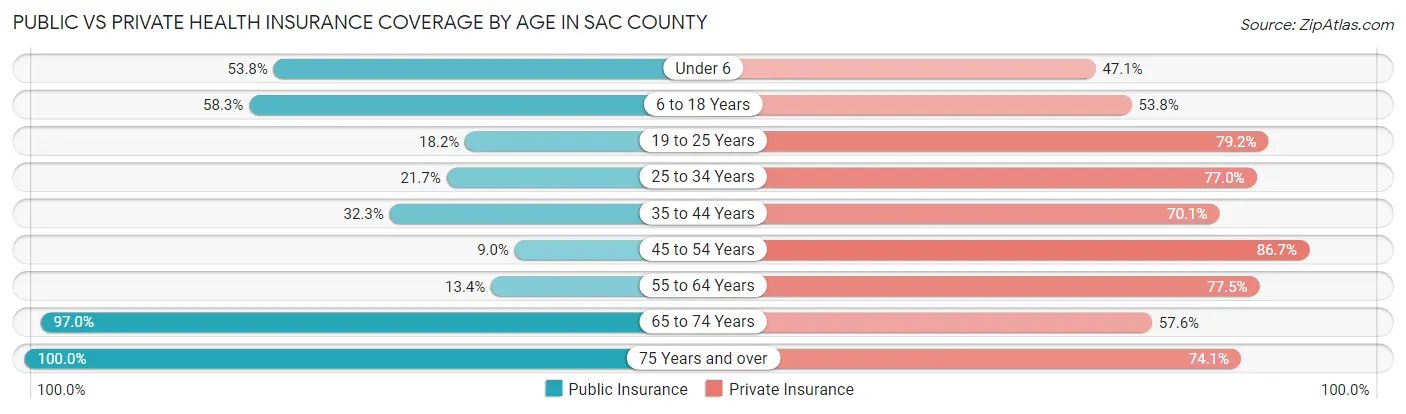
| Age Bracket | Public Insurance | Private Insurance |
| Under 6 | 377 (53.8%) | 330 (47.1%) |
| 6 to 18 Years | 886 (58.3%) | 817 (53.8%) |
| 19 to 25 Years | 126 (18.2%) | 547 (79.2%) |
| 25 to 34 Years | 208 (21.7%) | 738 (77.0%) |
| 35 to 44 Years | 320 (32.3%) | 695 (70.1%) |
| 45 to 54 Years | 96 (9.0%) | 923 (86.7%) |
| 55 to 64 Years | 204 (13.4%) | 1,179 (77.5%) |
| 65 to 74 Years | 1,207 (97.0%) | 716 (57.6%) |
| 75 Years and over | 914 (100.0%) | 677 (74.1%) |
| Total | 4,338 (45.2%) | 6,622 (68.9%) |
Disability Status by Sex by Age in Sac County
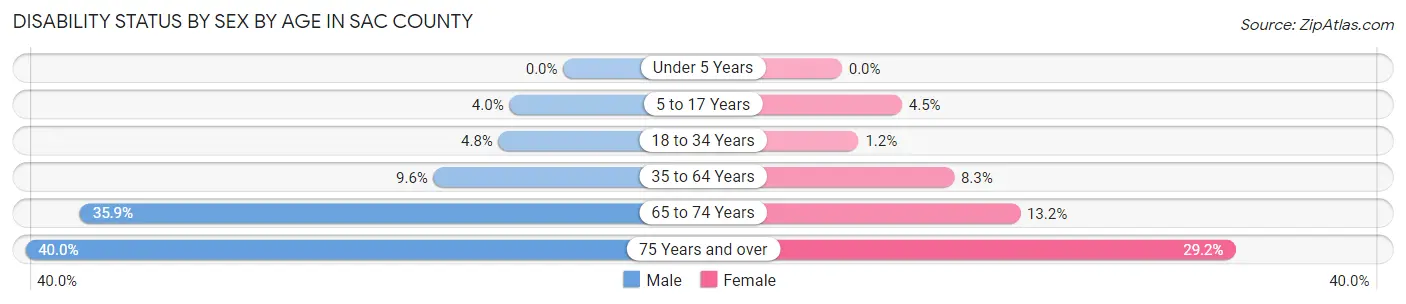
| Age Bracket | Male | Female |
| Under 5 Years | 0 (0.0%) | 0 (0.0%) |
| 5 to 17 Years | 33 (4.0%) | 34 (4.5%) |
| 18 to 34 Years | 43 (4.8%) | 10 (1.2%) |
| 35 to 64 Years | 177 (9.6%) | 145 (8.3%) |
| 65 to 74 Years | 224 (35.9%) | 82 (13.2%) |
| 75 Years and over | 149 (40.0%) | 158 (29.2%) |
Disability Class by Sex by Age in Sac County
Disability Class: Hearing Difficulty
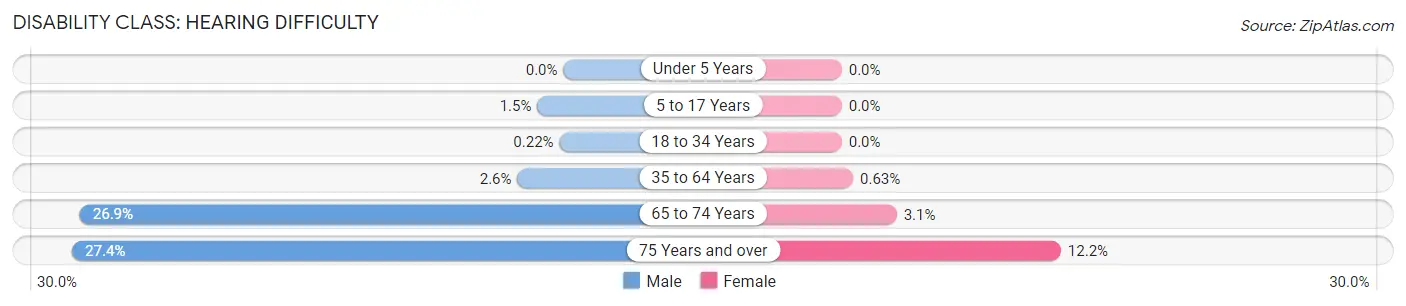
| Age Bracket | Male | Female |
| Under 5 Years | 0 (0.0%) | 0 (0.0%) |
| 5 to 17 Years | 12 (1.5%) | 0 (0.0%) |
| 18 to 34 Years | 2 (0.2%) | 0 (0.0%) |
| 35 to 64 Years | 47 (2.6%) | 11 (0.6%) |
| 65 to 74 Years | 168 (26.9%) | 19 (3.1%) |
| 75 Years and over | 102 (27.4%) | 66 (12.2%) |
Disability Class: Vision Difficulty
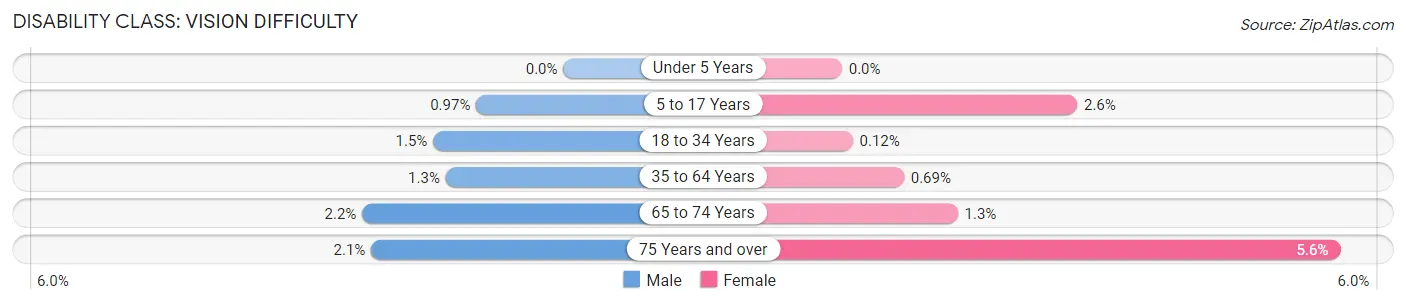
| Age Bracket | Male | Female |
| Under 5 Years | 0 (0.0%) | 0 (0.0%) |
| 5 to 17 Years | 8 (1.0%) | 20 (2.6%) |
| 18 to 34 Years | 13 (1.5%) | 1 (0.1%) |
| 35 to 64 Years | 24 (1.3%) | 12 (0.7%) |
| 65 to 74 Years | 14 (2.2%) | 8 (1.3%) |
| 75 Years and over | 8 (2.1%) | 30 (5.6%) |
Disability Class: Cognitive Difficulty
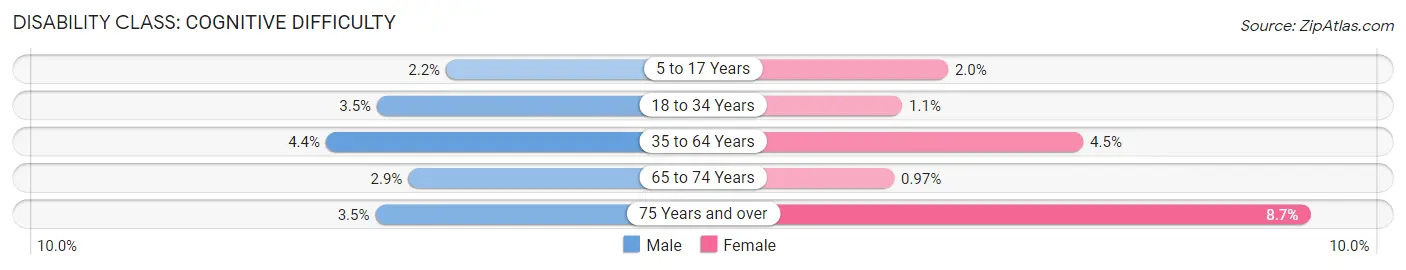
| Age Bracket | Male | Female |
| 5 to 17 Years | 18 (2.2%) | 15 (2.0%) |
| 18 to 34 Years | 31 (3.5%) | 9 (1.1%) |
| 35 to 64 Years | 81 (4.4%) | 78 (4.5%) |
| 65 to 74 Years | 18 (2.9%) | 6 (1.0%) |
| 75 Years and over | 13 (3.5%) | 47 (8.7%) |
Disability Class: Ambulatory Difficulty
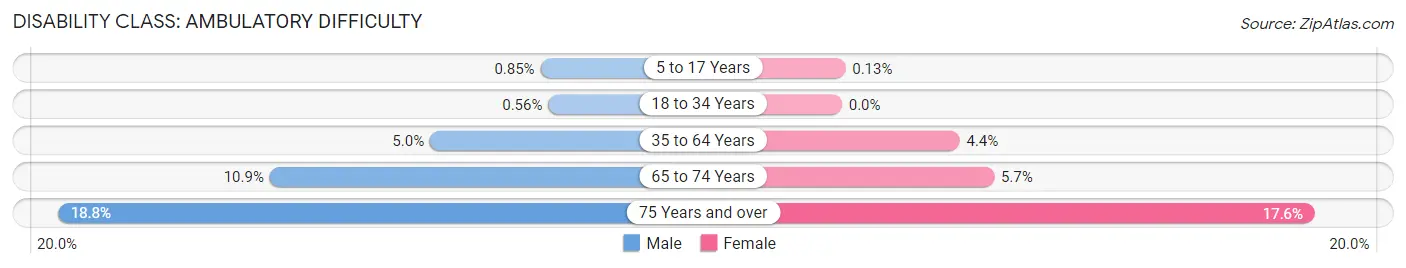
| Age Bracket | Male | Female |
| 5 to 17 Years | 7 (0.9%) | 1 (0.1%) |
| 18 to 34 Years | 5 (0.6%) | 0 (0.0%) |
| 35 to 64 Years | 91 (5.0%) | 76 (4.4%) |
| 65 to 74 Years | 68 (10.9%) | 35 (5.7%) |
| 75 Years and over | 70 (18.8%) | 95 (17.6%) |
Disability Class: Self-Care Difficulty
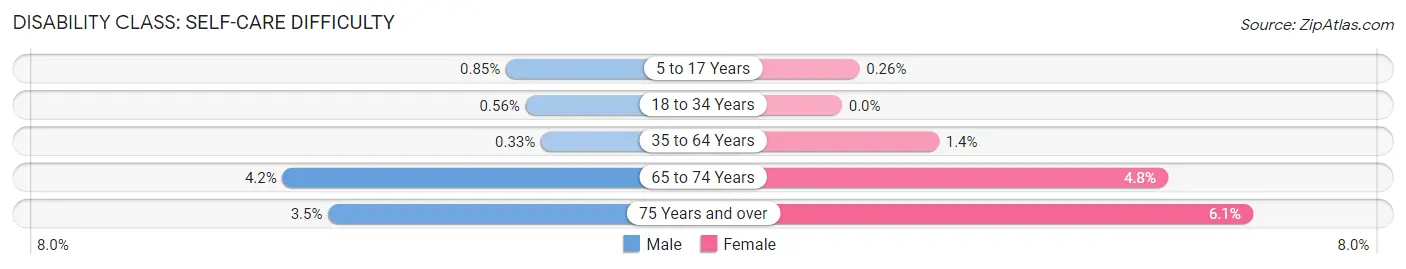
| Age Bracket | Male | Female |
| 5 to 17 Years | 7 (0.9%) | 2 (0.3%) |
| 18 to 34 Years | 5 (0.6%) | 0 (0.0%) |
| 35 to 64 Years | 6 (0.3%) | 25 (1.4%) |
| 65 to 74 Years | 26 (4.2%) | 30 (4.8%) |
| 75 Years and over | 13 (3.5%) | 33 (6.1%) |
Technology Access in Sac County
Computing Device Access in Sac County
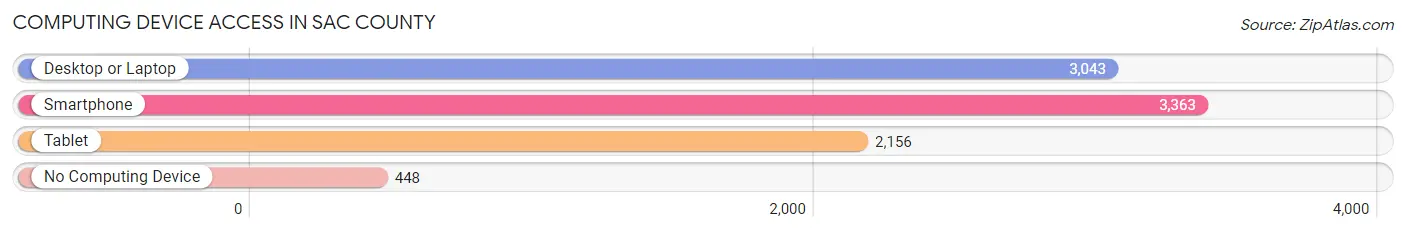
| Device Type | # Households | % Households |
| Desktop or Laptop | 3,043 | 72.3% |
| Smartphone | 3,363 | 79.9% |
| Tablet | 2,156 | 51.2% |
| No Computing Device | 448 | 10.6% |
| Total | 4,210 | 100.0% |
Internet Access in Sac County
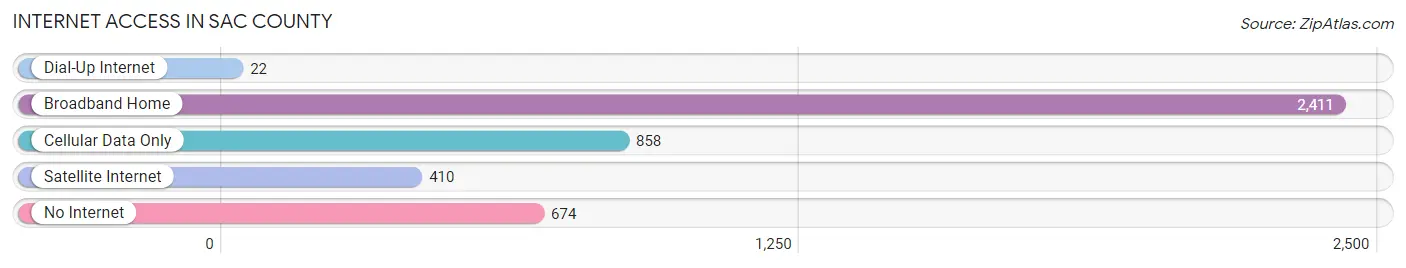
| Internet Type | # Households | % Households |
| Dial-Up Internet | 22 | 0.5% |
| Broadband Home | 2,411 | 57.3% |
| Cellular Data Only | 858 | 20.4% |
| Satellite Internet | 410 | 9.7% |
| No Internet | 674 | 16.0% |
| Total | 4,210 | 100.0% |
Sac County Summary
Sac County, Iowa is located in the northwest corner of the state and is part of the Sioux City metropolitan area. It is bordered by Plymouth County to the north, Woodbury County to the east, Monona County to the south, and Ida County to the west. The county seat is Sac City, and the county is named after the Sac and Fox Native American tribes.
History
Sac County was established in 1851 and was originally part of Woodbury County. It was named after the Sac and Fox Native American tribes, who had inhabited the area for centuries prior to European settlement. The first settlers arrived in the area in the late 1840s and early 1850s, and the county was officially organized in 1851.
The county was largely agricultural in its early years, with the majority of the population living in rural areas. The first railroad line was built in 1872, connecting Sac City to Sioux City. This allowed for the development of the county’s first industries, including a flour mill, a brickyard, and a sawmill.
In the late 19th and early 20th centuries, the county experienced a period of rapid growth. The population increased from 4,000 in 1880 to over 10,000 by 1910. This growth was largely due to the influx of immigrants from Europe, particularly from Germany and Scandinavia.
Geography
Sac County covers an area of 576 square miles and is located in the northwest corner of Iowa. It is bordered by Plymouth County to the north, Woodbury County to the east, Monona County to the south, and Ida County to the west. The county is largely rural, with the majority of the population living in small towns and rural areas.
The county is located in the Loess Hills region of Iowa, which is characterized by rolling hills and deep ravines. The county is drained by the West Nishnabotna River, which flows through the county from north to south. The county is also home to several small lakes, including Lake View, Silver Lake, and Lake Icaria.
Economy
Sac County’s economy is largely based on agriculture. The county is home to a number of large farms, which produce corn, soybeans, and other crops. The county is also home to several large livestock operations, which produce beef, pork, and dairy products.
In addition to agriculture, the county is home to several manufacturing companies, including a furniture manufacturer, a plastics manufacturer, and a metal fabrication company. The county is also home to several retail businesses, including grocery stores, hardware stores, and clothing stores.
Demographics
As of the 2010 census, the population of Sac County was 10,350. The population is largely white (94.3%), with small percentages of African Americans (2.2%), Hispanics (1.7%), and Asians (0.7%). The median household income is $45,845, and the median home value is $117,400.
The county is home to several small towns, including Sac City (population 2,845), Lake View (population 1,092), and Early (population 845). The county seat is Sac City, which is the largest town in the county. The county is also home to several unincorporated communities, including Silver Lake, Lake Icaria, and Varina.
Common Questions
What is Per Capita Income in Sac County?
Per Capita income in Sac County is $38,596.
What is the Median Family Income in Sac County?
Median Family Income in Sac County is $87,162.
What is the Median Household income in Sac County?
Median Household Income in Sac County is $68,778.
What is Income or Wage Gap in Sac County?
Income or Wage Gap in Sac County is 34.0%.
Women in Sac County earn 66.0 cents for every dollar earned by a man.
What is Family Income Deficit in Sac County?
Family Income Deficit in Sac County is $8,370.
Families that are below poverty line in Sac County earn $8,370 less on average than the poverty threshold level.
What is Inequality or Gini Index in Sac County?
Inequality or Gini Index in Sac County is 0.44.
What is the Total Population of Sac County?
Total Population of Sac County is 9,778.
What is the Total Male Population of Sac County?
Total Male Population of Sac County is 4,938.
What is the Total Female Population of Sac County?
Total Female Population of Sac County is 4,840.
What is the Ratio of Males per 100 Females in Sac County?
There are 102.02 Males per 100 Females in Sac County.
What is the Ratio of Females per 100 Males in Sac County?
There are 98.02 Females per 100 Males in Sac County.
What is the Median Population Age in Sac County?
Median Population Age in Sac County is 45.2 Years.
What is the Average Family Size in Sac County
Average Family Size in Sac County is 2.8 People.
What is the Average Household Size in Sac County
Average Household Size in Sac County is 2.3 People.
How Large is the Labor Force in Sac County?
There are 5,117 People in the Labor Forcein in Sac County.
What is the Percentage of People in the Labor Force in Sac County?
65.3% of People are in the Labor Force in Sac County.
What is the Unemployment Rate in Sac County?
Unemployment Rate in Sac County is 3.2%.