O'Brien County, IA Map & Demographics
O'Brien County Overview
$32,460
PER CAPITA INCOME
$89,832
AVG FAMILY INCOME
$65,076
AVG HOUSEHOLD INCOME
51.3%
WAGE / INCOME GAP [ % ]
48.7¢/ $1
WAGE / INCOME GAP [ $ ]
0.40
INEQUALITY / GINI INDEX
14,138
TOTAL POPULATION
7,007
MALE POPULATION
7,131
FEMALE POPULATION
98.26
MALES / 100 FEMALES
101.77
FEMALES / 100 MALES
40.4
MEDIAN AGE
3.0
AVG FAMILY SIZE
2.4
AVG HOUSEHOLD SIZE
7,129
LABOR FORCE [ PEOPLE ]
64.0%
PERCENT IN LABOR FORCE
2.4%
UNEMPLOYMENT RATE
O'Brien County Area Codes
Income in O'Brien County
Income Overview in O'Brien County
Per Capita Income in O'Brien County is $32,460, while median incomes of families and households are $89,832 and $65,076 respectively.
| Characteristic | Number | Measure |
| Per Capita Income | 14,138 | $32,460 |
| Median Family Income | 3,578 | $89,832 |
| Mean Family Income | 3,578 | $96,615 |
| Median Household Income | 5,700 | $65,076 |
| Mean Household Income | 5,700 | $77,922 |
| Income Deficit | 3,578 | $0 |
| Wage / Income Gap (%) | 14,138 | 51.26% |
| Wage / Income Gap ($) | 14,138 | 48.74¢ per $1 |
| Gini / Inequality Index | 14,138 | 0.40 |
Earnings by Sex in O'Brien County
Average Earnings in O'Brien County are $40,000, $50,401 for men and $24,565 for women, a difference of 51.3%.
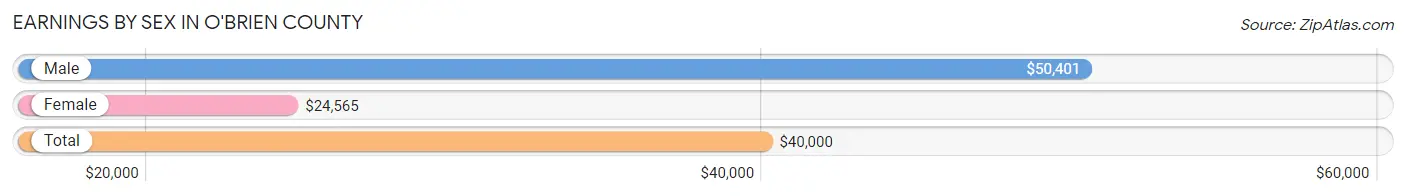
| Sex | Number | Average Earnings |
| Male | 4,229 (55.4%) | $50,401 |
| Female | 3,409 (44.6%) | $24,565 |
| Total | 7,638 (100.0%) | $40,000 |
Earnings by Sex by Income Bracket in O'Brien County
The most common earnings brackets in O'Brien County are $75,000 to $99,999 for men (579 | 13.7%) and $2,499 or less for women (374 | 11.0%).
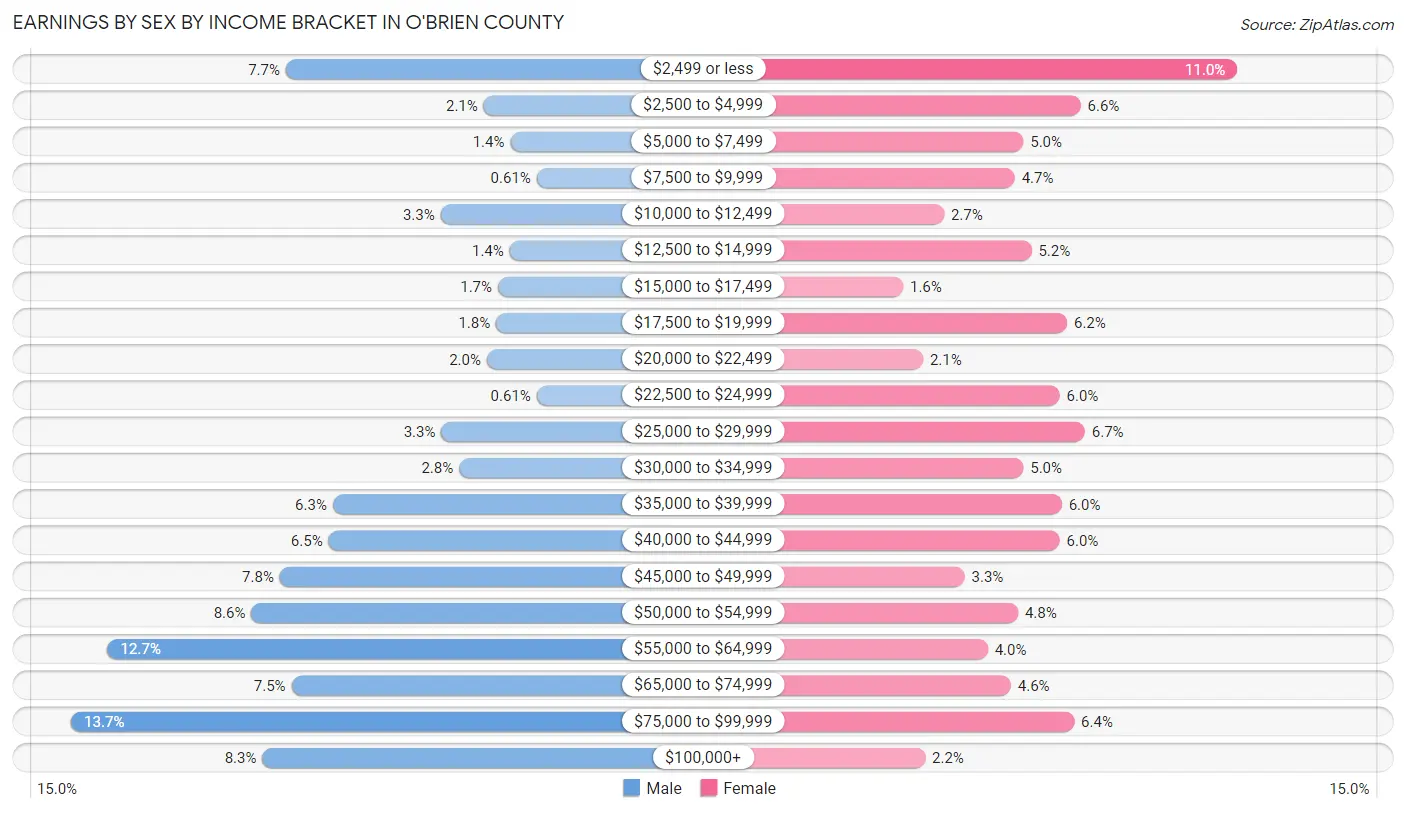
| Income | Male | Female |
| $2,499 or less | 324 (7.7%) | 374 (11.0%) |
| $2,500 to $4,999 | 89 (2.1%) | 224 (6.6%) |
| $5,000 to $7,499 | 57 (1.3%) | 169 (5.0%) |
| $7,500 to $9,999 | 26 (0.6%) | 161 (4.7%) |
| $10,000 to $12,499 | 140 (3.3%) | 93 (2.7%) |
| $12,500 to $14,999 | 58 (1.4%) | 177 (5.2%) |
| $15,000 to $17,499 | 72 (1.7%) | 54 (1.6%) |
| $17,500 to $19,999 | 74 (1.8%) | 211 (6.2%) |
| $20,000 to $22,499 | 85 (2.0%) | 73 (2.1%) |
| $22,500 to $24,999 | 26 (0.6%) | 204 (6.0%) |
| $25,000 to $29,999 | 139 (3.3%) | 228 (6.7%) |
| $30,000 to $34,999 | 118 (2.8%) | 169 (5.0%) |
| $35,000 to $39,999 | 268 (6.3%) | 206 (6.0%) |
| $40,000 to $44,999 | 273 (6.5%) | 204 (6.0%) |
| $45,000 to $49,999 | 331 (7.8%) | 113 (3.3%) |
| $50,000 to $54,999 | 365 (8.6%) | 164 (4.8%) |
| $55,000 to $64,999 | 536 (12.7%) | 135 (4.0%) |
| $65,000 to $74,999 | 317 (7.5%) | 157 (4.6%) |
| $75,000 to $99,999 | 579 (13.7%) | 218 (6.4%) |
| $100,000+ | 352 (8.3%) | 75 (2.2%) |
| Total | 4,229 (100.0%) | 3,409 (100.0%) |
Earnings by Sex by Educational Attainment in O'Brien County
Average earnings in O'Brien County are $52,656 for men and $29,802 for women, a difference of 43.4%. Men with an educational attainment of graduate degree enjoy the highest average annual earnings of $90,461, while those with less than high school education earn the least with $42,976. Women with an educational attainment of graduate degree earn the most with the average annual earnings of $70,917, while those with less than high school education have the smallest earnings of $14,180.
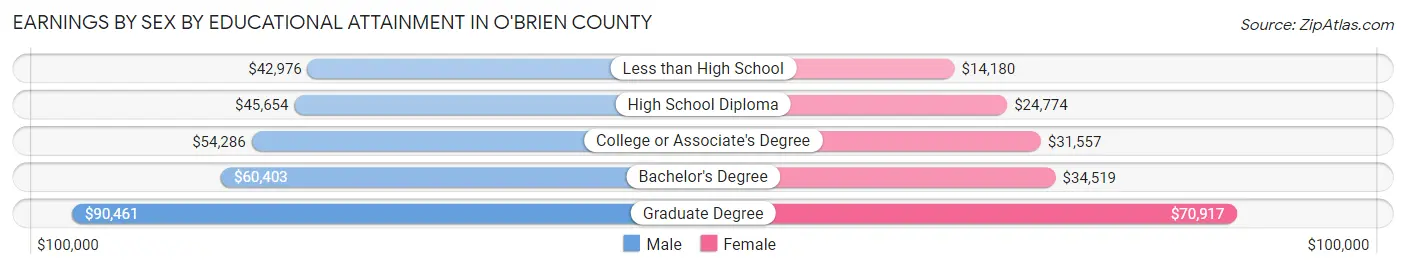
| Educational Attainment | Male Income | Female Income |
| Less than High School | $42,976 | $14,180 |
| High School Diploma | $45,654 | $24,774 |
| College or Associate's Degree | $54,286 | $31,557 |
| Bachelor's Degree | $60,403 | $34,519 |
| Graduate Degree | $90,461 | $70,917 |
| Total | $52,656 | $29,802 |
Family Income in O'Brien County
Family Income Brackets in O'Brien County
According to the O'Brien County family income data, there are 966 families falling into the $100,000 to $149,999 income range, which is the most common income bracket and makes up 27.0% of all families. Conversely, the less than $10,000 income bracket is the least frequent group with only 72 families (2.0%) belonging to this category.
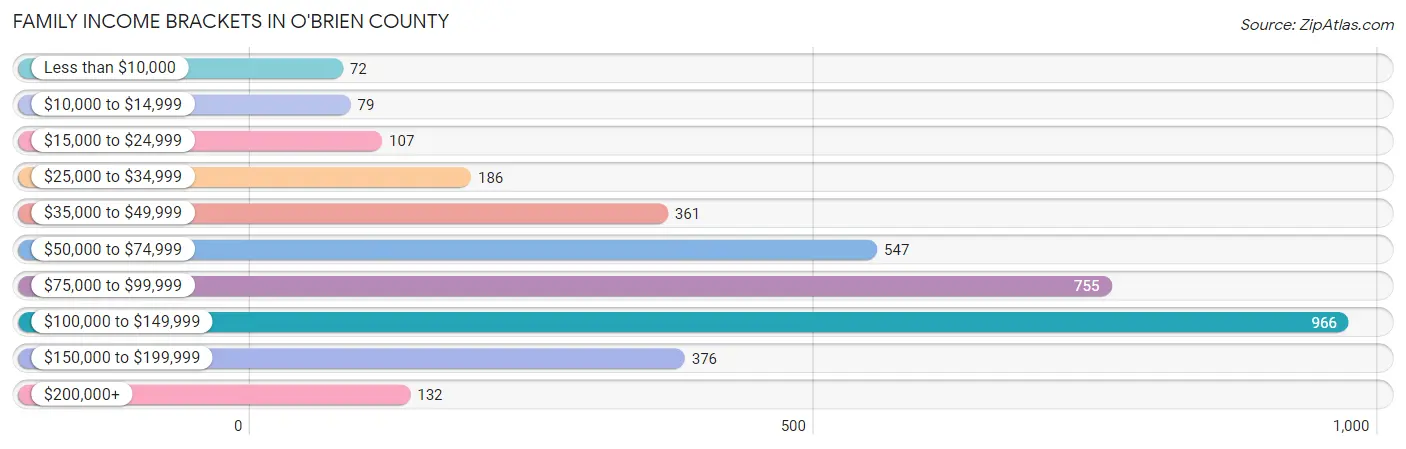
| Income Bracket | # Families | % Families |
| Less than $10,000 | 72 | 2.0% |
| $10,000 to $14,999 | 79 | 2.2% |
| $15,000 to $24,999 | 107 | 3.0% |
| $25,000 to $34,999 | 186 | 5.2% |
| $35,000 to $49,999 | 361 | 10.1% |
| $50,000 to $74,999 | 547 | 15.3% |
| $75,000 to $99,999 | 755 | 21.1% |
| $100,000 to $149,999 | 966 | 27.0% |
| $150,000 to $199,999 | 376 | 10.5% |
| $200,000+ | 132 | 3.7% |
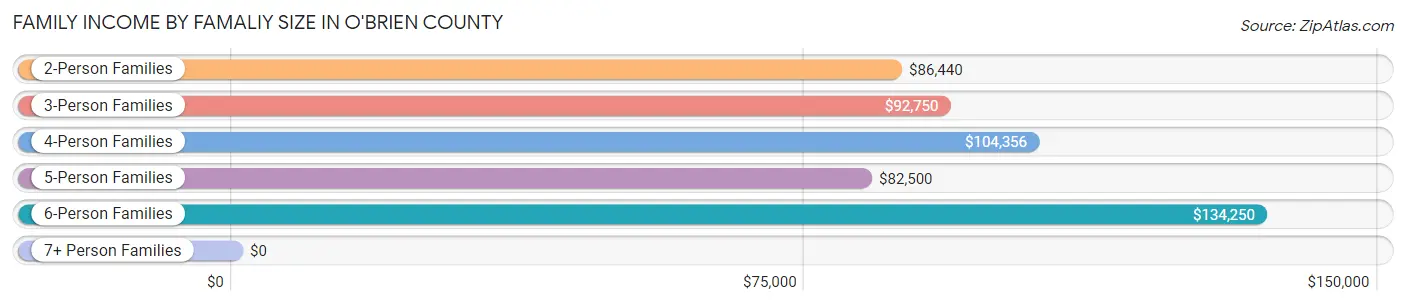
Family Income by Famaliy Size in O'Brien County
6-person families (87 | 2.4%) account for the highest median family income in O'Brien County with $134,250 per family, while 2-person families (1,937 | 54.1%) have the highest median income of $43,220 per family member.
| Income Bracket | # Families | Median Income |
| 2-Person Families | 1,937 (54.1%) | $86,440 |
| 3-Person Families | 646 (18.0%) | $92,750 |
| 4-Person Families | 609 (17.0%) | $104,356 |
| 5-Person Families | 242 (6.8%) | $82,500 |
| 6-Person Families | 87 (2.4%) | $134,250 |
| 7+ Person Families | 57 (1.6%) | $0 |
| Total | 3,578 (100.0%) | $89,832 |
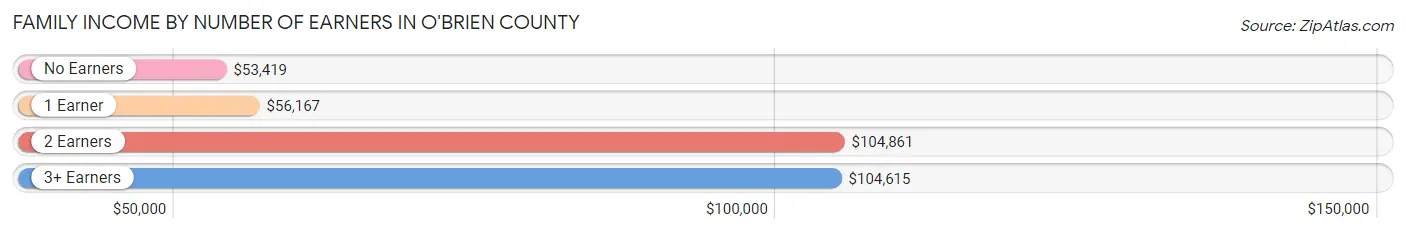
Family Income by Number of Earners in O'Brien County
The median family income in O'Brien County is $89,832, with families comprising 2 earners (1,807) having the highest median family income of $104,861, while families with no earners (479) have the lowest median family income of $53,419, accounting for 50.5% and 13.4% of families, respectively.
| Number of Earners | # Families | Median Income |
| No Earners | 479 (13.4%) | $53,419 |
| 1 Earner | 934 (26.1%) | $56,167 |
| 2 Earners | 1,807 (50.5%) | $104,861 |
| 3+ Earners | 358 (10.0%) | $104,615 |
| Total | 3,578 (100.0%) | $89,832 |
Household Income in O'Brien County
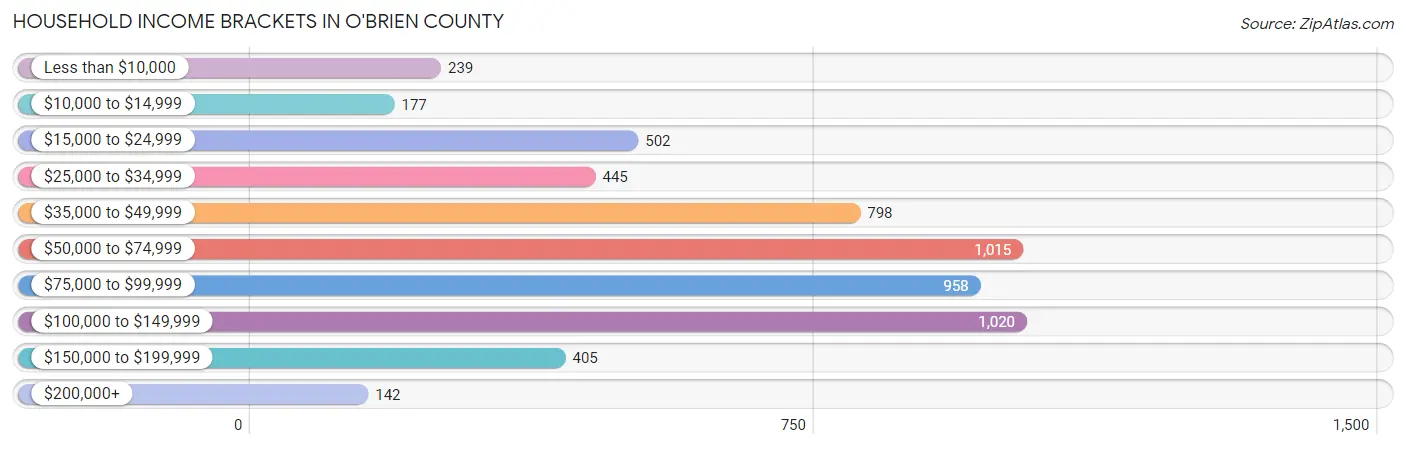
Household Income Brackets in O'Brien County
With 1,020 households falling in the category, the $100,000 to $149,999 income range is the most frequent in O'Brien County, accounting for 17.9% of all households. In contrast, only 142 households (2.5%) fall into the $200,000+ income bracket, making it the least populous group.
| Income Bracket | # Households | % Households |
| Less than $10,000 | 239 | 4.2% |
| $10,000 to $14,999 | 177 | 3.1% |
| $15,000 to $24,999 | 502 | 8.8% |
| $25,000 to $34,999 | 445 | 7.8% |
| $35,000 to $49,999 | 798 | 14.0% |
| $50,000 to $74,999 | 1,015 | 17.8% |
| $75,000 to $99,999 | 958 | 16.8% |
| $100,000 to $149,999 | 1,020 | 17.9% |
| $150,000 to $199,999 | 405 | 7.1% |
| $200,000+ | 142 | 2.5% |
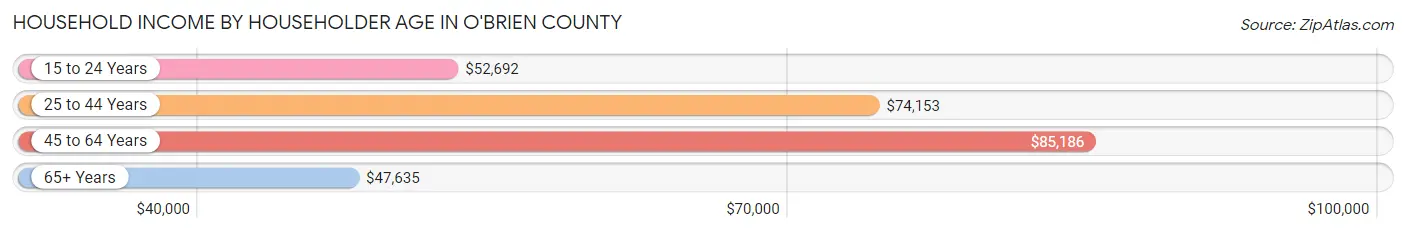
Household Income by Householder Age in O'Brien County
The median household income in O'Brien County is $65,076, with the highest median household income of $85,186 found in the 45 to 64 years age bracket for the primary householder. A total of 1,999 households (35.1%) fall into this category. Meanwhile, the 65+ years age bracket for the primary householder has the lowest median household income of $47,635, with 1,838 households (32.3%) in this group.
| Income Bracket | # Households | Median Income |
| 15 to 24 Years | 280 (4.9%) | $52,692 |
| 25 to 44 Years | 1,583 (27.8%) | $74,153 |
| 45 to 64 Years | 1,999 (35.1%) | $85,186 |
| 65+ Years | 1,838 (32.3%) | $47,635 |
| Total | 5,700 (100.0%) | $65,076 |
Poverty in O'Brien County
Income Below Poverty by Sex and Age in O'Brien County
With 11.2% poverty level for males and 13.1% for females among the residents of O'Brien County, 12 to 14 year old males and 16 and 17 year old females are the most vulnerable to poverty, with 50 males (22.2%) and 75 females (37.9%) in their respective age groups living below the poverty level.
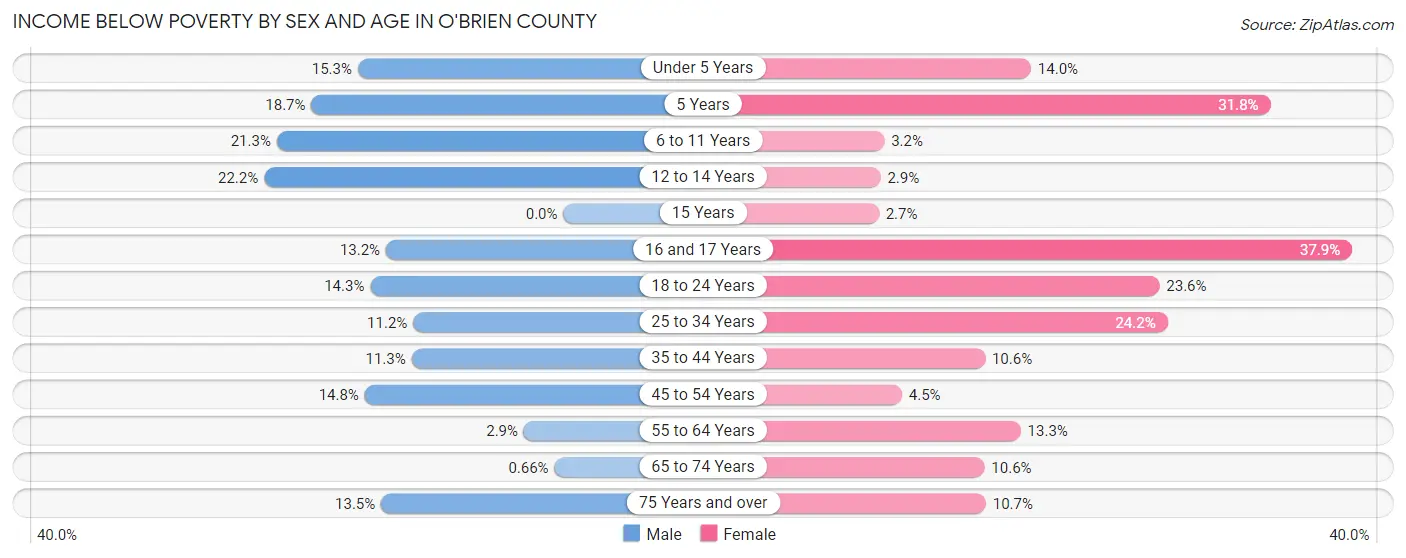
| Age Bracket | Male | Female |
| Under 5 Years | 65 (15.3%) | 65 (14.0%) |
| 5 Years | 29 (18.7%) | 28 (31.8%) |
| 6 to 11 Years | 120 (21.3%) | 19 (3.2%) |
| 12 to 14 Years | 50 (22.2%) | 8 (2.9%) |
| 15 Years | 0 (0.0%) | 2 (2.7%) |
| 16 and 17 Years | 22 (13.2%) | 75 (37.9%) |
| 18 to 24 Years | 83 (14.3%) | 108 (23.6%) |
| 25 to 34 Years | 95 (11.2%) | 198 (24.2%) |
| 35 to 44 Years | 96 (11.3%) | 86 (10.6%) |
| 45 to 54 Years | 114 (14.7%) | 30 (4.5%) |
| 55 to 64 Years | 28 (2.9%) | 123 (13.3%) |
| 65 to 74 Years | 5 (0.7%) | 77 (10.6%) |
| 75 Years and over | 69 (13.5%) | 88 (10.7%) |
| Total | 776 (11.2%) | 907 (13.1%) |
Income Above Poverty by Sex and Age in O'Brien County
According to the poverty statistics in O'Brien County, males aged 15 years and females aged 15 years are the age groups that are most secure financially, with 100.0% of males and 97.3% of females in these age groups living above the poverty line.
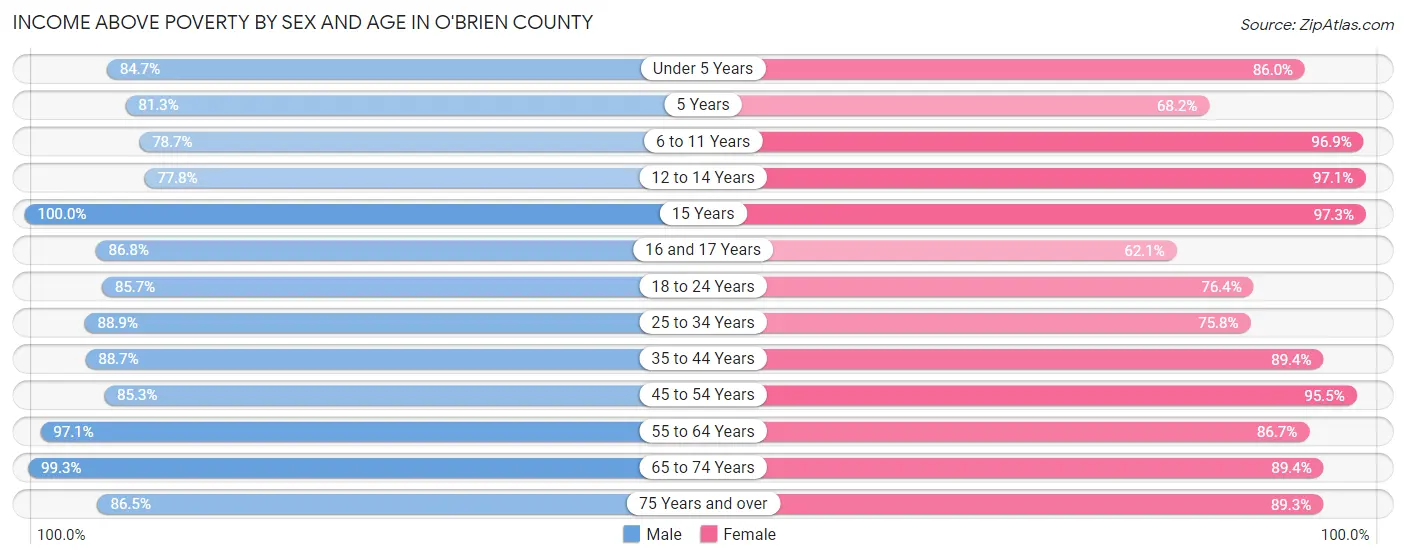
| Age Bracket | Male | Female |
| Under 5 Years | 361 (84.7%) | 398 (86.0%) |
| 5 Years | 126 (81.3%) | 60 (68.2%) |
| 6 to 11 Years | 444 (78.7%) | 585 (96.9%) |
| 12 to 14 Years | 175 (77.8%) | 271 (97.1%) |
| 15 Years | 107 (100.0%) | 71 (97.3%) |
| 16 and 17 Years | 145 (86.8%) | 123 (62.1%) |
| 18 to 24 Years | 496 (85.7%) | 350 (76.4%) |
| 25 to 34 Years | 757 (88.8%) | 621 (75.8%) |
| 35 to 44 Years | 756 (88.7%) | 723 (89.4%) |
| 45 to 54 Years | 659 (85.3%) | 643 (95.5%) |
| 55 to 64 Years | 927 (97.1%) | 803 (86.7%) |
| 65 to 74 Years | 758 (99.3%) | 650 (89.4%) |
| 75 Years and over | 441 (86.5%) | 735 (89.3%) |
| Total | 6,152 (88.8%) | 6,033 (86.9%) |
Income Below Poverty Among Married-Couple Families in O'Brien County
The poverty statistics for married-couple families in O'Brien County show that 4.4% or 135 of the total 3,061 families live below the poverty line. Families with 5 or more children have the highest poverty rate of 66.7%, comprising of 14 families. On the other hand, families with 3 or 4 children have the lowest poverty rate of 2.4%, which includes 8 families.
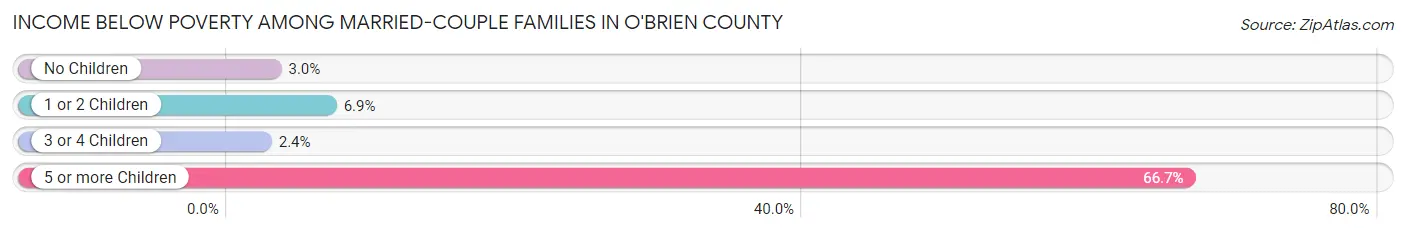
| Children | Above Poverty | Below Poverty |
| No Children | 1,827 (97.0%) | 57 (3.0%) |
| 1 or 2 Children | 759 (93.1%) | 56 (6.9%) |
| 3 or 4 Children | 333 (97.7%) | 8 (2.4%) |
| 5 or more Children | 7 (33.3%) | 14 (66.7%) |
| Total | 2,926 (95.6%) | 135 (4.4%) |
Income Below Poverty Among Single-Parent Households in O'Brien County
According to the poverty data in O'Brien County, 2.2% or 5 single-father households and 39.2% or 112 single-mother households are living below the poverty line. Among single-father households, those with 1 or 2 children have the highest poverty rate, with 5 households (4.4%) experiencing poverty. Likewise, among single-mother households, those with 3 or 4 children have the highest poverty rate, with 27 households (100.0%) falling below the poverty line.
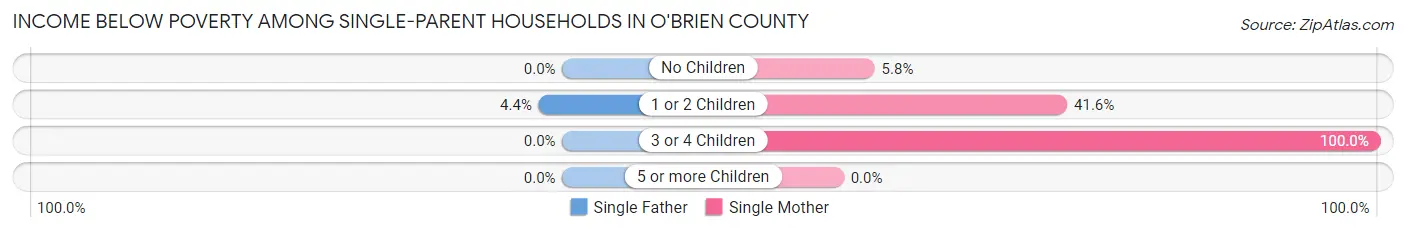
| Children | Single Father | Single Mother |
| No Children | 0 (0.0%) | 3 (5.8%) |
| 1 or 2 Children | 5 (4.4%) | 82 (41.6%) |
| 3 or 4 Children | 0 (0.0%) | 27 (100.0%) |
| 5 or more Children | 0 (0.0%) | 0 (0.0%) |
| Total | 5 (2.2%) | 112 (39.2%) |
Income Below Poverty Among Married-Couple vs Single-Parent Households in O'Brien County
The poverty data for O'Brien County shows that 135 of the married-couple family households (4.4%) and 117 of the single-parent households (22.6%) are living below the poverty level. Within the married-couple family households, those with 5 or more children have the highest poverty rate, with 14 households (66.7%) falling below the poverty line. Among the single-parent households, those with 3 or 4 children have the highest poverty rate, with 27 household (90.0%) living below poverty.
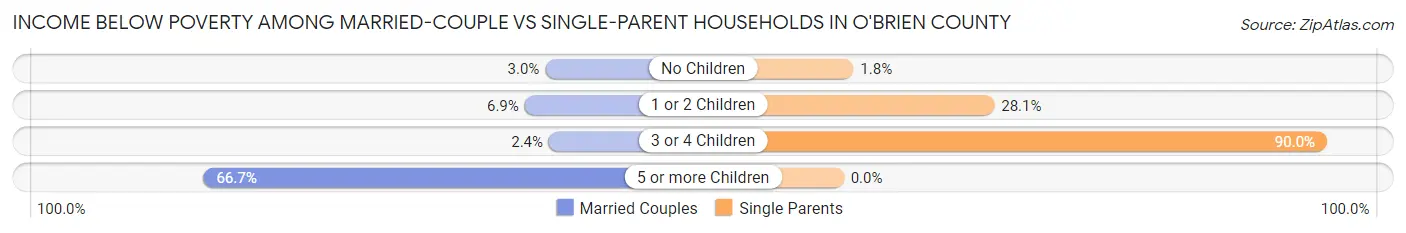
| Children | Married-Couple Families | Single-Parent Households |
| No Children | 57 (3.0%) | 3 (1.8%) |
| 1 or 2 Children | 56 (6.9%) | 87 (28.1%) |
| 3 or 4 Children | 8 (2.4%) | 27 (90.0%) |
| 5 or more Children | 14 (66.7%) | 0 (0.0%) |
| Total | 135 (4.4%) | 117 (22.6%) |
Race in O'Brien County
The most populous races in O'Brien County are White / Caucasian (12,933 | 91.5%), Hispanic or Latino (813 | 5.8%), and Two or more Races (643 | 4.5%).
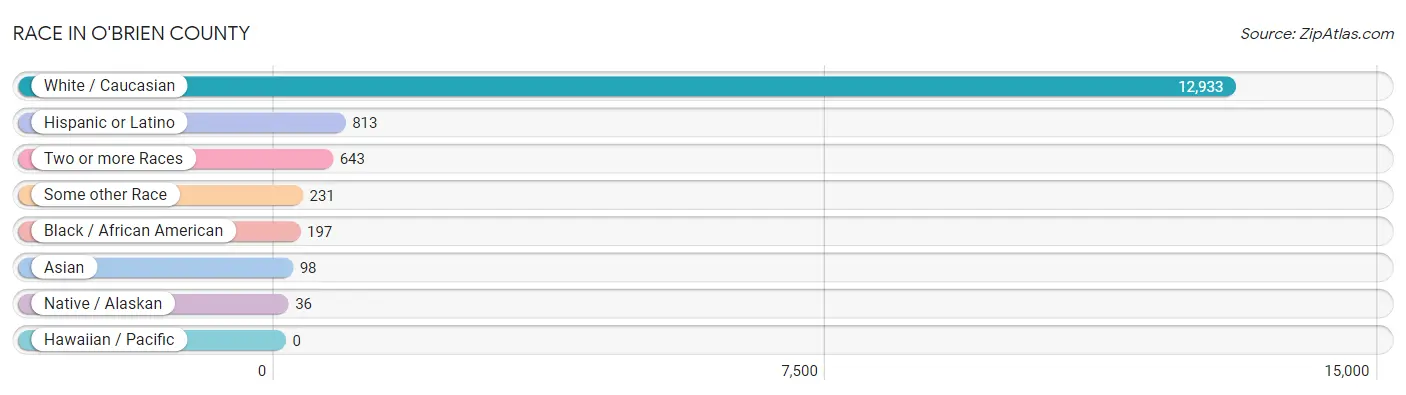
| Race | # Population | % Population |
| Asian | 98 | 0.7% |
| Black / African American | 197 | 1.4% |
| Hawaiian / Pacific | 0 | 0.0% |
| Hispanic or Latino | 813 | 5.8% |
| Native / Alaskan | 36 | 0.3% |
| White / Caucasian | 12,933 | 91.5% |
| Two or more Races | 643 | 4.5% |
| Some other Race | 231 | 1.6% |
| Total | 14,138 | 100.0% |
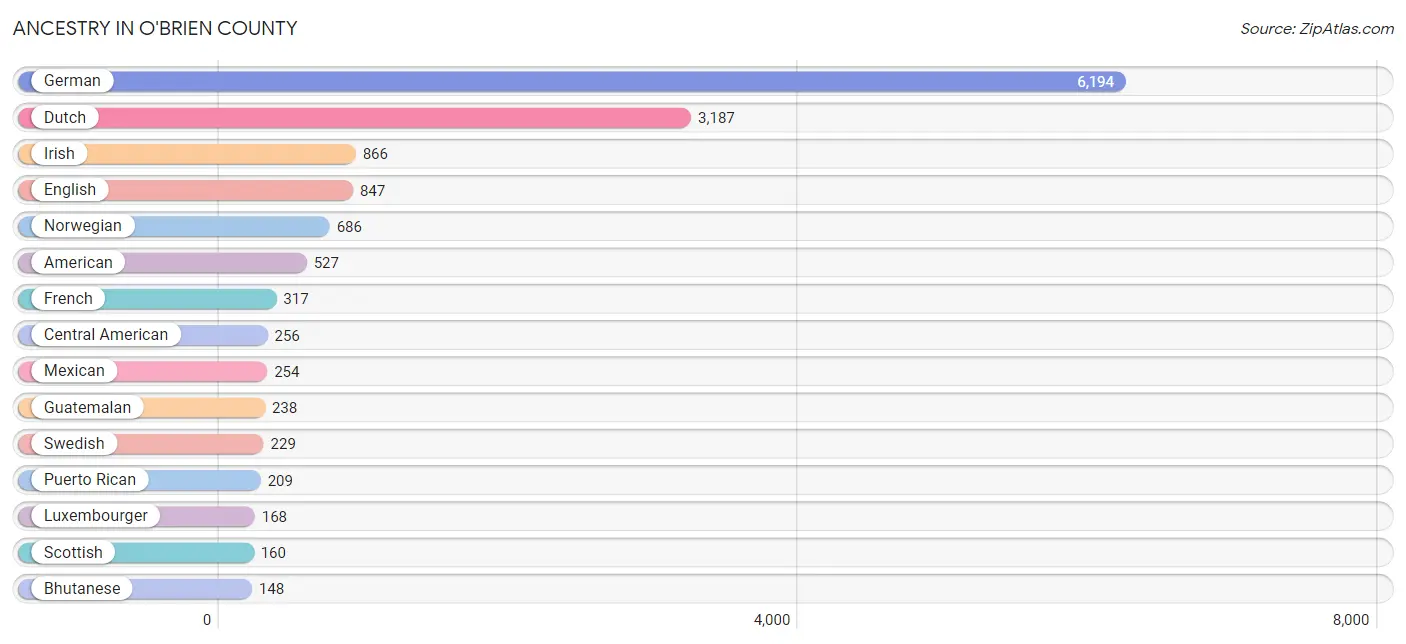
Ancestry in O'Brien County
The most populous ancestries reported in O'Brien County are German (6,194 | 43.8%), Dutch (3,187 | 22.5%), Irish (866 | 6.1%), English (847 | 6.0%), and Norwegian (686 | 4.9%), together accounting for 83.3% of all O'Brien County residents.
| Ancestry | # Population | % Population |
| African | 11 | 0.1% |
| American | 527 | 3.7% |
| Arab | 1 | 0.0% |
| Australian | 6 | 0.0% |
| Austrian | 11 | 0.1% |
| Belgian | 3 | 0.0% |
| Bhutanese | 148 | 1.1% |
| Brazilian | 2 | 0.0% |
| British | 5 | 0.0% |
| Burmese | 3 | 0.0% |
| Cajun | 7 | 0.1% |
| Canadian | 4 | 0.0% |
| Central American | 256 | 1.8% |
| Central American Indian | 1 | 0.0% |
| Cherokee | 37 | 0.3% |
| Cheyenne | 3 | 0.0% |
| Chippewa | 1 | 0.0% |
| Cuban | 29 | 0.2% |
| Czech | 51 | 0.4% |
| Danish | 132 | 0.9% |
| Dutch | 3,187 | 22.5% |
| English | 847 | 6.0% |
| European | 81 | 0.6% |
| Finnish | 20 | 0.1% |
| French | 317 | 2.2% |
| French Canadian | 12 | 0.1% |
| German | 6,194 | 43.8% |
| Greek | 3 | 0.0% |
| Guatemalan | 238 | 1.7% |
| Hungarian | 8 | 0.1% |
| Indian (Asian) | 31 | 0.2% |
| Indonesian | 9 | 0.1% |
| Irish | 866 | 6.1% |
| Italian | 133 | 0.9% |
| Kenyan | 13 | 0.1% |
| Korean | 8 | 0.1% |
| Lithuanian | 16 | 0.1% |
| Luxembourger | 168 | 1.2% |
| Mexican | 254 | 1.8% |
| Mexican American Indian | 19 | 0.1% |
| Northern European | 13 | 0.1% |
| Norwegian | 686 | 4.9% |
| Pakistani | 7 | 0.1% |
| Pennsylvania German | 14 | 0.1% |
| Peruvian | 43 | 0.3% |
| Polish | 30 | 0.2% |
| Puerto Rican | 209 | 1.5% |
| Russian | 29 | 0.2% |
| Salvadoran | 18 | 0.1% |
| Scandinavian | 30 | 0.2% |
| Scotch-Irish | 18 | 0.1% |
| Scottish | 160 | 1.1% |
| South African | 29 | 0.2% |
| South American | 43 | 0.3% |
| Spaniard | 2 | 0.0% |
| Spanish | 1 | 0.0% |
| Sri Lankan | 6 | 0.0% |
| Subsaharan African | 148 | 1.1% |
| Sudanese | 101 | 0.7% |
| Swedish | 229 | 1.6% |
| Swiss | 58 | 0.4% |
| Syrian | 1 | 0.0% |
| Thai | 9 | 0.1% |
| Welsh | 12 | 0.1% | View All 64 Rows |
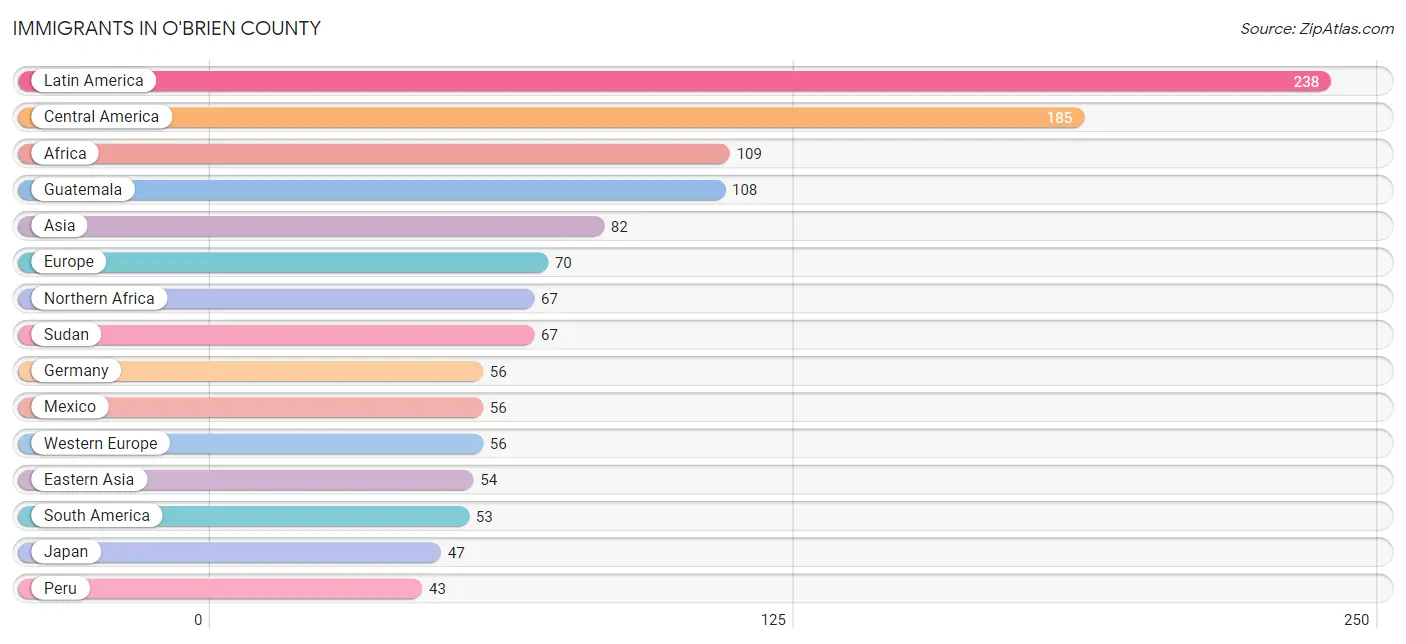
Immigrants in O'Brien County
The most numerous immigrant groups reported in O'Brien County came from Latin America (238 | 1.7%), Central America (185 | 1.3%), Africa (109 | 0.8%), Guatemala (108 | 0.8%), and Asia (82 | 0.6%), together accounting for 5.1% of all O'Brien County residents.
| Immigration Origin | # Population | % Population |
| Africa | 109 | 0.8% |
| Asia | 82 | 0.6% |
| Brazil | 10 | 0.1% |
| Central America | 185 | 1.3% |
| China | 3 | 0.0% |
| Denmark | 2 | 0.0% |
| Eastern Africa | 18 | 0.1% |
| Eastern Asia | 54 | 0.4% |
| Eastern Europe | 6 | 0.0% |
| El Salvador | 18 | 0.1% |
| England | 4 | 0.0% |
| Europe | 70 | 0.5% |
| Germany | 56 | 0.4% |
| Guatemala | 108 | 0.8% |
| Honduras | 3 | 0.0% |
| India | 9 | 0.1% |
| Japan | 47 | 0.3% |
| Kenya | 18 | 0.1% |
| Korea | 4 | 0.0% |
| Laos | 1 | 0.0% |
| Latin America | 238 | 1.7% |
| Mexico | 56 | 0.4% |
| Northern Africa | 67 | 0.5% |
| Northern Europe | 6 | 0.0% |
| Peru | 43 | 0.3% |
| Philippines | 17 | 0.1% |
| Romania | 4 | 0.0% |
| Russia | 2 | 0.0% |
| South Africa | 24 | 0.2% |
| South America | 53 | 0.4% |
| South Central Asia | 9 | 0.1% |
| South Eastern Asia | 19 | 0.1% |
| Southern Europe | 2 | 0.0% |
| Spain | 2 | 0.0% |
| Sudan | 67 | 0.5% |
| Western Europe | 56 | 0.4% | View All 36 Rows |
Sex and Age in O'Brien County
Sex and Age in O'Brien County
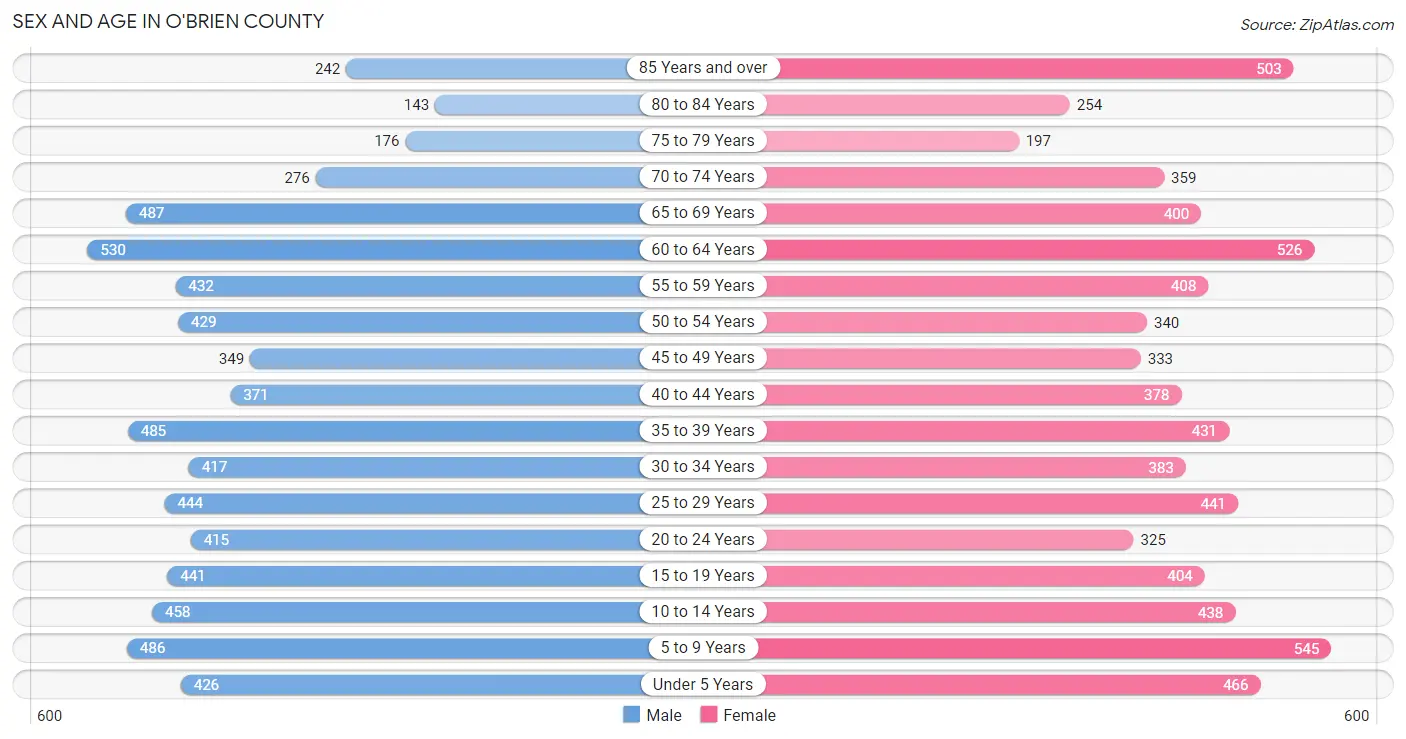
The most populous age groups in O'Brien County are 60 to 64 Years (530 | 7.6%) for men and 5 to 9 Years (545 | 7.6%) for women.
| Age Bracket | Male | Female |
| Under 5 Years | 426 (6.1%) | 466 (6.5%) |
| 5 to 9 Years | 486 (6.9%) | 545 (7.6%) |
| 10 to 14 Years | 458 (6.5%) | 438 (6.1%) |
| 15 to 19 Years | 441 (6.3%) | 404 (5.7%) |
| 20 to 24 Years | 415 (5.9%) | 325 (4.6%) |
| 25 to 29 Years | 444 (6.3%) | 441 (6.2%) |
| 30 to 34 Years | 417 (5.9%) | 383 (5.4%) |
| 35 to 39 Years | 485 (6.9%) | 431 (6.0%) |
| 40 to 44 Years | 371 (5.3%) | 378 (5.3%) |
| 45 to 49 Years | 349 (5.0%) | 333 (4.7%) |
| 50 to 54 Years | 429 (6.1%) | 340 (4.8%) |
| 55 to 59 Years | 432 (6.2%) | 408 (5.7%) |
| 60 to 64 Years | 530 (7.6%) | 526 (7.4%) |
| 65 to 69 Years | 487 (7.0%) | 400 (5.6%) |
| 70 to 74 Years | 276 (3.9%) | 359 (5.0%) |
| 75 to 79 Years | 176 (2.5%) | 197 (2.8%) |
| 80 to 84 Years | 143 (2.0%) | 254 (3.6%) |
| 85 Years and over | 242 (3.5%) | 503 (7.0%) |
| Total | 7,007 (100.0%) | 7,131 (100.0%) |
Families and Households in O'Brien County
Median Family Size in O'Brien County
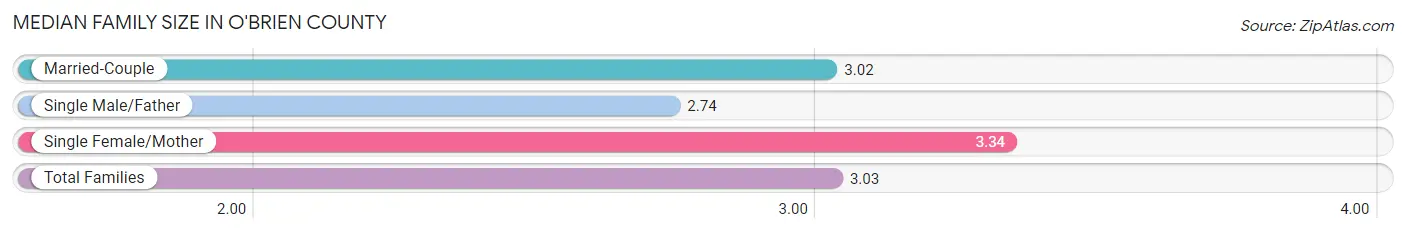
The median family size in O'Brien County is 3.03 persons per family, with single female/mother families (286 | 8.0%) accounting for the largest median family size of 3.34 persons per family. On the other hand, single male/father families (231 | 6.5%) represent the smallest median family size with 2.74 persons per family.
| Family Type | # Families | Family Size |
| Married-Couple | 3,061 (85.6%) | 3.02 |
| Single Male/Father | 231 (6.5%) | 2.74 |
| Single Female/Mother | 286 (8.0%) | 3.34 |
| Total Families | 3,578 (100.0%) | 3.03 |
Median Household Size in O'Brien County
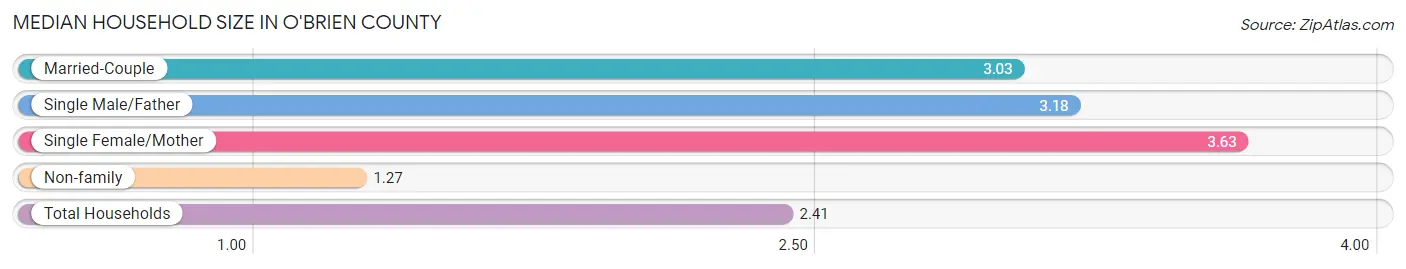
The median household size in O'Brien County is 2.41 persons per household, with single female/mother households (286 | 5.0%) accounting for the largest median household size of 3.63 persons per household. non-family households (2,122 | 37.2%) represent the smallest median household size with 1.27 persons per household.
| Household Type | # Households | Household Size |
| Married-Couple | 3,061 (53.7%) | 3.03 |
| Single Male/Father | 231 (4.1%) | 3.18 |
| Single Female/Mother | 286 (5.0%) | 3.63 |
| Non-family | 2,122 (37.2%) | 1.27 |
| Total Households | 5,700 (100.0%) | 2.41 |
Household Size by Marriage Status in O'Brien County
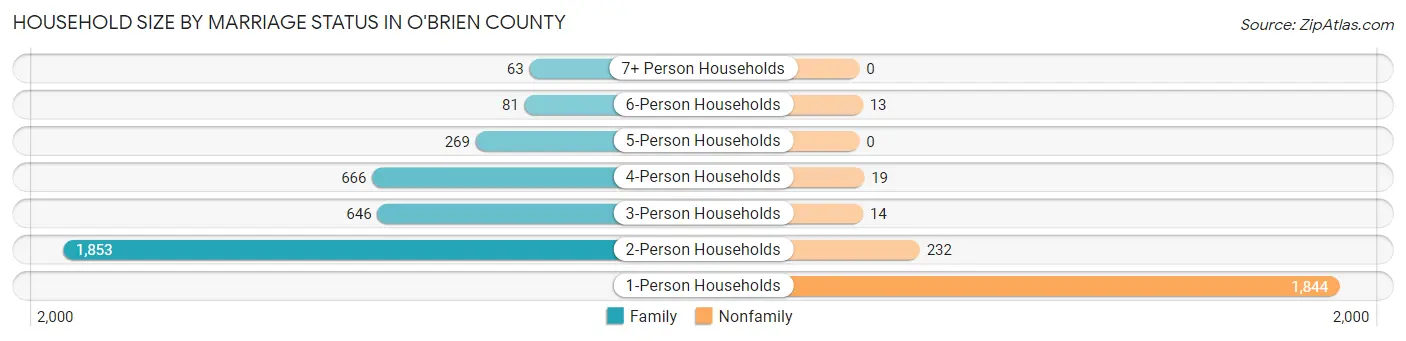
Out of a total of 5,700 households in O'Brien County, 3,578 (62.8%) are family households, while 2,122 (37.2%) are nonfamily households. The most numerous type of family households are 2-person households, comprising 1,853, and the most common type of nonfamily households are 1-person households, comprising 1,844.
| Household Size | Family Households | Nonfamily Households |
| 1-Person Households | - | 1,844 (32.4%) |
| 2-Person Households | 1,853 (32.5%) | 232 (4.1%) |
| 3-Person Households | 646 (11.3%) | 14 (0.3%) |
| 4-Person Households | 666 (11.7%) | 19 (0.3%) |
| 5-Person Households | 269 (4.7%) | 0 (0.0%) |
| 6-Person Households | 81 (1.4%) | 13 (0.2%) |
| 7+ Person Households | 63 (1.1%) | 0 (0.0%) |
| Total | 3,578 (62.8%) | 2,122 (37.2%) |
Female Fertility in O'Brien County
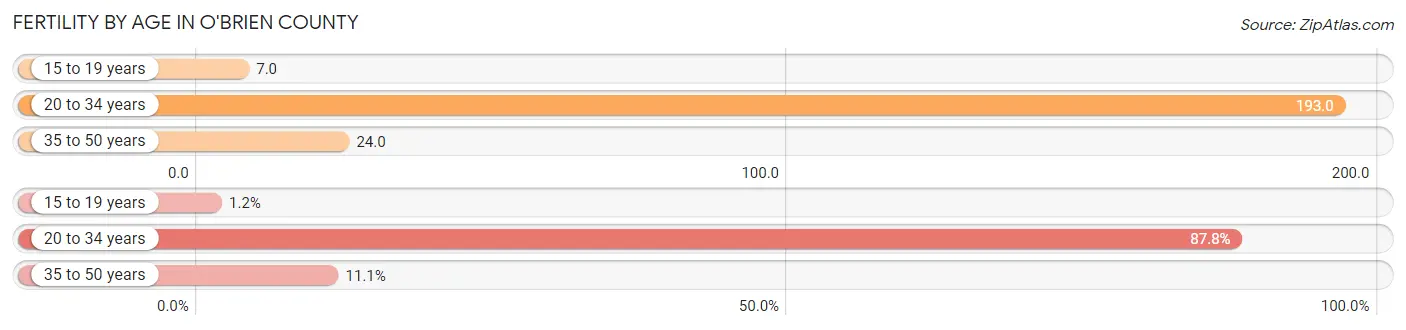
Fertility by Age in O'Brien County
Average fertility rate in O'Brien County is 92.0 births per 1,000 women. Women in the age bracket of 20 to 34 years have the highest fertility rate with 193.0 births per 1,000 women. Women in the age bracket of 20 to 34 years acount for 87.7% of all women with births.
| Age Bracket | Women with Births | Births / 1,000 Women |
| 15 to 19 years | 3 (1.2%) | 7.0 |
| 20 to 34 years | 222 (87.7%) | 193.0 |
| 35 to 50 years | 28 (11.1%) | 24.0 |
| Total | 253 (100.0%) | 92.0 |
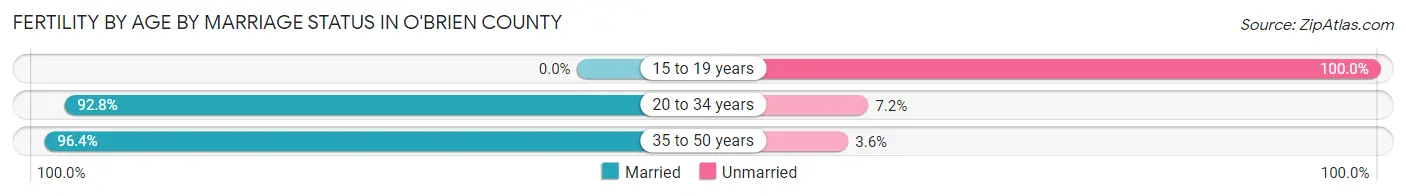
Fertility by Age by Marriage Status in O'Brien County
92.1% of women with births (253) in O'Brien County are married. The highest percentage of unmarried women with births falls into 15 to 19 years age bracket with 100.0% of them unmarried at the time of birth, while the lowest percentage of unmarried women with births belong to 35 to 50 years age bracket with 3.6% of them unmarried.
| Age Bracket | Married | Unmarried |
| 15 to 19 years | 0 (0.0%) | 3 (100.0%) |
| 20 to 34 years | 206 (92.8%) | 16 (7.2%) |
| 35 to 50 years | 27 (96.4%) | 1 (3.6%) |
| Total | 233 (92.1%) | 20 (7.9%) |
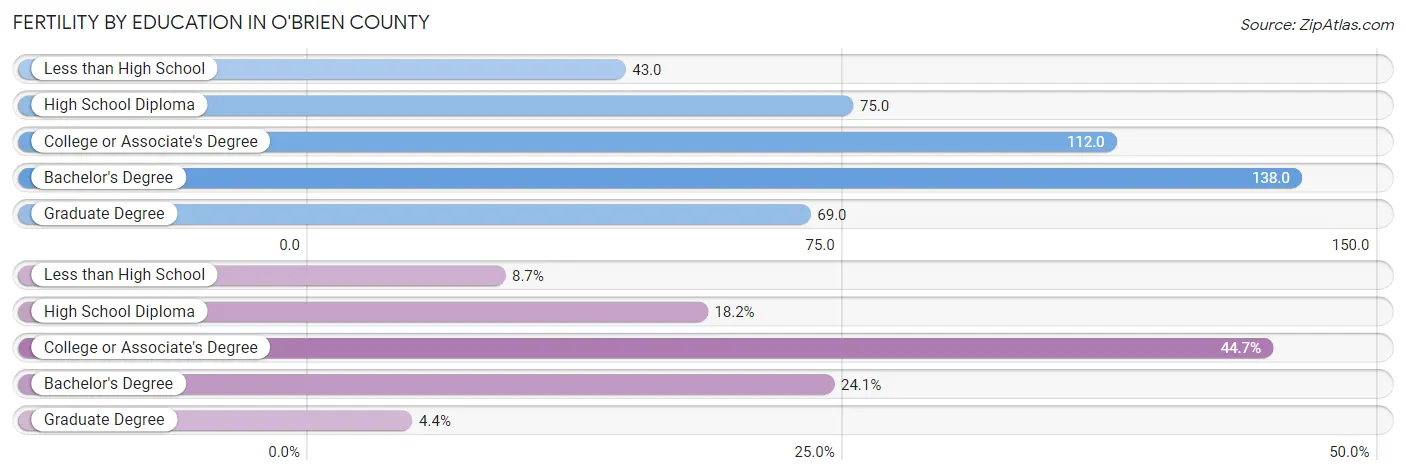
Fertility by Education in O'Brien County
Average fertility rate in O'Brien County is 92.0 births per 1,000 women. Women with the education attainment of bachelor's degree have the highest fertility rate of 138.0 births per 1,000 women, while women with the education attainment of less than high school have the lowest fertility at 43.0 births per 1,000 women. Women with the education attainment of college or associate's degree represent 44.7% of all women with births.
| Educational Attainment | Women with Births | Births / 1,000 Women |
| Less than High School | 22 (8.7%) | 43.0 |
| High School Diploma | 46 (18.2%) | 75.0 |
| College or Associate's Degree | 113 (44.7%) | 112.0 |
| Bachelor's Degree | 61 (24.1%) | 138.0 |
| Graduate Degree | 11 (4.3%) | 69.0 |
| Total | 253 (100.0%) | 92.0 |
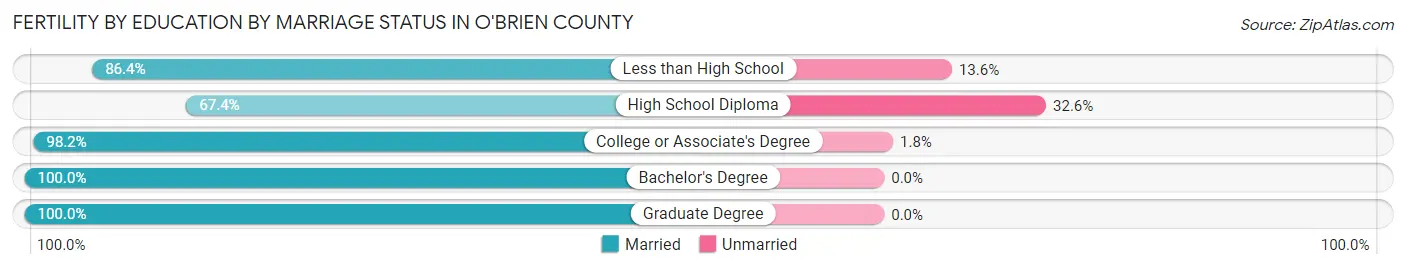
Fertility by Education by Marriage Status in O'Brien County
7.9% of women with births in O'Brien County are unmarried. Women with the educational attainment of bachelor's degree are most likely to be married with 100.0% of them married at childbirth, while women with the educational attainment of high school diploma are least likely to be married with 32.6% of them unmarried at childbirth.
| Educational Attainment | Married | Unmarried |
| Less than High School | 19 (86.4%) | 3 (13.6%) |
| High School Diploma | 31 (67.4%) | 15 (32.6%) |
| College or Associate's Degree | 111 (98.2%) | 2 (1.8%) |
| Bachelor's Degree | 61 (100.0%) | 0 (0.0%) |
| Graduate Degree | 11 (100.0%) | 0 (0.0%) |
| Total | 233 (92.1%) | 20 (7.9%) |
Employment Characteristics in O'Brien County
Employment by Class of Employer in O'Brien County
Among the 6,811 employed individuals in O'Brien County, private company employees (4,134 | 60.7%), not-for-profit organizations (691 | 10.2%), and local government employees (655 | 9.6%) make up the most common classes of employment.
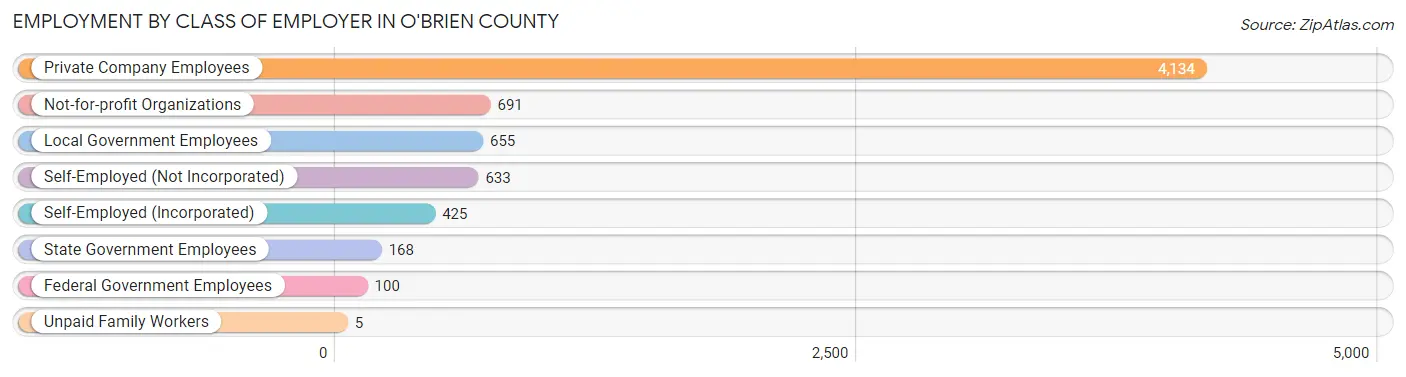
| Employer Class | # Employees | % Employees |
| Private Company Employees | 4,134 | 60.7% |
| Self-Employed (Incorporated) | 425 | 6.2% |
| Self-Employed (Not Incorporated) | 633 | 9.3% |
| Not-for-profit Organizations | 691 | 10.2% |
| Local Government Employees | 655 | 9.6% |
| State Government Employees | 168 | 2.5% |
| Federal Government Employees | 100 | 1.5% |
| Unpaid Family Workers | 5 | 0.1% |
| Total | 6,811 | 100.0% |
Employment Status by Age in O'Brien County
According to the labor force statistics for O'Brien County, out of the total population over 16 years of age (11,139), 64.0% or 7,129 individuals are in the labor force, with 2.4% or 171 of them unemployed. The age group with the highest labor force participation rate is 20 to 24 years, with 91.4% or 676 individuals in the labor force. Within the labor force, the 65 to 74 years age range has the highest percentage of unemployed individuals, with 5.6% or 33 of them being unemployed.
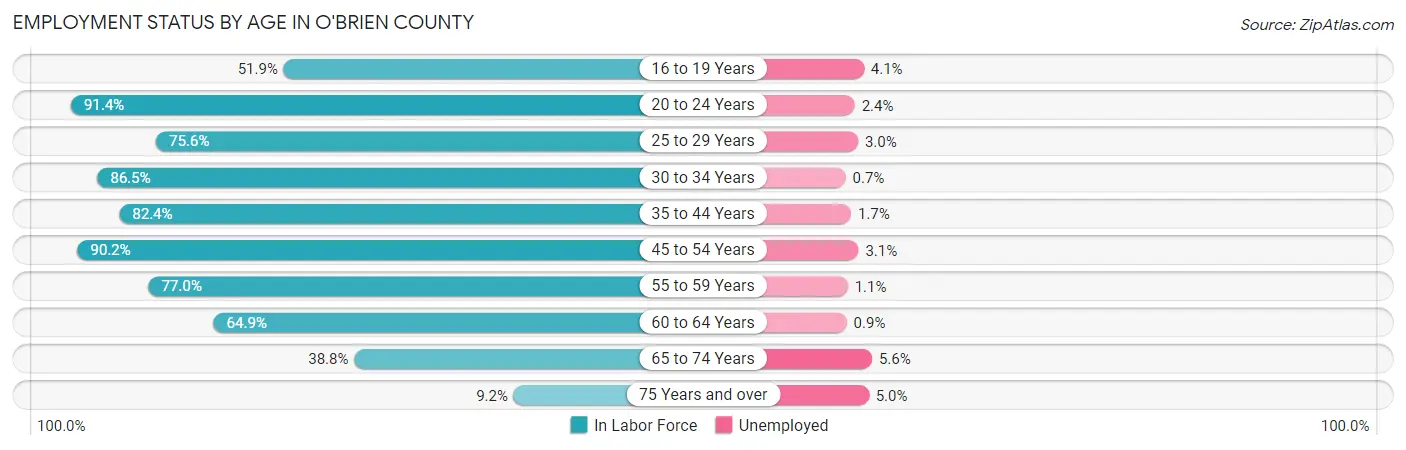
| Age Bracket | In Labor Force | Unemployed |
| 16 to 19 Years | 345 (51.9%) | 14 (4.1%) |
| 20 to 24 Years | 676 (91.4%) | 16 (2.4%) |
| 25 to 29 Years | 669 (75.6%) | 20 (3.0%) |
| 30 to 34 Years | 692 (86.5%) | 5 (0.7%) |
| 35 to 44 Years | 1,372 (82.4%) | 23 (1.7%) |
| 45 to 54 Years | 1,309 (90.2%) | 41 (3.1%) |
| 55 to 59 Years | 647 (77.0%) | 7 (1.1%) |
| 60 to 64 Years | 685 (64.9%) | 6 (0.9%) |
| 65 to 74 Years | 591 (38.8%) | 33 (5.6%) |
| 75 Years and over | 139 (9.2%) | 7 (5.0%) |
| Total | 7,129 (64.0%) | 171 (2.4%) |
Employment Status by Educational Attainment in O'Brien County
According to labor force statistics for O'Brien County, 80.2% of individuals (5,371) out of the total population between 25 and 64 years of age (6,697) are in the labor force, with 1.9% or 102 of them being unemployed. The group with the highest labor force participation rate are those with the educational attainment of bachelor's degree or higher, with 93.1% or 1,419 individuals in the labor force. Within the labor force, individuals with high school diploma education have the highest percentage of unemployment, with 3.5% or 55 of them being unemployed.
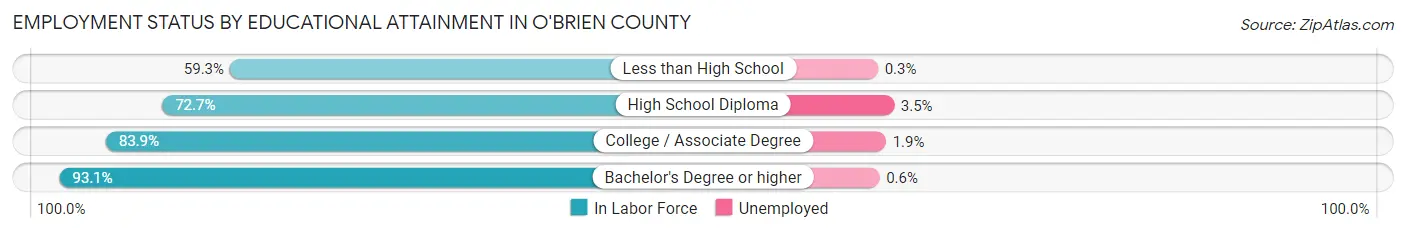
| Educational Attainment | In Labor Force | Unemployed |
| Less than High School | 349 (59.3%) | 2 (0.3%) |
| High School Diploma | 1,560 (72.7%) | 75 (3.5%) |
| College / Associate Degree | 2,045 (83.9%) | 46 (1.9%) |
| Bachelor's Degree or higher | 1,419 (93.1%) | 9 (0.6%) |
| Total | 5,371 (80.2%) | 127 (1.9%) |
Employment Occupations by Sex in O'Brien County
Management, Business, Science and Arts Occupations
The most common Management, Business, Science and Arts occupations in O'Brien County are Community & Social Service (746 | 10.7%), Management (706 | 10.2%), Education Instruction & Library (557 | 8.0%), Health Diagnosing & Treating (407 | 5.9%), and Health Technologists (274 | 3.9%).
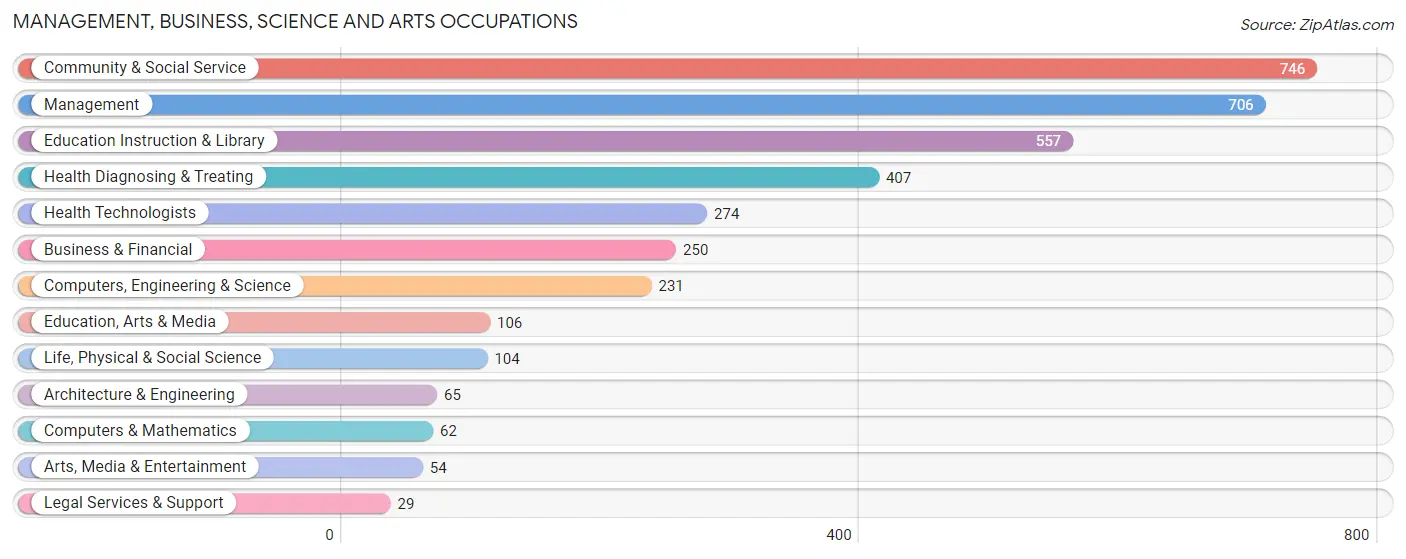
Management, Business, Science and Arts Occupations by Sex
Within the Management, Business, Science and Arts occupations in O'Brien County, the most male-oriented occupations are Life, Physical & Social Science (83.7%), Computers & Mathematics (82.3%), and Computers, Engineering & Science (81.4%), while the most female-oriented occupations are Health Technologists (83.2%), Health Diagnosing & Treating (77.1%), and Legal Services & Support (72.4%).
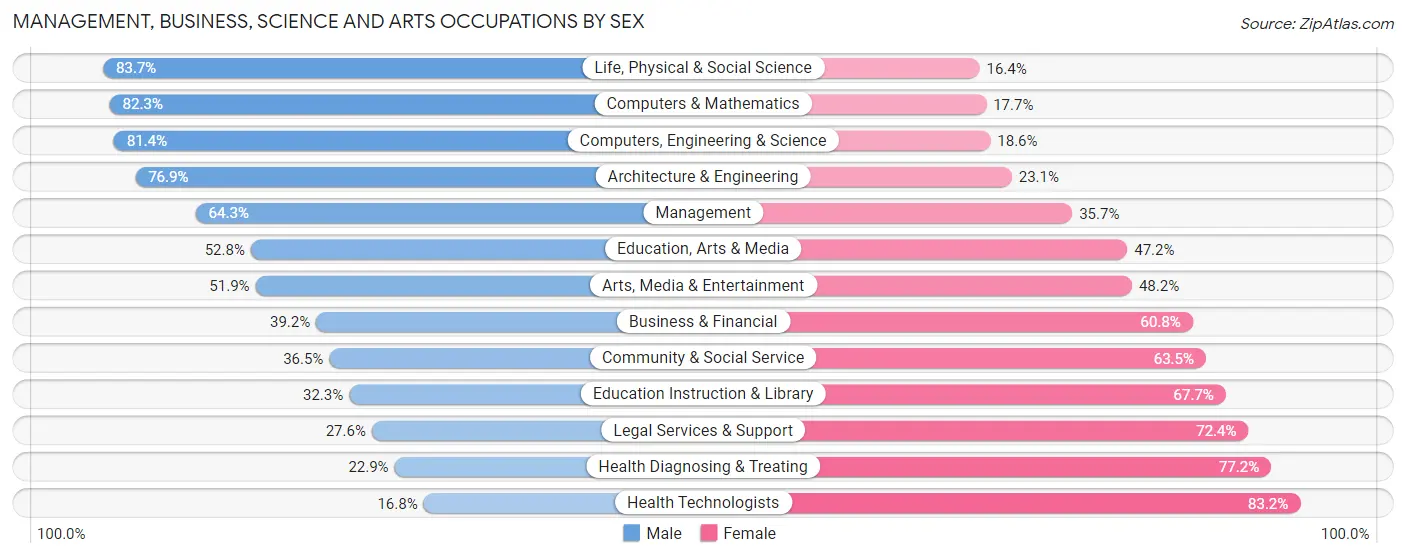
| Occupation | Male | Female |
| Management | 454 (64.3%) | 252 (35.7%) |
| Business & Financial | 98 (39.2%) | 152 (60.8%) |
| Computers, Engineering & Science | 188 (81.4%) | 43 (18.6%) |
| Computers & Mathematics | 51 (82.3%) | 11 (17.7%) |
| Architecture & Engineering | 50 (76.9%) | 15 (23.1%) |
| Life, Physical & Social Science | 87 (83.7%) | 17 (16.4%) |
| Community & Social Service | 272 (36.5%) | 474 (63.5%) |
| Education, Arts & Media | 56 (52.8%) | 50 (47.2%) |
| Legal Services & Support | 8 (27.6%) | 21 (72.4%) |
| Education Instruction & Library | 180 (32.3%) | 377 (67.7%) |
| Arts, Media & Entertainment | 28 (51.8%) | 26 (48.1%) |
| Health Diagnosing & Treating | 93 (22.9%) | 314 (77.1%) |
| Health Technologists | 46 (16.8%) | 228 (83.2%) |
| Total (Category) | 1,105 (47.2%) | 1,235 (52.8%) |
| Total (Overall) | 3,886 (55.9%) | 3,063 (44.1%) |
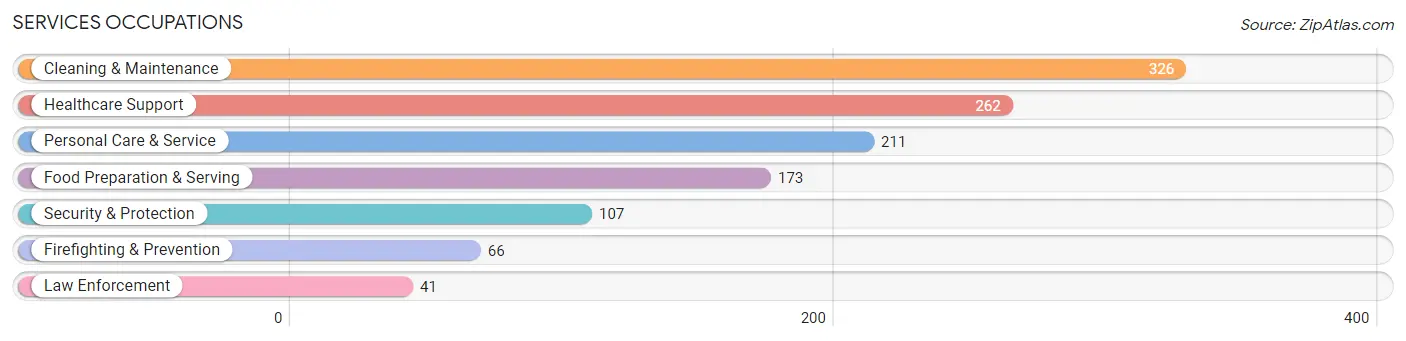
Services Occupations
The most common Services occupations in O'Brien County are Cleaning & Maintenance (326 | 4.7%), Healthcare Support (262 | 3.8%), Personal Care & Service (211 | 3.0%), Food Preparation & Serving (173 | 2.5%), and Security & Protection (107 | 1.5%).
Services Occupations by Sex
Within the Services occupations in O'Brien County, the most male-oriented occupations are Law Enforcement (75.6%), Security & Protection (58.9%), and Cleaning & Maintenance (58.3%), while the most female-oriented occupations are Healthcare Support (90.1%), Personal Care & Service (87.7%), and Food Preparation & Serving (76.9%).
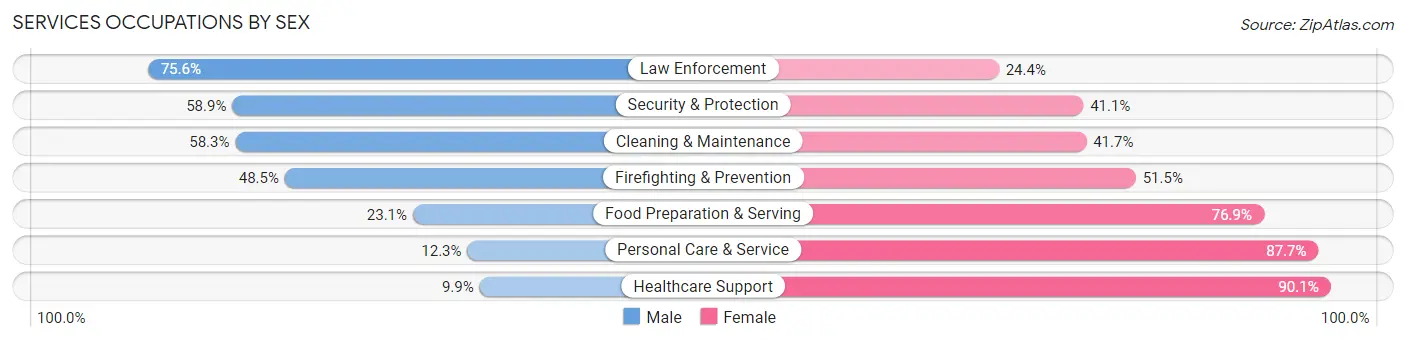
| Occupation | Male | Female |
| Healthcare Support | 26 (9.9%) | 236 (90.1%) |
| Security & Protection | 63 (58.9%) | 44 (41.1%) |
| Firefighting & Prevention | 32 (48.5%) | 34 (51.5%) |
| Law Enforcement | 31 (75.6%) | 10 (24.4%) |
| Food Preparation & Serving | 40 (23.1%) | 133 (76.9%) |
| Cleaning & Maintenance | 190 (58.3%) | 136 (41.7%) |
| Personal Care & Service | 26 (12.3%) | 185 (87.7%) |
| Total (Category) | 345 (32.0%) | 734 (68.0%) |
| Total (Overall) | 3,886 (55.9%) | 3,063 (44.1%) |
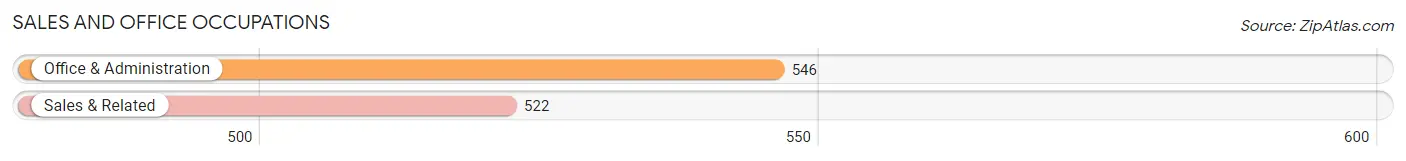
Sales and Office Occupations
The most common Sales and Office occupations in O'Brien County are Office & Administration (546 | 7.9%), and Sales & Related (522 | 7.5%).
Sales and Office Occupations by Sex
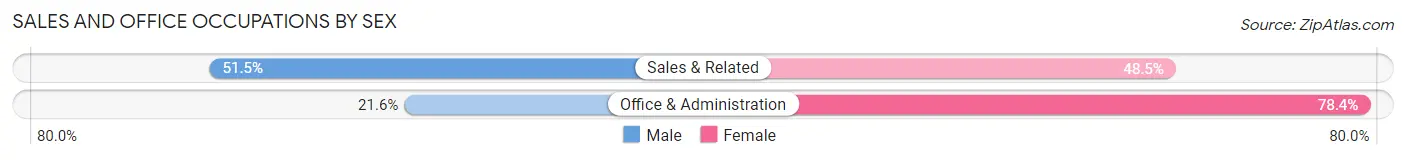
| Occupation | Male | Female |
| Sales & Related | 269 (51.5%) | 253 (48.5%) |
| Office & Administration | 118 (21.6%) | 428 (78.4%) |
| Total (Category) | 387 (36.2%) | 681 (63.8%) |
| Total (Overall) | 3,886 (55.9%) | 3,063 (44.1%) |
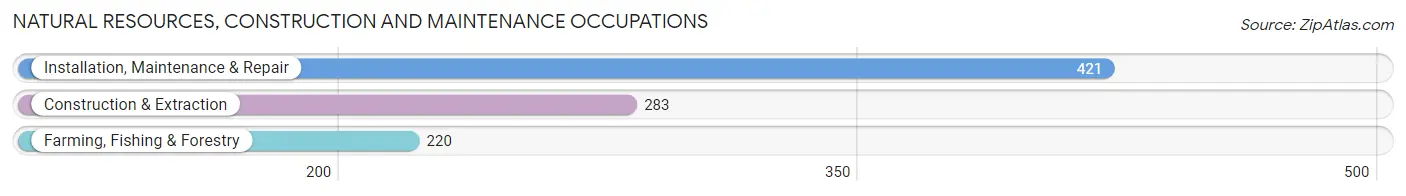
Natural Resources, Construction and Maintenance Occupations
The most common Natural Resources, Construction and Maintenance occupations in O'Brien County are Installation, Maintenance & Repair (421 | 6.1%), Construction & Extraction (283 | 4.1%), and Farming, Fishing & Forestry (220 | 3.2%).
Natural Resources, Construction and Maintenance Occupations by Sex
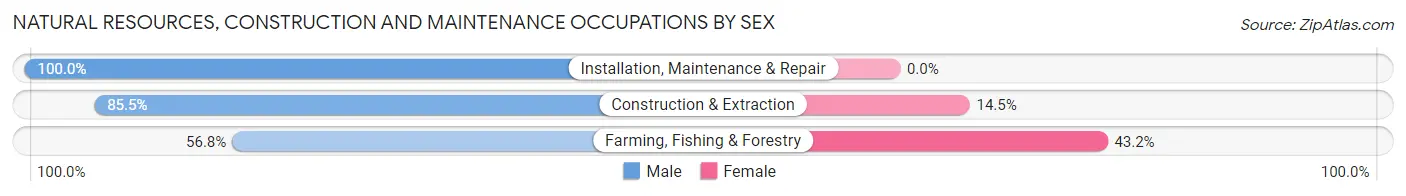
| Occupation | Male | Female |
| Farming, Fishing & Forestry | 125 (56.8%) | 95 (43.2%) |
| Construction & Extraction | 242 (85.5%) | 41 (14.5%) |
| Installation, Maintenance & Repair | 421 (100.0%) | 0 (0.0%) |
| Total (Category) | 788 (85.3%) | 136 (14.7%) |
| Total (Overall) | 3,886 (55.9%) | 3,063 (44.1%) |
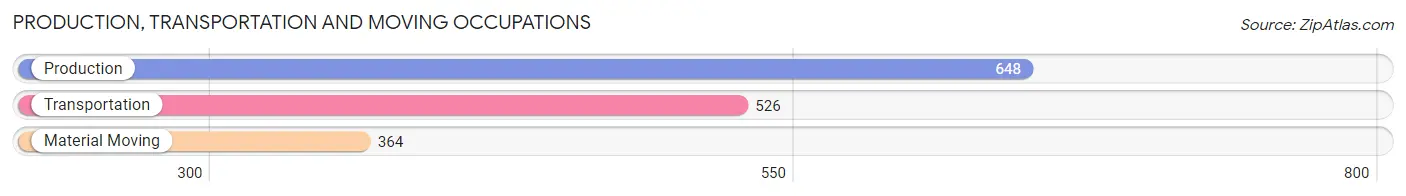
Production, Transportation and Moving Occupations
The most common Production, Transportation and Moving occupations in O'Brien County are Production (648 | 9.3%), Transportation (526 | 7.6%), and Material Moving (364 | 5.2%).
Production, Transportation and Moving Occupations by Sex
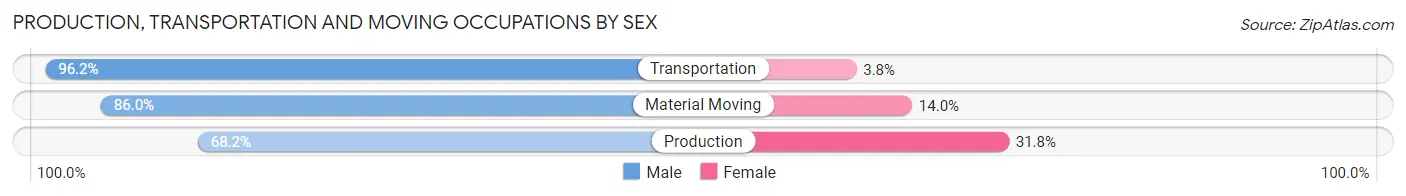
| Occupation | Male | Female |
| Production | 442 (68.2%) | 206 (31.8%) |
| Transportation | 506 (96.2%) | 20 (3.8%) |
| Material Moving | 313 (86.0%) | 51 (14.0%) |
| Total (Category) | 1,261 (82.0%) | 277 (18.0%) |
| Total (Overall) | 3,886 (55.9%) | 3,063 (44.1%) |
Employment Industries by Sex in O'Brien County
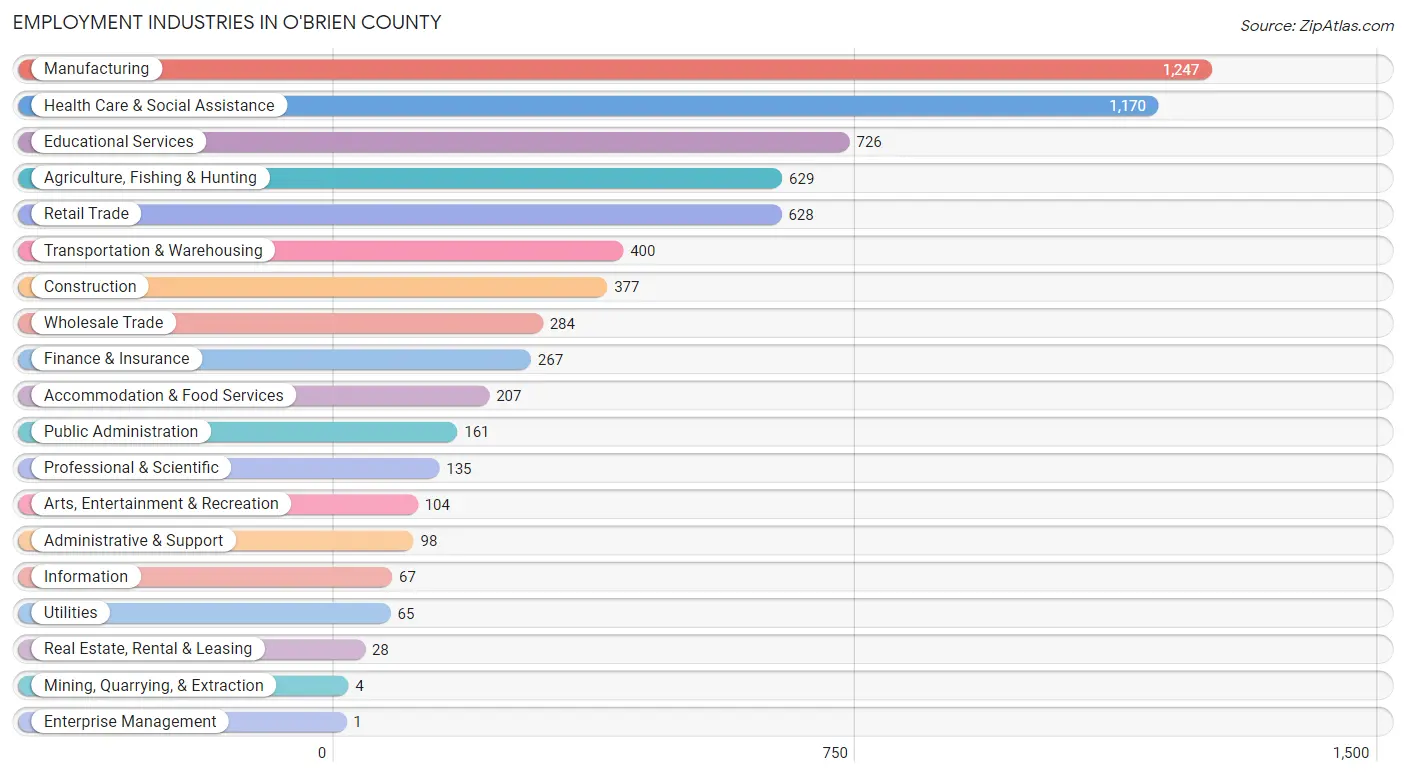
Employment Industries in O'Brien County
The major employment industries in O'Brien County include Manufacturing (1,247 | 17.9%), Health Care & Social Assistance (1,170 | 16.8%), Educational Services (726 | 10.4%), Agriculture, Fishing & Hunting (629 | 9.0%), and Retail Trade (628 | 9.0%).
Employment Industries by Sex in O'Brien County
The O'Brien County industries that see more men than women are Mining, Quarrying, & Extraction (100.0%), Wholesale Trade (92.2%), and Information (91.0%), whereas the industries that tend to have a higher number of women are Enterprise Management (100.0%), Health Care & Social Assistance (78.0%), and Accommodation & Food Services (75.8%).
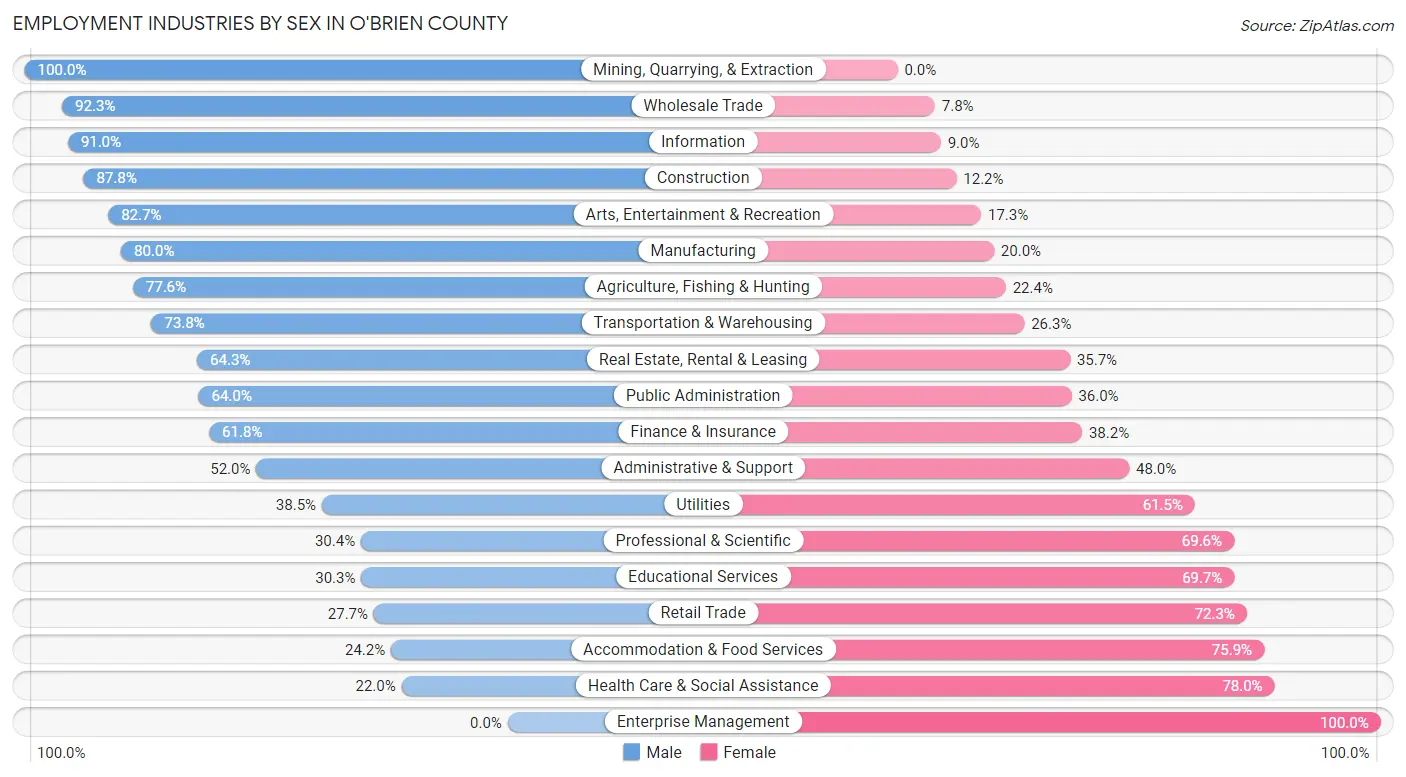
| Industry | Male | Female |
| Agriculture, Fishing & Hunting | 488 (77.6%) | 141 (22.4%) |
| Mining, Quarrying, & Extraction | 4 (100.0%) | 0 (0.0%) |
| Construction | 331 (87.8%) | 46 (12.2%) |
| Manufacturing | 998 (80.0%) | 249 (20.0%) |
| Wholesale Trade | 262 (92.2%) | 22 (7.7%) |
| Retail Trade | 174 (27.7%) | 454 (72.3%) |
| Transportation & Warehousing | 295 (73.8%) | 105 (26.3%) |
| Utilities | 25 (38.5%) | 40 (61.5%) |
| Information | 61 (91.0%) | 6 (9.0%) |
| Finance & Insurance | 165 (61.8%) | 102 (38.2%) |
| Real Estate, Rental & Leasing | 18 (64.3%) | 10 (35.7%) |
| Professional & Scientific | 41 (30.4%) | 94 (69.6%) |
| Enterprise Management | 0 (0.0%) | 1 (100.0%) |
| Administrative & Support | 51 (52.0%) | 47 (48.0%) |
| Educational Services | 220 (30.3%) | 506 (69.7%) |
| Health Care & Social Assistance | 257 (22.0%) | 913 (78.0%) |
| Arts, Entertainment & Recreation | 86 (82.7%) | 18 (17.3%) |
| Accommodation & Food Services | 50 (24.1%) | 157 (75.8%) |
| Public Administration | 103 (64.0%) | 58 (36.0%) |
| Total | 3,886 (55.9%) | 3,063 (44.1%) |
Education in O'Brien County
School Enrollment in O'Brien County
The most common levels of schooling among the 3,122 students in O'Brien County are middle school (796 | 25.5%), elementary school (756 | 24.2%), and high school (712 | 22.8%).
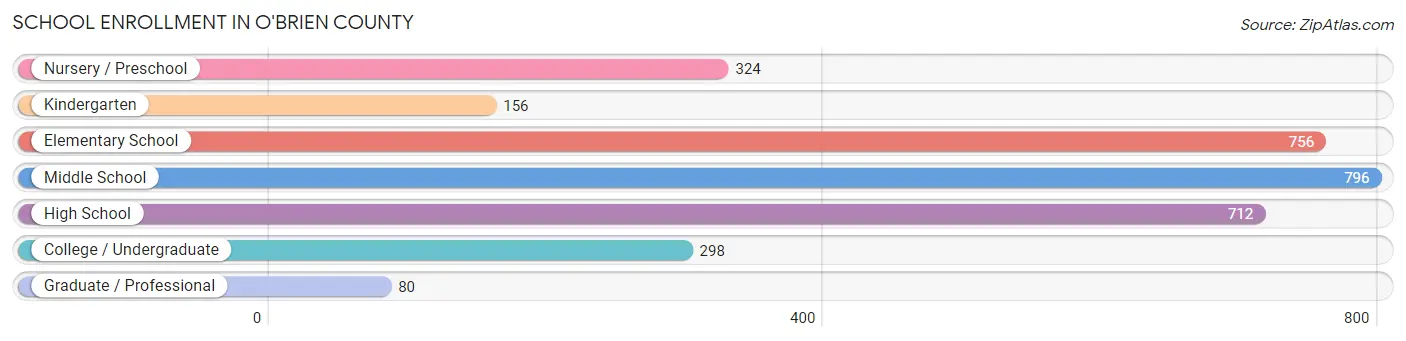
| School Level | # Students | % Students |
| Nursery / Preschool | 324 | 10.4% |
| Kindergarten | 156 | 5.0% |
| Elementary School | 756 | 24.2% |
| Middle School | 796 | 25.5% |
| High School | 712 | 22.8% |
| College / Undergraduate | 298 | 9.6% |
| Graduate / Professional | 80 | 2.6% |
| Total | 3,122 | 100.0% |
School Enrollment by Age by Funding Source in O'Brien County
Out of a total of 3,122 students who are enrolled in schools in O'Brien County, 425 (13.6%) attend a private institution, while the remaining 2,697 (86.4%) are enrolled in public schools. The age group of 35 years and over has the highest likelihood of being enrolled in private schools, with 40 (87.0% in the age bracket) enrolled. Conversely, the age group of 18 to 19 year olds has the lowest likelihood of being enrolled in a private school, with 196 (99.5% in the age bracket) attending a public institution.
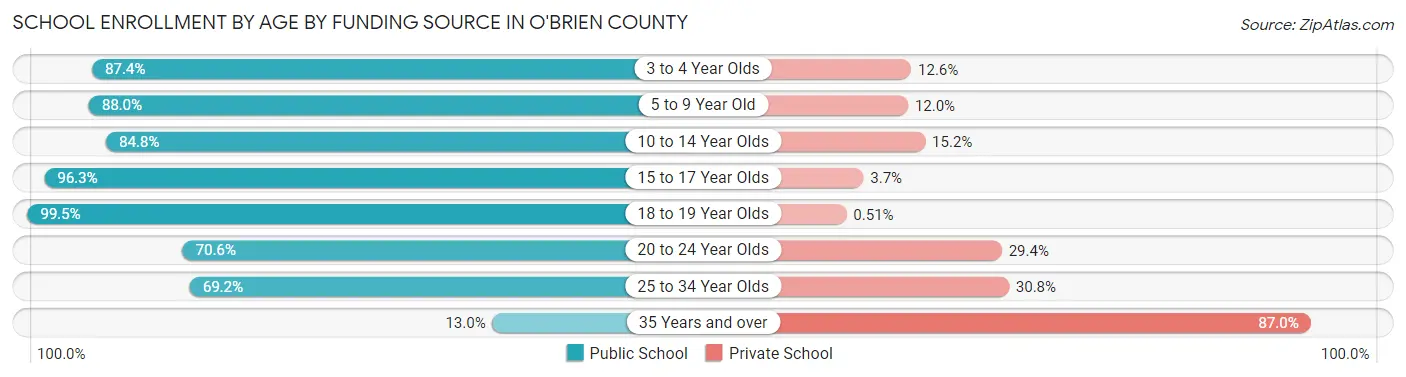
| Age Bracket | Public School | Private School |
| 3 to 4 Year Olds | 174 (87.4%) | 25 (12.6%) |
| 5 to 9 Year Old | 853 (88.0%) | 116 (12.0%) |
| 10 to 14 Year Olds | 760 (84.8%) | 136 (15.2%) |
| 15 to 17 Year Olds | 499 (96.3%) | 19 (3.7%) |
| 18 to 19 Year Olds | 196 (99.5%) | 1 (0.5%) |
| 20 to 24 Year Olds | 127 (70.6%) | 53 (29.4%) |
| 25 to 34 Year Olds | 81 (69.2%) | 36 (30.8%) |
| 35 Years and over | 6 (13.0%) | 40 (87.0%) |
| Total | 2,697 (86.4%) | 425 (13.6%) |
Educational Attainment by Field of Study in O'Brien County
Education (691 | 30.4%), business (537 | 23.6%), bio, nature & agricultural (206 | 9.1%), science & technology (159 | 7.0%), and arts & humanities (150 | 6.6%) are the most common fields of study among 2,272 individuals in O'Brien County who have obtained a bachelor's degree or higher.
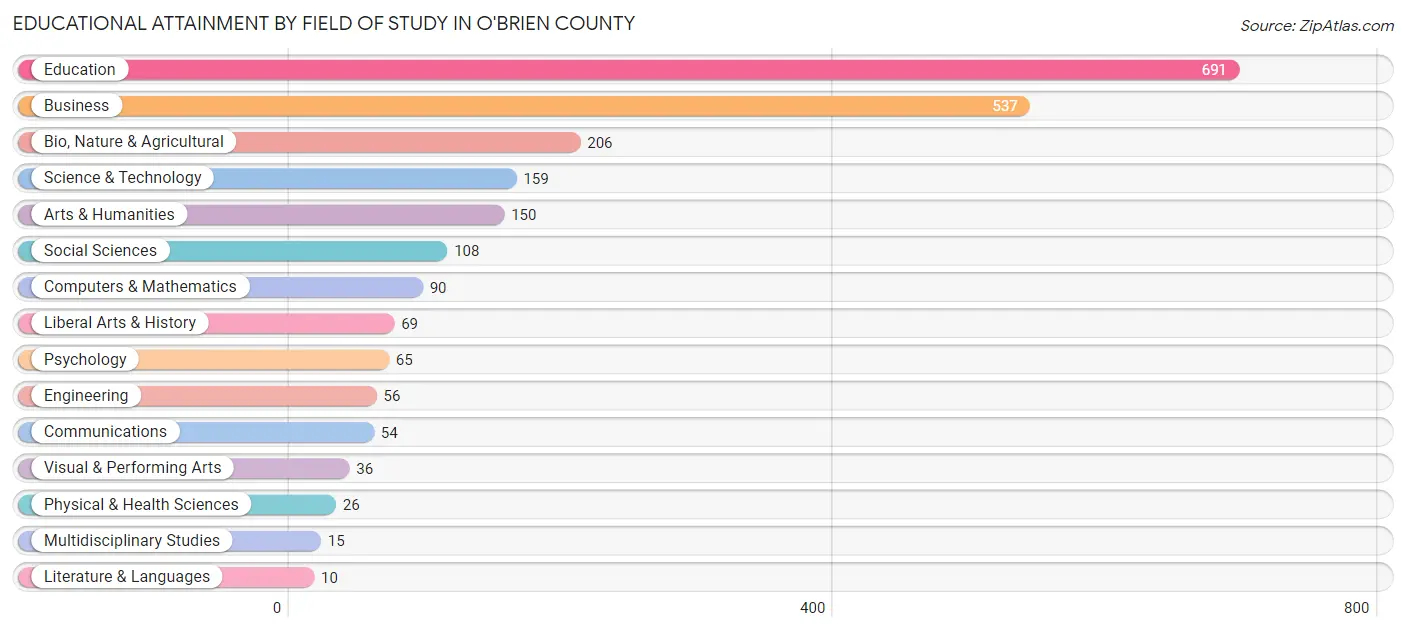
| Field of Study | # Graduates | % Graduates |
| Computers & Mathematics | 90 | 4.0% |
| Bio, Nature & Agricultural | 206 | 9.1% |
| Physical & Health Sciences | 26 | 1.1% |
| Psychology | 65 | 2.9% |
| Social Sciences | 108 | 4.8% |
| Engineering | 56 | 2.5% |
| Multidisciplinary Studies | 15 | 0.7% |
| Science & Technology | 159 | 7.0% |
| Business | 537 | 23.6% |
| Education | 691 | 30.4% |
| Literature & Languages | 10 | 0.4% |
| Liberal Arts & History | 69 | 3.0% |
| Visual & Performing Arts | 36 | 1.6% |
| Communications | 54 | 2.4% |
| Arts & Humanities | 150 | 6.6% |
| Total | 2,272 | 100.0% |
Transportation & Commute in O'Brien County
Vehicle Availability by Sex in O'Brien County
The most prevalent vehicle ownership categories in O'Brien County are males with 2 vehicles (1,387, accounting for 36.4%) and females with 2 vehicles (913, making up 47.3%).
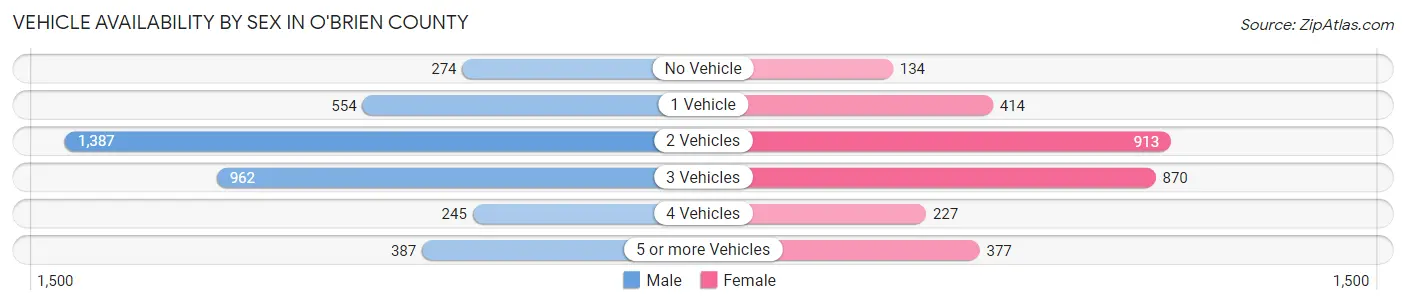
| Vehicles Available | Male | Female |
| No Vehicle | 274 (7.2%) | 134 (4.6%) |
| 1 Vehicle | 554 (14.5%) | 414 (14.1%) |
| 2 Vehicles | 1,387 (36.4%) | 913 (31.1%) |
| 3 Vehicles | 962 (25.3%) | 870 (29.6%) |
| 4 Vehicles | 245 (6.4%) | 227 (7.7%) |
| 5 or more Vehicles | 387 (10.2%) | 377 (12.8%) |
| Total | 3,809 (100.0%) | 2,935 (100.0%) |
Commute Time in O'Brien County
The most frequently occuring commute durations in O'Brien County are 5 to 9 minutes (1,767 commuters, 27.4%), 10 to 14 minutes (904 commuters, 14.0%), and less than 5 minutes (807 commuters, 12.5%).
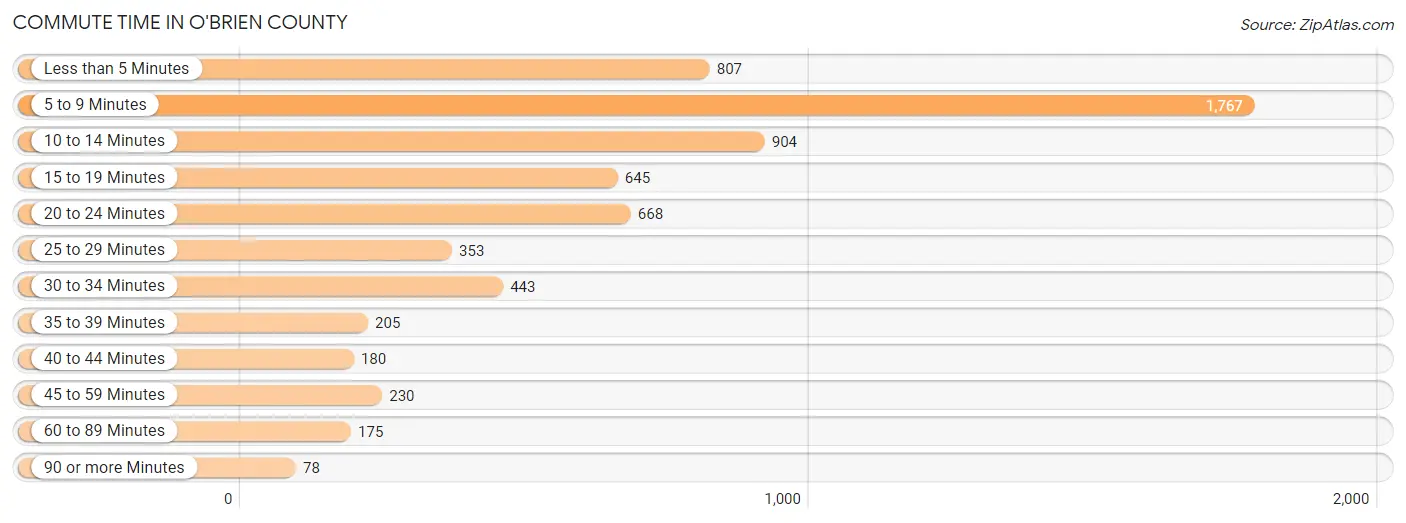
| Commute Time | # Commuters | % Commuters |
| Less than 5 Minutes | 807 | 12.5% |
| 5 to 9 Minutes | 1,767 | 27.4% |
| 10 to 14 Minutes | 904 | 14.0% |
| 15 to 19 Minutes | 645 | 10.0% |
| 20 to 24 Minutes | 668 | 10.3% |
| 25 to 29 Minutes | 353 | 5.5% |
| 30 to 34 Minutes | 443 | 6.9% |
| 35 to 39 Minutes | 205 | 3.2% |
| 40 to 44 Minutes | 180 | 2.8% |
| 45 to 59 Minutes | 230 | 3.6% |
| 60 to 89 Minutes | 175 | 2.7% |
| 90 or more Minutes | 78 | 1.2% |
Commute Time by Sex in O'Brien County
The most common commute times in O'Brien County are 5 to 9 minutes (1,057 commuters, 28.5%) for males and 5 to 9 minutes (710 commuters, 25.9%) for females.
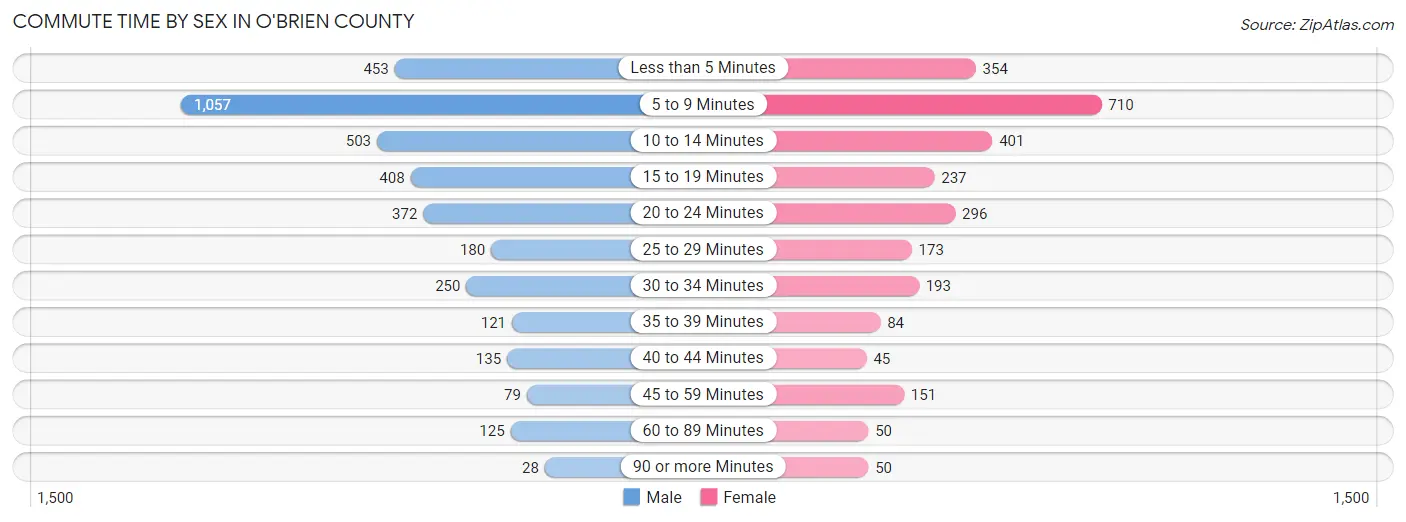
| Commute Time | Male | Female |
| Less than 5 Minutes | 453 (12.2%) | 354 (12.9%) |
| 5 to 9 Minutes | 1,057 (28.5%) | 710 (25.9%) |
| 10 to 14 Minutes | 503 (13.6%) | 401 (14.6%) |
| 15 to 19 Minutes | 408 (11.0%) | 237 (8.6%) |
| 20 to 24 Minutes | 372 (10.0%) | 296 (10.8%) |
| 25 to 29 Minutes | 180 (4.9%) | 173 (6.3%) |
| 30 to 34 Minutes | 250 (6.7%) | 193 (7.0%) |
| 35 to 39 Minutes | 121 (3.3%) | 84 (3.1%) |
| 40 to 44 Minutes | 135 (3.6%) | 45 (1.6%) |
| 45 to 59 Minutes | 79 (2.1%) | 151 (5.5%) |
| 60 to 89 Minutes | 125 (3.4%) | 50 (1.8%) |
| 90 or more Minutes | 28 (0.7%) | 50 (1.8%) |
Time of Departure to Work by Sex in O'Brien County
The most frequent times of departure to work in O'Brien County are 7:00 AM to 7:29 AM (687, 18.5%) for males and 7:30 AM to 7:59 AM (620, 22.6%) for females.
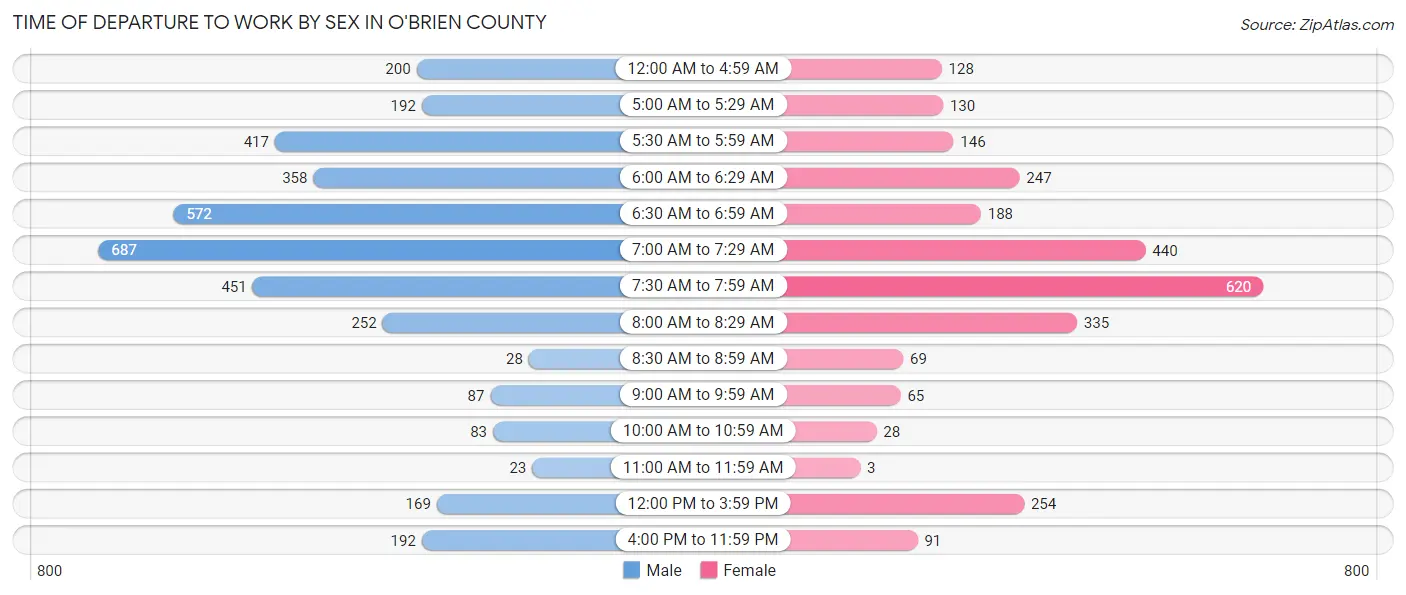
| Time of Departure | Male | Female |
| 12:00 AM to 4:59 AM | 200 (5.4%) | 128 (4.7%) |
| 5:00 AM to 5:29 AM | 192 (5.2%) | 130 (4.7%) |
| 5:30 AM to 5:59 AM | 417 (11.2%) | 146 (5.3%) |
| 6:00 AM to 6:29 AM | 358 (9.7%) | 247 (9.0%) |
| 6:30 AM to 6:59 AM | 572 (15.4%) | 188 (6.9%) |
| 7:00 AM to 7:29 AM | 687 (18.5%) | 440 (16.0%) |
| 7:30 AM to 7:59 AM | 451 (12.1%) | 620 (22.6%) |
| 8:00 AM to 8:29 AM | 252 (6.8%) | 335 (12.2%) |
| 8:30 AM to 8:59 AM | 28 (0.7%) | 69 (2.5%) |
| 9:00 AM to 9:59 AM | 87 (2.3%) | 65 (2.4%) |
| 10:00 AM to 10:59 AM | 83 (2.2%) | 28 (1.0%) |
| 11:00 AM to 11:59 AM | 23 (0.6%) | 3 (0.1%) |
| 12:00 PM to 3:59 PM | 169 (4.5%) | 254 (9.3%) |
| 4:00 PM to 11:59 PM | 192 (5.2%) | 91 (3.3%) |
| Total | 3,711 (100.0%) | 2,744 (100.0%) |
Housing Occupancy in O'Brien County
Occupancy by Ownership in O'Brien County
Of the total 5,700 dwellings in O'Brien County, owner-occupied units account for 4,333 (76.0%), while renter-occupied units make up 1,367 (24.0%).
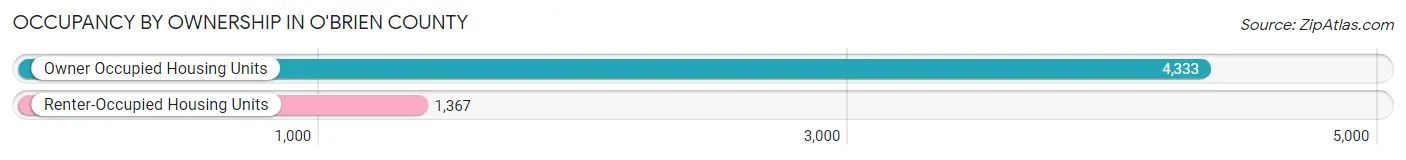
| Occupancy | # Housing Units | % Housing Units |
| Owner Occupied Housing Units | 4,333 | 76.0% |
| Renter-Occupied Housing Units | 1,367 | 24.0% |
| Total Occupied Housing Units | 5,700 | 100.0% |
Occupancy by Household Size in O'Brien County
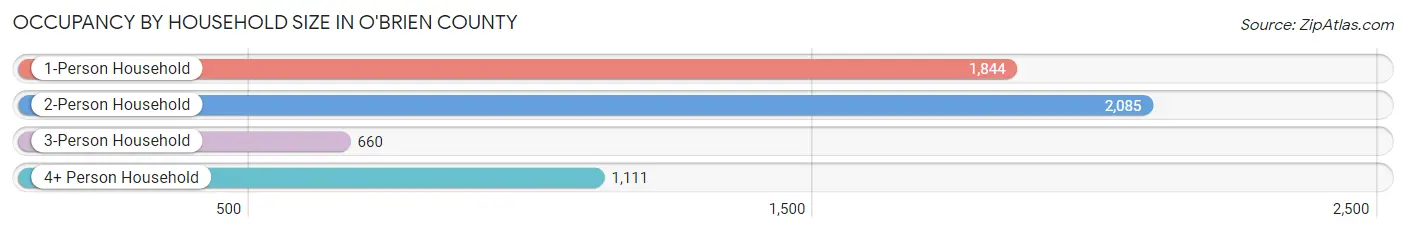
| Household Size | # Housing Units | % Housing Units |
| 1-Person Household | 1,844 | 32.4% |
| 2-Person Household | 2,085 | 36.6% |
| 3-Person Household | 660 | 11.6% |
| 4+ Person Household | 1,111 | 19.5% |
| Total Housing Units | 5,700 | 100.0% |
Occupancy by Ownership by Household Size in O'Brien County
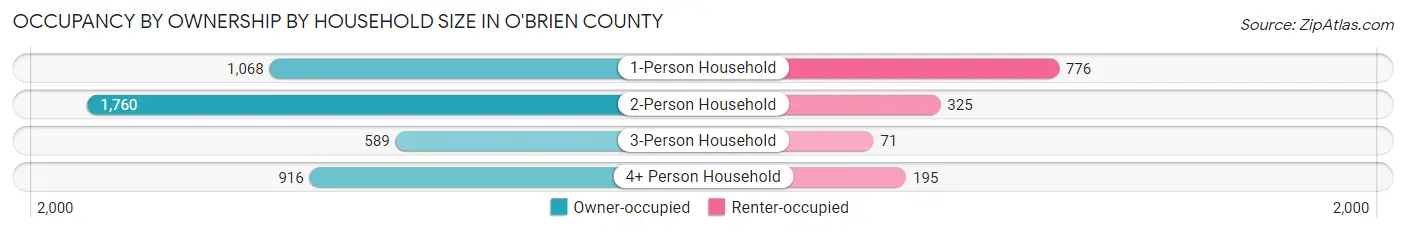
| Household Size | Owner-occupied | Renter-occupied |
| 1-Person Household | 1,068 (57.9%) | 776 (42.1%) |
| 2-Person Household | 1,760 (84.4%) | 325 (15.6%) |
| 3-Person Household | 589 (89.2%) | 71 (10.8%) |
| 4+ Person Household | 916 (82.5%) | 195 (17.5%) |
| Total Housing Units | 4,333 (76.0%) | 1,367 (24.0%) |
Occupancy by Educational Attainment in O'Brien County
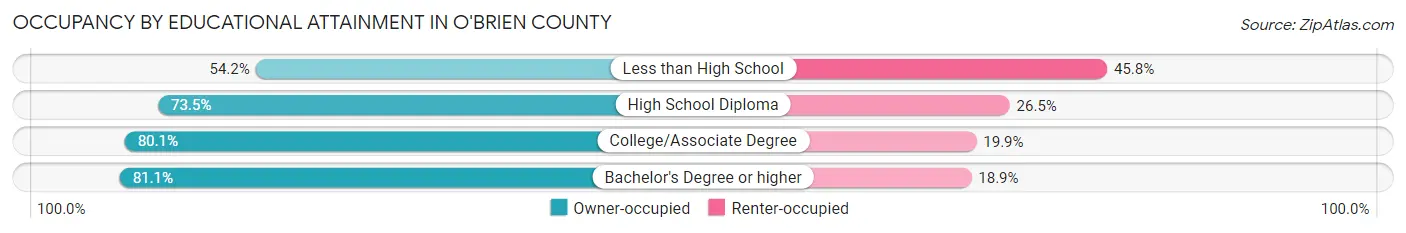
| Household Size | Owner-occupied | Renter-occupied |
| Less than High School | 225 (54.2%) | 190 (45.8%) |
| High School Diploma | 1,564 (73.5%) | 563 (26.5%) |
| College/Associate Degree | 1,469 (80.1%) | 364 (19.9%) |
| Bachelor's Degree or higher | 1,075 (81.1%) | 250 (18.9%) |
Occupancy by Age of Householder in O'Brien County
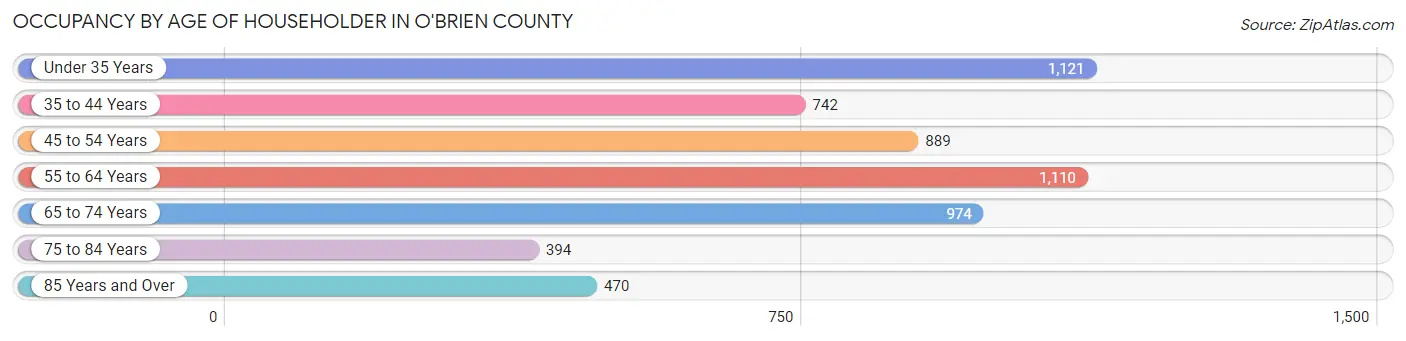
| Age Bracket | # Households | % Households |
| Under 35 Years | 1,121 | 19.7% |
| 35 to 44 Years | 742 | 13.0% |
| 45 to 54 Years | 889 | 15.6% |
| 55 to 64 Years | 1,110 | 19.5% |
| 65 to 74 Years | 974 | 17.1% |
| 75 to 84 Years | 394 | 6.9% |
| 85 Years and Over | 470 | 8.3% |
| Total | 5,700 | 100.0% |
Housing Finances in O'Brien County
Median Income by Occupancy in O'Brien County
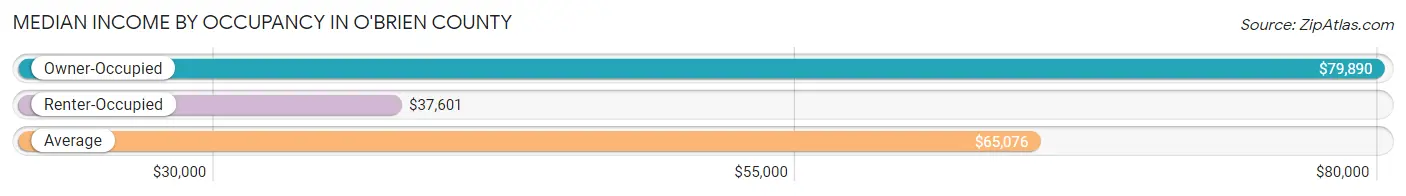
| Occupancy Type | # Households | Median Income |
| Owner-Occupied | 4,333 (76.0%) | $79,890 |
| Renter-Occupied | 1,367 (24.0%) | $37,601 |
| Average | 5,700 (100.0%) | $65,076 |
Occupancy by Householder Income Bracket in O'Brien County
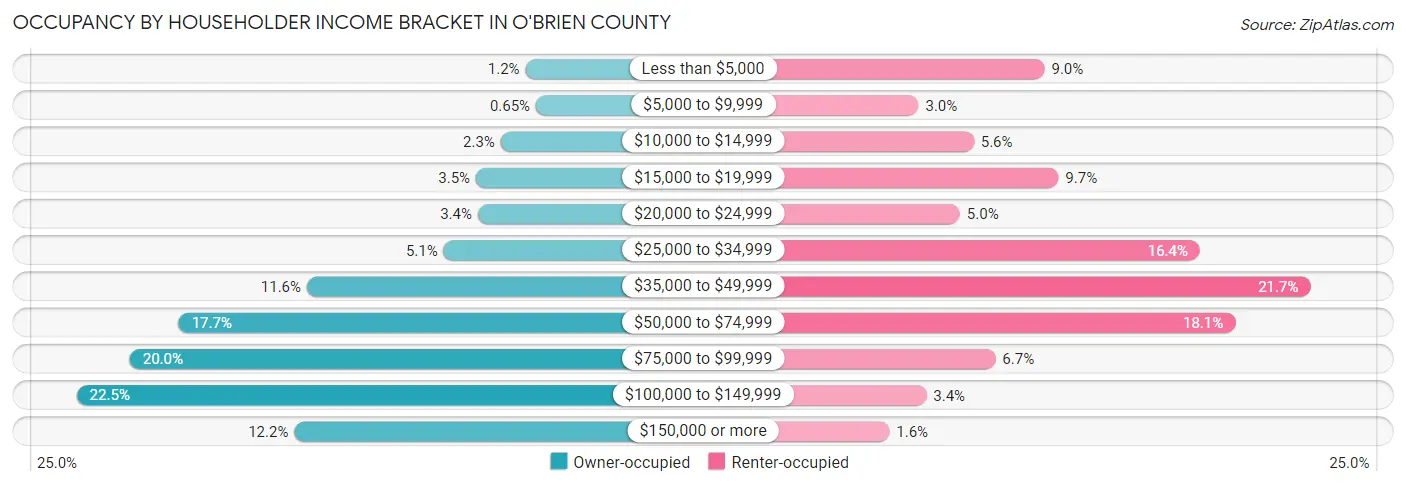
| Income Bracket | Owner-occupied | Renter-occupied |
| Less than $5,000 | 50 (1.1%) | 123 (9.0%) |
| $5,000 to $9,999 | 28 (0.6%) | 41 (3.0%) |
| $10,000 to $14,999 | 101 (2.3%) | 77 (5.6%) |
| $15,000 to $19,999 | 152 (3.5%) | 132 (9.7%) |
| $20,000 to $24,999 | 148 (3.4%) | 68 (5.0%) |
| $25,000 to $34,999 | 219 (5.1%) | 224 (16.4%) |
| $35,000 to $49,999 | 501 (11.6%) | 296 (21.6%) |
| $50,000 to $74,999 | 765 (17.7%) | 247 (18.1%) |
| $75,000 to $99,999 | 866 (20.0%) | 91 (6.7%) |
| $100,000 to $149,999 | 976 (22.5%) | 46 (3.4%) |
| $150,000 or more | 527 (12.2%) | 22 (1.6%) |
| Total | 4,333 (100.0%) | 1,367 (100.0%) |
Monthly Housing Cost Tiers in O'Brien County
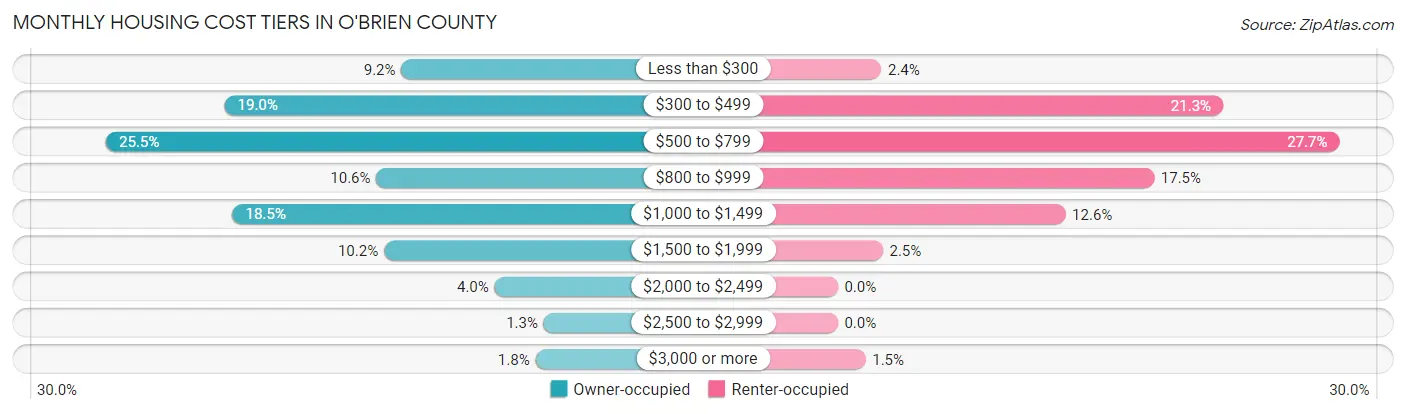
| Monthly Cost | Owner-occupied | Renter-occupied |
| Less than $300 | 398 (9.2%) | 33 (2.4%) |
| $300 to $499 | 821 (19.0%) | 291 (21.3%) |
| $500 to $799 | 1,105 (25.5%) | 379 (27.7%) |
| $800 to $999 | 458 (10.6%) | 239 (17.5%) |
| $1,000 to $1,499 | 802 (18.5%) | 172 (12.6%) |
| $1,500 to $1,999 | 440 (10.2%) | 34 (2.5%) |
| $2,000 to $2,499 | 175 (4.0%) | 0 (0.0%) |
| $2,500 to $2,999 | 57 (1.3%) | 0 (0.0%) |
| $3,000 or more | 77 (1.8%) | 21 (1.5%) |
| Total | 4,333 (100.0%) | 1,367 (100.0%) |
Physical Housing Characteristics in O'Brien County
Housing Structures in O'Brien County
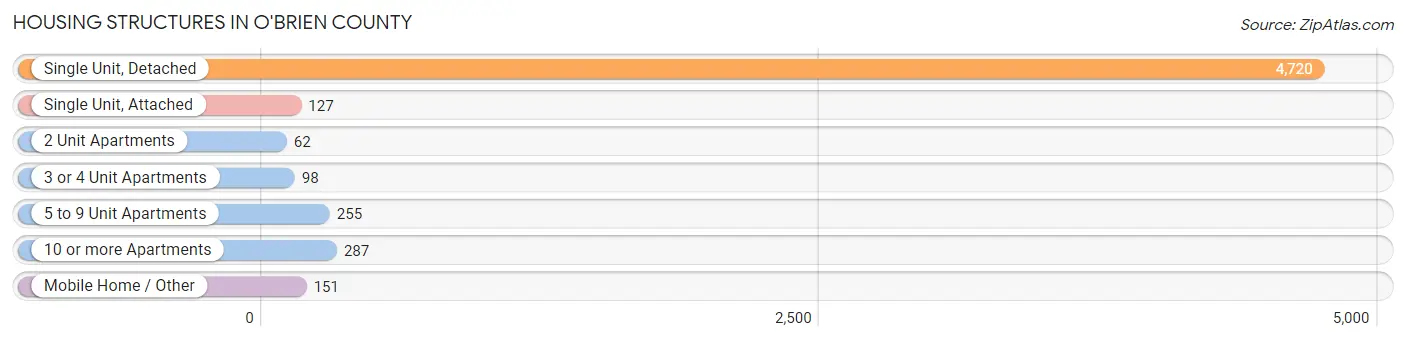
| Structure Type | # Housing Units | % Housing Units |
| Single Unit, Detached | 4,720 | 82.8% |
| Single Unit, Attached | 127 | 2.2% |
| 2 Unit Apartments | 62 | 1.1% |
| 3 or 4 Unit Apartments | 98 | 1.7% |
| 5 to 9 Unit Apartments | 255 | 4.5% |
| 10 or more Apartments | 287 | 5.0% |
| Mobile Home / Other | 151 | 2.6% |
| Total | 5,700 | 100.0% |
Housing Structures by Occupancy in O'Brien County
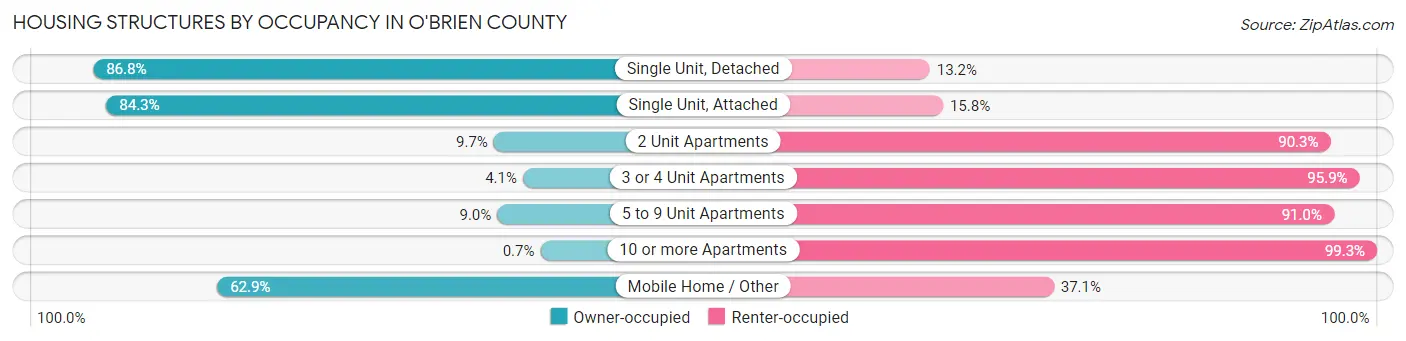
| Structure Type | Owner-occupied | Renter-occupied |
| Single Unit, Detached | 4,096 (86.8%) | 624 (13.2%) |
| Single Unit, Attached | 107 (84.3%) | 20 (15.8%) |
| 2 Unit Apartments | 6 (9.7%) | 56 (90.3%) |
| 3 or 4 Unit Apartments | 4 (4.1%) | 94 (95.9%) |
| 5 to 9 Unit Apartments | 23 (9.0%) | 232 (91.0%) |
| 10 or more Apartments | 2 (0.7%) | 285 (99.3%) |
| Mobile Home / Other | 95 (62.9%) | 56 (37.1%) |
| Total | 4,333 (76.0%) | 1,367 (24.0%) |
Housing Structures by Number of Rooms in O'Brien County
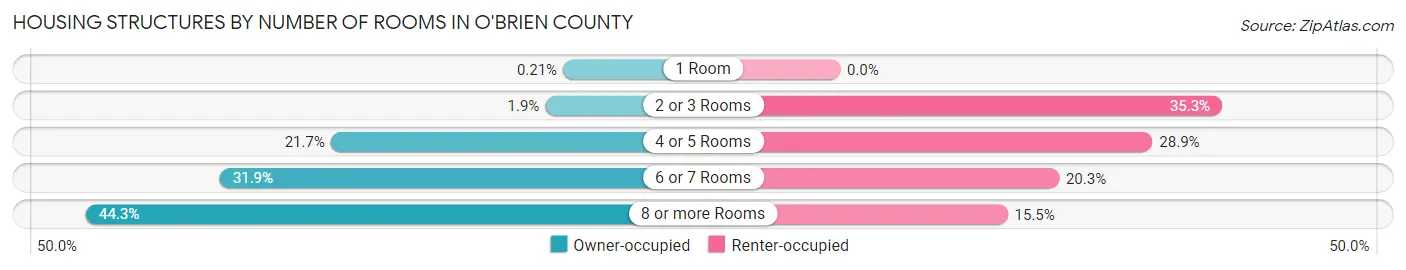
| Number of Rooms | Owner-occupied | Renter-occupied |
| 1 Room | 9 (0.2%) | 0 (0.0%) |
| 2 or 3 Rooms | 80 (1.8%) | 483 (35.3%) |
| 4 or 5 Rooms | 940 (21.7%) | 395 (28.9%) |
| 6 or 7 Rooms | 1,384 (31.9%) | 277 (20.3%) |
| 8 or more Rooms | 1,920 (44.3%) | 212 (15.5%) |
| Total | 4,333 (100.0%) | 1,367 (100.0%) |
Housing Structure by Heating Type in O'Brien County
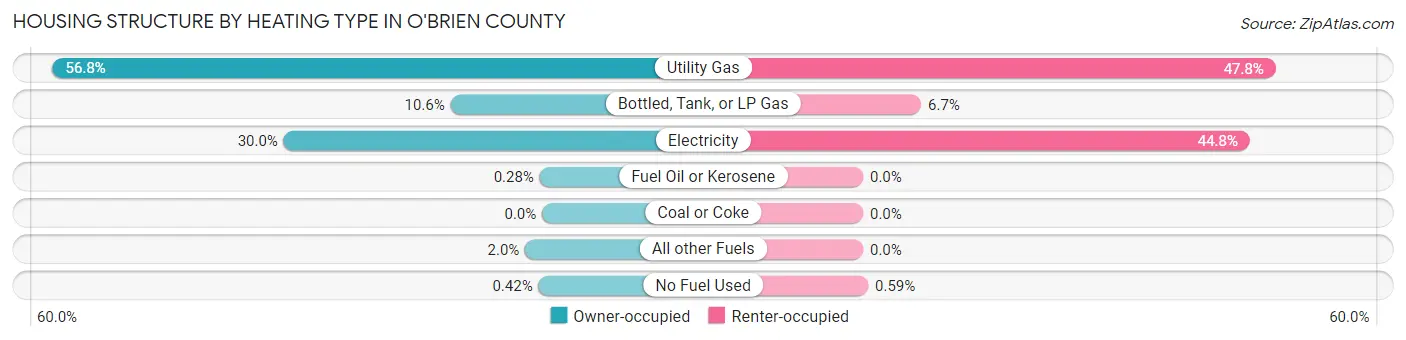
| Heating Type | Owner-occupied | Renter-occupied |
| Utility Gas | 2,460 (56.8%) | 654 (47.8%) |
| Bottled, Tank, or LP Gas | 460 (10.6%) | 92 (6.7%) |
| Electricity | 1,298 (30.0%) | 613 (44.8%) |
| Fuel Oil or Kerosene | 12 (0.3%) | 0 (0.0%) |
| Coal or Coke | 0 (0.0%) | 0 (0.0%) |
| All other Fuels | 85 (2.0%) | 0 (0.0%) |
| No Fuel Used | 18 (0.4%) | 8 (0.6%) |
| Total | 4,333 (100.0%) | 1,367 (100.0%) |
Household Vehicle Usage in O'Brien County
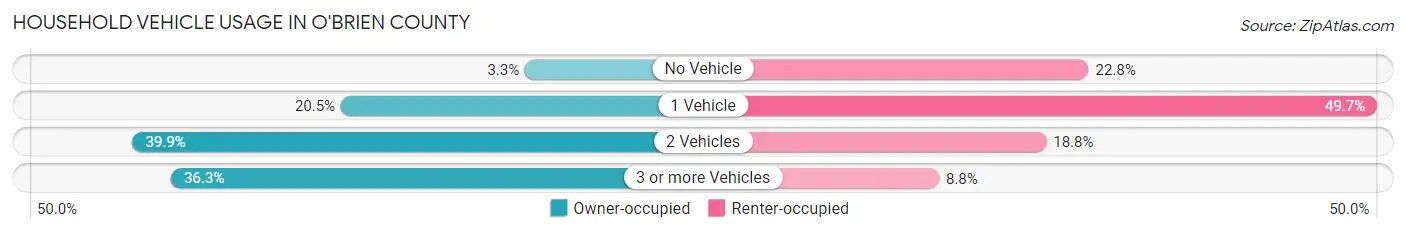
| Vehicles per Household | Owner-occupied | Renter-occupied |
| No Vehicle | 142 (3.3%) | 311 (22.8%) |
| 1 Vehicle | 887 (20.5%) | 679 (49.7%) |
| 2 Vehicles | 1,730 (39.9%) | 257 (18.8%) |
| 3 or more Vehicles | 1,574 (36.3%) | 120 (8.8%) |
| Total | 4,333 (100.0%) | 1,367 (100.0%) |
Real Estate & Mortgages in O'Brien County
Real Estate and Mortgage Overview in O'Brien County
| Characteristic | Without Mortgage | With Mortgage |
| Housing Units | 2,210 | 2,123 |
| Median Property Value | $125,400 | $157,300 |
| Median Household Income | $73,241 | $301 |
| Monthly Housing Costs | $474 | $77 |
| Real Estate Taxes | $1,416 | $10 |
Property Value by Mortgage Status in O'Brien County
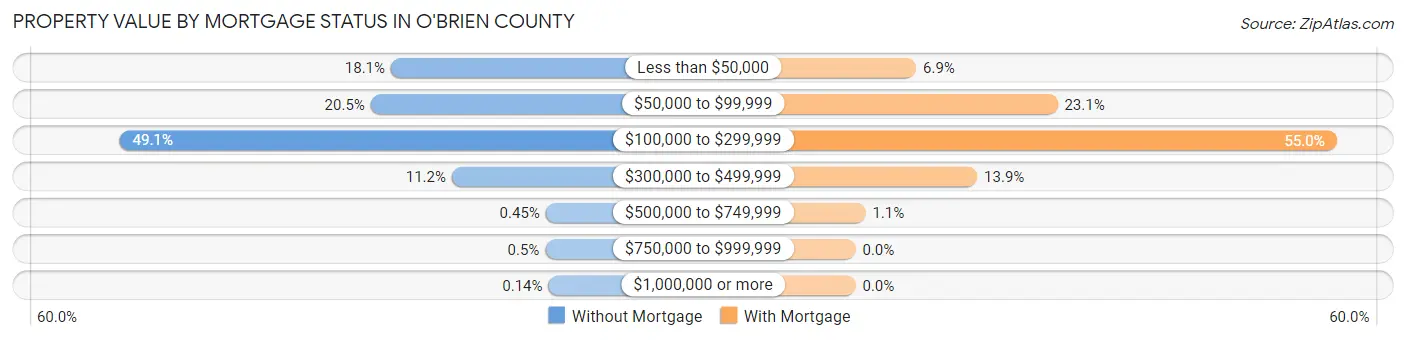
| Property Value | Without Mortgage | With Mortgage |
| Less than $50,000 | 401 (18.1%) | 147 (6.9%) |
| $50,000 to $99,999 | 452 (20.4%) | 490 (23.1%) |
| $100,000 to $299,999 | 1,086 (49.1%) | 1,167 (55.0%) |
| $300,000 to $499,999 | 247 (11.2%) | 295 (13.9%) |
| $500,000 to $749,999 | 10 (0.4%) | 24 (1.1%) |
| $750,000 to $999,999 | 11 (0.5%) | 0 (0.0%) |
| $1,000,000 or more | 3 (0.1%) | 0 (0.0%) |
| Total | 2,210 (100.0%) | 2,123 (100.0%) |
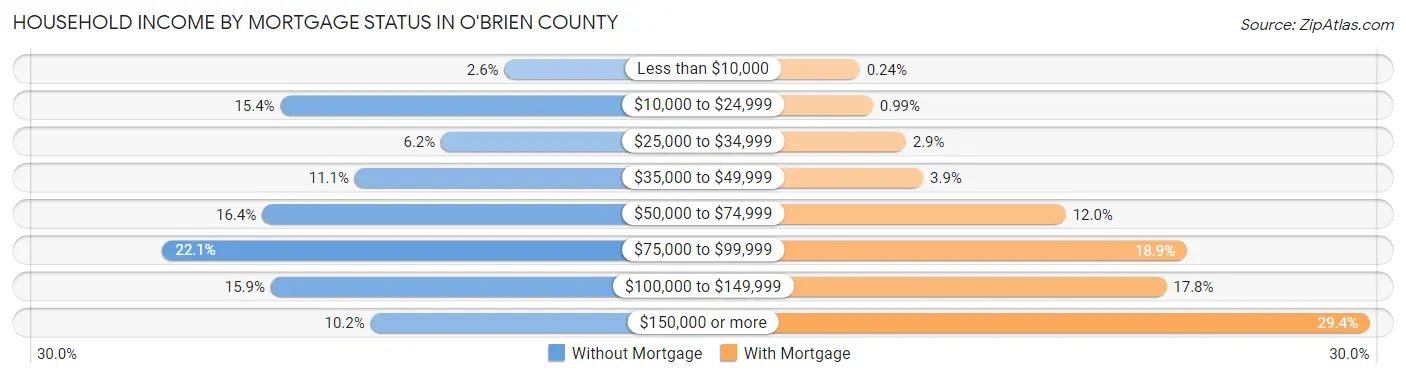
Household Income by Mortgage Status in O'Brien County
| Household Income | Without Mortgage | With Mortgage |
| Less than $10,000 | 57 (2.6%) | 5 (0.2%) |
| $10,000 to $24,999 | 340 (15.4%) | 21 (1.0%) |
| $25,000 to $34,999 | 137 (6.2%) | 61 (2.9%) |
| $35,000 to $49,999 | 246 (11.1%) | 82 (3.9%) |
| $50,000 to $74,999 | 363 (16.4%) | 255 (12.0%) |
| $75,000 to $99,999 | 489 (22.1%) | 402 (18.9%) |
| $100,000 to $149,999 | 352 (15.9%) | 377 (17.8%) |
| $150,000 or more | 226 (10.2%) | 624 (29.4%) |
| Total | 2,210 (100.0%) | 2,123 (100.0%) |
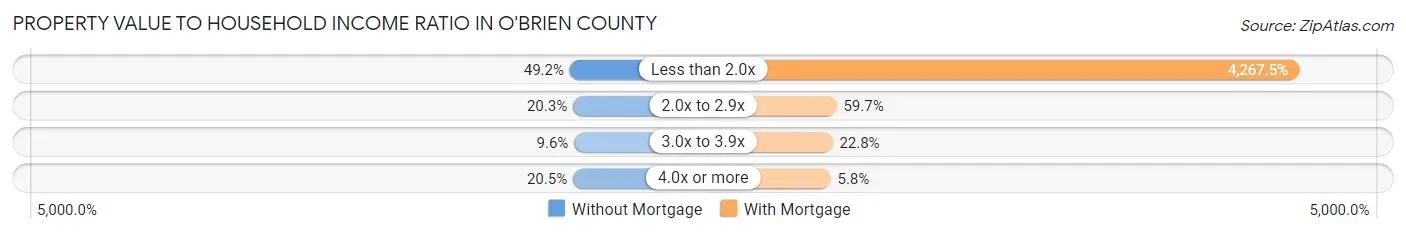
Property Value to Household Income Ratio in O'Brien County
| Value-to-Income Ratio | Without Mortgage | With Mortgage |
| Less than 2.0x | 1,087 (49.2%) | 90,599 (4,267.5%) |
| 2.0x to 2.9x | 448 (20.3%) | 1,267 (59.7%) |
| 3.0x to 3.9x | 213 (9.6%) | 483 (22.8%) |
| 4.0x or more | 452 (20.4%) | 122 (5.8%) |
| Total | 2,210 (100.0%) | 2,123 (100.0%) |
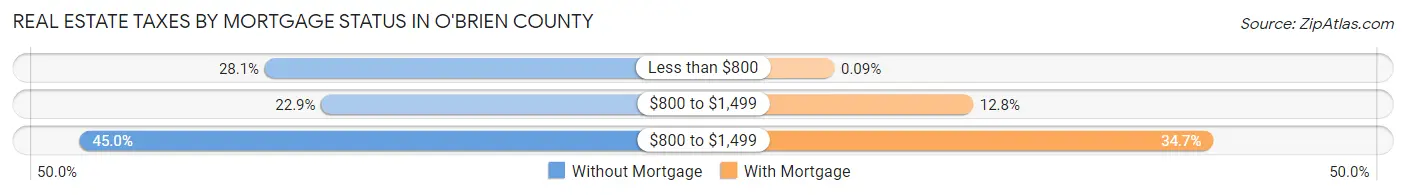
Real Estate Taxes by Mortgage Status in O'Brien County
| Property Taxes | Without Mortgage | With Mortgage |
| Less than $800 | 620 (28.1%) | 2 (0.1%) |
| $800 to $1,499 | 506 (22.9%) | 271 (12.8%) |
| $800 to $1,499 | 994 (45.0%) | 737 (34.7%) |
| Total | 2,210 (100.0%) | 2,123 (100.0%) |
Health & Disability in O'Brien County
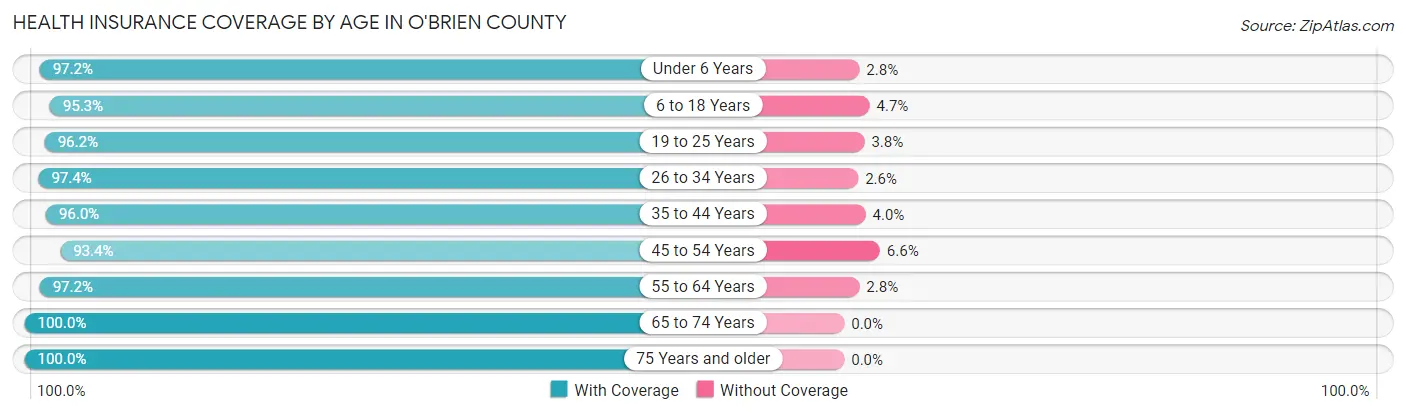
Health Insurance Coverage by Age in O'Brien County
| Age Bracket | With Coverage | Without Coverage |
| Under 6 Years | 1,103 (97.2%) | 32 (2.8%) |
| 6 to 18 Years | 2,323 (95.3%) | 115 (4.7%) |
| 19 to 25 Years | 921 (96.2%) | 36 (3.8%) |
| 26 to 34 Years | 1,502 (97.4%) | 40 (2.6%) |
| 35 to 44 Years | 1,592 (96.0%) | 66 (4.0%) |
| 45 to 54 Years | 1,350 (93.4%) | 96 (6.6%) |
| 55 to 64 Years | 1,828 (97.2%) | 53 (2.8%) |
| 65 to 74 Years | 1,490 (100.0%) | 0 (0.0%) |
| 75 Years and older | 1,333 (100.0%) | 0 (0.0%) |
| Total | 13,442 (96.8%) | 438 (3.2%) |
Health Insurance Coverage by Citizenship Status in O'Brien County
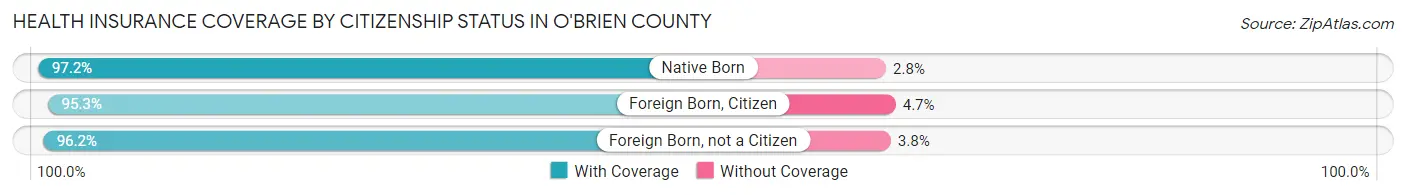
| Citizenship Status | With Coverage | Without Coverage |
| Native Born | 1,103 (97.2%) | 32 (2.8%) |
| Foreign Born, Citizen | 2,323 (95.3%) | 115 (4.7%) |
| Foreign Born, not a Citizen | 921 (96.2%) | 36 (3.8%) |
Health Insurance Coverage by Household Income in O'Brien County
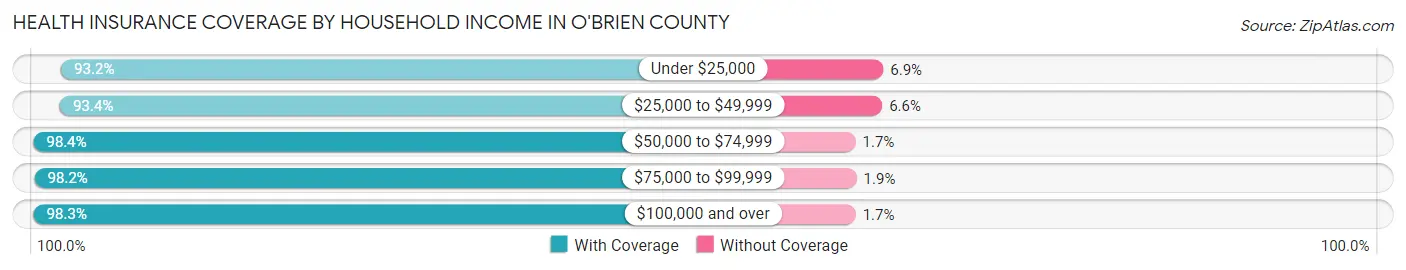
| Household Income | With Coverage | Without Coverage |
| Under $25,000 | 1,306 (93.1%) | 96 (6.9%) |
| $25,000 to $49,999 | 2,487 (93.4%) | 177 (6.6%) |
| $50,000 to $74,999 | 2,327 (98.4%) | 39 (1.7%) |
| $75,000 to $99,999 | 2,338 (98.2%) | 44 (1.8%) |
| $100,000 and over | 4,832 (98.3%) | 82 (1.7%) |
Public vs Private Health Insurance Coverage by Age in O'Brien County
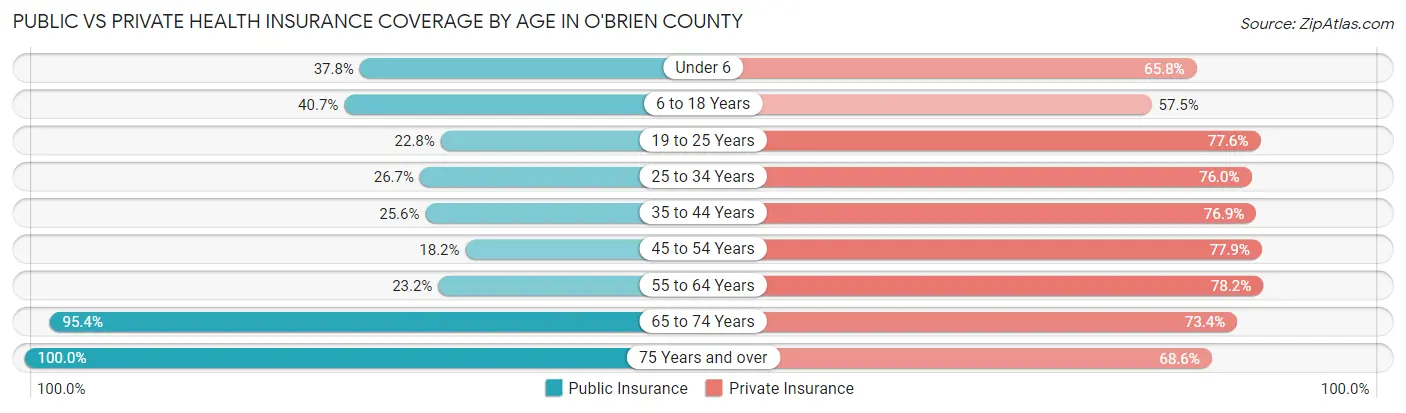
| Age Bracket | Public Insurance | Private Insurance |
| Under 6 | 429 (37.8%) | 747 (65.8%) |
| 6 to 18 Years | 992 (40.7%) | 1,402 (57.5%) |
| 19 to 25 Years | 218 (22.8%) | 743 (77.6%) |
| 25 to 34 Years | 411 (26.7%) | 1,172 (76.0%) |
| 35 to 44 Years | 425 (25.6%) | 1,275 (76.9%) |
| 45 to 54 Years | 263 (18.2%) | 1,127 (77.9%) |
| 55 to 64 Years | 437 (23.2%) | 1,471 (78.2%) |
| 65 to 74 Years | 1,421 (95.4%) | 1,093 (73.4%) |
| 75 Years and over | 1,333 (100.0%) | 915 (68.6%) |
| Total | 5,929 (42.7%) | 9,945 (71.7%) |
Disability Status by Sex by Age in O'Brien County
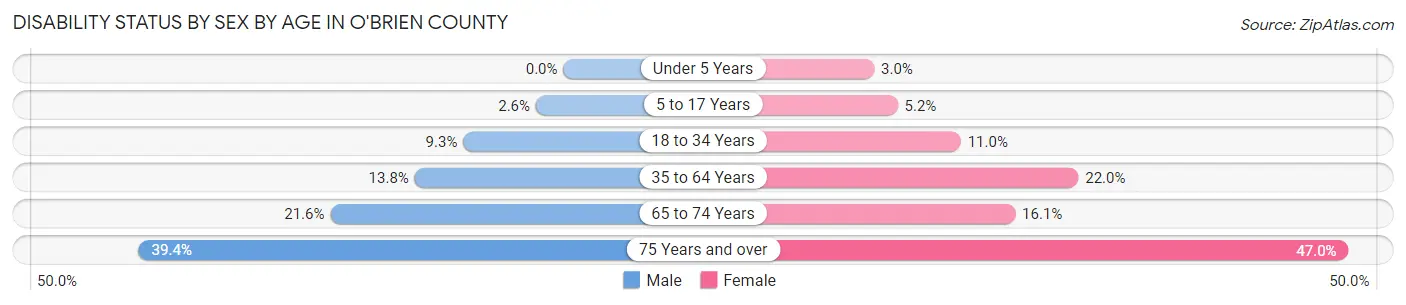
| Age Bracket | Male | Female |
| Under 5 Years | 0 (0.0%) | 14 (3.0%) |
| 5 to 17 Years | 31 (2.5%) | 65 (5.2%) |
| 18 to 34 Years | 133 (9.3%) | 141 (11.0%) |
| 35 to 64 Years | 356 (13.8%) | 528 (22.0%) |
| 65 to 74 Years | 165 (21.6%) | 117 (16.1%) |
| 75 Years and over | 201 (39.4%) | 387 (47.0%) |
Disability Class by Sex by Age in O'Brien County
Disability Class: Hearing Difficulty
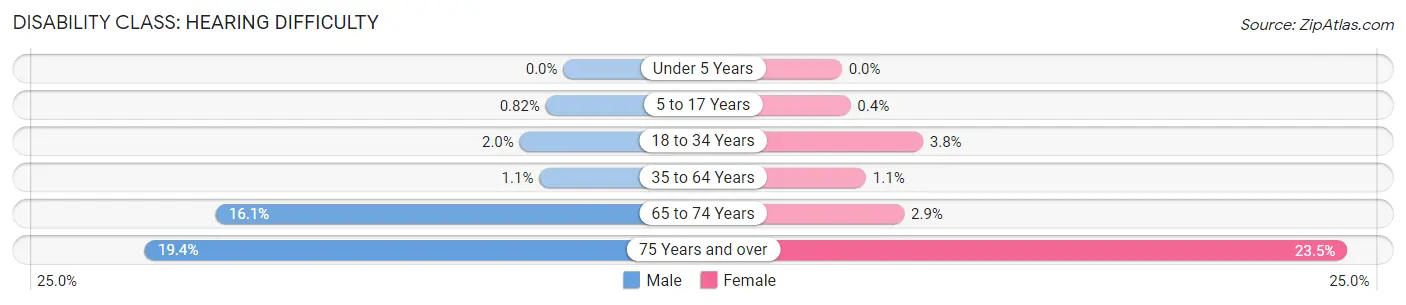
| Age Bracket | Male | Female |
| Under 5 Years | 0 (0.0%) | 0 (0.0%) |
| 5 to 17 Years | 10 (0.8%) | 5 (0.4%) |
| 18 to 34 Years | 29 (2.0%) | 48 (3.8%) |
| 35 to 64 Years | 29 (1.1%) | 27 (1.1%) |
| 65 to 74 Years | 123 (16.1%) | 21 (2.9%) |
| 75 Years and over | 99 (19.4%) | 193 (23.4%) |
Disability Class: Vision Difficulty
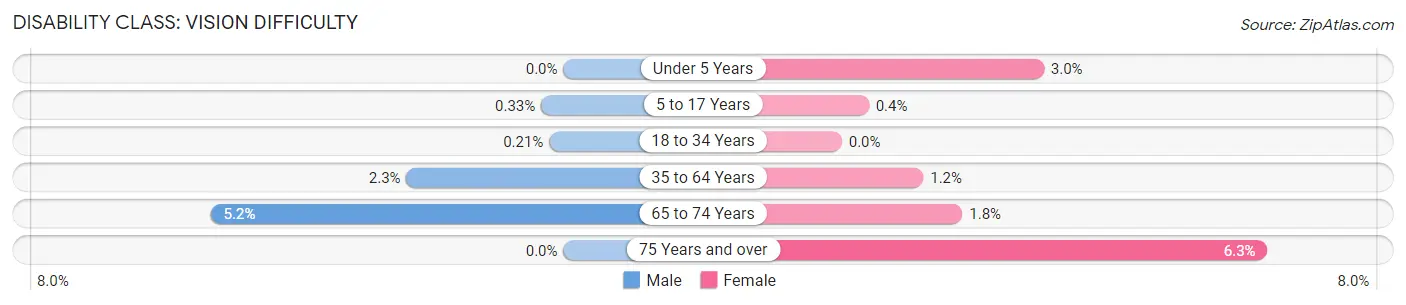
| Age Bracket | Male | Female |
| Under 5 Years | 0 (0.0%) | 14 (3.0%) |
| 5 to 17 Years | 4 (0.3%) | 5 (0.4%) |
| 18 to 34 Years | 3 (0.2%) | 0 (0.0%) |
| 35 to 64 Years | 60 (2.3%) | 29 (1.2%) |
| 65 to 74 Years | 40 (5.2%) | 13 (1.8%) |
| 75 Years and over | 0 (0.0%) | 52 (6.3%) |
Disability Class: Cognitive Difficulty
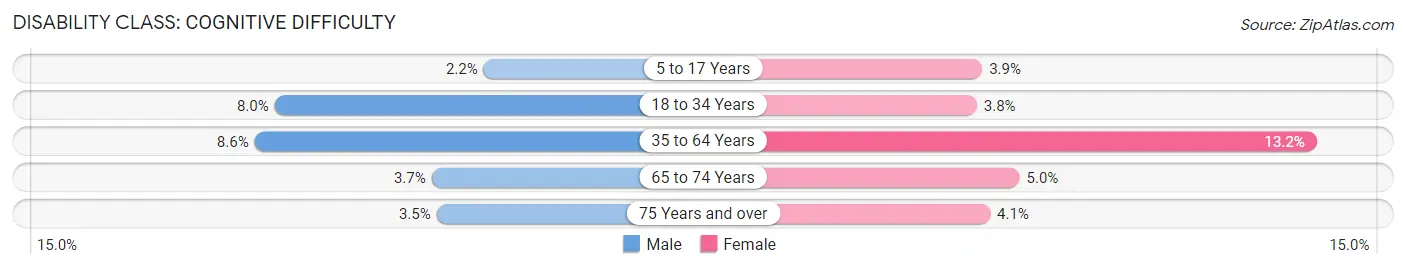
| Age Bracket | Male | Female |
| 5 to 17 Years | 27 (2.2%) | 49 (3.9%) |
| 18 to 34 Years | 115 (8.0%) | 48 (3.8%) |
| 35 to 64 Years | 222 (8.6%) | 318 (13.2%) |
| 65 to 74 Years | 28 (3.7%) | 36 (5.0%) |
| 75 Years and over | 18 (3.5%) | 34 (4.1%) |
Disability Class: Ambulatory Difficulty
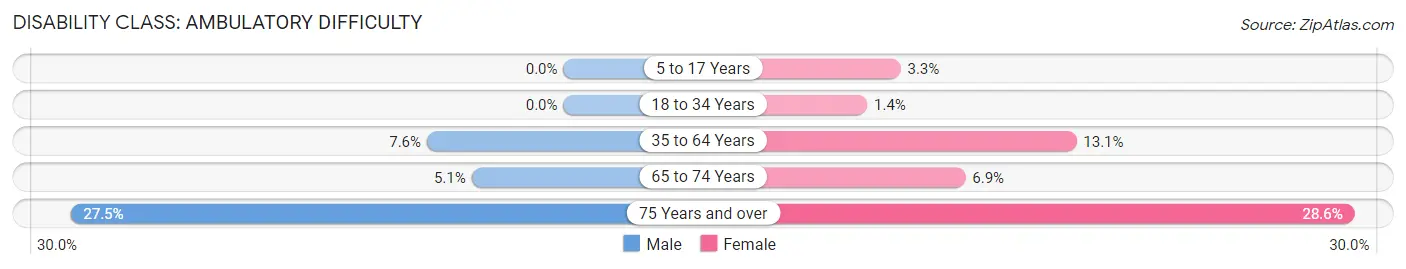
| Age Bracket | Male | Female |
| 5 to 17 Years | 0 (0.0%) | 41 (3.3%) |
| 18 to 34 Years | 0 (0.0%) | 18 (1.4%) |
| 35 to 64 Years | 196 (7.6%) | 314 (13.1%) |
| 65 to 74 Years | 39 (5.1%) | 50 (6.9%) |
| 75 Years and over | 140 (27.5%) | 235 (28.5%) |
Disability Class: Self-Care Difficulty
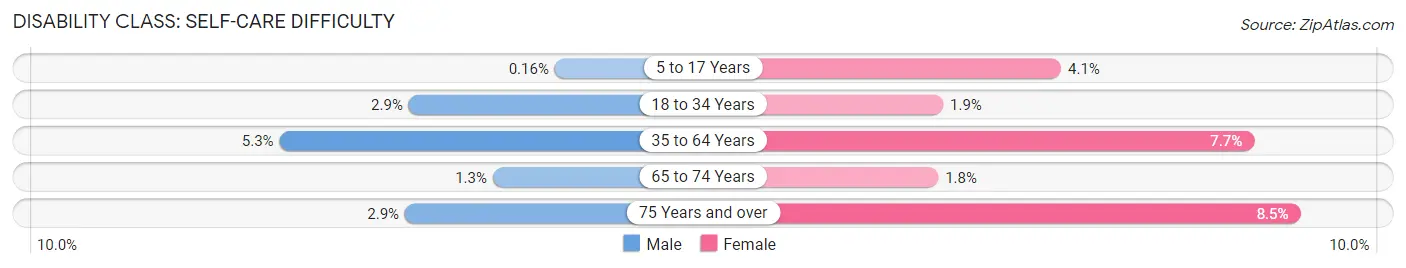
| Age Bracket | Male | Female |
| 5 to 17 Years | 2 (0.2%) | 51 (4.1%) |
| 18 to 34 Years | 41 (2.9%) | 24 (1.9%) |
| 35 to 64 Years | 136 (5.3%) | 184 (7.6%) |
| 65 to 74 Years | 10 (1.3%) | 13 (1.8%) |
| 75 Years and over | 15 (2.9%) | 70 (8.5%) |
Technology Access in O'Brien County
Computing Device Access in O'Brien County
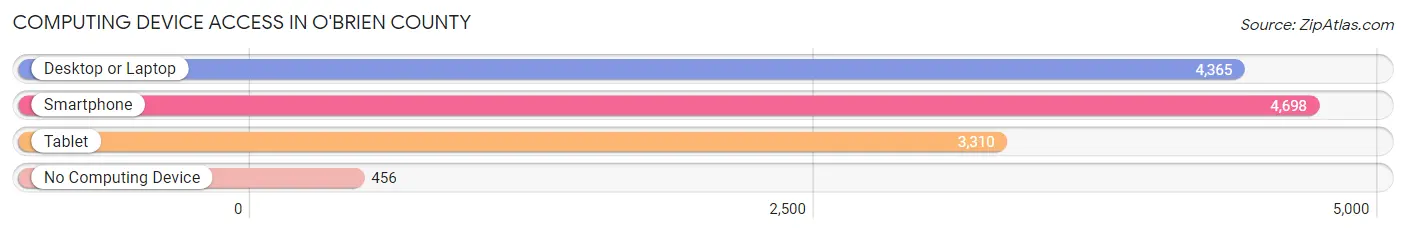
| Device Type | # Households | % Households |
| Desktop or Laptop | 4,365 | 76.6% |
| Smartphone | 4,698 | 82.4% |
| Tablet | 3,310 | 58.1% |
| No Computing Device | 456 | 8.0% |
| Total | 5,700 | 100.0% |
Internet Access in O'Brien County
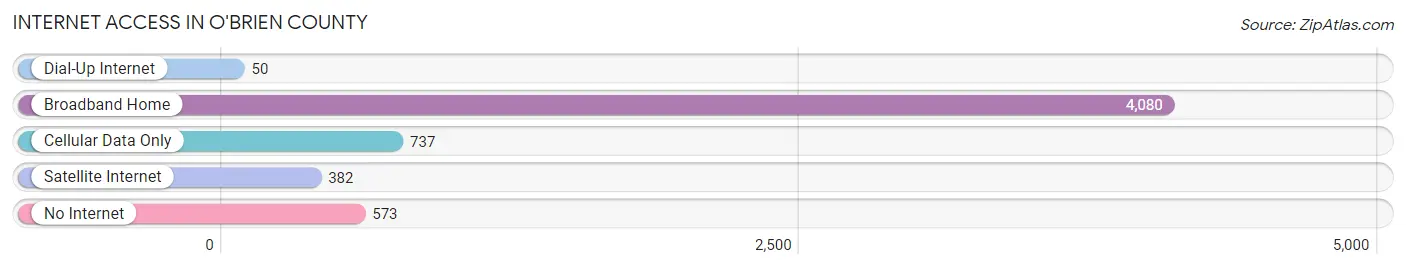
| Internet Type | # Households | % Households |
| Dial-Up Internet | 50 | 0.9% |
| Broadband Home | 4,080 | 71.6% |
| Cellular Data Only | 737 | 12.9% |
| Satellite Internet | 382 | 6.7% |
| No Internet | 573 | 10.1% |
| Total | 5,700 | 100.0% |
O'Brien County Summary
O’Brien County is located in the northwest corner of Iowa, and is bordered by Clay, Osceola, Dickinson, and Cherokee counties. It is part of the Sioux City, IA-NE-SD Metropolitan Statistical Area. The county was established in 1851 and named after William Smith O’Brien, an Irish patriot. As of the 2010 census, the population was 14,398.
Geography
O’Brien County covers an area of 576 square miles, making it the fourth smallest county in Iowa. The terrain is mostly flat, with some rolling hills in the northern part of the county. The county is drained by the Little Sioux River, which flows through the center of the county. The highest point in the county is located in the northwest corner, at an elevation of 1,541 feet.
The county is home to several state parks and wildlife areas, including the Little Sioux State Park, the O’Brien State Park, and the O’Brien Wildlife Area. The county also contains several lakes, including Lake O’Brien, Lake Poinsett, and Lake Ocheyedan.
Economy
Agriculture is the main economic activity in O’Brien County. The county is home to several large farms, and the majority of the population is employed in the agricultural sector. The county is also home to several food processing plants, including a Tyson Foods plant in Primghar.
The county is also home to several manufacturing companies, including a John Deere plant in Primghar and a Cargill plant in Sanborn. The county is also home to several wind farms, which provide a significant portion of the county’s energy needs.
Demographics
As of the 2010 census, the population of O’Brien County was 14,398. The racial makeup of the county was 95.3% White, 0.7% African American, 0.3% Native American, 0.3% Asian, 0.1% Pacific Islander, 2.2% from other races, and 1.3% from two or more races. Hispanic or Latino of any race were 4.2% of the population.
The median household income in the county was $45,945, and the median family income was $53,917. The per capita income was $21,845. About 8.3% of families and 11.2% of the population were below the poverty line, including 14.2% of those under age 18 and 8.2% of those age 65 or over.
The county is served by several school districts, including the Primghar Community School District, the Sheldon Community School District, and the South O’Brien Community School District. The county is also home to several private schools, including the O’Brien County Christian School and the O’Brien County Catholic School.
O’Brien County is served by several local media outlets, including the Sheldon Mail, the Primghar Times, and the O’Brien County Tribune. The county is also served by several radio and television stations, including KIWA-FM and KIWA-AM.
O’Brien County is home to several attractions, including the O’Brien County Historical Museum, the O’Brien County Fairgrounds, and the O’Brien County Speedway. The county is also home to several parks and recreational areas, including the Little Sioux State Park, the O’Brien State Park, and the O’Brien Wildlife Area.
Common Questions
What is Per Capita Income in O'Brien County?
Per Capita income in O'Brien County is $32,460.
What is the Median Family Income in O'Brien County?
Median Family Income in O'Brien County is $89,832.
What is the Median Household income in O'Brien County?
Median Household Income in O'Brien County is $65,076.
What is Income or Wage Gap in O'Brien County?
Income or Wage Gap in O'Brien County is 51.3%.
Women in O'Brien County earn 48.7 cents for every dollar earned by a man.
What is Inequality or Gini Index in O'Brien County?
Inequality or Gini Index in O'Brien County is 0.40.
What is the Total Population of O'Brien County?
Total Population of O'Brien County is 14,138.
What is the Total Male Population of O'Brien County?
Total Male Population of O'Brien County is 7,007.
What is the Total Female Population of O'Brien County?
Total Female Population of O'Brien County is 7,131.
What is the Ratio of Males per 100 Females in O'Brien County?
There are 98.26 Males per 100 Females in O'Brien County.
What is the Ratio of Females per 100 Males in O'Brien County?
There are 101.77 Females per 100 Males in O'Brien County.
What is the Median Population Age in O'Brien County?
Median Population Age in O'Brien County is 40.4 Years.
What is the Average Family Size in O'Brien County
Average Family Size in O'Brien County is 3.0 People.
What is the Average Household Size in O'Brien County
Average Household Size in O'Brien County is 2.4 People.
How Large is the Labor Force in O'Brien County?
There are 7,129 People in the Labor Forcein in O'Brien County.
What is the Percentage of People in the Labor Force in O'Brien County?
64.0% of People are in the Labor Force in O'Brien County.
What is the Unemployment Rate in O'Brien County?
Unemployment Rate in O'Brien County is 2.4%.