Madison County, IA Map & Demographics
Madison County Map
Madison County Overview
$39,442
PER CAPITA INCOME
$105,706
AVG FAMILY INCOME
$88,110
AVG HOUSEHOLD INCOME
33.8%
WAGE / INCOME GAP [ % ]
66.2¢/ $1
WAGE / INCOME GAP [ $ ]
0.37
INEQUALITY / GINI INDEX
16,609
TOTAL POPULATION
8,470
MALE POPULATION
8,139
FEMALE POPULATION
104.07
MALES / 100 FEMALES
96.09
FEMALES / 100 MALES
40.9
MEDIAN AGE
3.1
AVG FAMILY SIZE
2.5
AVG HOUSEHOLD SIZE
9,291
LABOR FORCE [ PEOPLE ]
71.5%
PERCENT IN LABOR FORCE
2.3%
UNEMPLOYMENT RATE
Income in Madison County
Income Overview in Madison County
Per Capita Income in Madison County is $39,442, while median incomes of families and households are $105,706 and $88,110 respectively.
| Characteristic | Number | Measure |
| Per Capita Income | 16,609 | $39,442 |
| Median Family Income | 4,397 | $105,706 |
| Mean Family Income | 4,397 | $115,617 |
| Median Household Income | 6,475 | $88,110 |
| Mean Household Income | 6,475 | $98,671 |
| Income Deficit | 4,397 | $0 |
| Wage / Income Gap (%) | 16,609 | 33.76% |
| Wage / Income Gap ($) | 16,609 | 66.24¢ per $1 |
| Gini / Inequality Index | 16,609 | 0.37 |
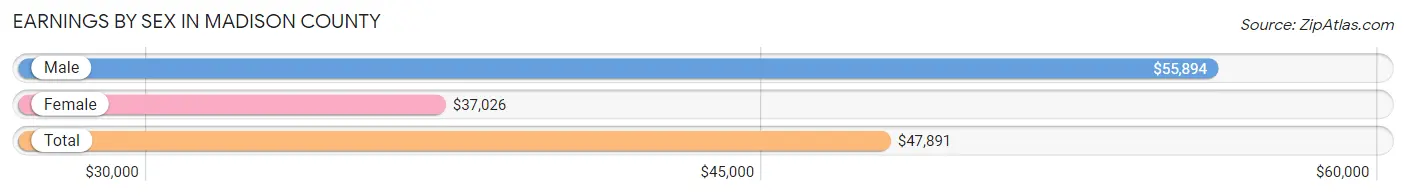
Earnings by Sex in Madison County
Average Earnings in Madison County are $47,891, $55,894 for men and $37,026 for women, a difference of 33.8%.
| Sex | Number | Average Earnings |
| Male | 5,101 (52.9%) | $55,894 |
| Female | 4,534 (47.1%) | $37,026 |
| Total | 9,635 (100.0%) | $47,891 |
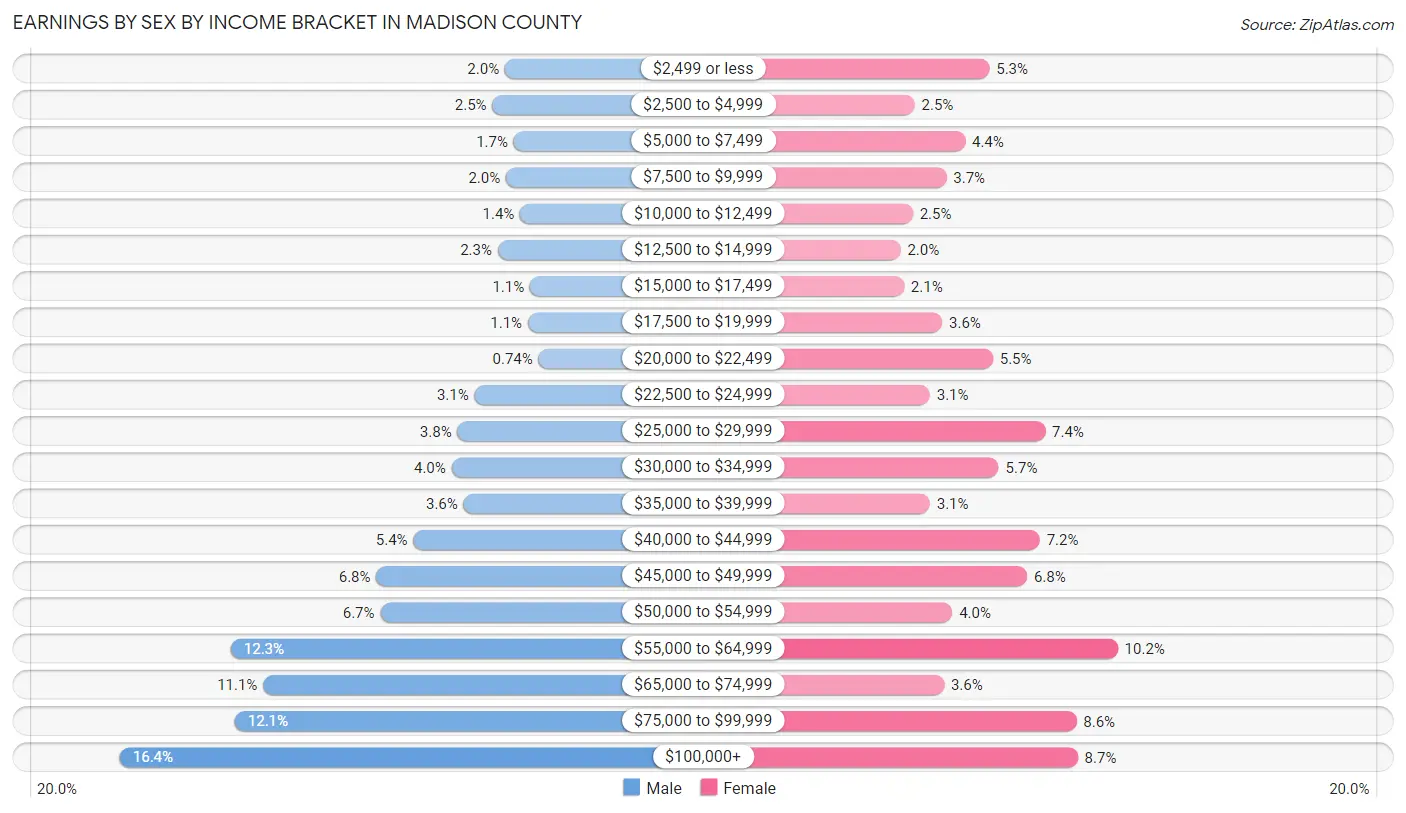
Earnings by Sex by Income Bracket in Madison County
The most common earnings brackets in Madison County are $100,000+ for men (838 | 16.4%) and $55,000 to $64,999 for women (460 | 10.2%).
| Income | Male | Female |
| $2,499 or less | 102 (2.0%) | 242 (5.3%) |
| $2,500 to $4,999 | 126 (2.5%) | 115 (2.5%) |
| $5,000 to $7,499 | 85 (1.7%) | 201 (4.4%) |
| $7,500 to $9,999 | 100 (2.0%) | 169 (3.7%) |
| $10,000 to $12,499 | 73 (1.4%) | 112 (2.5%) |
| $12,500 to $14,999 | 116 (2.3%) | 91 (2.0%) |
| $15,000 to $17,499 | 54 (1.1%) | 97 (2.1%) |
| $17,500 to $19,999 | 58 (1.1%) | 162 (3.6%) |
| $20,000 to $22,499 | 38 (0.7%) | 248 (5.5%) |
| $22,500 to $24,999 | 160 (3.1%) | 141 (3.1%) |
| $25,000 to $29,999 | 193 (3.8%) | 337 (7.4%) |
| $30,000 to $34,999 | 204 (4.0%) | 258 (5.7%) |
| $35,000 to $39,999 | 181 (3.5%) | 141 (3.1%) |
| $40,000 to $44,999 | 277 (5.4%) | 328 (7.2%) |
| $45,000 to $49,999 | 348 (6.8%) | 306 (6.8%) |
| $50,000 to $54,999 | 340 (6.7%) | 179 (4.0%) |
| $55,000 to $64,999 | 626 (12.3%) | 460 (10.2%) |
| $65,000 to $74,999 | 564 (11.1%) | 165 (3.6%) |
| $75,000 to $99,999 | 618 (12.1%) | 390 (8.6%) |
| $100,000+ | 838 (16.4%) | 392 (8.6%) |
| Total | 5,101 (100.0%) | 4,534 (100.0%) |
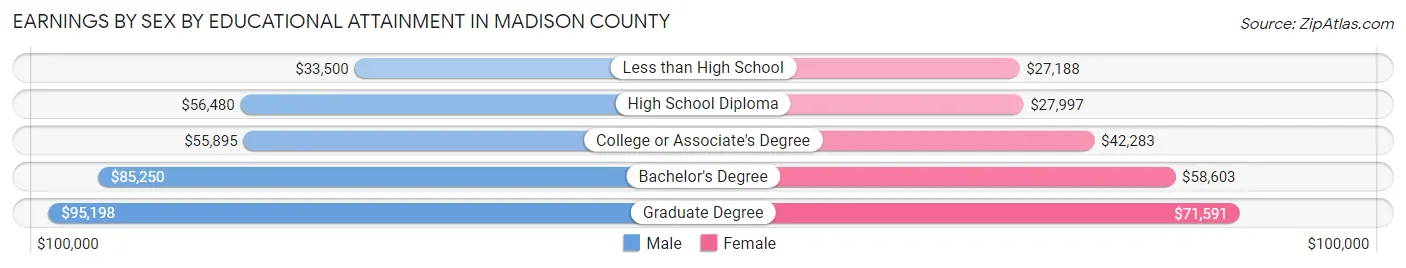
Earnings by Sex by Educational Attainment in Madison County
Average earnings in Madison County are $58,887 for men and $42,586 for women, a difference of 27.7%. Men with an educational attainment of graduate degree enjoy the highest average annual earnings of $95,198, while those with less than high school education earn the least with $33,500. Women with an educational attainment of graduate degree earn the most with the average annual earnings of $71,591, while those with less than high school education have the smallest earnings of $27,188.
| Educational Attainment | Male Income | Female Income |
| Less than High School | $33,500 | $27,188 |
| High School Diploma | $56,480 | $27,997 |
| College or Associate's Degree | $55,895 | $42,283 |
| Bachelor's Degree | $85,250 | $58,603 |
| Graduate Degree | $95,198 | $71,591 |
| Total | $58,887 | $42,586 |
Family Income in Madison County
Family Income Brackets in Madison County
According to the Madison County family income data, there are 1,403 families falling into the $100,000 to $149,999 income range, which is the most common income bracket and makes up 31.9% of all families. Conversely, the less than $10,000 income bracket is the least frequent group with only 13 families (0.3%) belonging to this category.
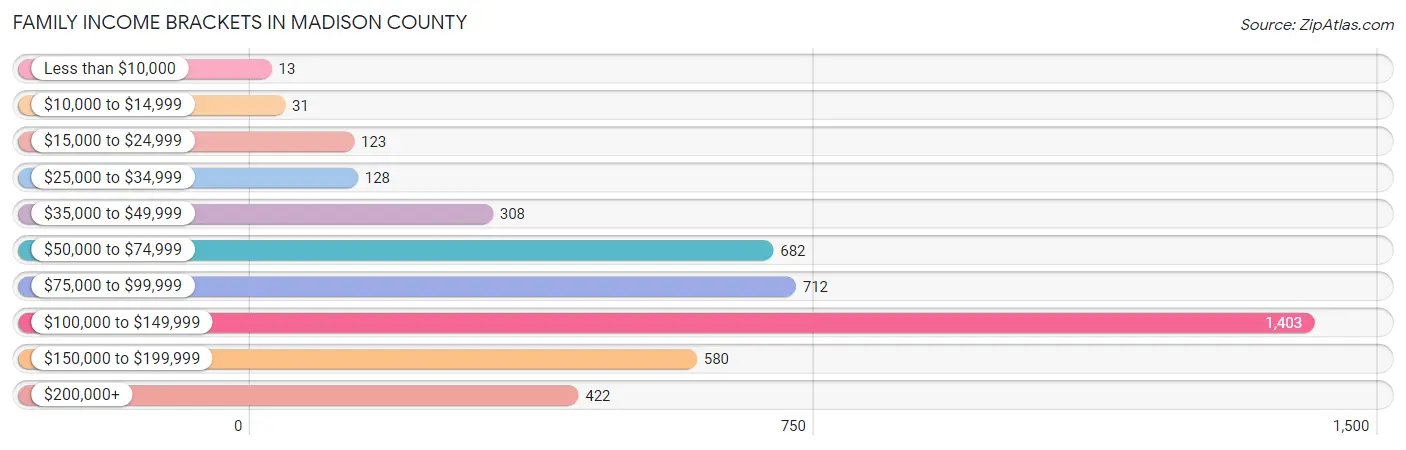
| Income Bracket | # Families | % Families |
| Less than $10,000 | 13 | 0.3% |
| $10,000 to $14,999 | 31 | 0.7% |
| $15,000 to $24,999 | 123 | 2.8% |
| $25,000 to $34,999 | 128 | 2.9% |
| $35,000 to $49,999 | 308 | 7.0% |
| $50,000 to $74,999 | 682 | 15.5% |
| $75,000 to $99,999 | 712 | 16.2% |
| $100,000 to $149,999 | 1,403 | 31.9% |
| $150,000 to $199,999 | 580 | 13.2% |
| $200,000+ | 422 | 9.6% |
Family Income by Famaliy Size in Madison County
5-person families (264 | 6.0%) account for the highest median family income in Madison County with $146,250 per family, while 2-person families (2,102 | 47.8%) have the highest median income of $51,340 per family member.
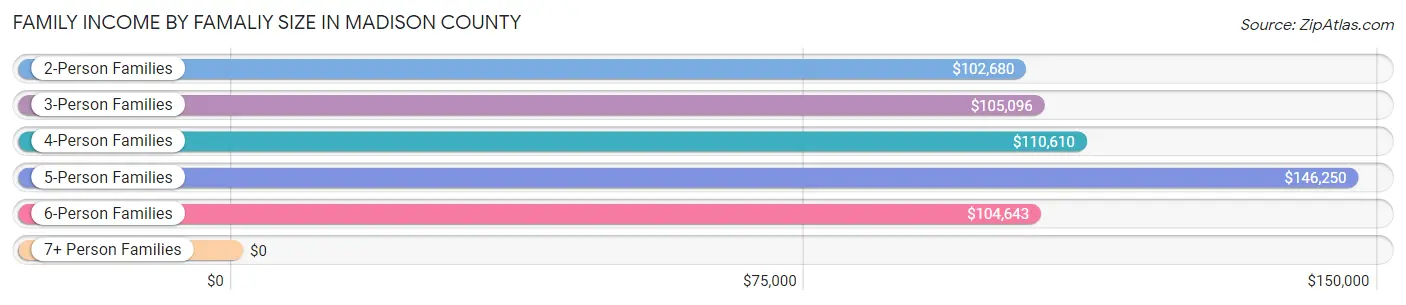
| Income Bracket | # Families | Median Income |
| 2-Person Families | 2,102 (47.8%) | $102,680 |
| 3-Person Families | 883 (20.1%) | $105,096 |
| 4-Person Families | 966 (22.0%) | $110,610 |
| 5-Person Families | 264 (6.0%) | $146,250 |
| 6-Person Families | 122 (2.8%) | $104,643 |
| 7+ Person Families | 60 (1.4%) | $0 |
| Total | 4,397 (100.0%) | $105,706 |
Family Income by Number of Earners in Madison County
The median family income in Madison County is $105,706, with families comprising 3+ earners (543) having the highest median family income of $155,810, while families with no earners (427) have the lowest median family income of $57,250, accounting for 12.3% and 9.7% of families, respectively.
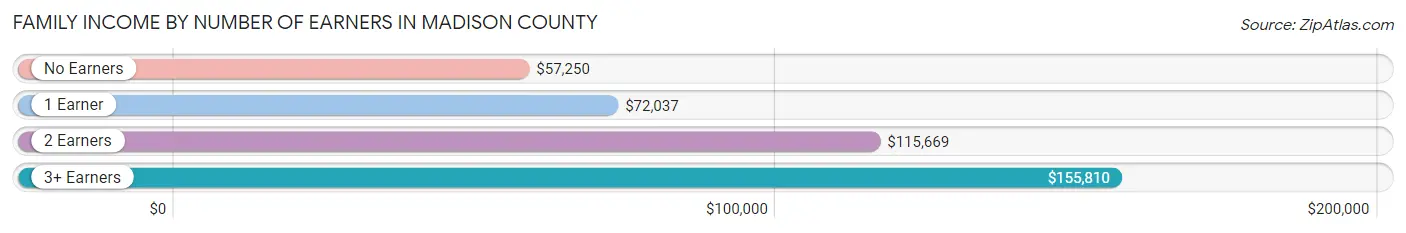
| Number of Earners | # Families | Median Income |
| No Earners | 427 (9.7%) | $57,250 |
| 1 Earner | 1,092 (24.8%) | $72,037 |
| 2 Earners | 2,335 (53.1%) | $115,669 |
| 3+ Earners | 543 (12.3%) | $155,810 |
| Total | 4,397 (100.0%) | $105,706 |
Household Income in Madison County
Household Income Brackets in Madison County
With 1,709 households falling in the category, the $100,000 to $149,999 income range is the most frequent in Madison County, accounting for 26.4% of all households. In contrast, only 84 households (1.3%) fall into the less than $10,000 income bracket, making it the least populous group.
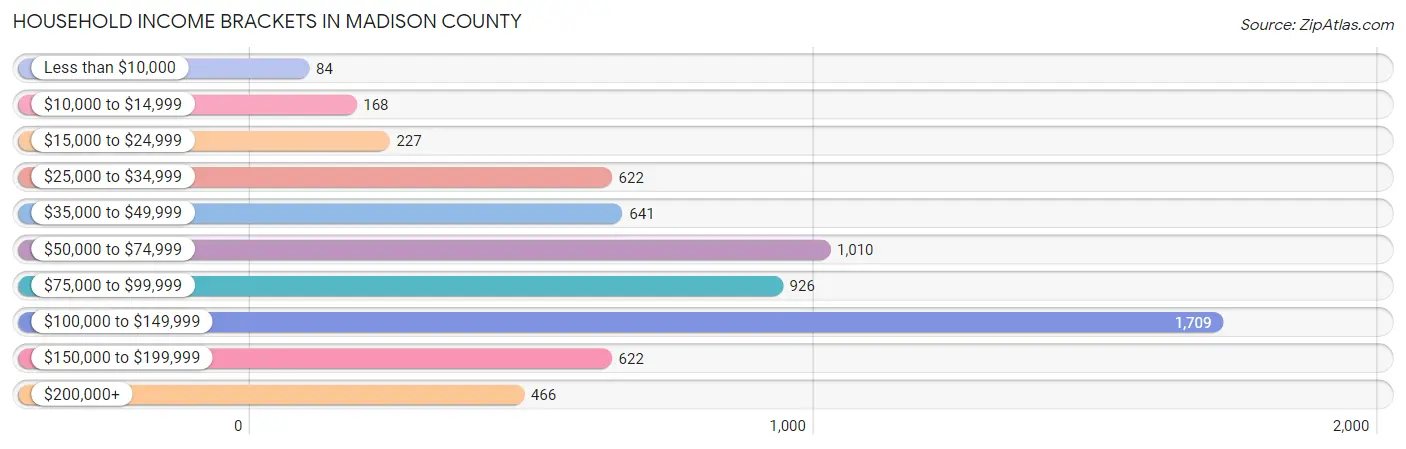
| Income Bracket | # Households | % Households |
| Less than $10,000 | 84 | 1.3% |
| $10,000 to $14,999 | 168 | 2.6% |
| $15,000 to $24,999 | 227 | 3.5% |
| $25,000 to $34,999 | 622 | 9.6% |
| $35,000 to $49,999 | 641 | 9.9% |
| $50,000 to $74,999 | 1,010 | 15.6% |
| $75,000 to $99,999 | 926 | 14.3% |
| $100,000 to $149,999 | 1,709 | 26.4% |
| $150,000 to $199,999 | 622 | 9.6% |
| $200,000+ | 466 | 7.2% |
Household Income by Householder Age in Madison County
The median household income in Madison County is $88,110, with the highest median household income of $111,222 found in the 45 to 64 years age bracket for the primary householder. A total of 2,422 households (37.4%) fall into this category. Meanwhile, the 65+ years age bracket for the primary householder has the lowest median household income of $46,811, with 2,021 households (31.2%) in this group.
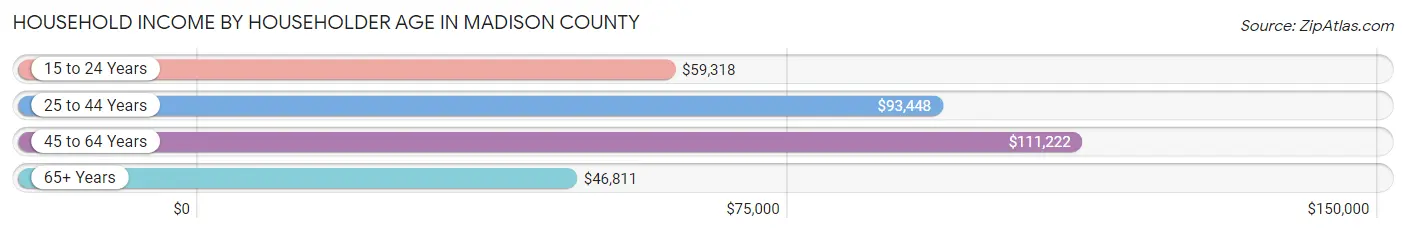
| Income Bracket | # Households | Median Income |
| 15 to 24 Years | 130 (2.0%) | $59,318 |
| 25 to 44 Years | 1,902 (29.4%) | $93,448 |
| 45 to 64 Years | 2,422 (37.4%) | $111,222 |
| 65+ Years | 2,021 (31.2%) | $46,811 |
| Total | 6,475 (100.0%) | $88,110 |
Poverty in Madison County
Income Below Poverty by Sex and Age in Madison County
With 4.4% poverty level for males and 8.0% for females among the residents of Madison County, 16 and 17 year old males and 15 year old females are the most vulnerable to poverty, with 37 males (15.9%) and 25 females (32.1%) in their respective age groups living below the poverty level.
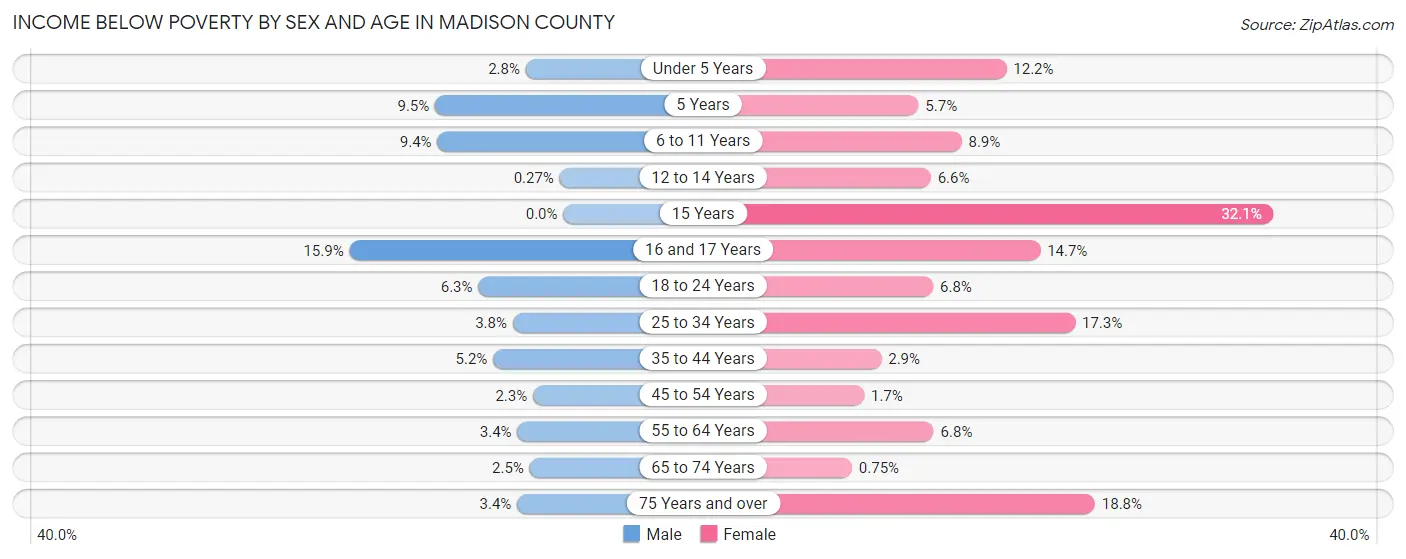
| Age Bracket | Male | Female |
| Under 5 Years | 12 (2.8%) | 54 (12.2%) |
| 5 Years | 10 (9.5%) | 7 (5.7%) |
| 6 to 11 Years | 76 (9.3%) | 63 (8.9%) |
| 12 to 14 Years | 1 (0.3%) | 20 (6.6%) |
| 15 Years | 0 (0.0%) | 25 (32.1%) |
| 16 and 17 Years | 37 (15.9%) | 38 (14.7%) |
| 18 to 24 Years | 40 (6.3%) | 37 (6.8%) |
| 25 to 34 Years | 28 (3.7%) | 150 (17.3%) |
| 35 to 44 Years | 59 (5.2%) | 31 (2.9%) |
| 45 to 54 Years | 25 (2.2%) | 18 (1.7%) |
| 55 to 64 Years | 38 (3.4%) | 78 (6.8%) |
| 65 to 74 Years | 26 (2.5%) | 6 (0.7%) |
| 75 Years and over | 16 (3.4%) | 112 (18.8%) |
| Total | 368 (4.4%) | 639 (8.0%) |
Income Above Poverty by Sex and Age in Madison County
According to the poverty statistics in Madison County, males aged 15 years and females aged 65 to 74 years are the age groups that are most secure financially, with 100.0% of males and 99.3% of females in these age groups living above the poverty line.
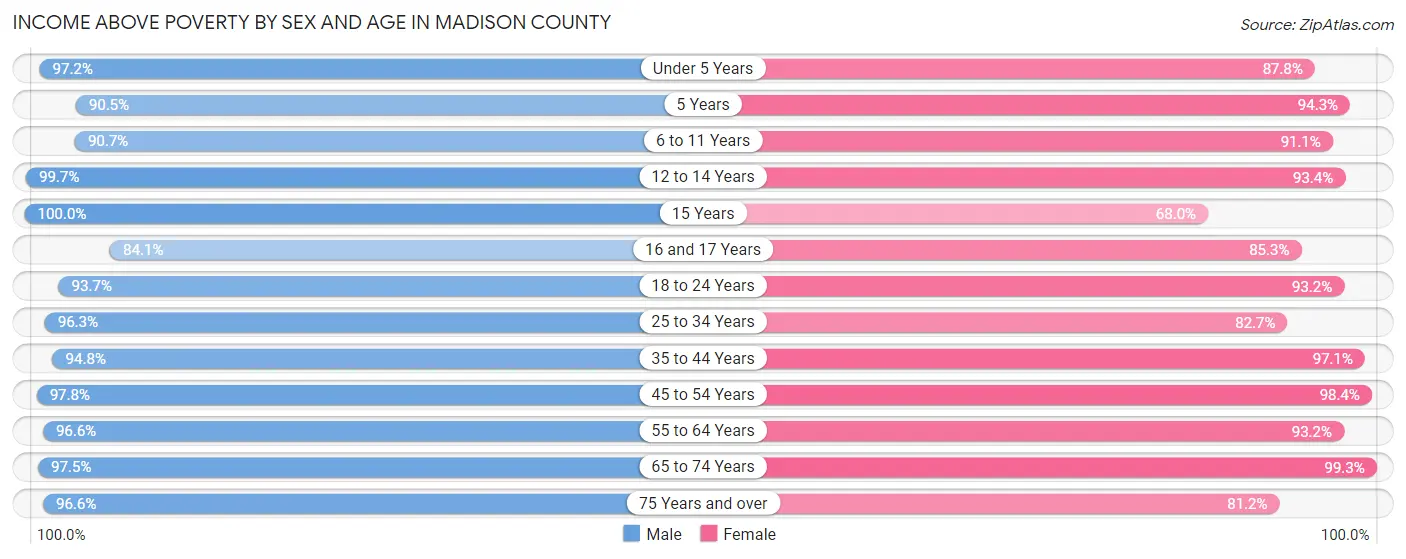
| Age Bracket | Male | Female |
| Under 5 Years | 418 (97.2%) | 388 (87.8%) |
| 5 Years | 95 (90.5%) | 116 (94.3%) |
| 6 to 11 Years | 737 (90.6%) | 646 (91.1%) |
| 12 to 14 Years | 371 (99.7%) | 283 (93.4%) |
| 15 Years | 201 (100.0%) | 53 (67.9%) |
| 16 and 17 Years | 196 (84.1%) | 220 (85.3%) |
| 18 to 24 Years | 594 (93.7%) | 509 (93.2%) |
| 25 to 34 Years | 719 (96.3%) | 716 (82.7%) |
| 35 to 44 Years | 1,073 (94.8%) | 1,027 (97.1%) |
| 45 to 54 Years | 1,086 (97.8%) | 1,076 (98.4%) |
| 55 to 64 Years | 1,077 (96.6%) | 1,066 (93.2%) |
| 65 to 74 Years | 1,012 (97.5%) | 791 (99.3%) |
| 75 Years and over | 450 (96.6%) | 484 (81.2%) |
| Total | 8,029 (95.6%) | 7,375 (92.0%) |
Income Below Poverty Among Married-Couple Families in Madison County
The poverty statistics for married-couple families in Madison County show that 1.0% or 38 of the total 3,761 families live below the poverty line. Families with 5 or more children have the highest poverty rate of 30.0%, comprising of 9 families. On the other hand, families with 1 or 2 children have the lowest poverty rate of 0.5%, which includes 6 families.
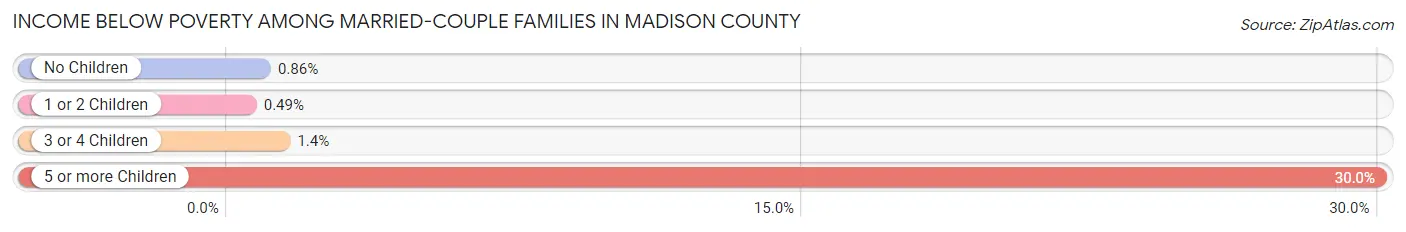
| Children | Above Poverty | Below Poverty |
| No Children | 2,183 (99.1%) | 19 (0.9%) |
| 1 or 2 Children | 1,231 (99.5%) | 6 (0.5%) |
| 3 or 4 Children | 288 (98.6%) | 4 (1.4%) |
| 5 or more Children | 21 (70.0%) | 9 (30.0%) |
| Total | 3,723 (99.0%) | 38 (1.0%) |
Income Below Poverty Among Single-Parent Households in Madison County
According to the poverty data in Madison County, 2.1% or 5 single-father households and 24.3% or 98 single-mother households are living below the poverty line. Among single-father households, those with 1 or 2 children have the highest poverty rate, with 5 households (3.8%) experiencing poverty. Likewise, among single-mother households, those with 3 or 4 children have the highest poverty rate, with 18 households (69.2%) falling below the poverty line.
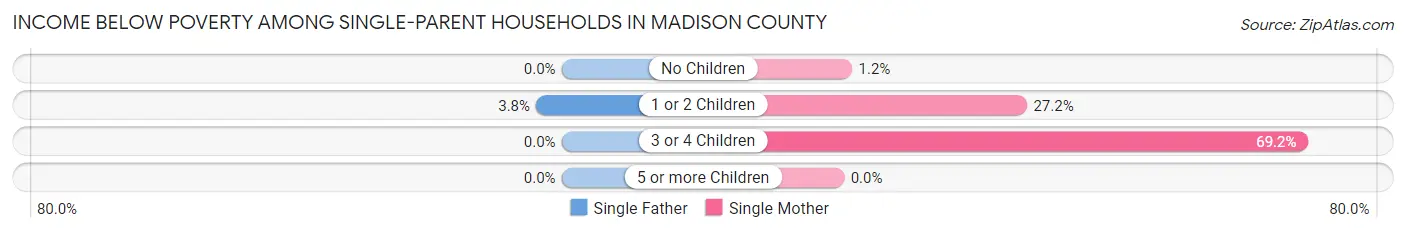
| Children | Single Father | Single Mother |
| No Children | 0 (0.0%) | 1 (1.2%) |
| 1 or 2 Children | 5 (3.8%) | 79 (27.2%) |
| 3 or 4 Children | 0 (0.0%) | 18 (69.2%) |
| 5 or more Children | 0 (0.0%) | 0 (0.0%) |
| Total | 5 (2.1%) | 98 (24.3%) |
Income Below Poverty Among Married-Couple vs Single-Parent Households in Madison County
The poverty data for Madison County shows that 38 of the married-couple family households (1.0%) and 103 of the single-parent households (16.2%) are living below the poverty level. Within the married-couple family households, those with 5 or more children have the highest poverty rate, with 9 households (30.0%) falling below the poverty line. Among the single-parent households, those with 3 or 4 children have the highest poverty rate, with 18 household (24.7%) living below poverty.
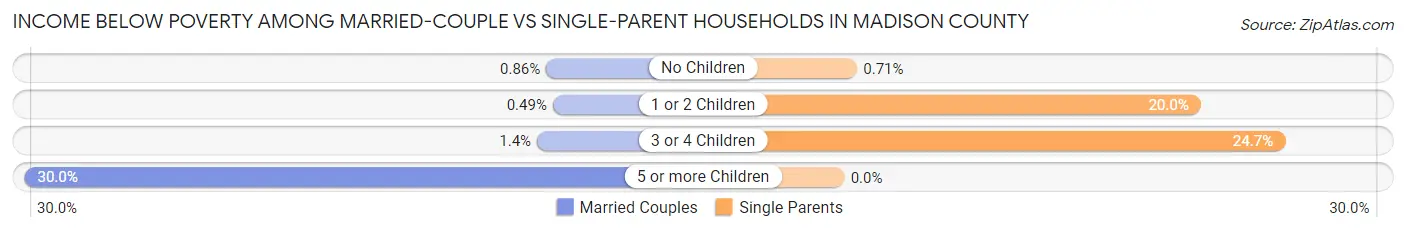
| Children | Married-Couple Families | Single-Parent Households |
| No Children | 19 (0.9%) | 1 (0.7%) |
| 1 or 2 Children | 6 (0.5%) | 84 (20.0%) |
| 3 or 4 Children | 4 (1.4%) | 18 (24.7%) |
| 5 or more Children | 9 (30.0%) | 0 (0.0%) |
| Total | 38 (1.0%) | 103 (16.2%) |
Race in Madison County
The most populous races in Madison County are White / Caucasian (15,906 | 95.8%), Hispanic or Latino (401 | 2.4%), and Two or more Races (347 | 2.1%).
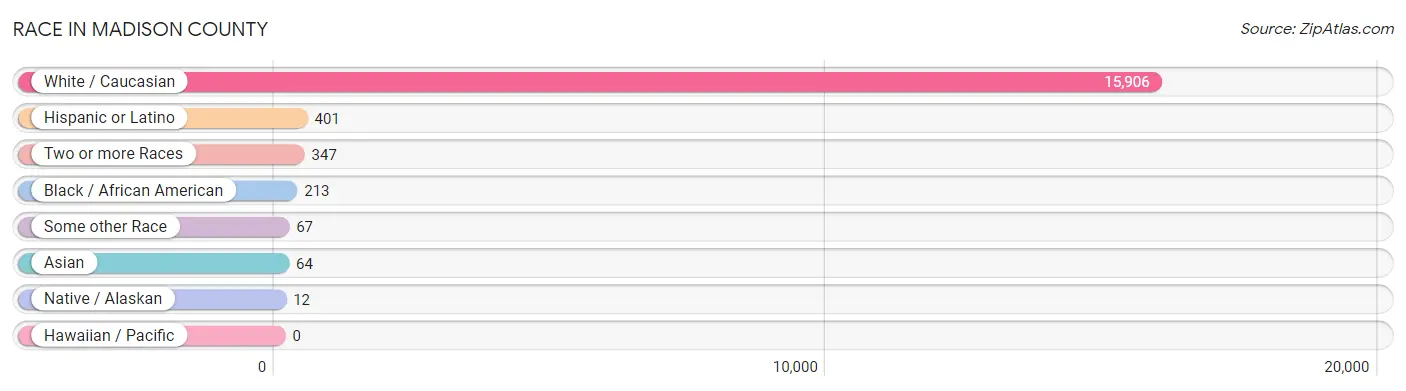
| Race | # Population | % Population |
| Asian | 64 | 0.4% |
| Black / African American | 213 | 1.3% |
| Hawaiian / Pacific | 0 | 0.0% |
| Hispanic or Latino | 401 | 2.4% |
| Native / Alaskan | 12 | 0.1% |
| White / Caucasian | 15,906 | 95.8% |
| Two or more Races | 347 | 2.1% |
| Some other Race | 67 | 0.4% |
| Total | 16,609 | 100.0% |
Ancestry in Madison County
The most populous ancestries reported in Madison County are German (4,985 | 30.0%), Irish (2,661 | 16.0%), English (1,844 | 11.1%), American (1,110 | 6.7%), and Dutch (627 | 3.8%), together accounting for 67.6% of all Madison County residents.
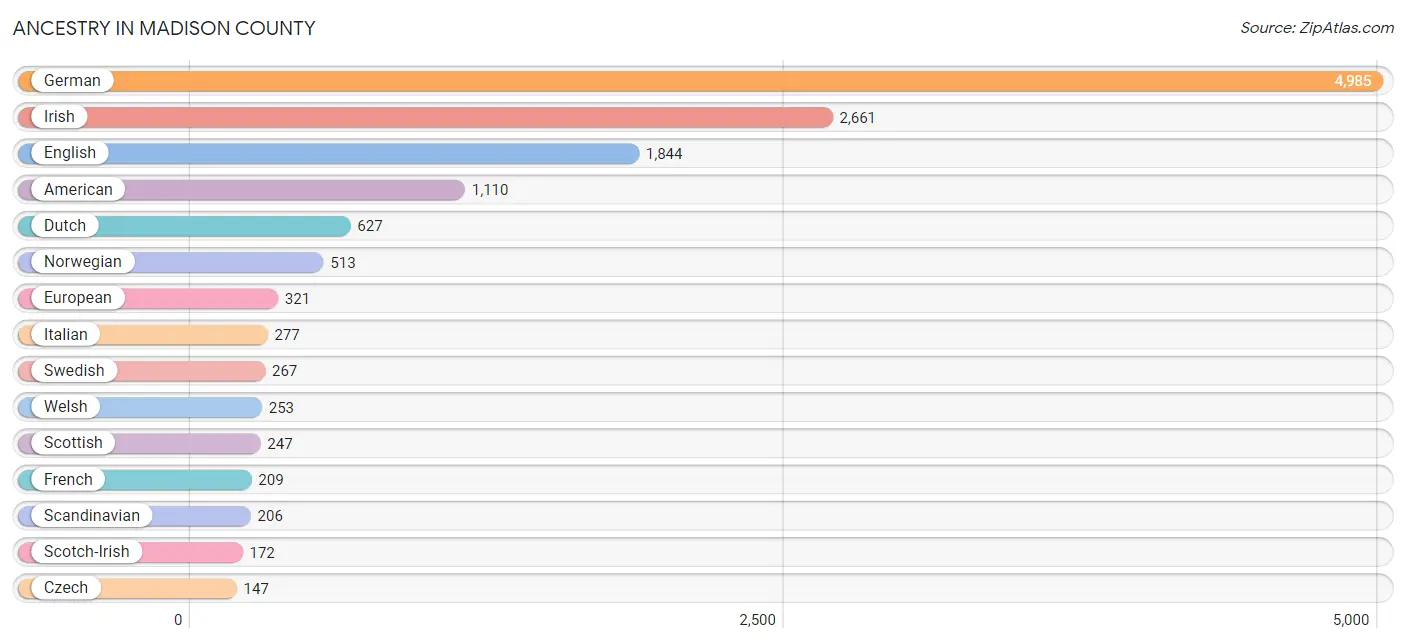
| Ancestry | # Population | % Population |
| African | 22 | 0.1% |
| American | 1,110 | 6.7% |
| Austrian | 5 | 0.0% |
| Belgian | 36 | 0.2% |
| British | 42 | 0.3% |
| Bulgarian | 2 | 0.0% |
| Burmese | 54 | 0.3% |
| Central American | 52 | 0.3% |
| Cherokee | 44 | 0.3% |
| Colombian | 5 | 0.0% |
| Colville | 1 | 0.0% |
| Costa Rican | 20 | 0.1% |
| Czech | 147 | 0.9% |
| Czechoslovakian | 3 | 0.0% |
| Danish | 113 | 0.7% |
| Dutch | 627 | 3.8% |
| Dutch West Indian | 9 | 0.1% |
| Eastern European | 25 | 0.2% |
| English | 1,844 | 11.1% |
| Estonian | 23 | 0.1% |
| European | 321 | 1.9% |
| Finnish | 19 | 0.1% |
| French | 209 | 1.3% |
| French Canadian | 6 | 0.0% |
| German | 4,985 | 30.0% |
| Greek | 42 | 0.3% |
| Hungarian | 4 | 0.0% |
| Irish | 2,661 | 16.0% |
| Iroquois | 12 | 0.1% |
| Italian | 277 | 1.7% |
| Korean | 79 | 0.5% |
| Luxembourger | 4 | 0.0% |
| Malaysian | 33 | 0.2% |
| Mexican | 52 | 0.3% |
| Native Hawaiian | 33 | 0.2% |
| Northern European | 47 | 0.3% |
| Norwegian | 513 | 3.1% |
| Pennsylvania German | 60 | 0.4% |
| Polish | 82 | 0.5% |
| Puerto Rican | 87 | 0.5% |
| Russian | 55 | 0.3% |
| Salvadoran | 32 | 0.2% |
| Samoan | 1 | 0.0% |
| Scandinavian | 206 | 1.2% |
| Scotch-Irish | 172 | 1.0% |
| Scottish | 247 | 1.5% |
| South American | 5 | 0.0% |
| Spaniard | 5 | 0.0% |
| Sri Lankan | 31 | 0.2% |
| Subsaharan African | 22 | 0.1% |
| Swedish | 267 | 1.6% |
| Swiss | 26 | 0.2% |
| Ute | 2 | 0.0% |
| Welsh | 253 | 1.5% |
| Yugoslavian | 58 | 0.4% | View All 55 Rows |
Immigrants in Madison County
The most numerous immigrant groups reported in Madison County came from Europe (77 | 0.5%), Latin America (69 | 0.4%), Bosnia and Herzegovina (66 | 0.4%), Eastern Europe (66 | 0.4%), and Central America (64 | 0.4%), together accounting for 2.1% of all Madison County residents.
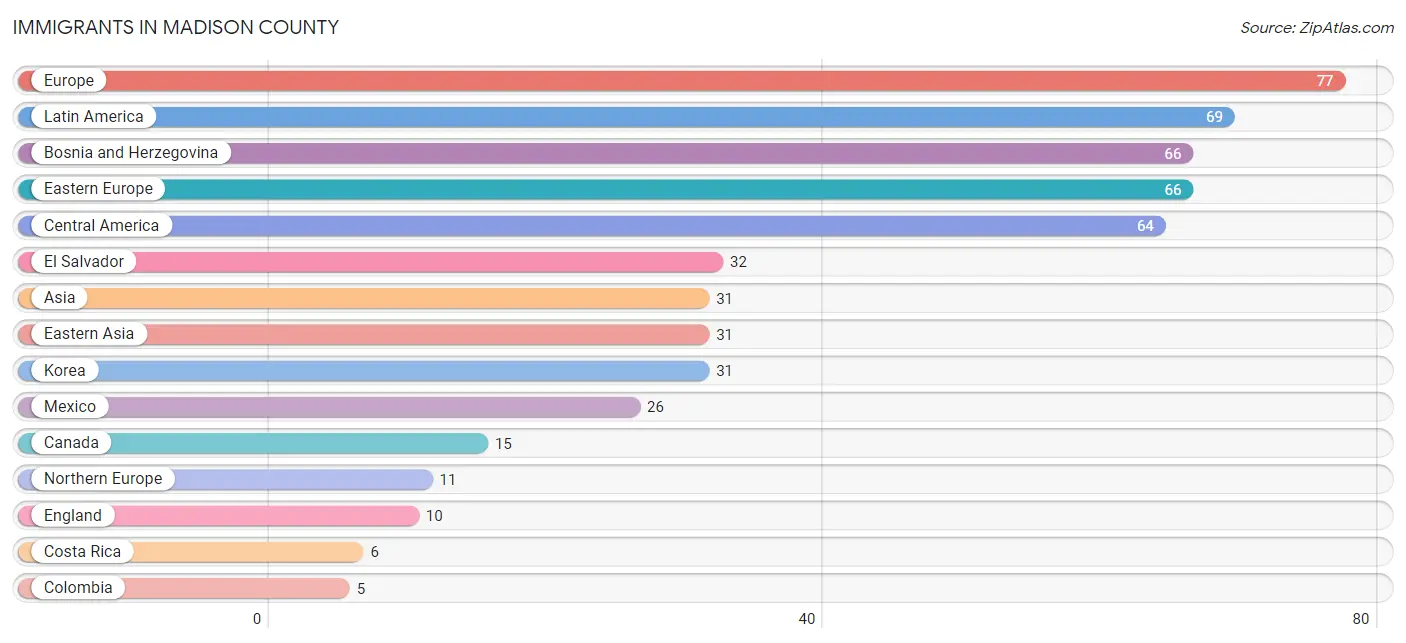
| Immigration Origin | # Population | % Population |
| Asia | 31 | 0.2% |
| Bosnia and Herzegovina | 66 | 0.4% |
| Canada | 15 | 0.1% |
| Central America | 64 | 0.4% |
| Colombia | 5 | 0.0% |
| Costa Rica | 6 | 0.0% |
| Eastern Asia | 31 | 0.2% |
| Eastern Europe | 66 | 0.4% |
| El Salvador | 32 | 0.2% |
| England | 10 | 0.1% |
| Europe | 77 | 0.5% |
| Korea | 31 | 0.2% |
| Latin America | 69 | 0.4% |
| Mexico | 26 | 0.2% |
| Northern Europe | 11 | 0.1% |
| South America | 5 | 0.0% | View All 16 Rows |
Sex and Age in Madison County
Sex and Age in Madison County
The most populous age groups in Madison County are 65 to 69 Years (689 | 8.1%) for men and 5 to 9 Years (682 | 8.4%) for women.
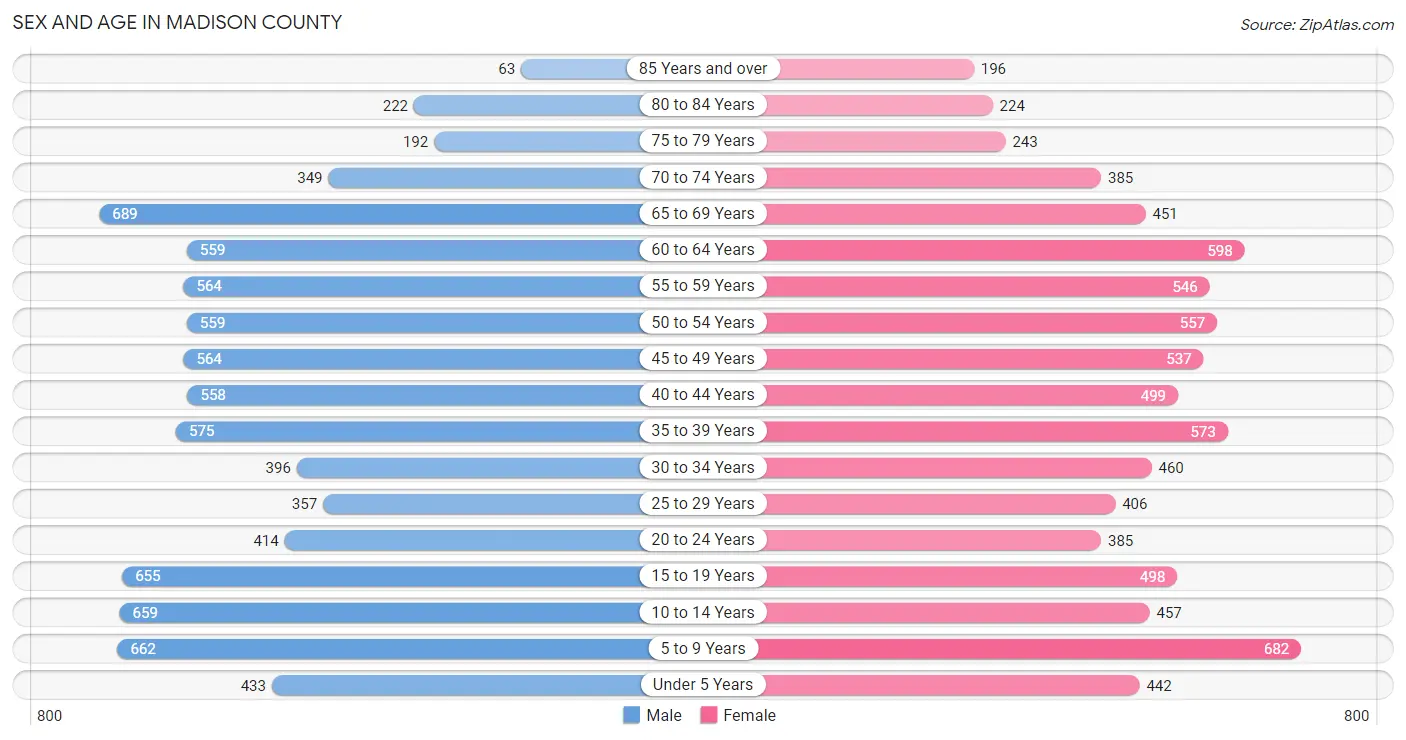
| Age Bracket | Male | Female |
| Under 5 Years | 433 (5.1%) | 442 (5.4%) |
| 5 to 9 Years | 662 (7.8%) | 682 (8.4%) |
| 10 to 14 Years | 659 (7.8%) | 457 (5.6%) |
| 15 to 19 Years | 655 (7.7%) | 498 (6.1%) |
| 20 to 24 Years | 414 (4.9%) | 385 (4.7%) |
| 25 to 29 Years | 357 (4.2%) | 406 (5.0%) |
| 30 to 34 Years | 396 (4.7%) | 460 (5.7%) |
| 35 to 39 Years | 575 (6.8%) | 573 (7.0%) |
| 40 to 44 Years | 558 (6.6%) | 499 (6.1%) |
| 45 to 49 Years | 564 (6.7%) | 537 (6.6%) |
| 50 to 54 Years | 559 (6.6%) | 557 (6.8%) |
| 55 to 59 Years | 564 (6.7%) | 546 (6.7%) |
| 60 to 64 Years | 559 (6.6%) | 598 (7.3%) |
| 65 to 69 Years | 689 (8.1%) | 451 (5.5%) |
| 70 to 74 Years | 349 (4.1%) | 385 (4.7%) |
| 75 to 79 Years | 192 (2.3%) | 243 (3.0%) |
| 80 to 84 Years | 222 (2.6%) | 224 (2.8%) |
| 85 Years and over | 63 (0.7%) | 196 (2.4%) |
| Total | 8,470 (100.0%) | 8,139 (100.0%) |
Families and Households in Madison County
Median Family Size in Madison County
The median family size in Madison County is 3.07 persons per family, with single female/mother families (403 | 9.2%) accounting for the largest median family size of 3.25 persons per family. On the other hand, single male/father families (233 | 5.3%) represent the smallest median family size with 3.01 persons per family.
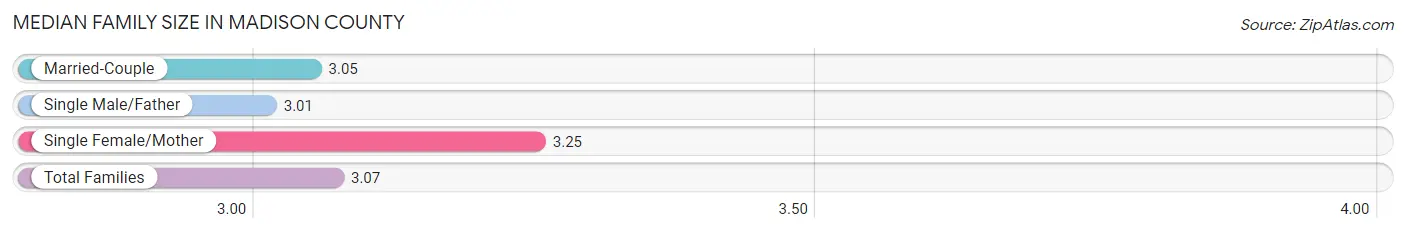
| Family Type | # Families | Family Size |
| Married-Couple | 3,761 (85.5%) | 3.05 |
| Single Male/Father | 233 (5.3%) | 3.01 |
| Single Female/Mother | 403 (9.2%) | 3.25 |
| Total Families | 4,397 (100.0%) | 3.07 |
Median Household Size in Madison County
The median household size in Madison County is 2.54 persons per household, with single female/mother households (403 | 6.2%) accounting for the largest median household size of 3.93 persons per household. non-family households (2,078 | 32.1%) represent the smallest median household size with 1.22 persons per household.
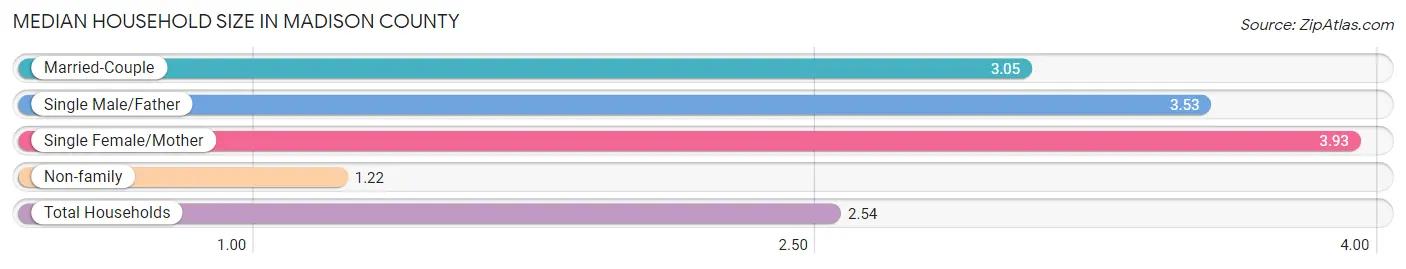
| Household Type | # Households | Household Size |
| Married-Couple | 3,761 (58.1%) | 3.05 |
| Single Male/Father | 233 (3.6%) | 3.53 |
| Single Female/Mother | 403 (6.2%) | 3.93 |
| Non-family | 2,078 (32.1%) | 1.22 |
| Total Households | 6,475 (100.0%) | 2.54 |
Household Size by Marriage Status in Madison County
Out of a total of 6,475 households in Madison County, 4,397 (67.9%) are family households, while 2,078 (32.1%) are nonfamily households. The most numerous type of family households are 2-person households, comprising 1,988, and the most common type of nonfamily households are 1-person households, comprising 1,777.
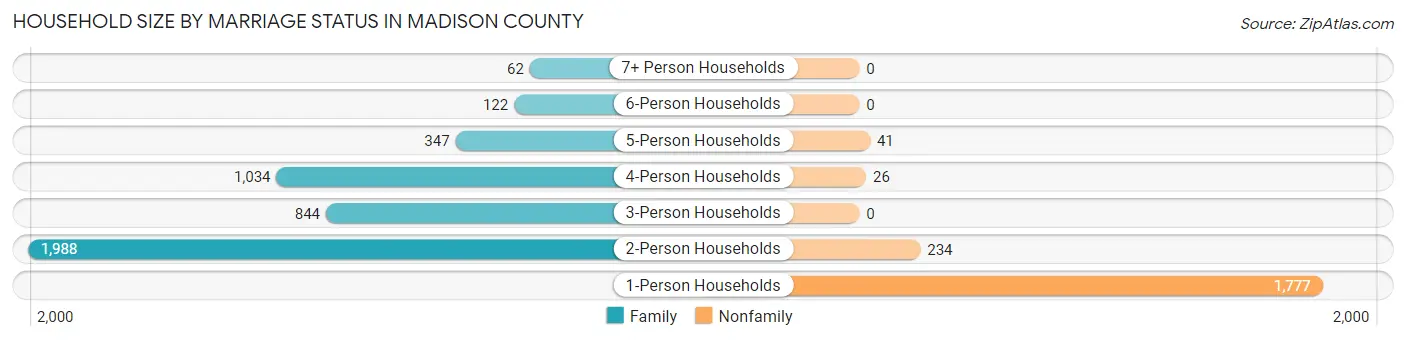
| Household Size | Family Households | Nonfamily Households |
| 1-Person Households | - | 1,777 (27.4%) |
| 2-Person Households | 1,988 (30.7%) | 234 (3.6%) |
| 3-Person Households | 844 (13.0%) | 0 (0.0%) |
| 4-Person Households | 1,034 (16.0%) | 26 (0.4%) |
| 5-Person Households | 347 (5.4%) | 41 (0.6%) |
| 6-Person Households | 122 (1.9%) | 0 (0.0%) |
| 7+ Person Households | 62 (1.0%) | 0 (0.0%) |
| Total | 4,397 (67.9%) | 2,078 (32.1%) |
Female Fertility in Madison County
Fertility by Age in Madison County
Average fertility rate in Madison County is 56.0 births per 1,000 women. Women in the age bracket of 20 to 34 years have the highest fertility rate with 132.0 births per 1,000 women. Women in the age bracket of 20 to 34 years acount for 84.6% of all women with births.
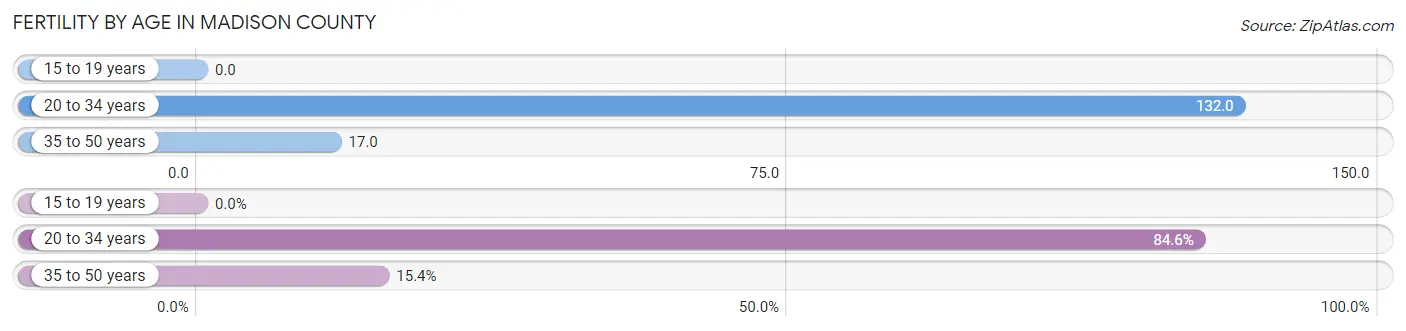
| Age Bracket | Women with Births | Births / 1,000 Women |
| 15 to 19 years | 0 (0.0%) | 0.0 |
| 20 to 34 years | 165 (84.6%) | 132.0 |
| 35 to 50 years | 30 (15.4%) | 17.0 |
| Total | 195 (100.0%) | 56.0 |
Fertility by Age by Marriage Status in Madison County
74.9% of women with births (195) in Madison County are married. The highest percentage of unmarried women with births falls into 20 to 34 years age bracket with 27.3% of them unmarried at the time of birth, while the lowest percentage of unmarried women with births belong to 35 to 50 years age bracket with 13.3% of them unmarried.
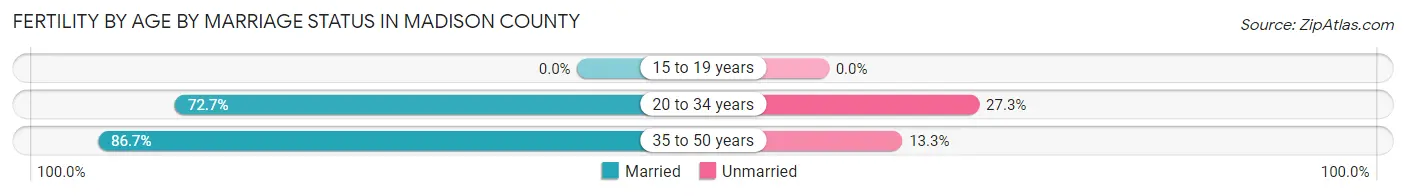
| Age Bracket | Married | Unmarried |
| 15 to 19 years | 0 (0.0%) | 0 (0.0%) |
| 20 to 34 years | 120 (72.7%) | 45 (27.3%) |
| 35 to 50 years | 26 (86.7%) | 4 (13.3%) |
| Total | 146 (74.9%) | 49 (25.1%) |
Fertility by Education in Madison County
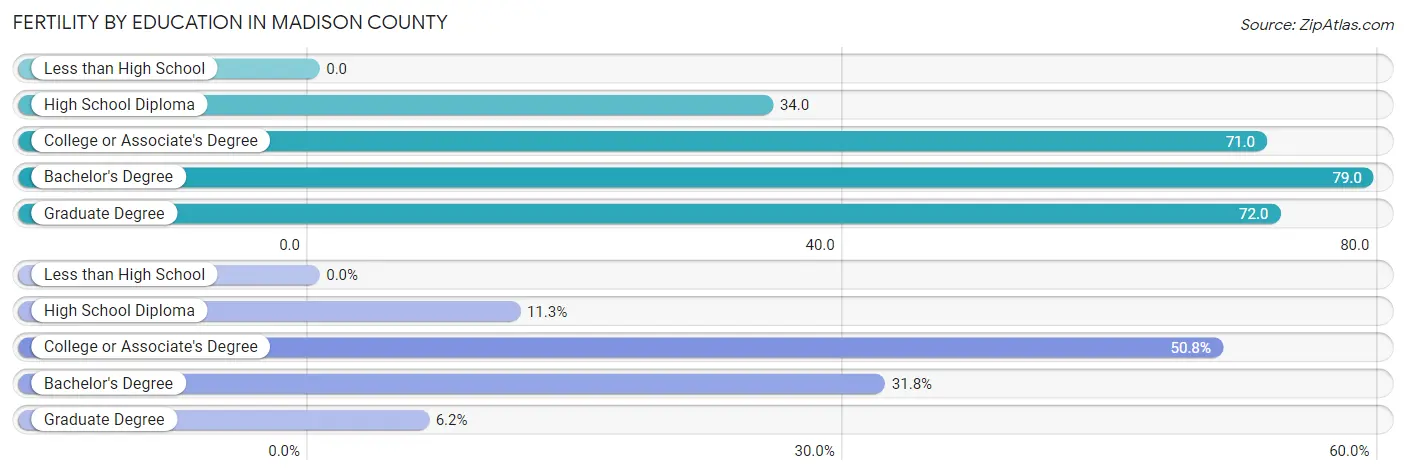
| Educational Attainment | Women with Births | Births / 1,000 Women |
| Less than High School | 0 (0.0%) | 0.0 |
| High School Diploma | 22 (11.3%) | 34.0 |
| College or Associate's Degree | 99 (50.8%) | 71.0 |
| Bachelor's Degree | 62 (31.8%) | 79.0 |
| Graduate Degree | 12 (6.1%) | 72.0 |
| Total | 195 (100.0%) | 56.0 |
Fertility by Education by Marriage Status in Madison County
25.1% of women with births in Madison County are unmarried. Women with the educational attainment of bachelor's degree are most likely to be married with 100.0% of them married at childbirth, while women with the educational attainment of college or associate's degree are least likely to be married with 48.5% of them unmarried at childbirth.
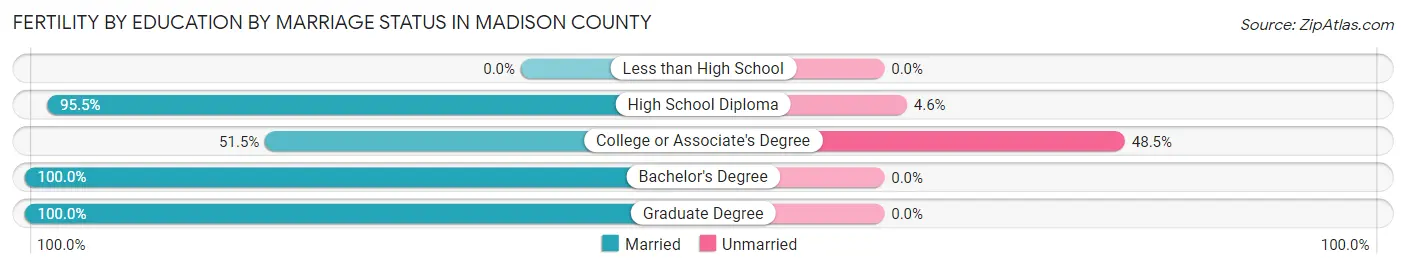
| Educational Attainment | Married | Unmarried |
| Less than High School | 0 (0.0%) | 0 (0.0%) |
| High School Diploma | 21 (95.5%) | 1 (4.5%) |
| College or Associate's Degree | 51 (51.5%) | 48 (48.5%) |
| Bachelor's Degree | 62 (100.0%) | 0 (0.0%) |
| Graduate Degree | 12 (100.0%) | 0 (0.0%) |
| Total | 146 (74.9%) | 49 (25.1%) |
Employment Characteristics in Madison County
Employment by Class of Employer in Madison County
Among the 8,899 employed individuals in Madison County, private company employees (6,023 | 67.7%), self-employed (not incorporated) (807 | 9.1%), and local government employees (710 | 8.0%) make up the most common classes of employment.
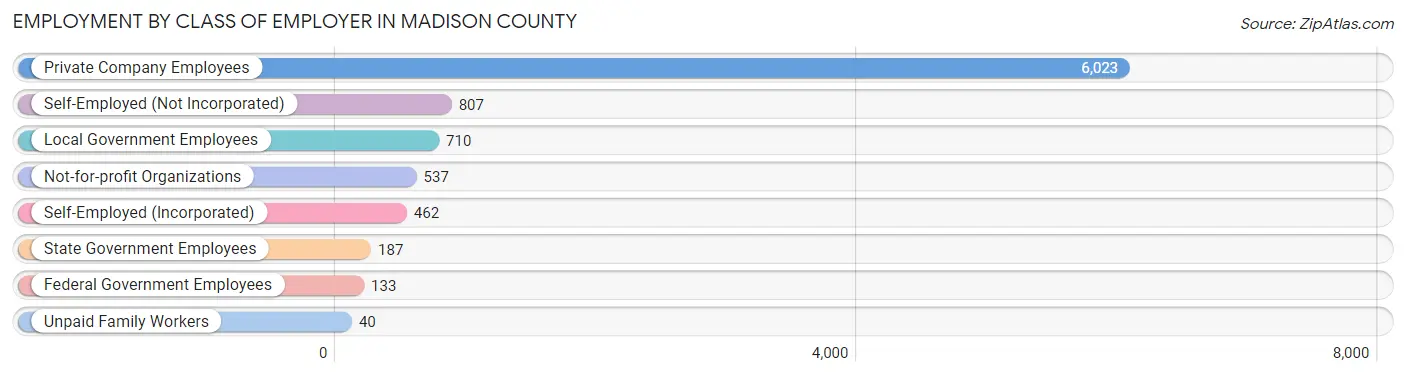
| Employer Class | # Employees | % Employees |
| Private Company Employees | 6,023 | 67.7% |
| Self-Employed (Incorporated) | 462 | 5.2% |
| Self-Employed (Not Incorporated) | 807 | 9.1% |
| Not-for-profit Organizations | 537 | 6.0% |
| Local Government Employees | 710 | 8.0% |
| State Government Employees | 187 | 2.1% |
| Federal Government Employees | 133 | 1.5% |
| Unpaid Family Workers | 40 | 0.4% |
| Total | 8,899 | 100.0% |
Employment Status by Age in Madison County
According to the labor force statistics for Madison County, out of the total population over 16 years of age (12,995), 71.5% or 9,291 individuals are in the labor force, with 2.3% or 214 of them unemployed. The age group with the highest labor force participation rate is 25 to 29 years, with 93.8% or 716 individuals in the labor force. Within the labor force, the 16 to 19 years age range has the highest percentage of unemployed individuals, with 8.7% or 49 of them being unemployed.
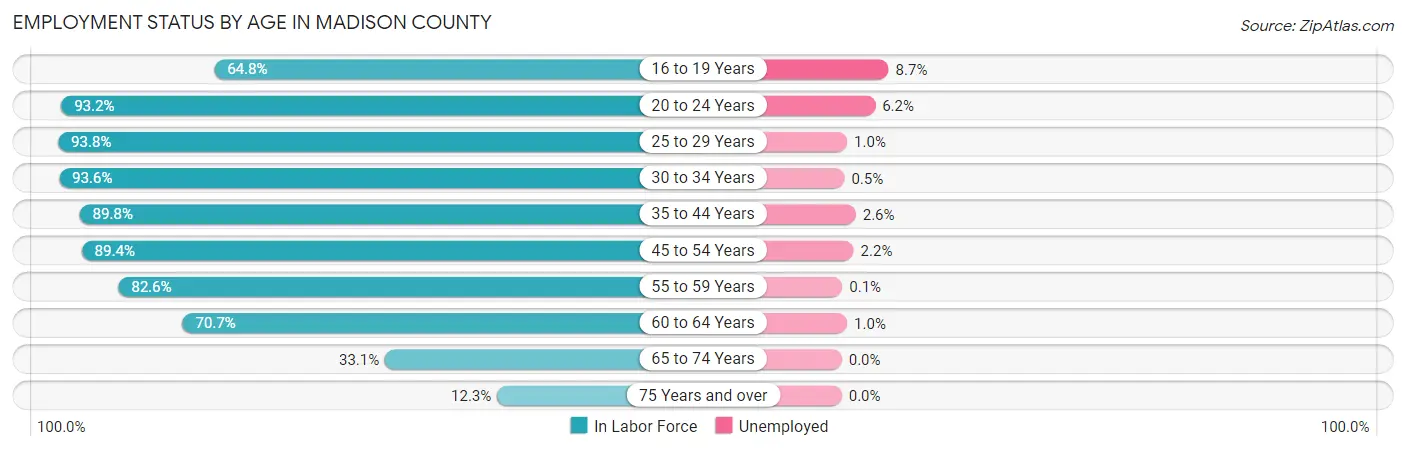
| Age Bracket | In Labor Force | Unemployed |
| 16 to 19 Years | 566 (64.8%) | 49 (8.7%) |
| 20 to 24 Years | 745 (93.2%) | 46 (6.2%) |
| 25 to 29 Years | 716 (93.8%) | 7 (1.0%) |
| 30 to 34 Years | 801 (93.6%) | 4 (0.5%) |
| 35 to 44 Years | 1,980 (89.8%) | 51 (2.6%) |
| 45 to 54 Years | 1,982 (89.4%) | 44 (2.2%) |
| 55 to 59 Years | 917 (82.6%) | 1 (0.1%) |
| 60 to 64 Years | 818 (70.7%) | 8 (1.0%) |
| 65 to 74 Years | 620 (33.1%) | 0 (0.0%) |
| 75 Years and over | 140 (12.3%) | 0 (0.0%) |
| Total | 9,291 (71.5%) | 214 (2.3%) |
Employment Status by Educational Attainment in Madison County
According to labor force statistics for Madison County, 86.8% of individuals (7,211) out of the total population between 25 and 64 years of age (8,308) are in the labor force, with 1.6% or 115 of them being unemployed. The group with the highest labor force participation rate are those with the educational attainment of bachelor's degree or higher, with 89.3% or 2,091 individuals in the labor force. Within the labor force, individuals with bachelor's degree or higher education have the highest percentage of unemployment, with 2.7% or 56 of them being unemployed.
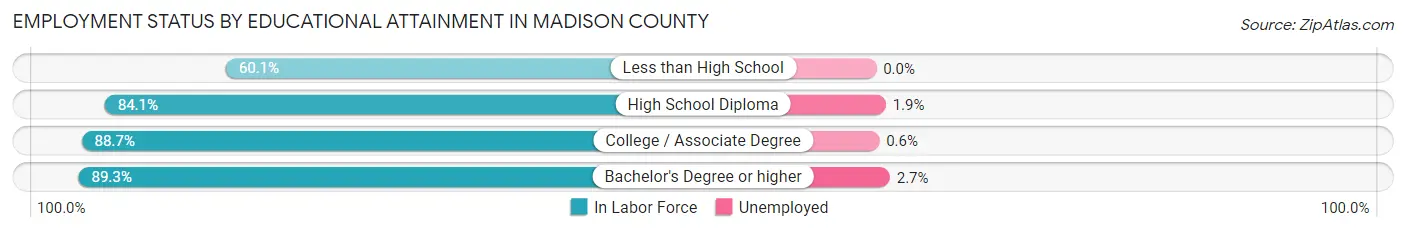
| Educational Attainment | In Labor Force | Unemployed |
| Less than High School | 104 (60.1%) | 0 (0.0%) |
| High School Diploma | 2,191 (84.1%) | 49 (1.9%) |
| College / Associate Degree | 2,828 (88.7%) | 19 (0.6%) |
| Bachelor's Degree or higher | 2,091 (89.3%) | 63 (2.7%) |
| Total | 7,211 (86.8%) | 133 (1.6%) |
Employment Occupations by Sex in Madison County
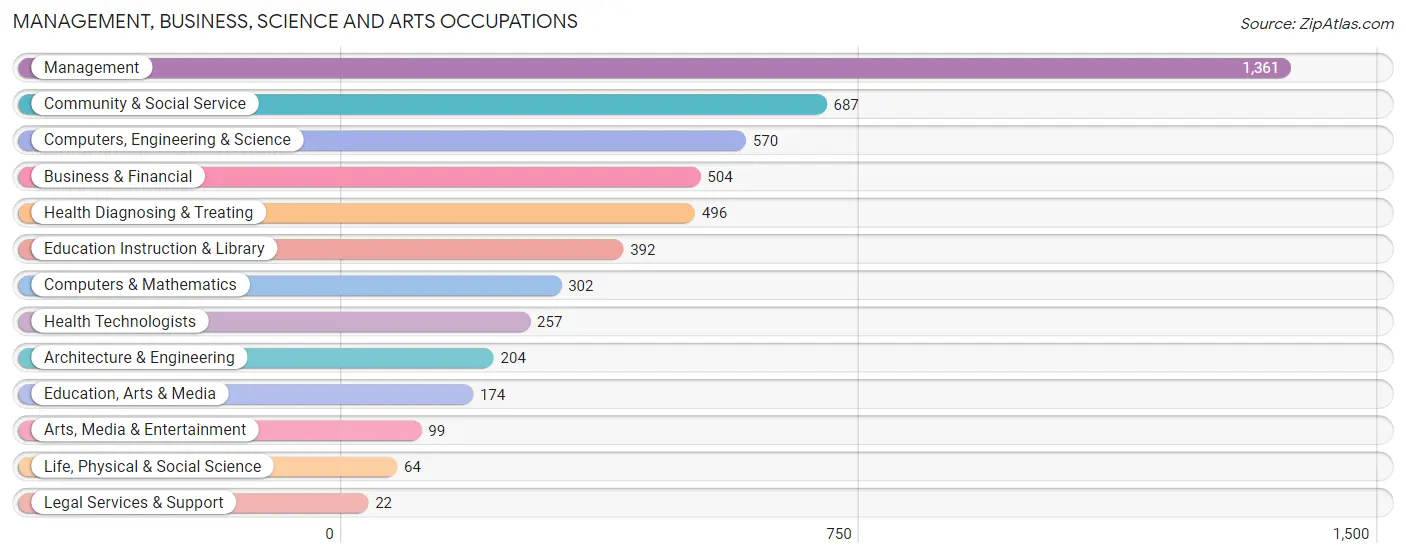
Management, Business, Science and Arts Occupations
The most common Management, Business, Science and Arts occupations in Madison County are Management (1,361 | 15.0%), Community & Social Service (687 | 7.6%), Computers, Engineering & Science (570 | 6.3%), Business & Financial (504 | 5.6%), and Health Diagnosing & Treating (496 | 5.5%).
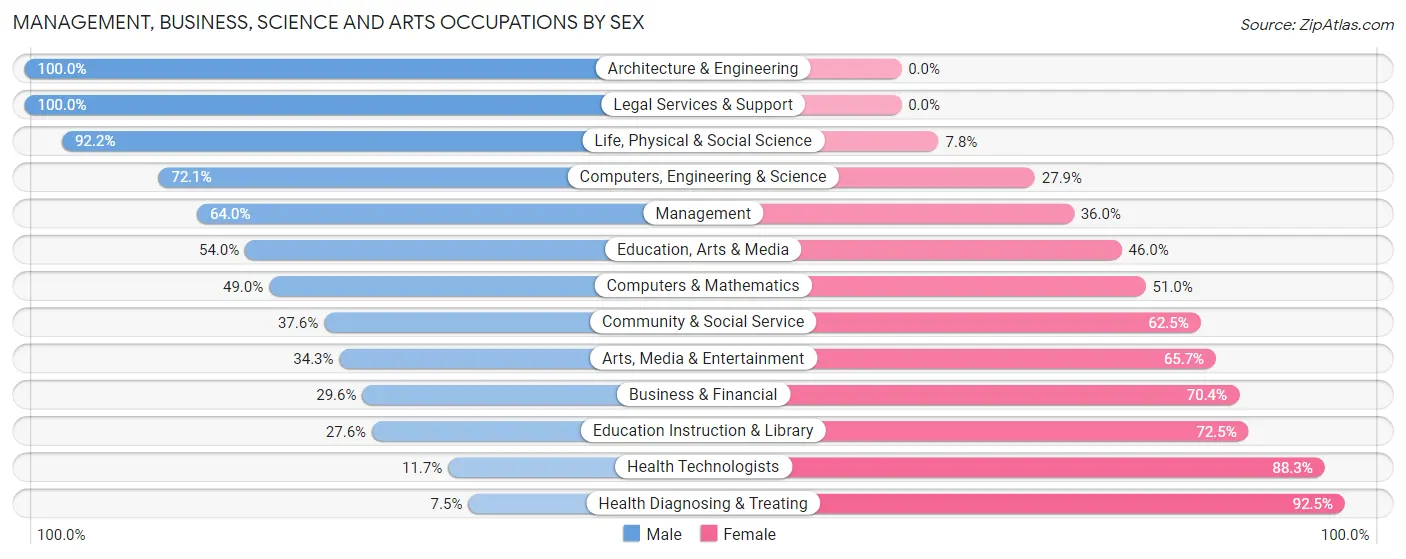
Management, Business, Science and Arts Occupations by Sex
Within the Management, Business, Science and Arts occupations in Madison County, the most male-oriented occupations are Architecture & Engineering (100.0%), Legal Services & Support (100.0%), and Life, Physical & Social Science (92.2%), while the most female-oriented occupations are Health Diagnosing & Treating (92.5%), Health Technologists (88.3%), and Education Instruction & Library (72.5%).
| Occupation | Male | Female |
| Management | 871 (64.0%) | 490 (36.0%) |
| Business & Financial | 149 (29.6%) | 355 (70.4%) |
| Computers, Engineering & Science | 411 (72.1%) | 159 (27.9%) |
| Computers & Mathematics | 148 (49.0%) | 154 (51.0%) |
| Architecture & Engineering | 204 (100.0%) | 0 (0.0%) |
| Life, Physical & Social Science | 59 (92.2%) | 5 (7.8%) |
| Community & Social Service | 258 (37.6%) | 429 (62.5%) |
| Education, Arts & Media | 94 (54.0%) | 80 (46.0%) |
| Legal Services & Support | 22 (100.0%) | 0 (0.0%) |
| Education Instruction & Library | 108 (27.6%) | 284 (72.5%) |
| Arts, Media & Entertainment | 34 (34.3%) | 65 (65.7%) |
| Health Diagnosing & Treating | 37 (7.5%) | 459 (92.5%) |
| Health Technologists | 30 (11.7%) | 227 (88.3%) |
| Total (Category) | 1,726 (47.7%) | 1,892 (52.3%) |
| Total (Overall) | 4,832 (53.4%) | 4,223 (46.6%) |
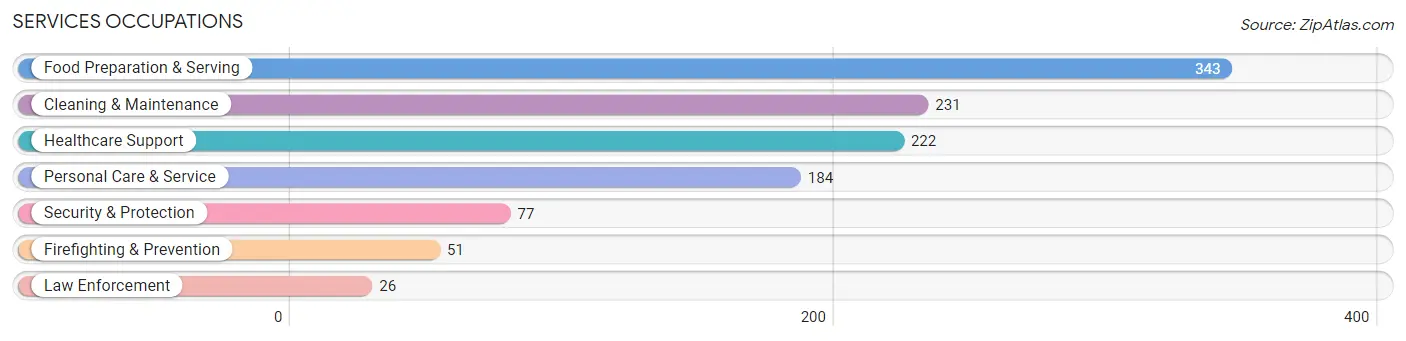
Services Occupations
The most common Services occupations in Madison County are Food Preparation & Serving (343 | 3.8%), Cleaning & Maintenance (231 | 2.5%), Healthcare Support (222 | 2.5%), Personal Care & Service (184 | 2.0%), and Security & Protection (77 | 0.9%).
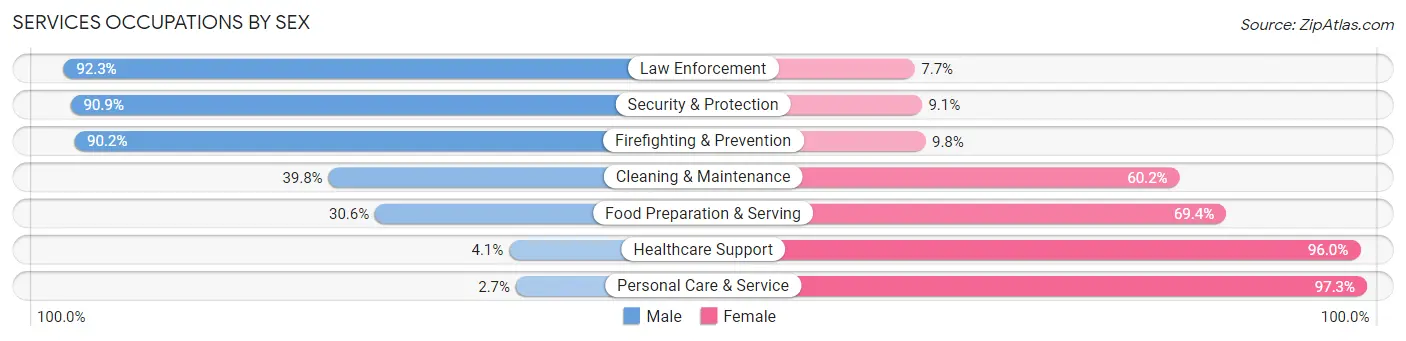
Services Occupations by Sex
Within the Services occupations in Madison County, the most male-oriented occupations are Law Enforcement (92.3%), Security & Protection (90.9%), and Firefighting & Prevention (90.2%), while the most female-oriented occupations are Personal Care & Service (97.3%), Healthcare Support (96.0%), and Food Preparation & Serving (69.4%).
| Occupation | Male | Female |
| Healthcare Support | 9 (4.1%) | 213 (96.0%) |
| Security & Protection | 70 (90.9%) | 7 (9.1%) |
| Firefighting & Prevention | 46 (90.2%) | 5 (9.8%) |
| Law Enforcement | 24 (92.3%) | 2 (7.7%) |
| Food Preparation & Serving | 105 (30.6%) | 238 (69.4%) |
| Cleaning & Maintenance | 92 (39.8%) | 139 (60.2%) |
| Personal Care & Service | 5 (2.7%) | 179 (97.3%) |
| Total (Category) | 281 (26.6%) | 776 (73.4%) |
| Total (Overall) | 4,832 (53.4%) | 4,223 (46.6%) |
Sales and Office Occupations
The most common Sales and Office occupations in Madison County are Sales & Related (1,180 | 13.0%), and Office & Administration (812 | 9.0%).
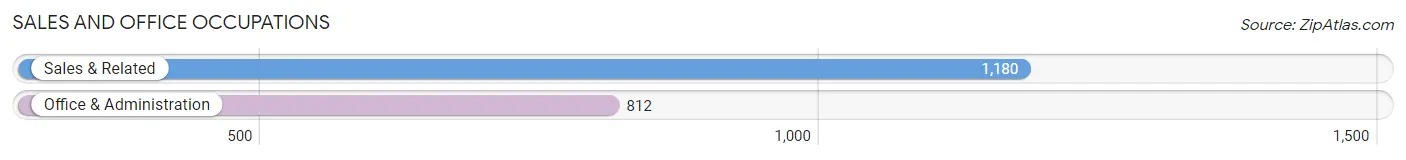
Sales and Office Occupations by Sex

| Occupation | Male | Female |
| Sales & Related | 589 (49.9%) | 591 (50.1%) |
| Office & Administration | 159 (19.6%) | 653 (80.4%) |
| Total (Category) | 748 (37.6%) | 1,244 (62.5%) |
| Total (Overall) | 4,832 (53.4%) | 4,223 (46.6%) |
Natural Resources, Construction and Maintenance Occupations
The most common Natural Resources, Construction and Maintenance occupations in Madison County are Construction & Extraction (817 | 9.0%), Installation, Maintenance & Repair (254 | 2.8%), and Farming, Fishing & Forestry (210 | 2.3%).
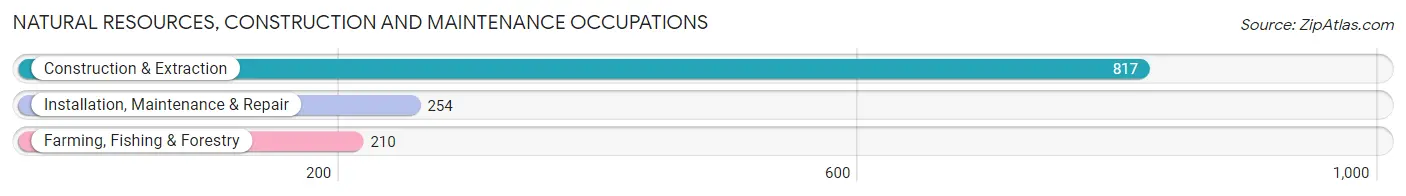
Natural Resources, Construction and Maintenance Occupations by Sex
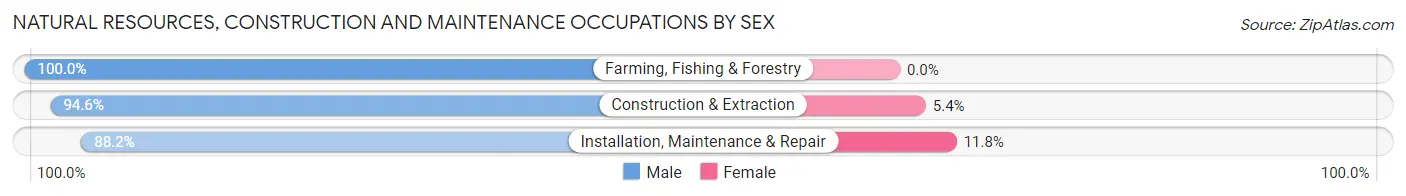
| Occupation | Male | Female |
| Farming, Fishing & Forestry | 210 (100.0%) | 0 (0.0%) |
| Construction & Extraction | 773 (94.6%) | 44 (5.4%) |
| Installation, Maintenance & Repair | 224 (88.2%) | 30 (11.8%) |
| Total (Category) | 1,207 (94.2%) | 74 (5.8%) |
| Total (Overall) | 4,832 (53.4%) | 4,223 (46.6%) |
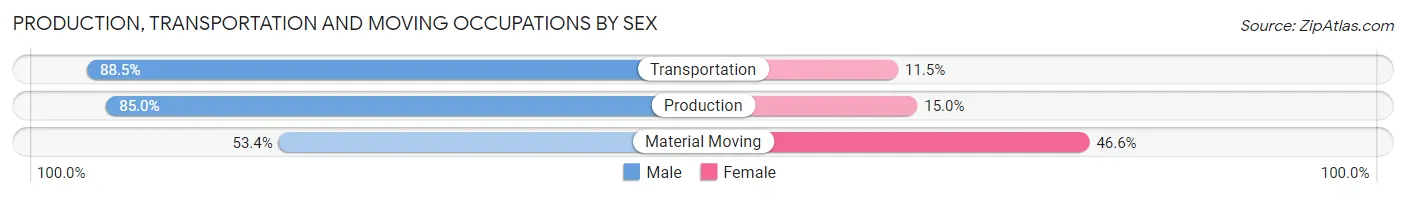
Production, Transportation and Moving Occupations
The most common Production, Transportation and Moving occupations in Madison County are Transportation (488 | 5.4%), Production (340 | 3.7%), and Material Moving (279 | 3.1%).
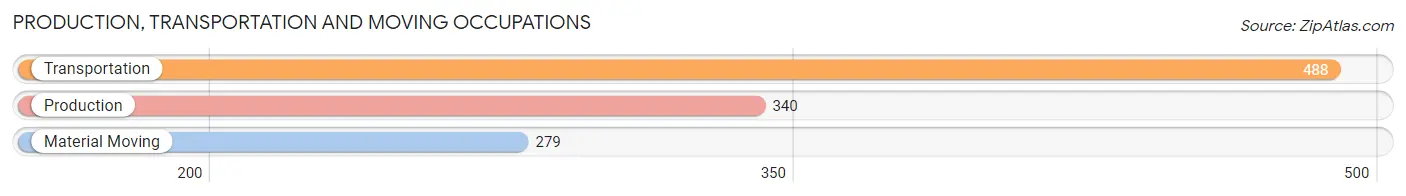
Production, Transportation and Moving Occupations by Sex
| Occupation | Male | Female |
| Production | 289 (85.0%) | 51 (15.0%) |
| Transportation | 432 (88.5%) | 56 (11.5%) |
| Material Moving | 149 (53.4%) | 130 (46.6%) |
| Total (Category) | 870 (78.6%) | 237 (21.4%) |
| Total (Overall) | 4,832 (53.4%) | 4,223 (46.6%) |
Employment Industries by Sex in Madison County
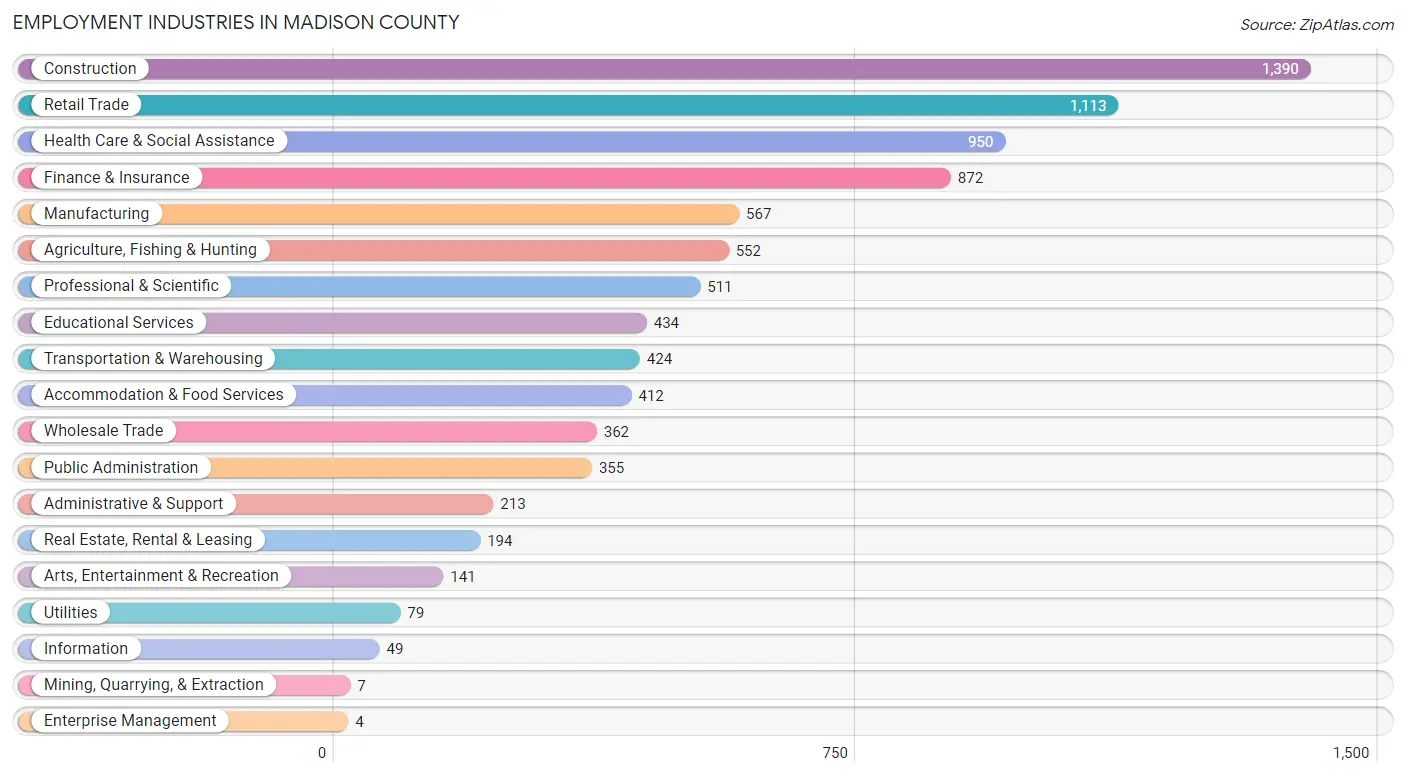
Employment Industries in Madison County
The major employment industries in Madison County include Construction (1,390 | 15.3%), Retail Trade (1,113 | 12.3%), Health Care & Social Assistance (950 | 10.5%), Finance & Insurance (872 | 9.6%), and Manufacturing (567 | 6.3%).
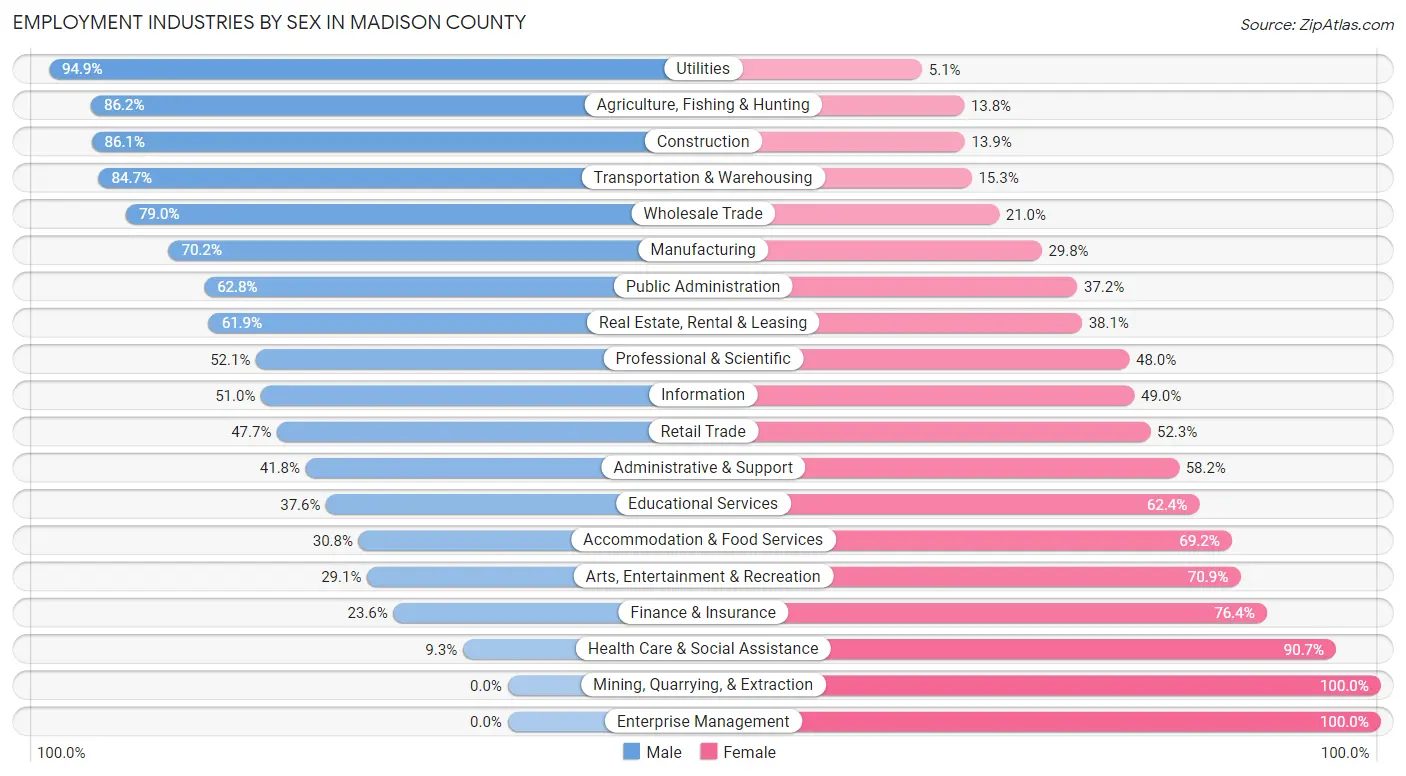
Employment Industries by Sex in Madison County
The Madison County industries that see more men than women are Utilities (94.9%), Agriculture, Fishing & Hunting (86.2%), and Construction (86.1%), whereas the industries that tend to have a higher number of women are Mining, Quarrying, & Extraction (100.0%), Enterprise Management (100.0%), and Health Care & Social Assistance (90.7%).
| Industry | Male | Female |
| Agriculture, Fishing & Hunting | 476 (86.2%) | 76 (13.8%) |
| Mining, Quarrying, & Extraction | 0 (0.0%) | 7 (100.0%) |
| Construction | 1,197 (86.1%) | 193 (13.9%) |
| Manufacturing | 398 (70.2%) | 169 (29.8%) |
| Wholesale Trade | 286 (79.0%) | 76 (21.0%) |
| Retail Trade | 531 (47.7%) | 582 (52.3%) |
| Transportation & Warehousing | 359 (84.7%) | 65 (15.3%) |
| Utilities | 75 (94.9%) | 4 (5.1%) |
| Information | 25 (51.0%) | 24 (49.0%) |
| Finance & Insurance | 206 (23.6%) | 666 (76.4%) |
| Real Estate, Rental & Leasing | 120 (61.9%) | 74 (38.1%) |
| Professional & Scientific | 266 (52.0%) | 245 (47.9%) |
| Enterprise Management | 0 (0.0%) | 4 (100.0%) |
| Administrative & Support | 89 (41.8%) | 124 (58.2%) |
| Educational Services | 163 (37.6%) | 271 (62.4%) |
| Health Care & Social Assistance | 88 (9.3%) | 862 (90.7%) |
| Arts, Entertainment & Recreation | 41 (29.1%) | 100 (70.9%) |
| Accommodation & Food Services | 127 (30.8%) | 285 (69.2%) |
| Public Administration | 223 (62.8%) | 132 (37.2%) |
| Total | 4,832 (53.4%) | 4,223 (46.6%) |
Education in Madison County
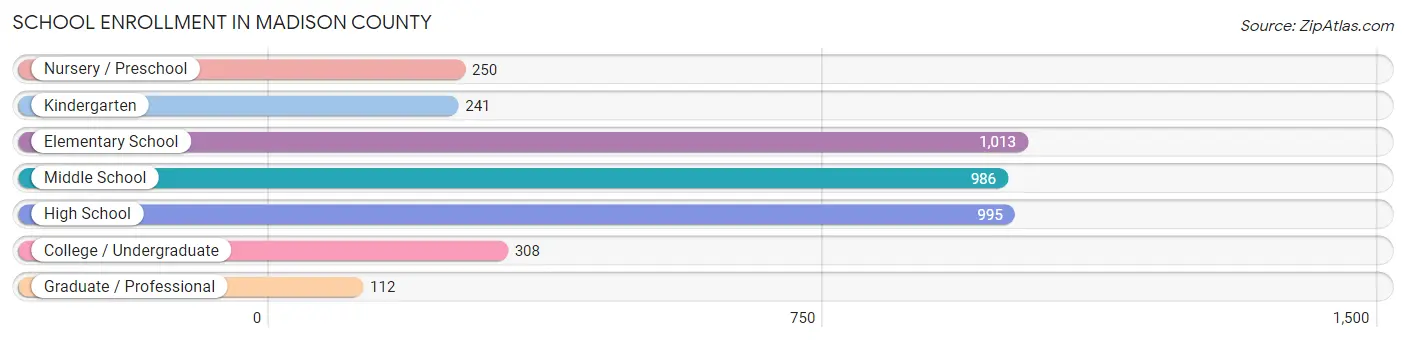
School Enrollment in Madison County
The most common levels of schooling among the 3,905 students in Madison County are elementary school (1,013 | 25.9%), high school (995 | 25.5%), and middle school (986 | 25.3%).
| School Level | # Students | % Students |
| Nursery / Preschool | 250 | 6.4% |
| Kindergarten | 241 | 6.2% |
| Elementary School | 1,013 | 25.9% |
| Middle School | 986 | 25.3% |
| High School | 995 | 25.5% |
| College / Undergraduate | 308 | 7.9% |
| Graduate / Professional | 112 | 2.9% |
| Total | 3,905 | 100.0% |
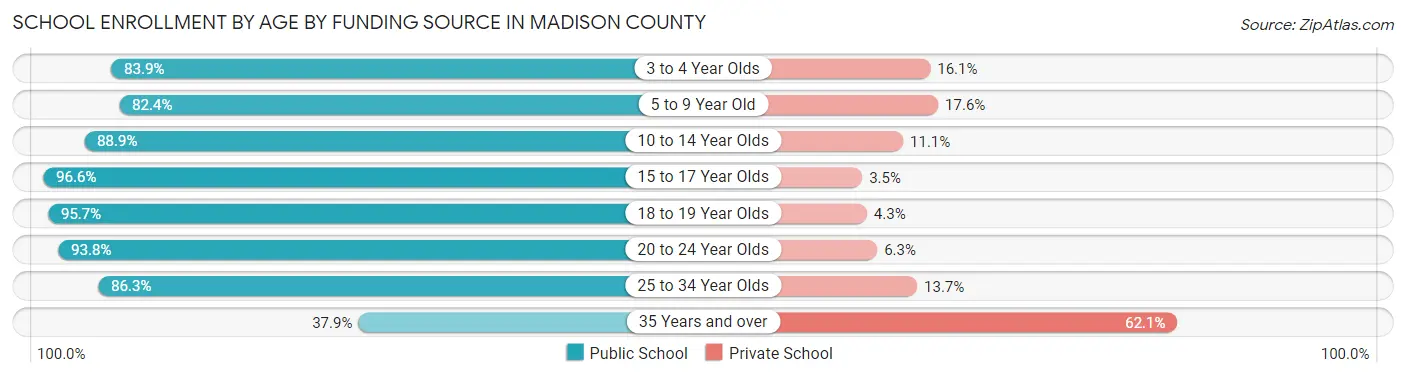
School Enrollment by Age by Funding Source in Madison County
Out of a total of 3,905 students who are enrolled in schools in Madison County, 496 (12.7%) attend a private institution, while the remaining 3,409 (87.3%) are enrolled in public schools. The age group of 35 years and over has the highest likelihood of being enrolled in private schools, with 64 (62.1% in the age bracket) enrolled. Conversely, the age group of 15 to 17 year olds has the lowest likelihood of being enrolled in a private school, with 727 (96.6% in the age bracket) attending a public institution.
| Age Bracket | Public School | Private School |
| 3 to 4 Year Olds | 104 (83.9%) | 20 (16.1%) |
| 5 to 9 Year Old | 1,072 (82.4%) | 229 (17.6%) |
| 10 to 14 Year Olds | 972 (88.9%) | 121 (11.1%) |
| 15 to 17 Year Olds | 727 (96.6%) | 26 (3.5%) |
| 18 to 19 Year Olds | 243 (95.7%) | 11 (4.3%) |
| 20 to 24 Year Olds | 150 (93.8%) | 10 (6.2%) |
| 25 to 34 Year Olds | 101 (86.3%) | 16 (13.7%) |
| 35 Years and over | 39 (37.9%) | 64 (62.1%) |
| Total | 3,409 (87.3%) | 496 (12.7%) |
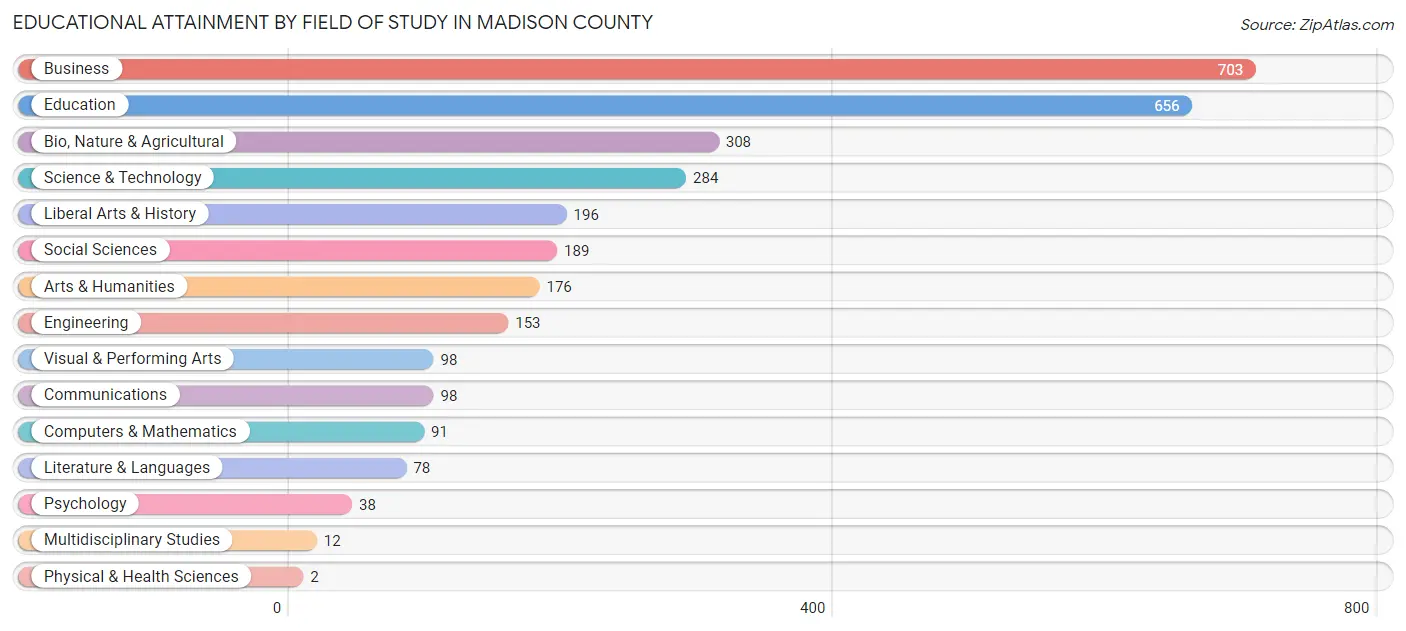
Educational Attainment by Field of Study in Madison County
Business (703 | 22.8%), education (656 | 21.3%), bio, nature & agricultural (308 | 10.0%), science & technology (284 | 9.2%), and liberal arts & history (196 | 6.4%) are the most common fields of study among 3,082 individuals in Madison County who have obtained a bachelor's degree or higher.
| Field of Study | # Graduates | % Graduates |
| Computers & Mathematics | 91 | 2.9% |
| Bio, Nature & Agricultural | 308 | 10.0% |
| Physical & Health Sciences | 2 | 0.1% |
| Psychology | 38 | 1.2% |
| Social Sciences | 189 | 6.1% |
| Engineering | 153 | 5.0% |
| Multidisciplinary Studies | 12 | 0.4% |
| Science & Technology | 284 | 9.2% |
| Business | 703 | 22.8% |
| Education | 656 | 21.3% |
| Literature & Languages | 78 | 2.5% |
| Liberal Arts & History | 196 | 6.4% |
| Visual & Performing Arts | 98 | 3.2% |
| Communications | 98 | 3.2% |
| Arts & Humanities | 176 | 5.7% |
| Total | 3,082 | 100.0% |
Transportation & Commute in Madison County
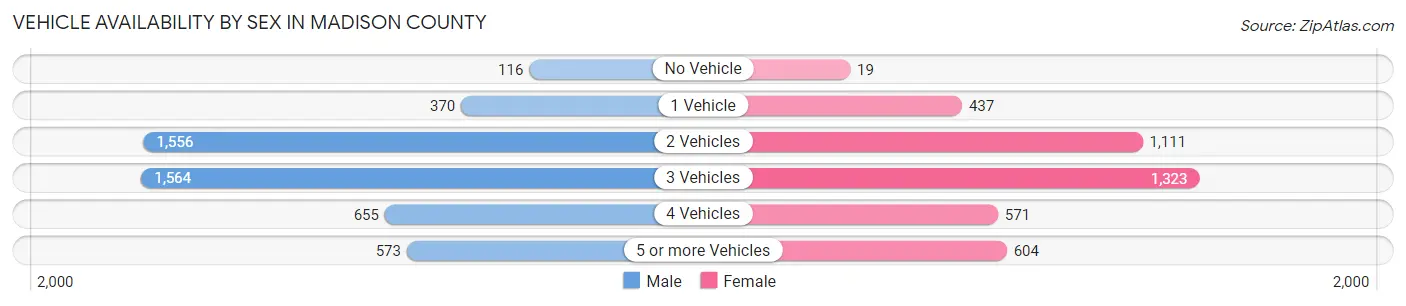
Vehicle Availability by Sex in Madison County
The most prevalent vehicle ownership categories in Madison County are males with 3 vehicles (1,564, accounting for 32.4%) and females with 3 vehicles (1,323, making up 38.5%).
| Vehicles Available | Male | Female |
| No Vehicle | 116 (2.4%) | 19 (0.5%) |
| 1 Vehicle | 370 (7.6%) | 437 (10.7%) |
| 2 Vehicles | 1,556 (32.2%) | 1,111 (27.3%) |
| 3 Vehicles | 1,564 (32.4%) | 1,323 (32.6%) |
| 4 Vehicles | 655 (13.6%) | 571 (14.1%) |
| 5 or more Vehicles | 573 (11.8%) | 604 (14.9%) |
| Total | 4,834 (100.0%) | 4,065 (100.0%) |
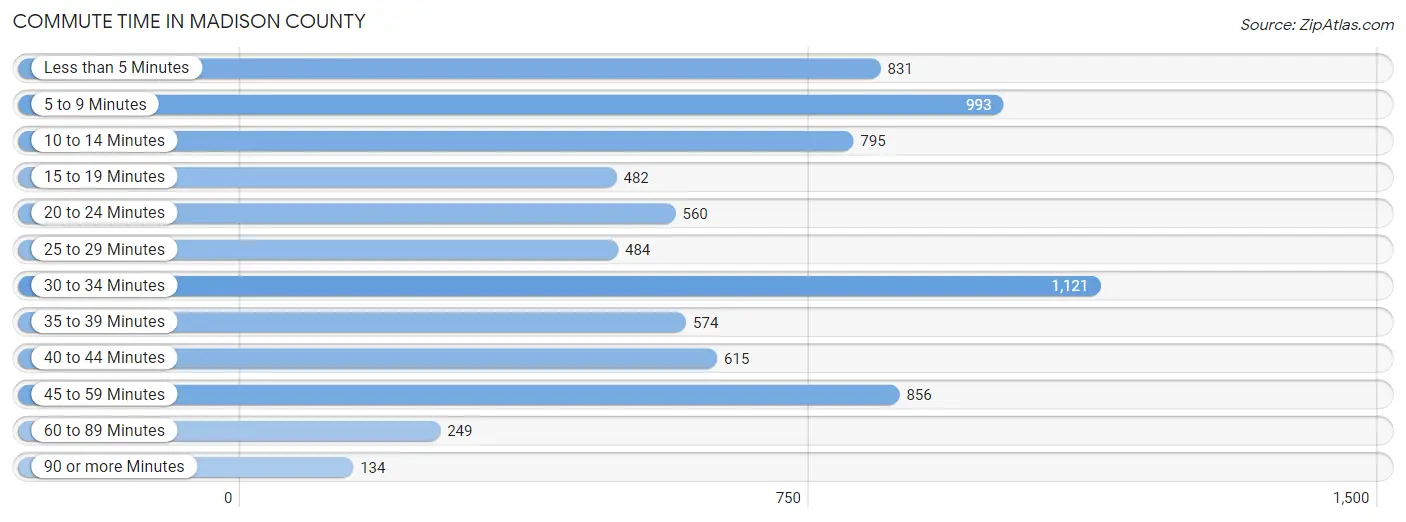
Commute Time in Madison County
The most frequently occuring commute durations in Madison County are 30 to 34 minutes (1,121 commuters, 14.6%), 5 to 9 minutes (993 commuters, 12.9%), and 45 to 59 minutes (856 commuters, 11.1%).
| Commute Time | # Commuters | % Commuters |
| Less than 5 Minutes | 831 | 10.8% |
| 5 to 9 Minutes | 993 | 12.9% |
| 10 to 14 Minutes | 795 | 10.3% |
| 15 to 19 Minutes | 482 | 6.3% |
| 20 to 24 Minutes | 560 | 7.3% |
| 25 to 29 Minutes | 484 | 6.3% |
| 30 to 34 Minutes | 1,121 | 14.6% |
| 35 to 39 Minutes | 574 | 7.5% |
| 40 to 44 Minutes | 615 | 8.0% |
| 45 to 59 Minutes | 856 | 11.1% |
| 60 to 89 Minutes | 249 | 3.2% |
| 90 or more Minutes | 134 | 1.7% |
Commute Time by Sex in Madison County
The most common commute times in Madison County are 30 to 34 minutes (634 commuters, 14.8%) for males and 30 to 34 minutes (487 commuters, 14.2%) for females.
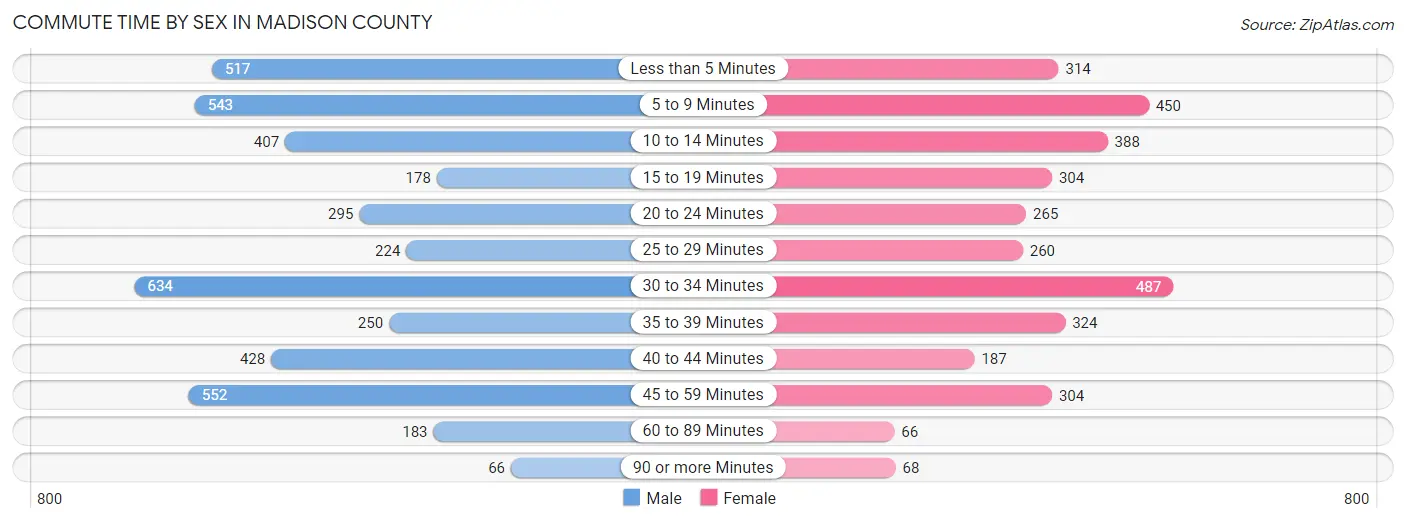
| Commute Time | Male | Female |
| Less than 5 Minutes | 517 (12.1%) | 314 (9.2%) |
| 5 to 9 Minutes | 543 (12.7%) | 450 (13.2%) |
| 10 to 14 Minutes | 407 (9.5%) | 388 (11.4%) |
| 15 to 19 Minutes | 178 (4.2%) | 304 (8.9%) |
| 20 to 24 Minutes | 295 (6.9%) | 265 (7.8%) |
| 25 to 29 Minutes | 224 (5.2%) | 260 (7.6%) |
| 30 to 34 Minutes | 634 (14.8%) | 487 (14.2%) |
| 35 to 39 Minutes | 250 (5.9%) | 324 (9.5%) |
| 40 to 44 Minutes | 428 (10.0%) | 187 (5.5%) |
| 45 to 59 Minutes | 552 (12.9%) | 304 (8.9%) |
| 60 to 89 Minutes | 183 (4.3%) | 66 (1.9%) |
| 90 or more Minutes | 66 (1.5%) | 68 (2.0%) |
Time of Departure to Work by Sex in Madison County
The most frequent times of departure to work in Madison County are 7:00 AM to 7:29 AM (824, 19.3%) for males and 7:00 AM to 7:29 AM (799, 23.4%) for females.
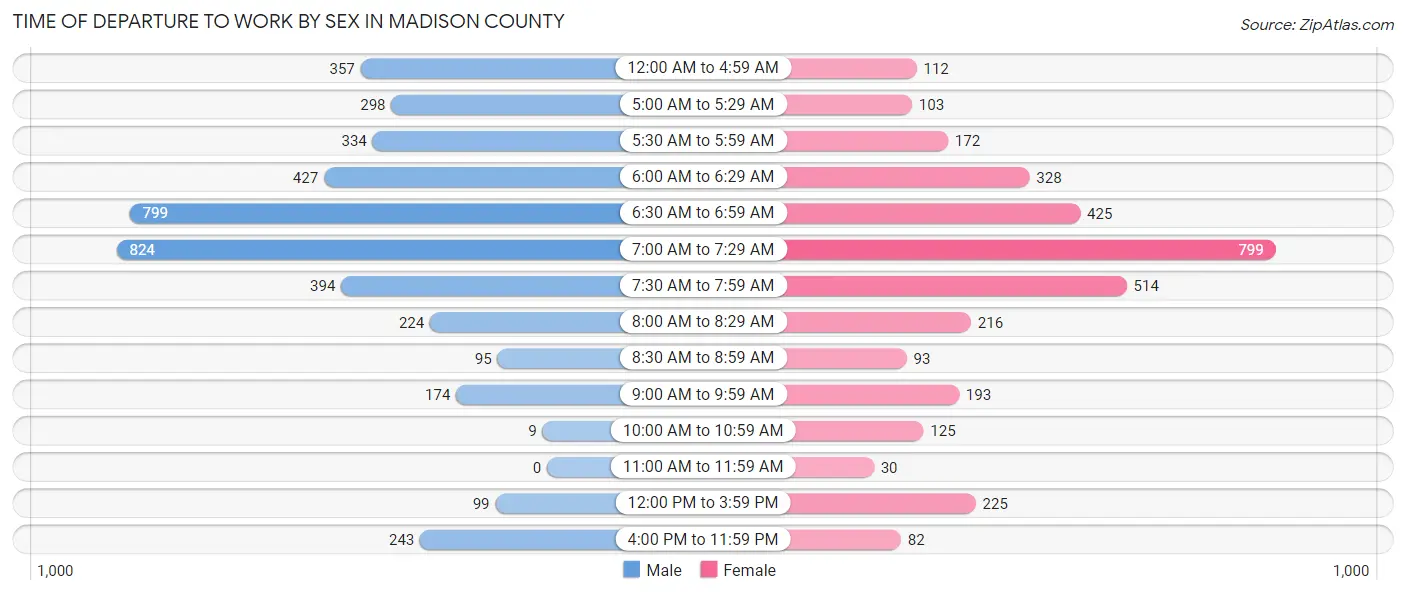
| Time of Departure | Male | Female |
| 12:00 AM to 4:59 AM | 357 (8.4%) | 112 (3.3%) |
| 5:00 AM to 5:29 AM | 298 (7.0%) | 103 (3.0%) |
| 5:30 AM to 5:59 AM | 334 (7.8%) | 172 (5.0%) |
| 6:00 AM to 6:29 AM | 427 (10.0%) | 328 (9.6%) |
| 6:30 AM to 6:59 AM | 799 (18.7%) | 425 (12.4%) |
| 7:00 AM to 7:29 AM | 824 (19.3%) | 799 (23.4%) |
| 7:30 AM to 7:59 AM | 394 (9.2%) | 514 (15.0%) |
| 8:00 AM to 8:29 AM | 224 (5.2%) | 216 (6.3%) |
| 8:30 AM to 8:59 AM | 95 (2.2%) | 93 (2.7%) |
| 9:00 AM to 9:59 AM | 174 (4.1%) | 193 (5.7%) |
| 10:00 AM to 10:59 AM | 9 (0.2%) | 125 (3.7%) |
| 11:00 AM to 11:59 AM | 0 (0.0%) | 30 (0.9%) |
| 12:00 PM to 3:59 PM | 99 (2.3%) | 225 (6.6%) |
| 4:00 PM to 11:59 PM | 243 (5.7%) | 82 (2.4%) |
| Total | 4,277 (100.0%) | 3,417 (100.0%) |
Housing Occupancy in Madison County
Occupancy by Ownership in Madison County
Of the total 6,475 dwellings in Madison County, owner-occupied units account for 5,337 (82.4%), while renter-occupied units make up 1,138 (17.6%).
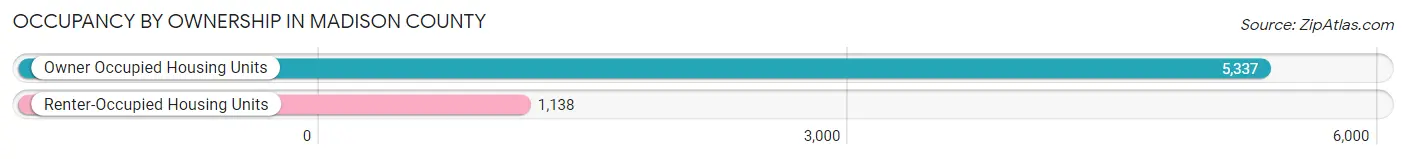
| Occupancy | # Housing Units | % Housing Units |
| Owner Occupied Housing Units | 5,337 | 82.4% |
| Renter-Occupied Housing Units | 1,138 | 17.6% |
| Total Occupied Housing Units | 6,475 | 100.0% |
Occupancy by Household Size in Madison County
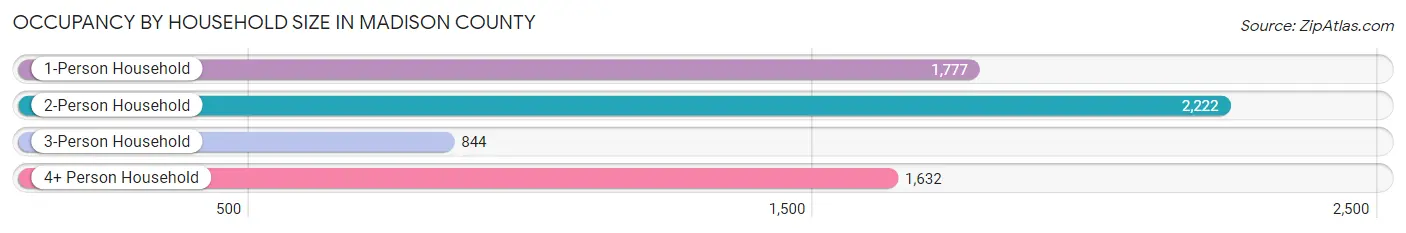
| Household Size | # Housing Units | % Housing Units |
| 1-Person Household | 1,777 | 27.4% |
| 2-Person Household | 2,222 | 34.3% |
| 3-Person Household | 844 | 13.0% |
| 4+ Person Household | 1,632 | 25.2% |
| Total Housing Units | 6,475 | 100.0% |
Occupancy by Ownership by Household Size in Madison County
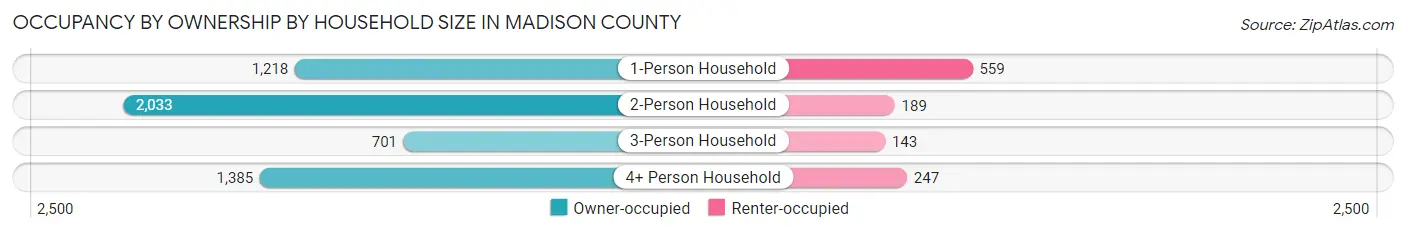
| Household Size | Owner-occupied | Renter-occupied |
| 1-Person Household | 1,218 (68.5%) | 559 (31.5%) |
| 2-Person Household | 2,033 (91.5%) | 189 (8.5%) |
| 3-Person Household | 701 (83.1%) | 143 (16.9%) |
| 4+ Person Household | 1,385 (84.9%) | 247 (15.1%) |
| Total Housing Units | 5,337 (82.4%) | 1,138 (17.6%) |
Occupancy by Educational Attainment in Madison County
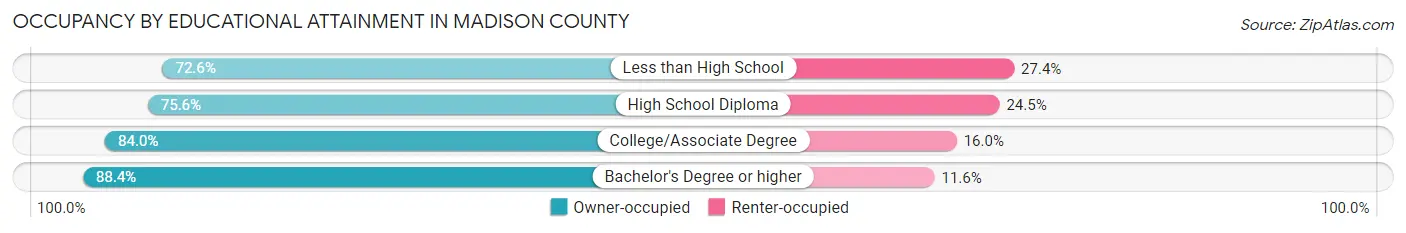
| Household Size | Owner-occupied | Renter-occupied |
| Less than High School | 146 (72.6%) | 55 (27.4%) |
| High School Diploma | 1,468 (75.5%) | 475 (24.4%) |
| College/Associate Degree | 2,041 (84.0%) | 388 (16.0%) |
| Bachelor's Degree or higher | 1,682 (88.4%) | 220 (11.6%) |
Occupancy by Age of Householder in Madison County
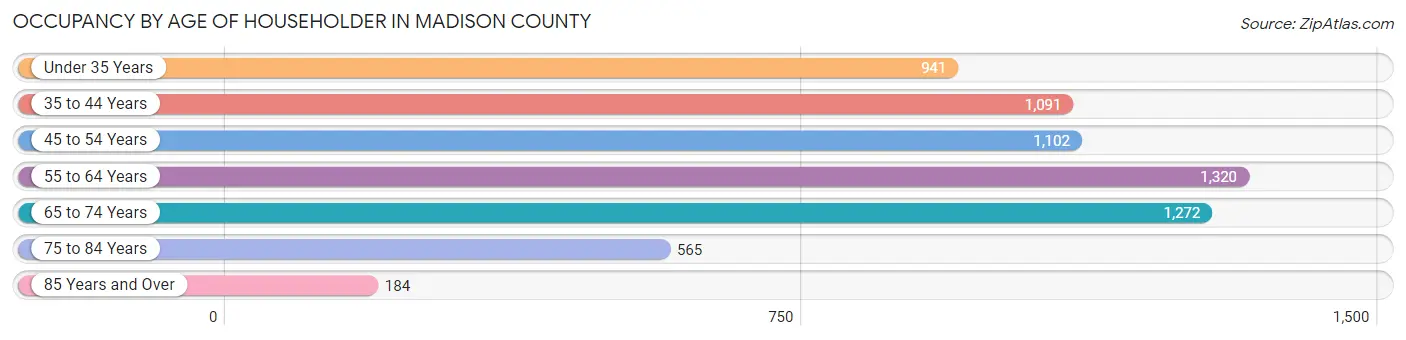
| Age Bracket | # Households | % Households |
| Under 35 Years | 941 | 14.5% |
| 35 to 44 Years | 1,091 | 16.9% |
| 45 to 54 Years | 1,102 | 17.0% |
| 55 to 64 Years | 1,320 | 20.4% |
| 65 to 74 Years | 1,272 | 19.6% |
| 75 to 84 Years | 565 | 8.7% |
| 85 Years and Over | 184 | 2.8% |
| Total | 6,475 | 100.0% |
Housing Finances in Madison County
Median Income by Occupancy in Madison County
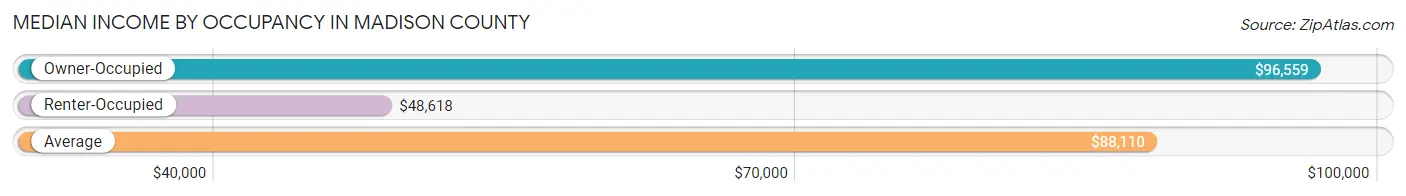
| Occupancy Type | # Households | Median Income |
| Owner-Occupied | 5,337 (82.4%) | $96,559 |
| Renter-Occupied | 1,138 (17.6%) | $48,618 |
| Average | 6,475 (100.0%) | $88,110 |
Occupancy by Householder Income Bracket in Madison County
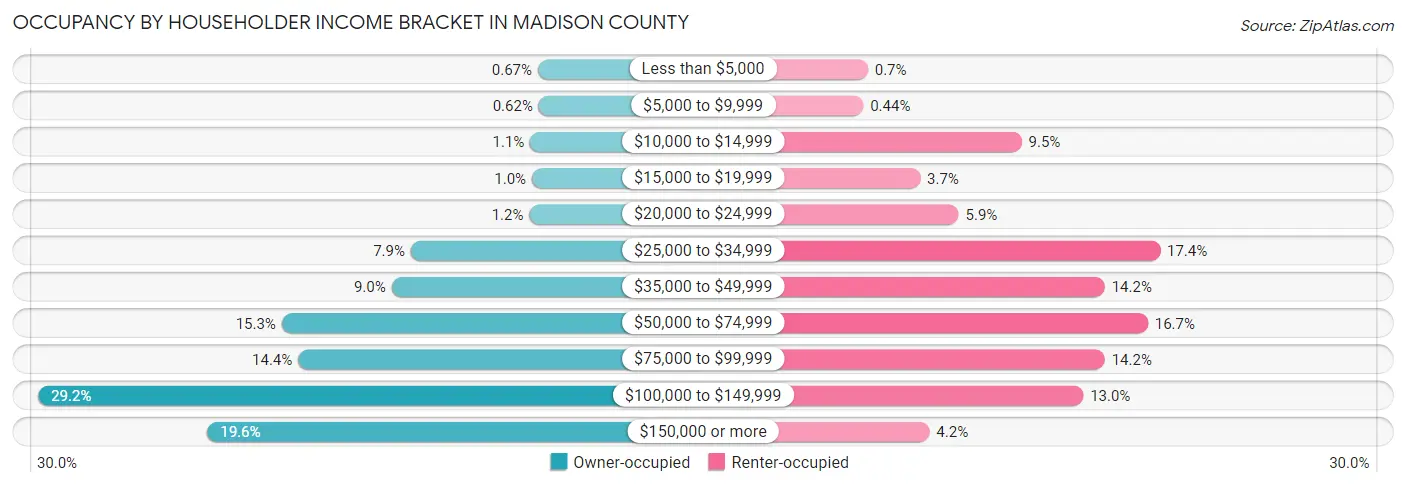
| Income Bracket | Owner-occupied | Renter-occupied |
| Less than $5,000 | 36 (0.7%) | 8 (0.7%) |
| $5,000 to $9,999 | 33 (0.6%) | 5 (0.4%) |
| $10,000 to $14,999 | 59 (1.1%) | 108 (9.5%) |
| $15,000 to $19,999 | 54 (1.0%) | 42 (3.7%) |
| $20,000 to $24,999 | 62 (1.2%) | 67 (5.9%) |
| $25,000 to $34,999 | 423 (7.9%) | 198 (17.4%) |
| $35,000 to $49,999 | 482 (9.0%) | 162 (14.2%) |
| $50,000 to $74,999 | 817 (15.3%) | 190 (16.7%) |
| $75,000 to $99,999 | 767 (14.4%) | 162 (14.2%) |
| $100,000 to $149,999 | 1,560 (29.2%) | 148 (13.0%) |
| $150,000 or more | 1,044 (19.6%) | 48 (4.2%) |
| Total | 5,337 (100.0%) | 1,138 (100.0%) |
Monthly Housing Cost Tiers in Madison County
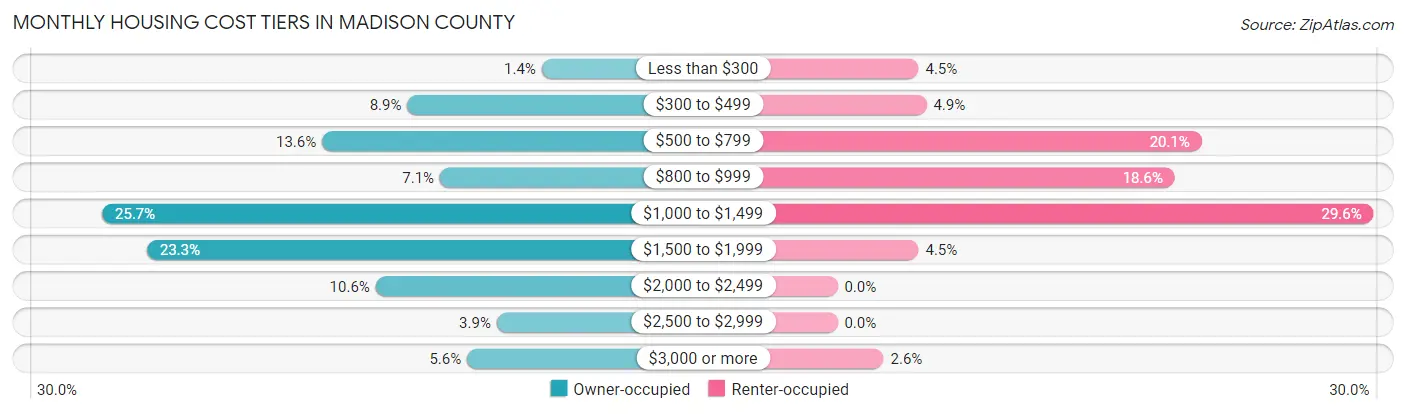
| Monthly Cost | Owner-occupied | Renter-occupied |
| Less than $300 | 77 (1.4%) | 51 (4.5%) |
| $300 to $499 | 473 (8.9%) | 56 (4.9%) |
| $500 to $799 | 724 (13.6%) | 229 (20.1%) |
| $800 to $999 | 377 (7.1%) | 212 (18.6%) |
| $1,000 to $1,499 | 1,373 (25.7%) | 337 (29.6%) |
| $1,500 to $1,999 | 1,241 (23.3%) | 51 (4.5%) |
| $2,000 to $2,499 | 566 (10.6%) | 0 (0.0%) |
| $2,500 to $2,999 | 209 (3.9%) | 0 (0.0%) |
| $3,000 or more | 297 (5.6%) | 29 (2.5%) |
| Total | 5,337 (100.0%) | 1,138 (100.0%) |
Physical Housing Characteristics in Madison County
Housing Structures in Madison County
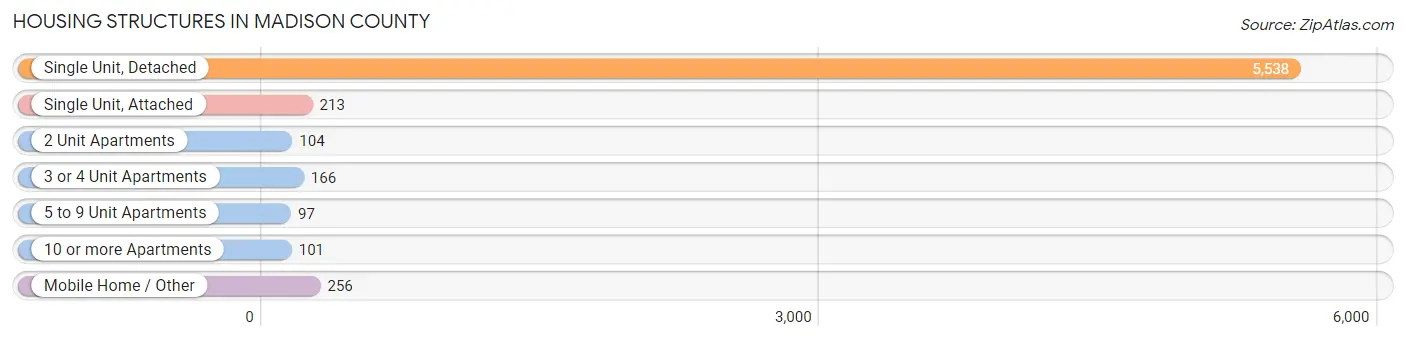
| Structure Type | # Housing Units | % Housing Units |
| Single Unit, Detached | 5,538 | 85.5% |
| Single Unit, Attached | 213 | 3.3% |
| 2 Unit Apartments | 104 | 1.6% |
| 3 or 4 Unit Apartments | 166 | 2.6% |
| 5 to 9 Unit Apartments | 97 | 1.5% |
| 10 or more Apartments | 101 | 1.6% |
| Mobile Home / Other | 256 | 4.0% |
| Total | 6,475 | 100.0% |
Housing Structures by Occupancy in Madison County
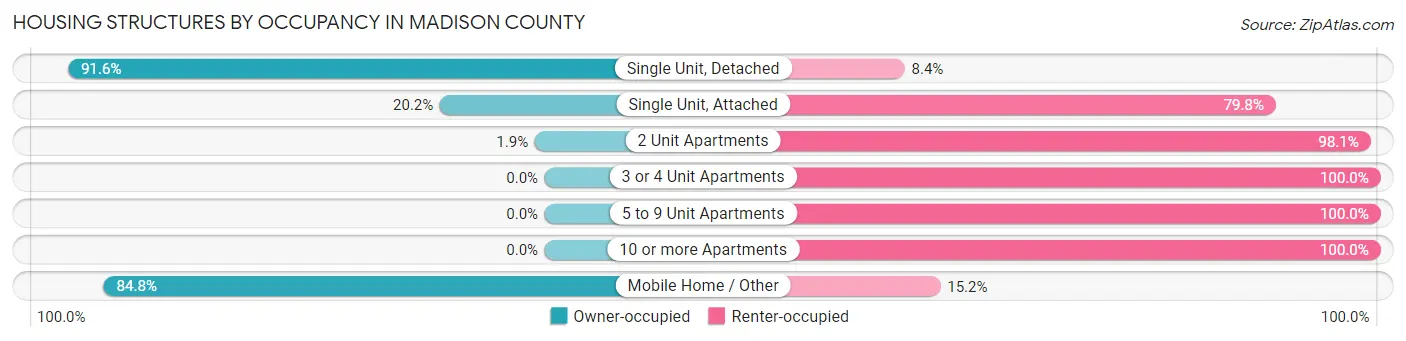
| Structure Type | Owner-occupied | Renter-occupied |
| Single Unit, Detached | 5,075 (91.6%) | 463 (8.4%) |
| Single Unit, Attached | 43 (20.2%) | 170 (79.8%) |
| 2 Unit Apartments | 2 (1.9%) | 102 (98.1%) |
| 3 or 4 Unit Apartments | 0 (0.0%) | 166 (100.0%) |
| 5 to 9 Unit Apartments | 0 (0.0%) | 97 (100.0%) |
| 10 or more Apartments | 0 (0.0%) | 101 (100.0%) |
| Mobile Home / Other | 217 (84.8%) | 39 (15.2%) |
| Total | 5,337 (82.4%) | 1,138 (17.6%) |
Housing Structures by Number of Rooms in Madison County
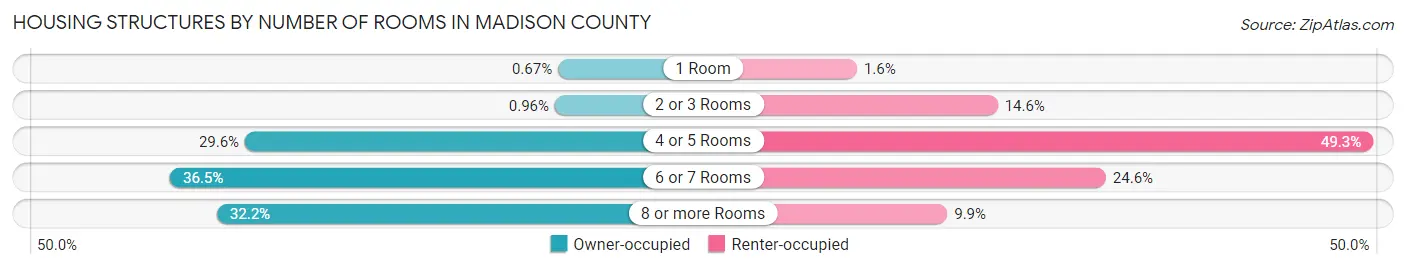
| Number of Rooms | Owner-occupied | Renter-occupied |
| 1 Room | 36 (0.7%) | 18 (1.6%) |
| 2 or 3 Rooms | 51 (1.0%) | 166 (14.6%) |
| 4 or 5 Rooms | 1,581 (29.6%) | 561 (49.3%) |
| 6 or 7 Rooms | 1,950 (36.5%) | 280 (24.6%) |
| 8 or more Rooms | 1,719 (32.2%) | 113 (9.9%) |
| Total | 5,337 (100.0%) | 1,138 (100.0%) |
Housing Structure by Heating Type in Madison County
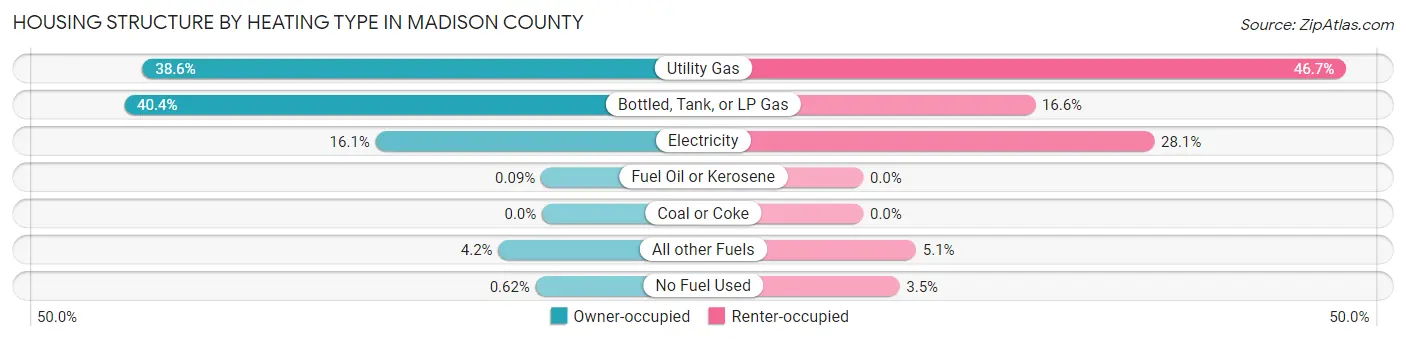
| Heating Type | Owner-occupied | Renter-occupied |
| Utility Gas | 2,061 (38.6%) | 531 (46.7%) |
| Bottled, Tank, or LP Gas | 2,155 (40.4%) | 189 (16.6%) |
| Electricity | 858 (16.1%) | 320 (28.1%) |
| Fuel Oil or Kerosene | 5 (0.1%) | 0 (0.0%) |
| Coal or Coke | 0 (0.0%) | 0 (0.0%) |
| All other Fuels | 225 (4.2%) | 58 (5.1%) |
| No Fuel Used | 33 (0.6%) | 40 (3.5%) |
| Total | 5,337 (100.0%) | 1,138 (100.0%) |
Household Vehicle Usage in Madison County
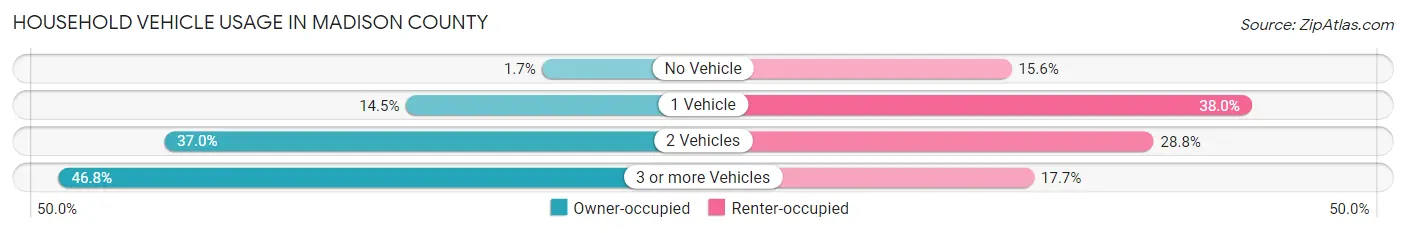
| Vehicles per Household | Owner-occupied | Renter-occupied |
| No Vehicle | 93 (1.7%) | 177 (15.5%) |
| 1 Vehicle | 772 (14.5%) | 432 (38.0%) |
| 2 Vehicles | 1,973 (37.0%) | 328 (28.8%) |
| 3 or more Vehicles | 2,499 (46.8%) | 201 (17.7%) |
| Total | 5,337 (100.0%) | 1,138 (100.0%) |
Real Estate & Mortgages in Madison County
Real Estate and Mortgage Overview in Madison County
| Characteristic | Without Mortgage | With Mortgage |
| Housing Units | 1,760 | 3,577 |
| Median Property Value | $195,900 | $249,900 |
| Median Household Income | $71,875 | $857 |
| Monthly Housing Costs | $636 | $297 |
| Real Estate Taxes | $3,252 | $26 |
Property Value by Mortgage Status in Madison County
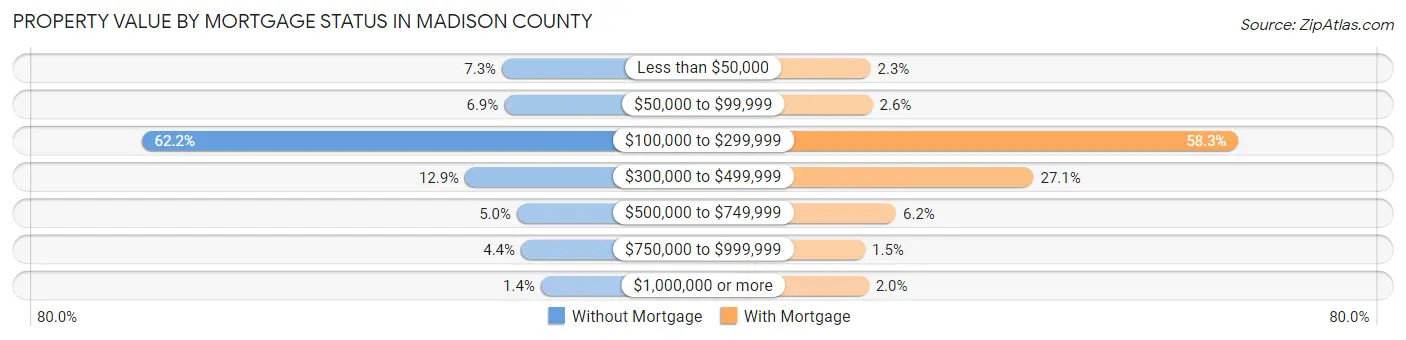
| Property Value | Without Mortgage | With Mortgage |
| Less than $50,000 | 128 (7.3%) | 82 (2.3%) |
| $50,000 to $99,999 | 122 (6.9%) | 93 (2.6%) |
| $100,000 to $299,999 | 1,094 (62.2%) | 2,087 (58.3%) |
| $300,000 to $499,999 | 227 (12.9%) | 970 (27.1%) |
| $500,000 to $749,999 | 88 (5.0%) | 221 (6.2%) |
| $750,000 to $999,999 | 77 (4.4%) | 52 (1.5%) |
| $1,000,000 or more | 24 (1.4%) | 72 (2.0%) |
| Total | 1,760 (100.0%) | 3,577 (100.0%) |
Household Income by Mortgage Status in Madison County
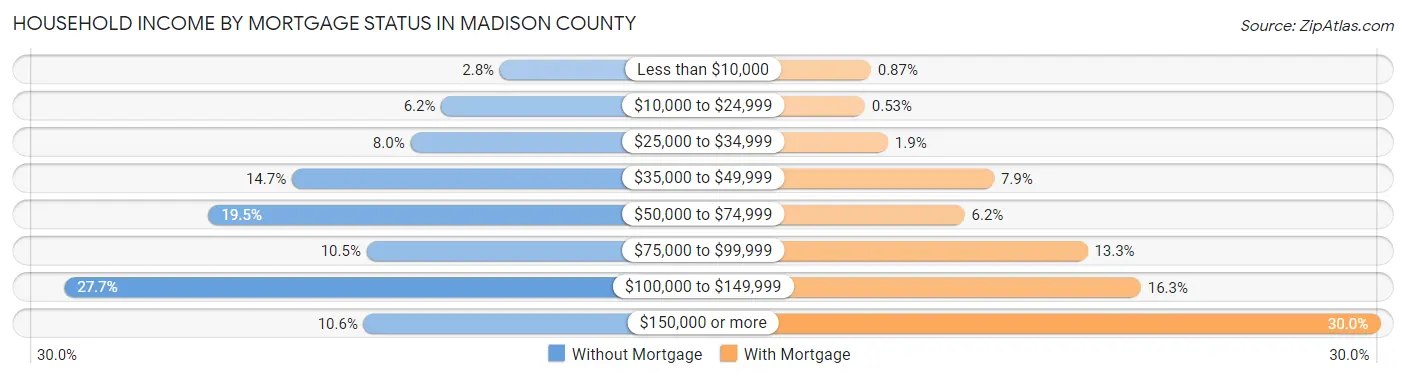
| Household Income | Without Mortgage | With Mortgage |
| Less than $10,000 | 50 (2.8%) | 31 (0.9%) |
| $10,000 to $24,999 | 109 (6.2%) | 19 (0.5%) |
| $25,000 to $34,999 | 140 (8.0%) | 66 (1.8%) |
| $35,000 to $49,999 | 259 (14.7%) | 283 (7.9%) |
| $50,000 to $74,999 | 343 (19.5%) | 223 (6.2%) |
| $75,000 to $99,999 | 184 (10.4%) | 474 (13.3%) |
| $100,000 to $149,999 | 488 (27.7%) | 583 (16.3%) |
| $150,000 or more | 187 (10.6%) | 1,072 (30.0%) |
| Total | 1,760 (100.0%) | 3,577 (100.0%) |
Property Value to Household Income Ratio in Madison County
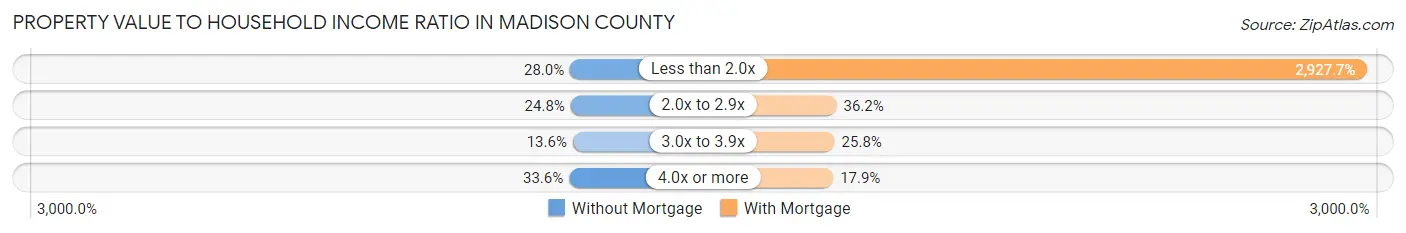
| Value-to-Income Ratio | Without Mortgage | With Mortgage |
| Less than 2.0x | 493 (28.0%) | 104,724 (2,927.7%) |
| 2.0x to 2.9x | 437 (24.8%) | 1,293 (36.1%) |
| 3.0x to 3.9x | 239 (13.6%) | 921 (25.8%) |
| 4.0x or more | 591 (33.6%) | 641 (17.9%) |
| Total | 1,760 (100.0%) | 3,577 (100.0%) |
Real Estate Taxes by Mortgage Status in Madison County
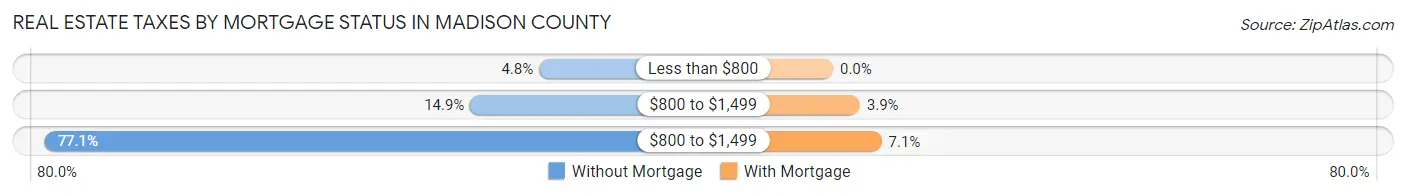
| Property Taxes | Without Mortgage | With Mortgage |
| Less than $800 | 85 (4.8%) | 0 (0.0%) |
| $800 to $1,499 | 262 (14.9%) | 140 (3.9%) |
| $800 to $1,499 | 1,356 (77.0%) | 254 (7.1%) |
| Total | 1,760 (100.0%) | 3,577 (100.0%) |
Health & Disability in Madison County
Health Insurance Coverage by Age in Madison County
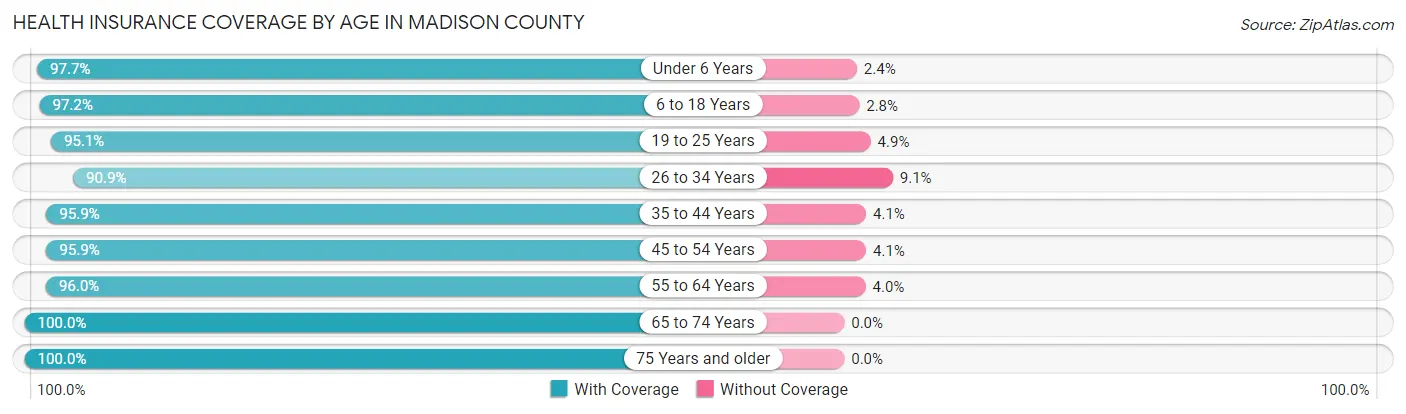
| Age Bracket | With Coverage | Without Coverage |
| Under 6 Years | 1,081 (97.7%) | 26 (2.4%) |
| 6 to 18 Years | 3,135 (97.2%) | 90 (2.8%) |
| 19 to 25 Years | 1,044 (95.1%) | 54 (4.9%) |
| 26 to 34 Years | 1,335 (90.9%) | 133 (9.1%) |
| 35 to 44 Years | 2,096 (95.9%) | 89 (4.1%) |
| 45 to 54 Years | 2,100 (95.9%) | 89 (4.1%) |
| 55 to 64 Years | 2,169 (96.0%) | 90 (4.0%) |
| 65 to 74 Years | 1,835 (100.0%) | 0 (0.0%) |
| 75 Years and older | 1,062 (100.0%) | 0 (0.0%) |
| Total | 15,857 (96.5%) | 571 (3.5%) |
Health Insurance Coverage by Citizenship Status in Madison County
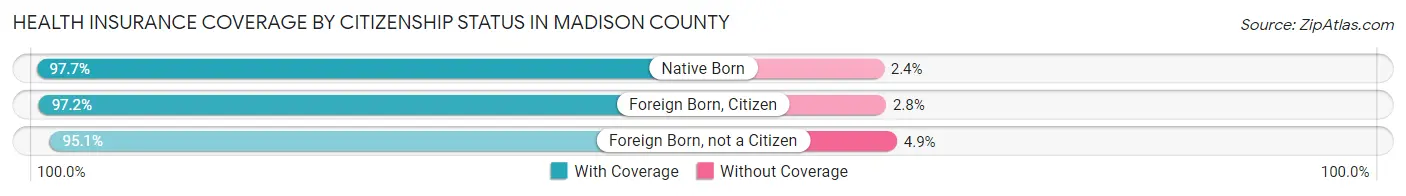
| Citizenship Status | With Coverage | Without Coverage |
| Native Born | 1,081 (97.7%) | 26 (2.4%) |
| Foreign Born, Citizen | 3,135 (97.2%) | 90 (2.8%) |
| Foreign Born, not a Citizen | 1,044 (95.1%) | 54 (4.9%) |
Health Insurance Coverage by Household Income in Madison County
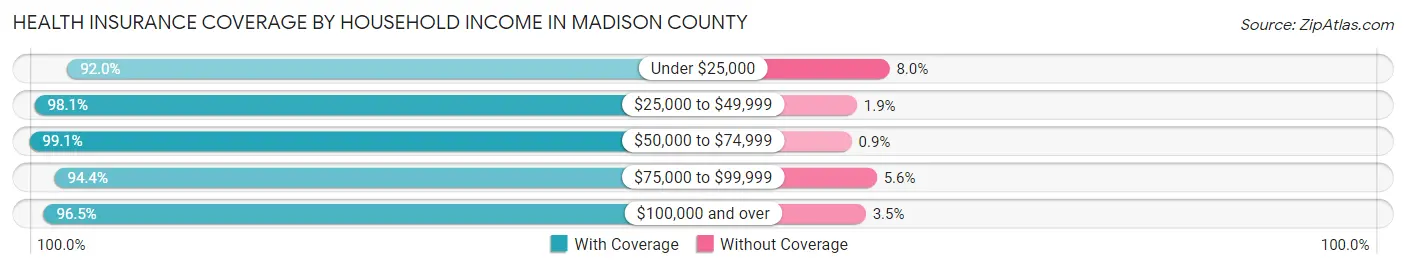
| Household Income | With Coverage | Without Coverage |
| Under $25,000 | 691 (92.0%) | 60 (8.0%) |
| $25,000 to $49,999 | 1,865 (98.1%) | 36 (1.9%) |
| $50,000 to $74,999 | 2,641 (99.1%) | 24 (0.9%) |
| $75,000 to $99,999 | 2,423 (94.4%) | 144 (5.6%) |
| $100,000 and over | 8,219 (96.5%) | 302 (3.5%) |
Public vs Private Health Insurance Coverage by Age in Madison County
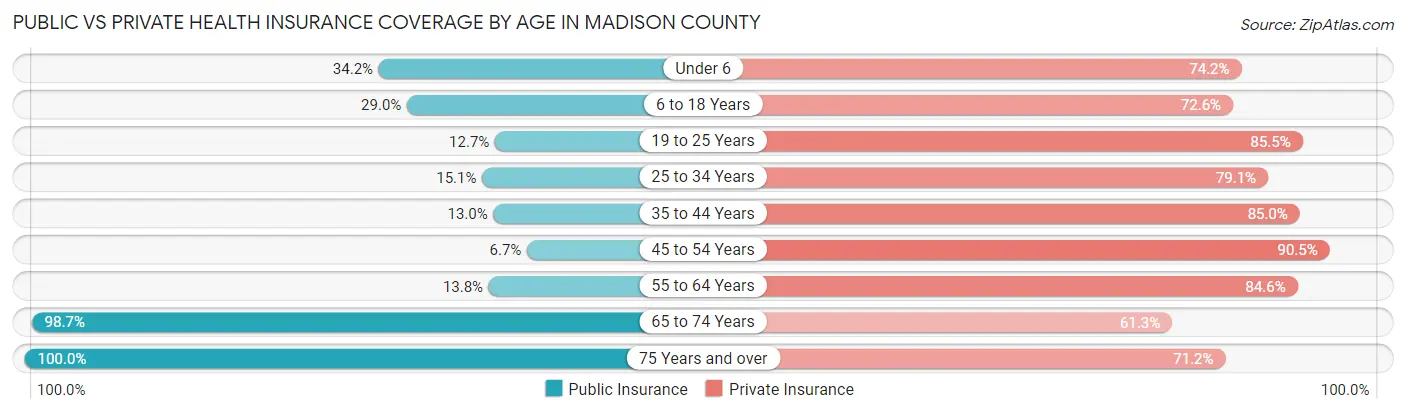
| Age Bracket | Public Insurance | Private Insurance |
| Under 6 | 379 (34.2%) | 821 (74.2%) |
| 6 to 18 Years | 935 (29.0%) | 2,341 (72.6%) |
| 19 to 25 Years | 139 (12.7%) | 939 (85.5%) |
| 25 to 34 Years | 221 (15.0%) | 1,161 (79.1%) |
| 35 to 44 Years | 283 (13.0%) | 1,857 (85.0%) |
| 45 to 54 Years | 147 (6.7%) | 1,982 (90.5%) |
| 55 to 64 Years | 312 (13.8%) | 1,911 (84.6%) |
| 65 to 74 Years | 1,811 (98.7%) | 1,125 (61.3%) |
| 75 Years and over | 1,062 (100.0%) | 756 (71.2%) |
| Total | 5,289 (32.2%) | 12,893 (78.5%) |
Disability Status by Sex by Age in Madison County
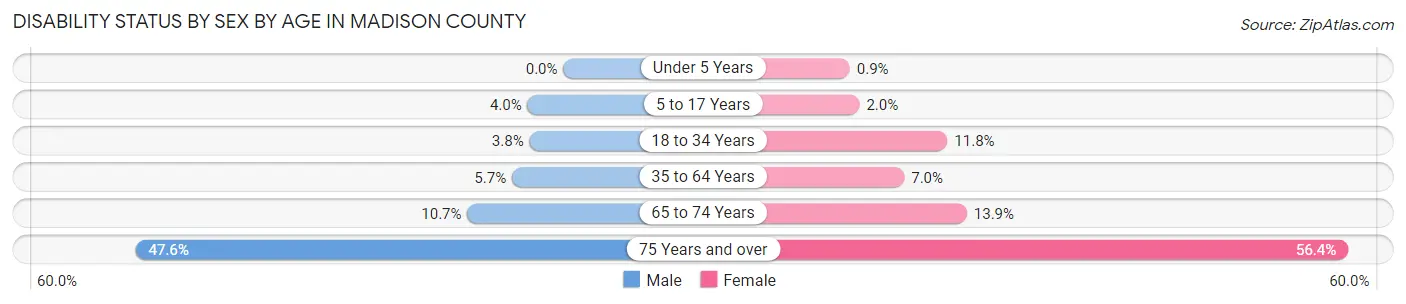
| Age Bracket | Male | Female |
| Under 5 Years | 0 (0.0%) | 4 (0.9%) |
| 5 to 17 Years | 70 (4.0%) | 29 (2.0%) |
| 18 to 34 Years | 52 (3.8%) | 166 (11.8%) |
| 35 to 64 Years | 191 (5.7%) | 229 (7.0%) |
| 65 to 74 Years | 111 (10.7%) | 111 (13.9%) |
| 75 Years and over | 222 (47.6%) | 336 (56.4%) |
Disability Class by Sex by Age in Madison County
Disability Class: Hearing Difficulty
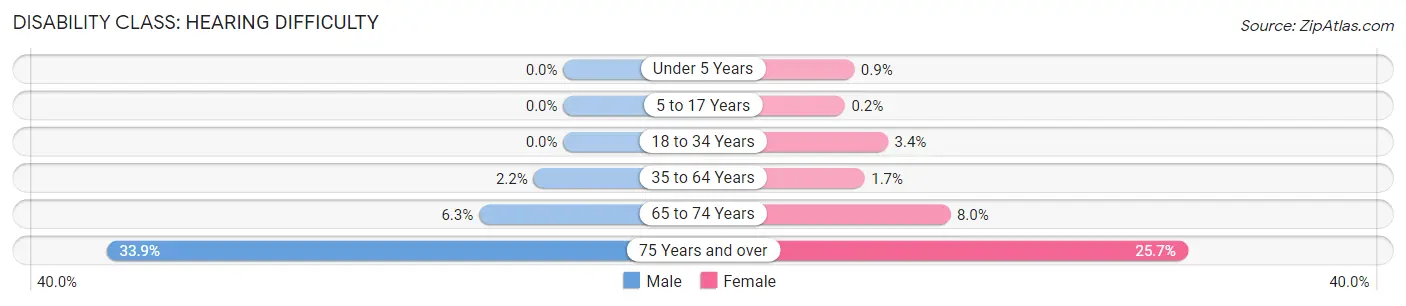
| Age Bracket | Male | Female |
| Under 5 Years | 0 (0.0%) | 4 (0.9%) |
| 5 to 17 Years | 0 (0.0%) | 3 (0.2%) |
| 18 to 34 Years | 0 (0.0%) | 48 (3.4%) |
| 35 to 64 Years | 74 (2.2%) | 55 (1.7%) |
| 65 to 74 Years | 65 (6.3%) | 64 (8.0%) |
| 75 Years and over | 158 (33.9%) | 153 (25.7%) |
Disability Class: Vision Difficulty
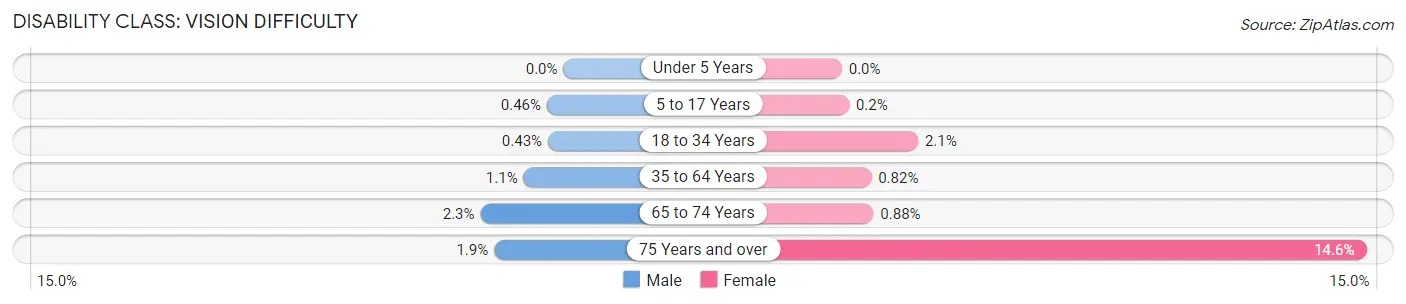
| Age Bracket | Male | Female |
| Under 5 Years | 0 (0.0%) | 0 (0.0%) |
| 5 to 17 Years | 8 (0.5%) | 3 (0.2%) |
| 18 to 34 Years | 6 (0.4%) | 30 (2.1%) |
| 35 to 64 Years | 37 (1.1%) | 27 (0.8%) |
| 65 to 74 Years | 24 (2.3%) | 7 (0.9%) |
| 75 Years and over | 9 (1.9%) | 87 (14.6%) |
Disability Class: Cognitive Difficulty
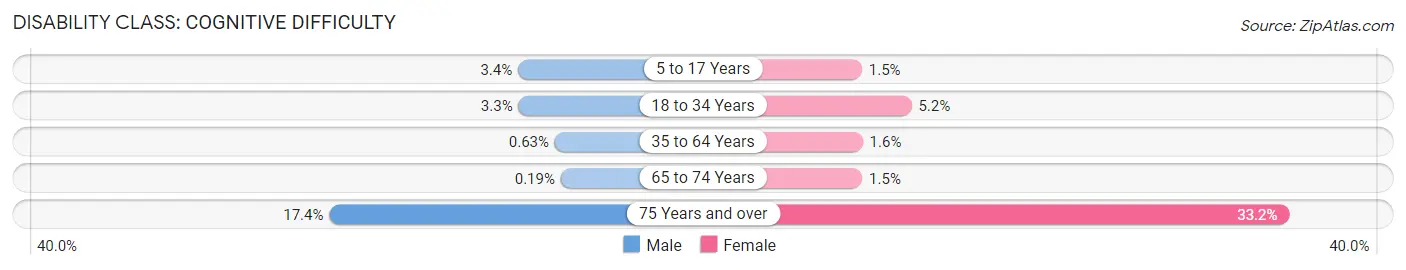
| Age Bracket | Male | Female |
| 5 to 17 Years | 59 (3.4%) | 22 (1.5%) |
| 18 to 34 Years | 46 (3.3%) | 73 (5.2%) |
| 35 to 64 Years | 21 (0.6%) | 51 (1.5%) |
| 65 to 74 Years | 2 (0.2%) | 12 (1.5%) |
| 75 Years and over | 81 (17.4%) | 198 (33.2%) |
Disability Class: Ambulatory Difficulty
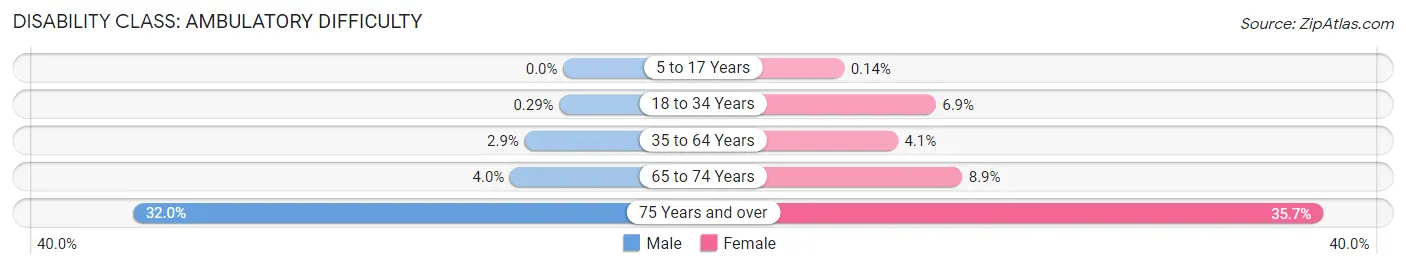
| Age Bracket | Male | Female |
| 5 to 17 Years | 0 (0.0%) | 2 (0.1%) |
| 18 to 34 Years | 4 (0.3%) | 98 (6.9%) |
| 35 to 64 Years | 96 (2.9%) | 136 (4.1%) |
| 65 to 74 Years | 41 (4.0%) | 71 (8.9%) |
| 75 Years and over | 149 (32.0%) | 213 (35.7%) |
Disability Class: Self-Care Difficulty
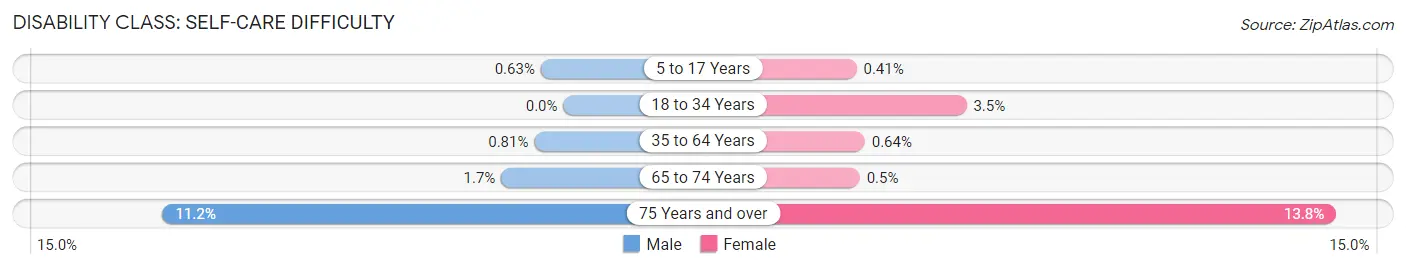
| Age Bracket | Male | Female |
| 5 to 17 Years | 11 (0.6%) | 6 (0.4%) |
| 18 to 34 Years | 0 (0.0%) | 49 (3.5%) |
| 35 to 64 Years | 27 (0.8%) | 21 (0.6%) |
| 65 to 74 Years | 18 (1.7%) | 4 (0.5%) |
| 75 Years and over | 52 (11.2%) | 82 (13.8%) |
Technology Access in Madison County
Computing Device Access in Madison County
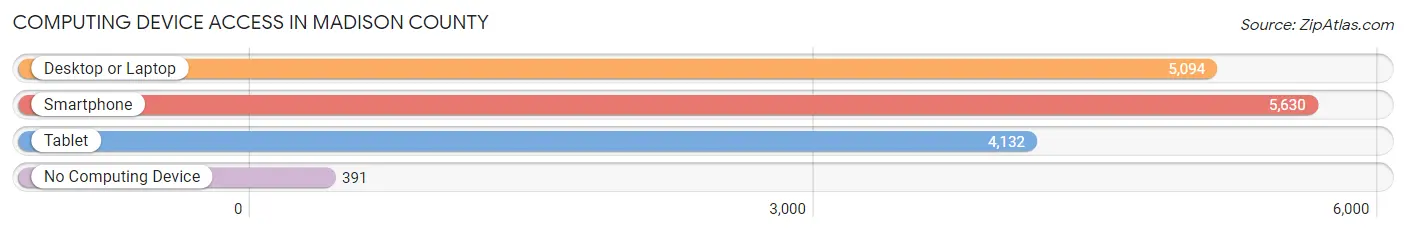
| Device Type | # Households | % Households |
| Desktop or Laptop | 5,094 | 78.7% |
| Smartphone | 5,630 | 87.0% |
| Tablet | 4,132 | 63.8% |
| No Computing Device | 391 | 6.0% |
| Total | 6,475 | 100.0% |
Internet Access in Madison County
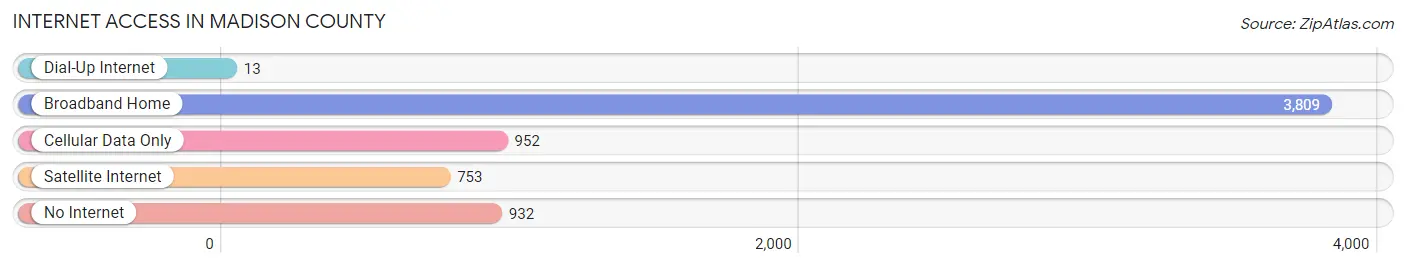
| Internet Type | # Households | % Households |
| Dial-Up Internet | 13 | 0.2% |
| Broadband Home | 3,809 | 58.8% |
| Cellular Data Only | 952 | 14.7% |
| Satellite Internet | 753 | 11.6% |
| No Internet | 932 | 14.4% |
| Total | 6,475 | 100.0% |
Madison County Summary
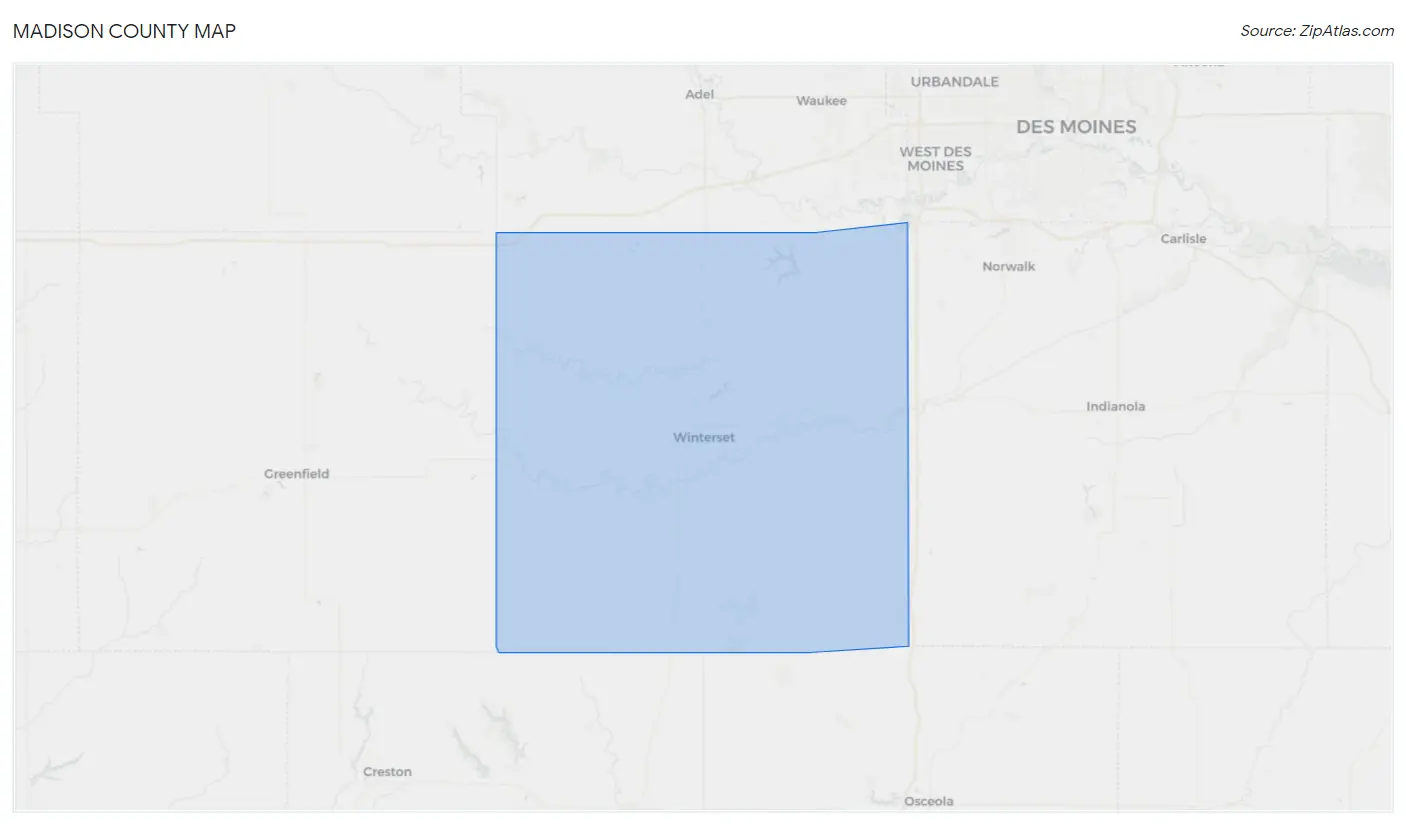
Madison County is located in the state of Iowa in the United States. It is part of the Des Moines–West Des Moines Metropolitan Statistical Area. The county seat is Winterset, and the largest city is Earlham. As of the 2010 census, the population was 15,679.
History
Madison County was established in 1846 and was named after James Madison, the fourth President of the United States. The county was originally part of the Iowa Territory, which was established in 1838. The county was organized in 1846 and the first county seat was established in Winterset.
The county was home to several Native American tribes, including the Sauk, Fox, and Ioway. The first settlers in the county were mostly of English and German descent. The first permanent settlement was established in 1846.
Geography
Madison County is located in the central part of Iowa, and is bordered by Adair County to the north, Warren County to the east, Polk County to the south, and Dallas County to the west. The county has a total area of 576 square miles, of which 575 square miles is land and 1 square mile is water.
The county is mostly flat, with rolling hills in the western part of the county. The Middle River runs through the county, and there are several small lakes and ponds. The highest point in the county is located in the western part of the county, at an elevation of 1,068 feet.
Economy
The economy of Madison County is largely based on agriculture. The county is home to several large farms, and the main crops grown in the county are corn, soybeans, and hay. The county also has a large livestock industry, with cattle, hogs, and sheep being the main animals raised.
The county also has a large manufacturing sector, with several companies located in the county. The largest employers in the county are John Deere, Winnebago Industries, and the Madison County Health Care Center.
Demographics
As of the 2010 census, there were 15,679 people, 6,092 households, and 4,093 families living in the county. The population density was 27.3 people per square mile. The racial makeup of the county was 97.3% White, 0.5% African American, 0.3% Native American, 0.3% Asian, 0.2% from other races, and 1.4% from two or more races. Hispanic or Latino of any race were 1.2% of the population.
The median income for a household in the county was $45,945, and the median income for a family was $54,945. The per capita income for the county was $21,945. About 8.2% of families and 11.2% of the population were below the poverty line, including 14.2% of those under age 18 and 8.2% of those age 65 or over.
Conclusion
Madison County is a rural county located in the state of Iowa. It is home to several large farms and has a large manufacturing sector. The county has a population of 15,679, and the median income for a household is $45,945. The county is largely agricultural, with corn, soybeans, and hay being the main crops grown. Madison County is a great place to live and work, and offers a variety of opportunities for those looking to settle down in the area.
Common Questions
What is Per Capita Income in Madison County?
Per Capita income in Madison County is $39,442.
What is the Median Family Income in Madison County?
Median Family Income in Madison County is $105,706.
What is the Median Household income in Madison County?
Median Household Income in Madison County is $88,110.
What is Income or Wage Gap in Madison County?
Income or Wage Gap in Madison County is 33.8%.
Women in Madison County earn 66.2 cents for every dollar earned by a man.
What is Inequality or Gini Index in Madison County?
Inequality or Gini Index in Madison County is 0.37.
What is the Total Population of Madison County?
Total Population of Madison County is 16,609.
What is the Total Male Population of Madison County?
Total Male Population of Madison County is 8,470.
What is the Total Female Population of Madison County?
Total Female Population of Madison County is 8,139.
What is the Ratio of Males per 100 Females in Madison County?
There are 104.07 Males per 100 Females in Madison County.
What is the Ratio of Females per 100 Males in Madison County?
There are 96.09 Females per 100 Males in Madison County.
What is the Median Population Age in Madison County?
Median Population Age in Madison County is 40.9 Years.
What is the Average Family Size in Madison County
Average Family Size in Madison County is 3.1 People.
What is the Average Household Size in Madison County
Average Household Size in Madison County is 2.5 People.
How Large is the Labor Force in Madison County?
There are 9,291 People in the Labor Forcein in Madison County.
What is the Percentage of People in the Labor Force in Madison County?
71.5% of People are in the Labor Force in Madison County.
What is the Unemployment Rate in Madison County?
Unemployment Rate in Madison County is 2.3%.