Harrison County, IA Map & Demographics
Harrison County Map
Harrison County Overview
$36,998
PER CAPITA INCOME
$89,443
AVG FAMILY INCOME
$75,830
AVG HOUSEHOLD INCOME
24.3%
WAGE / INCOME GAP [ % ]
75.7¢/ $1
WAGE / INCOME GAP [ $ ]
$12,005
FAMILY INCOME DEFICIT
0.41
INEQUALITY / GINI INDEX
14,623
TOTAL POPULATION
7,452
MALE POPULATION
7,171
FEMALE POPULATION
103.92
MALES / 100 FEMALES
96.23
FEMALES / 100 MALES
42.0
MEDIAN AGE
2.9
AVG FAMILY SIZE
2.4
AVG HOUSEHOLD SIZE
7,592
LABOR FORCE [ PEOPLE ]
65.2%
PERCENT IN LABOR FORCE
2.7%
UNEMPLOYMENT RATE
Harrison County Area Codes
Income in Harrison County
Income Overview in Harrison County
Per Capita Income in Harrison County is $36,998, while median incomes of families and households are $89,443 and $75,830 respectively.
| Characteristic | Number | Measure |
| Per Capita Income | 14,623 | $36,998 |
| Median Family Income | 4,247 | $89,443 |
| Mean Family Income | 4,247 | $105,253 |
| Median Household Income | 5,963 | $75,830 |
| Mean Household Income | 5,963 | $89,903 |
| Income Deficit | 4,247 | $12,005 |
| Wage / Income Gap (%) | 14,623 | 24.34% |
| Wage / Income Gap ($) | 14,623 | 75.66¢ per $1 |
| Gini / Inequality Index | 14,623 | 0.41 |
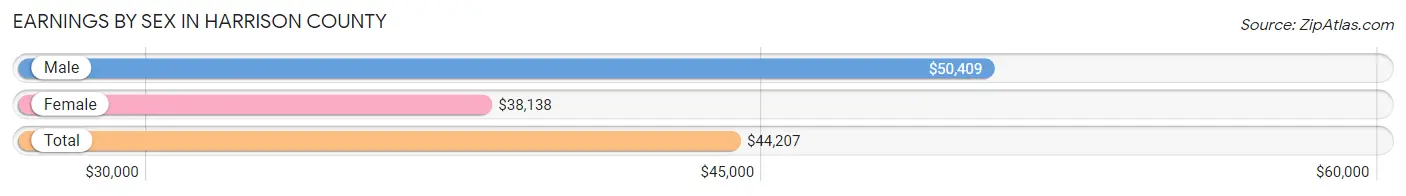
Earnings by Sex in Harrison County
Average Earnings in Harrison County are $44,207, $50,409 for men and $38,138 for women, a difference of 24.3%.
| Sex | Number | Average Earnings |
| Male | 4,379 (54.5%) | $50,409 |
| Female | 3,651 (45.5%) | $38,138 |
| Total | 8,030 (100.0%) | $44,207 |
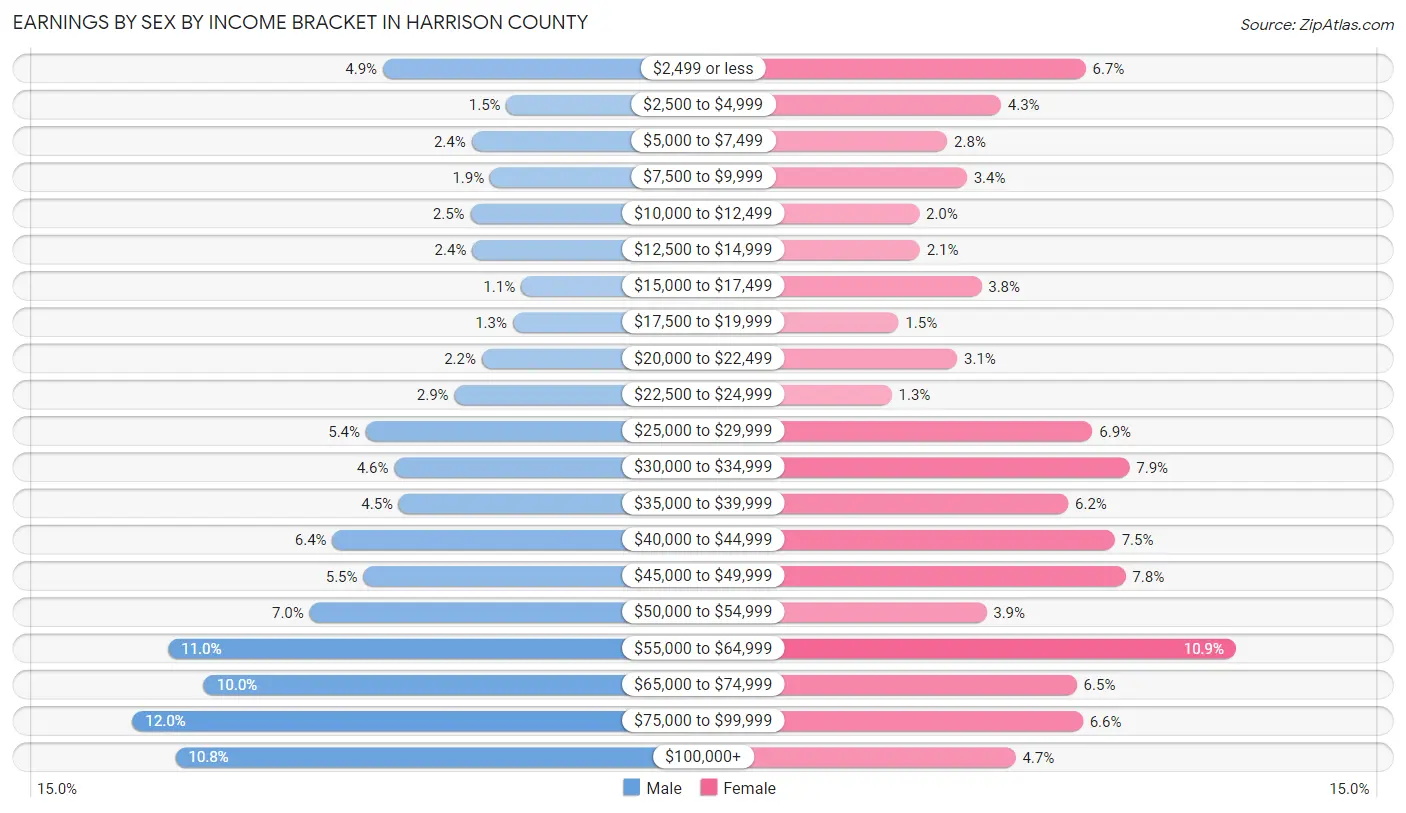
Earnings by Sex by Income Bracket in Harrison County
The most common earnings brackets in Harrison County are $75,000 to $99,999 for men (524 | 12.0%) and $55,000 to $64,999 for women (399 | 10.9%).
| Income | Male | Female |
| $2,499 or less | 216 (4.9%) | 245 (6.7%) |
| $2,500 to $4,999 | 64 (1.5%) | 158 (4.3%) |
| $5,000 to $7,499 | 107 (2.4%) | 103 (2.8%) |
| $7,500 to $9,999 | 84 (1.9%) | 123 (3.4%) |
| $10,000 to $12,499 | 108 (2.5%) | 74 (2.0%) |
| $12,500 to $14,999 | 106 (2.4%) | 75 (2.1%) |
| $15,000 to $17,499 | 46 (1.1%) | 138 (3.8%) |
| $17,500 to $19,999 | 56 (1.3%) | 53 (1.5%) |
| $20,000 to $22,499 | 94 (2.1%) | 113 (3.1%) |
| $22,500 to $24,999 | 128 (2.9%) | 46 (1.3%) |
| $25,000 to $29,999 | 237 (5.4%) | 252 (6.9%) |
| $30,000 to $34,999 | 202 (4.6%) | 290 (7.9%) |
| $35,000 to $39,999 | 196 (4.5%) | 227 (6.2%) |
| $40,000 to $44,999 | 278 (6.4%) | 275 (7.5%) |
| $45,000 to $49,999 | 240 (5.5%) | 286 (7.8%) |
| $50,000 to $54,999 | 306 (7.0%) | 143 (3.9%) |
| $55,000 to $64,999 | 480 (11.0%) | 399 (10.9%) |
| $65,000 to $74,999 | 436 (10.0%) | 236 (6.5%) |
| $75,000 to $99,999 | 524 (12.0%) | 242 (6.6%) |
| $100,000+ | 471 (10.8%) | 173 (4.7%) |
| Total | 4,379 (100.0%) | 3,651 (100.0%) |
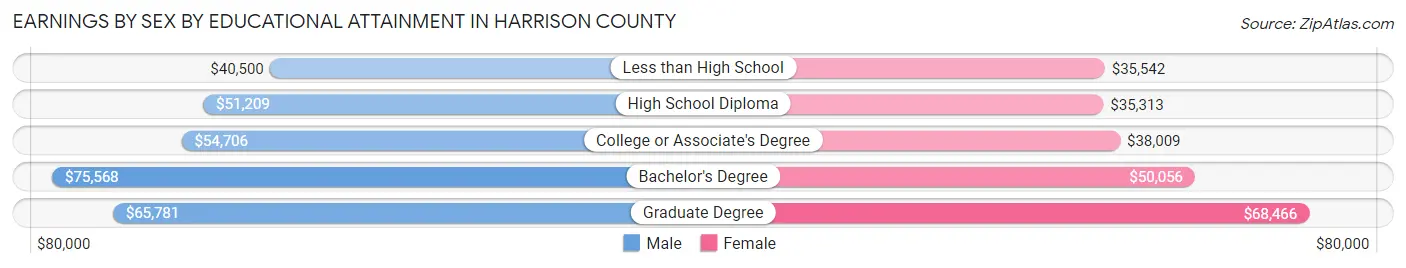
Earnings by Sex by Educational Attainment in Harrison County
Average earnings in Harrison County are $54,883 for men and $41,852 for women, a difference of 23.7%. Men with an educational attainment of bachelor's degree enjoy the highest average annual earnings of $75,568, while those with less than high school education earn the least with $40,500. Women with an educational attainment of graduate degree earn the most with the average annual earnings of $68,466, while those with high school diploma education have the smallest earnings of $35,313.
| Educational Attainment | Male Income | Female Income |
| Less than High School | $40,500 | $35,542 |
| High School Diploma | $51,209 | $35,313 |
| College or Associate's Degree | $54,706 | $38,009 |
| Bachelor's Degree | $75,568 | $50,056 |
| Graduate Degree | $65,781 | $68,466 |
| Total | $54,883 | $41,852 |
Family Income in Harrison County
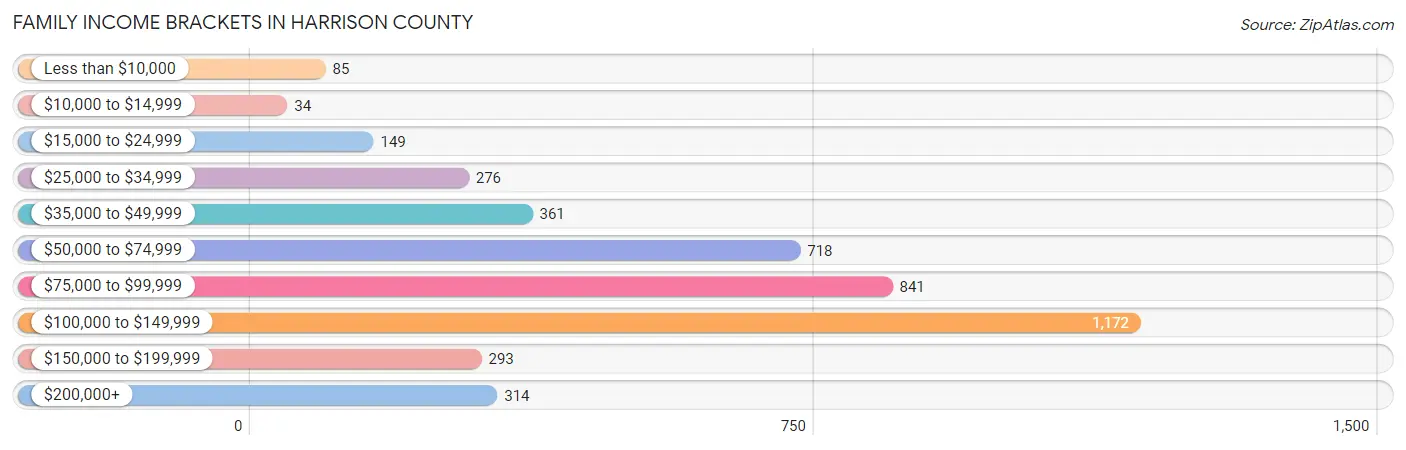
Family Income Brackets in Harrison County
According to the Harrison County family income data, there are 1,172 families falling into the $100,000 to $149,999 income range, which is the most common income bracket and makes up 27.6% of all families. Conversely, the $10,000 to $14,999 income bracket is the least frequent group with only 34 families (0.8%) belonging to this category.
| Income Bracket | # Families | % Families |
| Less than $10,000 | 85 | 2.0% |
| $10,000 to $14,999 | 34 | 0.8% |
| $15,000 to $24,999 | 149 | 3.5% |
| $25,000 to $34,999 | 276 | 6.5% |
| $35,000 to $49,999 | 361 | 8.5% |
| $50,000 to $74,999 | 718 | 16.9% |
| $75,000 to $99,999 | 841 | 19.8% |
| $100,000 to $149,999 | 1,172 | 27.6% |
| $150,000 to $199,999 | 293 | 6.9% |
| $200,000+ | 314 | 7.4% |
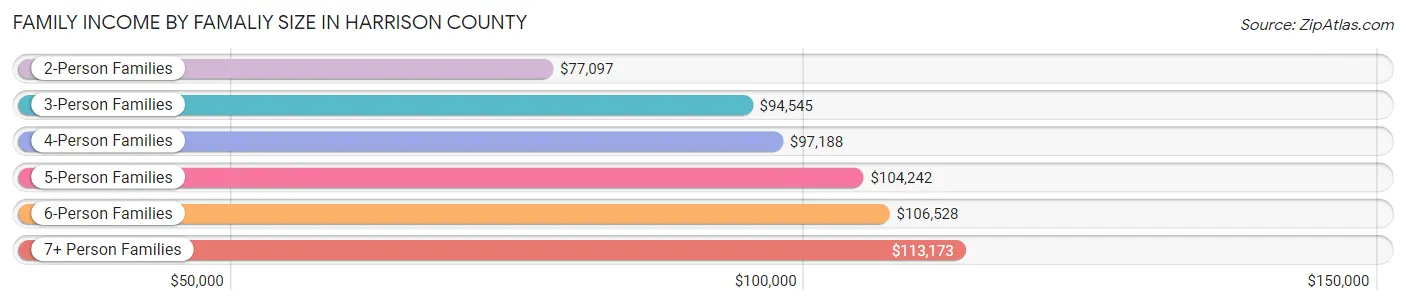
Family Income by Famaliy Size in Harrison County
7+ person families (49 | 1.1%) account for the highest median family income in Harrison County with $113,173 per family, while 2-person families (2,232 | 52.5%) have the highest median income of $38,548 per family member.
| Income Bracket | # Families | Median Income |
| 2-Person Families | 2,232 (52.5%) | $77,097 |
| 3-Person Families | 828 (19.5%) | $94,545 |
| 4-Person Families | 670 (15.8%) | $97,188 |
| 5-Person Families | 405 (9.5%) | $104,242 |
| 6-Person Families | 63 (1.5%) | $106,528 |
| 7+ Person Families | 49 (1.1%) | $113,173 |
| Total | 4,247 (100.0%) | $89,443 |
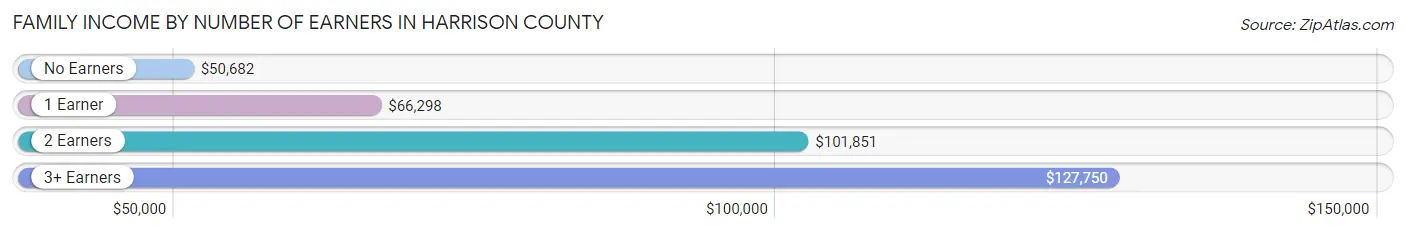
Family Income by Number of Earners in Harrison County
The median family income in Harrison County is $89,443, with families comprising 3+ earners (509) having the highest median family income of $127,750, while families with no earners (658) have the lowest median family income of $50,682, accounting for 12.0% and 15.5% of families, respectively.
| Number of Earners | # Families | Median Income |
| No Earners | 658 (15.5%) | $50,682 |
| 1 Earner | 1,025 (24.1%) | $66,298 |
| 2 Earners | 2,055 (48.4%) | $101,851 |
| 3+ Earners | 509 (12.0%) | $127,750 |
| Total | 4,247 (100.0%) | $89,443 |
Household Income in Harrison County
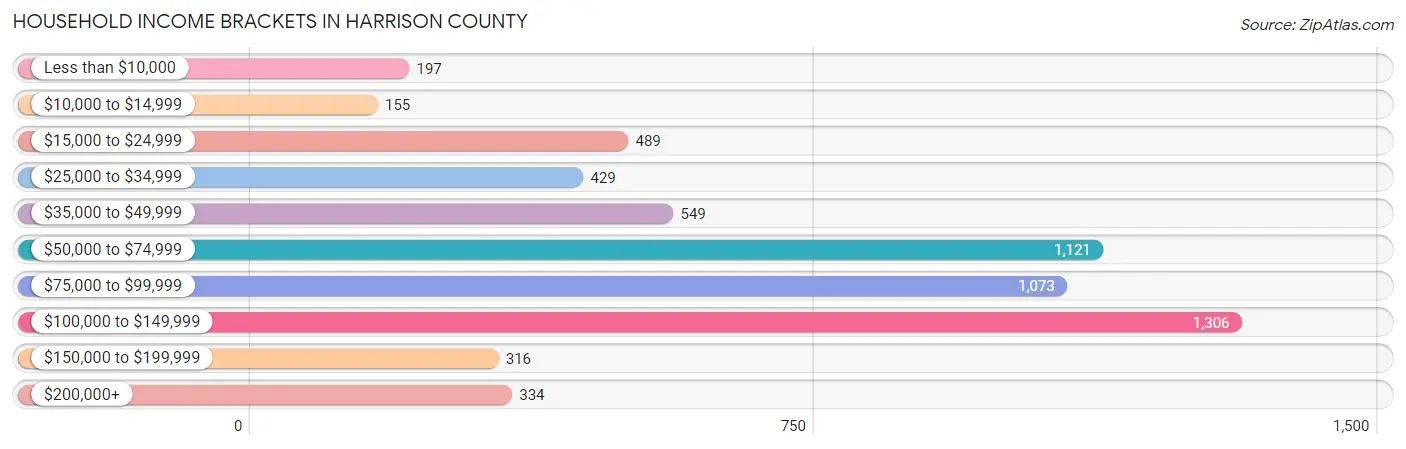
Household Income Brackets in Harrison County
With 1,306 households falling in the category, the $100,000 to $149,999 income range is the most frequent in Harrison County, accounting for 21.9% of all households. In contrast, only 155 households (2.6%) fall into the $10,000 to $14,999 income bracket, making it the least populous group.
| Income Bracket | # Households | % Households |
| Less than $10,000 | 197 | 3.3% |
| $10,000 to $14,999 | 155 | 2.6% |
| $15,000 to $24,999 | 489 | 8.2% |
| $25,000 to $34,999 | 429 | 7.2% |
| $35,000 to $49,999 | 549 | 9.2% |
| $50,000 to $74,999 | 1,121 | 18.8% |
| $75,000 to $99,999 | 1,073 | 18.0% |
| $100,000 to $149,999 | 1,306 | 21.9% |
| $150,000 to $199,999 | 316 | 5.3% |
| $200,000+ | 334 | 5.6% |
Household Income by Householder Age in Harrison County
The median household income in Harrison County is $75,830, with the highest median household income of $86,157 found in the 45 to 64 years age bracket for the primary householder. A total of 2,368 households (39.7%) fall into this category. Meanwhile, the 65+ years age bracket for the primary householder has the lowest median household income of $50,616, with 1,677 households (28.1%) in this group.
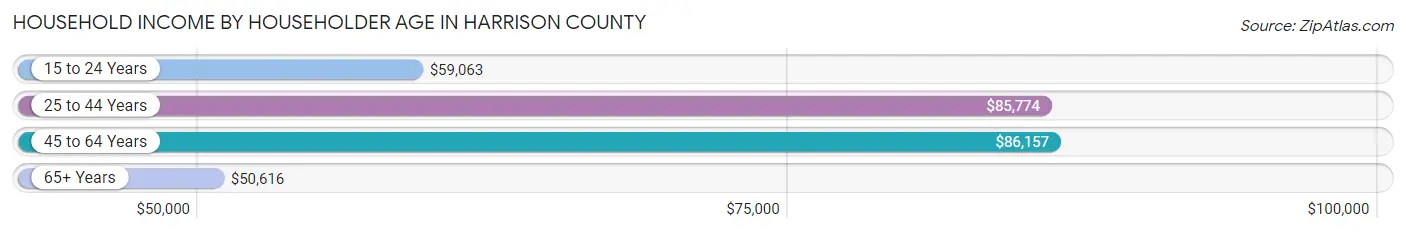
| Income Bracket | # Households | Median Income |
| 15 to 24 Years | 207 (3.5%) | $59,063 |
| 25 to 44 Years | 1,711 (28.7%) | $85,774 |
| 45 to 64 Years | 2,368 (39.7%) | $86,157 |
| 65+ Years | 1,677 (28.1%) | $50,616 |
| Total | 5,963 (100.0%) | $75,830 |
Poverty in Harrison County
Income Below Poverty by Sex and Age in Harrison County
With 6.2% poverty level for males and 9.1% for females among the residents of Harrison County, 5 year old males and 18 to 24 year old females are the most vulnerable to poverty, with 28 males (22.2%) and 69 females (14.2%) in their respective age groups living below the poverty level.
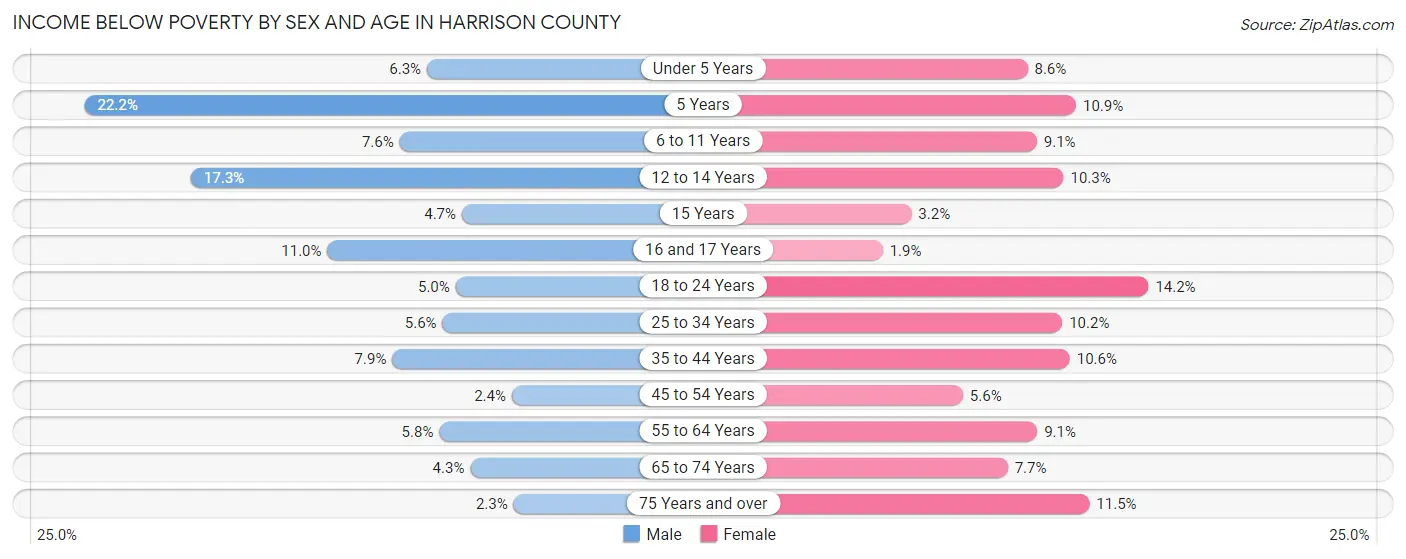
| Age Bracket | Male | Female |
| Under 5 Years | 25 (6.3%) | 38 (8.6%) |
| 5 Years | 28 (22.2%) | 5 (10.9%) |
| 6 to 11 Years | 49 (7.6%) | 43 (9.0%) |
| 12 to 14 Years | 47 (17.3%) | 36 (10.3%) |
| 15 Years | 4 (4.7%) | 4 (3.2%) |
| 16 and 17 Years | 23 (11.0%) | 3 (1.9%) |
| 18 to 24 Years | 31 (5.0%) | 69 (14.2%) |
| 25 to 34 Years | 44 (5.6%) | 76 (10.2%) |
| 35 to 44 Years | 68 (7.9%) | 89 (10.6%) |
| 45 to 54 Years | 22 (2.4%) | 49 (5.6%) |
| 55 to 64 Years | 67 (5.8%) | 100 (9.1%) |
| 65 to 74 Years | 35 (4.3%) | 58 (7.7%) |
| 75 Years and over | 11 (2.3%) | 68 (11.5%) |
| Total | 454 (6.2%) | 638 (9.1%) |
Income Above Poverty by Sex and Age in Harrison County
According to the poverty statistics in Harrison County, males aged 75 years and over and females aged 16 and 17 years are the age groups that are most secure financially, with 97.7% of males and 98.1% of females in these age groups living above the poverty line.
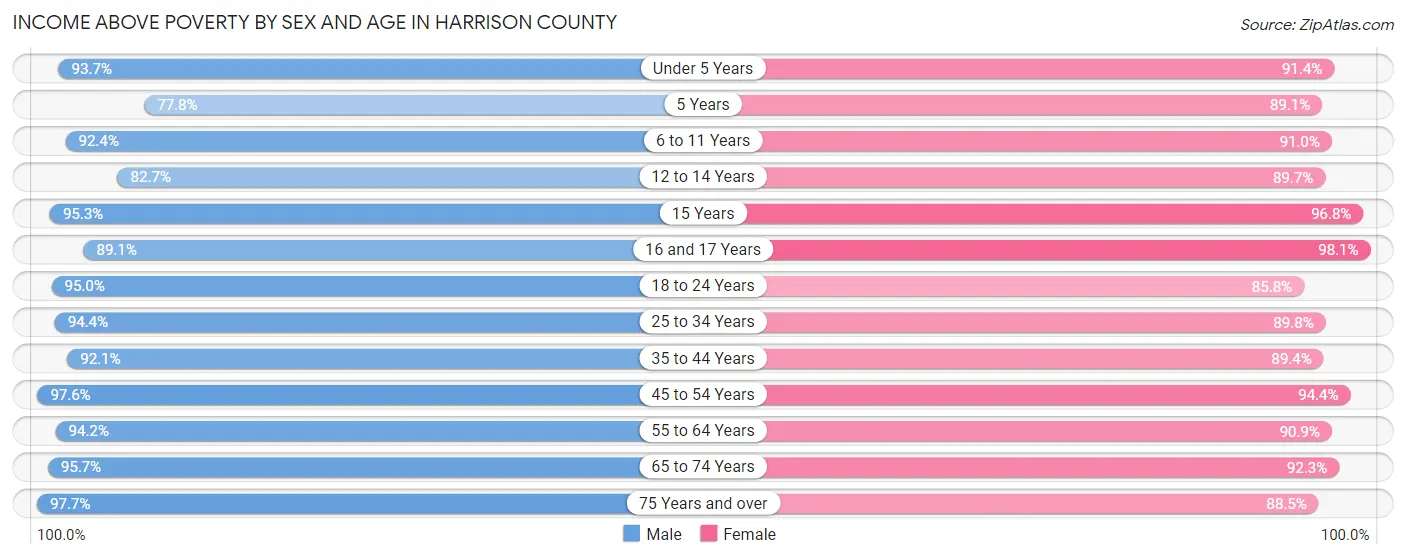
| Age Bracket | Male | Female |
| Under 5 Years | 370 (93.7%) | 403 (91.4%) |
| 5 Years | 98 (77.8%) | 41 (89.1%) |
| 6 to 11 Years | 596 (92.4%) | 432 (90.9%) |
| 12 to 14 Years | 225 (82.7%) | 314 (89.7%) |
| 15 Years | 81 (95.3%) | 120 (96.8%) |
| 16 and 17 Years | 187 (89.0%) | 155 (98.1%) |
| 18 to 24 Years | 589 (95.0%) | 416 (85.8%) |
| 25 to 34 Years | 741 (94.4%) | 667 (89.8%) |
| 35 to 44 Years | 788 (92.1%) | 752 (89.4%) |
| 45 to 54 Years | 900 (97.6%) | 823 (94.4%) |
| 55 to 64 Years | 1,096 (94.2%) | 1,002 (90.9%) |
| 65 to 74 Years | 775 (95.7%) | 695 (92.3%) |
| 75 Years and over | 466 (97.7%) | 524 (88.5%) |
| Total | 6,912 (93.8%) | 6,344 (90.9%) |
Income Below Poverty Among Married-Couple Families in Harrison County
The poverty statistics for married-couple families in Harrison County show that 2.0% or 72 of the total 3,529 families live below the poverty line. Families with 5 or more children have the highest poverty rate of 30.0%, comprising of 6 families. On the other hand, families with 3 or 4 children have the lowest poverty rate of 0.5%, which includes 2 families.
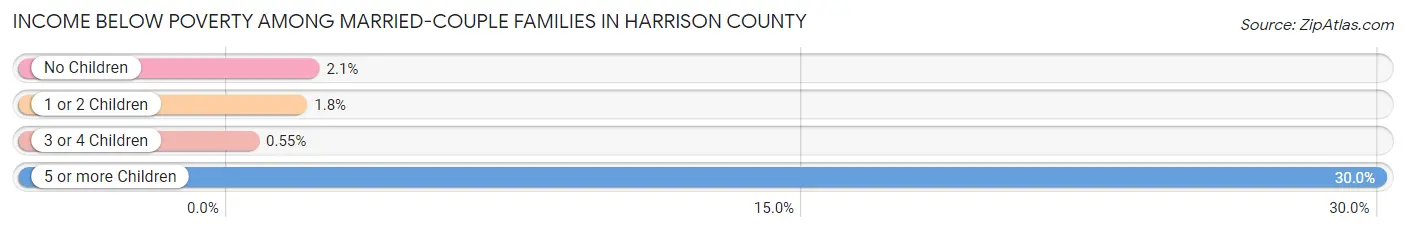
| Children | Above Poverty | Below Poverty |
| No Children | 2,158 (97.9%) | 47 (2.1%) |
| 1 or 2 Children | 923 (98.2%) | 17 (1.8%) |
| 3 or 4 Children | 362 (99.5%) | 2 (0.5%) |
| 5 or more Children | 14 (70.0%) | 6 (30.0%) |
| Total | 3,457 (98.0%) | 72 (2.0%) |
Income Below Poverty Among Single-Parent Households in Harrison County
According to the poverty data in Harrison County, 17.0% or 56 single-father households and 20.1% or 78 single-mother households are living below the poverty line. Among single-father households, those with 5 or more children have the highest poverty rate, with 10 households (100.0%) experiencing poverty. Likewise, among single-mother households, those with 3 or 4 children have the highest poverty rate, with 18 households (32.1%) falling below the poverty line.
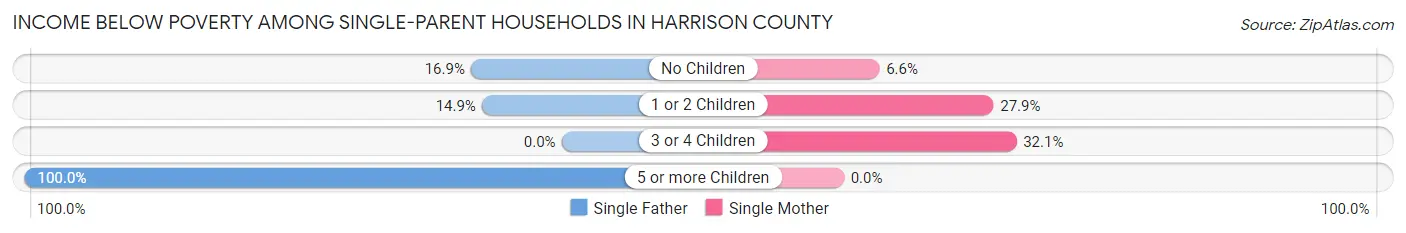
| Children | Single Father | Single Mother |
| No Children | 24 (16.9%) | 9 (6.6%) |
| 1 or 2 Children | 22 (14.9%) | 51 (27.9%) |
| 3 or 4 Children | 0 (0.0%) | 18 (32.1%) |
| 5 or more Children | 10 (100.0%) | 0 (0.0%) |
| Total | 56 (17.0%) | 78 (20.1%) |
Income Below Poverty Among Married-Couple vs Single-Parent Households in Harrison County
The poverty data for Harrison County shows that 72 of the married-couple family households (2.0%) and 134 of the single-parent households (18.7%) are living below the poverty level. Within the married-couple family households, those with 5 or more children have the highest poverty rate, with 6 households (30.0%) falling below the poverty line. Among the single-parent households, those with 5 or more children have the highest poverty rate, with 10 household (43.5%) living below poverty.
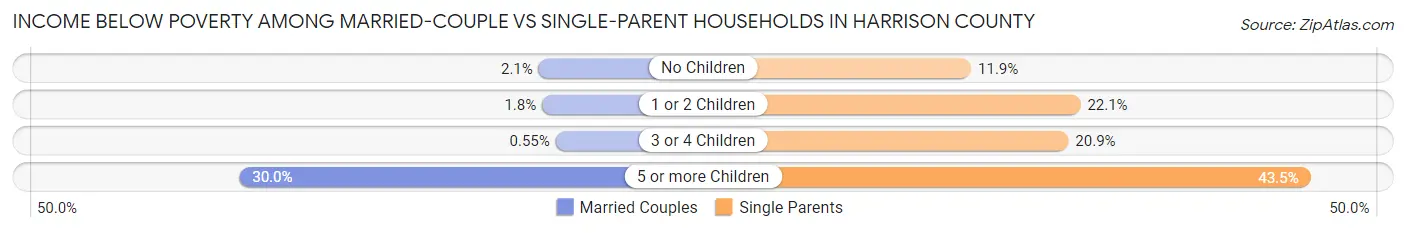
| Children | Married-Couple Families | Single-Parent Households |
| No Children | 47 (2.1%) | 33 (11.9%) |
| 1 or 2 Children | 17 (1.8%) | 73 (22.1%) |
| 3 or 4 Children | 2 (0.5%) | 18 (20.9%) |
| 5 or more Children | 6 (30.0%) | 10 (43.5%) |
| Total | 72 (2.0%) | 134 (18.7%) |
Race in Harrison County
The most populous races in Harrison County are White / Caucasian (14,070 | 96.2%), Two or more Races (435 | 3.0%), and Hispanic or Latino (300 | 2.1%).
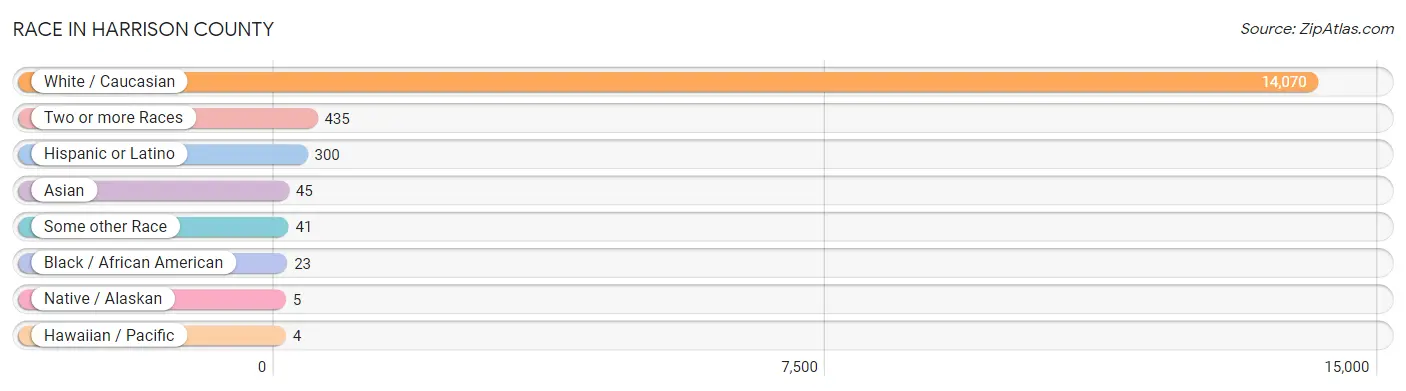
| Race | # Population | % Population |
| Asian | 45 | 0.3% |
| Black / African American | 23 | 0.2% |
| Hawaiian / Pacific | 4 | 0.0% |
| Hispanic or Latino | 300 | 2.1% |
| Native / Alaskan | 5 | 0.0% |
| White / Caucasian | 14,070 | 96.2% |
| Two or more Races | 435 | 3.0% |
| Some other Race | 41 | 0.3% |
| Total | 14,623 | 100.0% |
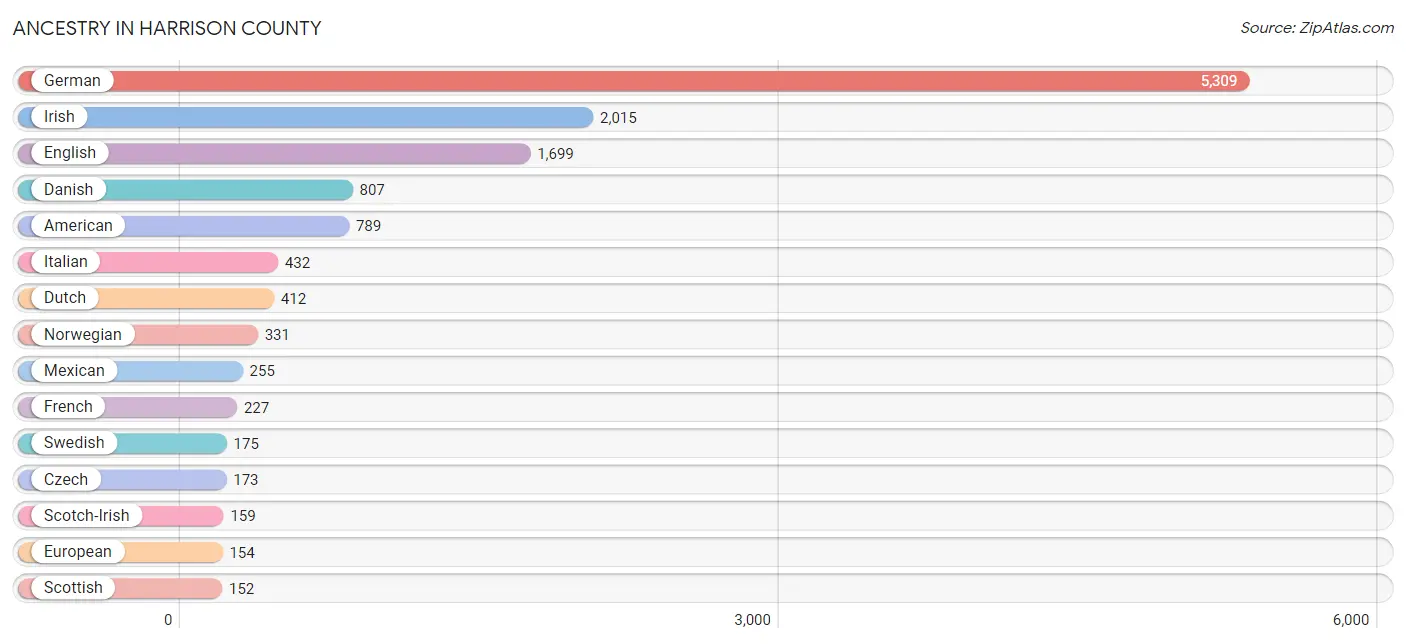
Ancestry in Harrison County
The most populous ancestries reported in Harrison County are German (5,309 | 36.3%), Irish (2,015 | 13.8%), English (1,699 | 11.6%), Danish (807 | 5.5%), and American (789 | 5.4%), together accounting for 72.6% of all Harrison County residents.
| Ancestry | # Population | % Population |
| African | 22 | 0.2% |
| American | 789 | 5.4% |
| Arab | 9 | 0.1% |
| Belgian | 20 | 0.1% |
| Bhutanese | 26 | 0.2% |
| Blackfeet | 3 | 0.0% |
| British | 41 | 0.3% |
| Burmese | 91 | 0.6% |
| Canadian | 9 | 0.1% |
| Central American | 15 | 0.1% |
| Cherokee | 34 | 0.2% |
| Chippewa | 31 | 0.2% |
| Cuban | 3 | 0.0% |
| Czech | 173 | 1.2% |
| Czechoslovakian | 6 | 0.0% |
| Danish | 807 | 5.5% |
| Dutch | 412 | 2.8% |
| Eastern European | 3 | 0.0% |
| English | 1,699 | 11.6% |
| European | 154 | 1.1% |
| Finnish | 19 | 0.1% |
| French | 227 | 1.5% |
| French Canadian | 23 | 0.2% |
| German | 5,309 | 36.3% |
| Guatemalan | 15 | 0.1% |
| Hungarian | 25 | 0.2% |
| Indian (Asian) | 5 | 0.0% |
| Irish | 2,015 | 13.8% |
| Italian | 432 | 2.9% |
| Korean | 33 | 0.2% |
| Lebanese | 9 | 0.1% |
| Lithuanian | 11 | 0.1% |
| Luxembourger | 28 | 0.2% |
| Mexican | 255 | 1.7% |
| Norwegian | 331 | 2.3% |
| Osage | 4 | 0.0% |
| Pakistani | 7 | 0.1% |
| Pennsylvania German | 32 | 0.2% |
| Polish | 125 | 0.9% |
| Puerto Rican | 5 | 0.0% |
| Romanian | 20 | 0.1% |
| Russian | 32 | 0.2% |
| Scandinavian | 72 | 0.5% |
| Scotch-Irish | 159 | 1.1% |
| Scottish | 152 | 1.0% |
| Serbian | 7 | 0.1% |
| Sioux | 22 | 0.2% |
| Slavic | 12 | 0.1% |
| Spaniard | 4 | 0.0% |
| Subsaharan African | 22 | 0.2% |
| Swedish | 175 | 1.2% |
| Swiss | 43 | 0.3% |
| Welsh | 62 | 0.4% |
| Yugoslavian | 1 | 0.0% | View All 54 Rows |
Immigrants in Harrison County
The most numerous immigrant groups reported in Harrison County came from Central America (51 | 0.4%), Latin America (51 | 0.4%), Asia (45 | 0.3%), Mexico (41 | 0.3%), and Eastern Asia (23 | 0.2%), together accounting for 1.5% of all Harrison County residents.
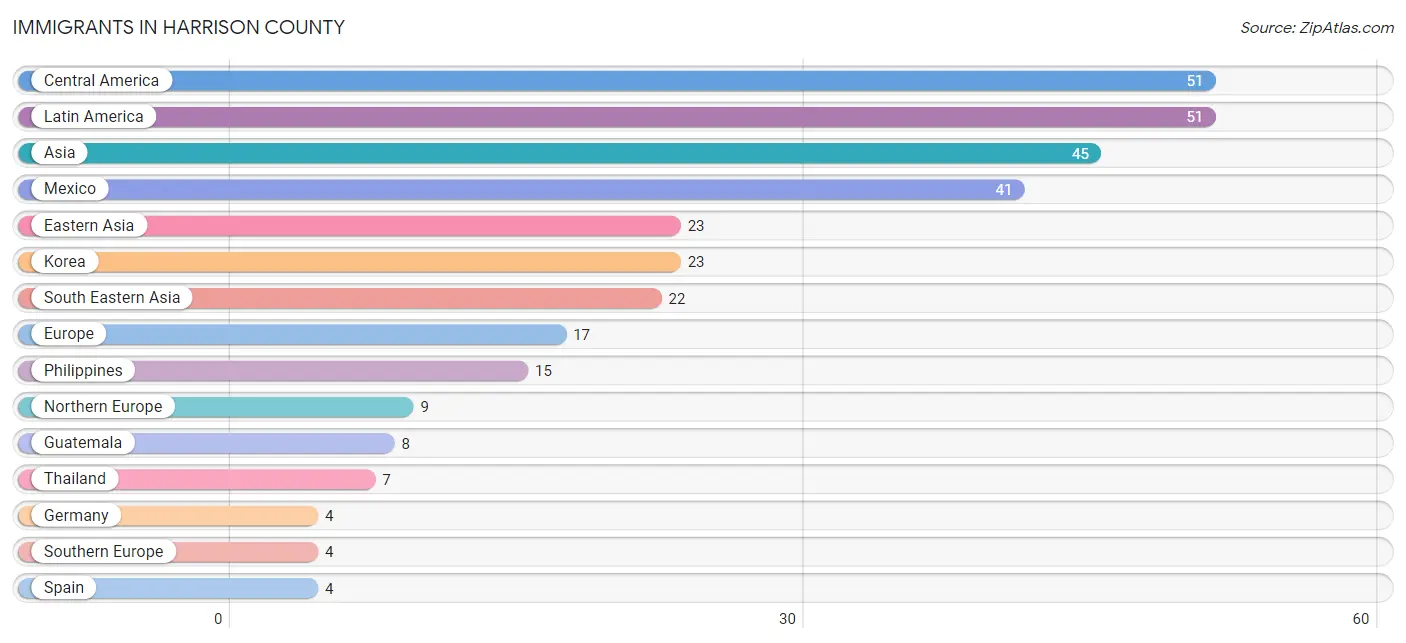
| Immigration Origin | # Population | % Population |
| Asia | 45 | 0.3% |
| Central America | 51 | 0.4% |
| Eastern Asia | 23 | 0.2% |
| El Salvador | 2 | 0.0% |
| Europe | 17 | 0.1% |
| Germany | 4 | 0.0% |
| Guatemala | 8 | 0.1% |
| Korea | 23 | 0.2% |
| Latin America | 51 | 0.4% |
| Mexico | 41 | 0.3% |
| Northern Europe | 9 | 0.1% |
| Philippines | 15 | 0.1% |
| South Eastern Asia | 22 | 0.2% |
| Southern Europe | 4 | 0.0% |
| Spain | 4 | 0.0% |
| Thailand | 7 | 0.1% |
| Western Europe | 4 | 0.0% | View All 17 Rows |
Sex and Age in Harrison County
Sex and Age in Harrison County
The most populous age groups in Harrison County are 60 to 64 Years (607 | 8.2%) for men and 10 to 14 Years (597 | 8.3%) for women.
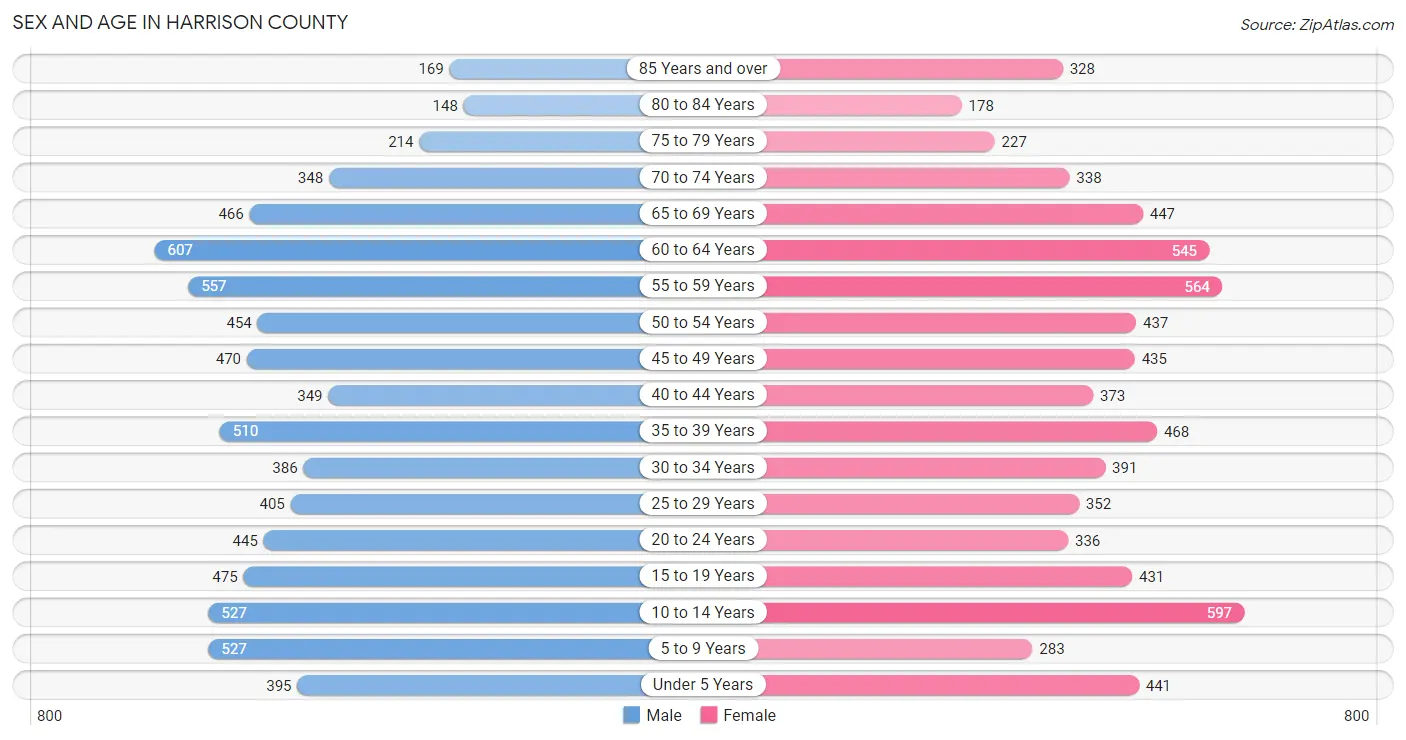
| Age Bracket | Male | Female |
| Under 5 Years | 395 (5.3%) | 441 (6.1%) |
| 5 to 9 Years | 527 (7.1%) | 283 (4.0%) |
| 10 to 14 Years | 527 (7.1%) | 597 (8.3%) |
| 15 to 19 Years | 475 (6.4%) | 431 (6.0%) |
| 20 to 24 Years | 445 (6.0%) | 336 (4.7%) |
| 25 to 29 Years | 405 (5.4%) | 352 (4.9%) |
| 30 to 34 Years | 386 (5.2%) | 391 (5.4%) |
| 35 to 39 Years | 510 (6.8%) | 468 (6.5%) |
| 40 to 44 Years | 349 (4.7%) | 373 (5.2%) |
| 45 to 49 Years | 470 (6.3%) | 435 (6.1%) |
| 50 to 54 Years | 454 (6.1%) | 437 (6.1%) |
| 55 to 59 Years | 557 (7.5%) | 564 (7.9%) |
| 60 to 64 Years | 607 (8.2%) | 545 (7.6%) |
| 65 to 69 Years | 466 (6.2%) | 447 (6.2%) |
| 70 to 74 Years | 348 (4.7%) | 338 (4.7%) |
| 75 to 79 Years | 214 (2.9%) | 227 (3.2%) |
| 80 to 84 Years | 148 (2.0%) | 178 (2.5%) |
| 85 Years and over | 169 (2.3%) | 328 (4.6%) |
| Total | 7,452 (100.0%) | 7,171 (100.0%) |
Families and Households in Harrison County
Median Family Size in Harrison County
The median family size in Harrison County is 2.85 persons per family, with married-couple families (3,529 | 83.1%) accounting for the largest median family size of 2.89 persons per family. On the other hand, single male/father families (330 | 7.8%) represent the smallest median family size with 2.32 persons per family.
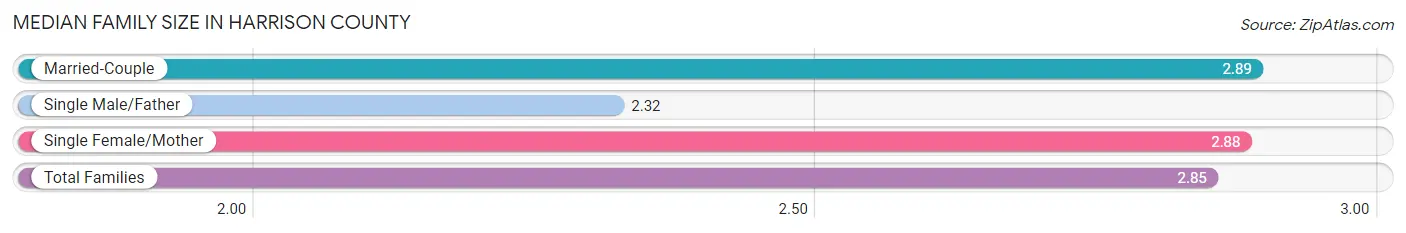
| Family Type | # Families | Family Size |
| Married-Couple | 3,529 (83.1%) | 2.89 |
| Single Male/Father | 330 (7.8%) | 2.32 |
| Single Female/Mother | 388 (9.1%) | 2.88 |
| Total Families | 4,247 (100.0%) | 2.85 |
Median Household Size in Harrison County
The median household size in Harrison County is 2.40 persons per household, with single female/mother households (388 | 6.5%) accounting for the largest median household size of 3.16 persons per household. non-family households (1,716 | 28.8%) represent the smallest median household size with 1.16 persons per household.
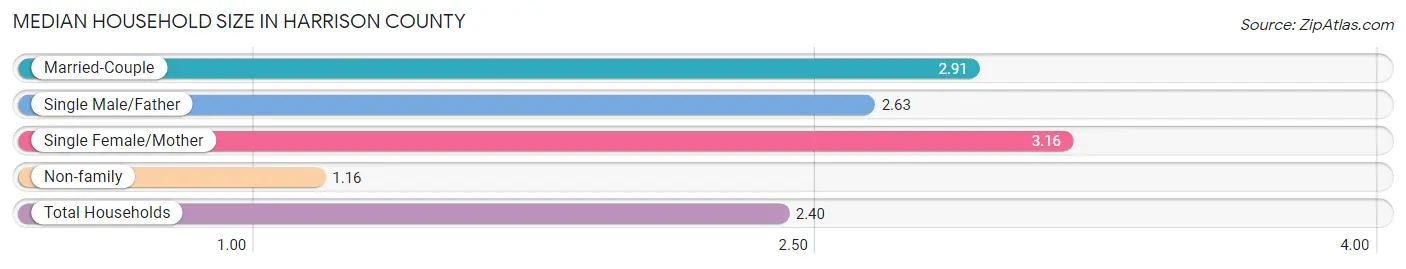
| Household Type | # Households | Household Size |
| Married-Couple | 3,529 (59.2%) | 2.91 |
| Single Male/Father | 330 (5.5%) | 2.63 |
| Single Female/Mother | 388 (6.5%) | 3.16 |
| Non-family | 1,716 (28.8%) | 1.16 |
| Total Households | 5,963 (100.0%) | 2.40 |
Household Size by Marriage Status in Harrison County
Out of a total of 5,963 households in Harrison County, 4,247 (71.2%) are family households, while 1,716 (28.8%) are nonfamily households. The most numerous type of family households are 2-person households, comprising 2,128, and the most common type of nonfamily households are 1-person households, comprising 1,454.
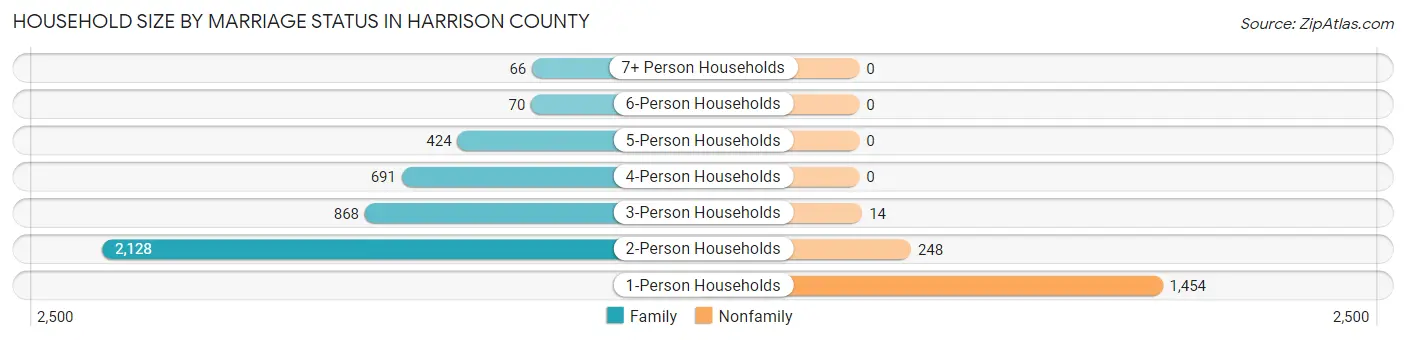
| Household Size | Family Households | Nonfamily Households |
| 1-Person Households | - | 1,454 (24.4%) |
| 2-Person Households | 2,128 (35.7%) | 248 (4.2%) |
| 3-Person Households | 868 (14.6%) | 14 (0.2%) |
| 4-Person Households | 691 (11.6%) | 0 (0.0%) |
| 5-Person Households | 424 (7.1%) | 0 (0.0%) |
| 6-Person Households | 70 (1.2%) | 0 (0.0%) |
| 7+ Person Households | 66 (1.1%) | 0 (0.0%) |
| Total | 4,247 (71.2%) | 1,716 (28.8%) |
Female Fertility in Harrison County
Fertility by Age in Harrison County
Average fertility rate in Harrison County is 69.0 births per 1,000 women. Women in the age bracket of 20 to 34 years have the highest fertility rate with 159.0 births per 1,000 women. Women in the age bracket of 20 to 34 years acount for 86.9% of all women with births.
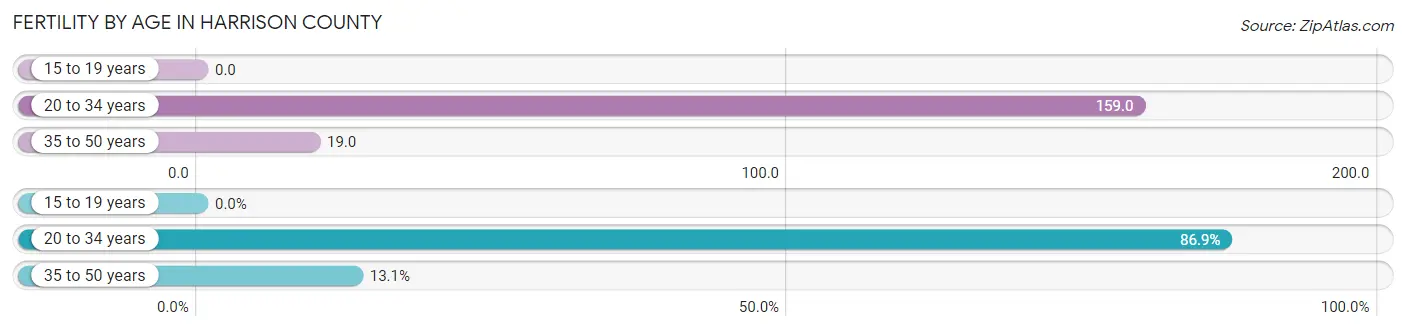
| Age Bracket | Women with Births | Births / 1,000 Women |
| 15 to 19 years | 0 (0.0%) | 0.0 |
| 20 to 34 years | 172 (86.9%) | 159.0 |
| 35 to 50 years | 26 (13.1%) | 19.0 |
| Total | 198 (100.0%) | 69.0 |
Fertility by Age by Marriage Status in Harrison County
66.7% of women with births (198) in Harrison County are married. The highest percentage of unmarried women with births falls into 35 to 50 years age bracket with 80.8% of them unmarried at the time of birth, while the lowest percentage of unmarried women with births belong to 20 to 34 years age bracket with 26.2% of them unmarried.
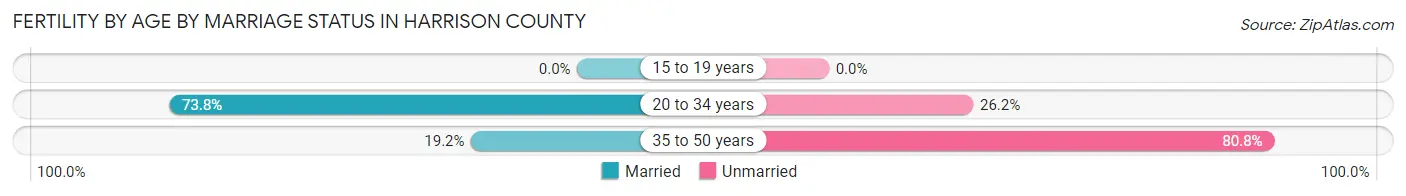
| Age Bracket | Married | Unmarried |
| 15 to 19 years | 0 (0.0%) | 0 (0.0%) |
| 20 to 34 years | 127 (73.8%) | 45 (26.2%) |
| 35 to 50 years | 5 (19.2%) | 21 (80.8%) |
| Total | 132 (66.7%) | 66 (33.3%) |
Fertility by Education in Harrison County
Average fertility rate in Harrison County is 69.0 births per 1,000 women. Women with the education attainment of graduate degree have the highest fertility rate of 172.0 births per 1,000 women, while women with the education attainment of less than high school have the lowest fertility at 10.0 births per 1,000 women. Women with the education attainment of college or associate's degree represent 50.0% of all women with births.
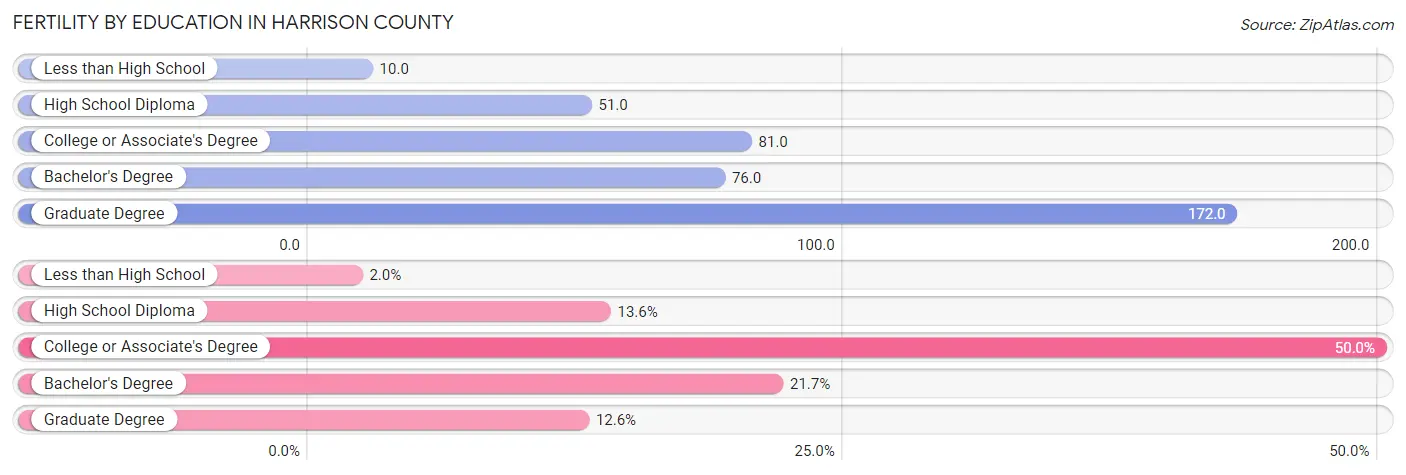
| Educational Attainment | Women with Births | Births / 1,000 Women |
| Less than High School | 4 (2.0%) | 10.0 |
| High School Diploma | 27 (13.6%) | 51.0 |
| College or Associate's Degree | 99 (50.0%) | 81.0 |
| Bachelor's Degree | 43 (21.7%) | 76.0 |
| Graduate Degree | 25 (12.6%) | 172.0 |
| Total | 198 (100.0%) | 69.0 |
Fertility by Education by Marriage Status in Harrison County
33.3% of women with births in Harrison County are unmarried. Women with the educational attainment of bachelor's degree are most likely to be married with 100.0% of them married at childbirth, while women with the educational attainment of less than high school are least likely to be married with 100.0% of them unmarried at childbirth.
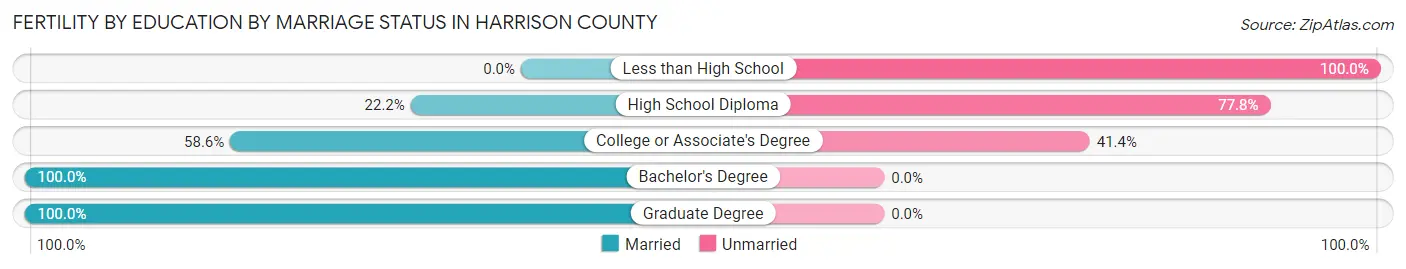
| Educational Attainment | Married | Unmarried |
| Less than High School | 0 (0.0%) | 4 (100.0%) |
| High School Diploma | 6 (22.2%) | 21 (77.8%) |
| College or Associate's Degree | 58 (58.6%) | 41 (41.4%) |
| Bachelor's Degree | 43 (100.0%) | 0 (0.0%) |
| Graduate Degree | 25 (100.0%) | 0 (0.0%) |
| Total | 132 (66.7%) | 66 (33.3%) |
Employment Characteristics in Harrison County
Employment by Class of Employer in Harrison County
Among the 7,301 employed individuals in Harrison County, private company employees (4,484 | 61.4%), local government employees (764 | 10.5%), and self-employed (not incorporated) (636 | 8.7%) make up the most common classes of employment.
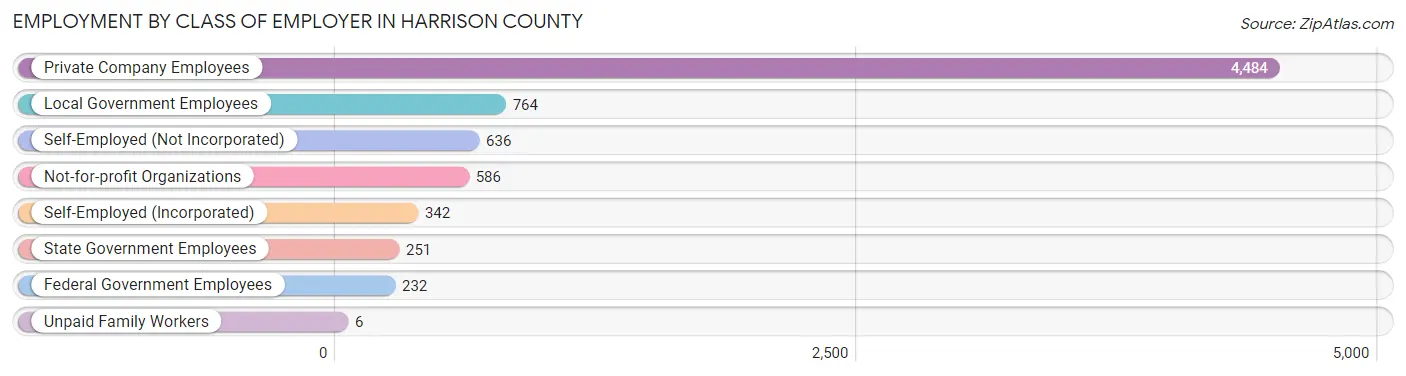
| Employer Class | # Employees | % Employees |
| Private Company Employees | 4,484 | 61.4% |
| Self-Employed (Incorporated) | 342 | 4.7% |
| Self-Employed (Not Incorporated) | 636 | 8.7% |
| Not-for-profit Organizations | 586 | 8.0% |
| Local Government Employees | 764 | 10.5% |
| State Government Employees | 251 | 3.4% |
| Federal Government Employees | 232 | 3.2% |
| Unpaid Family Workers | 6 | 0.1% |
| Total | 7,301 | 100.0% |
Employment Status by Age in Harrison County
According to the labor force statistics for Harrison County, out of the total population over 16 years of age (11,644), 65.2% or 7,592 individuals are in the labor force, with 2.7% or 205 of them unemployed. The age group with the highest labor force participation rate is 25 to 29 years, with 92.6% or 701 individuals in the labor force. Within the labor force, the 16 to 19 years age range has the highest percentage of unemployed individuals, with 11.9% or 33 of them being unemployed.
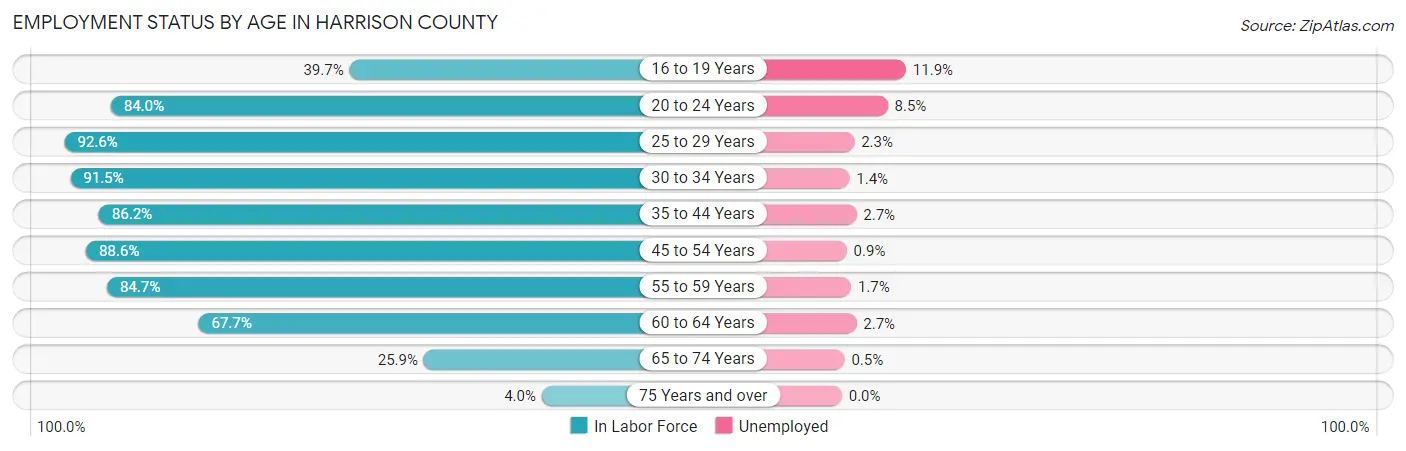
| Age Bracket | In Labor Force | Unemployed |
| 16 to 19 Years | 277 (39.7%) | 33 (11.9%) |
| 20 to 24 Years | 656 (84.0%) | 56 (8.5%) |
| 25 to 29 Years | 701 (92.6%) | 16 (2.3%) |
| 30 to 34 Years | 711 (91.5%) | 10 (1.4%) |
| 35 to 44 Years | 1,465 (86.2%) | 40 (2.7%) |
| 45 to 54 Years | 1,591 (88.6%) | 14 (0.9%) |
| 55 to 59 Years | 949 (84.7%) | 16 (1.7%) |
| 60 to 64 Years | 780 (67.7%) | 21 (2.7%) |
| 65 to 74 Years | 414 (25.9%) | 2 (0.5%) |
| 75 Years and over | 51 (4.0%) | 0 (0.0%) |
| Total | 7,592 (65.2%) | 205 (2.7%) |
Employment Status by Educational Attainment in Harrison County
According to labor force statistics for Harrison County, 84.9% of individuals (6,200) out of the total population between 25 and 64 years of age (7,303) are in the labor force, with 1.9% or 118 of them being unemployed. The group with the highest labor force participation rate are those with the educational attainment of bachelor's degree or higher, with 93.0% or 1,551 individuals in the labor force. Within the labor force, individuals with less than high school education have the highest percentage of unemployment, with 11.0% or 36 of them being unemployed.
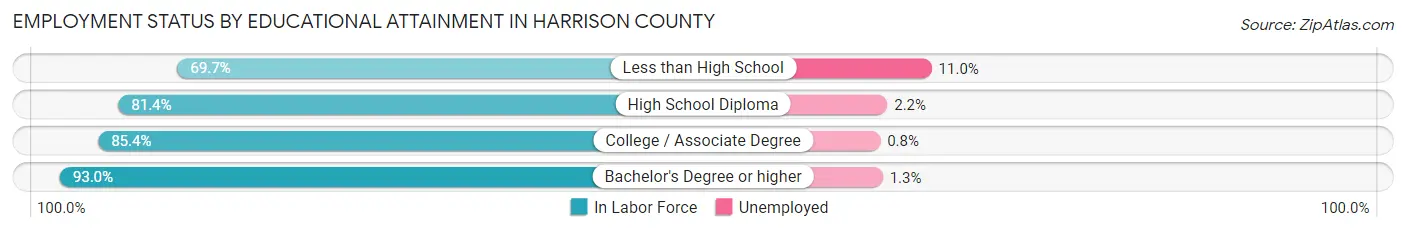
| Educational Attainment | In Labor Force | Unemployed |
| Less than High School | 326 (69.7%) | 51 (11.0%) |
| High School Diploma | 1,894 (81.4%) | 51 (2.2%) |
| College / Associate Degree | 2,425 (85.4%) | 23 (0.8%) |
| Bachelor's Degree or higher | 1,551 (93.0%) | 22 (1.3%) |
| Total | 6,200 (84.9%) | 139 (1.9%) |
Employment Occupations by Sex in Harrison County
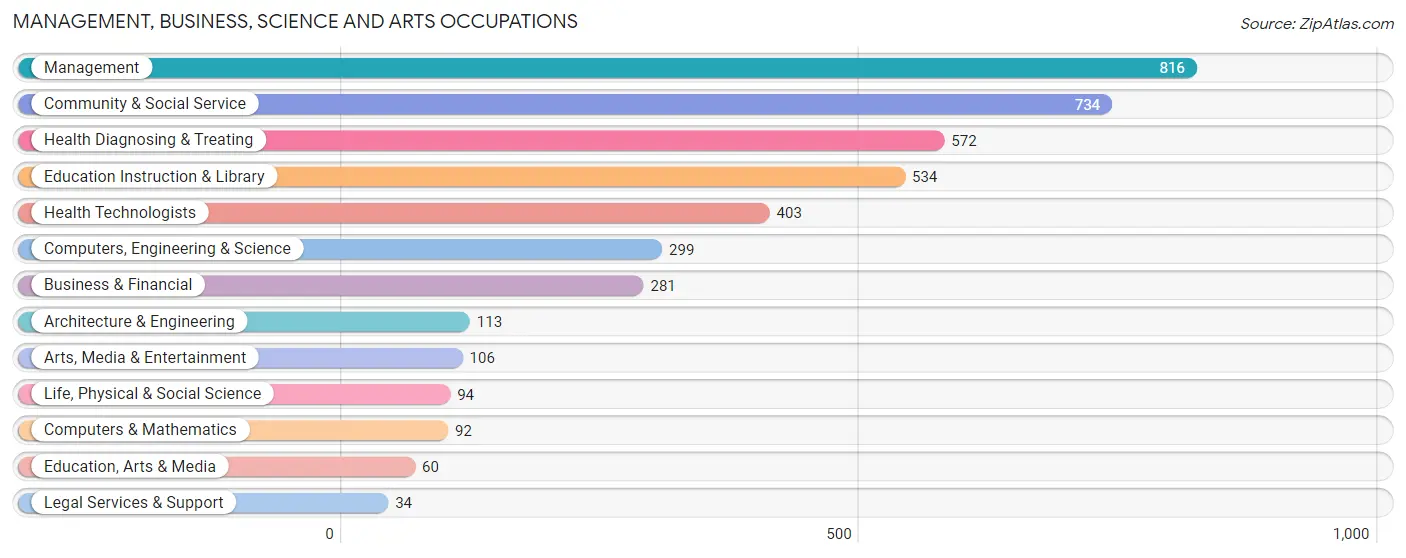
Management, Business, Science and Arts Occupations
The most common Management, Business, Science and Arts occupations in Harrison County are Management (816 | 11.1%), Community & Social Service (734 | 10.0%), Health Diagnosing & Treating (572 | 7.7%), Education Instruction & Library (534 | 7.2%), and Health Technologists (403 | 5.5%).
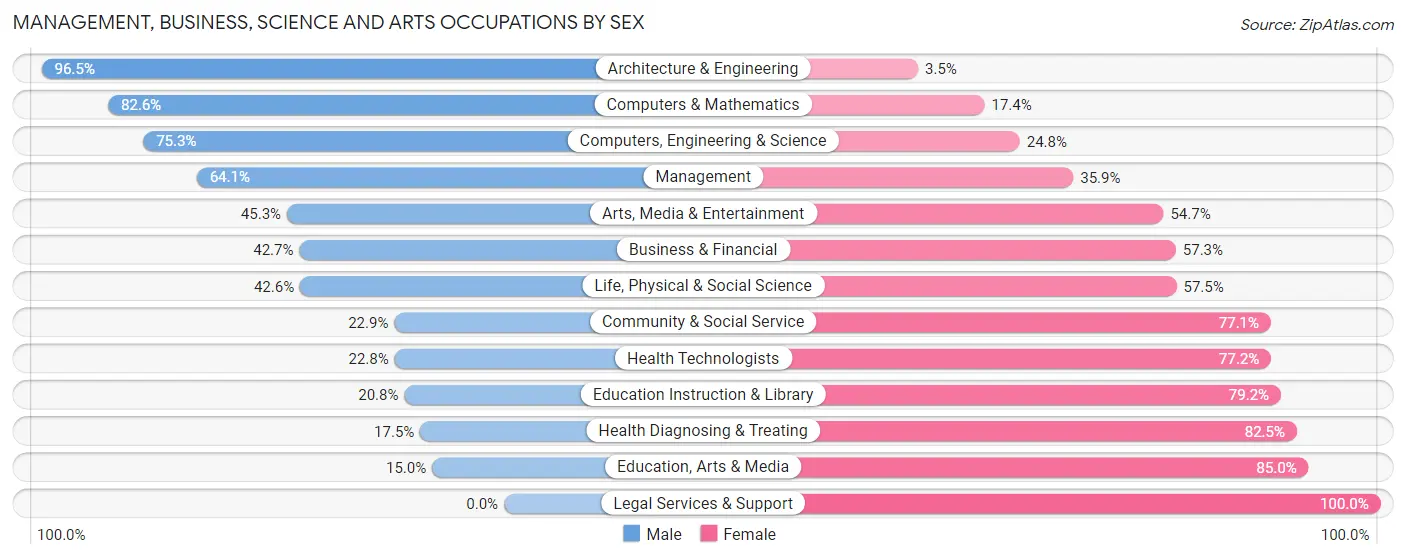
Management, Business, Science and Arts Occupations by Sex
Within the Management, Business, Science and Arts occupations in Harrison County, the most male-oriented occupations are Architecture & Engineering (96.5%), Computers & Mathematics (82.6%), and Computers, Engineering & Science (75.2%), while the most female-oriented occupations are Legal Services & Support (100.0%), Education, Arts & Media (85.0%), and Health Diagnosing & Treating (82.5%).
| Occupation | Male | Female |
| Management | 523 (64.1%) | 293 (35.9%) |
| Business & Financial | 120 (42.7%) | 161 (57.3%) |
| Computers, Engineering & Science | 225 (75.2%) | 74 (24.7%) |
| Computers & Mathematics | 76 (82.6%) | 16 (17.4%) |
| Architecture & Engineering | 109 (96.5%) | 4 (3.5%) |
| Life, Physical & Social Science | 40 (42.5%) | 54 (57.5%) |
| Community & Social Service | 168 (22.9%) | 566 (77.1%) |
| Education, Arts & Media | 9 (15.0%) | 51 (85.0%) |
| Legal Services & Support | 0 (0.0%) | 34 (100.0%) |
| Education Instruction & Library | 111 (20.8%) | 423 (79.2%) |
| Arts, Media & Entertainment | 48 (45.3%) | 58 (54.7%) |
| Health Diagnosing & Treating | 100 (17.5%) | 472 (82.5%) |
| Health Technologists | 92 (22.8%) | 311 (77.2%) |
| Total (Category) | 1,136 (42.0%) | 1,566 (58.0%) |
| Total (Overall) | 4,012 (54.4%) | 3,366 (45.6%) |
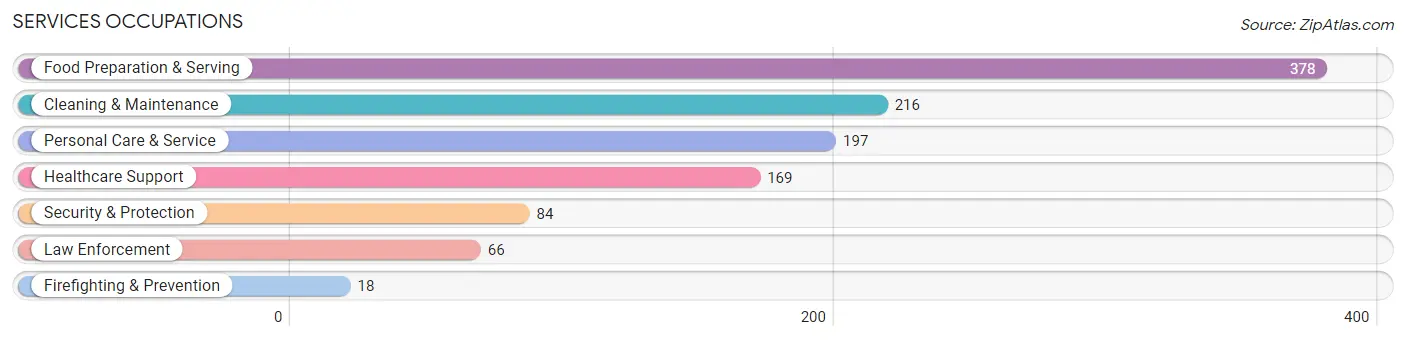
Services Occupations
The most common Services occupations in Harrison County are Food Preparation & Serving (378 | 5.1%), Cleaning & Maintenance (216 | 2.9%), Personal Care & Service (197 | 2.7%), Healthcare Support (169 | 2.3%), and Security & Protection (84 | 1.1%).
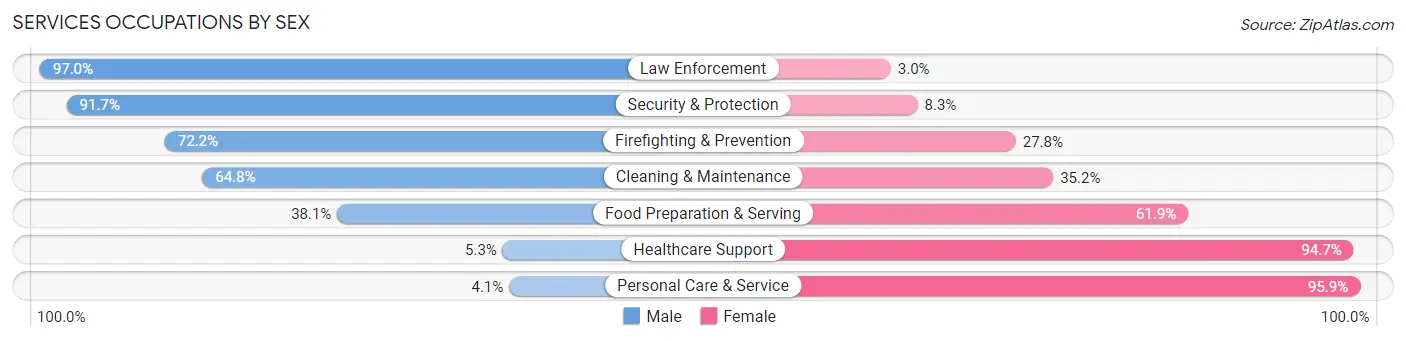
Services Occupations by Sex
Within the Services occupations in Harrison County, the most male-oriented occupations are Law Enforcement (97.0%), Security & Protection (91.7%), and Firefighting & Prevention (72.2%), while the most female-oriented occupations are Personal Care & Service (95.9%), Healthcare Support (94.7%), and Food Preparation & Serving (61.9%).
| Occupation | Male | Female |
| Healthcare Support | 9 (5.3%) | 160 (94.7%) |
| Security & Protection | 77 (91.7%) | 7 (8.3%) |
| Firefighting & Prevention | 13 (72.2%) | 5 (27.8%) |
| Law Enforcement | 64 (97.0%) | 2 (3.0%) |
| Food Preparation & Serving | 144 (38.1%) | 234 (61.9%) |
| Cleaning & Maintenance | 140 (64.8%) | 76 (35.2%) |
| Personal Care & Service | 8 (4.1%) | 189 (95.9%) |
| Total (Category) | 378 (36.2%) | 666 (63.8%) |
| Total (Overall) | 4,012 (54.4%) | 3,366 (45.6%) |
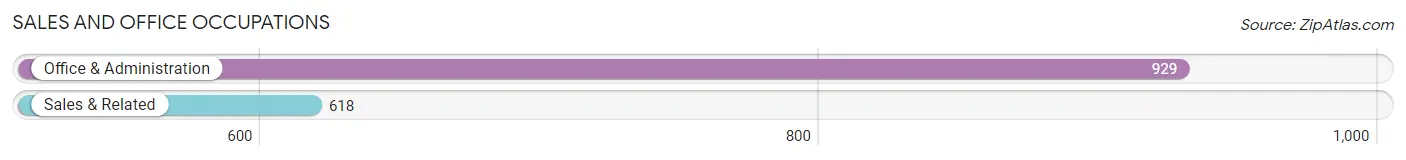
Sales and Office Occupations
The most common Sales and Office occupations in Harrison County are Office & Administration (929 | 12.6%), and Sales & Related (618 | 8.4%).
Sales and Office Occupations by Sex
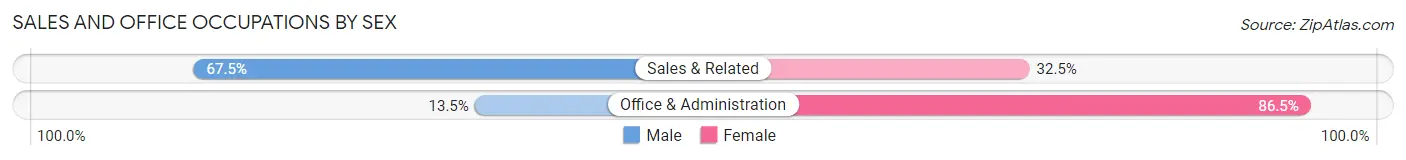
| Occupation | Male | Female |
| Sales & Related | 417 (67.5%) | 201 (32.5%) |
| Office & Administration | 125 (13.5%) | 804 (86.5%) |
| Total (Category) | 542 (35.0%) | 1,005 (65.0%) |
| Total (Overall) | 4,012 (54.4%) | 3,366 (45.6%) |
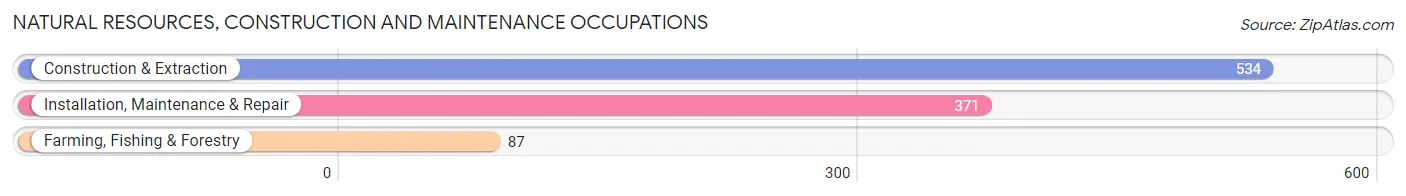
Natural Resources, Construction and Maintenance Occupations
The most common Natural Resources, Construction and Maintenance occupations in Harrison County are Construction & Extraction (534 | 7.2%), Installation, Maintenance & Repair (371 | 5.0%), and Farming, Fishing & Forestry (87 | 1.2%).
Natural Resources, Construction and Maintenance Occupations by Sex
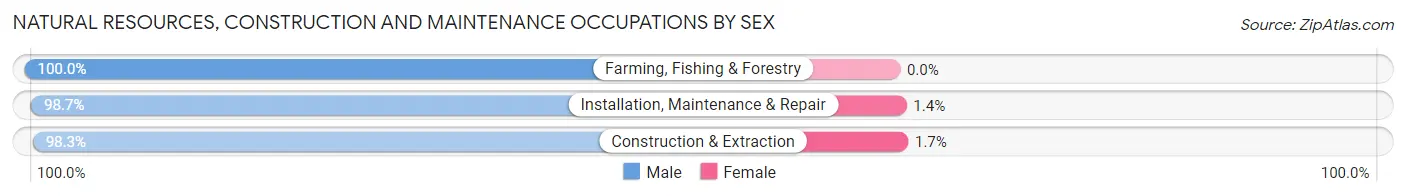
| Occupation | Male | Female |
| Farming, Fishing & Forestry | 87 (100.0%) | 0 (0.0%) |
| Construction & Extraction | 525 (98.3%) | 9 (1.7%) |
| Installation, Maintenance & Repair | 366 (98.7%) | 5 (1.3%) |
| Total (Category) | 978 (98.6%) | 14 (1.4%) |
| Total (Overall) | 4,012 (54.4%) | 3,366 (45.6%) |
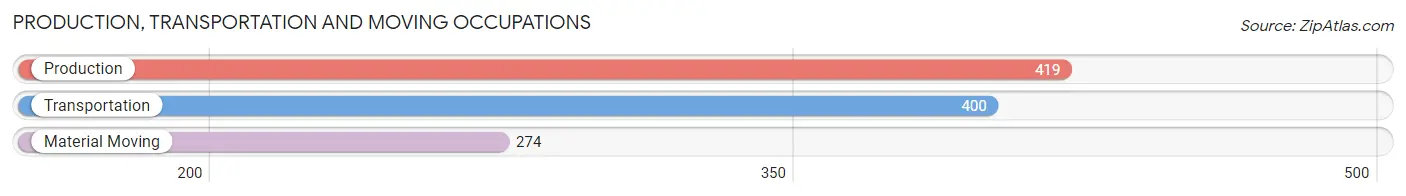
Production, Transportation and Moving Occupations
The most common Production, Transportation and Moving occupations in Harrison County are Production (419 | 5.7%), Transportation (400 | 5.4%), and Material Moving (274 | 3.7%).
Production, Transportation and Moving Occupations by Sex
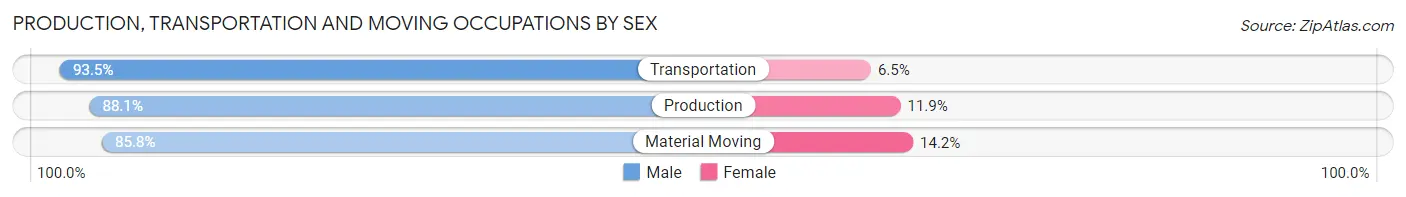
| Occupation | Male | Female |
| Production | 369 (88.1%) | 50 (11.9%) |
| Transportation | 374 (93.5%) | 26 (6.5%) |
| Material Moving | 235 (85.8%) | 39 (14.2%) |
| Total (Category) | 978 (89.5%) | 115 (10.5%) |
| Total (Overall) | 4,012 (54.4%) | 3,366 (45.6%) |
Employment Industries by Sex in Harrison County
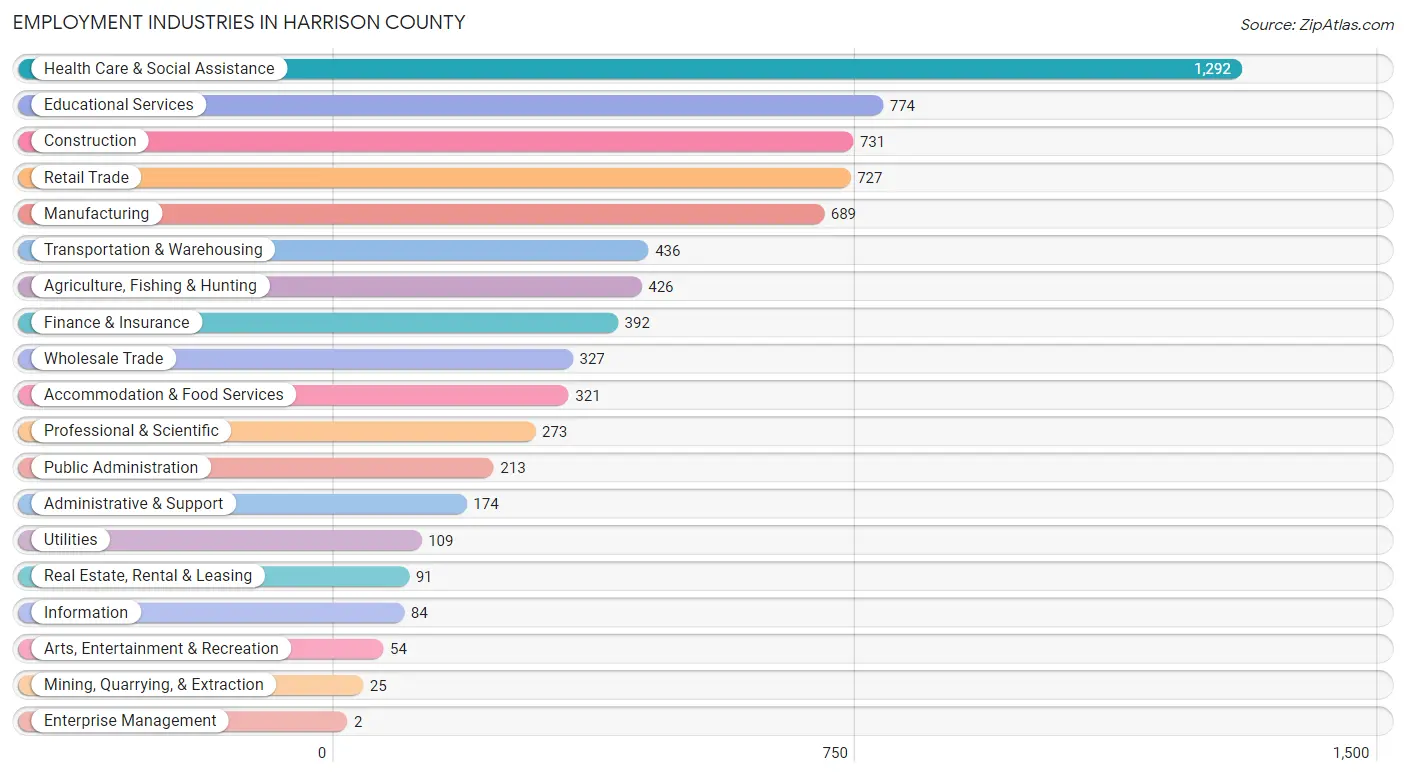
Employment Industries in Harrison County
The major employment industries in Harrison County include Health Care & Social Assistance (1,292 | 17.5%), Educational Services (774 | 10.5%), Construction (731 | 9.9%), Retail Trade (727 | 9.9%), and Manufacturing (689 | 9.3%).
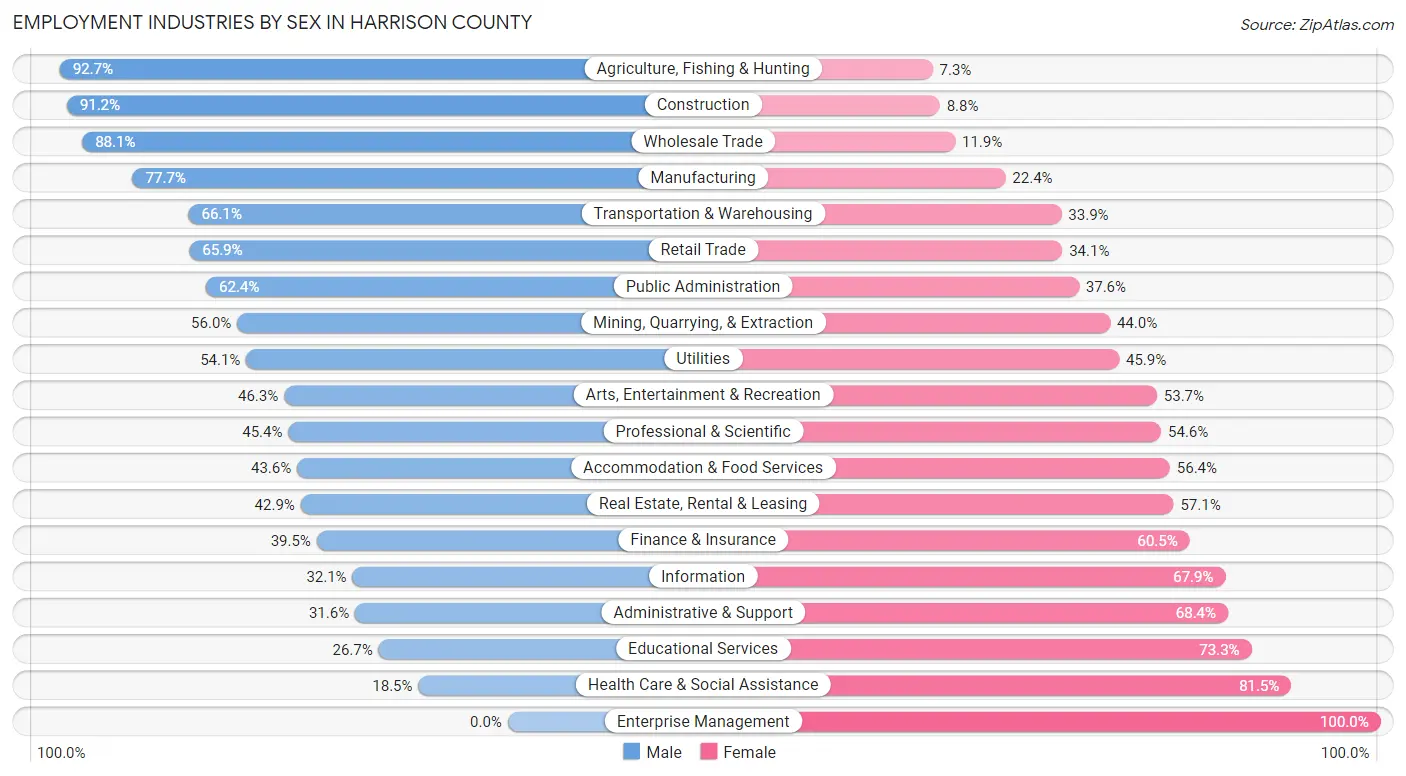
Employment Industries by Sex in Harrison County
The Harrison County industries that see more men than women are Agriculture, Fishing & Hunting (92.7%), Construction (91.2%), and Wholesale Trade (88.1%), whereas the industries that tend to have a higher number of women are Enterprise Management (100.0%), Health Care & Social Assistance (81.5%), and Educational Services (73.3%).
| Industry | Male | Female |
| Agriculture, Fishing & Hunting | 395 (92.7%) | 31 (7.3%) |
| Mining, Quarrying, & Extraction | 14 (56.0%) | 11 (44.0%) |
| Construction | 667 (91.2%) | 64 (8.8%) |
| Manufacturing | 535 (77.6%) | 154 (22.4%) |
| Wholesale Trade | 288 (88.1%) | 39 (11.9%) |
| Retail Trade | 479 (65.9%) | 248 (34.1%) |
| Transportation & Warehousing | 288 (66.1%) | 148 (33.9%) |
| Utilities | 59 (54.1%) | 50 (45.9%) |
| Information | 27 (32.1%) | 57 (67.9%) |
| Finance & Insurance | 155 (39.5%) | 237 (60.5%) |
| Real Estate, Rental & Leasing | 39 (42.9%) | 52 (57.1%) |
| Professional & Scientific | 124 (45.4%) | 149 (54.6%) |
| Enterprise Management | 0 (0.0%) | 2 (100.0%) |
| Administrative & Support | 55 (31.6%) | 119 (68.4%) |
| Educational Services | 207 (26.7%) | 567 (73.3%) |
| Health Care & Social Assistance | 239 (18.5%) | 1,053 (81.5%) |
| Arts, Entertainment & Recreation | 25 (46.3%) | 29 (53.7%) |
| Accommodation & Food Services | 140 (43.6%) | 181 (56.4%) |
| Public Administration | 133 (62.4%) | 80 (37.6%) |
| Total | 4,012 (54.4%) | 3,366 (45.6%) |
Education in Harrison County
School Enrollment in Harrison County
The most common levels of schooling among the 3,202 students in Harrison County are middle school (846 | 26.4%), high school (835 | 26.1%), and elementary school (573 | 17.9%).
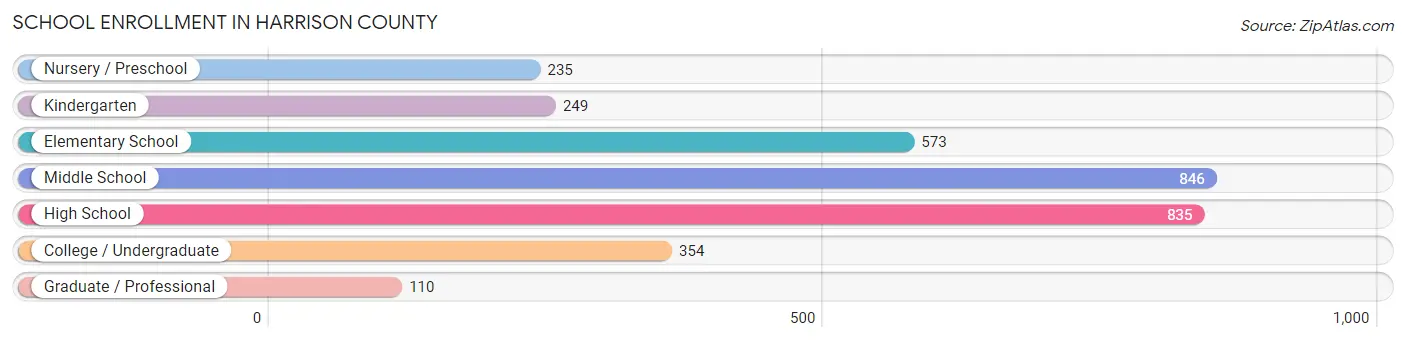
| School Level | # Students | % Students |
| Nursery / Preschool | 235 | 7.3% |
| Kindergarten | 249 | 7.8% |
| Elementary School | 573 | 17.9% |
| Middle School | 846 | 26.4% |
| High School | 835 | 26.1% |
| College / Undergraduate | 354 | 11.1% |
| Graduate / Professional | 110 | 3.4% |
| Total | 3,202 | 100.0% |
School Enrollment by Age by Funding Source in Harrison County
Out of a total of 3,202 students who are enrolled in schools in Harrison County, 333 (10.4%) attend a private institution, while the remaining 2,869 (89.6%) are enrolled in public schools. The age group of 35 years and over has the highest likelihood of being enrolled in private schools, with 26 (24.8% in the age bracket) enrolled. Conversely, the age group of 5 to 9 year old has the lowest likelihood of being enrolled in a private school, with 717 (94.1% in the age bracket) attending a public institution.
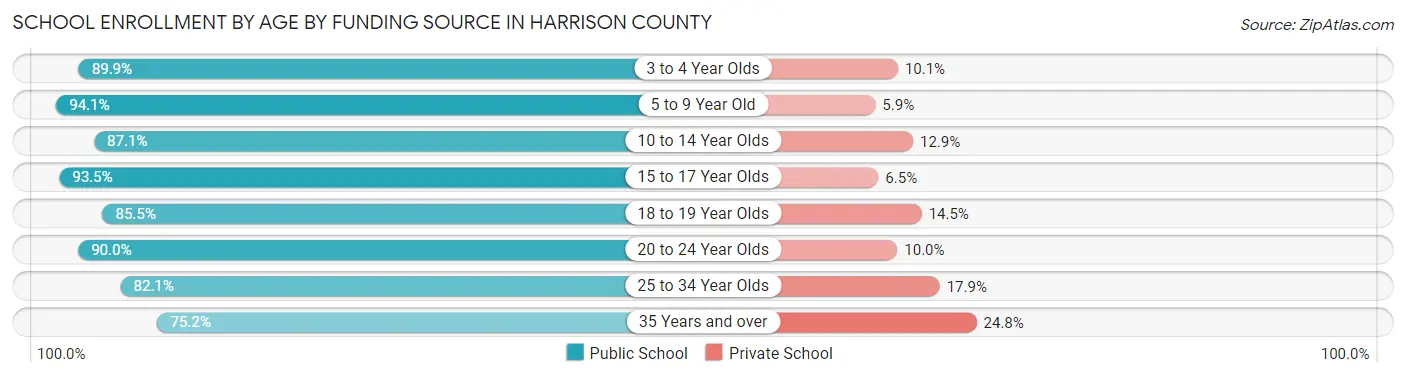
| Age Bracket | Public School | Private School |
| 3 to 4 Year Olds | 169 (89.9%) | 19 (10.1%) |
| 5 to 9 Year Old | 717 (94.1%) | 45 (5.9%) |
| 10 to 14 Year Olds | 949 (87.1%) | 141 (12.9%) |
| 15 to 17 Year Olds | 535 (93.5%) | 37 (6.5%) |
| 18 to 19 Year Olds | 147 (85.5%) | 25 (14.5%) |
| 20 to 24 Year Olds | 171 (90.0%) | 19 (10.0%) |
| 25 to 34 Year Olds | 101 (82.1%) | 22 (17.9%) |
| 35 Years and over | 79 (75.2%) | 26 (24.8%) |
| Total | 2,869 (89.6%) | 333 (10.4%) |
Educational Attainment by Field of Study in Harrison County
Education (558 | 24.6%), business (422 | 18.6%), science & technology (271 | 11.9%), bio, nature & agricultural (232 | 10.2%), and arts & humanities (207 | 9.1%) are the most common fields of study among 2,272 individuals in Harrison County who have obtained a bachelor's degree or higher.
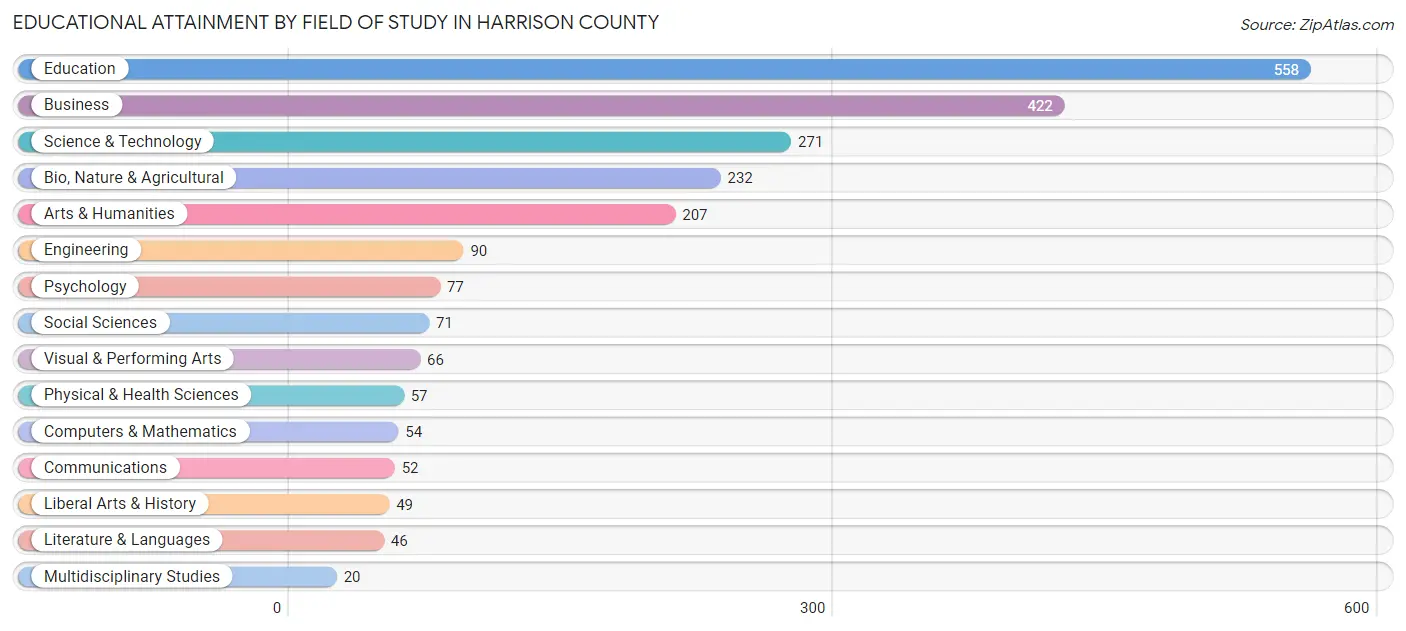
| Field of Study | # Graduates | % Graduates |
| Computers & Mathematics | 54 | 2.4% |
| Bio, Nature & Agricultural | 232 | 10.2% |
| Physical & Health Sciences | 57 | 2.5% |
| Psychology | 77 | 3.4% |
| Social Sciences | 71 | 3.1% |
| Engineering | 90 | 4.0% |
| Multidisciplinary Studies | 20 | 0.9% |
| Science & Technology | 271 | 11.9% |
| Business | 422 | 18.6% |
| Education | 558 | 24.6% |
| Literature & Languages | 46 | 2.0% |
| Liberal Arts & History | 49 | 2.2% |
| Visual & Performing Arts | 66 | 2.9% |
| Communications | 52 | 2.3% |
| Arts & Humanities | 207 | 9.1% |
| Total | 2,272 | 100.0% |
Transportation & Commute in Harrison County
Vehicle Availability by Sex in Harrison County
The most prevalent vehicle ownership categories in Harrison County are males with 2 vehicles (1,454, accounting for 36.6%) and females with 2 vehicles (1,179, making up 43.7%).
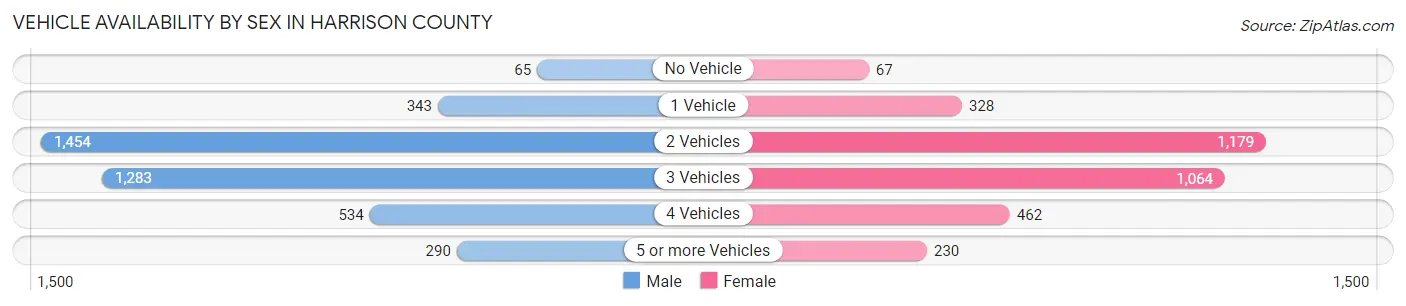
| Vehicles Available | Male | Female |
| No Vehicle | 65 (1.6%) | 67 (2.0%) |
| 1 Vehicle | 343 (8.6%) | 328 (9.9%) |
| 2 Vehicles | 1,454 (36.6%) | 1,179 (35.4%) |
| 3 Vehicles | 1,283 (32.3%) | 1,064 (32.0%) |
| 4 Vehicles | 534 (13.5%) | 462 (13.9%) |
| 5 or more Vehicles | 290 (7.3%) | 230 (6.9%) |
| Total | 3,969 (100.0%) | 3,330 (100.0%) |
Commute Time in Harrison County
The most frequently occuring commute durations in Harrison County are 30 to 34 minutes (995 commuters, 14.7%), 5 to 9 minutes (962 commuters, 14.2%), and 45 to 59 minutes (944 commuters, 14.0%).
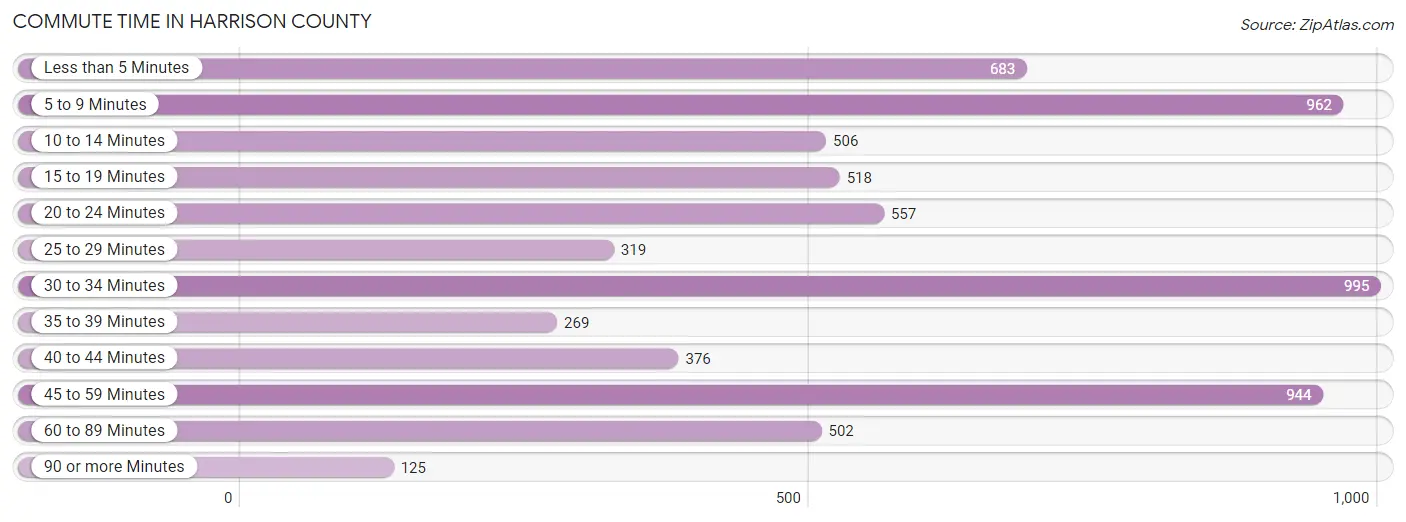
| Commute Time | # Commuters | % Commuters |
| Less than 5 Minutes | 683 | 10.1% |
| 5 to 9 Minutes | 962 | 14.2% |
| 10 to 14 Minutes | 506 | 7.5% |
| 15 to 19 Minutes | 518 | 7.7% |
| 20 to 24 Minutes | 557 | 8.2% |
| 25 to 29 Minutes | 319 | 4.7% |
| 30 to 34 Minutes | 995 | 14.7% |
| 35 to 39 Minutes | 269 | 4.0% |
| 40 to 44 Minutes | 376 | 5.6% |
| 45 to 59 Minutes | 944 | 14.0% |
| 60 to 89 Minutes | 502 | 7.4% |
| 90 or more Minutes | 125 | 1.8% |
Commute Time by Sex in Harrison County
The most common commute times in Harrison County are 30 to 34 minutes (601 commuters, 16.0%) for males and 45 to 59 minutes (406 commuters, 13.5%) for females.
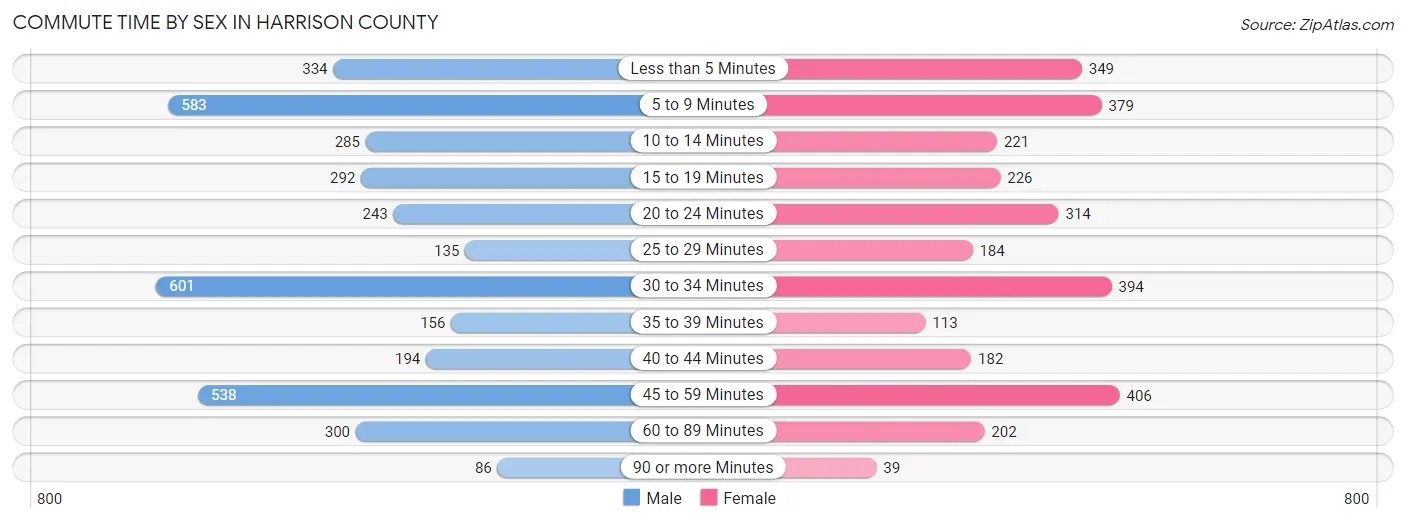
| Commute Time | Male | Female |
| Less than 5 Minutes | 334 (8.9%) | 349 (11.6%) |
| 5 to 9 Minutes | 583 (15.6%) | 379 (12.6%) |
| 10 to 14 Minutes | 285 (7.6%) | 221 (7.3%) |
| 15 to 19 Minutes | 292 (7.8%) | 226 (7.5%) |
| 20 to 24 Minutes | 243 (6.5%) | 314 (10.4%) |
| 25 to 29 Minutes | 135 (3.6%) | 184 (6.1%) |
| 30 to 34 Minutes | 601 (16.0%) | 394 (13.1%) |
| 35 to 39 Minutes | 156 (4.2%) | 113 (3.8%) |
| 40 to 44 Minutes | 194 (5.2%) | 182 (6.0%) |
| 45 to 59 Minutes | 538 (14.4%) | 406 (13.5%) |
| 60 to 89 Minutes | 300 (8.0%) | 202 (6.7%) |
| 90 or more Minutes | 86 (2.3%) | 39 (1.3%) |
Time of Departure to Work by Sex in Harrison County
The most frequent times of departure to work in Harrison County are 7:00 AM to 7:29 AM (761, 20.3%) for males and 7:00 AM to 7:29 AM (623, 20.7%) for females.
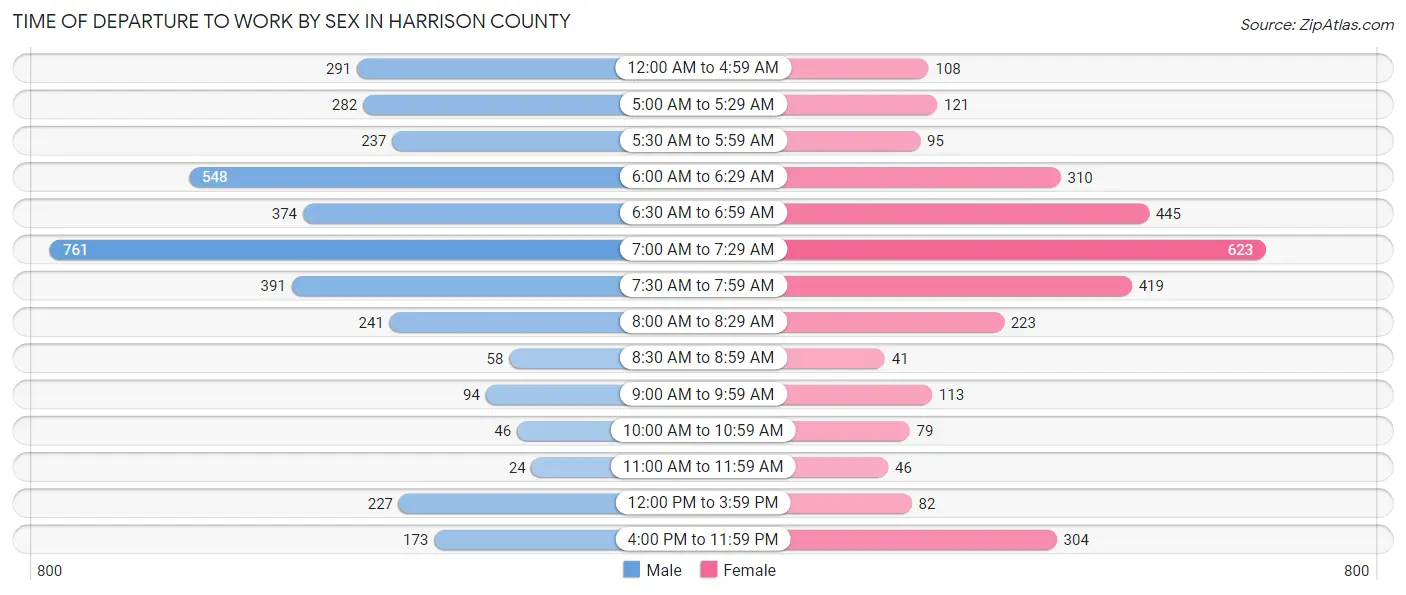
| Time of Departure | Male | Female |
| 12:00 AM to 4:59 AM | 291 (7.8%) | 108 (3.6%) |
| 5:00 AM to 5:29 AM | 282 (7.5%) | 121 (4.0%) |
| 5:30 AM to 5:59 AM | 237 (6.3%) | 95 (3.2%) |
| 6:00 AM to 6:29 AM | 548 (14.6%) | 310 (10.3%) |
| 6:30 AM to 6:59 AM | 374 (10.0%) | 445 (14.8%) |
| 7:00 AM to 7:29 AM | 761 (20.3%) | 623 (20.7%) |
| 7:30 AM to 7:59 AM | 391 (10.4%) | 419 (13.9%) |
| 8:00 AM to 8:29 AM | 241 (6.4%) | 223 (7.4%) |
| 8:30 AM to 8:59 AM | 58 (1.5%) | 41 (1.4%) |
| 9:00 AM to 9:59 AM | 94 (2.5%) | 113 (3.8%) |
| 10:00 AM to 10:59 AM | 46 (1.2%) | 79 (2.6%) |
| 11:00 AM to 11:59 AM | 24 (0.6%) | 46 (1.5%) |
| 12:00 PM to 3:59 PM | 227 (6.1%) | 82 (2.7%) |
| 4:00 PM to 11:59 PM | 173 (4.6%) | 304 (10.1%) |
| Total | 3,747 (100.0%) | 3,009 (100.0%) |
Housing Occupancy in Harrison County
Occupancy by Ownership in Harrison County
Of the total 5,963 dwellings in Harrison County, owner-occupied units account for 4,512 (75.7%), while renter-occupied units make up 1,451 (24.3%).
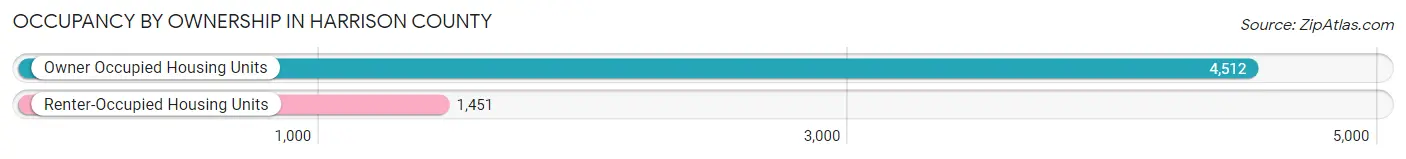
| Occupancy | # Housing Units | % Housing Units |
| Owner Occupied Housing Units | 4,512 | 75.7% |
| Renter-Occupied Housing Units | 1,451 | 24.3% |
| Total Occupied Housing Units | 5,963 | 100.0% |
Occupancy by Household Size in Harrison County
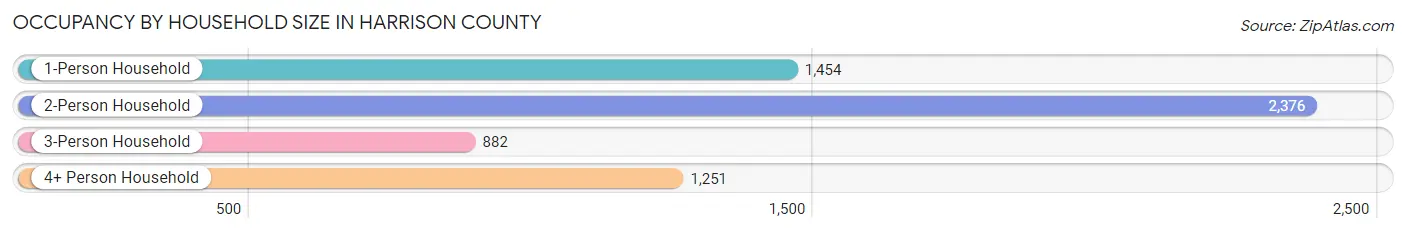
| Household Size | # Housing Units | % Housing Units |
| 1-Person Household | 1,454 | 24.4% |
| 2-Person Household | 2,376 | 39.9% |
| 3-Person Household | 882 | 14.8% |
| 4+ Person Household | 1,251 | 21.0% |
| Total Housing Units | 5,963 | 100.0% |
Occupancy by Ownership by Household Size in Harrison County
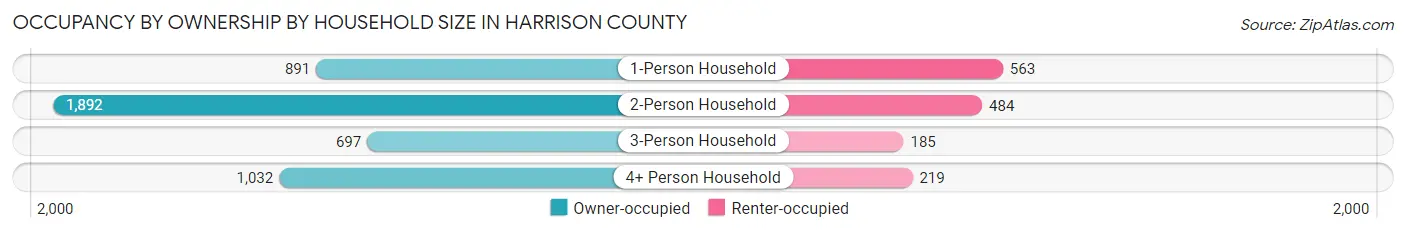
| Household Size | Owner-occupied | Renter-occupied |
| 1-Person Household | 891 (61.3%) | 563 (38.7%) |
| 2-Person Household | 1,892 (79.6%) | 484 (20.4%) |
| 3-Person Household | 697 (79.0%) | 185 (21.0%) |
| 4+ Person Household | 1,032 (82.5%) | 219 (17.5%) |
| Total Housing Units | 4,512 (75.7%) | 1,451 (24.3%) |
Occupancy by Educational Attainment in Harrison County
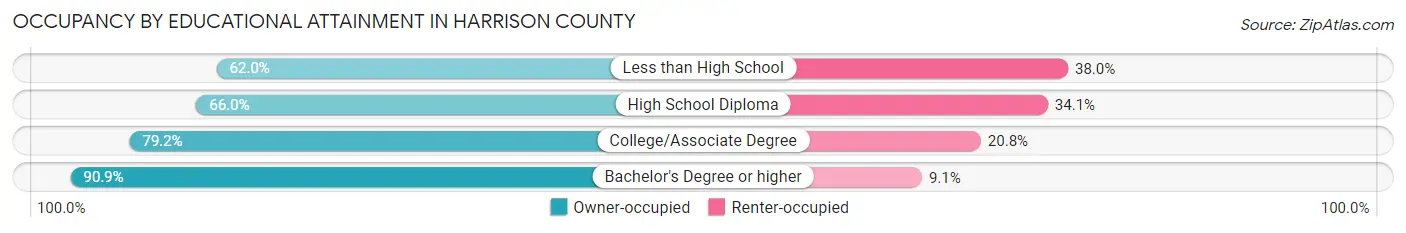
| Household Size | Owner-occupied | Renter-occupied |
| Less than High School | 228 (62.0%) | 140 (38.0%) |
| High School Diploma | 1,410 (65.9%) | 728 (34.1%) |
| College/Associate Degree | 1,823 (79.2%) | 478 (20.8%) |
| Bachelor's Degree or higher | 1,051 (90.9%) | 105 (9.1%) |
Occupancy by Age of Householder in Harrison County
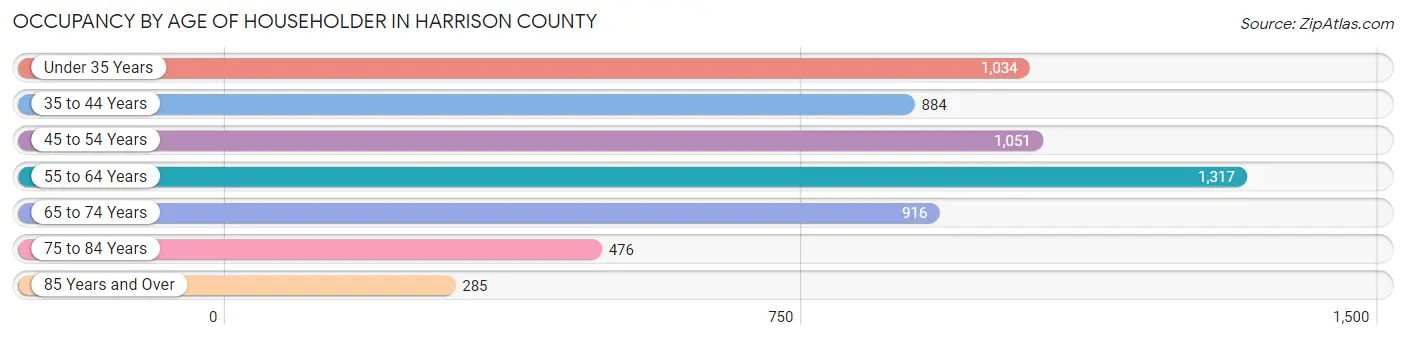
| Age Bracket | # Households | % Households |
| Under 35 Years | 1,034 | 17.3% |
| 35 to 44 Years | 884 | 14.8% |
| 45 to 54 Years | 1,051 | 17.6% |
| 55 to 64 Years | 1,317 | 22.1% |
| 65 to 74 Years | 916 | 15.4% |
| 75 to 84 Years | 476 | 8.0% |
| 85 Years and Over | 285 | 4.8% |
| Total | 5,963 | 100.0% |
Housing Finances in Harrison County
Median Income by Occupancy in Harrison County
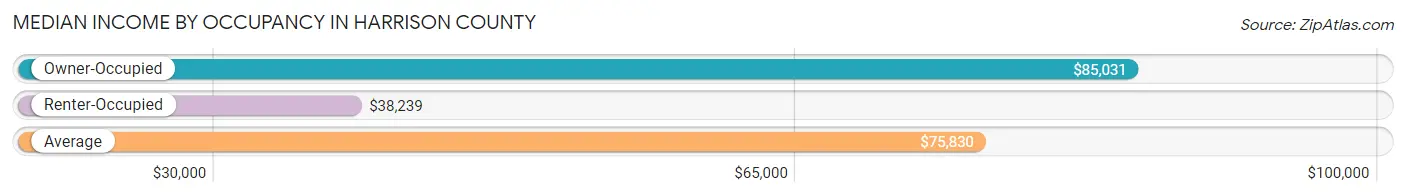
| Occupancy Type | # Households | Median Income |
| Owner-Occupied | 4,512 (75.7%) | $85,031 |
| Renter-Occupied | 1,451 (24.3%) | $38,239 |
| Average | 5,963 (100.0%) | $75,830 |
Occupancy by Householder Income Bracket in Harrison County
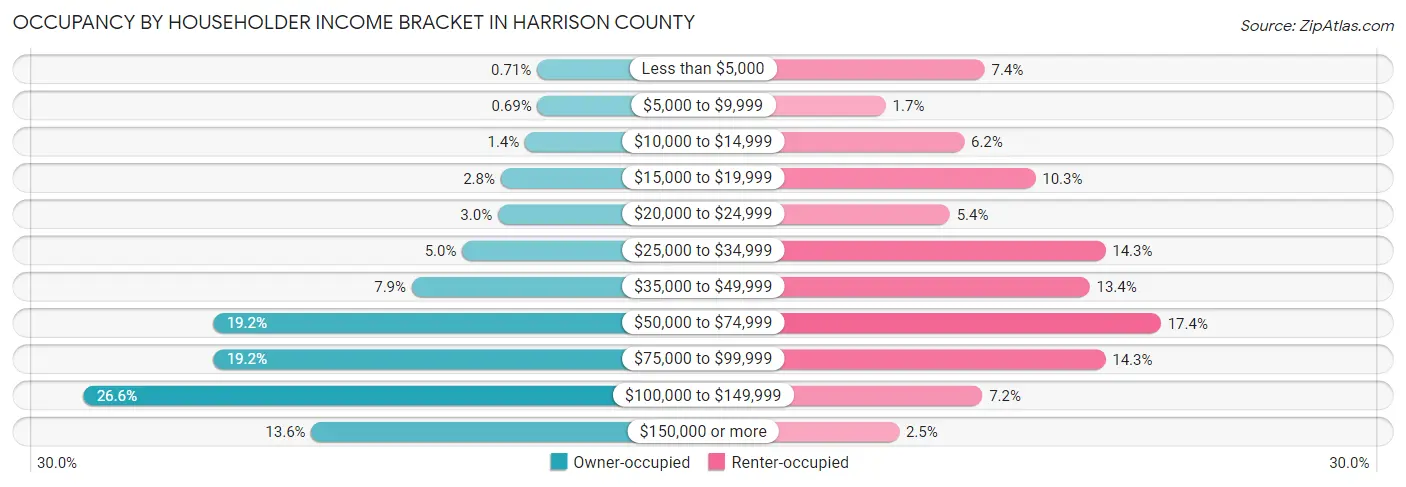
| Income Bracket | Owner-occupied | Renter-occupied |
| Less than $5,000 | 32 (0.7%) | 107 (7.4%) |
| $5,000 to $9,999 | 31 (0.7%) | 25 (1.7%) |
| $10,000 to $14,999 | 63 (1.4%) | 90 (6.2%) |
| $15,000 to $19,999 | 126 (2.8%) | 149 (10.3%) |
| $20,000 to $24,999 | 133 (2.9%) | 78 (5.4%) |
| $25,000 to $34,999 | 225 (5.0%) | 207 (14.3%) |
| $35,000 to $49,999 | 355 (7.9%) | 194 (13.4%) |
| $50,000 to $74,999 | 866 (19.2%) | 253 (17.4%) |
| $75,000 to $99,999 | 866 (19.2%) | 207 (14.3%) |
| $100,000 to $149,999 | 1,201 (26.6%) | 105 (7.2%) |
| $150,000 or more | 614 (13.6%) | 36 (2.5%) |
| Total | 4,512 (100.0%) | 1,451 (100.0%) |
Monthly Housing Cost Tiers in Harrison County
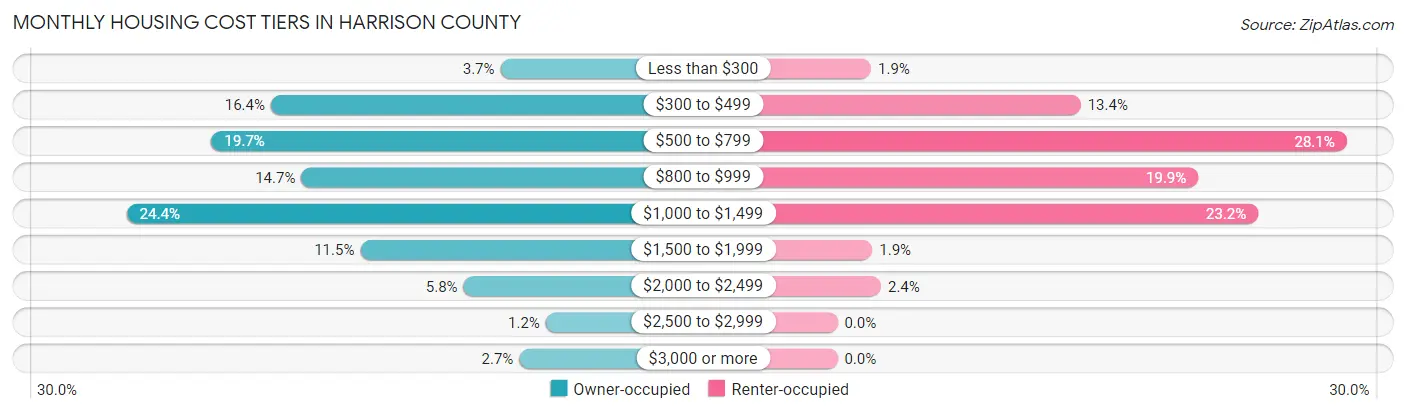
| Monthly Cost | Owner-occupied | Renter-occupied |
| Less than $300 | 168 (3.7%) | 27 (1.9%) |
| $300 to $499 | 740 (16.4%) | 195 (13.4%) |
| $500 to $799 | 888 (19.7%) | 408 (28.1%) |
| $800 to $999 | 664 (14.7%) | 289 (19.9%) |
| $1,000 to $1,499 | 1,099 (24.4%) | 337 (23.2%) |
| $1,500 to $1,999 | 517 (11.5%) | 28 (1.9%) |
| $2,000 to $2,499 | 260 (5.8%) | 35 (2.4%) |
| $2,500 to $2,999 | 55 (1.2%) | 0 (0.0%) |
| $3,000 or more | 121 (2.7%) | 0 (0.0%) |
| Total | 4,512 (100.0%) | 1,451 (100.0%) |
Physical Housing Characteristics in Harrison County
Housing Structures in Harrison County
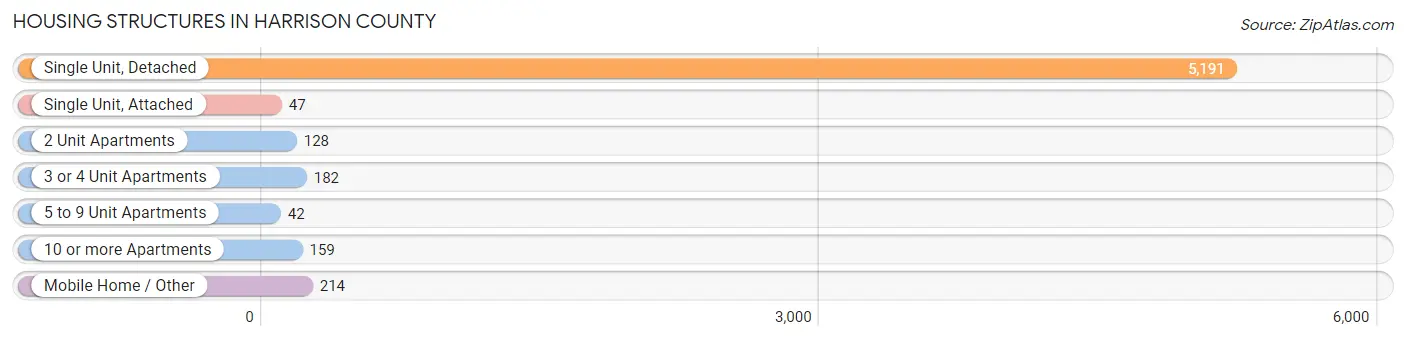
| Structure Type | # Housing Units | % Housing Units |
| Single Unit, Detached | 5,191 | 87.1% |
| Single Unit, Attached | 47 | 0.8% |
| 2 Unit Apartments | 128 | 2.1% |
| 3 or 4 Unit Apartments | 182 | 3.0% |
| 5 to 9 Unit Apartments | 42 | 0.7% |
| 10 or more Apartments | 159 | 2.7% |
| Mobile Home / Other | 214 | 3.6% |
| Total | 5,963 | 100.0% |
Housing Structures by Occupancy in Harrison County
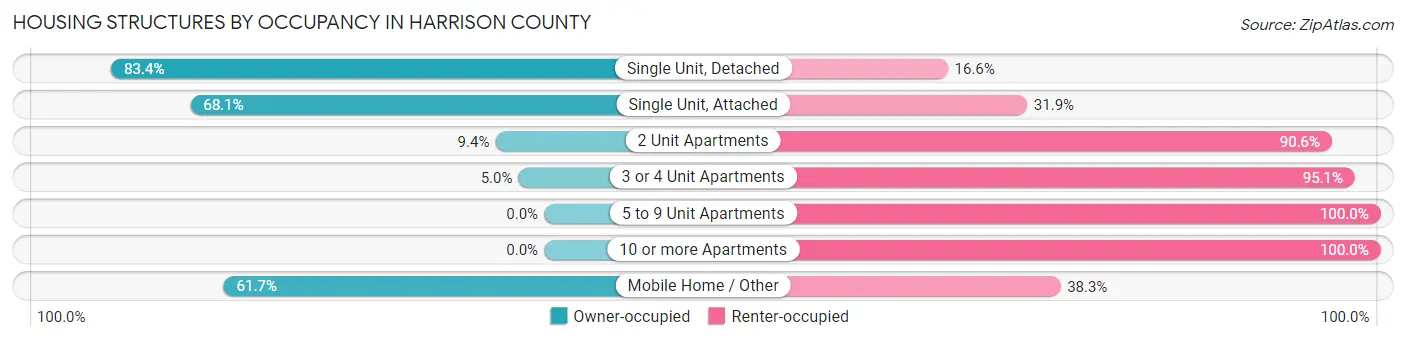
| Structure Type | Owner-occupied | Renter-occupied |
| Single Unit, Detached | 4,327 (83.4%) | 864 (16.6%) |
| Single Unit, Attached | 32 (68.1%) | 15 (31.9%) |
| 2 Unit Apartments | 12 (9.4%) | 116 (90.6%) |
| 3 or 4 Unit Apartments | 9 (5.0%) | 173 (95.1%) |
| 5 to 9 Unit Apartments | 0 (0.0%) | 42 (100.0%) |
| 10 or more Apartments | 0 (0.0%) | 159 (100.0%) |
| Mobile Home / Other | 132 (61.7%) | 82 (38.3%) |
| Total | 4,512 (75.7%) | 1,451 (24.3%) |
Housing Structures by Number of Rooms in Harrison County
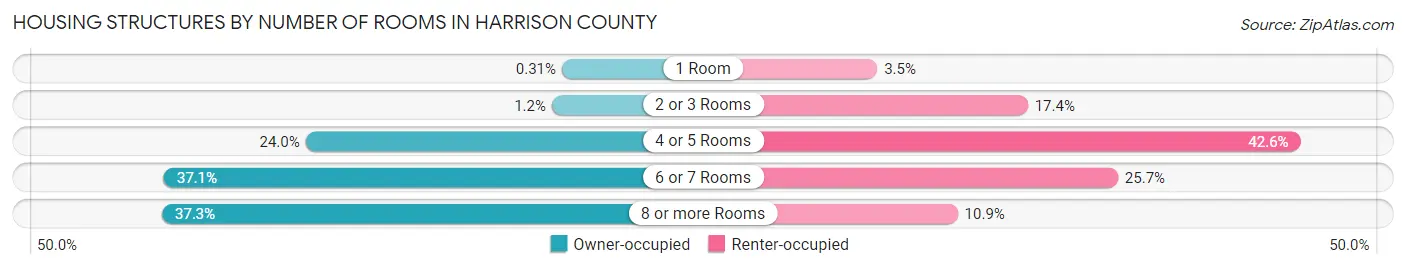
| Number of Rooms | Owner-occupied | Renter-occupied |
| 1 Room | 14 (0.3%) | 50 (3.5%) |
| 2 or 3 Rooms | 56 (1.2%) | 252 (17.4%) |
| 4 or 5 Rooms | 1,084 (24.0%) | 618 (42.6%) |
| 6 or 7 Rooms | 1,675 (37.1%) | 373 (25.7%) |
| 8 or more Rooms | 1,683 (37.3%) | 158 (10.9%) |
| Total | 4,512 (100.0%) | 1,451 (100.0%) |
Housing Structure by Heating Type in Harrison County
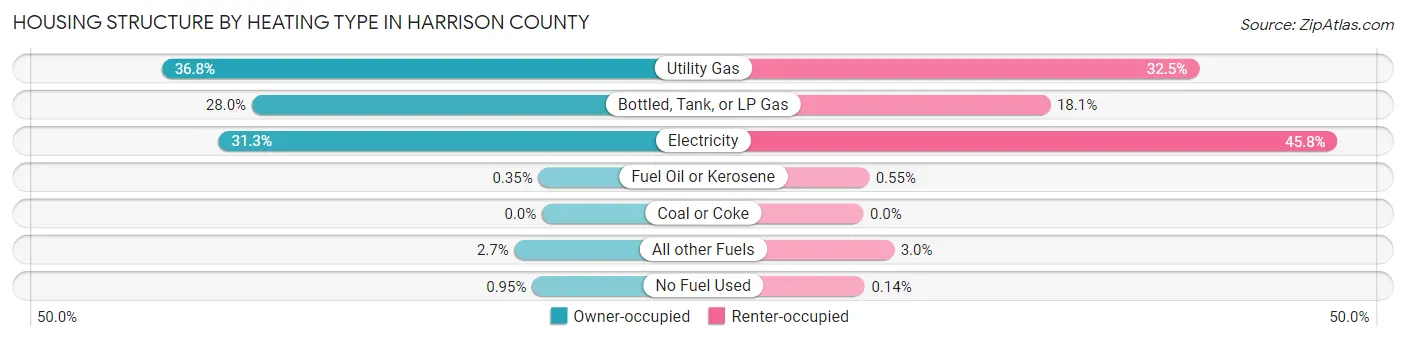
| Heating Type | Owner-occupied | Renter-occupied |
| Utility Gas | 1,658 (36.7%) | 471 (32.5%) |
| Bottled, Tank, or LP Gas | 1,265 (28.0%) | 262 (18.1%) |
| Electricity | 1,410 (31.2%) | 665 (45.8%) |
| Fuel Oil or Kerosene | 16 (0.4%) | 8 (0.5%) |
| Coal or Coke | 0 (0.0%) | 0 (0.0%) |
| All other Fuels | 120 (2.7%) | 43 (3.0%) |
| No Fuel Used | 43 (0.9%) | 2 (0.1%) |
| Total | 4,512 (100.0%) | 1,451 (100.0%) |
Household Vehicle Usage in Harrison County
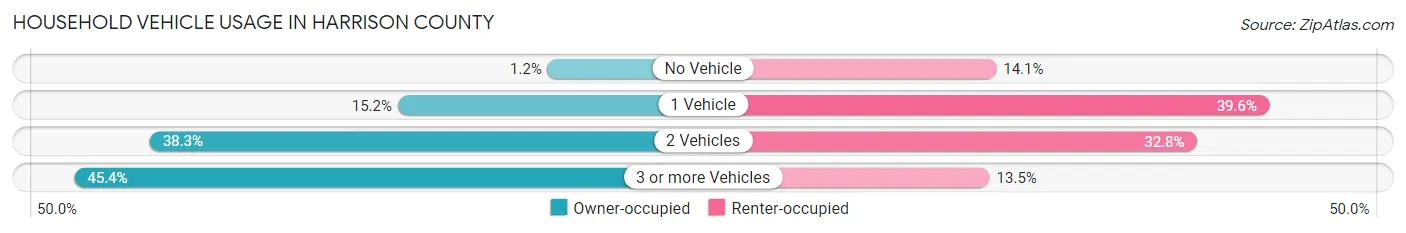
| Vehicles per Household | Owner-occupied | Renter-occupied |
| No Vehicle | 53 (1.2%) | 205 (14.1%) |
| 1 Vehicle | 684 (15.2%) | 574 (39.6%) |
| 2 Vehicles | 1,729 (38.3%) | 476 (32.8%) |
| 3 or more Vehicles | 2,046 (45.4%) | 196 (13.5%) |
| Total | 4,512 (100.0%) | 1,451 (100.0%) |
Real Estate & Mortgages in Harrison County
Real Estate and Mortgage Overview in Harrison County
| Characteristic | Without Mortgage | With Mortgage |
| Housing Units | 1,836 | 2,676 |
| Median Property Value | $137,700 | $159,900 |
| Median Household Income | $67,037 | $453 |
| Monthly Housing Costs | $505 | $121 |
| Real Estate Taxes | $1,944 | $44 |
Property Value by Mortgage Status in Harrison County
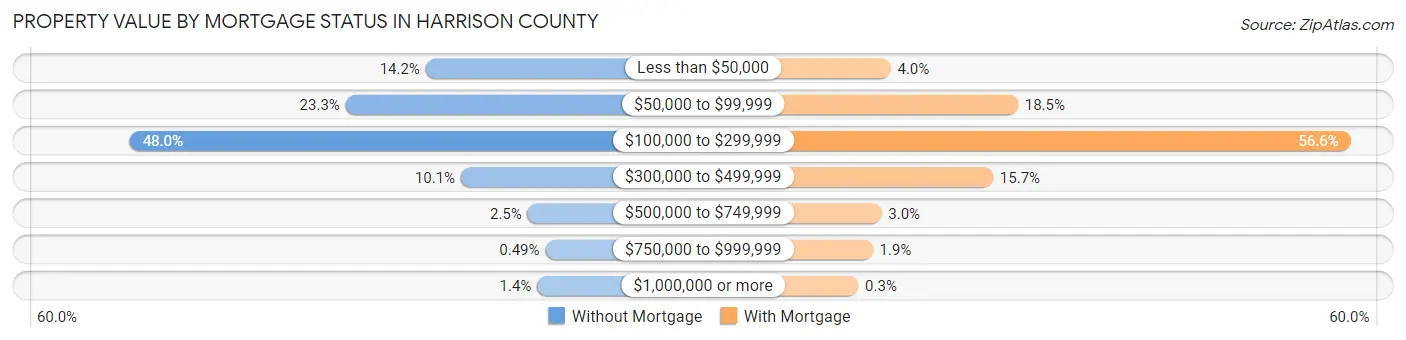
| Property Value | Without Mortgage | With Mortgage |
| Less than $50,000 | 260 (14.2%) | 107 (4.0%) |
| $50,000 to $99,999 | 428 (23.3%) | 496 (18.5%) |
| $100,000 to $299,999 | 881 (48.0%) | 1,514 (56.6%) |
| $300,000 to $499,999 | 186 (10.1%) | 420 (15.7%) |
| $500,000 to $749,999 | 46 (2.5%) | 79 (2.9%) |
| $750,000 to $999,999 | 9 (0.5%) | 52 (1.9%) |
| $1,000,000 or more | 26 (1.4%) | 8 (0.3%) |
| Total | 1,836 (100.0%) | 2,676 (100.0%) |
Household Income by Mortgage Status in Harrison County
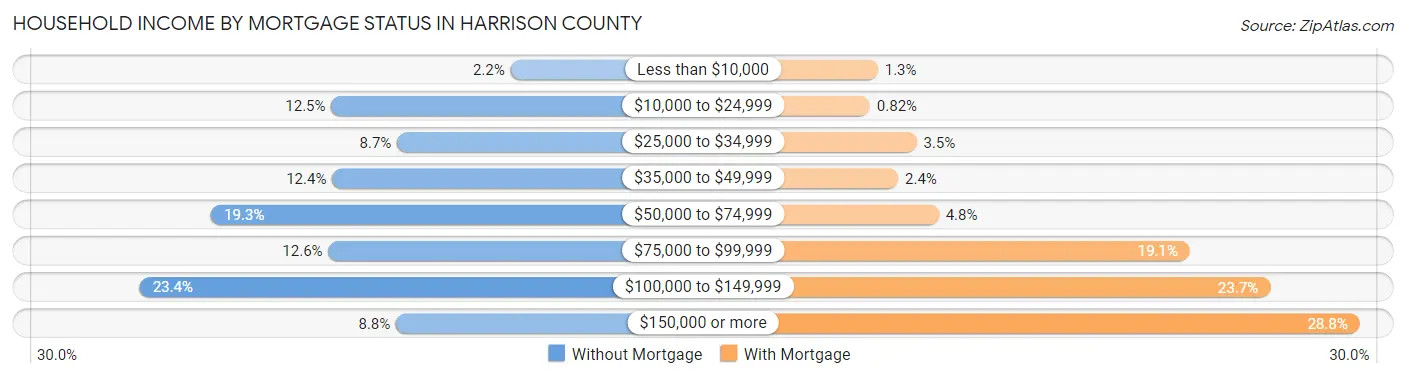
| Household Income | Without Mortgage | With Mortgage |
| Less than $10,000 | 41 (2.2%) | 34 (1.3%) |
| $10,000 to $24,999 | 229 (12.5%) | 22 (0.8%) |
| $25,000 to $34,999 | 160 (8.7%) | 93 (3.5%) |
| $35,000 to $49,999 | 228 (12.4%) | 65 (2.4%) |
| $50,000 to $74,999 | 355 (19.3%) | 127 (4.8%) |
| $75,000 to $99,999 | 232 (12.6%) | 511 (19.1%) |
| $100,000 to $149,999 | 430 (23.4%) | 634 (23.7%) |
| $150,000 or more | 161 (8.8%) | 771 (28.8%) |
| Total | 1,836 (100.0%) | 2,676 (100.0%) |
Property Value to Household Income Ratio in Harrison County
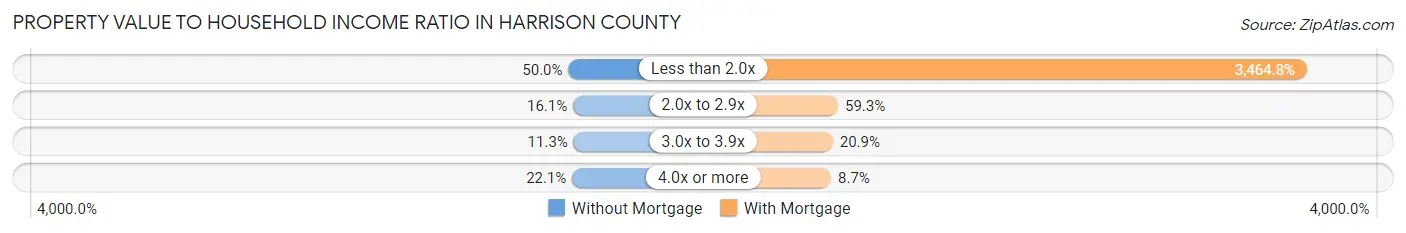
| Value-to-Income Ratio | Without Mortgage | With Mortgage |
| Less than 2.0x | 918 (50.0%) | 92,717 (3,464.8%) |
| 2.0x to 2.9x | 296 (16.1%) | 1,587 (59.3%) |
| 3.0x to 3.9x | 208 (11.3%) | 559 (20.9%) |
| 4.0x or more | 405 (22.1%) | 233 (8.7%) |
| Total | 1,836 (100.0%) | 2,676 (100.0%) |
Real Estate Taxes by Mortgage Status in Harrison County
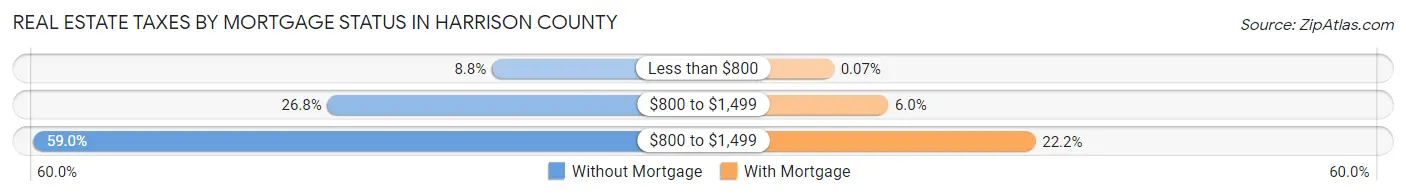
| Property Taxes | Without Mortgage | With Mortgage |
| Less than $800 | 161 (8.8%) | 2 (0.1%) |
| $800 to $1,499 | 492 (26.8%) | 161 (6.0%) |
| $800 to $1,499 | 1,083 (59.0%) | 593 (22.2%) |
| Total | 1,836 (100.0%) | 2,676 (100.0%) |
Health & Disability in Harrison County
Health Insurance Coverage by Age in Harrison County
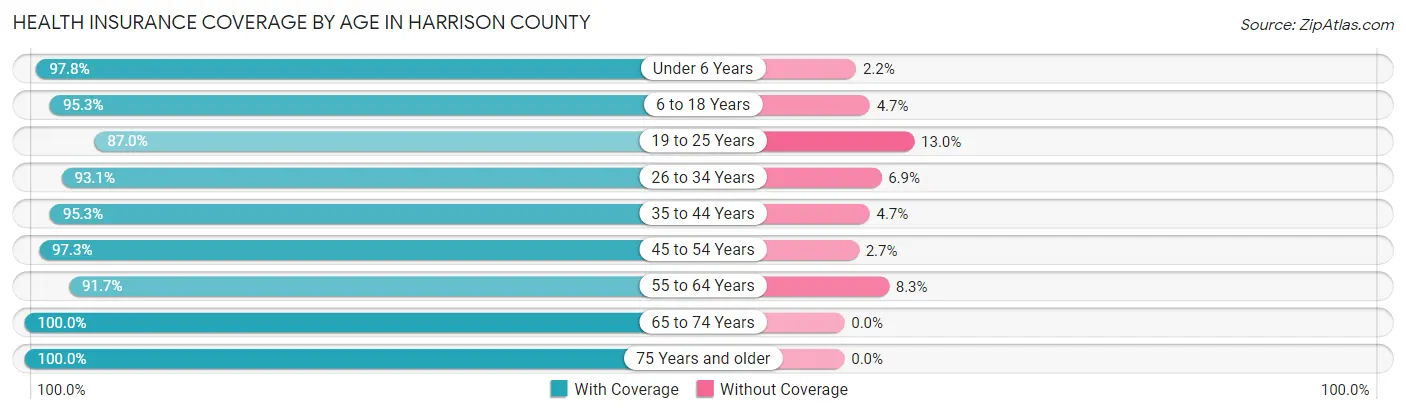
| Age Bracket | With Coverage | Without Coverage |
| Under 6 Years | 986 (97.8%) | 22 (2.2%) |
| 6 to 18 Years | 2,454 (95.3%) | 122 (4.7%) |
| 19 to 25 Years | 822 (87.0%) | 123 (13.0%) |
| 26 to 34 Years | 1,351 (93.1%) | 100 (6.9%) |
| 35 to 44 Years | 1,617 (95.3%) | 80 (4.7%) |
| 45 to 54 Years | 1,737 (97.3%) | 48 (2.7%) |
| 55 to 64 Years | 2,077 (91.7%) | 188 (8.3%) |
| 65 to 74 Years | 1,563 (100.0%) | 0 (0.0%) |
| 75 Years and older | 1,069 (100.0%) | 0 (0.0%) |
| Total | 13,676 (95.2%) | 683 (4.8%) |
Health Insurance Coverage by Citizenship Status in Harrison County
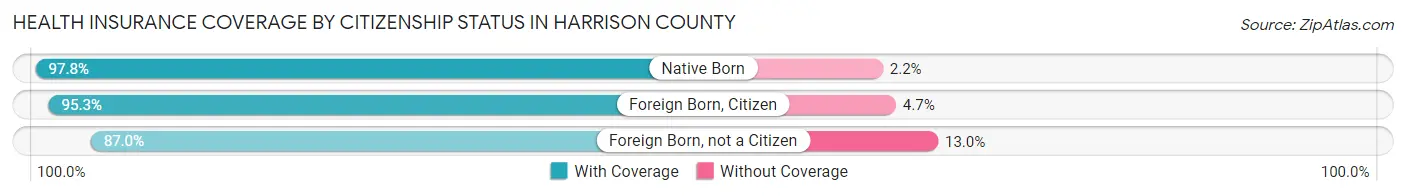
| Citizenship Status | With Coverage | Without Coverage |
| Native Born | 986 (97.8%) | 22 (2.2%) |
| Foreign Born, Citizen | 2,454 (95.3%) | 122 (4.7%) |
| Foreign Born, not a Citizen | 822 (87.0%) | 123 (13.0%) |
Health Insurance Coverage by Household Income in Harrison County
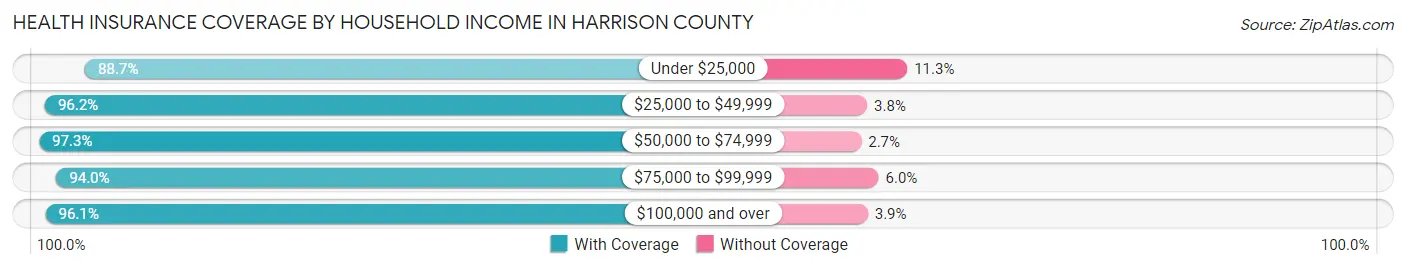
| Household Income | With Coverage | Without Coverage |
| Under $25,000 | 1,120 (88.7%) | 143 (11.3%) |
| $25,000 to $49,999 | 1,890 (96.2%) | 75 (3.8%) |
| $50,000 to $74,999 | 2,260 (97.3%) | 63 (2.7%) |
| $75,000 to $99,999 | 2,650 (94.0%) | 168 (6.0%) |
| $100,000 and over | 5,726 (96.1%) | 234 (3.9%) |
Public vs Private Health Insurance Coverage by Age in Harrison County
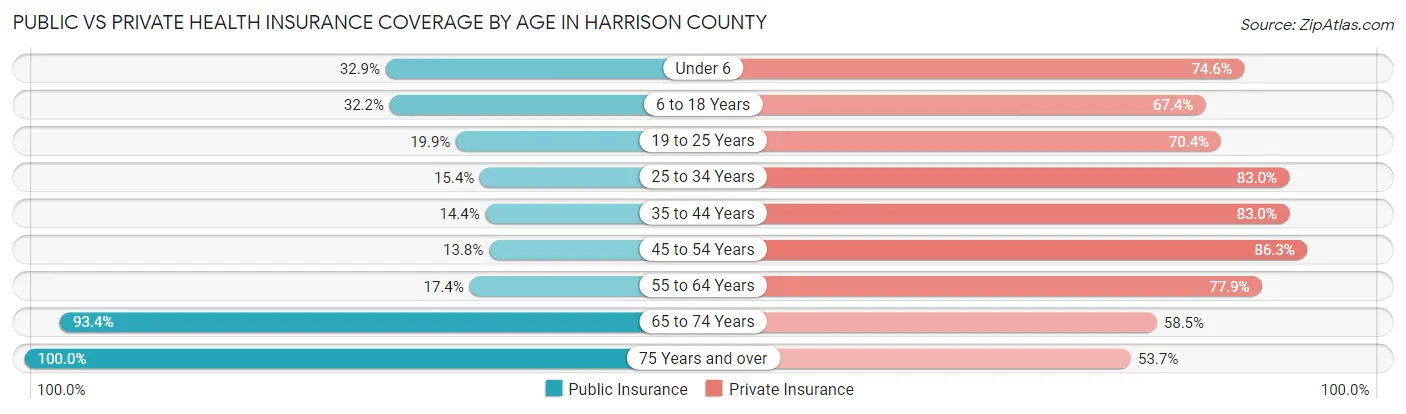
| Age Bracket | Public Insurance | Private Insurance |
| Under 6 | 332 (32.9%) | 752 (74.6%) |
| 6 to 18 Years | 830 (32.2%) | 1,737 (67.4%) |
| 19 to 25 Years | 188 (19.9%) | 665 (70.4%) |
| 25 to 34 Years | 224 (15.4%) | 1,204 (83.0%) |
| 35 to 44 Years | 245 (14.4%) | 1,408 (83.0%) |
| 45 to 54 Years | 246 (13.8%) | 1,540 (86.3%) |
| 55 to 64 Years | 394 (17.4%) | 1,764 (77.9%) |
| 65 to 74 Years | 1,460 (93.4%) | 914 (58.5%) |
| 75 Years and over | 1,069 (100.0%) | 574 (53.7%) |
| Total | 4,988 (34.7%) | 10,558 (73.5%) |
Disability Status by Sex by Age in Harrison County
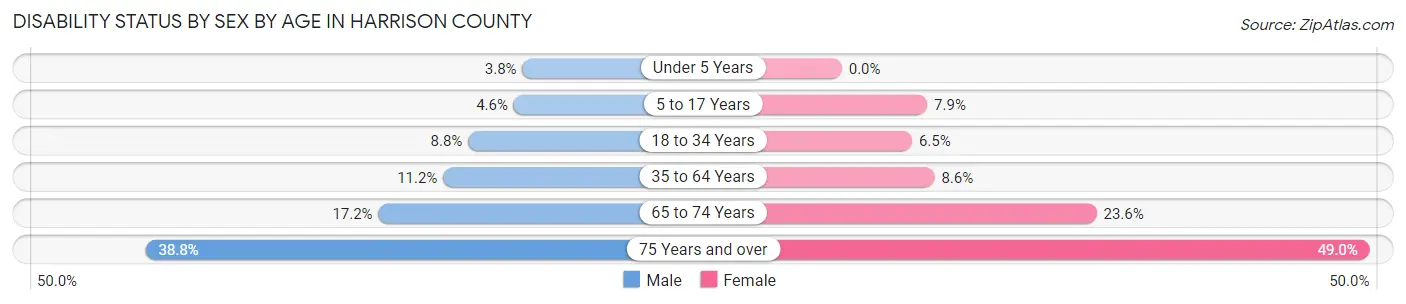
| Age Bracket | Male | Female |
| Under 5 Years | 15 (3.8%) | 0 (0.0%) |
| 5 to 17 Years | 62 (4.6%) | 92 (7.9%) |
| 18 to 34 Years | 124 (8.8%) | 80 (6.5%) |
| 35 to 64 Years | 327 (11.2%) | 242 (8.6%) |
| 65 to 74 Years | 139 (17.2%) | 178 (23.6%) |
| 75 Years and over | 185 (38.8%) | 290 (49.0%) |
Disability Class by Sex by Age in Harrison County
Disability Class: Hearing Difficulty
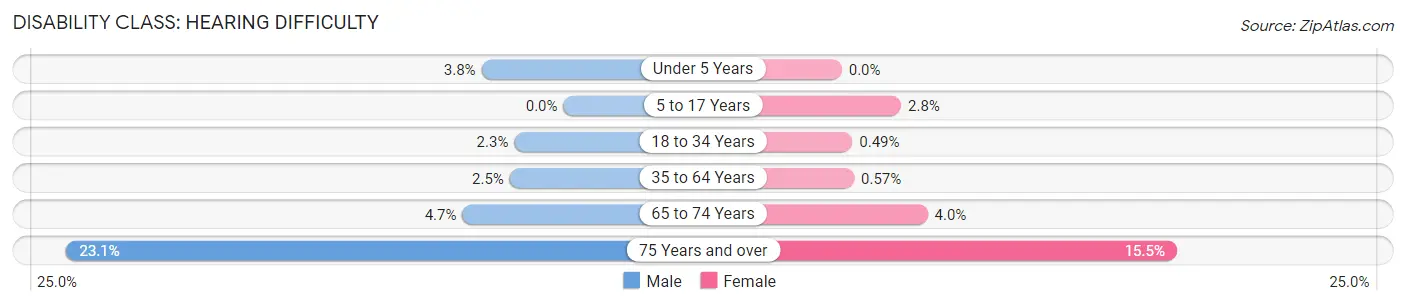
| Age Bracket | Male | Female |
| Under 5 Years | 15 (3.8%) | 0 (0.0%) |
| 5 to 17 Years | 0 (0.0%) | 32 (2.8%) |
| 18 to 34 Years | 32 (2.3%) | 6 (0.5%) |
| 35 to 64 Years | 73 (2.5%) | 16 (0.6%) |
| 65 to 74 Years | 38 (4.7%) | 30 (4.0%) |
| 75 Years and over | 110 (23.1%) | 92 (15.5%) |
Disability Class: Vision Difficulty
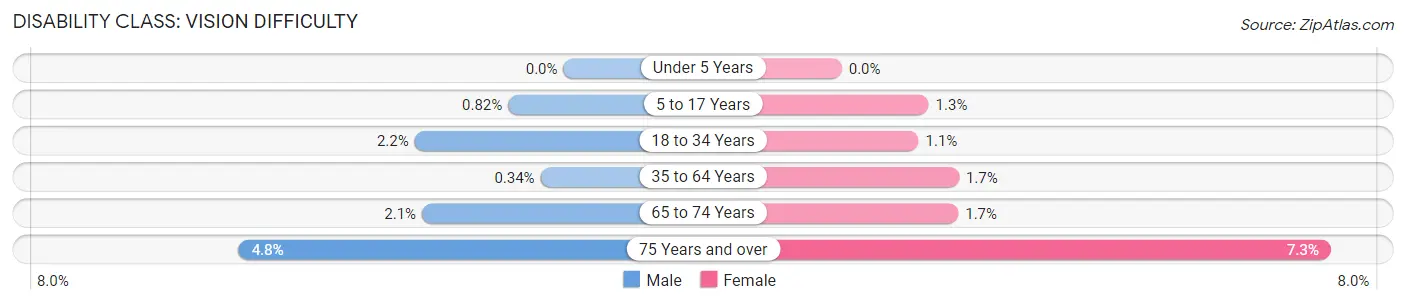
| Age Bracket | Male | Female |
| Under 5 Years | 0 (0.0%) | 0 (0.0%) |
| 5 to 17 Years | 11 (0.8%) | 15 (1.3%) |
| 18 to 34 Years | 31 (2.2%) | 14 (1.1%) |
| 35 to 64 Years | 10 (0.3%) | 49 (1.7%) |
| 65 to 74 Years | 17 (2.1%) | 13 (1.7%) |
| 75 Years and over | 23 (4.8%) | 43 (7.3%) |
Disability Class: Cognitive Difficulty
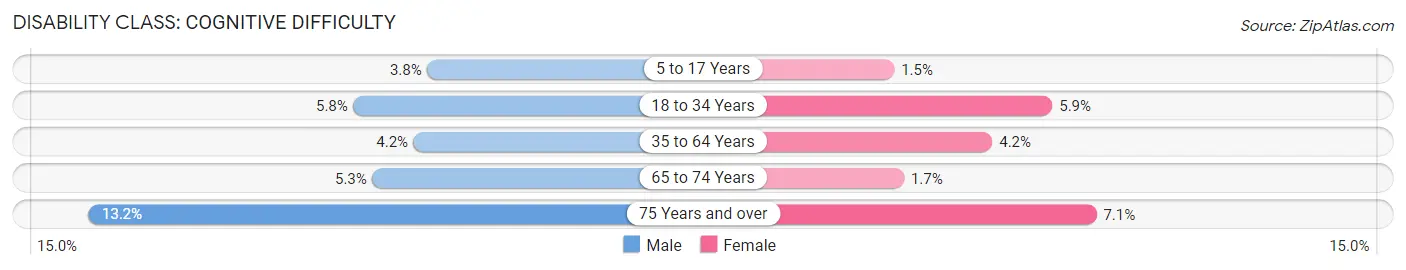
| Age Bracket | Male | Female |
| 5 to 17 Years | 51 (3.8%) | 17 (1.5%) |
| 18 to 34 Years | 82 (5.8%) | 72 (5.9%) |
| 35 to 64 Years | 122 (4.2%) | 118 (4.2%) |
| 65 to 74 Years | 43 (5.3%) | 13 (1.7%) |
| 75 Years and over | 63 (13.2%) | 42 (7.1%) |
Disability Class: Ambulatory Difficulty
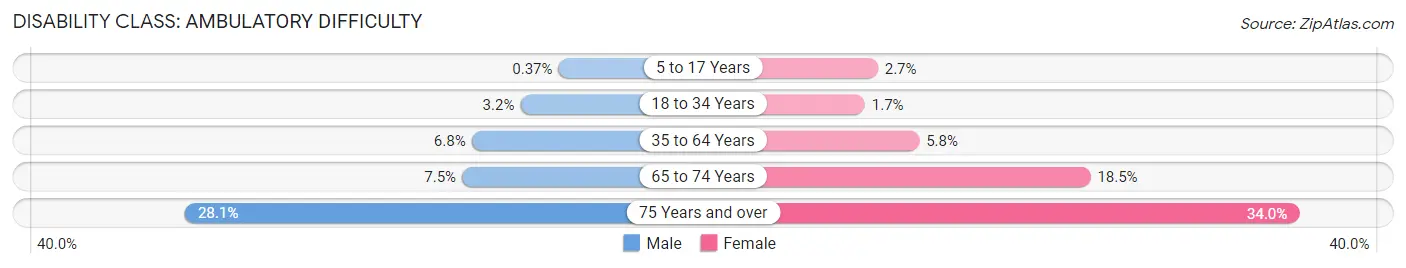
| Age Bracket | Male | Female |
| 5 to 17 Years | 5 (0.4%) | 31 (2.7%) |
| 18 to 34 Years | 45 (3.2%) | 21 (1.7%) |
| 35 to 64 Years | 200 (6.8%) | 162 (5.8%) |
| 65 to 74 Years | 61 (7.5%) | 139 (18.5%) |
| 75 Years and over | 134 (28.1%) | 201 (34.0%) |
Disability Class: Self-Care Difficulty
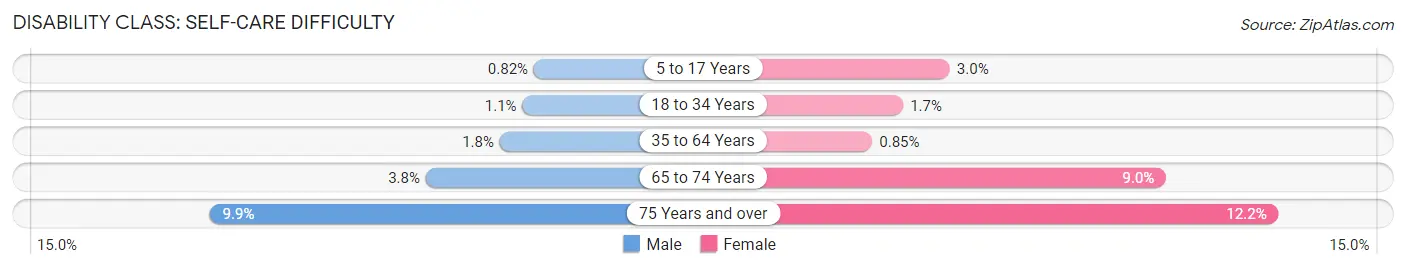
| Age Bracket | Male | Female |
| 5 to 17 Years | 11 (0.8%) | 35 (3.0%) |
| 18 to 34 Years | 16 (1.1%) | 21 (1.7%) |
| 35 to 64 Years | 52 (1.8%) | 24 (0.9%) |
| 65 to 74 Years | 31 (3.8%) | 68 (9.0%) |
| 75 Years and over | 47 (9.9%) | 72 (12.2%) |
Technology Access in Harrison County
Computing Device Access in Harrison County
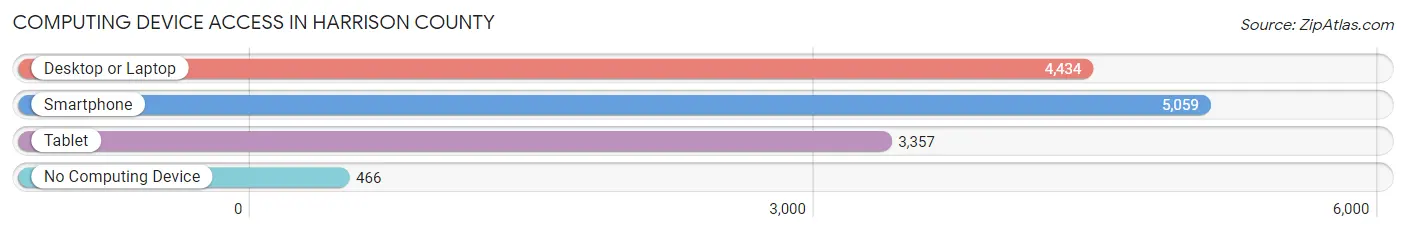
| Device Type | # Households | % Households |
| Desktop or Laptop | 4,434 | 74.4% |
| Smartphone | 5,059 | 84.8% |
| Tablet | 3,357 | 56.3% |
| No Computing Device | 466 | 7.8% |
| Total | 5,963 | 100.0% |
Internet Access in Harrison County
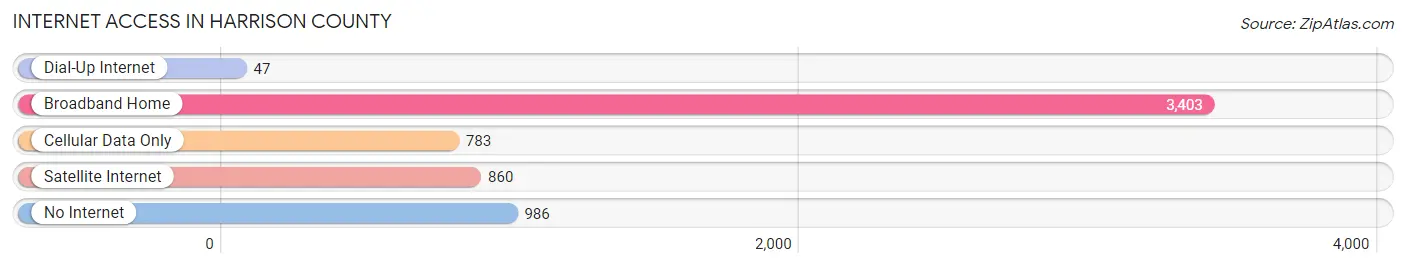
| Internet Type | # Households | % Households |
| Dial-Up Internet | 47 | 0.8% |
| Broadband Home | 3,403 | 57.1% |
| Cellular Data Only | 783 | 13.1% |
| Satellite Internet | 860 | 14.4% |
| No Internet | 986 | 16.5% |
| Total | 5,963 | 100.0% |
Harrison County Summary
Harrison County is located in the state of Iowa in the United States. It is bordered by Shelby County to the north, Pottawattamie County to the east, Mills County to the south, and Monona County to the west. The county seat is Logan, and the largest city is Missouri Valley. The county was established in 1851 and named after President William Henry Harrison. As of the 2010 census, the population was 14,928.
Geography
Harrison County is located in the Loess Hills region of western Iowa. The county is mostly rural, with rolling hills and valleys. The Little Sioux River flows through the county, and the Boyer River forms the county's western border. The county has a total area of 576 square miles, of which 575 square miles is land and 1.2 square miles is water.
Climate
Harrison County has a humid continental climate, with cold winters and hot, humid summers. The average annual temperature is 48°F, and the average annual precipitation is 33 inches.
Demographics
As of the 2010 census, there were 14,928 people, 5,845 households, and 4,072 families living in the county. The population density was 26 people per square mile. The racial makeup of the county was 97.3% White, 0.3% African American, 0.3% Native American, 0.3% Asian, 0.2% Pacific Islander, 0.7% from other races, and 0.9% from two or more races. Hispanic or Latino of any race were 2.2% of the population.
Economy
Harrison County is largely agricultural, with corn, soybeans, and hay being the main crops. Livestock production is also important, with beef cattle, hogs, and sheep being raised in the county. Manufacturing is also an important part of the economy, with companies such as John Deere, Cargill, and Tyson Foods having operations in the county.
The county also has a growing tourism industry, with attractions such as the Loess Hills National Scenic Byway, the Missouri Valley Historical Museum, and the Harrison County Fair.
Conclusion
Harrison County is a rural county in western Iowa with a population of 14,928. The county is largely agricultural, with corn, soybeans, and hay being the main crops. Manufacturing and tourism are also important parts of the economy. The county has a humid continental climate, with cold winters and hot, humid summers.
Common Questions
What is Per Capita Income in Harrison County?
Per Capita income in Harrison County is $36,998.
What is the Median Family Income in Harrison County?
Median Family Income in Harrison County is $89,443.
What is the Median Household income in Harrison County?
Median Household Income in Harrison County is $75,830.
What is Income or Wage Gap in Harrison County?
Income or Wage Gap in Harrison County is 24.3%.
Women in Harrison County earn 75.7 cents for every dollar earned by a man.
What is Family Income Deficit in Harrison County?
Family Income Deficit in Harrison County is $12,005.
Families that are below poverty line in Harrison County earn $12,005 less on average than the poverty threshold level.
What is Inequality or Gini Index in Harrison County?
Inequality or Gini Index in Harrison County is 0.41.
What is the Total Population of Harrison County?
Total Population of Harrison County is 14,623.
What is the Total Male Population of Harrison County?
Total Male Population of Harrison County is 7,452.
What is the Total Female Population of Harrison County?
Total Female Population of Harrison County is 7,171.
What is the Ratio of Males per 100 Females in Harrison County?
There are 103.92 Males per 100 Females in Harrison County.
What is the Ratio of Females per 100 Males in Harrison County?
There are 96.23 Females per 100 Males in Harrison County.
What is the Median Population Age in Harrison County?
Median Population Age in Harrison County is 42.0 Years.
What is the Average Family Size in Harrison County
Average Family Size in Harrison County is 2.9 People.
What is the Average Household Size in Harrison County
Average Household Size in Harrison County is 2.4 People.
How Large is the Labor Force in Harrison County?
There are 7,592 People in the Labor Forcein in Harrison County.
What is the Percentage of People in the Labor Force in Harrison County?
65.2% of People are in the Labor Force in Harrison County.
What is the Unemployment Rate in Harrison County?
Unemployment Rate in Harrison County is 2.7%.