Hamilton County, IA Map & Demographics
Hamilton County Map
Hamilton County Overview
$35,822
PER CAPITA INCOME
$81,270
AVG FAMILY INCOME
$66,685
AVG HOUSEHOLD INCOME
41.2%
WAGE / INCOME GAP [ % ]
58.8¢/ $1
WAGE / INCOME GAP [ $ ]
$11,649
FAMILY INCOME DEFICIT
0.43
INEQUALITY / GINI INDEX
14,979
TOTAL POPULATION
7,637
MALE POPULATION
7,342
FEMALE POPULATION
104.02
MALES / 100 FEMALES
96.14
FEMALES / 100 MALES
41.9
MEDIAN AGE
3.0
AVG FAMILY SIZE
2.4
AVG HOUSEHOLD SIZE
7,597
LABOR FORCE [ PEOPLE ]
63.3%
PERCENT IN LABOR FORCE
4.0%
UNEMPLOYMENT RATE
Hamilton County Area Codes
Income in Hamilton County
Income Overview in Hamilton County
Per Capita Income in Hamilton County is $35,822, while median incomes of families and households are $81,270 and $66,685 respectively.
| Characteristic | Number | Measure |
| Per Capita Income | 14,979 | $35,822 |
| Median Family Income | 3,781 | $81,270 |
| Mean Family Income | 3,781 | $100,363 |
| Median Household Income | 6,203 | $66,685 |
| Mean Household Income | 6,203 | $83,101 |
| Income Deficit | 3,781 | $11,649 |
| Wage / Income Gap (%) | 14,979 | 41.24% |
| Wage / Income Gap ($) | 14,979 | 58.76¢ per $1 |
| Gini / Inequality Index | 14,979 | 0.43 |
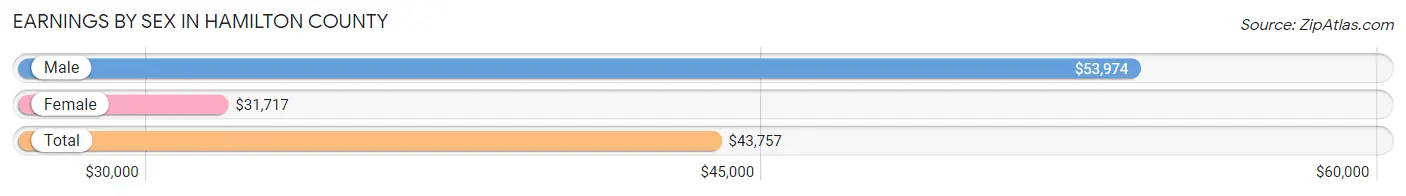
Earnings by Sex in Hamilton County
Average Earnings in Hamilton County are $43,757, $53,974 for men and $31,717 for women, a difference of 41.2%.
| Sex | Number | Average Earnings |
| Male | 4,298 (54.3%) | $53,974 |
| Female | 3,616 (45.7%) | $31,717 |
| Total | 7,914 (100.0%) | $43,757 |
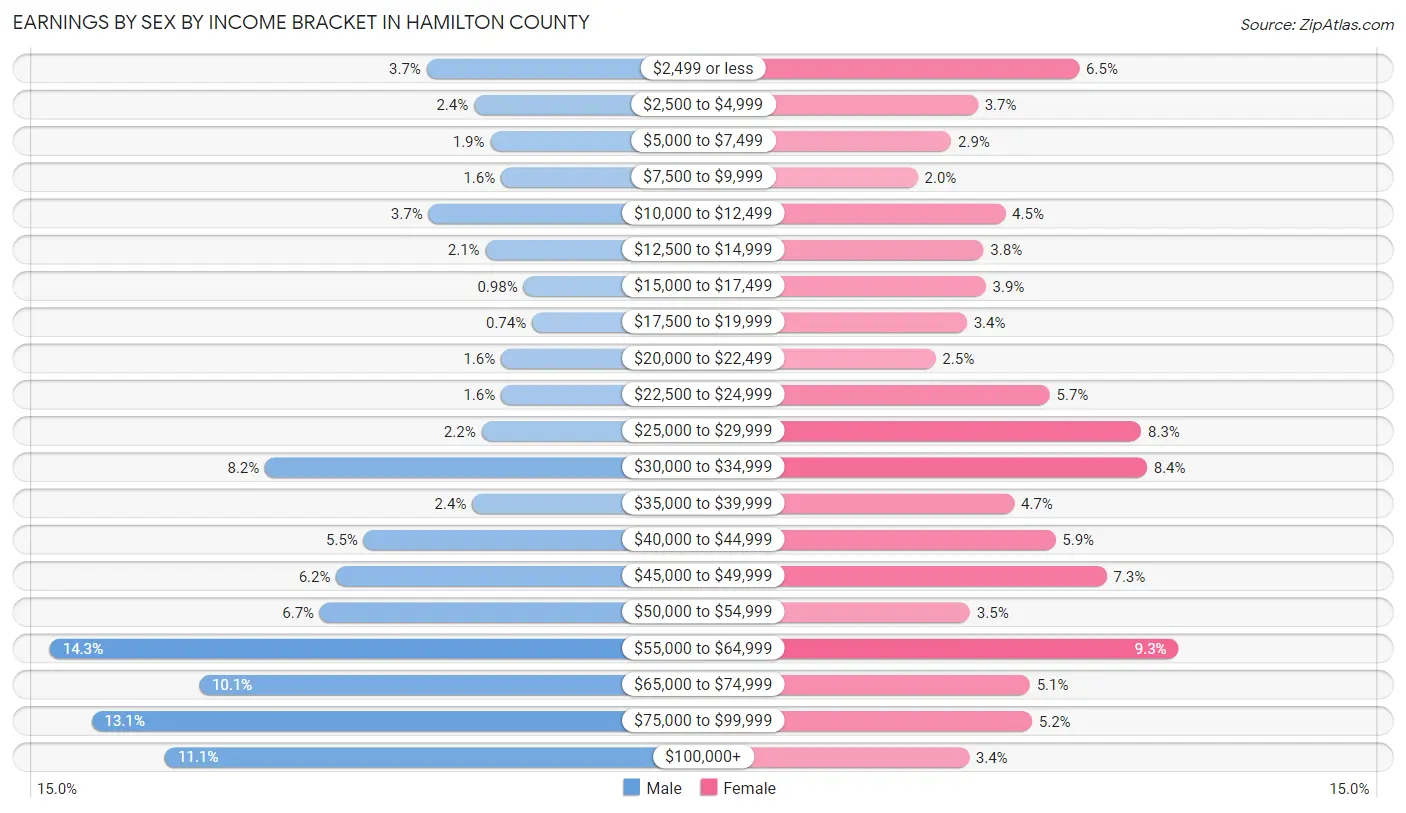
Earnings by Sex by Income Bracket in Hamilton County
The most common earnings brackets in Hamilton County are $55,000 to $64,999 for men (614 | 14.3%) and $55,000 to $64,999 for women (337 | 9.3%).
| Income | Male | Female |
| $2,499 or less | 159 (3.7%) | 236 (6.5%) |
| $2,500 to $4,999 | 102 (2.4%) | 133 (3.7%) |
| $5,000 to $7,499 | 82 (1.9%) | 106 (2.9%) |
| $7,500 to $9,999 | 69 (1.6%) | 72 (2.0%) |
| $10,000 to $12,499 | 157 (3.6%) | 161 (4.4%) |
| $12,500 to $14,999 | 88 (2.1%) | 139 (3.8%) |
| $15,000 to $17,499 | 42 (1.0%) | 141 (3.9%) |
| $17,500 to $19,999 | 32 (0.7%) | 122 (3.4%) |
| $20,000 to $22,499 | 69 (1.6%) | 90 (2.5%) |
| $22,500 to $24,999 | 69 (1.6%) | 206 (5.7%) |
| $25,000 to $29,999 | 93 (2.2%) | 299 (8.3%) |
| $30,000 to $34,999 | 354 (8.2%) | 305 (8.4%) |
| $35,000 to $39,999 | 104 (2.4%) | 170 (4.7%) |
| $40,000 to $44,999 | 235 (5.5%) | 212 (5.9%) |
| $45,000 to $49,999 | 268 (6.2%) | 264 (7.3%) |
| $50,000 to $54,999 | 288 (6.7%) | 125 (3.5%) |
| $55,000 to $64,999 | 614 (14.3%) | 337 (9.3%) |
| $65,000 to $74,999 | 434 (10.1%) | 186 (5.1%) |
| $75,000 to $99,999 | 564 (13.1%) | 188 (5.2%) |
| $100,000+ | 475 (11.1%) | 124 (3.4%) |
| Total | 4,298 (100.0%) | 3,616 (100.0%) |
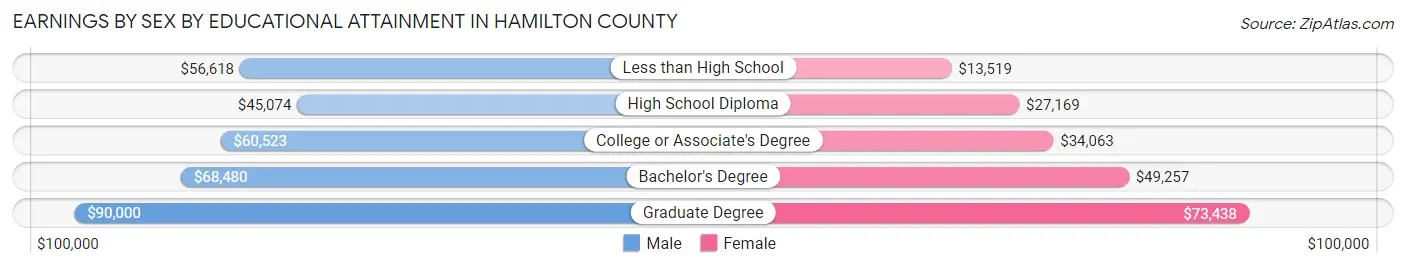
Earnings by Sex by Educational Attainment in Hamilton County
Average earnings in Hamilton County are $57,310 for men and $34,393 for women, a difference of 40.0%. Men with an educational attainment of graduate degree enjoy the highest average annual earnings of $90,000, while those with high school diploma education earn the least with $45,074. Women with an educational attainment of graduate degree earn the most with the average annual earnings of $73,438, while those with less than high school education have the smallest earnings of $13,519.
| Educational Attainment | Male Income | Female Income |
| Less than High School | $56,618 | $13,519 |
| High School Diploma | $45,074 | $27,169 |
| College or Associate's Degree | $60,523 | $34,063 |
| Bachelor's Degree | $68,480 | $49,257 |
| Graduate Degree | $90,000 | $73,438 |
| Total | $57,310 | $34,393 |
Family Income in Hamilton County
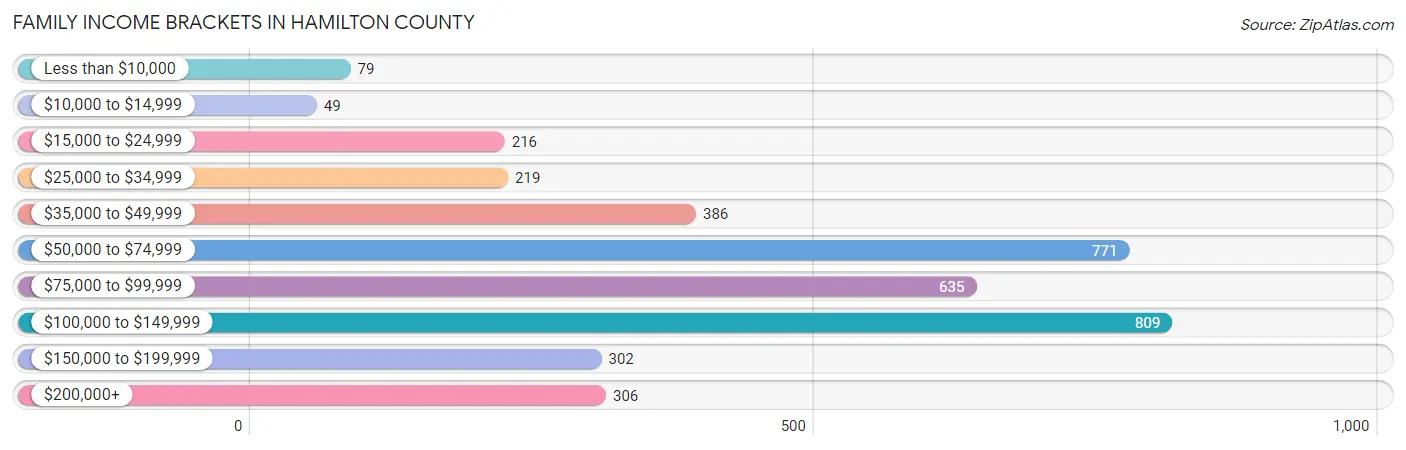
Family Income Brackets in Hamilton County
According to the Hamilton County family income data, there are 809 families falling into the $100,000 to $149,999 income range, which is the most common income bracket and makes up 21.4% of all families. Conversely, the $10,000 to $14,999 income bracket is the least frequent group with only 49 families (1.3%) belonging to this category.
| Income Bracket | # Families | % Families |
| Less than $10,000 | 79 | 2.1% |
| $10,000 to $14,999 | 49 | 1.3% |
| $15,000 to $24,999 | 216 | 5.7% |
| $25,000 to $34,999 | 219 | 5.8% |
| $35,000 to $49,999 | 386 | 10.2% |
| $50,000 to $74,999 | 771 | 20.4% |
| $75,000 to $99,999 | 635 | 16.8% |
| $100,000 to $149,999 | 809 | 21.4% |
| $150,000 to $199,999 | 302 | 8.0% |
| $200,000+ | 306 | 8.1% |
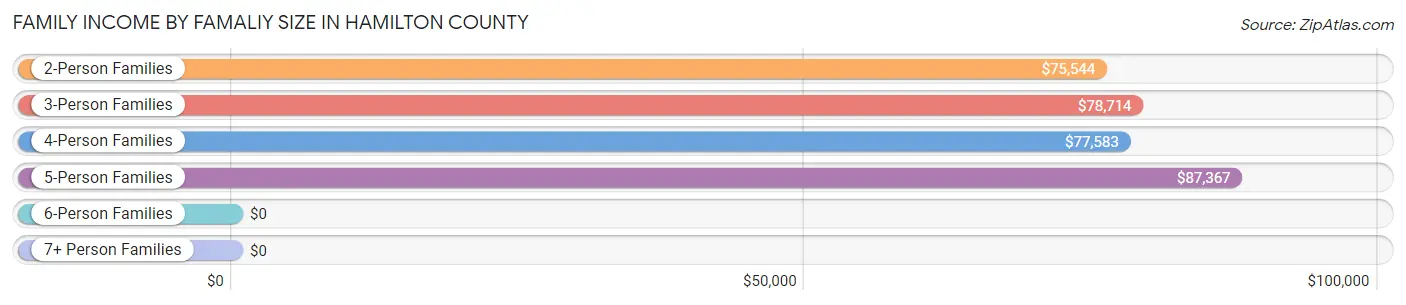
Family Income by Famaliy Size in Hamilton County
5-person families (413 | 10.9%) account for the highest median family income in Hamilton County with $87,367 per family, while 2-person families (1,999 | 52.9%) have the highest median income of $37,772 per family member.
| Income Bracket | # Families | Median Income |
| 2-Person Families | 1,999 (52.9%) | $75,544 |
| 3-Person Families | 740 (19.6%) | $78,714 |
| 4-Person Families | 545 (14.4%) | $77,583 |
| 5-Person Families | 413 (10.9%) | $87,367 |
| 6-Person Families | 66 (1.8%) | $0 |
| 7+ Person Families | 18 (0.5%) | $0 |
| Total | 3,781 (100.0%) | $81,270 |
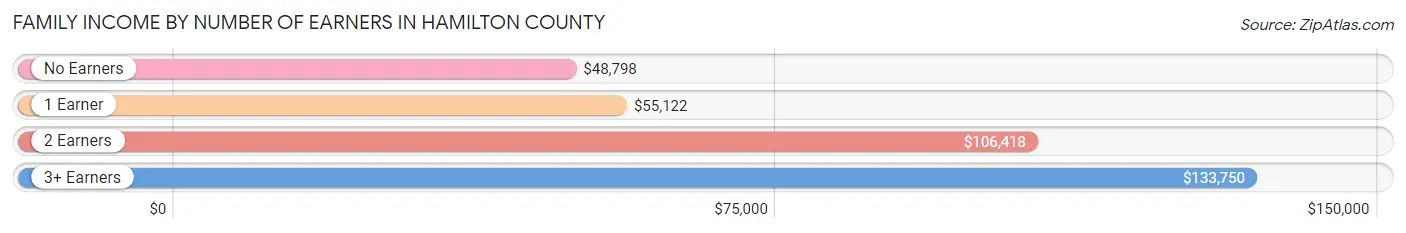
Family Income by Number of Earners in Hamilton County
The median family income in Hamilton County is $81,270, with families comprising 3+ earners (300) having the highest median family income of $133,750, while families with no earners (515) have the lowest median family income of $48,798, accounting for 7.9% and 13.6% of families, respectively.
| Number of Earners | # Families | Median Income |
| No Earners | 515 (13.6%) | $48,798 |
| 1 Earner | 1,094 (28.9%) | $55,122 |
| 2 Earners | 1,872 (49.5%) | $106,418 |
| 3+ Earners | 300 (7.9%) | $133,750 |
| Total | 3,781 (100.0%) | $81,270 |
Household Income in Hamilton County
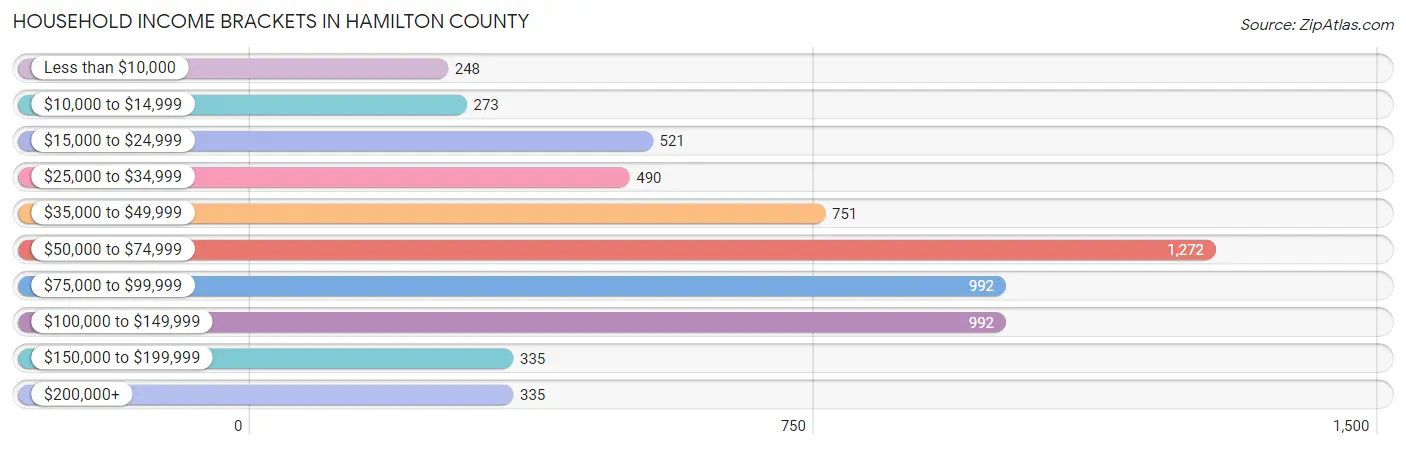
Household Income Brackets in Hamilton County
With 1,272 households falling in the category, the $50,000 to $74,999 income range is the most frequent in Hamilton County, accounting for 20.5% of all households. In contrast, only 248 households (4.0%) fall into the less than $10,000 income bracket, making it the least populous group.
| Income Bracket | # Households | % Households |
| Less than $10,000 | 248 | 4.0% |
| $10,000 to $14,999 | 273 | 4.4% |
| $15,000 to $24,999 | 521 | 8.4% |
| $25,000 to $34,999 | 490 | 7.9% |
| $35,000 to $49,999 | 751 | 12.1% |
| $50,000 to $74,999 | 1,272 | 20.5% |
| $75,000 to $99,999 | 992 | 16.0% |
| $100,000 to $149,999 | 992 | 16.0% |
| $150,000 to $199,999 | 335 | 5.4% |
| $200,000+ | 335 | 5.4% |
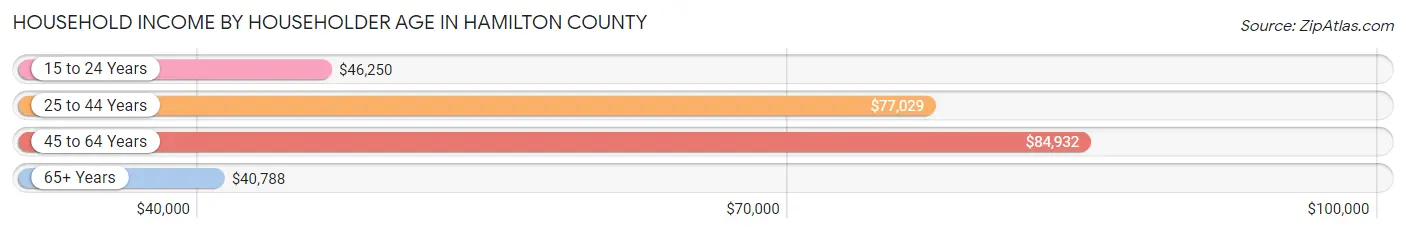
Household Income by Householder Age in Hamilton County
The median household income in Hamilton County is $66,685, with the highest median household income of $84,932 found in the 45 to 64 years age bracket for the primary householder. A total of 2,144 households (34.6%) fall into this category. Meanwhile, the 65+ years age bracket for the primary householder has the lowest median household income of $40,788, with 2,063 households (33.3%) in this group.
| Income Bracket | # Households | Median Income |
| 15 to 24 Years | 224 (3.6%) | $46,250 |
| 25 to 44 Years | 1,772 (28.6%) | $77,029 |
| 45 to 64 Years | 2,144 (34.6%) | $84,932 |
| 65+ Years | 2,063 (33.3%) | $40,788 |
| Total | 6,203 (100.0%) | $66,685 |
Poverty in Hamilton County
Income Below Poverty by Sex and Age in Hamilton County
With 7.1% poverty level for males and 8.5% for females among the residents of Hamilton County, 15 year old males and 15 year old females are the most vulnerable to poverty, with 32 males (28.3%) and 39 females (33.9%) in their respective age groups living below the poverty level.
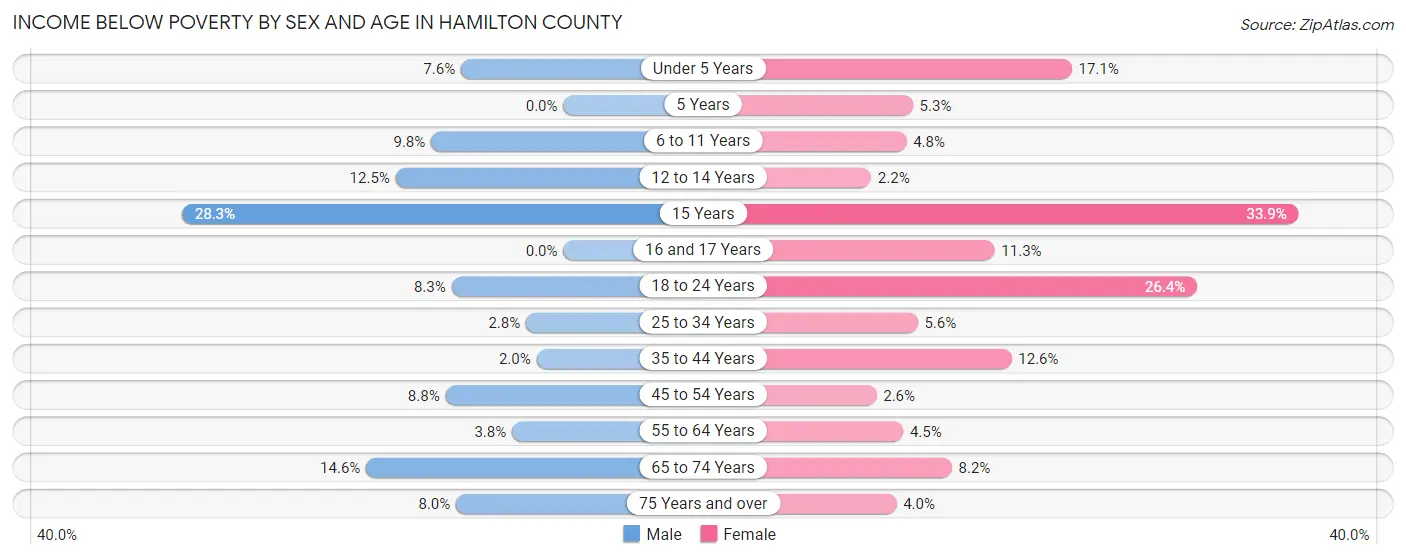
| Age Bracket | Male | Female |
| Under 5 Years | 31 (7.6%) | 65 (17.1%) |
| 5 Years | 0 (0.0%) | 2 (5.3%) |
| 6 to 11 Years | 56 (9.8%) | 29 (4.8%) |
| 12 to 14 Years | 29 (12.4%) | 6 (2.2%) |
| 15 Years | 32 (28.3%) | 39 (33.9%) |
| 16 and 17 Years | 0 (0.0%) | 17 (11.3%) |
| 18 to 24 Years | 44 (8.3%) | 139 (26.4%) |
| 25 to 34 Years | 22 (2.8%) | 46 (5.6%) |
| 35 to 44 Years | 21 (2.0%) | 105 (12.6%) |
| 45 to 54 Years | 73 (8.7%) | 21 (2.6%) |
| 55 to 64 Years | 43 (3.8%) | 49 (4.5%) |
| 65 to 74 Years | 134 (14.6%) | 67 (8.2%) |
| 75 Years and over | 43 (8.0%) | 31 (4.0%) |
| Total | 528 (7.1%) | 616 (8.5%) |
Income Above Poverty by Sex and Age in Hamilton County
According to the poverty statistics in Hamilton County, males aged 5 years and females aged 12 to 14 years are the age groups that are most secure financially, with 100.0% of males and 97.8% of females in these age groups living above the poverty line.
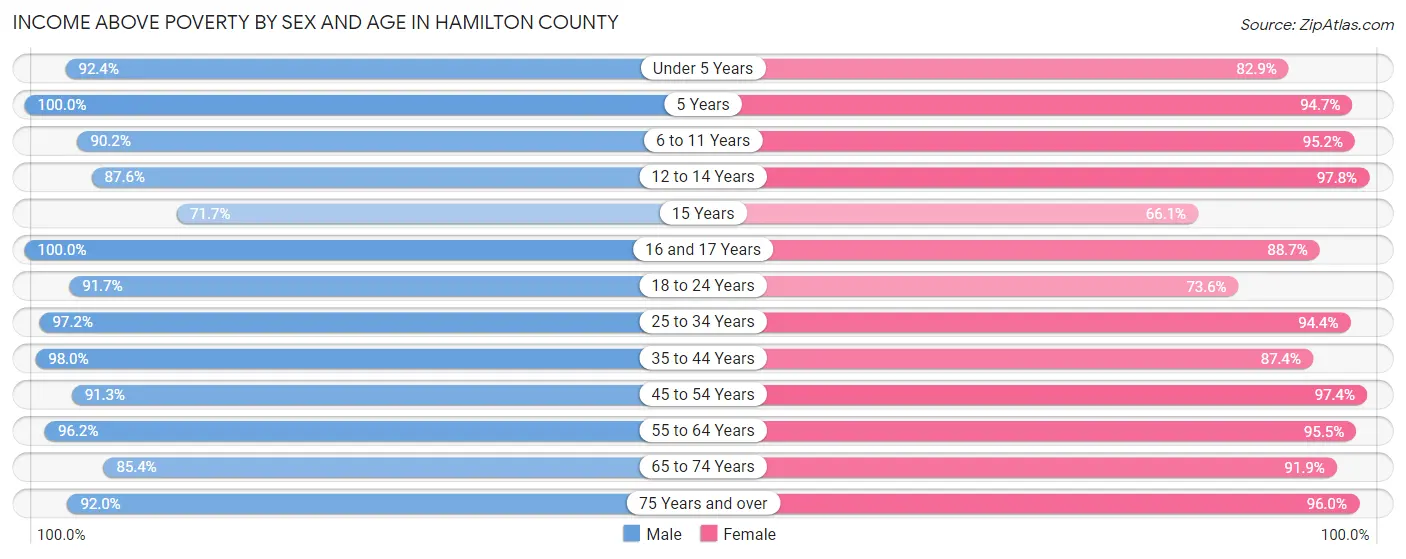
| Age Bracket | Male | Female |
| Under 5 Years | 377 (92.4%) | 316 (82.9%) |
| 5 Years | 153 (100.0%) | 36 (94.7%) |
| 6 to 11 Years | 514 (90.2%) | 578 (95.2%) |
| 12 to 14 Years | 204 (87.5%) | 272 (97.8%) |
| 15 Years | 81 (71.7%) | 76 (66.1%) |
| 16 and 17 Years | 195 (100.0%) | 133 (88.7%) |
| 18 to 24 Years | 486 (91.7%) | 388 (73.6%) |
| 25 to 34 Years | 771 (97.2%) | 772 (94.4%) |
| 35 to 44 Years | 1,032 (98.0%) | 729 (87.4%) |
| 45 to 54 Years | 761 (91.2%) | 799 (97.4%) |
| 55 to 64 Years | 1,086 (96.2%) | 1,030 (95.5%) |
| 65 to 74 Years | 781 (85.4%) | 755 (91.8%) |
| 75 Years and over | 497 (92.0%) | 737 (96.0%) |
| Total | 6,938 (92.9%) | 6,621 (91.5%) |
Income Below Poverty Among Married-Couple Families in Hamilton County
The poverty statistics for married-couple families in Hamilton County show that 2.4% or 71 of the total 3,022 families live below the poverty line. Families with 1 or 2 children have the highest poverty rate of 5.7%, comprising of 48 families. On the other hand, families with 5 or more children have the lowest poverty rate of 0.0%, which includes 0 families.
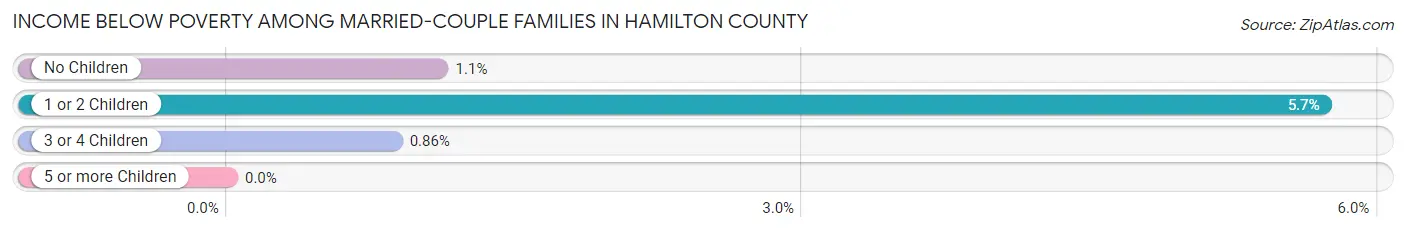
| Children | Above Poverty | Below Poverty |
| No Children | 1,803 (98.9%) | 20 (1.1%) |
| 1 or 2 Children | 793 (94.3%) | 48 (5.7%) |
| 3 or 4 Children | 345 (99.1%) | 3 (0.9%) |
| 5 or more Children | 10 (100.0%) | 0 (0.0%) |
| Total | 2,951 (97.7%) | 71 (2.4%) |
Income Below Poverty Among Single-Parent Households in Hamilton County
According to the poverty data in Hamilton County, 2.2% or 6 single-father households and 34.4% or 166 single-mother households are living below the poverty line. Among single-father households, those with no children have the highest poverty rate, with 2 households (3.2%) experiencing poverty. Likewise, among single-mother households, those with 3 or 4 children have the highest poverty rate, with 50 households (84.8%) falling below the poverty line.
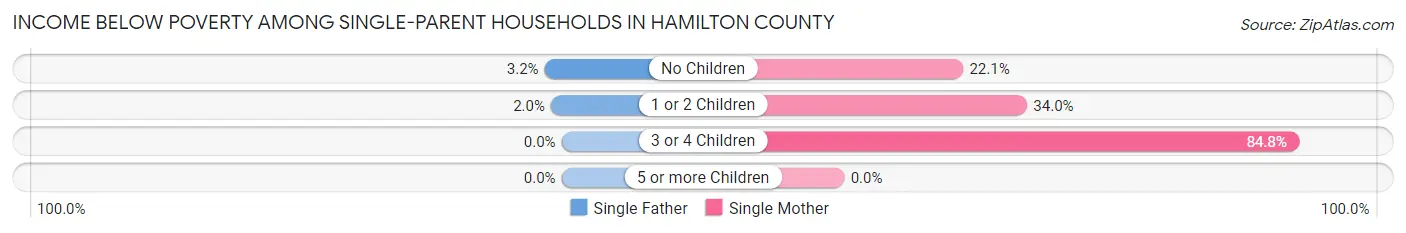
| Children | Single Father | Single Mother |
| No Children | 2 (3.2%) | 52 (22.1%) |
| 1 or 2 Children | 4 (2.0%) | 64 (34.0%) |
| 3 or 4 Children | 0 (0.0%) | 50 (84.8%) |
| 5 or more Children | 0 (0.0%) | 0 (0.0%) |
| Total | 6 (2.2%) | 166 (34.4%) |
Income Below Poverty Among Married-Couple vs Single-Parent Households in Hamilton County
The poverty data for Hamilton County shows that 71 of the married-couple family households (2.4%) and 172 of the single-parent households (22.7%) are living below the poverty level. Within the married-couple family households, those with 1 or 2 children have the highest poverty rate, with 48 households (5.7%) falling below the poverty line. Among the single-parent households, those with 3 or 4 children have the highest poverty rate, with 50 household (76.9%) living below poverty.
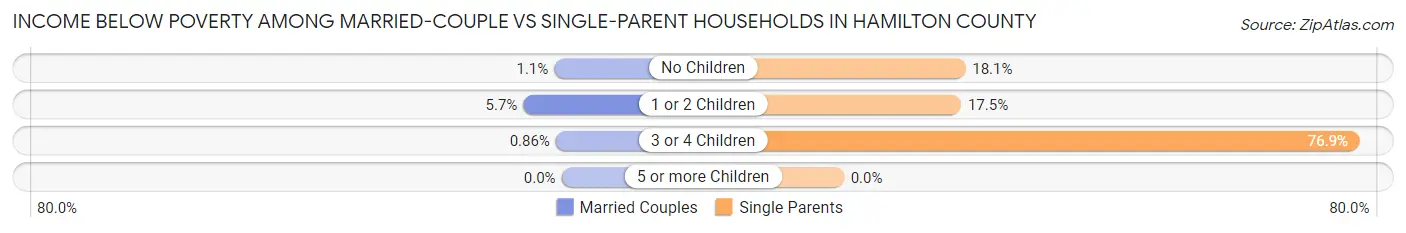
| Children | Married-Couple Families | Single-Parent Households |
| No Children | 20 (1.1%) | 54 (18.1%) |
| 1 or 2 Children | 48 (5.7%) | 68 (17.5%) |
| 3 or 4 Children | 3 (0.9%) | 50 (76.9%) |
| 5 or more Children | 0 (0.0%) | 0 (0.0%) |
| Total | 71 (2.4%) | 172 (22.7%) |
Race in Hamilton County
The most populous races in Hamilton County are White / Caucasian (13,597 | 90.8%), Hispanic or Latino (997 | 6.7%), and Two or more Races (614 | 4.1%).
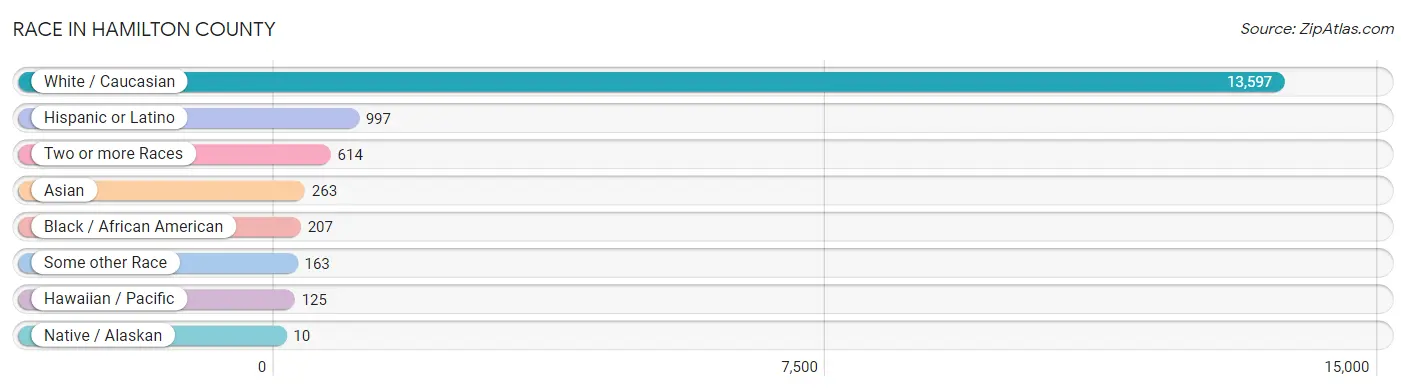
| Race | # Population | % Population |
| Asian | 263 | 1.8% |
| Black / African American | 207 | 1.4% |
| Hawaiian / Pacific | 125 | 0.8% |
| Hispanic or Latino | 997 | 6.7% |
| Native / Alaskan | 10 | 0.1% |
| White / Caucasian | 13,597 | 90.8% |
| Two or more Races | 614 | 4.1% |
| Some other Race | 163 | 1.1% |
| Total | 14,979 | 100.0% |
Ancestry in Hamilton County
The most populous ancestries reported in Hamilton County are German (4,904 | 32.7%), Norwegian (2,039 | 13.6%), Irish (1,368 | 9.1%), English (970 | 6.5%), and Mexican (815 | 5.4%), together accounting for 67.4% of all Hamilton County residents.

| Ancestry | # Population | % Population |
| American | 500 | 3.3% |
| Apache | 3 | 0.0% |
| Arab | 11 | 0.1% |
| Austrian | 2 | 0.0% |
| Belgian | 14 | 0.1% |
| Bhutanese | 3 | 0.0% |
| British | 47 | 0.3% |
| Burmese | 17 | 0.1% |
| Cambodian | 7 | 0.1% |
| Central American | 130 | 0.9% |
| Cherokee | 2 | 0.0% |
| Creek | 78 | 0.5% |
| Czech | 38 | 0.3% |
| Czechoslovakian | 38 | 0.3% |
| Danish | 237 | 1.6% |
| Dutch | 219 | 1.5% |
| English | 970 | 6.5% |
| European | 79 | 0.5% |
| Finnish | 22 | 0.2% |
| French | 372 | 2.5% |
| French Canadian | 9 | 0.1% |
| German | 4,904 | 32.7% |
| Greek | 6 | 0.0% |
| Guatemalan | 61 | 0.4% |
| Hungarian | 18 | 0.1% |
| Indian (Asian) | 35 | 0.2% |
| Irish | 1,368 | 9.1% |
| Italian | 108 | 0.7% |
| Korean | 103 | 0.7% |
| Lithuanian | 4 | 0.0% |
| Malaysian | 181 | 1.2% |
| Mexican | 815 | 5.4% |
| Mexican American Indian | 6 | 0.0% |
| Navajo | 10 | 0.1% |
| Nigerian | 7 | 0.1% |
| Northern European | 1 | 0.0% |
| Norwegian | 2,039 | 13.6% |
| Panamanian | 11 | 0.1% |
| Pennsylvania German | 1 | 0.0% |
| Peruvian | 5 | 0.0% |
| Polish | 84 | 0.6% |
| Portuguese | 18 | 0.1% |
| Puerto Rican | 31 | 0.2% |
| Russian | 19 | 0.1% |
| Salvadoran | 58 | 0.4% |
| Samoan | 45 | 0.3% |
| Scandinavian | 94 | 0.6% |
| Scotch-Irish | 116 | 0.8% |
| Scottish | 247 | 1.7% |
| Sioux | 6 | 0.0% |
| Slovak | 1 | 0.0% |
| South American | 5 | 0.0% |
| Spanish | 1 | 0.0% |
| Subsaharan African | 9 | 0.1% |
| Swedish | 657 | 4.4% |
| Swiss | 47 | 0.3% |
| Welsh | 43 | 0.3% | View All 57 Rows |
Immigrants in Hamilton County
The most numerous immigrant groups reported in Hamilton County came from Latin America (415 | 2.8%), Central America (410 | 2.7%), Mexico (323 | 2.2%), Asia (142 | 0.9%), and South Eastern Asia (105 | 0.7%), together accounting for 9.3% of all Hamilton County residents.
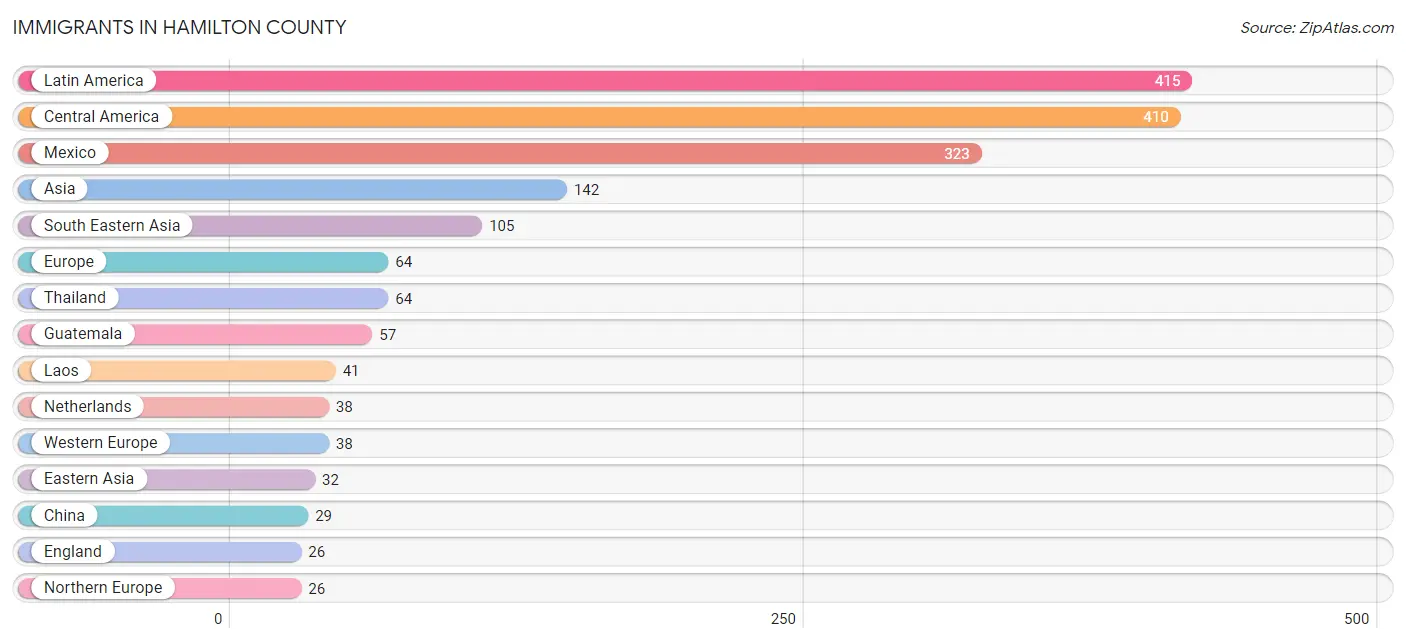
| Immigration Origin | # Population | % Population |
| Africa | 11 | 0.1% |
| Asia | 142 | 0.9% |
| Central America | 410 | 2.7% |
| China | 29 | 0.2% |
| Eastern Asia | 32 | 0.2% |
| El Salvador | 20 | 0.1% |
| England | 26 | 0.2% |
| Europe | 64 | 0.4% |
| Guatemala | 57 | 0.4% |
| Japan | 3 | 0.0% |
| Laos | 41 | 0.3% |
| Latin America | 415 | 2.8% |
| Mexico | 323 | 2.2% |
| Netherlands | 38 | 0.3% |
| Northern Africa | 11 | 0.1% |
| Northern Europe | 26 | 0.2% |
| Pakistan | 5 | 0.0% |
| Panama | 7 | 0.1% |
| Peru | 5 | 0.0% |
| South America | 5 | 0.0% |
| South Central Asia | 5 | 0.0% |
| South Eastern Asia | 105 | 0.7% |
| Thailand | 64 | 0.4% |
| Western Europe | 38 | 0.3% | View All 24 Rows |
Sex and Age in Hamilton County
Sex and Age in Hamilton County
The most populous age groups in Hamilton County are 35 to 39 Years (672 | 8.8%) for men and 55 to 59 Years (660 | 9.0%) for women.
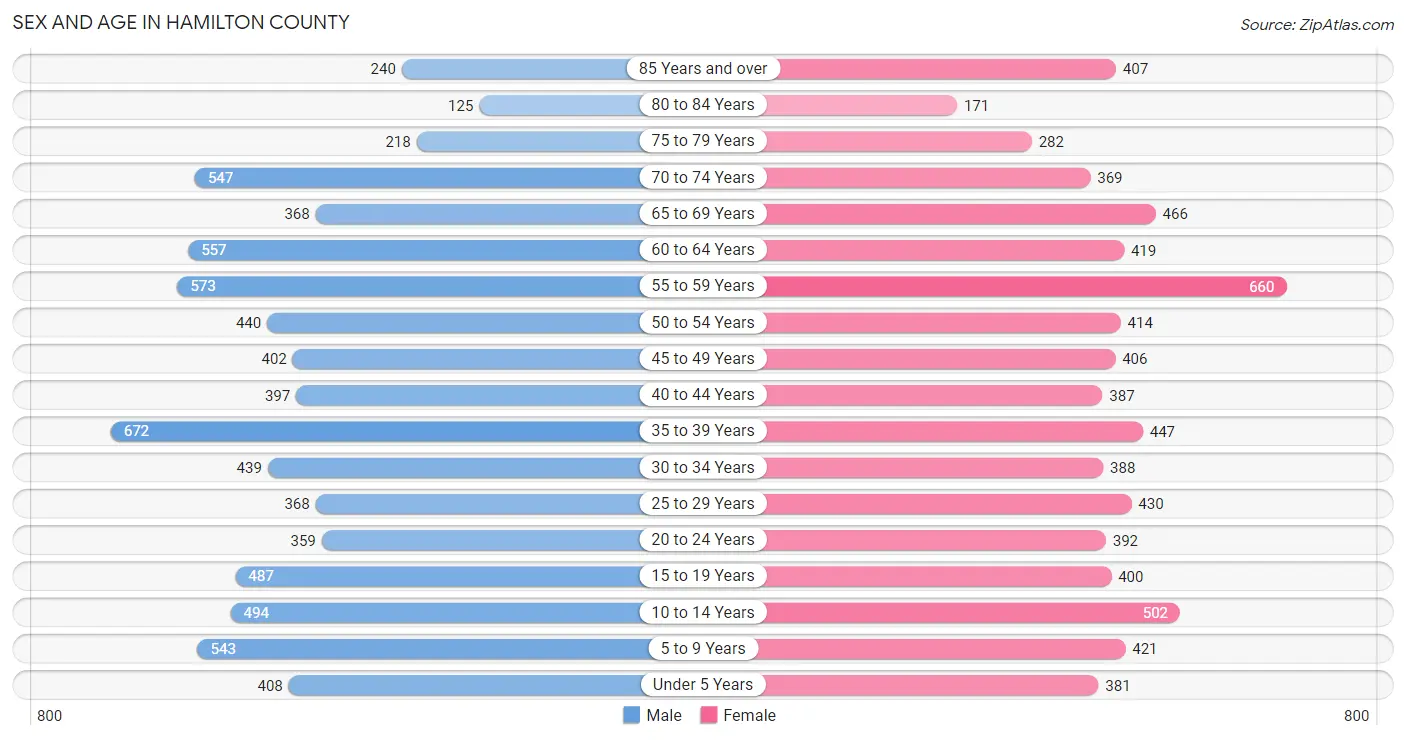
| Age Bracket | Male | Female |
| Under 5 Years | 408 (5.3%) | 381 (5.2%) |
| 5 to 9 Years | 543 (7.1%) | 421 (5.7%) |
| 10 to 14 Years | 494 (6.5%) | 502 (6.8%) |
| 15 to 19 Years | 487 (6.4%) | 400 (5.4%) |
| 20 to 24 Years | 359 (4.7%) | 392 (5.3%) |
| 25 to 29 Years | 368 (4.8%) | 430 (5.9%) |
| 30 to 34 Years | 439 (5.8%) | 388 (5.3%) |
| 35 to 39 Years | 672 (8.8%) | 447 (6.1%) |
| 40 to 44 Years | 397 (5.2%) | 387 (5.3%) |
| 45 to 49 Years | 402 (5.3%) | 406 (5.5%) |
| 50 to 54 Years | 440 (5.8%) | 414 (5.6%) |
| 55 to 59 Years | 573 (7.5%) | 660 (9.0%) |
| 60 to 64 Years | 557 (7.3%) | 419 (5.7%) |
| 65 to 69 Years | 368 (4.8%) | 466 (6.4%) |
| 70 to 74 Years | 547 (7.2%) | 369 (5.0%) |
| 75 to 79 Years | 218 (2.9%) | 282 (3.8%) |
| 80 to 84 Years | 125 (1.6%) | 171 (2.3%) |
| 85 Years and over | 240 (3.1%) | 407 (5.5%) |
| Total | 7,637 (100.0%) | 7,342 (100.0%) |
Families and Households in Hamilton County
Median Family Size in Hamilton County
The median family size in Hamilton County is 3.05 persons per family, with married-couple families (3,022 | 79.9%) accounting for the largest median family size of 3.09 persons per family. On the other hand, single male/father families (277 | 7.3%) represent the smallest median family size with 2.77 persons per family.
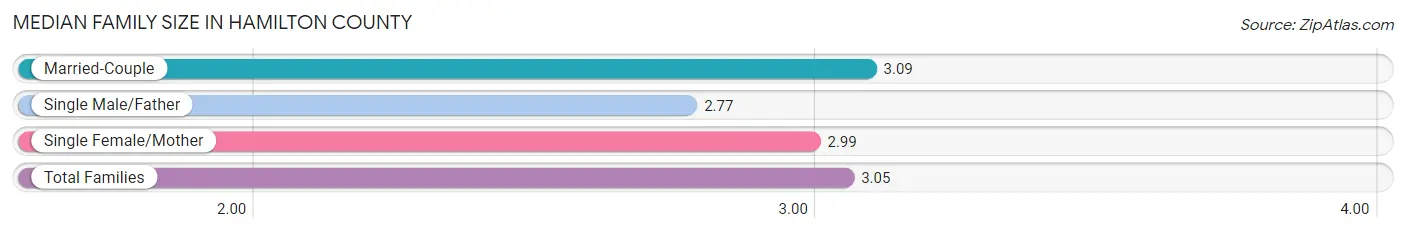
| Family Type | # Families | Family Size |
| Married-Couple | 3,022 (79.9%) | 3.09 |
| Single Male/Father | 277 (7.3%) | 2.77 |
| Single Female/Mother | 482 (12.8%) | 2.99 |
| Total Families | 3,781 (100.0%) | 3.05 |
Median Household Size in Hamilton County
The median household size in Hamilton County is 2.38 persons per household, with single male/father households (277 | 4.5%) accounting for the largest median household size of 3.61 persons per household. non-family households (2,422 | 39.1%) represent the smallest median household size with 1.19 persons per household.
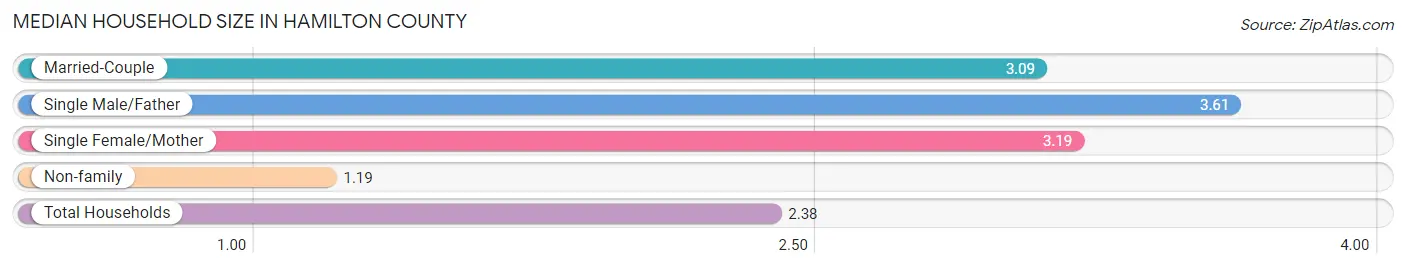
| Household Type | # Households | Household Size |
| Married-Couple | 3,022 (48.7%) | 3.09 |
| Single Male/Father | 277 (4.5%) | 3.61 |
| Single Female/Mother | 482 (7.8%) | 3.19 |
| Non-family | 2,422 (39.1%) | 1.19 |
| Total Households | 6,203 (100.0%) | 2.38 |
Household Size by Marriage Status in Hamilton County
Out of a total of 6,203 households in Hamilton County, 3,781 (61.0%) are family households, while 2,422 (39.1%) are nonfamily households. The most numerous type of family households are 2-person households, comprising 1,851, and the most common type of nonfamily households are 1-person households, comprising 2,052.
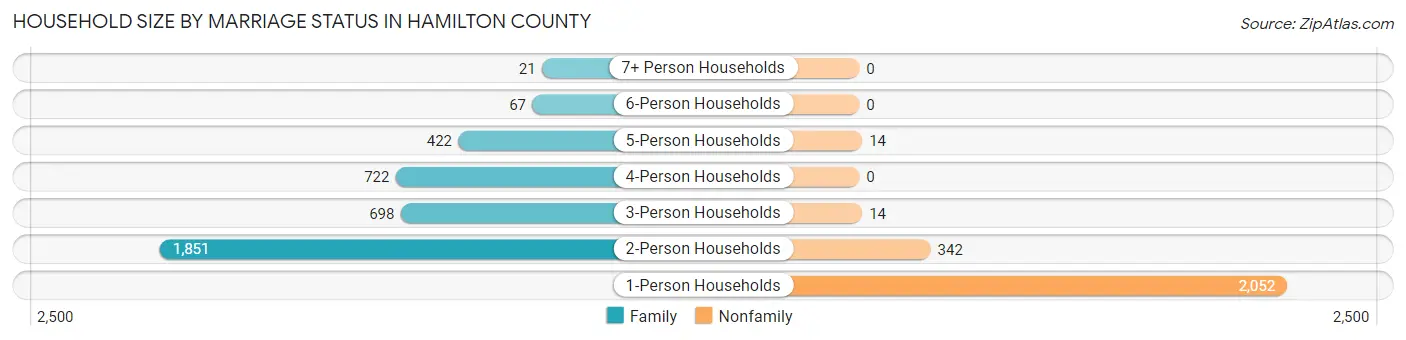
| Household Size | Family Households | Nonfamily Households |
| 1-Person Households | - | 2,052 (33.1%) |
| 2-Person Households | 1,851 (29.8%) | 342 (5.5%) |
| 3-Person Households | 698 (11.3%) | 14 (0.2%) |
| 4-Person Households | 722 (11.6%) | 0 (0.0%) |
| 5-Person Households | 422 (6.8%) | 14 (0.2%) |
| 6-Person Households | 67 (1.1%) | 0 (0.0%) |
| 7+ Person Households | 21 (0.3%) | 0 (0.0%) |
| Total | 3,781 (61.0%) | 2,422 (39.1%) |
Female Fertility in Hamilton County
Fertility by Age in Hamilton County
Average fertility rate in Hamilton County is 82.0 births per 1,000 women. Women in the age bracket of 20 to 34 years have the highest fertility rate with 198.0 births per 1,000 women. Women in the age bracket of 20 to 34 years acount for 99.2% of all women with births.
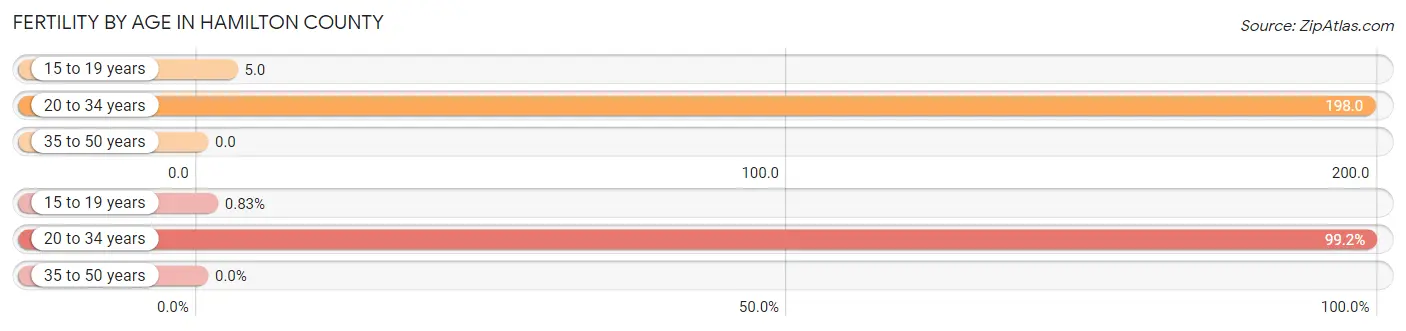
| Age Bracket | Women with Births | Births / 1,000 Women |
| 15 to 19 years | 2 (0.8%) | 5.0 |
| 20 to 34 years | 240 (99.2%) | 198.0 |
| 35 to 50 years | 0 (0.0%) | 0.0 |
| Total | 242 (100.0%) | 82.0 |
Fertility by Age by Marriage Status in Hamilton County
75.6% of women with births (242) in Hamilton County are married. The highest percentage of unmarried women with births falls into 15 to 19 years age bracket with 100.0% of them unmarried at the time of birth, while the lowest percentage of unmarried women with births belong to 20 to 34 years age bracket with 23.8% of them unmarried.
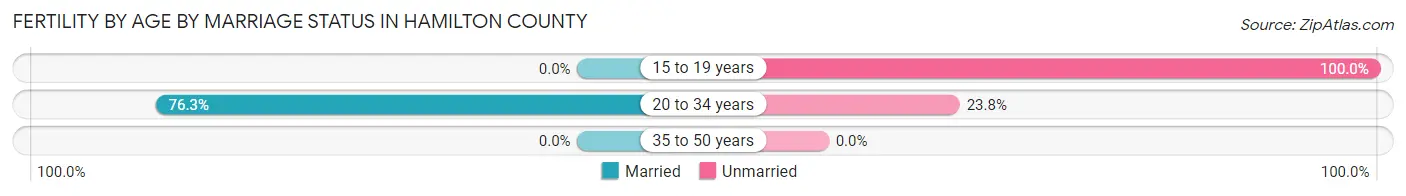
| Age Bracket | Married | Unmarried |
| 15 to 19 years | 0 (0.0%) | 2 (100.0%) |
| 20 to 34 years | 183 (76.2%) | 57 (23.7%) |
| 35 to 50 years | 0 (0.0%) | 0 (0.0%) |
| Total | 183 (75.6%) | 59 (24.4%) |
Fertility by Education in Hamilton County
Average fertility rate in Hamilton County is 82.0 births per 1,000 women. Women with the education attainment of bachelor's degree have the highest fertility rate of 136.0 births per 1,000 women, while women with the education attainment of less than high school have the lowest fertility at 51.0 births per 1,000 women. Women with the education attainment of college or associate's degree represent 35.1% of all women with births.
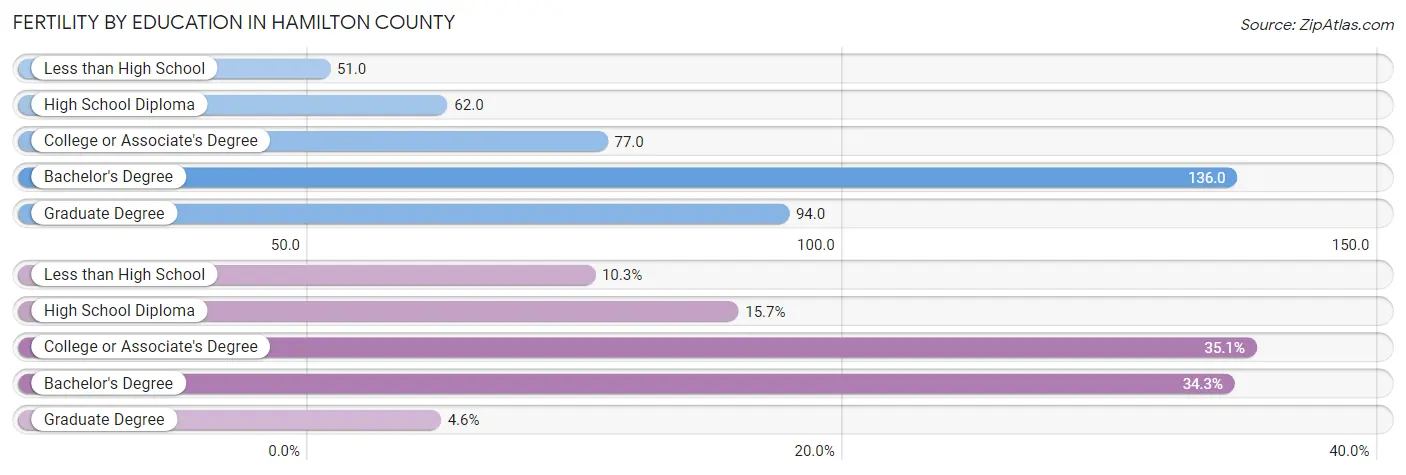
| Educational Attainment | Women with Births | Births / 1,000 Women |
| Less than High School | 25 (10.3%) | 51.0 |
| High School Diploma | 38 (15.7%) | 62.0 |
| College or Associate's Degree | 85 (35.1%) | 77.0 |
| Bachelor's Degree | 83 (34.3%) | 136.0 |
| Graduate Degree | 11 (4.5%) | 94.0 |
| Total | 242 (100.0%) | 82.0 |
Fertility by Education by Marriage Status in Hamilton County
24.4% of women with births in Hamilton County are unmarried. Women with the educational attainment of graduate degree are most likely to be married with 100.0% of them married at childbirth, while women with the educational attainment of high school diploma are least likely to be married with 55.3% of them unmarried at childbirth.
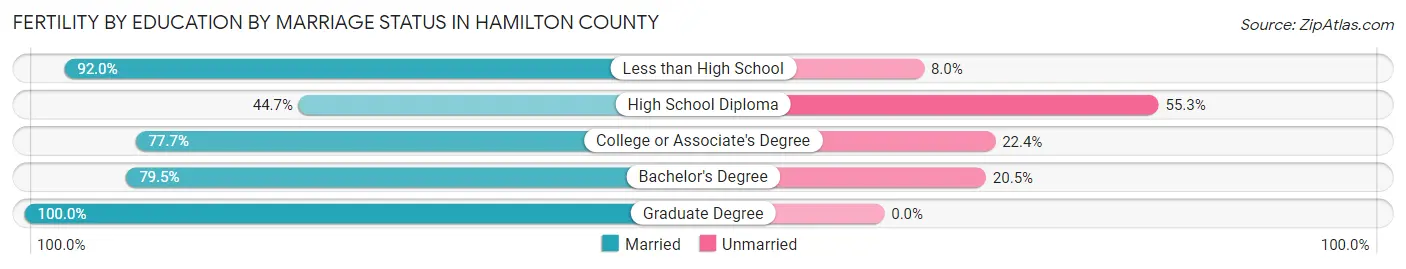
| Educational Attainment | Married | Unmarried |
| Less than High School | 23 (92.0%) | 2 (8.0%) |
| High School Diploma | 17 (44.7%) | 21 (55.3%) |
| College or Associate's Degree | 66 (77.6%) | 19 (22.4%) |
| Bachelor's Degree | 66 (79.5%) | 17 (20.5%) |
| Graduate Degree | 11 (100.0%) | 0 (0.0%) |
| Total | 183 (75.6%) | 59 (24.4%) |
Employment Characteristics in Hamilton County
Employment by Class of Employer in Hamilton County
Among the 7,201 employed individuals in Hamilton County, private company employees (4,889 | 67.9%), local government employees (745 | 10.3%), and self-employed (not incorporated) (559 | 7.8%) make up the most common classes of employment.
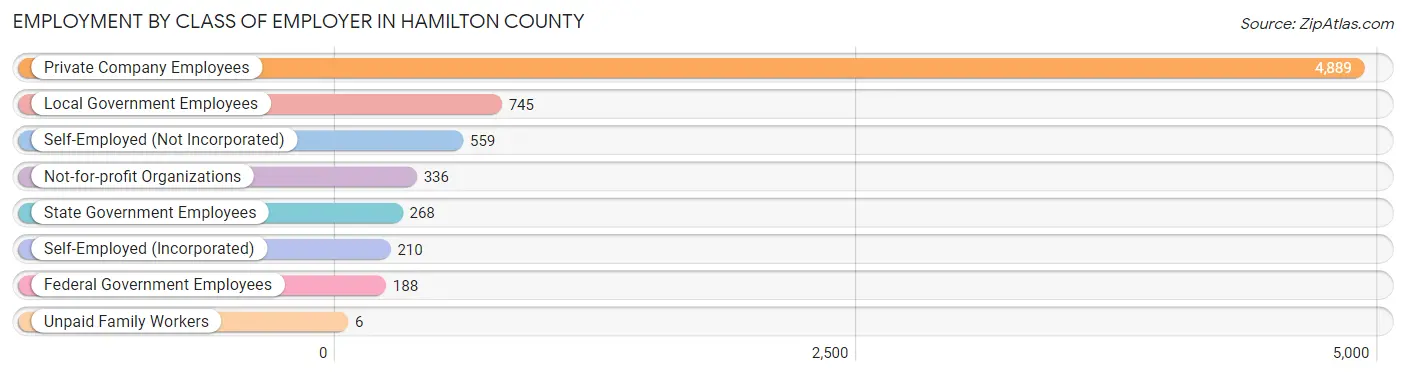
| Employer Class | # Employees | % Employees |
| Private Company Employees | 4,889 | 67.9% |
| Self-Employed (Incorporated) | 210 | 2.9% |
| Self-Employed (Not Incorporated) | 559 | 7.8% |
| Not-for-profit Organizations | 336 | 4.7% |
| Local Government Employees | 745 | 10.3% |
| State Government Employees | 268 | 3.7% |
| Federal Government Employees | 188 | 2.6% |
| Unpaid Family Workers | 6 | 0.1% |
| Total | 7,201 | 100.0% |
Employment Status by Age in Hamilton County
According to the labor force statistics for Hamilton County, out of the total population over 16 years of age (12,002), 63.3% or 7,597 individuals are in the labor force, with 4.0% or 304 of them unemployed. The age group with the highest labor force participation rate is 30 to 34 years, with 93.0% or 769 individuals in the labor force. Within the labor force, the 16 to 19 years age range has the highest percentage of unemployed individuals, with 11.9% or 37 of them being unemployed.
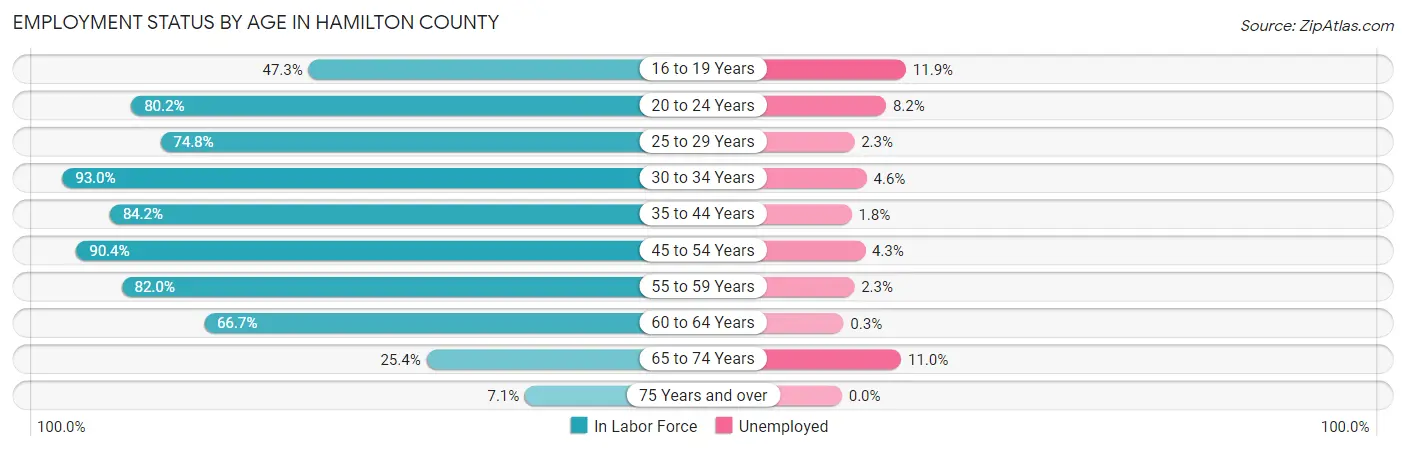
| Age Bracket | In Labor Force | Unemployed |
| 16 to 19 Years | 312 (47.3%) | 37 (11.9%) |
| 20 to 24 Years | 602 (80.2%) | 49 (8.2%) |
| 25 to 29 Years | 597 (74.8%) | 14 (2.3%) |
| 30 to 34 Years | 769 (93.0%) | 35 (4.6%) |
| 35 to 44 Years | 1,602 (84.2%) | 29 (1.8%) |
| 45 to 54 Years | 1,502 (90.4%) | 65 (4.3%) |
| 55 to 59 Years | 1,011 (82.0%) | 23 (2.3%) |
| 60 to 64 Years | 651 (66.7%) | 2 (0.3%) |
| 65 to 74 Years | 444 (25.4%) | 49 (11.0%) |
| 75 Years and over | 102 (7.1%) | 0 (0.0%) |
| Total | 7,597 (63.3%) | 304 (4.0%) |
Employment Status by Educational Attainment in Hamilton County
According to labor force statistics for Hamilton County, 82.9% of individuals (6,134) out of the total population between 25 and 64 years of age (7,399) are in the labor force, with 2.7% or 166 of them being unemployed. The group with the highest labor force participation rate are those with the educational attainment of bachelor's degree or higher, with 90.4% or 1,521 individuals in the labor force. Within the labor force, individuals with less than high school education have the highest percentage of unemployment, with 9.3% or 23 of them being unemployed.
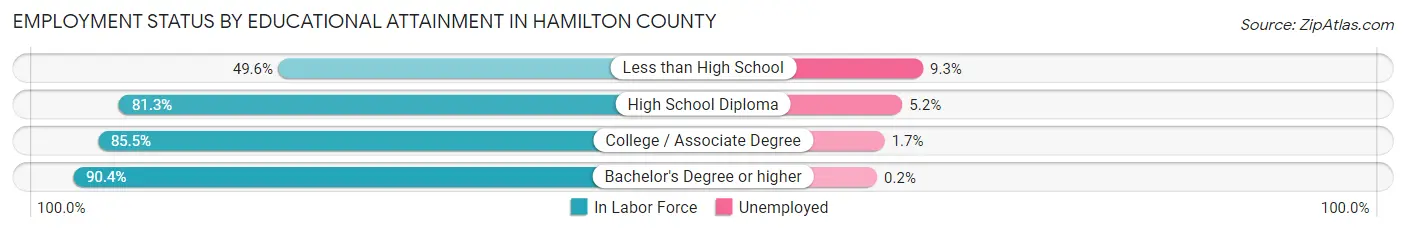
| Educational Attainment | In Labor Force | Unemployed |
| Less than High School | 246 (49.6%) | 46 (9.3%) |
| High School Diploma | 1,884 (81.3%) | 120 (5.2%) |
| College / Associate Degree | 2,482 (85.5%) | 49 (1.7%) |
| Bachelor's Degree or higher | 1,521 (90.4%) | 3 (0.2%) |
| Total | 6,134 (82.9%) | 200 (2.7%) |
Employment Occupations by Sex in Hamilton County
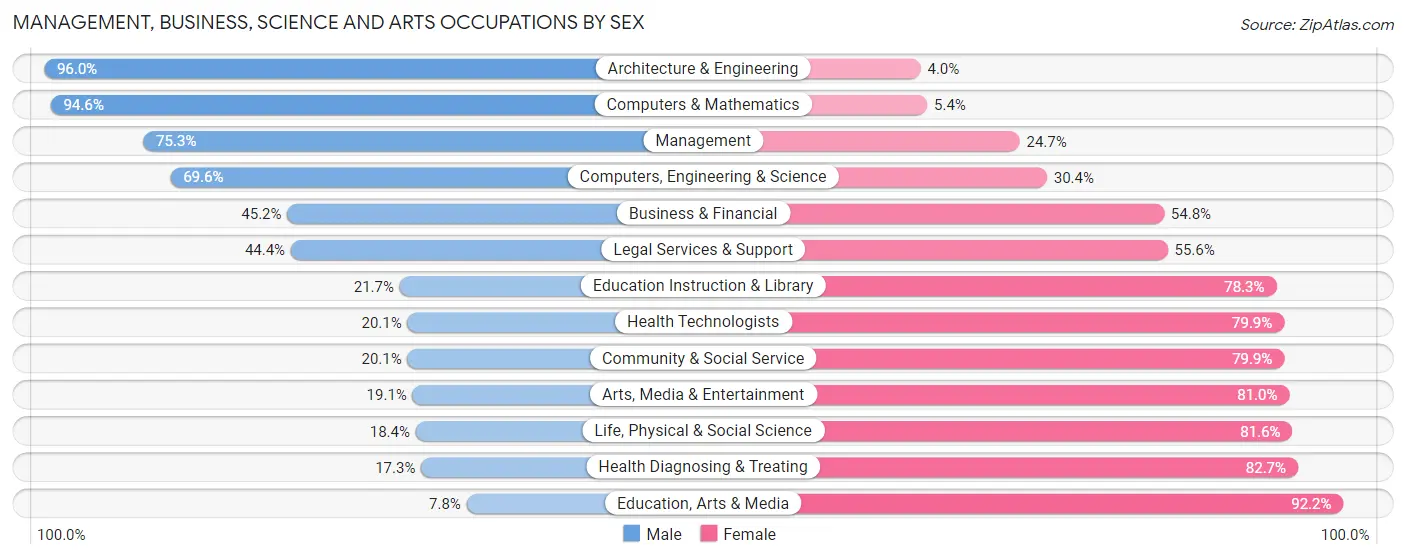
Management, Business, Science and Arts Occupations
The most common Management, Business, Science and Arts occupations in Hamilton County are Management (753 | 10.4%), Community & Social Service (696 | 9.6%), Education Instruction & Library (483 | 6.7%), Health Diagnosing & Treating (394 | 5.4%), and Health Technologists (323 | 4.4%).
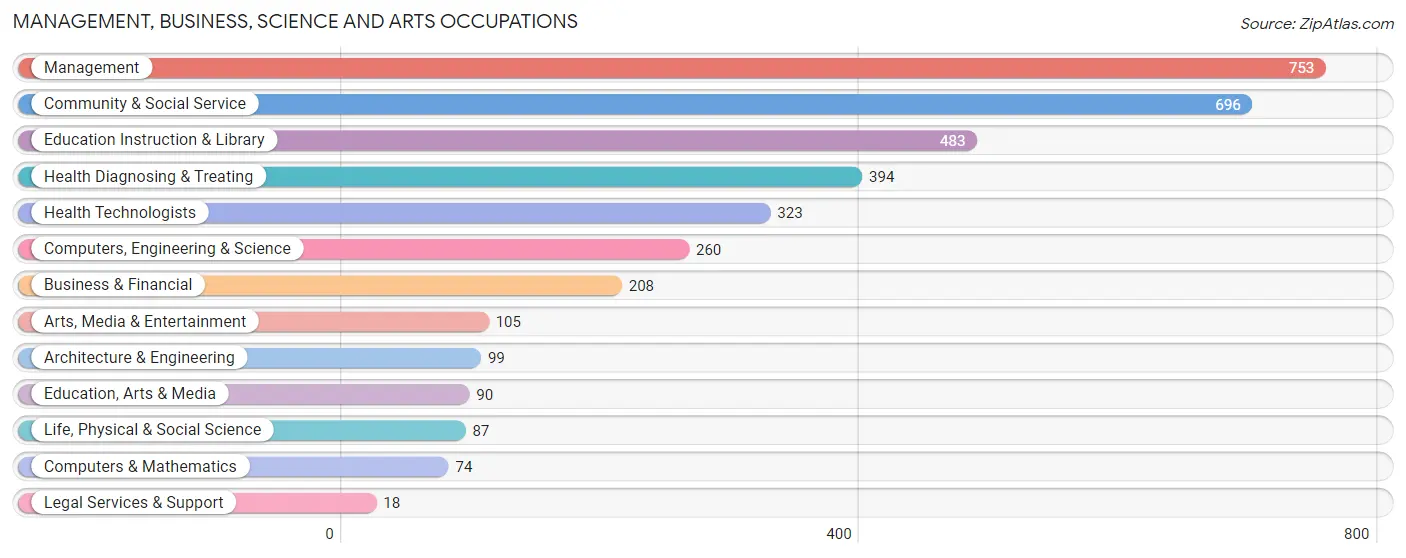
Management, Business, Science and Arts Occupations by Sex
Within the Management, Business, Science and Arts occupations in Hamilton County, the most male-oriented occupations are Architecture & Engineering (96.0%), Computers & Mathematics (94.6%), and Management (75.3%), while the most female-oriented occupations are Education, Arts & Media (92.2%), Health Diagnosing & Treating (82.7%), and Life, Physical & Social Science (81.6%).
| Occupation | Male | Female |
| Management | 567 (75.3%) | 186 (24.7%) |
| Business & Financial | 94 (45.2%) | 114 (54.8%) |
| Computers, Engineering & Science | 181 (69.6%) | 79 (30.4%) |
| Computers & Mathematics | 70 (94.6%) | 4 (5.4%) |
| Architecture & Engineering | 95 (96.0%) | 4 (4.0%) |
| Life, Physical & Social Science | 16 (18.4%) | 71 (81.6%) |
| Community & Social Service | 140 (20.1%) | 556 (79.9%) |
| Education, Arts & Media | 7 (7.8%) | 83 (92.2%) |
| Legal Services & Support | 8 (44.4%) | 10 (55.6%) |
| Education Instruction & Library | 105 (21.7%) | 378 (78.3%) |
| Arts, Media & Entertainment | 20 (19.1%) | 85 (80.9%) |
| Health Diagnosing & Treating | 68 (17.3%) | 326 (82.7%) |
| Health Technologists | 65 (20.1%) | 258 (79.9%) |
| Total (Category) | 1,050 (45.4%) | 1,261 (54.6%) |
| Total (Overall) | 3,949 (54.4%) | 3,307 (45.6%) |
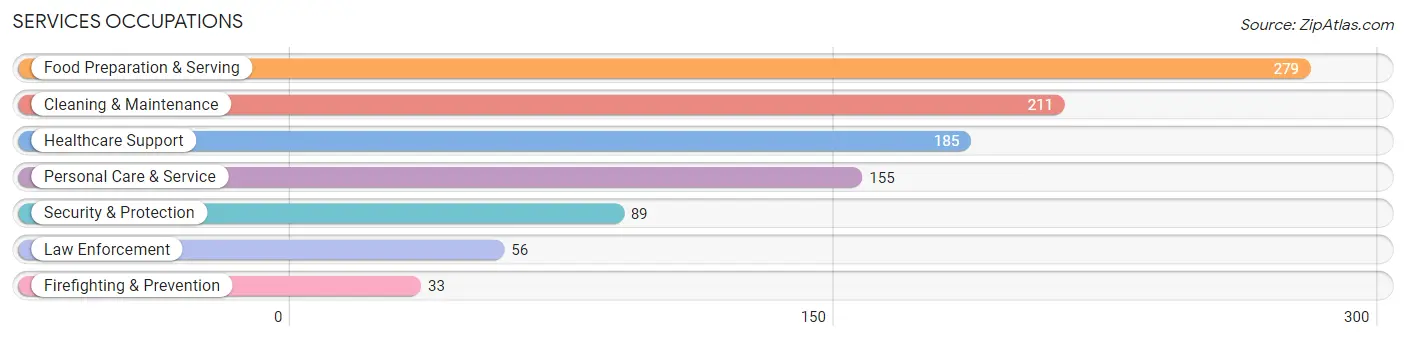
Services Occupations
The most common Services occupations in Hamilton County are Food Preparation & Serving (279 | 3.8%), Cleaning & Maintenance (211 | 2.9%), Healthcare Support (185 | 2.5%), Personal Care & Service (155 | 2.1%), and Security & Protection (89 | 1.2%).
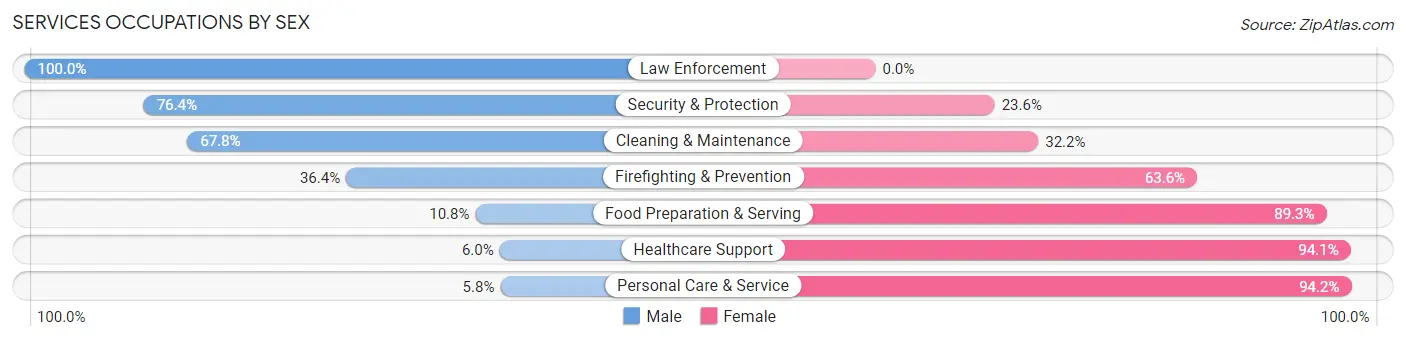
Services Occupations by Sex
Within the Services occupations in Hamilton County, the most male-oriented occupations are Law Enforcement (100.0%), Security & Protection (76.4%), and Cleaning & Maintenance (67.8%), while the most female-oriented occupations are Personal Care & Service (94.2%), Healthcare Support (94.1%), and Food Preparation & Serving (89.2%).
| Occupation | Male | Female |
| Healthcare Support | 11 (5.9%) | 174 (94.1%) |
| Security & Protection | 68 (76.4%) | 21 (23.6%) |
| Firefighting & Prevention | 12 (36.4%) | 21 (63.6%) |
| Law Enforcement | 56 (100.0%) | 0 (0.0%) |
| Food Preparation & Serving | 30 (10.7%) | 249 (89.2%) |
| Cleaning & Maintenance | 143 (67.8%) | 68 (32.2%) |
| Personal Care & Service | 9 (5.8%) | 146 (94.2%) |
| Total (Category) | 261 (28.4%) | 658 (71.6%) |
| Total (Overall) | 3,949 (54.4%) | 3,307 (45.6%) |
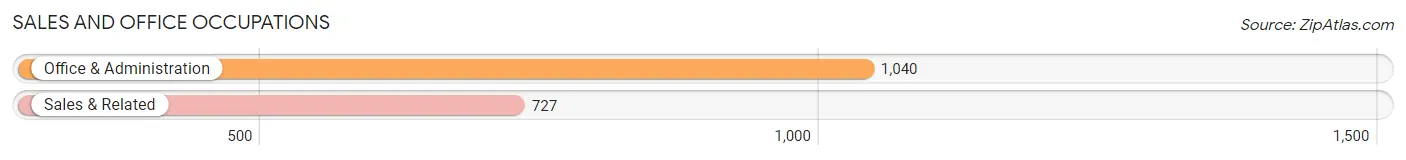
Sales and Office Occupations
The most common Sales and Office occupations in Hamilton County are Office & Administration (1,040 | 14.3%), and Sales & Related (727 | 10.0%).
Sales and Office Occupations by Sex
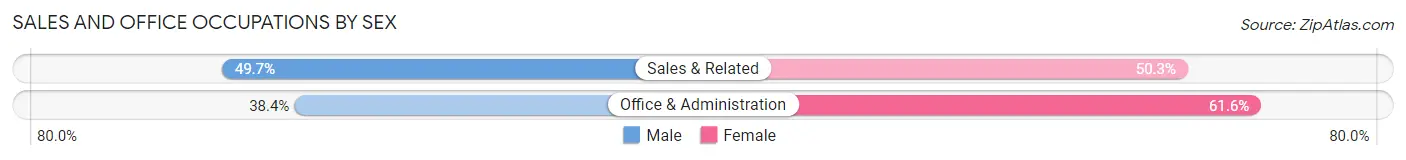
| Occupation | Male | Female |
| Sales & Related | 361 (49.7%) | 366 (50.3%) |
| Office & Administration | 399 (38.4%) | 641 (61.6%) |
| Total (Category) | 760 (43.0%) | 1,007 (57.0%) |
| Total (Overall) | 3,949 (54.4%) | 3,307 (45.6%) |
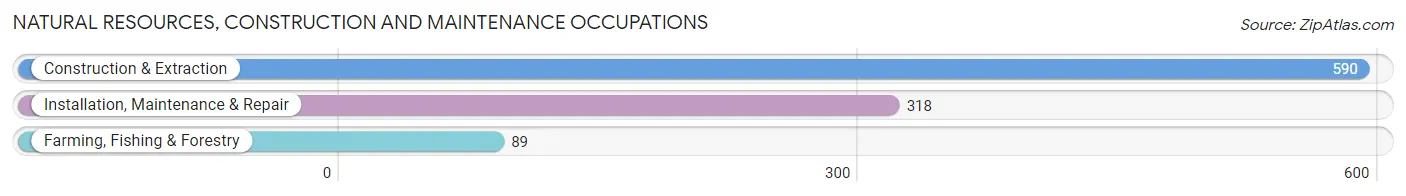
Natural Resources, Construction and Maintenance Occupations
The most common Natural Resources, Construction and Maintenance occupations in Hamilton County are Construction & Extraction (590 | 8.1%), Installation, Maintenance & Repair (318 | 4.4%), and Farming, Fishing & Forestry (89 | 1.2%).
Natural Resources, Construction and Maintenance Occupations by Sex
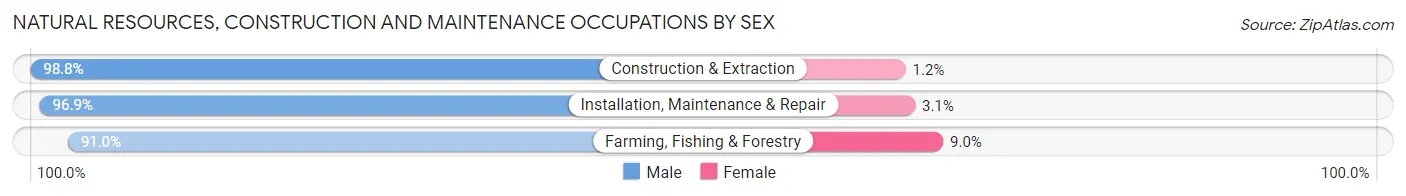
| Occupation | Male | Female |
| Farming, Fishing & Forestry | 81 (91.0%) | 8 (9.0%) |
| Construction & Extraction | 583 (98.8%) | 7 (1.2%) |
| Installation, Maintenance & Repair | 308 (96.9%) | 10 (3.1%) |
| Total (Category) | 972 (97.5%) | 25 (2.5%) |
| Total (Overall) | 3,949 (54.4%) | 3,307 (45.6%) |
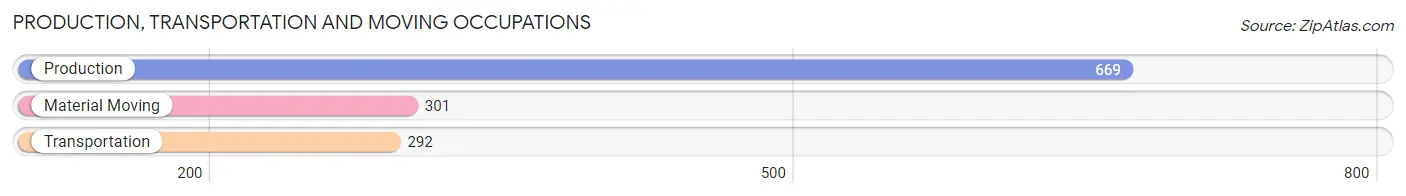
Production, Transportation and Moving Occupations
The most common Production, Transportation and Moving occupations in Hamilton County are Production (669 | 9.2%), Material Moving (301 | 4.2%), and Transportation (292 | 4.0%).
Production, Transportation and Moving Occupations by Sex
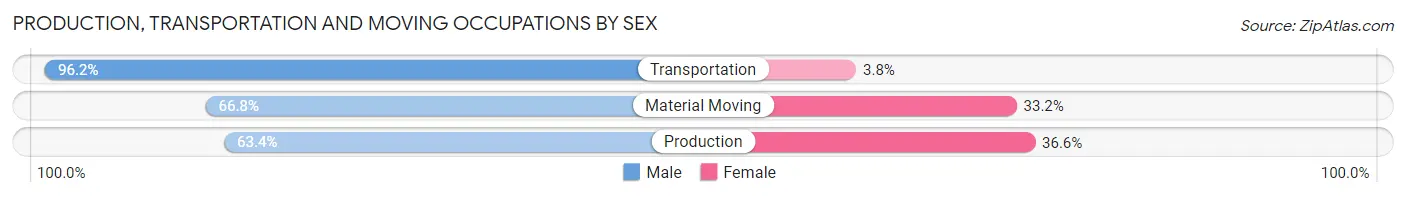
| Occupation | Male | Female |
| Production | 424 (63.4%) | 245 (36.6%) |
| Transportation | 281 (96.2%) | 11 (3.8%) |
| Material Moving | 201 (66.8%) | 100 (33.2%) |
| Total (Category) | 906 (71.8%) | 356 (28.2%) |
| Total (Overall) | 3,949 (54.4%) | 3,307 (45.6%) |
Employment Industries by Sex in Hamilton County
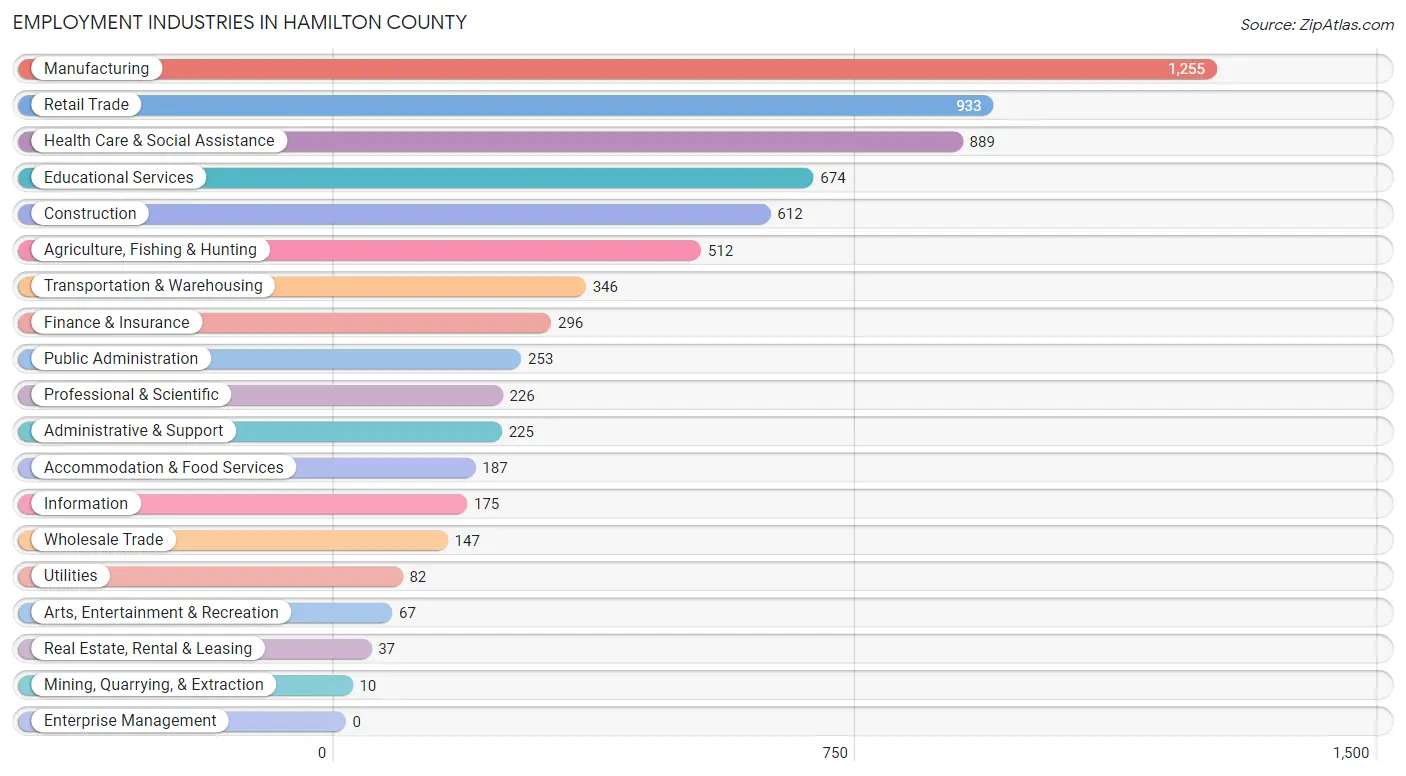
Employment Industries in Hamilton County
The major employment industries in Hamilton County include Manufacturing (1,255 | 17.3%), Retail Trade (933 | 12.9%), Health Care & Social Assistance (889 | 12.2%), Educational Services (674 | 9.3%), and Construction (612 | 8.4%).
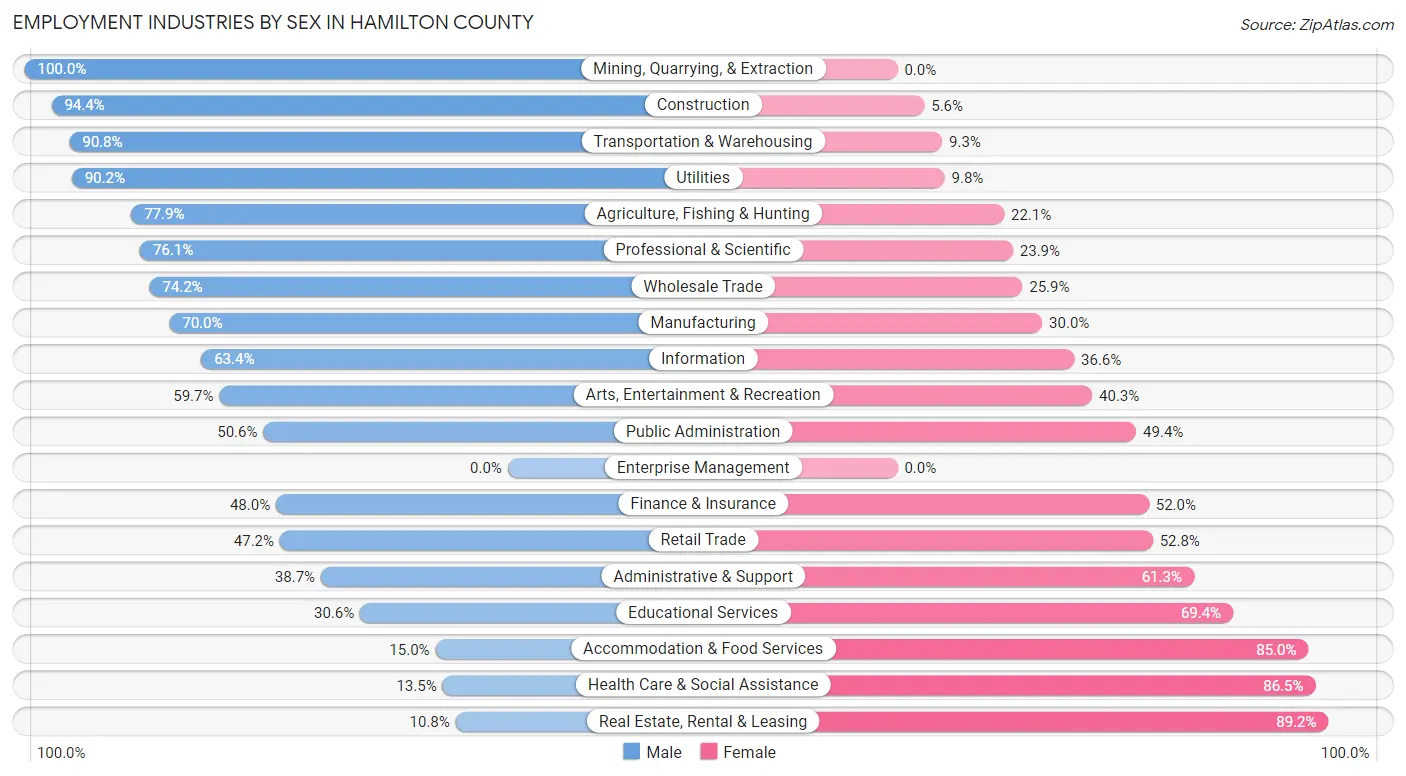
Employment Industries by Sex in Hamilton County
The Hamilton County industries that see more men than women are Mining, Quarrying, & Extraction (100.0%), Construction (94.4%), and Transportation & Warehousing (90.7%), whereas the industries that tend to have a higher number of women are Real Estate, Rental & Leasing (89.2%), Health Care & Social Assistance (86.5%), and Accommodation & Food Services (85.0%).
| Industry | Male | Female |
| Agriculture, Fishing & Hunting | 399 (77.9%) | 113 (22.1%) |
| Mining, Quarrying, & Extraction | 10 (100.0%) | 0 (0.0%) |
| Construction | 578 (94.4%) | 34 (5.6%) |
| Manufacturing | 879 (70.0%) | 376 (30.0%) |
| Wholesale Trade | 109 (74.2%) | 38 (25.9%) |
| Retail Trade | 440 (47.2%) | 493 (52.8%) |
| Transportation & Warehousing | 314 (90.7%) | 32 (9.2%) |
| Utilities | 74 (90.2%) | 8 (9.8%) |
| Information | 111 (63.4%) | 64 (36.6%) |
| Finance & Insurance | 142 (48.0%) | 154 (52.0%) |
| Real Estate, Rental & Leasing | 4 (10.8%) | 33 (89.2%) |
| Professional & Scientific | 172 (76.1%) | 54 (23.9%) |
| Enterprise Management | 0 (0.0%) | 0 (0.0%) |
| Administrative & Support | 87 (38.7%) | 138 (61.3%) |
| Educational Services | 206 (30.6%) | 468 (69.4%) |
| Health Care & Social Assistance | 120 (13.5%) | 769 (86.5%) |
| Arts, Entertainment & Recreation | 40 (59.7%) | 27 (40.3%) |
| Accommodation & Food Services | 28 (15.0%) | 159 (85.0%) |
| Public Administration | 128 (50.6%) | 125 (49.4%) |
| Total | 3,949 (54.4%) | 3,307 (45.6%) |
Education in Hamilton County
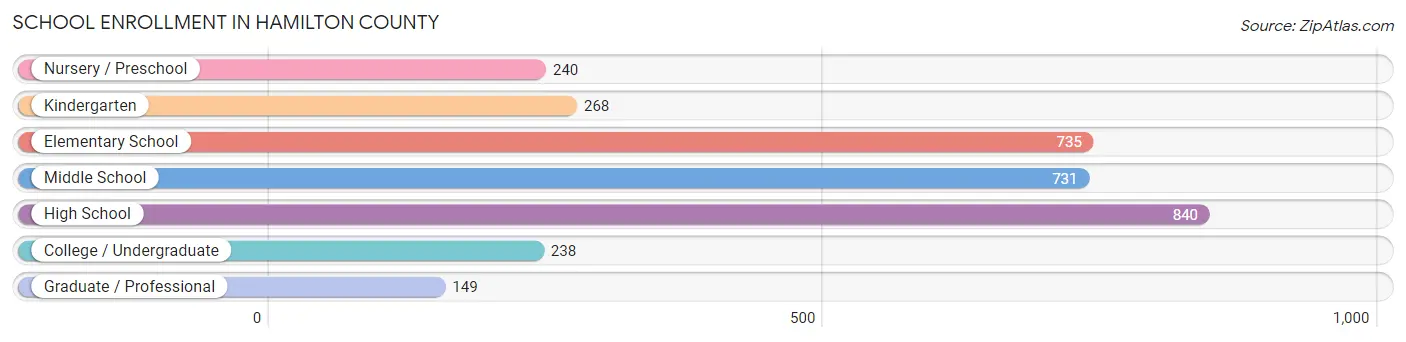
School Enrollment in Hamilton County
The most common levels of schooling among the 3,201 students in Hamilton County are high school (840 | 26.2%), elementary school (735 | 23.0%), and middle school (731 | 22.8%).
| School Level | # Students | % Students |
| Nursery / Preschool | 240 | 7.5% |
| Kindergarten | 268 | 8.4% |
| Elementary School | 735 | 23.0% |
| Middle School | 731 | 22.8% |
| High School | 840 | 26.2% |
| College / Undergraduate | 238 | 7.4% |
| Graduate / Professional | 149 | 4.6% |
| Total | 3,201 | 100.0% |
School Enrollment by Age by Funding Source in Hamilton County
Out of a total of 3,201 students who are enrolled in schools in Hamilton County, 314 (9.8%) attend a private institution, while the remaining 2,887 (90.2%) are enrolled in public schools. The age group of 35 years and over has the highest likelihood of being enrolled in private schools, with 73 (66.4% in the age bracket) enrolled. Conversely, the age group of 10 to 14 year olds has the lowest likelihood of being enrolled in a private school, with 929 (93.9% in the age bracket) attending a public institution.
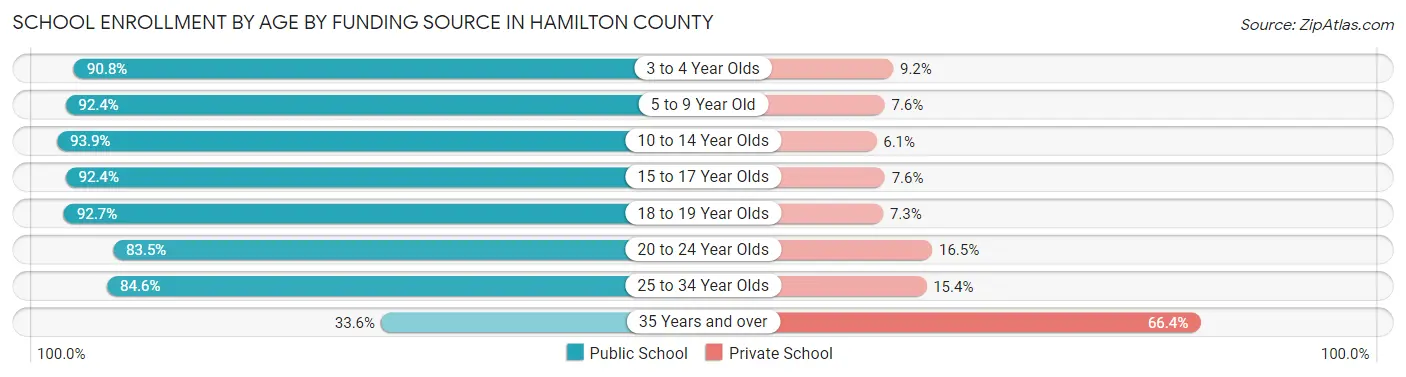
| Age Bracket | Public School | Private School |
| 3 to 4 Year Olds | 168 (90.8%) | 17 (9.2%) |
| 5 to 9 Year Old | 862 (92.4%) | 71 (7.6%) |
| 10 to 14 Year Olds | 929 (93.9%) | 60 (6.1%) |
| 15 to 17 Year Olds | 520 (92.4%) | 43 (7.6%) |
| 18 to 19 Year Olds | 190 (92.7%) | 15 (7.3%) |
| 20 to 24 Year Olds | 137 (83.5%) | 27 (16.5%) |
| 25 to 34 Year Olds | 44 (84.6%) | 8 (15.4%) |
| 35 Years and over | 37 (33.6%) | 73 (66.4%) |
| Total | 2,887 (90.2%) | 314 (9.8%) |
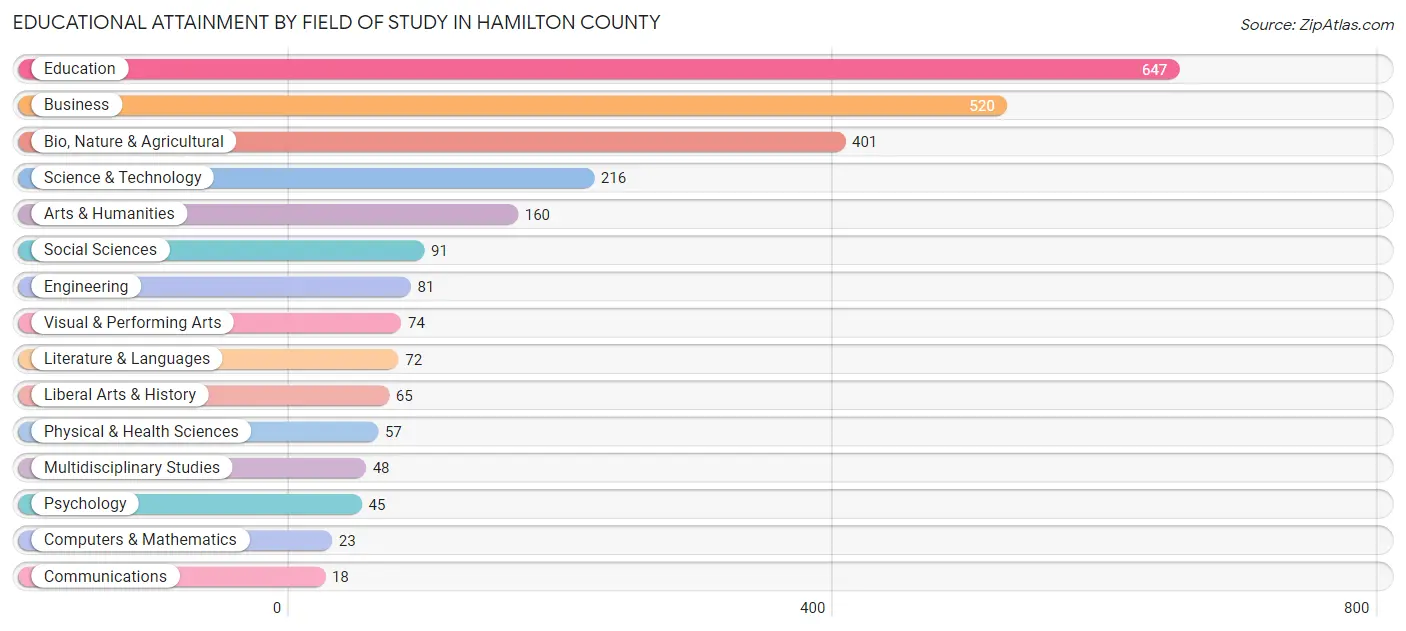
Educational Attainment by Field of Study in Hamilton County
Education (647 | 25.7%), business (520 | 20.6%), bio, nature & agricultural (401 | 15.9%), science & technology (216 | 8.6%), and arts & humanities (160 | 6.4%) are the most common fields of study among 2,518 individuals in Hamilton County who have obtained a bachelor's degree or higher.
| Field of Study | # Graduates | % Graduates |
| Computers & Mathematics | 23 | 0.9% |
| Bio, Nature & Agricultural | 401 | 15.9% |
| Physical & Health Sciences | 57 | 2.3% |
| Psychology | 45 | 1.8% |
| Social Sciences | 91 | 3.6% |
| Engineering | 81 | 3.2% |
| Multidisciplinary Studies | 48 | 1.9% |
| Science & Technology | 216 | 8.6% |
| Business | 520 | 20.6% |
| Education | 647 | 25.7% |
| Literature & Languages | 72 | 2.9% |
| Liberal Arts & History | 65 | 2.6% |
| Visual & Performing Arts | 74 | 2.9% |
| Communications | 18 | 0.7% |
| Arts & Humanities | 160 | 6.4% |
| Total | 2,518 | 100.0% |
Transportation & Commute in Hamilton County
Vehicle Availability by Sex in Hamilton County
The most prevalent vehicle ownership categories in Hamilton County are males with 2 vehicles (1,879, accounting for 47.4%) and females with 2 vehicles (1,426, making up 58.1%).
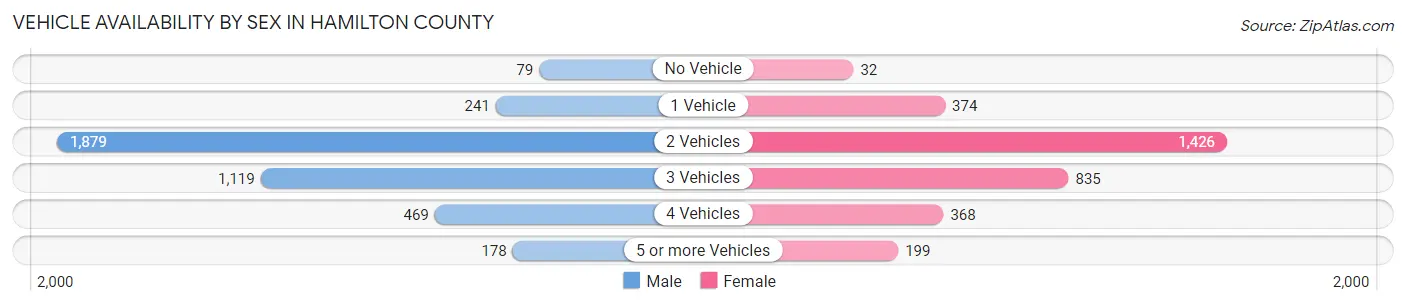
| Vehicles Available | Male | Female |
| No Vehicle | 79 (2.0%) | 32 (1.0%) |
| 1 Vehicle | 241 (6.1%) | 374 (11.6%) |
| 2 Vehicles | 1,879 (47.4%) | 1,426 (44.1%) |
| 3 Vehicles | 1,119 (28.2%) | 835 (25.8%) |
| 4 Vehicles | 469 (11.8%) | 368 (11.4%) |
| 5 or more Vehicles | 178 (4.5%) | 199 (6.1%) |
| Total | 3,965 (100.0%) | 3,234 (100.0%) |
Commute Time in Hamilton County
The most frequently occuring commute durations in Hamilton County are 5 to 9 minutes (1,336 commuters, 19.8%), 10 to 14 minutes (1,110 commuters, 16.5%), and 30 to 34 minutes (784 commuters, 11.6%).
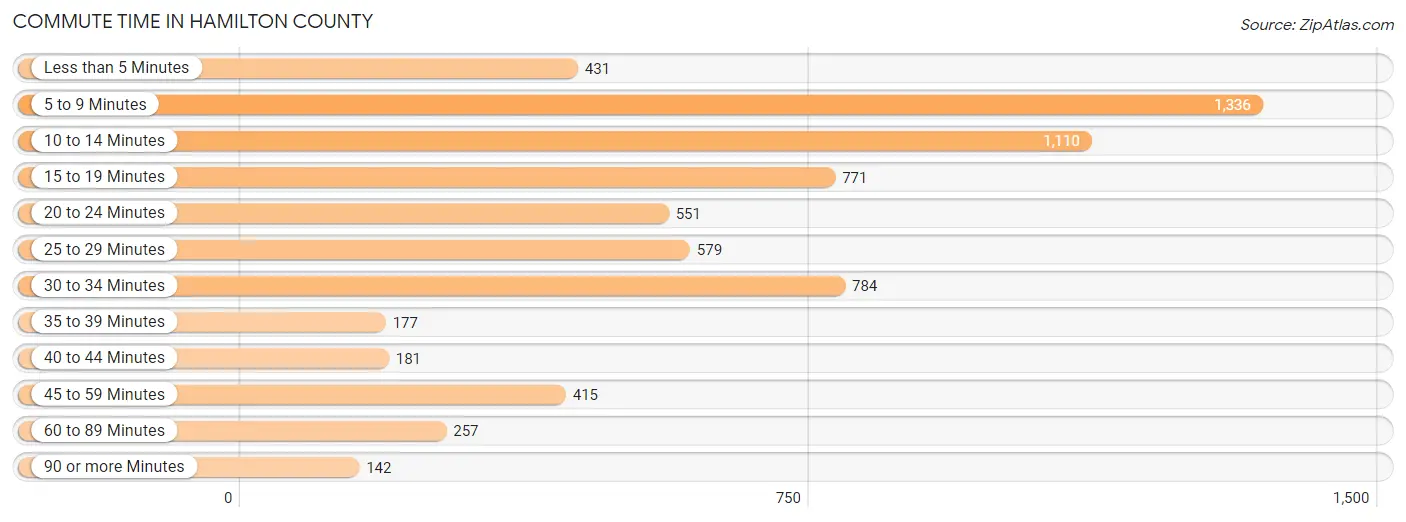
| Commute Time | # Commuters | % Commuters |
| Less than 5 Minutes | 431 | 6.4% |
| 5 to 9 Minutes | 1,336 | 19.8% |
| 10 to 14 Minutes | 1,110 | 16.5% |
| 15 to 19 Minutes | 771 | 11.5% |
| 20 to 24 Minutes | 551 | 8.2% |
| 25 to 29 Minutes | 579 | 8.6% |
| 30 to 34 Minutes | 784 | 11.6% |
| 35 to 39 Minutes | 177 | 2.6% |
| 40 to 44 Minutes | 181 | 2.7% |
| 45 to 59 Minutes | 415 | 6.2% |
| 60 to 89 Minutes | 257 | 3.8% |
| 90 or more Minutes | 142 | 2.1% |
Commute Time by Sex in Hamilton County
The most common commute times in Hamilton County are 5 to 9 minutes (676 commuters, 18.0%) for males and 5 to 9 minutes (660 commuters, 22.2%) for females.
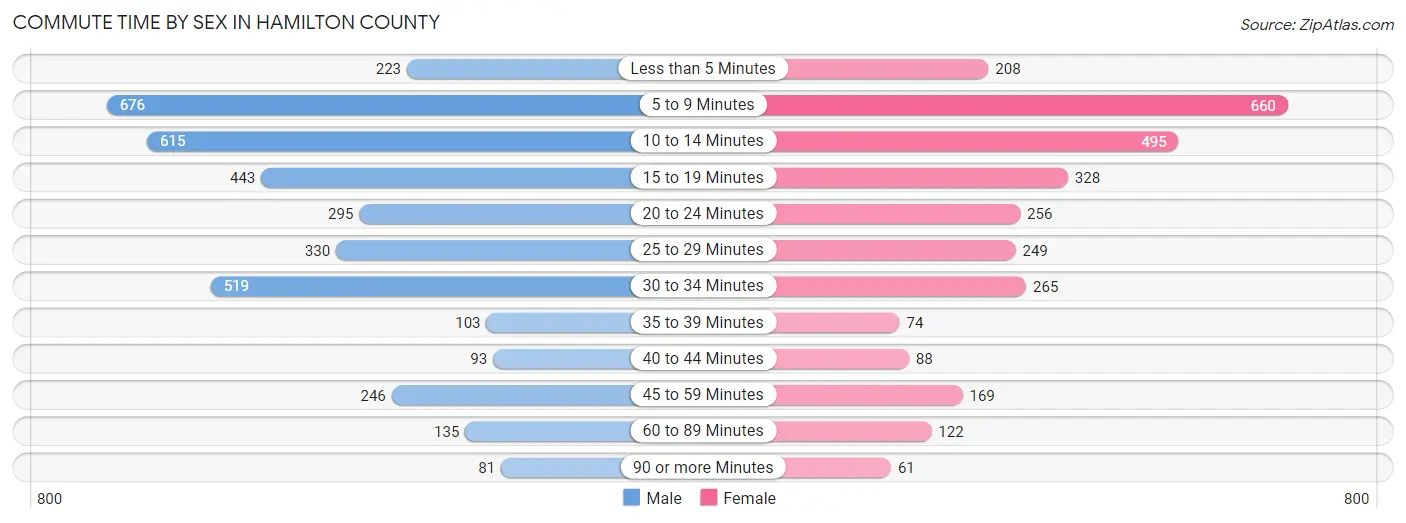
| Commute Time | Male | Female |
| Less than 5 Minutes | 223 (5.9%) | 208 (7.0%) |
| 5 to 9 Minutes | 676 (18.0%) | 660 (22.2%) |
| 10 to 14 Minutes | 615 (16.4%) | 495 (16.6%) |
| 15 to 19 Minutes | 443 (11.8%) | 328 (11.0%) |
| 20 to 24 Minutes | 295 (7.9%) | 256 (8.6%) |
| 25 to 29 Minutes | 330 (8.8%) | 249 (8.4%) |
| 30 to 34 Minutes | 519 (13.8%) | 265 (8.9%) |
| 35 to 39 Minutes | 103 (2.7%) | 74 (2.5%) |
| 40 to 44 Minutes | 93 (2.5%) | 88 (3.0%) |
| 45 to 59 Minutes | 246 (6.5%) | 169 (5.7%) |
| 60 to 89 Minutes | 135 (3.6%) | 122 (4.1%) |
| 90 or more Minutes | 81 (2.1%) | 61 (2.1%) |
Time of Departure to Work by Sex in Hamilton County
The most frequent times of departure to work in Hamilton County are 6:30 AM to 6:59 AM (620, 16.5%) for males and 7:30 AM to 7:59 AM (610, 20.5%) for females.
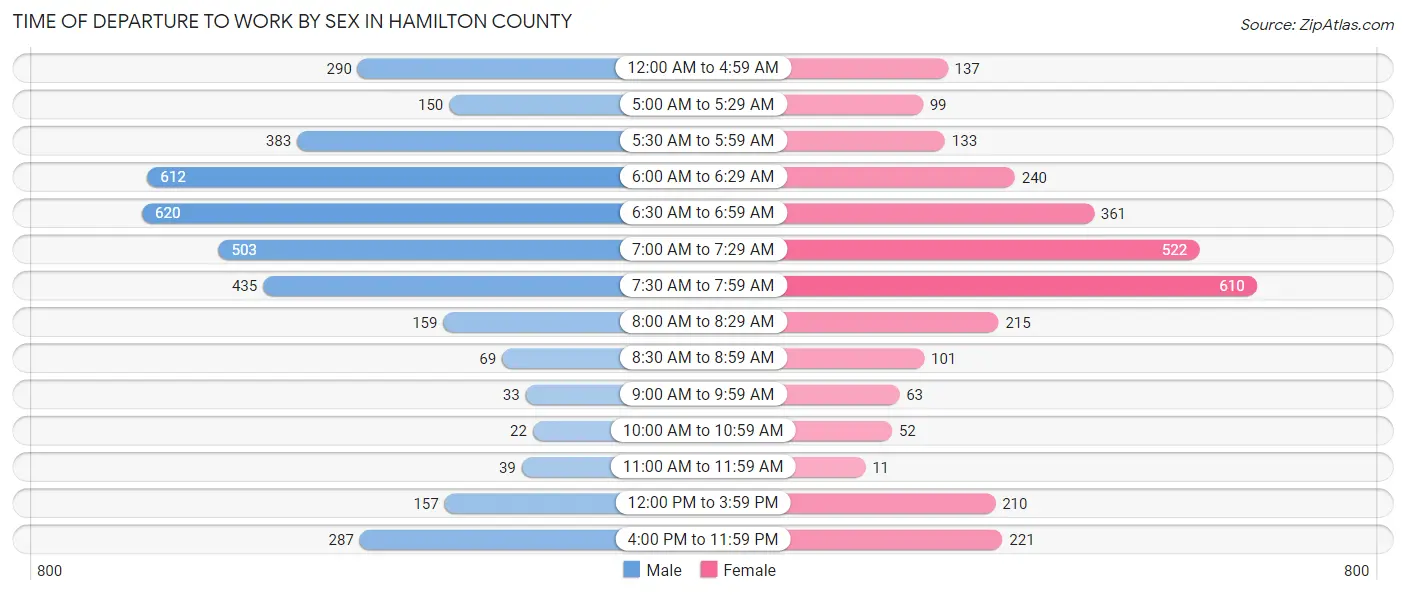
| Time of Departure | Male | Female |
| 12:00 AM to 4:59 AM | 290 (7.7%) | 137 (4.6%) |
| 5:00 AM to 5:29 AM | 150 (4.0%) | 99 (3.3%) |
| 5:30 AM to 5:59 AM | 383 (10.2%) | 133 (4.5%) |
| 6:00 AM to 6:29 AM | 612 (16.3%) | 240 (8.1%) |
| 6:30 AM to 6:59 AM | 620 (16.5%) | 361 (12.1%) |
| 7:00 AM to 7:29 AM | 503 (13.4%) | 522 (17.5%) |
| 7:30 AM to 7:59 AM | 435 (11.6%) | 610 (20.5%) |
| 8:00 AM to 8:29 AM | 159 (4.2%) | 215 (7.2%) |
| 8:30 AM to 8:59 AM | 69 (1.8%) | 101 (3.4%) |
| 9:00 AM to 9:59 AM | 33 (0.9%) | 63 (2.1%) |
| 10:00 AM to 10:59 AM | 22 (0.6%) | 52 (1.8%) |
| 11:00 AM to 11:59 AM | 39 (1.0%) | 11 (0.4%) |
| 12:00 PM to 3:59 PM | 157 (4.2%) | 210 (7.1%) |
| 4:00 PM to 11:59 PM | 287 (7.6%) | 221 (7.4%) |
| Total | 3,759 (100.0%) | 2,975 (100.0%) |
Housing Occupancy in Hamilton County
Occupancy by Ownership in Hamilton County
Of the total 6,203 dwellings in Hamilton County, owner-occupied units account for 4,430 (71.4%), while renter-occupied units make up 1,773 (28.6%).
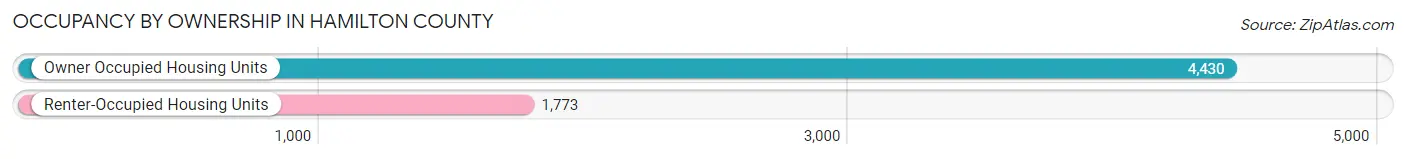
| Occupancy | # Housing Units | % Housing Units |
| Owner Occupied Housing Units | 4,430 | 71.4% |
| Renter-Occupied Housing Units | 1,773 | 28.6% |
| Total Occupied Housing Units | 6,203 | 100.0% |
Occupancy by Household Size in Hamilton County
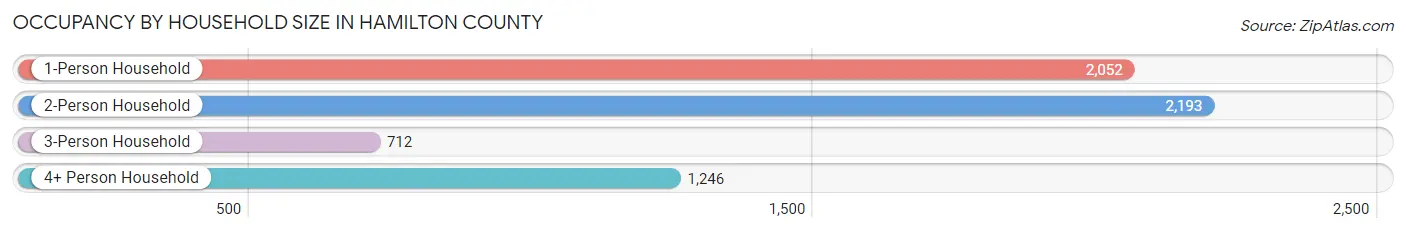
| Household Size | # Housing Units | % Housing Units |
| 1-Person Household | 2,052 | 33.1% |
| 2-Person Household | 2,193 | 35.3% |
| 3-Person Household | 712 | 11.5% |
| 4+ Person Household | 1,246 | 20.1% |
| Total Housing Units | 6,203 | 100.0% |
Occupancy by Ownership by Household Size in Hamilton County
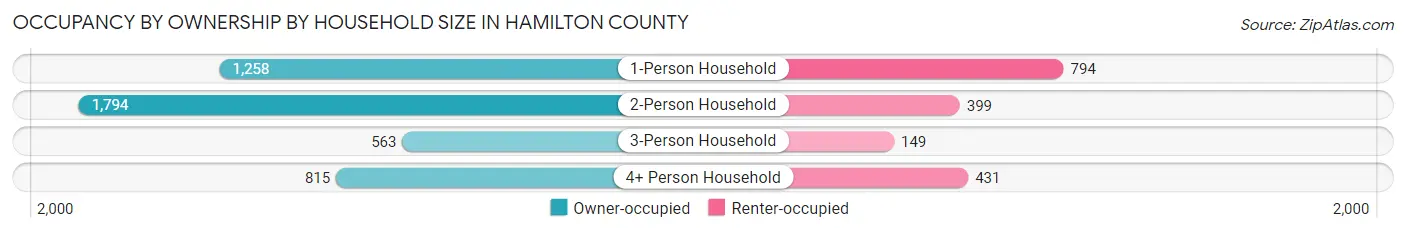
| Household Size | Owner-occupied | Renter-occupied |
| 1-Person Household | 1,258 (61.3%) | 794 (38.7%) |
| 2-Person Household | 1,794 (81.8%) | 399 (18.2%) |
| 3-Person Household | 563 (79.1%) | 149 (20.9%) |
| 4+ Person Household | 815 (65.4%) | 431 (34.6%) |
| Total Housing Units | 4,430 (71.4%) | 1,773 (28.6%) |
Occupancy by Educational Attainment in Hamilton County
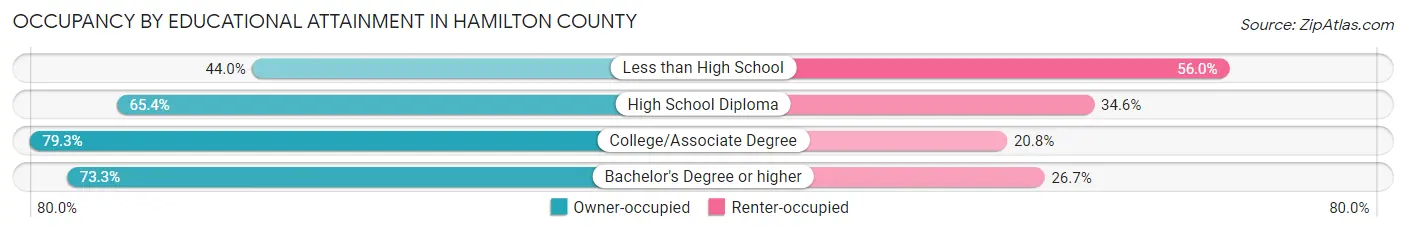
| Household Size | Owner-occupied | Renter-occupied |
| Less than High School | 165 (44.0%) | 210 (56.0%) |
| High School Diploma | 1,253 (65.4%) | 662 (34.6%) |
| College/Associate Degree | 1,914 (79.2%) | 501 (20.7%) |
| Bachelor's Degree or higher | 1,098 (73.3%) | 400 (26.7%) |
Occupancy by Age of Householder in Hamilton County
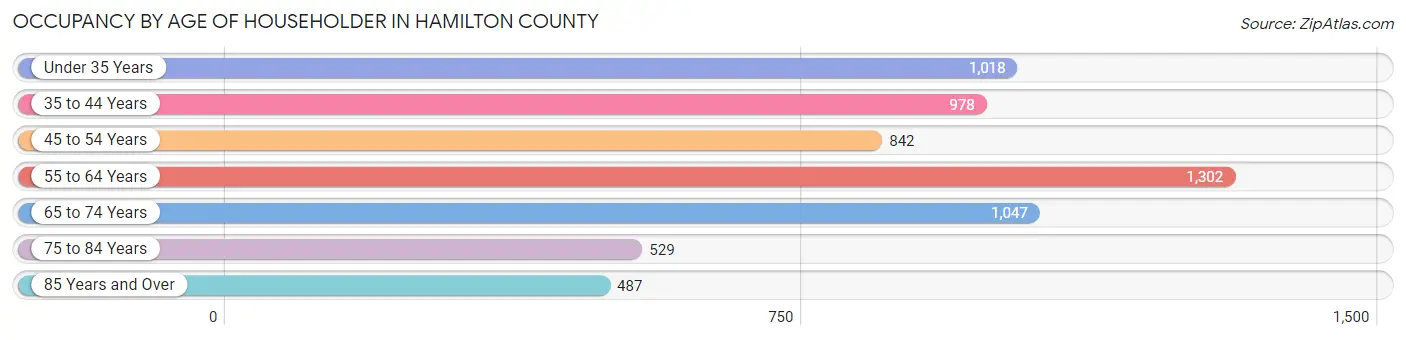
| Age Bracket | # Households | % Households |
| Under 35 Years | 1,018 | 16.4% |
| 35 to 44 Years | 978 | 15.8% |
| 45 to 54 Years | 842 | 13.6% |
| 55 to 64 Years | 1,302 | 21.0% |
| 65 to 74 Years | 1,047 | 16.9% |
| 75 to 84 Years | 529 | 8.5% |
| 85 Years and Over | 487 | 7.9% |
| Total | 6,203 | 100.0% |
Housing Finances in Hamilton County
Median Income by Occupancy in Hamilton County
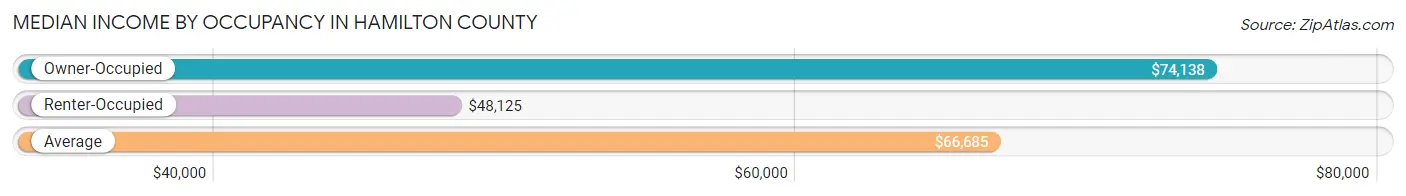
| Occupancy Type | # Households | Median Income |
| Owner-Occupied | 4,430 (71.4%) | $74,138 |
| Renter-Occupied | 1,773 (28.6%) | $48,125 |
| Average | 6,203 (100.0%) | $66,685 |
Occupancy by Householder Income Bracket in Hamilton County
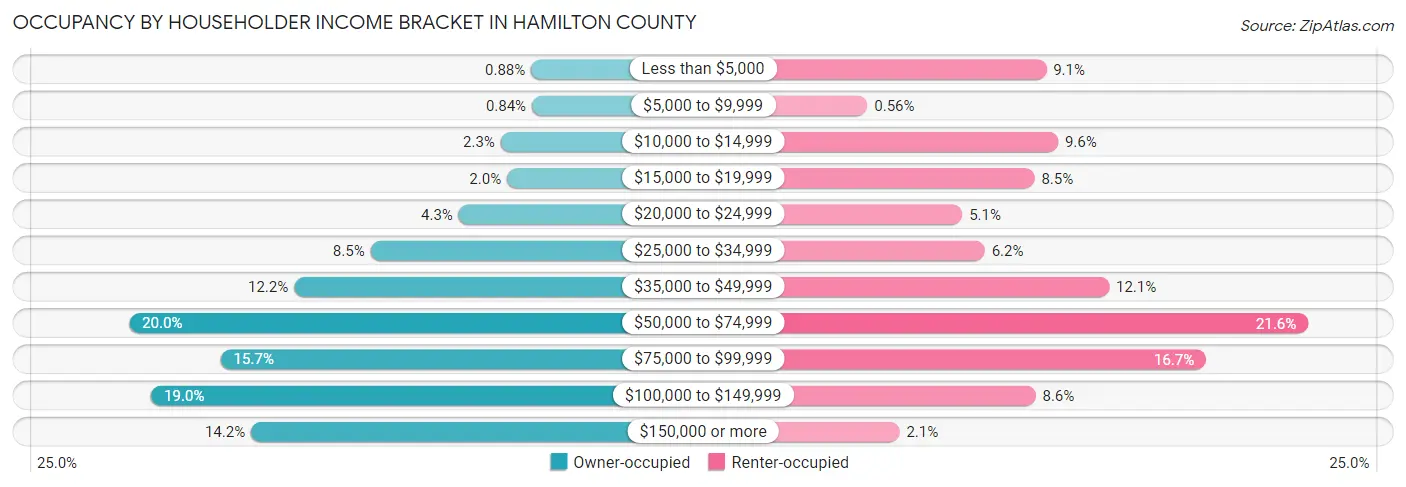
| Income Bracket | Owner-occupied | Renter-occupied |
| Less than $5,000 | 39 (0.9%) | 161 (9.1%) |
| $5,000 to $9,999 | 37 (0.8%) | 10 (0.6%) |
| $10,000 to $14,999 | 103 (2.3%) | 171 (9.6%) |
| $15,000 to $19,999 | 90 (2.0%) | 151 (8.5%) |
| $20,000 to $24,999 | 192 (4.3%) | 90 (5.1%) |
| $25,000 to $34,999 | 378 (8.5%) | 109 (6.1%) |
| $35,000 to $49,999 | 539 (12.2%) | 214 (12.1%) |
| $50,000 to $74,999 | 887 (20.0%) | 382 (21.5%) |
| $75,000 to $99,999 | 694 (15.7%) | 296 (16.7%) |
| $100,000 to $149,999 | 841 (19.0%) | 152 (8.6%) |
| $150,000 or more | 630 (14.2%) | 37 (2.1%) |
| Total | 4,430 (100.0%) | 1,773 (100.0%) |
Monthly Housing Cost Tiers in Hamilton County
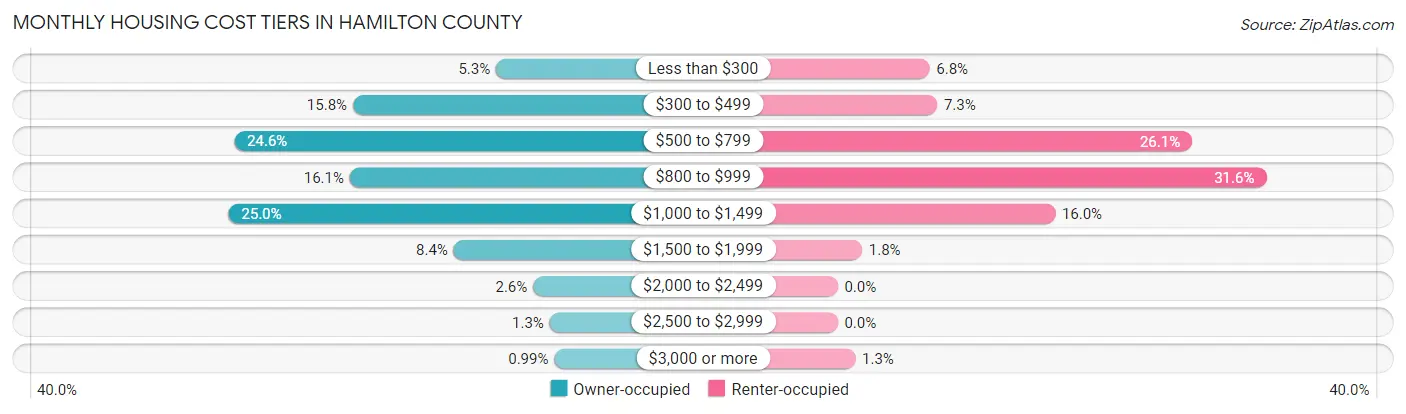
| Monthly Cost | Owner-occupied | Renter-occupied |
| Less than $300 | 234 (5.3%) | 120 (6.8%) |
| $300 to $499 | 701 (15.8%) | 130 (7.3%) |
| $500 to $799 | 1,089 (24.6%) | 463 (26.1%) |
| $800 to $999 | 711 (16.1%) | 560 (31.6%) |
| $1,000 to $1,499 | 1,107 (25.0%) | 284 (16.0%) |
| $1,500 to $1,999 | 372 (8.4%) | 32 (1.8%) |
| $2,000 to $2,499 | 113 (2.5%) | 0 (0.0%) |
| $2,500 to $2,999 | 59 (1.3%) | 0 (0.0%) |
| $3,000 or more | 44 (1.0%) | 23 (1.3%) |
| Total | 4,430 (100.0%) | 1,773 (100.0%) |
Physical Housing Characteristics in Hamilton County
Housing Structures in Hamilton County
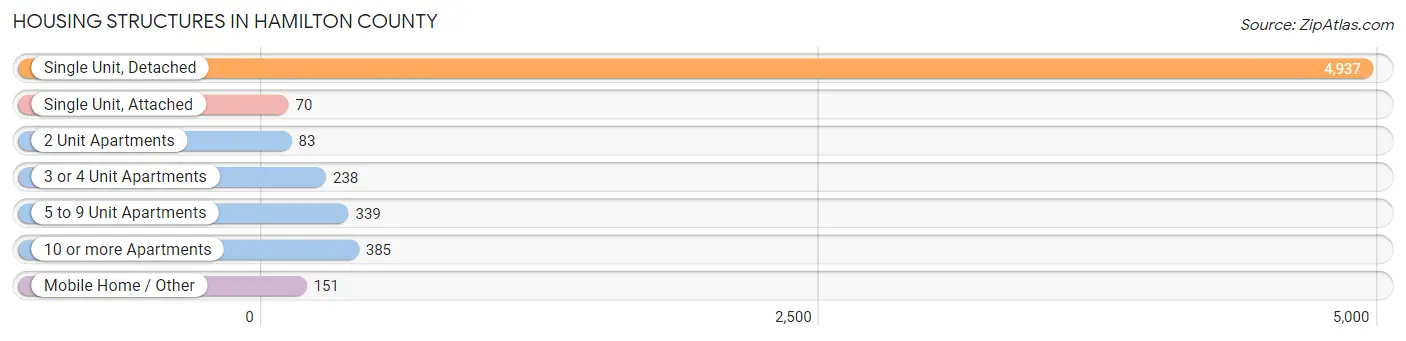
| Structure Type | # Housing Units | % Housing Units |
| Single Unit, Detached | 4,937 | 79.6% |
| Single Unit, Attached | 70 | 1.1% |
| 2 Unit Apartments | 83 | 1.3% |
| 3 or 4 Unit Apartments | 238 | 3.8% |
| 5 to 9 Unit Apartments | 339 | 5.5% |
| 10 or more Apartments | 385 | 6.2% |
| Mobile Home / Other | 151 | 2.4% |
| Total | 6,203 | 100.0% |
Housing Structures by Occupancy in Hamilton County
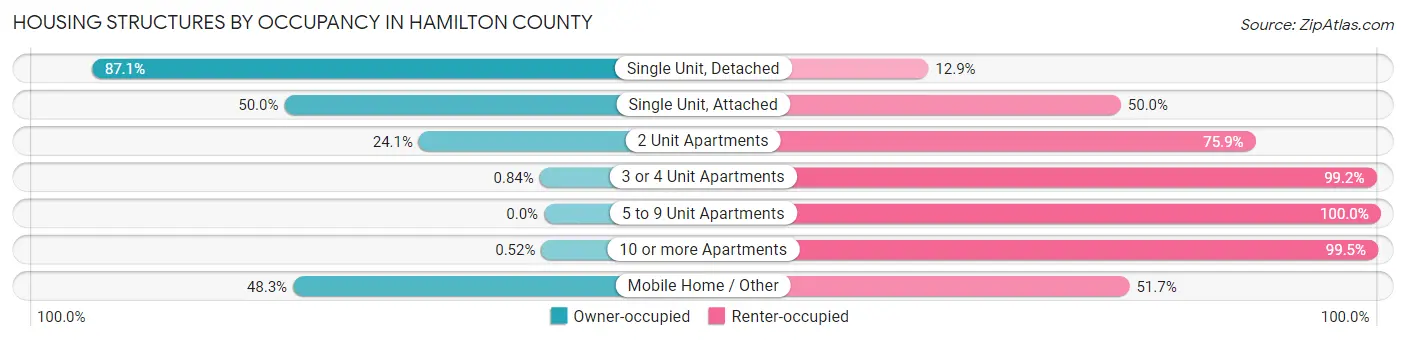
| Structure Type | Owner-occupied | Renter-occupied |
| Single Unit, Detached | 4,298 (87.1%) | 639 (12.9%) |
| Single Unit, Attached | 35 (50.0%) | 35 (50.0%) |
| 2 Unit Apartments | 20 (24.1%) | 63 (75.9%) |
| 3 or 4 Unit Apartments | 2 (0.8%) | 236 (99.2%) |
| 5 to 9 Unit Apartments | 0 (0.0%) | 339 (100.0%) |
| 10 or more Apartments | 2 (0.5%) | 383 (99.5%) |
| Mobile Home / Other | 73 (48.3%) | 78 (51.7%) |
| Total | 4,430 (71.4%) | 1,773 (28.6%) |
Housing Structures by Number of Rooms in Hamilton County
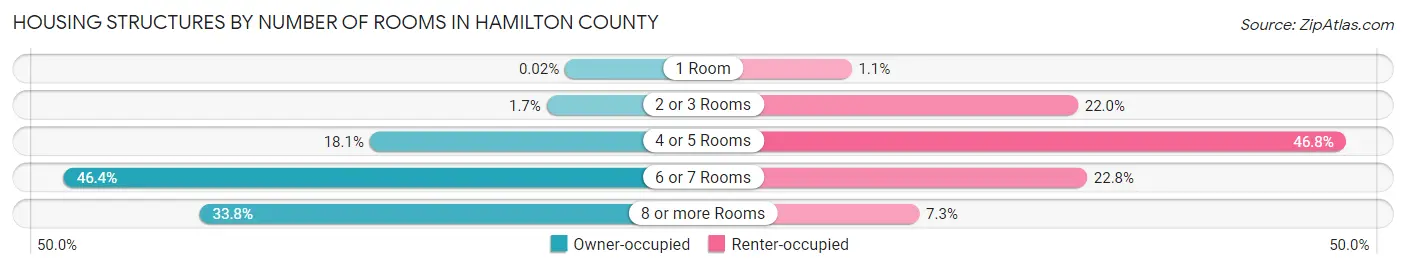
| Number of Rooms | Owner-occupied | Renter-occupied |
| 1 Room | 1 (0.0%) | 19 (1.1%) |
| 2 or 3 Rooms | 76 (1.7%) | 390 (22.0%) |
| 4 or 5 Rooms | 801 (18.1%) | 829 (46.8%) |
| 6 or 7 Rooms | 2,054 (46.4%) | 405 (22.8%) |
| 8 or more Rooms | 1,498 (33.8%) | 130 (7.3%) |
| Total | 4,430 (100.0%) | 1,773 (100.0%) |
Housing Structure by Heating Type in Hamilton County
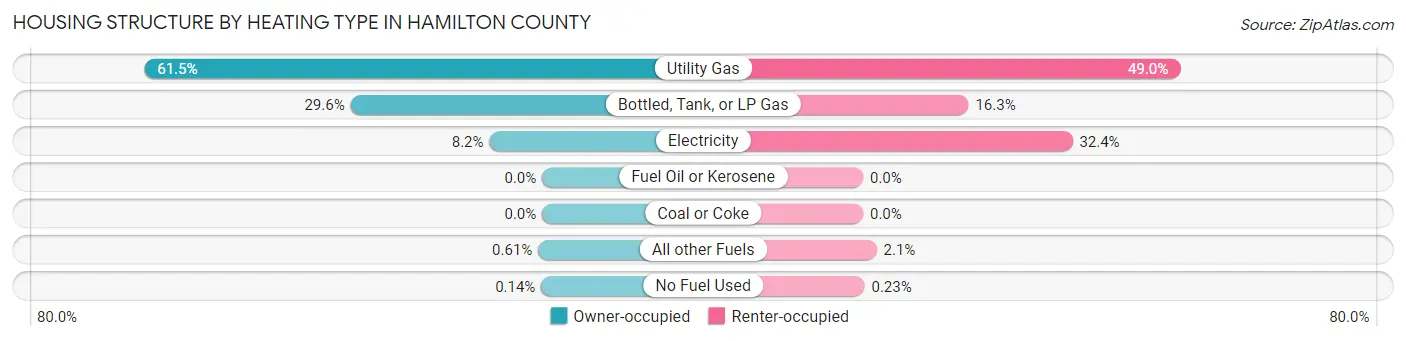
| Heating Type | Owner-occupied | Renter-occupied |
| Utility Gas | 2,724 (61.5%) | 869 (49.0%) |
| Bottled, Tank, or LP Gas | 1,312 (29.6%) | 289 (16.3%) |
| Electricity | 361 (8.2%) | 574 (32.4%) |
| Fuel Oil or Kerosene | 0 (0.0%) | 0 (0.0%) |
| Coal or Coke | 0 (0.0%) | 0 (0.0%) |
| All other Fuels | 27 (0.6%) | 37 (2.1%) |
| No Fuel Used | 6 (0.1%) | 4 (0.2%) |
| Total | 4,430 (100.0%) | 1,773 (100.0%) |
Household Vehicle Usage in Hamilton County
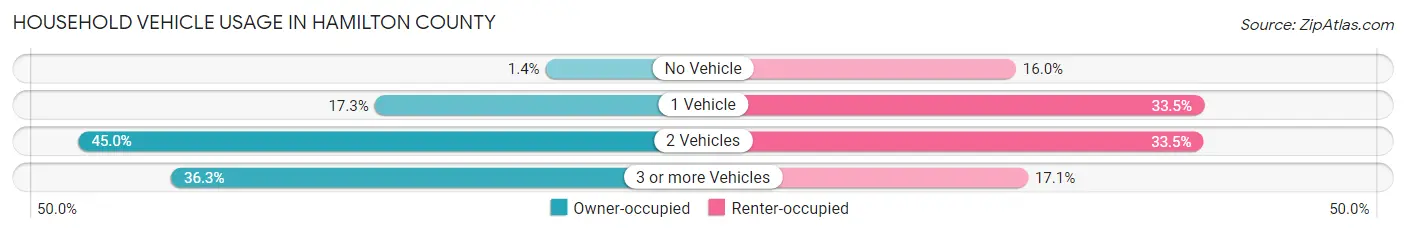
| Vehicles per Household | Owner-occupied | Renter-occupied |
| No Vehicle | 61 (1.4%) | 283 (16.0%) |
| 1 Vehicle | 768 (17.3%) | 594 (33.5%) |
| 2 Vehicles | 1,992 (45.0%) | 593 (33.5%) |
| 3 or more Vehicles | 1,609 (36.3%) | 303 (17.1%) |
| Total | 4,430 (100.0%) | 1,773 (100.0%) |
Real Estate & Mortgages in Hamilton County
Real Estate and Mortgage Overview in Hamilton County
| Characteristic | Without Mortgage | With Mortgage |
| Housing Units | 1,916 | 2,514 |
| Median Property Value | $116,400 | $115,500 |
| Median Household Income | $58,032 | $378 |
| Monthly Housing Costs | $521 | $37 |
| Real Estate Taxes | $1,639 | $22 |
Property Value by Mortgage Status in Hamilton County
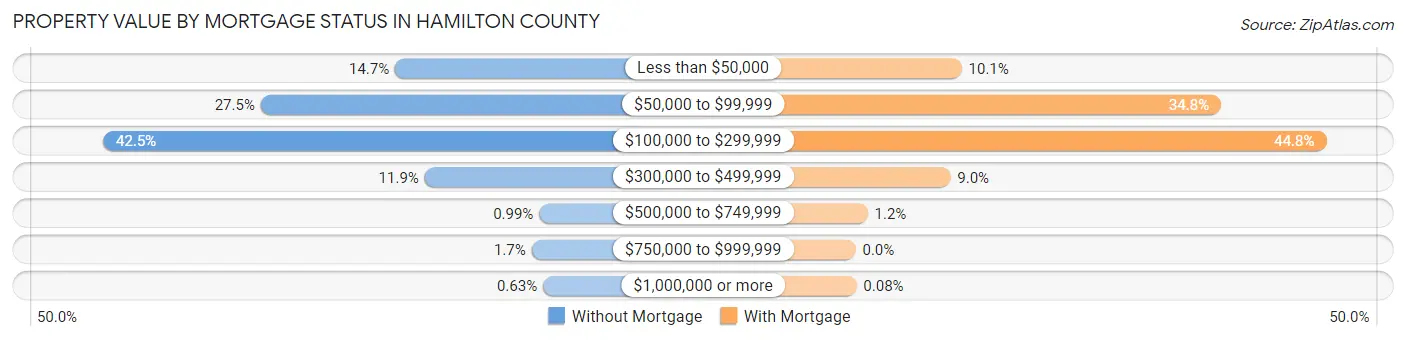
| Property Value | Without Mortgage | With Mortgage |
| Less than $50,000 | 282 (14.7%) | 254 (10.1%) |
| $50,000 to $99,999 | 527 (27.5%) | 875 (34.8%) |
| $100,000 to $299,999 | 815 (42.5%) | 1,127 (44.8%) |
| $300,000 to $499,999 | 228 (11.9%) | 227 (9.0%) |
| $500,000 to $749,999 | 19 (1.0%) | 29 (1.1%) |
| $750,000 to $999,999 | 33 (1.7%) | 0 (0.0%) |
| $1,000,000 or more | 12 (0.6%) | 2 (0.1%) |
| Total | 1,916 (100.0%) | 2,514 (100.0%) |
Household Income by Mortgage Status in Hamilton County
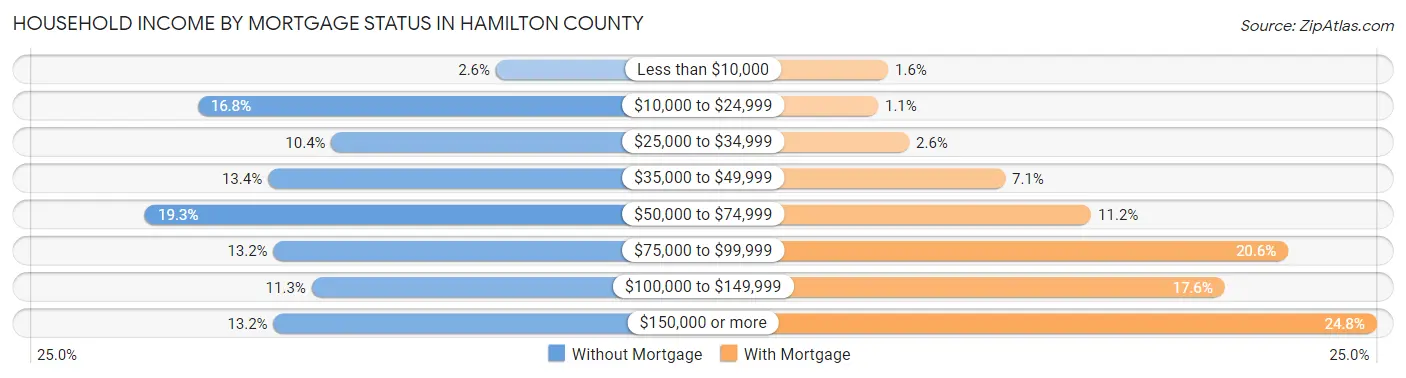
| Household Income | Without Mortgage | With Mortgage |
| Less than $10,000 | 49 (2.6%) | 39 (1.5%) |
| $10,000 to $24,999 | 321 (16.8%) | 27 (1.1%) |
| $25,000 to $34,999 | 199 (10.4%) | 64 (2.5%) |
| $35,000 to $49,999 | 257 (13.4%) | 179 (7.1%) |
| $50,000 to $74,999 | 369 (19.3%) | 282 (11.2%) |
| $75,000 to $99,999 | 252 (13.2%) | 518 (20.6%) |
| $100,000 to $149,999 | 217 (11.3%) | 442 (17.6%) |
| $150,000 or more | 252 (13.2%) | 624 (24.8%) |
| Total | 1,916 (100.0%) | 2,514 (100.0%) |
Property Value to Household Income Ratio in Hamilton County
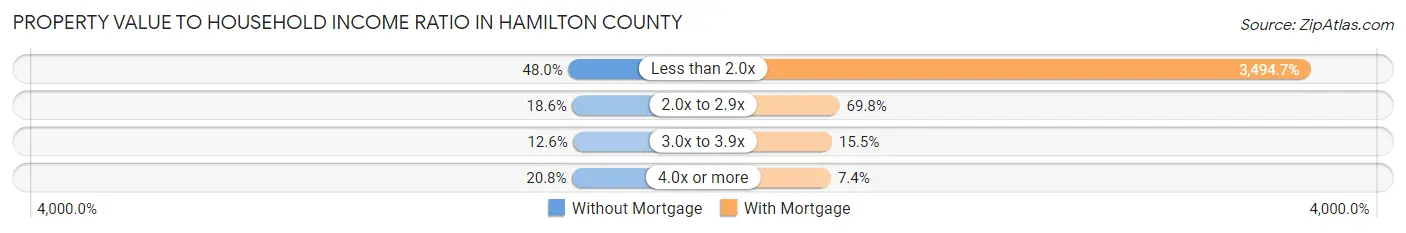
| Value-to-Income Ratio | Without Mortgage | With Mortgage |
| Less than 2.0x | 919 (48.0%) | 87,857 (3,494.7%) |
| 2.0x to 2.9x | 356 (18.6%) | 1,755 (69.8%) |
| 3.0x to 3.9x | 242 (12.6%) | 389 (15.5%) |
| 4.0x or more | 398 (20.8%) | 187 (7.4%) |
| Total | 1,916 (100.0%) | 2,514 (100.0%) |
Real Estate Taxes by Mortgage Status in Hamilton County
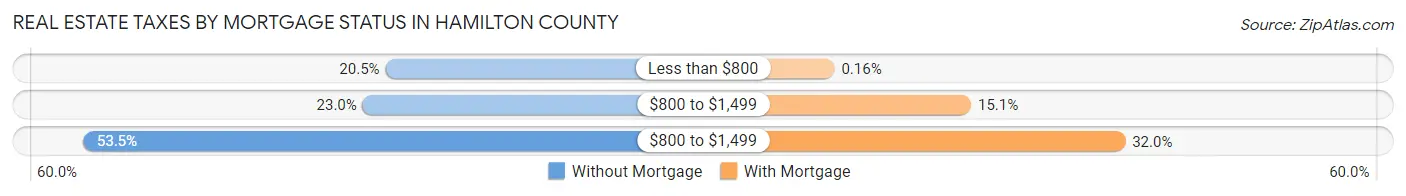
| Property Taxes | Without Mortgage | With Mortgage |
| Less than $800 | 392 (20.5%) | 4 (0.2%) |
| $800 to $1,499 | 440 (23.0%) | 380 (15.1%) |
| $800 to $1,499 | 1,025 (53.5%) | 805 (32.0%) |
| Total | 1,916 (100.0%) | 2,514 (100.0%) |
Health & Disability in Hamilton County
Health Insurance Coverage by Age in Hamilton County
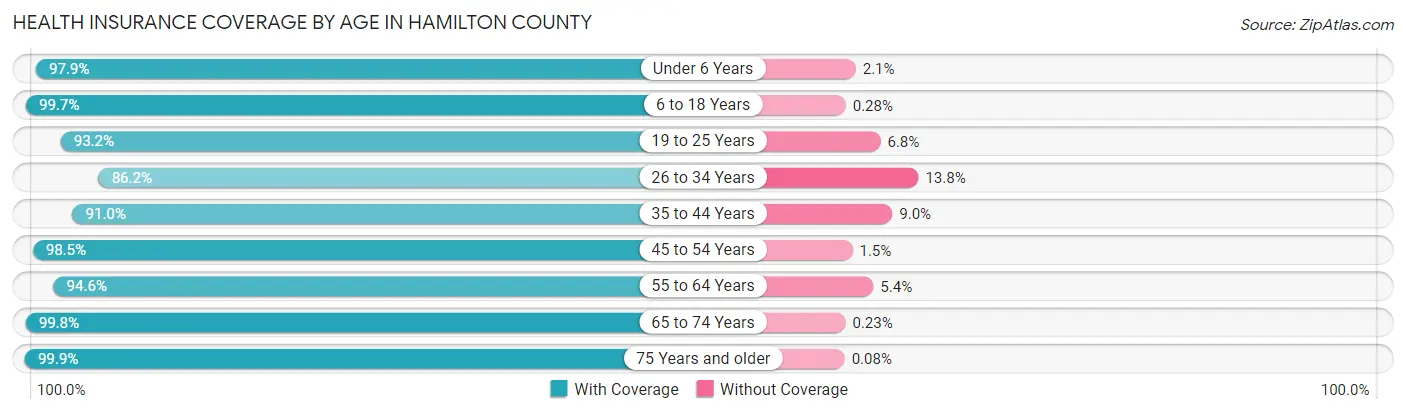
| Age Bracket | With Coverage | Without Coverage |
| Under 6 Years | 959 (97.9%) | 21 (2.1%) |
| 6 to 18 Years | 2,472 (99.7%) | 7 (0.3%) |
| 19 to 25 Years | 1,062 (93.2%) | 77 (6.8%) |
| 26 to 34 Years | 1,196 (86.2%) | 192 (13.8%) |
| 35 to 44 Years | 1,717 (91.0%) | 169 (9.0%) |
| 45 to 54 Years | 1,595 (98.5%) | 25 (1.5%) |
| 55 to 64 Years | 2,088 (94.6%) | 120 (5.4%) |
| 65 to 74 Years | 1,733 (99.8%) | 4 (0.2%) |
| 75 Years and older | 1,307 (99.9%) | 1 (0.1%) |
| Total | 14,129 (95.8%) | 616 (4.2%) |
Health Insurance Coverage by Citizenship Status in Hamilton County
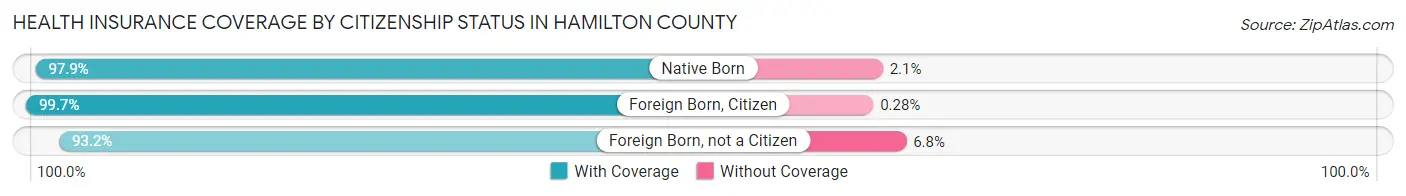
| Citizenship Status | With Coverage | Without Coverage |
| Native Born | 959 (97.9%) | 21 (2.1%) |
| Foreign Born, Citizen | 2,472 (99.7%) | 7 (0.3%) |
| Foreign Born, not a Citizen | 1,062 (93.2%) | 77 (6.8%) |
Health Insurance Coverage by Household Income in Hamilton County
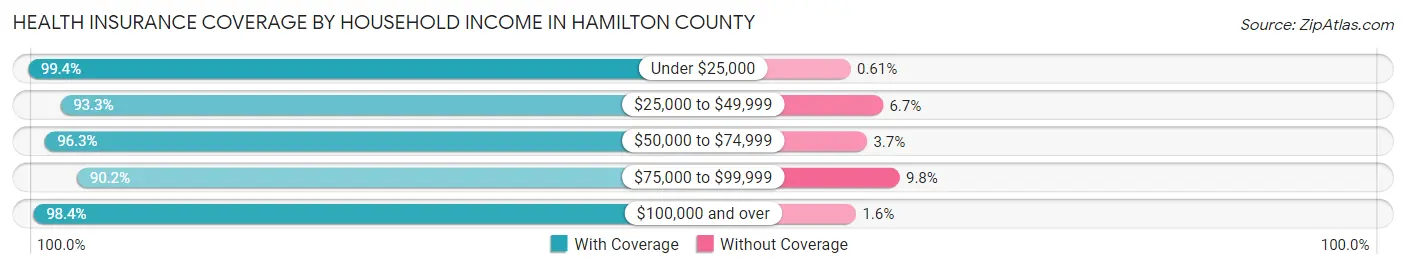
| Household Income | With Coverage | Without Coverage |
| Under $25,000 | 1,462 (99.4%) | 9 (0.6%) |
| $25,000 to $49,999 | 2,178 (93.3%) | 156 (6.7%) |
| $50,000 to $74,999 | 3,090 (96.3%) | 118 (3.7%) |
| $75,000 to $99,999 | 2,295 (90.2%) | 249 (9.8%) |
| $100,000 and over | 5,091 (98.4%) | 84 (1.6%) |
Public vs Private Health Insurance Coverage by Age in Hamilton County
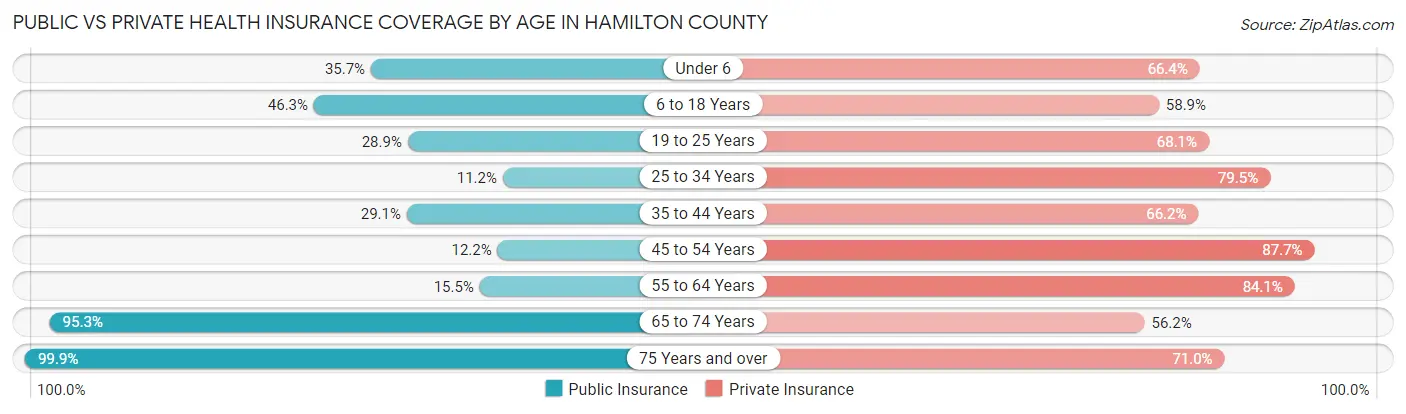
| Age Bracket | Public Insurance | Private Insurance |
| Under 6 | 350 (35.7%) | 651 (66.4%) |
| 6 to 18 Years | 1,148 (46.3%) | 1,459 (58.9%) |
| 19 to 25 Years | 329 (28.9%) | 776 (68.1%) |
| 25 to 34 Years | 156 (11.2%) | 1,103 (79.5%) |
| 35 to 44 Years | 548 (29.1%) | 1,248 (66.2%) |
| 45 to 54 Years | 198 (12.2%) | 1,421 (87.7%) |
| 55 to 64 Years | 343 (15.5%) | 1,856 (84.1%) |
| 65 to 74 Years | 1,656 (95.3%) | 976 (56.2%) |
| 75 Years and over | 1,307 (99.9%) | 929 (71.0%) |
| Total | 6,035 (40.9%) | 10,419 (70.7%) |
Disability Status by Sex by Age in Hamilton County
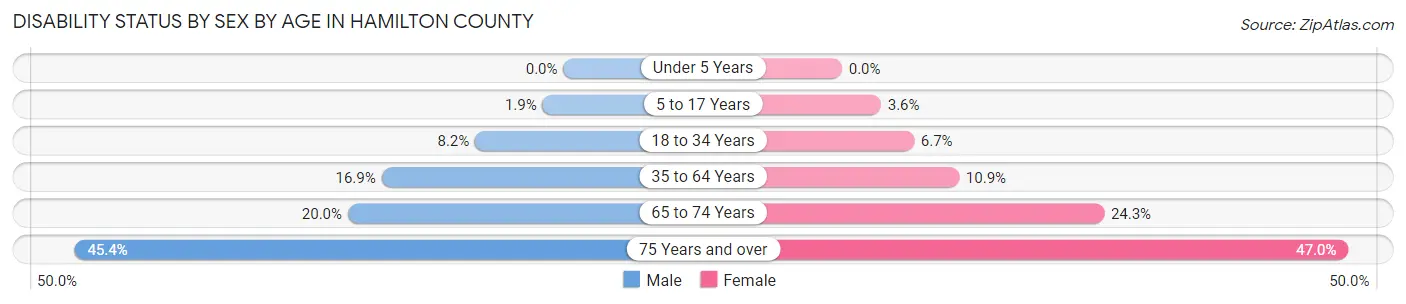
| Age Bracket | Male | Female |
| Under 5 Years | 0 (0.0%) | 0 (0.0%) |
| 5 to 17 Years | 26 (1.9%) | 43 (3.6%) |
| 18 to 34 Years | 108 (8.2%) | 90 (6.7%) |
| 35 to 64 Years | 503 (16.9%) | 297 (10.9%) |
| 65 to 74 Years | 183 (20.0%) | 200 (24.3%) |
| 75 Years and over | 245 (45.4%) | 361 (47.0%) |
Disability Class by Sex by Age in Hamilton County
Disability Class: Hearing Difficulty
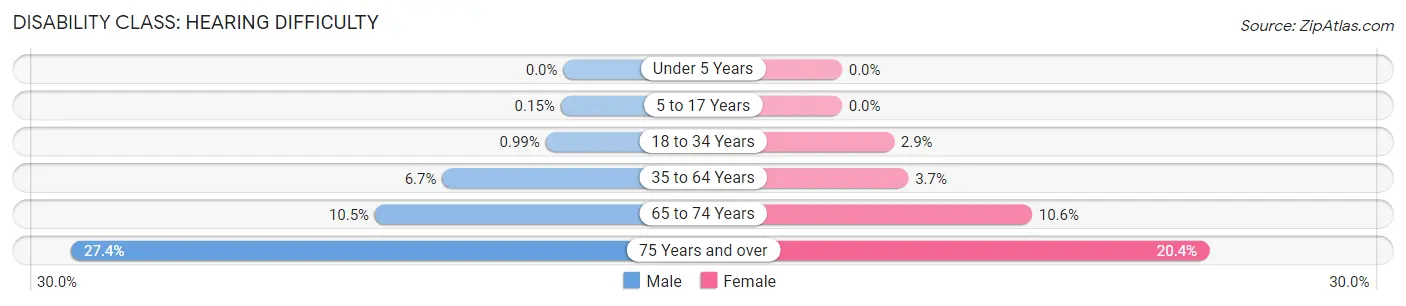
| Age Bracket | Male | Female |
| Under 5 Years | 0 (0.0%) | 0 (0.0%) |
| 5 to 17 Years | 2 (0.2%) | 0 (0.0%) |
| 18 to 34 Years | 13 (1.0%) | 39 (2.9%) |
| 35 to 64 Years | 201 (6.7%) | 101 (3.7%) |
| 65 to 74 Years | 96 (10.5%) | 87 (10.6%) |
| 75 Years and over | 148 (27.4%) | 157 (20.4%) |
Disability Class: Vision Difficulty
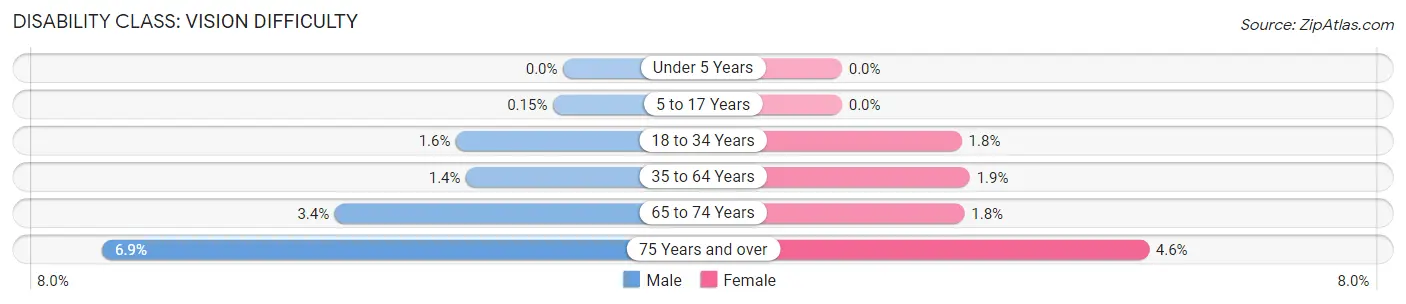
| Age Bracket | Male | Female |
| Under 5 Years | 0 (0.0%) | 0 (0.0%) |
| 5 to 17 Years | 2 (0.2%) | 0 (0.0%) |
| 18 to 34 Years | 21 (1.6%) | 24 (1.8%) |
| 35 to 64 Years | 43 (1.4%) | 52 (1.9%) |
| 65 to 74 Years | 31 (3.4%) | 15 (1.8%) |
| 75 Years and over | 37 (6.9%) | 35 (4.6%) |
Disability Class: Cognitive Difficulty
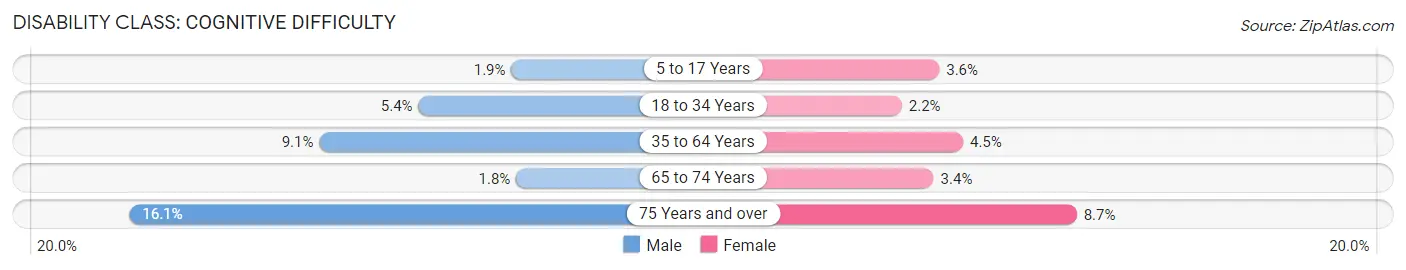
| Age Bracket | Male | Female |
| 5 to 17 Years | 26 (1.9%) | 43 (3.6%) |
| 18 to 34 Years | 71 (5.4%) | 30 (2.2%) |
| 35 to 64 Years | 270 (9.1%) | 123 (4.5%) |
| 65 to 74 Years | 16 (1.8%) | 28 (3.4%) |
| 75 Years and over | 87 (16.1%) | 67 (8.7%) |
Disability Class: Ambulatory Difficulty
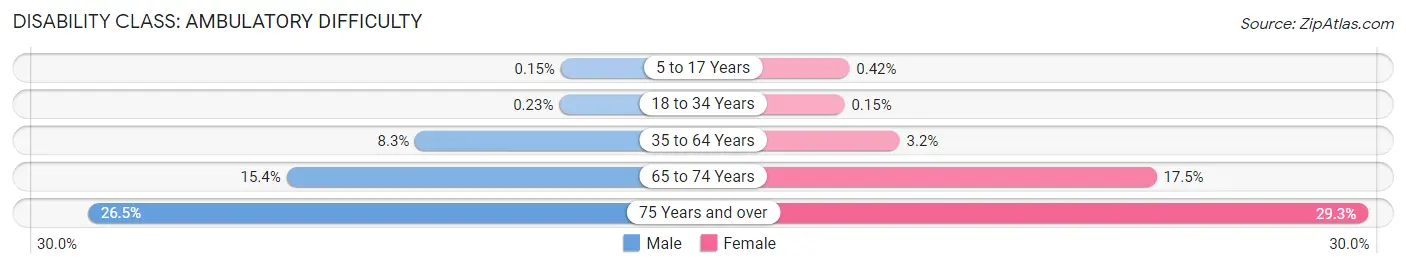
| Age Bracket | Male | Female |
| 5 to 17 Years | 2 (0.2%) | 5 (0.4%) |
| 18 to 34 Years | 3 (0.2%) | 2 (0.2%) |
| 35 to 64 Years | 246 (8.3%) | 88 (3.2%) |
| 65 to 74 Years | 141 (15.4%) | 144 (17.5%) |
| 75 Years and over | 143 (26.5%) | 225 (29.3%) |
Disability Class: Self-Care Difficulty
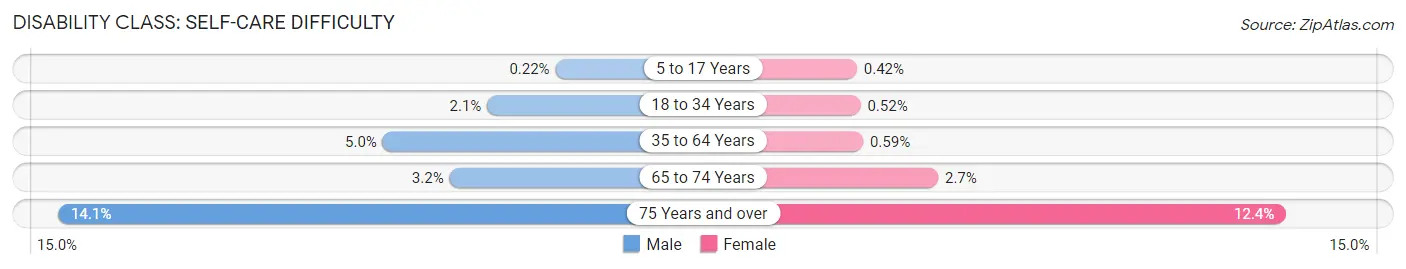
| Age Bracket | Male | Female |
| 5 to 17 Years | 3 (0.2%) | 5 (0.4%) |
| 18 to 34 Years | 28 (2.1%) | 7 (0.5%) |
| 35 to 64 Years | 150 (5.0%) | 16 (0.6%) |
| 65 to 74 Years | 29 (3.2%) | 22 (2.7%) |
| 75 Years and over | 76 (14.1%) | 95 (12.4%) |
Technology Access in Hamilton County
Computing Device Access in Hamilton County
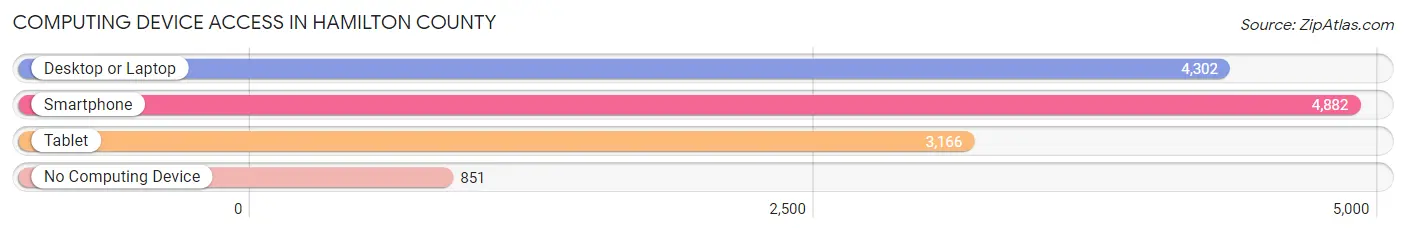
| Device Type | # Households | % Households |
| Desktop or Laptop | 4,302 | 69.4% |
| Smartphone | 4,882 | 78.7% |
| Tablet | 3,166 | 51.0% |
| No Computing Device | 851 | 13.7% |
| Total | 6,203 | 100.0% |
Internet Access in Hamilton County
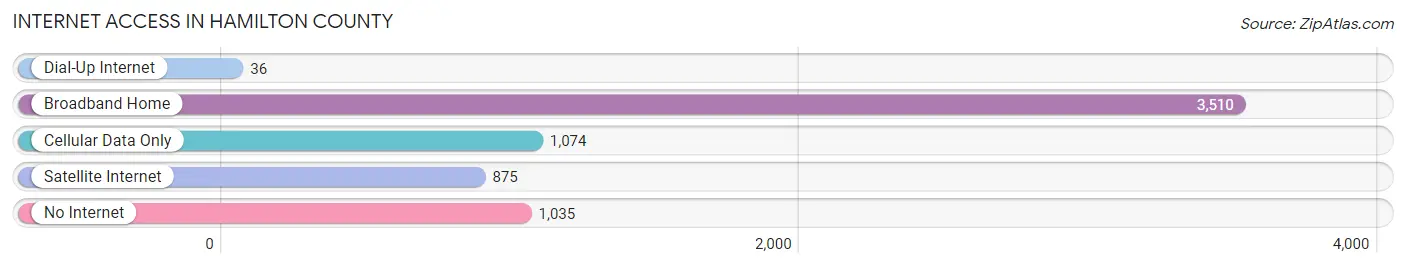
| Internet Type | # Households | % Households |
| Dial-Up Internet | 36 | 0.6% |
| Broadband Home | 3,510 | 56.6% |
| Cellular Data Only | 1,074 | 17.3% |
| Satellite Internet | 875 | 14.1% |
| No Internet | 1,035 | 16.7% |
| Total | 6,203 | 100.0% |
Hamilton County Summary
Hamilton County is located in the state of Iowa in the United States. It is bordered by Hardin County to the north, Webster County to the east, Boone County to the south, and Story County to the west. The county seat is Webster City. The county was established in 1851 and named after Alexander Hamilton, the first Secretary of the Treasury.
Geography
Hamilton County covers an area of 576 square miles and is located in the central part of the state. The terrain is mostly rolling hills and prairies, with some wooded areas. The county is drained by the Boone River, which flows through the county from north to south. The highest point in the county is located in the northwest corner, at an elevation of 1,541 feet.
The county is home to several state parks and recreation areas, including Briggs Woods Park, Dolliver Memorial State Park, and the Hamilton County Conservation Board. The county also contains several wildlife management areas, including the Briggs Woods Wildlife Management Area and the Dolliver Memorial Wildlife Management Area.
Demographics
As of the 2010 census, the population of Hamilton County was 15,673. The population density was 27.3 people per square mile. The racial makeup of the county was 97.2% White, 0.4% African American, 0.2% Native American, 0.5% Asian, 0.1% Pacific Islander, 0.7% from other races, and 0.9% from two or more races. Hispanic or Latino of any race were 2.2% of the population.
The median income for a household in the county was $45,945, and the median income for a family was $54,845. The per capita income for the county was $22,845. About 6.2% of families and 8.7% of the population were below the poverty line, including 11.2% of those under age 18 and 6.3% of those age 65 or over.
Economy
The economy of Hamilton County is largely based on agriculture. The county is home to several large farms, as well as numerous smaller family farms. The main crops grown in the county are corn, soybeans, and hay. Livestock production is also important, with beef cattle, hogs, and sheep being the main animals raised.
The county is also home to several manufacturing companies, including a large pork processing plant, a metal fabrication plant, and a plastics manufacturing plant. The county also has a large tourism industry, with several state parks and recreation areas, as well as several golf courses.
Hamilton County is served by two school districts, the Webster City Community School District and the South Hamilton Community School District. The county also has several private schools, including a Catholic school and a Lutheran school. The county is home to one college, Iowa Central Community College, which is located in Webster City.
Conclusion
Hamilton County is a rural county located in the state of Iowa. It is home to several state parks and recreation areas, as well as several large and small farms. The economy of the county is largely based on agriculture, with corn, soybeans, and hay being the main crops grown. The county also has several manufacturing companies and a large tourism industry. The county is served by two school districts and one college.
Common Questions
What is Per Capita Income in Hamilton County?
Per Capita income in Hamilton County is $35,822.
What is the Median Family Income in Hamilton County?
Median Family Income in Hamilton County is $81,270.
What is the Median Household income in Hamilton County?
Median Household Income in Hamilton County is $66,685.
What is Income or Wage Gap in Hamilton County?
Income or Wage Gap in Hamilton County is 41.2%.
Women in Hamilton County earn 58.8 cents for every dollar earned by a man.
What is Family Income Deficit in Hamilton County?
Family Income Deficit in Hamilton County is $11,649.
Families that are below poverty line in Hamilton County earn $11,649 less on average than the poverty threshold level.
What is Inequality or Gini Index in Hamilton County?
Inequality or Gini Index in Hamilton County is 0.43.
What is the Total Population of Hamilton County?
Total Population of Hamilton County is 14,979.
What is the Total Male Population of Hamilton County?
Total Male Population of Hamilton County is 7,637.
What is the Total Female Population of Hamilton County?
Total Female Population of Hamilton County is 7,342.
What is the Ratio of Males per 100 Females in Hamilton County?
There are 104.02 Males per 100 Females in Hamilton County.
What is the Ratio of Females per 100 Males in Hamilton County?
There are 96.14 Females per 100 Males in Hamilton County.
What is the Median Population Age in Hamilton County?
Median Population Age in Hamilton County is 41.9 Years.
What is the Average Family Size in Hamilton County
Average Family Size in Hamilton County is 3.0 People.
What is the Average Household Size in Hamilton County
Average Household Size in Hamilton County is 2.4 People.
How Large is the Labor Force in Hamilton County?
There are 7,597 People in the Labor Forcein in Hamilton County.
What is the Percentage of People in the Labor Force in Hamilton County?
63.3% of People are in the Labor Force in Hamilton County.
What is the Unemployment Rate in Hamilton County?
Unemployment Rate in Hamilton County is 4.0%.