Fremont County, IA Map & Demographics
Fremont County Map
Fremont County Overview
$37,236
PER CAPITA INCOME
$83,844
AVG FAMILY INCOME
$69,375
AVG HOUSEHOLD INCOME
25.1%
WAGE / INCOME GAP [ % ]
74.9¢/ $1
WAGE / INCOME GAP [ $ ]
0.43
INEQUALITY / GINI INDEX
6,639
TOTAL POPULATION
3,327
MALE POPULATION
3,312
FEMALE POPULATION
100.45
MALES / 100 FEMALES
99.55
FEMALES / 100 MALES
46.2
MEDIAN AGE
3.0
AVG FAMILY SIZE
2.4
AVG HOUSEHOLD SIZE
3,204
LABOR FORCE [ PEOPLE ]
59.6%
PERCENT IN LABOR FORCE
1.7%
UNEMPLOYMENT RATE
Fremont County Area Codes
Income in Fremont County
Income Overview in Fremont County
Per Capita Income in Fremont County is $37,236, while median incomes of families and households are $83,844 and $69,375 respectively.
| Characteristic | Number | Measure |
| Per Capita Income | 6,639 | $37,236 |
| Median Family Income | 1,733 | $83,844 |
| Mean Family Income | 1,733 | $106,098 |
| Median Household Income | 2,736 | $69,375 |
| Mean Household Income | 2,736 | $88,553 |
| Income Deficit | 1,733 | $0 |
| Wage / Income Gap (%) | 6,639 | 25.11% |
| Wage / Income Gap ($) | 6,639 | 74.89¢ per $1 |
| Gini / Inequality Index | 6,639 | 0.43 |
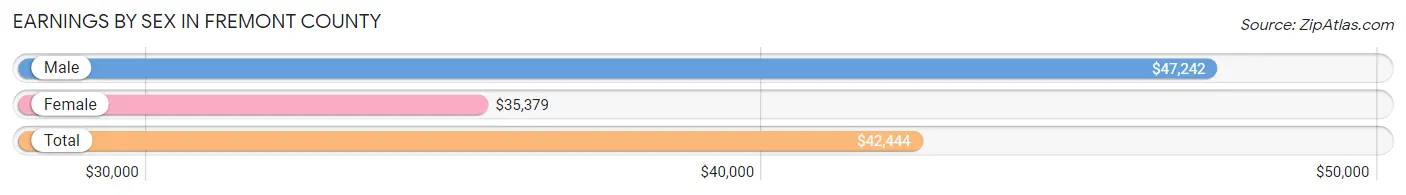
Earnings by Sex in Fremont County
Average Earnings in Fremont County are $42,444, $47,242 for men and $35,379 for women, a difference of 25.1%.
| Sex | Number | Average Earnings |
| Male | 1,828 (52.7%) | $47,242 |
| Female | 1,638 (47.3%) | $35,379 |
| Total | 3,466 (100.0%) | $42,444 |
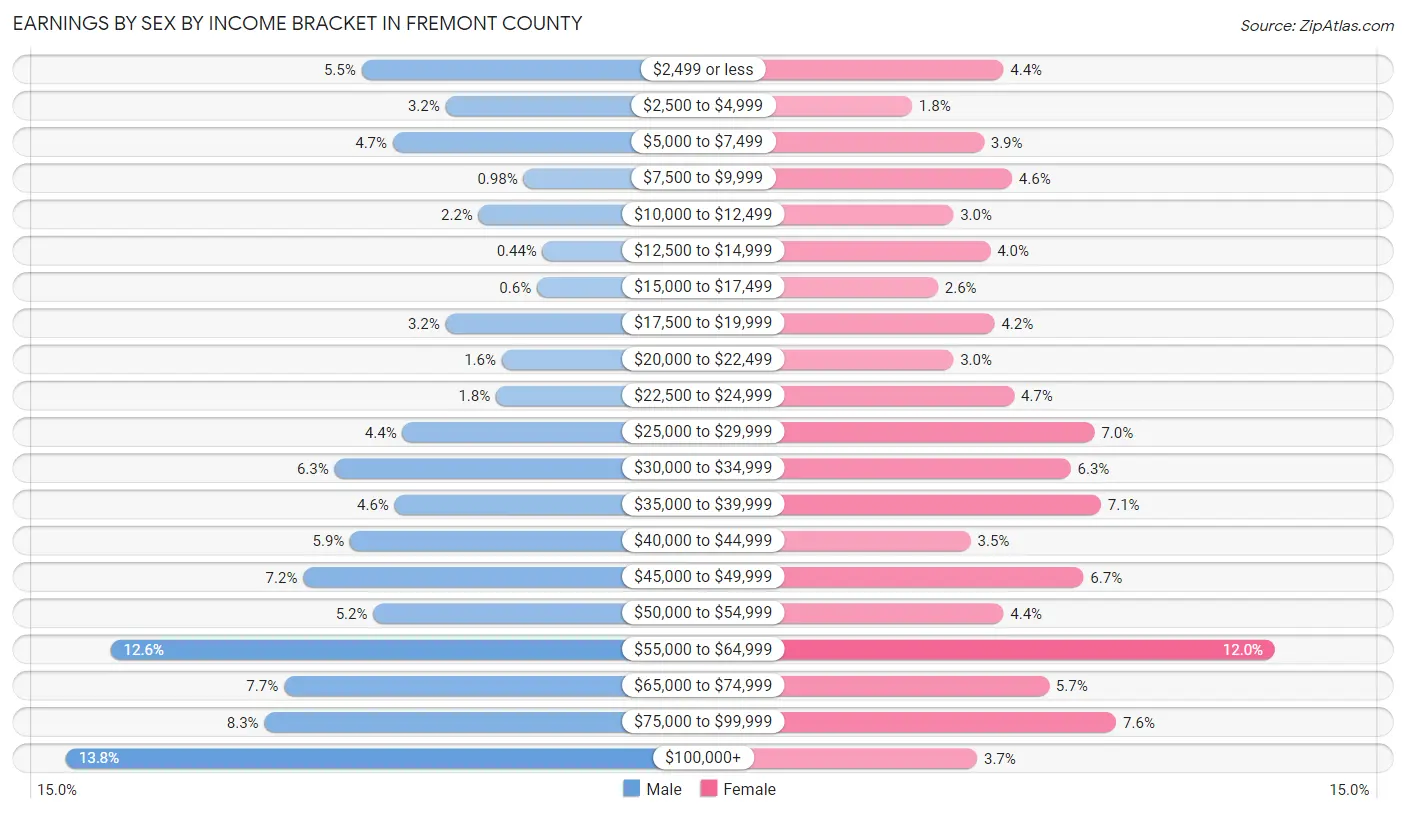
Earnings by Sex by Income Bracket in Fremont County
The most common earnings brackets in Fremont County are $100,000+ for men (253 | 13.8%) and $55,000 to $64,999 for women (197 | 12.0%).
| Income | Male | Female |
| $2,499 or less | 101 (5.5%) | 72 (4.4%) |
| $2,500 to $4,999 | 58 (3.2%) | 30 (1.8%) |
| $5,000 to $7,499 | 85 (4.6%) | 63 (3.8%) |
| $7,500 to $9,999 | 18 (1.0%) | 76 (4.6%) |
| $10,000 to $12,499 | 41 (2.2%) | 49 (3.0%) |
| $12,500 to $14,999 | 8 (0.4%) | 66 (4.0%) |
| $15,000 to $17,499 | 11 (0.6%) | 42 (2.6%) |
| $17,500 to $19,999 | 58 (3.2%) | 68 (4.2%) |
| $20,000 to $22,499 | 29 (1.6%) | 49 (3.0%) |
| $22,500 to $24,999 | 32 (1.8%) | 77 (4.7%) |
| $25,000 to $29,999 | 80 (4.4%) | 114 (7.0%) |
| $30,000 to $34,999 | 115 (6.3%) | 103 (6.3%) |
| $35,000 to $39,999 | 84 (4.6%) | 117 (7.1%) |
| $40,000 to $44,999 | 107 (5.9%) | 57 (3.5%) |
| $45,000 to $49,999 | 131 (7.2%) | 109 (6.7%) |
| $50,000 to $54,999 | 95 (5.2%) | 72 (4.4%) |
| $55,000 to $64,999 | 230 (12.6%) | 197 (12.0%) |
| $65,000 to $74,999 | 141 (7.7%) | 93 (5.7%) |
| $75,000 to $99,999 | 151 (8.3%) | 124 (7.6%) |
| $100,000+ | 253 (13.8%) | 60 (3.7%) |
| Total | 1,828 (100.0%) | 1,638 (100.0%) |
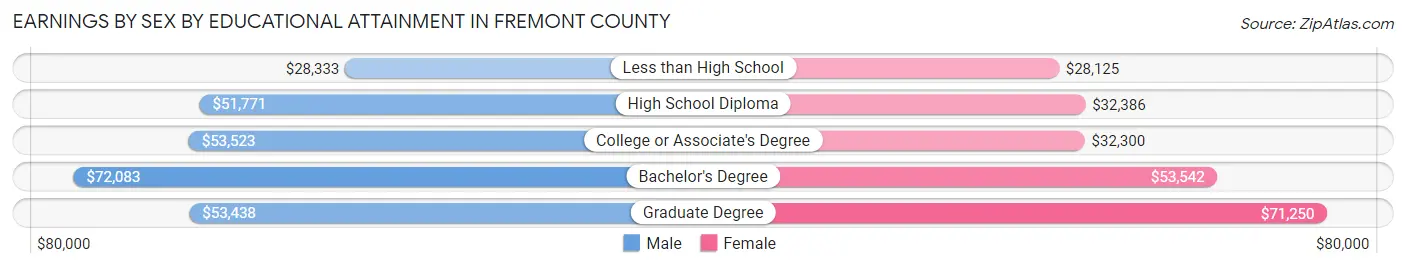
Earnings by Sex by Educational Attainment in Fremont County
Average earnings in Fremont County are $53,512 for men and $37,966 for women, a difference of 29.0%. Men with an educational attainment of bachelor's degree enjoy the highest average annual earnings of $72,083, while those with less than high school education earn the least with $28,333. Women with an educational attainment of graduate degree earn the most with the average annual earnings of $71,250, while those with less than high school education have the smallest earnings of $28,125.
| Educational Attainment | Male Income | Female Income |
| Less than High School | $28,333 | $28,125 |
| High School Diploma | $51,771 | $32,386 |
| College or Associate's Degree | $53,523 | $32,300 |
| Bachelor's Degree | $72,083 | $53,542 |
| Graduate Degree | $53,438 | $71,250 |
| Total | $53,512 | $37,966 |
Family Income in Fremont County
Family Income Brackets in Fremont County
According to the Fremont County family income data, there are 362 families falling into the $100,000 to $149,999 income range, which is the most common income bracket and makes up 20.9% of all families. Conversely, the $10,000 to $14,999 income bracket is the least frequent group with only 10 families (0.6%) belonging to this category.
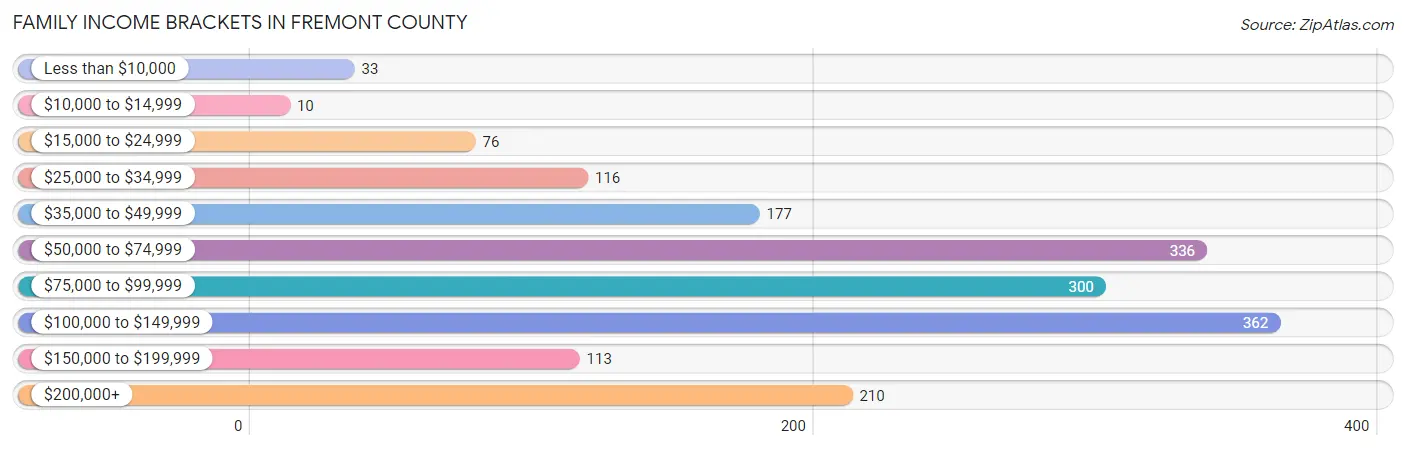
| Income Bracket | # Families | % Families |
| Less than $10,000 | 33 | 1.9% |
| $10,000 to $14,999 | 10 | 0.6% |
| $15,000 to $24,999 | 76 | 4.4% |
| $25,000 to $34,999 | 116 | 6.7% |
| $35,000 to $49,999 | 177 | 10.2% |
| $50,000 to $74,999 | 336 | 19.4% |
| $75,000 to $99,999 | 300 | 17.3% |
| $100,000 to $149,999 | 362 | 20.9% |
| $150,000 to $199,999 | 113 | 6.5% |
| $200,000+ | 210 | 12.1% |
Family Income by Famaliy Size in Fremont County
4-person families (309 | 17.8%) account for the highest median family income in Fremont County with $109,306 per family, while 2-person families (964 | 55.6%) have the highest median income of $35,478 per family member.
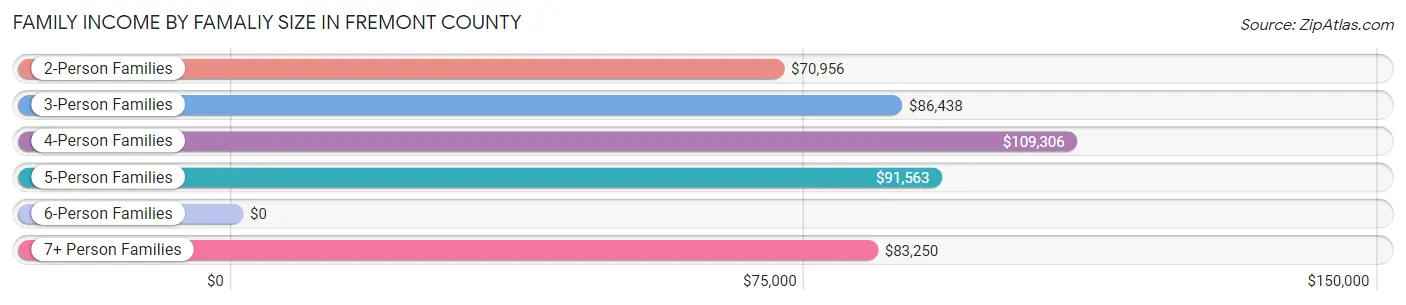
| Income Bracket | # Families | Median Income |
| 2-Person Families | 964 (55.6%) | $70,956 |
| 3-Person Families | 269 (15.5%) | $86,438 |
| 4-Person Families | 309 (17.8%) | $109,306 |
| 5-Person Families | 101 (5.8%) | $91,563 |
| 6-Person Families | 75 (4.3%) | $0 |
| 7+ Person Families | 15 (0.9%) | $83,250 |
| Total | 1,733 (100.0%) | $83,844 |
Family Income by Number of Earners in Fremont County
The median family income in Fremont County is $83,844, with families comprising 3+ earners (174) having the highest median family income of $130,000, while families with no earners (337) have the lowest median family income of $46,964, accounting for 10.0% and 19.5% of families, respectively.
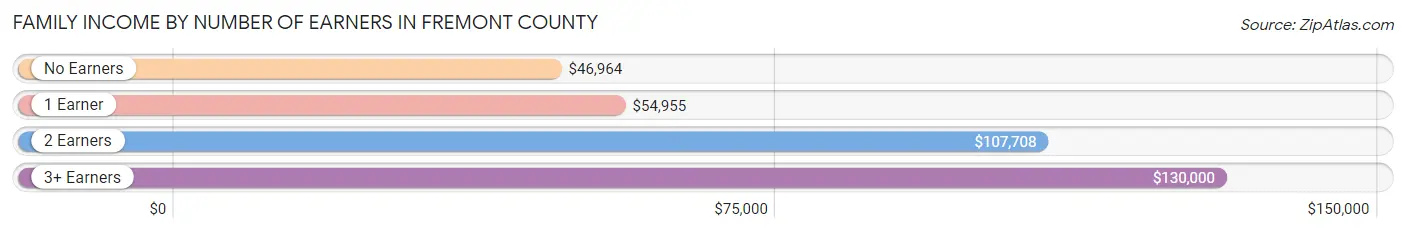
| Number of Earners | # Families | Median Income |
| No Earners | 337 (19.5%) | $46,964 |
| 1 Earner | 454 (26.2%) | $54,955 |
| 2 Earners | 768 (44.3%) | $107,708 |
| 3+ Earners | 174 (10.0%) | $130,000 |
| Total | 1,733 (100.0%) | $83,844 |
Household Income in Fremont County
Household Income Brackets in Fremont County
With 514 households falling in the category, the $50,000 to $74,999 income range is the most frequent in Fremont County, accounting for 18.8% of all households. In contrast, only 77 households (2.8%) fall into the $10,000 to $14,999 income bracket, making it the least populous group.
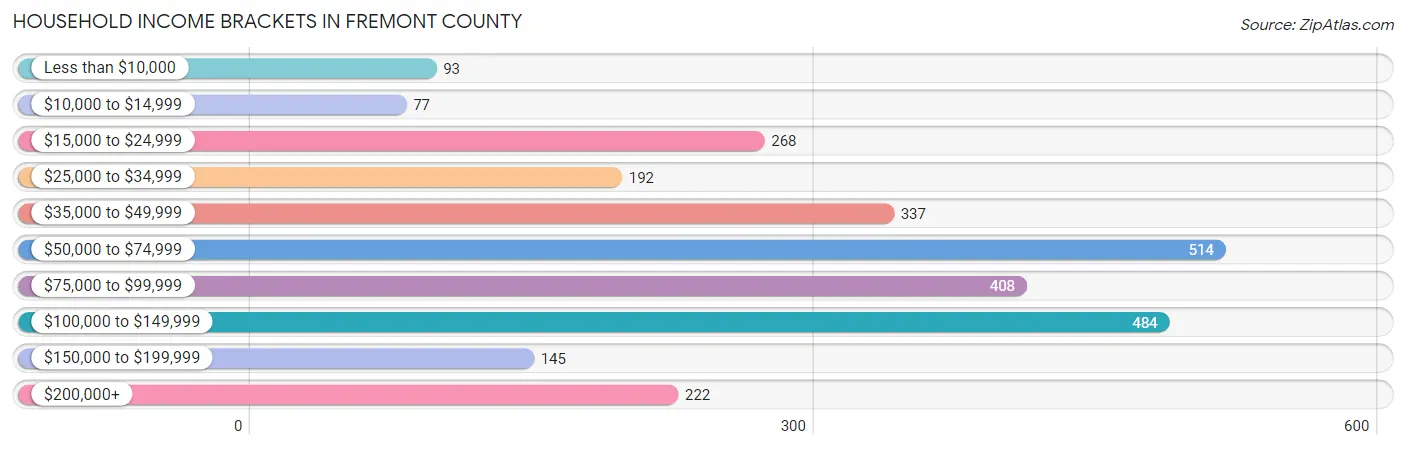
| Income Bracket | # Households | % Households |
| Less than $10,000 | 93 | 3.4% |
| $10,000 to $14,999 | 77 | 2.8% |
| $15,000 to $24,999 | 268 | 9.8% |
| $25,000 to $34,999 | 192 | 7.0% |
| $35,000 to $49,999 | 337 | 12.3% |
| $50,000 to $74,999 | 514 | 18.8% |
| $75,000 to $99,999 | 408 | 14.9% |
| $100,000 to $149,999 | 484 | 17.7% |
| $150,000 to $199,999 | 145 | 5.3% |
| $200,000+ | 222 | 8.1% |
Household Income by Householder Age in Fremont County
The median household income in Fremont County is $69,375, with the highest median household income of $82,417 found in the 45 to 64 years age bracket for the primary householder. A total of 1,131 households (41.3%) fall into this category. Meanwhile, the 65+ years age bracket for the primary householder has the lowest median household income of $50,938, with 839 households (30.7%) in this group.
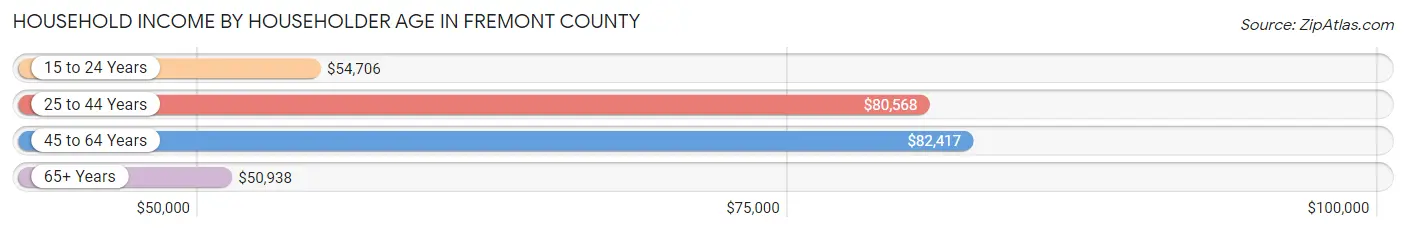
| Income Bracket | # Households | Median Income |
| 15 to 24 Years | 122 (4.5%) | $54,706 |
| 25 to 44 Years | 644 (23.5%) | $80,568 |
| 45 to 64 Years | 1,131 (41.3%) | $82,417 |
| 65+ Years | 839 (30.7%) | $50,938 |
| Total | 2,736 (100.0%) | $69,375 |
Poverty in Fremont County
Income Below Poverty by Sex and Age in Fremont County
With 5.7% poverty level for males and 9.3% for females among the residents of Fremont County, 18 to 24 year old males and 5 year old females are the most vulnerable to poverty, with 35 males (15.8%) and 10 females (26.3%) in their respective age groups living below the poverty level.
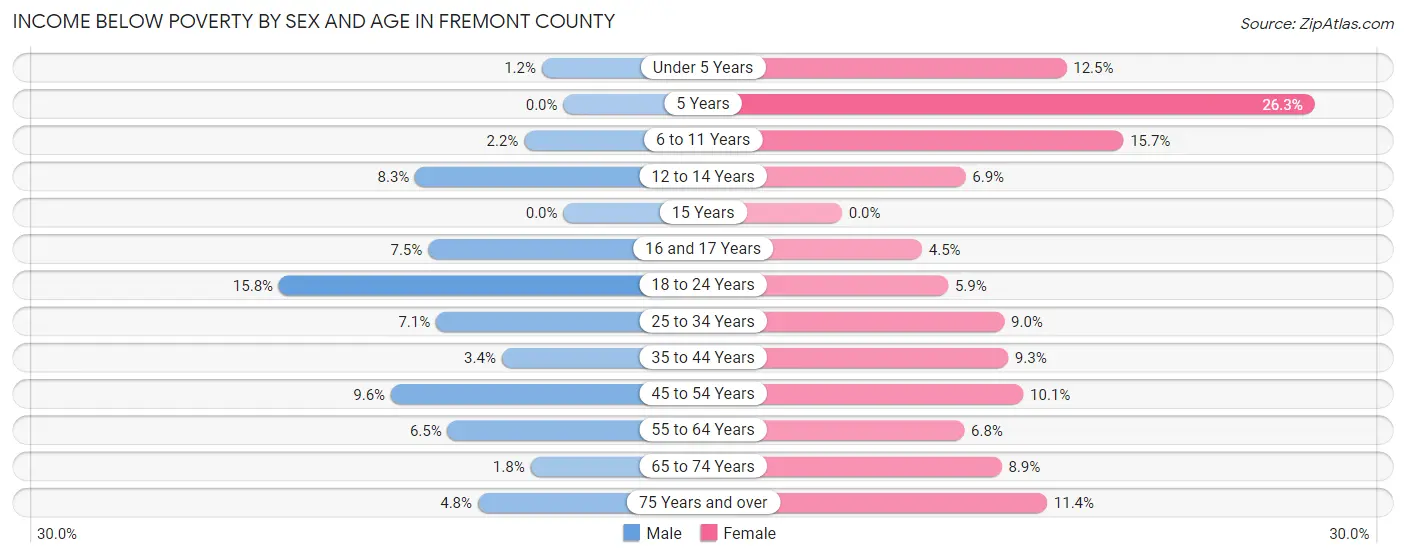
| Age Bracket | Male | Female |
| Under 5 Years | 2 (1.2%) | 19 (12.5%) |
| 5 Years | 0 (0.0%) | 10 (26.3%) |
| 6 to 11 Years | 6 (2.2%) | 34 (15.7%) |
| 12 to 14 Years | 8 (8.3%) | 11 (6.9%) |
| 15 Years | 0 (0.0%) | 0 (0.0%) |
| 16 and 17 Years | 7 (7.5%) | 5 (4.5%) |
| 18 to 24 Years | 35 (15.8%) | 12 (5.9%) |
| 25 to 34 Years | 21 (7.1%) | 30 (9.0%) |
| 35 to 44 Years | 12 (3.4%) | 31 (9.2%) |
| 45 to 54 Years | 41 (9.6%) | 40 (10.1%) |
| 55 to 64 Years | 35 (6.5%) | 37 (6.8%) |
| 65 to 74 Years | 8 (1.8%) | 37 (8.9%) |
| 75 Years and over | 11 (4.8%) | 37 (11.4%) |
| Total | 186 (5.7%) | 303 (9.3%) |
Income Above Poverty by Sex and Age in Fremont County
According to the poverty statistics in Fremont County, males aged 5 years and females aged 15 years are the age groups that are most secure financially, with 100.0% of males and 100.0% of females in these age groups living above the poverty line.
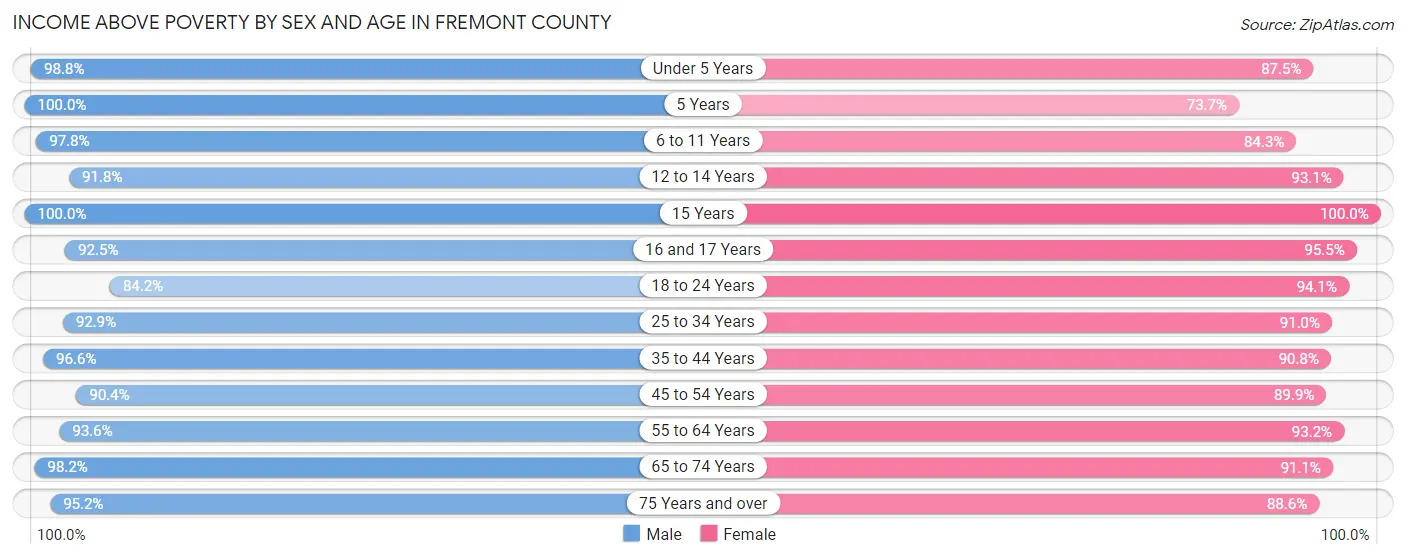
| Age Bracket | Male | Female |
| Under 5 Years | 164 (98.8%) | 133 (87.5%) |
| 5 Years | 29 (100.0%) | 28 (73.7%) |
| 6 to 11 Years | 269 (97.8%) | 183 (84.3%) |
| 12 to 14 Years | 89 (91.7%) | 149 (93.1%) |
| 15 Years | 83 (100.0%) | 13 (100.0%) |
| 16 and 17 Years | 86 (92.5%) | 107 (95.5%) |
| 18 to 24 Years | 186 (84.2%) | 191 (94.1%) |
| 25 to 34 Years | 275 (92.9%) | 302 (91.0%) |
| 35 to 44 Years | 338 (96.6%) | 304 (90.7%) |
| 45 to 54 Years | 386 (90.4%) | 356 (89.9%) |
| 55 to 64 Years | 508 (93.5%) | 506 (93.2%) |
| 65 to 74 Years | 428 (98.2%) | 379 (91.1%) |
| 75 Years and over | 220 (95.2%) | 287 (88.6%) |
| Total | 3,061 (94.3%) | 2,938 (90.6%) |
Income Below Poverty Among Married-Couple Families in Fremont County
The poverty statistics for married-couple families in Fremont County show that 4.1% or 60 of the total 1,473 families live below the poverty line. Families with 5 or more children have the highest poverty rate of 12.5%, comprising of 1 families. On the other hand, families with 1 or 2 children have the lowest poverty rate of 0.7%, which includes 3 families.
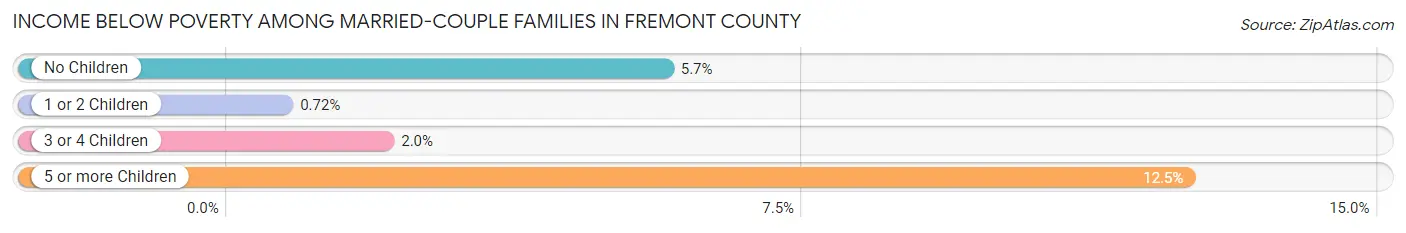
| Children | Above Poverty | Below Poverty |
| No Children | 895 (94.3%) | 54 (5.7%) |
| 1 or 2 Children | 415 (99.3%) | 3 (0.7%) |
| 3 or 4 Children | 96 (98.0%) | 2 (2.0%) |
| 5 or more Children | 7 (87.5%) | 1 (12.5%) |
| Total | 1,413 (95.9%) | 60 (4.1%) |
Income Below Poverty Among Single-Parent Households in Fremont County
According to the poverty data in Fremont County, 6.8% or 6 single-father households and 12.2% or 21 single-mother households are living below the poverty line. Among single-father households, those with 3 or 4 children have the highest poverty rate, with 6 households (46.2%) experiencing poverty. Likewise, among single-mother households, those with 3 or 4 children have the highest poverty rate, with 11 households (22.9%) falling below the poverty line.
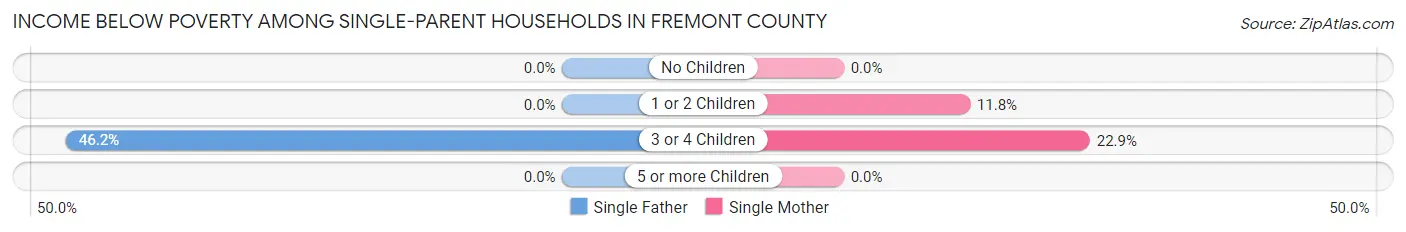
| Children | Single Father | Single Mother |
| No Children | 0 (0.0%) | 0 (0.0%) |
| 1 or 2 Children | 0 (0.0%) | 10 (11.8%) |
| 3 or 4 Children | 6 (46.2%) | 11 (22.9%) |
| 5 or more Children | 0 (0.0%) | 0 (0.0%) |
| Total | 6 (6.8%) | 21 (12.2%) |
Income Below Poverty Among Married-Couple vs Single-Parent Households in Fremont County
The poverty data for Fremont County shows that 60 of the married-couple family households (4.1%) and 27 of the single-parent households (10.4%) are living below the poverty level. Within the married-couple family households, those with 5 or more children have the highest poverty rate, with 1 households (12.5%) falling below the poverty line. Among the single-parent households, those with 3 or 4 children have the highest poverty rate, with 17 household (27.9%) living below poverty.
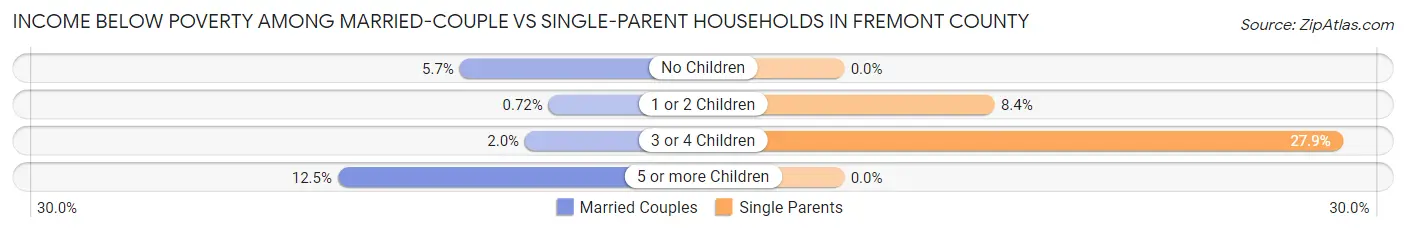
| Children | Married-Couple Families | Single-Parent Households |
| No Children | 54 (5.7%) | 0 (0.0%) |
| 1 or 2 Children | 3 (0.7%) | 10 (8.4%) |
| 3 or 4 Children | 2 (2.0%) | 17 (27.9%) |
| 5 or more Children | 1 (12.5%) | 0 (0.0%) |
| Total | 60 (4.1%) | 27 (10.4%) |
Race in Fremont County
The most populous races in Fremont County are White / Caucasian (6,224 | 93.8%), Two or more Races (331 | 5.0%), and Hispanic or Latino (206 | 3.1%).
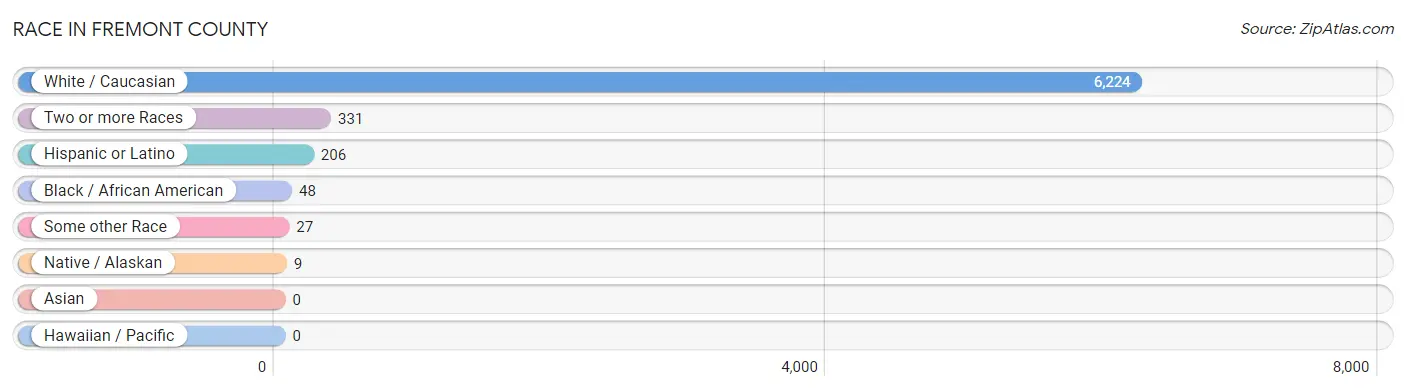
| Race | # Population | % Population |
| Asian | 0 | 0.0% |
| Black / African American | 48 | 0.7% |
| Hawaiian / Pacific | 0 | 0.0% |
| Hispanic or Latino | 206 | 3.1% |
| Native / Alaskan | 9 | 0.1% |
| White / Caucasian | 6,224 | 93.8% |
| Two or more Races | 331 | 5.0% |
| Some other Race | 27 | 0.4% |
| Total | 6,639 | 100.0% |
Ancestry in Fremont County
The most populous ancestries reported in Fremont County are German (2,064 | 31.1%), Irish (886 | 13.4%), English (804 | 12.1%), American (494 | 7.4%), and European (174 | 2.6%), together accounting for 66.6% of all Fremont County residents.
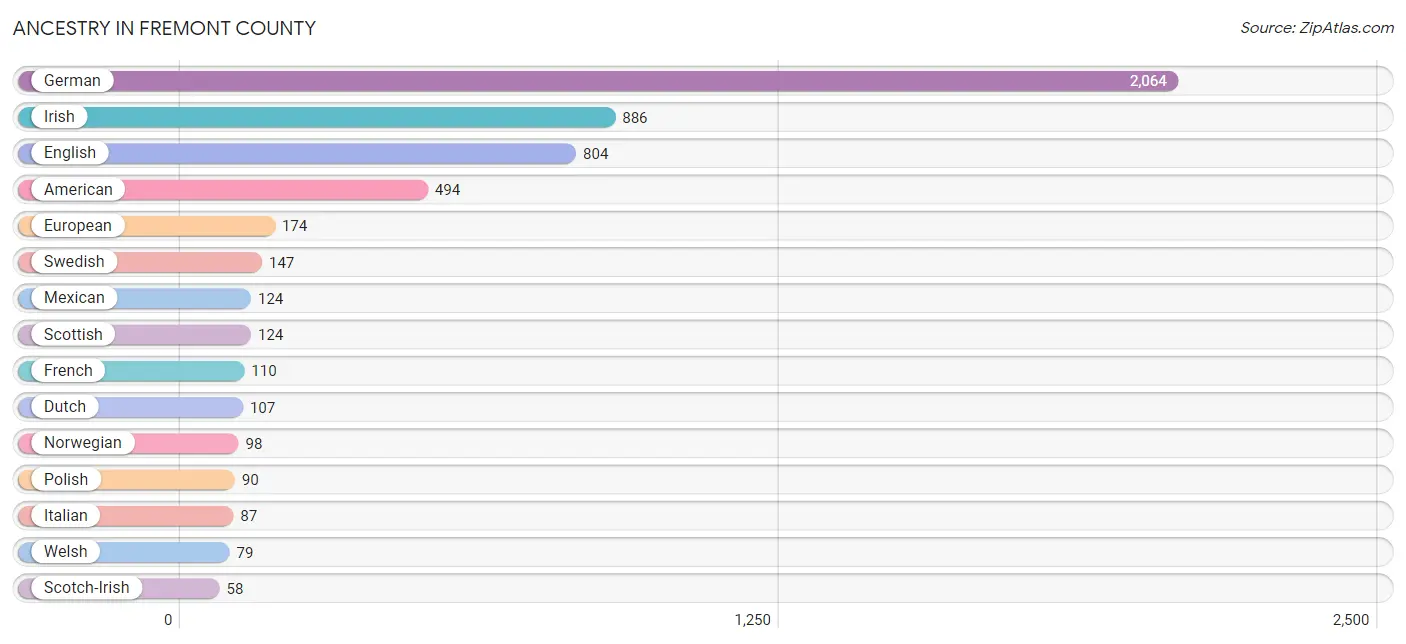
| Ancestry | # Population | % Population |
| American | 494 | 7.4% |
| Basque | 12 | 0.2% |
| Bhutanese | 31 | 0.5% |
| British | 18 | 0.3% |
| Canadian | 12 | 0.2% |
| Cherokee | 12 | 0.2% |
| Cuban | 14 | 0.2% |
| Czech | 52 | 0.8% |
| Czechoslovakian | 10 | 0.2% |
| Danish | 38 | 0.6% |
| Dutch | 107 | 1.6% |
| Eastern European | 50 | 0.7% |
| English | 804 | 12.1% |
| European | 174 | 2.6% |
| Finnish | 7 | 0.1% |
| French | 110 | 1.7% |
| French Canadian | 31 | 0.5% |
| German | 2,064 | 31.1% |
| Greek | 5 | 0.1% |
| Hungarian | 2 | 0.0% |
| Irish | 886 | 13.4% |
| Italian | 87 | 1.3% |
| Korean | 21 | 0.3% |
| Latvian | 3 | 0.1% |
| Lithuanian | 3 | 0.1% |
| Mexican | 124 | 1.9% |
| Northern European | 3 | 0.1% |
| Norwegian | 98 | 1.5% |
| Pennsylvania German | 6 | 0.1% |
| Polish | 90 | 1.4% |
| Portuguese | 4 | 0.1% |
| Puerto Rican | 33 | 0.5% |
| Russian | 12 | 0.2% |
| Scandinavian | 25 | 0.4% |
| Scotch-Irish | 58 | 0.9% |
| Scottish | 124 | 1.9% |
| Serbian | 5 | 0.1% |
| Sioux | 6 | 0.1% |
| Spanish | 23 | 0.4% |
| Sri Lankan | 25 | 0.4% |
| Subsaharan African | 16 | 0.2% |
| Swedish | 147 | 2.2% |
| Swiss | 15 | 0.2% |
| Welsh | 79 | 1.2% | View All 44 Rows |
Immigrants in Fremont County
The most numerous immigrant groups reported in Fremont County came from Central America (37 | 0.6%), Latin America (37 | 0.6%), Mexico (37 | 0.6%), Africa (14 | 0.2%), and Western Africa (14 | 0.2%), together accounting for 2.1% of all Fremont County residents.
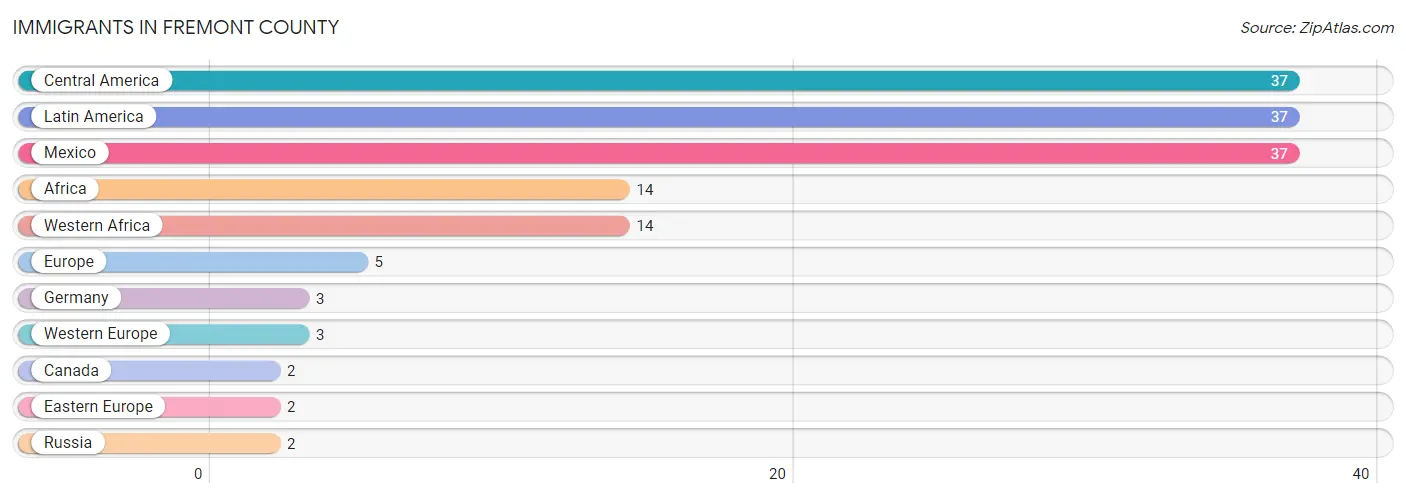
| Immigration Origin | # Population | % Population |
| Africa | 14 | 0.2% |
| Canada | 2 | 0.0% |
| Central America | 37 | 0.6% |
| Eastern Europe | 2 | 0.0% |
| Europe | 5 | 0.1% |
| Germany | 3 | 0.1% |
| Latin America | 37 | 0.6% |
| Mexico | 37 | 0.6% |
| Russia | 2 | 0.0% |
| Western Africa | 14 | 0.2% |
| Western Europe | 3 | 0.1% | View All 11 Rows |
Sex and Age in Fremont County
Sex and Age in Fremont County
The most populous age groups in Fremont County are 60 to 64 Years (304 | 9.1%) for men and 60 to 64 Years (335 | 10.1%) for women.
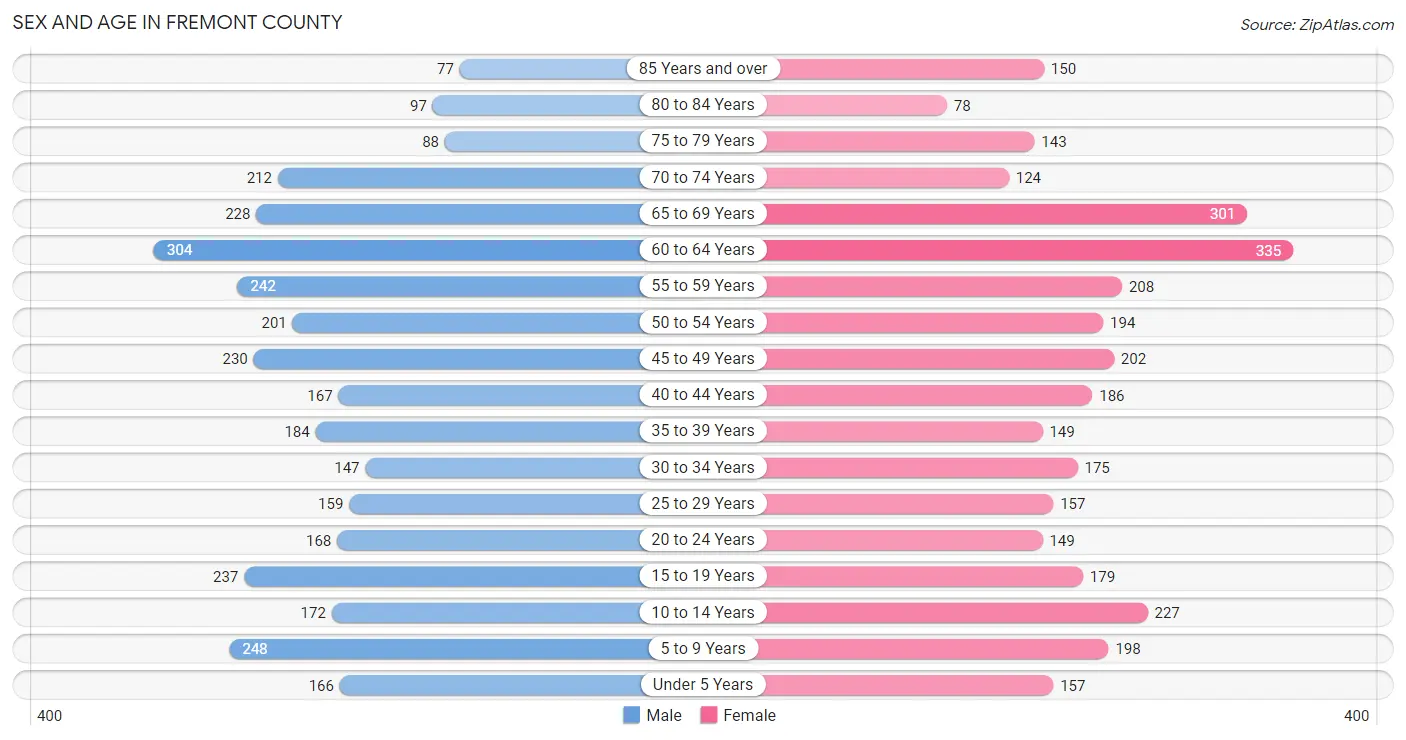
| Age Bracket | Male | Female |
| Under 5 Years | 166 (5.0%) | 157 (4.7%) |
| 5 to 9 Years | 248 (7.4%) | 198 (6.0%) |
| 10 to 14 Years | 172 (5.2%) | 227 (6.9%) |
| 15 to 19 Years | 237 (7.1%) | 179 (5.4%) |
| 20 to 24 Years | 168 (5.1%) | 149 (4.5%) |
| 25 to 29 Years | 159 (4.8%) | 157 (4.7%) |
| 30 to 34 Years | 147 (4.4%) | 175 (5.3%) |
| 35 to 39 Years | 184 (5.5%) | 149 (4.5%) |
| 40 to 44 Years | 167 (5.0%) | 186 (5.6%) |
| 45 to 49 Years | 230 (6.9%) | 202 (6.1%) |
| 50 to 54 Years | 201 (6.0%) | 194 (5.9%) |
| 55 to 59 Years | 242 (7.3%) | 208 (6.3%) |
| 60 to 64 Years | 304 (9.1%) | 335 (10.1%) |
| 65 to 69 Years | 228 (6.9%) | 301 (9.1%) |
| 70 to 74 Years | 212 (6.4%) | 124 (3.7%) |
| 75 to 79 Years | 88 (2.6%) | 143 (4.3%) |
| 80 to 84 Years | 97 (2.9%) | 78 (2.4%) |
| 85 Years and over | 77 (2.3%) | 150 (4.5%) |
| Total | 3,327 (100.0%) | 3,312 (100.0%) |
Families and Households in Fremont County
Median Family Size in Fremont County
The median family size in Fremont County is 2.99 persons per family, with single female/mother families (172 | 9.9%) accounting for the largest median family size of 3.08 persons per family. On the other hand, single male/father families (88 | 5.1%) represent the smallest median family size with 2.88 persons per family.
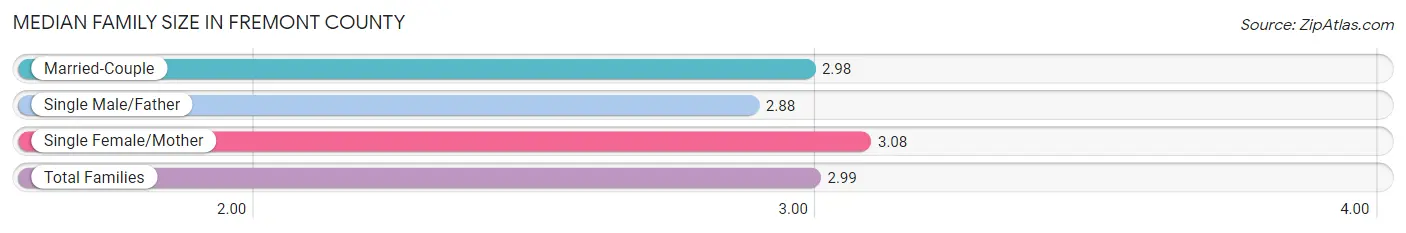
| Family Type | # Families | Family Size |
| Married-Couple | 1,473 (85.0%) | 2.98 |
| Single Male/Father | 88 (5.1%) | 2.88 |
| Single Female/Mother | 172 (9.9%) | 3.08 |
| Total Families | 1,733 (100.0%) | 2.99 |
Median Household Size in Fremont County
The median household size in Fremont County is 2.38 persons per household, with single female/mother households (172 | 6.3%) accounting for the largest median household size of 3.42 persons per household. non-family households (1,003 | 36.7%) represent the smallest median household size with 1.23 persons per household.
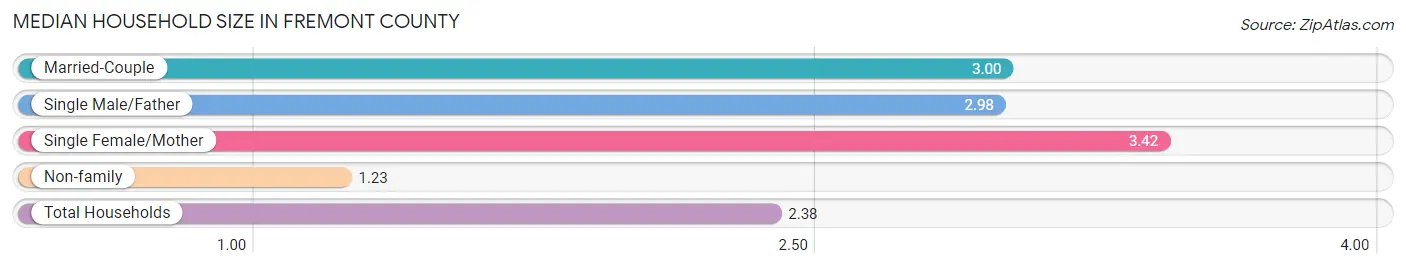
| Household Type | # Households | Household Size |
| Married-Couple | 1,473 (53.8%) | 3.00 |
| Single Male/Father | 88 (3.2%) | 2.98 |
| Single Female/Mother | 172 (6.3%) | 3.42 |
| Non-family | 1,003 (36.7%) | 1.23 |
| Total Households | 2,736 (100.0%) | 2.38 |
Household Size by Marriage Status in Fremont County
Out of a total of 2,736 households in Fremont County, 1,733 (63.3%) are family households, while 1,003 (36.7%) are nonfamily households. The most numerous type of family households are 2-person households, comprising 948, and the most common type of nonfamily households are 1-person households, comprising 776.
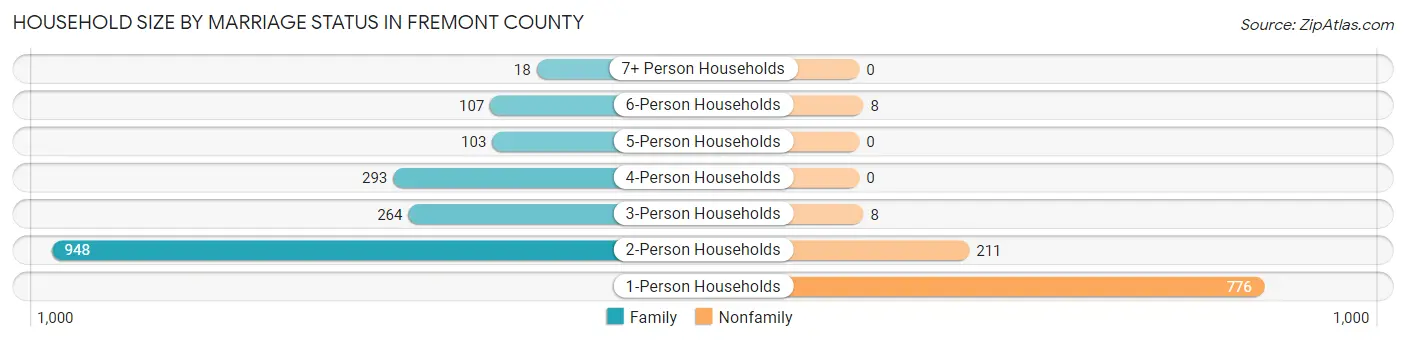
| Household Size | Family Households | Nonfamily Households |
| 1-Person Households | - | 776 (28.4%) |
| 2-Person Households | 948 (34.6%) | 211 (7.7%) |
| 3-Person Households | 264 (9.7%) | 8 (0.3%) |
| 4-Person Households | 293 (10.7%) | 0 (0.0%) |
| 5-Person Households | 103 (3.8%) | 0 (0.0%) |
| 6-Person Households | 107 (3.9%) | 8 (0.3%) |
| 7+ Person Households | 18 (0.7%) | 0 (0.0%) |
| Total | 1,733 (63.3%) | 1,003 (36.7%) |
Female Fertility in Fremont County
Fertility by Age in Fremont County
Average fertility rate in Fremont County is 48.0 births per 1,000 women. Women in the age bracket of 20 to 34 years have the highest fertility rate with 116.0 births per 1,000 women. Women in the age bracket of 20 to 34 years acount for 93.3% of all women with births.
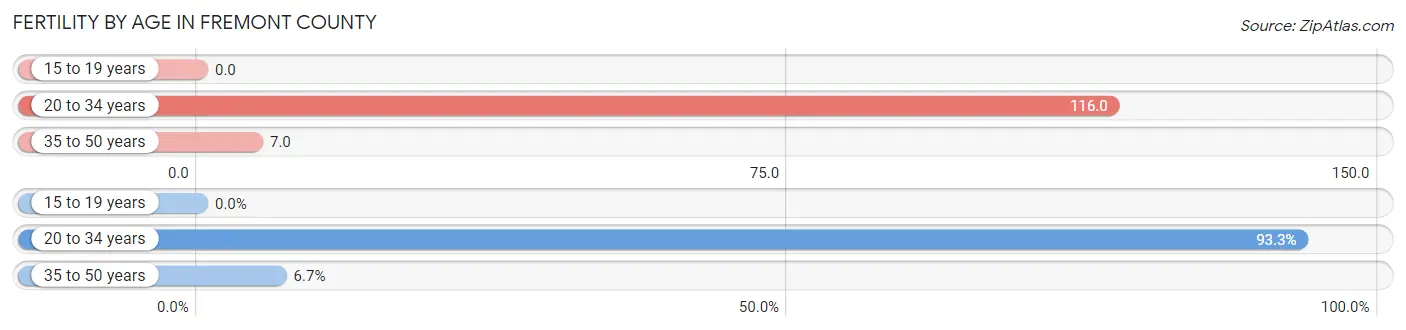
| Age Bracket | Women with Births | Births / 1,000 Women |
| 15 to 19 years | 0 (0.0%) | 0.0 |
| 20 to 34 years | 56 (93.3%) | 116.0 |
| 35 to 50 years | 4 (6.7%) | 7.0 |
| Total | 60 (100.0%) | 48.0 |
Fertility by Age by Marriage Status in Fremont County
48.3% of women with births (60) in Fremont County are married. The highest percentage of unmarried women with births falls into 20 to 34 years age bracket with 55.4% of them unmarried at the time of birth, while the lowest percentage of unmarried women with births belong to 35 to 50 years age bracket with 0.0% of them unmarried.
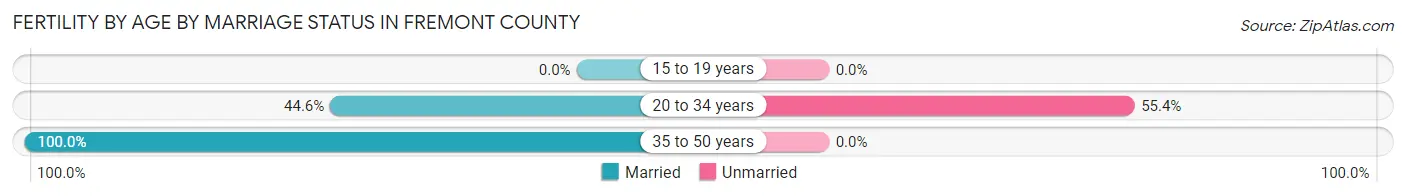
| Age Bracket | Married | Unmarried |
| 15 to 19 years | 0 (0.0%) | 0 (0.0%) |
| 20 to 34 years | 25 (44.6%) | 31 (55.4%) |
| 35 to 50 years | 4 (100.0%) | 0 (0.0%) |
| Total | 29 (48.3%) | 31 (51.7%) |
Fertility by Education in Fremont County
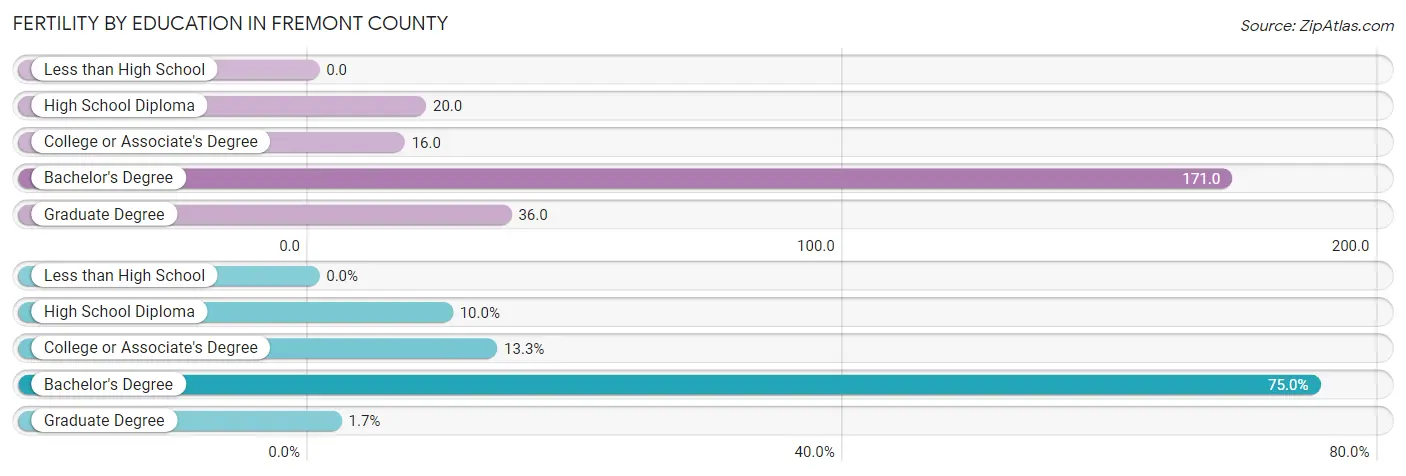
| Educational Attainment | Women with Births | Births / 1,000 Women |
| Less than High School | 0 (0.0%) | 0.0 |
| High School Diploma | 6 (10.0%) | 20.0 |
| College or Associate's Degree | 8 (13.3%) | 16.0 |
| Bachelor's Degree | 45 (75.0%) | 171.0 |
| Graduate Degree | 1 (1.7%) | 36.0 |
| Total | 60 (100.0%) | 48.0 |
Fertility by Education by Marriage Status in Fremont County
51.7% of women with births in Fremont County are unmarried. Women with the educational attainment of college or associate's degree are most likely to be married with 100.0% of them married at childbirth, while women with the educational attainment of bachelor's degree are least likely to be married with 66.7% of them unmarried at childbirth.
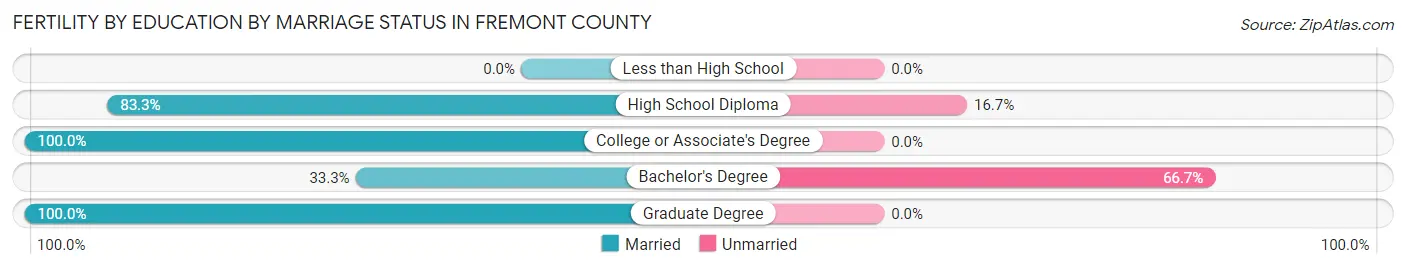
| Educational Attainment | Married | Unmarried |
| Less than High School | 0 (0.0%) | 0 (0.0%) |
| High School Diploma | 5 (83.3%) | 1 (16.7%) |
| College or Associate's Degree | 8 (100.0%) | 0 (0.0%) |
| Bachelor's Degree | 15 (33.3%) | 30 (66.7%) |
| Graduate Degree | 1 (100.0%) | 0 (0.0%) |
| Total | 29 (48.3%) | 31 (51.7%) |
Employment Characteristics in Fremont County
Employment by Class of Employer in Fremont County
Among the 3,089 employed individuals in Fremont County, private company employees (1,735 | 56.2%), local government employees (338 | 10.9%), and self-employed (not incorporated) (323 | 10.5%) make up the most common classes of employment.
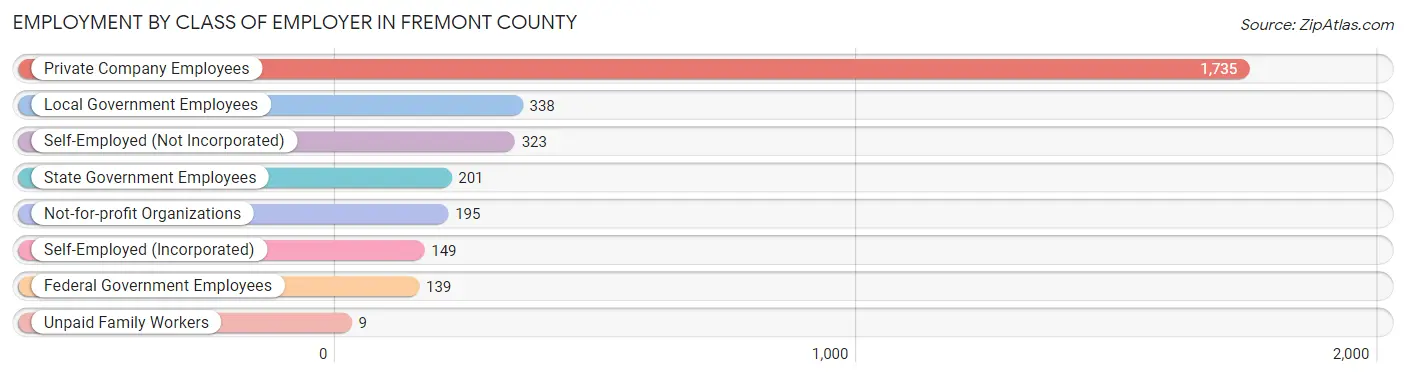
| Employer Class | # Employees | % Employees |
| Private Company Employees | 1,735 | 56.2% |
| Self-Employed (Incorporated) | 149 | 4.8% |
| Self-Employed (Not Incorporated) | 323 | 10.5% |
| Not-for-profit Organizations | 195 | 6.3% |
| Local Government Employees | 338 | 10.9% |
| State Government Employees | 201 | 6.5% |
| Federal Government Employees | 139 | 4.5% |
| Unpaid Family Workers | 9 | 0.3% |
| Total | 3,089 | 100.0% |
Employment Status by Age in Fremont County
According to the labor force statistics for Fremont County, out of the total population over 16 years of age (5,375), 59.6% or 3,204 individuals are in the labor force, with 1.7% or 54 of them unemployed. The age group with the highest labor force participation rate is 35 to 44 years, with 87.8% or 602 individuals in the labor force. Within the labor force, the 25 to 29 years age range has the highest percentage of unemployed individuals, with 8.2% or 22 of them being unemployed.
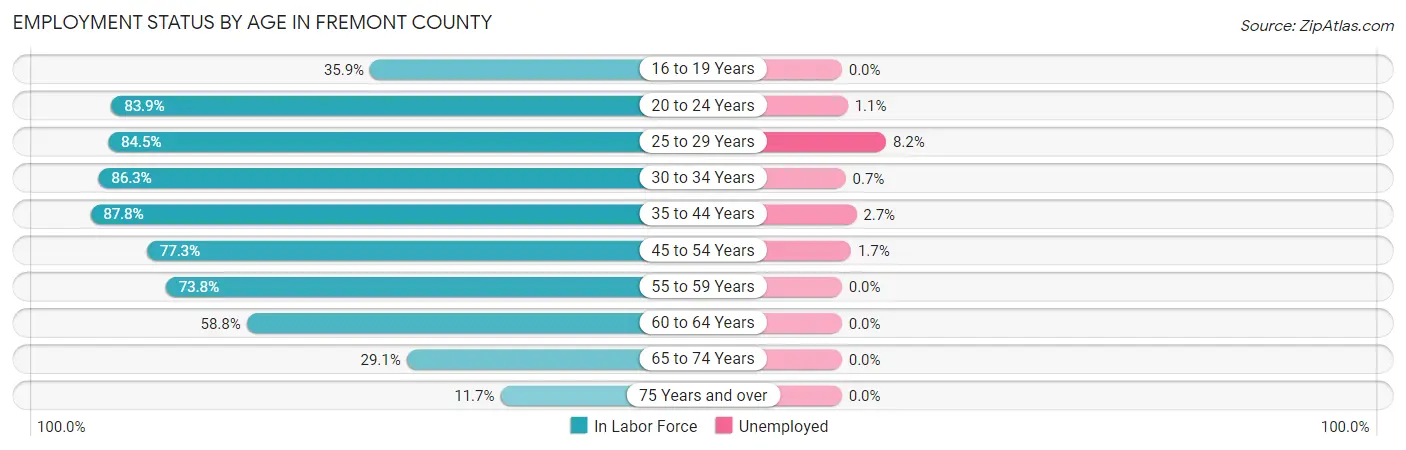
| Age Bracket | In Labor Force | Unemployed |
| 16 to 19 Years | 115 (35.9%) | 0 (0.0%) |
| 20 to 24 Years | 266 (83.9%) | 3 (1.1%) |
| 25 to 29 Years | 267 (84.5%) | 22 (8.2%) |
| 30 to 34 Years | 278 (86.3%) | 2 (0.7%) |
| 35 to 44 Years | 602 (87.8%) | 16 (2.7%) |
| 45 to 54 Years | 639 (77.3%) | 11 (1.7%) |
| 55 to 59 Years | 332 (73.8%) | 0 (0.0%) |
| 60 to 64 Years | 376 (58.8%) | 0 (0.0%) |
| 65 to 74 Years | 252 (29.1%) | 0 (0.0%) |
| 75 Years and over | 74 (11.7%) | 0 (0.0%) |
| Total | 3,204 (59.6%) | 54 (1.7%) |
Employment Status by Educational Attainment in Fremont County
According to labor force statistics for Fremont County, 77.0% of individuals (2,495) out of the total population between 25 and 64 years of age (3,240) are in the labor force, with 2.0% or 50 of them being unemployed. The group with the highest labor force participation rate are those with the educational attainment of bachelor's degree or higher, with 82.6% or 543 individuals in the labor force. Within the labor force, individuals with less than high school education have the highest percentage of unemployment, with 16.4% or 12 of them being unemployed.
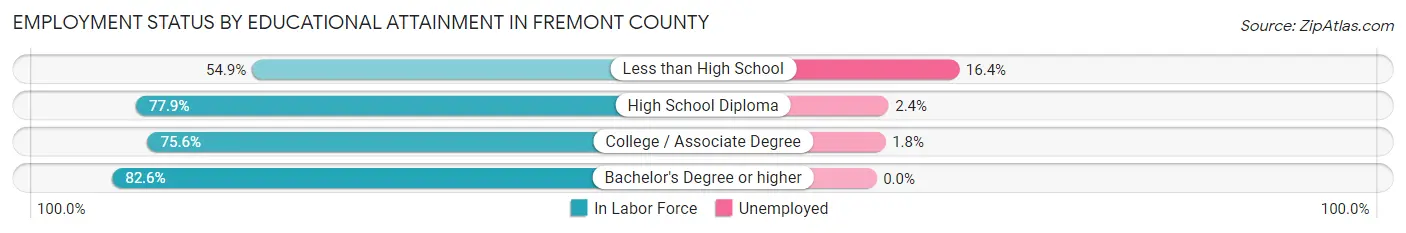
| Educational Attainment | In Labor Force | Unemployed |
| Less than High School | 73 (54.9%) | 22 (16.4%) |
| High School Diploma | 859 (77.9%) | 26 (2.4%) |
| College / Associate Degree | 1,018 (75.6%) | 24 (1.8%) |
| Bachelor's Degree or higher | 543 (82.6%) | 0 (0.0%) |
| Total | 2,495 (77.0%) | 65 (2.0%) |
Employment Occupations by Sex in Fremont County
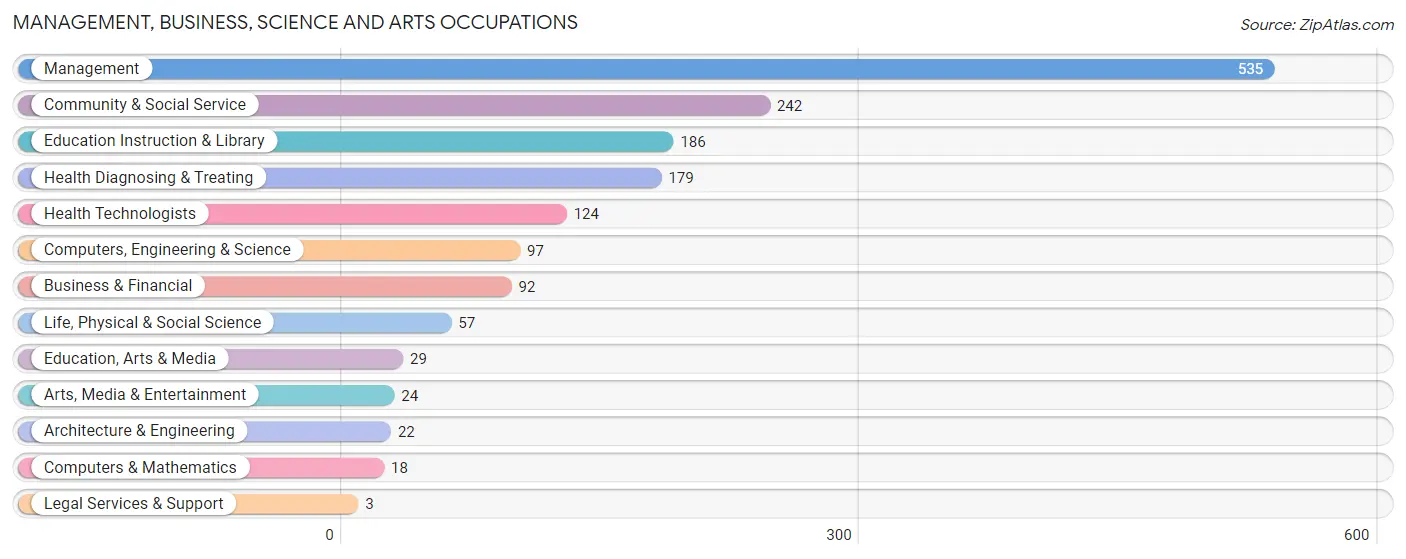
Management, Business, Science and Arts Occupations
The most common Management, Business, Science and Arts occupations in Fremont County are Management (535 | 17.1%), Community & Social Service (242 | 7.7%), Education Instruction & Library (186 | 5.9%), Health Diagnosing & Treating (179 | 5.7%), and Health Technologists (124 | 4.0%).
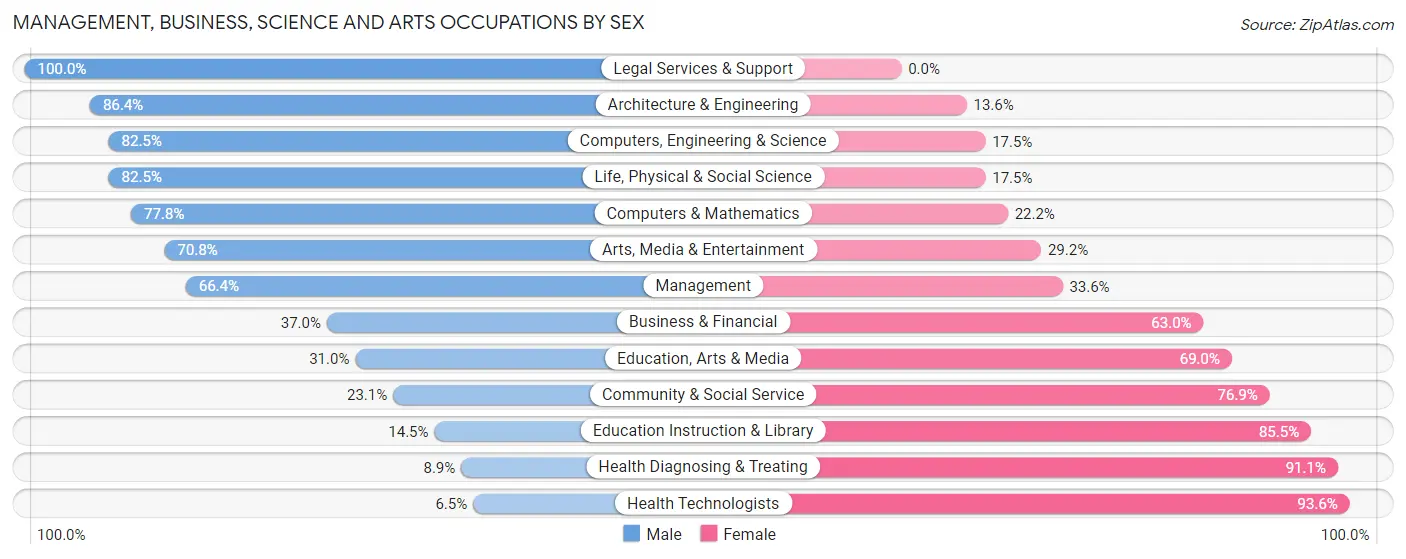
Management, Business, Science and Arts Occupations by Sex
Within the Management, Business, Science and Arts occupations in Fremont County, the most male-oriented occupations are Legal Services & Support (100.0%), Architecture & Engineering (86.4%), and Computers, Engineering & Science (82.5%), while the most female-oriented occupations are Health Technologists (93.5%), Health Diagnosing & Treating (91.1%), and Education Instruction & Library (85.5%).
| Occupation | Male | Female |
| Management | 355 (66.4%) | 180 (33.6%) |
| Business & Financial | 34 (37.0%) | 58 (63.0%) |
| Computers, Engineering & Science | 80 (82.5%) | 17 (17.5%) |
| Computers & Mathematics | 14 (77.8%) | 4 (22.2%) |
| Architecture & Engineering | 19 (86.4%) | 3 (13.6%) |
| Life, Physical & Social Science | 47 (82.5%) | 10 (17.5%) |
| Community & Social Service | 56 (23.1%) | 186 (76.9%) |
| Education, Arts & Media | 9 (31.0%) | 20 (69.0%) |
| Legal Services & Support | 3 (100.0%) | 0 (0.0%) |
| Education Instruction & Library | 27 (14.5%) | 159 (85.5%) |
| Arts, Media & Entertainment | 17 (70.8%) | 7 (29.2%) |
| Health Diagnosing & Treating | 16 (8.9%) | 163 (91.1%) |
| Health Technologists | 8 (6.5%) | 116 (93.5%) |
| Total (Category) | 541 (47.2%) | 604 (52.7%) |
| Total (Overall) | 1,657 (53.0%) | 1,472 (47.0%) |
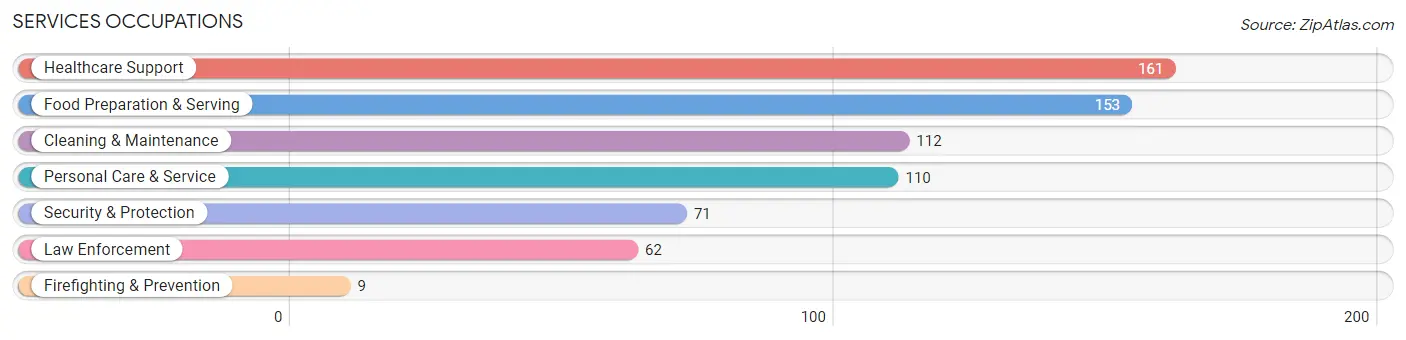
Services Occupations
The most common Services occupations in Fremont County are Healthcare Support (161 | 5.1%), Food Preparation & Serving (153 | 4.9%), Cleaning & Maintenance (112 | 3.6%), Personal Care & Service (110 | 3.5%), and Security & Protection (71 | 2.3%).
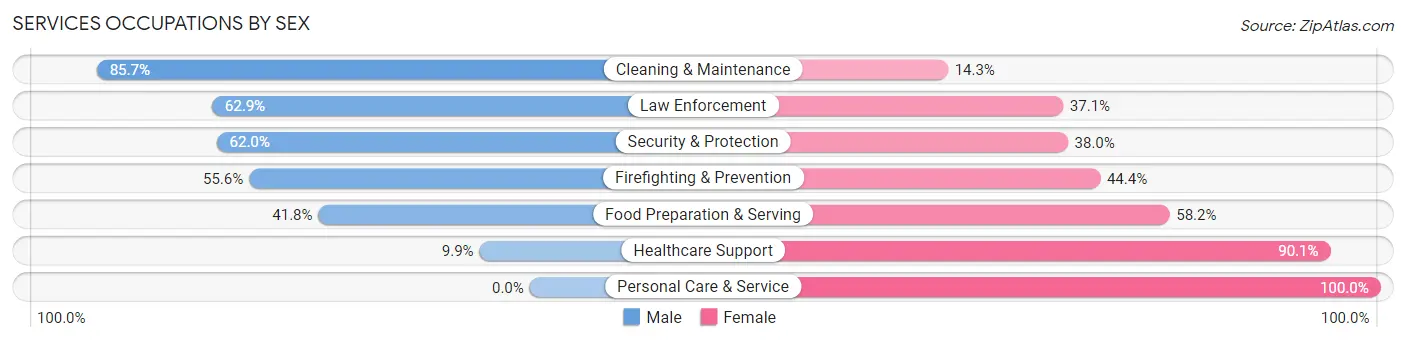
Services Occupations by Sex
Within the Services occupations in Fremont County, the most male-oriented occupations are Cleaning & Maintenance (85.7%), Law Enforcement (62.9%), and Security & Protection (62.0%), while the most female-oriented occupations are Personal Care & Service (100.0%), Healthcare Support (90.1%), and Food Preparation & Serving (58.2%).
| Occupation | Male | Female |
| Healthcare Support | 16 (9.9%) | 145 (90.1%) |
| Security & Protection | 44 (62.0%) | 27 (38.0%) |
| Firefighting & Prevention | 5 (55.6%) | 4 (44.4%) |
| Law Enforcement | 39 (62.9%) | 23 (37.1%) |
| Food Preparation & Serving | 64 (41.8%) | 89 (58.2%) |
| Cleaning & Maintenance | 96 (85.7%) | 16 (14.3%) |
| Personal Care & Service | 0 (0.0%) | 110 (100.0%) |
| Total (Category) | 220 (36.2%) | 387 (63.8%) |
| Total (Overall) | 1,657 (53.0%) | 1,472 (47.0%) |
Sales and Office Occupations
The most common Sales and Office occupations in Fremont County are Office & Administration (276 | 8.8%), and Sales & Related (205 | 6.6%).
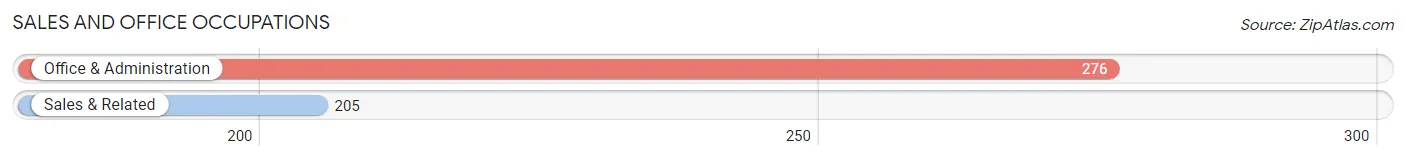
Sales and Office Occupations by Sex
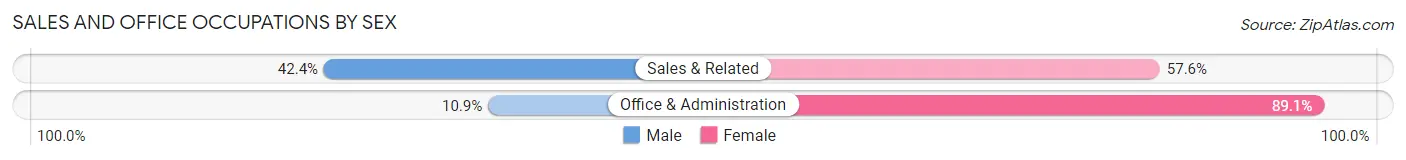
| Occupation | Male | Female |
| Sales & Related | 87 (42.4%) | 118 (57.6%) |
| Office & Administration | 30 (10.9%) | 246 (89.1%) |
| Total (Category) | 117 (24.3%) | 364 (75.7%) |
| Total (Overall) | 1,657 (53.0%) | 1,472 (47.0%) |
Natural Resources, Construction and Maintenance Occupations
The most common Natural Resources, Construction and Maintenance occupations in Fremont County are Construction & Extraction (208 | 6.7%), Installation, Maintenance & Repair (113 | 3.6%), and Farming, Fishing & Forestry (43 | 1.4%).
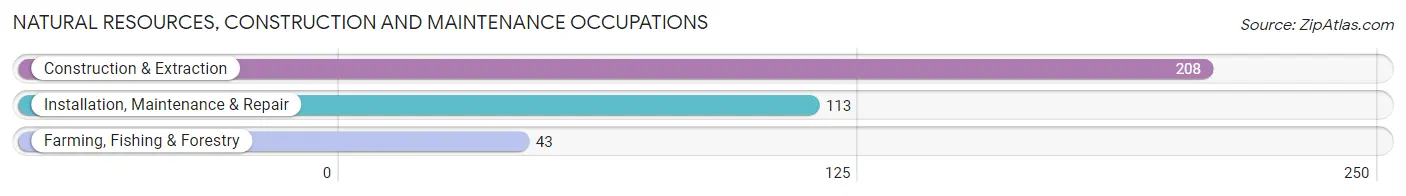
Natural Resources, Construction and Maintenance Occupations by Sex
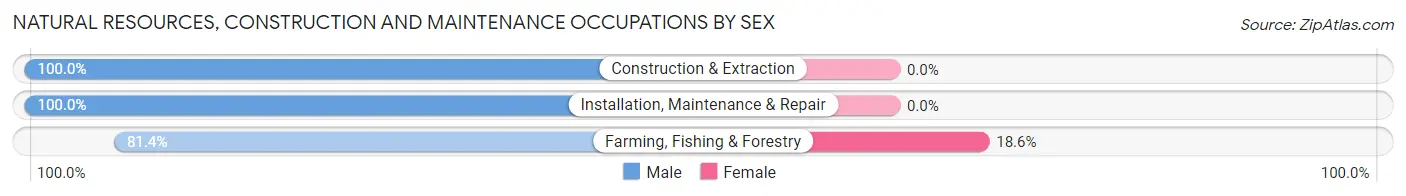
| Occupation | Male | Female |
| Farming, Fishing & Forestry | 35 (81.4%) | 8 (18.6%) |
| Construction & Extraction | 208 (100.0%) | 0 (0.0%) |
| Installation, Maintenance & Repair | 113 (100.0%) | 0 (0.0%) |
| Total (Category) | 356 (97.8%) | 8 (2.2%) |
| Total (Overall) | 1,657 (53.0%) | 1,472 (47.0%) |
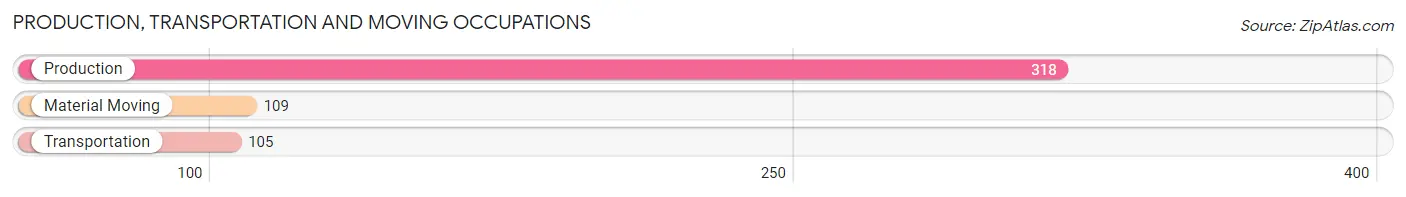
Production, Transportation and Moving Occupations
The most common Production, Transportation and Moving occupations in Fremont County are Production (318 | 10.2%), Material Moving (109 | 3.5%), and Transportation (105 | 3.4%).
Production, Transportation and Moving Occupations by Sex
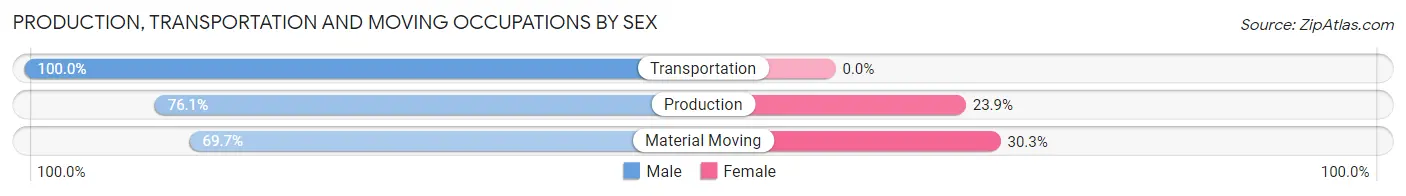
| Occupation | Male | Female |
| Production | 242 (76.1%) | 76 (23.9%) |
| Transportation | 105 (100.0%) | 0 (0.0%) |
| Material Moving | 76 (69.7%) | 33 (30.3%) |
| Total (Category) | 423 (79.5%) | 109 (20.5%) |
| Total (Overall) | 1,657 (53.0%) | 1,472 (47.0%) |
Employment Industries by Sex in Fremont County
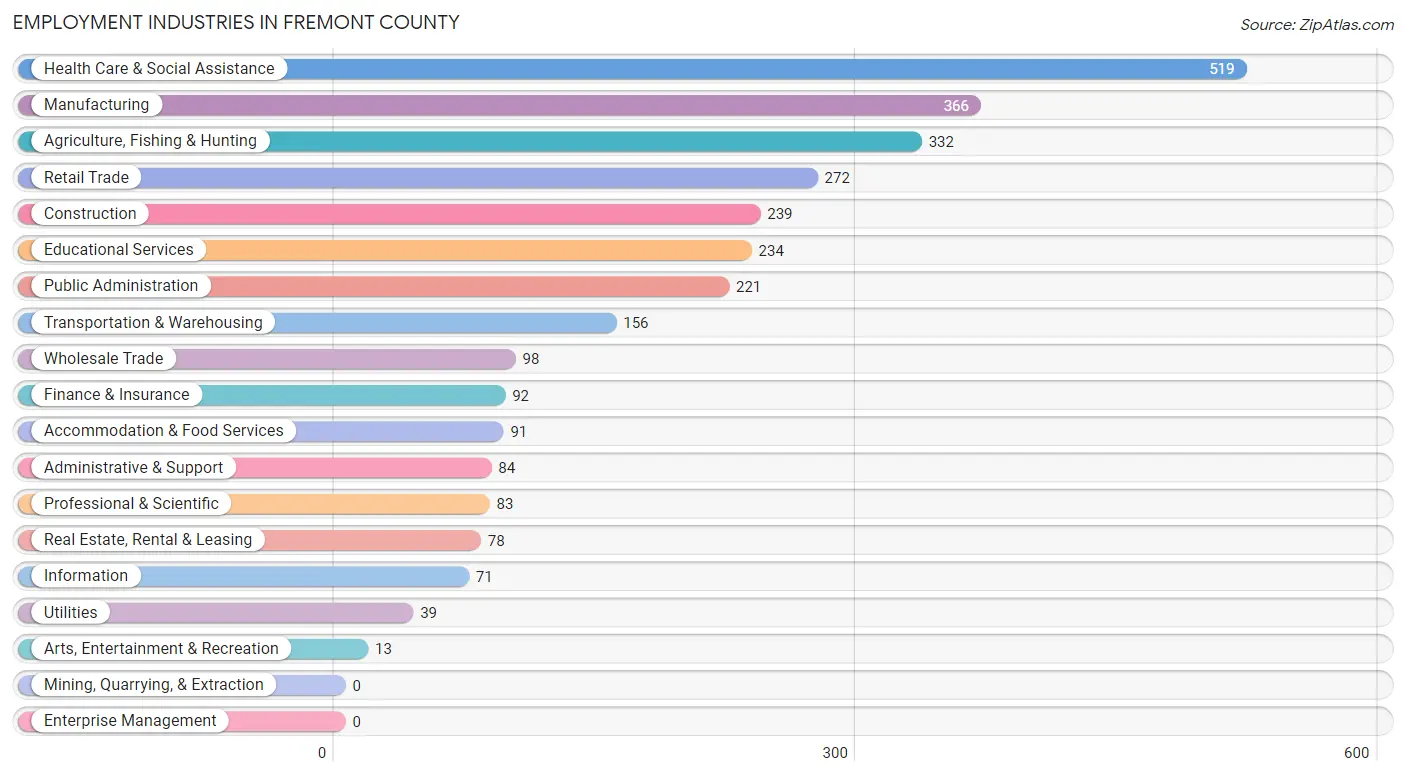
Employment Industries in Fremont County
The major employment industries in Fremont County include Health Care & Social Assistance (519 | 16.6%), Manufacturing (366 | 11.7%), Agriculture, Fishing & Hunting (332 | 10.6%), Retail Trade (272 | 8.7%), and Construction (239 | 7.6%).
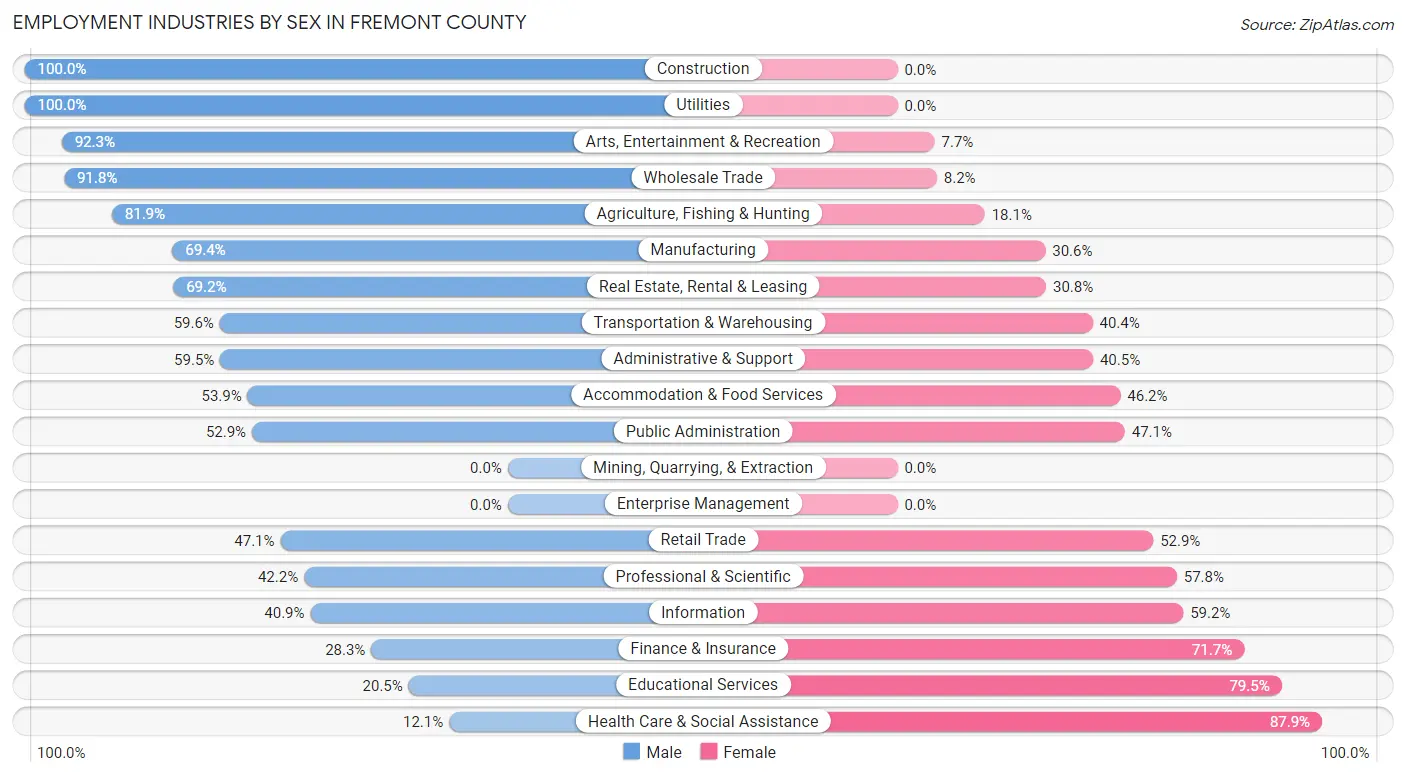
Employment Industries by Sex in Fremont County
The Fremont County industries that see more men than women are Construction (100.0%), Utilities (100.0%), and Arts, Entertainment & Recreation (92.3%), whereas the industries that tend to have a higher number of women are Health Care & Social Assistance (87.9%), Educational Services (79.5%), and Finance & Insurance (71.7%).
| Industry | Male | Female |
| Agriculture, Fishing & Hunting | 272 (81.9%) | 60 (18.1%) |
| Mining, Quarrying, & Extraction | 0 (0.0%) | 0 (0.0%) |
| Construction | 239 (100.0%) | 0 (0.0%) |
| Manufacturing | 254 (69.4%) | 112 (30.6%) |
| Wholesale Trade | 90 (91.8%) | 8 (8.2%) |
| Retail Trade | 128 (47.1%) | 144 (52.9%) |
| Transportation & Warehousing | 93 (59.6%) | 63 (40.4%) |
| Utilities | 39 (100.0%) | 0 (0.0%) |
| Information | 29 (40.8%) | 42 (59.2%) |
| Finance & Insurance | 26 (28.3%) | 66 (71.7%) |
| Real Estate, Rental & Leasing | 54 (69.2%) | 24 (30.8%) |
| Professional & Scientific | 35 (42.2%) | 48 (57.8%) |
| Enterprise Management | 0 (0.0%) | 0 (0.0%) |
| Administrative & Support | 50 (59.5%) | 34 (40.5%) |
| Educational Services | 48 (20.5%) | 186 (79.5%) |
| Health Care & Social Assistance | 63 (12.1%) | 456 (87.9%) |
| Arts, Entertainment & Recreation | 12 (92.3%) | 1 (7.7%) |
| Accommodation & Food Services | 49 (53.8%) | 42 (46.2%) |
| Public Administration | 117 (52.9%) | 104 (47.1%) |
| Total | 1,657 (53.0%) | 1,472 (47.0%) |
Education in Fremont County
School Enrollment in Fremont County
The most common levels of schooling among the 1,426 students in Fremont County are high school (411 | 28.8%), middle school (310 | 21.7%), and elementary school (287 | 20.1%).
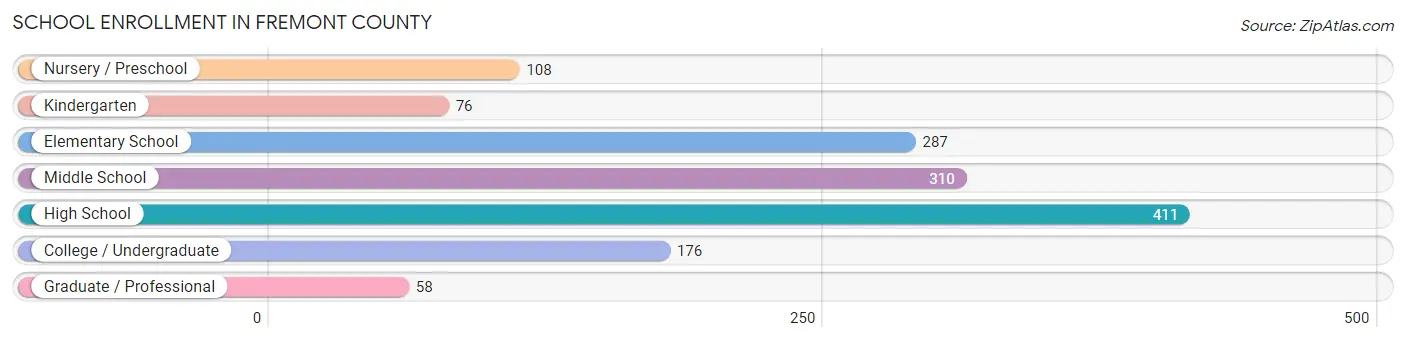
| School Level | # Students | % Students |
| Nursery / Preschool | 108 | 7.6% |
| Kindergarten | 76 | 5.3% |
| Elementary School | 287 | 20.1% |
| Middle School | 310 | 21.7% |
| High School | 411 | 28.8% |
| College / Undergraduate | 176 | 12.3% |
| Graduate / Professional | 58 | 4.1% |
| Total | 1,426 | 100.0% |
School Enrollment by Age by Funding Source in Fremont County
Out of a total of 1,426 students who are enrolled in schools in Fremont County, 93 (6.5%) attend a private institution, while the remaining 1,333 (93.5%) are enrolled in public schools. The age group of 20 to 24 year olds has the highest likelihood of being enrolled in private schools, with 17 (24.6% in the age bracket) enrolled. Conversely, the age group of 3 to 4 year olds has the lowest likelihood of being enrolled in a private school, with 83 (100.0% in the age bracket) attending a public institution.
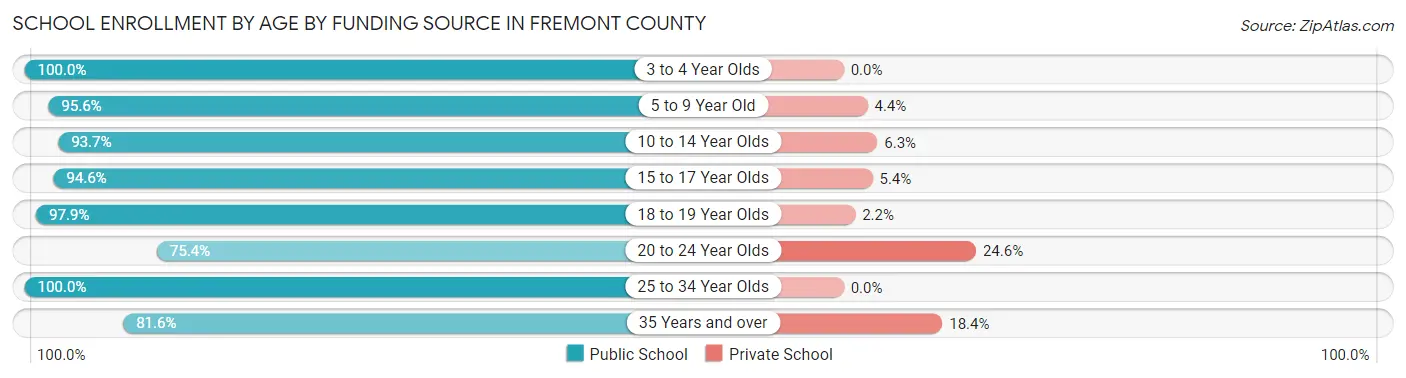
| Age Bracket | Public School | Private School |
| 3 to 4 Year Olds | 83 (100.0%) | 0 (0.0%) |
| 5 to 9 Year Old | 344 (95.6%) | 16 (4.4%) |
| 10 to 14 Year Olds | 344 (93.7%) | 23 (6.3%) |
| 15 to 17 Year Olds | 282 (94.6%) | 16 (5.4%) |
| 18 to 19 Year Olds | 91 (97.9%) | 2 (2.1%) |
| 20 to 24 Year Olds | 52 (75.4%) | 17 (24.6%) |
| 25 to 34 Year Olds | 58 (100.0%) | 0 (0.0%) |
| 35 Years and over | 80 (81.6%) | 18 (18.4%) |
| Total | 1,333 (93.5%) | 93 (6.5%) |
Educational Attainment by Field of Study in Fremont County
Education (271 | 26.8%), bio, nature & agricultural (190 | 18.8%), business (171 | 16.9%), science & technology (100 | 9.9%), and liberal arts & history (70 | 6.9%) are the most common fields of study among 1,011 individuals in Fremont County who have obtained a bachelor's degree or higher.
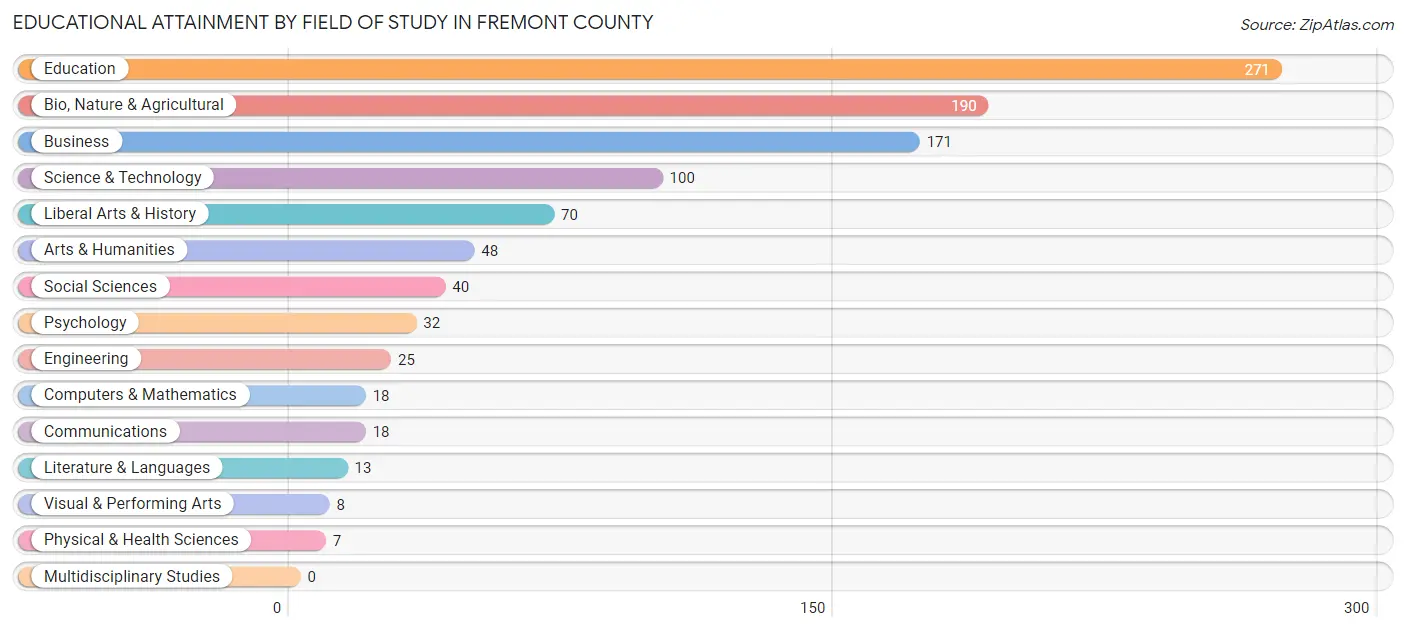
| Field of Study | # Graduates | % Graduates |
| Computers & Mathematics | 18 | 1.8% |
| Bio, Nature & Agricultural | 190 | 18.8% |
| Physical & Health Sciences | 7 | 0.7% |
| Psychology | 32 | 3.2% |
| Social Sciences | 40 | 4.0% |
| Engineering | 25 | 2.5% |
| Multidisciplinary Studies | 0 | 0.0% |
| Science & Technology | 100 | 9.9% |
| Business | 171 | 16.9% |
| Education | 271 | 26.8% |
| Literature & Languages | 13 | 1.3% |
| Liberal Arts & History | 70 | 6.9% |
| Visual & Performing Arts | 8 | 0.8% |
| Communications | 18 | 1.8% |
| Arts & Humanities | 48 | 4.8% |
| Total | 1,011 | 100.0% |
Transportation & Commute in Fremont County
Vehicle Availability by Sex in Fremont County
The most prevalent vehicle ownership categories in Fremont County are males with 3 vehicles (530, accounting for 32.3%) and females with 3 vehicles (422, making up 36.6%).
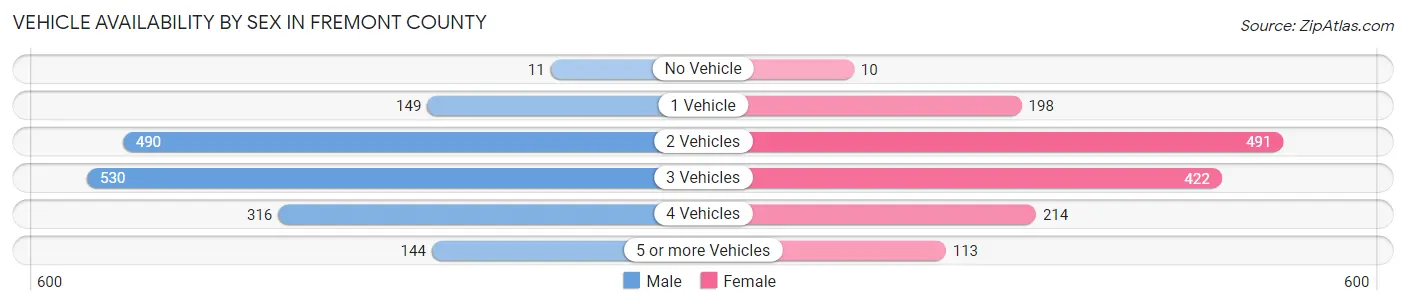
| Vehicles Available | Male | Female |
| No Vehicle | 11 (0.7%) | 10 (0.7%) |
| 1 Vehicle | 149 (9.1%) | 198 (13.7%) |
| 2 Vehicles | 490 (29.9%) | 491 (33.9%) |
| 3 Vehicles | 530 (32.3%) | 422 (29.1%) |
| 4 Vehicles | 316 (19.3%) | 214 (14.8%) |
| 5 or more Vehicles | 144 (8.8%) | 113 (7.8%) |
| Total | 1,640 (100.0%) | 1,448 (100.0%) |
Commute Time in Fremont County
The most frequently occuring commute durations in Fremont County are 5 to 9 minutes (467 commuters, 16.2%), 15 to 19 minutes (385 commuters, 13.3%), and less than 5 minutes (377 commuters, 13.1%).
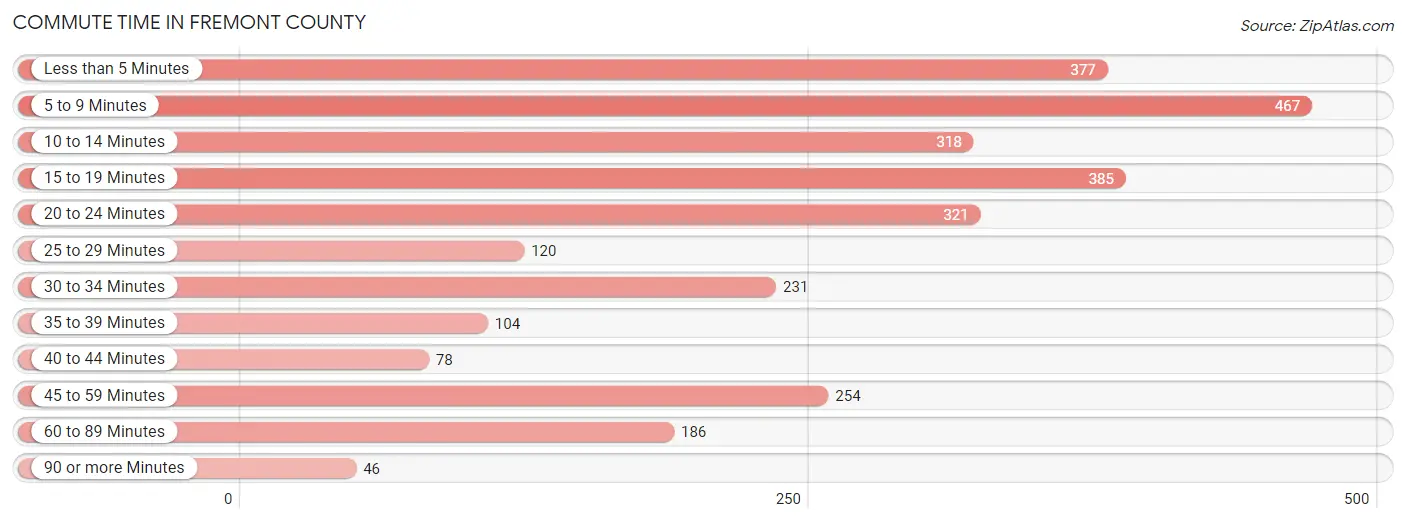
| Commute Time | # Commuters | % Commuters |
| Less than 5 Minutes | 377 | 13.1% |
| 5 to 9 Minutes | 467 | 16.2% |
| 10 to 14 Minutes | 318 | 11.0% |
| 15 to 19 Minutes | 385 | 13.3% |
| 20 to 24 Minutes | 321 | 11.1% |
| 25 to 29 Minutes | 120 | 4.2% |
| 30 to 34 Minutes | 231 | 8.0% |
| 35 to 39 Minutes | 104 | 3.6% |
| 40 to 44 Minutes | 78 | 2.7% |
| 45 to 59 Minutes | 254 | 8.8% |
| 60 to 89 Minutes | 186 | 6.4% |
| 90 or more Minutes | 46 | 1.6% |
Commute Time by Sex in Fremont County
The most common commute times in Fremont County are 5 to 9 minutes (256 commuters, 16.8%) for males and 5 to 9 minutes (211 commuters, 15.4%) for females.
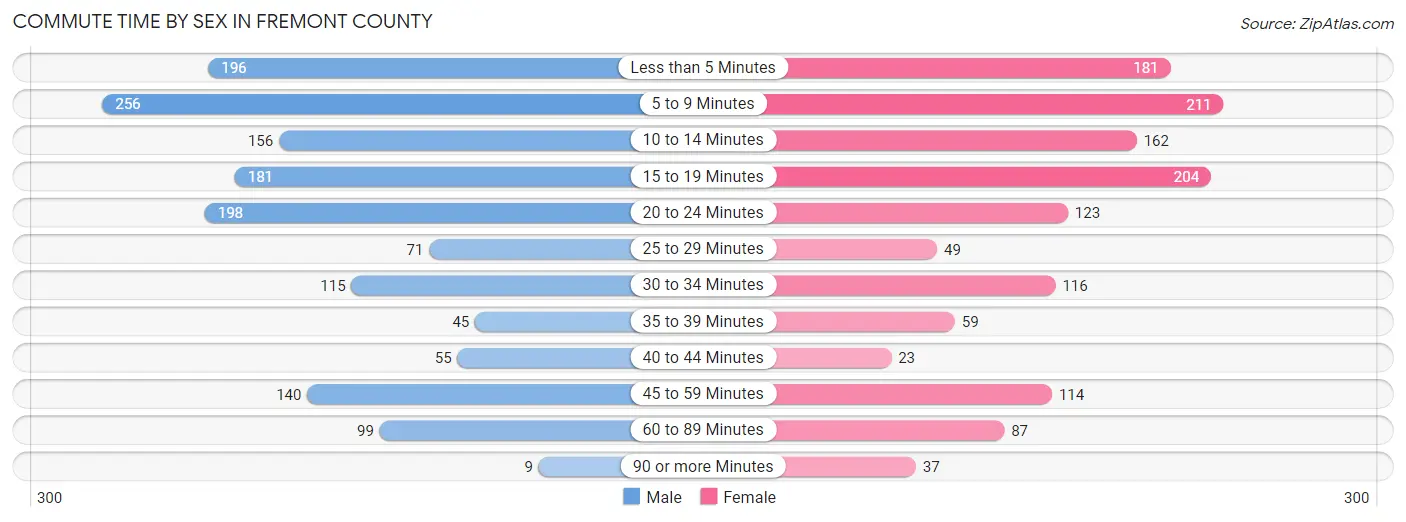
| Commute Time | Male | Female |
| Less than 5 Minutes | 196 (12.9%) | 181 (13.3%) |
| 5 to 9 Minutes | 256 (16.8%) | 211 (15.4%) |
| 10 to 14 Minutes | 156 (10.3%) | 162 (11.9%) |
| 15 to 19 Minutes | 181 (11.9%) | 204 (14.9%) |
| 20 to 24 Minutes | 198 (13.0%) | 123 (9.0%) |
| 25 to 29 Minutes | 71 (4.7%) | 49 (3.6%) |
| 30 to 34 Minutes | 115 (7.6%) | 116 (8.5%) |
| 35 to 39 Minutes | 45 (3.0%) | 59 (4.3%) |
| 40 to 44 Minutes | 55 (3.6%) | 23 (1.7%) |
| 45 to 59 Minutes | 140 (9.2%) | 114 (8.4%) |
| 60 to 89 Minutes | 99 (6.5%) | 87 (6.4%) |
| 90 or more Minutes | 9 (0.6%) | 37 (2.7%) |
Time of Departure to Work by Sex in Fremont County
The most frequent times of departure to work in Fremont County are 7:00 AM to 7:29 AM (197, 13.0%) for males and 7:30 AM to 7:59 AM (190, 13.9%) for females.
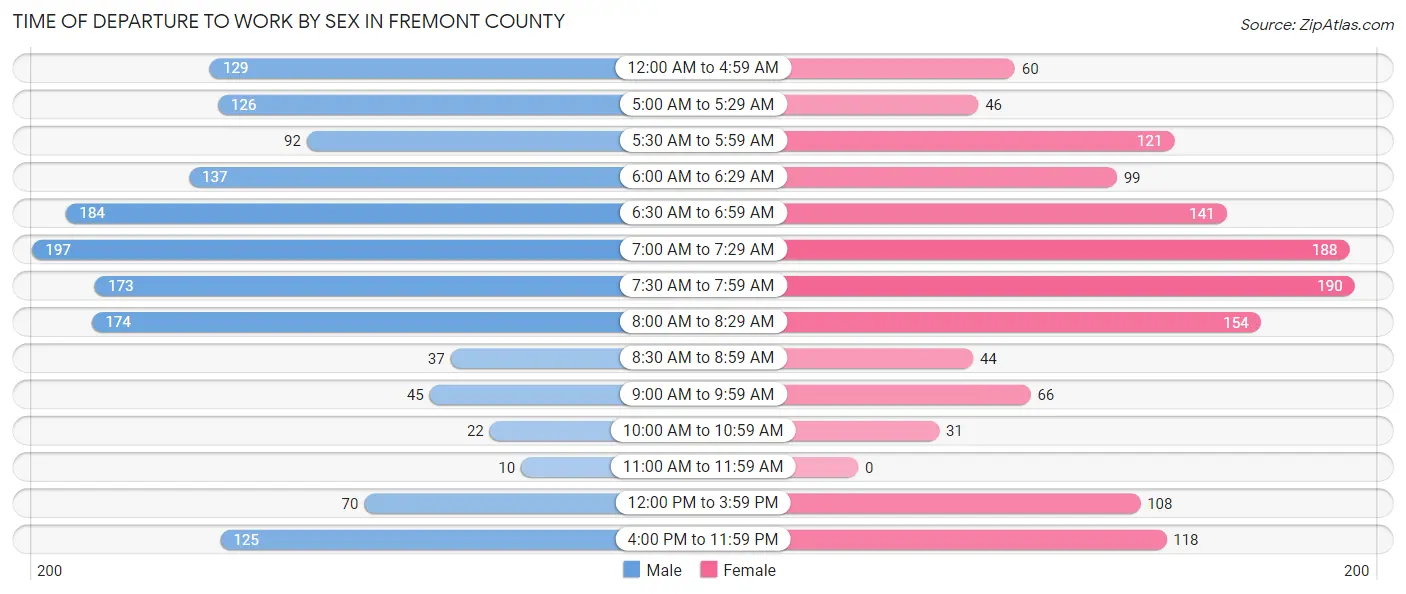
| Time of Departure | Male | Female |
| 12:00 AM to 4:59 AM | 129 (8.5%) | 60 (4.4%) |
| 5:00 AM to 5:29 AM | 126 (8.3%) | 46 (3.4%) |
| 5:30 AM to 5:59 AM | 92 (6.0%) | 121 (8.9%) |
| 6:00 AM to 6:29 AM | 137 (9.0%) | 99 (7.2%) |
| 6:30 AM to 6:59 AM | 184 (12.1%) | 141 (10.3%) |
| 7:00 AM to 7:29 AM | 197 (13.0%) | 188 (13.8%) |
| 7:30 AM to 7:59 AM | 173 (11.4%) | 190 (13.9%) |
| 8:00 AM to 8:29 AM | 174 (11.4%) | 154 (11.3%) |
| 8:30 AM to 8:59 AM | 37 (2.4%) | 44 (3.2%) |
| 9:00 AM to 9:59 AM | 45 (3.0%) | 66 (4.8%) |
| 10:00 AM to 10:59 AM | 22 (1.5%) | 31 (2.3%) |
| 11:00 AM to 11:59 AM | 10 (0.7%) | 0 (0.0%) |
| 12:00 PM to 3:59 PM | 70 (4.6%) | 108 (7.9%) |
| 4:00 PM to 11:59 PM | 125 (8.2%) | 118 (8.6%) |
| Total | 1,521 (100.0%) | 1,366 (100.0%) |
Housing Occupancy in Fremont County
Occupancy by Ownership in Fremont County
Of the total 2,736 dwellings in Fremont County, owner-occupied units account for 2,136 (78.1%), while renter-occupied units make up 600 (21.9%).
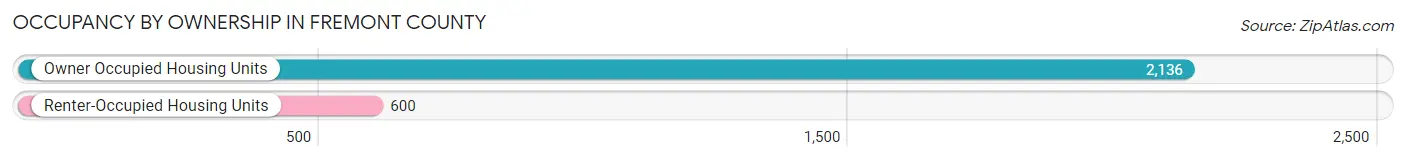
| Occupancy | # Housing Units | % Housing Units |
| Owner Occupied Housing Units | 2,136 | 78.1% |
| Renter-Occupied Housing Units | 600 | 21.9% |
| Total Occupied Housing Units | 2,736 | 100.0% |
Occupancy by Household Size in Fremont County
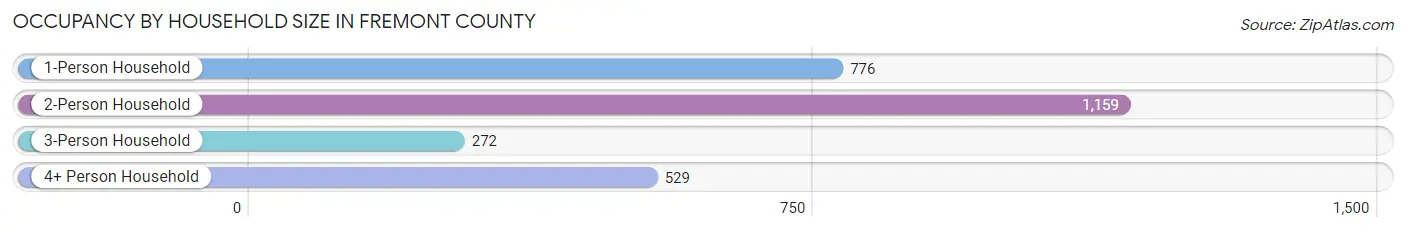
| Household Size | # Housing Units | % Housing Units |
| 1-Person Household | 776 | 28.4% |
| 2-Person Household | 1,159 | 42.4% |
| 3-Person Household | 272 | 9.9% |
| 4+ Person Household | 529 | 19.3% |
| Total Housing Units | 2,736 | 100.0% |
Occupancy by Ownership by Household Size in Fremont County
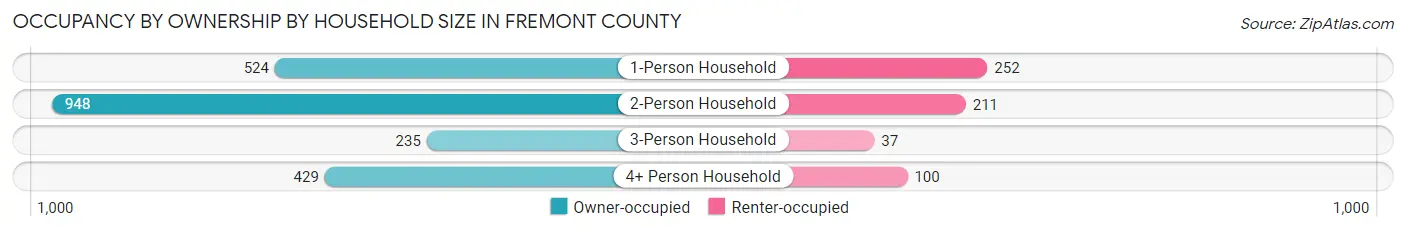
| Household Size | Owner-occupied | Renter-occupied |
| 1-Person Household | 524 (67.5%) | 252 (32.5%) |
| 2-Person Household | 948 (81.8%) | 211 (18.2%) |
| 3-Person Household | 235 (86.4%) | 37 (13.6%) |
| 4+ Person Household | 429 (81.1%) | 100 (18.9%) |
| Total Housing Units | 2,136 (78.1%) | 600 (21.9%) |
Occupancy by Educational Attainment in Fremont County
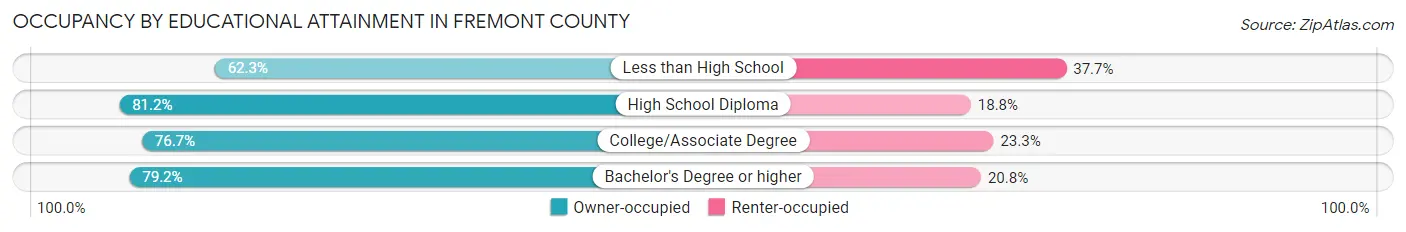
| Household Size | Owner-occupied | Renter-occupied |
| Less than High School | 76 (62.3%) | 46 (37.7%) |
| High School Diploma | 714 (81.2%) | 165 (18.8%) |
| College/Associate Degree | 881 (76.7%) | 267 (23.3%) |
| Bachelor's Degree or higher | 465 (79.2%) | 122 (20.8%) |
Occupancy by Age of Householder in Fremont County
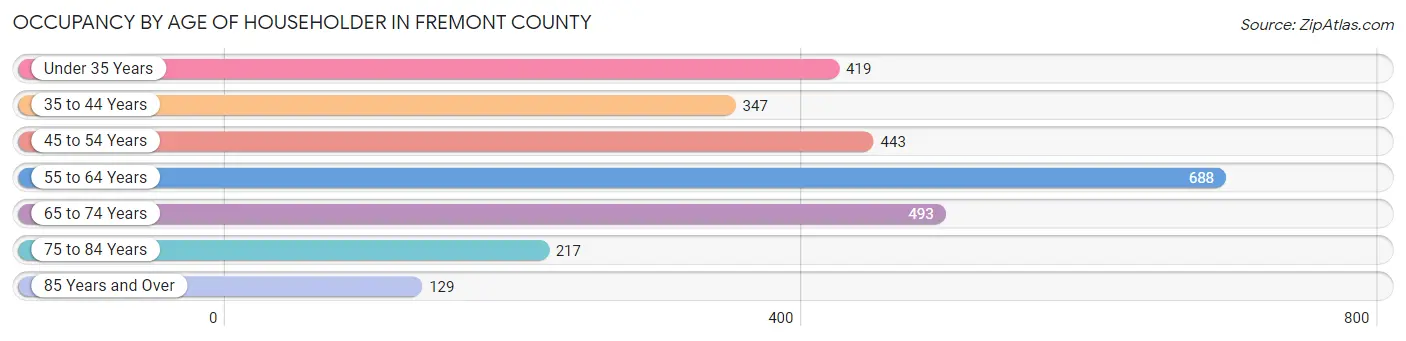
| Age Bracket | # Households | % Households |
| Under 35 Years | 419 | 15.3% |
| 35 to 44 Years | 347 | 12.7% |
| 45 to 54 Years | 443 | 16.2% |
| 55 to 64 Years | 688 | 25.2% |
| 65 to 74 Years | 493 | 18.0% |
| 75 to 84 Years | 217 | 7.9% |
| 85 Years and Over | 129 | 4.7% |
| Total | 2,736 | 100.0% |
Housing Finances in Fremont County
Median Income by Occupancy in Fremont County
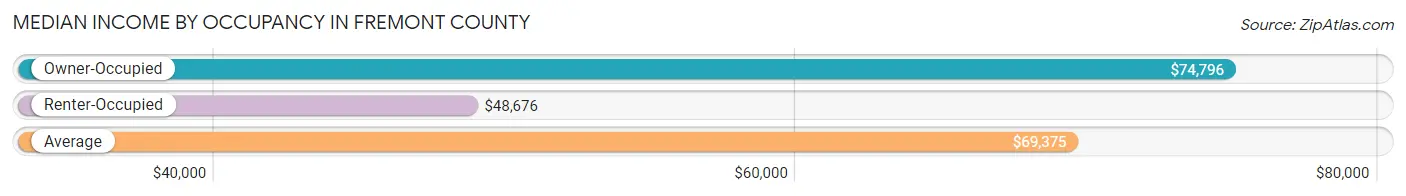
| Occupancy Type | # Households | Median Income |
| Owner-Occupied | 2,136 (78.1%) | $74,796 |
| Renter-Occupied | 600 (21.9%) | $48,676 |
| Average | 2,736 (100.0%) | $69,375 |
Occupancy by Householder Income Bracket in Fremont County
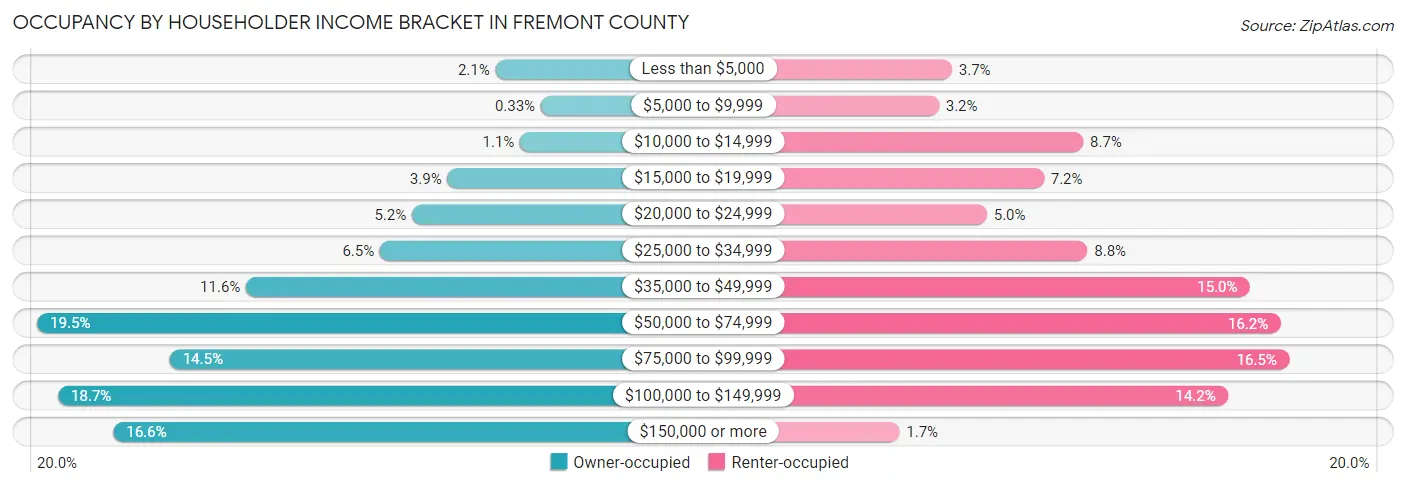
| Income Bracket | Owner-occupied | Renter-occupied |
| Less than $5,000 | 44 (2.1%) | 22 (3.7%) |
| $5,000 to $9,999 | 7 (0.3%) | 19 (3.2%) |
| $10,000 to $14,999 | 24 (1.1%) | 52 (8.7%) |
| $15,000 to $19,999 | 83 (3.9%) | 43 (7.2%) |
| $20,000 to $24,999 | 112 (5.2%) | 30 (5.0%) |
| $25,000 to $34,999 | 138 (6.5%) | 53 (8.8%) |
| $35,000 to $49,999 | 247 (11.6%) | 90 (15.0%) |
| $50,000 to $74,999 | 417 (19.5%) | 97 (16.2%) |
| $75,000 to $99,999 | 309 (14.5%) | 99 (16.5%) |
| $100,000 to $149,999 | 400 (18.7%) | 85 (14.2%) |
| $150,000 or more | 355 (16.6%) | 10 (1.7%) |
| Total | 2,136 (100.0%) | 600 (100.0%) |
Monthly Housing Cost Tiers in Fremont County
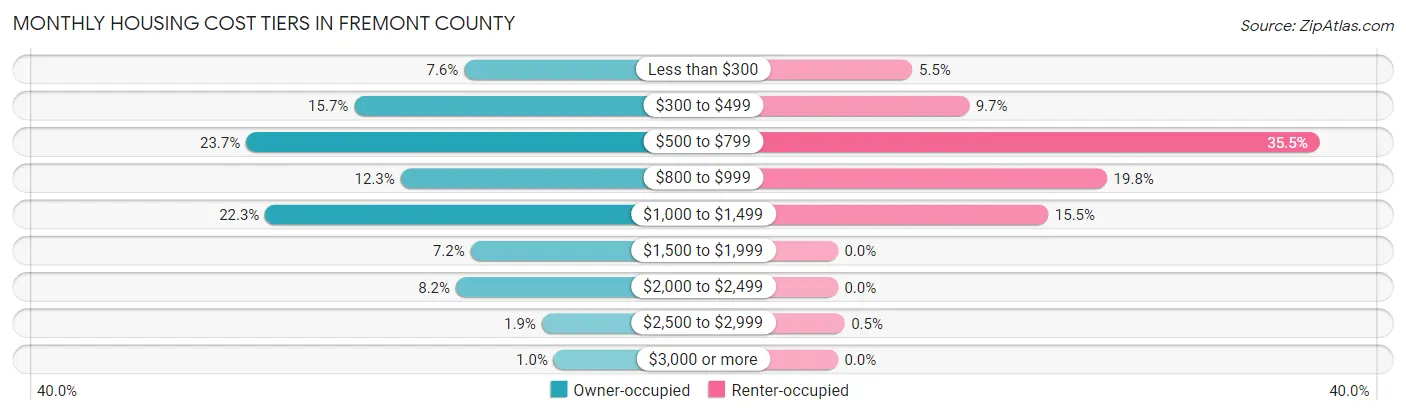
| Monthly Cost | Owner-occupied | Renter-occupied |
| Less than $300 | 163 (7.6%) | 33 (5.5%) |
| $300 to $499 | 336 (15.7%) | 58 (9.7%) |
| $500 to $799 | 506 (23.7%) | 213 (35.5%) |
| $800 to $999 | 263 (12.3%) | 119 (19.8%) |
| $1,000 to $1,499 | 476 (22.3%) | 93 (15.5%) |
| $1,500 to $1,999 | 153 (7.2%) | 0 (0.0%) |
| $2,000 to $2,499 | 176 (8.2%) | 0 (0.0%) |
| $2,500 to $2,999 | 41 (1.9%) | 3 (0.5%) |
| $3,000 or more | 22 (1.0%) | 0 (0.0%) |
| Total | 2,136 (100.0%) | 600 (100.0%) |
Physical Housing Characteristics in Fremont County
Housing Structures in Fremont County
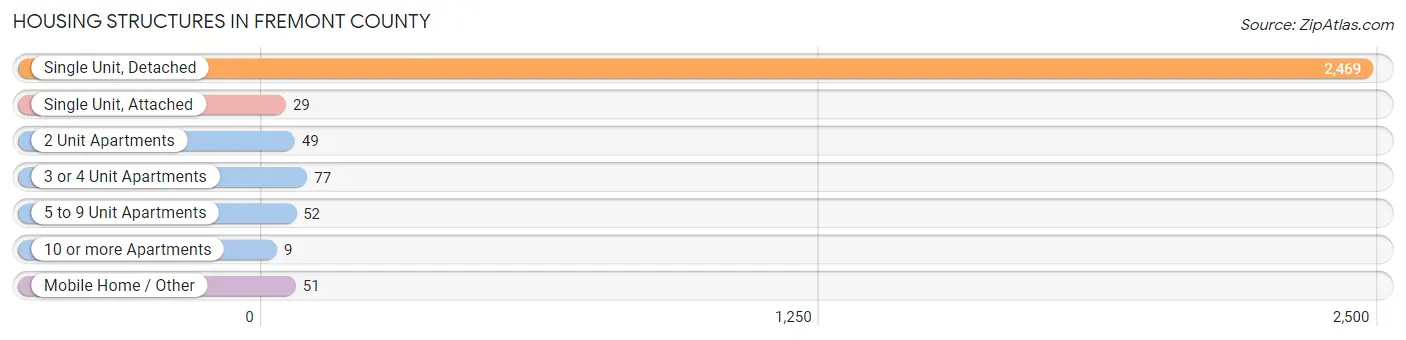
| Structure Type | # Housing Units | % Housing Units |
| Single Unit, Detached | 2,469 | 90.2% |
| Single Unit, Attached | 29 | 1.1% |
| 2 Unit Apartments | 49 | 1.8% |
| 3 or 4 Unit Apartments | 77 | 2.8% |
| 5 to 9 Unit Apartments | 52 | 1.9% |
| 10 or more Apartments | 9 | 0.3% |
| Mobile Home / Other | 51 | 1.9% |
| Total | 2,736 | 100.0% |
Housing Structures by Occupancy in Fremont County
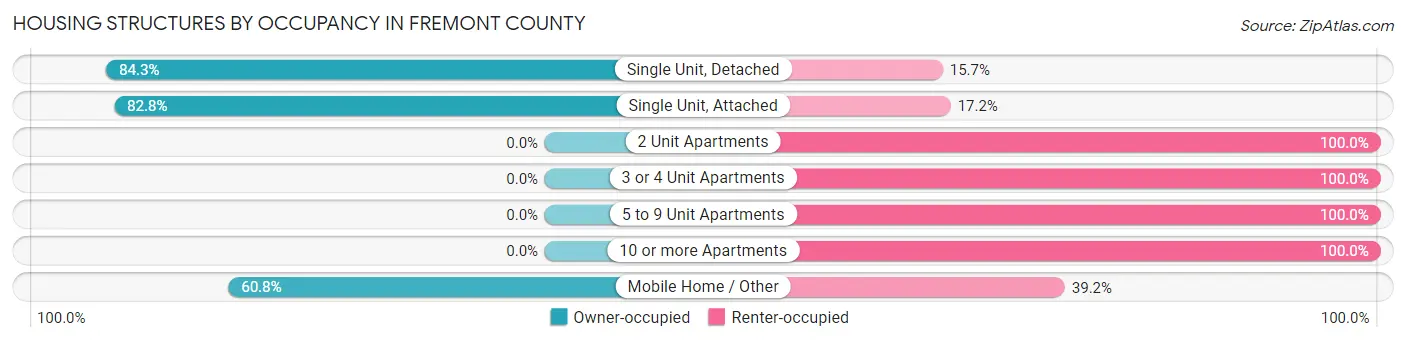
| Structure Type | Owner-occupied | Renter-occupied |
| Single Unit, Detached | 2,081 (84.3%) | 388 (15.7%) |
| Single Unit, Attached | 24 (82.8%) | 5 (17.2%) |
| 2 Unit Apartments | 0 (0.0%) | 49 (100.0%) |
| 3 or 4 Unit Apartments | 0 (0.0%) | 77 (100.0%) |
| 5 to 9 Unit Apartments | 0 (0.0%) | 52 (100.0%) |
| 10 or more Apartments | 0 (0.0%) | 9 (100.0%) |
| Mobile Home / Other | 31 (60.8%) | 20 (39.2%) |
| Total | 2,136 (78.1%) | 600 (21.9%) |
Housing Structures by Number of Rooms in Fremont County
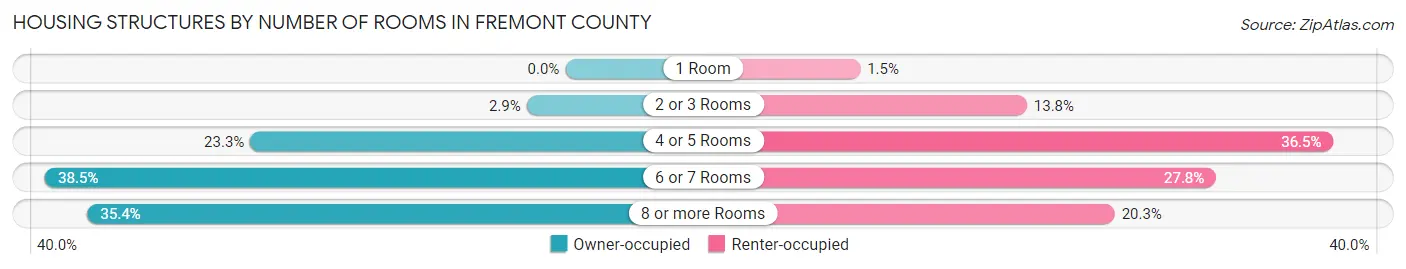
| Number of Rooms | Owner-occupied | Renter-occupied |
| 1 Room | 0 (0.0%) | 9 (1.5%) |
| 2 or 3 Rooms | 61 (2.9%) | 83 (13.8%) |
| 4 or 5 Rooms | 498 (23.3%) | 219 (36.5%) |
| 6 or 7 Rooms | 822 (38.5%) | 167 (27.8%) |
| 8 or more Rooms | 755 (35.3%) | 122 (20.3%) |
| Total | 2,136 (100.0%) | 600 (100.0%) |
Housing Structure by Heating Type in Fremont County
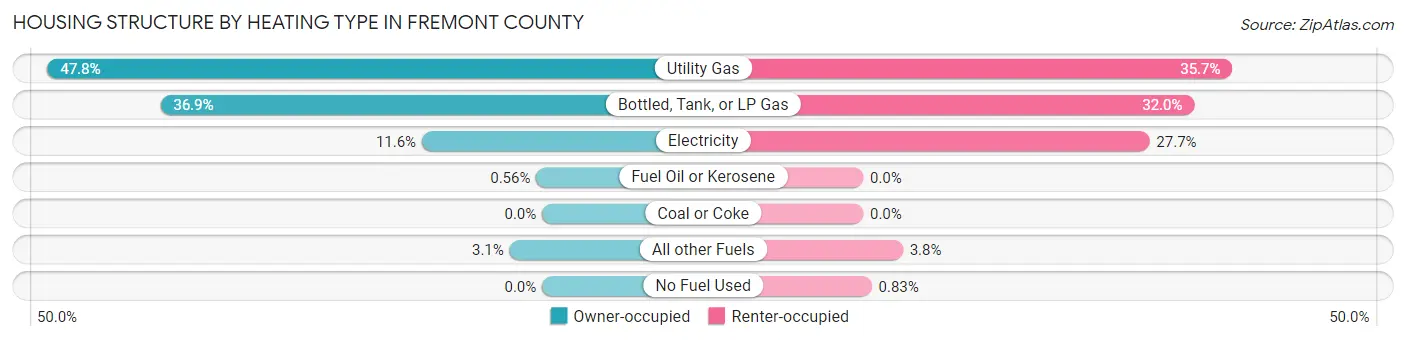
| Heating Type | Owner-occupied | Renter-occupied |
| Utility Gas | 1,021 (47.8%) | 214 (35.7%) |
| Bottled, Tank, or LP Gas | 788 (36.9%) | 192 (32.0%) |
| Electricity | 248 (11.6%) | 166 (27.7%) |
| Fuel Oil or Kerosene | 12 (0.6%) | 0 (0.0%) |
| Coal or Coke | 0 (0.0%) | 0 (0.0%) |
| All other Fuels | 67 (3.1%) | 23 (3.8%) |
| No Fuel Used | 0 (0.0%) | 5 (0.8%) |
| Total | 2,136 (100.0%) | 600 (100.0%) |
Household Vehicle Usage in Fremont County
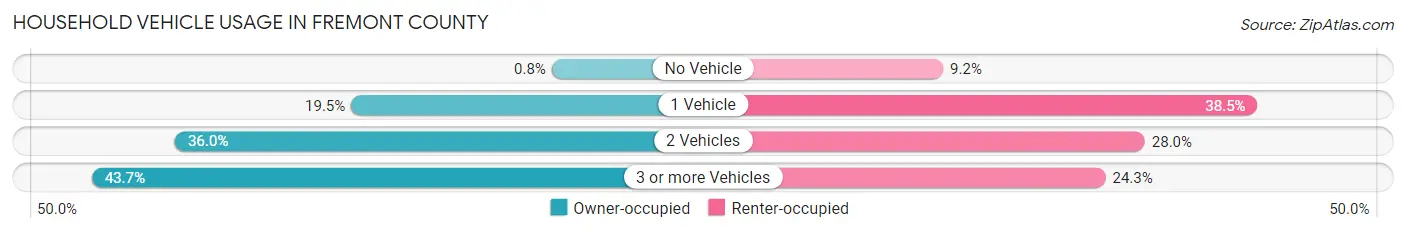
| Vehicles per Household | Owner-occupied | Renter-occupied |
| No Vehicle | 17 (0.8%) | 55 (9.2%) |
| 1 Vehicle | 417 (19.5%) | 231 (38.5%) |
| 2 Vehicles | 768 (36.0%) | 168 (28.0%) |
| 3 or more Vehicles | 934 (43.7%) | 146 (24.3%) |
| Total | 2,136 (100.0%) | 600 (100.0%) |
Real Estate & Mortgages in Fremont County
Real Estate and Mortgage Overview in Fremont County
| Characteristic | Without Mortgage | With Mortgage |
| Housing Units | 978 | 1,158 |
| Median Property Value | $132,600 | $146,700 |
| Median Household Income | $60,395 | $260 |
| Monthly Housing Costs | $498 | $22 |
| Real Estate Taxes | $1,657 | $15 |
Property Value by Mortgage Status in Fremont County
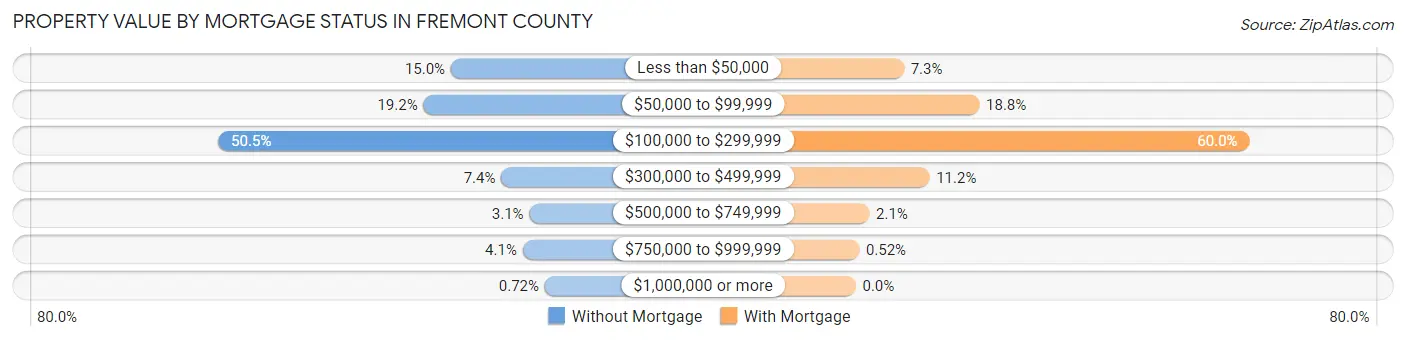
| Property Value | Without Mortgage | With Mortgage |
| Less than $50,000 | 147 (15.0%) | 85 (7.3%) |
| $50,000 to $99,999 | 188 (19.2%) | 218 (18.8%) |
| $100,000 to $299,999 | 494 (50.5%) | 695 (60.0%) |
| $300,000 to $499,999 | 72 (7.4%) | 130 (11.2%) |
| $500,000 to $749,999 | 30 (3.1%) | 24 (2.1%) |
| $750,000 to $999,999 | 40 (4.1%) | 6 (0.5%) |
| $1,000,000 or more | 7 (0.7%) | 0 (0.0%) |
| Total | 978 (100.0%) | 1,158 (100.0%) |
Household Income by Mortgage Status in Fremont County
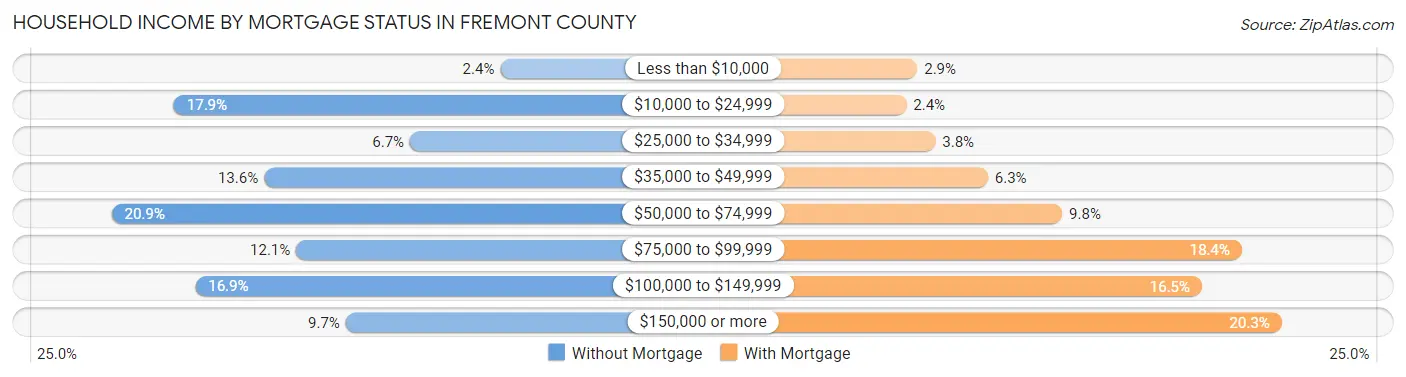
| Household Income | Without Mortgage | With Mortgage |
| Less than $10,000 | 23 (2.4%) | 34 (2.9%) |
| $10,000 to $24,999 | 175 (17.9%) | 28 (2.4%) |
| $25,000 to $34,999 | 65 (6.7%) | 44 (3.8%) |
| $35,000 to $49,999 | 133 (13.6%) | 73 (6.3%) |
| $50,000 to $74,999 | 204 (20.9%) | 114 (9.8%) |
| $75,000 to $99,999 | 118 (12.1%) | 213 (18.4%) |
| $100,000 to $149,999 | 165 (16.9%) | 191 (16.5%) |
| $150,000 or more | 95 (9.7%) | 235 (20.3%) |
| Total | 978 (100.0%) | 1,158 (100.0%) |
Property Value to Household Income Ratio in Fremont County
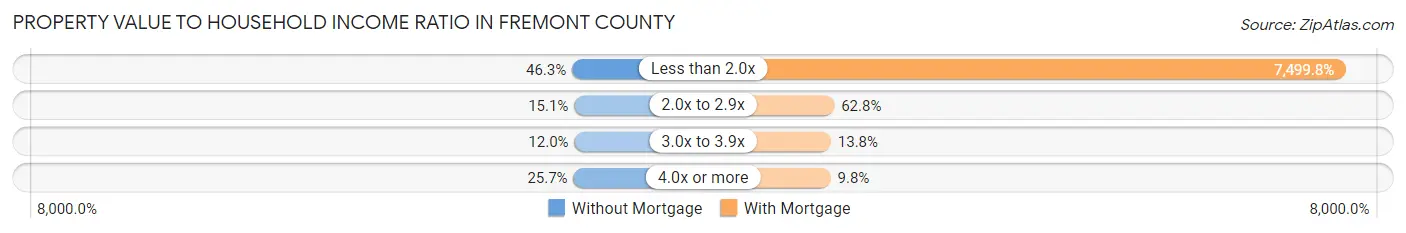
| Value-to-Income Ratio | Without Mortgage | With Mortgage |
| Less than 2.0x | 453 (46.3%) | 86,848 (7,499.8%) |
| 2.0x to 2.9x | 148 (15.1%) | 727 (62.8%) |
| 3.0x to 3.9x | 117 (12.0%) | 160 (13.8%) |
| 4.0x or more | 251 (25.7%) | 114 (9.8%) |
| Total | 978 (100.0%) | 1,158 (100.0%) |
Real Estate Taxes by Mortgage Status in Fremont County
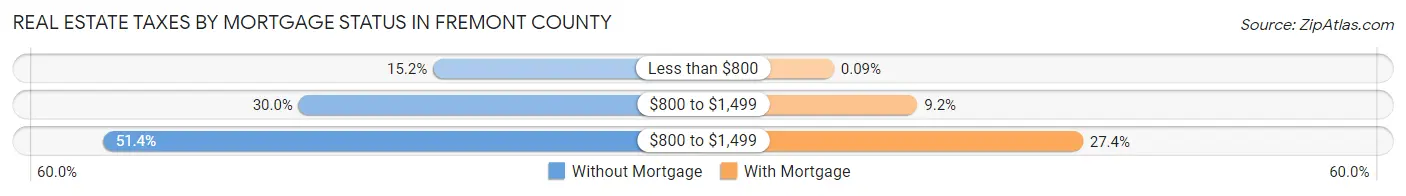
| Property Taxes | Without Mortgage | With Mortgage |
| Less than $800 | 149 (15.2%) | 1 (0.1%) |
| $800 to $1,499 | 293 (30.0%) | 107 (9.2%) |
| $800 to $1,499 | 503 (51.4%) | 317 (27.4%) |
| Total | 978 (100.0%) | 1,158 (100.0%) |
Health & Disability in Fremont County
Health Insurance Coverage by Age in Fremont County
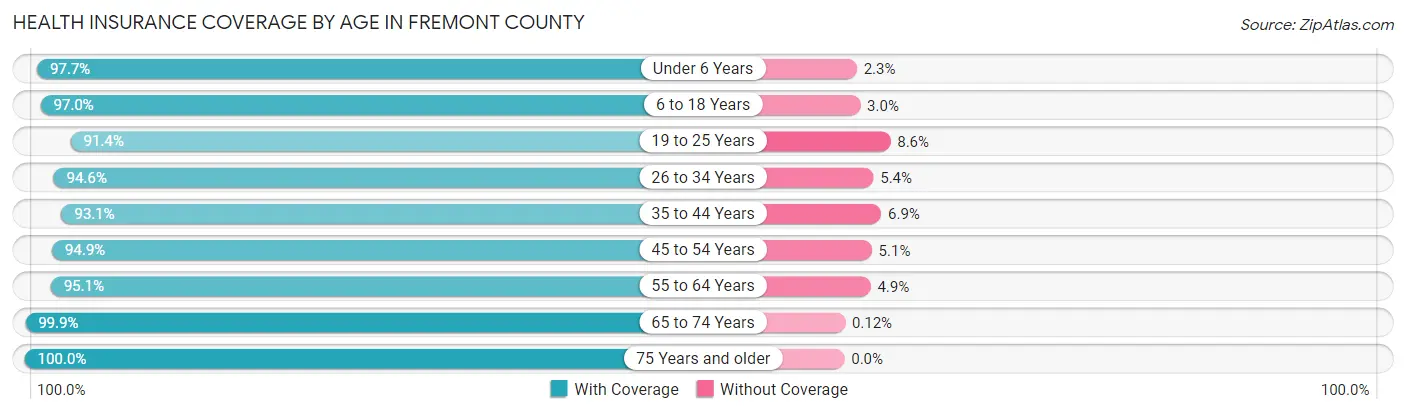
| Age Bracket | With Coverage | Without Coverage |
| Under 6 Years | 381 (97.7%) | 9 (2.3%) |
| 6 to 18 Years | 1,114 (97.0%) | 34 (3.0%) |
| 19 to 25 Years | 341 (91.4%) | 32 (8.6%) |
| 26 to 34 Years | 559 (94.6%) | 32 (5.4%) |
| 35 to 44 Years | 638 (93.1%) | 47 (6.9%) |
| 45 to 54 Years | 781 (94.9%) | 42 (5.1%) |
| 55 to 64 Years | 1,033 (95.1%) | 53 (4.9%) |
| 65 to 74 Years | 851 (99.9%) | 1 (0.1%) |
| 75 Years and older | 555 (100.0%) | 0 (0.0%) |
| Total | 6,253 (96.2%) | 250 (3.8%) |
Health Insurance Coverage by Citizenship Status in Fremont County
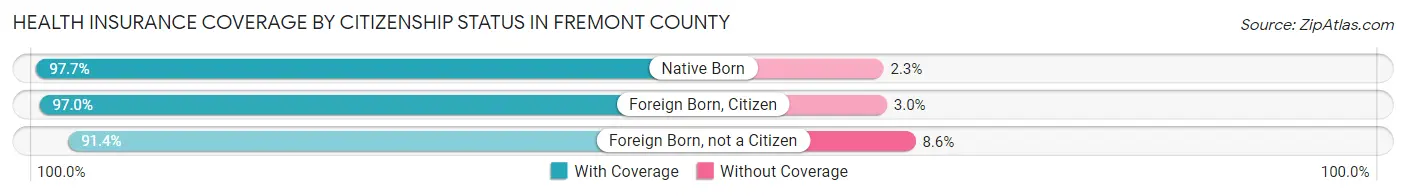
| Citizenship Status | With Coverage | Without Coverage |
| Native Born | 381 (97.7%) | 9 (2.3%) |
| Foreign Born, Citizen | 1,114 (97.0%) | 34 (3.0%) |
| Foreign Born, not a Citizen | 341 (91.4%) | 32 (8.6%) |
Health Insurance Coverage by Household Income in Fremont County
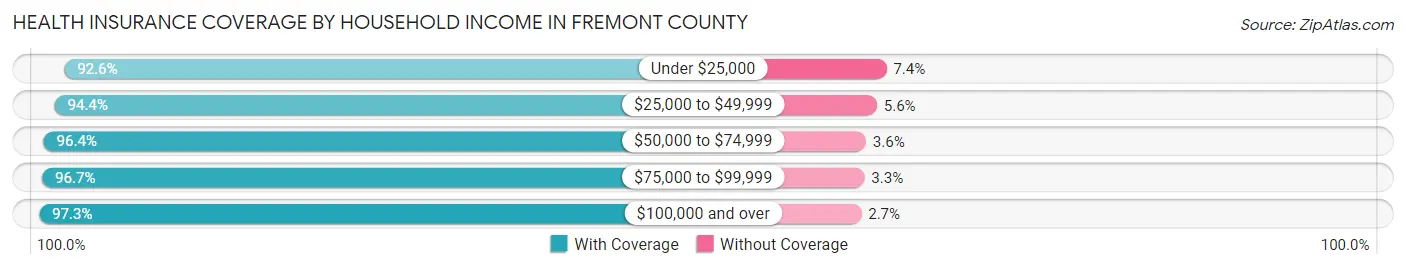
| Household Income | With Coverage | Without Coverage |
| Under $25,000 | 548 (92.6%) | 44 (7.4%) |
| $25,000 to $49,999 | 939 (94.4%) | 56 (5.6%) |
| $50,000 to $74,999 | 1,132 (96.4%) | 42 (3.6%) |
| $75,000 to $99,999 | 1,112 (96.7%) | 38 (3.3%) |
| $100,000 and over | 2,510 (97.3%) | 70 (2.7%) |
Public vs Private Health Insurance Coverage by Age in Fremont County
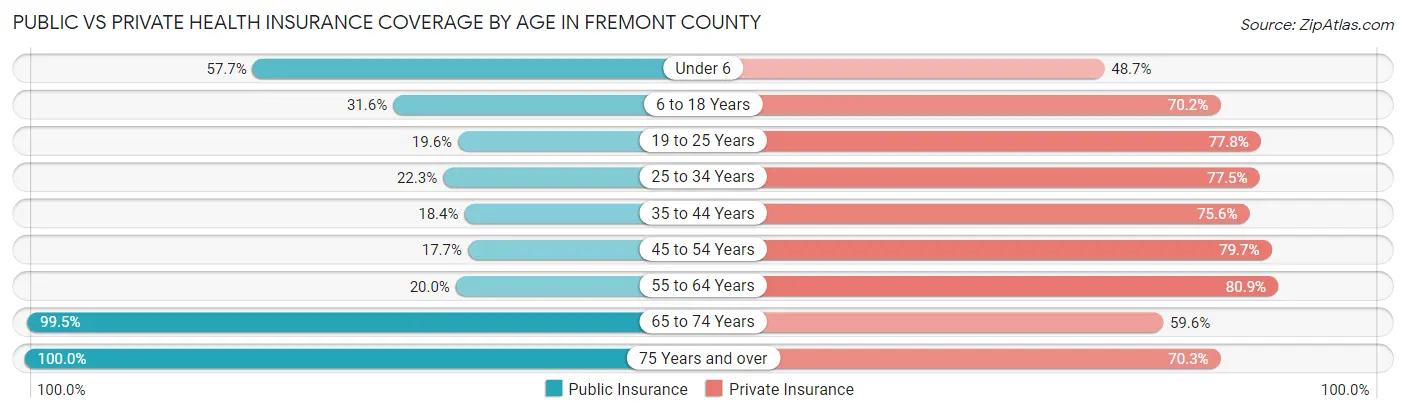
| Age Bracket | Public Insurance | Private Insurance |
| Under 6 | 225 (57.7%) | 190 (48.7%) |
| 6 to 18 Years | 363 (31.6%) | 806 (70.2%) |
| 19 to 25 Years | 73 (19.6%) | 290 (77.7%) |
| 25 to 34 Years | 132 (22.3%) | 458 (77.5%) |
| 35 to 44 Years | 126 (18.4%) | 518 (75.6%) |
| 45 to 54 Years | 146 (17.7%) | 656 (79.7%) |
| 55 to 64 Years | 217 (20.0%) | 879 (80.9%) |
| 65 to 74 Years | 848 (99.5%) | 508 (59.6%) |
| 75 Years and over | 555 (100.0%) | 390 (70.3%) |
| Total | 2,685 (41.3%) | 4,695 (72.2%) |
Disability Status by Sex by Age in Fremont County
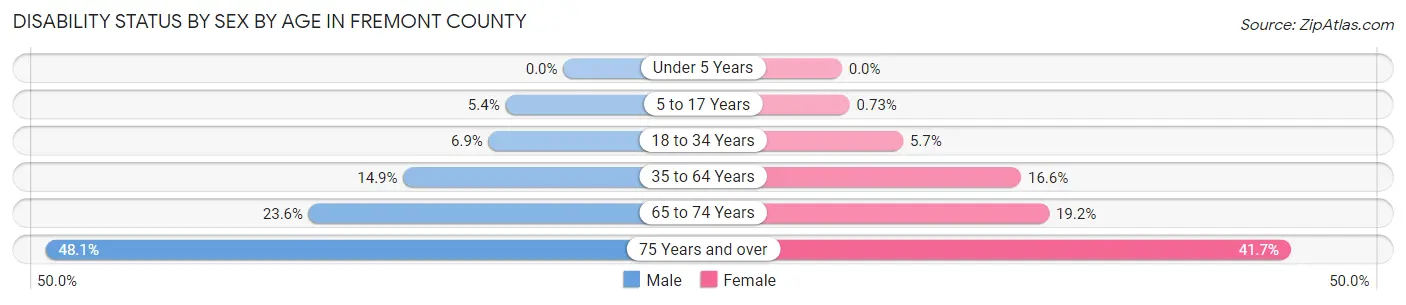
| Age Bracket | Male | Female |
| Under 5 Years | 0 (0.0%) | 0 (0.0%) |
| 5 to 17 Years | 32 (5.4%) | 4 (0.7%) |
| 18 to 34 Years | 35 (6.9%) | 30 (5.7%) |
| 35 to 64 Years | 196 (14.8%) | 212 (16.6%) |
| 65 to 74 Years | 103 (23.6%) | 80 (19.2%) |
| 75 Years and over | 111 (48.0%) | 135 (41.7%) |
Disability Class by Sex by Age in Fremont County
Disability Class: Hearing Difficulty
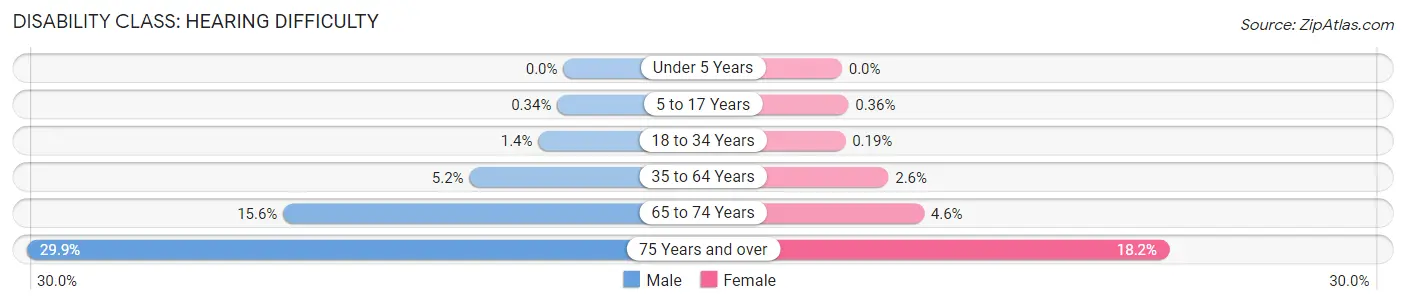
| Age Bracket | Male | Female |
| Under 5 Years | 0 (0.0%) | 0 (0.0%) |
| 5 to 17 Years | 2 (0.3%) | 2 (0.4%) |
| 18 to 34 Years | 7 (1.4%) | 1 (0.2%) |
| 35 to 64 Years | 69 (5.2%) | 33 (2.6%) |
| 65 to 74 Years | 68 (15.6%) | 19 (4.6%) |
| 75 Years and over | 69 (29.9%) | 59 (18.2%) |
Disability Class: Vision Difficulty
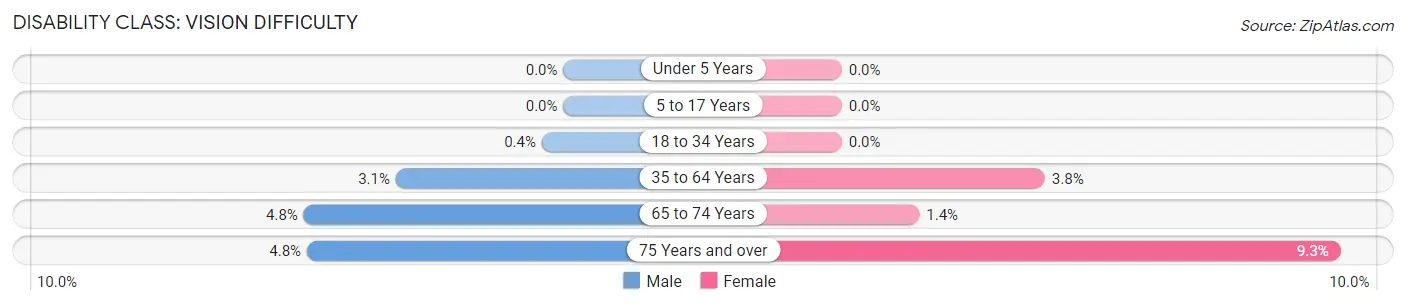
| Age Bracket | Male | Female |
| Under 5 Years | 0 (0.0%) | 0 (0.0%) |
| 5 to 17 Years | 0 (0.0%) | 0 (0.0%) |
| 18 to 34 Years | 2 (0.4%) | 0 (0.0%) |
| 35 to 64 Years | 41 (3.1%) | 48 (3.8%) |
| 65 to 74 Years | 21 (4.8%) | 6 (1.4%) |
| 75 Years and over | 11 (4.8%) | 30 (9.3%) |
Disability Class: Cognitive Difficulty
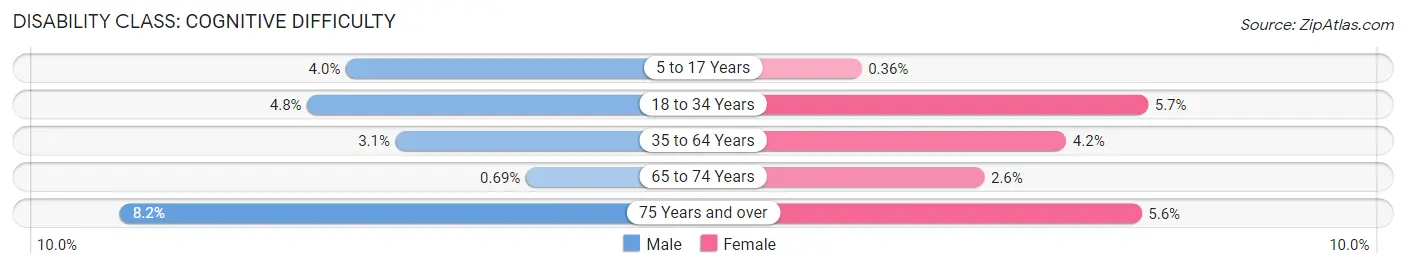
| Age Bracket | Male | Female |
| 5 to 17 Years | 24 (4.0%) | 2 (0.4%) |
| 18 to 34 Years | 24 (4.8%) | 30 (5.7%) |
| 35 to 64 Years | 41 (3.1%) | 53 (4.2%) |
| 65 to 74 Years | 3 (0.7%) | 11 (2.6%) |
| 75 Years and over | 19 (8.2%) | 18 (5.6%) |
Disability Class: Ambulatory Difficulty
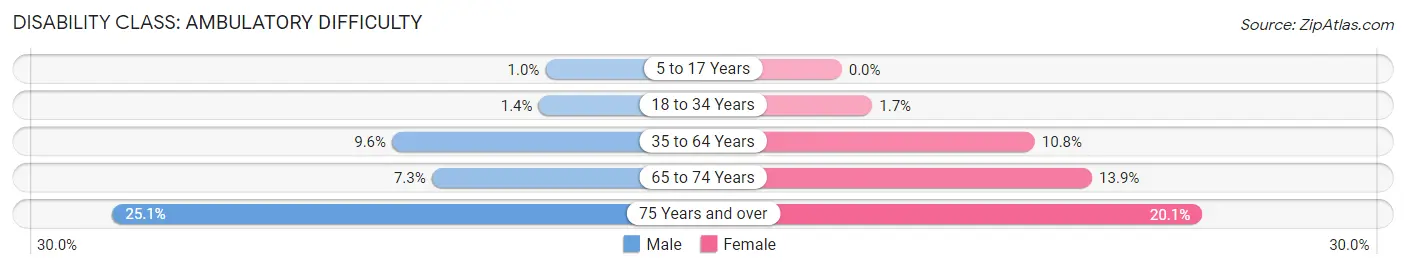
| Age Bracket | Male | Female |
| 5 to 17 Years | 6 (1.0%) | 0 (0.0%) |
| 18 to 34 Years | 7 (1.4%) | 9 (1.7%) |
| 35 to 64 Years | 126 (9.6%) | 137 (10.7%) |
| 65 to 74 Years | 32 (7.3%) | 58 (13.9%) |
| 75 Years and over | 58 (25.1%) | 65 (20.1%) |
Disability Class: Self-Care Difficulty
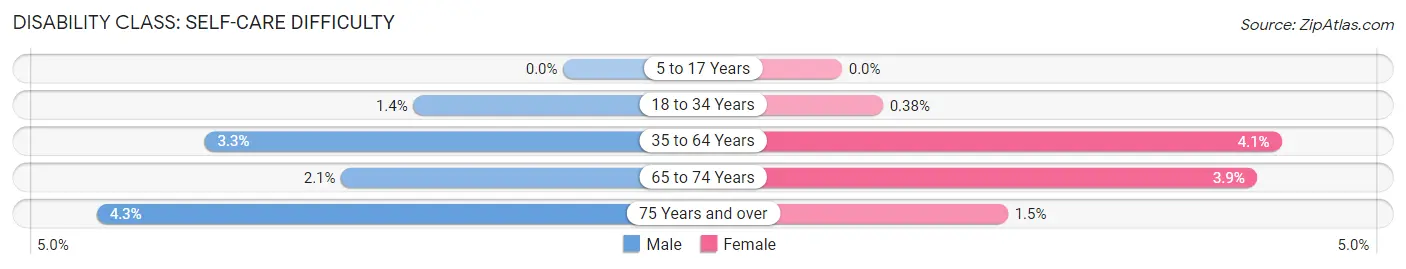
| Age Bracket | Male | Female |
| 5 to 17 Years | 0 (0.0%) | 0 (0.0%) |
| 18 to 34 Years | 7 (1.4%) | 2 (0.4%) |
| 35 to 64 Years | 44 (3.3%) | 52 (4.1%) |
| 65 to 74 Years | 9 (2.1%) | 16 (3.8%) |
| 75 Years and over | 10 (4.3%) | 5 (1.5%) |
Technology Access in Fremont County
Computing Device Access in Fremont County
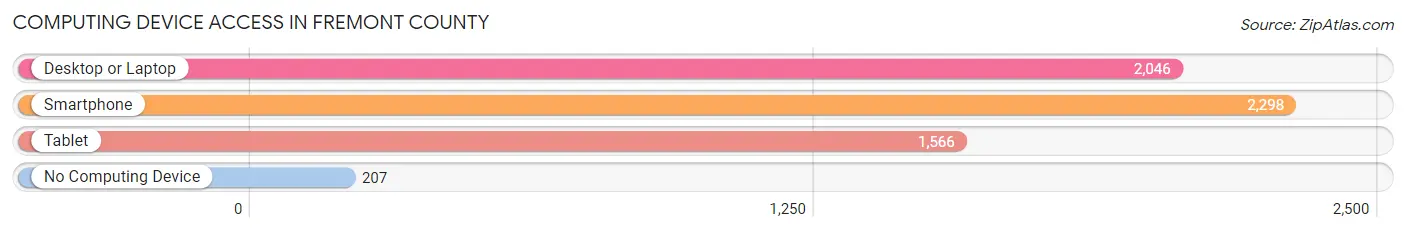
| Device Type | # Households | % Households |
| Desktop or Laptop | 2,046 | 74.8% |
| Smartphone | 2,298 | 84.0% |
| Tablet | 1,566 | 57.2% |
| No Computing Device | 207 | 7.6% |
| Total | 2,736 | 100.0% |
Internet Access in Fremont County
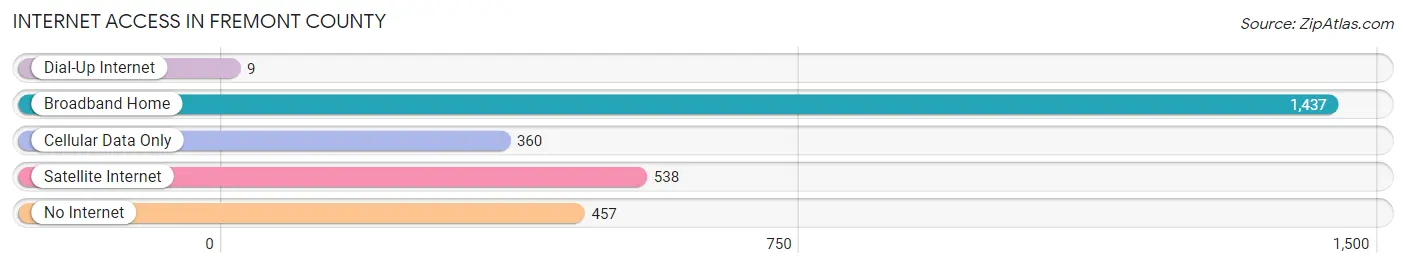
| Internet Type | # Households | % Households |
| Dial-Up Internet | 9 | 0.3% |
| Broadband Home | 1,437 | 52.5% |
| Cellular Data Only | 360 | 13.2% |
| Satellite Internet | 538 | 19.7% |
| No Internet | 457 | 16.7% |
| Total | 2,736 | 100.0% |
Fremont County Summary
Fremont County, Iowa is located in the southwestern corner of the state and is bordered by Mills County to the north, Page County to the east, Montgomery County to the south, and Harrison County to the west. The county seat is Sidney, and the county was named after John C. Fremont, an explorer and the first Republican presidential candidate. The county has a total area of 576 square miles, of which 575 square miles is land and 1 square mile is water.
As of the 2010 census, the population of Fremont County was 7,441, with a population density of 13 people per square mile. The median age was 44.7 years, and the median household income was $45,845. The racial makeup of the county was 97.3% White, 0.3% African American, 0.3% Native American, 0.2% Asian, 0.1% Pacific Islander, 0.7% from other races, and 1.1% from two or more races. Hispanic or Latino of any race were 2.2% of the population.
Fremont County is home to several small towns, including Sidney, Tabor, Thurman, and Hamburg. The county is also home to the Loess Hills, a region of rolling hills and bluffs that were formed by wind-blown silt deposits. The Loess Hills are a popular destination for outdoor recreation, including hiking, camping, and bird watching.
The economy of Fremont County is largely based on agriculture. The county is home to several large farms, as well as smaller family-owned operations. The main crops grown in the county are corn, soybeans, and hay. Livestock production is also important, with beef cattle, hogs, and sheep being raised in the area.
In addition to agriculture, Fremont County is home to several small businesses, including manufacturing, retail, and service industries. The county is also home to a number of tourist attractions, including the Loess Hills National Scenic Byway, the Sidney Historical Museum, and the Fremont County Fair.
Fremont County is served by two school districts, the Sidney Community School District and the Tabor-Hamburg Community School District. The county is also home to several higher education institutions, including Iowa Western Community College and the University of Iowa.
Fremont County is a rural area with a rich history and a strong agricultural economy. The county is home to a variety of attractions, including the Loess Hills National Scenic Byway, the Sidney Historical Museum, and the Fremont County Fair. The county is also home to several small businesses, including manufacturing, retail, and service industries. With its strong agricultural economy and its variety of attractions, Fremont County is an ideal place to live and work.
Common Questions
What is Per Capita Income in Fremont County?
Per Capita income in Fremont County is $37,236.
What is the Median Family Income in Fremont County?
Median Family Income in Fremont County is $83,844.
What is the Median Household income in Fremont County?
Median Household Income in Fremont County is $69,375.
What is Income or Wage Gap in Fremont County?
Income or Wage Gap in Fremont County is 25.1%.
Women in Fremont County earn 74.9 cents for every dollar earned by a man.
What is Inequality or Gini Index in Fremont County?
Inequality or Gini Index in Fremont County is 0.43.
What is the Total Population of Fremont County?
Total Population of Fremont County is 6,639.
What is the Total Male Population of Fremont County?
Total Male Population of Fremont County is 3,327.
What is the Total Female Population of Fremont County?
Total Female Population of Fremont County is 3,312.
What is the Ratio of Males per 100 Females in Fremont County?
There are 100.45 Males per 100 Females in Fremont County.
What is the Ratio of Females per 100 Males in Fremont County?
There are 99.55 Females per 100 Males in Fremont County.
What is the Median Population Age in Fremont County?
Median Population Age in Fremont County is 46.2 Years.
What is the Average Family Size in Fremont County
Average Family Size in Fremont County is 3.0 People.
What is the Average Household Size in Fremont County
Average Household Size in Fremont County is 2.4 People.
How Large is the Labor Force in Fremont County?
There are 3,204 People in the Labor Forcein in Fremont County.
What is the Percentage of People in the Labor Force in Fremont County?
59.6% of People are in the Labor Force in Fremont County.
What is the Unemployment Rate in Fremont County?
Unemployment Rate in Fremont County is 1.7%.