Emmet County, IA Map & Demographics
Emmet County Map
Emmet County Overview
$34,657
PER CAPITA INCOME
$76,332
AVG FAMILY INCOME
$64,461
AVG HOUSEHOLD INCOME
36.7%
WAGE / INCOME GAP [ % ]
63.3¢/ $1
WAGE / INCOME GAP [ $ ]
$10,156
FAMILY INCOME DEFICIT
0.43
INEQUALITY / GINI INDEX
9,349
TOTAL POPULATION
4,635
MALE POPULATION
4,714
FEMALE POPULATION
98.32
MALES / 100 FEMALES
101.70
FEMALES / 100 MALES
44.8
MEDIAN AGE
2.8
AVG FAMILY SIZE
2.2
AVG HOUSEHOLD SIZE
4,983
LABOR FORCE [ PEOPLE ]
64.0%
PERCENT IN LABOR FORCE
2.1%
UNEMPLOYMENT RATE
Emmet County Area Codes
Income in Emmet County
Income Overview in Emmet County
Per Capita Income in Emmet County is $34,657, while median incomes of families and households are $76,332 and $64,461 respectively.
| Characteristic | Number | Measure |
| Per Capita Income | 9,349 | $34,657 |
| Median Family Income | 2,229 | $76,332 |
| Mean Family Income | 2,229 | $91,443 |
| Median Household Income | 3,881 | $64,461 |
| Mean Household Income | 3,881 | $77,456 |
| Income Deficit | 2,229 | $10,156 |
| Wage / Income Gap (%) | 9,349 | 36.72% |
| Wage / Income Gap ($) | 9,349 | 63.28¢ per $1 |
| Gini / Inequality Index | 9,349 | 0.43 |
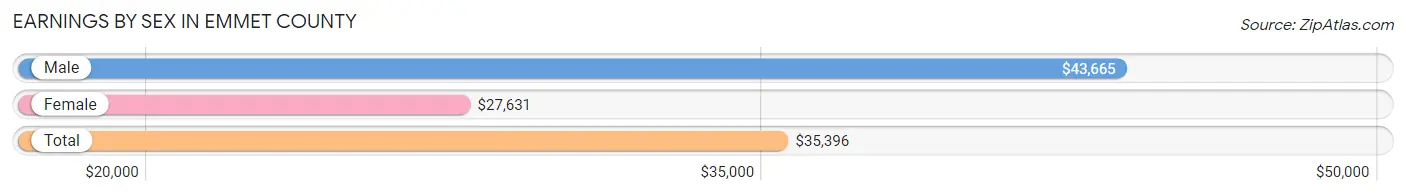
Earnings by Sex in Emmet County
Average Earnings in Emmet County are $35,396, $43,665 for men and $27,631 for women, a difference of 36.7%.
| Sex | Number | Average Earnings |
| Male | 2,981 (54.8%) | $43,665 |
| Female | 2,459 (45.2%) | $27,631 |
| Total | 5,440 (100.0%) | $35,396 |
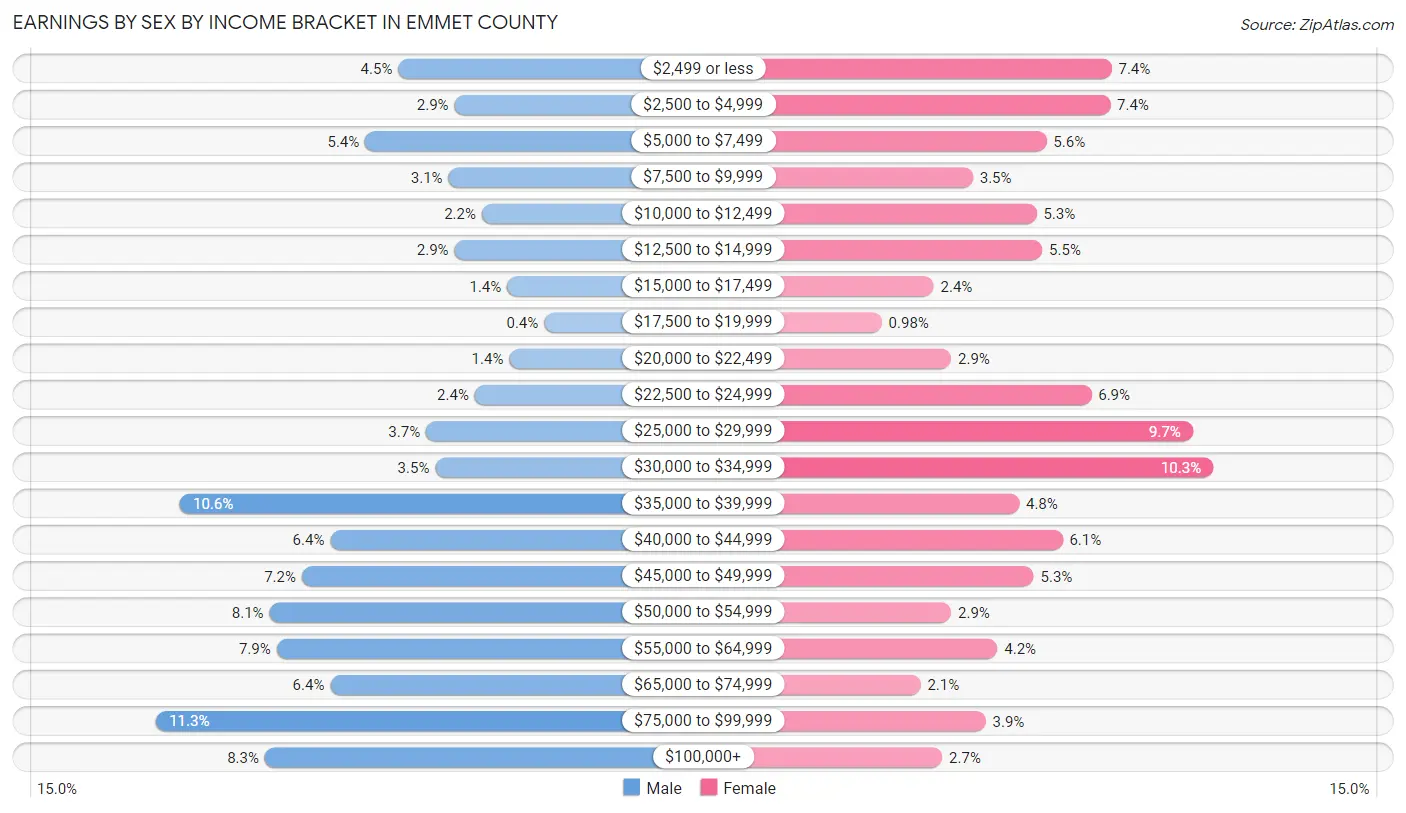
Earnings by Sex by Income Bracket in Emmet County
The most common earnings brackets in Emmet County are $75,000 to $99,999 for men (337 | 11.3%) and $30,000 to $34,999 for women (253 | 10.3%).
| Income | Male | Female |
| $2,499 or less | 134 (4.5%) | 183 (7.4%) |
| $2,500 to $4,999 | 87 (2.9%) | 182 (7.4%) |
| $5,000 to $7,499 | 162 (5.4%) | 138 (5.6%) |
| $7,500 to $9,999 | 92 (3.1%) | 87 (3.5%) |
| $10,000 to $12,499 | 64 (2.1%) | 131 (5.3%) |
| $12,500 to $14,999 | 87 (2.9%) | 135 (5.5%) |
| $15,000 to $17,499 | 43 (1.4%) | 60 (2.4%) |
| $17,500 to $19,999 | 12 (0.4%) | 24 (1.0%) |
| $20,000 to $22,499 | 41 (1.4%) | 72 (2.9%) |
| $22,500 to $24,999 | 70 (2.4%) | 169 (6.9%) |
| $25,000 to $29,999 | 111 (3.7%) | 239 (9.7%) |
| $30,000 to $34,999 | 103 (3.5%) | 253 (10.3%) |
| $35,000 to $39,999 | 317 (10.6%) | 119 (4.8%) |
| $40,000 to $44,999 | 191 (6.4%) | 149 (6.1%) |
| $45,000 to $49,999 | 215 (7.2%) | 129 (5.2%) |
| $50,000 to $54,999 | 242 (8.1%) | 72 (2.9%) |
| $55,000 to $64,999 | 236 (7.9%) | 104 (4.2%) |
| $65,000 to $74,999 | 191 (6.4%) | 51 (2.1%) |
| $75,000 to $99,999 | 337 (11.3%) | 96 (3.9%) |
| $100,000+ | 246 (8.3%) | 66 (2.7%) |
| Total | 2,981 (100.0%) | 2,459 (100.0%) |
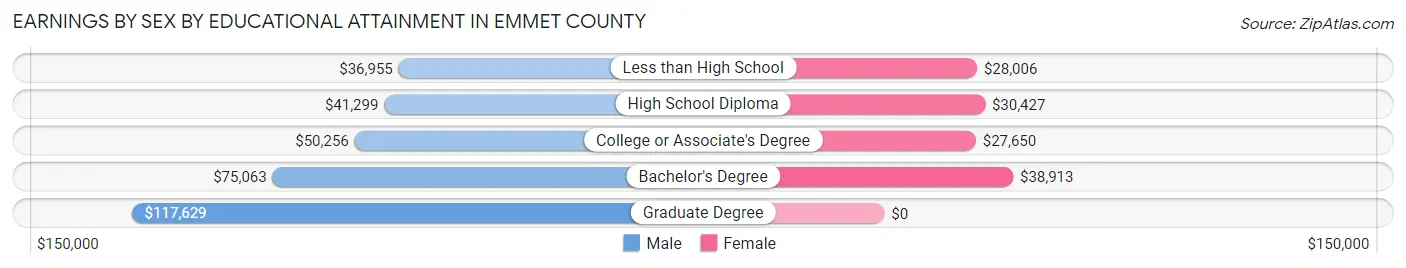
Earnings by Sex by Educational Attainment in Emmet County
Average earnings in Emmet County are $48,496 for men and $29,657 for women, a difference of 38.9%. Men with an educational attainment of graduate degree enjoy the highest average annual earnings of $117,629, while those with less than high school education earn the least with $36,955. Women with an educational attainment of bachelor's degree earn the most with the average annual earnings of $38,913, while those with college or associate's degree education have the smallest earnings of $27,650.
| Educational Attainment | Male Income | Female Income |
| Less than High School | $36,955 | $28,006 |
| High School Diploma | $41,299 | $30,427 |
| College or Associate's Degree | $50,256 | $27,650 |
| Bachelor's Degree | $75,063 | $38,913 |
| Graduate Degree | $117,629 | $0 |
| Total | $48,496 | $29,657 |
Family Income in Emmet County
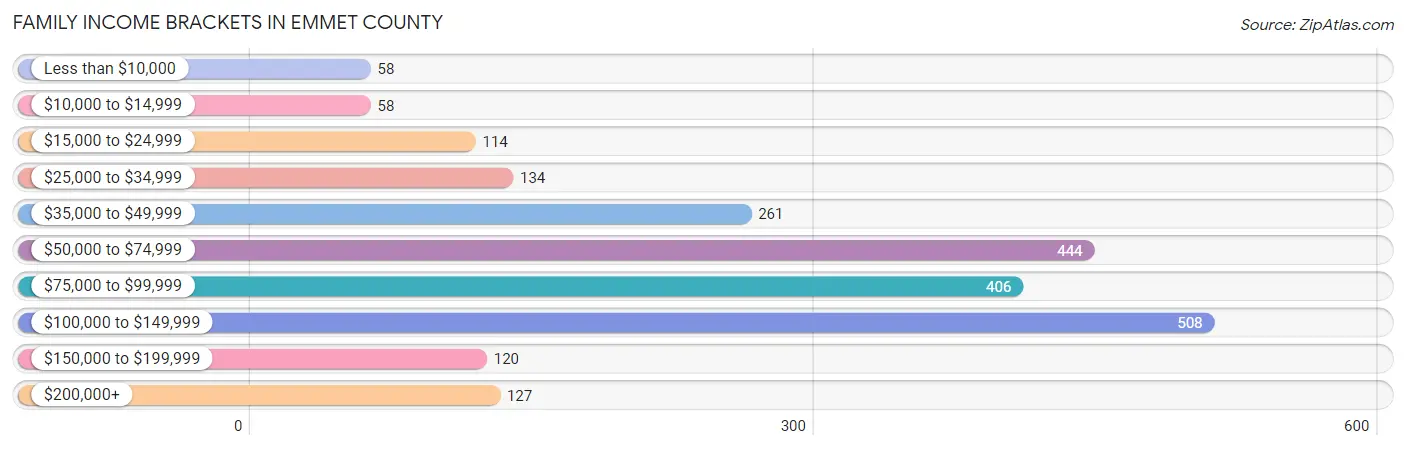
Family Income Brackets in Emmet County
According to the Emmet County family income data, there are 508 families falling into the $100,000 to $149,999 income range, which is the most common income bracket and makes up 22.8% of all families. Conversely, the less than $10,000 income bracket is the least frequent group with only 58 families (2.6%) belonging to this category.
| Income Bracket | # Families | % Families |
| Less than $10,000 | 58 | 2.6% |
| $10,000 to $14,999 | 58 | 2.6% |
| $15,000 to $24,999 | 114 | 5.1% |
| $25,000 to $34,999 | 134 | 6.0% |
| $35,000 to $49,999 | 261 | 11.7% |
| $50,000 to $74,999 | 444 | 19.9% |
| $75,000 to $99,999 | 406 | 18.2% |
| $100,000 to $149,999 | 508 | 22.8% |
| $150,000 to $199,999 | 120 | 5.4% |
| $200,000+ | 127 | 5.7% |
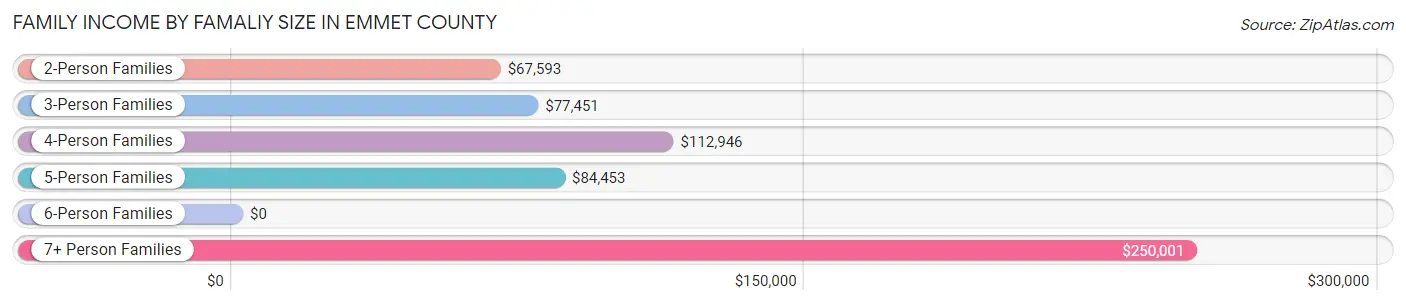
Family Income by Famaliy Size in Emmet County
7+ person families (44 | 2.0%) account for the highest median family income in Emmet County with $250,001 per family, while 7+ person families (44 | 2.0%) have the highest median income of $35,714 per family member.
| Income Bracket | # Families | Median Income |
| 2-Person Families | 1,346 (60.4%) | $67,593 |
| 3-Person Families | 348 (15.6%) | $77,451 |
| 4-Person Families | 215 (9.7%) | $112,946 |
| 5-Person Families | 229 (10.3%) | $84,453 |
| 6-Person Families | 47 (2.1%) | $0 |
| 7+ Person Families | 44 (2.0%) | $250,001 |
| Total | 2,229 (100.0%) | $76,332 |
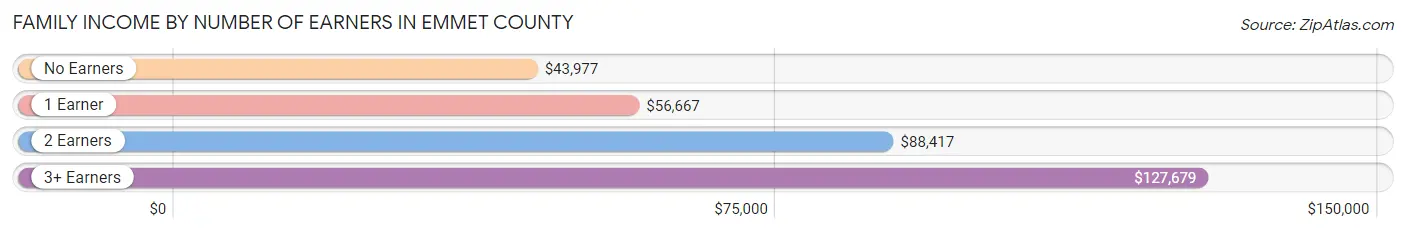
Family Income by Number of Earners in Emmet County
The median family income in Emmet County is $76,332, with families comprising 3+ earners (195) having the highest median family income of $127,679, while families with no earners (366) have the lowest median family income of $43,977, accounting for 8.7% and 16.4% of families, respectively.
| Number of Earners | # Families | Median Income |
| No Earners | 366 (16.4%) | $43,977 |
| 1 Earner | 552 (24.8%) | $56,667 |
| 2 Earners | 1,116 (50.1%) | $88,417 |
| 3+ Earners | 195 (8.7%) | $127,679 |
| Total | 2,229 (100.0%) | $76,332 |
Household Income in Emmet County
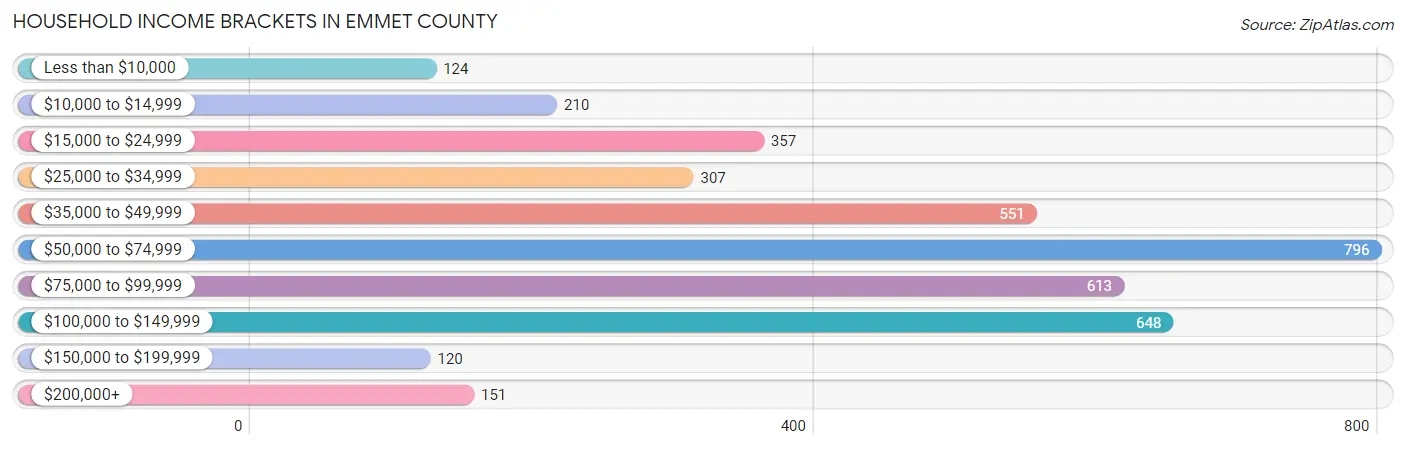
Household Income Brackets in Emmet County
With 796 households falling in the category, the $50,000 to $74,999 income range is the most frequent in Emmet County, accounting for 20.5% of all households. In contrast, only 120 households (3.1%) fall into the $150,000 to $199,999 income bracket, making it the least populous group.
| Income Bracket | # Households | % Households |
| Less than $10,000 | 124 | 3.2% |
| $10,000 to $14,999 | 210 | 5.4% |
| $15,000 to $24,999 | 357 | 9.2% |
| $25,000 to $34,999 | 307 | 7.9% |
| $35,000 to $49,999 | 551 | 14.2% |
| $50,000 to $74,999 | 796 | 20.5% |
| $75,000 to $99,999 | 613 | 15.8% |
| $100,000 to $149,999 | 648 | 16.7% |
| $150,000 to $199,999 | 120 | 3.1% |
| $200,000+ | 151 | 3.9% |
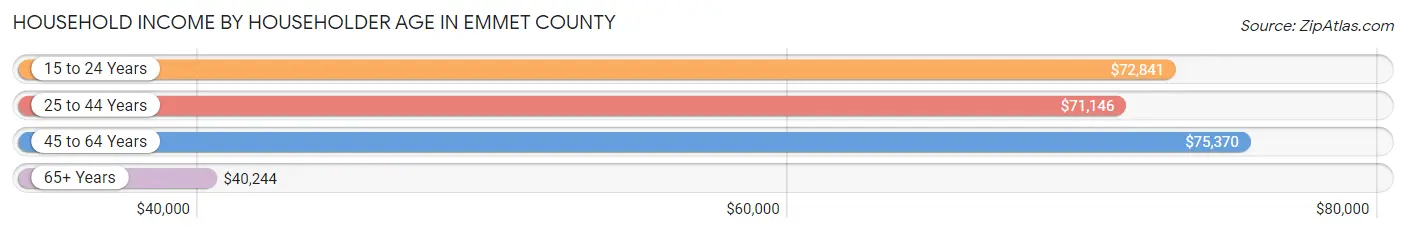
Household Income by Householder Age in Emmet County
The median household income in Emmet County is $64,461, with the highest median household income of $75,370 found in the 45 to 64 years age bracket for the primary householder. A total of 1,448 households (37.3%) fall into this category. Meanwhile, the 65+ years age bracket for the primary householder has the lowest median household income of $40,244, with 1,256 households (32.4%) in this group.
| Income Bracket | # Households | Median Income |
| 15 to 24 Years | 122 (3.1%) | $72,841 |
| 25 to 44 Years | 1,055 (27.2%) | $71,146 |
| 45 to 64 Years | 1,448 (37.3%) | $75,370 |
| 65+ Years | 1,256 (32.4%) | $40,244 |
| Total | 3,881 (100.0%) | $64,461 |
Poverty in Emmet County
Income Below Poverty by Sex and Age in Emmet County
With 11.1% poverty level for males and 14.3% for females among the residents of Emmet County, 6 to 11 year old males and 15 year old females are the most vulnerable to poverty, with 117 males (45.9%) and 17 females (42.5%) in their respective age groups living below the poverty level.
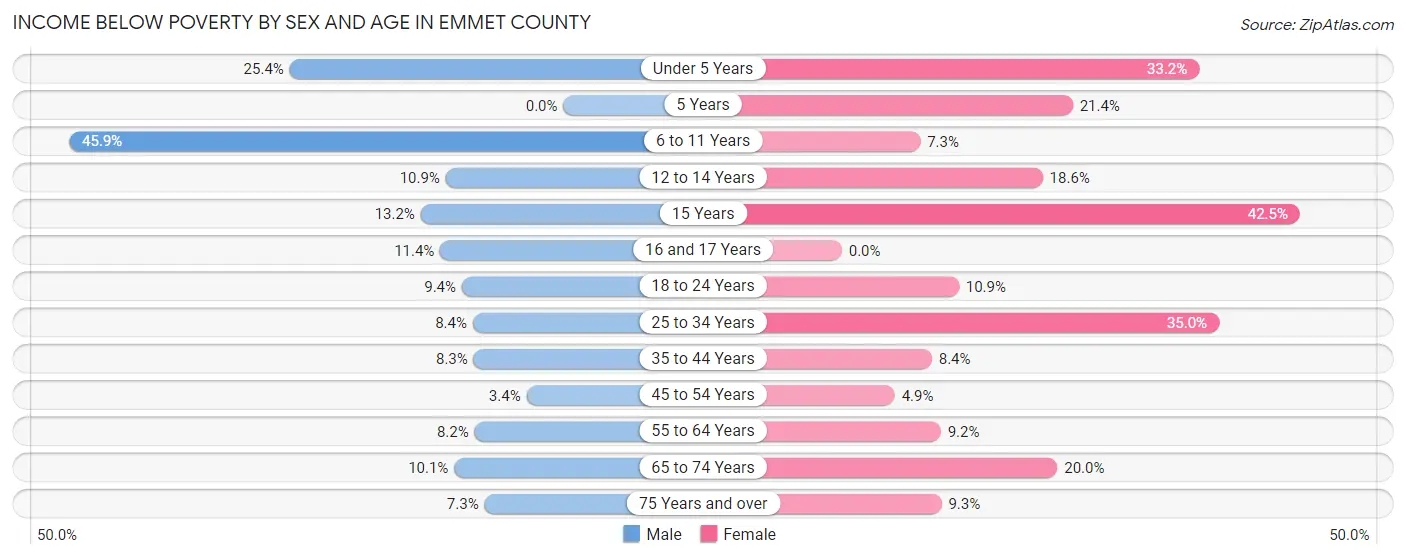
| Age Bracket | Male | Female |
| Under 5 Years | 48 (25.4%) | 63 (33.2%) |
| 5 Years | 0 (0.0%) | 9 (21.4%) |
| 6 to 11 Years | 117 (45.9%) | 27 (7.3%) |
| 12 to 14 Years | 25 (10.9%) | 22 (18.6%) |
| 15 Years | 9 (13.2%) | 17 (42.5%) |
| 16 and 17 Years | 12 (11.4%) | 0 (0.0%) |
| 18 to 24 Years | 18 (9.4%) | 24 (10.9%) |
| 25 to 34 Years | 43 (8.4%) | 154 (35.0%) |
| 35 to 44 Years | 46 (8.3%) | 42 (8.4%) |
| 45 to 54 Years | 20 (3.4%) | 23 (4.9%) |
| 55 to 64 Years | 58 (8.2%) | 68 (9.2%) |
| 65 to 74 Years | 62 (10.1%) | 125 (20.0%) |
| 75 Years and over | 26 (7.3%) | 38 (9.2%) |
| Total | 484 (11.1%) | 612 (14.3%) |
Income Above Poverty by Sex and Age in Emmet County
According to the poverty statistics in Emmet County, males aged 5 years and females aged 16 and 17 years are the age groups that are most secure financially, with 100.0% of males and 100.0% of females in these age groups living above the poverty line.
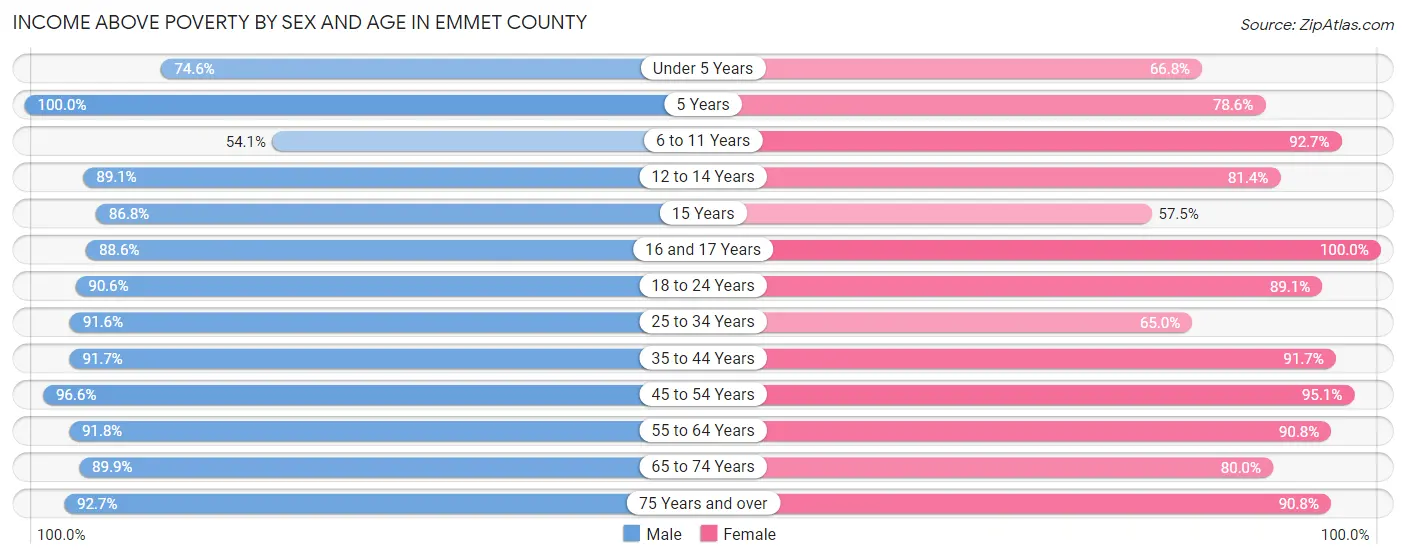
| Age Bracket | Male | Female |
| Under 5 Years | 141 (74.6%) | 127 (66.8%) |
| 5 Years | 6 (100.0%) | 33 (78.6%) |
| 6 to 11 Years | 138 (54.1%) | 344 (92.7%) |
| 12 to 14 Years | 204 (89.1%) | 96 (81.4%) |
| 15 Years | 59 (86.8%) | 23 (57.5%) |
| 16 and 17 Years | 93 (88.6%) | 100 (100.0%) |
| 18 to 24 Years | 173 (90.6%) | 197 (89.1%) |
| 25 to 34 Years | 469 (91.6%) | 286 (65.0%) |
| 35 to 44 Years | 506 (91.7%) | 461 (91.6%) |
| 45 to 54 Years | 564 (96.6%) | 445 (95.1%) |
| 55 to 64 Years | 646 (91.8%) | 673 (90.8%) |
| 65 to 74 Years | 550 (89.9%) | 500 (80.0%) |
| 75 Years and over | 329 (92.7%) | 373 (90.7%) |
| Total | 3,878 (88.9%) | 3,658 (85.7%) |
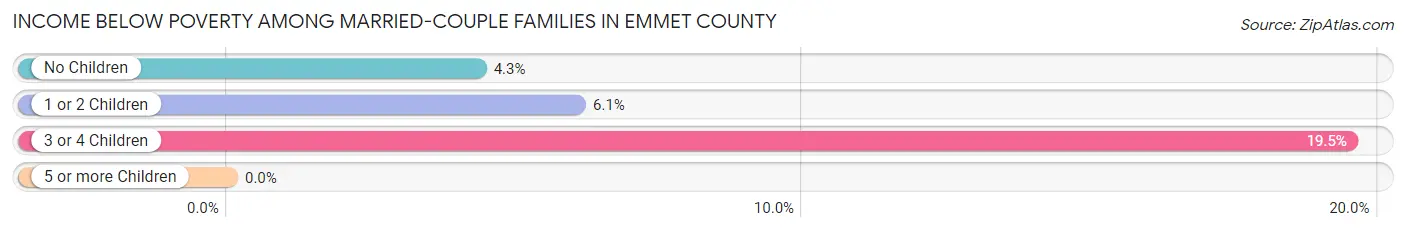
Income Below Poverty Among Married-Couple Families in Emmet County
The poverty statistics for married-couple families in Emmet County show that 6.8% or 115 of the total 1,689 families live below the poverty line. Families with 3 or 4 children have the highest poverty rate of 19.5%, comprising of 48 families. On the other hand, families with 5 or more children have the lowest poverty rate of 0.0%, which includes 0 families.
| Children | Above Poverty | Below Poverty |
| No Children | 1,082 (95.7%) | 49 (4.3%) |
| 1 or 2 Children | 279 (93.9%) | 18 (6.1%) |
| 3 or 4 Children | 198 (80.5%) | 48 (19.5%) |
| 5 or more Children | 15 (100.0%) | 0 (0.0%) |
| Total | 1,574 (93.2%) | 115 (6.8%) |
Income Below Poverty Among Single-Parent Households in Emmet County
According to the poverty data in Emmet County, 14.3% or 18 single-father households and 21.0% or 87 single-mother households are living below the poverty line. Among single-father households, those with 3 or 4 children have the highest poverty rate, with 7 households (100.0%) experiencing poverty. Likewise, among single-mother households, those with 5 or more children have the highest poverty rate, with 16 households (100.0%) falling below the poverty line.
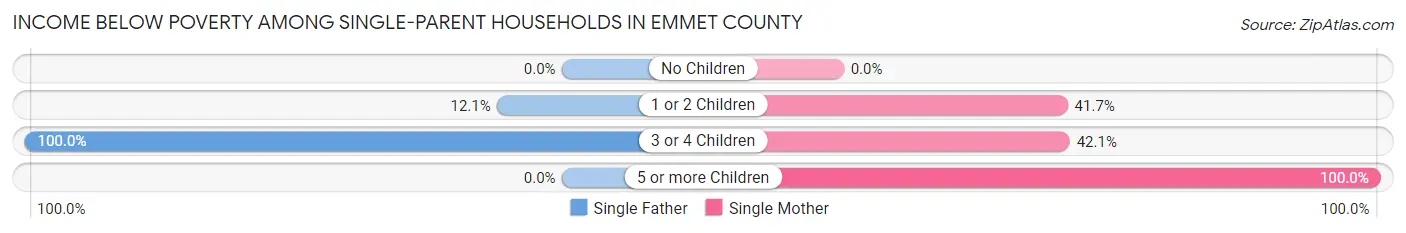
| Children | Single Father | Single Mother |
| No Children | 0 (0.0%) | 0 (0.0%) |
| 1 or 2 Children | 11 (12.1%) | 63 (41.7%) |
| 3 or 4 Children | 7 (100.0%) | 8 (42.1%) |
| 5 or more Children | 0 (0.0%) | 16 (100.0%) |
| Total | 18 (14.3%) | 87 (21.0%) |
Income Below Poverty Among Married-Couple vs Single-Parent Households in Emmet County
The poverty data for Emmet County shows that 115 of the married-couple family households (6.8%) and 105 of the single-parent households (19.4%) are living below the poverty level. Within the married-couple family households, those with 3 or 4 children have the highest poverty rate, with 48 households (19.5%) falling below the poverty line. Among the single-parent households, those with 5 or more children have the highest poverty rate, with 16 household (100.0%) living below poverty.
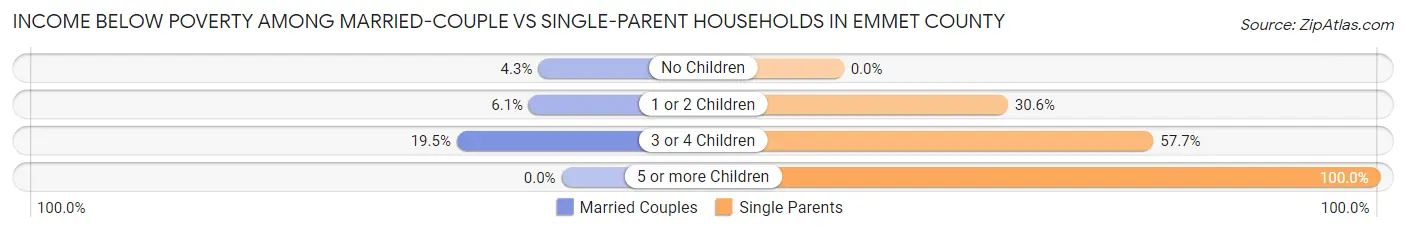
| Children | Married-Couple Families | Single-Parent Households |
| No Children | 49 (4.3%) | 0 (0.0%) |
| 1 or 2 Children | 18 (6.1%) | 74 (30.6%) |
| 3 or 4 Children | 48 (19.5%) | 15 (57.7%) |
| 5 or more Children | 0 (0.0%) | 16 (100.0%) |
| Total | 115 (6.8%) | 105 (19.4%) |
Race in Emmet County
The most populous races in Emmet County are White / Caucasian (8,083 | 86.5%), Hispanic or Latino (922 | 9.9%), and Two or more Races (686 | 7.3%).
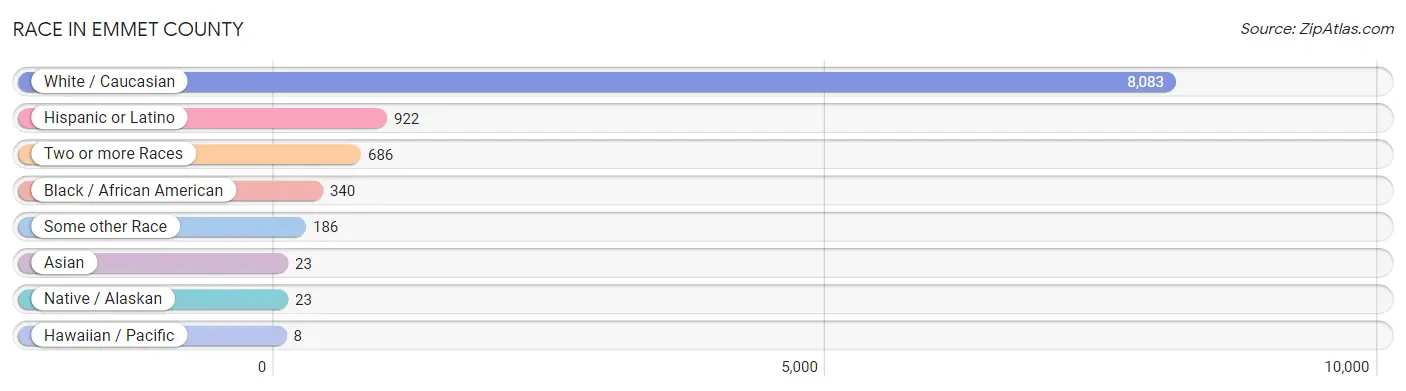
| Race | # Population | % Population |
| Asian | 23 | 0.3% |
| Black / African American | 340 | 3.6% |
| Hawaiian / Pacific | 8 | 0.1% |
| Hispanic or Latino | 922 | 9.9% |
| Native / Alaskan | 23 | 0.3% |
| White / Caucasian | 8,083 | 86.5% |
| Two or more Races | 686 | 7.3% |
| Some other Race | 186 | 2.0% |
| Total | 9,349 | 100.0% |
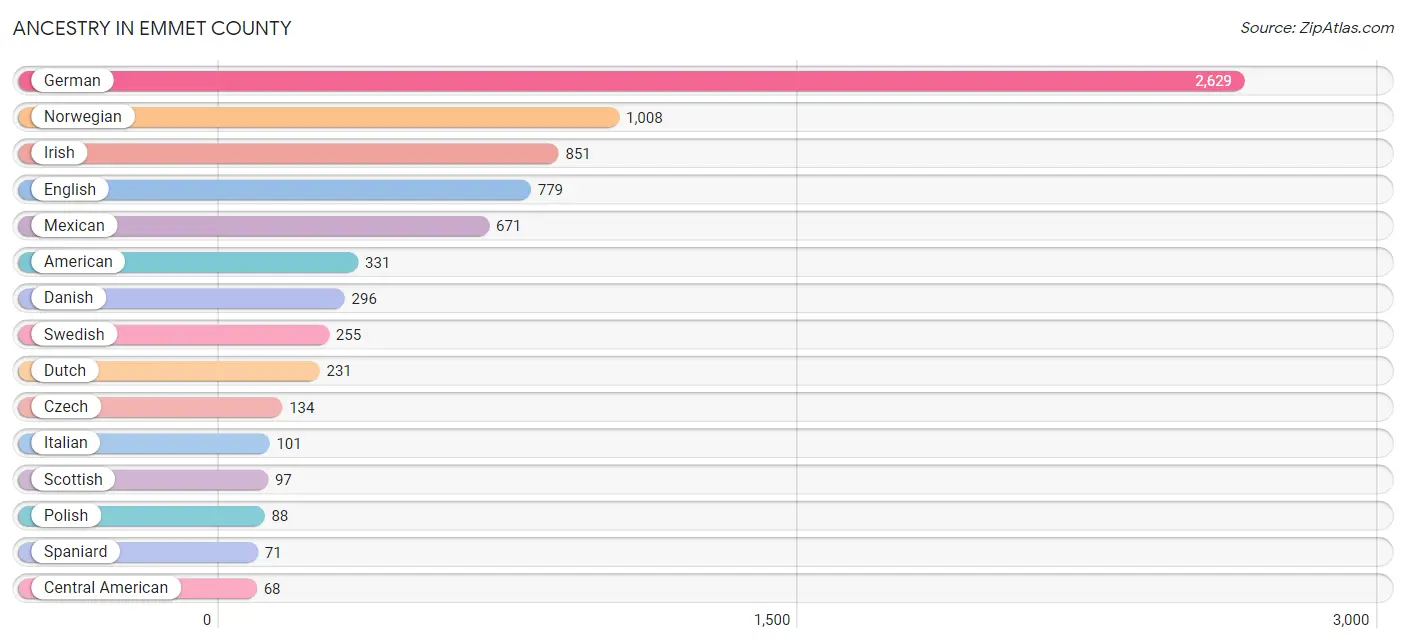
Ancestry in Emmet County
The most populous ancestries reported in Emmet County are German (2,629 | 28.1%), Norwegian (1,008 | 10.8%), Irish (851 | 9.1%), English (779 | 8.3%), and Mexican (671 | 7.2%), together accounting for 63.5% of all Emmet County residents.
| Ancestry | # Population | % Population |
| African | 16 | 0.2% |
| American | 331 | 3.5% |
| Arab | 2 | 0.0% |
| Austrian | 5 | 0.1% |
| Belgian | 5 | 0.1% |
| Bolivian | 12 | 0.1% |
| Brazilian | 11 | 0.1% |
| British | 53 | 0.6% |
| Burmese | 2 | 0.0% |
| Canadian | 12 | 0.1% |
| Central American | 68 | 0.7% |
| Cherokee | 5 | 0.1% |
| Choctaw | 5 | 0.1% |
| Comanche | 7 | 0.1% |
| Czech | 134 | 1.4% |
| Czechoslovakian | 52 | 0.6% |
| Danish | 296 | 3.2% |
| Dutch | 231 | 2.5% |
| Eastern European | 22 | 0.2% |
| Egyptian | 2 | 0.0% |
| English | 779 | 8.3% |
| European | 63 | 0.7% |
| Fijian | 20 | 0.2% |
| French | 53 | 0.6% |
| French Canadian | 8 | 0.1% |
| German | 2,629 | 28.1% |
| Greek | 11 | 0.1% |
| Haitian | 7 | 0.1% |
| Honduran | 33 | 0.4% |
| Hungarian | 51 | 0.5% |
| Indian (Asian) | 11 | 0.1% |
| Irish | 851 | 9.1% |
| Italian | 101 | 1.1% |
| Korean | 5 | 0.1% |
| Liberian | 29 | 0.3% |
| Lithuanian | 1 | 0.0% |
| Mexican | 671 | 7.2% |
| Navajo | 11 | 0.1% |
| Northern European | 22 | 0.2% |
| Norwegian | 1,008 | 10.8% |
| Ottawa | 12 | 0.1% |
| Panamanian | 4 | 0.0% |
| Pennsylvania German | 4 | 0.0% |
| Polish | 88 | 0.9% |
| Puerto Rican | 5 | 0.1% |
| Romanian | 7 | 0.1% |
| Russian | 6 | 0.1% |
| Salvadoran | 31 | 0.3% |
| Scandinavian | 31 | 0.3% |
| Scotch-Irish | 56 | 0.6% |
| Scottish | 97 | 1.0% |
| Sierra Leonean | 29 | 0.3% |
| Slovak | 22 | 0.2% |
| South American | 12 | 0.1% |
| Spaniard | 71 | 0.8% |
| Sri Lankan | 5 | 0.1% |
| Subsaharan African | 46 | 0.5% |
| Sudanese | 1 | 0.0% |
| Swedish | 255 | 2.7% |
| Swiss | 9 | 0.1% |
| Ute | 5 | 0.1% |
| Welsh | 27 | 0.3% | View All 62 Rows |
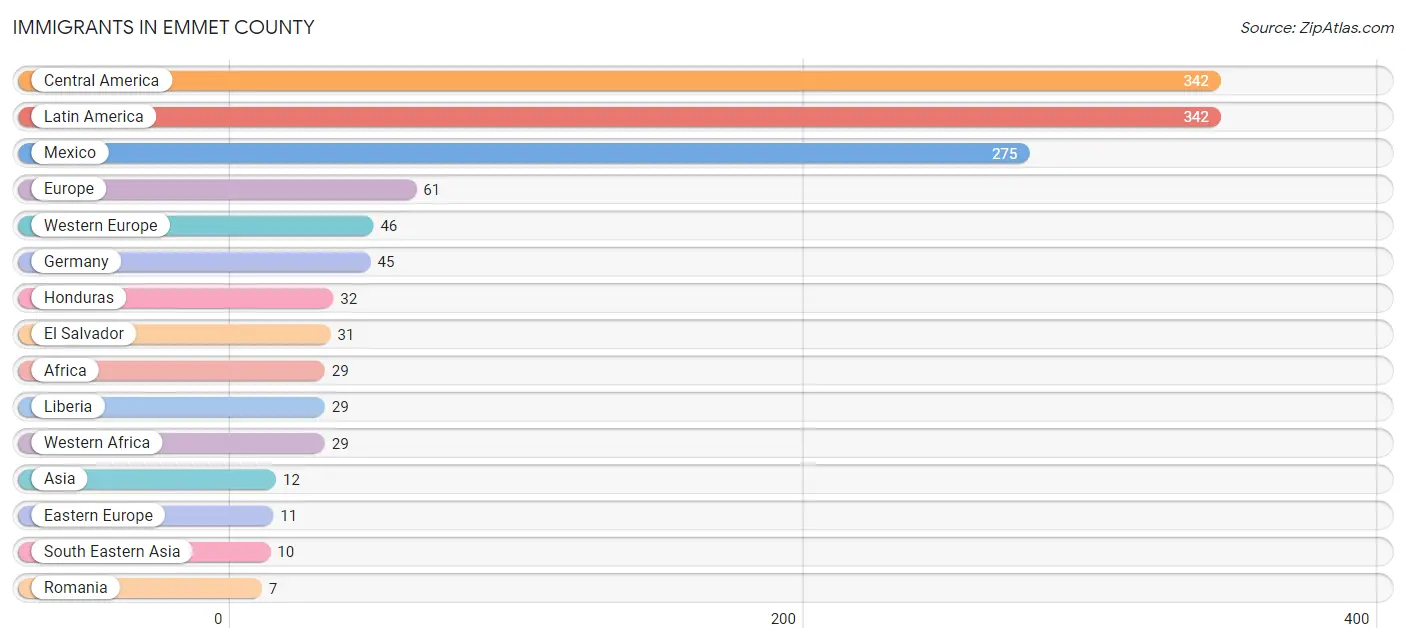
Immigrants in Emmet County
The most numerous immigrant groups reported in Emmet County came from Central America (342 | 3.7%), Latin America (342 | 3.7%), Mexico (275 | 2.9%), Europe (61 | 0.6%), and Western Europe (46 | 0.5%), together accounting for 11.4% of all Emmet County residents.
| Immigration Origin | # Population | % Population |
| Africa | 29 | 0.3% |
| Asia | 12 | 0.1% |
| Canada | 3 | 0.0% |
| Central America | 342 | 3.7% |
| Eastern Asia | 2 | 0.0% |
| Eastern Europe | 11 | 0.1% |
| El Salvador | 31 | 0.3% |
| Europe | 61 | 0.6% |
| Germany | 45 | 0.5% |
| Honduras | 32 | 0.3% |
| Italy | 4 | 0.0% |
| Korea | 2 | 0.0% |
| Latin America | 342 | 3.7% |
| Liberia | 29 | 0.3% |
| Mexico | 275 | 2.9% |
| Panama | 4 | 0.0% |
| Philippines | 5 | 0.1% |
| Romania | 7 | 0.1% |
| South Eastern Asia | 10 | 0.1% |
| Southern Europe | 4 | 0.0% |
| Switzerland | 1 | 0.0% |
| Ukraine | 4 | 0.0% |
| Vietnam | 5 | 0.1% |
| Western Africa | 29 | 0.3% |
| Western Europe | 46 | 0.5% | View All 25 Rows |
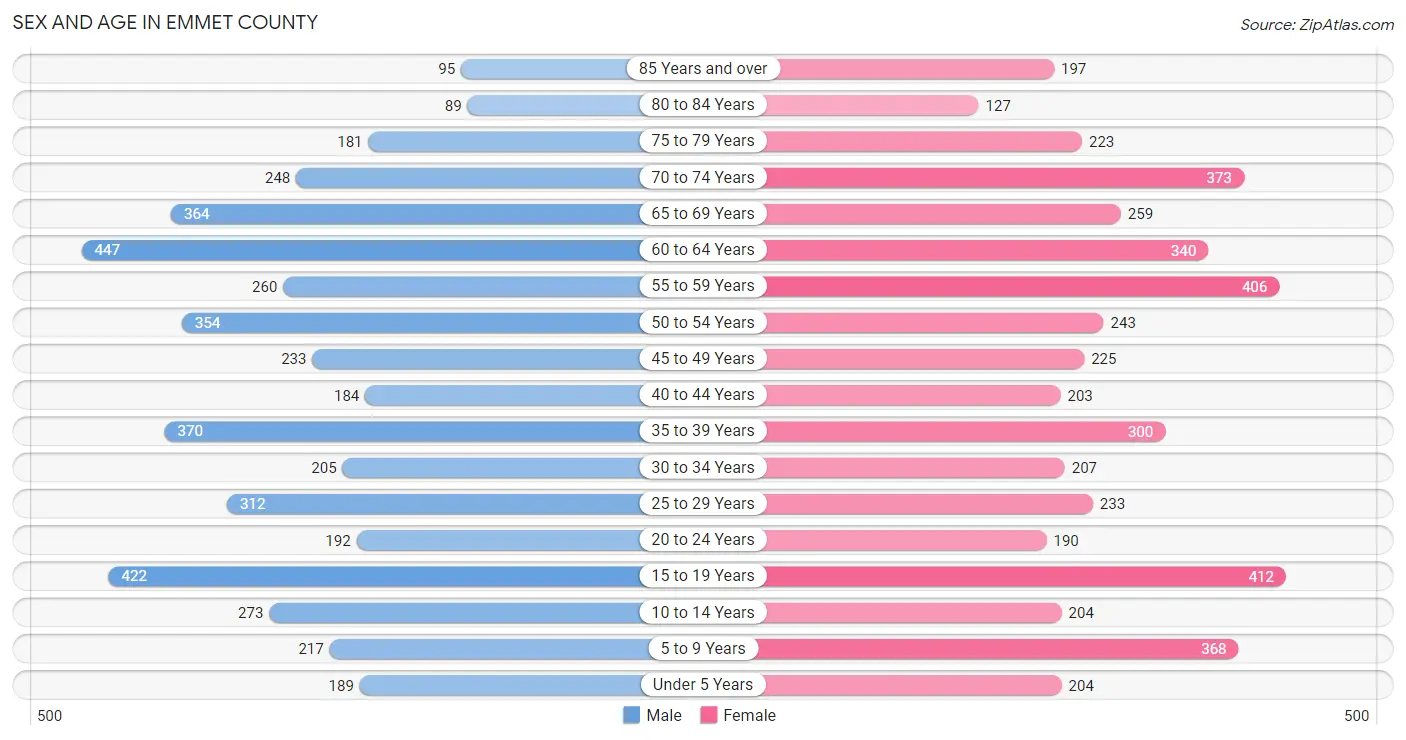
Sex and Age in Emmet County
Sex and Age in Emmet County
The most populous age groups in Emmet County are 60 to 64 Years (447 | 9.6%) for men and 15 to 19 Years (412 | 8.7%) for women.
| Age Bracket | Male | Female |
| Under 5 Years | 189 (4.1%) | 204 (4.3%) |
| 5 to 9 Years | 217 (4.7%) | 368 (7.8%) |
| 10 to 14 Years | 273 (5.9%) | 204 (4.3%) |
| 15 to 19 Years | 422 (9.1%) | 412 (8.7%) |
| 20 to 24 Years | 192 (4.1%) | 190 (4.0%) |
| 25 to 29 Years | 312 (6.7%) | 233 (4.9%) |
| 30 to 34 Years | 205 (4.4%) | 207 (4.4%) |
| 35 to 39 Years | 370 (8.0%) | 300 (6.4%) |
| 40 to 44 Years | 184 (4.0%) | 203 (4.3%) |
| 45 to 49 Years | 233 (5.0%) | 225 (4.8%) |
| 50 to 54 Years | 354 (7.6%) | 243 (5.1%) |
| 55 to 59 Years | 260 (5.6%) | 406 (8.6%) |
| 60 to 64 Years | 447 (9.6%) | 340 (7.2%) |
| 65 to 69 Years | 364 (7.9%) | 259 (5.5%) |
| 70 to 74 Years | 248 (5.3%) | 373 (7.9%) |
| 75 to 79 Years | 181 (3.9%) | 223 (4.7%) |
| 80 to 84 Years | 89 (1.9%) | 127 (2.7%) |
| 85 Years and over | 95 (2.1%) | 197 (4.2%) |
| Total | 4,635 (100.0%) | 4,714 (100.0%) |
Families and Households in Emmet County
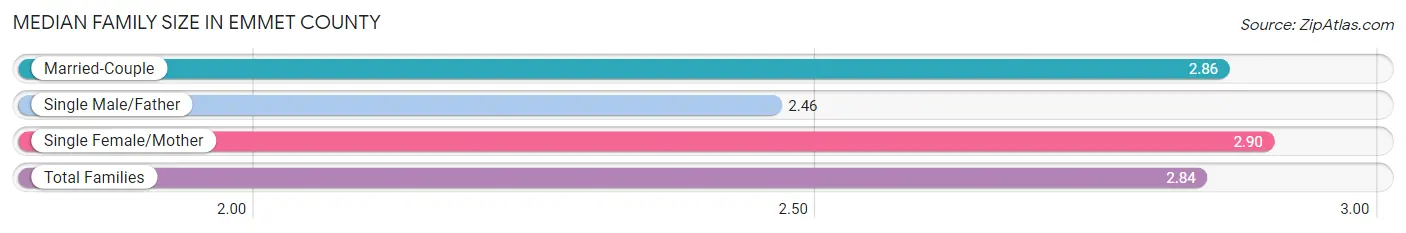
Median Family Size in Emmet County
The median family size in Emmet County is 2.84 persons per family, with single female/mother families (414 | 18.6%) accounting for the largest median family size of 2.9 persons per family. On the other hand, single male/father families (126 | 5.7%) represent the smallest median family size with 2.46 persons per family.
| Family Type | # Families | Family Size |
| Married-Couple | 1,689 (75.8%) | 2.86 |
| Single Male/Father | 126 (5.7%) | 2.46 |
| Single Female/Mother | 414 (18.6%) | 2.90 |
| Total Families | 2,229 (100.0%) | 2.84 |
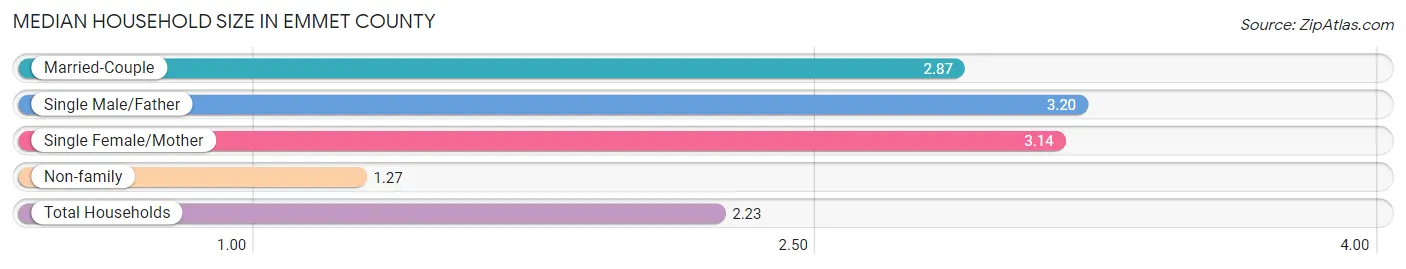
Median Household Size in Emmet County
The median household size in Emmet County is 2.23 persons per household, with single male/father households (126 | 3.3%) accounting for the largest median household size of 3.2 persons per household. non-family households (1,652 | 42.6%) represent the smallest median household size with 1.27 persons per household.
| Household Type | # Households | Household Size |
| Married-Couple | 1,689 (43.5%) | 2.87 |
| Single Male/Father | 126 (3.3%) | 3.20 |
| Single Female/Mother | 414 (10.7%) | 3.14 |
| Non-family | 1,652 (42.6%) | 1.27 |
| Total Households | 3,881 (100.0%) | 2.23 |
Household Size by Marriage Status in Emmet County
Out of a total of 3,881 households in Emmet County, 2,229 (57.4%) are family households, while 1,652 (42.6%) are nonfamily households. The most numerous type of family households are 2-person households, comprising 1,243, and the most common type of nonfamily households are 1-person households, comprising 1,314.
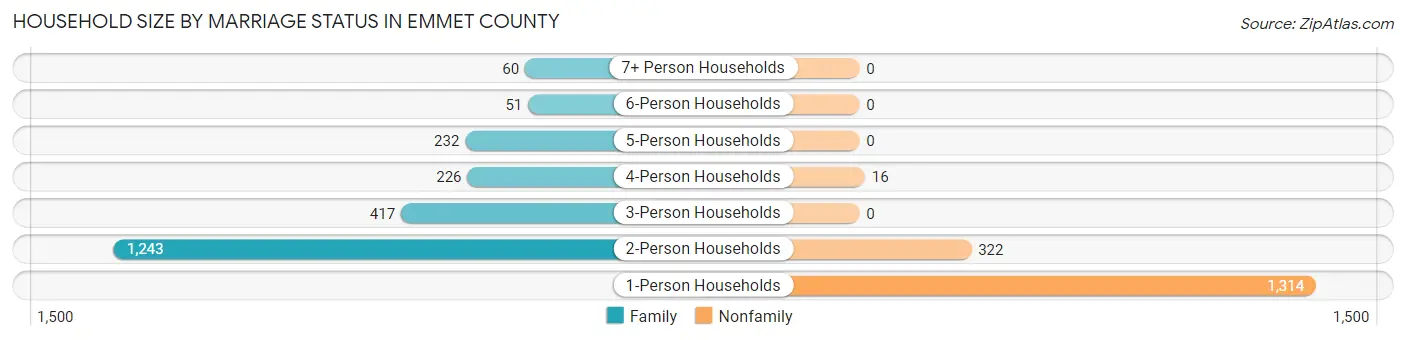
| Household Size | Family Households | Nonfamily Households |
| 1-Person Households | - | 1,314 (33.9%) |
| 2-Person Households | 1,243 (32.0%) | 322 (8.3%) |
| 3-Person Households | 417 (10.7%) | 0 (0.0%) |
| 4-Person Households | 226 (5.8%) | 16 (0.4%) |
| 5-Person Households | 232 (6.0%) | 0 (0.0%) |
| 6-Person Households | 51 (1.3%) | 0 (0.0%) |
| 7+ Person Households | 60 (1.5%) | 0 (0.0%) |
| Total | 2,229 (57.4%) | 1,652 (42.6%) |
Female Fertility in Emmet County
Fertility by Age in Emmet County
Average fertility rate in Emmet County is 77.0 births per 1,000 women. Women in the age bracket of 20 to 34 years have the highest fertility rate with 168.0 births per 1,000 women. Women in the age bracket of 20 to 34 years acount for 77.4% of all women with births.
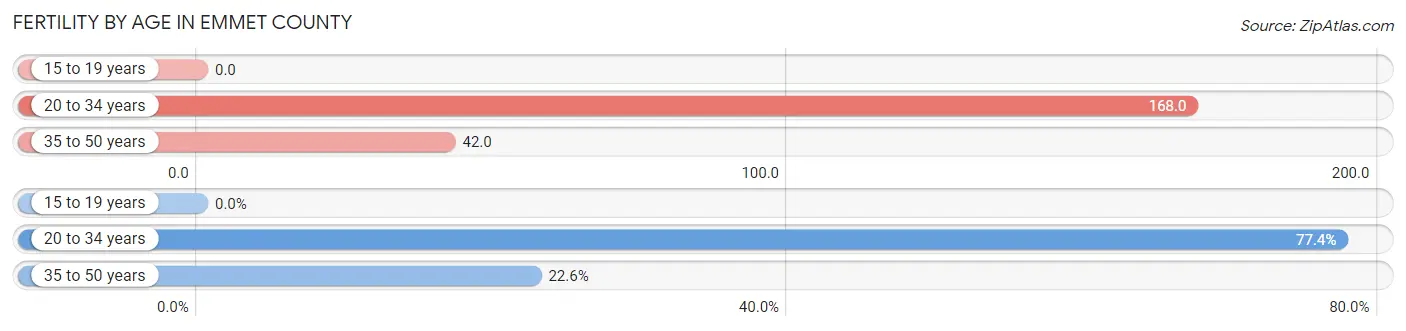
| Age Bracket | Women with Births | Births / 1,000 Women |
| 15 to 19 years | 0 (0.0%) | 0.0 |
| 20 to 34 years | 106 (77.4%) | 168.0 |
| 35 to 50 years | 31 (22.6%) | 42.0 |
| Total | 137 (100.0%) | 77.0 |
Fertility by Age by Marriage Status in Emmet County
37.2% of women with births (137) in Emmet County are married. The highest percentage of unmarried women with births falls into 20 to 34 years age bracket with 80.2% of them unmarried at the time of birth, while the lowest percentage of unmarried women with births belong to 35 to 50 years age bracket with 3.2% of them unmarried.
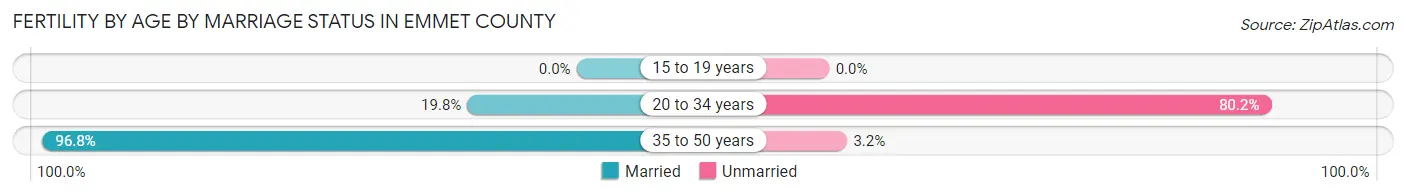
| Age Bracket | Married | Unmarried |
| 15 to 19 years | 0 (0.0%) | 0 (0.0%) |
| 20 to 34 years | 21 (19.8%) | 85 (80.2%) |
| 35 to 50 years | 30 (96.8%) | 1 (3.2%) |
| Total | 51 (37.2%) | 86 (62.8%) |
Fertility by Education in Emmet County
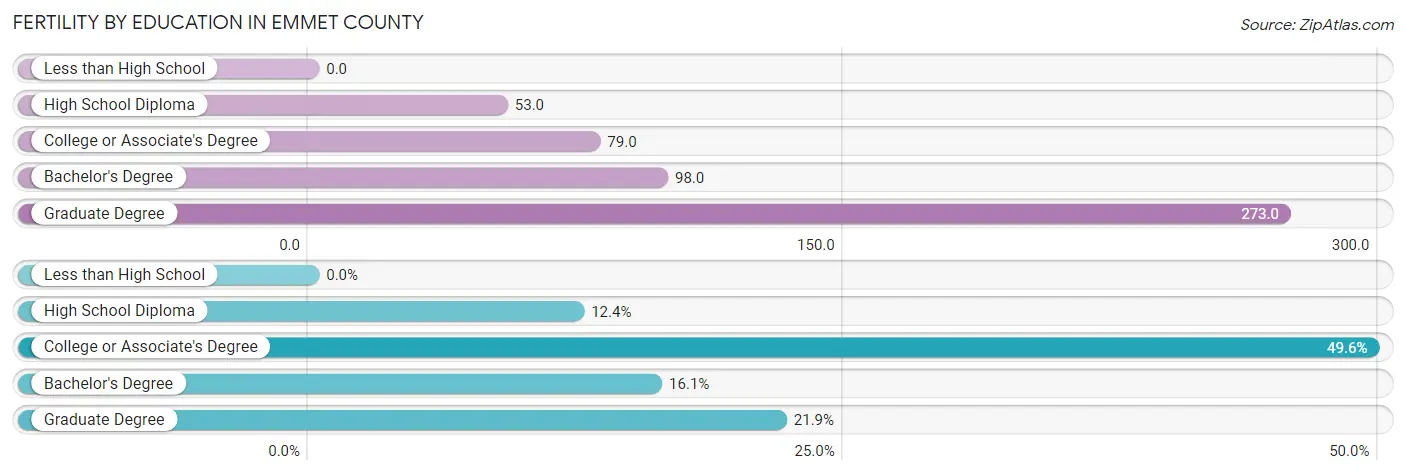
| Educational Attainment | Women with Births | Births / 1,000 Women |
| Less than High School | 0 (0.0%) | 0.0 |
| High School Diploma | 17 (12.4%) | 53.0 |
| College or Associate's Degree | 68 (49.6%) | 79.0 |
| Bachelor's Degree | 22 (16.1%) | 98.0 |
| Graduate Degree | 30 (21.9%) | 273.0 |
| Total | 137 (100.0%) | 77.0 |
Fertility by Education by Marriage Status in Emmet County
62.8% of women with births in Emmet County are unmarried. Women with the educational attainment of graduate degree are most likely to be married with 100.0% of them married at childbirth, while women with the educational attainment of high school diploma are least likely to be married with 100.0% of them unmarried at childbirth.
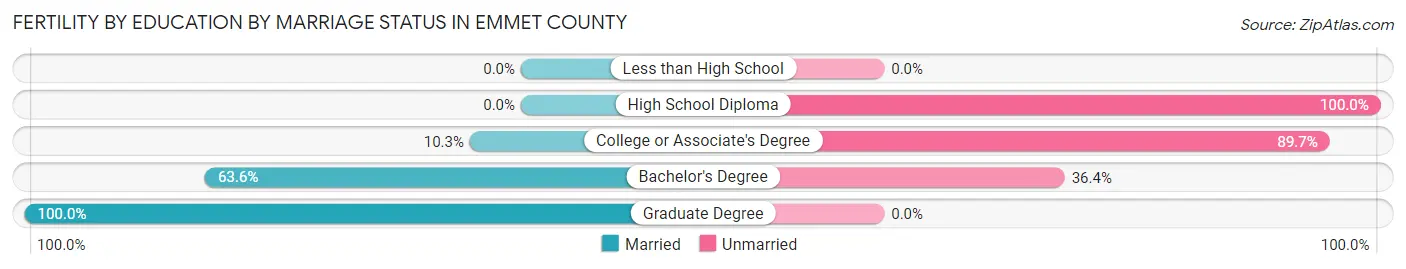
| Educational Attainment | Married | Unmarried |
| Less than High School | 0 (0.0%) | 0 (0.0%) |
| High School Diploma | 0 (0.0%) | 17 (100.0%) |
| College or Associate's Degree | 7 (10.3%) | 61 (89.7%) |
| Bachelor's Degree | 14 (63.6%) | 8 (36.4%) |
| Graduate Degree | 30 (100.0%) | 0 (0.0%) |
| Total | 51 (37.2%) | 86 (62.8%) |
Employment Characteristics in Emmet County
Employment by Class of Employer in Emmet County
Among the 4,843 employed individuals in Emmet County, private company employees (3,300 | 68.1%), self-employed (not incorporated) (438 | 9.0%), and not-for-profit organizations (349 | 7.2%) make up the most common classes of employment.
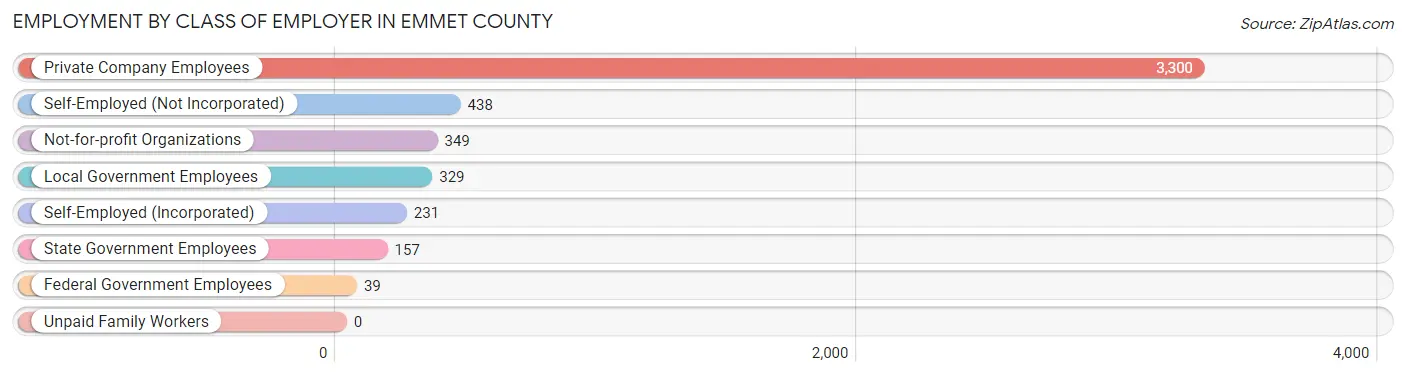
| Employer Class | # Employees | % Employees |
| Private Company Employees | 3,300 | 68.1% |
| Self-Employed (Incorporated) | 231 | 4.8% |
| Self-Employed (Not Incorporated) | 438 | 9.0% |
| Not-for-profit Organizations | 349 | 7.2% |
| Local Government Employees | 329 | 6.8% |
| State Government Employees | 157 | 3.2% |
| Federal Government Employees | 39 | 0.8% |
| Unpaid Family Workers | 0 | 0.0% |
| Total | 4,843 | 100.0% |
Employment Status by Age in Emmet County
According to the labor force statistics for Emmet County, out of the total population over 16 years of age (7,786), 64.0% or 4,983 individuals are in the labor force, with 2.1% or 105 of them unemployed. The age group with the highest labor force participation rate is 45 to 54 years, with 93.2% or 983 individuals in the labor force. Within the labor force, the 16 to 19 years age range has the highest percentage of unemployed individuals, with 7.9% or 30 of them being unemployed.
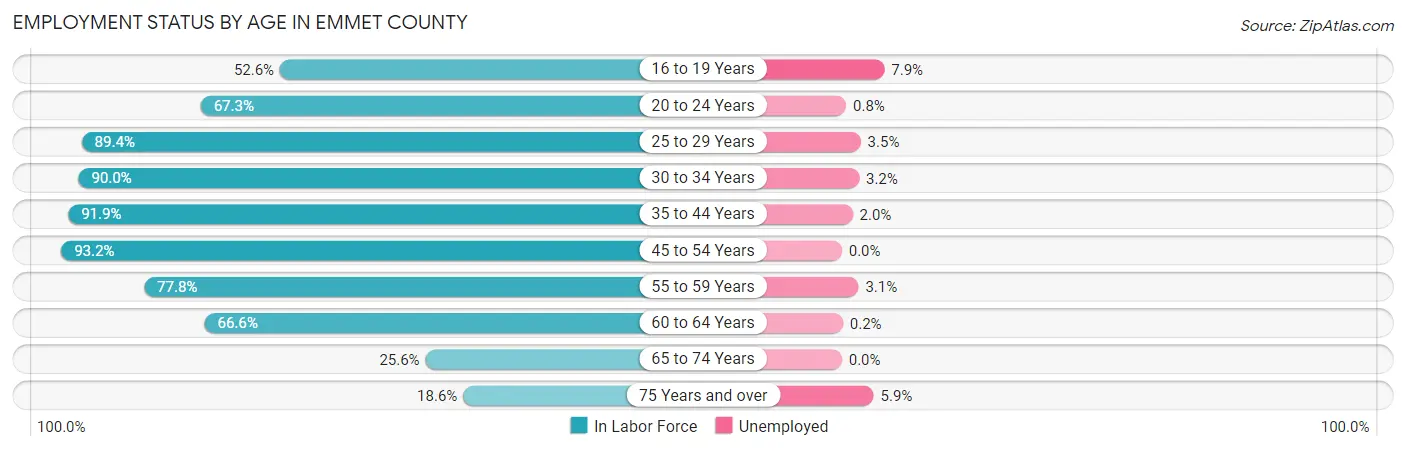
| Age Bracket | In Labor Force | Unemployed |
| 16 to 19 Years | 382 (52.6%) | 30 (7.9%) |
| 20 to 24 Years | 257 (67.3%) | 2 (0.8%) |
| 25 to 29 Years | 487 (89.4%) | 17 (3.5%) |
| 30 to 34 Years | 371 (90.0%) | 12 (3.2%) |
| 35 to 44 Years | 971 (91.9%) | 19 (2.0%) |
| 45 to 54 Years | 983 (93.2%) | 0 (0.0%) |
| 55 to 59 Years | 518 (77.8%) | 16 (3.1%) |
| 60 to 64 Years | 524 (66.6%) | 1 (0.2%) |
| 65 to 74 Years | 318 (25.6%) | 0 (0.0%) |
| 75 Years and over | 170 (18.6%) | 10 (5.9%) |
| Total | 4,983 (64.0%) | 105 (2.1%) |
Employment Status by Educational Attainment in Emmet County
According to labor force statistics for Emmet County, 85.2% of individuals (3,853) out of the total population between 25 and 64 years of age (4,522) are in the labor force, with 1.7% or 66 of them being unemployed. The group with the highest labor force participation rate are those with the educational attainment of bachelor's degree or higher, with 92.1% or 649 individuals in the labor force. Within the labor force, individuals with high school diploma education have the highest percentage of unemployment, with 4.4% or 51 of them being unemployed.
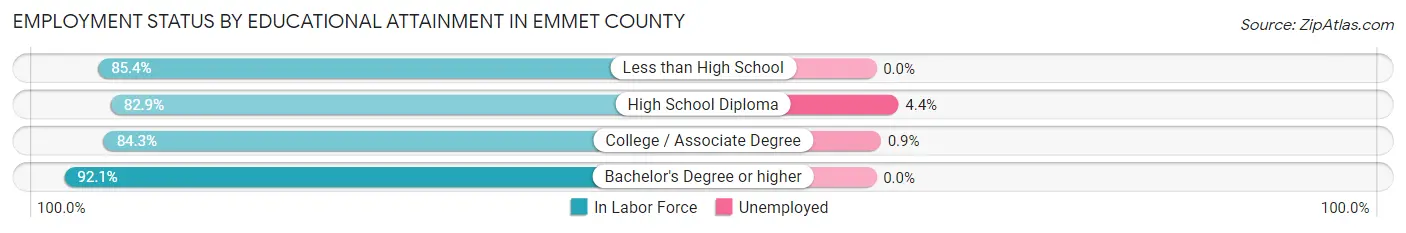
| Educational Attainment | In Labor Force | Unemployed |
| Less than High School | 526 (85.4%) | 0 (0.0%) |
| High School Diploma | 1,151 (82.9%) | 61 (4.4%) |
| College / Associate Degree | 1,528 (84.3%) | 16 (0.9%) |
| Bachelor's Degree or higher | 649 (92.1%) | 0 (0.0%) |
| Total | 3,853 (85.2%) | 77 (1.7%) |
Employment Occupations by Sex in Emmet County
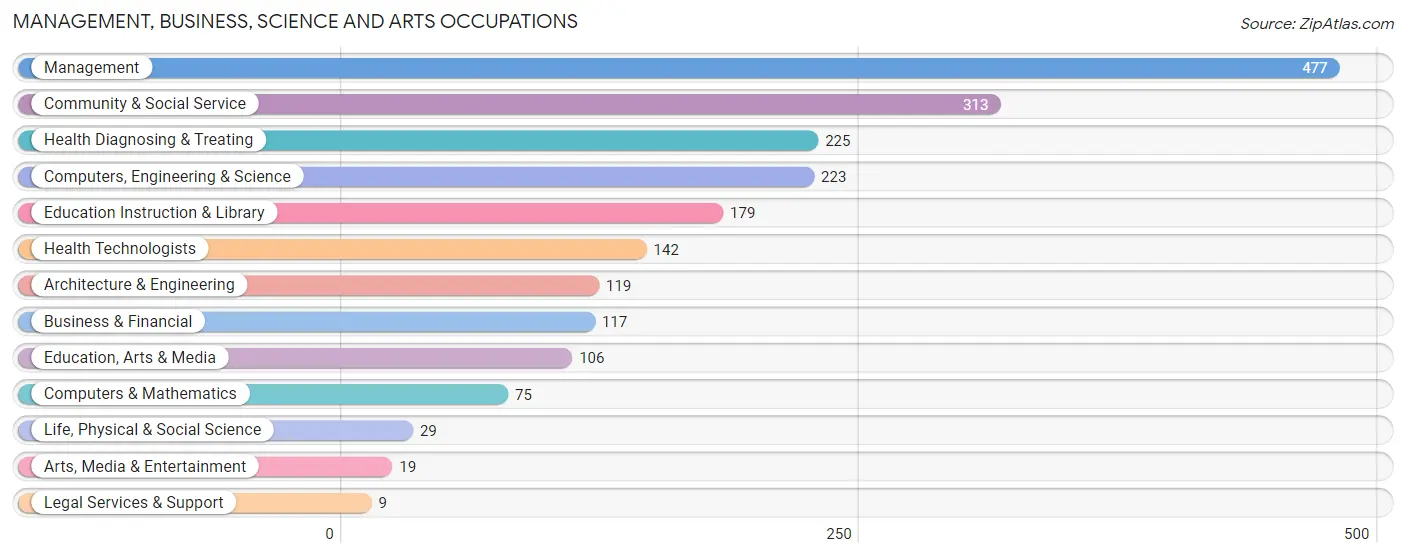
Management, Business, Science and Arts Occupations
The most common Management, Business, Science and Arts occupations in Emmet County are Management (477 | 9.8%), Community & Social Service (313 | 6.4%), Health Diagnosing & Treating (225 | 4.6%), Computers, Engineering & Science (223 | 4.6%), and Education Instruction & Library (179 | 3.7%).
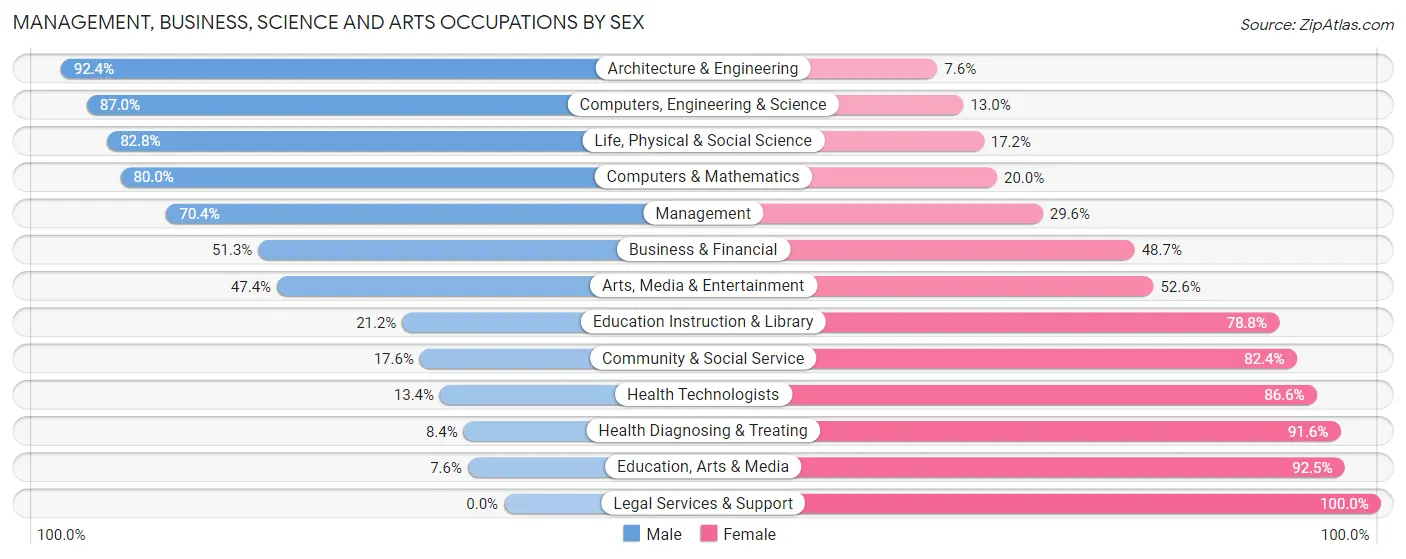
Management, Business, Science and Arts Occupations by Sex
Within the Management, Business, Science and Arts occupations in Emmet County, the most male-oriented occupations are Architecture & Engineering (92.4%), Computers, Engineering & Science (87.0%), and Life, Physical & Social Science (82.8%), while the most female-oriented occupations are Legal Services & Support (100.0%), Education, Arts & Media (92.4%), and Health Diagnosing & Treating (91.6%).
| Occupation | Male | Female |
| Management | 336 (70.4%) | 141 (29.6%) |
| Business & Financial | 60 (51.3%) | 57 (48.7%) |
| Computers, Engineering & Science | 194 (87.0%) | 29 (13.0%) |
| Computers & Mathematics | 60 (80.0%) | 15 (20.0%) |
| Architecture & Engineering | 110 (92.4%) | 9 (7.6%) |
| Life, Physical & Social Science | 24 (82.8%) | 5 (17.2%) |
| Community & Social Service | 55 (17.6%) | 258 (82.4%) |
| Education, Arts & Media | 8 (7.5%) | 98 (92.4%) |
| Legal Services & Support | 0 (0.0%) | 9 (100.0%) |
| Education Instruction & Library | 38 (21.2%) | 141 (78.8%) |
| Arts, Media & Entertainment | 9 (47.4%) | 10 (52.6%) |
| Health Diagnosing & Treating | 19 (8.4%) | 206 (91.6%) |
| Health Technologists | 19 (13.4%) | 123 (86.6%) |
| Total (Category) | 664 (49.0%) | 691 (51.0%) |
| Total (Overall) | 2,687 (55.2%) | 2,184 (44.8%) |
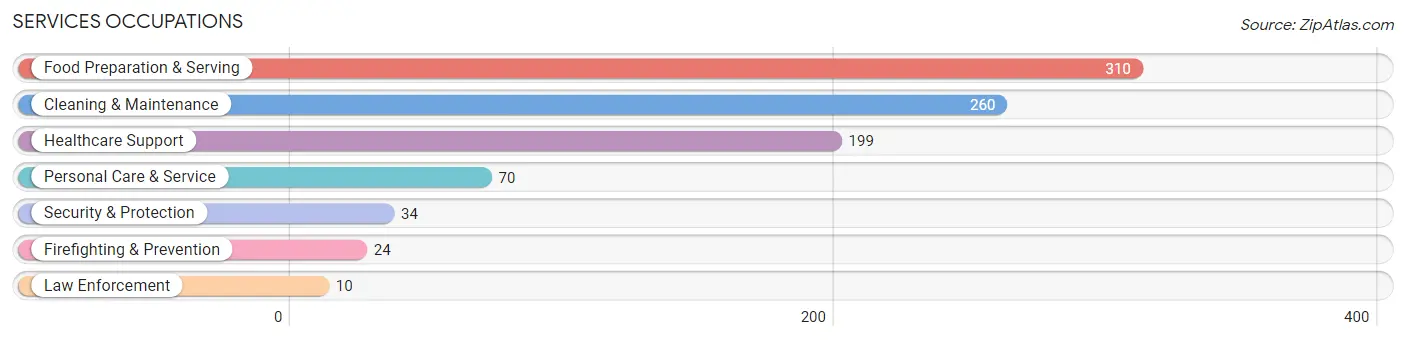
Services Occupations
The most common Services occupations in Emmet County are Food Preparation & Serving (310 | 6.4%), Cleaning & Maintenance (260 | 5.3%), Healthcare Support (199 | 4.1%), Personal Care & Service (70 | 1.4%), and Security & Protection (34 | 0.7%).
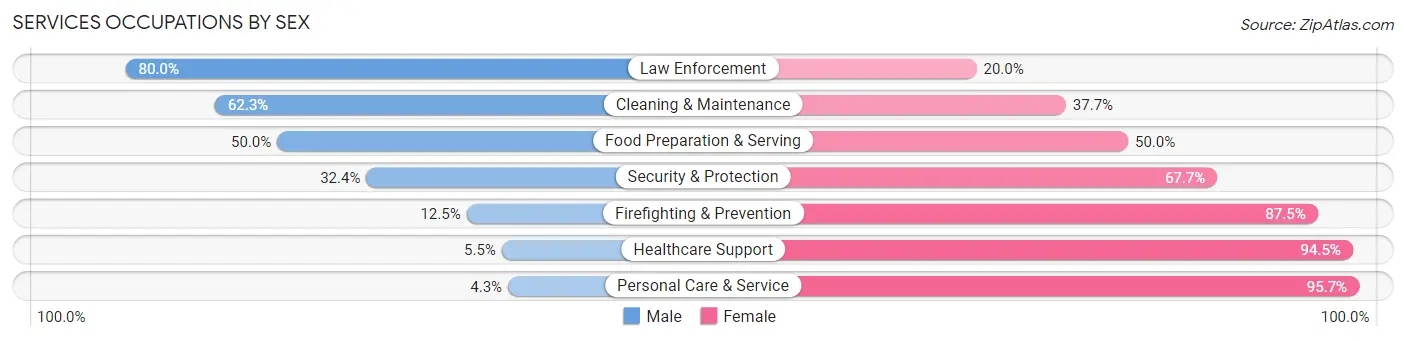
Services Occupations by Sex
Within the Services occupations in Emmet County, the most male-oriented occupations are Law Enforcement (80.0%), Cleaning & Maintenance (62.3%), and Food Preparation & Serving (50.0%), while the most female-oriented occupations are Personal Care & Service (95.7%), Healthcare Support (94.5%), and Firefighting & Prevention (87.5%).
| Occupation | Male | Female |
| Healthcare Support | 11 (5.5%) | 188 (94.5%) |
| Security & Protection | 11 (32.4%) | 23 (67.6%) |
| Firefighting & Prevention | 3 (12.5%) | 21 (87.5%) |
| Law Enforcement | 8 (80.0%) | 2 (20.0%) |
| Food Preparation & Serving | 155 (50.0%) | 155 (50.0%) |
| Cleaning & Maintenance | 162 (62.3%) | 98 (37.7%) |
| Personal Care & Service | 3 (4.3%) | 67 (95.7%) |
| Total (Category) | 342 (39.2%) | 531 (60.8%) |
| Total (Overall) | 2,687 (55.2%) | 2,184 (44.8%) |
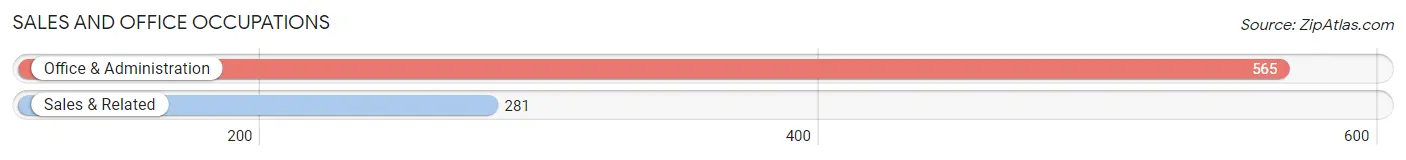
Sales and Office Occupations
The most common Sales and Office occupations in Emmet County are Office & Administration (565 | 11.6%), and Sales & Related (281 | 5.8%).
Sales and Office Occupations by Sex
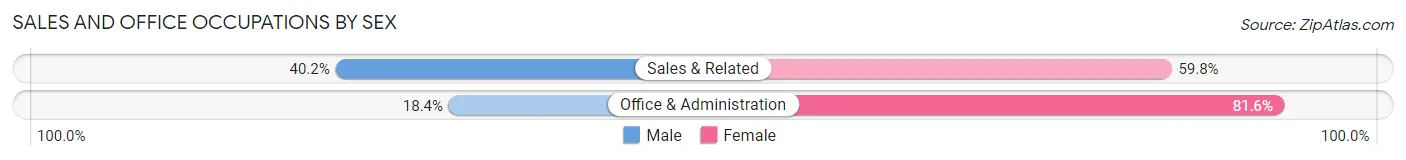
| Occupation | Male | Female |
| Sales & Related | 113 (40.2%) | 168 (59.8%) |
| Office & Administration | 104 (18.4%) | 461 (81.6%) |
| Total (Category) | 217 (25.7%) | 629 (74.4%) |
| Total (Overall) | 2,687 (55.2%) | 2,184 (44.8%) |
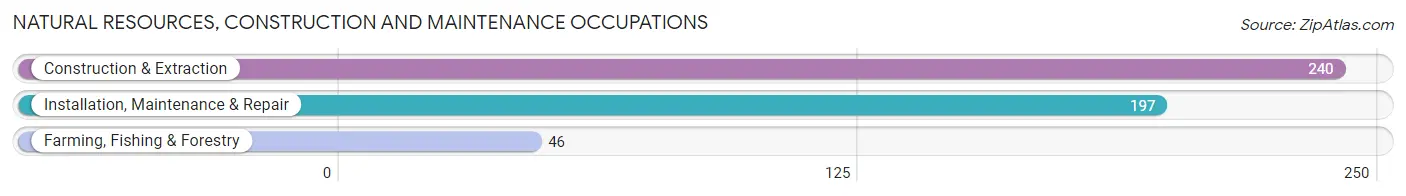
Natural Resources, Construction and Maintenance Occupations
The most common Natural Resources, Construction and Maintenance occupations in Emmet County are Construction & Extraction (240 | 4.9%), Installation, Maintenance & Repair (197 | 4.0%), and Farming, Fishing & Forestry (46 | 0.9%).
Natural Resources, Construction and Maintenance Occupations by Sex
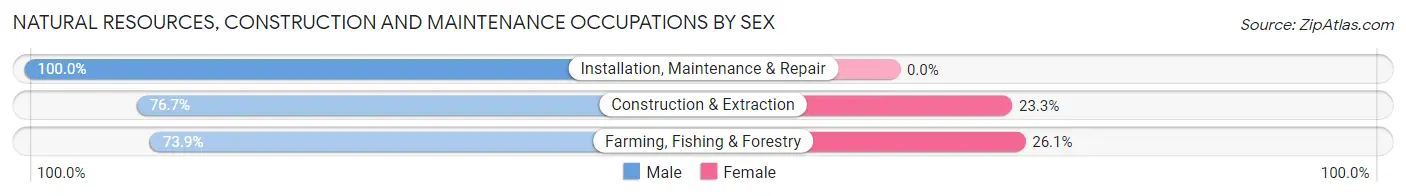
| Occupation | Male | Female |
| Farming, Fishing & Forestry | 34 (73.9%) | 12 (26.1%) |
| Construction & Extraction | 184 (76.7%) | 56 (23.3%) |
| Installation, Maintenance & Repair | 197 (100.0%) | 0 (0.0%) |
| Total (Category) | 415 (85.9%) | 68 (14.1%) |
| Total (Overall) | 2,687 (55.2%) | 2,184 (44.8%) |
Production, Transportation and Moving Occupations
The most common Production, Transportation and Moving occupations in Emmet County are Production (556 | 11.4%), Material Moving (421 | 8.6%), and Transportation (337 | 6.9%).
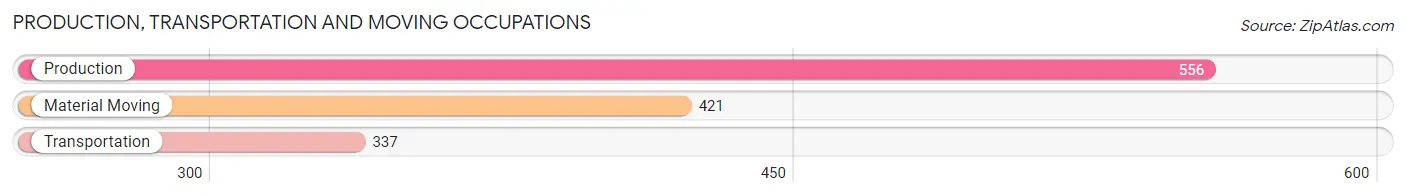
Production, Transportation and Moving Occupations by Sex
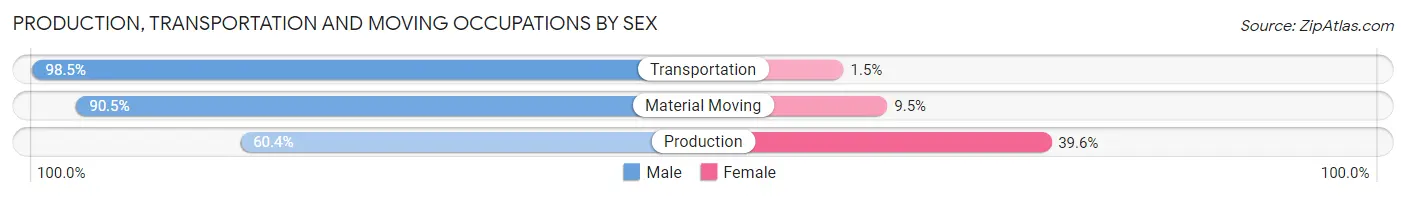
| Occupation | Male | Female |
| Production | 336 (60.4%) | 220 (39.6%) |
| Transportation | 332 (98.5%) | 5 (1.5%) |
| Material Moving | 381 (90.5%) | 40 (9.5%) |
| Total (Category) | 1,049 (79.8%) | 265 (20.2%) |
| Total (Overall) | 2,687 (55.2%) | 2,184 (44.8%) |
Employment Industries by Sex in Emmet County
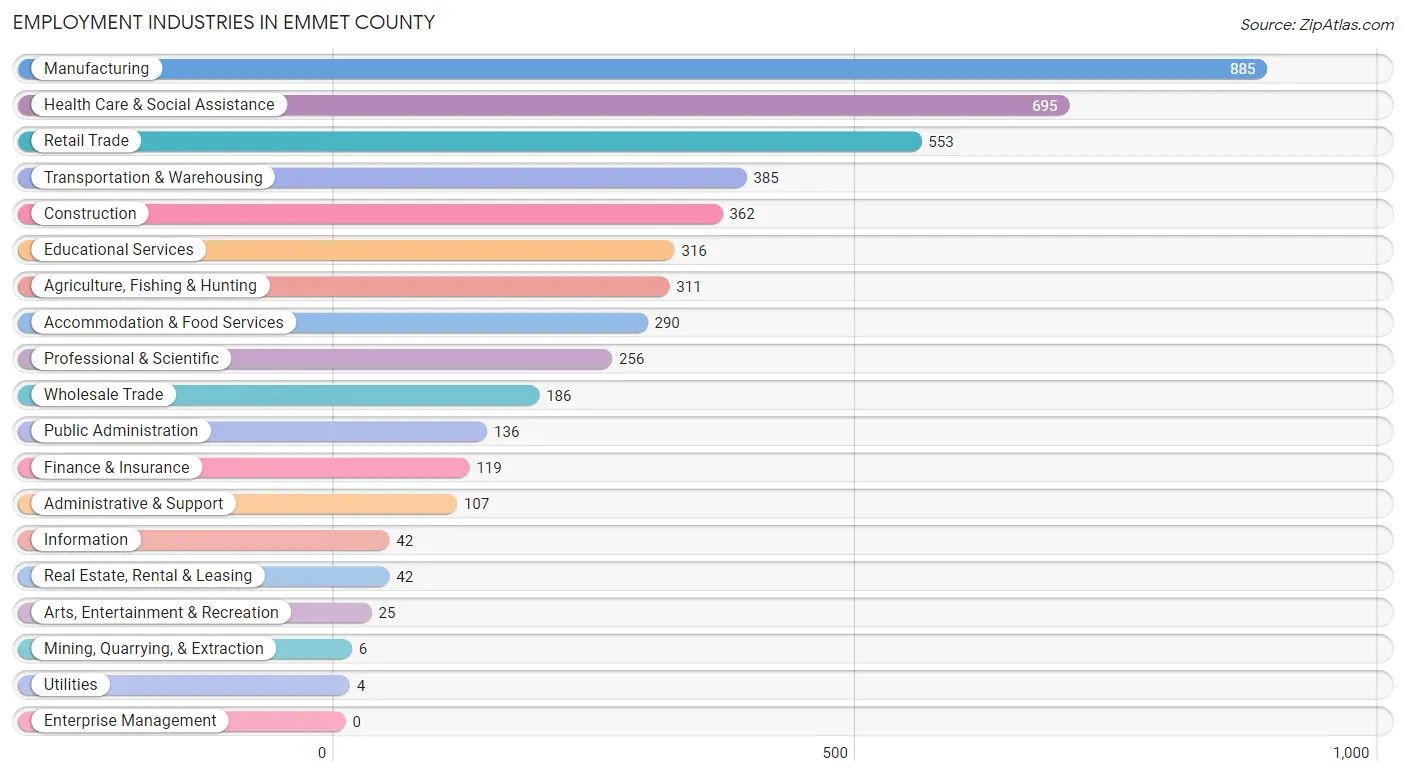
Employment Industries in Emmet County
The major employment industries in Emmet County include Manufacturing (885 | 18.2%), Health Care & Social Assistance (695 | 14.3%), Retail Trade (553 | 11.4%), Transportation & Warehousing (385 | 7.9%), and Construction (362 | 7.4%).
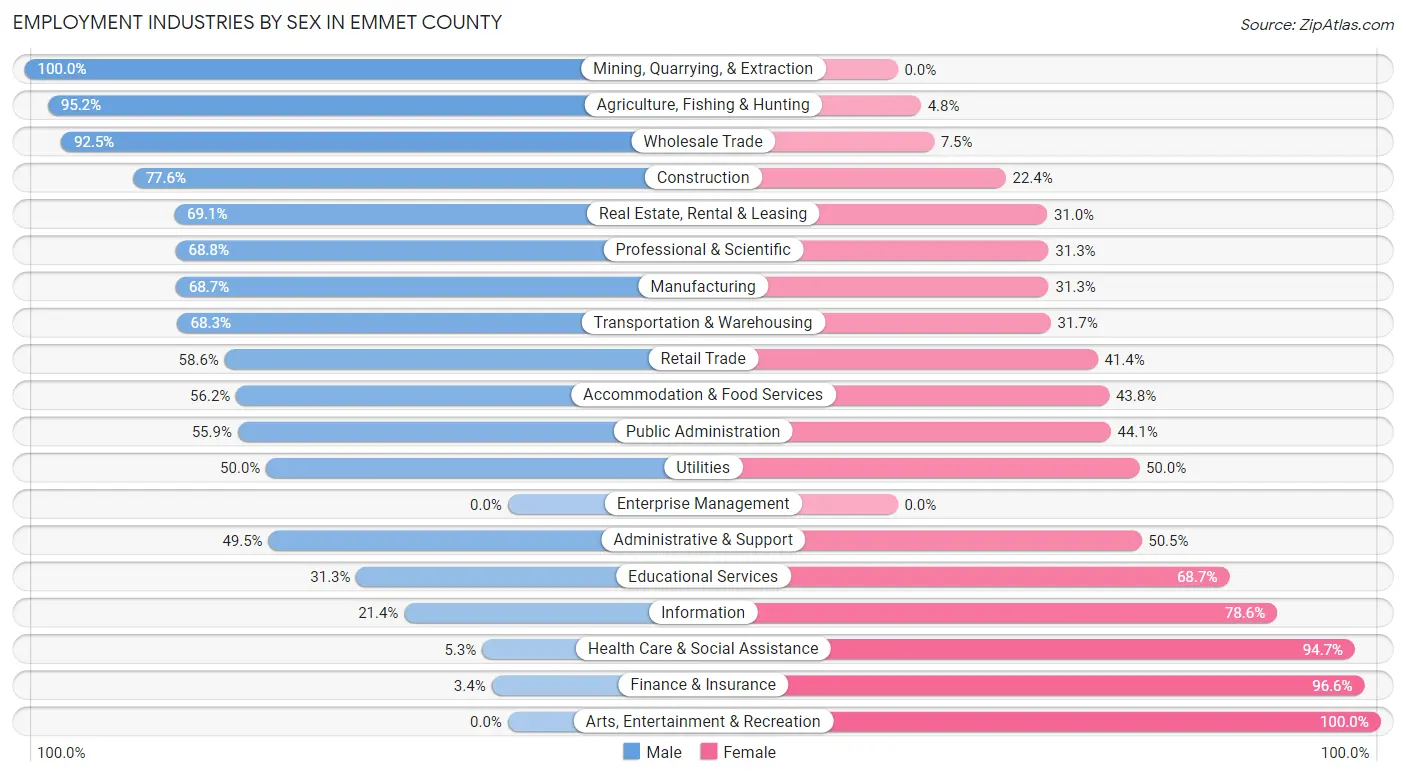
Employment Industries by Sex in Emmet County
The Emmet County industries that see more men than women are Mining, Quarrying, & Extraction (100.0%), Agriculture, Fishing & Hunting (95.2%), and Wholesale Trade (92.5%), whereas the industries that tend to have a higher number of women are Arts, Entertainment & Recreation (100.0%), Finance & Insurance (96.6%), and Health Care & Social Assistance (94.7%).
| Industry | Male | Female |
| Agriculture, Fishing & Hunting | 296 (95.2%) | 15 (4.8%) |
| Mining, Quarrying, & Extraction | 6 (100.0%) | 0 (0.0%) |
| Construction | 281 (77.6%) | 81 (22.4%) |
| Manufacturing | 608 (68.7%) | 277 (31.3%) |
| Wholesale Trade | 172 (92.5%) | 14 (7.5%) |
| Retail Trade | 324 (58.6%) | 229 (41.4%) |
| Transportation & Warehousing | 263 (68.3%) | 122 (31.7%) |
| Utilities | 2 (50.0%) | 2 (50.0%) |
| Information | 9 (21.4%) | 33 (78.6%) |
| Finance & Insurance | 4 (3.4%) | 115 (96.6%) |
| Real Estate, Rental & Leasing | 29 (69.1%) | 13 (30.9%) |
| Professional & Scientific | 176 (68.8%) | 80 (31.2%) |
| Enterprise Management | 0 (0.0%) | 0 (0.0%) |
| Administrative & Support | 53 (49.5%) | 54 (50.5%) |
| Educational Services | 99 (31.3%) | 217 (68.7%) |
| Health Care & Social Assistance | 37 (5.3%) | 658 (94.7%) |
| Arts, Entertainment & Recreation | 0 (0.0%) | 25 (100.0%) |
| Accommodation & Food Services | 163 (56.2%) | 127 (43.8%) |
| Public Administration | 76 (55.9%) | 60 (44.1%) |
| Total | 2,687 (55.2%) | 2,184 (44.8%) |
Education in Emmet County
School Enrollment in Emmet County
The most common levels of schooling among the 2,246 students in Emmet County are college / undergraduate (690 | 30.7%), elementary school (488 | 21.7%), and high school (481 | 21.4%).
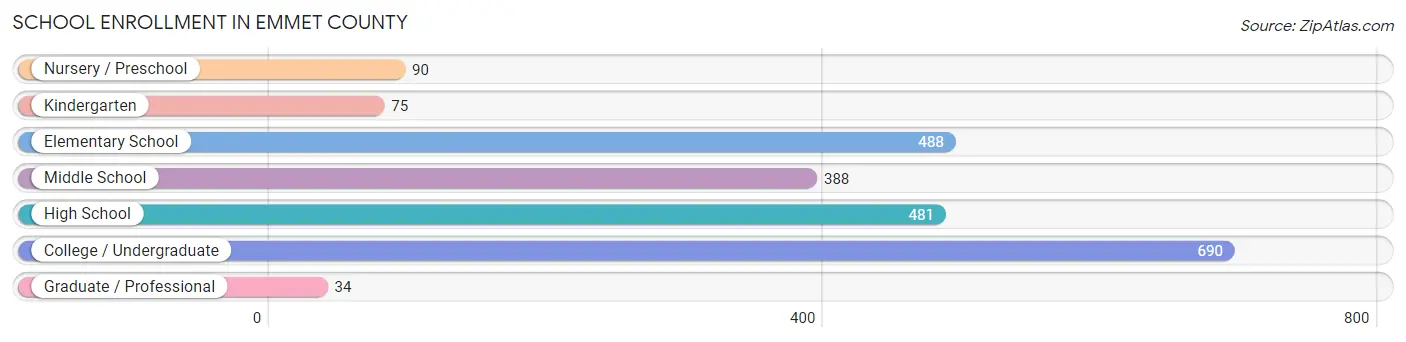
| School Level | # Students | % Students |
| Nursery / Preschool | 90 | 4.0% |
| Kindergarten | 75 | 3.3% |
| Elementary School | 488 | 21.7% |
| Middle School | 388 | 17.3% |
| High School | 481 | 21.4% |
| College / Undergraduate | 690 | 30.7% |
| Graduate / Professional | 34 | 1.5% |
| Total | 2,246 | 100.0% |
School Enrollment by Age by Funding Source in Emmet County
Out of a total of 2,246 students who are enrolled in schools in Emmet County, 106 (4.7%) attend a private institution, while the remaining 2,140 (95.3%) are enrolled in public schools. The age group of 25 to 34 year olds has the highest likelihood of being enrolled in private schools, with 3 (14.3% in the age bracket) enrolled. Conversely, the age group of 5 to 9 year old has the lowest likelihood of being enrolled in a private school, with 554 (98.2% in the age bracket) attending a public institution.
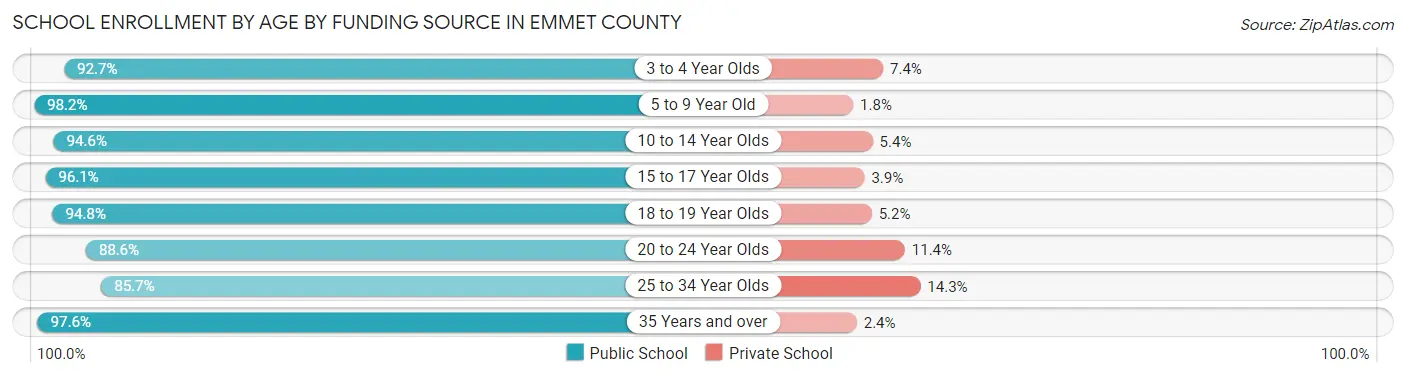
| Age Bracket | Public School | Private School |
| 3 to 4 Year Olds | 63 (92.6%) | 5 (7.3%) |
| 5 to 9 Year Old | 554 (98.2%) | 10 (1.8%) |
| 10 to 14 Year Olds | 438 (94.6%) | 25 (5.4%) |
| 15 to 17 Year Olds | 322 (96.1%) | 13 (3.9%) |
| 18 to 19 Year Olds | 454 (94.8%) | 25 (5.2%) |
| 20 to 24 Year Olds | 171 (88.6%) | 22 (11.4%) |
| 25 to 34 Year Olds | 18 (85.7%) | 3 (14.3%) |
| 35 Years and over | 120 (97.6%) | 3 (2.4%) |
| Total | 2,140 (95.3%) | 106 (4.7%) |
Educational Attainment by Field of Study in Emmet County
Business (265 | 24.1%), education (234 | 21.3%), bio, nature & agricultural (151 | 13.7%), science & technology (120 | 10.9%), and arts & humanities (120 | 10.9%) are the most common fields of study among 1,099 individuals in Emmet County who have obtained a bachelor's degree or higher.
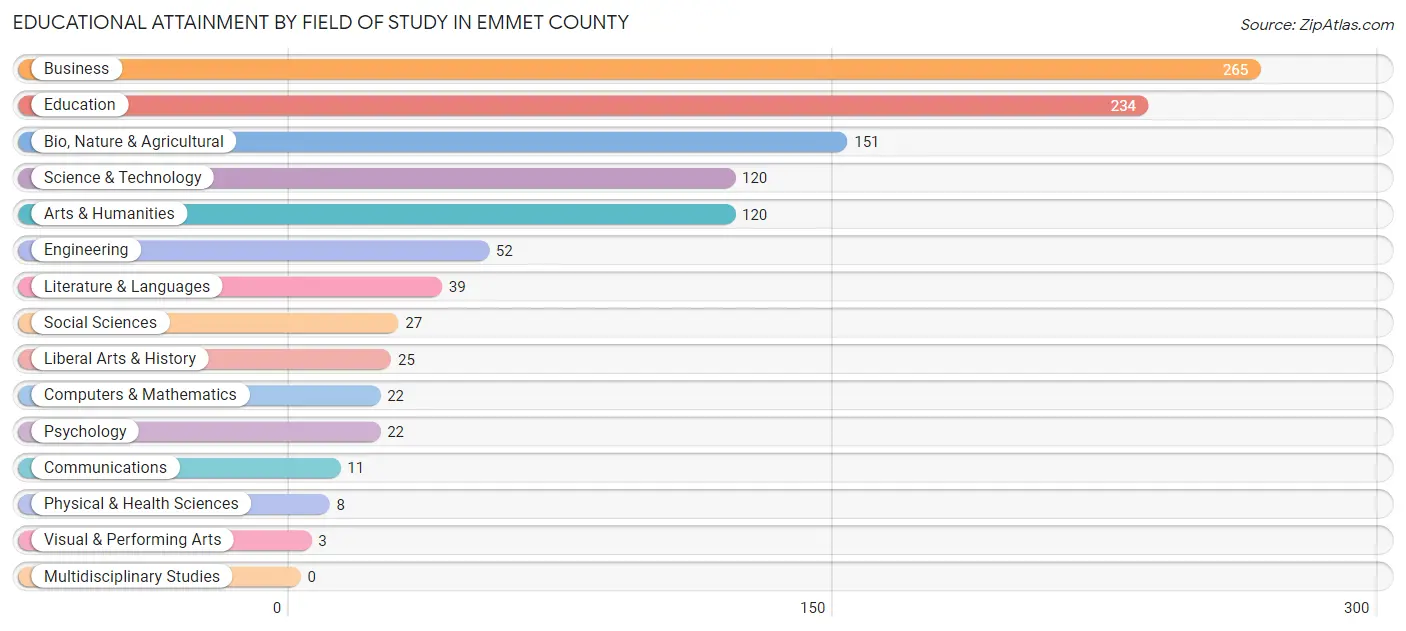
| Field of Study | # Graduates | % Graduates |
| Computers & Mathematics | 22 | 2.0% |
| Bio, Nature & Agricultural | 151 | 13.7% |
| Physical & Health Sciences | 8 | 0.7% |
| Psychology | 22 | 2.0% |
| Social Sciences | 27 | 2.5% |
| Engineering | 52 | 4.7% |
| Multidisciplinary Studies | 0 | 0.0% |
| Science & Technology | 120 | 10.9% |
| Business | 265 | 24.1% |
| Education | 234 | 21.3% |
| Literature & Languages | 39 | 3.5% |
| Liberal Arts & History | 25 | 2.3% |
| Visual & Performing Arts | 3 | 0.3% |
| Communications | 11 | 1.0% |
| Arts & Humanities | 120 | 10.9% |
| Total | 1,099 | 100.0% |
Transportation & Commute in Emmet County
Vehicle Availability by Sex in Emmet County
The most prevalent vehicle ownership categories in Emmet County are males with 2 vehicles (1,028, accounting for 39.8%) and females with 2 vehicles (794, making up 48.8%).
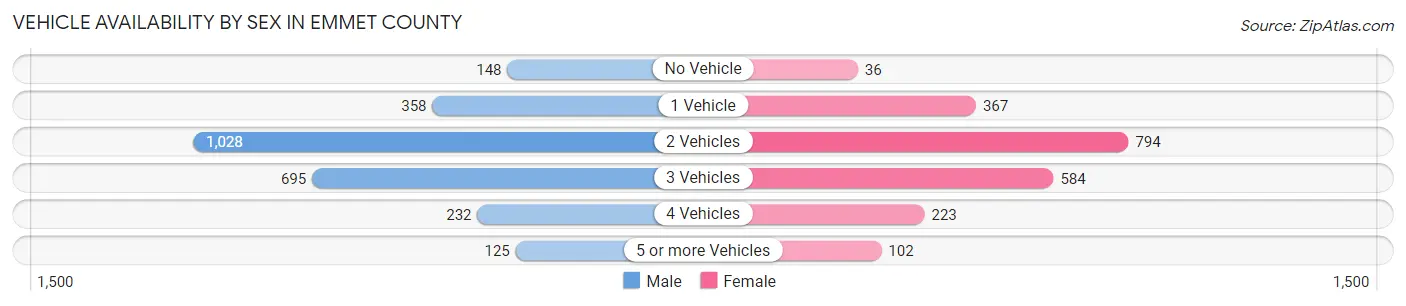
| Vehicles Available | Male | Female |
| No Vehicle | 148 (5.7%) | 36 (1.7%) |
| 1 Vehicle | 358 (13.8%) | 367 (17.4%) |
| 2 Vehicles | 1,028 (39.8%) | 794 (37.7%) |
| 3 Vehicles | 695 (26.9%) | 584 (27.7%) |
| 4 Vehicles | 232 (9.0%) | 223 (10.6%) |
| 5 or more Vehicles | 125 (4.8%) | 102 (4.8%) |
| Total | 2,586 (100.0%) | 2,106 (100.0%) |
Commute Time in Emmet County
The most frequently occuring commute durations in Emmet County are 5 to 9 minutes (1,117 commuters, 24.8%), 10 to 14 minutes (713 commuters, 15.9%), and less than 5 minutes (510 commuters, 11.4%).
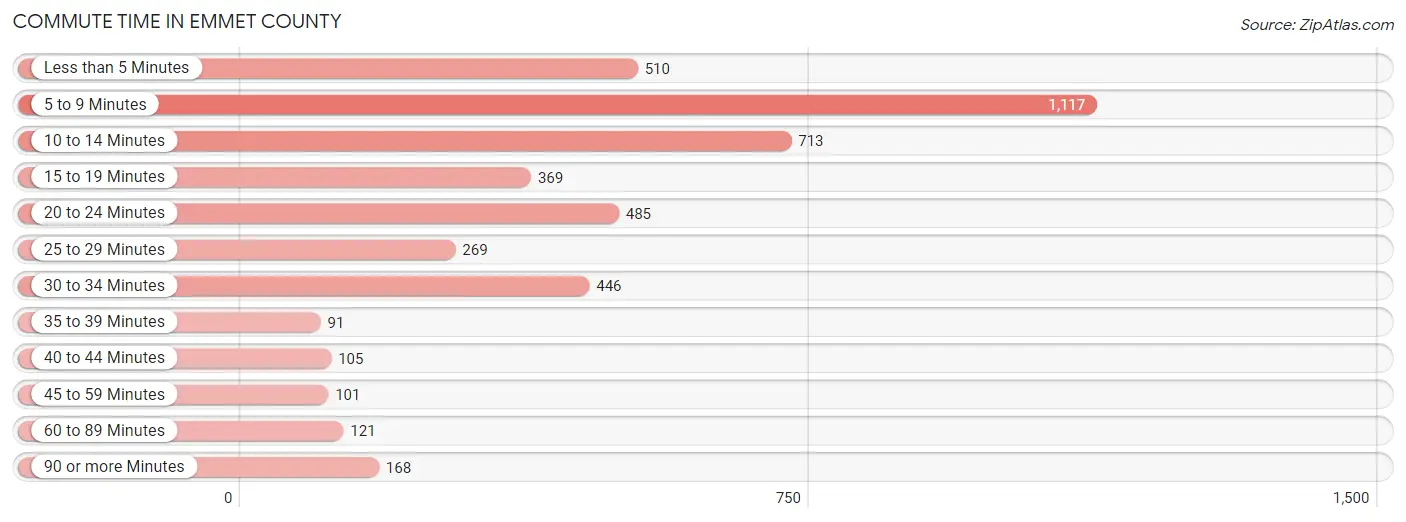
| Commute Time | # Commuters | % Commuters |
| Less than 5 Minutes | 510 | 11.4% |
| 5 to 9 Minutes | 1,117 | 24.8% |
| 10 to 14 Minutes | 713 | 15.9% |
| 15 to 19 Minutes | 369 | 8.2% |
| 20 to 24 Minutes | 485 | 10.8% |
| 25 to 29 Minutes | 269 | 6.0% |
| 30 to 34 Minutes | 446 | 9.9% |
| 35 to 39 Minutes | 91 | 2.0% |
| 40 to 44 Minutes | 105 | 2.3% |
| 45 to 59 Minutes | 101 | 2.2% |
| 60 to 89 Minutes | 121 | 2.7% |
| 90 or more Minutes | 168 | 3.7% |
Commute Time by Sex in Emmet County
The most common commute times in Emmet County are 5 to 9 minutes (463 commuters, 18.4%) for males and 5 to 9 minutes (654 commuters, 33.1%) for females.
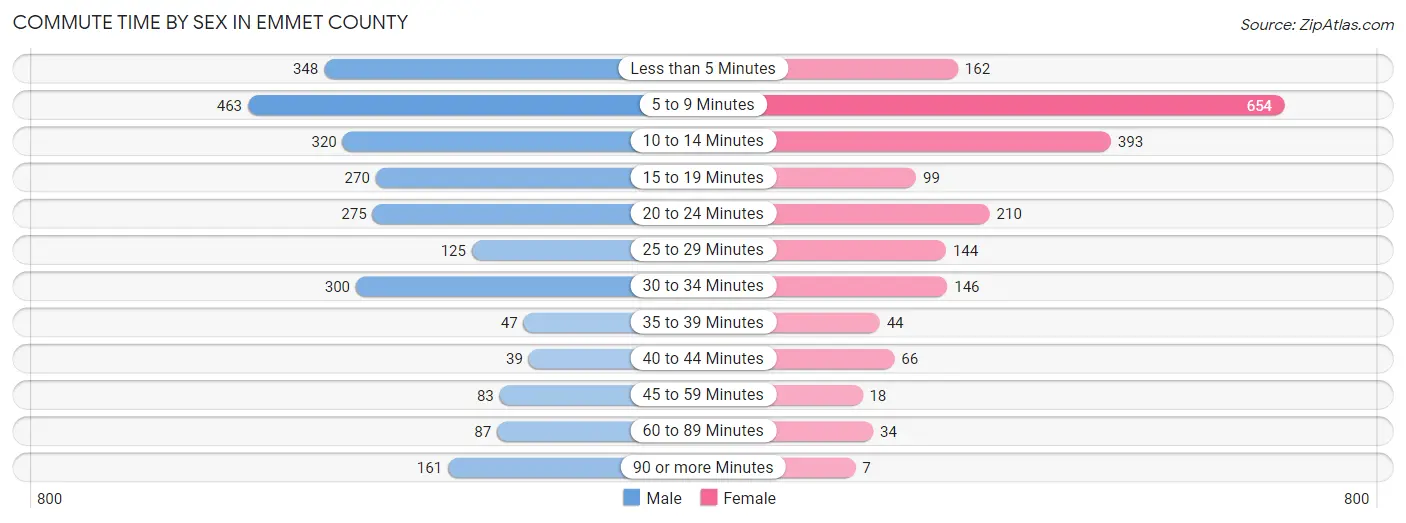
| Commute Time | Male | Female |
| Less than 5 Minutes | 348 (13.8%) | 162 (8.2%) |
| 5 to 9 Minutes | 463 (18.4%) | 654 (33.1%) |
| 10 to 14 Minutes | 320 (12.7%) | 393 (19.9%) |
| 15 to 19 Minutes | 270 (10.7%) | 99 (5.0%) |
| 20 to 24 Minutes | 275 (10.9%) | 210 (10.6%) |
| 25 to 29 Minutes | 125 (5.0%) | 144 (7.3%) |
| 30 to 34 Minutes | 300 (11.9%) | 146 (7.4%) |
| 35 to 39 Minutes | 47 (1.9%) | 44 (2.2%) |
| 40 to 44 Minutes | 39 (1.5%) | 66 (3.3%) |
| 45 to 59 Minutes | 83 (3.3%) | 18 (0.9%) |
| 60 to 89 Minutes | 87 (3.5%) | 34 (1.7%) |
| 90 or more Minutes | 161 (6.4%) | 7 (0.4%) |
Time of Departure to Work by Sex in Emmet County
The most frequent times of departure to work in Emmet County are 6:30 AM to 6:59 AM (394, 15.7%) for males and 8:00 AM to 8:29 AM (360, 18.2%) for females.
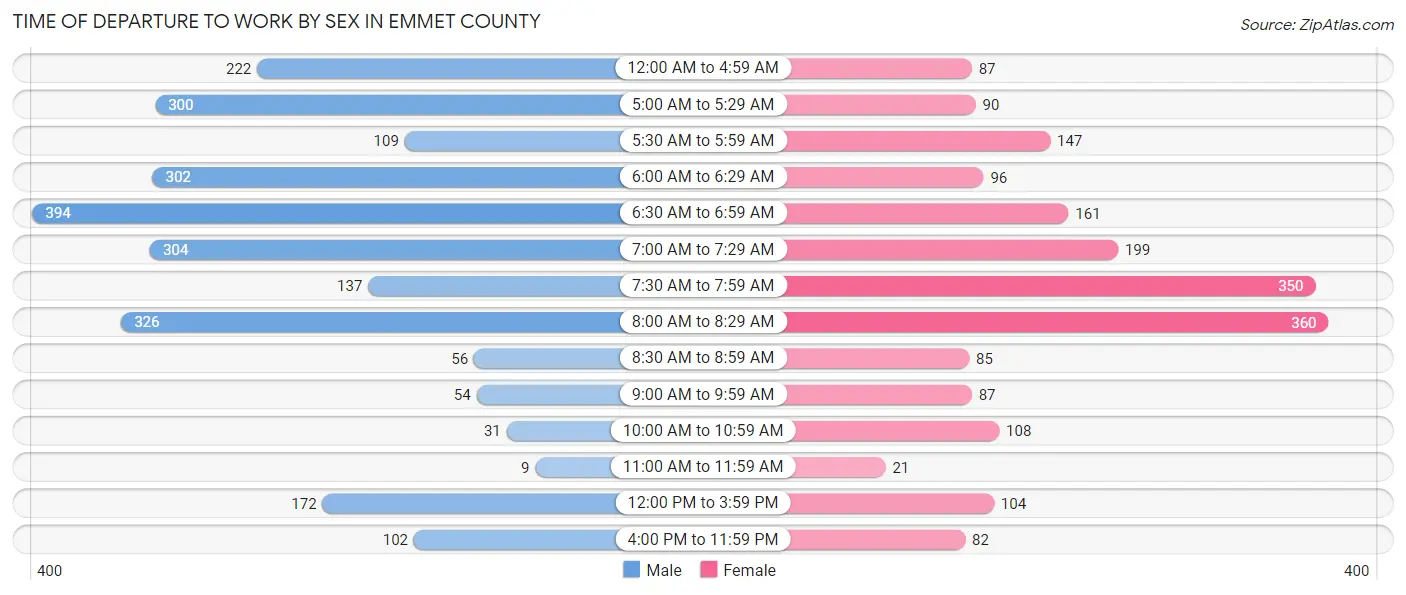
| Time of Departure | Male | Female |
| 12:00 AM to 4:59 AM | 222 (8.8%) | 87 (4.4%) |
| 5:00 AM to 5:29 AM | 300 (11.9%) | 90 (4.5%) |
| 5:30 AM to 5:59 AM | 109 (4.3%) | 147 (7.4%) |
| 6:00 AM to 6:29 AM | 302 (12.0%) | 96 (4.9%) |
| 6:30 AM to 6:59 AM | 394 (15.7%) | 161 (8.1%) |
| 7:00 AM to 7:29 AM | 304 (12.1%) | 199 (10.1%) |
| 7:30 AM to 7:59 AM | 137 (5.4%) | 350 (17.7%) |
| 8:00 AM to 8:29 AM | 326 (13.0%) | 360 (18.2%) |
| 8:30 AM to 8:59 AM | 56 (2.2%) | 85 (4.3%) |
| 9:00 AM to 9:59 AM | 54 (2.1%) | 87 (4.4%) |
| 10:00 AM to 10:59 AM | 31 (1.2%) | 108 (5.5%) |
| 11:00 AM to 11:59 AM | 9 (0.4%) | 21 (1.1%) |
| 12:00 PM to 3:59 PM | 172 (6.8%) | 104 (5.3%) |
| 4:00 PM to 11:59 PM | 102 (4.1%) | 82 (4.2%) |
| Total | 2,518 (100.0%) | 1,977 (100.0%) |
Housing Occupancy in Emmet County
Occupancy by Ownership in Emmet County
Of the total 3,881 dwellings in Emmet County, owner-occupied units account for 3,013 (77.6%), while renter-occupied units make up 868 (22.4%).
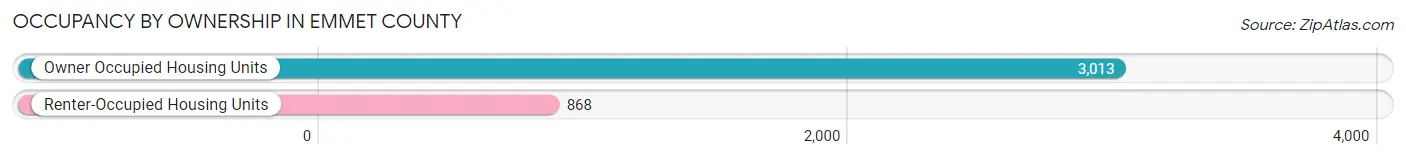
| Occupancy | # Housing Units | % Housing Units |
| Owner Occupied Housing Units | 3,013 | 77.6% |
| Renter-Occupied Housing Units | 868 | 22.4% |
| Total Occupied Housing Units | 3,881 | 100.0% |
Occupancy by Household Size in Emmet County
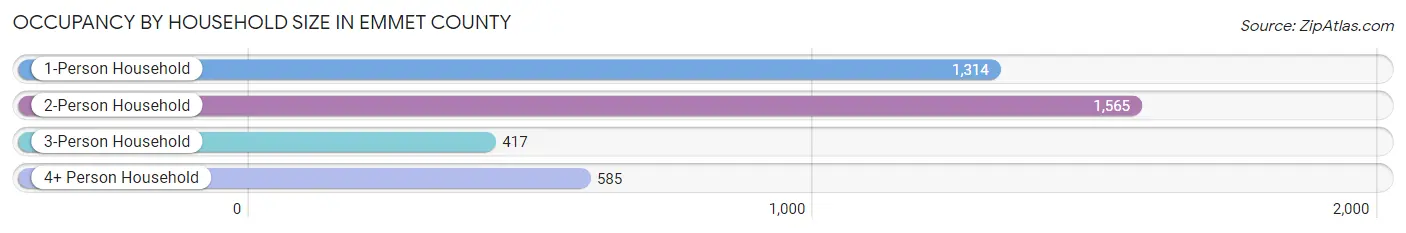
| Household Size | # Housing Units | % Housing Units |
| 1-Person Household | 1,314 | 33.9% |
| 2-Person Household | 1,565 | 40.3% |
| 3-Person Household | 417 | 10.7% |
| 4+ Person Household | 585 | 15.1% |
| Total Housing Units | 3,881 | 100.0% |
Occupancy by Ownership by Household Size in Emmet County
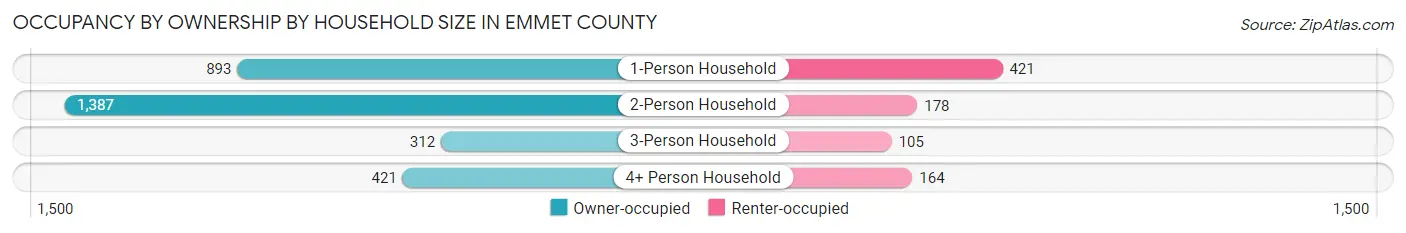
| Household Size | Owner-occupied | Renter-occupied |
| 1-Person Household | 893 (68.0%) | 421 (32.0%) |
| 2-Person Household | 1,387 (88.6%) | 178 (11.4%) |
| 3-Person Household | 312 (74.8%) | 105 (25.2%) |
| 4+ Person Household | 421 (72.0%) | 164 (28.0%) |
| Total Housing Units | 3,013 (77.6%) | 868 (22.4%) |
Occupancy by Educational Attainment in Emmet County
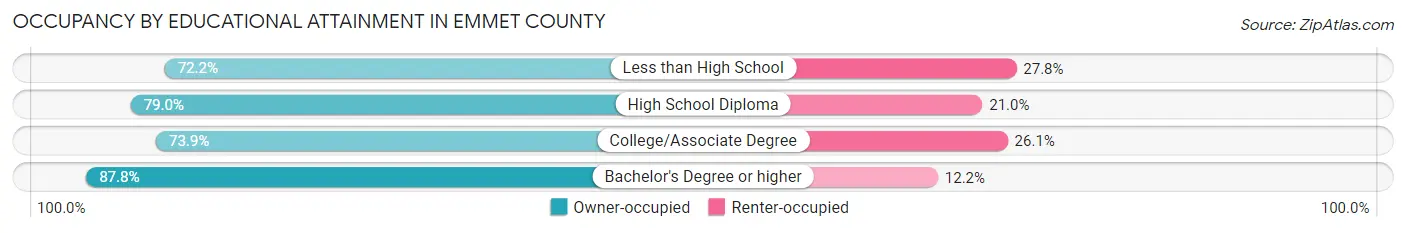
| Household Size | Owner-occupied | Renter-occupied |
| Less than High School | 291 (72.2%) | 112 (27.8%) |
| High School Diploma | 961 (79.0%) | 256 (21.0%) |
| College/Associate Degree | 1,194 (73.9%) | 421 (26.1%) |
| Bachelor's Degree or higher | 567 (87.8%) | 79 (12.2%) |
Occupancy by Age of Householder in Emmet County
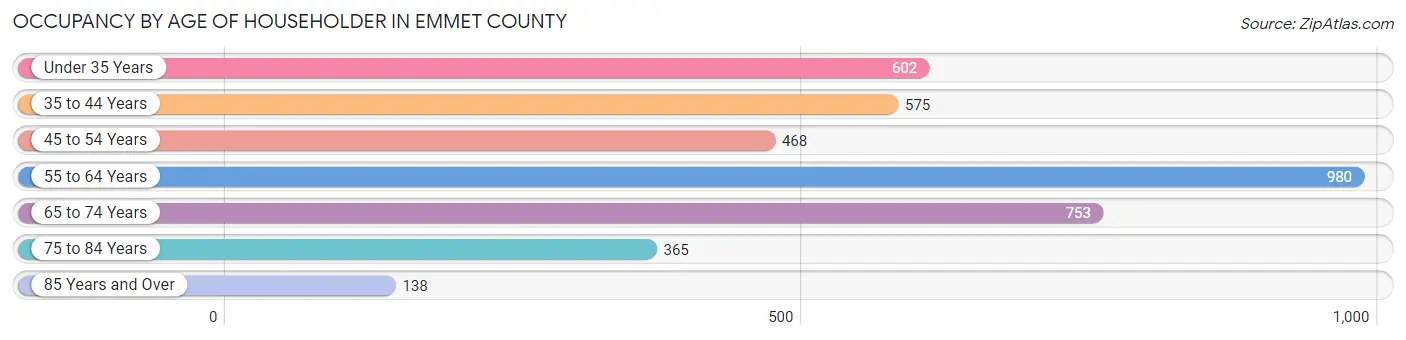
| Age Bracket | # Households | % Households |
| Under 35 Years | 602 | 15.5% |
| 35 to 44 Years | 575 | 14.8% |
| 45 to 54 Years | 468 | 12.1% |
| 55 to 64 Years | 980 | 25.3% |
| 65 to 74 Years | 753 | 19.4% |
| 75 to 84 Years | 365 | 9.4% |
| 85 Years and Over | 138 | 3.6% |
| Total | 3,881 | 100.0% |
Housing Finances in Emmet County
Median Income by Occupancy in Emmet County
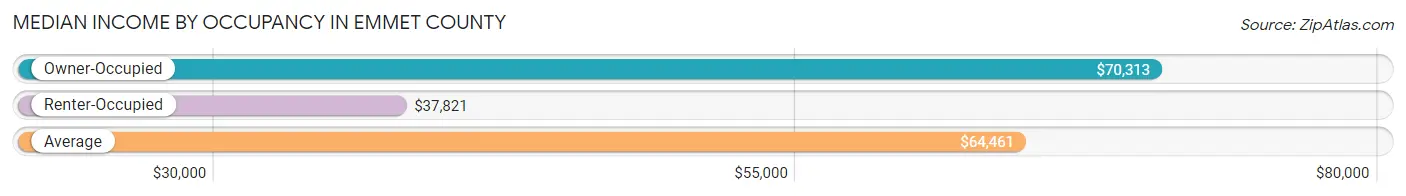
| Occupancy Type | # Households | Median Income |
| Owner-Occupied | 3,013 (77.6%) | $70,313 |
| Renter-Occupied | 868 (22.4%) | $37,821 |
| Average | 3,881 (100.0%) | $64,461 |
Occupancy by Householder Income Bracket in Emmet County
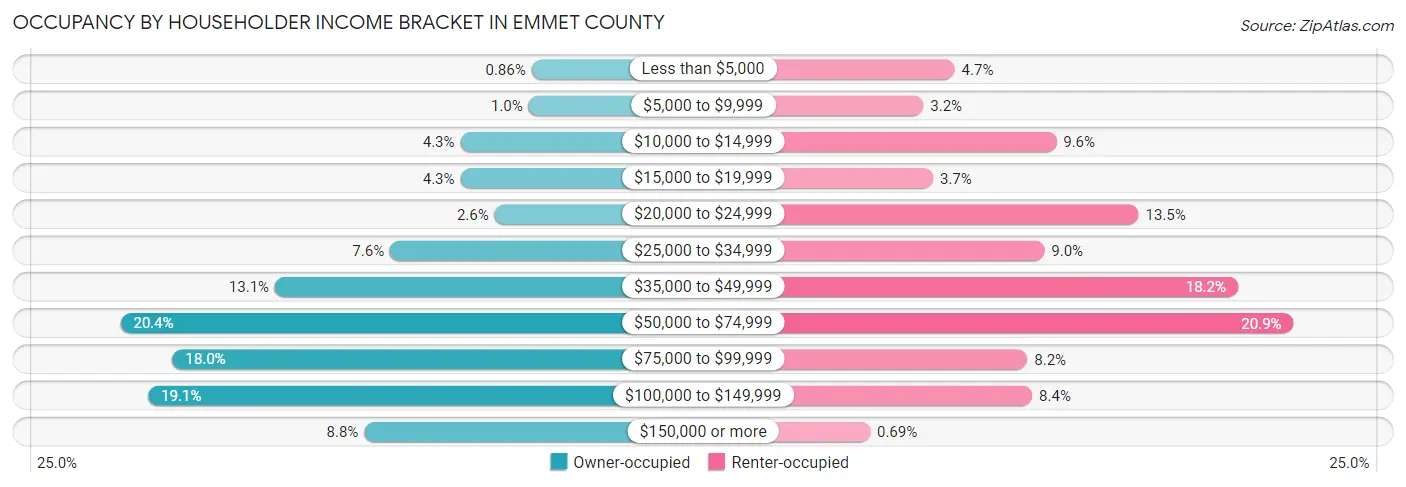
| Income Bracket | Owner-occupied | Renter-occupied |
| Less than $5,000 | 26 (0.9%) | 41 (4.7%) |
| $5,000 to $9,999 | 30 (1.0%) | 28 (3.2%) |
| $10,000 to $14,999 | 128 (4.3%) | 83 (9.6%) |
| $15,000 to $19,999 | 128 (4.3%) | 32 (3.7%) |
| $20,000 to $24,999 | 79 (2.6%) | 117 (13.5%) |
| $25,000 to $34,999 | 229 (7.6%) | 78 (9.0%) |
| $35,000 to $49,999 | 394 (13.1%) | 158 (18.2%) |
| $50,000 to $74,999 | 616 (20.4%) | 181 (20.8%) |
| $75,000 to $99,999 | 541 (18.0%) | 71 (8.2%) |
| $100,000 to $149,999 | 576 (19.1%) | 73 (8.4%) |
| $150,000 or more | 266 (8.8%) | 6 (0.7%) |
| Total | 3,013 (100.0%) | 868 (100.0%) |
Monthly Housing Cost Tiers in Emmet County
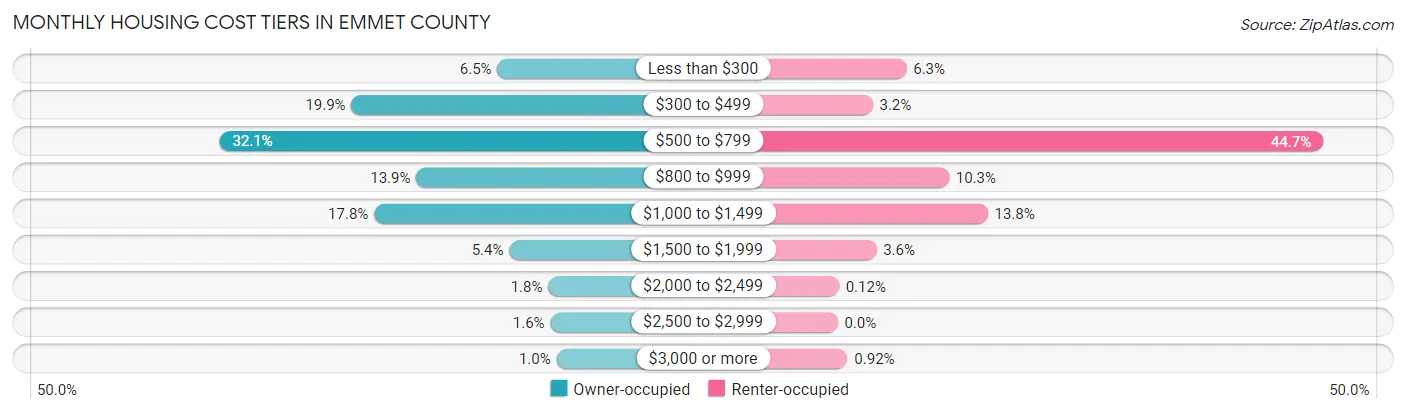
| Monthly Cost | Owner-occupied | Renter-occupied |
| Less than $300 | 195 (6.5%) | 55 (6.3%) |
| $300 to $499 | 600 (19.9%) | 28 (3.2%) |
| $500 to $799 | 966 (32.1%) | 388 (44.7%) |
| $800 to $999 | 420 (13.9%) | 89 (10.2%) |
| $1,000 to $1,499 | 537 (17.8%) | 120 (13.8%) |
| $1,500 to $1,999 | 162 (5.4%) | 31 (3.6%) |
| $2,000 to $2,499 | 54 (1.8%) | 1 (0.1%) |
| $2,500 to $2,999 | 48 (1.6%) | 0 (0.0%) |
| $3,000 or more | 31 (1.0%) | 8 (0.9%) |
| Total | 3,013 (100.0%) | 868 (100.0%) |
Physical Housing Characteristics in Emmet County
Housing Structures in Emmet County
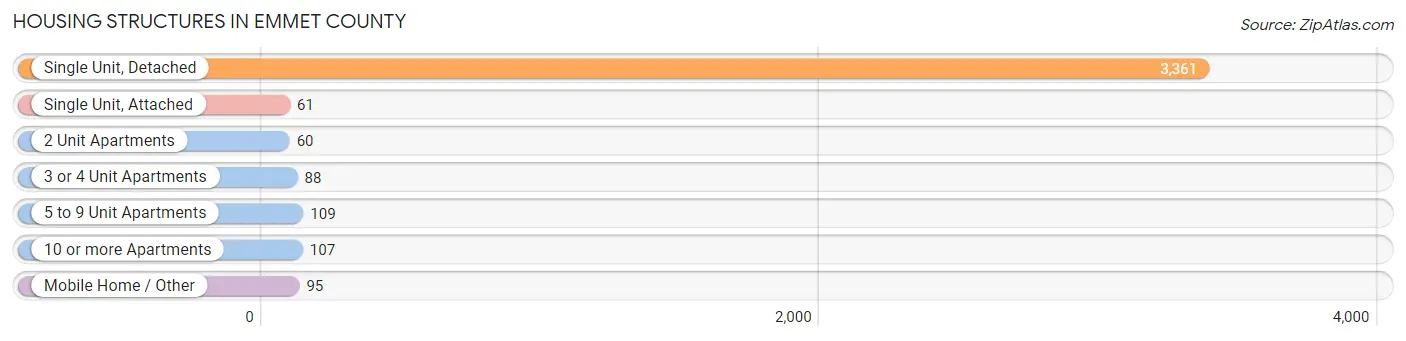
| Structure Type | # Housing Units | % Housing Units |
| Single Unit, Detached | 3,361 | 86.6% |
| Single Unit, Attached | 61 | 1.6% |
| 2 Unit Apartments | 60 | 1.5% |
| 3 or 4 Unit Apartments | 88 | 2.3% |
| 5 to 9 Unit Apartments | 109 | 2.8% |
| 10 or more Apartments | 107 | 2.8% |
| Mobile Home / Other | 95 | 2.5% |
| Total | 3,881 | 100.0% |
Housing Structures by Occupancy in Emmet County
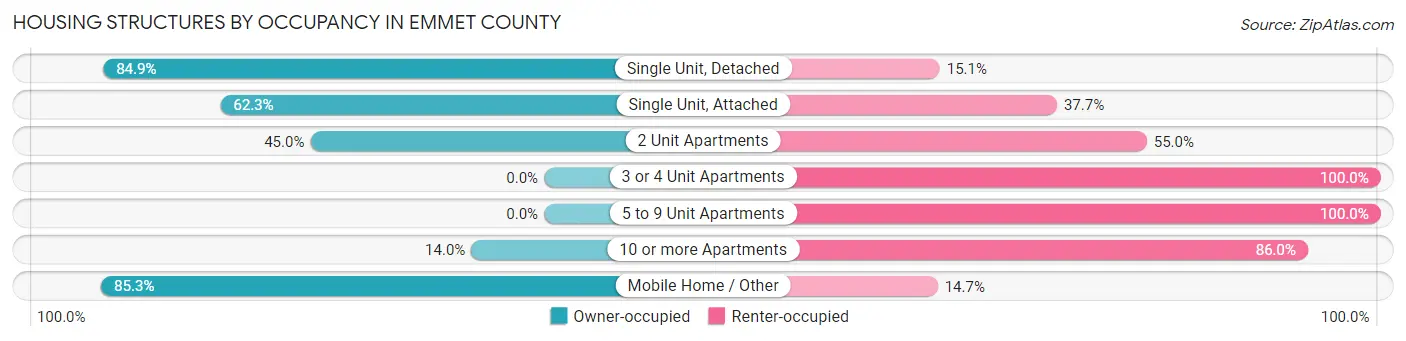
| Structure Type | Owner-occupied | Renter-occupied |
| Single Unit, Detached | 2,852 (84.9%) | 509 (15.1%) |
| Single Unit, Attached | 38 (62.3%) | 23 (37.7%) |
| 2 Unit Apartments | 27 (45.0%) | 33 (55.0%) |
| 3 or 4 Unit Apartments | 0 (0.0%) | 88 (100.0%) |
| 5 to 9 Unit Apartments | 0 (0.0%) | 109 (100.0%) |
| 10 or more Apartments | 15 (14.0%) | 92 (86.0%) |
| Mobile Home / Other | 81 (85.3%) | 14 (14.7%) |
| Total | 3,013 (77.6%) | 868 (22.4%) |
Housing Structures by Number of Rooms in Emmet County
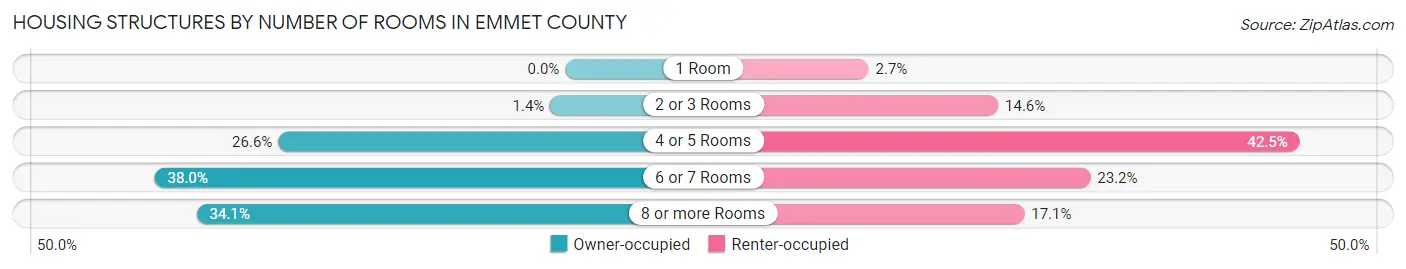
| Number of Rooms | Owner-occupied | Renter-occupied |
| 1 Room | 0 (0.0%) | 23 (2.6%) |
| 2 or 3 Rooms | 42 (1.4%) | 127 (14.6%) |
| 4 or 5 Rooms | 800 (26.6%) | 369 (42.5%) |
| 6 or 7 Rooms | 1,144 (38.0%) | 201 (23.2%) |
| 8 or more Rooms | 1,027 (34.1%) | 148 (17.1%) |
| Total | 3,013 (100.0%) | 868 (100.0%) |
Housing Structure by Heating Type in Emmet County
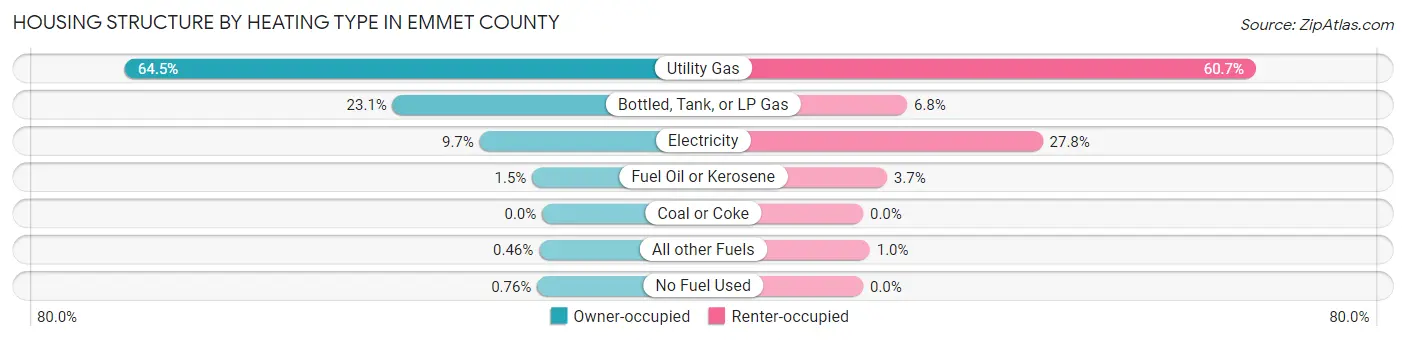
| Heating Type | Owner-occupied | Renter-occupied |
| Utility Gas | 1,943 (64.5%) | 527 (60.7%) |
| Bottled, Tank, or LP Gas | 696 (23.1%) | 59 (6.8%) |
| Electricity | 291 (9.7%) | 241 (27.8%) |
| Fuel Oil or Kerosene | 46 (1.5%) | 32 (3.7%) |
| Coal or Coke | 0 (0.0%) | 0 (0.0%) |
| All other Fuels | 14 (0.5%) | 9 (1.0%) |
| No Fuel Used | 23 (0.8%) | 0 (0.0%) |
| Total | 3,013 (100.0%) | 868 (100.0%) |
Household Vehicle Usage in Emmet County
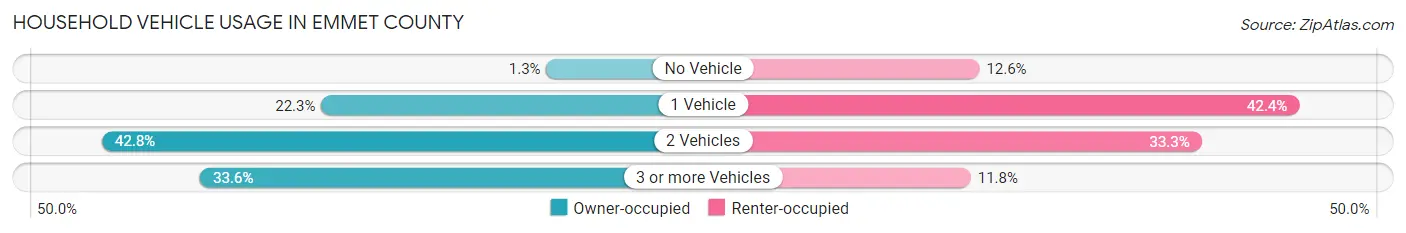
| Vehicles per Household | Owner-occupied | Renter-occupied |
| No Vehicle | 39 (1.3%) | 109 (12.6%) |
| 1 Vehicle | 672 (22.3%) | 368 (42.4%) |
| 2 Vehicles | 1,289 (42.8%) | 289 (33.3%) |
| 3 or more Vehicles | 1,013 (33.6%) | 102 (11.7%) |
| Total | 3,013 (100.0%) | 868 (100.0%) |
Real Estate & Mortgages in Emmet County
Real Estate and Mortgage Overview in Emmet County
| Characteristic | Without Mortgage | With Mortgage |
| Housing Units | 1,524 | 1,489 |
| Median Property Value | $89,400 | $113,900 |
| Median Household Income | $57,024 | $158 |
| Monthly Housing Costs | $502 | $31 |
| Real Estate Taxes | $1,422 | $2 |
Property Value by Mortgage Status in Emmet County
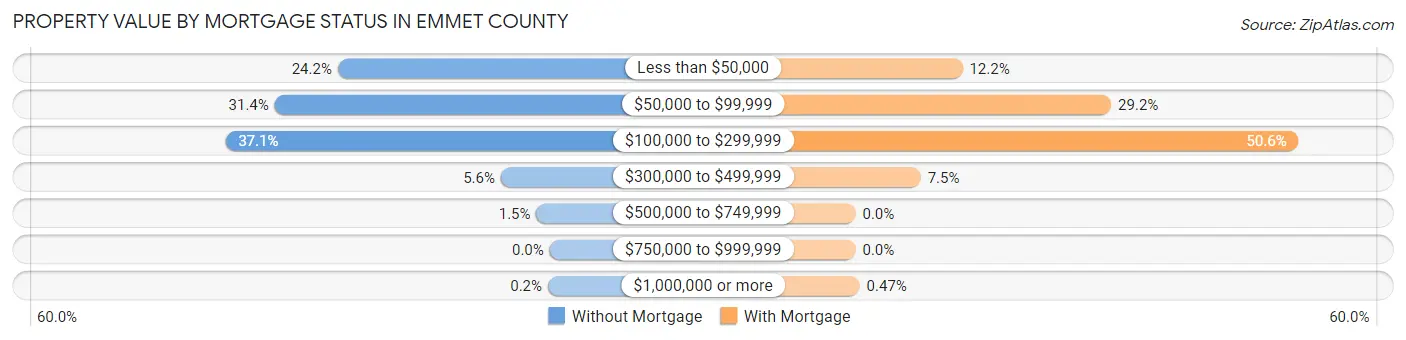
| Property Value | Without Mortgage | With Mortgage |
| Less than $50,000 | 369 (24.2%) | 182 (12.2%) |
| $50,000 to $99,999 | 479 (31.4%) | 435 (29.2%) |
| $100,000 to $299,999 | 565 (37.1%) | 754 (50.6%) |
| $300,000 to $499,999 | 85 (5.6%) | 111 (7.4%) |
| $500,000 to $749,999 | 23 (1.5%) | 0 (0.0%) |
| $750,000 to $999,999 | 0 (0.0%) | 0 (0.0%) |
| $1,000,000 or more | 3 (0.2%) | 7 (0.5%) |
| Total | 1,524 (100.0%) | 1,489 (100.0%) |
Household Income by Mortgage Status in Emmet County
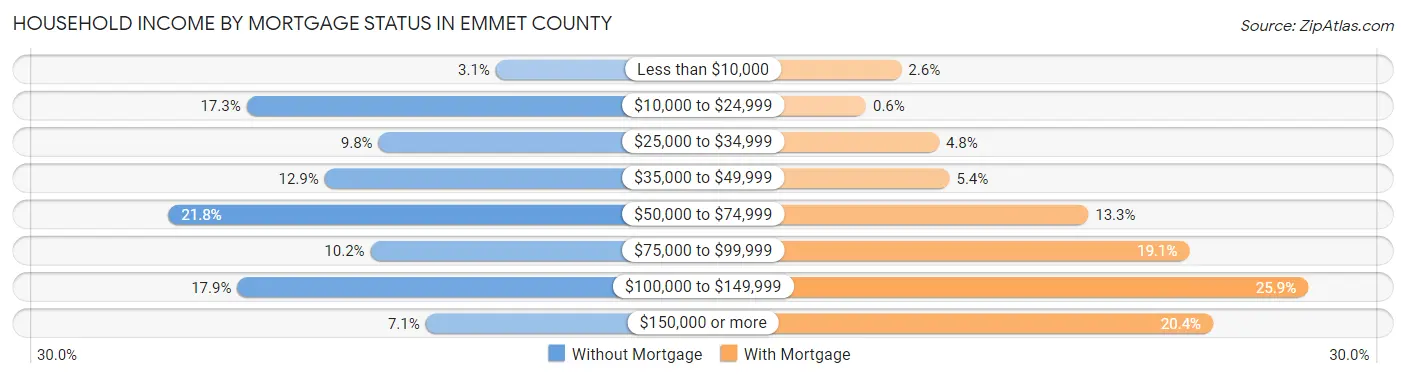
| Household Income | Without Mortgage | With Mortgage |
| Less than $10,000 | 47 (3.1%) | 39 (2.6%) |
| $10,000 to $24,999 | 264 (17.3%) | 9 (0.6%) |
| $25,000 to $34,999 | 149 (9.8%) | 71 (4.8%) |
| $35,000 to $49,999 | 196 (12.9%) | 80 (5.4%) |
| $50,000 to $74,999 | 332 (21.8%) | 198 (13.3%) |
| $75,000 to $99,999 | 156 (10.2%) | 284 (19.1%) |
| $100,000 to $149,999 | 272 (17.8%) | 385 (25.9%) |
| $150,000 or more | 108 (7.1%) | 304 (20.4%) |
| Total | 1,524 (100.0%) | 1,489 (100.0%) |
Property Value to Household Income Ratio in Emmet County
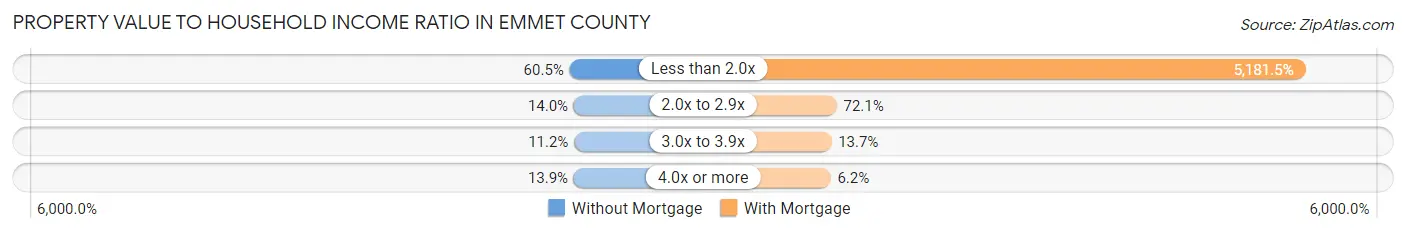
| Value-to-Income Ratio | Without Mortgage | With Mortgage |
| Less than 2.0x | 922 (60.5%) | 77,153 (5,181.5%) |
| 2.0x to 2.9x | 214 (14.0%) | 1,073 (72.1%) |
| 3.0x to 3.9x | 170 (11.2%) | 204 (13.7%) |
| 4.0x or more | 211 (13.9%) | 92 (6.2%) |
| Total | 1,524 (100.0%) | 1,489 (100.0%) |
Real Estate Taxes by Mortgage Status in Emmet County
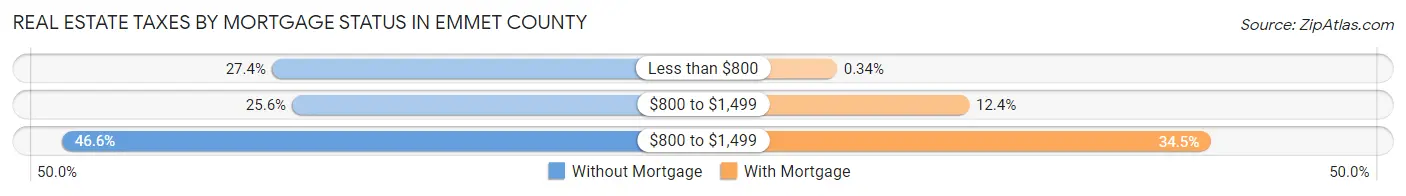
| Property Taxes | Without Mortgage | With Mortgage |
| Less than $800 | 418 (27.4%) | 5 (0.3%) |
| $800 to $1,499 | 390 (25.6%) | 185 (12.4%) |
| $800 to $1,499 | 710 (46.6%) | 514 (34.5%) |
| Total | 1,524 (100.0%) | 1,489 (100.0%) |
Health & Disability in Emmet County
Health Insurance Coverage by Age in Emmet County
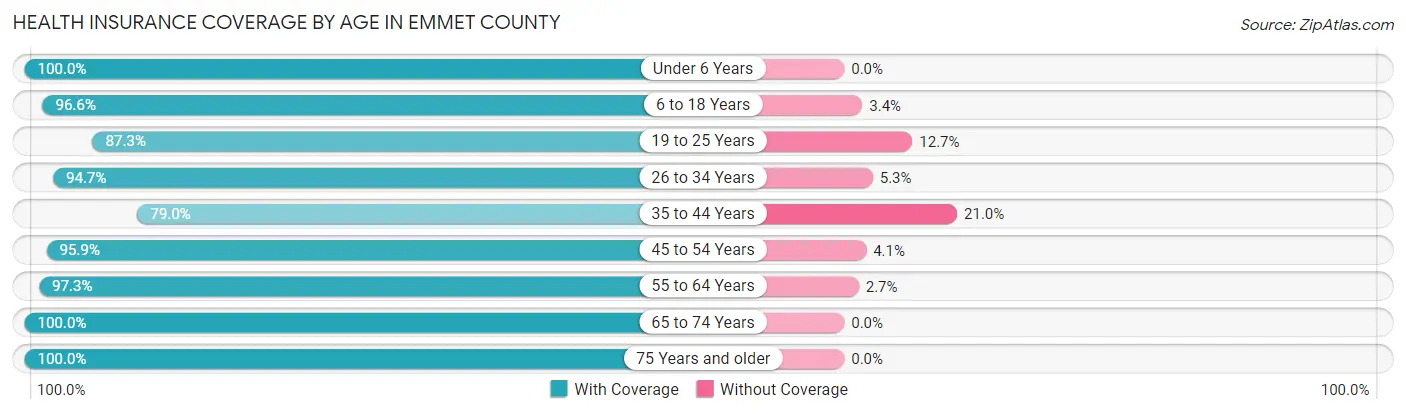
| Age Bracket | With Coverage | Without Coverage |
| Under 6 Years | 441 (100.0%) | 0 (0.0%) |
| 6 to 18 Years | 1,437 (96.6%) | 50 (3.4%) |
| 19 to 25 Years | 674 (87.3%) | 98 (12.7%) |
| 26 to 34 Years | 802 (94.7%) | 45 (5.3%) |
| 35 to 44 Years | 833 (79.0%) | 222 (21.0%) |
| 45 to 54 Years | 1,009 (95.9%) | 43 (4.1%) |
| 55 to 64 Years | 1,406 (97.3%) | 39 (2.7%) |
| 65 to 74 Years | 1,237 (100.0%) | 0 (0.0%) |
| 75 Years and older | 766 (100.0%) | 0 (0.0%) |
| Total | 8,605 (94.5%) | 497 (5.5%) |
Health Insurance Coverage by Citizenship Status in Emmet County
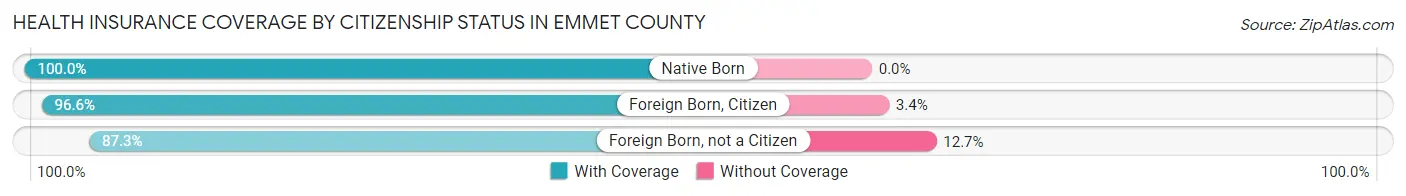
| Citizenship Status | With Coverage | Without Coverage |
| Native Born | 441 (100.0%) | 0 (0.0%) |
| Foreign Born, Citizen | 1,437 (96.6%) | 50 (3.4%) |
| Foreign Born, not a Citizen | 674 (87.3%) | 98 (12.7%) |
Health Insurance Coverage by Household Income in Emmet County
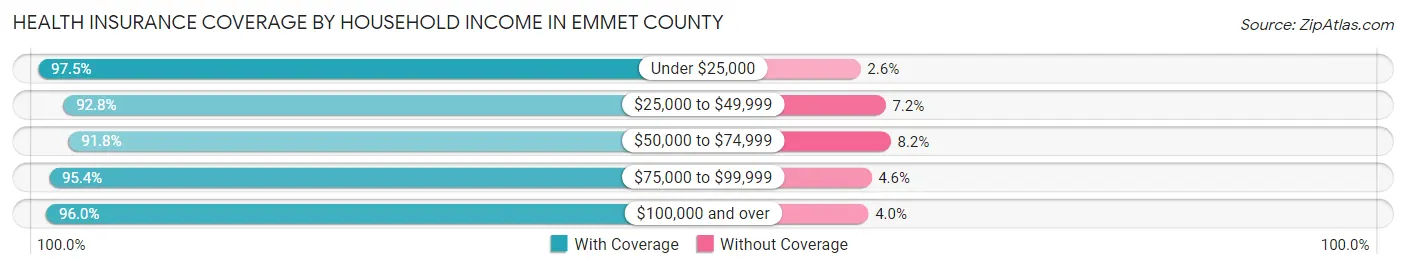
| Household Income | With Coverage | Without Coverage |
| Under $25,000 | 1,070 (97.5%) | 28 (2.5%) |
| $25,000 to $49,999 | 1,346 (92.8%) | 105 (7.2%) |
| $50,000 to $74,999 | 1,746 (91.8%) | 156 (8.2%) |
| $75,000 to $99,999 | 1,378 (95.4%) | 66 (4.6%) |
| $100,000 and over | 2,627 (96.0%) | 110 (4.0%) |
Public vs Private Health Insurance Coverage by Age in Emmet County
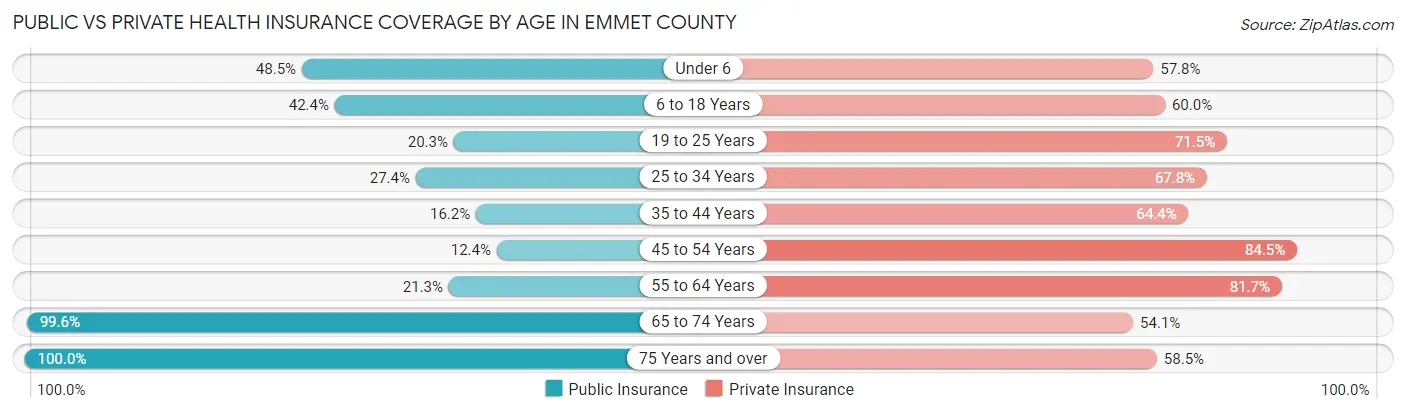
| Age Bracket | Public Insurance | Private Insurance |
| Under 6 | 214 (48.5%) | 255 (57.8%) |
| 6 to 18 Years | 631 (42.4%) | 892 (60.0%) |
| 19 to 25 Years | 157 (20.3%) | 552 (71.5%) |
| 25 to 34 Years | 232 (27.4%) | 574 (67.8%) |
| 35 to 44 Years | 171 (16.2%) | 679 (64.4%) |
| 45 to 54 Years | 130 (12.4%) | 889 (84.5%) |
| 55 to 64 Years | 307 (21.2%) | 1,180 (81.7%) |
| 65 to 74 Years | 1,232 (99.6%) | 669 (54.1%) |
| 75 Years and over | 766 (100.0%) | 448 (58.5%) |
| Total | 3,840 (42.2%) | 6,138 (67.4%) |
Disability Status by Sex by Age in Emmet County
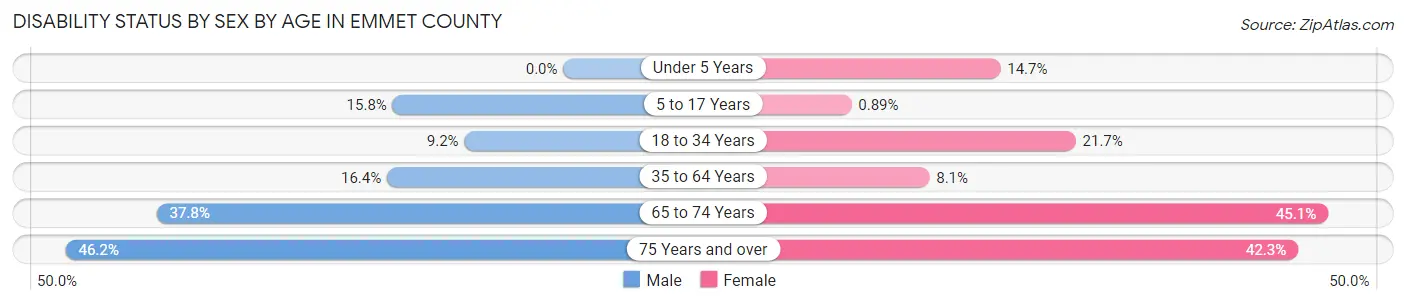
| Age Bracket | Male | Female |
| Under 5 Years | 0 (0.0%) | 30 (14.7%) |
| 5 to 17 Years | 105 (15.8%) | 6 (0.9%) |
| 18 to 34 Years | 87 (9.2%) | 189 (21.7%) |
| 35 to 64 Years | 301 (16.4%) | 139 (8.1%) |
| 65 to 74 Years | 231 (37.8%) | 282 (45.1%) |
| 75 Years and over | 164 (46.2%) | 174 (42.3%) |
Disability Class by Sex by Age in Emmet County
Disability Class: Hearing Difficulty
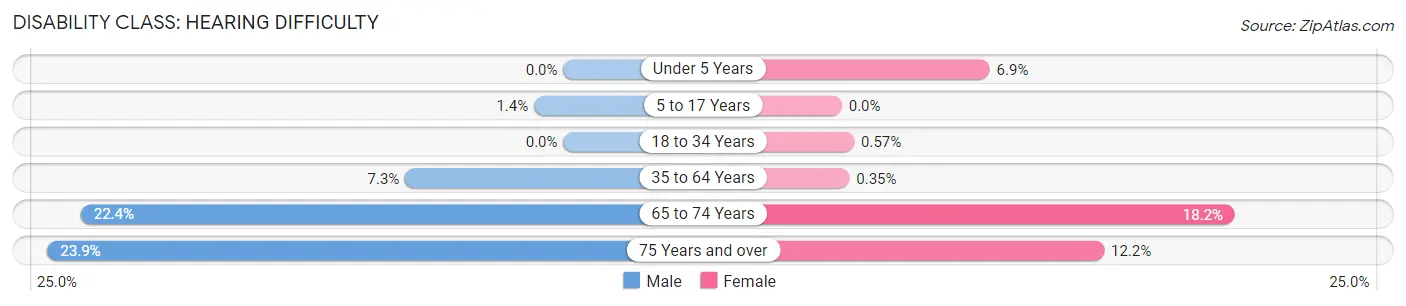
| Age Bracket | Male | Female |
| Under 5 Years | 0 (0.0%) | 14 (6.9%) |
| 5 to 17 Years | 9 (1.4%) | 0 (0.0%) |
| 18 to 34 Years | 0 (0.0%) | 5 (0.6%) |
| 35 to 64 Years | 135 (7.3%) | 6 (0.4%) |
| 65 to 74 Years | 137 (22.4%) | 114 (18.2%) |
| 75 Years and over | 85 (23.9%) | 50 (12.2%) |
Disability Class: Vision Difficulty
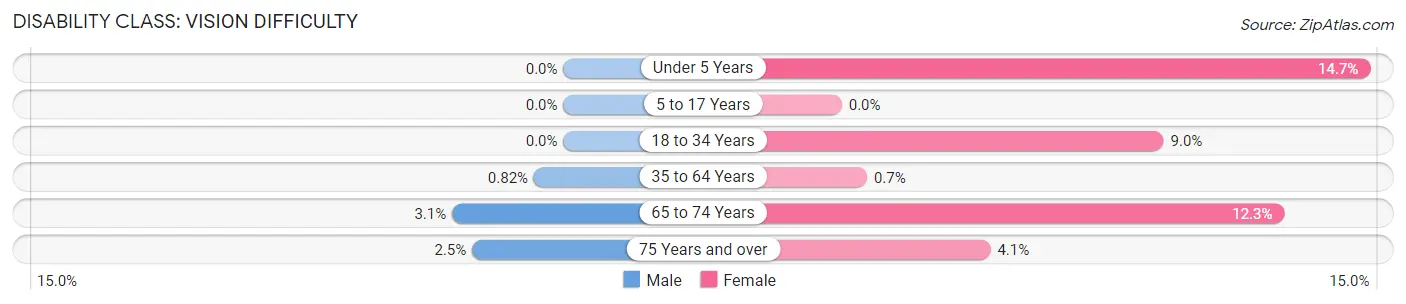
| Age Bracket | Male | Female |
| Under 5 Years | 0 (0.0%) | 30 (14.7%) |
| 5 to 17 Years | 0 (0.0%) | 0 (0.0%) |
| 18 to 34 Years | 0 (0.0%) | 78 (9.0%) |
| 35 to 64 Years | 15 (0.8%) | 12 (0.7%) |
| 65 to 74 Years | 19 (3.1%) | 77 (12.3%) |
| 75 Years and over | 9 (2.5%) | 17 (4.1%) |
Disability Class: Cognitive Difficulty
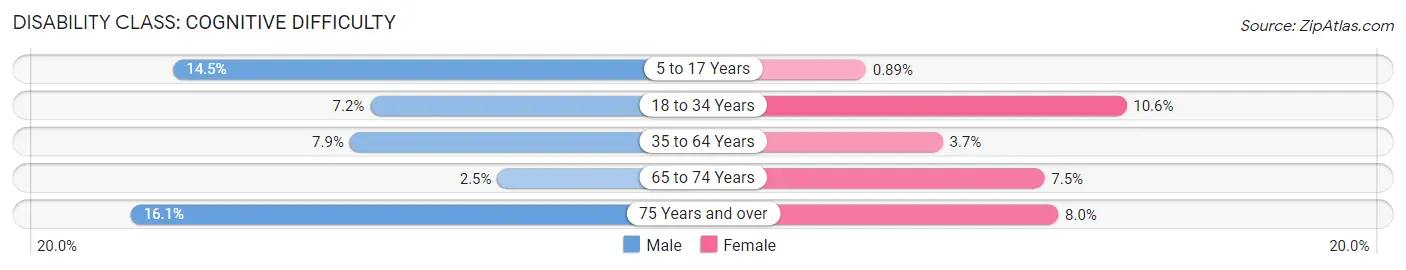
| Age Bracket | Male | Female |
| 5 to 17 Years | 96 (14.5%) | 6 (0.9%) |
| 18 to 34 Years | 68 (7.2%) | 92 (10.6%) |
| 35 to 64 Years | 146 (7.9%) | 64 (3.7%) |
| 65 to 74 Years | 15 (2.5%) | 47 (7.5%) |
| 75 Years and over | 57 (16.1%) | 33 (8.0%) |
Disability Class: Ambulatory Difficulty
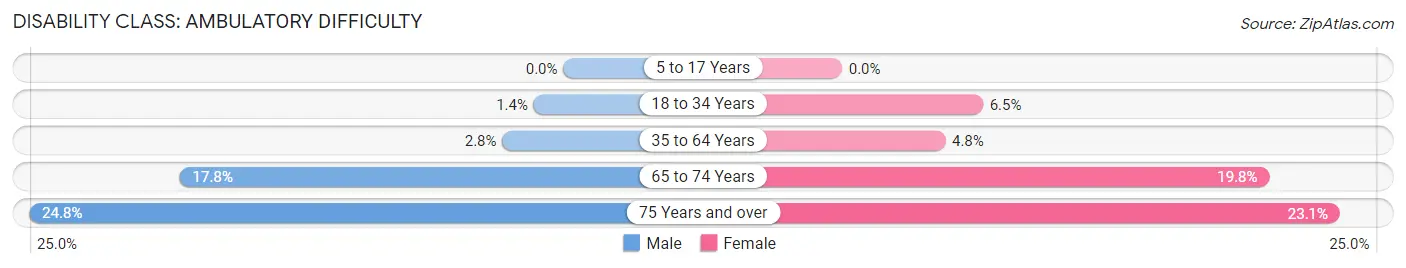
| Age Bracket | Male | Female |
| 5 to 17 Years | 0 (0.0%) | 0 (0.0%) |
| 18 to 34 Years | 13 (1.4%) | 57 (6.5%) |
| 35 to 64 Years | 52 (2.8%) | 82 (4.8%) |
| 65 to 74 Years | 109 (17.8%) | 124 (19.8%) |
| 75 Years and over | 88 (24.8%) | 95 (23.1%) |
Disability Class: Self-Care Difficulty
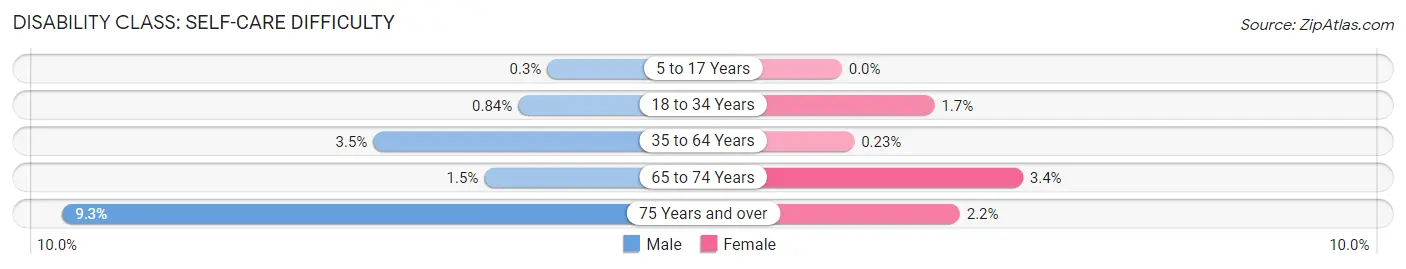
| Age Bracket | Male | Female |
| 5 to 17 Years | 2 (0.3%) | 0 (0.0%) |
| 18 to 34 Years | 8 (0.8%) | 15 (1.7%) |
| 35 to 64 Years | 65 (3.5%) | 4 (0.2%) |
| 65 to 74 Years | 9 (1.5%) | 21 (3.4%) |
| 75 Years and over | 33 (9.3%) | 9 (2.2%) |
Technology Access in Emmet County
Computing Device Access in Emmet County
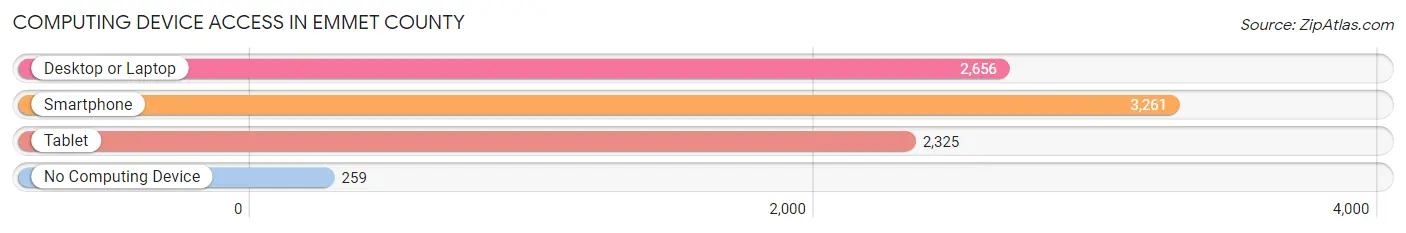
| Device Type | # Households | % Households |
| Desktop or Laptop | 2,656 | 68.4% |
| Smartphone | 3,261 | 84.0% |
| Tablet | 2,325 | 59.9% |
| No Computing Device | 259 | 6.7% |
| Total | 3,881 | 100.0% |
Internet Access in Emmet County
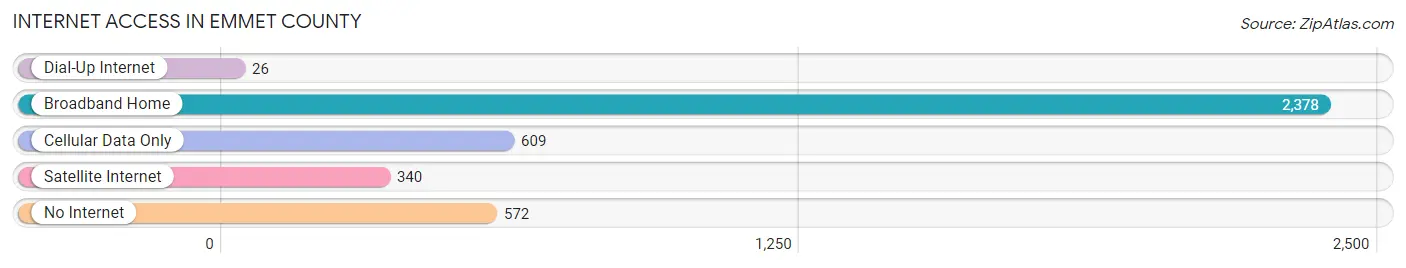
| Internet Type | # Households | % Households |
| Dial-Up Internet | 26 | 0.7% |
| Broadband Home | 2,378 | 61.3% |
| Cellular Data Only | 609 | 15.7% |
| Satellite Internet | 340 | 8.8% |
| No Internet | 572 | 14.7% |
| Total | 3,881 | 100.0% |
Emmet County Summary
Emmet County is located in the northwest corner of Iowa, and is part of the Iowa Great Lakes region. It is bordered by Dickinson County to the north, Kossuth County to the east, Palo Alto County to the south, and Clay County, Minnesota to the west. The county seat is Estherville, and the county has a total area of 576 square miles, of which 574 square miles is land and 2 square miles is water.
History
Emmet County was established in 1851 and was named after Irish patriot Robert Emmet. The county was originally part of the Iowa Territory, and was part of the original land grant given to the Iowa Territory by the United States government. The first settlers arrived in the area in 1856, and the county was officially organized in 1858.
The county was largely agricultural in its early years, with the main crops being wheat, oats, and corn. In the late 19th century, the area began to develop into a tourist destination, with the establishment of several resorts and hotels. The county also became a popular destination for hunters and fishermen.
In the early 20th century, the county began to diversify its economy, with the establishment of several manufacturing plants. The most notable of these was the Estherville Woolen Mills, which was established in 1912 and was the largest woolen mill in the state. The county also became a major center for the production of dairy products, and the area is still known for its high-quality dairy products.
Geography
Emmet County is located in the northwest corner of Iowa, and is part of the Iowa Great Lakes region. It is bordered by Dickinson County to the north, Kossuth County to the east, Palo Alto County to the south, and Clay County, Minnesota to the west. The county has a total area of 576 square miles, of which 574 square miles is land and 2 square miles is water.
The county is largely rural, with the majority of the land being used for agricultural purposes. The terrain is generally flat, with some rolling hills in the northern part of the county. The county is home to several lakes, including Big Spirit Lake, East Okoboji Lake, and West Okoboji Lake.
Economy
Emmet County has a diverse economy, with a mix of agriculture, manufacturing, and tourism. The county is home to several large employers, including the Estherville Woolen Mills, the Iowa Lakes Community College, and the Iowa Lakes Electric Cooperative.
Agriculture is the main economic driver in the county, with the main crops being corn, soybeans, and hay. The county is also home to several dairy farms, and is known for its high-quality dairy products.
Manufacturing is also an important part of the county’s economy, with several large factories located in the area. The most notable of these is the Estherville Woolen Mills, which produces woolen fabrics and clothing.
Tourism is also an important part of the county’s economy, with the area being a popular destination for hunters and fishermen. The county is also home to several resorts and hotels, as well as several golf courses.
Demographics
As of the 2010 census, the population of Emmet County was 10,302. The population is largely white (96.2%), with small percentages of African American (1.2%), Native American (0.5%), Asian (0.4%), and other races (1.7%). The median household income is $45,845, and the median age is 43.7.
Emmet County is home to several religious denominations, including Lutheran, Methodist, Catholic, and Baptist. The county is also home to several colleges and universities, including Iowa Lakes Community College and Buena Vista University.
Common Questions
What is Per Capita Income in Emmet County?
Per Capita income in Emmet County is $34,657.
What is the Median Family Income in Emmet County?
Median Family Income in Emmet County is $76,332.
What is the Median Household income in Emmet County?
Median Household Income in Emmet County is $64,461.
What is Income or Wage Gap in Emmet County?
Income or Wage Gap in Emmet County is 36.7%.
Women in Emmet County earn 63.3 cents for every dollar earned by a man.
What is Family Income Deficit in Emmet County?
Family Income Deficit in Emmet County is $10,156.
Families that are below poverty line in Emmet County earn $10,156 less on average than the poverty threshold level.
What is Inequality or Gini Index in Emmet County?
Inequality or Gini Index in Emmet County is 0.43.
What is the Total Population of Emmet County?
Total Population of Emmet County is 9,349.
What is the Total Male Population of Emmet County?
Total Male Population of Emmet County is 4,635.
What is the Total Female Population of Emmet County?
Total Female Population of Emmet County is 4,714.
What is the Ratio of Males per 100 Females in Emmet County?
There are 98.32 Males per 100 Females in Emmet County.
What is the Ratio of Females per 100 Males in Emmet County?
There are 101.70 Females per 100 Males in Emmet County.
What is the Median Population Age in Emmet County?
Median Population Age in Emmet County is 44.8 Years.
What is the Average Family Size in Emmet County
Average Family Size in Emmet County is 2.8 People.
What is the Average Household Size in Emmet County
Average Household Size in Emmet County is 2.2 People.
How Large is the Labor Force in Emmet County?
There are 4,983 People in the Labor Forcein in Emmet County.
What is the Percentage of People in the Labor Force in Emmet County?
64.0% of People are in the Labor Force in Emmet County.
What is the Unemployment Rate in Emmet County?
Unemployment Rate in Emmet County is 2.1%.