Clay County, IA Map & Demographics
Clay County Map
Clay County Overview
$35,787
PER CAPITA INCOME
$84,432
AVG FAMILY INCOME
$61,756
AVG HOUSEHOLD INCOME
32.0%
WAGE / INCOME GAP [ % ]
68.0¢/ $1
WAGE / INCOME GAP [ $ ]
$7,506
FAMILY INCOME DEFICIT
0.42
INEQUALITY / GINI INDEX
16,423
TOTAL POPULATION
8,029
MALE POPULATION
8,394
FEMALE POPULATION
95.65
MALES / 100 FEMALES
104.55
FEMALES / 100 MALES
41.5
MEDIAN AGE
3.0
AVG FAMILY SIZE
2.2
AVG HOUSEHOLD SIZE
8,786
LABOR FORCE [ PEOPLE ]
67.4%
PERCENT IN LABOR FORCE
4.1%
UNEMPLOYMENT RATE
Clay County Area Codes
Income in Clay County
Income Overview in Clay County
Per Capita Income in Clay County is $35,787, while median incomes of families and households are $84,432 and $61,756 respectively.
| Characteristic | Number | Measure |
| Per Capita Income | 16,423 | $35,787 |
| Median Family Income | 4,075 | $84,432 |
| Mean Family Income | 4,075 | $99,590 |
| Median Household Income | 7,225 | $61,756 |
| Mean Household Income | 7,225 | $78,126 |
| Income Deficit | 4,075 | $7,506 |
| Wage / Income Gap (%) | 16,423 | 31.99% |
| Wage / Income Gap ($) | 16,423 | 68.01¢ per $1 |
| Gini / Inequality Index | 16,423 | 0.42 |
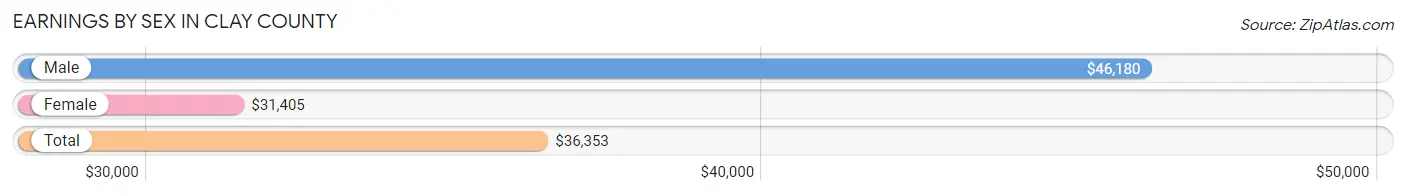
Earnings by Sex in Clay County
Average Earnings in Clay County are $36,353, $46,180 for men and $31,405 for women, a difference of 32.0%.
| Sex | Number | Average Earnings |
| Male | 4,985 (53.2%) | $46,180 |
| Female | 4,391 (46.8%) | $31,405 |
| Total | 9,376 (100.0%) | $36,353 |
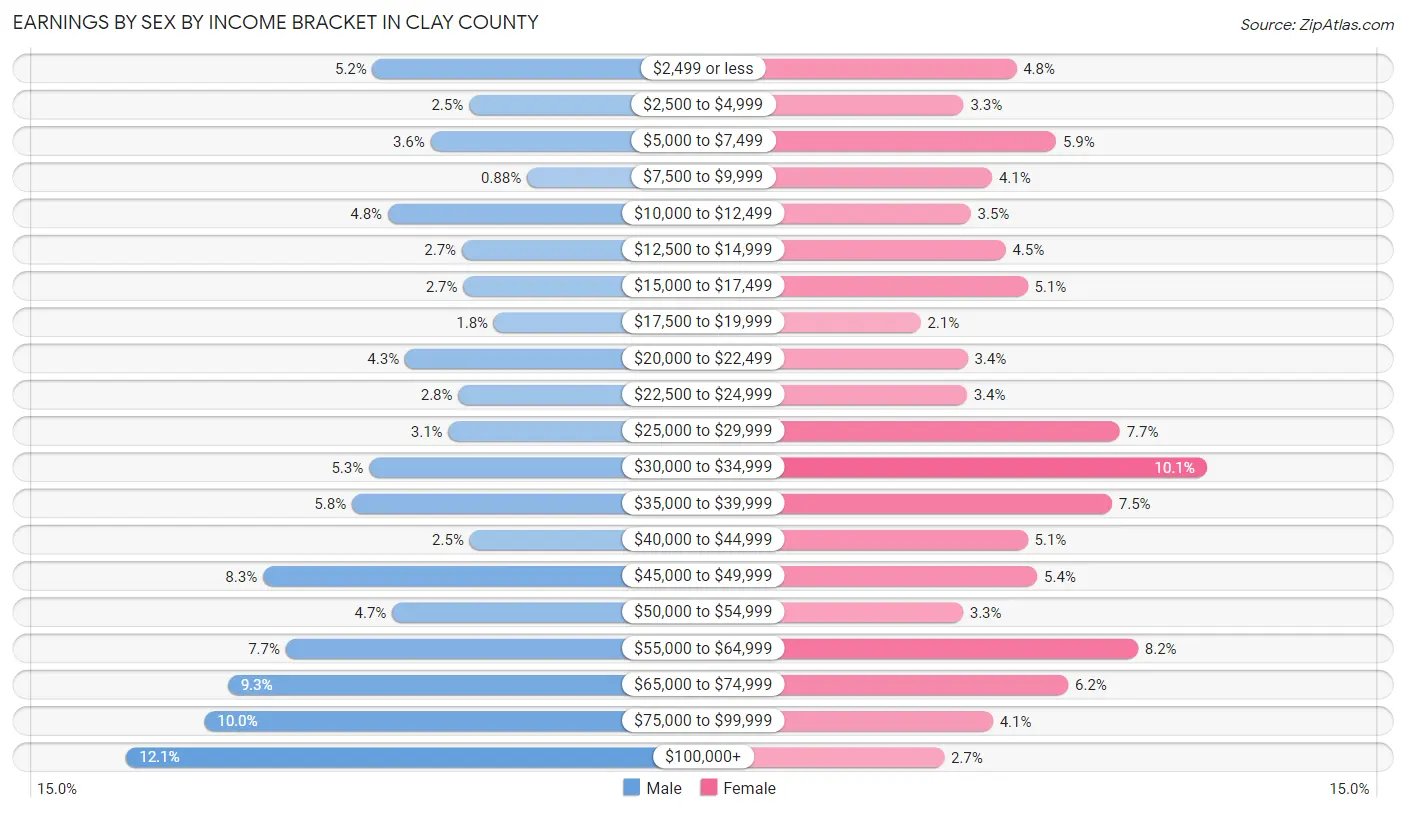
Earnings by Sex by Income Bracket in Clay County
The most common earnings brackets in Clay County are $100,000+ for men (605 | 12.1%) and $30,000 to $34,999 for women (444 | 10.1%).
| Income | Male | Female |
| $2,499 or less | 260 (5.2%) | 209 (4.8%) |
| $2,500 to $4,999 | 125 (2.5%) | 144 (3.3%) |
| $5,000 to $7,499 | 179 (3.6%) | 258 (5.9%) |
| $7,500 to $9,999 | 44 (0.9%) | 179 (4.1%) |
| $10,000 to $12,499 | 239 (4.8%) | 153 (3.5%) |
| $12,500 to $14,999 | 135 (2.7%) | 196 (4.5%) |
| $15,000 to $17,499 | 133 (2.7%) | 223 (5.1%) |
| $17,500 to $19,999 | 90 (1.8%) | 91 (2.1%) |
| $20,000 to $22,499 | 215 (4.3%) | 149 (3.4%) |
| $22,500 to $24,999 | 140 (2.8%) | 148 (3.4%) |
| $25,000 to $29,999 | 154 (3.1%) | 337 (7.7%) |
| $30,000 to $34,999 | 265 (5.3%) | 444 (10.1%) |
| $35,000 to $39,999 | 289 (5.8%) | 327 (7.4%) |
| $40,000 to $44,999 | 124 (2.5%) | 223 (5.1%) |
| $45,000 to $49,999 | 414 (8.3%) | 235 (5.3%) |
| $50,000 to $54,999 | 233 (4.7%) | 143 (3.3%) |
| $55,000 to $64,999 | 382 (7.7%) | 359 (8.2%) |
| $65,000 to $74,999 | 463 (9.3%) | 273 (6.2%) |
| $75,000 to $99,999 | 496 (10.0%) | 180 (4.1%) |
| $100,000+ | 605 (12.1%) | 120 (2.7%) |
| Total | 4,985 (100.0%) | 4,391 (100.0%) |
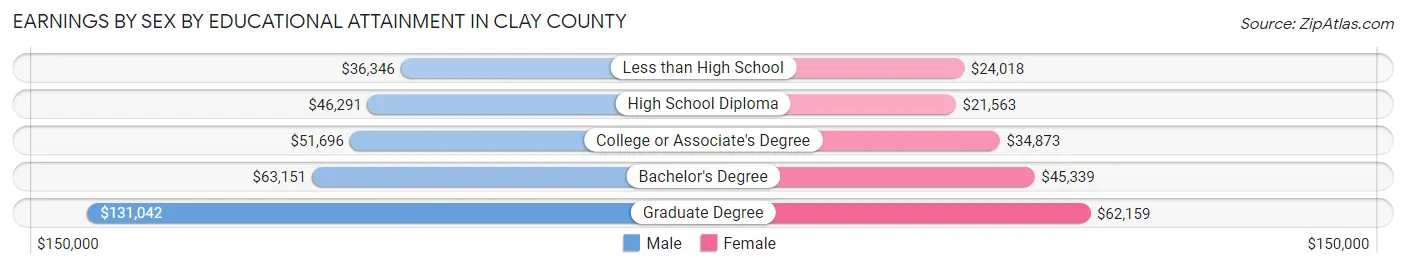
Earnings by Sex by Educational Attainment in Clay County
Average earnings in Clay County are $51,030 for men and $35,364 for women, a difference of 30.7%. Men with an educational attainment of graduate degree enjoy the highest average annual earnings of $131,042, while those with less than high school education earn the least with $36,346. Women with an educational attainment of graduate degree earn the most with the average annual earnings of $62,159, while those with high school diploma education have the smallest earnings of $21,563.
| Educational Attainment | Male Income | Female Income |
| Less than High School | $36,346 | $24,018 |
| High School Diploma | $46,291 | $21,563 |
| College or Associate's Degree | $51,696 | $34,873 |
| Bachelor's Degree | $63,151 | $45,339 |
| Graduate Degree | $131,042 | $62,159 |
| Total | $51,030 | $35,364 |
Family Income in Clay County
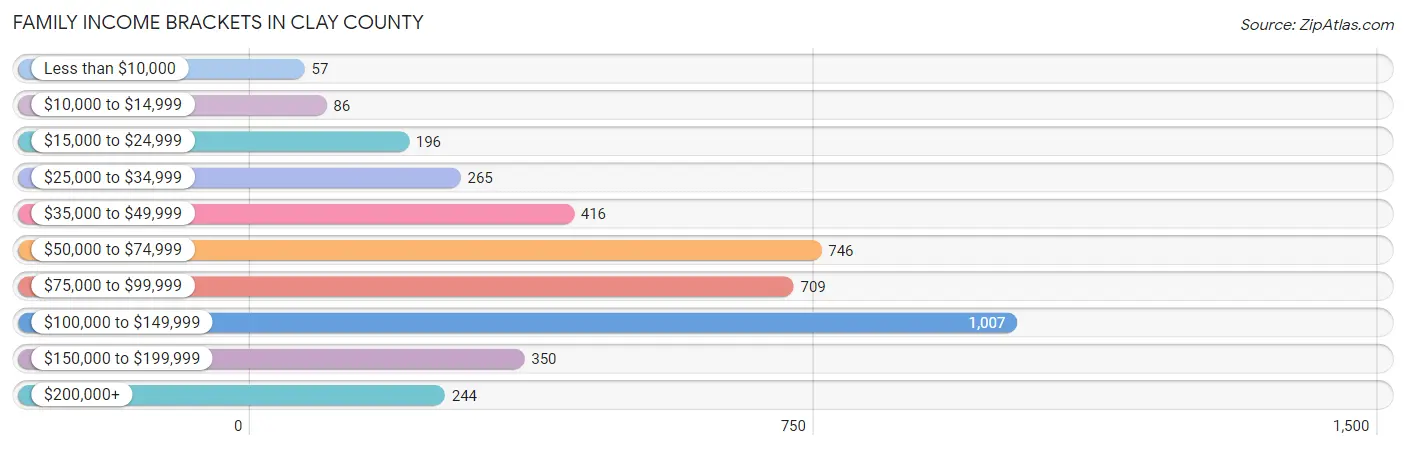
Family Income Brackets in Clay County
According to the Clay County family income data, there are 1,007 families falling into the $100,000 to $149,999 income range, which is the most common income bracket and makes up 24.7% of all families. Conversely, the less than $10,000 income bracket is the least frequent group with only 57 families (1.4%) belonging to this category.
| Income Bracket | # Families | % Families |
| Less than $10,000 | 57 | 1.4% |
| $10,000 to $14,999 | 86 | 2.1% |
| $15,000 to $24,999 | 196 | 4.8% |
| $25,000 to $34,999 | 265 | 6.5% |
| $35,000 to $49,999 | 416 | 10.2% |
| $50,000 to $74,999 | 746 | 18.3% |
| $75,000 to $99,999 | 709 | 17.4% |
| $100,000 to $149,999 | 1,007 | 24.7% |
| $150,000 to $199,999 | 350 | 8.6% |
| $200,000+ | 244 | 6.0% |
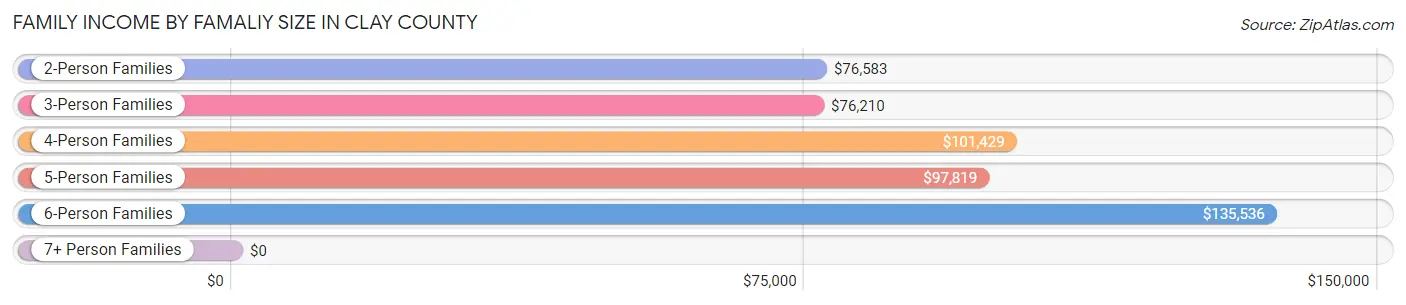
Family Income by Famaliy Size in Clay County
6-person families (43 | 1.1%) account for the highest median family income in Clay County with $135,536 per family, while 2-person families (2,337 | 57.4%) have the highest median income of $38,292 per family member.
| Income Bracket | # Families | Median Income |
| 2-Person Families | 2,337 (57.4%) | $76,583 |
| 3-Person Families | 716 (17.6%) | $76,210 |
| 4-Person Families | 630 (15.5%) | $101,429 |
| 5-Person Families | 345 (8.5%) | $97,819 |
| 6-Person Families | 43 (1.1%) | $135,536 |
| 7+ Person Families | 4 (0.1%) | $0 |
| Total | 4,075 (100.0%) | $84,432 |
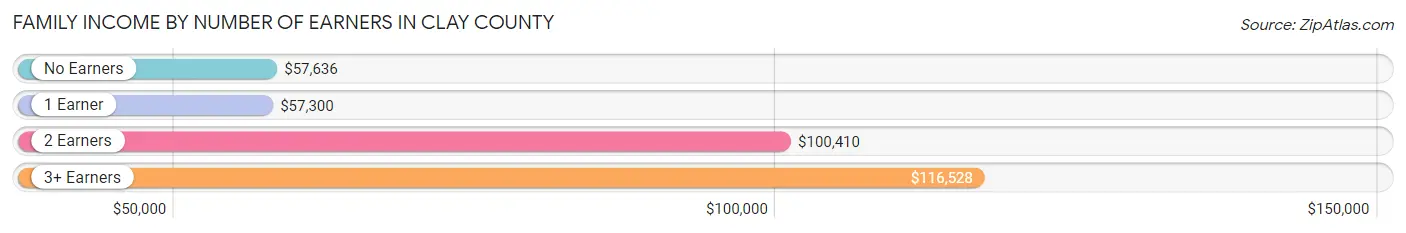
Family Income by Number of Earners in Clay County
The median family income in Clay County is $84,432, with families comprising 3+ earners (396) having the highest median family income of $116,528, while families with 1 earner (1,078) have the lowest median family income of $57,300, accounting for 9.7% and 26.5% of families, respectively.
| Number of Earners | # Families | Median Income |
| No Earners | 689 (16.9%) | $57,636 |
| 1 Earner | 1,078 (26.5%) | $57,300 |
| 2 Earners | 1,912 (46.9%) | $100,410 |
| 3+ Earners | 396 (9.7%) | $116,528 |
| Total | 4,075 (100.0%) | $84,432 |
Household Income in Clay County
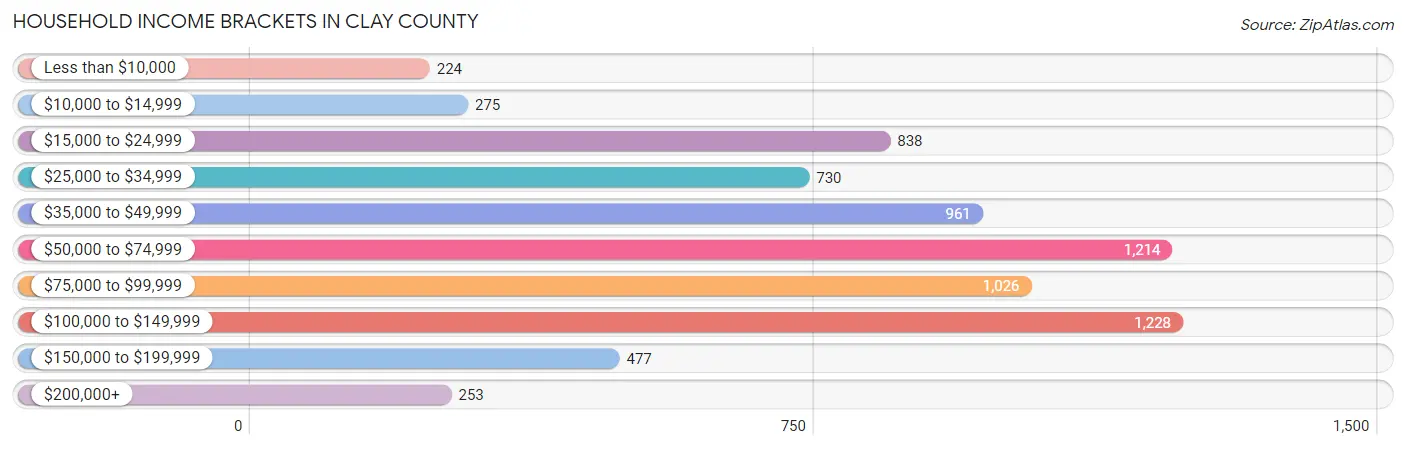
Household Income Brackets in Clay County
With 1,228 households falling in the category, the $100,000 to $149,999 income range is the most frequent in Clay County, accounting for 17.0% of all households. In contrast, only 224 households (3.1%) fall into the less than $10,000 income bracket, making it the least populous group.
| Income Bracket | # Households | % Households |
| Less than $10,000 | 224 | 3.1% |
| $10,000 to $14,999 | 275 | 3.8% |
| $15,000 to $24,999 | 838 | 11.6% |
| $25,000 to $34,999 | 730 | 10.1% |
| $35,000 to $49,999 | 961 | 13.3% |
| $50,000 to $74,999 | 1,214 | 16.8% |
| $75,000 to $99,999 | 1,026 | 14.2% |
| $100,000 to $149,999 | 1,228 | 17.0% |
| $150,000 to $199,999 | 477 | 6.6% |
| $200,000+ | 253 | 3.5% |
Household Income by Householder Age in Clay County
The median household income in Clay County is $61,756, with the highest median household income of $75,750 found in the 45 to 64 years age bracket for the primary householder. A total of 2,374 households (32.9%) fall into this category. Meanwhile, the 15 to 24 years age bracket for the primary householder has the lowest median household income of $37,917, with 428 households (5.9%) in this group.
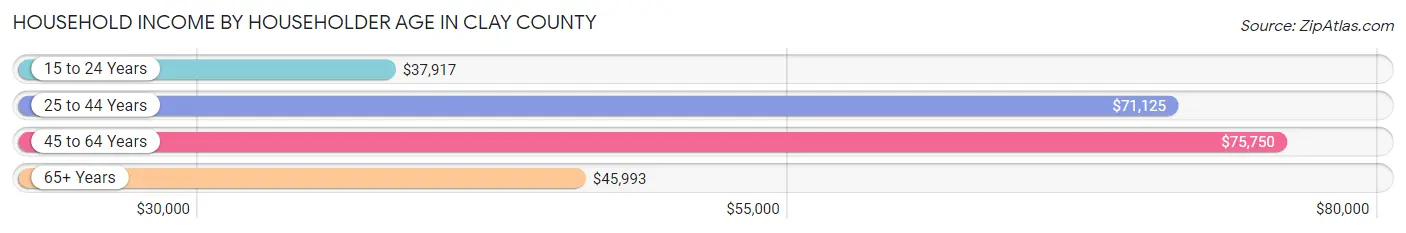
| Income Bracket | # Households | Median Income |
| 15 to 24 Years | 428 (5.9%) | $37,917 |
| 25 to 44 Years | 2,119 (29.3%) | $71,125 |
| 45 to 64 Years | 2,374 (32.9%) | $75,750 |
| 65+ Years | 2,304 (31.9%) | $45,993 |
| Total | 7,225 (100.0%) | $61,756 |
Poverty in Clay County
Income Below Poverty by Sex and Age in Clay County
With 9.6% poverty level for males and 13.2% for females among the residents of Clay County, 18 to 24 year old males and 12 to 14 year old females are the most vulnerable to poverty, with 252 males (36.8%) and 123 females (31.7%) in their respective age groups living below the poverty level.
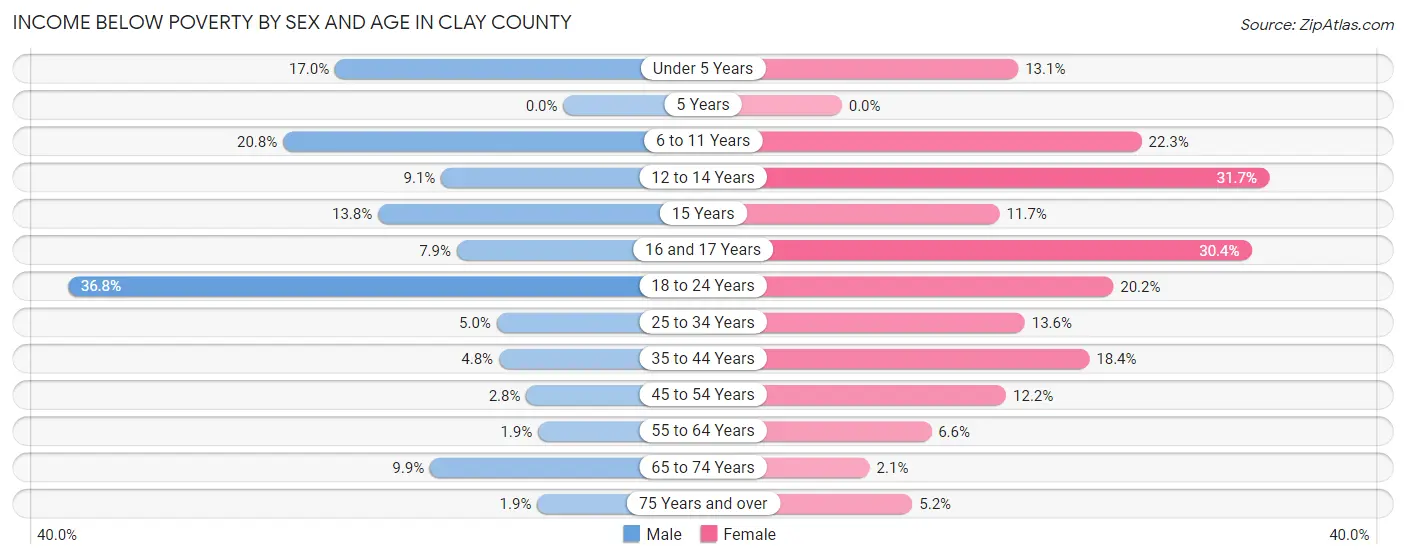
| Age Bracket | Male | Female |
| Under 5 Years | 80 (17.0%) | 66 (13.1%) |
| 5 Years | 0 (0.0%) | 0 (0.0%) |
| 6 to 11 Years | 133 (20.8%) | 142 (22.3%) |
| 12 to 14 Years | 34 (9.1%) | 123 (31.7%) |
| 15 Years | 15 (13.8%) | 17 (11.7%) |
| 16 and 17 Years | 14 (7.9%) | 69 (30.4%) |
| 18 to 24 Years | 252 (36.8%) | 123 (20.2%) |
| 25 to 34 Years | 42 (5.0%) | 112 (13.6%) |
| 35 to 44 Years | 45 (4.8%) | 181 (18.4%) |
| 45 to 54 Years | 25 (2.8%) | 108 (12.2%) |
| 55 to 64 Years | 21 (1.9%) | 76 (6.6%) |
| 65 to 74 Years | 91 (9.9%) | 20 (2.1%) |
| 75 Years and over | 13 (1.9%) | 43 (5.2%) |
| Total | 765 (9.6%) | 1,080 (13.2%) |
Income Above Poverty by Sex and Age in Clay County
According to the poverty statistics in Clay County, males aged 5 years and females aged 5 years are the age groups that are most secure financially, with 100.0% of males and 100.0% of females in these age groups living above the poverty line.
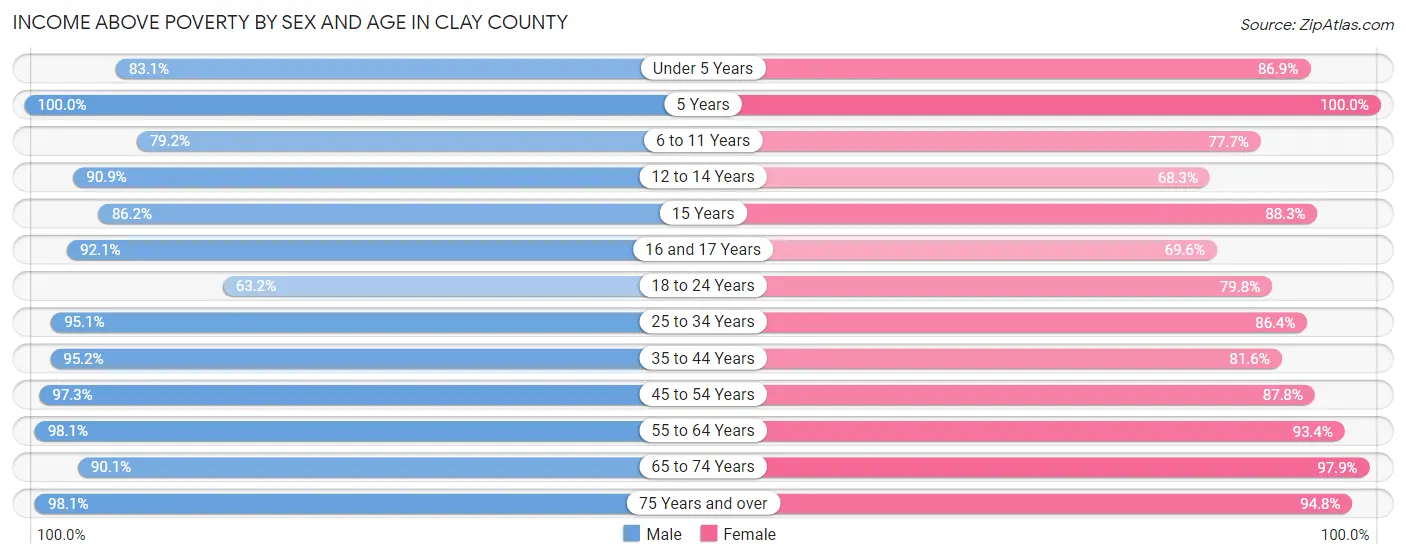
| Age Bracket | Male | Female |
| Under 5 Years | 392 (83.1%) | 438 (86.9%) |
| 5 Years | 77 (100.0%) | 32 (100.0%) |
| 6 to 11 Years | 506 (79.2%) | 496 (77.7%) |
| 12 to 14 Years | 341 (90.9%) | 265 (68.3%) |
| 15 Years | 94 (86.2%) | 128 (88.3%) |
| 16 and 17 Years | 163 (92.1%) | 158 (69.6%) |
| 18 to 24 Years | 433 (63.2%) | 487 (79.8%) |
| 25 to 34 Years | 806 (95.1%) | 712 (86.4%) |
| 35 to 44 Years | 897 (95.2%) | 804 (81.6%) |
| 45 to 54 Years | 885 (97.3%) | 777 (87.8%) |
| 55 to 64 Years | 1,095 (98.1%) | 1,068 (93.4%) |
| 65 to 74 Years | 828 (90.1%) | 948 (97.9%) |
| 75 Years and over | 656 (98.1%) | 778 (94.8%) |
| Total | 7,173 (90.4%) | 7,091 (86.8%) |
Income Below Poverty Among Married-Couple Families in Clay County
The poverty statistics for married-couple families in Clay County show that 1.9% or 59 of the total 3,170 families live below the poverty line. Families with 5 or more children have the highest poverty rate of 100.0%, comprising of 3 families. On the other hand, families with 1 or 2 children have the lowest poverty rate of 0.3%, which includes 2 families.
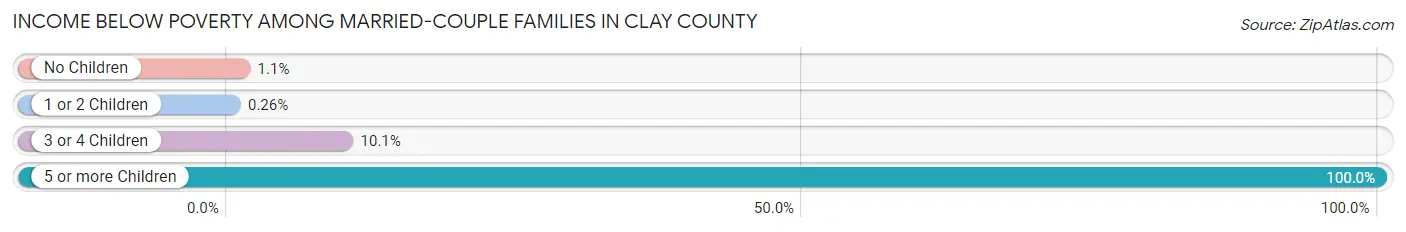
| Children | Above Poverty | Below Poverty |
| No Children | 2,063 (98.9%) | 23 (1.1%) |
| 1 or 2 Children | 771 (99.7%) | 2 (0.3%) |
| 3 or 4 Children | 277 (89.9%) | 31 (10.1%) |
| 5 or more Children | 0 (0.0%) | 3 (100.0%) |
| Total | 3,111 (98.1%) | 59 (1.9%) |
Income Below Poverty Among Single-Parent Households in Clay County
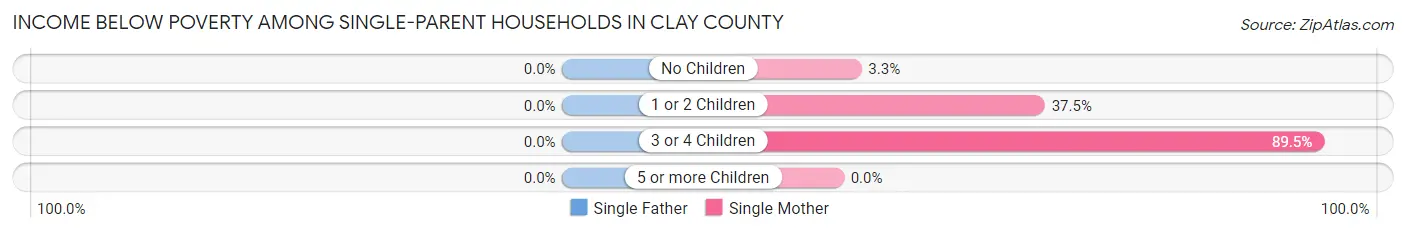
| Children | Single Father | Single Mother |
| No Children | 0 (0.0%) | 3 (3.3%) |
| 1 or 2 Children | 0 (0.0%) | 182 (37.4%) |
| 3 or 4 Children | 0 (0.0%) | 85 (89.5%) |
| 5 or more Children | 0 (0.0%) | 0 (0.0%) |
| Total | 0 (0.0%) | 270 (40.2%) |
Income Below Poverty Among Married-Couple vs Single-Parent Households in Clay County
The poverty data for Clay County shows that 59 of the married-couple family households (1.9%) and 270 of the single-parent households (29.8%) are living below the poverty level. Within the married-couple family households, those with 5 or more children have the highest poverty rate, with 3 households (100.0%) falling below the poverty line. Among the single-parent households, those with 3 or 4 children have the highest poverty rate, with 85 household (85.9%) living below poverty.
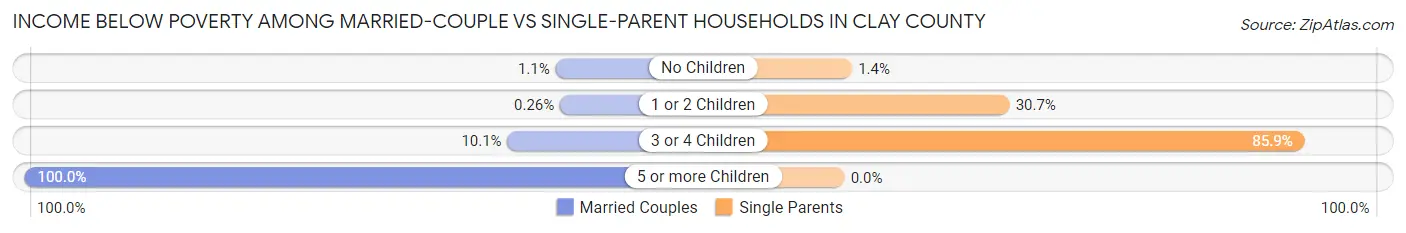
| Children | Married-Couple Families | Single-Parent Households |
| No Children | 23 (1.1%) | 3 (1.4%) |
| 1 or 2 Children | 2 (0.3%) | 182 (30.7%) |
| 3 or 4 Children | 31 (10.1%) | 85 (85.9%) |
| 5 or more Children | 3 (100.0%) | 0 (0.0%) |
| Total | 59 (1.9%) | 270 (29.8%) |
Race in Clay County
The most populous races in Clay County are White / Caucasian (15,544 | 94.7%), Hispanic or Latino (685 | 4.2%), and Two or more Races (549 | 3.3%).
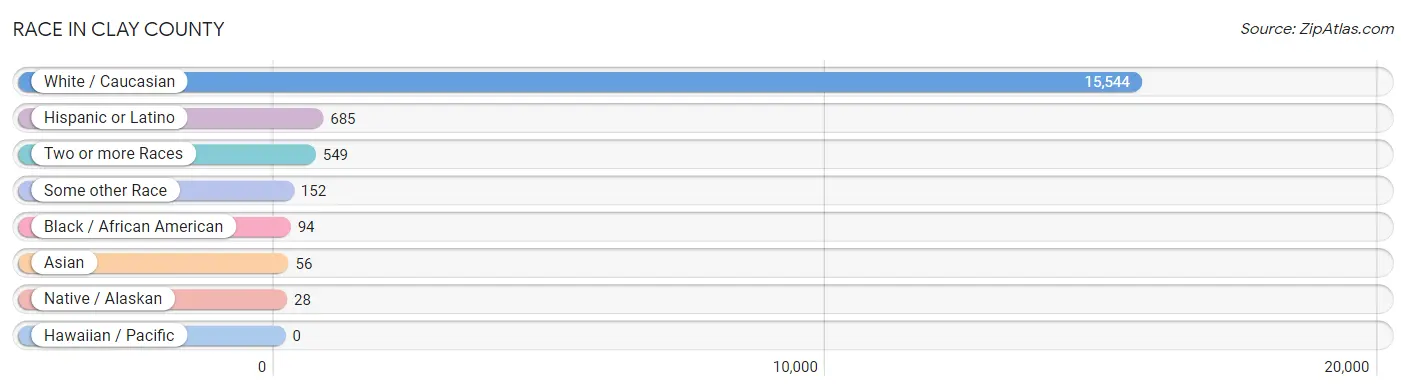
| Race | # Population | % Population |
| Asian | 56 | 0.3% |
| Black / African American | 94 | 0.6% |
| Hawaiian / Pacific | 0 | 0.0% |
| Hispanic or Latino | 685 | 4.2% |
| Native / Alaskan | 28 | 0.2% |
| White / Caucasian | 15,544 | 94.7% |
| Two or more Races | 549 | 3.3% |
| Some other Race | 152 | 0.9% |
| Total | 16,423 | 100.0% |
Ancestry in Clay County
The most populous ancestries reported in Clay County are German (6,831 | 41.6%), Irish (1,792 | 10.9%), Norwegian (1,678 | 10.2%), English (1,017 | 6.2%), and Danish (963 | 5.9%), together accounting for 74.8% of all Clay County residents.
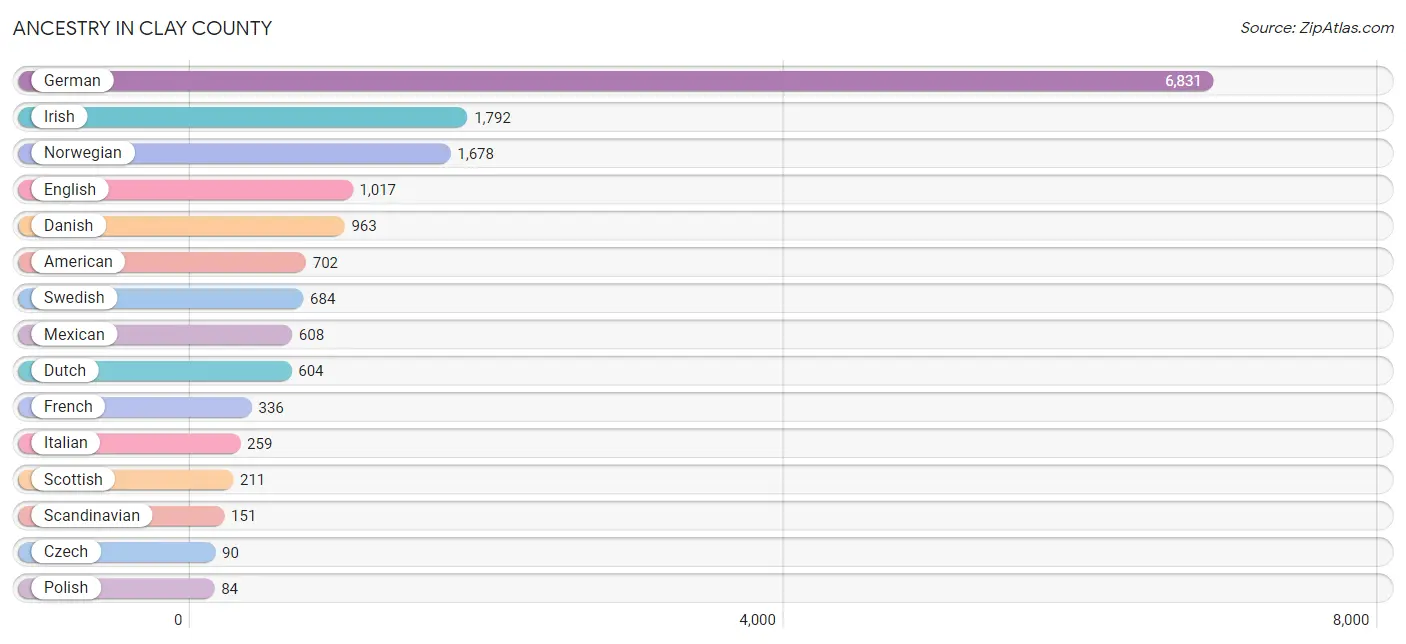
| Ancestry | # Population | % Population |
| African | 4 | 0.0% |
| Alaskan Athabascan | 2 | 0.0% |
| American | 702 | 4.3% |
| Australian | 1 | 0.0% |
| Belgian | 2 | 0.0% |
| Brazilian | 3 | 0.0% |
| British | 43 | 0.3% |
| Burmese | 83 | 0.5% |
| Cajun | 11 | 0.1% |
| Canadian | 12 | 0.1% |
| Central American | 3 | 0.0% |
| Cherokee | 60 | 0.4% |
| Chippewa | 19 | 0.1% |
| Choctaw | 6 | 0.0% |
| Colombian | 5 | 0.0% |
| Czech | 90 | 0.5% |
| Czechoslovakian | 27 | 0.2% |
| Danish | 963 | 5.9% |
| Dutch | 604 | 3.7% |
| Eastern European | 1 | 0.0% |
| English | 1,017 | 6.2% |
| European | 49 | 0.3% |
| French | 336 | 2.1% |
| French Canadian | 17 | 0.1% |
| German | 6,831 | 41.6% |
| Greek | 1 | 0.0% |
| Indian (Asian) | 4 | 0.0% |
| Irish | 1,792 | 10.9% |
| Italian | 259 | 1.6% |
| Korean | 59 | 0.4% |
| Luxembourger | 18 | 0.1% |
| Malaysian | 8 | 0.1% |
| Mexican | 608 | 3.7% |
| Nicaraguan | 3 | 0.0% |
| Northern European | 18 | 0.1% |
| Norwegian | 1,678 | 10.2% |
| Pennsylvania German | 40 | 0.2% |
| Polish | 84 | 0.5% |
| Portuguese | 12 | 0.1% |
| Puerto Rican | 67 | 0.4% |
| Russian | 3 | 0.0% |
| Scandinavian | 151 | 0.9% |
| Scotch-Irish | 39 | 0.2% |
| Scottish | 211 | 1.3% |
| Serbian | 28 | 0.2% |
| Sioux | 4 | 0.0% |
| South American | 5 | 0.0% |
| Spanish | 2 | 0.0% |
| Subsaharan African | 4 | 0.0% |
| Swedish | 684 | 4.2% |
| Swiss | 57 | 0.4% |
| Ukrainian | 28 | 0.2% |
| Welsh | 54 | 0.3% | View All 53 Rows |
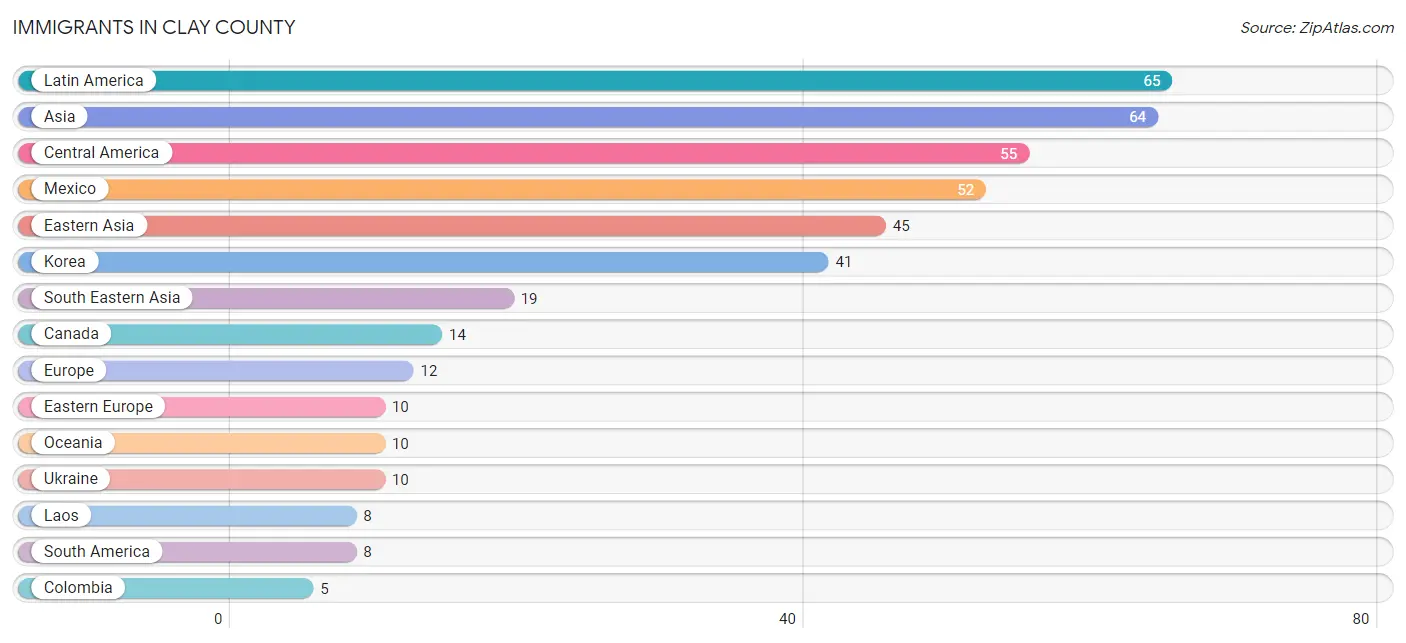
Immigrants in Clay County
The most numerous immigrant groups reported in Clay County came from Latin America (65 | 0.4%), Asia (64 | 0.4%), Central America (55 | 0.3%), Mexico (52 | 0.3%), and Eastern Asia (45 | 0.3%), together accounting for 1.7% of all Clay County residents.
| Immigration Origin | # Population | % Population |
| Asia | 64 | 0.4% |
| Australia | 3 | 0.0% |
| Brazil | 3 | 0.0% |
| Canada | 14 | 0.1% |
| Caribbean | 2 | 0.0% |
| Central America | 55 | 0.3% |
| China | 4 | 0.0% |
| Colombia | 5 | 0.0% |
| Eastern Asia | 45 | 0.3% |
| Eastern Europe | 10 | 0.1% |
| Europe | 12 | 0.1% |
| Ireland | 2 | 0.0% |
| Korea | 41 | 0.3% |
| Laos | 8 | 0.1% |
| Latin America | 65 | 0.4% |
| Mexico | 52 | 0.3% |
| Nicaragua | 3 | 0.0% |
| Northern Europe | 2 | 0.0% |
| Oceania | 10 | 0.1% |
| Philippines | 3 | 0.0% |
| South America | 8 | 0.1% |
| South Eastern Asia | 19 | 0.1% |
| Trinidad and Tobago | 2 | 0.0% |
| Ukraine | 10 | 0.1% | View All 24 Rows |
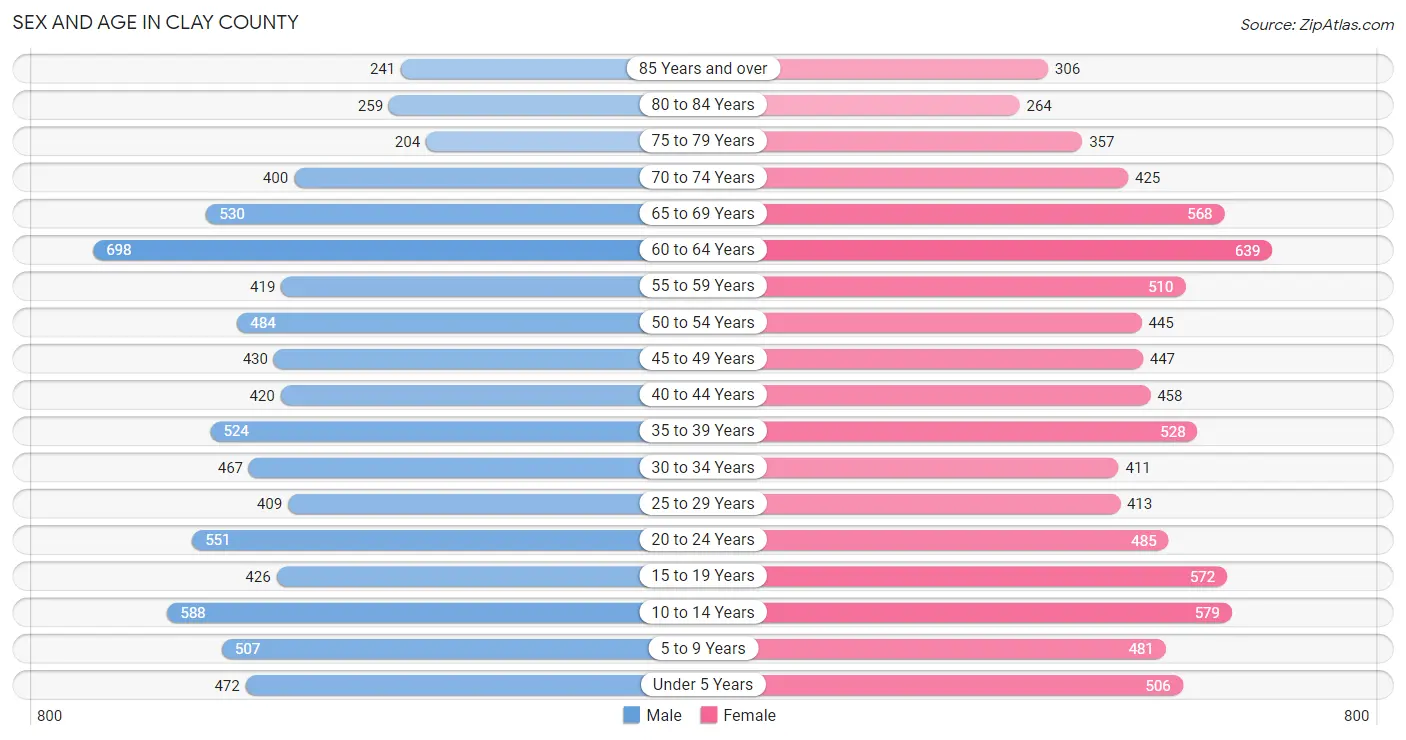
Sex and Age in Clay County
Sex and Age in Clay County
The most populous age groups in Clay County are 60 to 64 Years (698 | 8.7%) for men and 60 to 64 Years (639 | 7.6%) for women.
| Age Bracket | Male | Female |
| Under 5 Years | 472 (5.9%) | 506 (6.0%) |
| 5 to 9 Years | 507 (6.3%) | 481 (5.7%) |
| 10 to 14 Years | 588 (7.3%) | 579 (6.9%) |
| 15 to 19 Years | 426 (5.3%) | 572 (6.8%) |
| 20 to 24 Years | 551 (6.9%) | 485 (5.8%) |
| 25 to 29 Years | 409 (5.1%) | 413 (4.9%) |
| 30 to 34 Years | 467 (5.8%) | 411 (4.9%) |
| 35 to 39 Years | 524 (6.5%) | 528 (6.3%) |
| 40 to 44 Years | 420 (5.2%) | 458 (5.5%) |
| 45 to 49 Years | 430 (5.4%) | 447 (5.3%) |
| 50 to 54 Years | 484 (6.0%) | 445 (5.3%) |
| 55 to 59 Years | 419 (5.2%) | 510 (6.1%) |
| 60 to 64 Years | 698 (8.7%) | 639 (7.6%) |
| 65 to 69 Years | 530 (6.6%) | 568 (6.8%) |
| 70 to 74 Years | 400 (5.0%) | 425 (5.1%) |
| 75 to 79 Years | 204 (2.5%) | 357 (4.3%) |
| 80 to 84 Years | 259 (3.2%) | 264 (3.2%) |
| 85 Years and over | 241 (3.0%) | 306 (3.6%) |
| Total | 8,029 (100.0%) | 8,394 (100.0%) |
Families and Households in Clay County
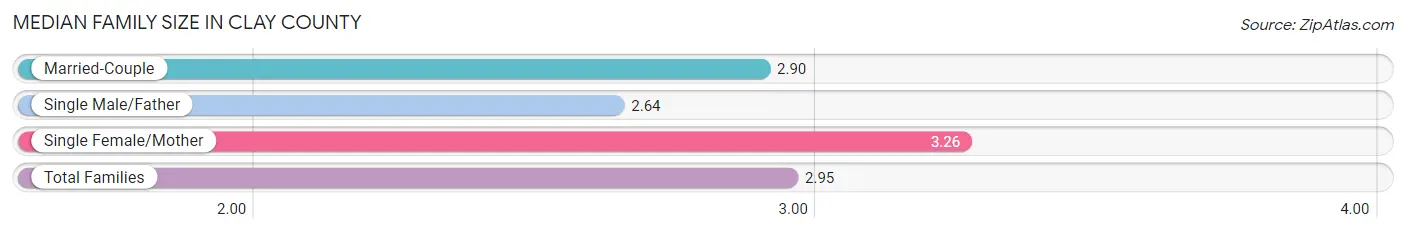
Median Family Size in Clay County
The median family size in Clay County is 2.95 persons per family, with single female/mother families (672 | 16.5%) accounting for the largest median family size of 3.26 persons per family. On the other hand, single male/father families (233 | 5.7%) represent the smallest median family size with 2.64 persons per family.
| Family Type | # Families | Family Size |
| Married-Couple | 3,170 (77.8%) | 2.90 |
| Single Male/Father | 233 (5.7%) | 2.64 |
| Single Female/Mother | 672 (16.5%) | 3.26 |
| Total Families | 4,075 (100.0%) | 2.95 |
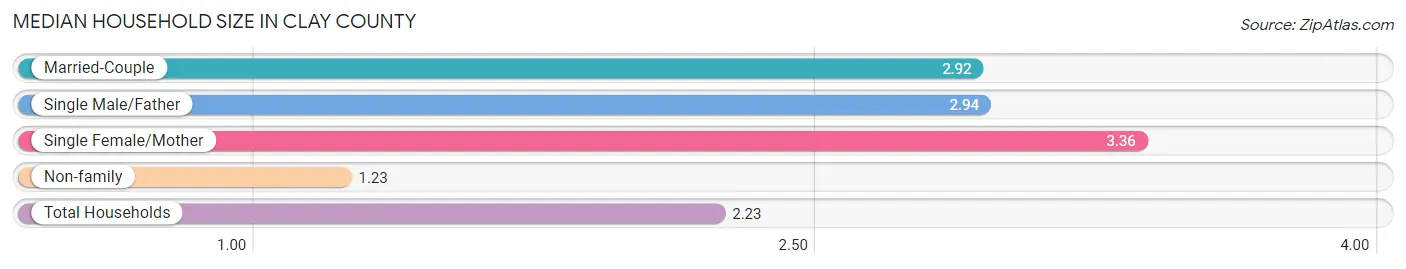
Median Household Size in Clay County
The median household size in Clay County is 2.23 persons per household, with single female/mother households (672 | 9.3%) accounting for the largest median household size of 3.36 persons per household. non-family households (3,150 | 43.6%) represent the smallest median household size with 1.23 persons per household.
| Household Type | # Households | Household Size |
| Married-Couple | 3,170 (43.9%) | 2.92 |
| Single Male/Father | 233 (3.2%) | 2.94 |
| Single Female/Mother | 672 (9.3%) | 3.36 |
| Non-family | 3,150 (43.6%) | 1.23 |
| Total Households | 7,225 (100.0%) | 2.23 |
Household Size by Marriage Status in Clay County
Out of a total of 7,225 households in Clay County, 4,075 (56.4%) are family households, while 3,150 (43.6%) are nonfamily households. The most numerous type of family households are 2-person households, comprising 2,283, and the most common type of nonfamily households are 1-person households, comprising 2,560.
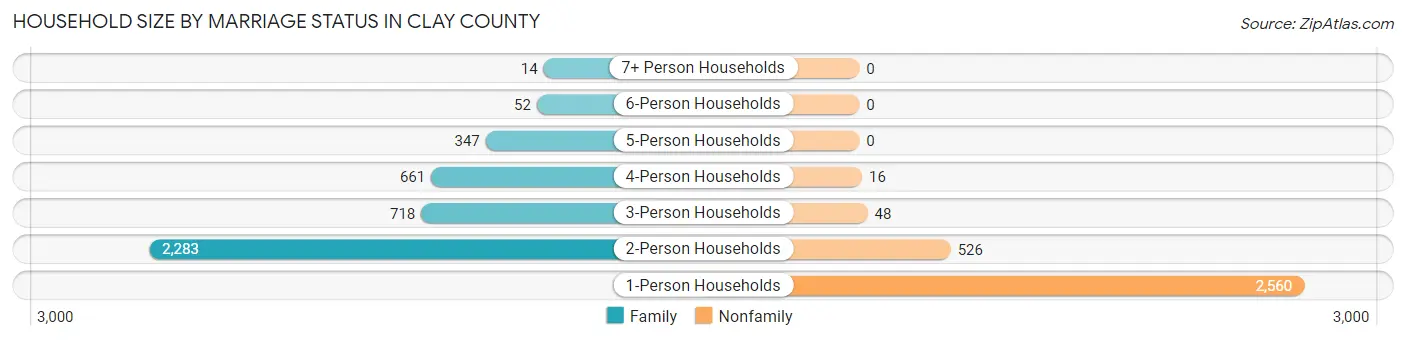
| Household Size | Family Households | Nonfamily Households |
| 1-Person Households | - | 2,560 (35.4%) |
| 2-Person Households | 2,283 (31.6%) | 526 (7.3%) |
| 3-Person Households | 718 (9.9%) | 48 (0.7%) |
| 4-Person Households | 661 (9.1%) | 16 (0.2%) |
| 5-Person Households | 347 (4.8%) | 0 (0.0%) |
| 6-Person Households | 52 (0.7%) | 0 (0.0%) |
| 7+ Person Households | 14 (0.2%) | 0 (0.0%) |
| Total | 4,075 (56.4%) | 3,150 (43.6%) |
Female Fertility in Clay County
Fertility by Age in Clay County
Average fertility rate in Clay County is 29.0 births per 1,000 women. Women in the age bracket of 20 to 34 years have the highest fertility rate with 67.0 births per 1,000 women. Women in the age bracket of 20 to 34 years acount for 90.7% of all women with births.
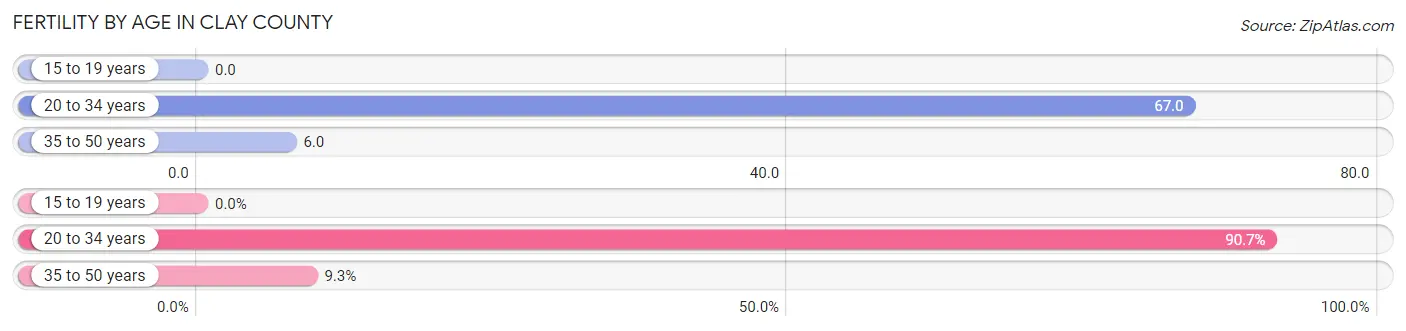
| Age Bracket | Women with Births | Births / 1,000 Women |
| 15 to 19 years | 0 (0.0%) | 0.0 |
| 20 to 34 years | 88 (90.7%) | 67.0 |
| 35 to 50 years | 9 (9.3%) | 6.0 |
| Total | 97 (100.0%) | 29.0 |
Fertility by Age by Marriage Status in Clay County
53.6% of women with births (97) in Clay County are married. The highest percentage of unmarried women with births falls into 20 to 34 years age bracket with 51.1% of them unmarried at the time of birth, while the lowest percentage of unmarried women with births belong to 35 to 50 years age bracket with 0.0% of them unmarried.
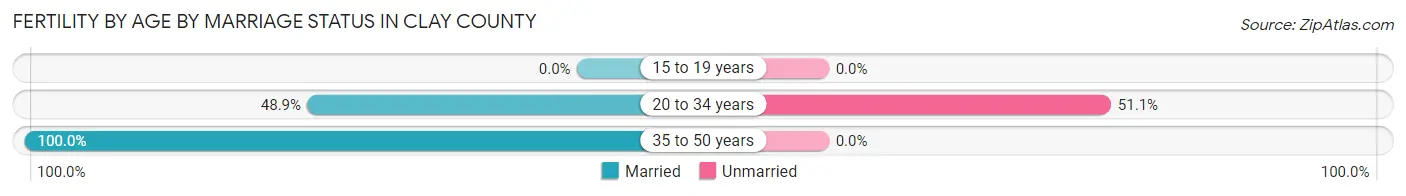
| Age Bracket | Married | Unmarried |
| 15 to 19 years | 0 (0.0%) | 0 (0.0%) |
| 20 to 34 years | 43 (48.9%) | 45 (51.1%) |
| 35 to 50 years | 9 (100.0%) | 0 (0.0%) |
| Total | 52 (53.6%) | 45 (46.4%) |
Fertility by Education in Clay County
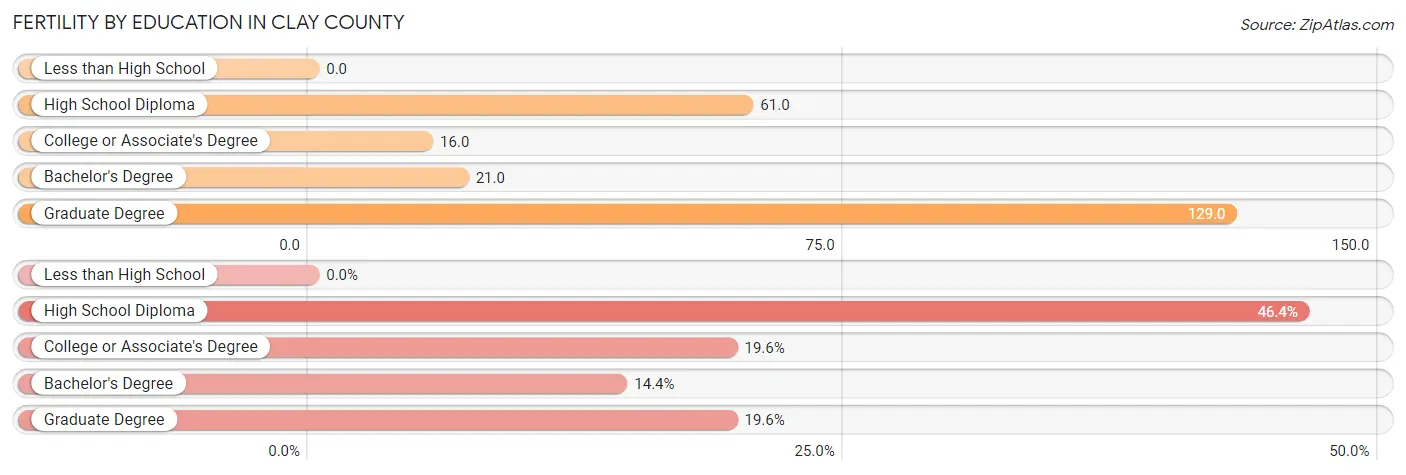
| Educational Attainment | Women with Births | Births / 1,000 Women |
| Less than High School | 0 (0.0%) | 0.0 |
| High School Diploma | 45 (46.4%) | 61.0 |
| College or Associate's Degree | 19 (19.6%) | 16.0 |
| Bachelor's Degree | 14 (14.4%) | 21.0 |
| Graduate Degree | 19 (19.6%) | 129.0 |
| Total | 97 (100.0%) | 29.0 |
Fertility by Education by Marriage Status in Clay County
46.4% of women with births in Clay County are unmarried. Women with the educational attainment of bachelor's degree are most likely to be married with 100.0% of them married at childbirth, while women with the educational attainment of high school diploma are least likely to be married with 93.3% of them unmarried at childbirth.
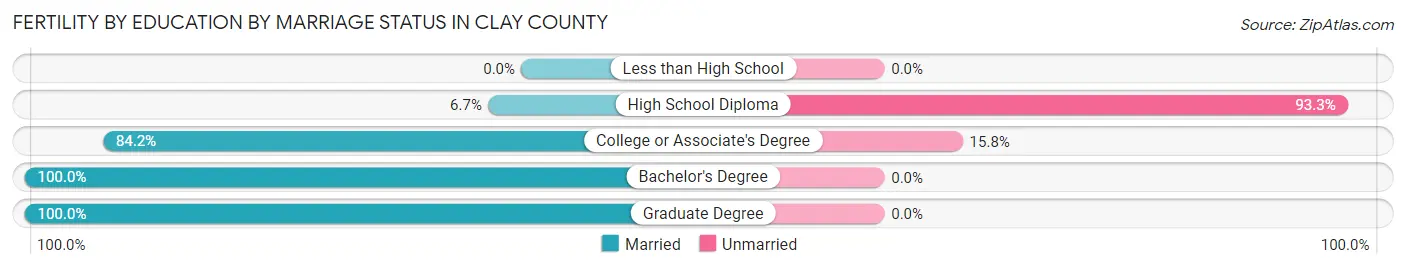
| Educational Attainment | Married | Unmarried |
| Less than High School | 0 (0.0%) | 0 (0.0%) |
| High School Diploma | 3 (6.7%) | 42 (93.3%) |
| College or Associate's Degree | 16 (84.2%) | 3 (15.8%) |
| Bachelor's Degree | 14 (100.0%) | 0 (0.0%) |
| Graduate Degree | 19 (100.0%) | 0 (0.0%) |
| Total | 52 (53.6%) | 45 (46.4%) |
Employment Characteristics in Clay County
Employment by Class of Employer in Clay County
Among the 8,259 employed individuals in Clay County, private company employees (5,638 | 68.3%), local government employees (596 | 7.2%), and self-employed (incorporated) (564 | 6.8%) make up the most common classes of employment.
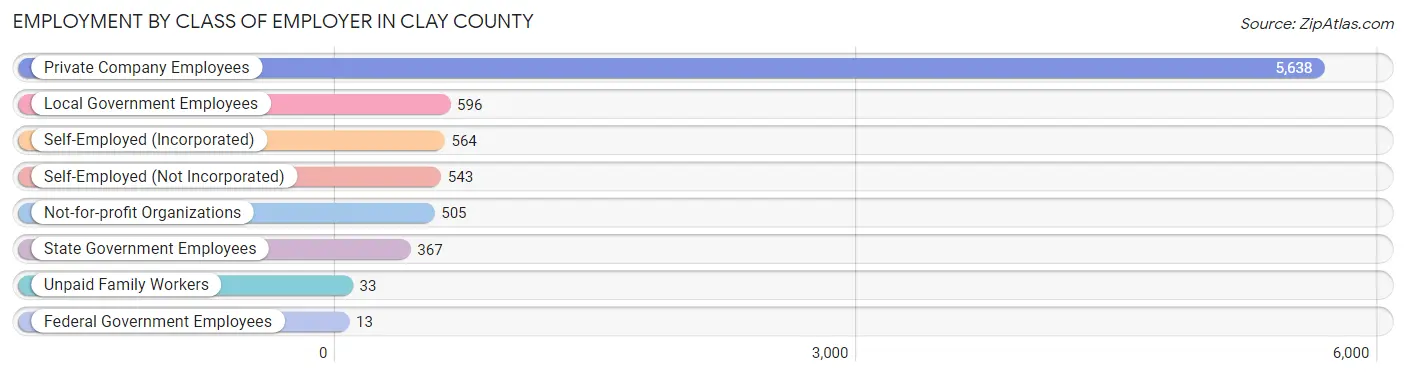
| Employer Class | # Employees | % Employees |
| Private Company Employees | 5,638 | 68.3% |
| Self-Employed (Incorporated) | 564 | 6.8% |
| Self-Employed (Not Incorporated) | 543 | 6.6% |
| Not-for-profit Organizations | 505 | 6.1% |
| Local Government Employees | 596 | 7.2% |
| State Government Employees | 367 | 4.4% |
| Federal Government Employees | 13 | 0.2% |
| Unpaid Family Workers | 33 | 0.4% |
| Total | 8,259 | 100.0% |
Employment Status by Age in Clay County
According to the labor force statistics for Clay County, out of the total population over 16 years of age (13,036), 67.4% or 8,786 individuals are in the labor force, with 4.1% or 360 of them unemployed. The age group with the highest labor force participation rate is 25 to 29 years, with 96.0% or 789 individuals in the labor force. Within the labor force, the 20 to 24 years age range has the highest percentage of unemployed individuals, with 13.6% or 127 of them being unemployed.
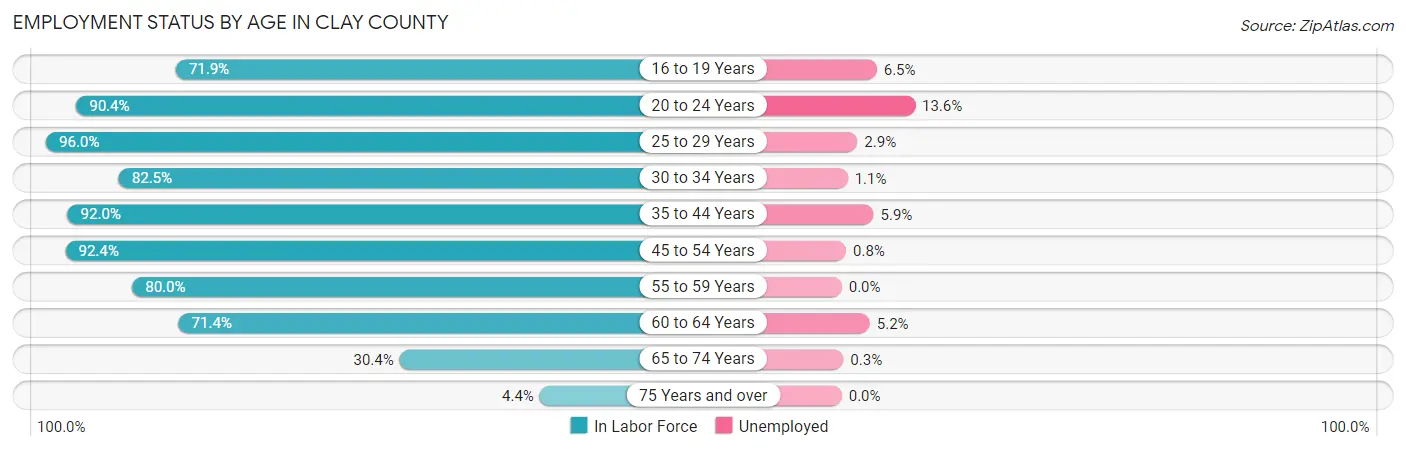
| Age Bracket | In Labor Force | Unemployed |
| 16 to 19 Years | 535 (71.9%) | 35 (6.5%) |
| 20 to 24 Years | 937 (90.4%) | 127 (13.6%) |
| 25 to 29 Years | 789 (96.0%) | 23 (2.9%) |
| 30 to 34 Years | 724 (82.5%) | 8 (1.1%) |
| 35 to 44 Years | 1,776 (92.0%) | 105 (5.9%) |
| 45 to 54 Years | 1,669 (92.4%) | 13 (0.8%) |
| 55 to 59 Years | 743 (80.0%) | 0 (0.0%) |
| 60 to 64 Years | 955 (71.4%) | 50 (5.2%) |
| 65 to 74 Years | 585 (30.4%) | 2 (0.3%) |
| 75 Years and over | 72 (4.4%) | 0 (0.0%) |
| Total | 8,786 (67.4%) | 360 (4.1%) |
Employment Status by Educational Attainment in Clay County
According to labor force statistics for Clay County, 86.4% of individuals (6,655) out of the total population between 25 and 64 years of age (7,702) are in the labor force, with 3.0% or 200 of them being unemployed. The group with the highest labor force participation rate are those with the educational attainment of bachelor's degree or higher, with 90.3% or 2,058 individuals in the labor force. Within the labor force, individuals with high school diploma education have the highest percentage of unemployment, with 3.4% or 55 of them being unemployed.
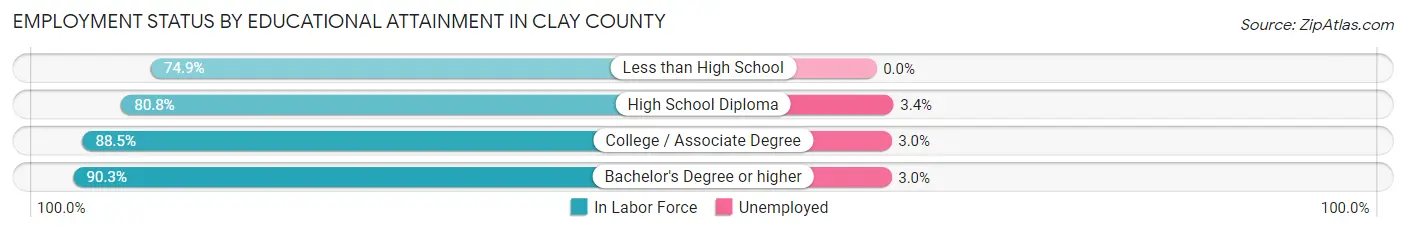
| Educational Attainment | In Labor Force | Unemployed |
| Less than High School | 259 (74.9%) | 0 (0.0%) |
| High School Diploma | 1,610 (80.8%) | 68 (3.4%) |
| College / Associate Degree | 2,729 (88.5%) | 93 (3.0%) |
| Bachelor's Degree or higher | 2,058 (90.3%) | 68 (3.0%) |
| Total | 6,655 (86.4%) | 231 (3.0%) |
Employment Occupations by Sex in Clay County
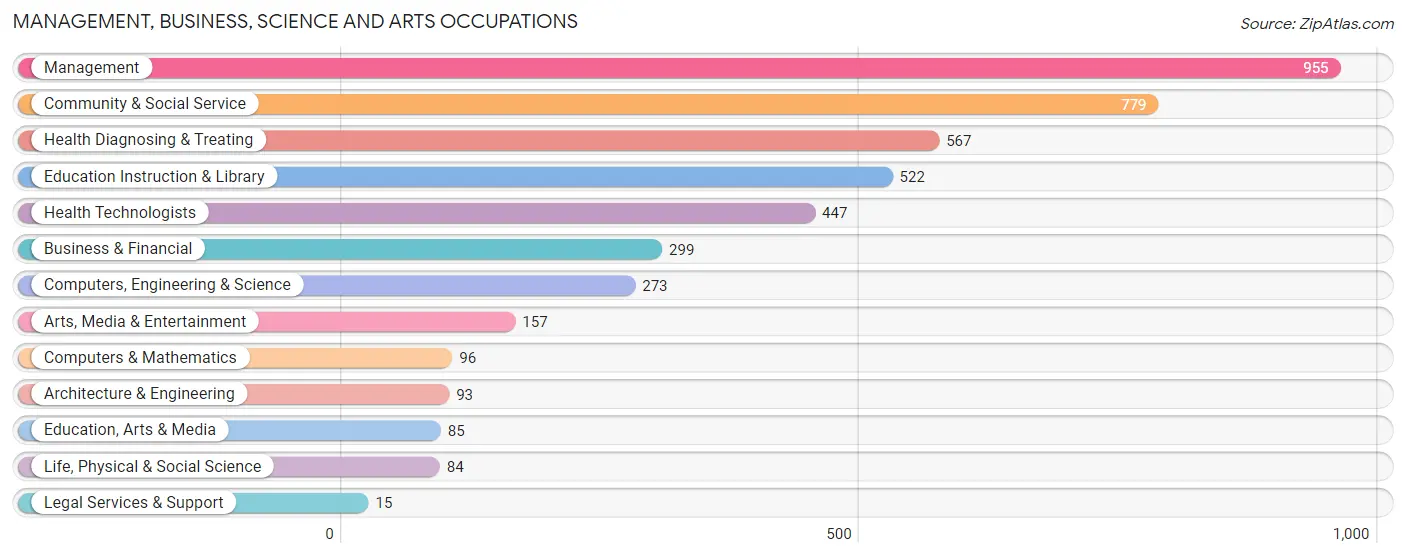
Management, Business, Science and Arts Occupations
The most common Management, Business, Science and Arts occupations in Clay County are Management (955 | 11.3%), Community & Social Service (779 | 9.2%), Health Diagnosing & Treating (567 | 6.7%), Education Instruction & Library (522 | 6.2%), and Health Technologists (447 | 5.3%).
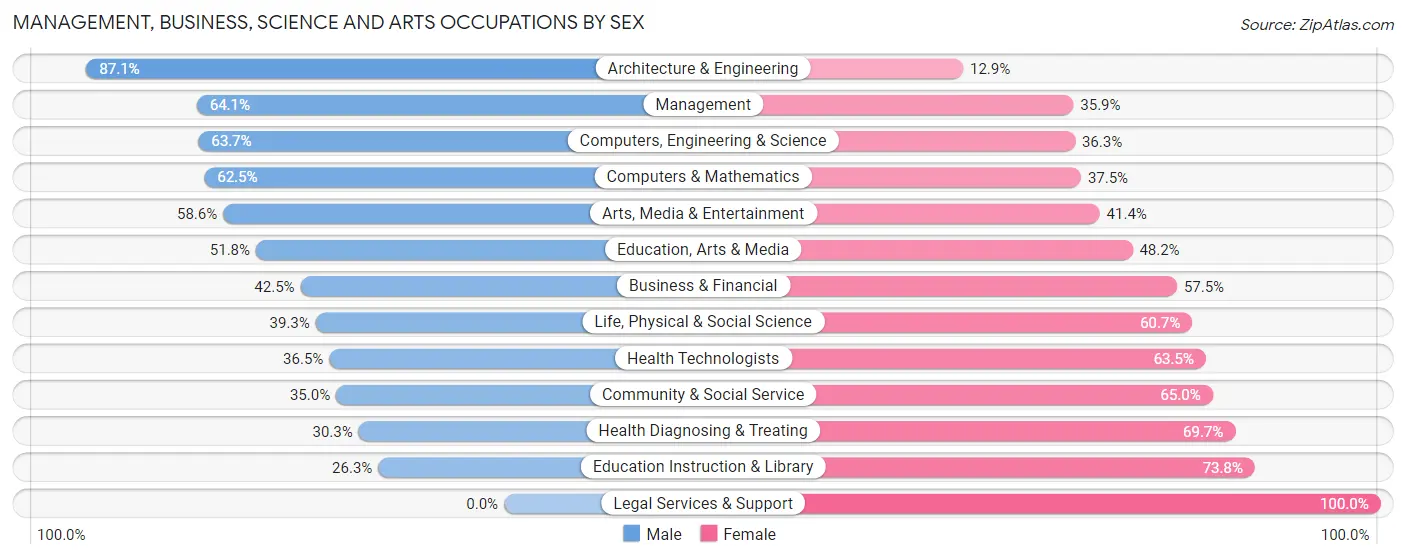
Management, Business, Science and Arts Occupations by Sex
Within the Management, Business, Science and Arts occupations in Clay County, the most male-oriented occupations are Architecture & Engineering (87.1%), Management (64.1%), and Computers, Engineering & Science (63.7%), while the most female-oriented occupations are Legal Services & Support (100.0%), Education Instruction & Library (73.8%), and Health Diagnosing & Treating (69.7%).
| Occupation | Male | Female |
| Management | 612 (64.1%) | 343 (35.9%) |
| Business & Financial | 127 (42.5%) | 172 (57.5%) |
| Computers, Engineering & Science | 174 (63.7%) | 99 (36.3%) |
| Computers & Mathematics | 60 (62.5%) | 36 (37.5%) |
| Architecture & Engineering | 81 (87.1%) | 12 (12.9%) |
| Life, Physical & Social Science | 33 (39.3%) | 51 (60.7%) |
| Community & Social Service | 273 (35.0%) | 506 (65.0%) |
| Education, Arts & Media | 44 (51.8%) | 41 (48.2%) |
| Legal Services & Support | 0 (0.0%) | 15 (100.0%) |
| Education Instruction & Library | 137 (26.3%) | 385 (73.8%) |
| Arts, Media & Entertainment | 92 (58.6%) | 65 (41.4%) |
| Health Diagnosing & Treating | 172 (30.3%) | 395 (69.7%) |
| Health Technologists | 163 (36.5%) | 284 (63.5%) |
| Total (Category) | 1,358 (47.3%) | 1,515 (52.7%) |
| Total (Overall) | 4,432 (52.6%) | 3,988 (47.4%) |
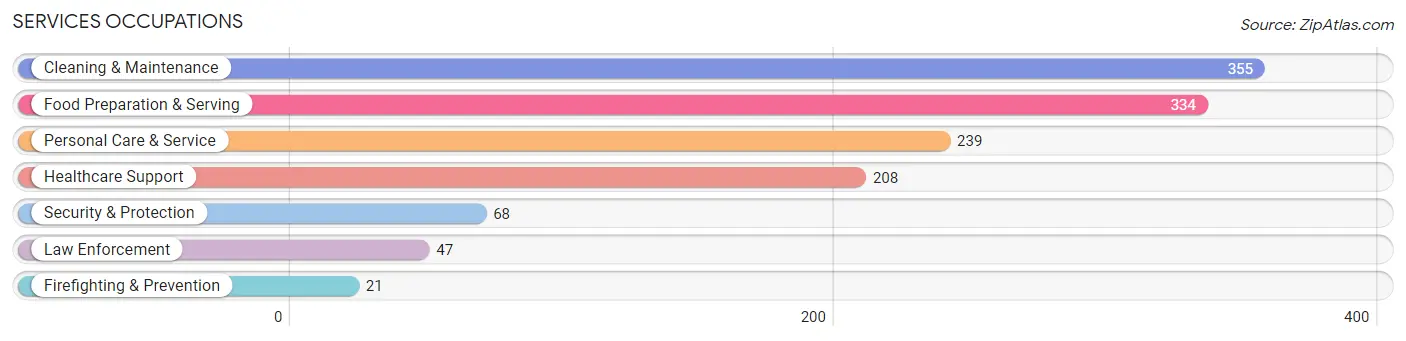
Services Occupations
The most common Services occupations in Clay County are Cleaning & Maintenance (355 | 4.2%), Food Preparation & Serving (334 | 4.0%), Personal Care & Service (239 | 2.8%), Healthcare Support (208 | 2.5%), and Security & Protection (68 | 0.8%).
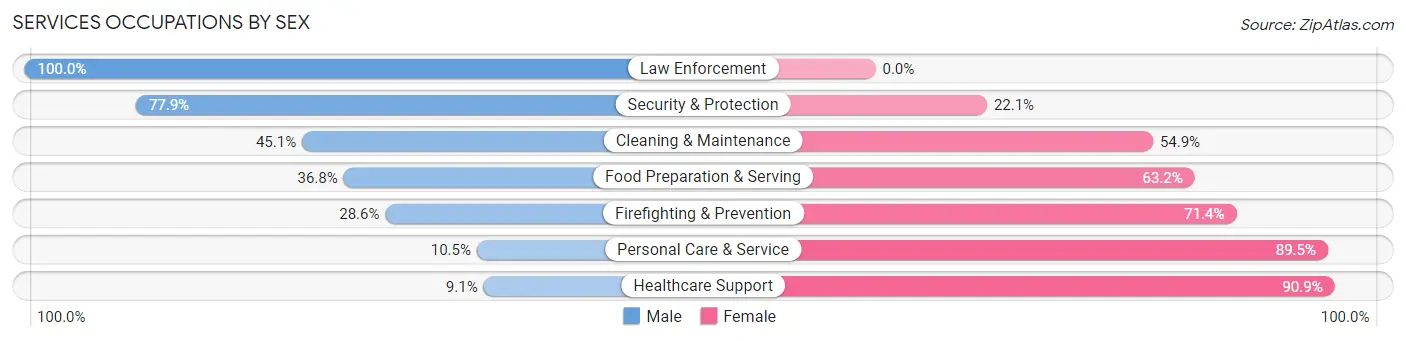
Services Occupations by Sex
Within the Services occupations in Clay County, the most male-oriented occupations are Law Enforcement (100.0%), Security & Protection (77.9%), and Cleaning & Maintenance (45.1%), while the most female-oriented occupations are Healthcare Support (90.9%), Personal Care & Service (89.5%), and Firefighting & Prevention (71.4%).
| Occupation | Male | Female |
| Healthcare Support | 19 (9.1%) | 189 (90.9%) |
| Security & Protection | 53 (77.9%) | 15 (22.1%) |
| Firefighting & Prevention | 6 (28.6%) | 15 (71.4%) |
| Law Enforcement | 47 (100.0%) | 0 (0.0%) |
| Food Preparation & Serving | 123 (36.8%) | 211 (63.2%) |
| Cleaning & Maintenance | 160 (45.1%) | 195 (54.9%) |
| Personal Care & Service | 25 (10.5%) | 214 (89.5%) |
| Total (Category) | 380 (31.6%) | 824 (68.4%) |
| Total (Overall) | 4,432 (52.6%) | 3,988 (47.4%) |
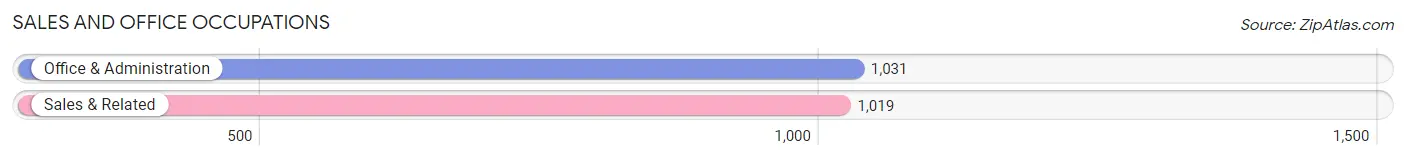
Sales and Office Occupations
The most common Sales and Office occupations in Clay County are Office & Administration (1,031 | 12.2%), and Sales & Related (1,019 | 12.1%).
Sales and Office Occupations by Sex
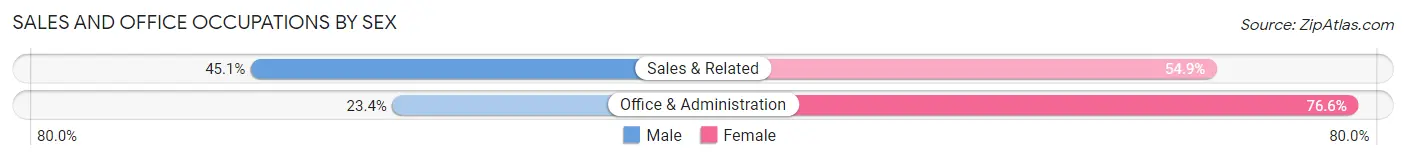
| Occupation | Male | Female |
| Sales & Related | 460 (45.1%) | 559 (54.9%) |
| Office & Administration | 241 (23.4%) | 790 (76.6%) |
| Total (Category) | 701 (34.2%) | 1,349 (65.8%) |
| Total (Overall) | 4,432 (52.6%) | 3,988 (47.4%) |
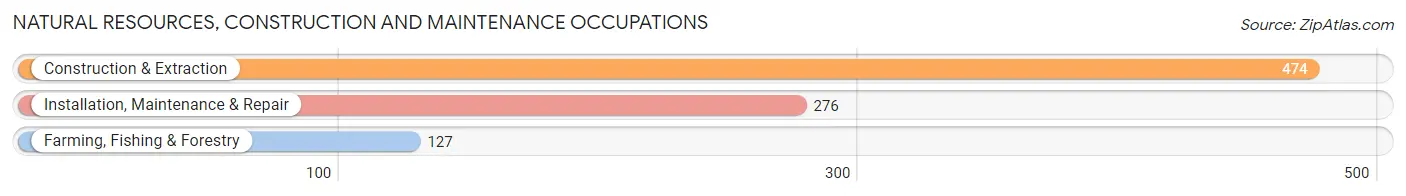
Natural Resources, Construction and Maintenance Occupations
The most common Natural Resources, Construction and Maintenance occupations in Clay County are Construction & Extraction (474 | 5.6%), Installation, Maintenance & Repair (276 | 3.3%), and Farming, Fishing & Forestry (127 | 1.5%).
Natural Resources, Construction and Maintenance Occupations by Sex
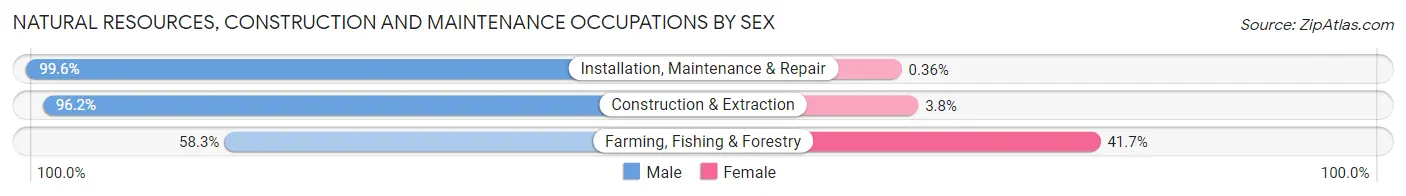
| Occupation | Male | Female |
| Farming, Fishing & Forestry | 74 (58.3%) | 53 (41.7%) |
| Construction & Extraction | 456 (96.2%) | 18 (3.8%) |
| Installation, Maintenance & Repair | 275 (99.6%) | 1 (0.4%) |
| Total (Category) | 805 (91.8%) | 72 (8.2%) |
| Total (Overall) | 4,432 (52.6%) | 3,988 (47.4%) |
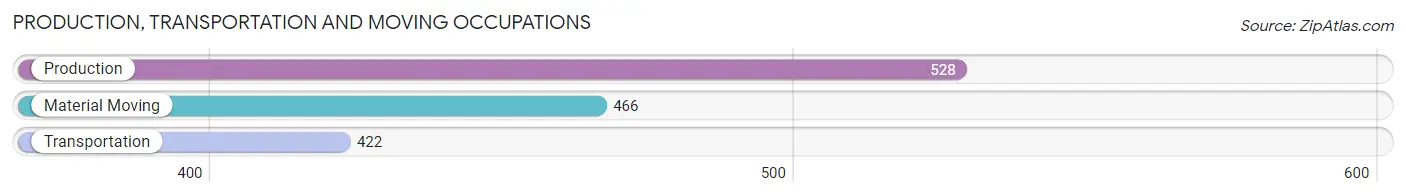
Production, Transportation and Moving Occupations
The most common Production, Transportation and Moving occupations in Clay County are Production (528 | 6.3%), Material Moving (466 | 5.5%), and Transportation (422 | 5.0%).
Production, Transportation and Moving Occupations by Sex
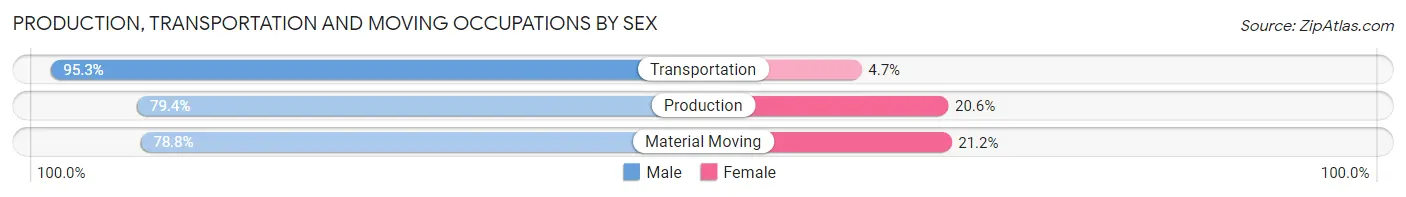
| Occupation | Male | Female |
| Production | 419 (79.4%) | 109 (20.6%) |
| Transportation | 402 (95.3%) | 20 (4.7%) |
| Material Moving | 367 (78.8%) | 99 (21.2%) |
| Total (Category) | 1,188 (83.9%) | 228 (16.1%) |
| Total (Overall) | 4,432 (52.6%) | 3,988 (47.4%) |
Employment Industries by Sex in Clay County
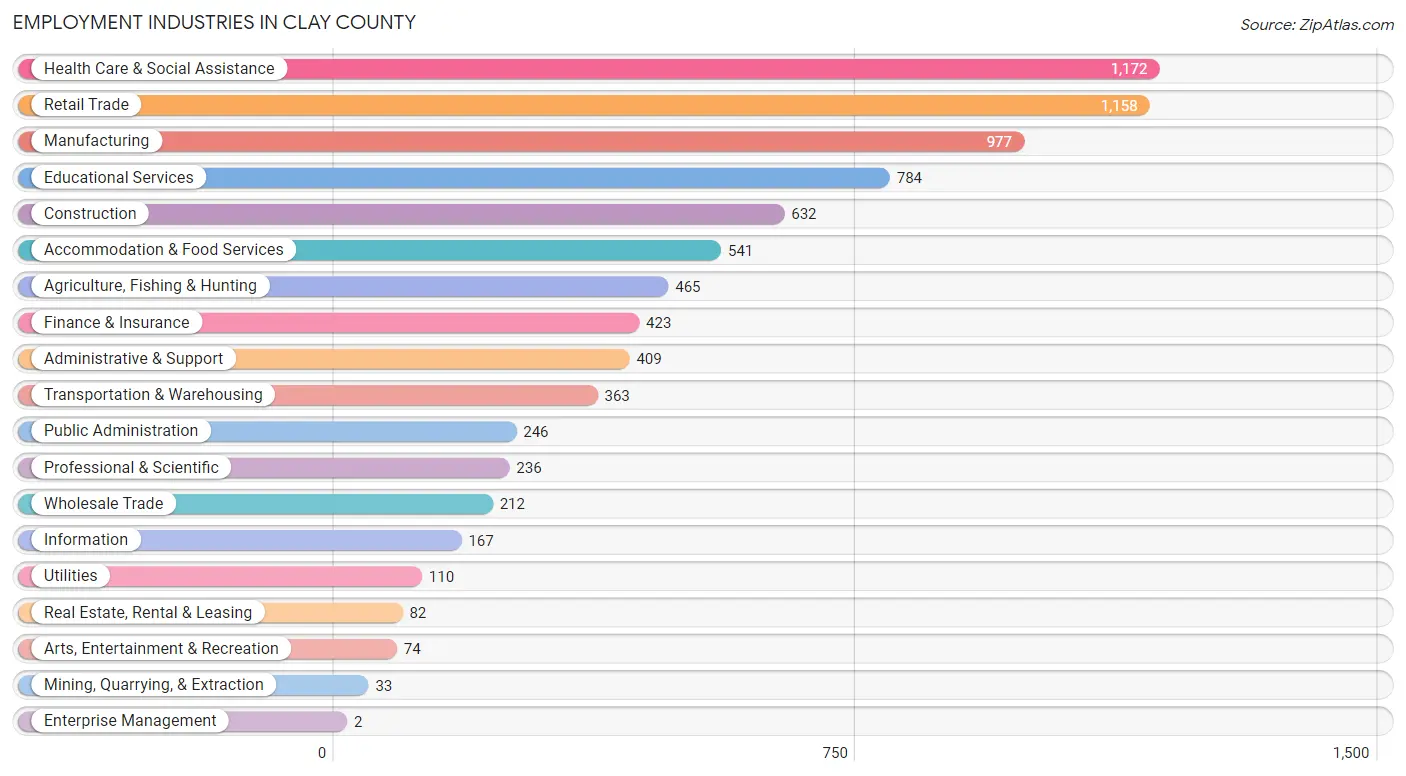
Employment Industries in Clay County
The major employment industries in Clay County include Health Care & Social Assistance (1,172 | 13.9%), Retail Trade (1,158 | 13.8%), Manufacturing (977 | 11.6%), Educational Services (784 | 9.3%), and Construction (632 | 7.5%).
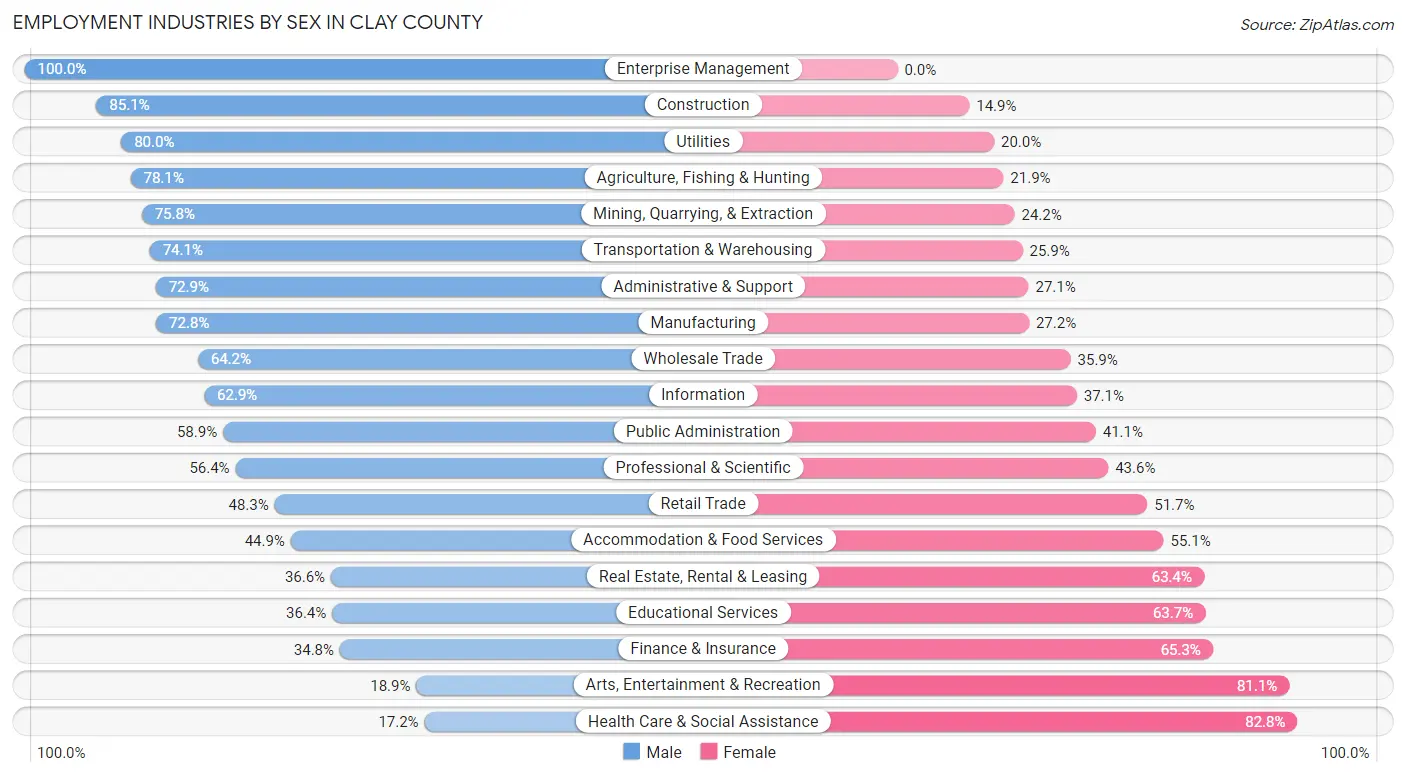
Employment Industries by Sex in Clay County
The Clay County industries that see more men than women are Enterprise Management (100.0%), Construction (85.1%), and Utilities (80.0%), whereas the industries that tend to have a higher number of women are Health Care & Social Assistance (82.8%), Arts, Entertainment & Recreation (81.1%), and Finance & Insurance (65.2%).
| Industry | Male | Female |
| Agriculture, Fishing & Hunting | 363 (78.1%) | 102 (21.9%) |
| Mining, Quarrying, & Extraction | 25 (75.8%) | 8 (24.2%) |
| Construction | 538 (85.1%) | 94 (14.9%) |
| Manufacturing | 711 (72.8%) | 266 (27.2%) |
| Wholesale Trade | 136 (64.1%) | 76 (35.8%) |
| Retail Trade | 559 (48.3%) | 599 (51.7%) |
| Transportation & Warehousing | 269 (74.1%) | 94 (25.9%) |
| Utilities | 88 (80.0%) | 22 (20.0%) |
| Information | 105 (62.9%) | 62 (37.1%) |
| Finance & Insurance | 147 (34.7%) | 276 (65.2%) |
| Real Estate, Rental & Leasing | 30 (36.6%) | 52 (63.4%) |
| Professional & Scientific | 133 (56.4%) | 103 (43.6%) |
| Enterprise Management | 2 (100.0%) | 0 (0.0%) |
| Administrative & Support | 298 (72.9%) | 111 (27.1%) |
| Educational Services | 285 (36.3%) | 499 (63.6%) |
| Health Care & Social Assistance | 202 (17.2%) | 970 (82.8%) |
| Arts, Entertainment & Recreation | 14 (18.9%) | 60 (81.1%) |
| Accommodation & Food Services | 243 (44.9%) | 298 (55.1%) |
| Public Administration | 145 (58.9%) | 101 (41.1%) |
| Total | 4,432 (52.6%) | 3,988 (47.4%) |
Education in Clay County
School Enrollment in Clay County
The most common levels of schooling among the 3,662 students in Clay County are high school (848 | 23.2%), middle school (824 | 22.5%), and elementary school (725 | 19.8%).
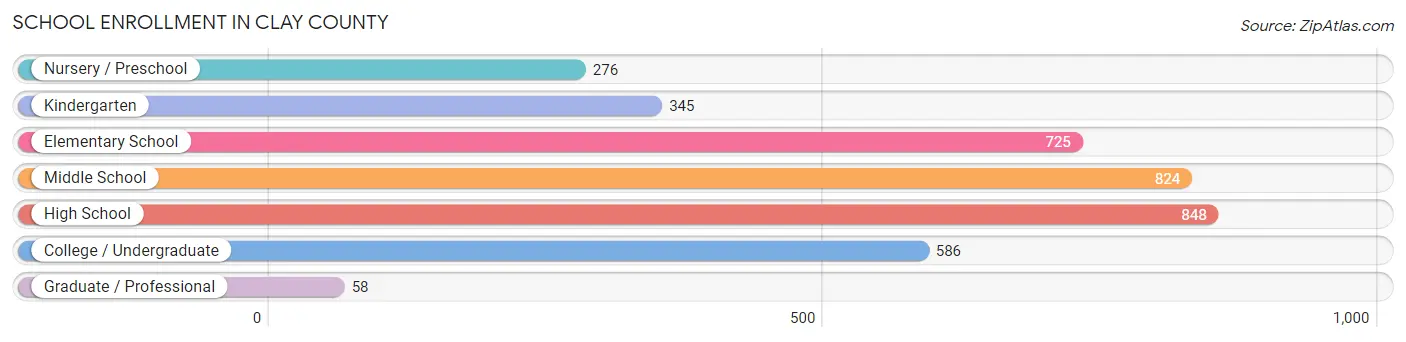
| School Level | # Students | % Students |
| Nursery / Preschool | 276 | 7.5% |
| Kindergarten | 345 | 9.4% |
| Elementary School | 725 | 19.8% |
| Middle School | 824 | 22.5% |
| High School | 848 | 23.2% |
| College / Undergraduate | 586 | 16.0% |
| Graduate / Professional | 58 | 1.6% |
| Total | 3,662 | 100.0% |
School Enrollment by Age by Funding Source in Clay County
Out of a total of 3,662 students who are enrolled in schools in Clay County, 212 (5.8%) attend a private institution, while the remaining 3,450 (94.2%) are enrolled in public schools. The age group of 3 to 4 year olds has the highest likelihood of being enrolled in private schools, with 62 (26.6% in the age bracket) enrolled. Conversely, the age group of 15 to 17 year olds has the lowest likelihood of being enrolled in a private school, with 635 (100.0% in the age bracket) attending a public institution.
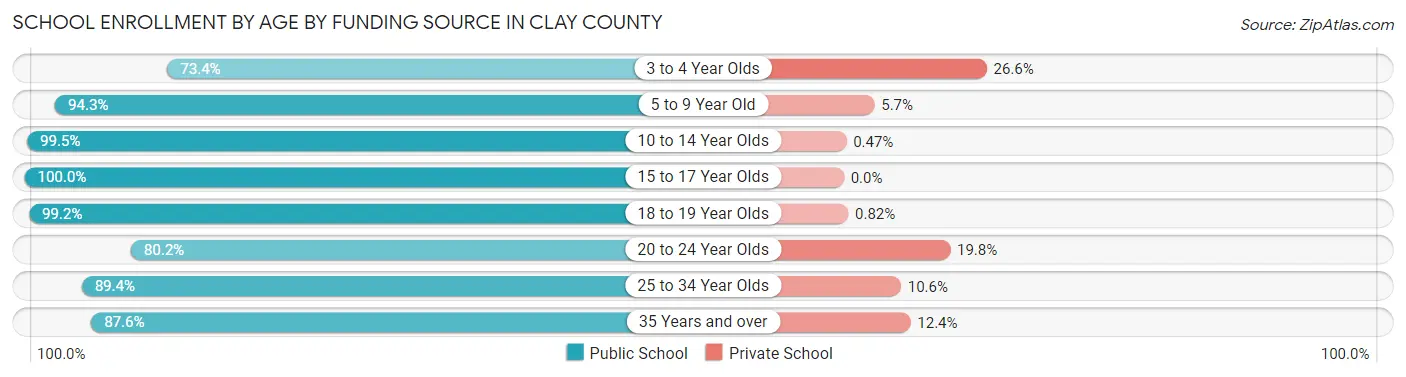
| Age Bracket | Public School | Private School |
| 3 to 4 Year Olds | 171 (73.4%) | 62 (26.6%) |
| 5 to 9 Year Old | 926 (94.3%) | 56 (5.7%) |
| 10 to 14 Year Olds | 1,051 (99.5%) | 5 (0.5%) |
| 15 to 17 Year Olds | 635 (100.0%) | 0 (0.0%) |
| 18 to 19 Year Olds | 241 (99.2%) | 2 (0.8%) |
| 20 to 24 Year Olds | 251 (80.2%) | 62 (19.8%) |
| 25 to 34 Year Olds | 42 (89.4%) | 5 (10.6%) |
| 35 Years and over | 134 (87.6%) | 19 (12.4%) |
| Total | 3,450 (94.2%) | 212 (5.8%) |
Educational Attainment by Field of Study in Clay County
Business (829 | 24.5%), education (615 | 18.2%), bio, nature & agricultural (348 | 10.3%), science & technology (340 | 10.1%), and arts & humanities (241 | 7.1%) are the most common fields of study among 3,380 individuals in Clay County who have obtained a bachelor's degree or higher.
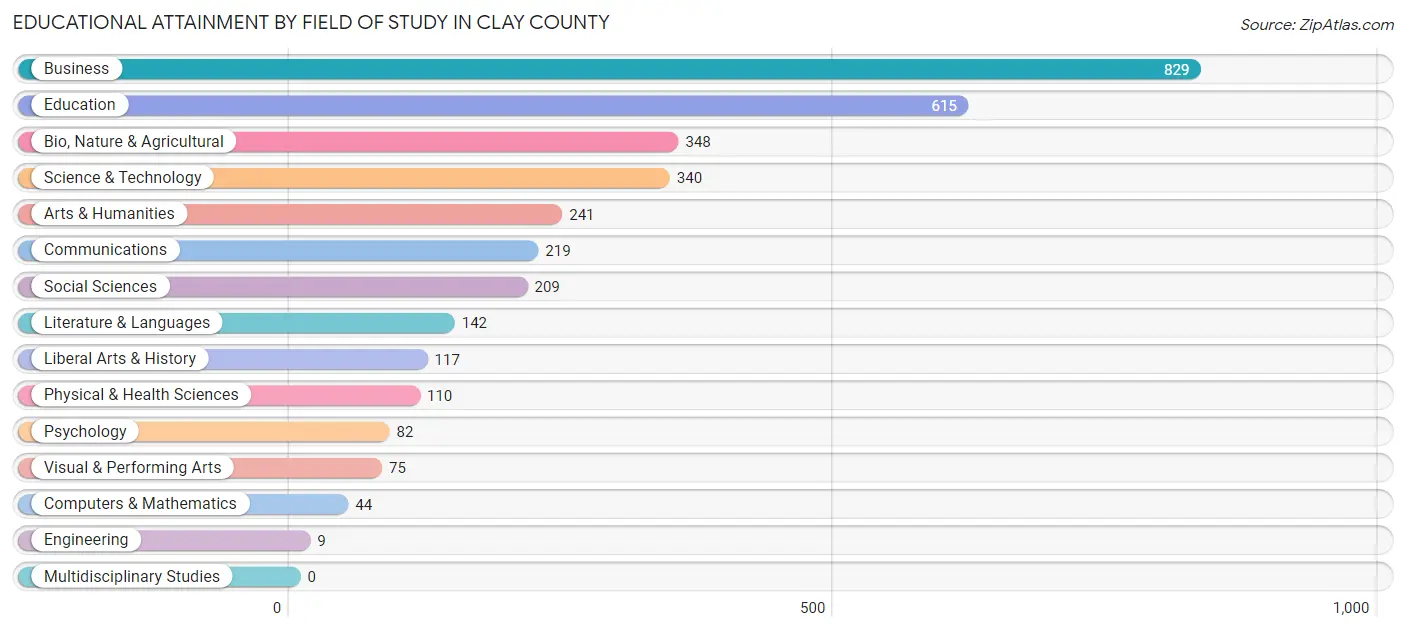
| Field of Study | # Graduates | % Graduates |
| Computers & Mathematics | 44 | 1.3% |
| Bio, Nature & Agricultural | 348 | 10.3% |
| Physical & Health Sciences | 110 | 3.3% |
| Psychology | 82 | 2.4% |
| Social Sciences | 209 | 6.2% |
| Engineering | 9 | 0.3% |
| Multidisciplinary Studies | 0 | 0.0% |
| Science & Technology | 340 | 10.1% |
| Business | 829 | 24.5% |
| Education | 615 | 18.2% |
| Literature & Languages | 142 | 4.2% |
| Liberal Arts & History | 117 | 3.5% |
| Visual & Performing Arts | 75 | 2.2% |
| Communications | 219 | 6.5% |
| Arts & Humanities | 241 | 7.1% |
| Total | 3,380 | 100.0% |
Transportation & Commute in Clay County
Vehicle Availability by Sex in Clay County
The most prevalent vehicle ownership categories in Clay County are males with 2 vehicles (2,169, accounting for 49.7%) and females with 2 vehicles (1,484, making up 56.5%).
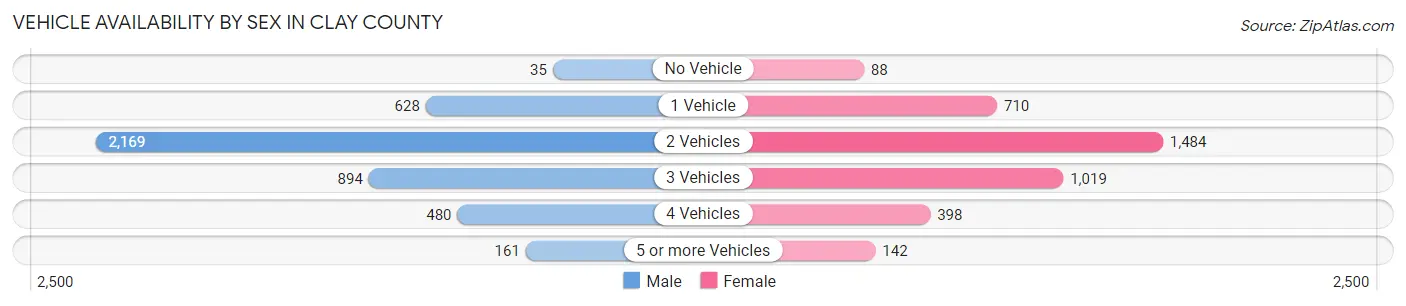
| Vehicles Available | Male | Female |
| No Vehicle | 35 (0.8%) | 88 (2.3%) |
| 1 Vehicle | 628 (14.4%) | 710 (18.5%) |
| 2 Vehicles | 2,169 (49.7%) | 1,484 (38.6%) |
| 3 Vehicles | 894 (20.5%) | 1,019 (26.5%) |
| 4 Vehicles | 480 (11.0%) | 398 (10.4%) |
| 5 or more Vehicles | 161 (3.7%) | 142 (3.7%) |
| Total | 4,367 (100.0%) | 3,841 (100.0%) |
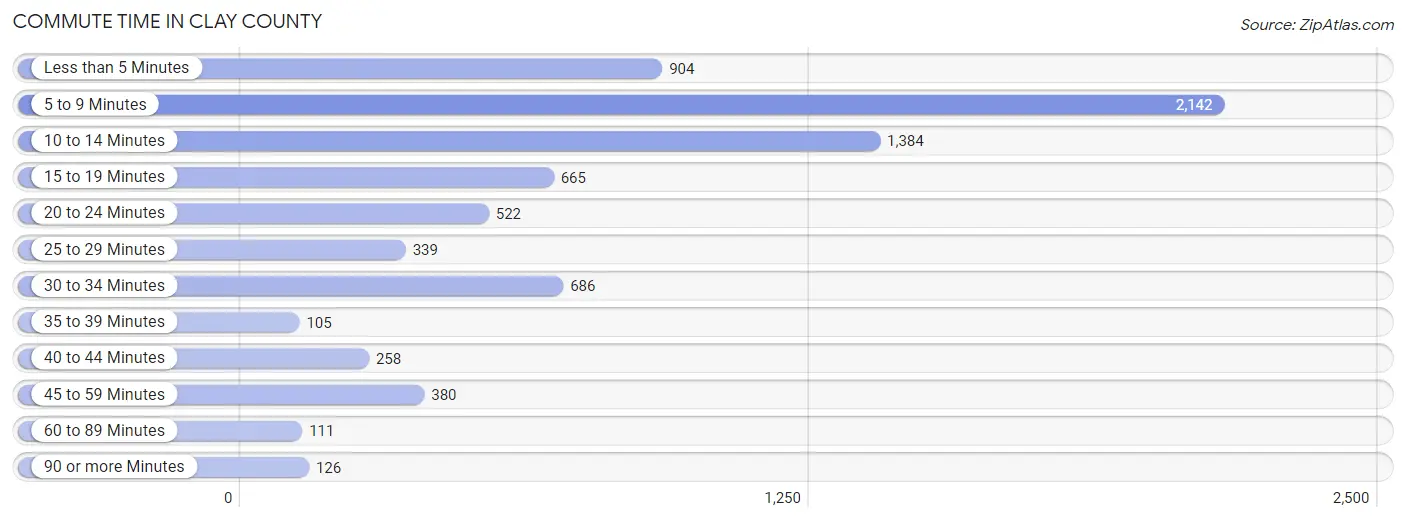
Commute Time in Clay County
The most frequently occuring commute durations in Clay County are 5 to 9 minutes (2,142 commuters, 28.1%), 10 to 14 minutes (1,384 commuters, 18.2%), and less than 5 minutes (904 commuters, 11.9%).
| Commute Time | # Commuters | % Commuters |
| Less than 5 Minutes | 904 | 11.9% |
| 5 to 9 Minutes | 2,142 | 28.1% |
| 10 to 14 Minutes | 1,384 | 18.2% |
| 15 to 19 Minutes | 665 | 8.7% |
| 20 to 24 Minutes | 522 | 6.9% |
| 25 to 29 Minutes | 339 | 4.4% |
| 30 to 34 Minutes | 686 | 9.0% |
| 35 to 39 Minutes | 105 | 1.4% |
| 40 to 44 Minutes | 258 | 3.4% |
| 45 to 59 Minutes | 380 | 5.0% |
| 60 to 89 Minutes | 111 | 1.5% |
| 90 or more Minutes | 126 | 1.7% |
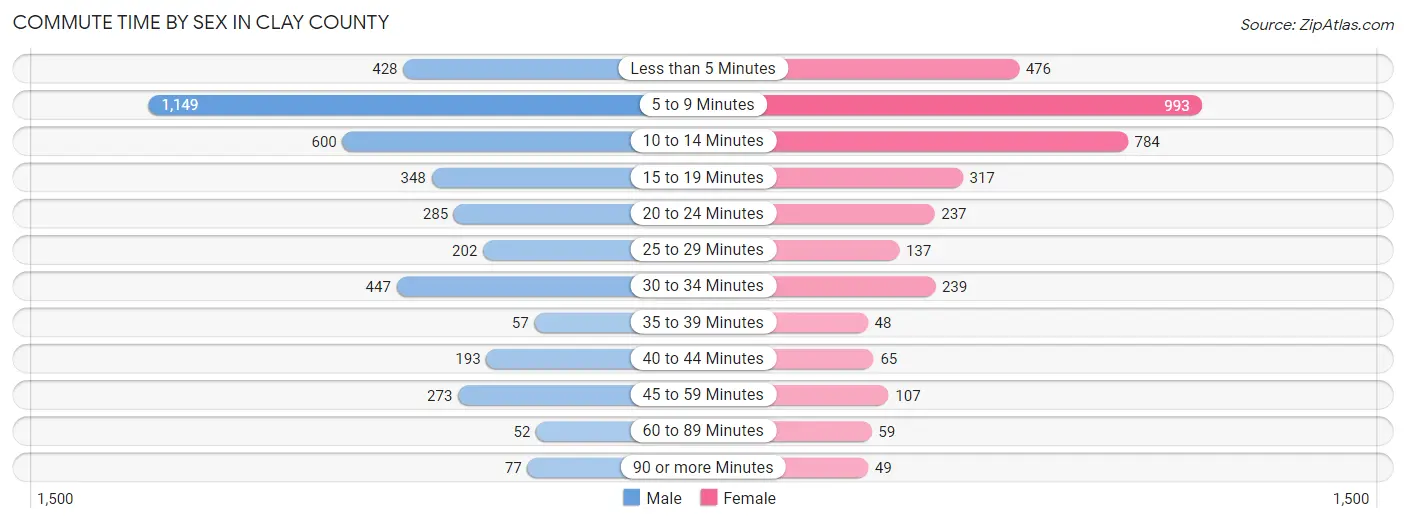
Commute Time by Sex in Clay County
The most common commute times in Clay County are 5 to 9 minutes (1,149 commuters, 28.0%) for males and 5 to 9 minutes (993 commuters, 28.3%) for females.
| Commute Time | Male | Female |
| Less than 5 Minutes | 428 (10.4%) | 476 (13.6%) |
| 5 to 9 Minutes | 1,149 (28.0%) | 993 (28.3%) |
| 10 to 14 Minutes | 600 (14.6%) | 784 (22.3%) |
| 15 to 19 Minutes | 348 (8.5%) | 317 (9.0%) |
| 20 to 24 Minutes | 285 (6.9%) | 237 (6.8%) |
| 25 to 29 Minutes | 202 (4.9%) | 137 (3.9%) |
| 30 to 34 Minutes | 447 (10.9%) | 239 (6.8%) |
| 35 to 39 Minutes | 57 (1.4%) | 48 (1.4%) |
| 40 to 44 Minutes | 193 (4.7%) | 65 (1.8%) |
| 45 to 59 Minutes | 273 (6.6%) | 107 (3.0%) |
| 60 to 89 Minutes | 52 (1.3%) | 59 (1.7%) |
| 90 or more Minutes | 77 (1.9%) | 49 (1.4%) |
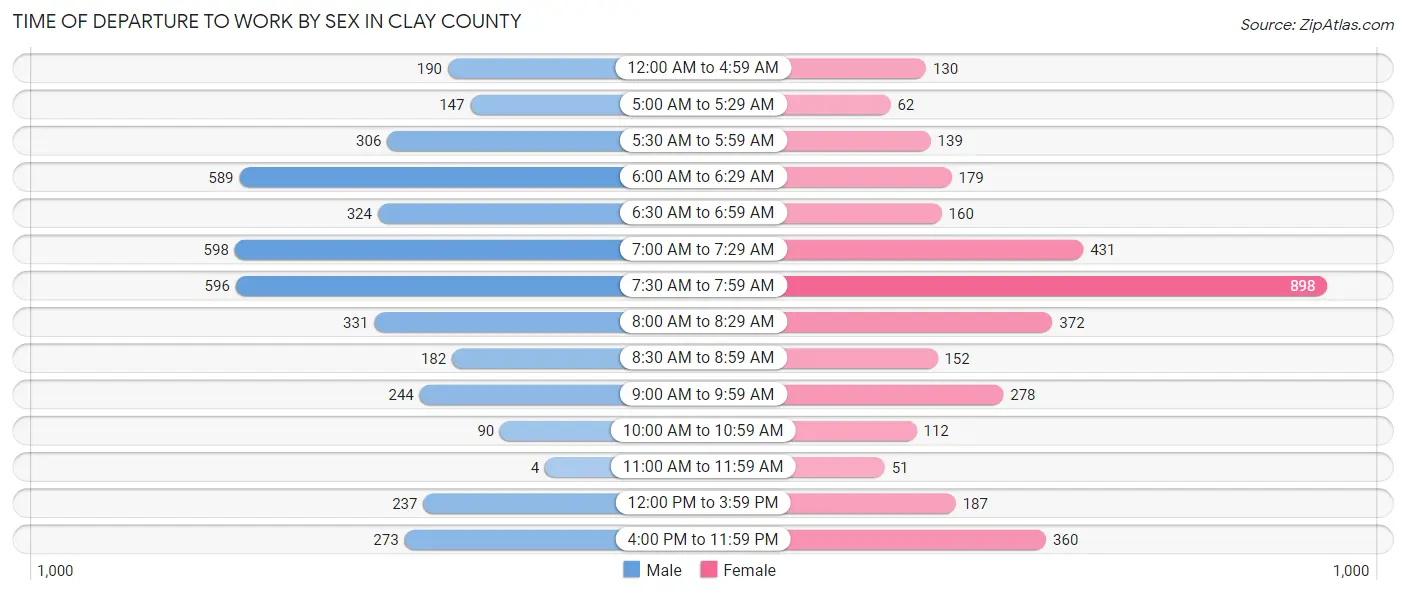
Time of Departure to Work by Sex in Clay County
The most frequent times of departure to work in Clay County are 7:00 AM to 7:29 AM (598, 14.5%) for males and 7:30 AM to 7:59 AM (898, 25.6%) for females.
| Time of Departure | Male | Female |
| 12:00 AM to 4:59 AM | 190 (4.6%) | 130 (3.7%) |
| 5:00 AM to 5:29 AM | 147 (3.6%) | 62 (1.8%) |
| 5:30 AM to 5:59 AM | 306 (7.4%) | 139 (4.0%) |
| 6:00 AM to 6:29 AM | 589 (14.3%) | 179 (5.1%) |
| 6:30 AM to 6:59 AM | 324 (7.9%) | 160 (4.6%) |
| 7:00 AM to 7:29 AM | 598 (14.5%) | 431 (12.3%) |
| 7:30 AM to 7:59 AM | 596 (14.5%) | 898 (25.6%) |
| 8:00 AM to 8:29 AM | 331 (8.1%) | 372 (10.6%) |
| 8:30 AM to 8:59 AM | 182 (4.4%) | 152 (4.3%) |
| 9:00 AM to 9:59 AM | 244 (5.9%) | 278 (7.9%) |
| 10:00 AM to 10:59 AM | 90 (2.2%) | 112 (3.2%) |
| 11:00 AM to 11:59 AM | 4 (0.1%) | 51 (1.5%) |
| 12:00 PM to 3:59 PM | 237 (5.8%) | 187 (5.3%) |
| 4:00 PM to 11:59 PM | 273 (6.6%) | 360 (10.2%) |
| Total | 4,111 (100.0%) | 3,511 (100.0%) |
Housing Occupancy in Clay County
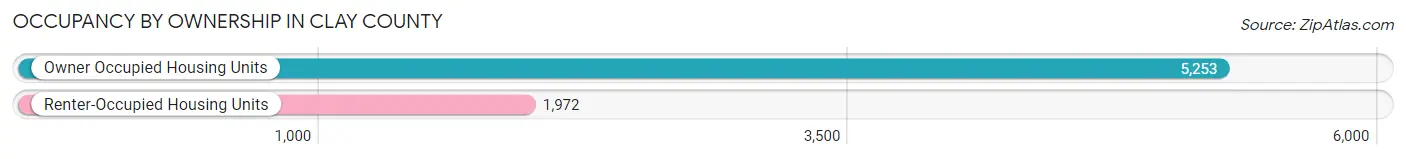
Occupancy by Ownership in Clay County
Of the total 7,225 dwellings in Clay County, owner-occupied units account for 5,253 (72.7%), while renter-occupied units make up 1,972 (27.3%).
| Occupancy | # Housing Units | % Housing Units |
| Owner Occupied Housing Units | 5,253 | 72.7% |
| Renter-Occupied Housing Units | 1,972 | 27.3% |
| Total Occupied Housing Units | 7,225 | 100.0% |
Occupancy by Household Size in Clay County
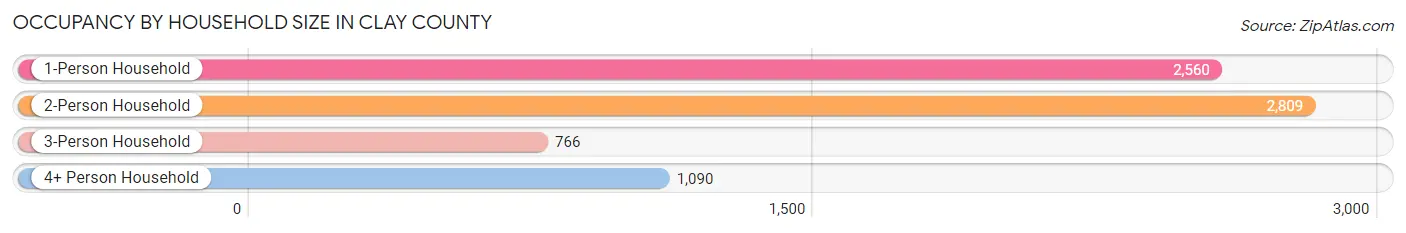
| Household Size | # Housing Units | % Housing Units |
| 1-Person Household | 2,560 | 35.4% |
| 2-Person Household | 2,809 | 38.9% |
| 3-Person Household | 766 | 10.6% |
| 4+ Person Household | 1,090 | 15.1% |
| Total Housing Units | 7,225 | 100.0% |
Occupancy by Ownership by Household Size in Clay County
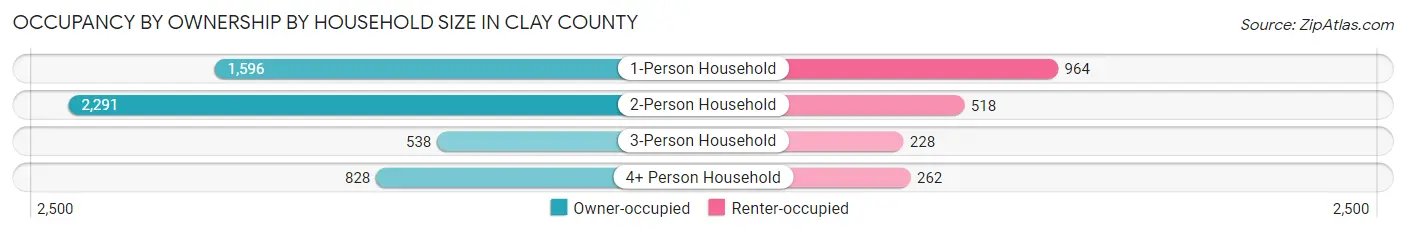
| Household Size | Owner-occupied | Renter-occupied |
| 1-Person Household | 1,596 (62.3%) | 964 (37.7%) |
| 2-Person Household | 2,291 (81.6%) | 518 (18.4%) |
| 3-Person Household | 538 (70.2%) | 228 (29.8%) |
| 4+ Person Household | 828 (76.0%) | 262 (24.0%) |
| Total Housing Units | 5,253 (72.7%) | 1,972 (27.3%) |
Occupancy by Educational Attainment in Clay County
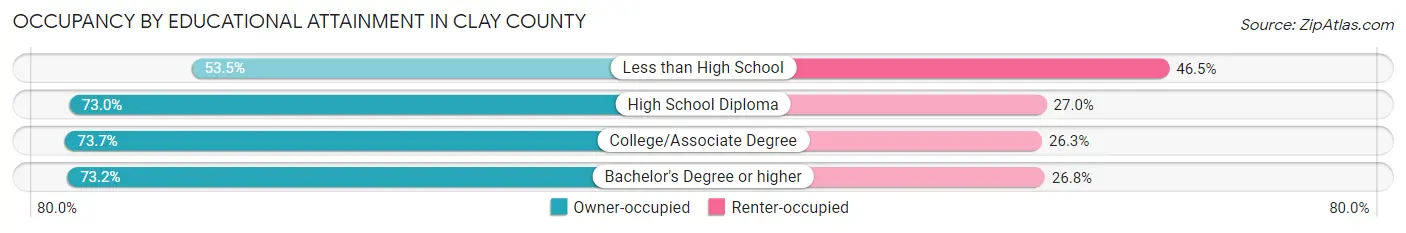
| Household Size | Owner-occupied | Renter-occupied |
| Less than High School | 122 (53.5%) | 106 (46.5%) |
| High School Diploma | 1,592 (73.0%) | 590 (27.0%) |
| College/Associate Degree | 2,083 (73.7%) | 744 (26.3%) |
| Bachelor's Degree or higher | 1,456 (73.2%) | 532 (26.8%) |
Occupancy by Age of Householder in Clay County
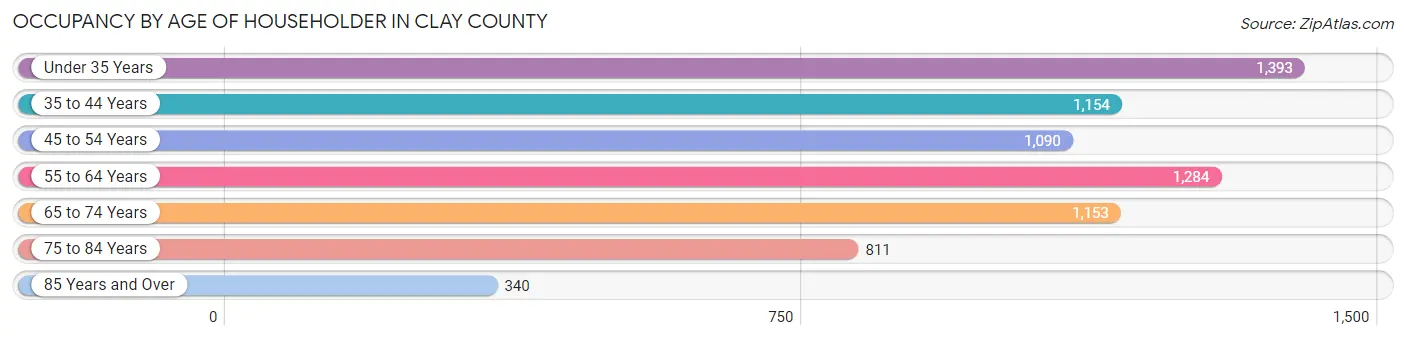
| Age Bracket | # Households | % Households |
| Under 35 Years | 1,393 | 19.3% |
| 35 to 44 Years | 1,154 | 16.0% |
| 45 to 54 Years | 1,090 | 15.1% |
| 55 to 64 Years | 1,284 | 17.8% |
| 65 to 74 Years | 1,153 | 16.0% |
| 75 to 84 Years | 811 | 11.2% |
| 85 Years and Over | 340 | 4.7% |
| Total | 7,225 | 100.0% |
Housing Finances in Clay County
Median Income by Occupancy in Clay County
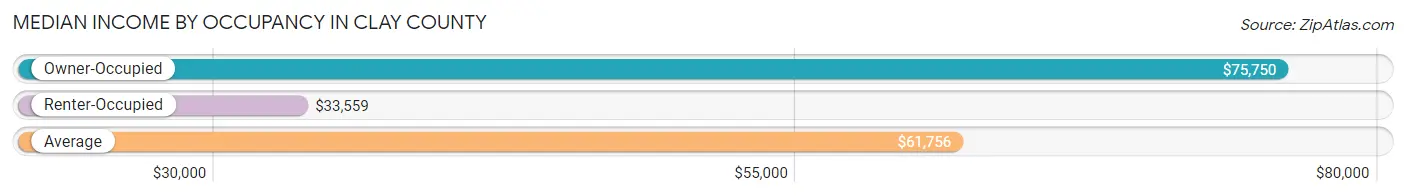
| Occupancy Type | # Households | Median Income |
| Owner-Occupied | 5,253 (72.7%) | $75,750 |
| Renter-Occupied | 1,972 (27.3%) | $33,559 |
| Average | 7,225 (100.0%) | $61,756 |
Occupancy by Householder Income Bracket in Clay County
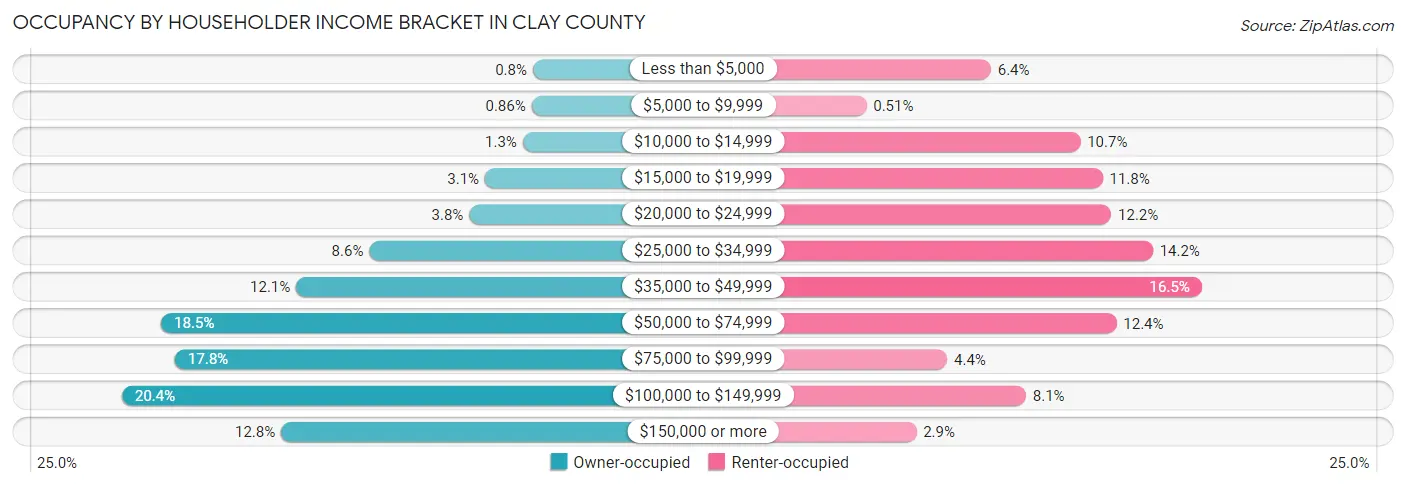
| Income Bracket | Owner-occupied | Renter-occupied |
| Less than $5,000 | 42 (0.8%) | 127 (6.4%) |
| $5,000 to $9,999 | 45 (0.9%) | 10 (0.5%) |
| $10,000 to $14,999 | 67 (1.3%) | 211 (10.7%) |
| $15,000 to $19,999 | 162 (3.1%) | 232 (11.8%) |
| $20,000 to $24,999 | 201 (3.8%) | 240 (12.2%) |
| $25,000 to $34,999 | 451 (8.6%) | 279 (14.1%) |
| $35,000 to $49,999 | 634 (12.1%) | 325 (16.5%) |
| $50,000 to $74,999 | 972 (18.5%) | 245 (12.4%) |
| $75,000 to $99,999 | 937 (17.8%) | 86 (4.4%) |
| $100,000 to $149,999 | 1,070 (20.4%) | 160 (8.1%) |
| $150,000 or more | 672 (12.8%) | 57 (2.9%) |
| Total | 5,253 (100.0%) | 1,972 (100.0%) |
Monthly Housing Cost Tiers in Clay County
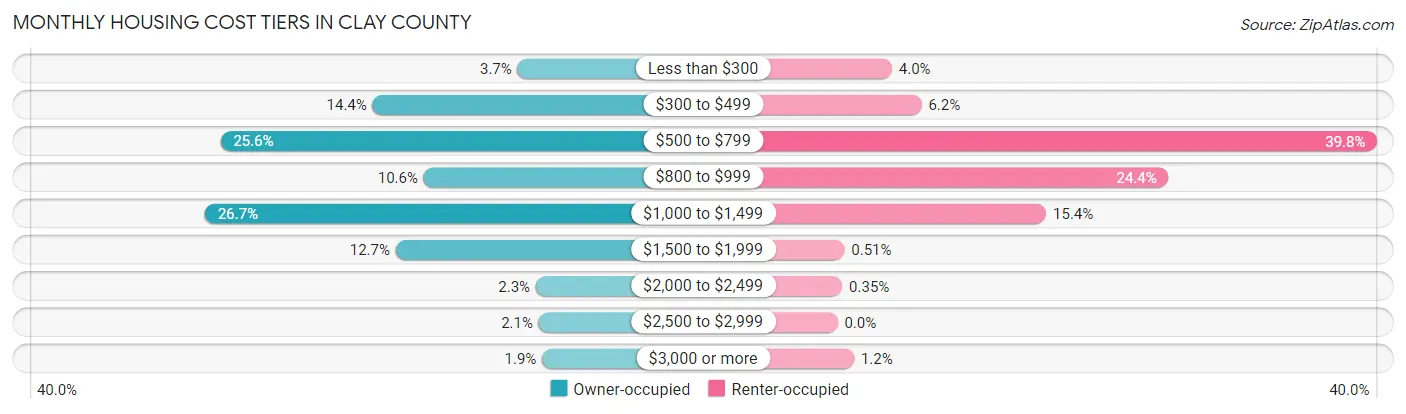
| Monthly Cost | Owner-occupied | Renter-occupied |
| Less than $300 | 194 (3.7%) | 79 (4.0%) |
| $300 to $499 | 755 (14.4%) | 122 (6.2%) |
| $500 to $799 | 1,344 (25.6%) | 784 (39.8%) |
| $800 to $999 | 557 (10.6%) | 481 (24.4%) |
| $1,000 to $1,499 | 1,404 (26.7%) | 303 (15.4%) |
| $1,500 to $1,999 | 665 (12.7%) | 10 (0.5%) |
| $2,000 to $2,499 | 123 (2.3%) | 7 (0.4%) |
| $2,500 to $2,999 | 112 (2.1%) | 0 (0.0%) |
| $3,000 or more | 99 (1.9%) | 24 (1.2%) |
| Total | 5,253 (100.0%) | 1,972 (100.0%) |
Physical Housing Characteristics in Clay County
Housing Structures in Clay County
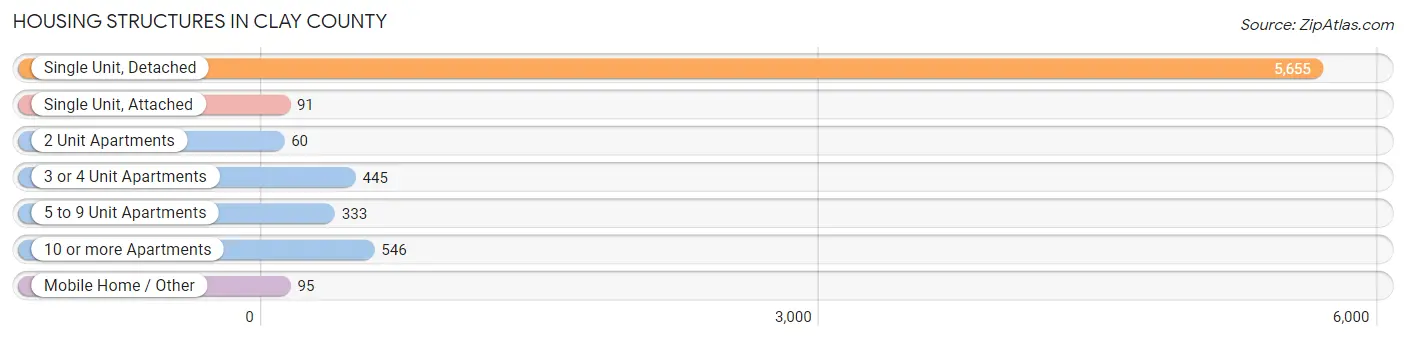
| Structure Type | # Housing Units | % Housing Units |
| Single Unit, Detached | 5,655 | 78.3% |
| Single Unit, Attached | 91 | 1.3% |
| 2 Unit Apartments | 60 | 0.8% |
| 3 or 4 Unit Apartments | 445 | 6.2% |
| 5 to 9 Unit Apartments | 333 | 4.6% |
| 10 or more Apartments | 546 | 7.6% |
| Mobile Home / Other | 95 | 1.3% |
| Total | 7,225 | 100.0% |
Housing Structures by Occupancy in Clay County
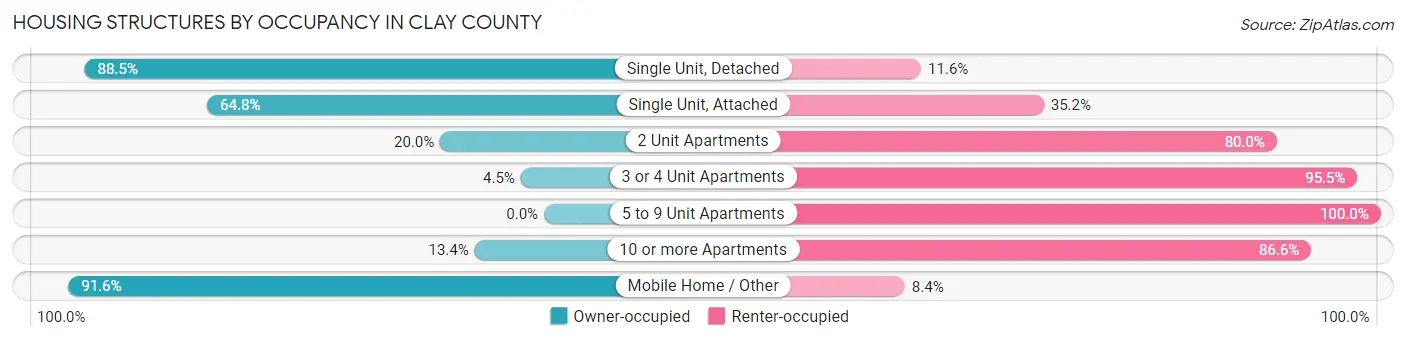
| Structure Type | Owner-occupied | Renter-occupied |
| Single Unit, Detached | 5,002 (88.4%) | 653 (11.6%) |
| Single Unit, Attached | 59 (64.8%) | 32 (35.2%) |
| 2 Unit Apartments | 12 (20.0%) | 48 (80.0%) |
| 3 or 4 Unit Apartments | 20 (4.5%) | 425 (95.5%) |
| 5 to 9 Unit Apartments | 0 (0.0%) | 333 (100.0%) |
| 10 or more Apartments | 73 (13.4%) | 473 (86.6%) |
| Mobile Home / Other | 87 (91.6%) | 8 (8.4%) |
| Total | 5,253 (72.7%) | 1,972 (27.3%) |
Housing Structures by Number of Rooms in Clay County
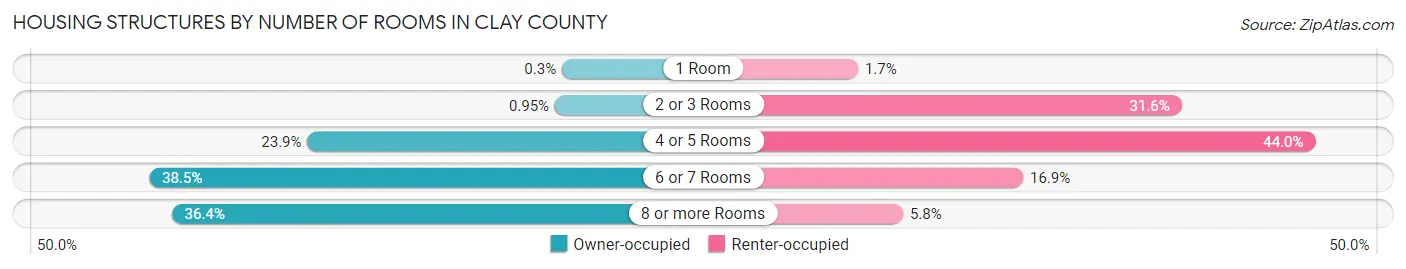
| Number of Rooms | Owner-occupied | Renter-occupied |
| 1 Room | 16 (0.3%) | 33 (1.7%) |
| 2 or 3 Rooms | 50 (0.9%) | 623 (31.6%) |
| 4 or 5 Rooms | 1,253 (23.8%) | 867 (44.0%) |
| 6 or 7 Rooms | 2,022 (38.5%) | 334 (16.9%) |
| 8 or more Rooms | 1,912 (36.4%) | 115 (5.8%) |
| Total | 5,253 (100.0%) | 1,972 (100.0%) |
Housing Structure by Heating Type in Clay County
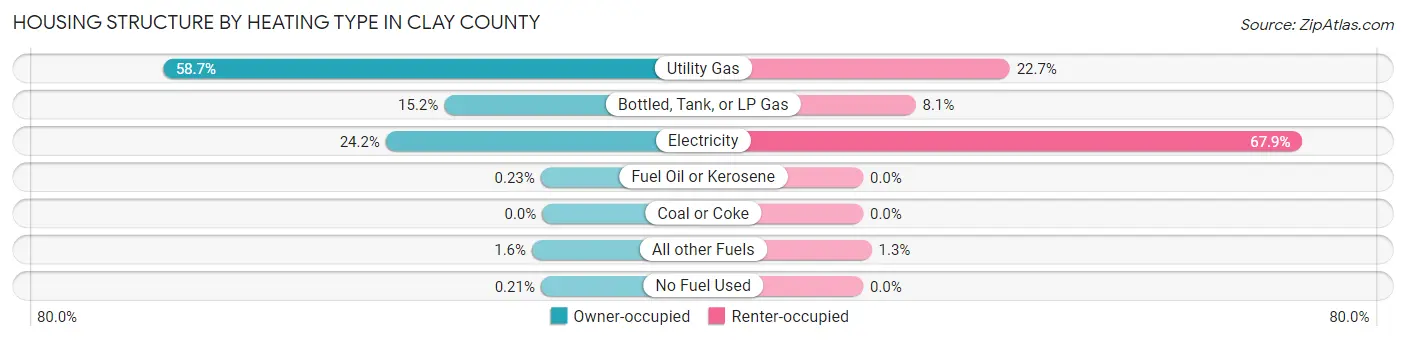
| Heating Type | Owner-occupied | Renter-occupied |
| Utility Gas | 3,081 (58.7%) | 447 (22.7%) |
| Bottled, Tank, or LP Gas | 796 (15.1%) | 160 (8.1%) |
| Electricity | 1,270 (24.2%) | 1,339 (67.9%) |
| Fuel Oil or Kerosene | 12 (0.2%) | 0 (0.0%) |
| Coal or Coke | 0 (0.0%) | 0 (0.0%) |
| All other Fuels | 83 (1.6%) | 26 (1.3%) |
| No Fuel Used | 11 (0.2%) | 0 (0.0%) |
| Total | 5,253 (100.0%) | 1,972 (100.0%) |
Household Vehicle Usage in Clay County
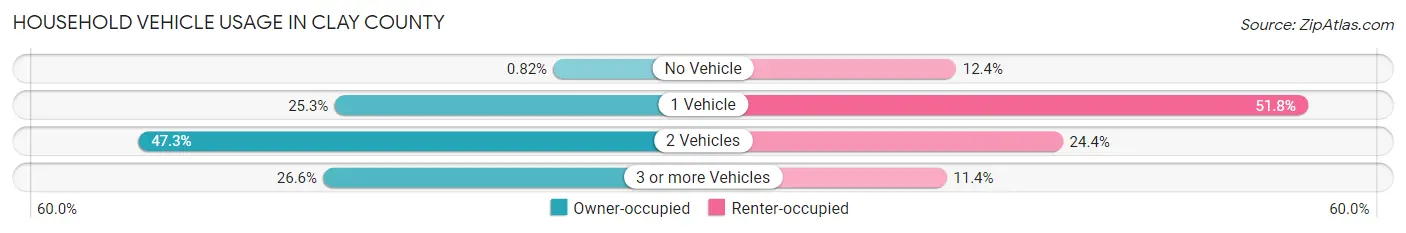
| Vehicles per Household | Owner-occupied | Renter-occupied |
| No Vehicle | 43 (0.8%) | 245 (12.4%) |
| 1 Vehicle | 1,330 (25.3%) | 1,022 (51.8%) |
| 2 Vehicles | 2,483 (47.3%) | 481 (24.4%) |
| 3 or more Vehicles | 1,397 (26.6%) | 224 (11.4%) |
| Total | 5,253 (100.0%) | 1,972 (100.0%) |
Real Estate & Mortgages in Clay County
Real Estate and Mortgage Overview in Clay County
| Characteristic | Without Mortgage | With Mortgage |
| Housing Units | 2,411 | 2,842 |
| Median Property Value | $154,100 | $150,200 |
| Median Household Income | $62,964 | $387 |
| Monthly Housing Costs | $561 | $91 |
| Real Estate Taxes | $1,891 | $27 |
Property Value by Mortgage Status in Clay County
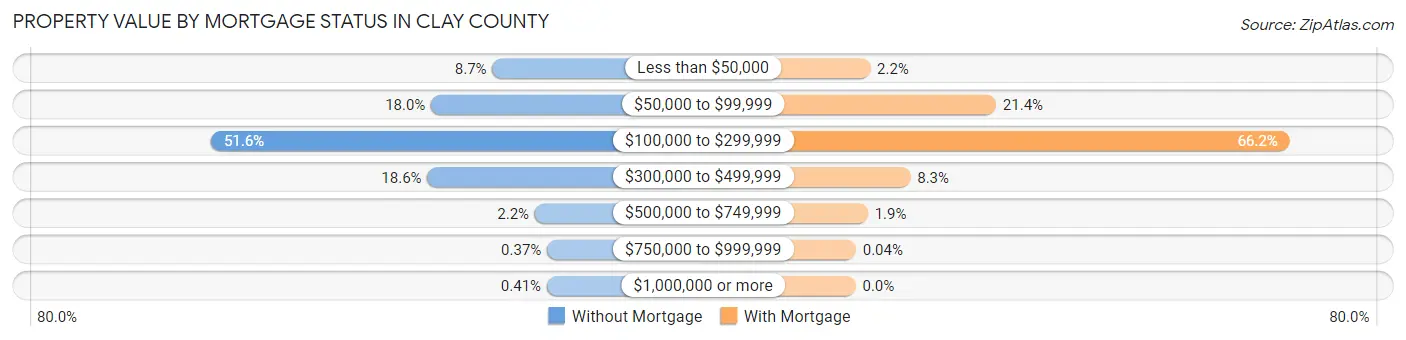
| Property Value | Without Mortgage | With Mortgage |
| Less than $50,000 | 210 (8.7%) | 63 (2.2%) |
| $50,000 to $99,999 | 435 (18.0%) | 608 (21.4%) |
| $100,000 to $299,999 | 1,244 (51.6%) | 1,880 (66.1%) |
| $300,000 to $499,999 | 449 (18.6%) | 237 (8.3%) |
| $500,000 to $749,999 | 54 (2.2%) | 53 (1.9%) |
| $750,000 to $999,999 | 9 (0.4%) | 1 (0.0%) |
| $1,000,000 or more | 10 (0.4%) | 0 (0.0%) |
| Total | 2,411 (100.0%) | 2,842 (100.0%) |
Household Income by Mortgage Status in Clay County
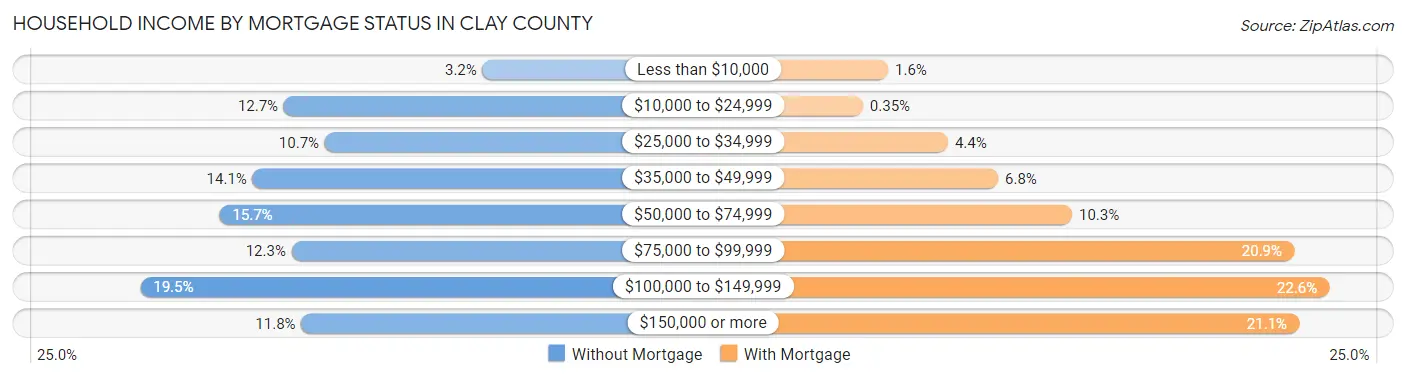
| Household Income | Without Mortgage | With Mortgage |
| Less than $10,000 | 77 (3.2%) | 44 (1.5%) |
| $10,000 to $24,999 | 305 (12.7%) | 10 (0.4%) |
| $25,000 to $34,999 | 258 (10.7%) | 125 (4.4%) |
| $35,000 to $49,999 | 341 (14.1%) | 193 (6.8%) |
| $50,000 to $74,999 | 379 (15.7%) | 293 (10.3%) |
| $75,000 to $99,999 | 296 (12.3%) | 593 (20.9%) |
| $100,000 to $149,999 | 470 (19.5%) | 641 (22.6%) |
| $150,000 or more | 285 (11.8%) | 600 (21.1%) |
| Total | 2,411 (100.0%) | 2,842 (100.0%) |
Property Value to Household Income Ratio in Clay County
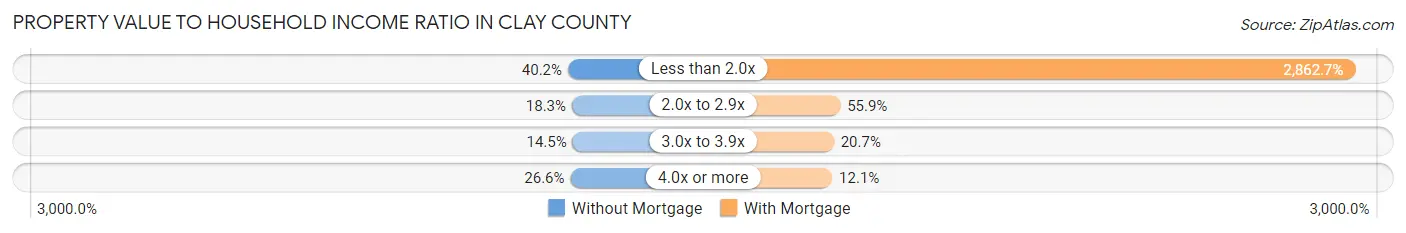
| Value-to-Income Ratio | Without Mortgage | With Mortgage |
| Less than 2.0x | 968 (40.2%) | 81,358 (2,862.7%) |
| 2.0x to 2.9x | 440 (18.2%) | 1,588 (55.9%) |
| 3.0x to 3.9x | 350 (14.5%) | 589 (20.7%) |
| 4.0x or more | 641 (26.6%) | 344 (12.1%) |
| Total | 2,411 (100.0%) | 2,842 (100.0%) |
Real Estate Taxes by Mortgage Status in Clay County
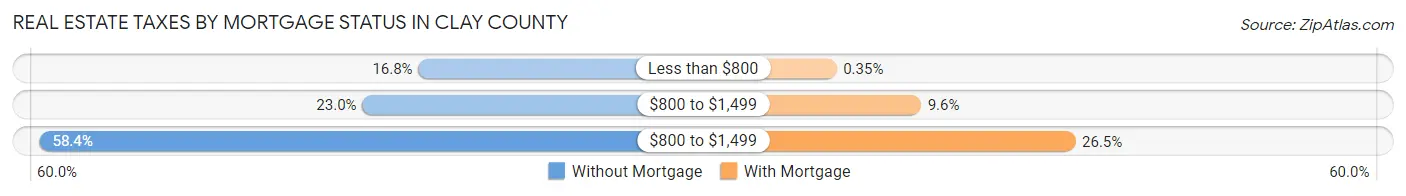
| Property Taxes | Without Mortgage | With Mortgage |
| Less than $800 | 406 (16.8%) | 10 (0.4%) |
| $800 to $1,499 | 554 (23.0%) | 273 (9.6%) |
| $800 to $1,499 | 1,407 (58.4%) | 754 (26.5%) |
| Total | 2,411 (100.0%) | 2,842 (100.0%) |
Health & Disability in Clay County
Health Insurance Coverage by Age in Clay County
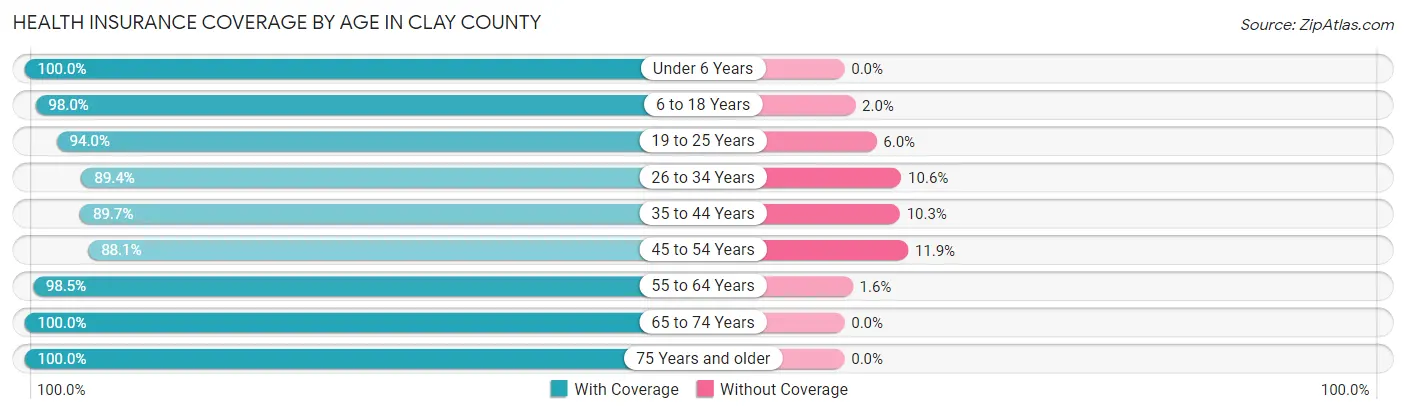
| Age Bracket | With Coverage | Without Coverage |
| Under 6 Years | 1,087 (100.0%) | 0 (0.0%) |
| 6 to 18 Years | 2,808 (98.0%) | 58 (2.0%) |
| 19 to 25 Years | 1,228 (94.0%) | 78 (6.0%) |
| 26 to 34 Years | 1,409 (89.4%) | 167 (10.6%) |
| 35 to 44 Years | 1,728 (89.7%) | 199 (10.3%) |
| 45 to 54 Years | 1,582 (88.1%) | 213 (11.9%) |
| 55 to 64 Years | 2,225 (98.5%) | 35 (1.5%) |
| 65 to 74 Years | 1,887 (100.0%) | 0 (0.0%) |
| 75 Years and older | 1,490 (100.0%) | 0 (0.0%) |
| Total | 15,444 (95.4%) | 750 (4.6%) |
Health Insurance Coverage by Citizenship Status in Clay County
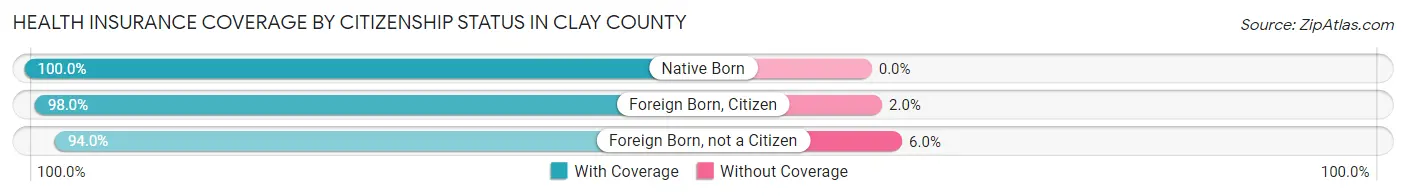
| Citizenship Status | With Coverage | Without Coverage |
| Native Born | 1,087 (100.0%) | 0 (0.0%) |
| Foreign Born, Citizen | 2,808 (98.0%) | 58 (2.0%) |
| Foreign Born, not a Citizen | 1,228 (94.0%) | 78 (6.0%) |
Health Insurance Coverage by Household Income in Clay County
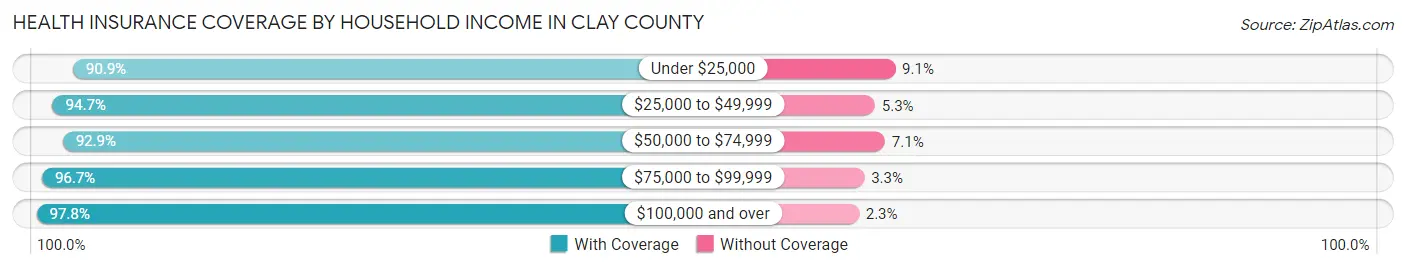
| Household Income | With Coverage | Without Coverage |
| Under $25,000 | 1,848 (90.9%) | 184 (9.1%) |
| $25,000 to $49,999 | 2,830 (94.7%) | 157 (5.3%) |
| $50,000 to $74,999 | 2,354 (92.9%) | 181 (7.1%) |
| $75,000 to $99,999 | 2,672 (96.7%) | 90 (3.3%) |
| $100,000 and over | 5,658 (97.8%) | 130 (2.2%) |
Public vs Private Health Insurance Coverage by Age in Clay County
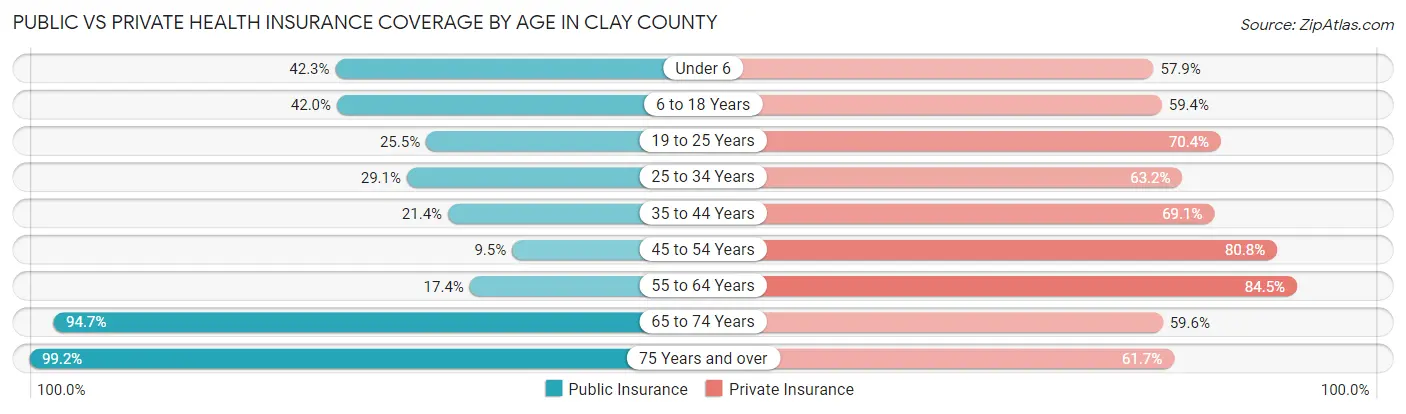
| Age Bracket | Public Insurance | Private Insurance |
| Under 6 | 460 (42.3%) | 629 (57.9%) |
| 6 to 18 Years | 1,205 (42.0%) | 1,702 (59.4%) |
| 19 to 25 Years | 333 (25.5%) | 919 (70.4%) |
| 25 to 34 Years | 458 (29.1%) | 996 (63.2%) |
| 35 to 44 Years | 413 (21.4%) | 1,332 (69.1%) |
| 45 to 54 Years | 171 (9.5%) | 1,450 (80.8%) |
| 55 to 64 Years | 393 (17.4%) | 1,909 (84.5%) |
| 65 to 74 Years | 1,787 (94.7%) | 1,124 (59.6%) |
| 75 Years and over | 1,478 (99.2%) | 919 (61.7%) |
| Total | 6,698 (41.4%) | 10,980 (67.8%) |
Disability Status by Sex by Age in Clay County
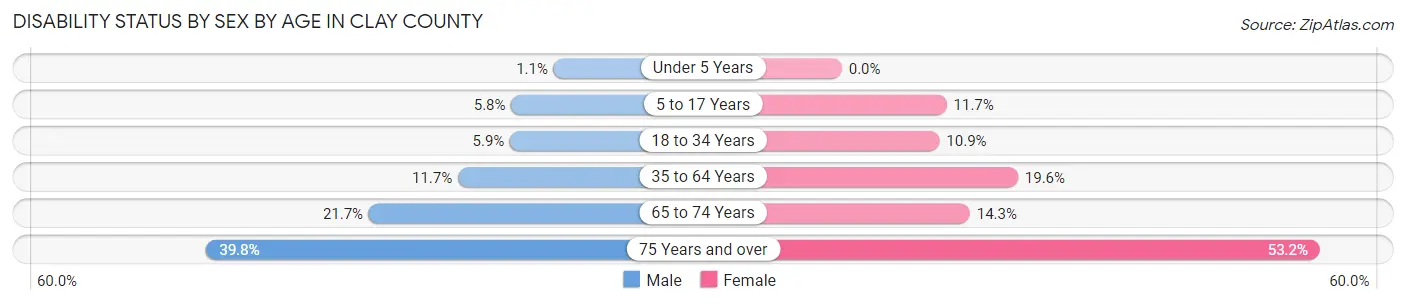
| Age Bracket | Male | Female |
| Under 5 Years | 5 (1.1%) | 0 (0.0%) |
| 5 to 17 Years | 80 (5.8%) | 167 (11.7%) |
| 18 to 34 Years | 91 (5.9%) | 164 (10.9%) |
| 35 to 64 Years | 348 (11.7%) | 591 (19.6%) |
| 65 to 74 Years | 199 (21.6%) | 138 (14.3%) |
| 75 Years and over | 266 (39.8%) | 437 (53.2%) |
Disability Class by Sex by Age in Clay County
Disability Class: Hearing Difficulty
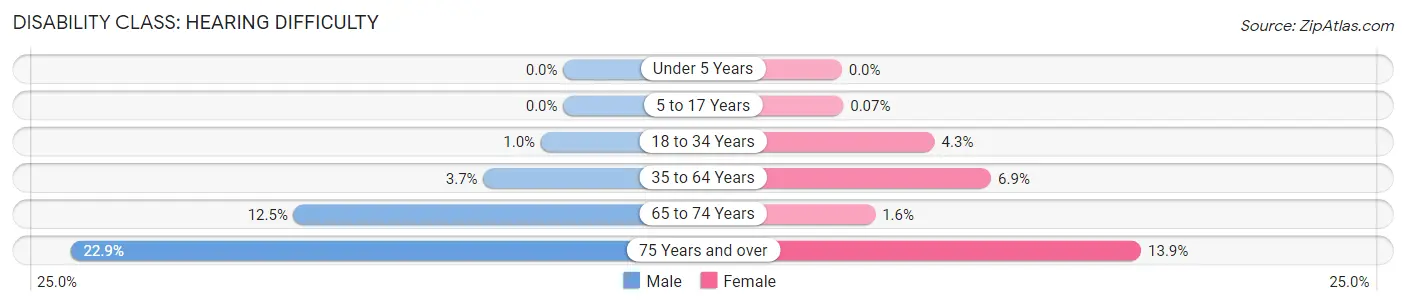
| Age Bracket | Male | Female |
| Under 5 Years | 0 (0.0%) | 0 (0.0%) |
| 5 to 17 Years | 0 (0.0%) | 1 (0.1%) |
| 18 to 34 Years | 16 (1.0%) | 65 (4.3%) |
| 35 to 64 Years | 110 (3.7%) | 209 (6.9%) |
| 65 to 74 Years | 115 (12.5%) | 15 (1.5%) |
| 75 Years and over | 153 (22.9%) | 114 (13.9%) |
Disability Class: Vision Difficulty
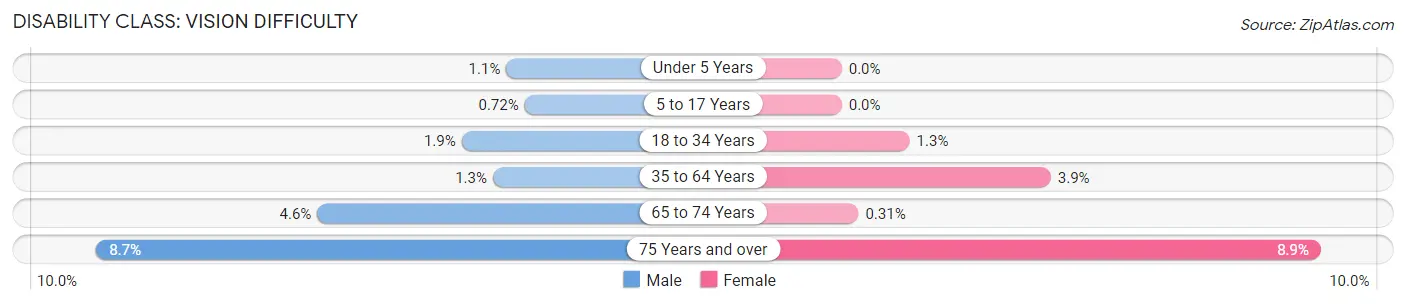
| Age Bracket | Male | Female |
| Under 5 Years | 5 (1.1%) | 0 (0.0%) |
| 5 to 17 Years | 10 (0.7%) | 0 (0.0%) |
| 18 to 34 Years | 29 (1.9%) | 19 (1.3%) |
| 35 to 64 Years | 39 (1.3%) | 117 (3.9%) |
| 65 to 74 Years | 42 (4.6%) | 3 (0.3%) |
| 75 Years and over | 58 (8.7%) | 73 (8.9%) |
Disability Class: Cognitive Difficulty
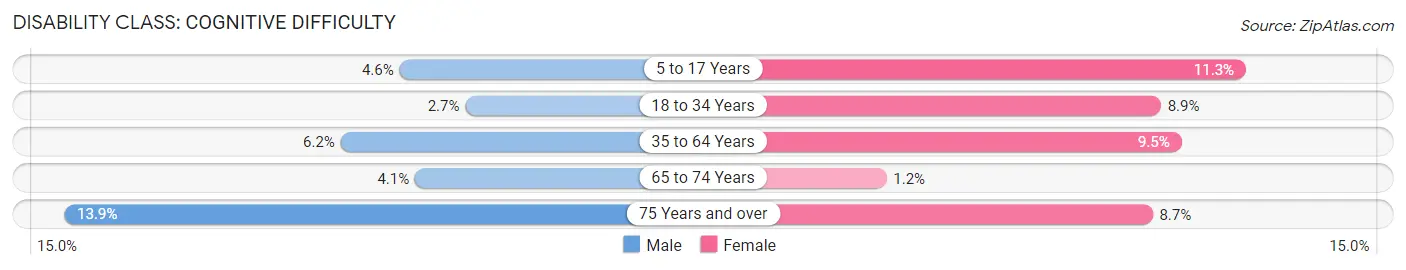
| Age Bracket | Male | Female |
| 5 to 17 Years | 63 (4.6%) | 161 (11.3%) |
| 18 to 34 Years | 42 (2.7%) | 134 (8.9%) |
| 35 to 64 Years | 184 (6.2%) | 285 (9.5%) |
| 65 to 74 Years | 38 (4.1%) | 12 (1.2%) |
| 75 Years and over | 93 (13.9%) | 71 (8.6%) |
Disability Class: Ambulatory Difficulty
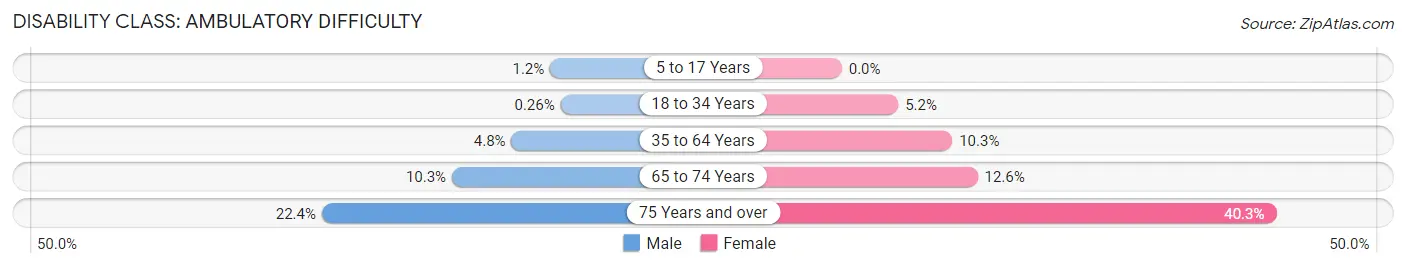
| Age Bracket | Male | Female |
| 5 to 17 Years | 17 (1.2%) | 0 (0.0%) |
| 18 to 34 Years | 4 (0.3%) | 79 (5.2%) |
| 35 to 64 Years | 143 (4.8%) | 309 (10.2%) |
| 65 to 74 Years | 95 (10.3%) | 122 (12.6%) |
| 75 Years and over | 150 (22.4%) | 331 (40.3%) |
Disability Class: Self-Care Difficulty
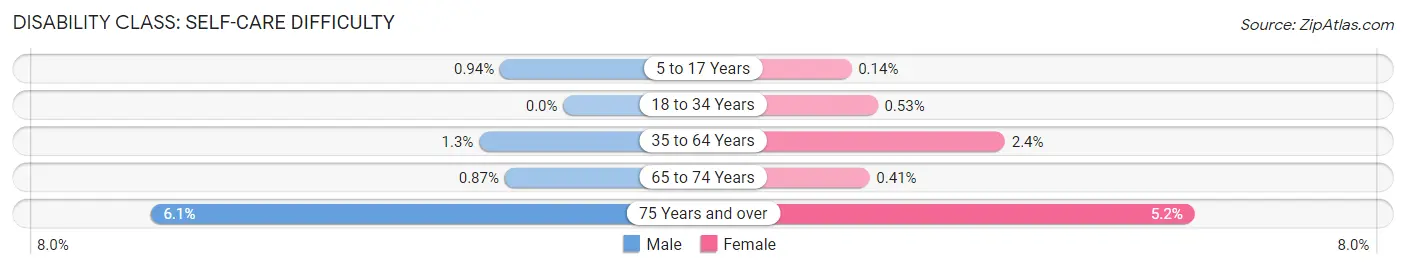
| Age Bracket | Male | Female |
| 5 to 17 Years | 13 (0.9%) | 2 (0.1%) |
| 18 to 34 Years | 0 (0.0%) | 8 (0.5%) |
| 35 to 64 Years | 37 (1.3%) | 73 (2.4%) |
| 65 to 74 Years | 8 (0.9%) | 4 (0.4%) |
| 75 Years and over | 41 (6.1%) | 43 (5.2%) |
Technology Access in Clay County
Computing Device Access in Clay County
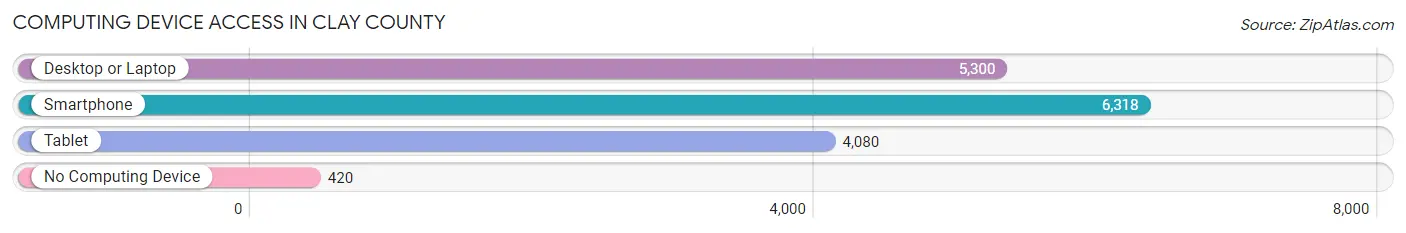
| Device Type | # Households | % Households |
| Desktop or Laptop | 5,300 | 73.4% |
| Smartphone | 6,318 | 87.5% |
| Tablet | 4,080 | 56.5% |
| No Computing Device | 420 | 5.8% |
| Total | 7,225 | 100.0% |
Internet Access in Clay County
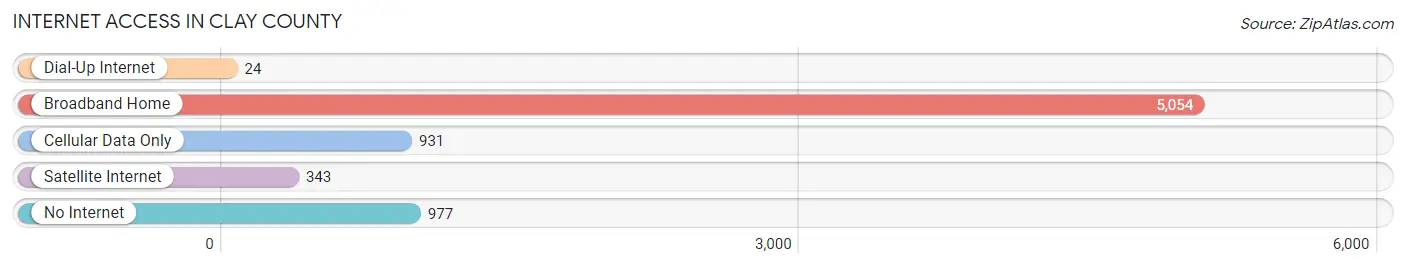
| Internet Type | # Households | % Households |
| Dial-Up Internet | 24 | 0.3% |
| Broadband Home | 5,054 | 70.0% |
| Cellular Data Only | 931 | 12.9% |
| Satellite Internet | 343 | 4.8% |
| No Internet | 977 | 13.5% |
| Total | 7,225 | 100.0% |
Clay County Summary
Clay County, Iowa is located in the northwest corner of the state and is part of the Sioux City metropolitan area. It is bordered by Plymouth County to the north, Dickinson County to the east, O'Brien County to the south, and Sioux County to the west. The county seat is Spencer, and the largest city is Spencer. The county was named for Henry Clay, a prominent statesman and senator from Kentucky.
Geography
Clay County covers an area of 576 square miles and is located in the Loess Hills region of Iowa. The terrain is mostly rolling hills, with some flat areas in the northern part of the county. The Little Sioux River flows through the county, and there are several small lakes and ponds. The county is mostly rural, with some small towns and villages scattered throughout.
Demographics
As of the 2010 census, Clay County had a population of 16,667. The racial makeup of the county was 95.3% White, 0.7% African American, 0.3% Native American, 0.5% Asian, 0.1% Pacific Islander, 1.9% from other races, and 1.2% from two or more races. Hispanic or Latino of any race were 4.2% of the population.
The median income for a household in the county was $45,845 and the median income for a family was $54,845. The per capita income for the county was $21,945. About 8.2% of families and 11.2% of the population were below the poverty line, including 14.2% of those under age 18 and 8.2% of those age 65 or over.
Economy
Clay County's economy is largely based on agriculture. The county is home to several large farms, and the main crops grown are corn, soybeans, and hay. Livestock production is also important, with beef and dairy cattle being the main animals raised.
The county is also home to several manufacturing companies, including a large pork processing plant and a furniture factory. Tourism is also an important part of the economy, with several lakes and parks in the area.
History
Clay County was established in 1858 and was named after Henry Clay, a prominent statesman and senator from Kentucky. The county seat was originally located in Peterson, but was moved to Spencer in 1871.
The county was largely rural until the late 19th century, when the railroad was built through the area. This led to the development of several small towns and villages, and the growth of the county's economy.
In the early 20th century, Clay County was a major producer of corn and hogs. The county also had several large dairy farms, and the area was known for its high-quality dairy products.
Clay County has continued to grow and develop over the years, and today it is a vibrant and diverse community. The county is home to several small towns and villages, and the economy is largely based on agriculture and manufacturing. The county is also home to several lakes and parks, making it a popular destination for tourists.
Common Questions
What is Per Capita Income in Clay County?
Per Capita income in Clay County is $35,787.
What is the Median Family Income in Clay County?
Median Family Income in Clay County is $84,432.
What is the Median Household income in Clay County?
Median Household Income in Clay County is $61,756.
What is Income or Wage Gap in Clay County?
Income or Wage Gap in Clay County is 32.0%.
Women in Clay County earn 68.0 cents for every dollar earned by a man.
What is Family Income Deficit in Clay County?
Family Income Deficit in Clay County is $7,506.
Families that are below poverty line in Clay County earn $7,506 less on average than the poverty threshold level.
What is Inequality or Gini Index in Clay County?
Inequality or Gini Index in Clay County is 0.42.
What is the Total Population of Clay County?
Total Population of Clay County is 16,423.
What is the Total Male Population of Clay County?
Total Male Population of Clay County is 8,029.
What is the Total Female Population of Clay County?
Total Female Population of Clay County is 8,394.
What is the Ratio of Males per 100 Females in Clay County?
There are 95.65 Males per 100 Females in Clay County.
What is the Ratio of Females per 100 Males in Clay County?
There are 104.55 Females per 100 Males in Clay County.
What is the Median Population Age in Clay County?
Median Population Age in Clay County is 41.5 Years.
What is the Average Family Size in Clay County
Average Family Size in Clay County is 3.0 People.
What is the Average Household Size in Clay County
Average Household Size in Clay County is 2.2 People.
How Large is the Labor Force in Clay County?
There are 8,786 People in the Labor Forcein in Clay County.
What is the Percentage of People in the Labor Force in Clay County?
67.4% of People are in the Labor Force in Clay County.
What is the Unemployment Rate in Clay County?
Unemployment Rate in Clay County is 4.1%.