Cherokee County, IA Map & Demographics
Cherokee County Map
Cherokee County Overview
$35,939
PER CAPITA INCOME
$90,243
AVG FAMILY INCOME
$63,638
AVG HOUSEHOLD INCOME
40.3%
WAGE / INCOME GAP [ % ]
59.7¢/ $1
WAGE / INCOME GAP [ $ ]
0.42
INEQUALITY / GINI INDEX
11,601
TOTAL POPULATION
5,842
MALE POPULATION
5,759
FEMALE POPULATION
101.44
MALES / 100 FEMALES
98.58
FEMALES / 100 MALES
44.8
MEDIAN AGE
2.8
AVG FAMILY SIZE
2.2
AVG HOUSEHOLD SIZE
6,151
LABOR FORCE [ PEOPLE ]
65.3%
PERCENT IN LABOR FORCE
3.2%
UNEMPLOYMENT RATE
Cherokee County Area Codes
Income in Cherokee County
Income Overview in Cherokee County
Per Capita Income in Cherokee County is $35,939, while median incomes of families and households are $90,243 and $63,638 respectively.
| Characteristic | Number | Measure |
| Per Capita Income | 11,601 | $35,939 |
| Median Family Income | 3,127 | $90,243 |
| Mean Family Income | 3,127 | $102,688 |
| Median Household Income | 5,143 | $63,638 |
| Mean Household Income | 5,143 | $81,329 |
| Income Deficit | 3,127 | $0 |
| Wage / Income Gap (%) | 11,601 | 40.29% |
| Wage / Income Gap ($) | 11,601 | 59.71¢ per $1 |
| Gini / Inequality Index | 11,601 | 0.42 |
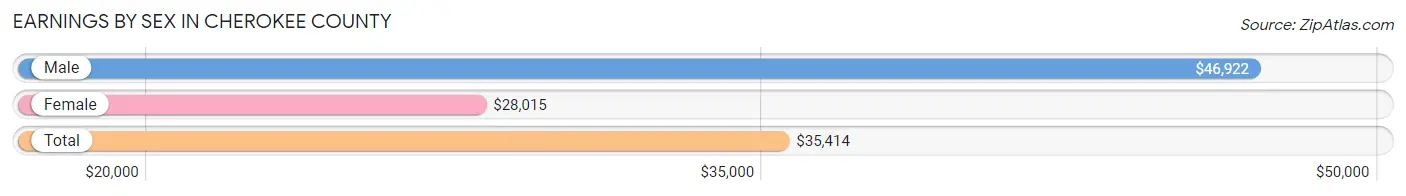
Earnings by Sex in Cherokee County
Average Earnings in Cherokee County are $35,414, $46,922 for men and $28,015 for women, a difference of 40.3%.
| Sex | Number | Average Earnings |
| Male | 3,465 (53.3%) | $46,922 |
| Female | 3,034 (46.7%) | $28,015 |
| Total | 6,499 (100.0%) | $35,414 |
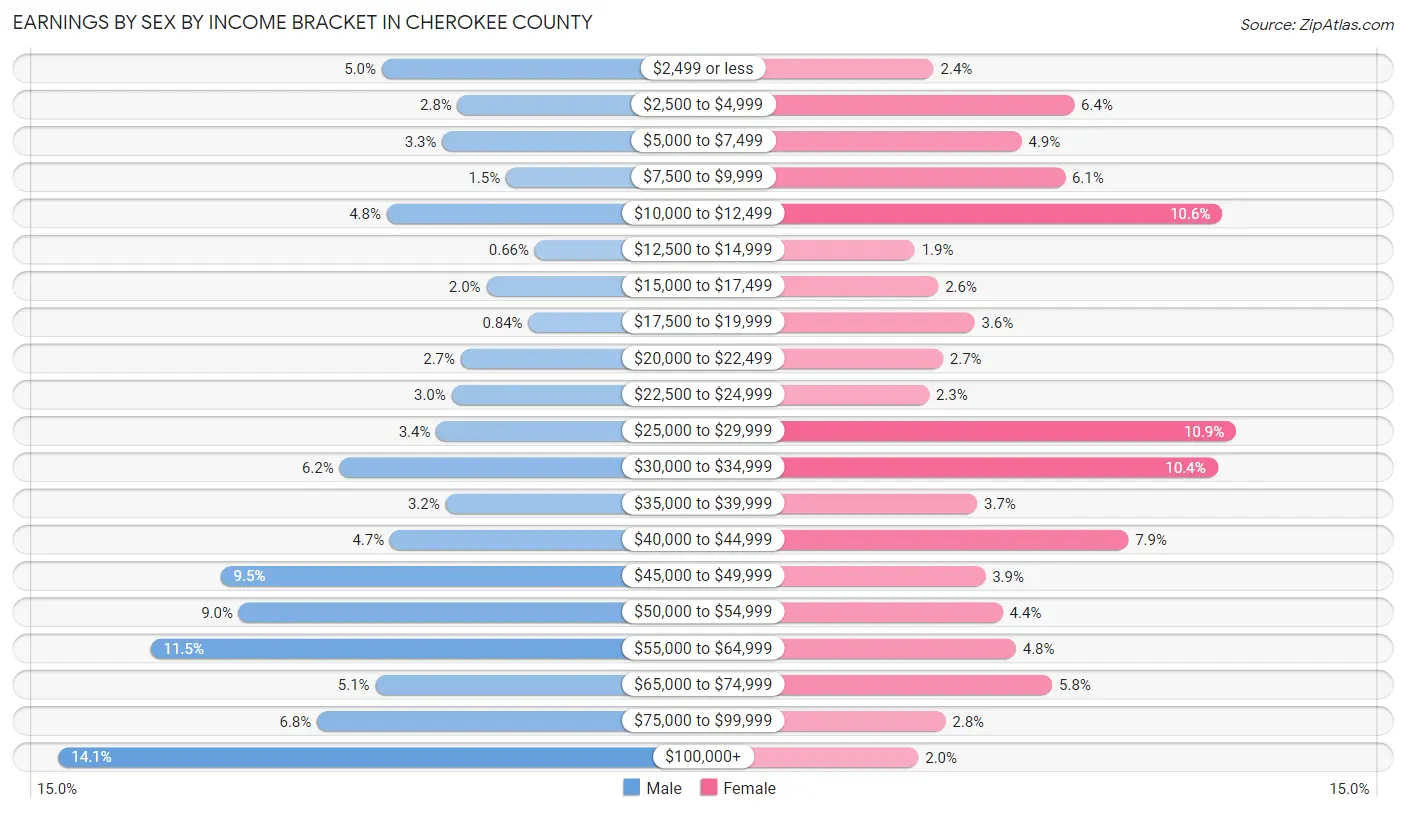
Earnings by Sex by Income Bracket in Cherokee County
The most common earnings brackets in Cherokee County are $100,000+ for men (487 | 14.1%) and $25,000 to $29,999 for women (332 | 10.9%).
| Income | Male | Female |
| $2,499 or less | 172 (5.0%) | 74 (2.4%) |
| $2,500 to $4,999 | 98 (2.8%) | 194 (6.4%) |
| $5,000 to $7,499 | 113 (3.3%) | 149 (4.9%) |
| $7,500 to $9,999 | 51 (1.5%) | 186 (6.1%) |
| $10,000 to $12,499 | 167 (4.8%) | 320 (10.5%) |
| $12,500 to $14,999 | 23 (0.7%) | 58 (1.9%) |
| $15,000 to $17,499 | 70 (2.0%) | 78 (2.6%) |
| $17,500 to $19,999 | 29 (0.8%) | 109 (3.6%) |
| $20,000 to $22,499 | 95 (2.7%) | 82 (2.7%) |
| $22,500 to $24,999 | 104 (3.0%) | 70 (2.3%) |
| $25,000 to $29,999 | 119 (3.4%) | 332 (10.9%) |
| $30,000 to $34,999 | 213 (6.1%) | 316 (10.4%) |
| $35,000 to $39,999 | 110 (3.2%) | 111 (3.7%) |
| $40,000 to $44,999 | 164 (4.7%) | 240 (7.9%) |
| $45,000 to $49,999 | 329 (9.5%) | 118 (3.9%) |
| $50,000 to $54,999 | 311 (9.0%) | 133 (4.4%) |
| $55,000 to $64,999 | 397 (11.5%) | 144 (4.8%) |
| $65,000 to $74,999 | 178 (5.1%) | 175 (5.8%) |
| $75,000 to $99,999 | 235 (6.8%) | 84 (2.8%) |
| $100,000+ | 487 (14.1%) | 61 (2.0%) |
| Total | 3,465 (100.0%) | 3,034 (100.0%) |
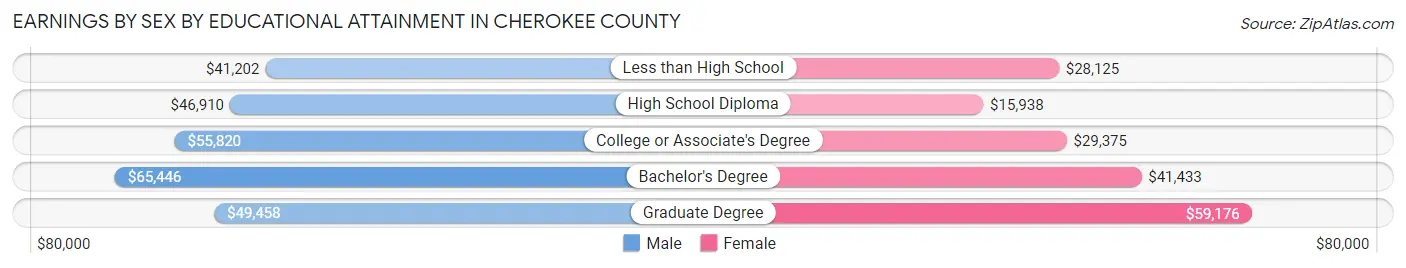
Earnings by Sex by Educational Attainment in Cherokee County
Average earnings in Cherokee County are $51,094 for men and $29,697 for women, a difference of 41.9%. Men with an educational attainment of bachelor's degree enjoy the highest average annual earnings of $65,446, while those with less than high school education earn the least with $41,202. Women with an educational attainment of graduate degree earn the most with the average annual earnings of $59,176, while those with high school diploma education have the smallest earnings of $15,938.
| Educational Attainment | Male Income | Female Income |
| Less than High School | $41,202 | $28,125 |
| High School Diploma | $46,910 | $15,938 |
| College or Associate's Degree | $55,820 | $29,375 |
| Bachelor's Degree | $65,446 | $41,433 |
| Graduate Degree | $49,458 | $59,176 |
| Total | $51,094 | $29,697 |
Family Income in Cherokee County
Family Income Brackets in Cherokee County
According to the Cherokee County family income data, there are 854 families falling into the $100,000 to $149,999 income range, which is the most common income bracket and makes up 27.3% of all families. Conversely, the $10,000 to $14,999 income bracket is the least frequent group with only 19 families (0.6%) belonging to this category.
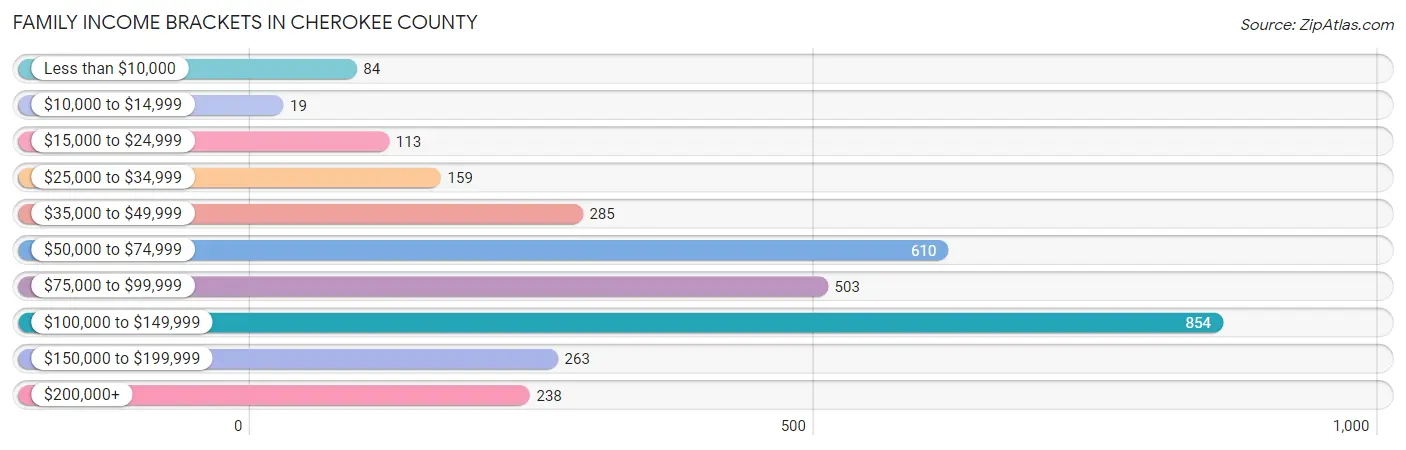
| Income Bracket | # Families | % Families |
| Less than $10,000 | 84 | 2.7% |
| $10,000 to $14,999 | 19 | 0.6% |
| $15,000 to $24,999 | 113 | 3.6% |
| $25,000 to $34,999 | 159 | 5.1% |
| $35,000 to $49,999 | 285 | 9.1% |
| $50,000 to $74,999 | 610 | 19.5% |
| $75,000 to $99,999 | 503 | 16.1% |
| $100,000 to $149,999 | 854 | 27.3% |
| $150,000 to $199,999 | 263 | 8.4% |
| $200,000+ | 238 | 7.6% |
Family Income by Famaliy Size in Cherokee County
4-person families (361 | 11.5%) account for the highest median family income in Cherokee County with $118,688 per family, while 2-person families (1,757 | 56.2%) have the highest median income of $42,994 per family member.
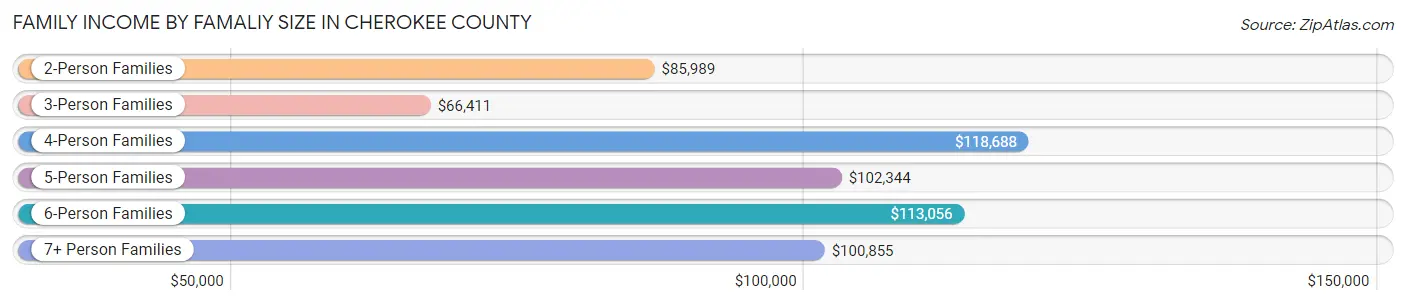
| Income Bracket | # Families | Median Income |
| 2-Person Families | 1,757 (56.2%) | $85,989 |
| 3-Person Families | 635 (20.3%) | $66,411 |
| 4-Person Families | 361 (11.5%) | $118,688 |
| 5-Person Families | 231 (7.4%) | $102,344 |
| 6-Person Families | 110 (3.5%) | $113,056 |
| 7+ Person Families | 33 (1.1%) | $100,855 |
| Total | 3,127 (100.0%) | $90,243 |
Family Income by Number of Earners in Cherokee County
The median family income in Cherokee County is $90,243, with families comprising 3+ earners (305) having the highest median family income of $152,708, while families with 1 earner (853) have the lowest median family income of $52,610, accounting for 9.8% and 27.3% of families, respectively.
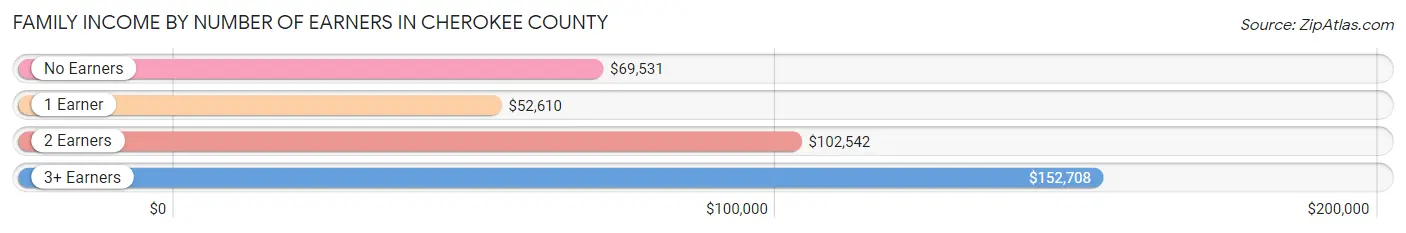
| Number of Earners | # Families | Median Income |
| No Earners | 373 (11.9%) | $69,531 |
| 1 Earner | 853 (27.3%) | $52,610 |
| 2 Earners | 1,596 (51.0%) | $102,542 |
| 3+ Earners | 305 (9.8%) | $152,708 |
| Total | 3,127 (100.0%) | $90,243 |
Household Income in Cherokee County
Household Income Brackets in Cherokee County
With 1,013 households falling in the category, the $50,000 to $74,999 income range is the most frequent in Cherokee County, accounting for 19.7% of all households. In contrast, only 206 households (4.0%) fall into the $10,000 to $14,999 income bracket, making it the least populous group.
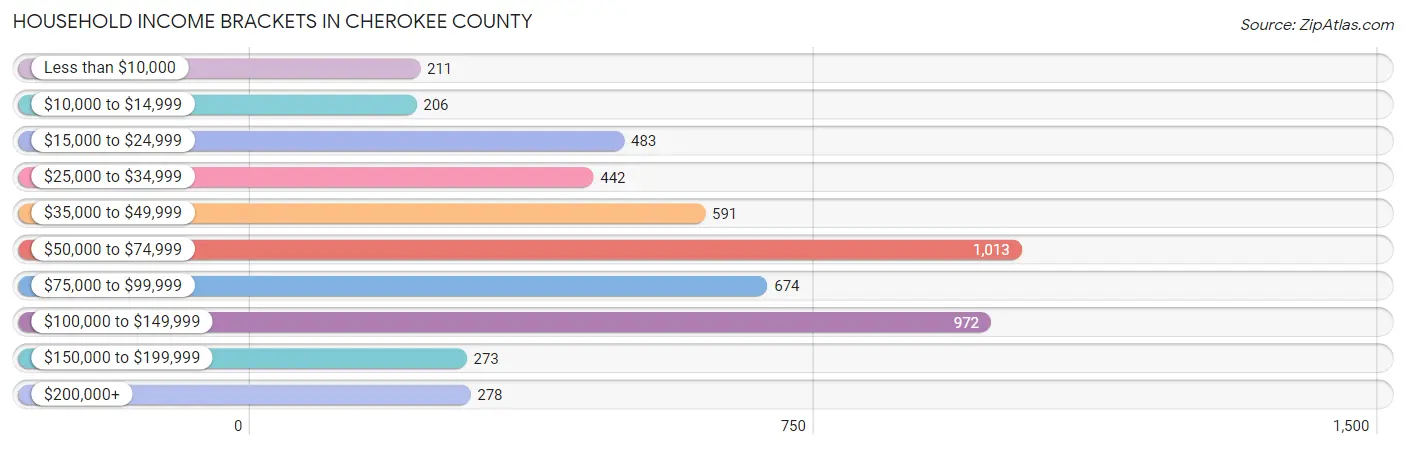
| Income Bracket | # Households | % Households |
| Less than $10,000 | 211 | 4.1% |
| $10,000 to $14,999 | 206 | 4.0% |
| $15,000 to $24,999 | 483 | 9.4% |
| $25,000 to $34,999 | 442 | 8.6% |
| $35,000 to $49,999 | 591 | 11.5% |
| $50,000 to $74,999 | 1,013 | 19.7% |
| $75,000 to $99,999 | 674 | 13.1% |
| $100,000 to $149,999 | 972 | 18.9% |
| $150,000 to $199,999 | 273 | 5.3% |
| $200,000+ | 278 | 5.4% |
Household Income by Householder Age in Cherokee County
The median household income in Cherokee County is $63,638, with the highest median household income of $80,464 found in the 25 to 44 years age bracket for the primary householder. A total of 1,325 households (25.8%) fall into this category. Meanwhile, the 65+ years age bracket for the primary householder has the lowest median household income of $51,623, with 1,858 households (36.1%) in this group.
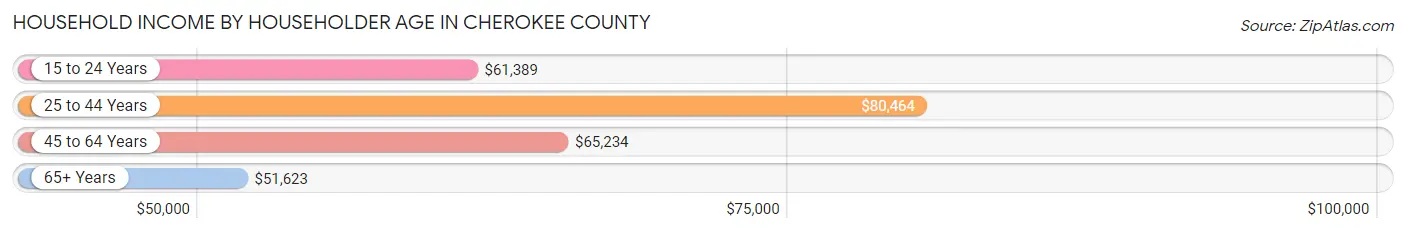
| Income Bracket | # Households | Median Income |
| 15 to 24 Years | 200 (3.9%) | $61,389 |
| 25 to 44 Years | 1,325 (25.8%) | $80,464 |
| 45 to 64 Years | 1,760 (34.2%) | $65,234 |
| 65+ Years | 1,858 (36.1%) | $51,623 |
| Total | 5,143 (100.0%) | $63,638 |
Poverty in Cherokee County
Income Below Poverty by Sex and Age in Cherokee County
With 10.7% poverty level for males and 16.0% for females among the residents of Cherokee County, 6 to 11 year old males and 12 to 14 year old females are the most vulnerable to poverty, with 152 males (27.9%) and 121 females (43.4%) in their respective age groups living below the poverty level.
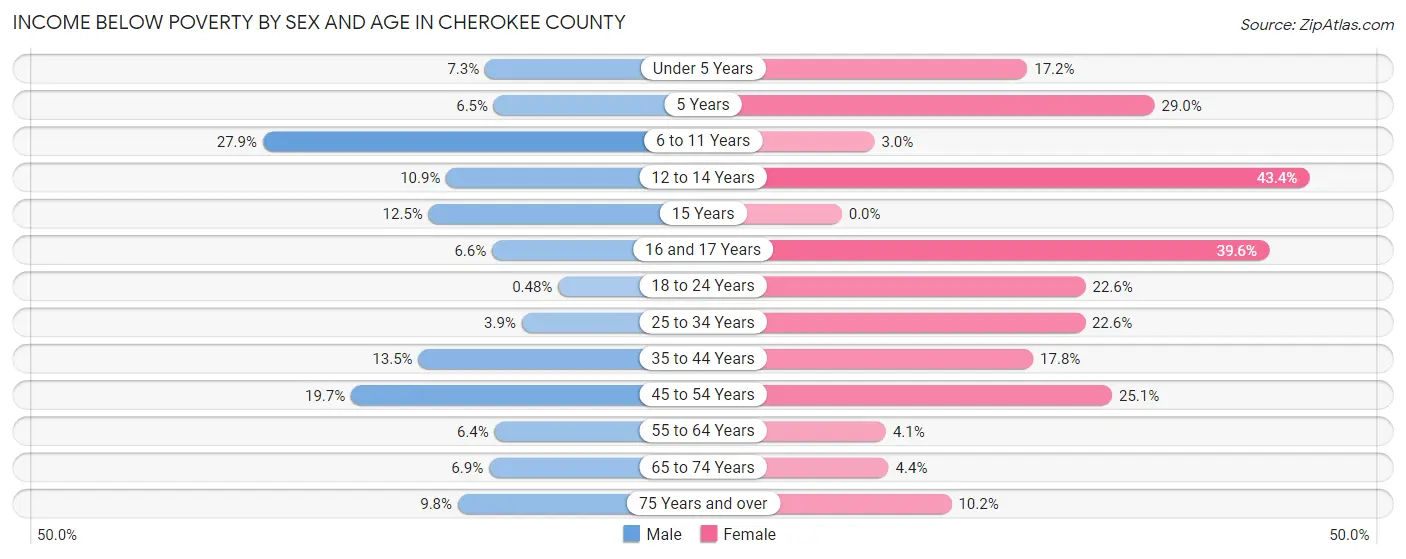
| Age Bracket | Male | Female |
| Under 5 Years | 24 (7.3%) | 47 (17.2%) |
| 5 Years | 2 (6.5%) | 27 (29.0%) |
| 6 to 11 Years | 152 (27.9%) | 10 (3.0%) |
| 12 to 14 Years | 20 (10.9%) | 121 (43.4%) |
| 15 Years | 7 (12.5%) | 0 (0.0%) |
| 16 and 17 Years | 9 (6.6%) | 86 (39.6%) |
| 18 to 24 Years | 2 (0.5%) | 83 (22.6%) |
| 25 to 34 Years | 22 (3.9%) | 137 (22.6%) |
| 35 to 44 Years | 99 (13.5%) | 100 (17.8%) |
| 45 to 54 Years | 119 (19.7%) | 152 (25.1%) |
| 55 to 64 Years | 56 (6.4%) | 36 (4.1%) |
| 65 to 74 Years | 49 (6.9%) | 30 (4.3%) |
| 75 Years and over | 43 (9.8%) | 73 (10.2%) |
| Total | 604 (10.7%) | 902 (16.0%) |
Income Above Poverty by Sex and Age in Cherokee County
According to the poverty statistics in Cherokee County, males aged 18 to 24 years and females aged 15 years are the age groups that are most secure financially, with 99.5% of males and 100.0% of females in these age groups living above the poverty line.
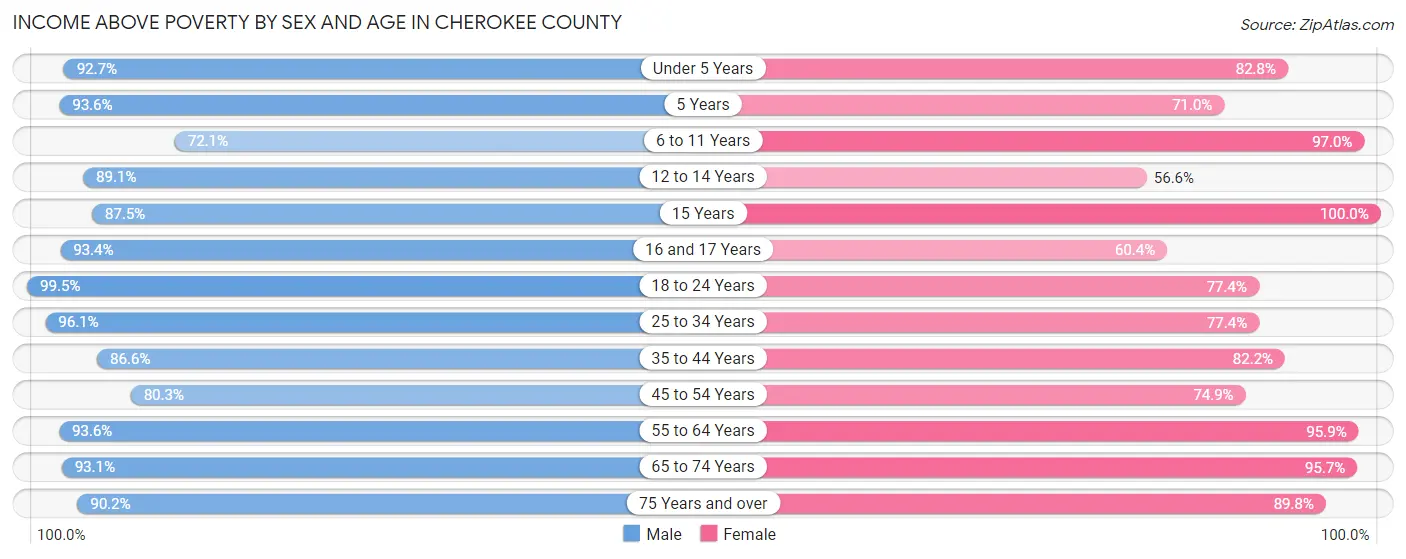
| Age Bracket | Male | Female |
| Under 5 Years | 306 (92.7%) | 226 (82.8%) |
| 5 Years | 29 (93.5%) | 66 (71.0%) |
| 6 to 11 Years | 393 (72.1%) | 319 (97.0%) |
| 12 to 14 Years | 164 (89.1%) | 158 (56.6%) |
| 15 Years | 49 (87.5%) | 35 (100.0%) |
| 16 and 17 Years | 127 (93.4%) | 131 (60.4%) |
| 18 to 24 Years | 413 (99.5%) | 284 (77.4%) |
| 25 to 34 Years | 548 (96.1%) | 470 (77.4%) |
| 35 to 44 Years | 637 (86.6%) | 463 (82.2%) |
| 45 to 54 Years | 485 (80.3%) | 454 (74.9%) |
| 55 to 64 Years | 822 (93.6%) | 841 (95.9%) |
| 65 to 74 Years | 661 (93.1%) | 659 (95.7%) |
| 75 Years and over | 396 (90.2%) | 644 (89.8%) |
| Total | 5,030 (89.3%) | 4,750 (84.0%) |
Income Below Poverty Among Married-Couple Families in Cherokee County
The poverty statistics for married-couple families in Cherokee County show that 2.9% or 74 of the total 2,556 families live below the poverty line. Families with 3 or 4 children have the highest poverty rate of 13.0%, comprising of 36 families. On the other hand, families with 5 or more children have the lowest poverty rate of 0.0%, which includes 0 families.
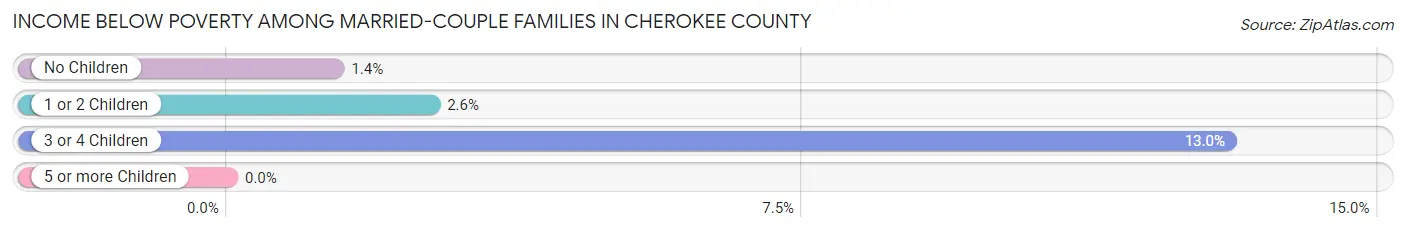
| Children | Above Poverty | Below Poverty |
| No Children | 1,700 (98.6%) | 24 (1.4%) |
| 1 or 2 Children | 517 (97.4%) | 14 (2.6%) |
| 3 or 4 Children | 240 (87.0%) | 36 (13.0%) |
| 5 or more Children | 25 (100.0%) | 0 (0.0%) |
| Total | 2,482 (97.1%) | 74 (2.9%) |
Income Below Poverty Among Single-Parent Households in Cherokee County
According to the poverty data in Cherokee County, 5.2% or 11 single-father households and 43.9% or 158 single-mother households are living below the poverty line. Among single-father households, those with 1 or 2 children have the highest poverty rate, with 9 households (10.1%) experiencing poverty. Likewise, among single-mother households, those with 1 or 2 children have the highest poverty rate, with 152 households (50.7%) falling below the poverty line.
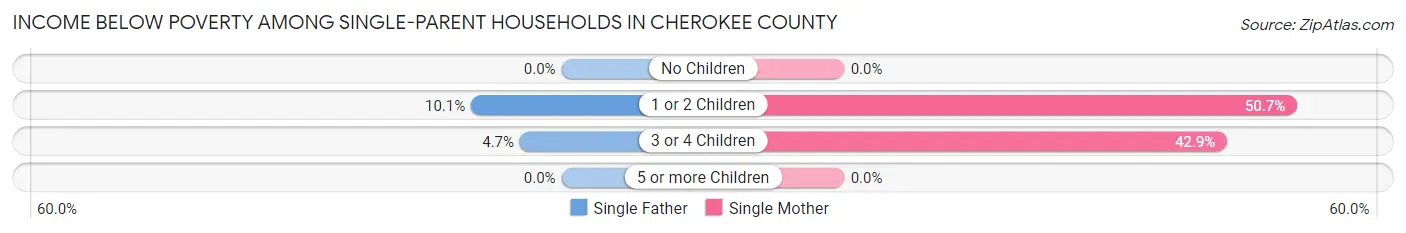
| Children | Single Father | Single Mother |
| No Children | 0 (0.0%) | 0 (0.0%) |
| 1 or 2 Children | 9 (10.1%) | 152 (50.7%) |
| 3 or 4 Children | 2 (4.6%) | 6 (42.9%) |
| 5 or more Children | 0 (0.0%) | 0 (0.0%) |
| Total | 11 (5.2%) | 158 (43.9%) |
Income Below Poverty Among Married-Couple vs Single-Parent Households in Cherokee County
The poverty data for Cherokee County shows that 74 of the married-couple family households (2.9%) and 169 of the single-parent households (29.6%) are living below the poverty level. Within the married-couple family households, those with 3 or 4 children have the highest poverty rate, with 36 households (13.0%) falling below the poverty line. Among the single-parent households, those with 1 or 2 children have the highest poverty rate, with 161 household (41.4%) living below poverty.
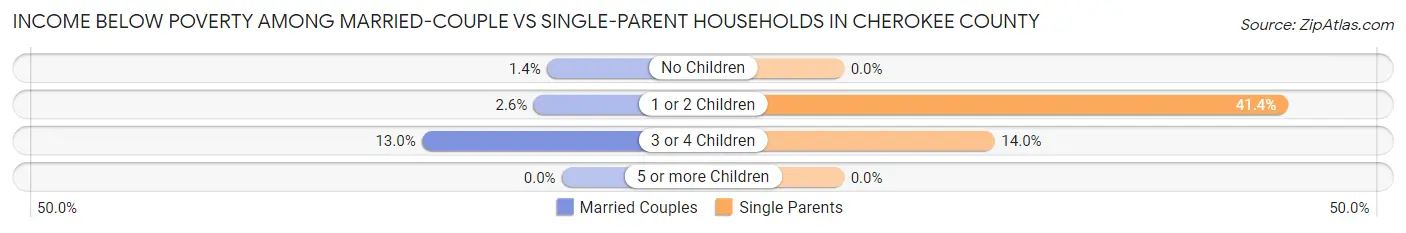
| Children | Married-Couple Families | Single-Parent Households |
| No Children | 24 (1.4%) | 0 (0.0%) |
| 1 or 2 Children | 14 (2.6%) | 161 (41.4%) |
| 3 or 4 Children | 36 (13.0%) | 8 (14.0%) |
| 5 or more Children | 0 (0.0%) | 0 (0.0%) |
| Total | 74 (2.9%) | 169 (29.6%) |
Race in Cherokee County
The most populous races in Cherokee County are White / Caucasian (10,745 | 92.6%), Two or more Races (531 | 4.6%), and Hispanic or Latino (528 | 4.5%).
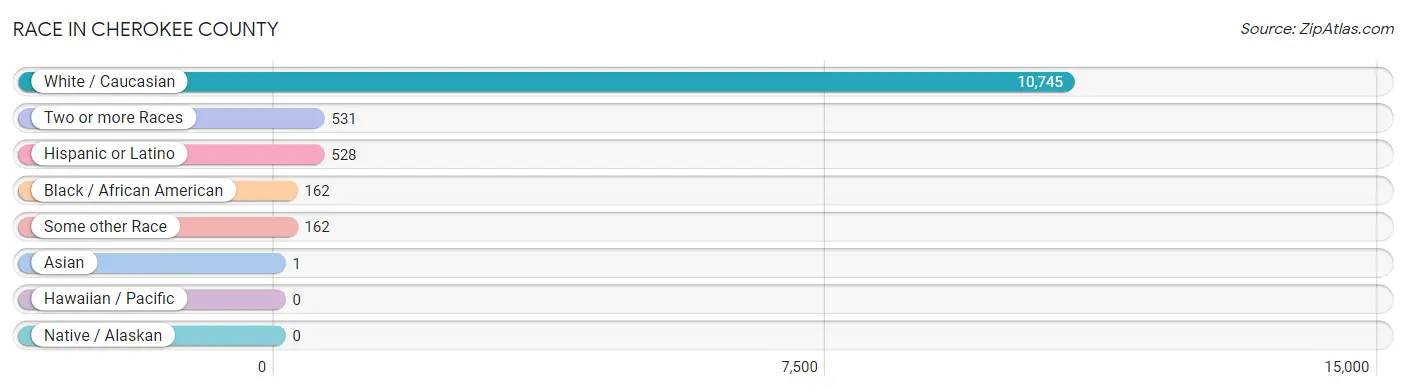
| Race | # Population | % Population |
| Asian | 1 | 0.0% |
| Black / African American | 162 | 1.4% |
| Hawaiian / Pacific | 0 | 0.0% |
| Hispanic or Latino | 528 | 4.5% |
| Native / Alaskan | 0 | 0.0% |
| White / Caucasian | 10,745 | 92.6% |
| Two or more Races | 531 | 4.6% |
| Some other Race | 162 | 1.4% |
| Total | 11,601 | 100.0% |
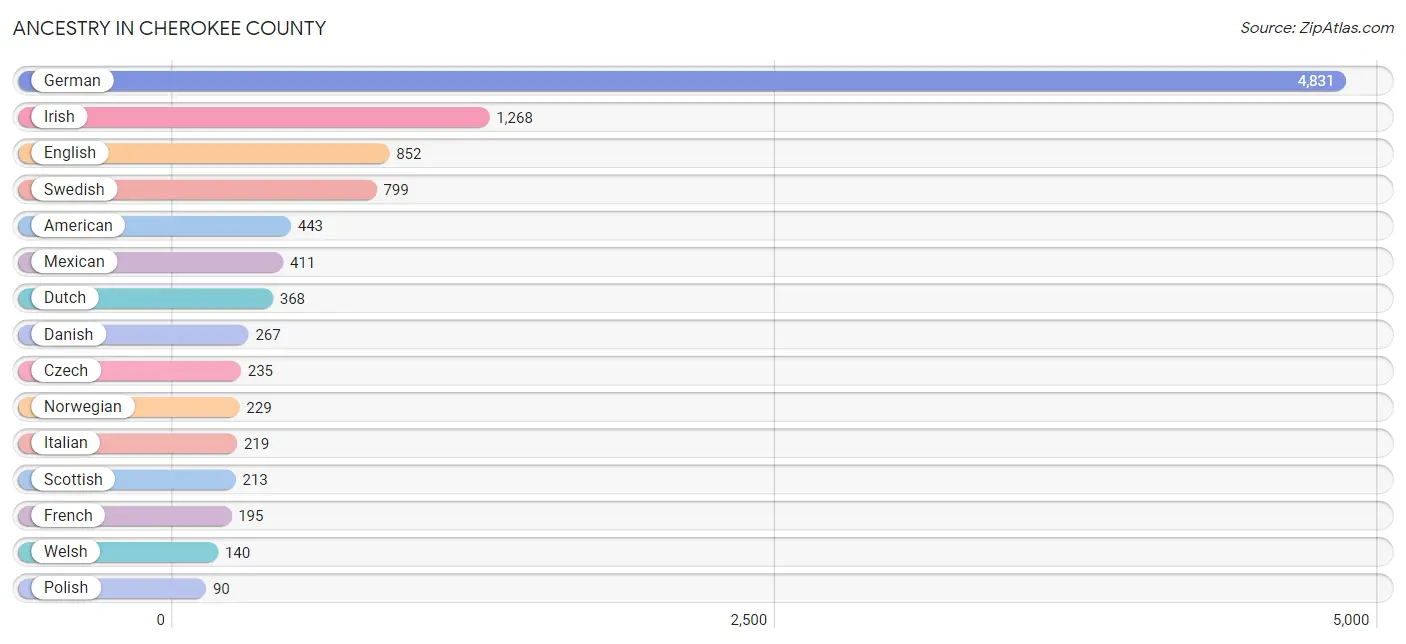
Ancestry in Cherokee County
The most populous ancestries reported in Cherokee County are German (4,831 | 41.6%), Irish (1,268 | 10.9%), English (852 | 7.3%), Swedish (799 | 6.9%), and American (443 | 3.8%), together accounting for 70.6% of all Cherokee County residents.
| Ancestry | # Population | % Population |
| African | 9 | 0.1% |
| American | 443 | 3.8% |
| Arab | 1 | 0.0% |
| Belgian | 2 | 0.0% |
| Bhutanese | 41 | 0.4% |
| Brazilian | 39 | 0.3% |
| British | 33 | 0.3% |
| Bulgarian | 4 | 0.0% |
| Cherokee | 4 | 0.0% |
| Chickasaw | 6 | 0.1% |
| Chippewa | 13 | 0.1% |
| Cuban | 1 | 0.0% |
| Czech | 235 | 2.0% |
| Czechoslovakian | 36 | 0.3% |
| Danish | 267 | 2.3% |
| Dutch | 368 | 3.2% |
| Eastern European | 15 | 0.1% |
| English | 852 | 7.3% |
| European | 82 | 0.7% |
| Finnish | 1 | 0.0% |
| French | 195 | 1.7% |
| German | 4,831 | 41.6% |
| Indian (Asian) | 5 | 0.0% |
| Irish | 1,268 | 10.9% |
| Italian | 219 | 1.9% |
| Lithuanian | 6 | 0.1% |
| Luxembourger | 51 | 0.4% |
| Mexican | 411 | 3.5% |
| Norwegian | 229 | 2.0% |
| Osage | 1 | 0.0% |
| Pennsylvania German | 42 | 0.4% |
| Polish | 90 | 0.8% |
| Portuguese | 9 | 0.1% |
| Puerto Rican | 14 | 0.1% |
| Russian | 17 | 0.2% |
| Samoan | 13 | 0.1% |
| Scandinavian | 37 | 0.3% |
| Scotch-Irish | 29 | 0.3% |
| Scottish | 213 | 1.8% |
| Sioux | 4 | 0.0% |
| Subsaharan African | 9 | 0.1% |
| Swedish | 799 | 6.9% |
| Swiss | 30 | 0.3% |
| Syrian | 1 | 0.0% |
| Ukrainian | 10 | 0.1% |
| Welsh | 140 | 1.2% | View All 46 Rows |
Immigrants in Cherokee County
The most numerous immigrant groups reported in Cherokee County came from Latin America (187 | 1.6%), Central America (148 | 1.3%), Mexico (148 | 1.3%), Brazil (39 | 0.3%), and South America (39 | 0.3%), together accounting for 4.9% of all Cherokee County residents.
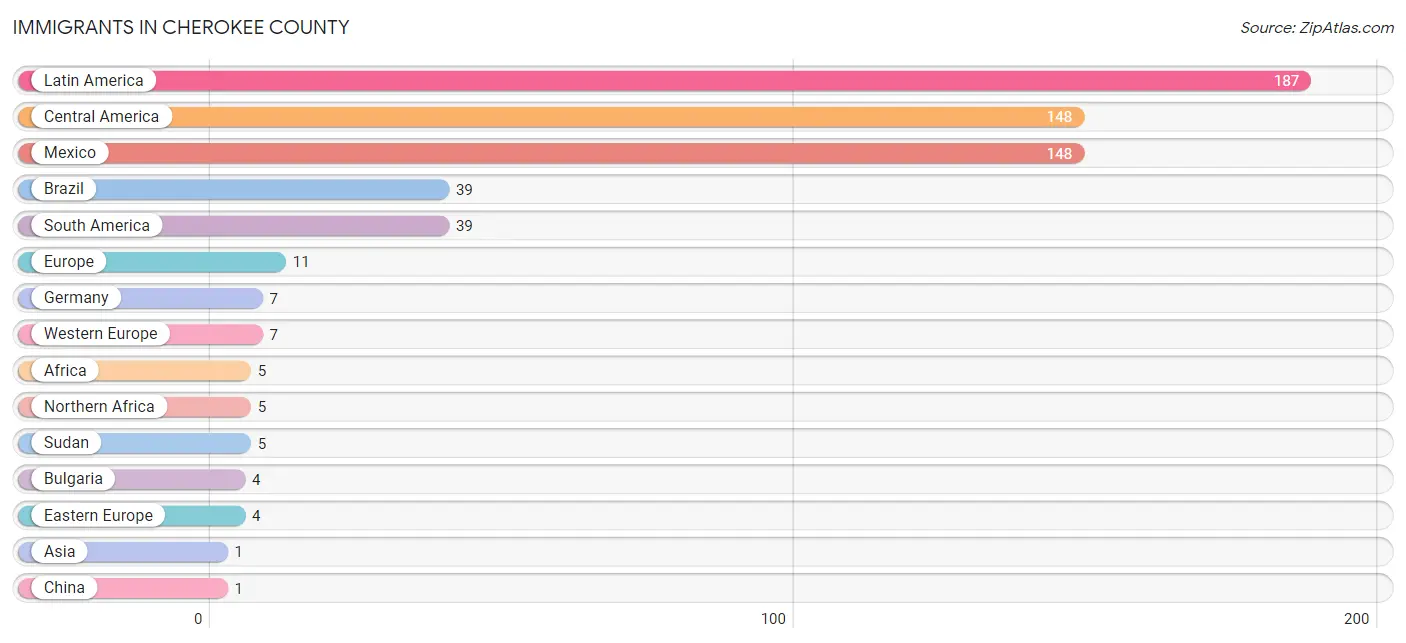
| Immigration Origin | # Population | % Population |
| Africa | 5 | 0.0% |
| Asia | 1 | 0.0% |
| Brazil | 39 | 0.3% |
| Bulgaria | 4 | 0.0% |
| Central America | 148 | 1.3% |
| China | 1 | 0.0% |
| Eastern Asia | 1 | 0.0% |
| Eastern Europe | 4 | 0.0% |
| Europe | 11 | 0.1% |
| Germany | 7 | 0.1% |
| Latin America | 187 | 1.6% |
| Mexico | 148 | 1.3% |
| Northern Africa | 5 | 0.0% |
| South America | 39 | 0.3% |
| Sudan | 5 | 0.0% |
| Western Europe | 7 | 0.1% | View All 16 Rows |
Sex and Age in Cherokee County
Sex and Age in Cherokee County
The most populous age groups in Cherokee County are 60 to 64 Years (490 | 8.4%) for men and 60 to 64 Years (461 | 8.0%) for women.
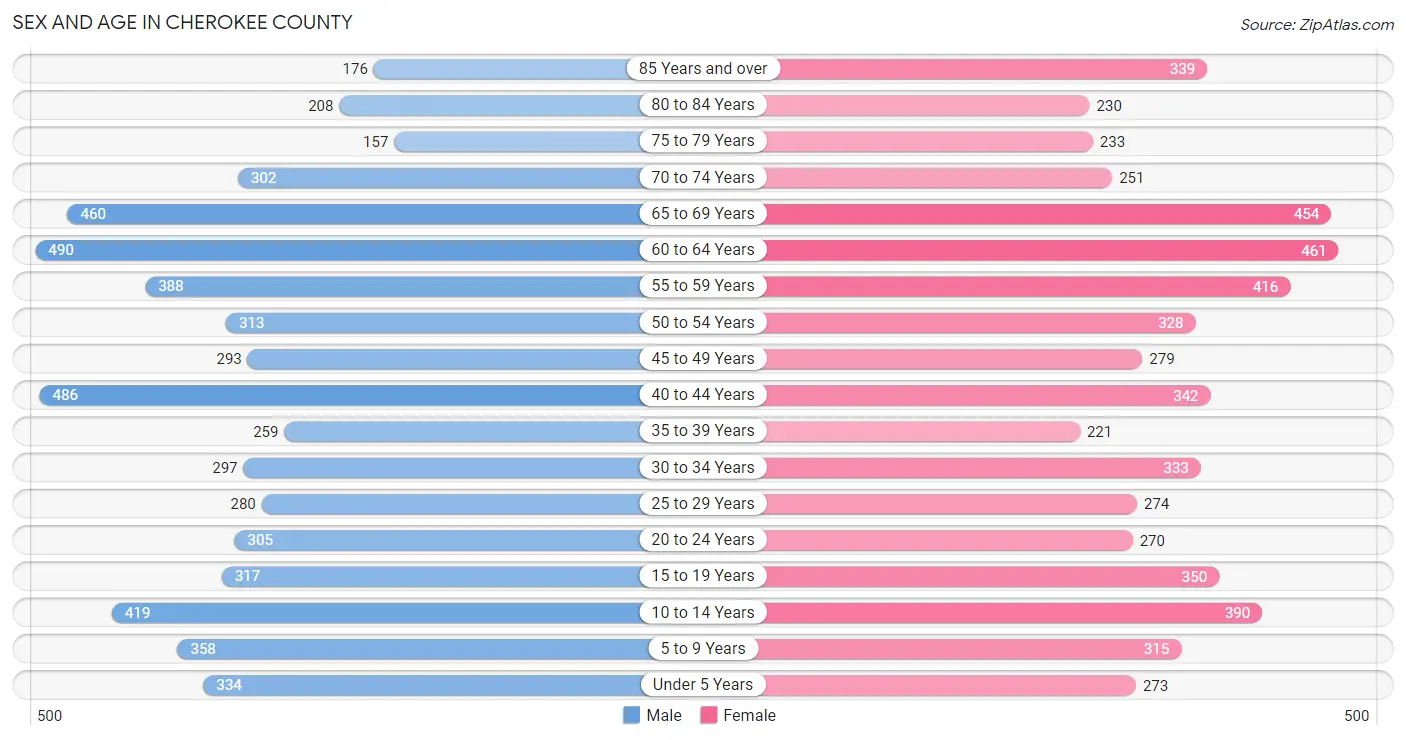
| Age Bracket | Male | Female |
| Under 5 Years | 334 (5.7%) | 273 (4.7%) |
| 5 to 9 Years | 358 (6.1%) | 315 (5.5%) |
| 10 to 14 Years | 419 (7.2%) | 390 (6.8%) |
| 15 to 19 Years | 317 (5.4%) | 350 (6.1%) |
| 20 to 24 Years | 305 (5.2%) | 270 (4.7%) |
| 25 to 29 Years | 280 (4.8%) | 274 (4.8%) |
| 30 to 34 Years | 297 (5.1%) | 333 (5.8%) |
| 35 to 39 Years | 259 (4.4%) | 221 (3.8%) |
| 40 to 44 Years | 486 (8.3%) | 342 (5.9%) |
| 45 to 49 Years | 293 (5.0%) | 279 (4.8%) |
| 50 to 54 Years | 313 (5.4%) | 328 (5.7%) |
| 55 to 59 Years | 388 (6.6%) | 416 (7.2%) |
| 60 to 64 Years | 490 (8.4%) | 461 (8.0%) |
| 65 to 69 Years | 460 (7.9%) | 454 (7.9%) |
| 70 to 74 Years | 302 (5.2%) | 251 (4.4%) |
| 75 to 79 Years | 157 (2.7%) | 233 (4.1%) |
| 80 to 84 Years | 208 (3.6%) | 230 (4.0%) |
| 85 Years and over | 176 (3.0%) | 339 (5.9%) |
| Total | 5,842 (100.0%) | 5,759 (100.0%) |
Families and Households in Cherokee County
Median Family Size in Cherokee County
The median family size in Cherokee County is 2.76 persons per family, with married-couple families (2,556 | 81.7%) accounting for the largest median family size of 2.8 persons per family. On the other hand, single male/father families (211 | 6.8%) represent the smallest median family size with 2.45 persons per family.
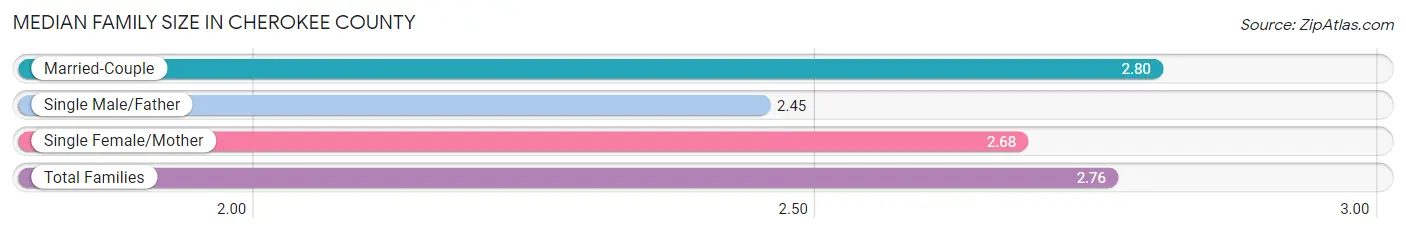
| Family Type | # Families | Family Size |
| Married-Couple | 2,556 (81.7%) | 2.80 |
| Single Male/Father | 211 (6.8%) | 2.45 |
| Single Female/Mother | 360 (11.5%) | 2.68 |
| Total Families | 3,127 (100.0%) | 2.76 |
Median Household Size in Cherokee County
The median household size in Cherokee County is 2.17 persons per household, with single female/mother households (360 | 7.0%) accounting for the largest median household size of 3.01 persons per household. non-family households (2,016 | 39.2%) represent the smallest median household size with 1.16 persons per household.
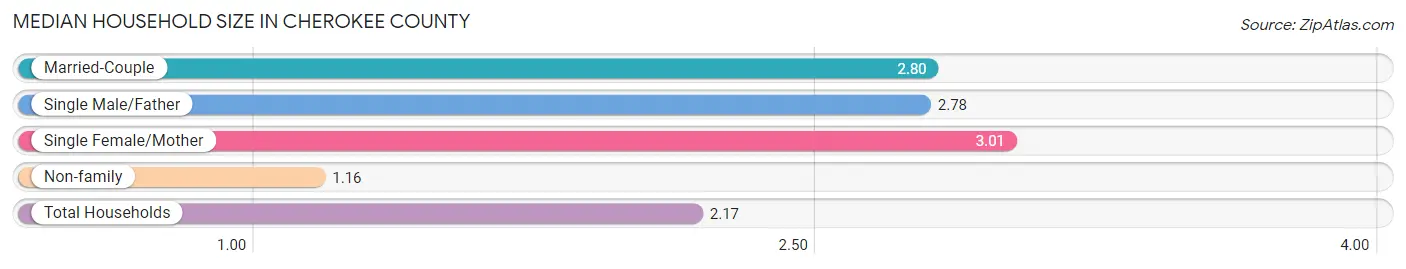
| Household Type | # Households | Household Size |
| Married-Couple | 2,556 (49.7%) | 2.80 |
| Single Male/Father | 211 (4.1%) | 2.78 |
| Single Female/Mother | 360 (7.0%) | 3.01 |
| Non-family | 2,016 (39.2%) | 1.16 |
| Total Households | 5,143 (100.0%) | 2.17 |
Household Size by Marriage Status in Cherokee County
Out of a total of 5,143 households in Cherokee County, 3,127 (60.8%) are family households, while 2,016 (39.2%) are nonfamily households. The most numerous type of family households are 2-person households, comprising 1,720, and the most common type of nonfamily households are 1-person households, comprising 1,730.
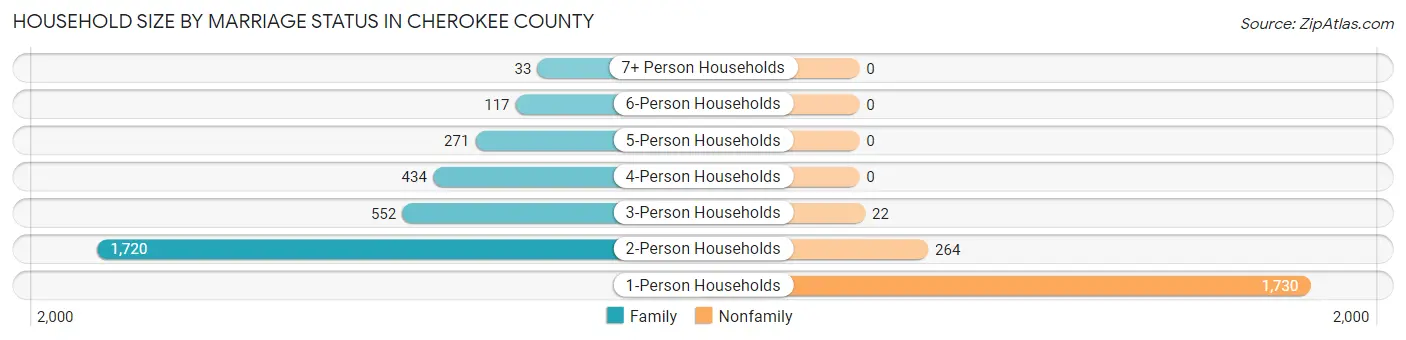
| Household Size | Family Households | Nonfamily Households |
| 1-Person Households | - | 1,730 (33.6%) |
| 2-Person Households | 1,720 (33.4%) | 264 (5.1%) |
| 3-Person Households | 552 (10.7%) | 22 (0.4%) |
| 4-Person Households | 434 (8.4%) | 0 (0.0%) |
| 5-Person Households | 271 (5.3%) | 0 (0.0%) |
| 6-Person Households | 117 (2.3%) | 0 (0.0%) |
| 7+ Person Households | 33 (0.6%) | 0 (0.0%) |
| Total | 3,127 (60.8%) | 2,016 (39.2%) |
Female Fertility in Cherokee County
Fertility by Age in Cherokee County
Average fertility rate in Cherokee County is 140.0 births per 1,000 women. Women in the age bracket of 20 to 34 years have the highest fertility rate with 284.0 births per 1,000 women. Women in the age bracket of 20 to 34 years acount for 83.6% of all women with births.
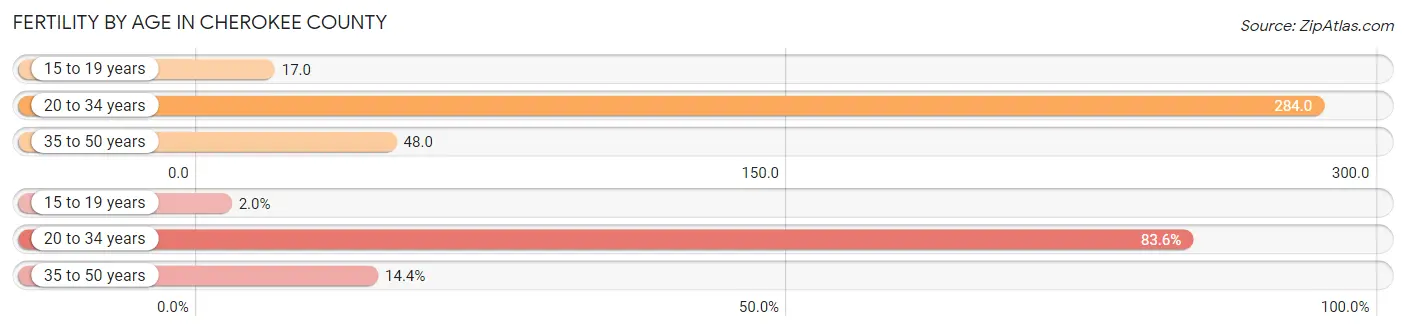
| Age Bracket | Women with Births | Births / 1,000 Women |
| 15 to 19 years | 6 (2.0%) | 17.0 |
| 20 to 34 years | 249 (83.6%) | 284.0 |
| 35 to 50 years | 43 (14.4%) | 48.0 |
| Total | 298 (100.0%) | 140.0 |
Fertility by Age by Marriage Status in Cherokee County
49.0% of women with births (298) in Cherokee County are married. The highest percentage of unmarried women with births falls into 15 to 19 years age bracket with 100.0% of them unmarried at the time of birth, while the lowest percentage of unmarried women with births belong to 35 to 50 years age bracket with 23.3% of them unmarried.
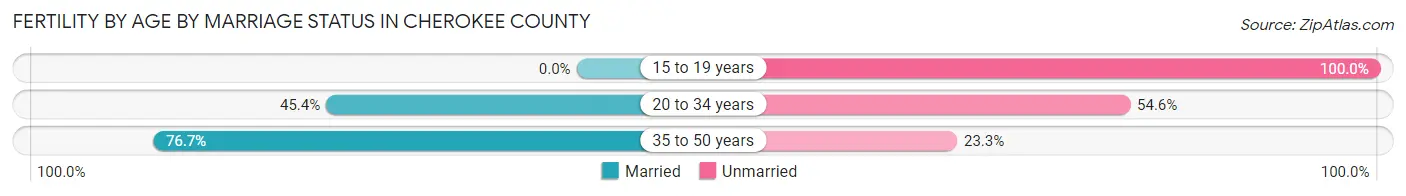
| Age Bracket | Married | Unmarried |
| 15 to 19 years | 0 (0.0%) | 6 (100.0%) |
| 20 to 34 years | 113 (45.4%) | 136 (54.6%) |
| 35 to 50 years | 33 (76.7%) | 10 (23.3%) |
| Total | 146 (49.0%) | 152 (51.0%) |
Fertility by Education in Cherokee County
Average fertility rate in Cherokee County is 140.0 births per 1,000 women. Women with the education attainment of graduate degree have the highest fertility rate of 317.0 births per 1,000 women, while women with the education attainment of less than high school have the lowest fertility at 17.0 births per 1,000 women. Women with the education attainment of college or associate's degree represent 36.6% of all women with births.
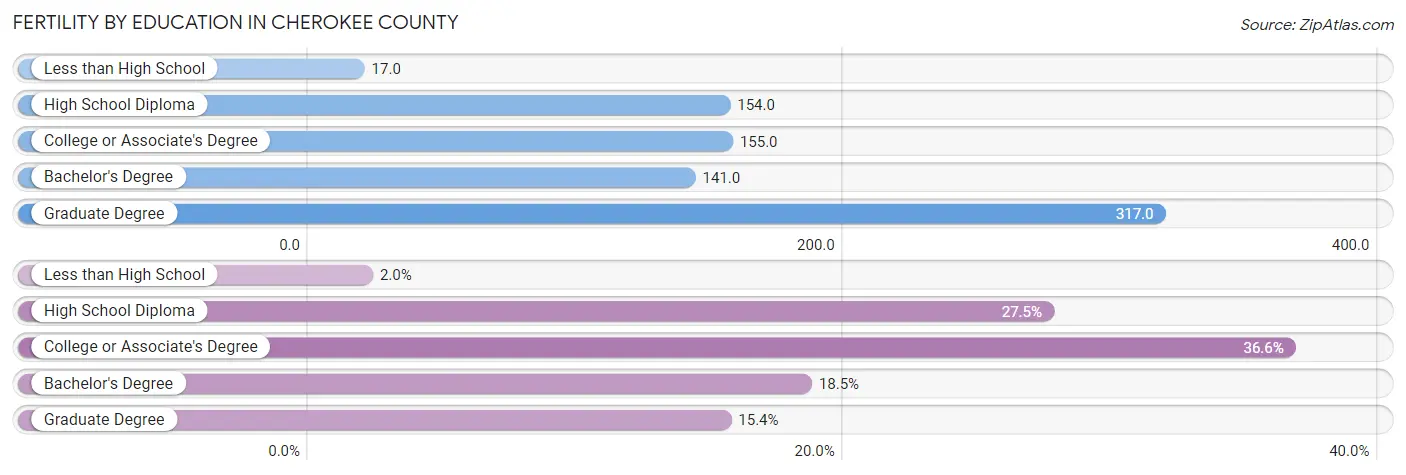
| Educational Attainment | Women with Births | Births / 1,000 Women |
| Less than High School | 6 (2.0%) | 17.0 |
| High School Diploma | 82 (27.5%) | 154.0 |
| College or Associate's Degree | 109 (36.6%) | 155.0 |
| Bachelor's Degree | 55 (18.5%) | 141.0 |
| Graduate Degree | 46 (15.4%) | 317.0 |
| Total | 298 (100.0%) | 140.0 |
Fertility by Education by Marriage Status in Cherokee County
51.0% of women with births in Cherokee County are unmarried. Women with the educational attainment of graduate degree are most likely to be married with 100.0% of them married at childbirth, while women with the educational attainment of high school diploma are least likely to be married with 85.4% of them unmarried at childbirth.
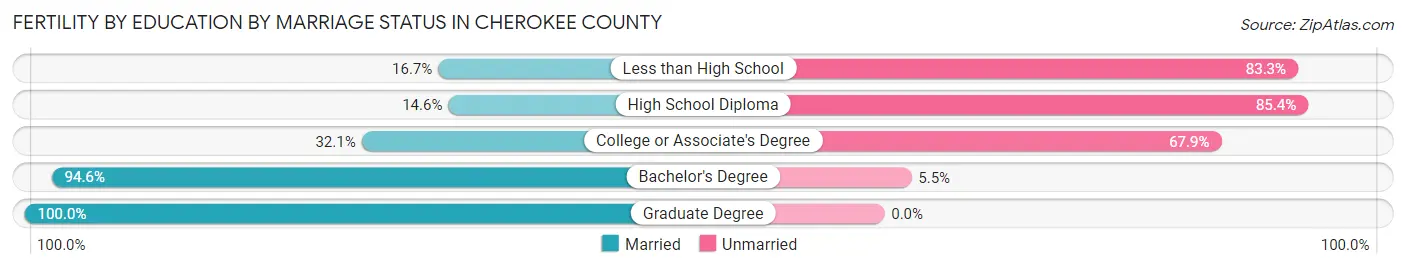
| Educational Attainment | Married | Unmarried |
| Less than High School | 1 (16.7%) | 5 (83.3%) |
| High School Diploma | 12 (14.6%) | 70 (85.4%) |
| College or Associate's Degree | 35 (32.1%) | 74 (67.9%) |
| Bachelor's Degree | 52 (94.6%) | 3 (5.4%) |
| Graduate Degree | 46 (100.0%) | 0 (0.0%) |
| Total | 146 (49.0%) | 152 (51.0%) |
Employment Characteristics in Cherokee County
Employment by Class of Employer in Cherokee County
Among the 5,847 employed individuals in Cherokee County, private company employees (3,657 | 62.5%), self-employed (not incorporated) (736 | 12.6%), and local government employees (587 | 10.0%) make up the most common classes of employment.
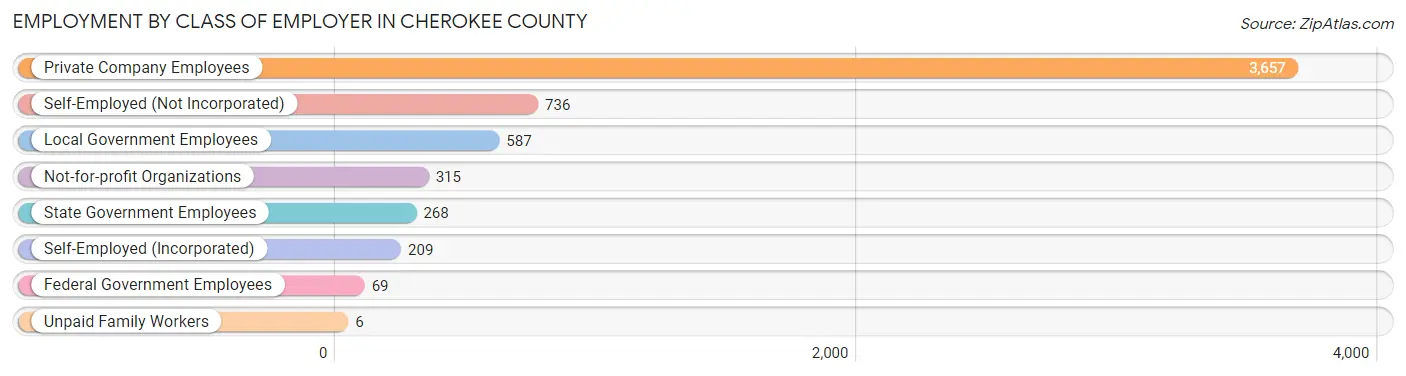
| Employer Class | # Employees | % Employees |
| Private Company Employees | 3,657 | 62.5% |
| Self-Employed (Incorporated) | 209 | 3.6% |
| Self-Employed (Not Incorporated) | 736 | 12.6% |
| Not-for-profit Organizations | 315 | 5.4% |
| Local Government Employees | 587 | 10.0% |
| State Government Employees | 268 | 4.6% |
| Federal Government Employees | 69 | 1.2% |
| Unpaid Family Workers | 6 | 0.1% |
| Total | 5,847 | 100.0% |
Employment Status by Age in Cherokee County
According to the labor force statistics for Cherokee County, out of the total population over 16 years of age (9,419), 65.3% or 6,151 individuals are in the labor force, with 3.2% or 197 of them unemployed. The age group with the highest labor force participation rate is 25 to 29 years, with 97.3% or 539 individuals in the labor force. Within the labor force, the 16 to 19 years age range has the highest percentage of unemployed individuals, with 19.3% or 41 of them being unemployed.
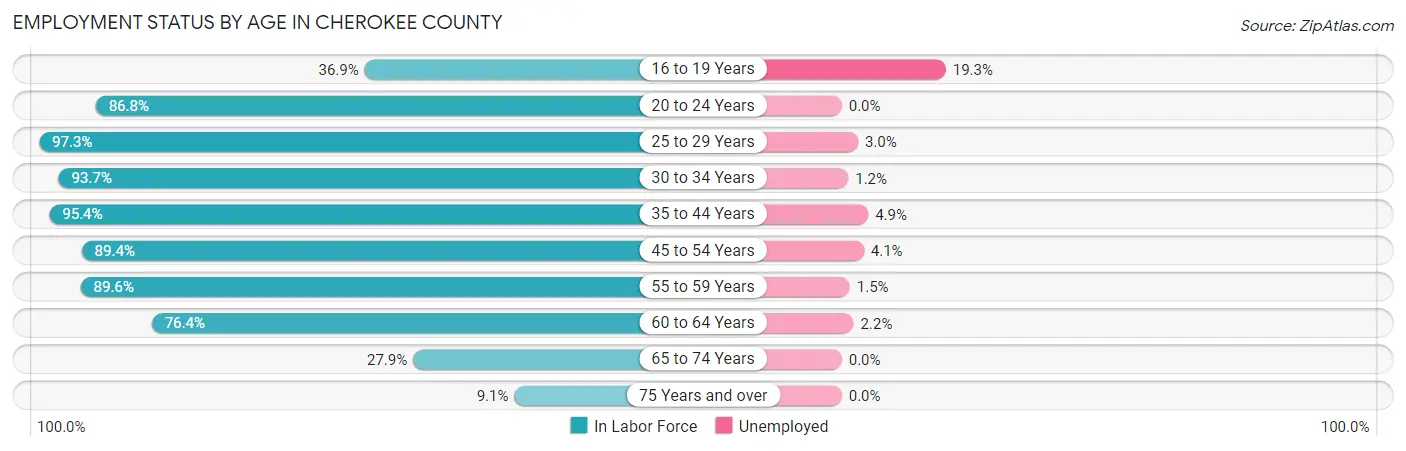
| Age Bracket | In Labor Force | Unemployed |
| 16 to 19 Years | 212 (36.9%) | 41 (19.3%) |
| 20 to 24 Years | 499 (86.8%) | 0 (0.0%) |
| 25 to 29 Years | 539 (97.3%) | 16 (3.0%) |
| 30 to 34 Years | 590 (93.7%) | 7 (1.2%) |
| 35 to 44 Years | 1,248 (95.4%) | 61 (4.9%) |
| 45 to 54 Years | 1,084 (89.4%) | 44 (4.1%) |
| 55 to 59 Years | 720 (89.6%) | 11 (1.5%) |
| 60 to 64 Years | 727 (76.4%) | 16 (2.2%) |
| 65 to 74 Years | 409 (27.9%) | 0 (0.0%) |
| 75 Years and over | 122 (9.1%) | 0 (0.0%) |
| Total | 6,151 (65.3%) | 197 (3.2%) |
Employment Status by Educational Attainment in Cherokee County
According to labor force statistics for Cherokee County, 89.9% of individuals (4,909) out of the total population between 25 and 64 years of age (5,460) are in the labor force, with 3.2% or 157 of them being unemployed. The group with the highest labor force participation rate are those with the educational attainment of bachelor's degree or higher, with 95.1% or 1,086 individuals in the labor force. Within the labor force, individuals with less than high school education have the highest percentage of unemployment, with 7.2% or 23 of them being unemployed.
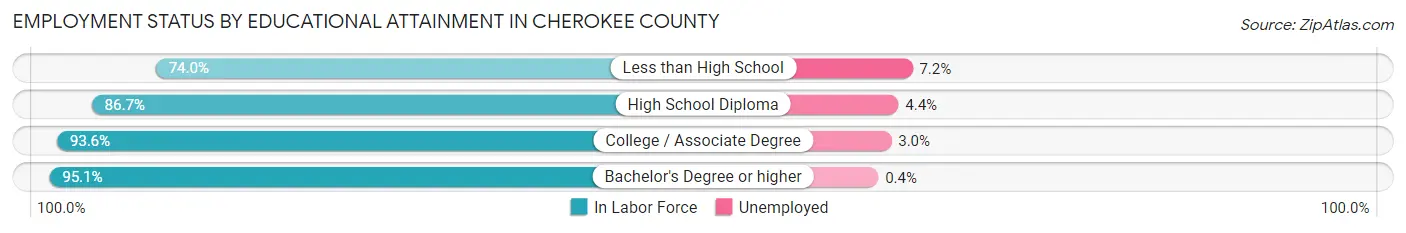
| Educational Attainment | In Labor Force | Unemployed |
| Less than High School | 318 (74.0%) | 31 (7.2%) |
| High School Diploma | 1,688 (86.7%) | 86 (4.4%) |
| College / Associate Degree | 1,817 (93.6%) | 58 (3.0%) |
| Bachelor's Degree or higher | 1,086 (95.1%) | 5 (0.4%) |
| Total | 4,909 (89.9%) | 175 (3.2%) |
Employment Occupations by Sex in Cherokee County
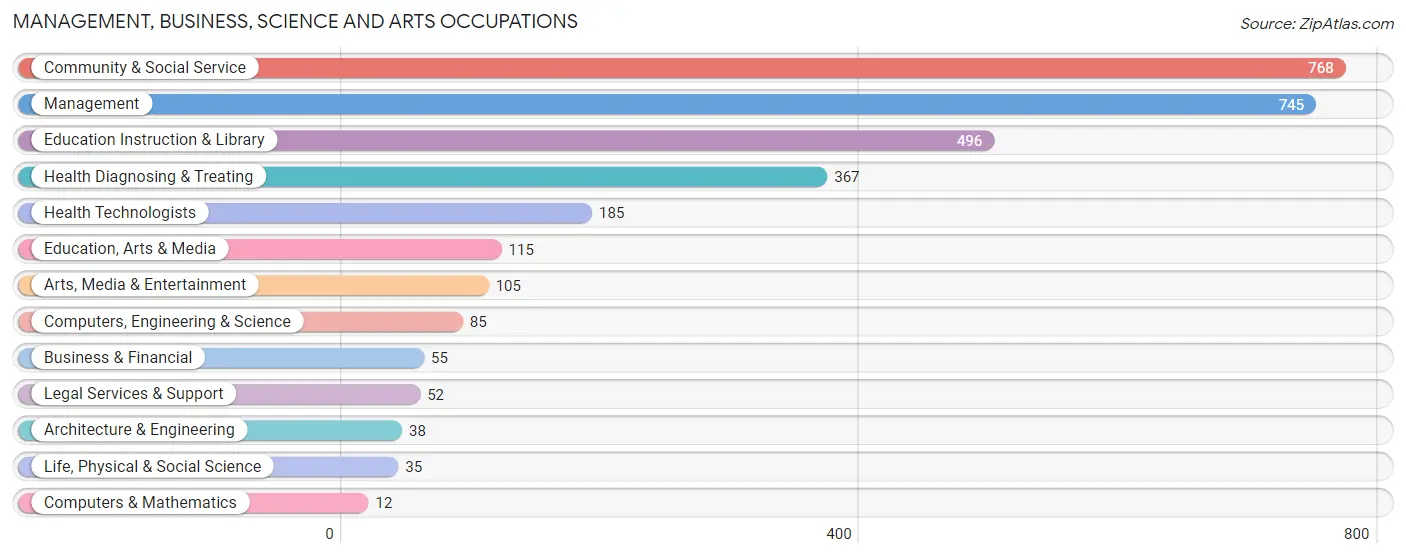
Management, Business, Science and Arts Occupations
The most common Management, Business, Science and Arts occupations in Cherokee County are Community & Social Service (768 | 12.9%), Management (745 | 12.5%), Education Instruction & Library (496 | 8.3%), Health Diagnosing & Treating (367 | 6.2%), and Health Technologists (185 | 3.1%).
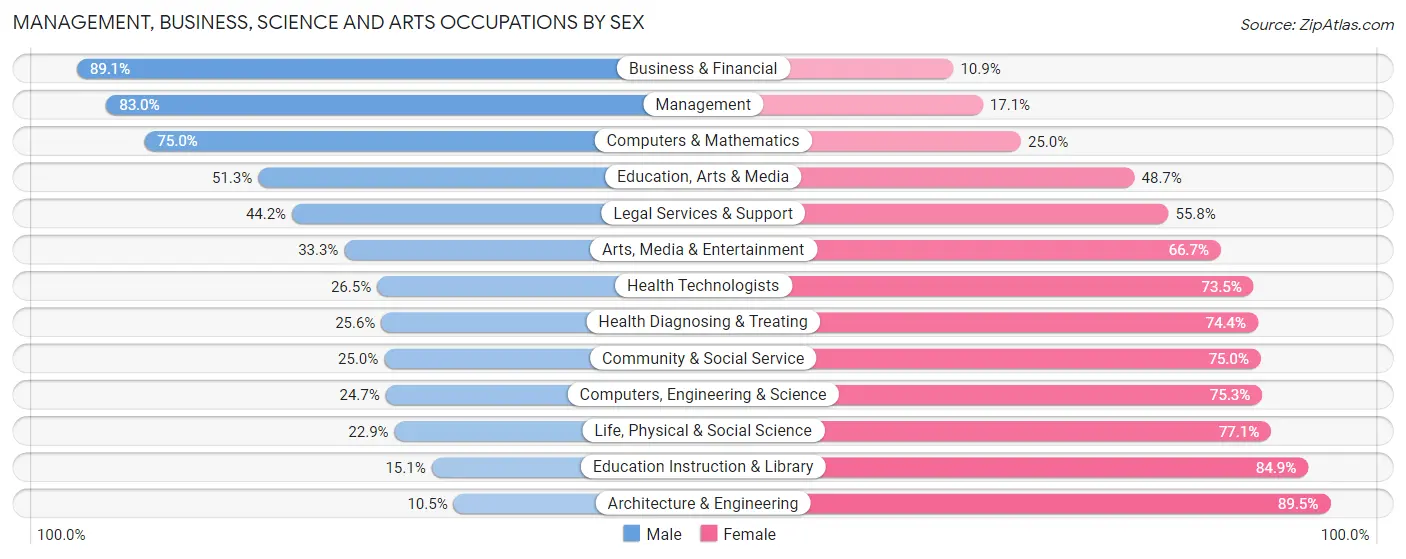
Management, Business, Science and Arts Occupations by Sex
Within the Management, Business, Science and Arts occupations in Cherokee County, the most male-oriented occupations are Business & Financial (89.1%), Management (83.0%), and Computers & Mathematics (75.0%), while the most female-oriented occupations are Architecture & Engineering (89.5%), Education Instruction & Library (84.9%), and Life, Physical & Social Science (77.1%).
| Occupation | Male | Female |
| Management | 618 (83.0%) | 127 (17.1%) |
| Business & Financial | 49 (89.1%) | 6 (10.9%) |
| Computers, Engineering & Science | 21 (24.7%) | 64 (75.3%) |
| Computers & Mathematics | 9 (75.0%) | 3 (25.0%) |
| Architecture & Engineering | 4 (10.5%) | 34 (89.5%) |
| Life, Physical & Social Science | 8 (22.9%) | 27 (77.1%) |
| Community & Social Service | 192 (25.0%) | 576 (75.0%) |
| Education, Arts & Media | 59 (51.3%) | 56 (48.7%) |
| Legal Services & Support | 23 (44.2%) | 29 (55.8%) |
| Education Instruction & Library | 75 (15.1%) | 421 (84.9%) |
| Arts, Media & Entertainment | 35 (33.3%) | 70 (66.7%) |
| Health Diagnosing & Treating | 94 (25.6%) | 273 (74.4%) |
| Health Technologists | 49 (26.5%) | 136 (73.5%) |
| Total (Category) | 974 (48.2%) | 1,046 (51.8%) |
| Total (Overall) | 3,168 (53.2%) | 2,786 (46.8%) |
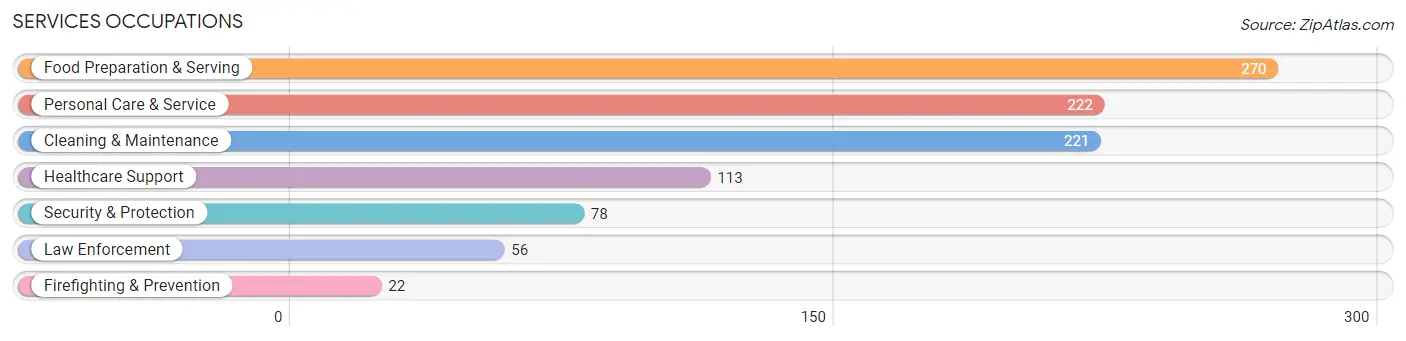
Services Occupations
The most common Services occupations in Cherokee County are Food Preparation & Serving (270 | 4.5%), Personal Care & Service (222 | 3.7%), Cleaning & Maintenance (221 | 3.7%), Healthcare Support (113 | 1.9%), and Security & Protection (78 | 1.3%).
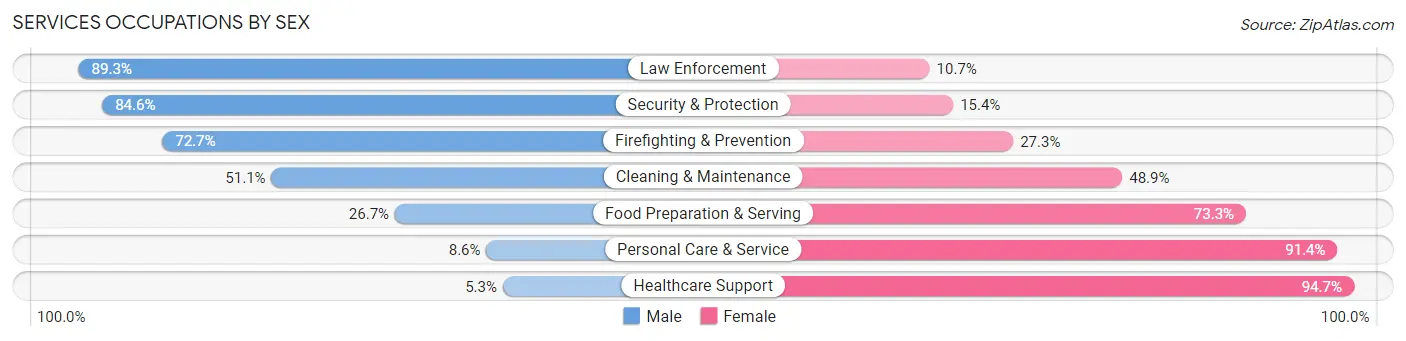
Services Occupations by Sex
Within the Services occupations in Cherokee County, the most male-oriented occupations are Law Enforcement (89.3%), Security & Protection (84.6%), and Firefighting & Prevention (72.7%), while the most female-oriented occupations are Healthcare Support (94.7%), Personal Care & Service (91.4%), and Food Preparation & Serving (73.3%).
| Occupation | Male | Female |
| Healthcare Support | 6 (5.3%) | 107 (94.7%) |
| Security & Protection | 66 (84.6%) | 12 (15.4%) |
| Firefighting & Prevention | 16 (72.7%) | 6 (27.3%) |
| Law Enforcement | 50 (89.3%) | 6 (10.7%) |
| Food Preparation & Serving | 72 (26.7%) | 198 (73.3%) |
| Cleaning & Maintenance | 113 (51.1%) | 108 (48.9%) |
| Personal Care & Service | 19 (8.6%) | 203 (91.4%) |
| Total (Category) | 276 (30.5%) | 628 (69.5%) |
| Total (Overall) | 3,168 (53.2%) | 2,786 (46.8%) |
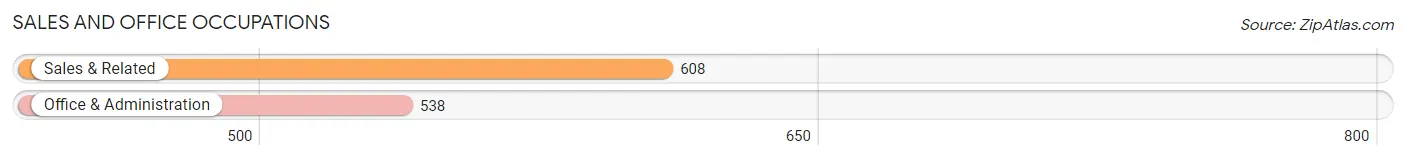
Sales and Office Occupations
The most common Sales and Office occupations in Cherokee County are Sales & Related (608 | 10.2%), and Office & Administration (538 | 9.0%).
Sales and Office Occupations by Sex
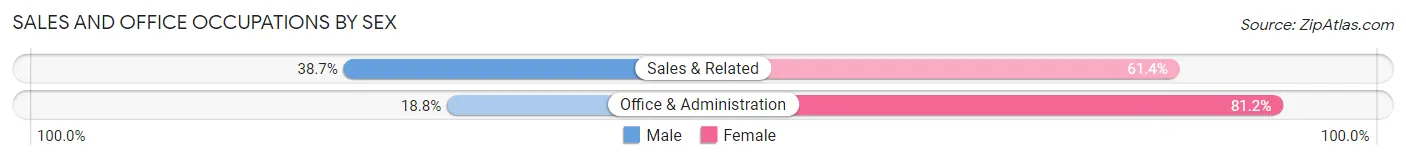
| Occupation | Male | Female |
| Sales & Related | 235 (38.7%) | 373 (61.4%) |
| Office & Administration | 101 (18.8%) | 437 (81.2%) |
| Total (Category) | 336 (29.3%) | 810 (70.7%) |
| Total (Overall) | 3,168 (53.2%) | 2,786 (46.8%) |
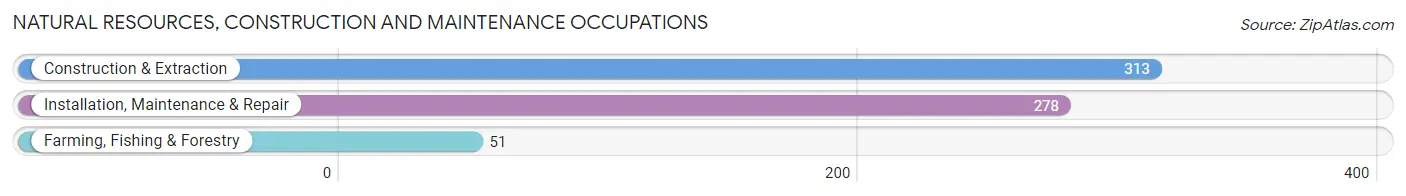
Natural Resources, Construction and Maintenance Occupations
The most common Natural Resources, Construction and Maintenance occupations in Cherokee County are Construction & Extraction (313 | 5.3%), Installation, Maintenance & Repair (278 | 4.7%), and Farming, Fishing & Forestry (51 | 0.9%).
Natural Resources, Construction and Maintenance Occupations by Sex
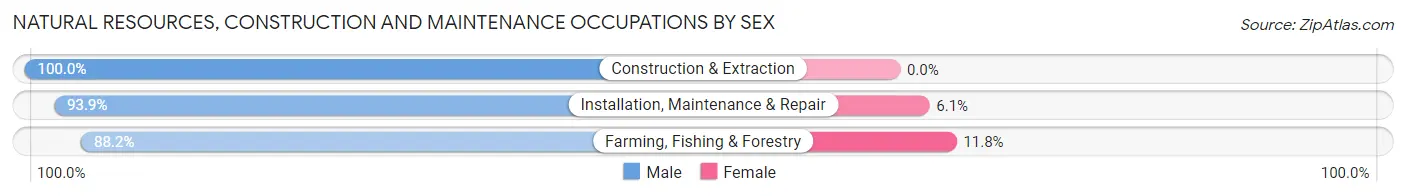
| Occupation | Male | Female |
| Farming, Fishing & Forestry | 45 (88.2%) | 6 (11.8%) |
| Construction & Extraction | 313 (100.0%) | 0 (0.0%) |
| Installation, Maintenance & Repair | 261 (93.9%) | 17 (6.1%) |
| Total (Category) | 619 (96.4%) | 23 (3.6%) |
| Total (Overall) | 3,168 (53.2%) | 2,786 (46.8%) |
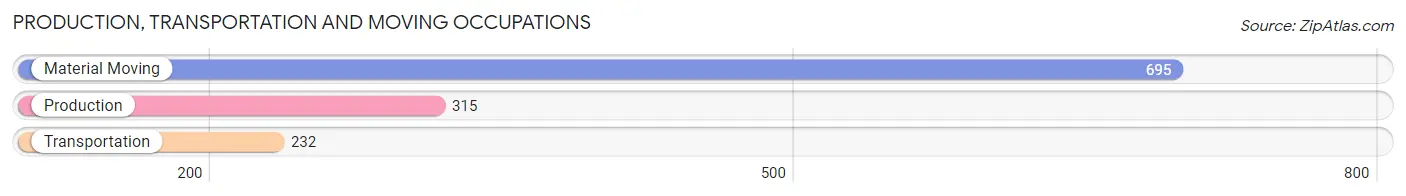
Production, Transportation and Moving Occupations
The most common Production, Transportation and Moving occupations in Cherokee County are Material Moving (695 | 11.7%), Production (315 | 5.3%), and Transportation (232 | 3.9%).
Production, Transportation and Moving Occupations by Sex
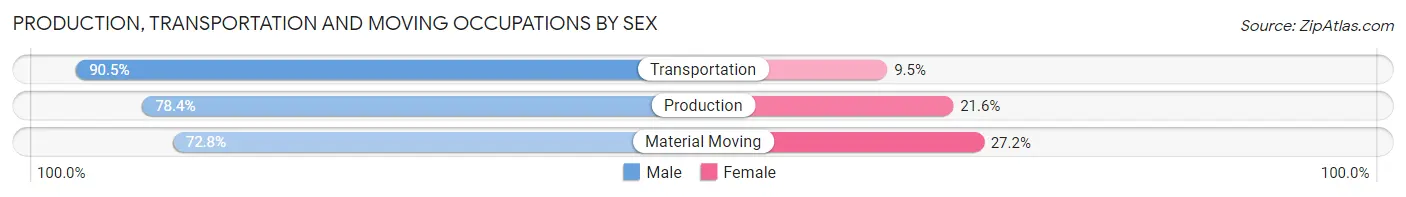
| Occupation | Male | Female |
| Production | 247 (78.4%) | 68 (21.6%) |
| Transportation | 210 (90.5%) | 22 (9.5%) |
| Material Moving | 506 (72.8%) | 189 (27.2%) |
| Total (Category) | 963 (77.5%) | 279 (22.5%) |
| Total (Overall) | 3,168 (53.2%) | 2,786 (46.8%) |
Employment Industries by Sex in Cherokee County
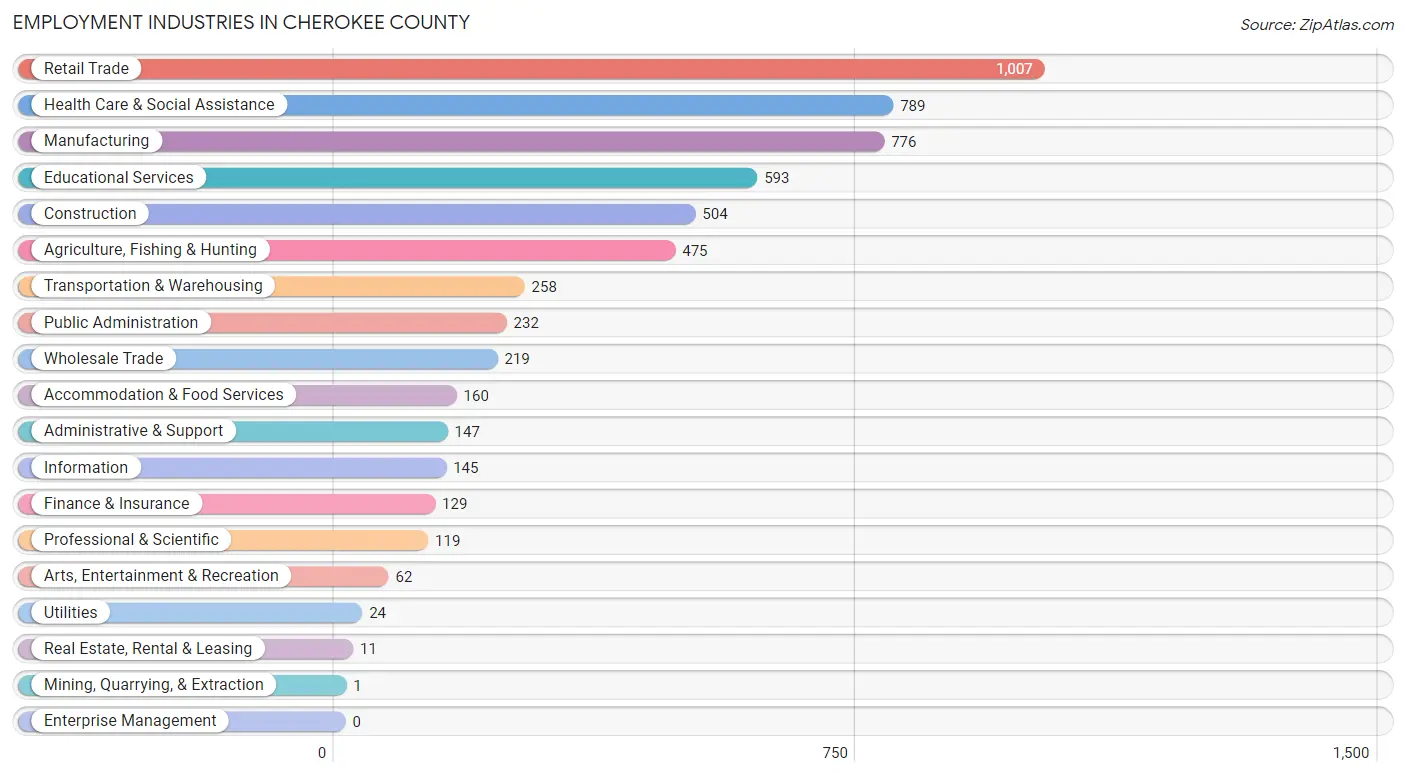
Employment Industries in Cherokee County
The major employment industries in Cherokee County include Retail Trade (1,007 | 16.9%), Health Care & Social Assistance (789 | 13.3%), Manufacturing (776 | 13.0%), Educational Services (593 | 10.0%), and Construction (504 | 8.5%).
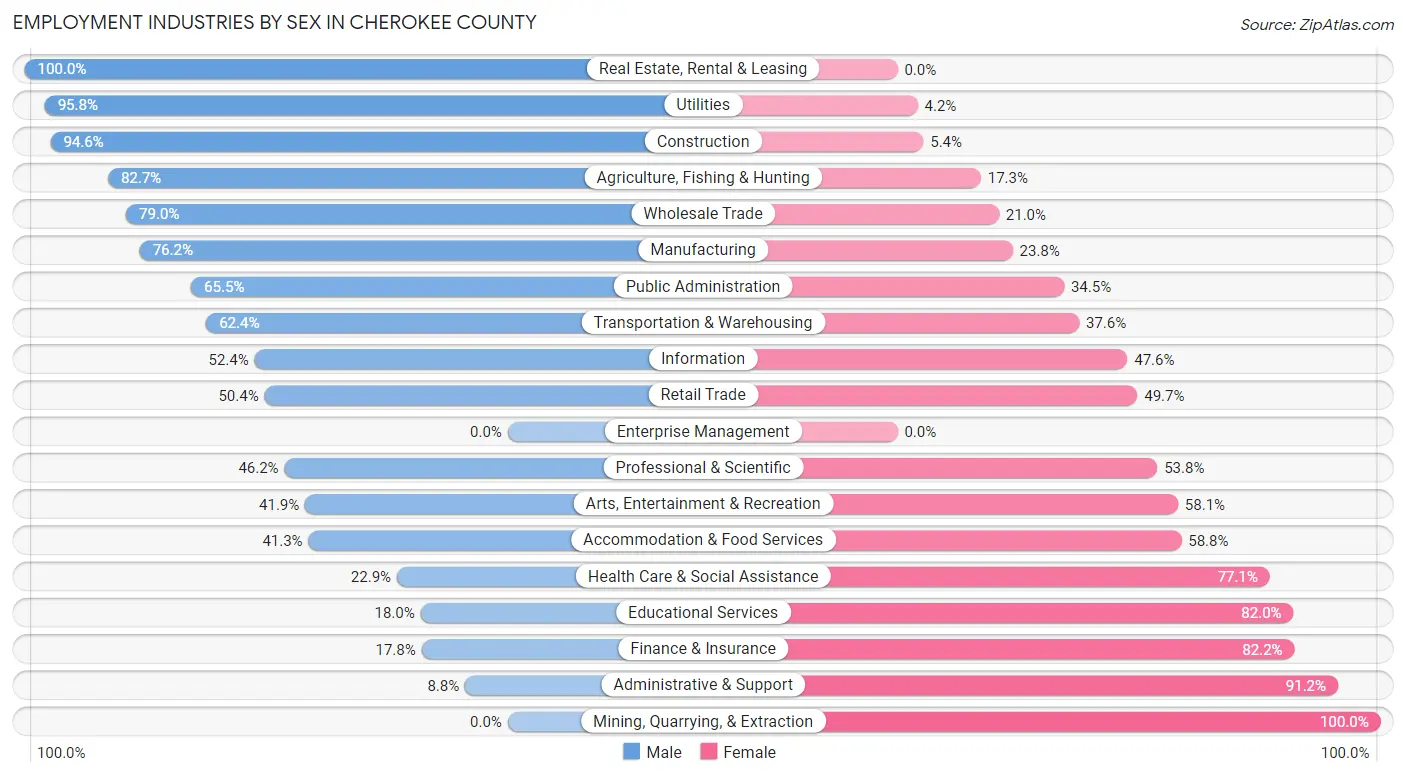
Employment Industries by Sex in Cherokee County
The Cherokee County industries that see more men than women are Real Estate, Rental & Leasing (100.0%), Utilities (95.8%), and Construction (94.6%), whereas the industries that tend to have a higher number of women are Mining, Quarrying, & Extraction (100.0%), Administrative & Support (91.2%), and Finance & Insurance (82.2%).
| Industry | Male | Female |
| Agriculture, Fishing & Hunting | 393 (82.7%) | 82 (17.3%) |
| Mining, Quarrying, & Extraction | 0 (0.0%) | 1 (100.0%) |
| Construction | 477 (94.6%) | 27 (5.4%) |
| Manufacturing | 591 (76.2%) | 185 (23.8%) |
| Wholesale Trade | 173 (79.0%) | 46 (21.0%) |
| Retail Trade | 507 (50.3%) | 500 (49.6%) |
| Transportation & Warehousing | 161 (62.4%) | 97 (37.6%) |
| Utilities | 23 (95.8%) | 1 (4.2%) |
| Information | 76 (52.4%) | 69 (47.6%) |
| Finance & Insurance | 23 (17.8%) | 106 (82.2%) |
| Real Estate, Rental & Leasing | 11 (100.0%) | 0 (0.0%) |
| Professional & Scientific | 55 (46.2%) | 64 (53.8%) |
| Enterprise Management | 0 (0.0%) | 0 (0.0%) |
| Administrative & Support | 13 (8.8%) | 134 (91.2%) |
| Educational Services | 107 (18.0%) | 486 (82.0%) |
| Health Care & Social Assistance | 181 (22.9%) | 608 (77.1%) |
| Arts, Entertainment & Recreation | 26 (41.9%) | 36 (58.1%) |
| Accommodation & Food Services | 66 (41.2%) | 94 (58.8%) |
| Public Administration | 152 (65.5%) | 80 (34.5%) |
| Total | 3,168 (53.2%) | 2,786 (46.8%) |
Education in Cherokee County
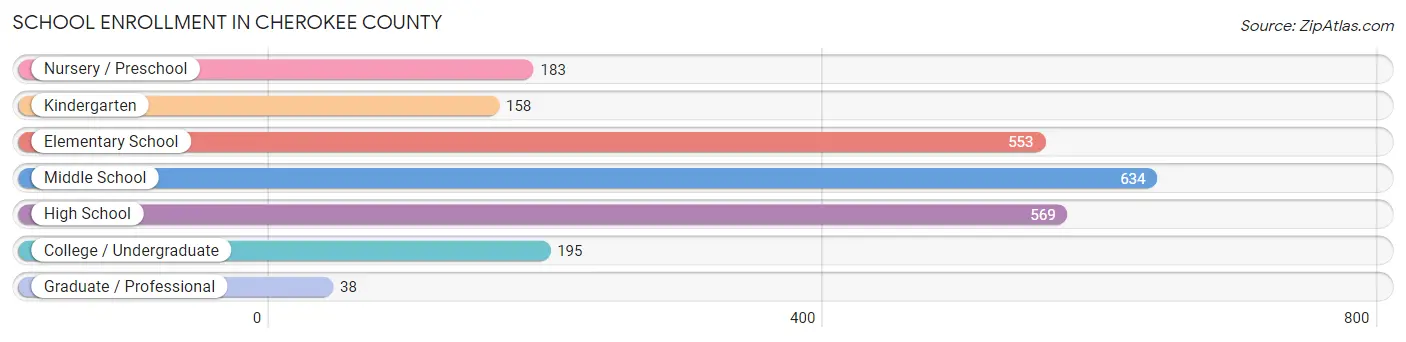
School Enrollment in Cherokee County
The most common levels of schooling among the 2,330 students in Cherokee County are middle school (634 | 27.2%), high school (569 | 24.4%), and elementary school (553 | 23.7%).
| School Level | # Students | % Students |
| Nursery / Preschool | 183 | 7.9% |
| Kindergarten | 158 | 6.8% |
| Elementary School | 553 | 23.7% |
| Middle School | 634 | 27.2% |
| High School | 569 | 24.4% |
| College / Undergraduate | 195 | 8.4% |
| Graduate / Professional | 38 | 1.6% |
| Total | 2,330 | 100.0% |
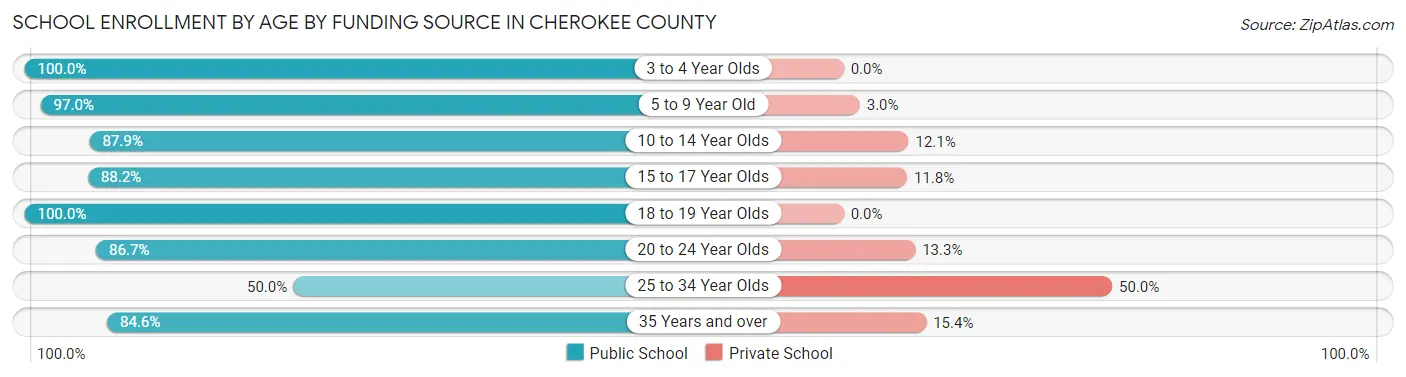
School Enrollment by Age by Funding Source in Cherokee County
Out of a total of 2,330 students who are enrolled in schools in Cherokee County, 231 (9.9%) attend a private institution, while the remaining 2,099 (90.1%) are enrolled in public schools. The age group of 25 to 34 year olds has the highest likelihood of being enrolled in private schools, with 39 (50.0% in the age bracket) enrolled. Conversely, the age group of 3 to 4 year olds has the lowest likelihood of being enrolled in a private school, with 93 (100.0% in the age bracket) attending a public institution.
| Age Bracket | Public School | Private School |
| 3 to 4 Year Olds | 93 (100.0%) | 0 (0.0%) |
| 5 to 9 Year Old | 647 (97.0%) | 20 (3.0%) |
| 10 to 14 Year Olds | 698 (87.9%) | 96 (12.1%) |
| 15 to 17 Year Olds | 396 (88.2%) | 53 (11.8%) |
| 18 to 19 Year Olds | 98 (100.0%) | 0 (0.0%) |
| 20 to 24 Year Olds | 52 (86.7%) | 8 (13.3%) |
| 25 to 34 Year Olds | 39 (50.0%) | 39 (50.0%) |
| 35 Years and over | 77 (84.6%) | 14 (15.4%) |
| Total | 2,099 (90.1%) | 231 (9.9%) |
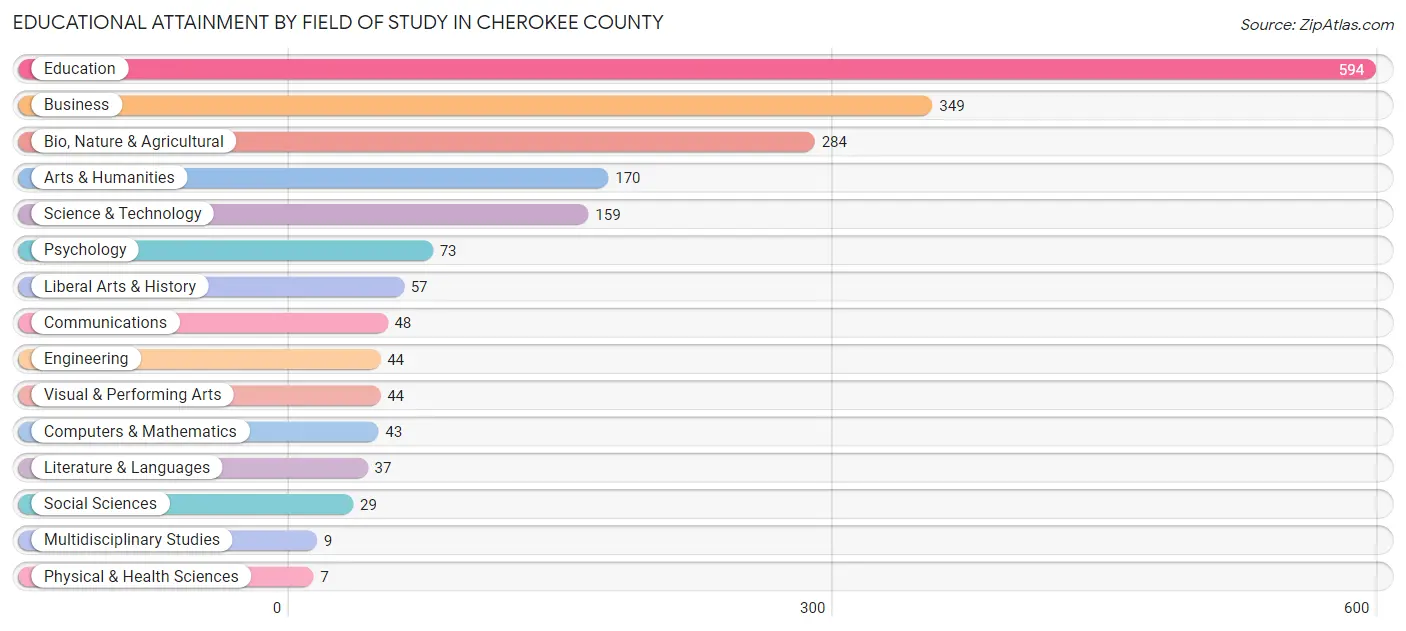
Educational Attainment by Field of Study in Cherokee County
Education (594 | 30.5%), business (349 | 17.9%), bio, nature & agricultural (284 | 14.6%), arts & humanities (170 | 8.7%), and science & technology (159 | 8.2%) are the most common fields of study among 1,947 individuals in Cherokee County who have obtained a bachelor's degree or higher.
| Field of Study | # Graduates | % Graduates |
| Computers & Mathematics | 43 | 2.2% |
| Bio, Nature & Agricultural | 284 | 14.6% |
| Physical & Health Sciences | 7 | 0.4% |
| Psychology | 73 | 3.7% |
| Social Sciences | 29 | 1.5% |
| Engineering | 44 | 2.3% |
| Multidisciplinary Studies | 9 | 0.5% |
| Science & Technology | 159 | 8.2% |
| Business | 349 | 17.9% |
| Education | 594 | 30.5% |
| Literature & Languages | 37 | 1.9% |
| Liberal Arts & History | 57 | 2.9% |
| Visual & Performing Arts | 44 | 2.3% |
| Communications | 48 | 2.5% |
| Arts & Humanities | 170 | 8.7% |
| Total | 1,947 | 100.0% |
Transportation & Commute in Cherokee County
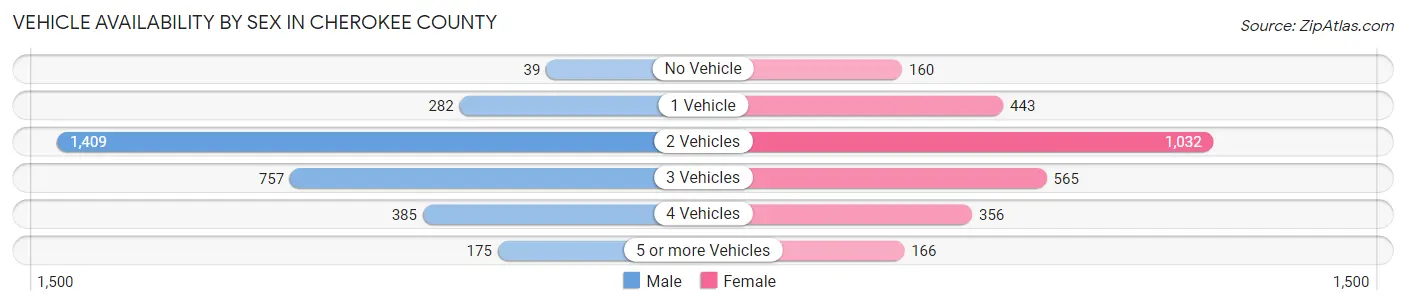
Vehicle Availability by Sex in Cherokee County
The most prevalent vehicle ownership categories in Cherokee County are males with 2 vehicles (1,409, accounting for 46.2%) and females with 2 vehicles (1,032, making up 51.8%).
| Vehicles Available | Male | Female |
| No Vehicle | 39 (1.3%) | 160 (5.9%) |
| 1 Vehicle | 282 (9.3%) | 443 (16.3%) |
| 2 Vehicles | 1,409 (46.2%) | 1,032 (37.9%) |
| 3 Vehicles | 757 (24.8%) | 565 (20.8%) |
| 4 Vehicles | 385 (12.6%) | 356 (13.1%) |
| 5 or more Vehicles | 175 (5.7%) | 166 (6.1%) |
| Total | 3,047 (100.0%) | 2,722 (100.0%) |
Commute Time in Cherokee County
The most frequently occuring commute durations in Cherokee County are 5 to 9 minutes (1,405 commuters, 26.4%), 10 to 14 minutes (847 commuters, 15.9%), and less than 5 minutes (818 commuters, 15.4%).
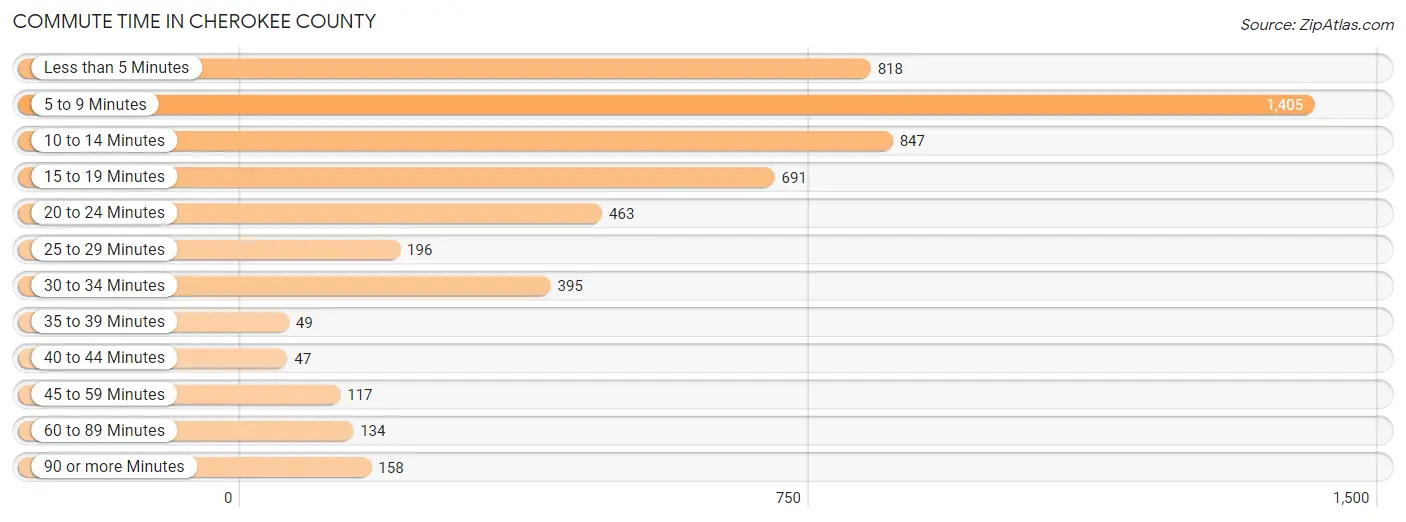
| Commute Time | # Commuters | % Commuters |
| Less than 5 Minutes | 818 | 15.4% |
| 5 to 9 Minutes | 1,405 | 26.4% |
| 10 to 14 Minutes | 847 | 15.9% |
| 15 to 19 Minutes | 691 | 13.0% |
| 20 to 24 Minutes | 463 | 8.7% |
| 25 to 29 Minutes | 196 | 3.7% |
| 30 to 34 Minutes | 395 | 7.4% |
| 35 to 39 Minutes | 49 | 0.9% |
| 40 to 44 Minutes | 47 | 0.9% |
| 45 to 59 Minutes | 117 | 2.2% |
| 60 to 89 Minutes | 134 | 2.5% |
| 90 or more Minutes | 158 | 3.0% |
Commute Time by Sex in Cherokee County
The most common commute times in Cherokee County are 5 to 9 minutes (659 commuters, 23.2%) for males and 5 to 9 minutes (746 commuters, 30.0%) for females.
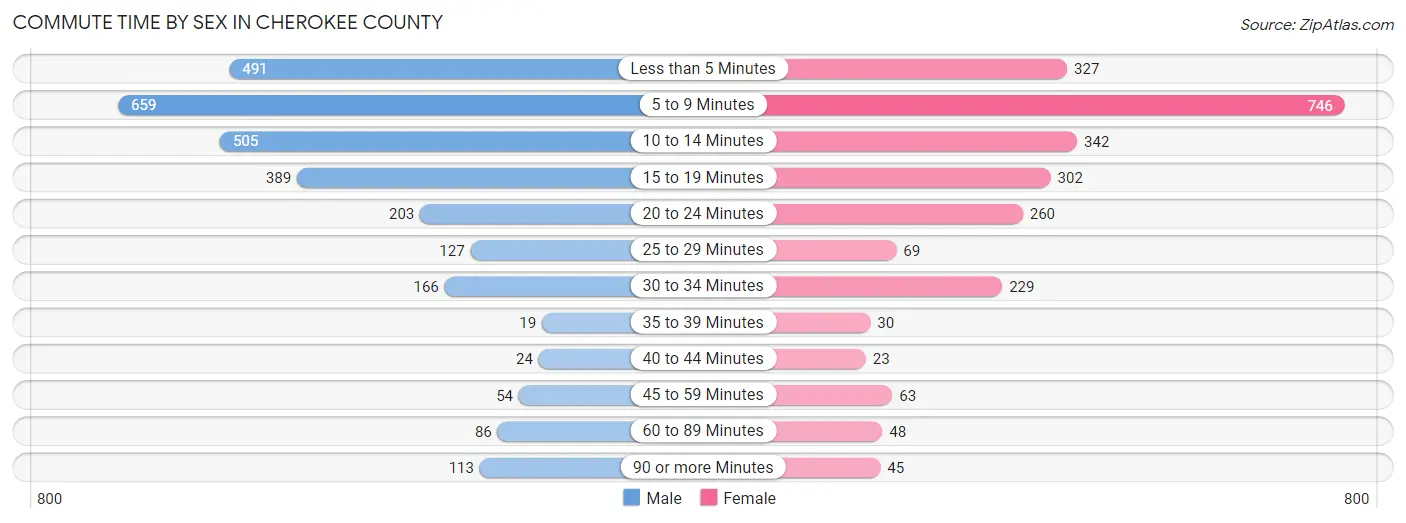
| Commute Time | Male | Female |
| Less than 5 Minutes | 491 (17.3%) | 327 (13.2%) |
| 5 to 9 Minutes | 659 (23.2%) | 746 (30.0%) |
| 10 to 14 Minutes | 505 (17.8%) | 342 (13.8%) |
| 15 to 19 Minutes | 389 (13.7%) | 302 (12.2%) |
| 20 to 24 Minutes | 203 (7.2%) | 260 (10.5%) |
| 25 to 29 Minutes | 127 (4.5%) | 69 (2.8%) |
| 30 to 34 Minutes | 166 (5.9%) | 229 (9.2%) |
| 35 to 39 Minutes | 19 (0.7%) | 30 (1.2%) |
| 40 to 44 Minutes | 24 (0.9%) | 23 (0.9%) |
| 45 to 59 Minutes | 54 (1.9%) | 63 (2.5%) |
| 60 to 89 Minutes | 86 (3.0%) | 48 (1.9%) |
| 90 or more Minutes | 113 (4.0%) | 45 (1.8%) |
Time of Departure to Work by Sex in Cherokee County
The most frequent times of departure to work in Cherokee County are 7:00 AM to 7:29 AM (526, 18.5%) for males and 7:30 AM to 7:59 AM (490, 19.7%) for females.
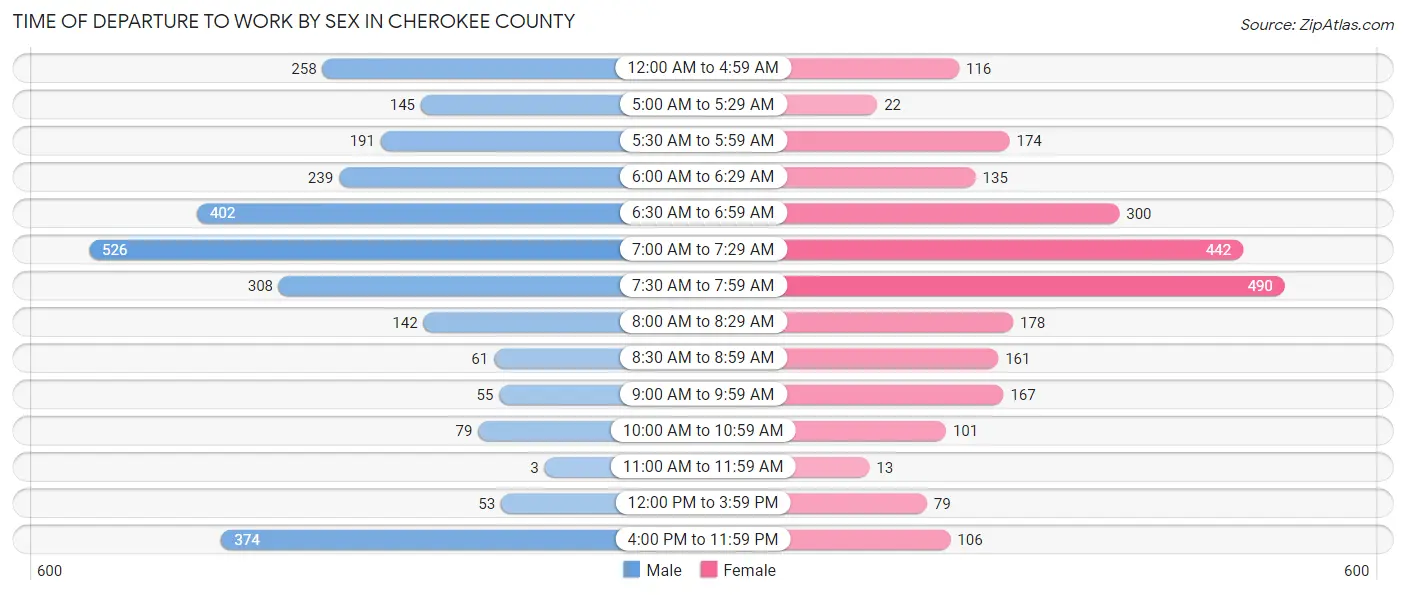
| Time of Departure | Male | Female |
| 12:00 AM to 4:59 AM | 258 (9.1%) | 116 (4.7%) |
| 5:00 AM to 5:29 AM | 145 (5.1%) | 22 (0.9%) |
| 5:30 AM to 5:59 AM | 191 (6.7%) | 174 (7.0%) |
| 6:00 AM to 6:29 AM | 239 (8.4%) | 135 (5.4%) |
| 6:30 AM to 6:59 AM | 402 (14.2%) | 300 (12.1%) |
| 7:00 AM to 7:29 AM | 526 (18.5%) | 442 (17.8%) |
| 7:30 AM to 7:59 AM | 308 (10.9%) | 490 (19.7%) |
| 8:00 AM to 8:29 AM | 142 (5.0%) | 178 (7.2%) |
| 8:30 AM to 8:59 AM | 61 (2.1%) | 161 (6.5%) |
| 9:00 AM to 9:59 AM | 55 (1.9%) | 167 (6.7%) |
| 10:00 AM to 10:59 AM | 79 (2.8%) | 101 (4.1%) |
| 11:00 AM to 11:59 AM | 3 (0.1%) | 13 (0.5%) |
| 12:00 PM to 3:59 PM | 53 (1.9%) | 79 (3.2%) |
| 4:00 PM to 11:59 PM | 374 (13.2%) | 106 (4.3%) |
| Total | 2,836 (100.0%) | 2,484 (100.0%) |
Housing Occupancy in Cherokee County
Occupancy by Ownership in Cherokee County
Of the total 5,143 dwellings in Cherokee County, owner-occupied units account for 3,810 (74.1%), while renter-occupied units make up 1,333 (25.9%).
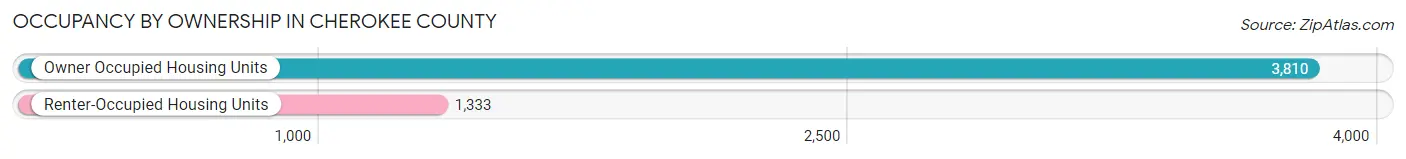
| Occupancy | # Housing Units | % Housing Units |
| Owner Occupied Housing Units | 3,810 | 74.1% |
| Renter-Occupied Housing Units | 1,333 | 25.9% |
| Total Occupied Housing Units | 5,143 | 100.0% |
Occupancy by Household Size in Cherokee County
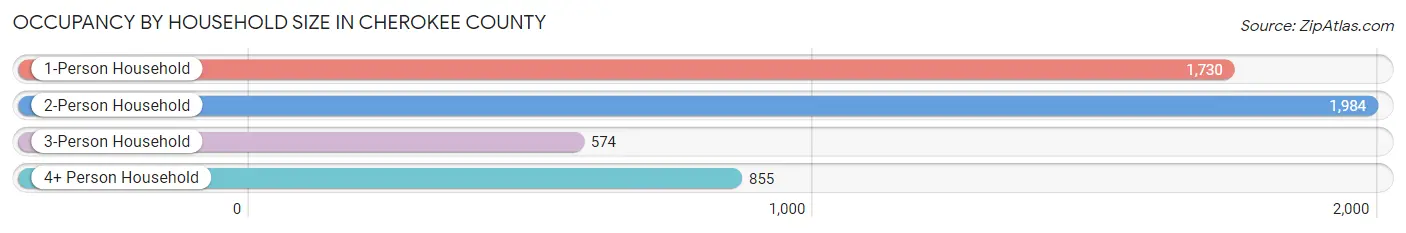
| Household Size | # Housing Units | % Housing Units |
| 1-Person Household | 1,730 | 33.6% |
| 2-Person Household | 1,984 | 38.6% |
| 3-Person Household | 574 | 11.2% |
| 4+ Person Household | 855 | 16.6% |
| Total Housing Units | 5,143 | 100.0% |
Occupancy by Ownership by Household Size in Cherokee County
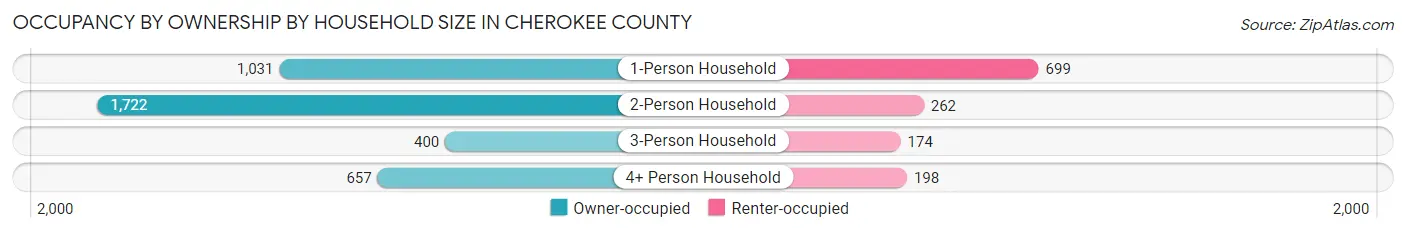
| Household Size | Owner-occupied | Renter-occupied |
| 1-Person Household | 1,031 (59.6%) | 699 (40.4%) |
| 2-Person Household | 1,722 (86.8%) | 262 (13.2%) |
| 3-Person Household | 400 (69.7%) | 174 (30.3%) |
| 4+ Person Household | 657 (76.8%) | 198 (23.2%) |
| Total Housing Units | 3,810 (74.1%) | 1,333 (25.9%) |
Occupancy by Educational Attainment in Cherokee County
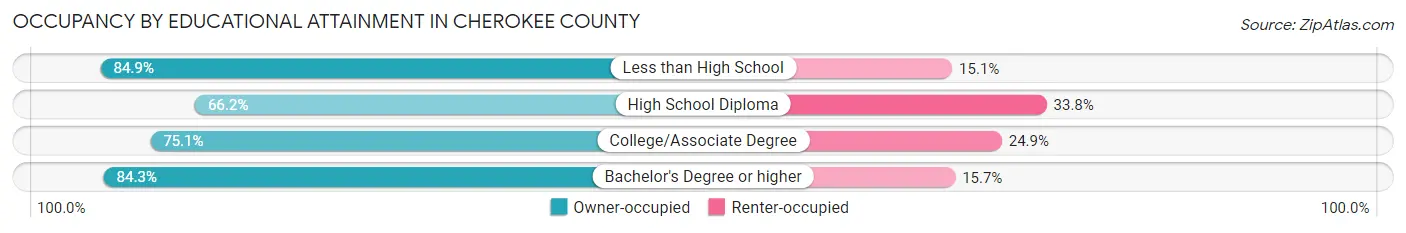
| Household Size | Owner-occupied | Renter-occupied |
| Less than High School | 203 (84.9%) | 36 (15.1%) |
| High School Diploma | 1,358 (66.2%) | 693 (33.8%) |
| College/Associate Degree | 1,275 (75.1%) | 423 (24.9%) |
| Bachelor's Degree or higher | 974 (84.3%) | 181 (15.7%) |
Occupancy by Age of Householder in Cherokee County
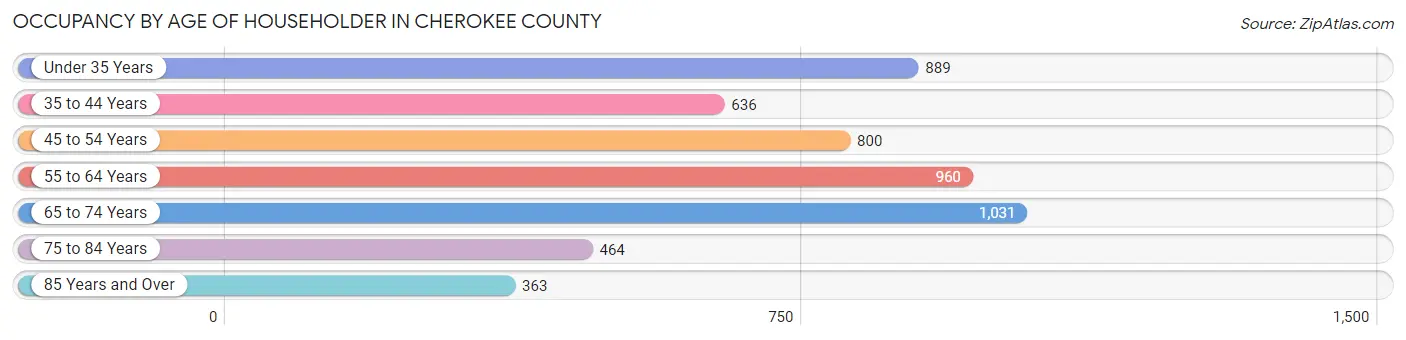
| Age Bracket | # Households | % Households |
| Under 35 Years | 889 | 17.3% |
| 35 to 44 Years | 636 | 12.4% |
| 45 to 54 Years | 800 | 15.6% |
| 55 to 64 Years | 960 | 18.7% |
| 65 to 74 Years | 1,031 | 20.1% |
| 75 to 84 Years | 464 | 9.0% |
| 85 Years and Over | 363 | 7.1% |
| Total | 5,143 | 100.0% |
Housing Finances in Cherokee County
Median Income by Occupancy in Cherokee County
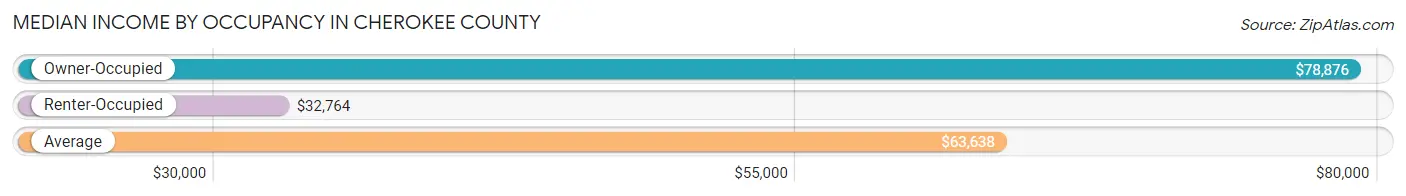
| Occupancy Type | # Households | Median Income |
| Owner-Occupied | 3,810 (74.1%) | $78,876 |
| Renter-Occupied | 1,333 (25.9%) | $32,764 |
| Average | 5,143 (100.0%) | $63,638 |
Occupancy by Householder Income Bracket in Cherokee County
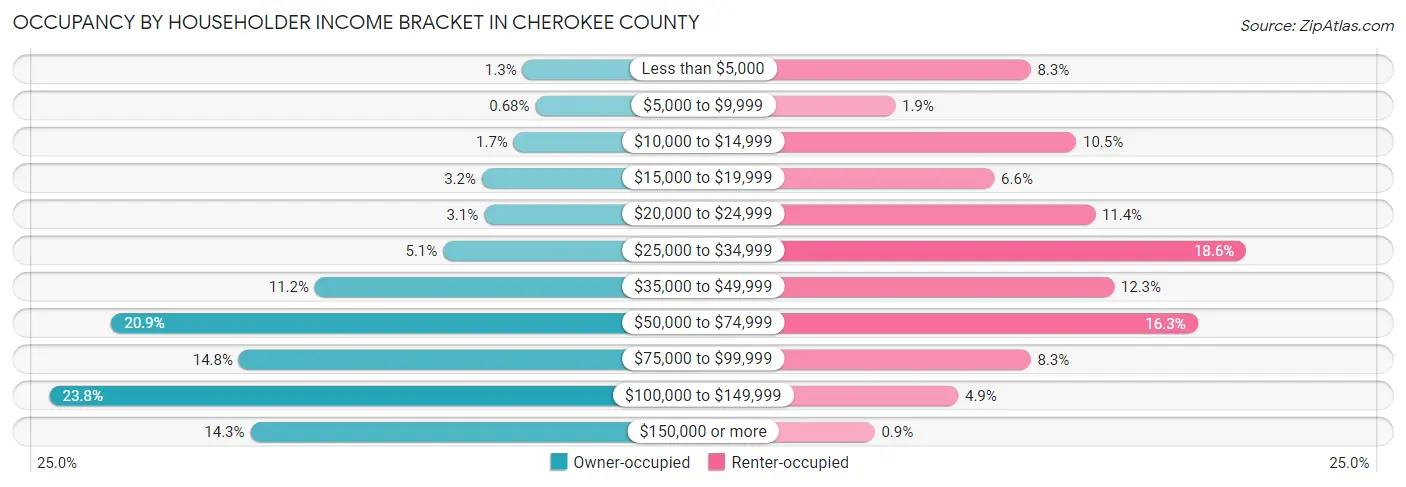
| Income Bracket | Owner-occupied | Renter-occupied |
| Less than $5,000 | 49 (1.3%) | 111 (8.3%) |
| $5,000 to $9,999 | 26 (0.7%) | 25 (1.9%) |
| $10,000 to $14,999 | 65 (1.7%) | 140 (10.5%) |
| $15,000 to $19,999 | 123 (3.2%) | 88 (6.6%) |
| $20,000 to $24,999 | 119 (3.1%) | 152 (11.4%) |
| $25,000 to $34,999 | 193 (5.1%) | 248 (18.6%) |
| $35,000 to $49,999 | 426 (11.2%) | 164 (12.3%) |
| $50,000 to $74,999 | 795 (20.9%) | 217 (16.3%) |
| $75,000 to $99,999 | 564 (14.8%) | 111 (8.3%) |
| $100,000 to $149,999 | 907 (23.8%) | 65 (4.9%) |
| $150,000 or more | 543 (14.2%) | 12 (0.9%) |
| Total | 3,810 (100.0%) | 1,333 (100.0%) |
Monthly Housing Cost Tiers in Cherokee County
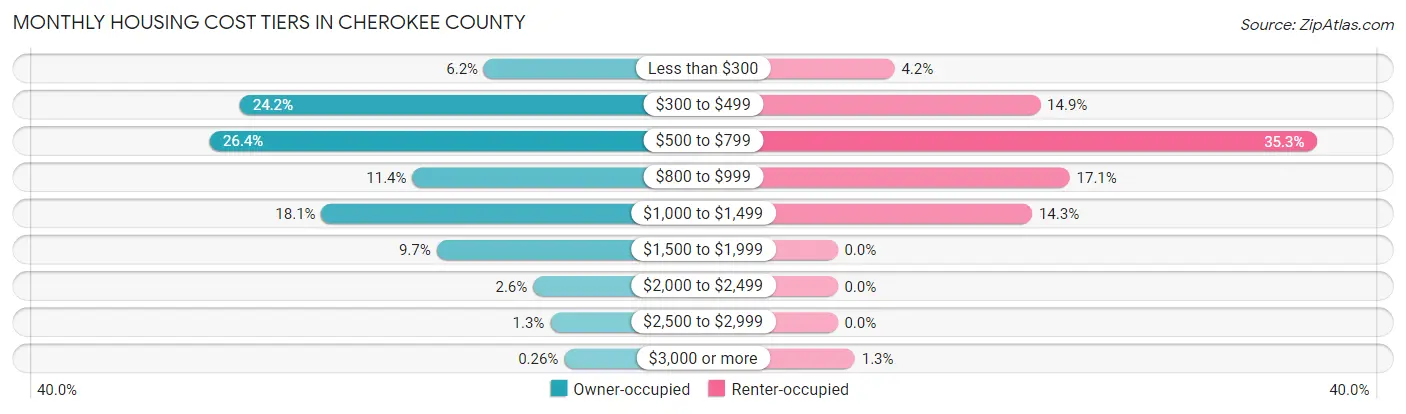
| Monthly Cost | Owner-occupied | Renter-occupied |
| Less than $300 | 235 (6.2%) | 56 (4.2%) |
| $300 to $499 | 920 (24.1%) | 199 (14.9%) |
| $500 to $799 | 1,004 (26.4%) | 470 (35.3%) |
| $800 to $999 | 436 (11.4%) | 228 (17.1%) |
| $1,000 to $1,499 | 691 (18.1%) | 191 (14.3%) |
| $1,500 to $1,999 | 368 (9.7%) | 0 (0.0%) |
| $2,000 to $2,499 | 97 (2.5%) | 0 (0.0%) |
| $2,500 to $2,999 | 49 (1.3%) | 0 (0.0%) |
| $3,000 or more | 10 (0.3%) | 17 (1.3%) |
| Total | 3,810 (100.0%) | 1,333 (100.0%) |
Physical Housing Characteristics in Cherokee County
Housing Structures in Cherokee County
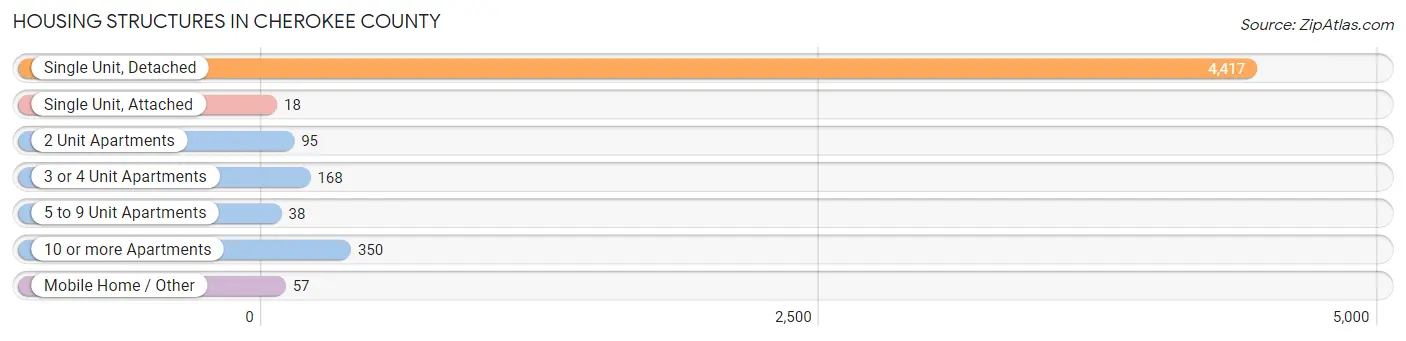
| Structure Type | # Housing Units | % Housing Units |
| Single Unit, Detached | 4,417 | 85.9% |
| Single Unit, Attached | 18 | 0.4% |
| 2 Unit Apartments | 95 | 1.8% |
| 3 or 4 Unit Apartments | 168 | 3.3% |
| 5 to 9 Unit Apartments | 38 | 0.7% |
| 10 or more Apartments | 350 | 6.8% |
| Mobile Home / Other | 57 | 1.1% |
| Total | 5,143 | 100.0% |
Housing Structures by Occupancy in Cherokee County
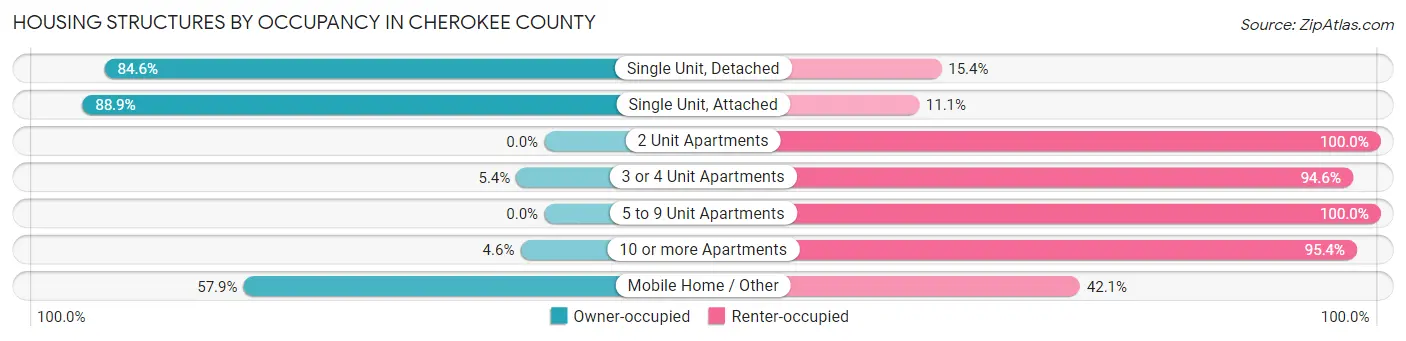
| Structure Type | Owner-occupied | Renter-occupied |
| Single Unit, Detached | 3,736 (84.6%) | 681 (15.4%) |
| Single Unit, Attached | 16 (88.9%) | 2 (11.1%) |
| 2 Unit Apartments | 0 (0.0%) | 95 (100.0%) |
| 3 or 4 Unit Apartments | 9 (5.4%) | 159 (94.6%) |
| 5 to 9 Unit Apartments | 0 (0.0%) | 38 (100.0%) |
| 10 or more Apartments | 16 (4.6%) | 334 (95.4%) |
| Mobile Home / Other | 33 (57.9%) | 24 (42.1%) |
| Total | 3,810 (74.1%) | 1,333 (25.9%) |
Housing Structures by Number of Rooms in Cherokee County
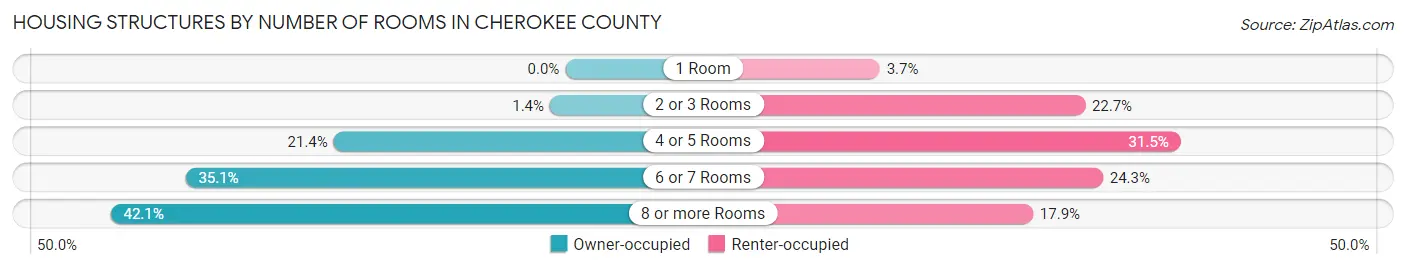
| Number of Rooms | Owner-occupied | Renter-occupied |
| 1 Room | 0 (0.0%) | 49 (3.7%) |
| 2 or 3 Rooms | 54 (1.4%) | 302 (22.7%) |
| 4 or 5 Rooms | 816 (21.4%) | 420 (31.5%) |
| 6 or 7 Rooms | 1,338 (35.1%) | 324 (24.3%) |
| 8 or more Rooms | 1,602 (42.0%) | 238 (17.8%) |
| Total | 3,810 (100.0%) | 1,333 (100.0%) |
Housing Structure by Heating Type in Cherokee County
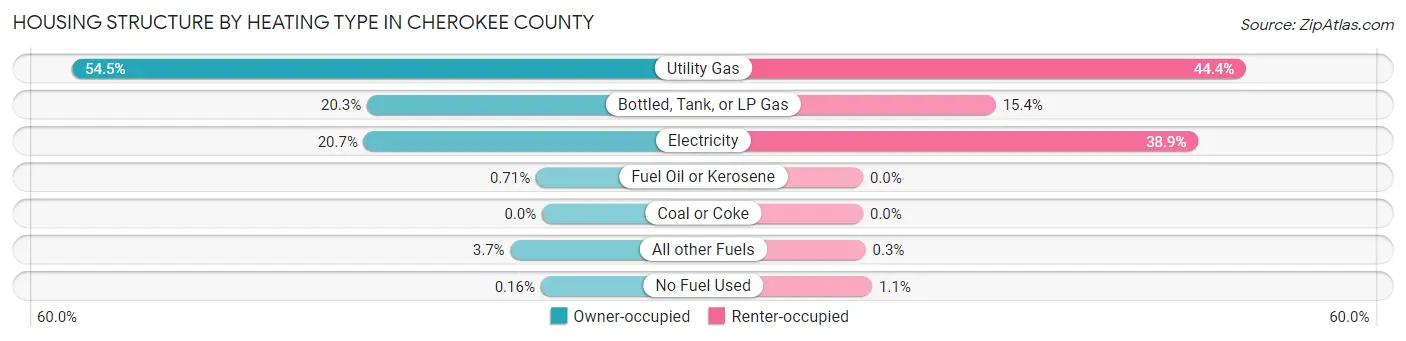
| Heating Type | Owner-occupied | Renter-occupied |
| Utility Gas | 2,076 (54.5%) | 592 (44.4%) |
| Bottled, Tank, or LP Gas | 773 (20.3%) | 205 (15.4%) |
| Electricity | 788 (20.7%) | 518 (38.9%) |
| Fuel Oil or Kerosene | 27 (0.7%) | 0 (0.0%) |
| Coal or Coke | 0 (0.0%) | 0 (0.0%) |
| All other Fuels | 140 (3.7%) | 4 (0.3%) |
| No Fuel Used | 6 (0.2%) | 14 (1.1%) |
| Total | 3,810 (100.0%) | 1,333 (100.0%) |
Household Vehicle Usage in Cherokee County
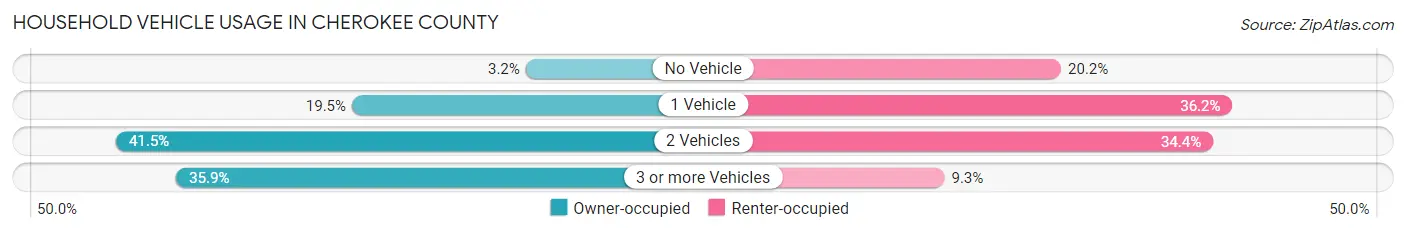
| Vehicles per Household | Owner-occupied | Renter-occupied |
| No Vehicle | 123 (3.2%) | 269 (20.2%) |
| 1 Vehicle | 741 (19.5%) | 482 (36.2%) |
| 2 Vehicles | 1,580 (41.5%) | 458 (34.4%) |
| 3 or more Vehicles | 1,366 (35.8%) | 124 (9.3%) |
| Total | 3,810 (100.0%) | 1,333 (100.0%) |
Real Estate & Mortgages in Cherokee County
Real Estate and Mortgage Overview in Cherokee County
| Characteristic | Without Mortgage | With Mortgage |
| Housing Units | 1,921 | 1,889 |
| Median Property Value | $132,800 | $155,500 |
| Median Household Income | $63,942 | $334 |
| Monthly Housing Costs | $467 | $10 |
| Real Estate Taxes | $1,470 | $62 |
Property Value by Mortgage Status in Cherokee County
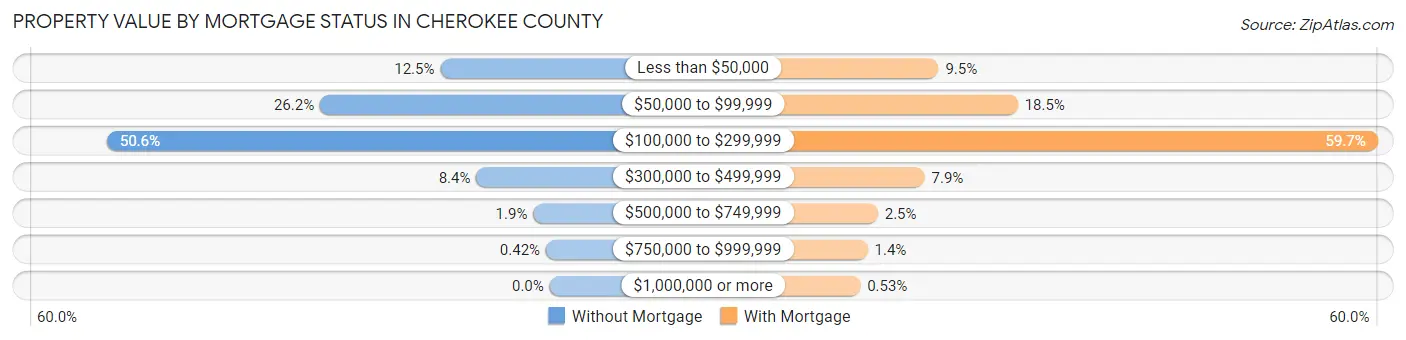
| Property Value | Without Mortgage | With Mortgage |
| Less than $50,000 | 240 (12.5%) | 179 (9.5%) |
| $50,000 to $99,999 | 504 (26.2%) | 350 (18.5%) |
| $100,000 to $299,999 | 972 (50.6%) | 1,127 (59.7%) |
| $300,000 to $499,999 | 161 (8.4%) | 149 (7.9%) |
| $500,000 to $749,999 | 36 (1.9%) | 48 (2.5%) |
| $750,000 to $999,999 | 8 (0.4%) | 26 (1.4%) |
| $1,000,000 or more | 0 (0.0%) | 10 (0.5%) |
| Total | 1,921 (100.0%) | 1,889 (100.0%) |
Household Income by Mortgage Status in Cherokee County
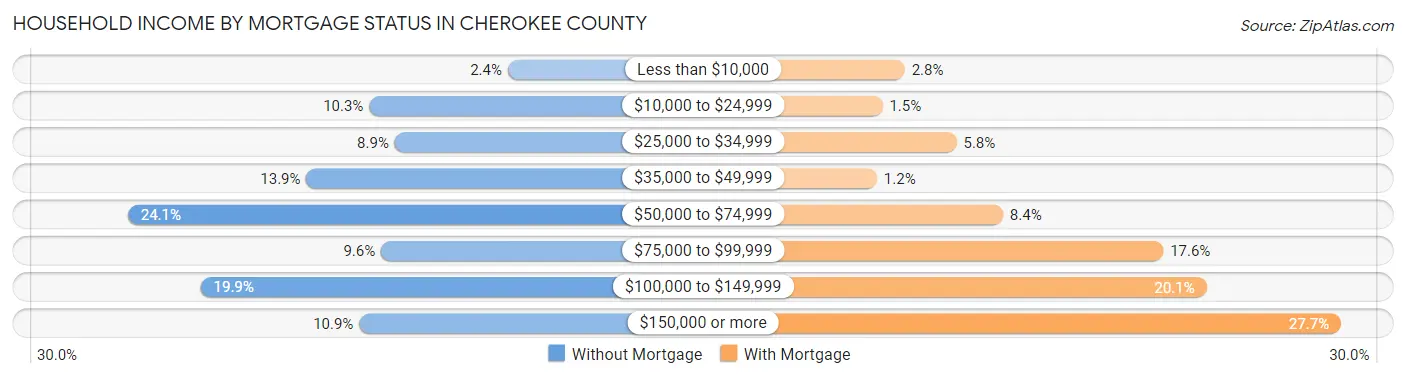
| Household Income | Without Mortgage | With Mortgage |
| Less than $10,000 | 46 (2.4%) | 53 (2.8%) |
| $10,000 to $24,999 | 198 (10.3%) | 29 (1.5%) |
| $25,000 to $34,999 | 170 (8.8%) | 109 (5.8%) |
| $35,000 to $49,999 | 267 (13.9%) | 23 (1.2%) |
| $50,000 to $74,999 | 463 (24.1%) | 159 (8.4%) |
| $75,000 to $99,999 | 185 (9.6%) | 332 (17.6%) |
| $100,000 to $149,999 | 383 (19.9%) | 379 (20.1%) |
| $150,000 or more | 209 (10.9%) | 524 (27.7%) |
| Total | 1,921 (100.0%) | 1,889 (100.0%) |
Property Value to Household Income Ratio in Cherokee County
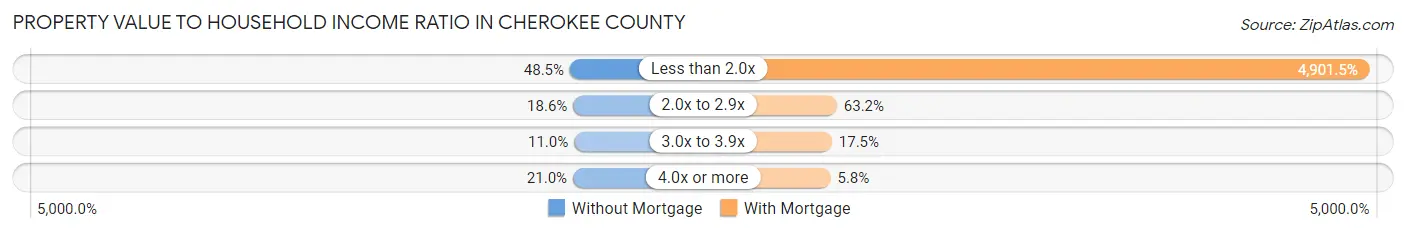
| Value-to-Income Ratio | Without Mortgage | With Mortgage |
| Less than 2.0x | 932 (48.5%) | 92,589 (4,901.5%) |
| 2.0x to 2.9x | 358 (18.6%) | 1,194 (63.2%) |
| 3.0x to 3.9x | 211 (11.0%) | 331 (17.5%) |
| 4.0x or more | 404 (21.0%) | 109 (5.8%) |
| Total | 1,921 (100.0%) | 1,889 (100.0%) |
Real Estate Taxes by Mortgage Status in Cherokee County
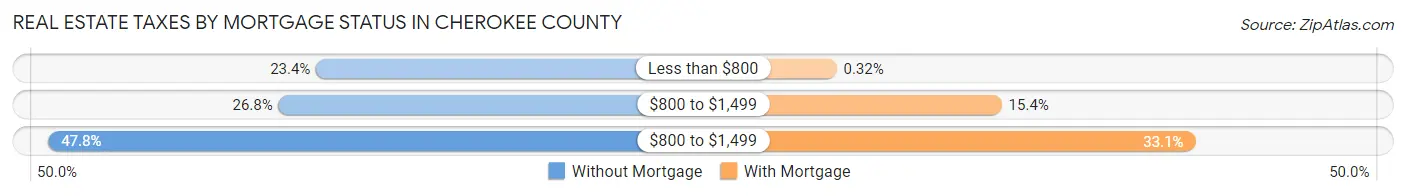
| Property Taxes | Without Mortgage | With Mortgage |
| Less than $800 | 449 (23.4%) | 6 (0.3%) |
| $800 to $1,499 | 515 (26.8%) | 291 (15.4%) |
| $800 to $1,499 | 919 (47.8%) | 625 (33.1%) |
| Total | 1,921 (100.0%) | 1,889 (100.0%) |
Health & Disability in Cherokee County
Health Insurance Coverage by Age in Cherokee County
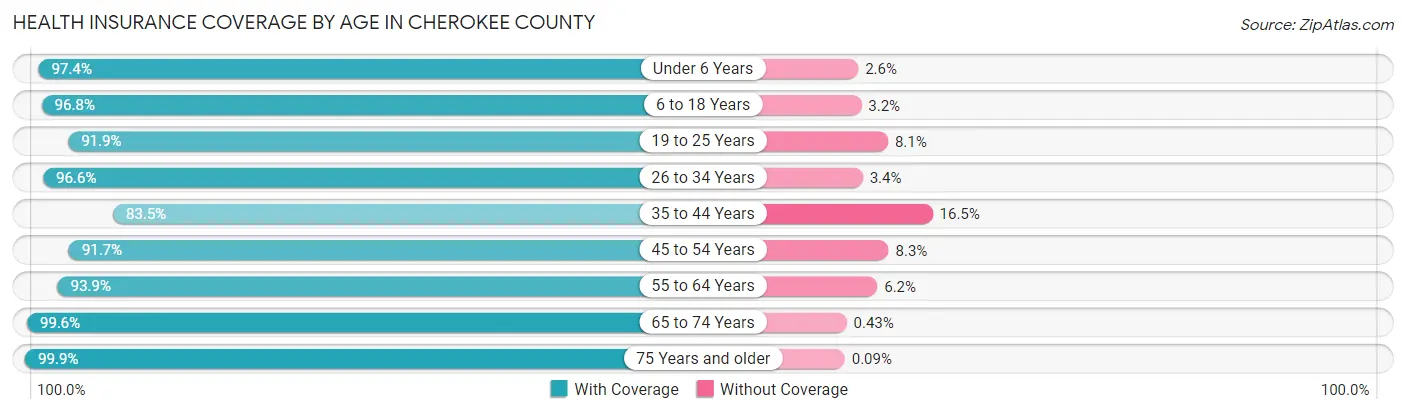
| Age Bracket | With Coverage | Without Coverage |
| Under 6 Years | 712 (97.4%) | 19 (2.6%) |
| 6 to 18 Years | 1,885 (96.8%) | 62 (3.2%) |
| 19 to 25 Years | 756 (91.9%) | 67 (8.1%) |
| 26 to 34 Years | 954 (96.6%) | 34 (3.4%) |
| 35 to 44 Years | 1,085 (83.5%) | 214 (16.5%) |
| 45 to 54 Years | 1,110 (91.7%) | 100 (8.3%) |
| 55 to 64 Years | 1,647 (93.9%) | 108 (6.1%) |
| 65 to 74 Years | 1,393 (99.6%) | 6 (0.4%) |
| 75 Years and older | 1,155 (99.9%) | 1 (0.1%) |
| Total | 10,697 (94.6%) | 611 (5.4%) |
Health Insurance Coverage by Citizenship Status in Cherokee County
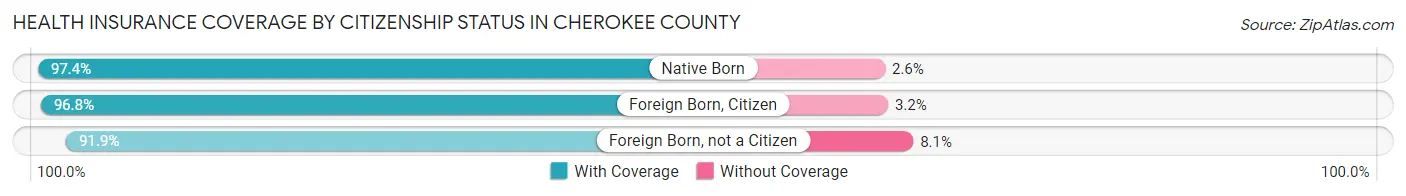
| Citizenship Status | With Coverage | Without Coverage |
| Native Born | 712 (97.4%) | 19 (2.6%) |
| Foreign Born, Citizen | 1,885 (96.8%) | 62 (3.2%) |
| Foreign Born, not a Citizen | 756 (91.9%) | 67 (8.1%) |
Health Insurance Coverage by Household Income in Cherokee County
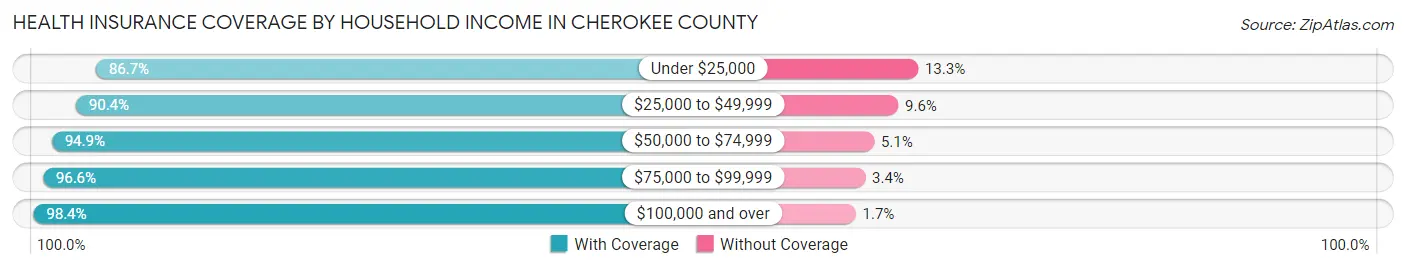
| Household Income | With Coverage | Without Coverage |
| Under $25,000 | 1,078 (86.7%) | 166 (13.3%) |
| $25,000 to $49,999 | 1,946 (90.4%) | 207 (9.6%) |
| $50,000 to $74,999 | 1,975 (94.9%) | 106 (5.1%) |
| $75,000 to $99,999 | 1,579 (96.6%) | 56 (3.4%) |
| $100,000 and over | 3,995 (98.4%) | 67 (1.7%) |
Public vs Private Health Insurance Coverage by Age in Cherokee County
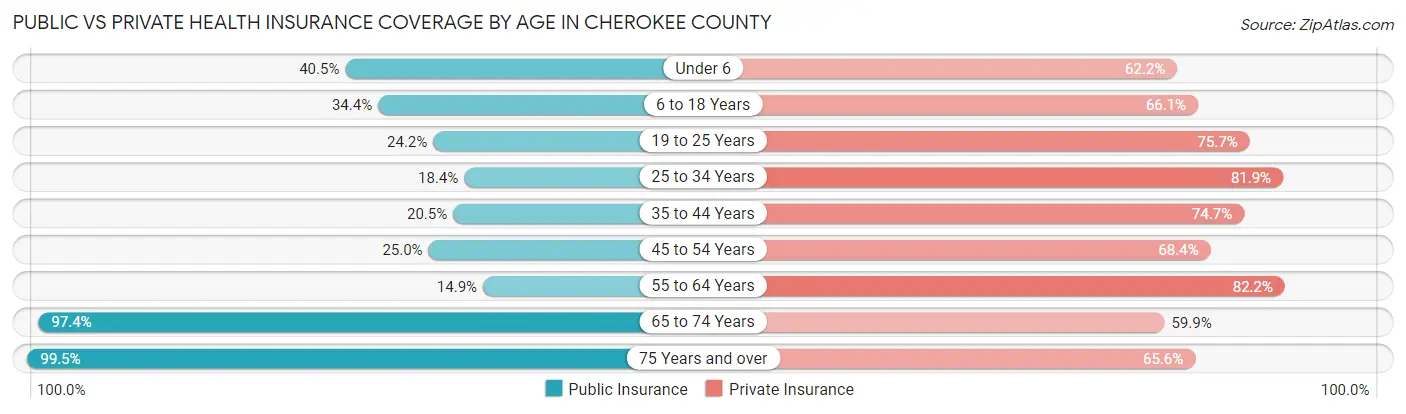
| Age Bracket | Public Insurance | Private Insurance |
| Under 6 | 296 (40.5%) | 455 (62.2%) |
| 6 to 18 Years | 670 (34.4%) | 1,287 (66.1%) |
| 19 to 25 Years | 199 (24.2%) | 623 (75.7%) |
| 25 to 34 Years | 182 (18.4%) | 809 (81.9%) |
| 35 to 44 Years | 266 (20.5%) | 970 (74.7%) |
| 45 to 54 Years | 303 (25.0%) | 828 (68.4%) |
| 55 to 64 Years | 262 (14.9%) | 1,443 (82.2%) |
| 65 to 74 Years | 1,363 (97.4%) | 838 (59.9%) |
| 75 Years and over | 1,150 (99.5%) | 758 (65.6%) |
| Total | 4,691 (41.5%) | 8,011 (70.8%) |
Disability Status by Sex by Age in Cherokee County
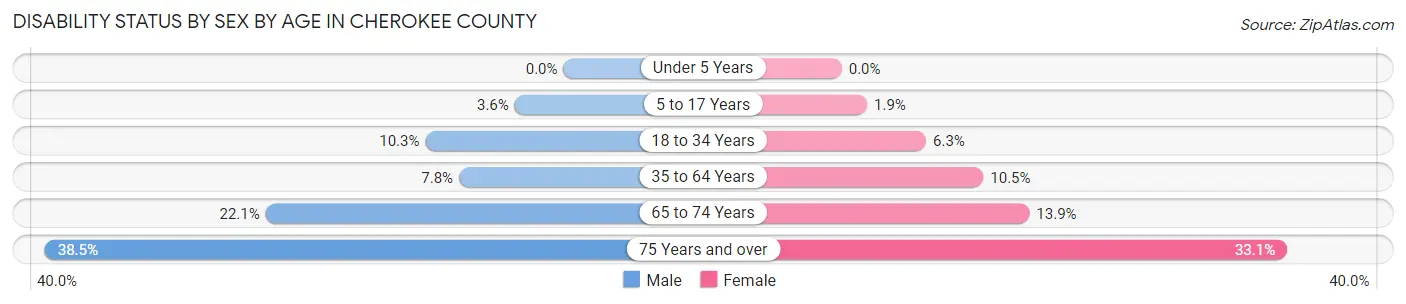
| Age Bracket | Male | Female |
| Under 5 Years | 0 (0.0%) | 0 (0.0%) |
| 5 to 17 Years | 35 (3.6%) | 18 (1.9%) |
| 18 to 34 Years | 101 (10.2%) | 61 (6.3%) |
| 35 to 64 Years | 172 (7.7%) | 215 (10.5%) |
| 65 to 74 Years | 157 (22.1%) | 96 (13.9%) |
| 75 Years and over | 169 (38.5%) | 237 (33.1%) |
Disability Class by Sex by Age in Cherokee County
Disability Class: Hearing Difficulty
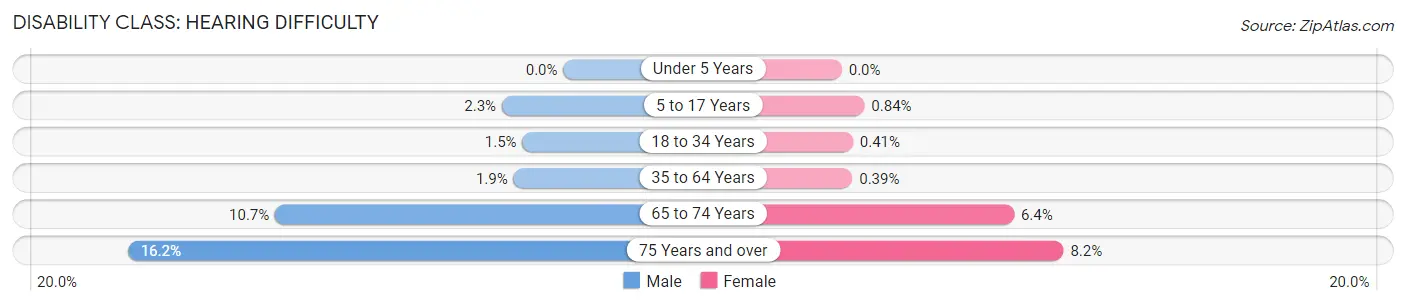
| Age Bracket | Male | Female |
| Under 5 Years | 0 (0.0%) | 0 (0.0%) |
| 5 to 17 Years | 22 (2.3%) | 8 (0.8%) |
| 18 to 34 Years | 15 (1.5%) | 4 (0.4%) |
| 35 to 64 Years | 41 (1.8%) | 8 (0.4%) |
| 65 to 74 Years | 76 (10.7%) | 44 (6.4%) |
| 75 Years and over | 71 (16.2%) | 59 (8.2%) |
Disability Class: Vision Difficulty
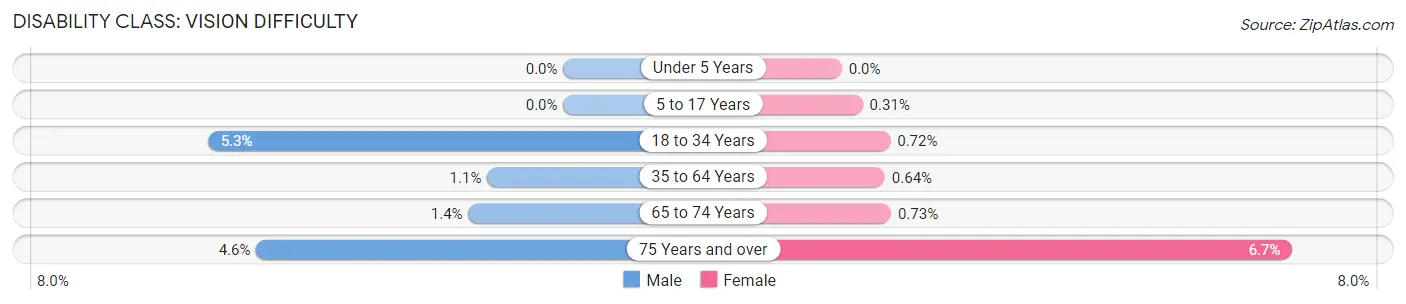
| Age Bracket | Male | Female |
| Under 5 Years | 0 (0.0%) | 0 (0.0%) |
| 5 to 17 Years | 0 (0.0%) | 3 (0.3%) |
| 18 to 34 Years | 52 (5.3%) | 7 (0.7%) |
| 35 to 64 Years | 25 (1.1%) | 13 (0.6%) |
| 65 to 74 Years | 10 (1.4%) | 5 (0.7%) |
| 75 Years and over | 20 (4.6%) | 48 (6.7%) |
Disability Class: Cognitive Difficulty
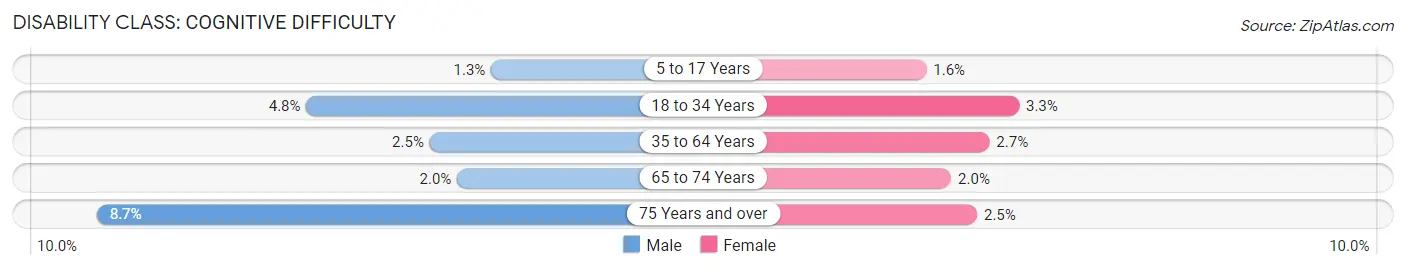
| Age Bracket | Male | Female |
| 5 to 17 Years | 13 (1.3%) | 15 (1.6%) |
| 18 to 34 Years | 47 (4.8%) | 32 (3.3%) |
| 35 to 64 Years | 55 (2.5%) | 56 (2.7%) |
| 65 to 74 Years | 14 (2.0%) | 14 (2.0%) |
| 75 Years and over | 38 (8.7%) | 18 (2.5%) |
Disability Class: Ambulatory Difficulty
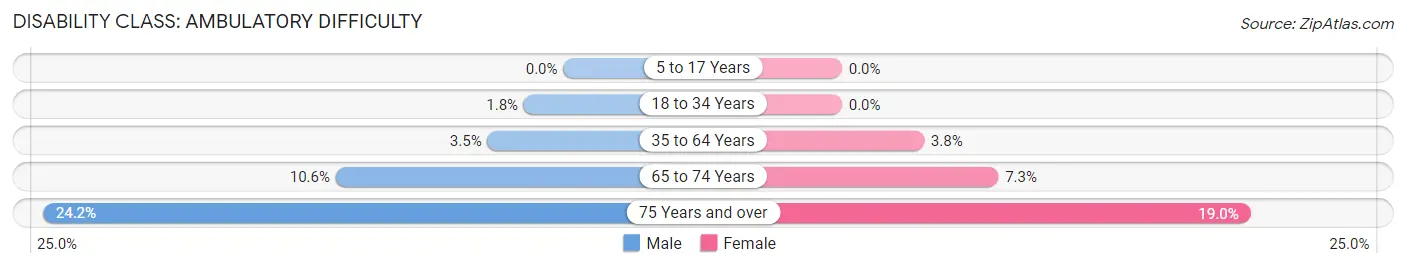
| Age Bracket | Male | Female |
| 5 to 17 Years | 0 (0.0%) | 0 (0.0%) |
| 18 to 34 Years | 18 (1.8%) | 0 (0.0%) |
| 35 to 64 Years | 78 (3.5%) | 78 (3.8%) |
| 65 to 74 Years | 75 (10.6%) | 50 (7.3%) |
| 75 Years and over | 106 (24.1%) | 136 (19.0%) |
Disability Class: Self-Care Difficulty
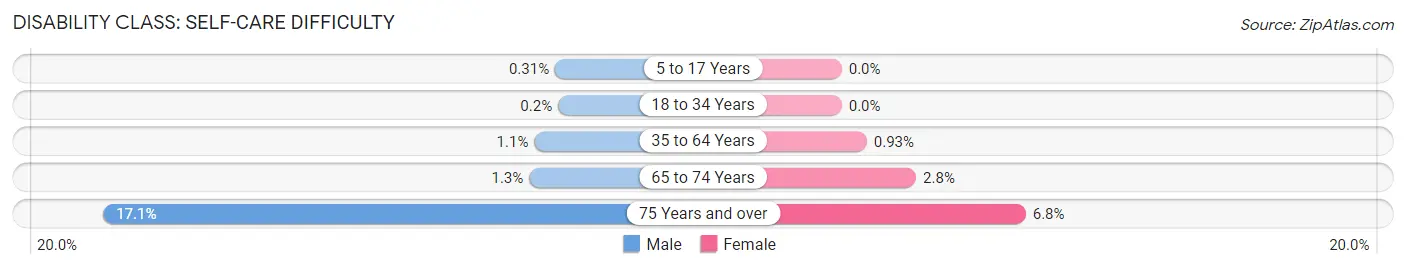
| Age Bracket | Male | Female |
| 5 to 17 Years | 3 (0.3%) | 0 (0.0%) |
| 18 to 34 Years | 2 (0.2%) | 0 (0.0%) |
| 35 to 64 Years | 24 (1.1%) | 19 (0.9%) |
| 65 to 74 Years | 9 (1.3%) | 19 (2.8%) |
| 75 Years and over | 75 (17.1%) | 49 (6.8%) |
Technology Access in Cherokee County
Computing Device Access in Cherokee County
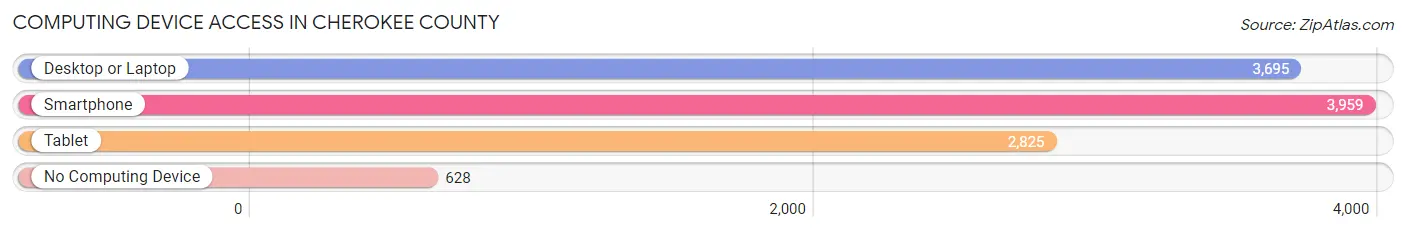
| Device Type | # Households | % Households |
| Desktop or Laptop | 3,695 | 71.9% |
| Smartphone | 3,959 | 77.0% |
| Tablet | 2,825 | 54.9% |
| No Computing Device | 628 | 12.2% |
| Total | 5,143 | 100.0% |
Internet Access in Cherokee County
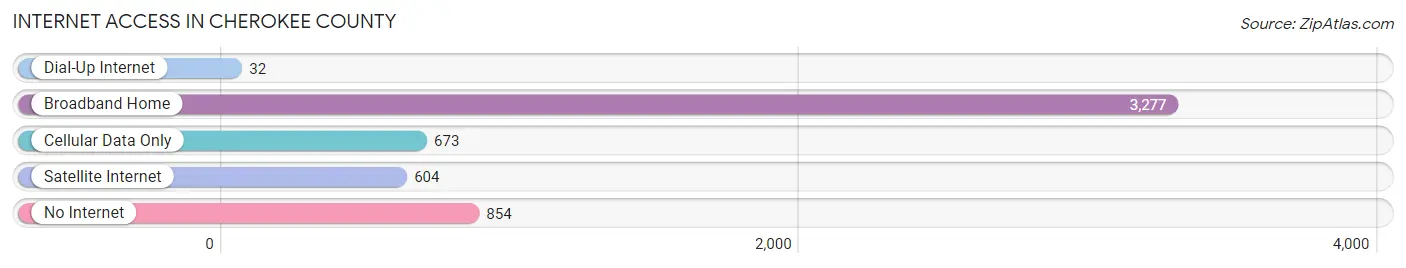
| Internet Type | # Households | % Households |
| Dial-Up Internet | 32 | 0.6% |
| Broadband Home | 3,277 | 63.7% |
| Cellular Data Only | 673 | 13.1% |
| Satellite Internet | 604 | 11.7% |
| No Internet | 854 | 16.6% |
| Total | 5,143 | 100.0% |
Cherokee County Summary
Cherokee County is located in the northwest corner of Iowa, and is bordered by Plymouth, Sioux, O'Brien, and Buena Vista counties. It is part of the Sioux City, IA-NE-SD Metropolitan Statistical Area. The county seat is Cherokee, and the largest city is Marcus. As of the 2010 census, the population was 12,072.
History
Cherokee County was established in 1851 and was named after the Cherokee Indians who had been removed from the area in the 1830s. The first settlers arrived in the area in 1856. The county was organized in 1858 and the first courthouse was built in 1859.
The county was an important agricultural center in the late 19th and early 20th centuries. The county was home to several large farms, and the area was known for its production of corn, oats, and hay.
Geography
Cherokee County covers an area of 576 square miles. The terrain is mostly rolling hills, with some flat areas in the north and east. The county is drained by the Little Sioux River and its tributaries. The highest point in the county is located in the northwest corner, at an elevation of 1,619 feet.
The county is home to several state parks and wildlife areas, including Little Sioux Park, Cherokee State Park, and the Cherokee Wildlife Management Area.
Economy
The economy of Cherokee County is largely based on agriculture. The county is home to several large farms, and the area is known for its production of corn, oats, and hay. Other important industries in the county include manufacturing, retail, and tourism.
Demographics
As of the 2010 census, the population of Cherokee County was 12,072. The racial makeup of the county was 95.3% White, 0.7% African American, 0.4% Native American, 0.3% Asian, 0.1% Pacific Islander, 1.7% from other races, and 1.4% from two or more races. Hispanic or Latino of any race were 3.3% of the population.
The median household income in the county was $45,945, and the median family income was $53,945. The per capita income was $21,945. About 8.3% of families and 11.2% of the population were below the poverty line.
Common Questions
What is Per Capita Income in Cherokee County?
Per Capita income in Cherokee County is $35,939.
What is the Median Family Income in Cherokee County?
Median Family Income in Cherokee County is $90,243.
What is the Median Household income in Cherokee County?
Median Household Income in Cherokee County is $63,638.
What is Income or Wage Gap in Cherokee County?
Income or Wage Gap in Cherokee County is 40.3%.
Women in Cherokee County earn 59.7 cents for every dollar earned by a man.
What is Inequality or Gini Index in Cherokee County?
Inequality or Gini Index in Cherokee County is 0.42.
What is the Total Population of Cherokee County?
Total Population of Cherokee County is 11,601.
What is the Total Male Population of Cherokee County?
Total Male Population of Cherokee County is 5,842.
What is the Total Female Population of Cherokee County?
Total Female Population of Cherokee County is 5,759.
What is the Ratio of Males per 100 Females in Cherokee County?
There are 101.44 Males per 100 Females in Cherokee County.
What is the Ratio of Females per 100 Males in Cherokee County?
There are 98.58 Females per 100 Males in Cherokee County.
What is the Median Population Age in Cherokee County?
Median Population Age in Cherokee County is 44.8 Years.
What is the Average Family Size in Cherokee County
Average Family Size in Cherokee County is 2.8 People.
What is the Average Household Size in Cherokee County
Average Household Size in Cherokee County is 2.2 People.
How Large is the Labor Force in Cherokee County?
There are 6,151 People in the Labor Forcein in Cherokee County.
What is the Percentage of People in the Labor Force in Cherokee County?
65.3% of People are in the Labor Force in Cherokee County.
What is the Unemployment Rate in Cherokee County?
Unemployment Rate in Cherokee County is 3.2%.