Bouton, IA Map & Demographics
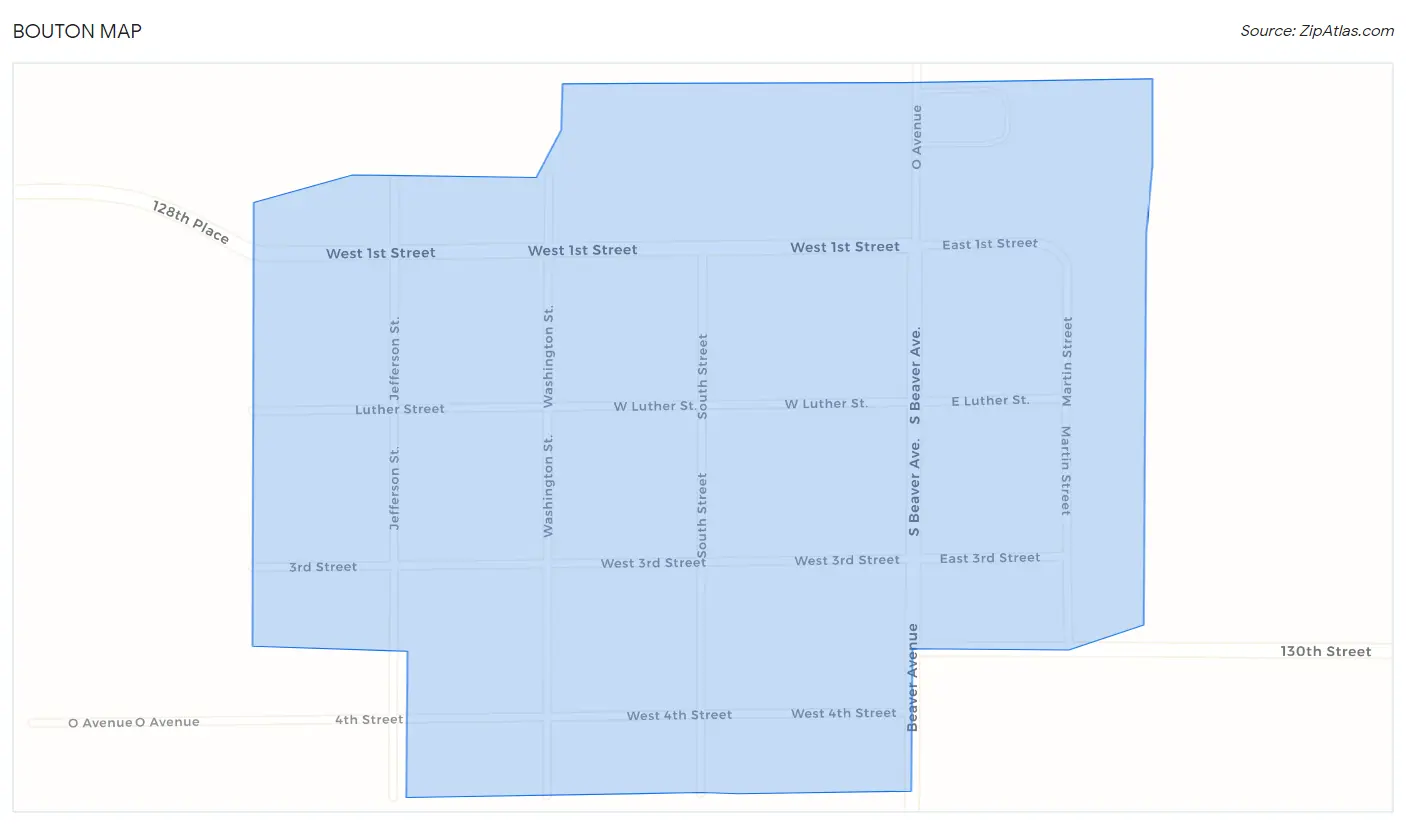
Bouton Map
Bouton Overview
$38,718
PER CAPITA INCOME
$77,500
AVG FAMILY INCOME
$75,313
AVG HOUSEHOLD INCOME
11.1%
WAGE / INCOME GAP [ % ]
88.9¢/ $1
WAGE / INCOME GAP [ $ ]
0.57
INEQUALITY / GINI INDEX
169
TOTAL POPULATION
77
MALE POPULATION
92
FEMALE POPULATION
83.70
MALES / 100 FEMALES
119.48
FEMALES / 100 MALES
32.9
MEDIAN AGE
3.7
AVG FAMILY SIZE
3.3
AVG HOUSEHOLD SIZE
70
LABOR FORCE [ PEOPLE ]
63.1%
PERCENT IN LABOR FORCE
Bouton Zip Codes
Bouton Area Codes
Income in Bouton
Income Overview in Bouton
Per Capita Income in Bouton is $38,718, while median incomes of families and households are $77,500 and $75,313 respectively.
| Characteristic | Number | Measure |
| Per Capita Income | 169 | $38,718 |
| Median Family Income | 40 | $77,500 |
| Mean Family Income | 40 | $139,918 |
| Median Household Income | 51 | $75,313 |
| Mean Household Income | 51 | $121,027 |
| Income Deficit | 40 | $0 |
| Wage / Income Gap (%) | 169 | 11.11% |
| Wage / Income Gap ($) | 169 | 88.89¢ per $1 |
| Gini / Inequality Index | 169 | 0.57 |
Earnings by Sex in Bouton
Average Earnings in Bouton are $41,667, $45,000 for men and $40,000 for women, a difference of 11.1%.
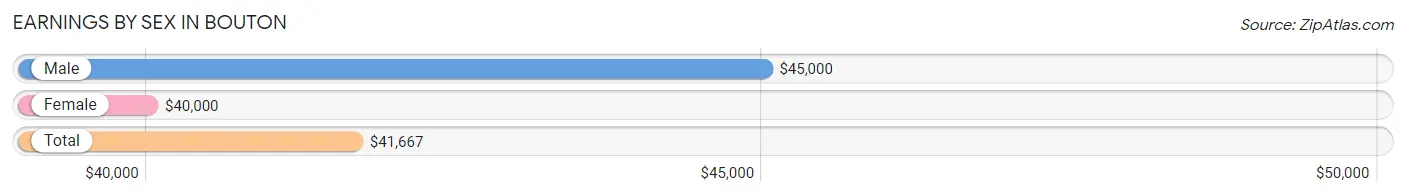
| Sex | Number | Average Earnings |
| Male | 34 (47.2%) | $45,000 |
| Female | 38 (52.8%) | $40,000 |
| Total | 72 (100.0%) | $41,667 |
Earnings by Sex by Income Bracket in Bouton
The most common earnings brackets in Bouton are $45,000 to $49,999 for men (8 | 23.5%) and $25,000 to $29,999 for women (7 | 18.4%).
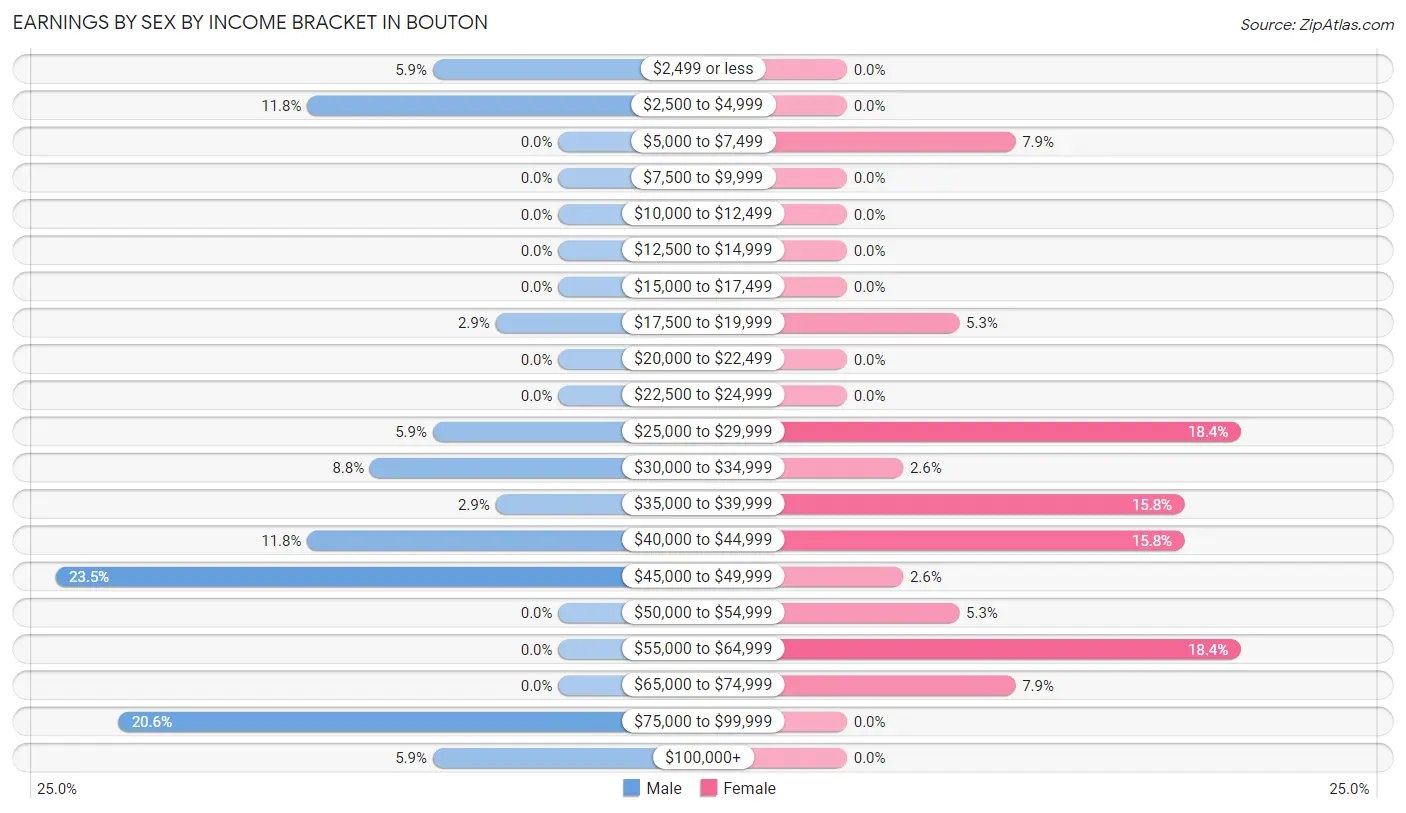
| Income | Male | Female |
| $2,499 or less | 2 (5.9%) | 0 (0.0%) |
| $2,500 to $4,999 | 4 (11.8%) | 0 (0.0%) |
| $5,000 to $7,499 | 0 (0.0%) | 3 (7.9%) |
| $7,500 to $9,999 | 0 (0.0%) | 0 (0.0%) |
| $10,000 to $12,499 | 0 (0.0%) | 0 (0.0%) |
| $12,500 to $14,999 | 0 (0.0%) | 0 (0.0%) |
| $15,000 to $17,499 | 0 (0.0%) | 0 (0.0%) |
| $17,500 to $19,999 | 1 (2.9%) | 2 (5.3%) |
| $20,000 to $22,499 | 0 (0.0%) | 0 (0.0%) |
| $22,500 to $24,999 | 0 (0.0%) | 0 (0.0%) |
| $25,000 to $29,999 | 2 (5.9%) | 7 (18.4%) |
| $30,000 to $34,999 | 3 (8.8%) | 1 (2.6%) |
| $35,000 to $39,999 | 1 (2.9%) | 6 (15.8%) |
| $40,000 to $44,999 | 4 (11.8%) | 6 (15.8%) |
| $45,000 to $49,999 | 8 (23.5%) | 1 (2.6%) |
| $50,000 to $54,999 | 0 (0.0%) | 2 (5.3%) |
| $55,000 to $64,999 | 0 (0.0%) | 7 (18.4%) |
| $65,000 to $74,999 | 0 (0.0%) | 3 (7.9%) |
| $75,000 to $99,999 | 7 (20.6%) | 0 (0.0%) |
| $100,000+ | 2 (5.9%) | 0 (0.0%) |
| Total | 34 (100.0%) | 38 (100.0%) |
Earnings by Sex by Educational Attainment in Bouton
Average earnings in Bouton are $44,375 for men and $40,625 for women, a difference of 8.5%. Men with an educational attainment of college or associate's degree enjoy the highest average annual earnings of $45,417, while those with high school diploma education earn the least with $38,750. Women with an educational attainment of college or associate's degree earn the most with the average annual earnings of $40,000, while those with college or associate's degree education have the smallest earnings of $40,000.
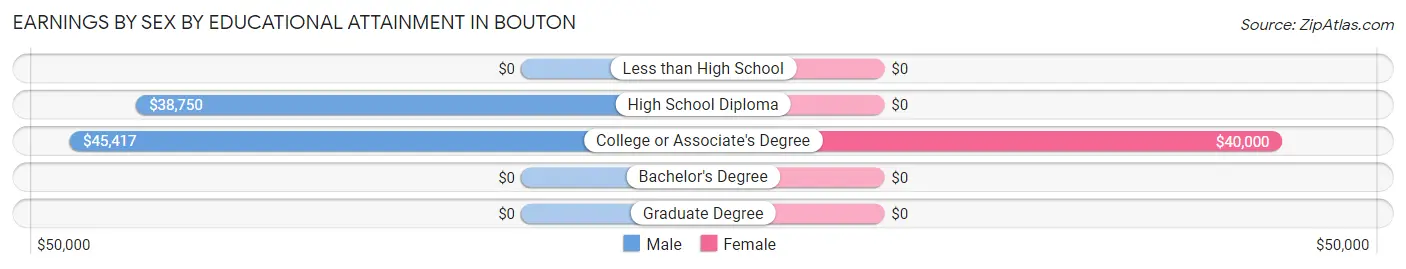
| Educational Attainment | Male Income | Female Income |
| Less than High School | - | - |
| High School Diploma | $38,750 | $0 |
| College or Associate's Degree | $45,417 | $40,000 |
| Bachelor's Degree | - | - |
| Graduate Degree | - | - |
| Total | $44,375 | $40,625 |
Family Income in Bouton
Family Income Brackets in Bouton
According to the Bouton family income data, there are 10 families falling into the $75,000 to $99,999 income range, which is the most common income bracket and makes up 25.0% of all families.
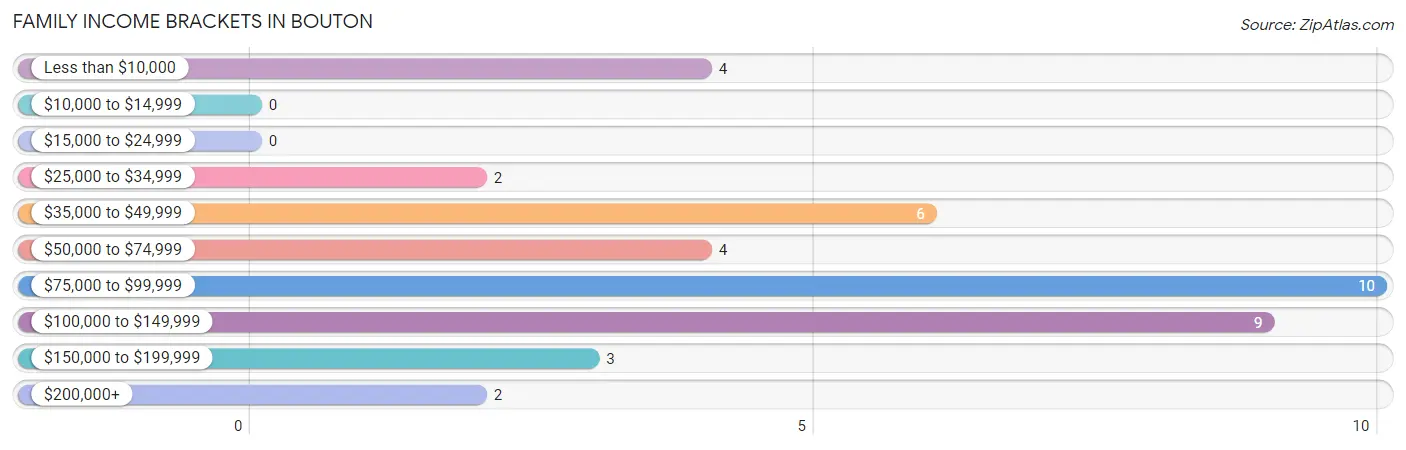
| Income Bracket | # Families | % Families |
| Less than $10,000 | 4 | 10.0% |
| $10,000 to $14,999 | 0 | 0.0% |
| $15,000 to $24,999 | 0 | 0.0% |
| $25,000 to $34,999 | 2 | 5.0% |
| $35,000 to $49,999 | 6 | 15.0% |
| $50,000 to $74,999 | 4 | 10.0% |
| $75,000 to $99,999 | 10 | 25.0% |
| $100,000 to $149,999 | 9 | 22.5% |
| $150,000 to $199,999 | 3 | 7.5% |
| $200,000+ | 2 | 5.0% |
Family Income by Famaliy Size in Bouton
4-person families (9 | 22.5%) account for the highest median family income in Bouton with $102,750 per family, while 2-person families (18 | 45.0%) have the highest median income of $37,812 per family member.
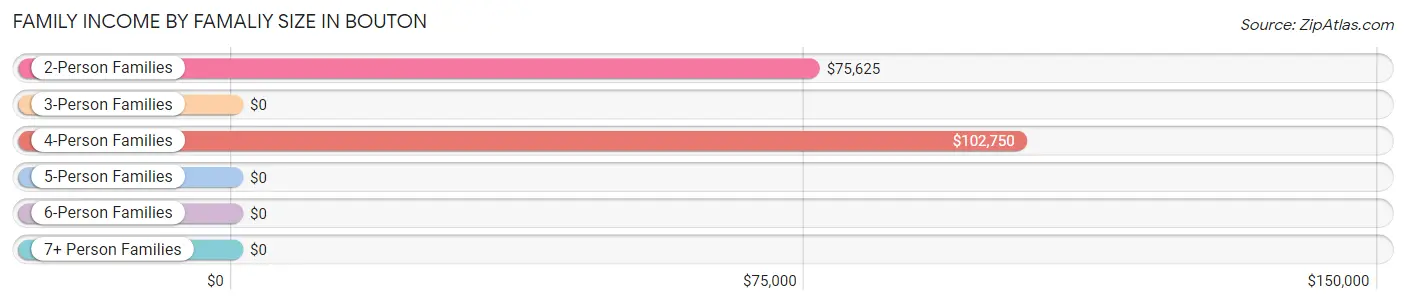
| Income Bracket | # Families | Median Income |
| 2-Person Families | 18 (45.0%) | $75,625 |
| 3-Person Families | 9 (22.5%) | $0 |
| 4-Person Families | 9 (22.5%) | $102,750 |
| 5-Person Families | 0 (0.0%) | $0 |
| 6-Person Families | 0 (0.0%) | $0 |
| 7+ Person Families | 4 (10.0%) | $0 |
| Total | 40 (100.0%) | $77,500 |
Family Income by Number of Earners in Bouton
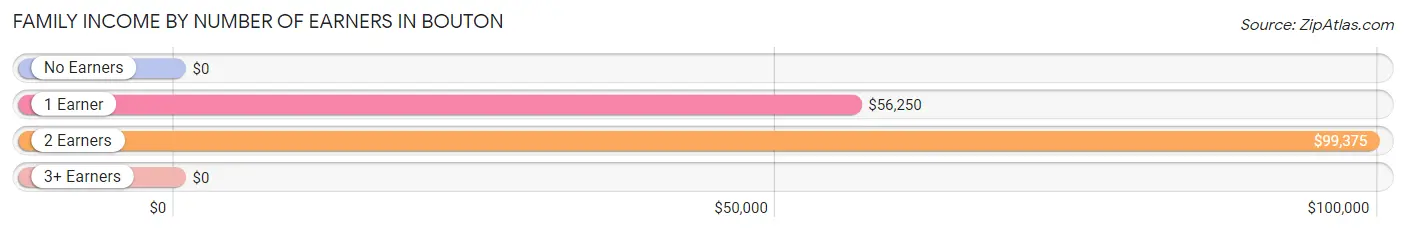
| Number of Earners | # Families | Median Income |
| No Earners | 1 (2.5%) | $0 |
| 1 Earner | 22 (55.0%) | $56,250 |
| 2 Earners | 17 (42.5%) | $99,375 |
| 3+ Earners | 0 (0.0%) | $0 |
| Total | 40 (100.0%) | $77,500 |
Household Income in Bouton
Household Income Brackets in Bouton
With 11 households falling in the category, the $100,000 to $149,999 income range is the most frequent in Bouton, accounting for 21.6% of all households. In contrast, only 1 households (2.0%) fall into the less than $10,000 income bracket, making it the least populous group.
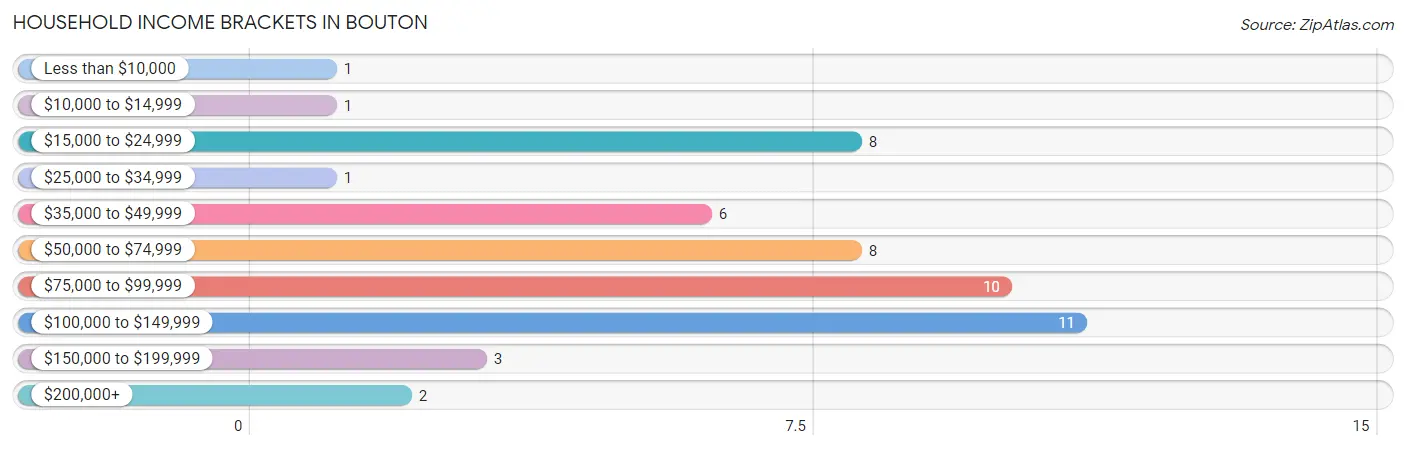
| Income Bracket | # Households | % Households |
| Less than $10,000 | 1 | 2.0% |
| $10,000 to $14,999 | 1 | 2.0% |
| $15,000 to $24,999 | 8 | 15.7% |
| $25,000 to $34,999 | 1 | 2.0% |
| $35,000 to $49,999 | 6 | 11.8% |
| $50,000 to $74,999 | 8 | 15.7% |
| $75,000 to $99,999 | 10 | 19.6% |
| $100,000 to $149,999 | 11 | 21.6% |
| $150,000 to $199,999 | 3 | 5.9% |
| $200,000+ | 2 | 3.9% |
Household Income by Householder Age in Bouton
The median household income in Bouton is $75,313, with the highest median household income of $98,125 found in the 25 to 44 years age bracket for the primary householder. A total of 19 households (37.2%) fall into this category. Meanwhile, the 15 to 24 years age bracket for the primary householder has the lowest median household income of $0, with 4 households (7.8%) in this group.
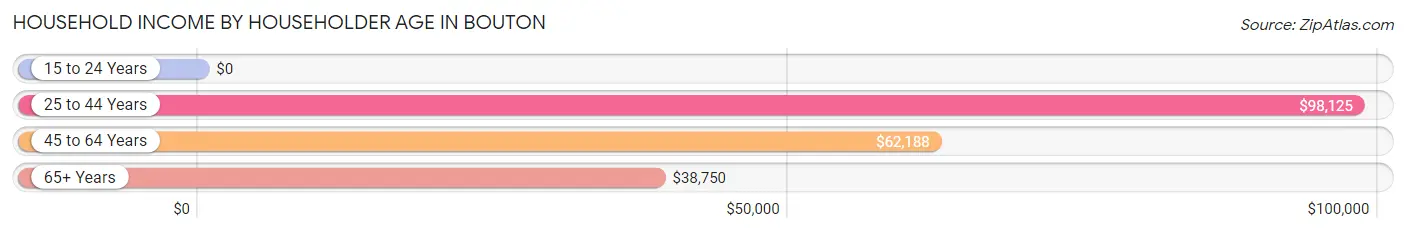
| Income Bracket | # Households | Median Income |
| 15 to 24 Years | 4 (7.8%) | $0 |
| 25 to 44 Years | 19 (37.2%) | $98,125 |
| 45 to 64 Years | 15 (29.4%) | $62,188 |
| 65+ Years | 13 (25.5%) | $38,750 |
| Total | 51 (100.0%) | $75,313 |
Poverty in Bouton
Income Below Poverty by Sex and Age in Bouton
With 15.6% poverty level for males and 17.4% for females among the residents of Bouton, 12 to 14 year old males and 5 year old females are the most vulnerable to poverty, with 2 males (100.0%) and 4 females (100.0%) in their respective age groups living below the poverty level.
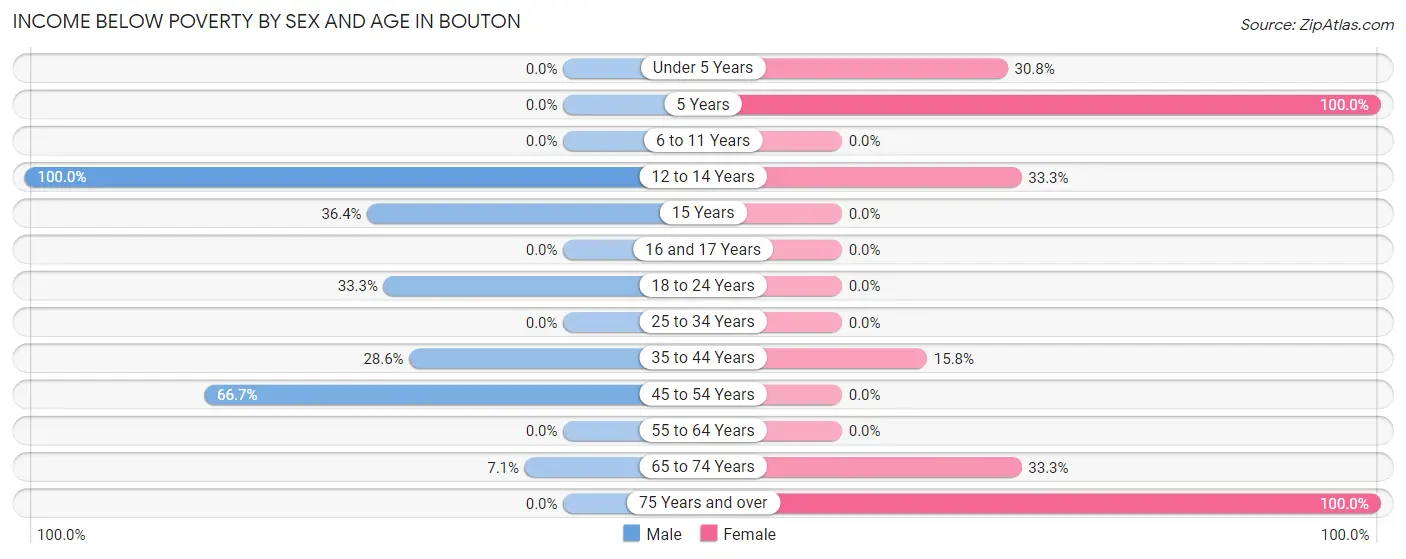
| Age Bracket | Male | Female |
| Under 5 Years | 0 (0.0%) | 4 (30.8%) |
| 5 Years | 0 (0.0%) | 4 (100.0%) |
| 6 to 11 Years | 0 (0.0%) | 0 (0.0%) |
| 12 to 14 Years | 2 (100.0%) | 3 (33.3%) |
| 15 Years | 4 (36.4%) | 0 (0.0%) |
| 16 and 17 Years | 0 (0.0%) | 0 (0.0%) |
| 18 to 24 Years | 1 (33.3%) | 0 (0.0%) |
| 25 to 34 Years | 0 (0.0%) | 0 (0.0%) |
| 35 to 44 Years | 2 (28.6%) | 3 (15.8%) |
| 45 to 54 Years | 2 (66.7%) | 0 (0.0%) |
| 55 to 64 Years | 0 (0.0%) | 0 (0.0%) |
| 65 to 74 Years | 1 (7.1%) | 1 (33.3%) |
| 75 Years and over | 0 (0.0%) | 1 (100.0%) |
| Total | 12 (15.6%) | 16 (17.4%) |
Income Above Poverty by Sex and Age in Bouton
According to the poverty statistics in Bouton, males aged under 5 years and females aged 6 to 11 years are the age groups that are most secure financially, with 100.0% of males and 100.0% of females in these age groups living above the poverty line.
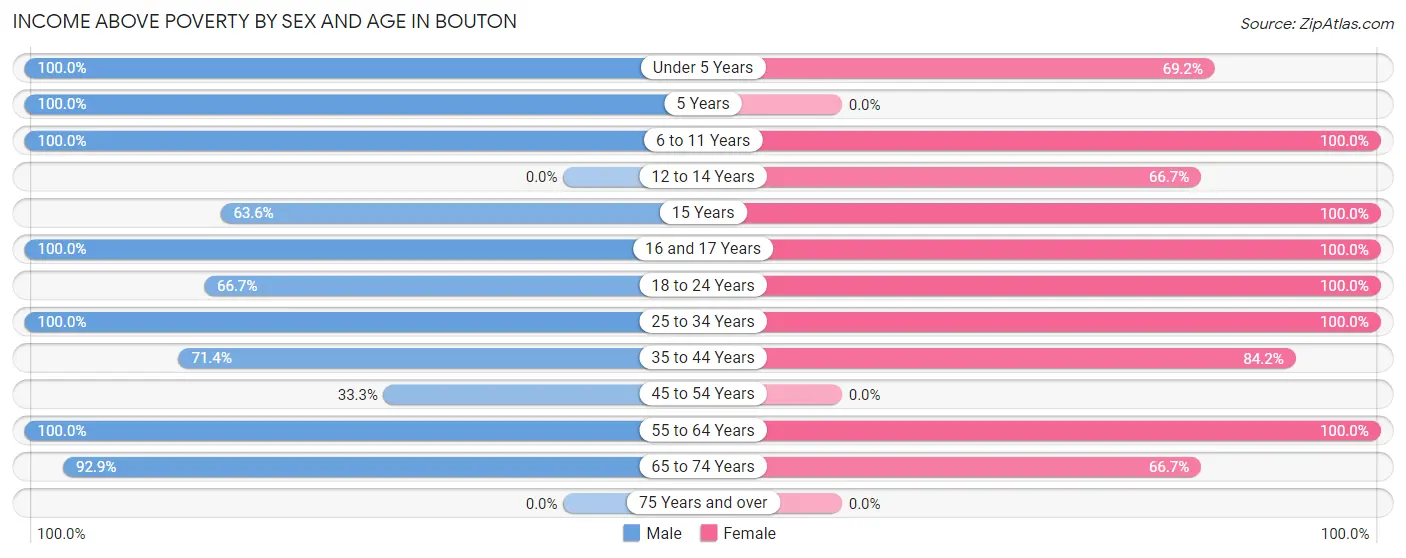
| Age Bracket | Male | Female |
| Under 5 Years | 3 (100.0%) | 9 (69.2%) |
| 5 Years | 2 (100.0%) | 0 (0.0%) |
| 6 to 11 Years | 4 (100.0%) | 6 (100.0%) |
| 12 to 14 Years | 0 (0.0%) | 6 (66.7%) |
| 15 Years | 7 (63.6%) | 4 (100.0%) |
| 16 and 17 Years | 3 (100.0%) | 5 (100.0%) |
| 18 to 24 Years | 2 (66.7%) | 5 (100.0%) |
| 25 to 34 Years | 11 (100.0%) | 3 (100.0%) |
| 35 to 44 Years | 5 (71.4%) | 16 (84.2%) |
| 45 to 54 Years | 1 (33.3%) | 0 (0.0%) |
| 55 to 64 Years | 14 (100.0%) | 20 (100.0%) |
| 65 to 74 Years | 13 (92.9%) | 2 (66.7%) |
| 75 Years and over | 0 (0.0%) | 0 (0.0%) |
| Total | 65 (84.4%) | 76 (82.6%) |
Income Below Poverty Among Married-Couple Families in Bouton
The poverty statistics for married-couple families in Bouton show that 3.6% or 1 of the total 28 families live below the poverty line. Families with no children have the highest poverty rate of 8.3%, comprising of 1 families. On the other hand, families with 1 or 2 children have the lowest poverty rate of 0.0%, which includes 0 families.
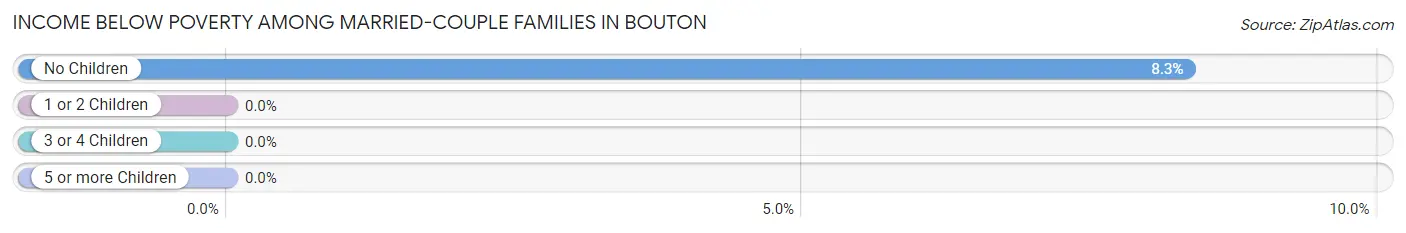
| Children | Above Poverty | Below Poverty |
| No Children | 11 (91.7%) | 1 (8.3%) |
| 1 or 2 Children | 16 (100.0%) | 0 (0.0%) |
| 3 or 4 Children | 0 (0.0%) | 0 (0.0%) |
| 5 or more Children | 0 (0.0%) | 0 (0.0%) |
| Total | 27 (96.4%) | 1 (3.6%) |
Income Below Poverty Among Single-Parent Households in Bouton
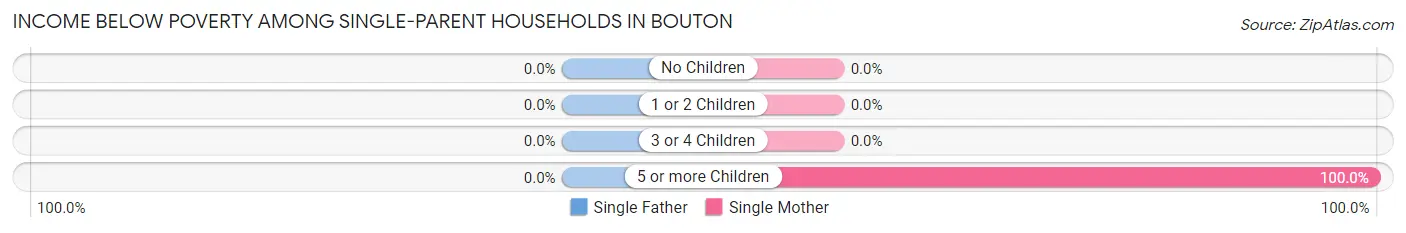
| Children | Single Father | Single Mother |
| No Children | 0 (0.0%) | 0 (0.0%) |
| 1 or 2 Children | 0 (0.0%) | 0 (0.0%) |
| 3 or 4 Children | 0 (0.0%) | 0 (0.0%) |
| 5 or more Children | 0 (0.0%) | 3 (100.0%) |
| Total | 0 (0.0%) | 3 (42.9%) |
Income Below Poverty Among Married-Couple vs Single-Parent Households in Bouton
The poverty data for Bouton shows that 1 of the married-couple family households (3.6%) and 3 of the single-parent households (25.0%) are living below the poverty level. Within the married-couple family households, those with no children have the highest poverty rate, with 1 households (8.3%) falling below the poverty line. Among the single-parent households, those with 5 or more children have the highest poverty rate, with 3 household (75.0%) living below poverty.
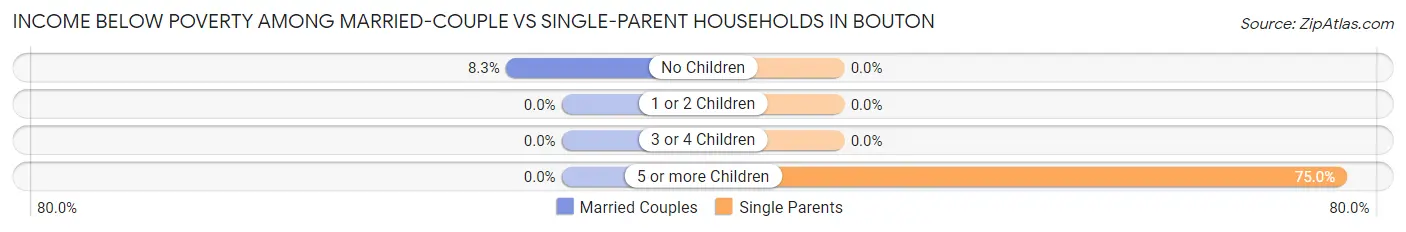
| Children | Married-Couple Families | Single-Parent Households |
| No Children | 1 (8.3%) | 0 (0.0%) |
| 1 or 2 Children | 0 (0.0%) | 0 (0.0%) |
| 3 or 4 Children | 0 (0.0%) | 0 (0.0%) |
| 5 or more Children | 0 (0.0%) | 3 (75.0%) |
| Total | 1 (3.6%) | 3 (25.0%) |
Race in Bouton
The most populous races in Bouton are White / Caucasian (153 | 90.5%), Two or more Races (12 | 7.1%), and Hispanic or Latino (9 | 5.3%).
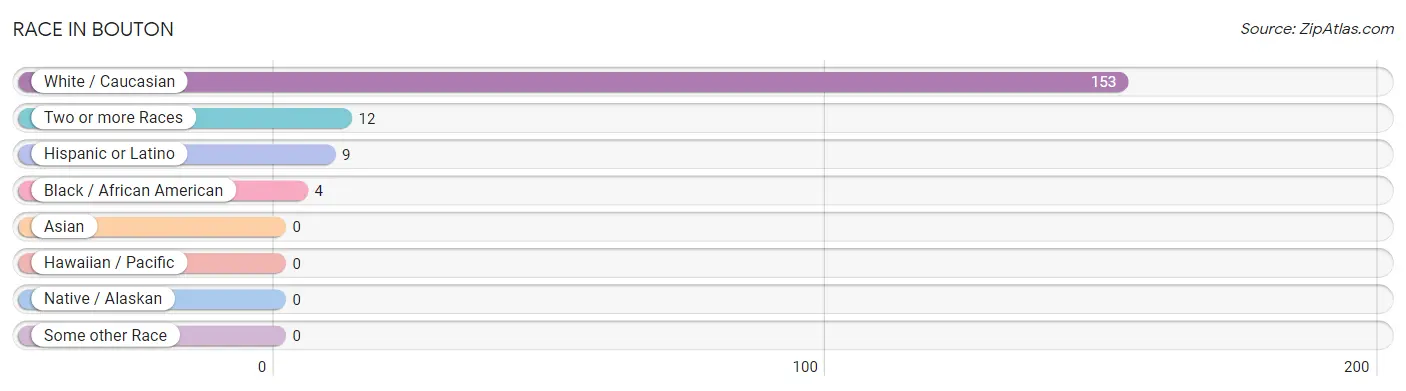
| Race | # Population | % Population |
| Asian | 0 | 0.0% |
| Black / African American | 4 | 2.4% |
| Hawaiian / Pacific | 0 | 0.0% |
| Hispanic or Latino | 9 | 5.3% |
| Native / Alaskan | 0 | 0.0% |
| White / Caucasian | 153 | 90.5% |
| Two or more Races | 12 | 7.1% |
| Some other Race | 0 | 0.0% |
| Total | 169 | 100.0% |
Ancestry in Bouton
The most populous ancestries reported in Bouton are German (52 | 30.8%), English (20 | 11.8%), Norwegian (14 | 8.3%), Irish (12 | 7.1%), and Cuban (9 | 5.3%), together accounting for 63.3% of all Bouton residents.
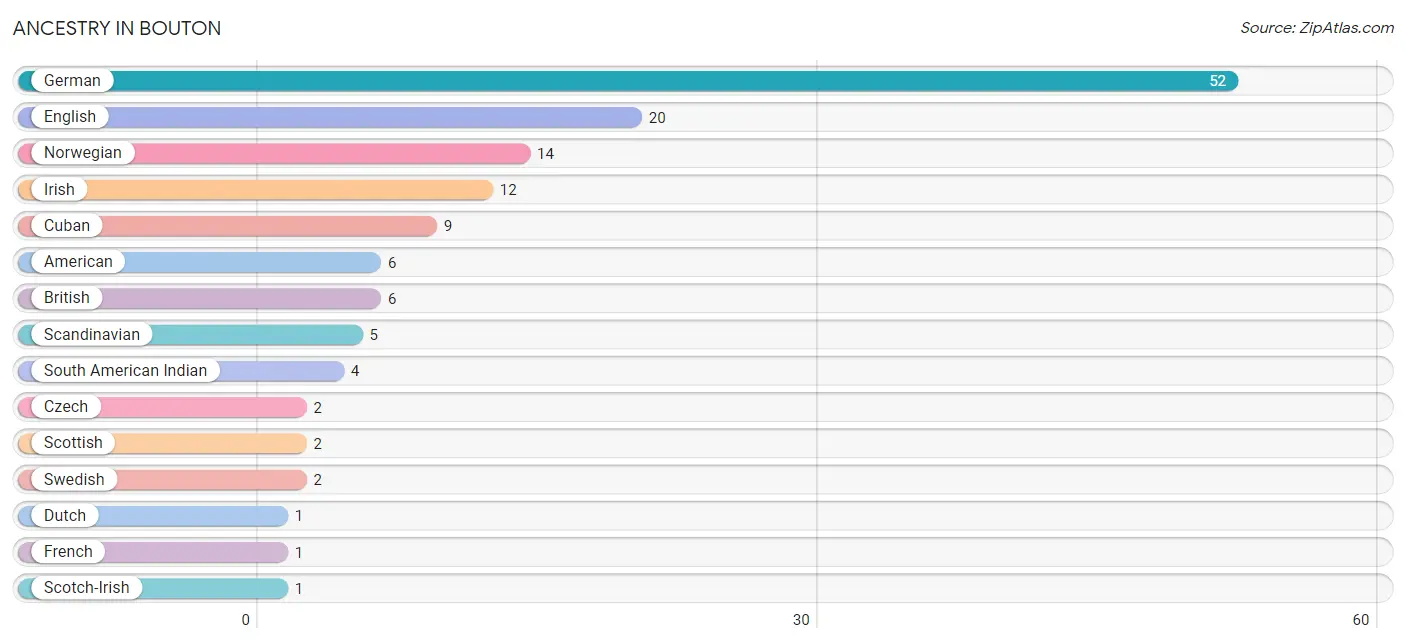
| Ancestry | # Population | % Population |
| American | 6 | 3.5% |
| British | 6 | 3.5% |
| Cuban | 9 | 5.3% |
| Czech | 2 | 1.2% |
| Dutch | 1 | 0.6% |
| English | 20 | 11.8% |
| French | 1 | 0.6% |
| German | 52 | 30.8% |
| Irish | 12 | 7.1% |
| Norwegian | 14 | 8.3% |
| Scandinavian | 5 | 3.0% |
| Scotch-Irish | 1 | 0.6% |
| Scottish | 2 | 1.2% |
| South American Indian | 4 | 2.4% |
| Swedish | 2 | 1.2% | View All 15 Rows |
Immigrants in Bouton
The most numerous immigrant groups reported in Bouton came from , and Oceania (4 | 2.4%), together accounting for 2.4% of all Bouton residents.

| Immigration Origin | # Population | % Population |
| Oceania | 4 | 2.4% | View All 1 Rows |
Sex and Age in Bouton
Sex and Age in Bouton
The most populous age groups in Bouton are 15 to 19 Years (15 | 19.5%) for men and 35 to 39 Years (14 | 15.2%) for women.
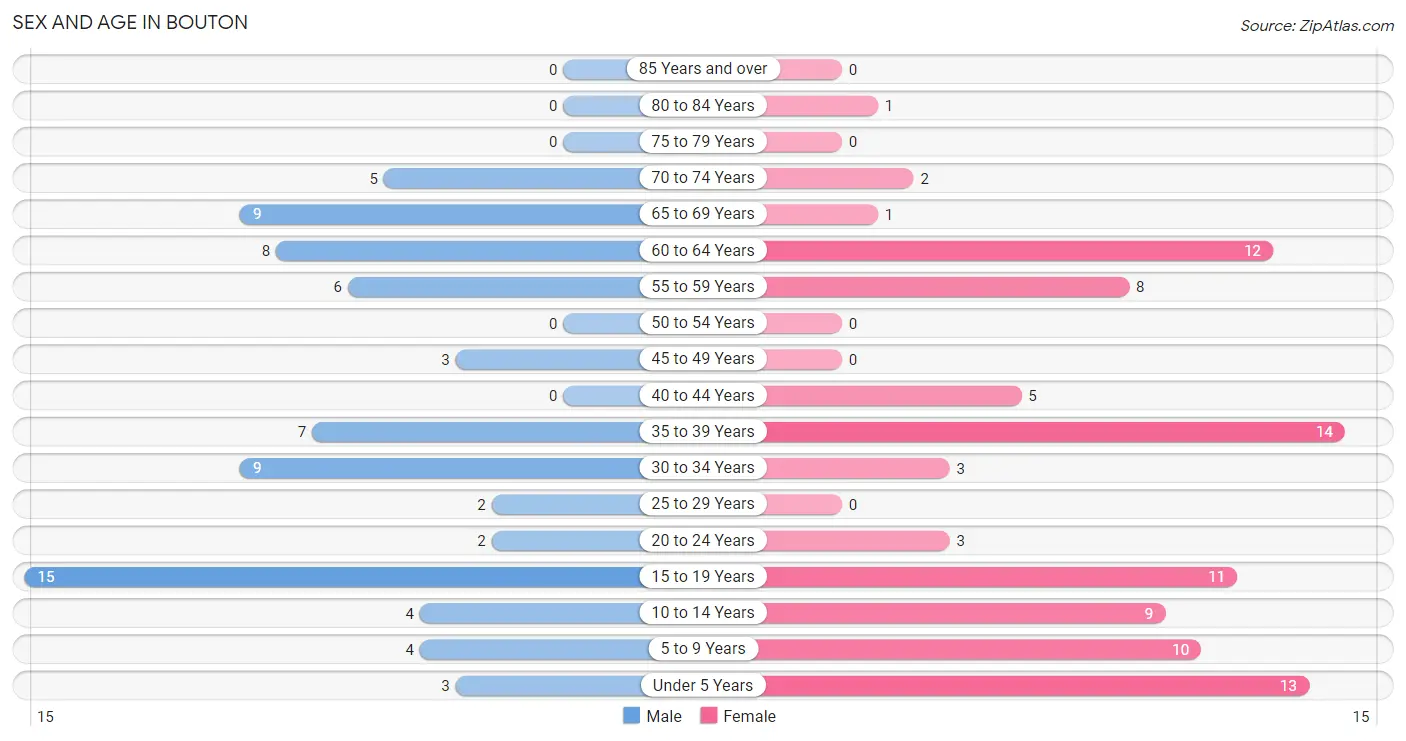
| Age Bracket | Male | Female |
| Under 5 Years | 3 (3.9%) | 13 (14.1%) |
| 5 to 9 Years | 4 (5.2%) | 10 (10.9%) |
| 10 to 14 Years | 4 (5.2%) | 9 (9.8%) |
| 15 to 19 Years | 15 (19.5%) | 11 (12.0%) |
| 20 to 24 Years | 2 (2.6%) | 3 (3.3%) |
| 25 to 29 Years | 2 (2.6%) | 0 (0.0%) |
| 30 to 34 Years | 9 (11.7%) | 3 (3.3%) |
| 35 to 39 Years | 7 (9.1%) | 14 (15.2%) |
| 40 to 44 Years | 0 (0.0%) | 5 (5.4%) |
| 45 to 49 Years | 3 (3.9%) | 0 (0.0%) |
| 50 to 54 Years | 0 (0.0%) | 0 (0.0%) |
| 55 to 59 Years | 6 (7.8%) | 8 (8.7%) |
| 60 to 64 Years | 8 (10.4%) | 12 (13.0%) |
| 65 to 69 Years | 9 (11.7%) | 1 (1.1%) |
| 70 to 74 Years | 5 (6.5%) | 2 (2.2%) |
| 75 to 79 Years | 0 (0.0%) | 0 (0.0%) |
| 80 to 84 Years | 0 (0.0%) | 1 (1.1%) |
| 85 Years and over | 0 (0.0%) | 0 (0.0%) |
| Total | 77 (100.0%) | 92 (100.0%) |
Families and Households in Bouton
Median Family Size in Bouton
The median family size in Bouton is 3.68 persons per family, with single male/father families (5 | 12.5%) accounting for the largest median family size of 6.2 persons per family. On the other hand, married-couple families (28 | 70.0%) represent the smallest median family size with 3.11 persons per family.
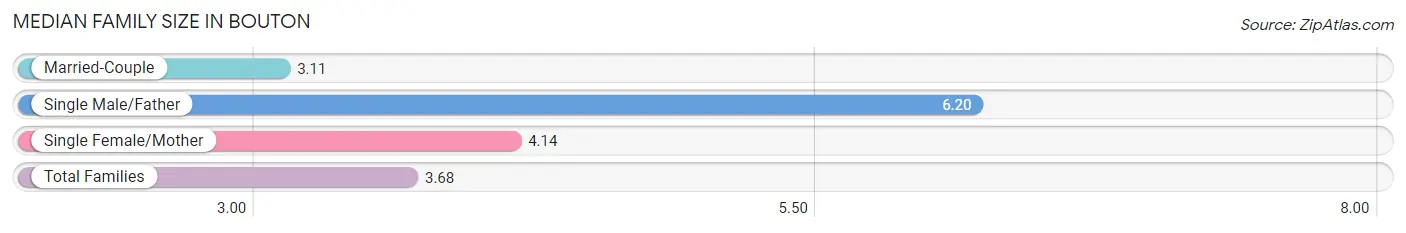
| Family Type | # Families | Family Size |
| Married-Couple | 28 (70.0%) | 3.11 |
| Single Male/Father | 5 (12.5%) | 6.20 |
| Single Female/Mother | 7 (17.5%) | 4.14 |
| Total Families | 40 (100.0%) | 3.68 |
Median Household Size in Bouton
The median household size in Bouton is 3.31 persons per household, with single male/father households (5 | 9.8%) accounting for the largest median household size of 6.8 persons per household. non-family households (11 | 21.6%) represent the smallest median household size with 1.27 persons per household.
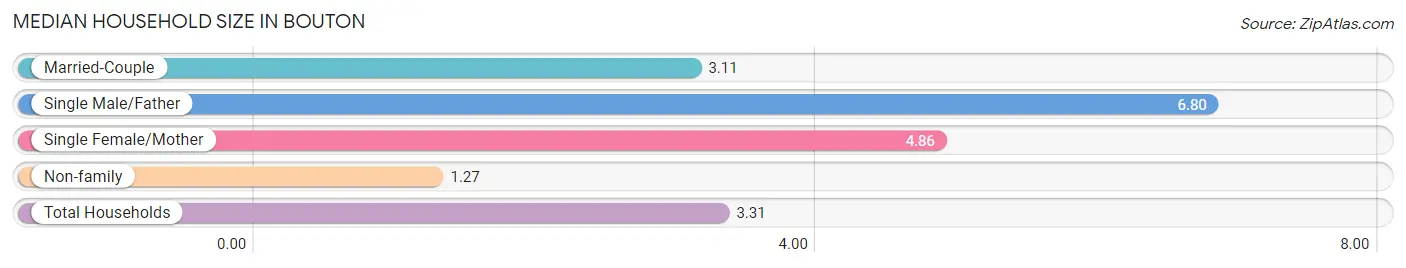
| Household Type | # Households | Household Size |
| Married-Couple | 28 (54.9%) | 3.11 |
| Single Male/Father | 5 (9.8%) | 6.80 |
| Single Female/Mother | 7 (13.7%) | 4.86 |
| Non-family | 11 (21.6%) | 1.27 |
| Total Households | 51 (100.0%) | 3.31 |
Household Size by Marriage Status in Bouton
Out of a total of 51 households in Bouton, 40 (78.4%) are family households, while 11 (21.6%) are nonfamily households. The most numerous type of family households are 2-person households, comprising 14, and the most common type of nonfamily households are 1-person households, comprising 7.
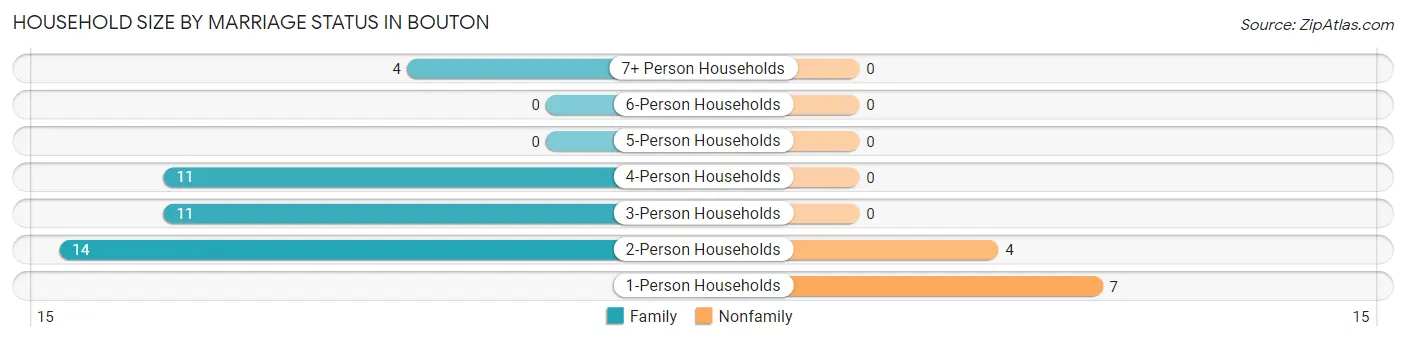
| Household Size | Family Households | Nonfamily Households |
| 1-Person Households | - | 7 (13.7%) |
| 2-Person Households | 14 (27.5%) | 4 (7.8%) |
| 3-Person Households | 11 (21.6%) | 0 (0.0%) |
| 4-Person Households | 11 (21.6%) | 0 (0.0%) |
| 5-Person Households | 0 (0.0%) | 0 (0.0%) |
| 6-Person Households | 0 (0.0%) | 0 (0.0%) |
| 7+ Person Households | 4 (7.8%) | 0 (0.0%) |
| Total | 40 (78.4%) | 11 (21.6%) |
Female Fertility in Bouton
Fertility by Age in Bouton
Average fertility rate in Bouton is 56.0 births per 1,000 women. Women in the age bracket of 20 to 34 years have the highest fertility rate with 333.0 births per 1,000 women. Women in the age bracket of 20 to 34 years acount for 100.0% of all women with births.
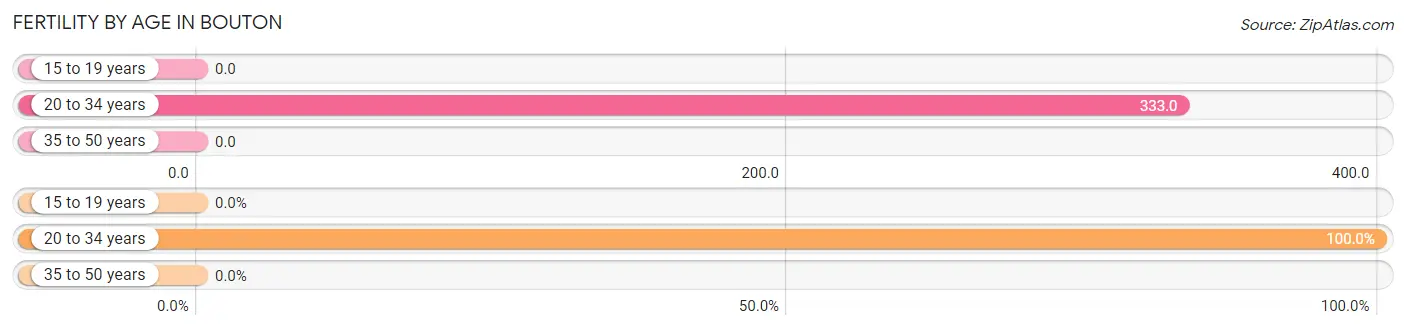
| Age Bracket | Women with Births | Births / 1,000 Women |
| 15 to 19 years | 0 (0.0%) | 0.0 |
| 20 to 34 years | 2 (100.0%) | 333.0 |
| 35 to 50 years | 0 (0.0%) | 0.0 |
| Total | 2 (100.0%) | 56.0 |
Fertility by Age by Marriage Status in Bouton
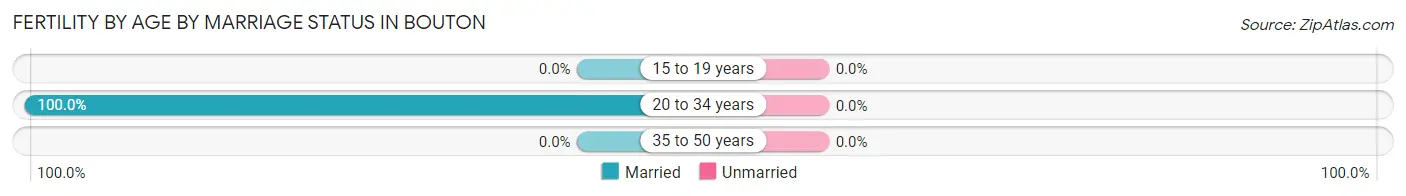
| Age Bracket | Married | Unmarried |
| 15 to 19 years | 0 (0.0%) | 0 (0.0%) |
| 20 to 34 years | 2 (100.0%) | 0 (0.0%) |
| 35 to 50 years | 0 (0.0%) | 0 (0.0%) |
| Total | 2 (100.0%) | 0 (0.0%) |
Fertility by Education in Bouton
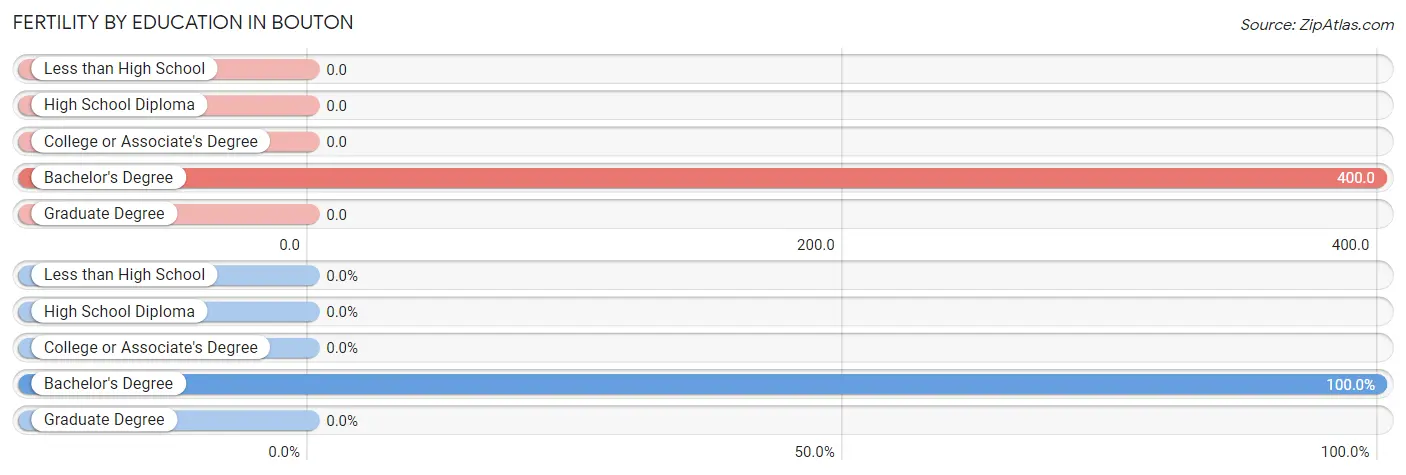
| Educational Attainment | Women with Births | Births / 1,000 Women |
| Less than High School | 0 (0.0%) | 0.0 |
| High School Diploma | 0 (0.0%) | 0.0 |
| College or Associate's Degree | 0 (0.0%) | 0.0 |
| Bachelor's Degree | 2 (100.0%) | 400.0 |
| Graduate Degree | 0 (0.0%) | 0.0 |
| Total | 2 (100.0%) | 56.0 |
Fertility by Education by Marriage Status in Bouton
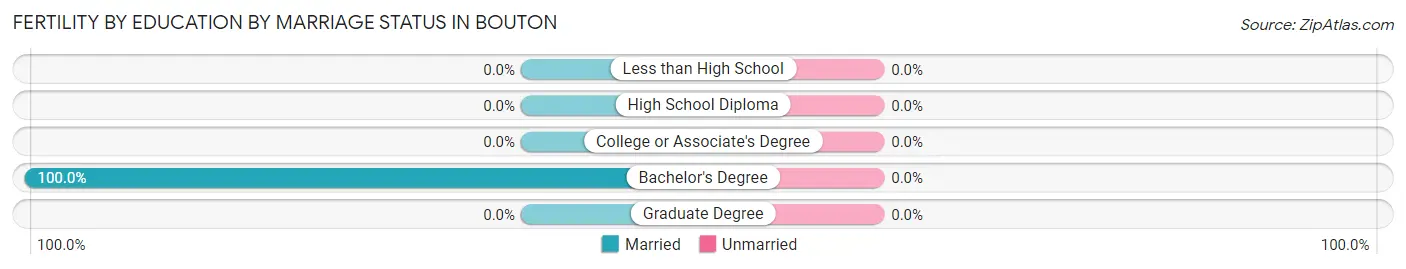
| Educational Attainment | Married | Unmarried |
| Less than High School | 0 (0.0%) | 0 (0.0%) |
| High School Diploma | 0 (0.0%) | 0 (0.0%) |
| College or Associate's Degree | 0 (0.0%) | 0 (0.0%) |
| Bachelor's Degree | 2 (100.0%) | 0 (0.0%) |
| Graduate Degree | 0 (0.0%) | 0 (0.0%) |
| Total | 2 (100.0%) | 0 (0.0%) |
Employment Characteristics in Bouton
Employment by Class of Employer in Bouton
Among the 70 employed individuals in Bouton, private company employees (37 | 52.9%), state government employees (12 | 17.1%), and local government employees (10 | 14.3%) make up the most common classes of employment.
| Employer Class | # Employees | % Employees |
| Private Company Employees | 37 | 52.9% |
| Self-Employed (Incorporated) | 2 | 2.9% |
| Self-Employed (Not Incorporated) | 3 | 4.3% |
| Not-for-profit Organizations | 6 | 8.6% |
| Local Government Employees | 10 | 14.3% |
| State Government Employees | 12 | 17.1% |
| Federal Government Employees | 0 | 0.0% |
| Unpaid Family Workers | 0 | 0.0% |
| Total | 70 | 100.0% |
Employment Status by Age in Bouton
| Age Bracket | In Labor Force | Unemployed |
| 16 to 19 Years | 0 (0.0%) | 0 (0.0%) |
| 20 to 24 Years | 5 (100.0%) | 0 (0.0%) |
| 25 to 29 Years | 2 (100.0%) | 0 (0.0%) |
| 30 to 34 Years | 12 (100.0%) | 0 (0.0%) |
| 35 to 44 Years | 22 (84.6%) | 0 (0.0%) |
| 45 to 54 Years | 3 (100.0%) | 0 (0.0%) |
| 55 to 59 Years | 8 (57.1%) | 0 (0.0%) |
| 60 to 64 Years | 13 (65.0%) | 0 (0.0%) |
| 65 to 74 Years | 5 (29.4%) | 0 (0.0%) |
| 75 Years and over | 0 (0.0%) | 0 (0.0%) |
| Total | 70 (63.1%) | 0 (0.0%) |
Employment Status by Educational Attainment in Bouton
| Educational Attainment | In Labor Force | Unemployed |
| Less than High School | 2 (66.7%) | 0 (0.0%) |
| High School Diploma | 21 (75.0%) | 0 (0.0%) |
| College / Associate Degree | 26 (78.8%) | 0 (0.0%) |
| Bachelor's Degree or higher | 11 (84.6%) | 0 (0.0%) |
| Total | 60 (77.9%) | 0 (0.0%) |
Employment Occupations by Sex in Bouton
Management, Business, Science and Arts Occupations
The most common Management, Business, Science and Arts occupations in Bouton are Computers, Engineering & Science (8 | 11.4%), Life, Physical & Social Science (6 | 8.6%), Management (4 | 5.7%), Business & Financial (4 | 5.7%), and Community & Social Service (4 | 5.7%).
Management, Business, Science and Arts Occupations by Sex
Within the Management, Business, Science and Arts occupations in Bouton, the most male-oriented occupations are Management (100.0%), Architecture & Engineering (100.0%), and Computers, Engineering & Science (75.0%), while the most female-oriented occupations are Community & Social Service (100.0%), Education Instruction & Library (100.0%), and Business & Financial (50.0%).
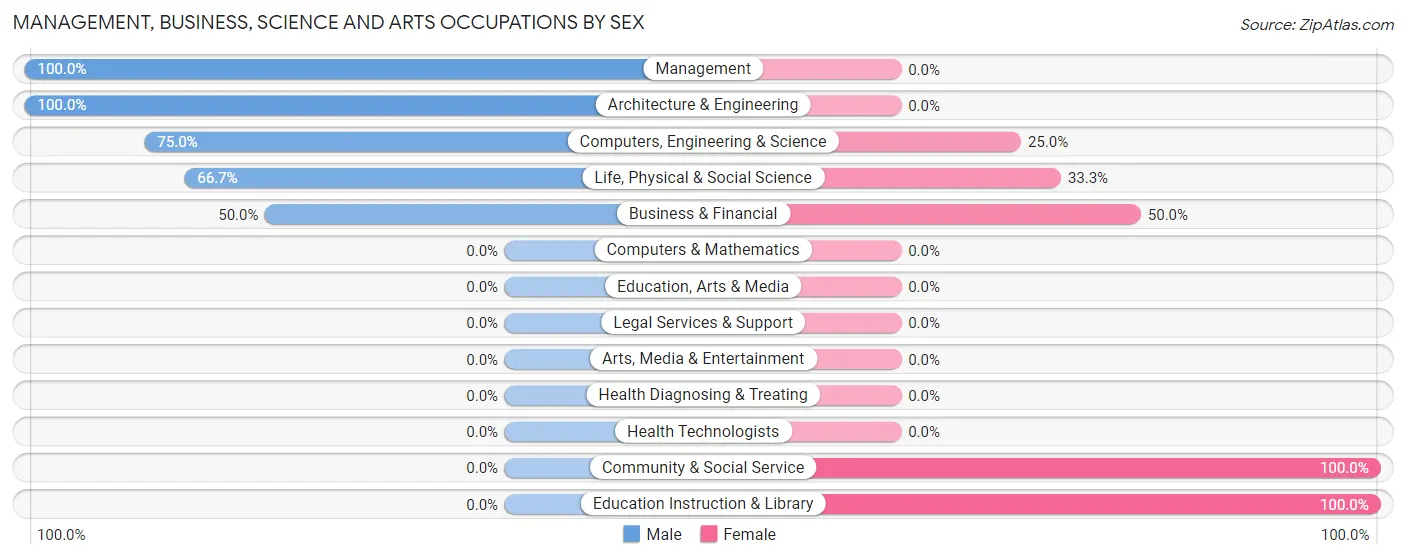
| Occupation | Male | Female |
| Management | 4 (100.0%) | 0 (0.0%) |
| Business & Financial | 2 (50.0%) | 2 (50.0%) |
| Computers, Engineering & Science | 6 (75.0%) | 2 (25.0%) |
| Computers & Mathematics | 0 (0.0%) | 0 (0.0%) |
| Architecture & Engineering | 2 (100.0%) | 0 (0.0%) |
| Life, Physical & Social Science | 4 (66.7%) | 2 (33.3%) |
| Community & Social Service | 0 (0.0%) | 4 (100.0%) |
| Education, Arts & Media | 0 (0.0%) | 0 (0.0%) |
| Legal Services & Support | 0 (0.0%) | 0 (0.0%) |
| Education Instruction & Library | 0 (0.0%) | 4 (100.0%) |
| Arts, Media & Entertainment | 0 (0.0%) | 0 (0.0%) |
| Health Diagnosing & Treating | 0 (0.0%) | 0 (0.0%) |
| Health Technologists | 0 (0.0%) | 0 (0.0%) |
| Total (Category) | 12 (60.0%) | 8 (40.0%) |
| Total (Overall) | 32 (45.7%) | 38 (54.3%) |
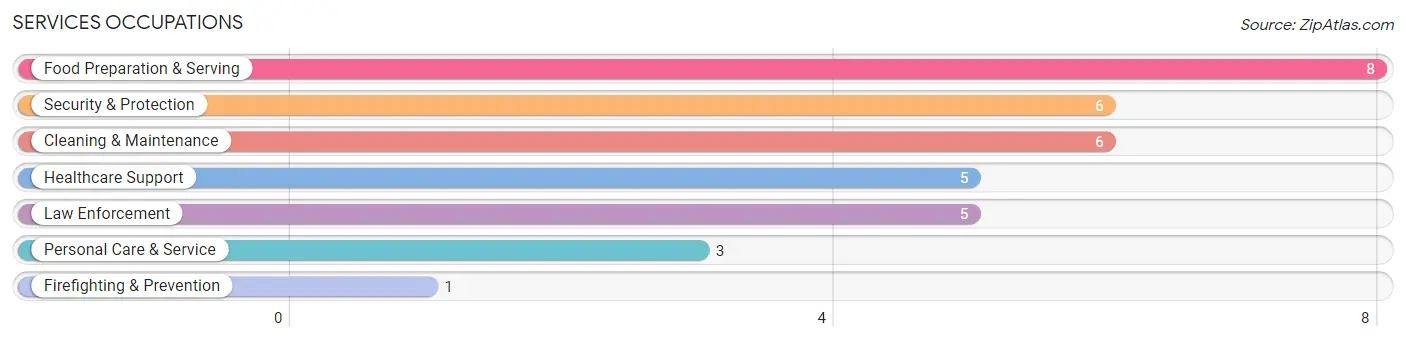
Services Occupations
The most common Services occupations in Bouton are Food Preparation & Serving (8 | 11.4%), Security & Protection (6 | 8.6%), Cleaning & Maintenance (6 | 8.6%), Healthcare Support (5 | 7.1%), and Law Enforcement (5 | 7.1%).
Services Occupations by Sex
Within the Services occupations in Bouton, the most male-oriented occupations are Firefighting & Prevention (100.0%), Food Preparation & Serving (50.0%), and Cleaning & Maintenance (50.0%), while the most female-oriented occupations are Healthcare Support (100.0%), Law Enforcement (100.0%), and Personal Care & Service (100.0%).
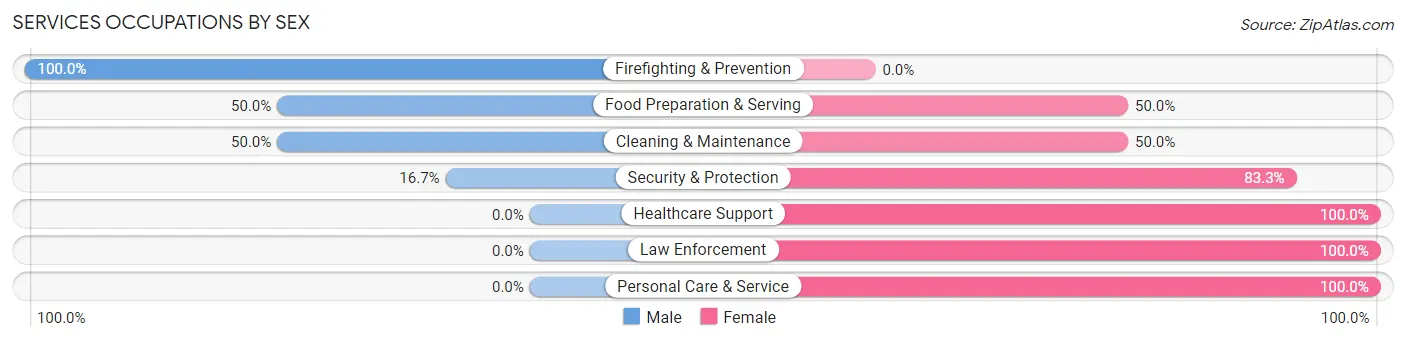
| Occupation | Male | Female |
| Healthcare Support | 0 (0.0%) | 5 (100.0%) |
| Security & Protection | 1 (16.7%) | 5 (83.3%) |
| Firefighting & Prevention | 1 (100.0%) | 0 (0.0%) |
| Law Enforcement | 0 (0.0%) | 5 (100.0%) |
| Food Preparation & Serving | 4 (50.0%) | 4 (50.0%) |
| Cleaning & Maintenance | 3 (50.0%) | 3 (50.0%) |
| Personal Care & Service | 0 (0.0%) | 3 (100.0%) |
| Total (Category) | 8 (28.6%) | 20 (71.4%) |
| Total (Overall) | 32 (45.7%) | 38 (54.3%) |
Sales and Office Occupations
The most common Sales and Office occupations in Bouton are Office & Administration (6 | 8.6%), and Sales & Related (3 | 4.3%).
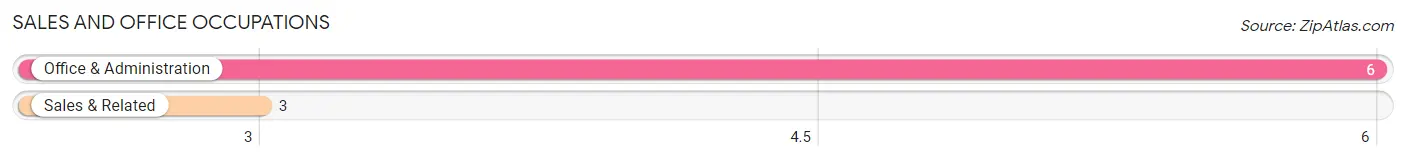
Sales and Office Occupations by Sex
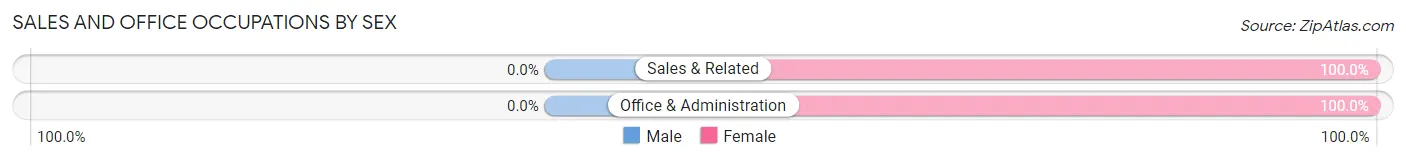
| Occupation | Male | Female |
| Sales & Related | 0 (0.0%) | 3 (100.0%) |
| Office & Administration | 0 (0.0%) | 6 (100.0%) |
| Total (Category) | 0 (0.0%) | 9 (100.0%) |
| Total (Overall) | 32 (45.7%) | 38 (54.3%) |
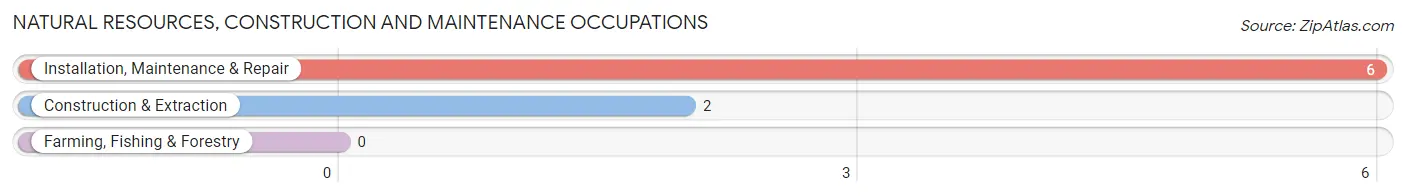
Natural Resources, Construction and Maintenance Occupations
The most common Natural Resources, Construction and Maintenance occupations in Bouton are Installation, Maintenance & Repair (6 | 8.6%), and Construction & Extraction (2 | 2.9%).
Natural Resources, Construction and Maintenance Occupations by Sex
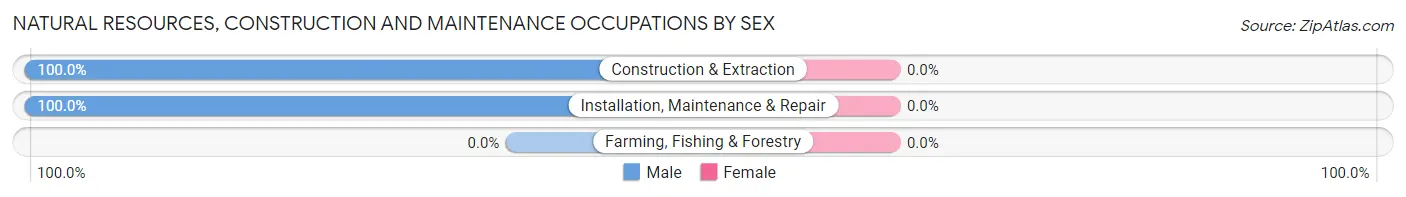
| Occupation | Male | Female |
| Farming, Fishing & Forestry | 0 (0.0%) | 0 (0.0%) |
| Construction & Extraction | 2 (100.0%) | 0 (0.0%) |
| Installation, Maintenance & Repair | 6 (100.0%) | 0 (0.0%) |
| Total (Category) | 8 (100.0%) | 0 (0.0%) |
| Total (Overall) | 32 (45.7%) | 38 (54.3%) |
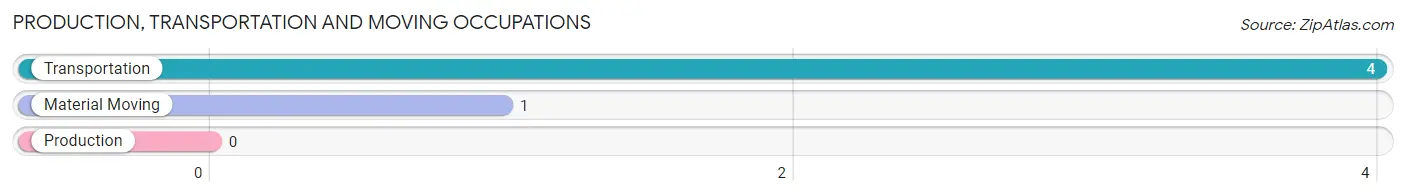
Production, Transportation and Moving Occupations
The most common Production, Transportation and Moving occupations in Bouton are Transportation (4 | 5.7%), and Material Moving (1 | 1.4%).
Production, Transportation and Moving Occupations by Sex
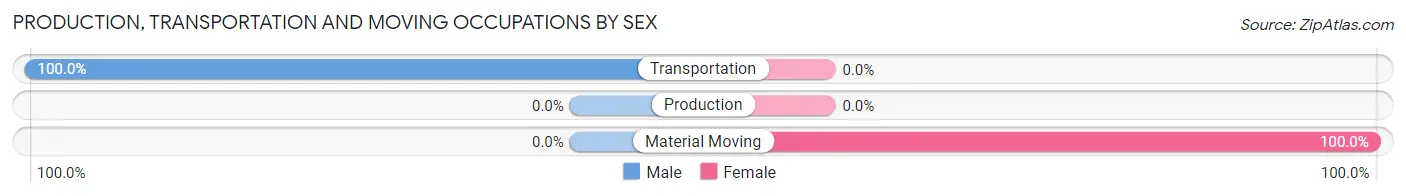
| Occupation | Male | Female |
| Production | 0 (0.0%) | 0 (0.0%) |
| Transportation | 4 (100.0%) | 0 (0.0%) |
| Material Moving | 0 (0.0%) | 1 (100.0%) |
| Total (Category) | 4 (80.0%) | 1 (20.0%) |
| Total (Overall) | 32 (45.7%) | 38 (54.3%) |
Employment Industries by Sex in Bouton
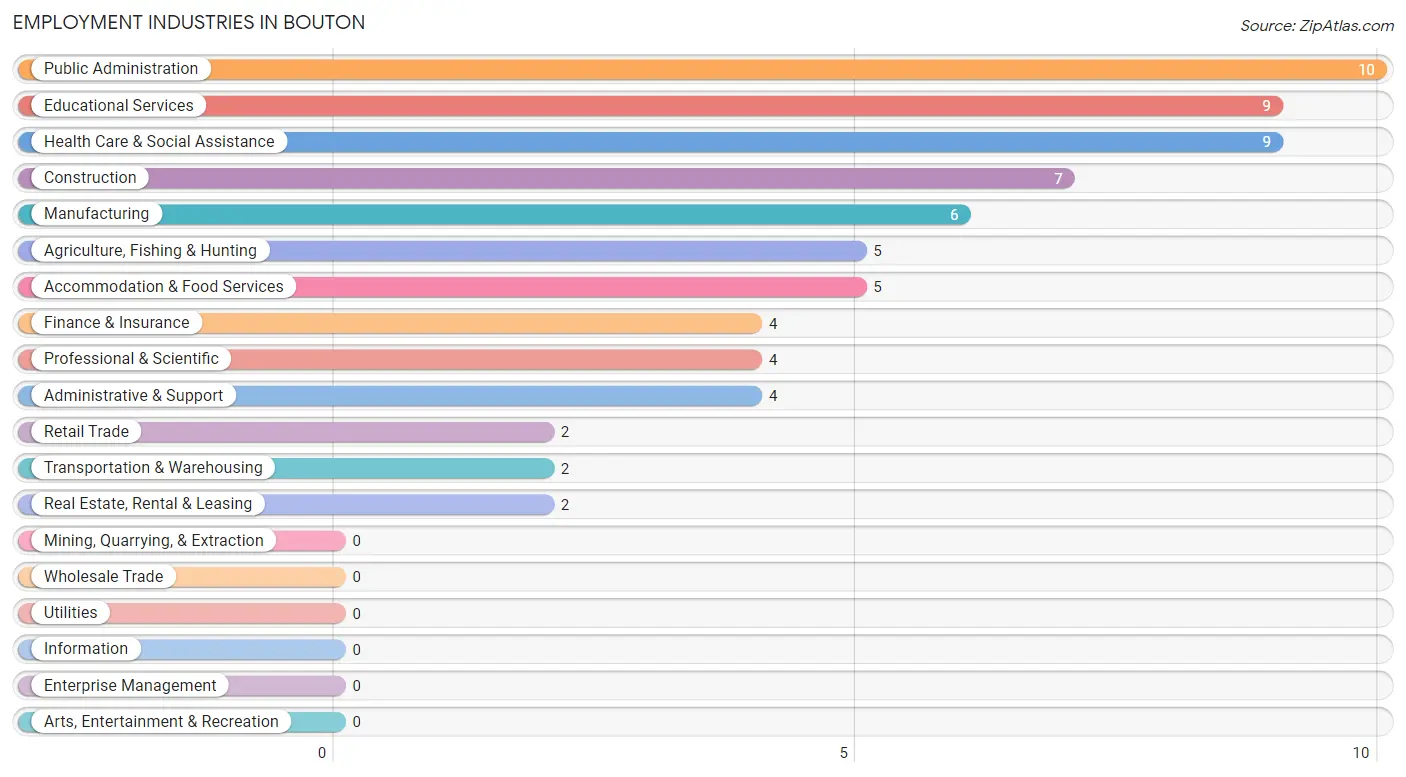
Employment Industries in Bouton
The major employment industries in Bouton include Public Administration (10 | 14.3%), Educational Services (9 | 12.9%), Health Care & Social Assistance (9 | 12.9%), Construction (7 | 10.0%), and Manufacturing (6 | 8.6%).
Employment Industries by Sex in Bouton
The Bouton industries that see more men than women are Construction (100.0%), Retail Trade (100.0%), and Transportation & Warehousing (100.0%), whereas the industries that tend to have a higher number of women are Manufacturing (100.0%), Finance & Insurance (100.0%), and Health Care & Social Assistance (88.9%).
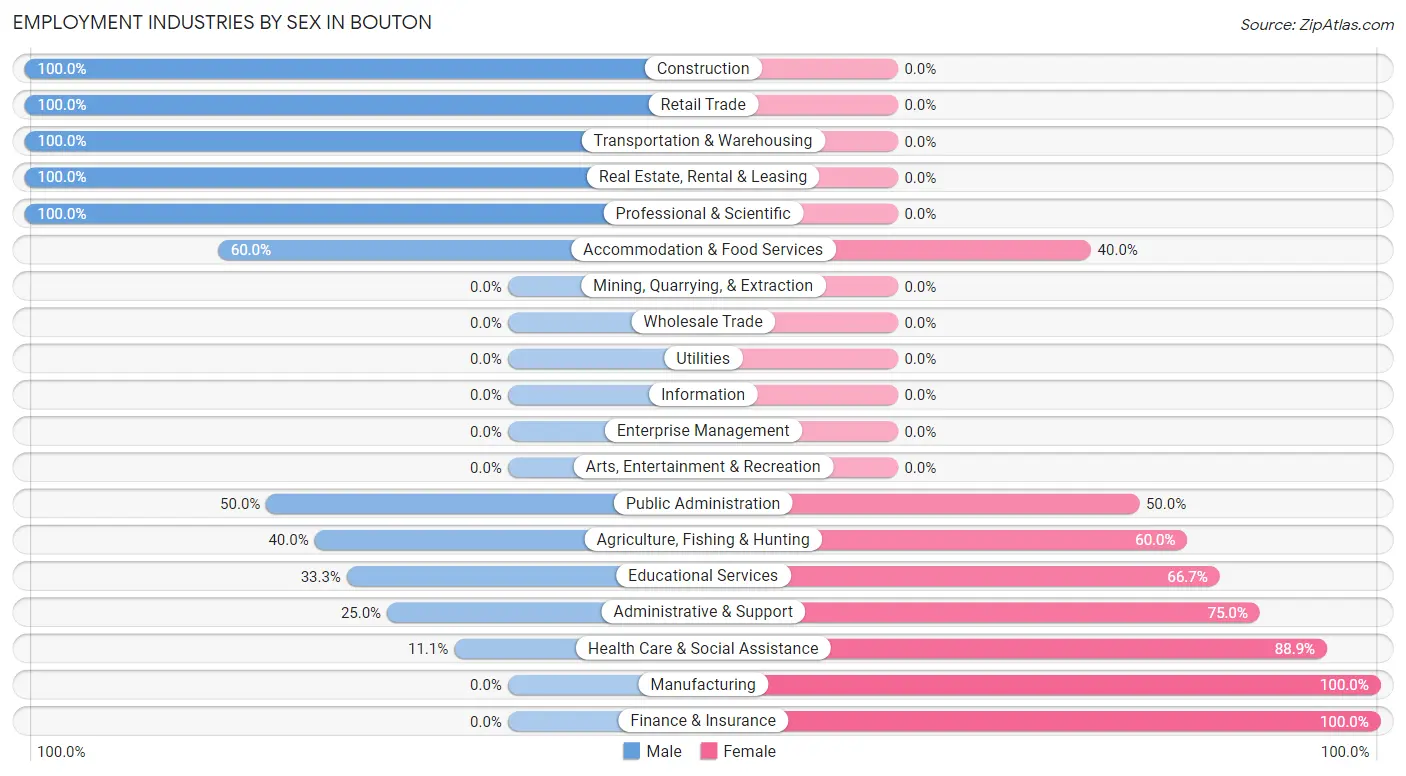
| Industry | Male | Female |
| Agriculture, Fishing & Hunting | 2 (40.0%) | 3 (60.0%) |
| Mining, Quarrying, & Extraction | 0 (0.0%) | 0 (0.0%) |
| Construction | 7 (100.0%) | 0 (0.0%) |
| Manufacturing | 0 (0.0%) | 6 (100.0%) |
| Wholesale Trade | 0 (0.0%) | 0 (0.0%) |
| Retail Trade | 2 (100.0%) | 0 (0.0%) |
| Transportation & Warehousing | 2 (100.0%) | 0 (0.0%) |
| Utilities | 0 (0.0%) | 0 (0.0%) |
| Information | 0 (0.0%) | 0 (0.0%) |
| Finance & Insurance | 0 (0.0%) | 4 (100.0%) |
| Real Estate, Rental & Leasing | 2 (100.0%) | 0 (0.0%) |
| Professional & Scientific | 4 (100.0%) | 0 (0.0%) |
| Enterprise Management | 0 (0.0%) | 0 (0.0%) |
| Administrative & Support | 1 (25.0%) | 3 (75.0%) |
| Educational Services | 3 (33.3%) | 6 (66.7%) |
| Health Care & Social Assistance | 1 (11.1%) | 8 (88.9%) |
| Arts, Entertainment & Recreation | 0 (0.0%) | 0 (0.0%) |
| Accommodation & Food Services | 3 (60.0%) | 2 (40.0%) |
| Public Administration | 5 (50.0%) | 5 (50.0%) |
| Total | 32 (45.7%) | 38 (54.3%) |
Education in Bouton
School Enrollment in Bouton
The most common levels of schooling among the 47 students in Bouton are high school (27 | 57.5%), middle school (12 | 25.5%), and elementary school (7 | 14.9%).
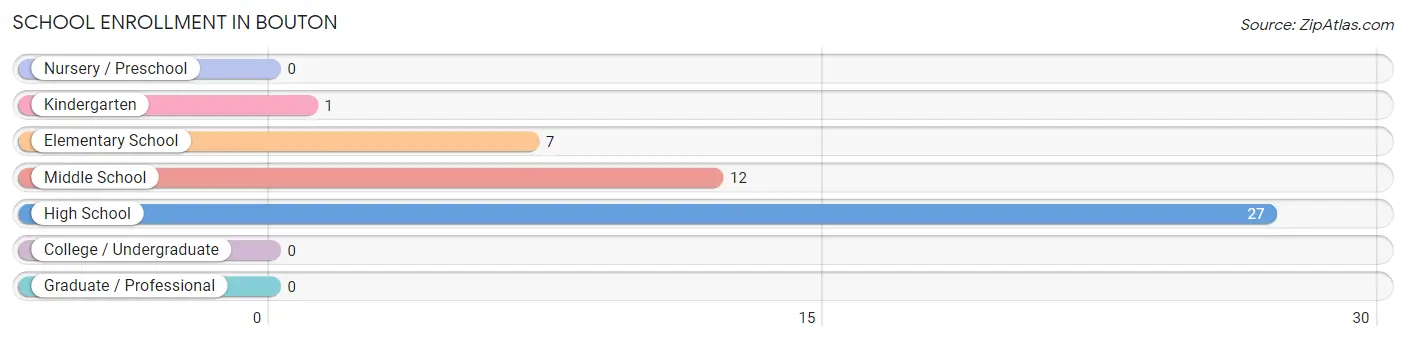
| School Level | # Students | % Students |
| Nursery / Preschool | 0 | 0.0% |
| Kindergarten | 1 | 2.1% |
| Elementary School | 7 | 14.9% |
| Middle School | 12 | 25.5% |
| High School | 27 | 57.5% |
| College / Undergraduate | 0 | 0.0% |
| Graduate / Professional | 0 | 0.0% |
| Total | 47 | 100.0% |
School Enrollment by Age by Funding Source in Bouton
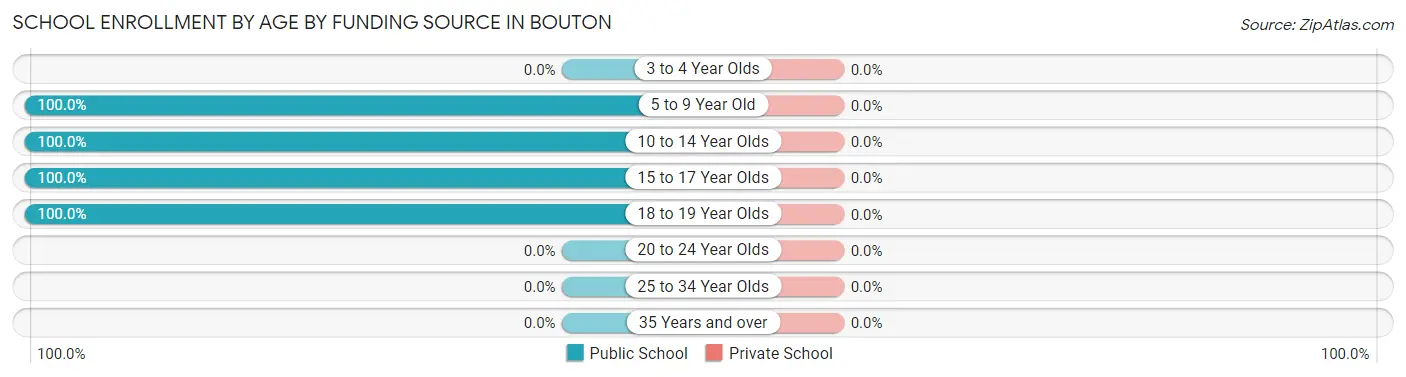
| Age Bracket | Public School | Private School |
| 3 to 4 Year Olds | 0 (0.0%) | 0 (0.0%) |
| 5 to 9 Year Old | 8 (100.0%) | 0 (0.0%) |
| 10 to 14 Year Olds | 13 (100.0%) | 0 (0.0%) |
| 15 to 17 Year Olds | 23 (100.0%) | 0 (0.0%) |
| 18 to 19 Year Olds | 3 (100.0%) | 0 (0.0%) |
| 20 to 24 Year Olds | 0 (0.0%) | 0 (0.0%) |
| 25 to 34 Year Olds | 0 (0.0%) | 0 (0.0%) |
| 35 Years and over | 0 (0.0%) | 0 (0.0%) |
| Total | 47 (100.0%) | 0 (0.0%) |
Educational Attainment by Field of Study in Bouton
Physical & health sciences (7 | 35.0%), business (6 | 30.0%), literature & languages (3 | 15.0%), liberal arts & history (3 | 15.0%), and engineering (1 | 5.0%) are the most common fields of study among 20 individuals in Bouton who have obtained a bachelor's degree or higher.
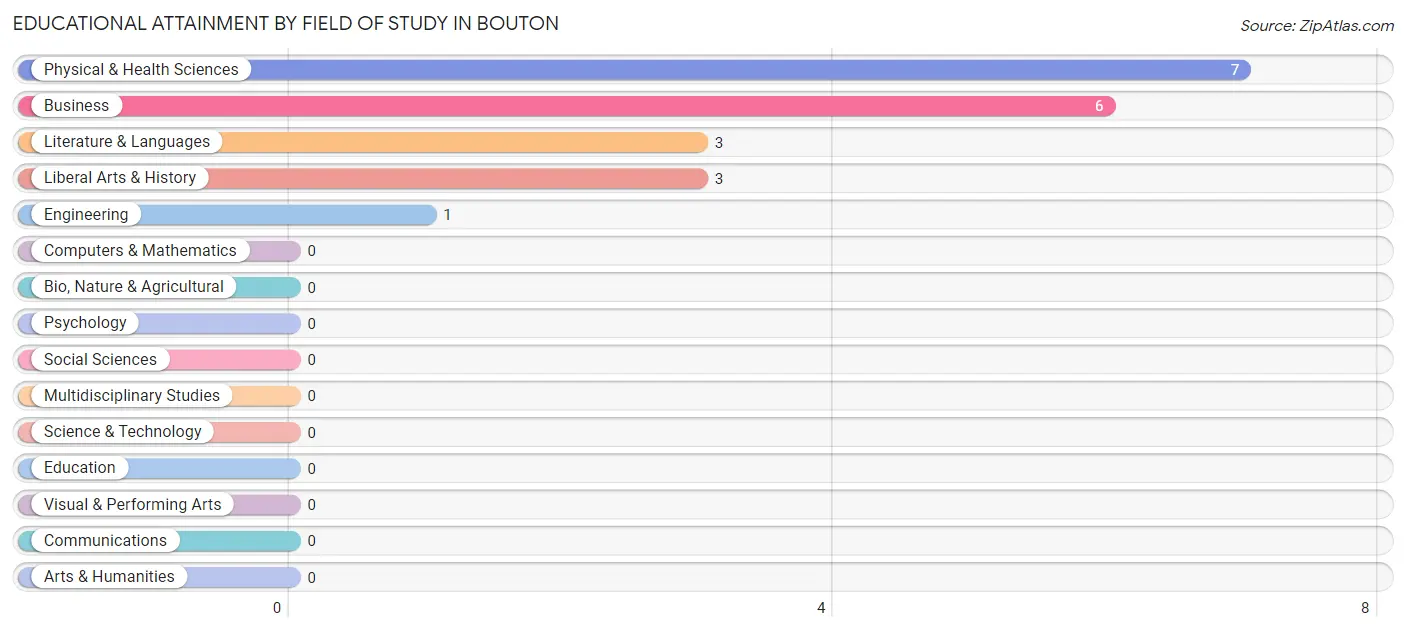
| Field of Study | # Graduates | % Graduates |
| Computers & Mathematics | 0 | 0.0% |
| Bio, Nature & Agricultural | 0 | 0.0% |
| Physical & Health Sciences | 7 | 35.0% |
| Psychology | 0 | 0.0% |
| Social Sciences | 0 | 0.0% |
| Engineering | 1 | 5.0% |
| Multidisciplinary Studies | 0 | 0.0% |
| Science & Technology | 0 | 0.0% |
| Business | 6 | 30.0% |
| Education | 0 | 0.0% |
| Literature & Languages | 3 | 15.0% |
| Liberal Arts & History | 3 | 15.0% |
| Visual & Performing Arts | 0 | 0.0% |
| Communications | 0 | 0.0% |
| Arts & Humanities | 0 | 0.0% |
| Total | 20 | 100.0% |
Transportation & Commute in Bouton
Vehicle Availability by Sex in Bouton
The most prevalent vehicle ownership categories in Bouton are males with 2 vehicles (17, accounting for 53.1%) and females with 2 vehicles (19, making up 44.7%).
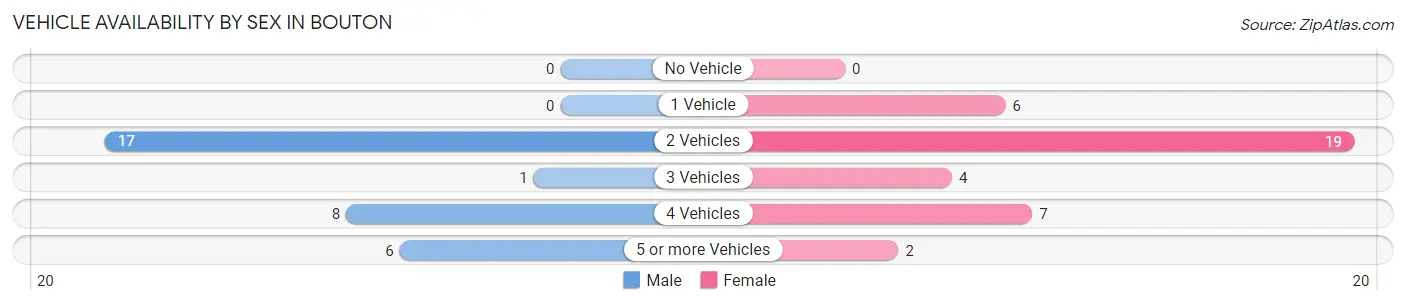
| Vehicles Available | Male | Female |
| No Vehicle | 0 (0.0%) | 0 (0.0%) |
| 1 Vehicle | 0 (0.0%) | 6 (15.8%) |
| 2 Vehicles | 17 (53.1%) | 19 (50.0%) |
| 3 Vehicles | 1 (3.1%) | 4 (10.5%) |
| 4 Vehicles | 8 (25.0%) | 7 (18.4%) |
| 5 or more Vehicles | 6 (18.8%) | 2 (5.3%) |
| Total | 32 (100.0%) | 38 (100.0%) |
Commute Time in Bouton
The most frequently occuring commute durations in Bouton are 30 to 34 minutes (20 commuters, 28.6%), 15 to 19 minutes (12 commuters, 17.1%), and 45 to 59 minutes (11 commuters, 15.7%).
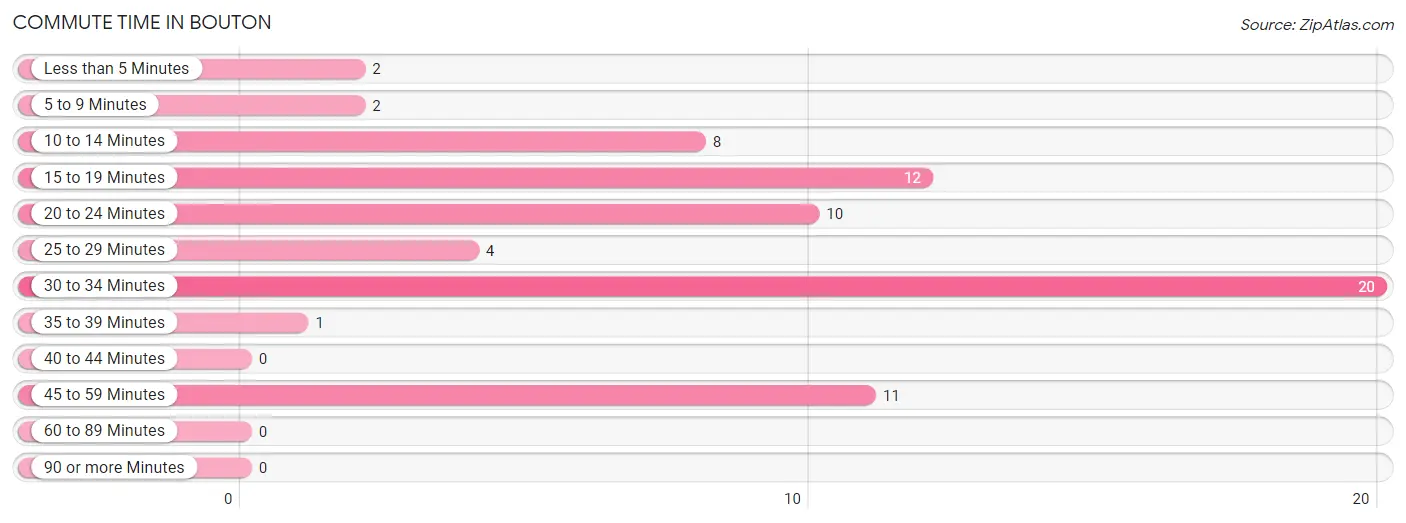
| Commute Time | # Commuters | % Commuters |
| Less than 5 Minutes | 2 | 2.9% |
| 5 to 9 Minutes | 2 | 2.9% |
| 10 to 14 Minutes | 8 | 11.4% |
| 15 to 19 Minutes | 12 | 17.1% |
| 20 to 24 Minutes | 10 | 14.3% |
| 25 to 29 Minutes | 4 | 5.7% |
| 30 to 34 Minutes | 20 | 28.6% |
| 35 to 39 Minutes | 1 | 1.4% |
| 40 to 44 Minutes | 0 | 0.0% |
| 45 to 59 Minutes | 11 | 15.7% |
| 60 to 89 Minutes | 0 | 0.0% |
| 90 or more Minutes | 0 | 0.0% |
Commute Time by Sex in Bouton
The most common commute times in Bouton are 30 to 34 minutes (8 commuters, 25.0%) for males and 30 to 34 minutes (12 commuters, 31.6%) for females.
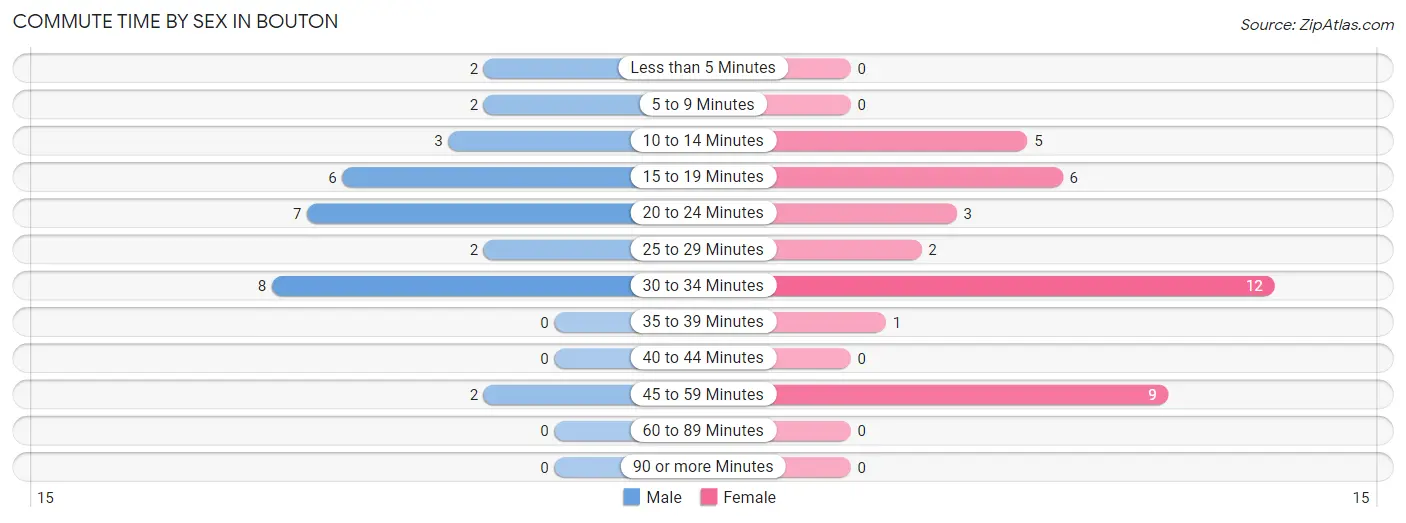
| Commute Time | Male | Female |
| Less than 5 Minutes | 2 (6.2%) | 0 (0.0%) |
| 5 to 9 Minutes | 2 (6.2%) | 0 (0.0%) |
| 10 to 14 Minutes | 3 (9.4%) | 5 (13.2%) |
| 15 to 19 Minutes | 6 (18.8%) | 6 (15.8%) |
| 20 to 24 Minutes | 7 (21.9%) | 3 (7.9%) |
| 25 to 29 Minutes | 2 (6.2%) | 2 (5.3%) |
| 30 to 34 Minutes | 8 (25.0%) | 12 (31.6%) |
| 35 to 39 Minutes | 0 (0.0%) | 1 (2.6%) |
| 40 to 44 Minutes | 0 (0.0%) | 0 (0.0%) |
| 45 to 59 Minutes | 2 (6.2%) | 9 (23.7%) |
| 60 to 89 Minutes | 0 (0.0%) | 0 (0.0%) |
| 90 or more Minutes | 0 (0.0%) | 0 (0.0%) |
Time of Departure to Work by Sex in Bouton
The most frequent times of departure to work in Bouton are 6:30 AM to 6:59 AM (9, 28.1%) for males and 7:30 AM to 7:59 AM (11, 28.9%) for females.
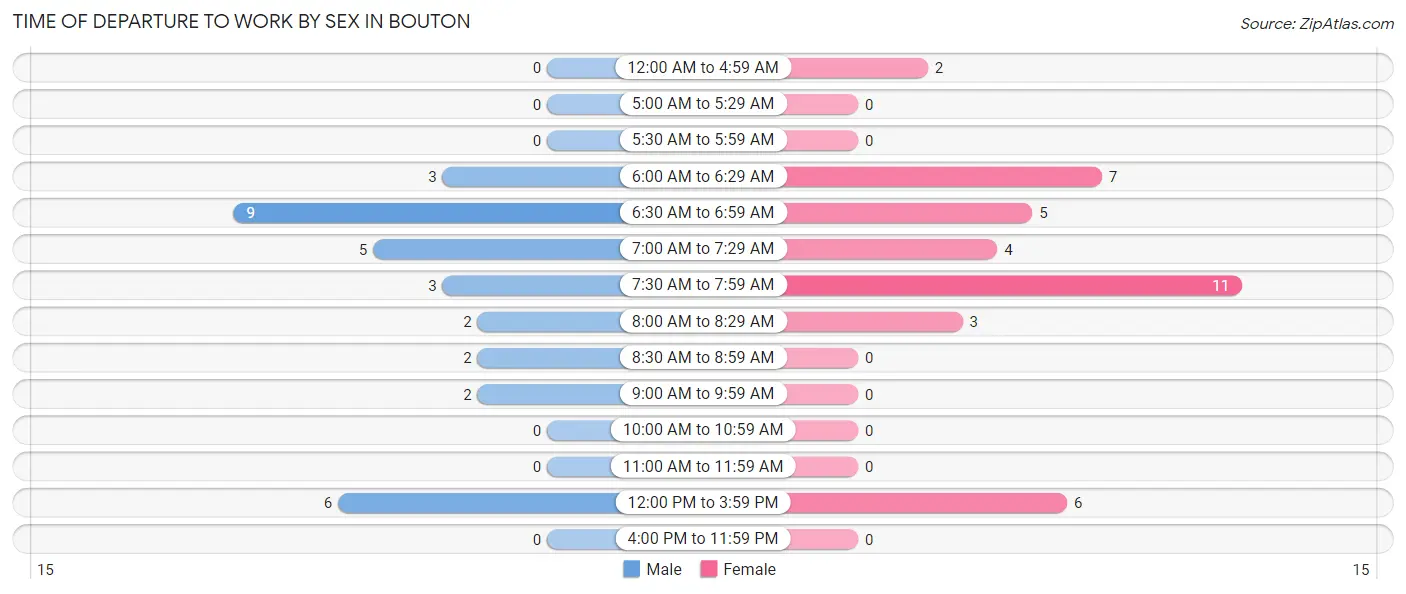
| Time of Departure | Male | Female |
| 12:00 AM to 4:59 AM | 0 (0.0%) | 2 (5.3%) |
| 5:00 AM to 5:29 AM | 0 (0.0%) | 0 (0.0%) |
| 5:30 AM to 5:59 AM | 0 (0.0%) | 0 (0.0%) |
| 6:00 AM to 6:29 AM | 3 (9.4%) | 7 (18.4%) |
| 6:30 AM to 6:59 AM | 9 (28.1%) | 5 (13.2%) |
| 7:00 AM to 7:29 AM | 5 (15.6%) | 4 (10.5%) |
| 7:30 AM to 7:59 AM | 3 (9.4%) | 11 (28.9%) |
| 8:00 AM to 8:29 AM | 2 (6.2%) | 3 (7.9%) |
| 8:30 AM to 8:59 AM | 2 (6.2%) | 0 (0.0%) |
| 9:00 AM to 9:59 AM | 2 (6.2%) | 0 (0.0%) |
| 10:00 AM to 10:59 AM | 0 (0.0%) | 0 (0.0%) |
| 11:00 AM to 11:59 AM | 0 (0.0%) | 0 (0.0%) |
| 12:00 PM to 3:59 PM | 6 (18.8%) | 6 (15.8%) |
| 4:00 PM to 11:59 PM | 0 (0.0%) | 0 (0.0%) |
| Total | 32 (100.0%) | 38 (100.0%) |
Housing Occupancy in Bouton
Occupancy by Ownership in Bouton
Of the total 51 dwellings in Bouton, owner-occupied units account for 41 (80.4%), while renter-occupied units make up 10 (19.6%).
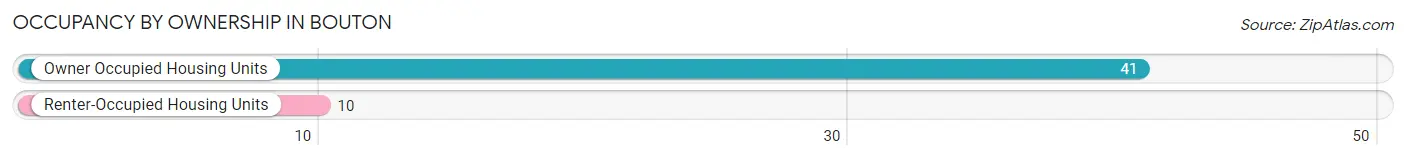
| Occupancy | # Housing Units | % Housing Units |
| Owner Occupied Housing Units | 41 | 80.4% |
| Renter-Occupied Housing Units | 10 | 19.6% |
| Total Occupied Housing Units | 51 | 100.0% |
Occupancy by Household Size in Bouton
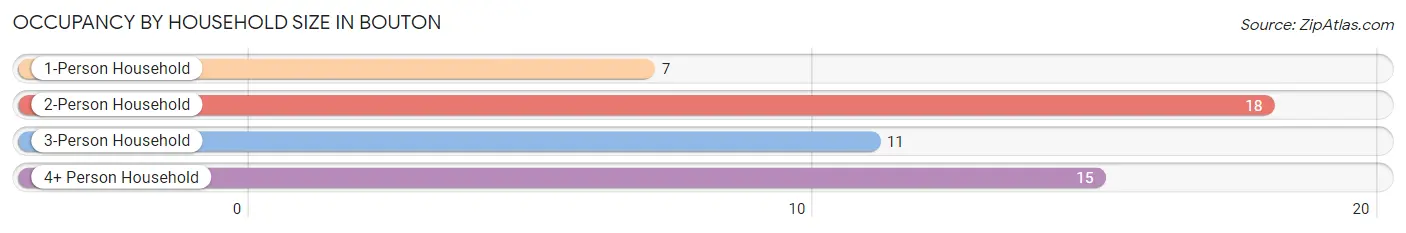
| Household Size | # Housing Units | % Housing Units |
| 1-Person Household | 7 | 13.7% |
| 2-Person Household | 18 | 35.3% |
| 3-Person Household | 11 | 21.6% |
| 4+ Person Household | 15 | 29.4% |
| Total Housing Units | 51 | 100.0% |
Occupancy by Ownership by Household Size in Bouton
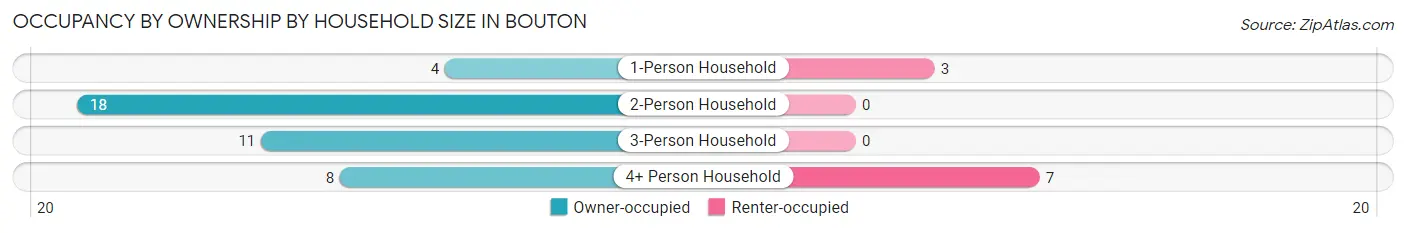
| Household Size | Owner-occupied | Renter-occupied |
| 1-Person Household | 4 (57.1%) | 3 (42.9%) |
| 2-Person Household | 18 (100.0%) | 0 (0.0%) |
| 3-Person Household | 11 (100.0%) | 0 (0.0%) |
| 4+ Person Household | 8 (53.3%) | 7 (46.7%) |
| Total Housing Units | 41 (80.4%) | 10 (19.6%) |
Occupancy by Educational Attainment in Bouton
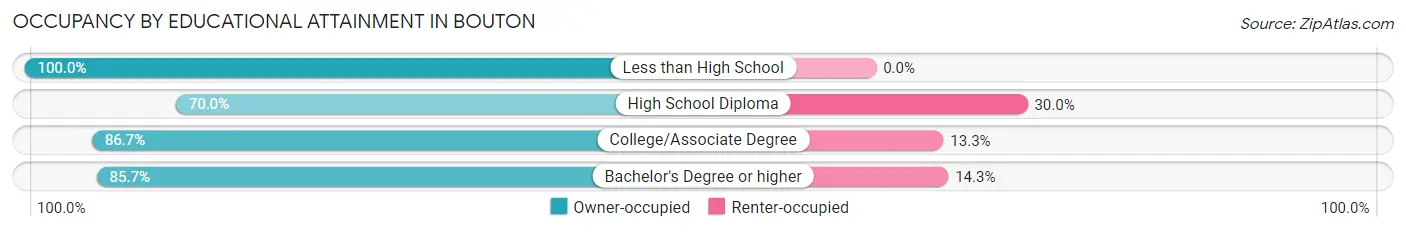
| Household Size | Owner-occupied | Renter-occupied |
| Less than High School | 2 (100.0%) | 0 (0.0%) |
| High School Diploma | 14 (70.0%) | 6 (30.0%) |
| College/Associate Degree | 13 (86.7%) | 2 (13.3%) |
| Bachelor's Degree or higher | 12 (85.7%) | 2 (14.3%) |
Occupancy by Age of Householder in Bouton
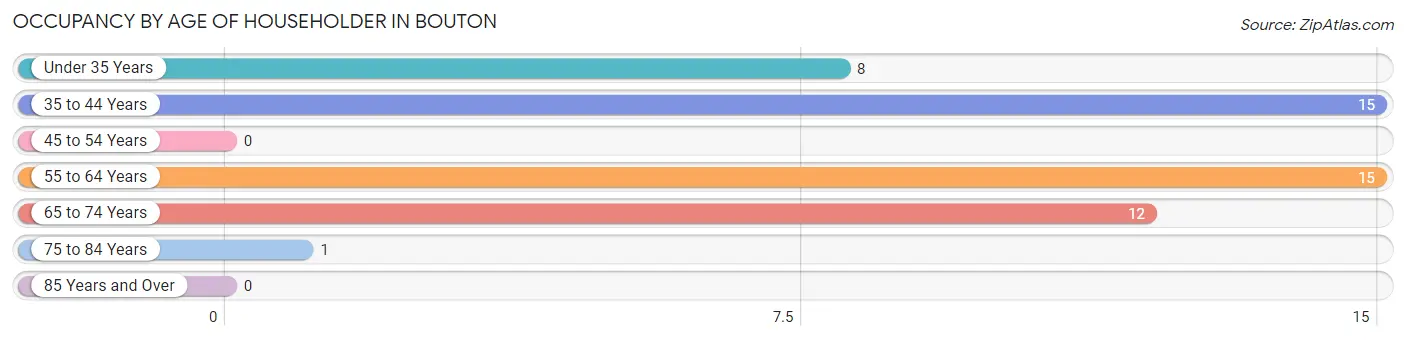
| Age Bracket | # Households | % Households |
| Under 35 Years | 8 | 15.7% |
| 35 to 44 Years | 15 | 29.4% |
| 45 to 54 Years | 0 | 0.0% |
| 55 to 64 Years | 15 | 29.4% |
| 65 to 74 Years | 12 | 23.5% |
| 75 to 84 Years | 1 | 2.0% |
| 85 Years and Over | 0 | 0.0% |
| Total | 51 | 100.0% |
Housing Finances in Bouton
Median Income by Occupancy in Bouton
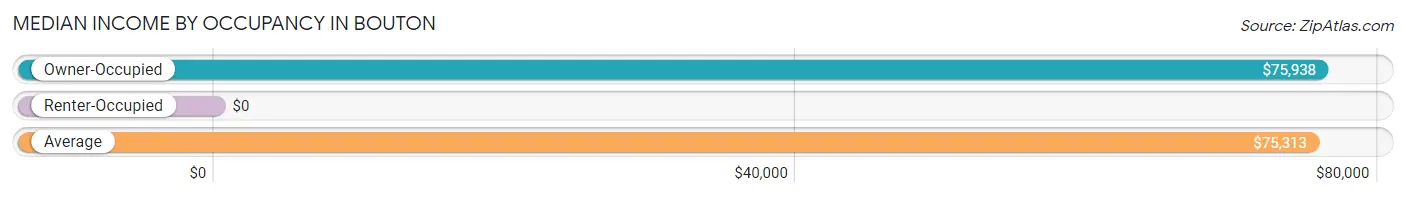
| Occupancy Type | # Households | Median Income |
| Owner-Occupied | 41 (80.4%) | $75,938 |
| Renter-Occupied | 10 (19.6%) | $0 |
| Average | 51 (100.0%) | $75,313 |
Occupancy by Householder Income Bracket in Bouton
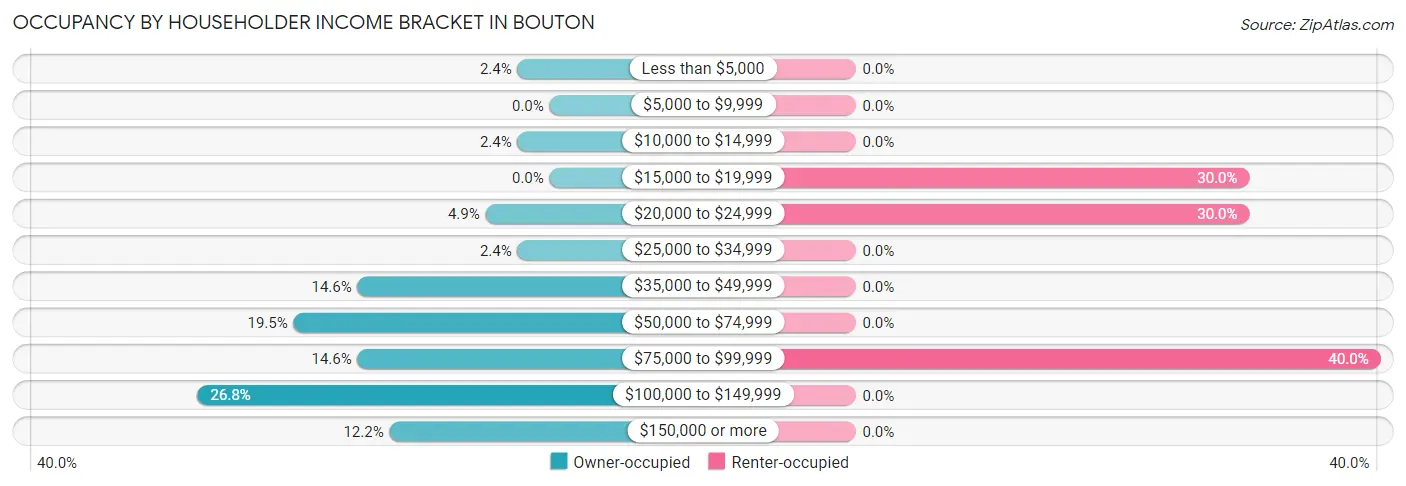
| Income Bracket | Owner-occupied | Renter-occupied |
| Less than $5,000 | 1 (2.4%) | 0 (0.0%) |
| $5,000 to $9,999 | 0 (0.0%) | 0 (0.0%) |
| $10,000 to $14,999 | 1 (2.4%) | 0 (0.0%) |
| $15,000 to $19,999 | 0 (0.0%) | 3 (30.0%) |
| $20,000 to $24,999 | 2 (4.9%) | 3 (30.0%) |
| $25,000 to $34,999 | 1 (2.4%) | 0 (0.0%) |
| $35,000 to $49,999 | 6 (14.6%) | 0 (0.0%) |
| $50,000 to $74,999 | 8 (19.5%) | 0 (0.0%) |
| $75,000 to $99,999 | 6 (14.6%) | 4 (40.0%) |
| $100,000 to $149,999 | 11 (26.8%) | 0 (0.0%) |
| $150,000 or more | 5 (12.2%) | 0 (0.0%) |
| Total | 41 (100.0%) | 10 (100.0%) |
Monthly Housing Cost Tiers in Bouton
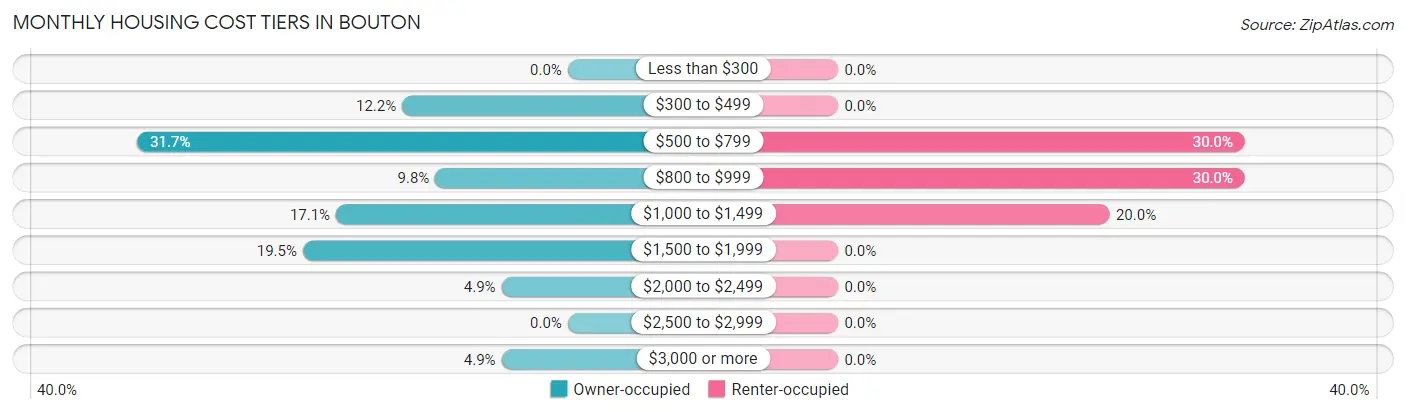
| Monthly Cost | Owner-occupied | Renter-occupied |
| Less than $300 | 0 (0.0%) | 0 (0.0%) |
| $300 to $499 | 5 (12.2%) | 0 (0.0%) |
| $500 to $799 | 13 (31.7%) | 3 (30.0%) |
| $800 to $999 | 4 (9.8%) | 3 (30.0%) |
| $1,000 to $1,499 | 7 (17.1%) | 2 (20.0%) |
| $1,500 to $1,999 | 8 (19.5%) | 0 (0.0%) |
| $2,000 to $2,499 | 2 (4.9%) | 0 (0.0%) |
| $2,500 to $2,999 | 0 (0.0%) | 0 (0.0%) |
| $3,000 or more | 2 (4.9%) | 0 (0.0%) |
| Total | 41 (100.0%) | 10 (100.0%) |
Physical Housing Characteristics in Bouton
Housing Structures in Bouton
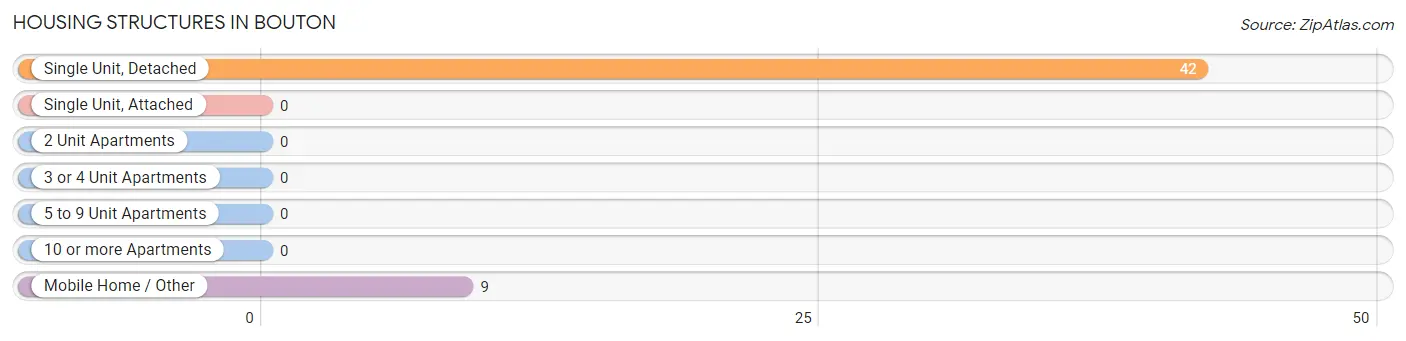
| Structure Type | # Housing Units | % Housing Units |
| Single Unit, Detached | 42 | 82.4% |
| Single Unit, Attached | 0 | 0.0% |
| 2 Unit Apartments | 0 | 0.0% |
| 3 or 4 Unit Apartments | 0 | 0.0% |
| 5 to 9 Unit Apartments | 0 | 0.0% |
| 10 or more Apartments | 0 | 0.0% |
| Mobile Home / Other | 9 | 17.6% |
| Total | 51 | 100.0% |
Housing Structures by Occupancy in Bouton
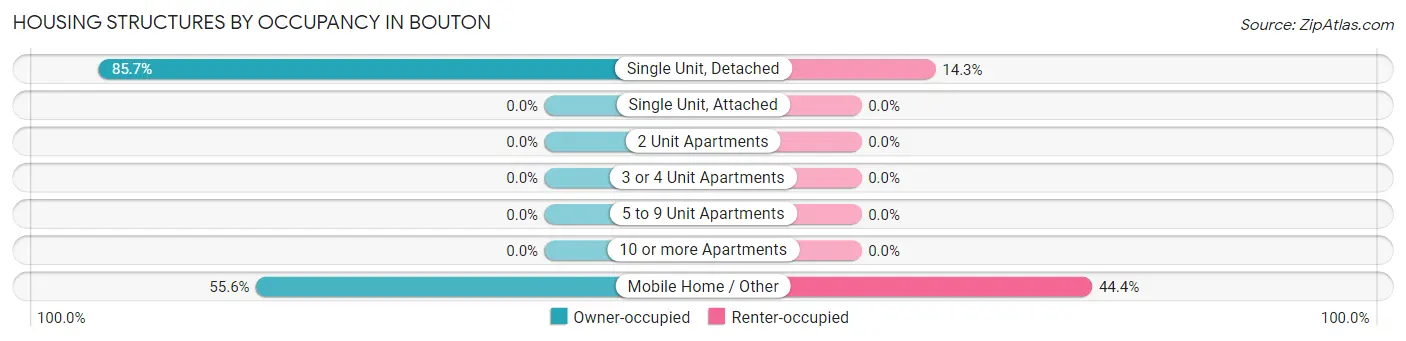
| Structure Type | Owner-occupied | Renter-occupied |
| Single Unit, Detached | 36 (85.7%) | 6 (14.3%) |
| Single Unit, Attached | 0 (0.0%) | 0 (0.0%) |
| 2 Unit Apartments | 0 (0.0%) | 0 (0.0%) |
| 3 or 4 Unit Apartments | 0 (0.0%) | 0 (0.0%) |
| 5 to 9 Unit Apartments | 0 (0.0%) | 0 (0.0%) |
| 10 or more Apartments | 0 (0.0%) | 0 (0.0%) |
| Mobile Home / Other | 5 (55.6%) | 4 (44.4%) |
| Total | 41 (80.4%) | 10 (19.6%) |
Housing Structures by Number of Rooms in Bouton
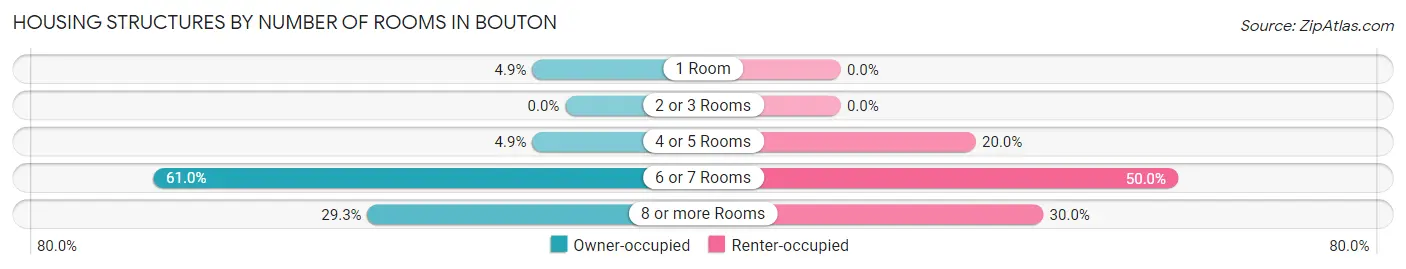
| Number of Rooms | Owner-occupied | Renter-occupied |
| 1 Room | 2 (4.9%) | 0 (0.0%) |
| 2 or 3 Rooms | 0 (0.0%) | 0 (0.0%) |
| 4 or 5 Rooms | 2 (4.9%) | 2 (20.0%) |
| 6 or 7 Rooms | 25 (61.0%) | 5 (50.0%) |
| 8 or more Rooms | 12 (29.3%) | 3 (30.0%) |
| Total | 41 (100.0%) | 10 (100.0%) |
Housing Structure by Heating Type in Bouton
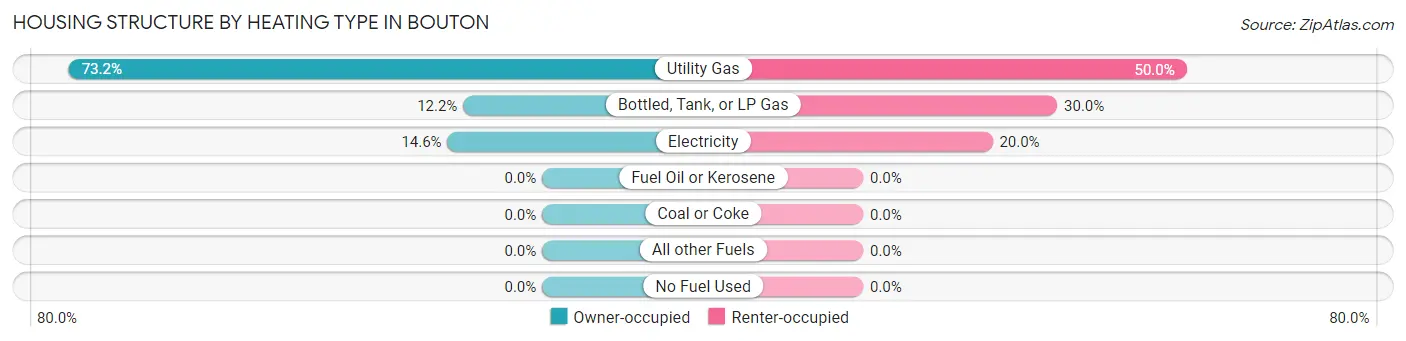
| Heating Type | Owner-occupied | Renter-occupied |
| Utility Gas | 30 (73.2%) | 5 (50.0%) |
| Bottled, Tank, or LP Gas | 5 (12.2%) | 3 (30.0%) |
| Electricity | 6 (14.6%) | 2 (20.0%) |
| Fuel Oil or Kerosene | 0 (0.0%) | 0 (0.0%) |
| Coal or Coke | 0 (0.0%) | 0 (0.0%) |
| All other Fuels | 0 (0.0%) | 0 (0.0%) |
| No Fuel Used | 0 (0.0%) | 0 (0.0%) |
| Total | 41 (100.0%) | 10 (100.0%) |
Household Vehicle Usage in Bouton
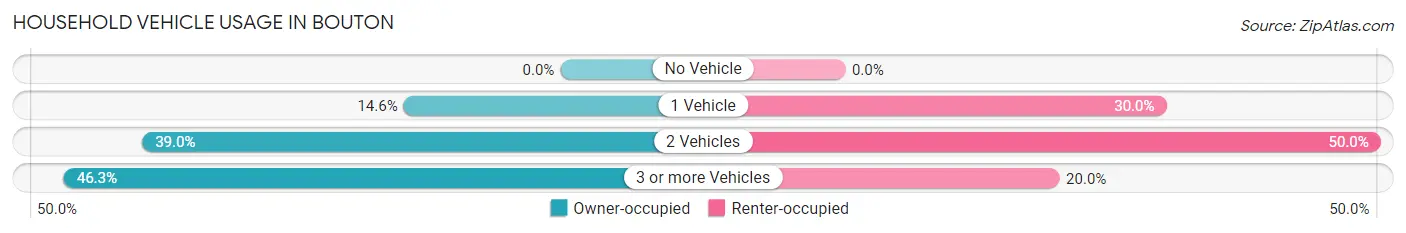
| Vehicles per Household | Owner-occupied | Renter-occupied |
| No Vehicle | 0 (0.0%) | 0 (0.0%) |
| 1 Vehicle | 6 (14.6%) | 3 (30.0%) |
| 2 Vehicles | 16 (39.0%) | 5 (50.0%) |
| 3 or more Vehicles | 19 (46.3%) | 2 (20.0%) |
| Total | 41 (100.0%) | 10 (100.0%) |
Real Estate & Mortgages in Bouton
Real Estate and Mortgage Overview in Bouton
| Characteristic | Without Mortgage | With Mortgage |
| Housing Units | 23 | 18 |
| Median Property Value | $87,500 | $0 |
| Median Household Income | $75,313 | $3 |
| Monthly Housing Costs | $625 | $2 |
| Real Estate Taxes | $1,583 | $0 |
Property Value by Mortgage Status in Bouton
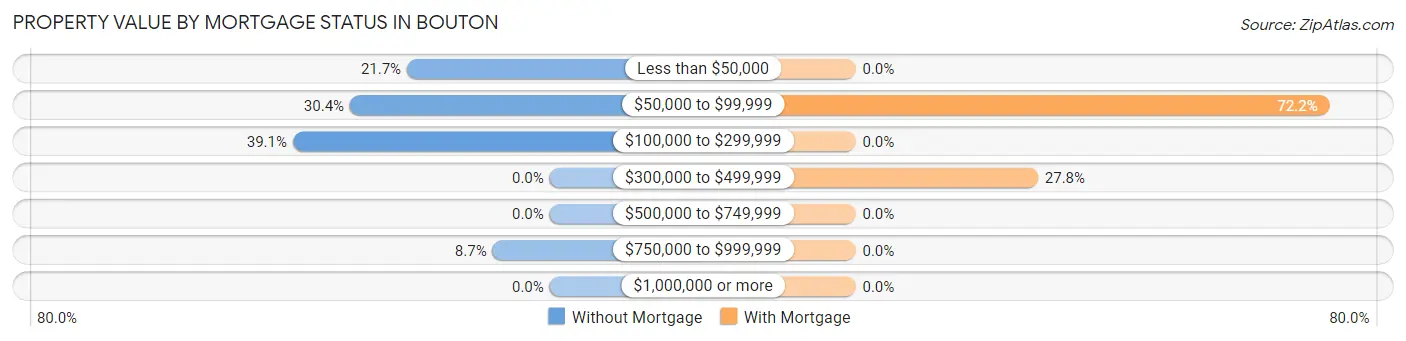
| Property Value | Without Mortgage | With Mortgage |
| Less than $50,000 | 5 (21.7%) | 0 (0.0%) |
| $50,000 to $99,999 | 7 (30.4%) | 13 (72.2%) |
| $100,000 to $299,999 | 9 (39.1%) | 0 (0.0%) |
| $300,000 to $499,999 | 0 (0.0%) | 5 (27.8%) |
| $500,000 to $749,999 | 0 (0.0%) | 0 (0.0%) |
| $750,000 to $999,999 | 2 (8.7%) | 0 (0.0%) |
| $1,000,000 or more | 0 (0.0%) | 0 (0.0%) |
| Total | 23 (100.0%) | 18 (100.0%) |
Household Income by Mortgage Status in Bouton
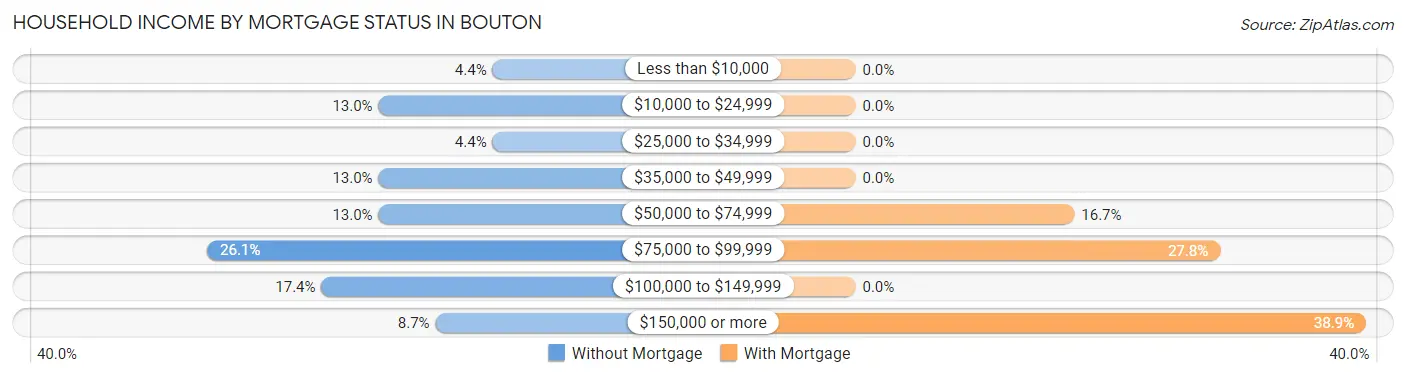
| Household Income | Without Mortgage | With Mortgage |
| Less than $10,000 | 1 (4.3%) | 0 (0.0%) |
| $10,000 to $24,999 | 3 (13.0%) | 0 (0.0%) |
| $25,000 to $34,999 | 1 (4.3%) | 0 (0.0%) |
| $35,000 to $49,999 | 3 (13.0%) | 0 (0.0%) |
| $50,000 to $74,999 | 3 (13.0%) | 3 (16.7%) |
| $75,000 to $99,999 | 6 (26.1%) | 5 (27.8%) |
| $100,000 to $149,999 | 4 (17.4%) | 0 (0.0%) |
| $150,000 or more | 2 (8.7%) | 7 (38.9%) |
| Total | 23 (100.0%) | 18 (100.0%) |
Property Value to Household Income Ratio in Bouton
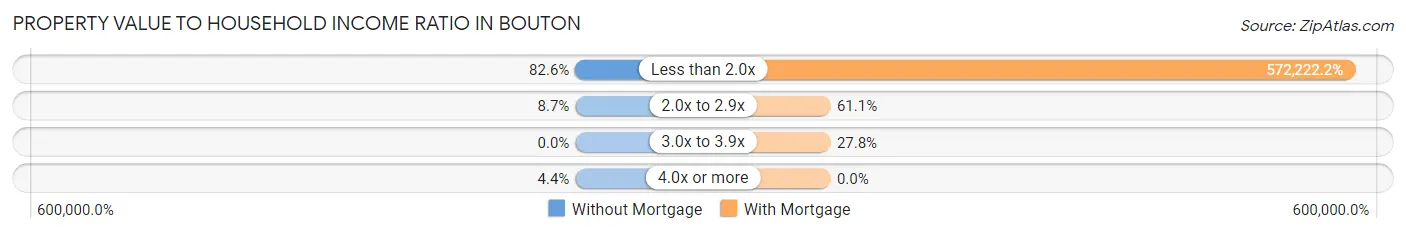
| Value-to-Income Ratio | Without Mortgage | With Mortgage |
| Less than 2.0x | 19 (82.6%) | 103,000 (572,222.2%) |
| 2.0x to 2.9x | 2 (8.7%) | 11 (61.1%) |
| 3.0x to 3.9x | 0 (0.0%) | 5 (27.8%) |
| 4.0x or more | 1 (4.3%) | 0 (0.0%) |
| Total | 23 (100.0%) | 18 (100.0%) |
Real Estate Taxes by Mortgage Status in Bouton
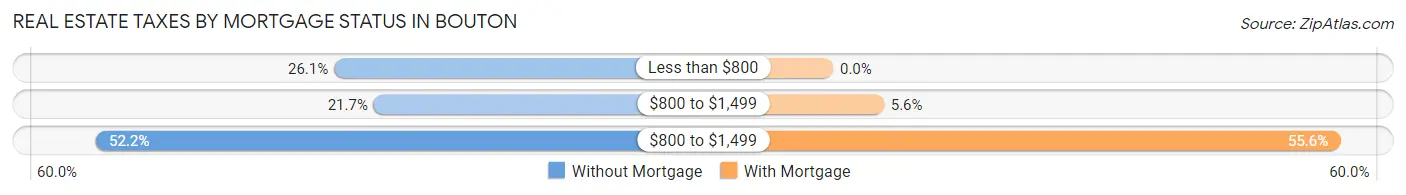
| Property Taxes | Without Mortgage | With Mortgage |
| Less than $800 | 6 (26.1%) | 0 (0.0%) |
| $800 to $1,499 | 5 (21.7%) | 1 (5.6%) |
| $800 to $1,499 | 12 (52.2%) | 10 (55.6%) |
| Total | 23 (100.0%) | 18 (100.0%) |
Health & Disability in Bouton
Health Insurance Coverage by Age in Bouton
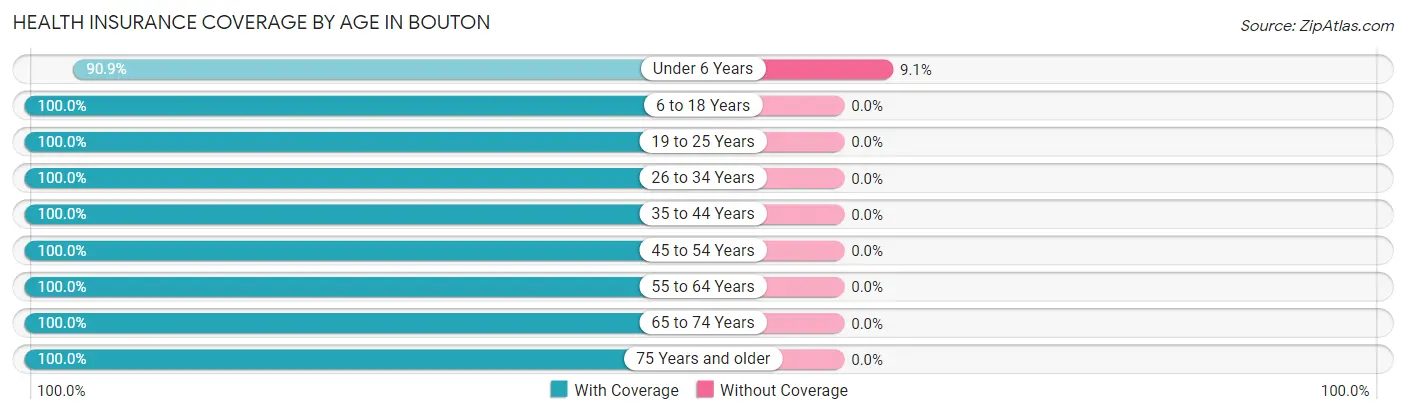
| Age Bracket | With Coverage | Without Coverage |
| Under 6 Years | 20 (90.9%) | 2 (9.1%) |
| 6 to 18 Years | 47 (100.0%) | 0 (0.0%) |
| 19 to 25 Years | 5 (100.0%) | 0 (0.0%) |
| 26 to 34 Years | 14 (100.0%) | 0 (0.0%) |
| 35 to 44 Years | 26 (100.0%) | 0 (0.0%) |
| 45 to 54 Years | 3 (100.0%) | 0 (0.0%) |
| 55 to 64 Years | 34 (100.0%) | 0 (0.0%) |
| 65 to 74 Years | 17 (100.0%) | 0 (0.0%) |
| 75 Years and older | 1 (100.0%) | 0 (0.0%) |
| Total | 167 (98.8%) | 2 (1.2%) |
Health Insurance Coverage by Citizenship Status in Bouton
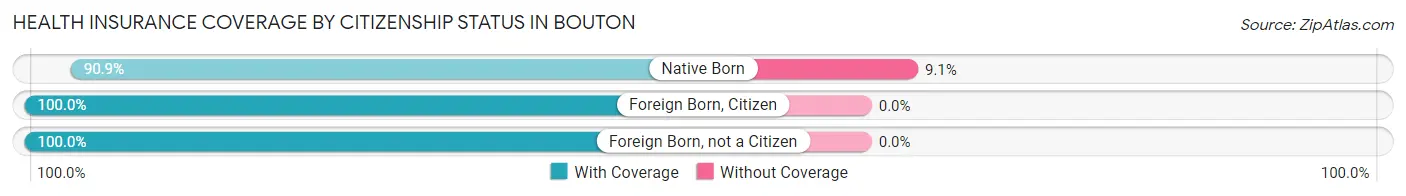
| Citizenship Status | With Coverage | Without Coverage |
| Native Born | 20 (90.9%) | 2 (9.1%) |
| Foreign Born, Citizen | 47 (100.0%) | 0 (0.0%) |
| Foreign Born, not a Citizen | 5 (100.0%) | 0 (0.0%) |
Health Insurance Coverage by Household Income in Bouton
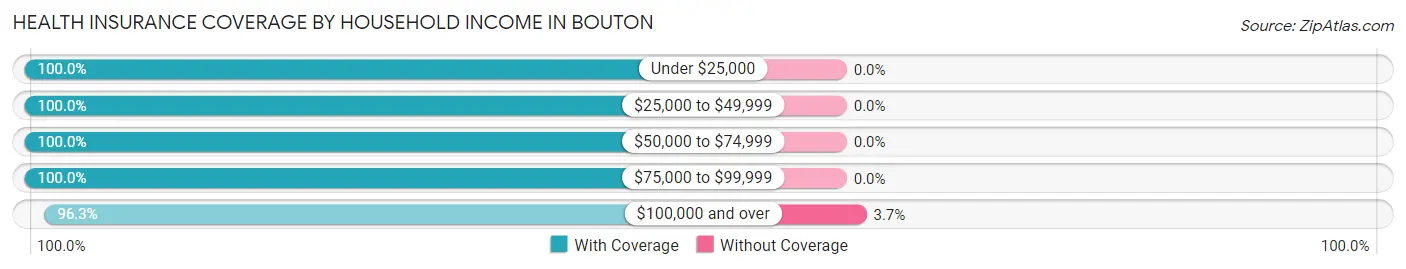
| Household Income | With Coverage | Without Coverage |
| Under $25,000 | 31 (100.0%) | 0 (0.0%) |
| $25,000 to $49,999 | 16 (100.0%) | 0 (0.0%) |
| $50,000 to $74,999 | 38 (100.0%) | 0 (0.0%) |
| $75,000 to $99,999 | 30 (100.0%) | 0 (0.0%) |
| $100,000 and over | 52 (96.3%) | 2 (3.7%) |
Public vs Private Health Insurance Coverage by Age in Bouton
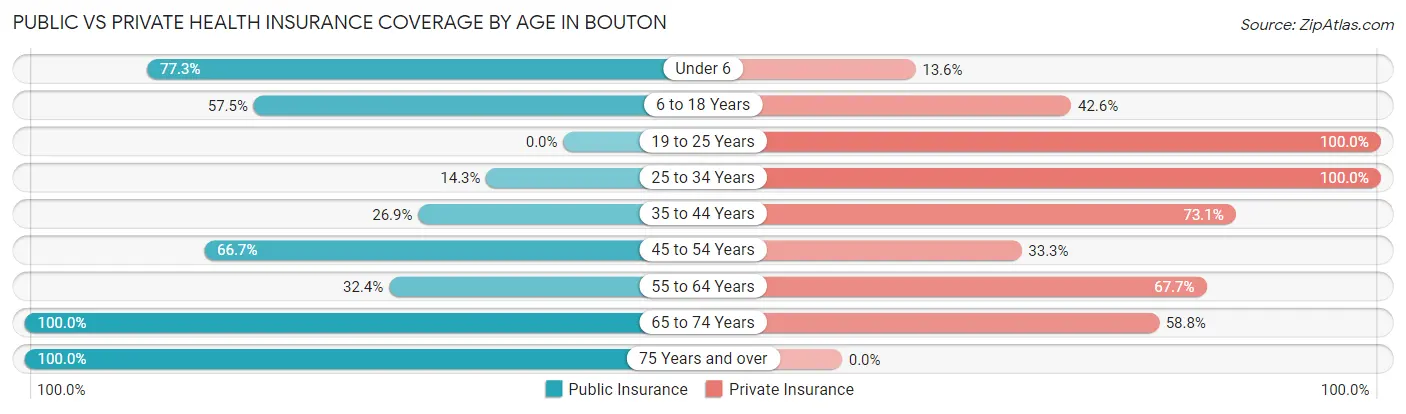
| Age Bracket | Public Insurance | Private Insurance |
| Under 6 | 17 (77.3%) | 3 (13.6%) |
| 6 to 18 Years | 27 (57.5%) | 20 (42.5%) |
| 19 to 25 Years | 0 (0.0%) | 5 (100.0%) |
| 25 to 34 Years | 2 (14.3%) | 14 (100.0%) |
| 35 to 44 Years | 7 (26.9%) | 19 (73.1%) |
| 45 to 54 Years | 2 (66.7%) | 1 (33.3%) |
| 55 to 64 Years | 11 (32.4%) | 23 (67.6%) |
| 65 to 74 Years | 17 (100.0%) | 10 (58.8%) |
| 75 Years and over | 1 (100.0%) | 0 (0.0%) |
| Total | 84 (49.7%) | 95 (56.2%) |
Disability Status by Sex by Age in Bouton
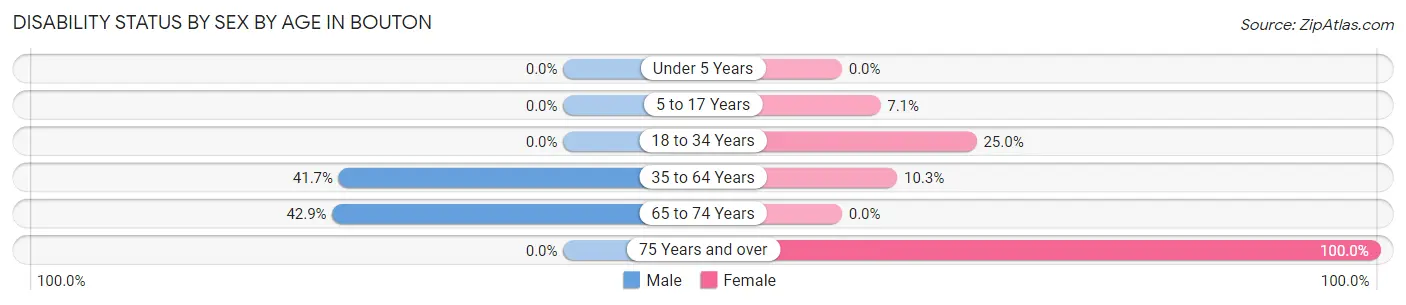
| Age Bracket | Male | Female |
| Under 5 Years | 0 (0.0%) | 0 (0.0%) |
| 5 to 17 Years | 0 (0.0%) | 2 (7.1%) |
| 18 to 34 Years | 0 (0.0%) | 2 (25.0%) |
| 35 to 64 Years | 10 (41.7%) | 4 (10.3%) |
| 65 to 74 Years | 6 (42.9%) | 0 (0.0%) |
| 75 Years and over | 0 (0.0%) | 1 (100.0%) |
Disability Class by Sex by Age in Bouton
Disability Class: Hearing Difficulty
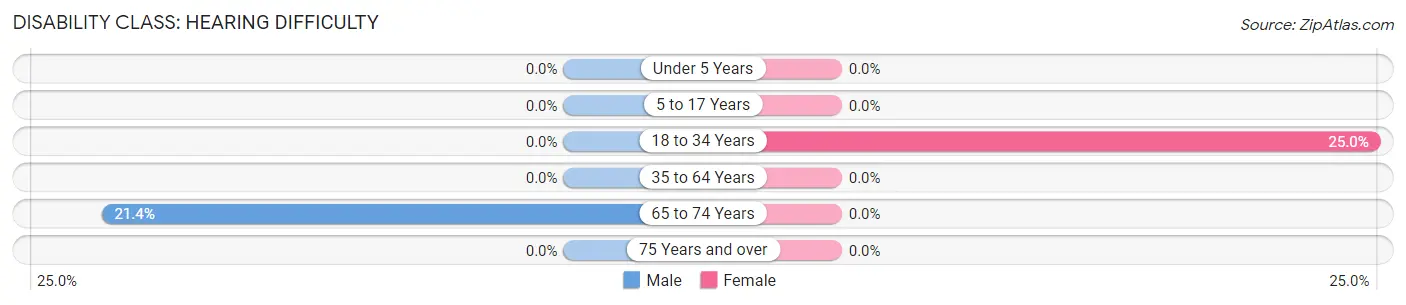
| Age Bracket | Male | Female |
| Under 5 Years | 0 (0.0%) | 0 (0.0%) |
| 5 to 17 Years | 0 (0.0%) | 0 (0.0%) |
| 18 to 34 Years | 0 (0.0%) | 2 (25.0%) |
| 35 to 64 Years | 0 (0.0%) | 0 (0.0%) |
| 65 to 74 Years | 3 (21.4%) | 0 (0.0%) |
| 75 Years and over | 0 (0.0%) | 0 (0.0%) |
Disability Class: Vision Difficulty
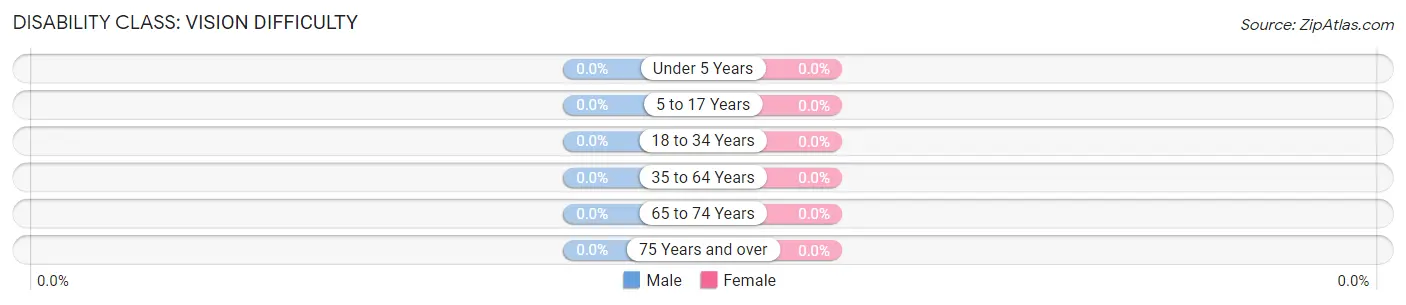
| Age Bracket | Male | Female |
| Under 5 Years | 0 (0.0%) | 0 (0.0%) |
| 5 to 17 Years | 0 (0.0%) | 0 (0.0%) |
| 18 to 34 Years | 0 (0.0%) | 0 (0.0%) |
| 35 to 64 Years | 0 (0.0%) | 0 (0.0%) |
| 65 to 74 Years | 0 (0.0%) | 0 (0.0%) |
| 75 Years and over | 0 (0.0%) | 0 (0.0%) |
Disability Class: Cognitive Difficulty
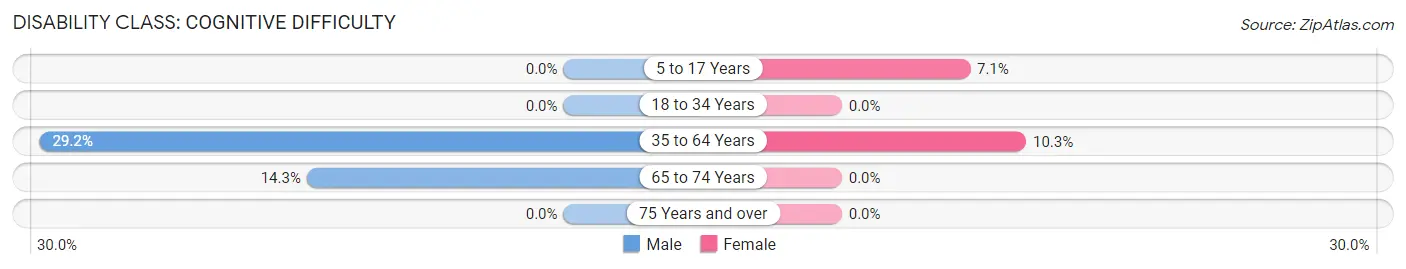
| Age Bracket | Male | Female |
| 5 to 17 Years | 0 (0.0%) | 2 (7.1%) |
| 18 to 34 Years | 0 (0.0%) | 0 (0.0%) |
| 35 to 64 Years | 7 (29.2%) | 4 (10.3%) |
| 65 to 74 Years | 2 (14.3%) | 0 (0.0%) |
| 75 Years and over | 0 (0.0%) | 0 (0.0%) |
Disability Class: Ambulatory Difficulty
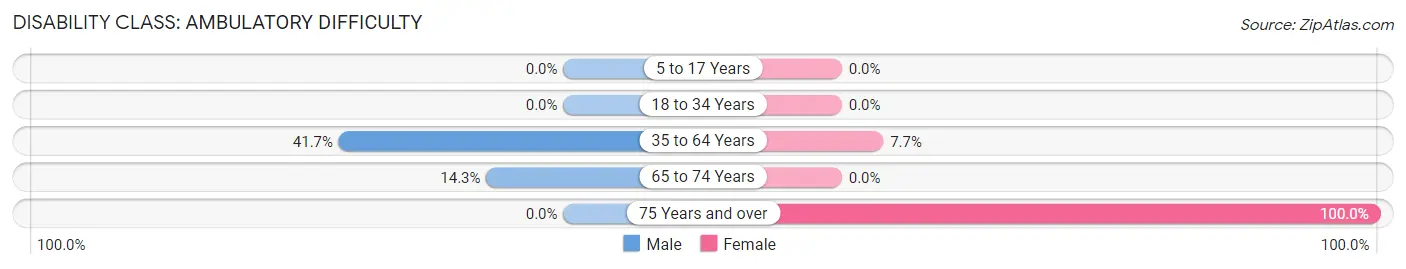
| Age Bracket | Male | Female |
| 5 to 17 Years | 0 (0.0%) | 0 (0.0%) |
| 18 to 34 Years | 0 (0.0%) | 0 (0.0%) |
| 35 to 64 Years | 10 (41.7%) | 3 (7.7%) |
| 65 to 74 Years | 2 (14.3%) | 0 (0.0%) |
| 75 Years and over | 0 (0.0%) | 1 (100.0%) |
Disability Class: Self-Care Difficulty
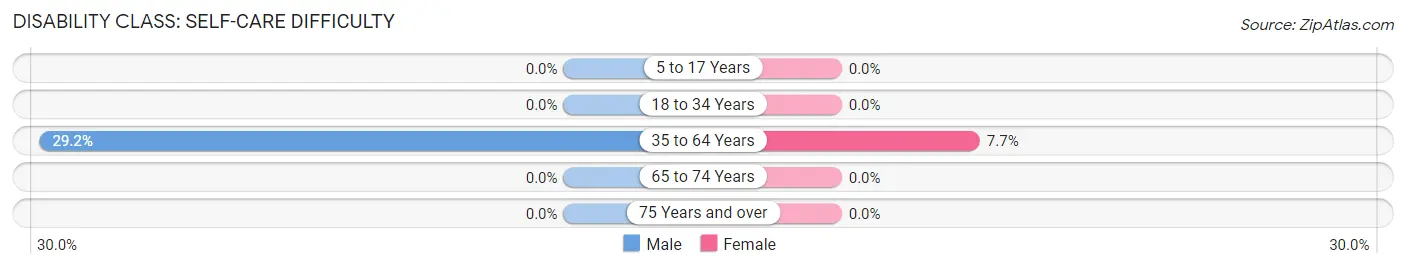
| Age Bracket | Male | Female |
| 5 to 17 Years | 0 (0.0%) | 0 (0.0%) |
| 18 to 34 Years | 0 (0.0%) | 0 (0.0%) |
| 35 to 64 Years | 7 (29.2%) | 3 (7.7%) |
| 65 to 74 Years | 0 (0.0%) | 0 (0.0%) |
| 75 Years and over | 0 (0.0%) | 0 (0.0%) |
Technology Access in Bouton
Computing Device Access in Bouton
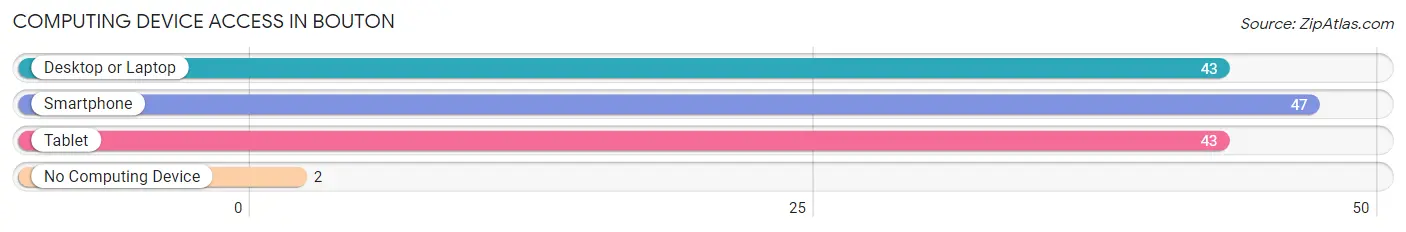
| Device Type | # Households | % Households |
| Desktop or Laptop | 43 | 84.3% |
| Smartphone | 47 | 92.2% |
| Tablet | 43 | 84.3% |
| No Computing Device | 2 | 3.9% |
| Total | 51 | 100.0% |
Internet Access in Bouton
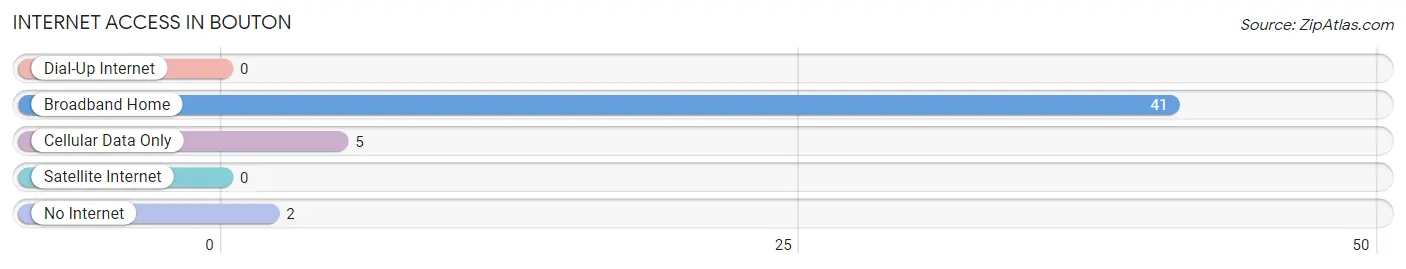
| Internet Type | # Households | % Households |
| Dial-Up Internet | 0 | 0.0% |
| Broadband Home | 41 | 80.4% |
| Cellular Data Only | 5 | 9.8% |
| Satellite Internet | 0 | 0.0% |
| No Internet | 2 | 3.9% |
| Total | 51 | 100.0% |
Bouton Summary
IA is a state located in the Midwestern region of the United States. It is bordered by Minnesota to the north, Wisconsin and Illinois to the east, Missouri to the south, and Nebraska and South Dakota to the west. IA is the 26th most populous state in the US, with a population of 3,155,070 as of 2019.
Geography
IA is located in the Midwestern region of the United States. It is bordered by Minnesota to the north, Wisconsin and Illinois to the east, Missouri to the south, and Nebraska and South Dakota to the west. IA is the 26th most populous state in the US, with a population of 3,155,070 as of 2019. IA is the 30th largest state in the US, with an area of 56,272 square miles. IA is divided into 99 counties, with the largest being Polk County. IA is home to the Des Moines metropolitan area, which is the largest metropolitan area in the state.
History
IA was first explored by French explorers in the late 17th century. IA was part of the Louisiana Purchase in 1803, and became part of the United States. IA was admitted to the Union as the 29th state in 1846. IA was an important part of the Underground Railroad, and was a major destination for African American slaves escaping from the South. IA was also an important part of the American Civil War, and was the site of several battles.
Economy
IA has a diverse economy, with a variety of industries. The state’s largest industries are agriculture, manufacturing, and services. IA is a major producer of corn, soybeans, and hogs. IA is also a major producer of ethanol, and is the largest producer of ethanol in the US. IA is home to several major companies, including John Deere, Rockwell Collins, and Principal Financial Group. IA is also home to several major universities, including the University of Iowa, Iowa State University, and Drake University.
Demographics
IA is a diverse state, with a population of 3,155,070 as of 2019. IA is the 26th most populous state in the US. IA is home to a variety of ethnic and racial groups, including White (86.2%), Hispanic or Latino (5.3%), Black or African American (3.7%), Asian (2.7%), and Native American (0.7%). IA is also home to a variety of religious groups, including Protestant (50.2%), Catholic (25.2%), and Other (24.6%). IA is also home to a variety of languages, including English (90.2%), Spanish (3.7%), and Other (6.1%).
Common Questions
What is Per Capita Income in Bouton?
Per Capita income in Bouton is $38,718.
What is the Median Family Income in Bouton?
Median Family Income in Bouton is $77,500.
What is the Median Household income in Bouton?
Median Household Income in Bouton is $75,313.
What is Income or Wage Gap in Bouton?
Income or Wage Gap in Bouton is 11.1%.
Women in Bouton earn 88.9 cents for every dollar earned by a man.
What is Inequality or Gini Index in Bouton?
Inequality or Gini Index in Bouton is 0.57.
What is the Total Population of Bouton?
Total Population of Bouton is 169.
What is the Total Male Population of Bouton?
Total Male Population of Bouton is 77.
What is the Total Female Population of Bouton?
Total Female Population of Bouton is 92.
What is the Ratio of Males per 100 Females in Bouton?
There are 83.70 Males per 100 Females in Bouton.
What is the Ratio of Females per 100 Males in Bouton?
There are 119.48 Females per 100 Males in Bouton.
What is the Median Population Age in Bouton?
Median Population Age in Bouton is 32.9 Years.
What is the Average Family Size in Bouton
Average Family Size in Bouton is 3.7 People.
What is the Average Household Size in Bouton
Average Household Size in Bouton is 3.3 People.
How Large is the Labor Force in Bouton?
There are 70 People in the Labor Forcein in Bouton.
What is the Percentage of People in the Labor Force in Bouton?
63.1% of People are in the Labor Force in Bouton.