Blanchard, IA Map & Demographics
Blanchard Map
Blanchard Overview
$33,865
PER CAPITA INCOME
$43,750
AVG FAMILY INCOME
$43,750
AVG HOUSEHOLD INCOME
0.12
INEQUALITY / GINI INDEX
34
TOTAL POPULATION
26
MALE POPULATION
8
FEMALE POPULATION
325.00
MALES / 100 FEMALES
30.77
FEMALES / 100 MALES
48.9
MEDIAN AGE
3.8
AVG FAMILY SIZE
3.8
AVG HOUSEHOLD SIZE
9
LABOR FORCE [ PEOPLE ]
27.3%
PERCENT IN LABOR FORCE
Blanchard Zip Codes
Blanchard Area Codes
Income in Blanchard
Income Overview in Blanchard
Per Capita Income in Blanchard is $33,865, while median incomes of families and households are $43,750 and $43,750 respectively.
| Characteristic | Number | Measure |
| Per Capita Income | 34 | $33,865 |
| Median Family Income | 9 | $43,750 |
| Mean Family Income | 9 | $50,078 |
| Median Household Income | 9 | $43,750 |
| Mean Household Income | 9 | $50,078 |
| Income Deficit | 9 | $0 |
| Wage / Income Gap (%) | 34 | 0.00% |
| Wage / Income Gap ($) | 34 | 100.00¢ per $1 |
| Gini / Inequality Index | 34 | 0.12 |
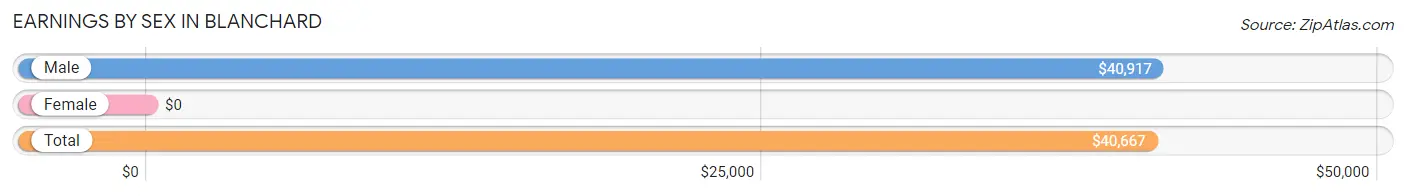
Earnings by Sex in Blanchard
| Sex | Number | Average Earnings |
| Male | 21 (87.5%) | $40,917 |
| Female | 3 (12.5%) | $0 |
| Total | 24 (100.0%) | $40,667 |
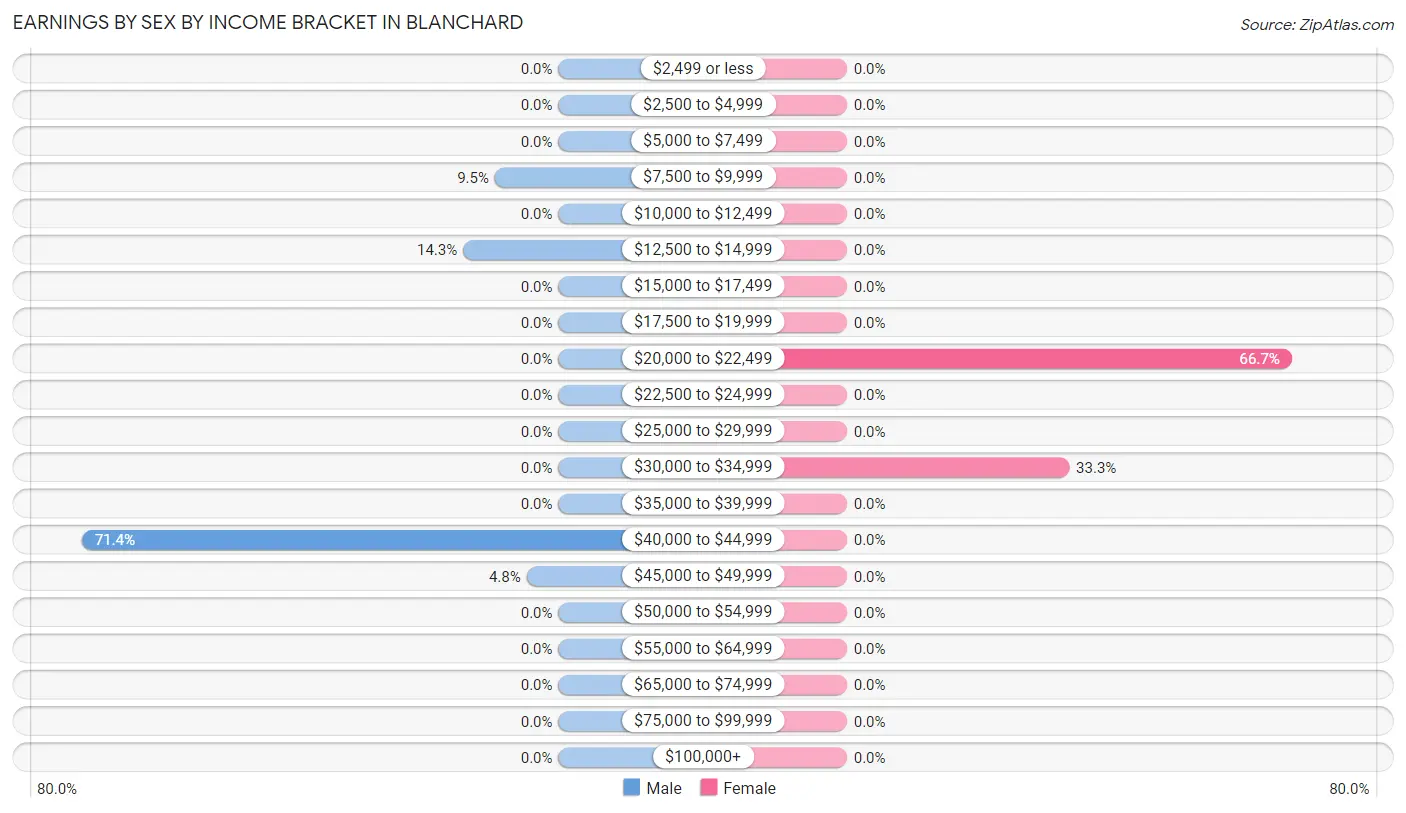
Earnings by Sex by Income Bracket in Blanchard
The most common earnings brackets in Blanchard are $40,000 to $44,999 for men (15 | 71.4%) and $20,000 to $22,499 for women (2 | 66.7%).
| Income | Male | Female |
| $2,499 or less | 0 (0.0%) | 0 (0.0%) |
| $2,500 to $4,999 | 0 (0.0%) | 0 (0.0%) |
| $5,000 to $7,499 | 0 (0.0%) | 0 (0.0%) |
| $7,500 to $9,999 | 2 (9.5%) | 0 (0.0%) |
| $10,000 to $12,499 | 0 (0.0%) | 0 (0.0%) |
| $12,500 to $14,999 | 3 (14.3%) | 0 (0.0%) |
| $15,000 to $17,499 | 0 (0.0%) | 0 (0.0%) |
| $17,500 to $19,999 | 0 (0.0%) | 0 (0.0%) |
| $20,000 to $22,499 | 0 (0.0%) | 2 (66.7%) |
| $22,500 to $24,999 | 0 (0.0%) | 0 (0.0%) |
| $25,000 to $29,999 | 0 (0.0%) | 0 (0.0%) |
| $30,000 to $34,999 | 0 (0.0%) | 1 (33.3%) |
| $35,000 to $39,999 | 0 (0.0%) | 0 (0.0%) |
| $40,000 to $44,999 | 15 (71.4%) | 0 (0.0%) |
| $45,000 to $49,999 | 1 (4.8%) | 0 (0.0%) |
| $50,000 to $54,999 | 0 (0.0%) | 0 (0.0%) |
| $55,000 to $64,999 | 0 (0.0%) | 0 (0.0%) |
| $65,000 to $74,999 | 0 (0.0%) | 0 (0.0%) |
| $75,000 to $99,999 | 0 (0.0%) | 0 (0.0%) |
| $100,000+ | 0 (0.0%) | 0 (0.0%) |
| Total | 21 (100.0%) | 3 (100.0%) |
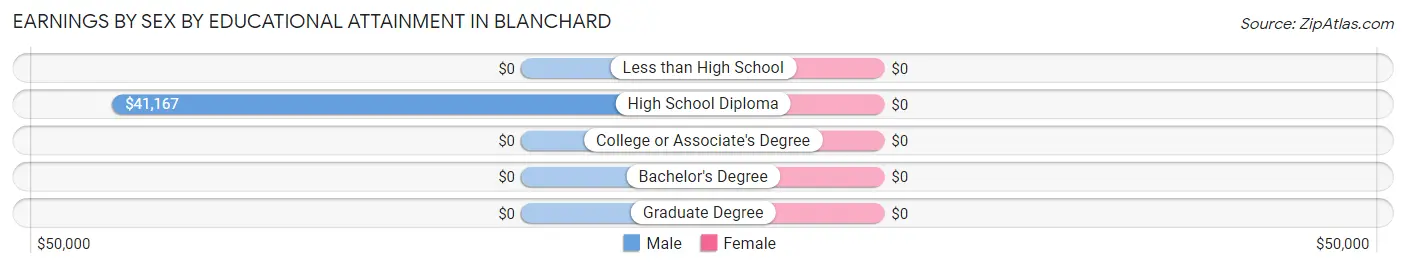
Earnings by Sex by Educational Attainment in Blanchard
| Educational Attainment | Male Income | Female Income |
| Less than High School | - | - |
| High School Diploma | $41,167 | $0 |
| College or Associate's Degree | - | - |
| Bachelor's Degree | - | - |
| Graduate Degree | - | - |
| Total | $40,917 | $0 |
Family Income in Blanchard
Family Income Brackets in Blanchard
According to the Blanchard family income data, there are 6 families falling into the $35,000 to $49,999 income range, which is the most common income bracket and makes up 66.7% of all families.
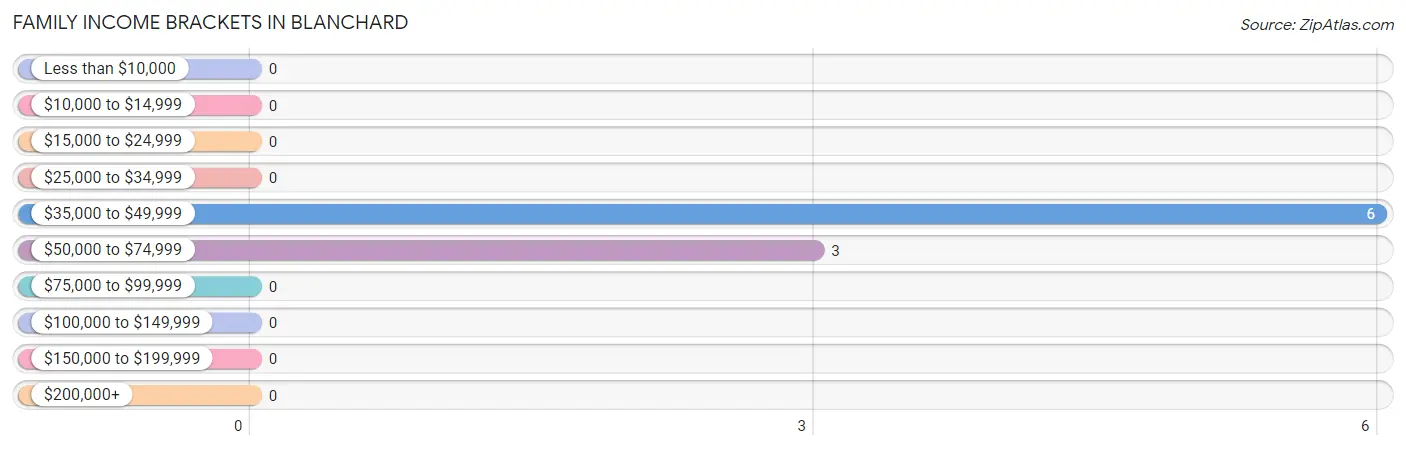
| Income Bracket | # Families | % Families |
| Less than $10,000 | 0 | 0.0% |
| $10,000 to $14,999 | 0 | 0.0% |
| $15,000 to $24,999 | 0 | 0.0% |
| $25,000 to $34,999 | 0 | 0.0% |
| $35,000 to $49,999 | 6 | 66.7% |
| $50,000 to $74,999 | 3 | 33.3% |
| $75,000 to $99,999 | 0 | 0.0% |
| $100,000 to $149,999 | 0 | 0.0% |
| $150,000 to $199,999 | 0 | 0.0% |
| $200,000+ | 0 | 0.0% |
Family Income by Famaliy Size in Blanchard
2-person families (8 | 88.9%) account for the highest median family income in Blanchard with $45,000 per family, while 2-person families (8 | 88.9%) have the highest median income of $22,500 per family member.
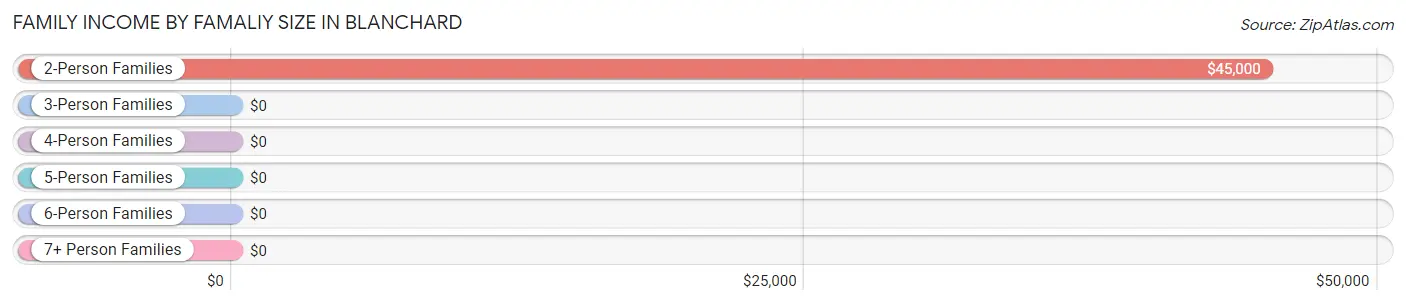
| Income Bracket | # Families | Median Income |
| 2-Person Families | 8 (88.9%) | $45,000 |
| 3-Person Families | 0 (0.0%) | $0 |
| 4-Person Families | 1 (11.1%) | $0 |
| 5-Person Families | 0 (0.0%) | $0 |
| 6-Person Families | 0 (0.0%) | $0 |
| 7+ Person Families | 0 (0.0%) | $0 |
| Total | 9 (100.0%) | $43,750 |
Family Income by Number of Earners in Blanchard
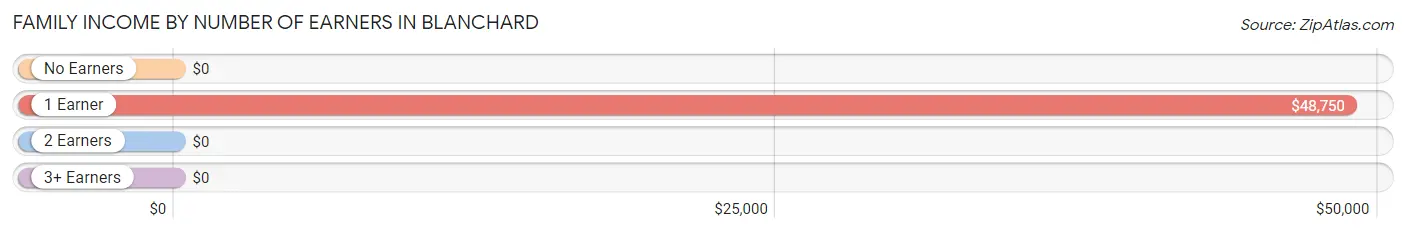
| Number of Earners | # Families | Median Income |
| No Earners | 1 (11.1%) | $0 |
| 1 Earner | 7 (77.8%) | $48,750 |
| 2 Earners | 1 (11.1%) | $0 |
| 3+ Earners | 0 (0.0%) | $0 |
| Total | 9 (100.0%) | $43,750 |
Household Income in Blanchard
Household Income Brackets in Blanchard
With 6 households falling in the category, the $35,000 to $49,999 income range is the most frequent in Blanchard, accounting for 66.7% of all households.
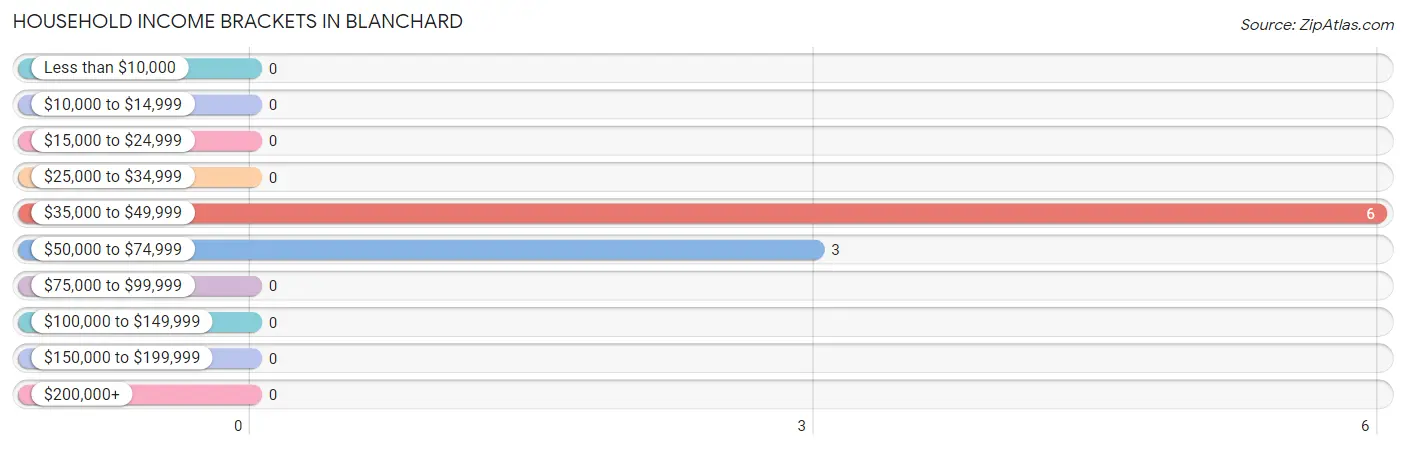
| Income Bracket | # Households | % Households |
| Less than $10,000 | 0 | 0.0% |
| $10,000 to $14,999 | 0 | 0.0% |
| $15,000 to $24,999 | 0 | 0.0% |
| $25,000 to $34,999 | 0 | 0.0% |
| $35,000 to $49,999 | 6 | 66.7% |
| $50,000 to $74,999 | 3 | 33.3% |
| $75,000 to $99,999 | 0 | 0.0% |
| $100,000 to $149,999 | 0 | 0.0% |
| $150,000 to $199,999 | 0 | 0.0% |
| $200,000+ | 0 | 0.0% |
Household Income by Householder Age in Blanchard
The median household income in Blanchard is $43,750, with the highest median household income of $65,833 found in the 65+ years age bracket for the primary householder. A total of 4 households (44.4%) fall into this category.
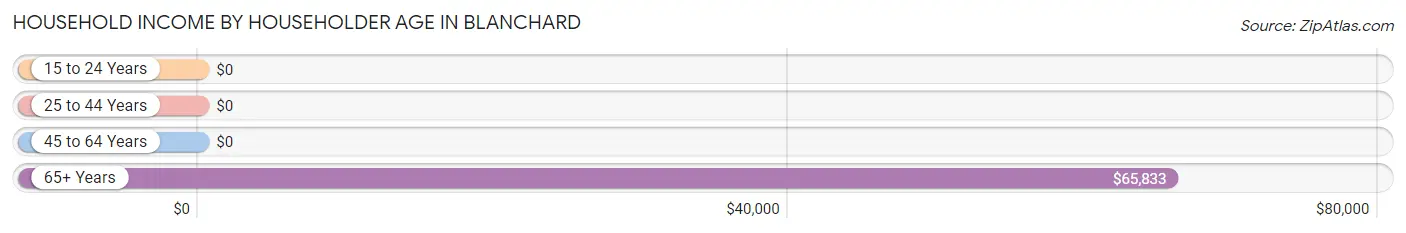
| Income Bracket | # Households | Median Income |
| 15 to 24 Years | 0 (0.0%) | $0 |
| 25 to 44 Years | 1 (11.1%) | $0 |
| 45 to 64 Years | 4 (44.4%) | $0 |
| 65+ Years | 4 (44.4%) | $65,833 |
| Total | 9 (100.0%) | $43,750 |
Poverty in Blanchard
Income Below Poverty by Sex and Age in Blanchard
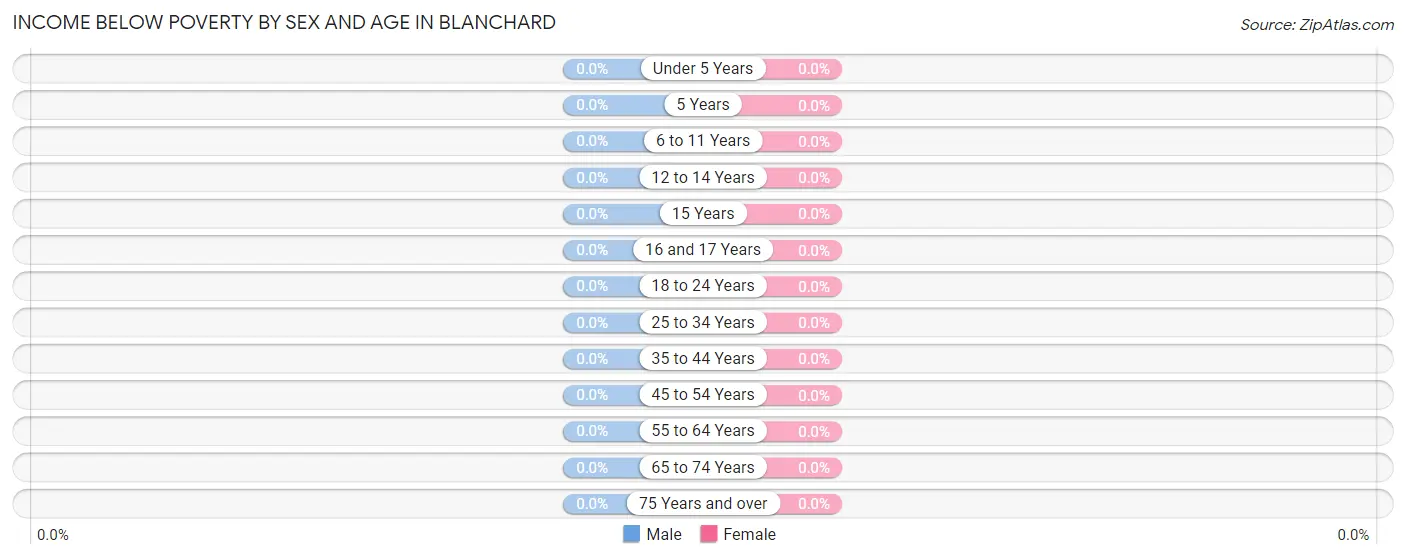
| Age Bracket | Male | Female |
| Under 5 Years | 0 (0.0%) | 0 (0.0%) |
| 5 Years | 0 (0.0%) | 0 (0.0%) |
| 6 to 11 Years | 0 (0.0%) | 0 (0.0%) |
| 12 to 14 Years | 0 (0.0%) | 0 (0.0%) |
| 15 Years | 0 (0.0%) | 0 (0.0%) |
| 16 and 17 Years | 0 (0.0%) | 0 (0.0%) |
| 18 to 24 Years | 0 (0.0%) | 0 (0.0%) |
| 25 to 34 Years | 0 (0.0%) | 0 (0.0%) |
| 35 to 44 Years | 0 (0.0%) | 0 (0.0%) |
| 45 to 54 Years | 0 (0.0%) | 0 (0.0%) |
| 55 to 64 Years | 0 (0.0%) | 0 (0.0%) |
| 65 to 74 Years | 0 (0.0%) | 0 (0.0%) |
| 75 Years and over | 0 (0.0%) | 0 (0.0%) |
| Total | 0 (0.0%) | 0 (0.0%) |
Income Above Poverty by Sex and Age in Blanchard
According to the poverty statistics in Blanchard, males aged 6 to 11 years and females aged 35 to 44 years are the age groups that are most secure financially, with 100.0% of males and 100.0% of females in these age groups living above the poverty line.
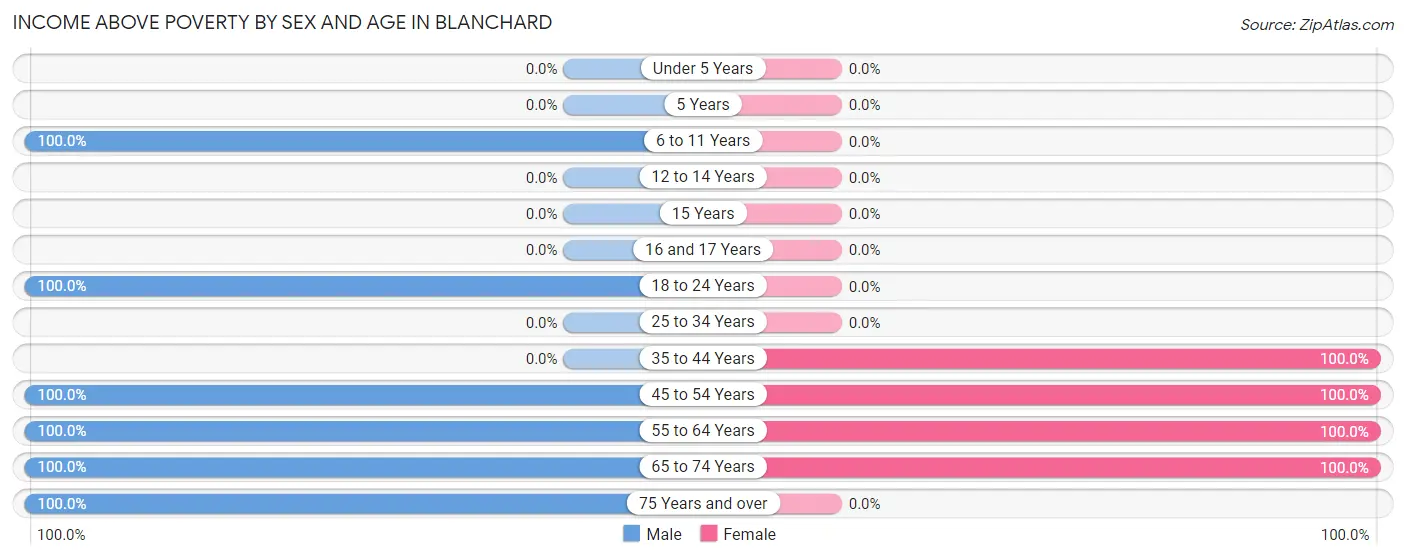
| Age Bracket | Male | Female |
| Under 5 Years | 0 (0.0%) | 0 (0.0%) |
| 5 Years | 0 (0.0%) | 0 (0.0%) |
| 6 to 11 Years | 1 (100.0%) | 0 (0.0%) |
| 12 to 14 Years | 0 (0.0%) | 0 (0.0%) |
| 15 Years | 0 (0.0%) | 0 (0.0%) |
| 16 and 17 Years | 0 (0.0%) | 0 (0.0%) |
| 18 to 24 Years | 1 (100.0%) | 0 (0.0%) |
| 25 to 34 Years | 0 (0.0%) | 0 (0.0%) |
| 35 to 44 Years | 0 (0.0%) | 1 (100.0%) |
| 45 to 54 Years | 20 (100.0%) | 2 (100.0%) |
| 55 to 64 Years | 1 (100.0%) | 1 (100.0%) |
| 65 to 74 Years | 1 (100.0%) | 4 (100.0%) |
| 75 Years and over | 2 (100.0%) | 0 (0.0%) |
| Total | 26 (100.0%) | 8 (100.0%) |
Income Below Poverty Among Married-Couple Families in Blanchard
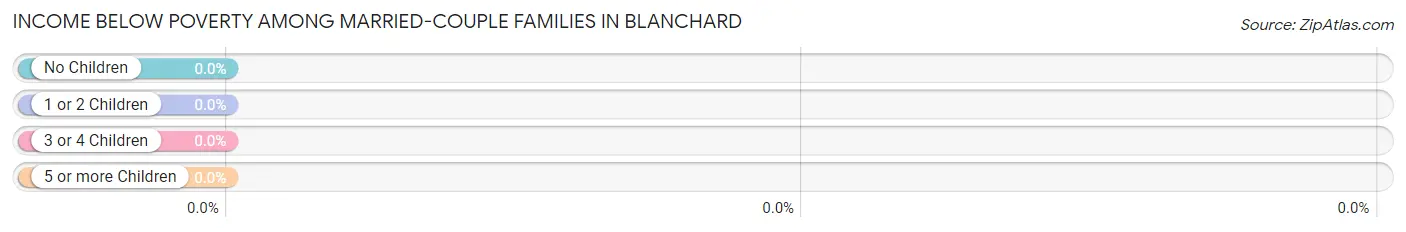
| Children | Above Poverty | Below Poverty |
| No Children | 7 (100.0%) | 0 (0.0%) |
| 1 or 2 Children | 1 (100.0%) | 0 (0.0%) |
| 3 or 4 Children | 0 (0.0%) | 0 (0.0%) |
| 5 or more Children | 0 (0.0%) | 0 (0.0%) |
| Total | 8 (100.0%) | 0 (0.0%) |
Income Below Poverty Among Single-Parent Households in Blanchard
| Children | Single Father | Single Mother |
| No Children | 0 (0.0%) | 0 (0.0%) |
| 1 or 2 Children | 0 (0.0%) | 0 (0.0%) |
| 3 or 4 Children | 0 (0.0%) | 0 (0.0%) |
| 5 or more Children | 0 (0.0%) | 0 (0.0%) |
| Total | 0 (0.0%) | 0 (0.0%) |
Income Below Poverty Among Married-Couple vs Single-Parent Households in Blanchard
| Children | Married-Couple Families | Single-Parent Households |
| No Children | 0 (0.0%) | 0 (0.0%) |
| 1 or 2 Children | 0 (0.0%) | 0 (0.0%) |
| 3 or 4 Children | 0 (0.0%) | 0 (0.0%) |
| 5 or more Children | 0 (0.0%) | 0 (0.0%) |
| Total | 0 (0.0%) | 0 (0.0%) |
Race in Blanchard
The most populous races in Blanchard are , and White / Caucasian (34 | 100.0%).
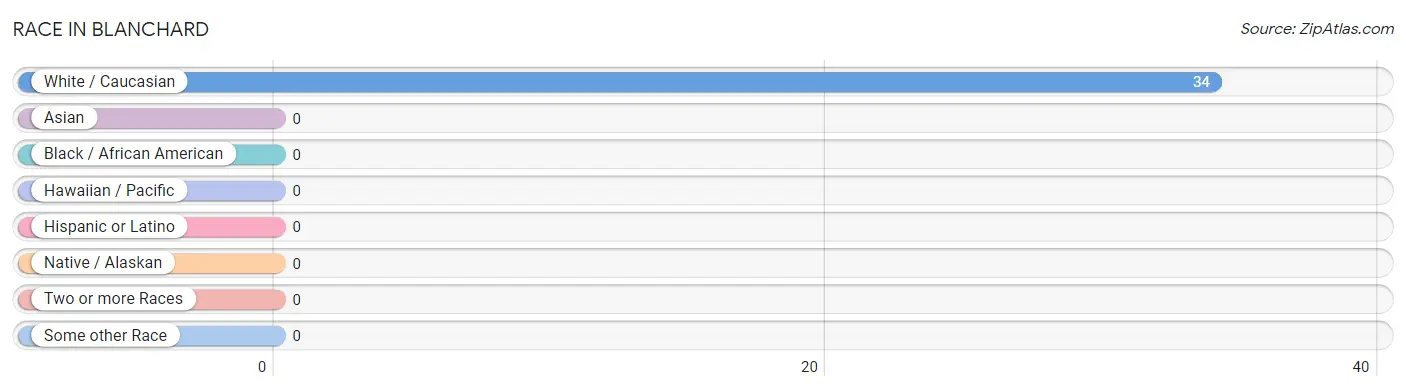
| Race | # Population | % Population |
| Asian | 0 | 0.0% |
| Black / African American | 0 | 0.0% |
| Hawaiian / Pacific | 0 | 0.0% |
| Hispanic or Latino | 0 | 0.0% |
| Native / Alaskan | 0 | 0.0% |
| White / Caucasian | 34 | 100.0% |
| Two or more Races | 0 | 0.0% |
| Some other Race | 0 | 0.0% |
| Total | 34 | 100.0% |
Ancestry in Blanchard
The most populous ancestries reported in Blanchard are American (5 | 14.7%), European (5 | 14.7%), German (2 | 5.9%), Danish (1 | 2.9%), and Irish (1 | 2.9%), together accounting for 41.2% of all Blanchard residents.
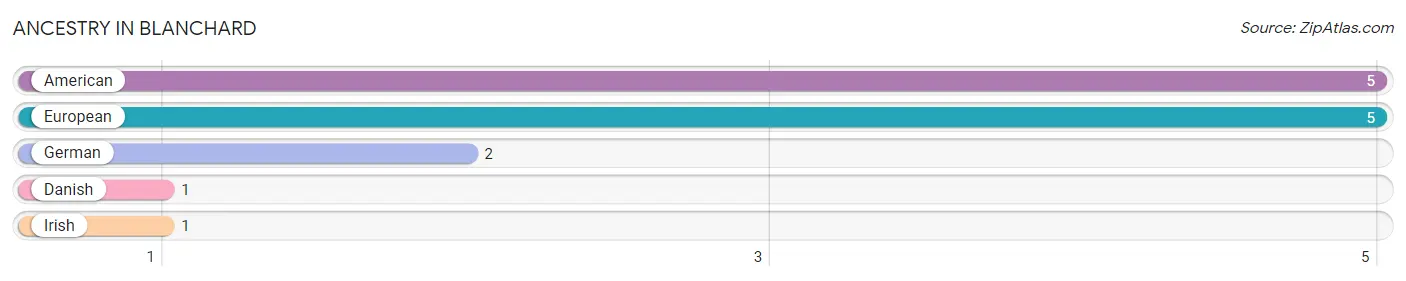
| Ancestry | # Population | % Population |
| American | 5 | 14.7% |
| Danish | 1 | 2.9% |
| European | 5 | 14.7% |
| German | 2 | 5.9% |
| Irish | 1 | 2.9% | View All 5 Rows |
Immigrants in Blanchard

| Immigration Origin | # Population | % Population | View All 0 Rows |
Sex and Age in Blanchard
Sex and Age in Blanchard
The most populous age groups in Blanchard are 45 to 49 Years (15 | 57.7%) for men and 45 to 49 Years (2 | 25.0%) for women.
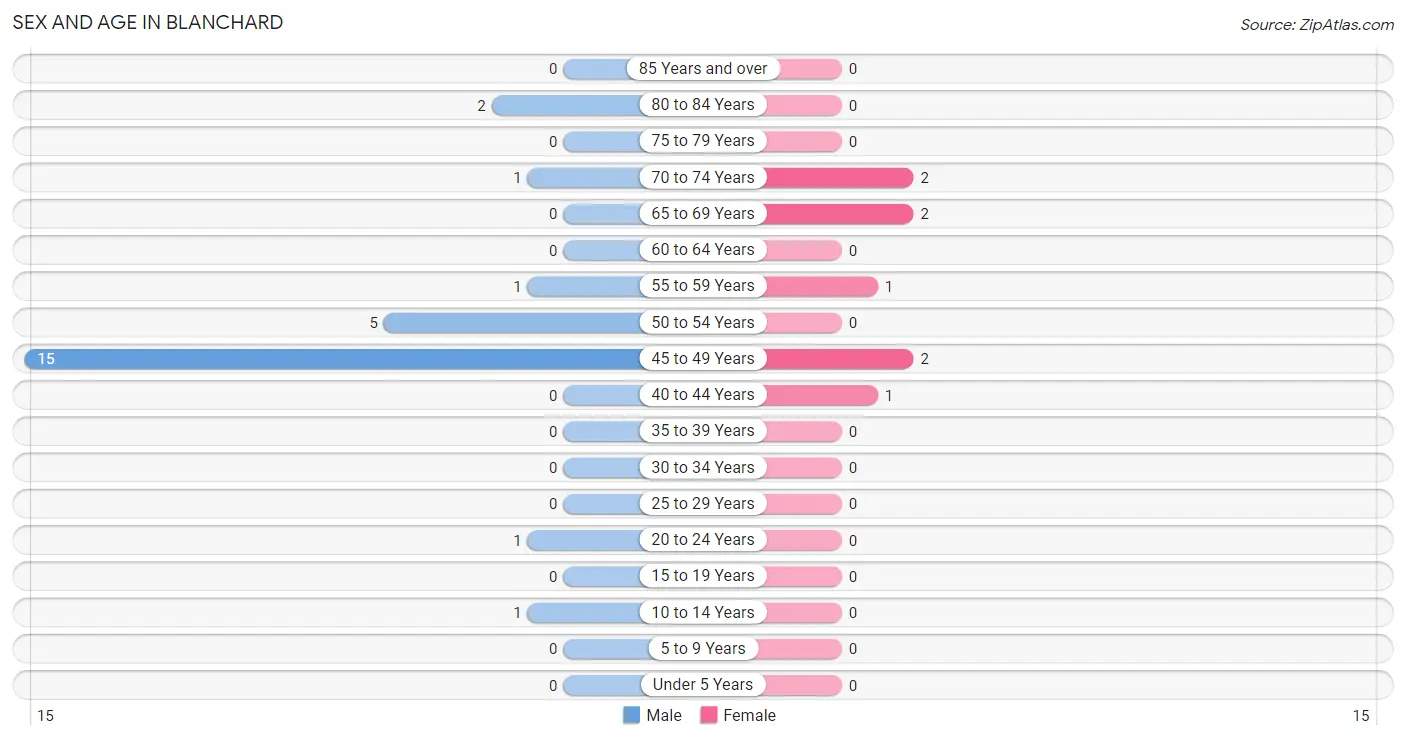
| Age Bracket | Male | Female |
| Under 5 Years | 0 (0.0%) | 0 (0.0%) |
| 5 to 9 Years | 0 (0.0%) | 0 (0.0%) |
| 10 to 14 Years | 1 (3.8%) | 0 (0.0%) |
| 15 to 19 Years | 0 (0.0%) | 0 (0.0%) |
| 20 to 24 Years | 1 (3.8%) | 0 (0.0%) |
| 25 to 29 Years | 0 (0.0%) | 0 (0.0%) |
| 30 to 34 Years | 0 (0.0%) | 0 (0.0%) |
| 35 to 39 Years | 0 (0.0%) | 0 (0.0%) |
| 40 to 44 Years | 0 (0.0%) | 1 (12.5%) |
| 45 to 49 Years | 15 (57.7%) | 2 (25.0%) |
| 50 to 54 Years | 5 (19.2%) | 0 (0.0%) |
| 55 to 59 Years | 1 (3.8%) | 1 (12.5%) |
| 60 to 64 Years | 0 (0.0%) | 0 (0.0%) |
| 65 to 69 Years | 0 (0.0%) | 2 (25.0%) |
| 70 to 74 Years | 1 (3.8%) | 2 (25.0%) |
| 75 to 79 Years | 0 (0.0%) | 0 (0.0%) |
| 80 to 84 Years | 2 (7.7%) | 0 (0.0%) |
| 85 Years and over | 0 (0.0%) | 0 (0.0%) |
| Total | 26 (100.0%) | 8 (100.0%) |
Families and Households in Blanchard
Median Family Size in Blanchard
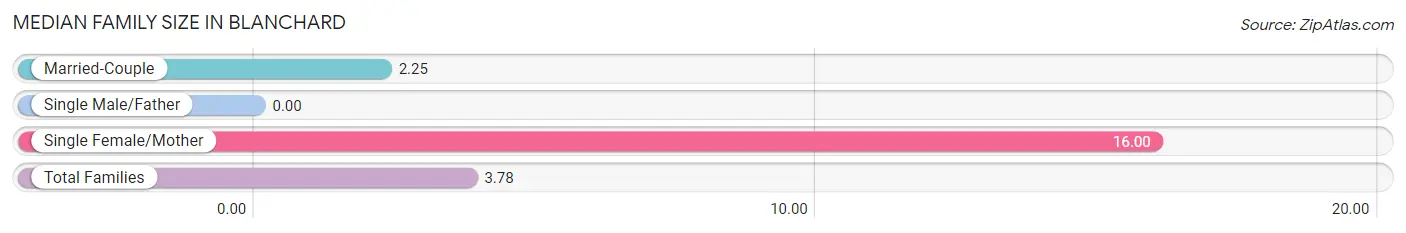
| Family Type | # Families | Family Size |
| Married-Couple | 8 (88.9%) | 2.25 |
| Single Male/Father | 0 (0.0%) | - |
| Single Female/Mother | 1 (11.1%) | 16.00 |
| Total Families | 9 (100.0%) | 3.78 |
Median Household Size in Blanchard
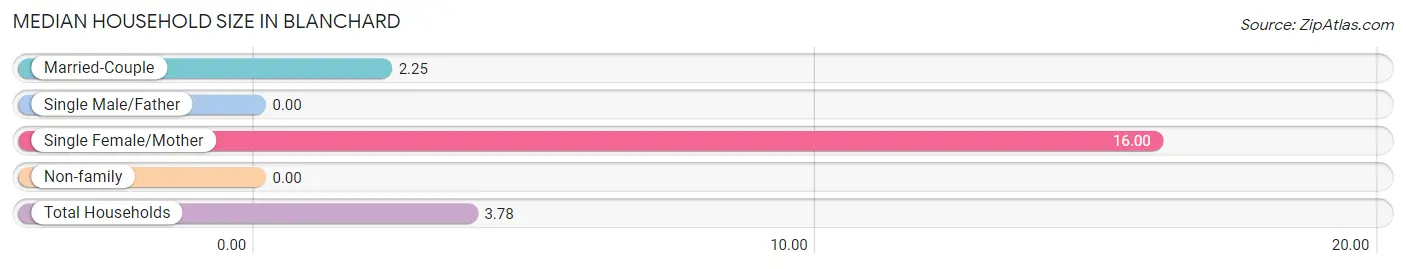
| Household Type | # Households | Household Size |
| Married-Couple | 8 (88.9%) | 2.25 |
| Single Male/Father | 0 (0.0%) | - |
| Single Female/Mother | 1 (11.1%) | 16.00 |
| Non-family | 0 (0.0%) | - |
| Total Households | 9 (100.0%) | 3.78 |
Household Size by Marriage Status in Blanchard
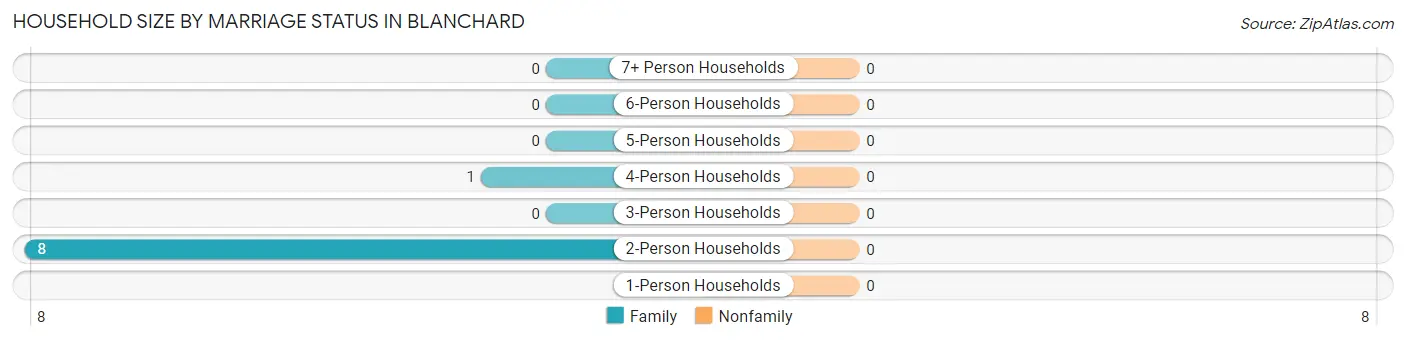
| Household Size | Family Households | Nonfamily Households |
| 1-Person Households | - | 0 (0.0%) |
| 2-Person Households | 8 (88.9%) | 0 (0.0%) |
| 3-Person Households | 0 (0.0%) | 0 (0.0%) |
| 4-Person Households | 1 (11.1%) | 0 (0.0%) |
| 5-Person Households | 0 (0.0%) | 0 (0.0%) |
| 6-Person Households | 0 (0.0%) | 0 (0.0%) |
| 7+ Person Households | 0 (0.0%) | 0 (0.0%) |
| Total | 9 (100.0%) | 0 (0.0%) |
Female Fertility in Blanchard
Fertility by Age in Blanchard
| Age Bracket | Women with Births | Births / 1,000 Women |
| 15 to 19 years | 0 (0.0%) | 0.0 |
| 20 to 34 years | 0 (0.0%) | 0.0 |
| 35 to 50 years | 0 (0.0%) | 0.0 |
| Total | 0 (0.0%) | 0.0 |
Fertility by Age by Marriage Status in Blanchard
| Age Bracket | Married | Unmarried |
| 15 to 19 years | 0 (0.0%) | 0 (0.0%) |
| 20 to 34 years | 0 (0.0%) | 0 (0.0%) |
| 35 to 50 years | 0 (0.0%) | 0 (0.0%) |
| Total | 0 (0.0%) | 0 (0.0%) |
Fertility by Education in Blanchard
| Educational Attainment | Women with Births | Births / 1,000 Women |
| Less than High School | 0 (0.0%) | 0.0 |
| High School Diploma | 0 (0.0%) | 0.0 |
| College or Associate's Degree | 0 (0.0%) | 0.0 |
| Bachelor's Degree | 0 (0.0%) | 0.0 |
| Graduate Degree | 0 (0.0%) | 0.0 |
| Total | 0 (0.0%) | 0.0 |
Fertility by Education by Marriage Status in Blanchard
| Educational Attainment | Married | Unmarried |
| Less than High School | 0 (0.0%) | 0 (0.0%) |
| High School Diploma | 0 (0.0%) | 0 (0.0%) |
| College or Associate's Degree | 0 (0.0%) | 0 (0.0%) |
| Bachelor's Degree | 0 (0.0%) | 0 (0.0%) |
| Graduate Degree | 0 (0.0%) | 0 (0.0%) |
| Total | 0 (0.0%) | 0 (0.0%) |
Employment Characteristics in Blanchard
Employment by Class of Employer in Blanchard
Among the 9 employed individuals in Blanchard, private company employees (3 | 33.3%), self-employed (not incorporated) (3 | 33.3%), and self-employed (incorporated) (2 | 22.2%) make up the most common classes of employment.
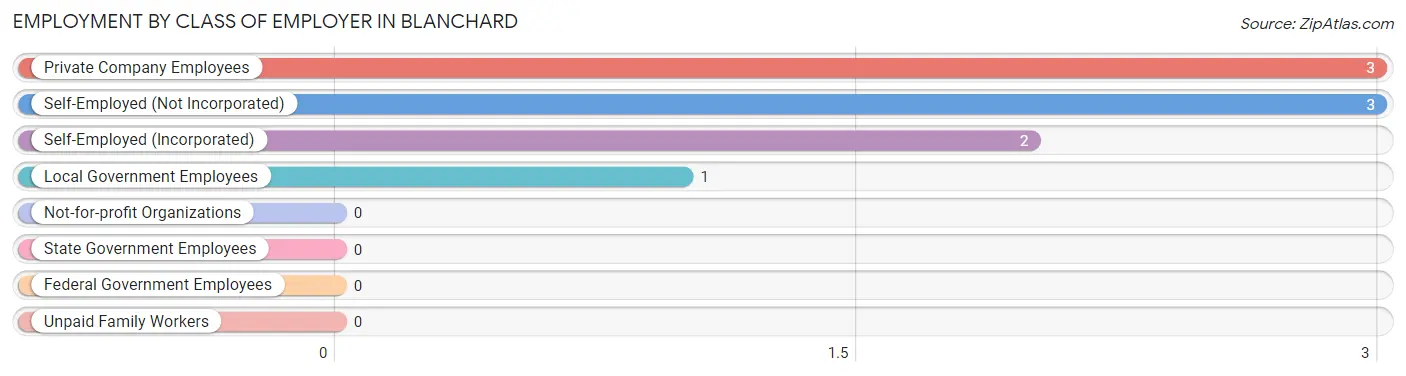
| Employer Class | # Employees | % Employees |
| Private Company Employees | 3 | 33.3% |
| Self-Employed (Incorporated) | 2 | 22.2% |
| Self-Employed (Not Incorporated) | 3 | 33.3% |
| Not-for-profit Organizations | 0 | 0.0% |
| Local Government Employees | 1 | 11.1% |
| State Government Employees | 0 | 0.0% |
| Federal Government Employees | 0 | 0.0% |
| Unpaid Family Workers | 0 | 0.0% |
| Total | 9 | 100.0% |
Employment Status by Age in Blanchard
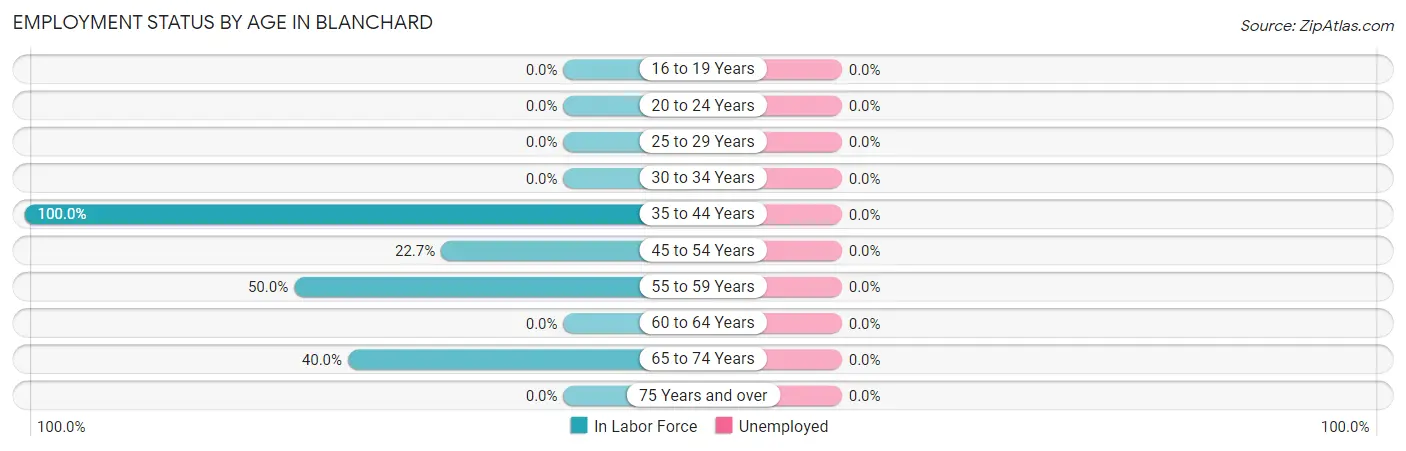
| Age Bracket | In Labor Force | Unemployed |
| 16 to 19 Years | 0 (0.0%) | 0 (0.0%) |
| 20 to 24 Years | 0 (0.0%) | 0 (0.0%) |
| 25 to 29 Years | 0 (0.0%) | 0 (0.0%) |
| 30 to 34 Years | 0 (0.0%) | 0 (0.0%) |
| 35 to 44 Years | 1 (100.0%) | 0 (0.0%) |
| 45 to 54 Years | 5 (22.7%) | 0 (0.0%) |
| 55 to 59 Years | 1 (50.0%) | 0 (0.0%) |
| 60 to 64 Years | 0 (0.0%) | 0 (0.0%) |
| 65 to 74 Years | 2 (40.0%) | 0 (0.0%) |
| 75 Years and over | 0 (0.0%) | 0 (0.0%) |
| Total | 9 (27.3%) | 0 (0.0%) |
Employment Status by Educational Attainment in Blanchard
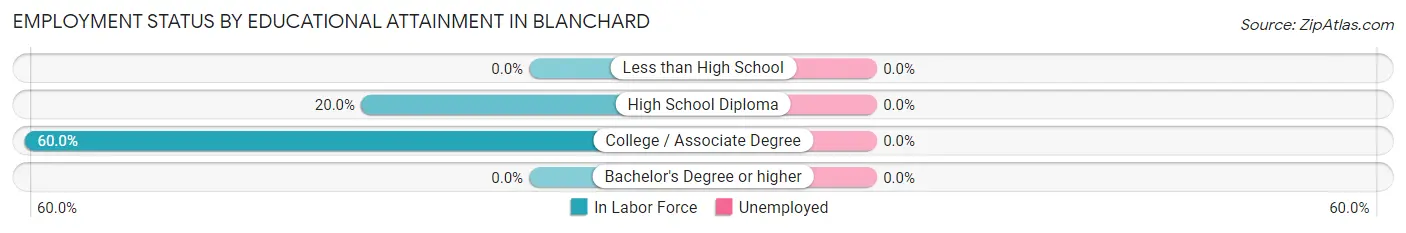
| Educational Attainment | In Labor Force | Unemployed |
| Less than High School | 0 (0.0%) | 0 (0.0%) |
| High School Diploma | 4 (20.0%) | 0 (0.0%) |
| College / Associate Degree | 3 (60.0%) | 0 (0.0%) |
| Bachelor's Degree or higher | 0 (0.0%) | 0 (0.0%) |
| Total | 7 (28.0%) | 0 (0.0%) |
Employment Occupations by Sex in Blanchard
Management, Business, Science and Arts Occupations
The most common Management, Business, Science and Arts occupations in Blanchard are Management (3 | 33.3%), and Business & Financial (2 | 22.2%).
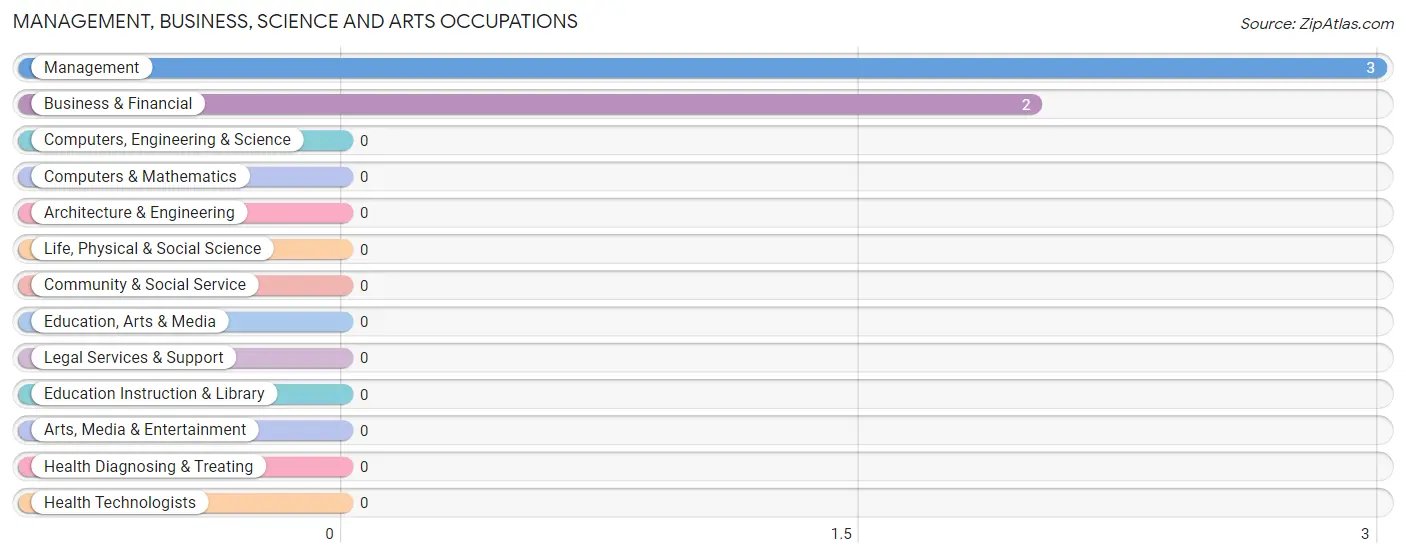
Management, Business, Science and Arts Occupations by Sex
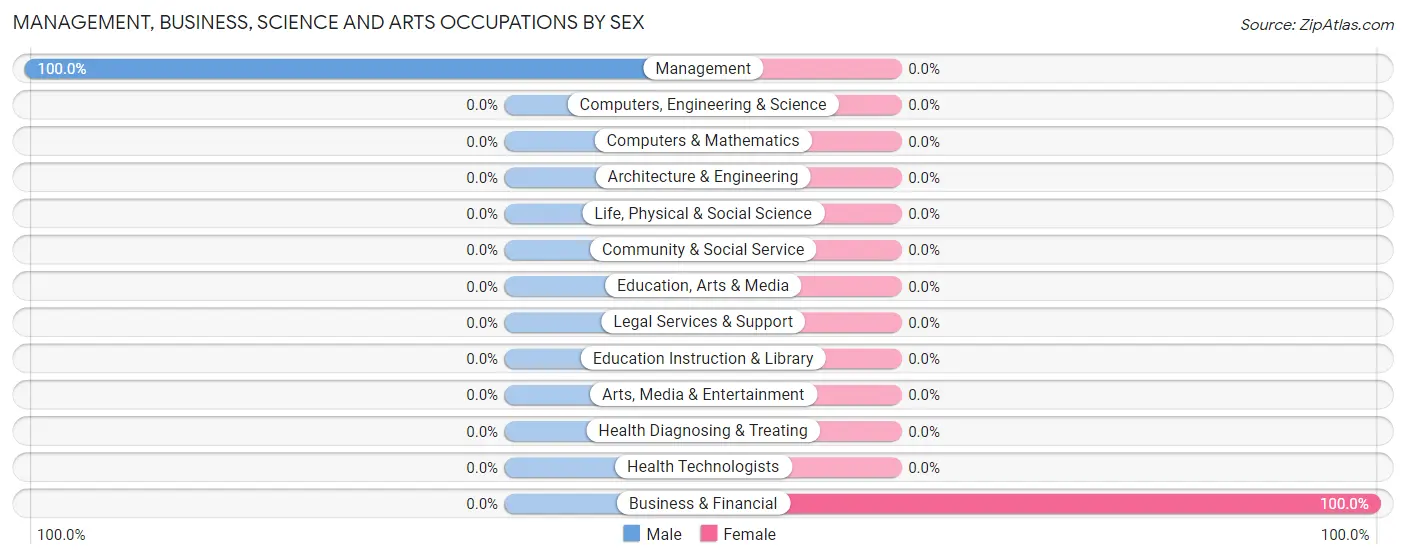
| Occupation | Male | Female |
| Management | 3 (100.0%) | 0 (0.0%) |
| Business & Financial | 0 (0.0%) | 2 (100.0%) |
| Computers, Engineering & Science | 0 (0.0%) | 0 (0.0%) |
| Computers & Mathematics | 0 (0.0%) | 0 (0.0%) |
| Architecture & Engineering | 0 (0.0%) | 0 (0.0%) |
| Life, Physical & Social Science | 0 (0.0%) | 0 (0.0%) |
| Community & Social Service | 0 (0.0%) | 0 (0.0%) |
| Education, Arts & Media | 0 (0.0%) | 0 (0.0%) |
| Legal Services & Support | 0 (0.0%) | 0 (0.0%) |
| Education Instruction & Library | 0 (0.0%) | 0 (0.0%) |
| Arts, Media & Entertainment | 0 (0.0%) | 0 (0.0%) |
| Health Diagnosing & Treating | 0 (0.0%) | 0 (0.0%) |
| Health Technologists | 0 (0.0%) | 0 (0.0%) |
| Total (Category) | 3 (60.0%) | 2 (40.0%) |
| Total (Overall) | 6 (66.7%) | 3 (33.3%) |
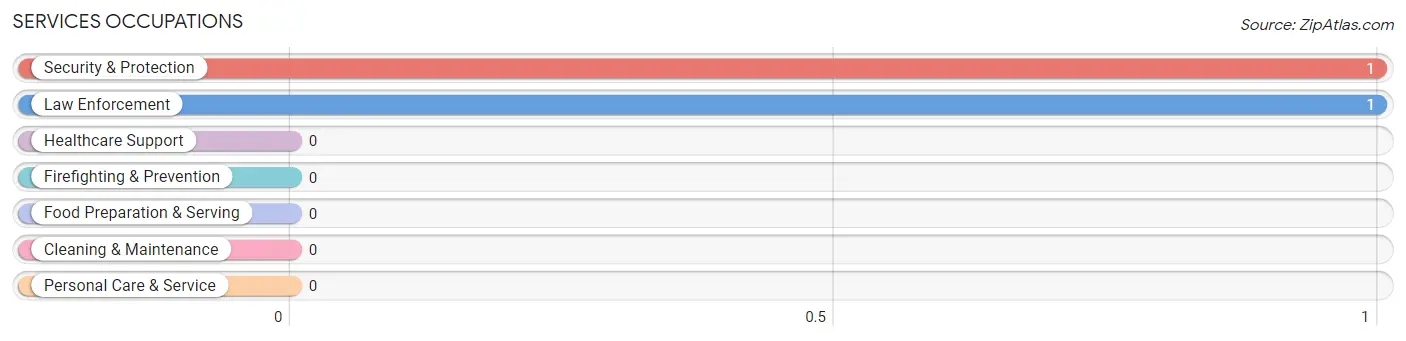
Services Occupations
The most common Services occupations in Blanchard are Security & Protection (1 | 11.1%), and Law Enforcement (1 | 11.1%).
Services Occupations by Sex
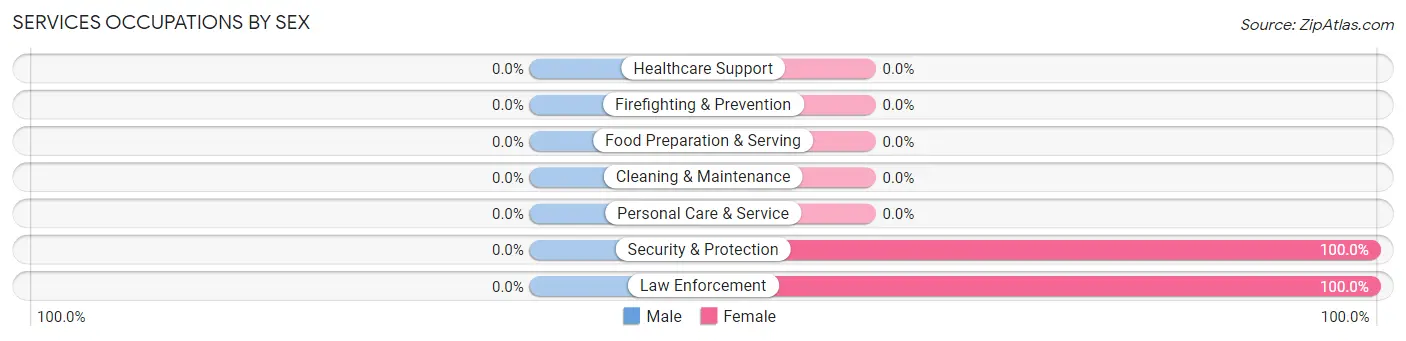
| Occupation | Male | Female |
| Healthcare Support | 0 (0.0%) | 0 (0.0%) |
| Security & Protection | 0 (0.0%) | 1 (100.0%) |
| Firefighting & Prevention | 0 (0.0%) | 0 (0.0%) |
| Law Enforcement | 0 (0.0%) | 1 (100.0%) |
| Food Preparation & Serving | 0 (0.0%) | 0 (0.0%) |
| Cleaning & Maintenance | 0 (0.0%) | 0 (0.0%) |
| Personal Care & Service | 0 (0.0%) | 0 (0.0%) |
| Total (Category) | 0 (0.0%) | 1 (100.0%) |
| Total (Overall) | 6 (66.7%) | 3 (33.3%) |
Sales and Office Occupations
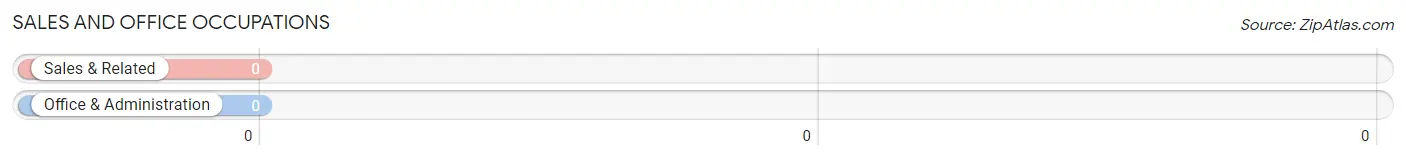
Sales and Office Occupations by Sex
| Occupation | Male | Female |
| Sales & Related | 0 (0.0%) | 0 (0.0%) |
| Office & Administration | 0 (0.0%) | 0 (0.0%) |
| Total (Category) | 0 (0.0%) | 0 (0.0%) |
| Total (Overall) | 6 (66.7%) | 3 (33.3%) |
Natural Resources, Construction and Maintenance Occupations
The most common Natural Resources, Construction and Maintenance occupations in Blanchard are , and Construction & Extraction (2 | 22.2%).
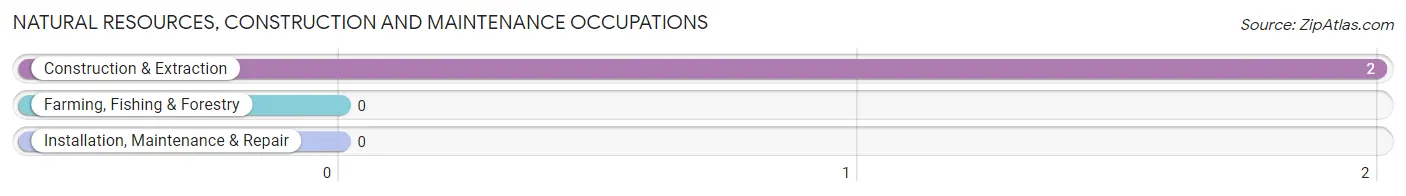
Natural Resources, Construction and Maintenance Occupations by Sex
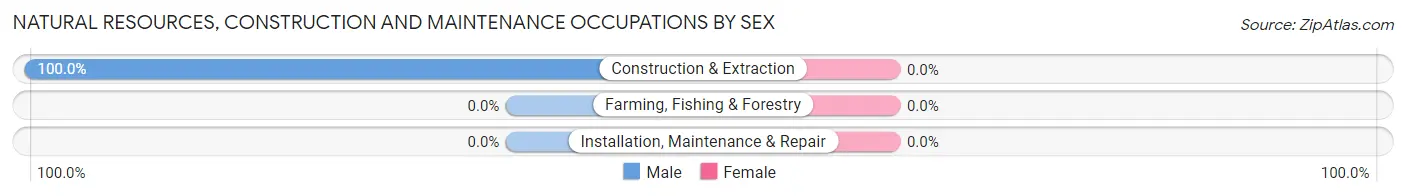
| Occupation | Male | Female |
| Farming, Fishing & Forestry | 0 (0.0%) | 0 (0.0%) |
| Construction & Extraction | 2 (100.0%) | 0 (0.0%) |
| Installation, Maintenance & Repair | 0 (0.0%) | 0 (0.0%) |
| Total (Category) | 2 (100.0%) | 0 (0.0%) |
| Total (Overall) | 6 (66.7%) | 3 (33.3%) |
Production, Transportation and Moving Occupations
The most common Production, Transportation and Moving occupations in Blanchard are , and Transportation (1 | 11.1%).
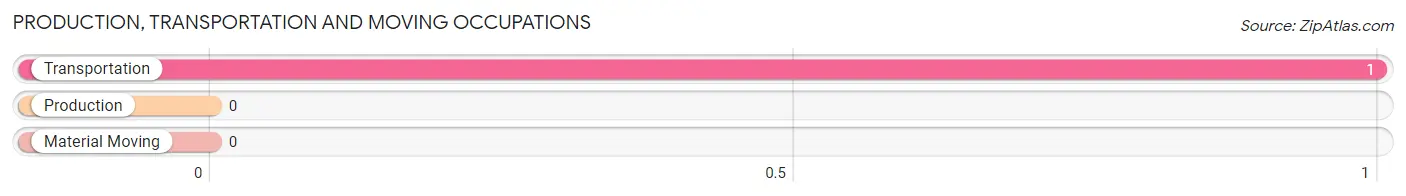
Production, Transportation and Moving Occupations by Sex
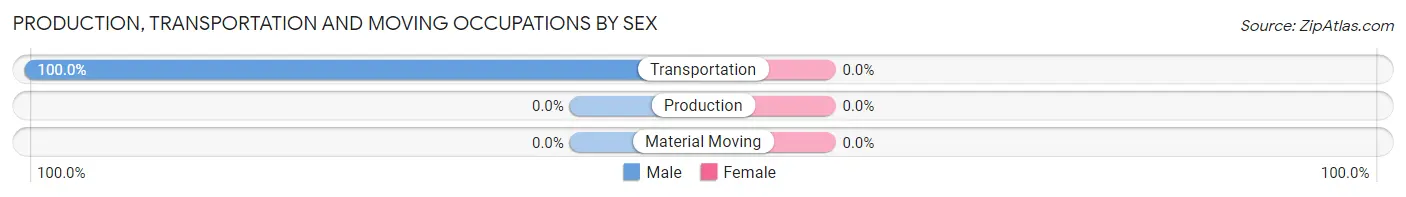
| Occupation | Male | Female |
| Production | 0 (0.0%) | 0 (0.0%) |
| Transportation | 1 (100.0%) | 0 (0.0%) |
| Material Moving | 0 (0.0%) | 0 (0.0%) |
| Total (Category) | 1 (100.0%) | 0 (0.0%) |
| Total (Overall) | 6 (66.7%) | 3 (33.3%) |
Employment Industries by Sex in Blanchard
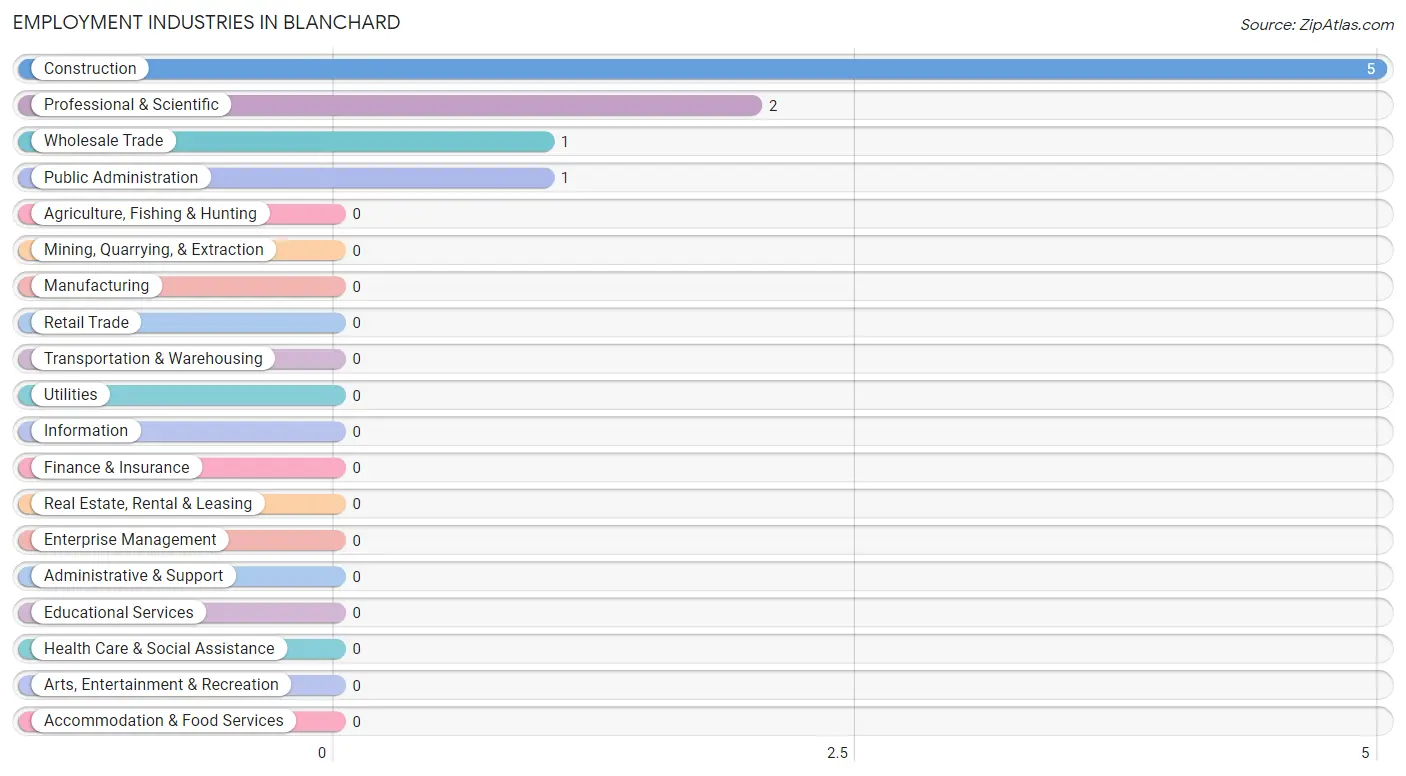
Employment Industries in Blanchard
The major employment industries in Blanchard include Construction (5 | 55.6%), Professional & Scientific (2 | 22.2%), Wholesale Trade (1 | 11.1%), and Public Administration (1 | 11.1%).
Employment Industries by Sex in Blanchard
The Blanchard industries that see more men than women are Construction (100.0%), and Wholesale Trade (100.0%), whereas the industries that tend to have a higher number of women are Professional & Scientific (100.0%), and Public Administration (100.0%).
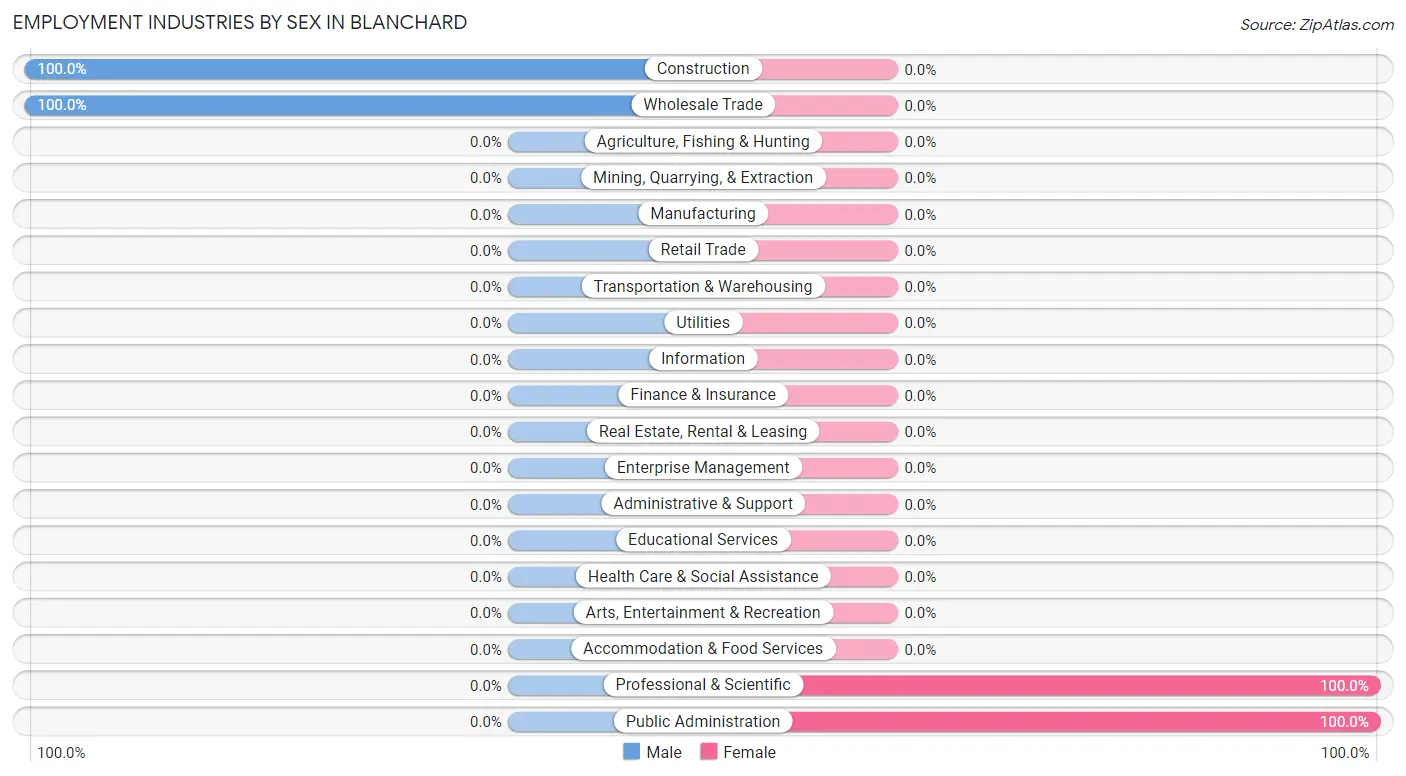
| Industry | Male | Female |
| Agriculture, Fishing & Hunting | 0 (0.0%) | 0 (0.0%) |
| Mining, Quarrying, & Extraction | 0 (0.0%) | 0 (0.0%) |
| Construction | 5 (100.0%) | 0 (0.0%) |
| Manufacturing | 0 (0.0%) | 0 (0.0%) |
| Wholesale Trade | 1 (100.0%) | 0 (0.0%) |
| Retail Trade | 0 (0.0%) | 0 (0.0%) |
| Transportation & Warehousing | 0 (0.0%) | 0 (0.0%) |
| Utilities | 0 (0.0%) | 0 (0.0%) |
| Information | 0 (0.0%) | 0 (0.0%) |
| Finance & Insurance | 0 (0.0%) | 0 (0.0%) |
| Real Estate, Rental & Leasing | 0 (0.0%) | 0 (0.0%) |
| Professional & Scientific | 0 (0.0%) | 2 (100.0%) |
| Enterprise Management | 0 (0.0%) | 0 (0.0%) |
| Administrative & Support | 0 (0.0%) | 0 (0.0%) |
| Educational Services | 0 (0.0%) | 0 (0.0%) |
| Health Care & Social Assistance | 0 (0.0%) | 0 (0.0%) |
| Arts, Entertainment & Recreation | 0 (0.0%) | 0 (0.0%) |
| Accommodation & Food Services | 0 (0.0%) | 0 (0.0%) |
| Public Administration | 0 (0.0%) | 1 (100.0%) |
| Total | 6 (66.7%) | 3 (33.3%) |
Education in Blanchard
School Enrollment in Blanchard
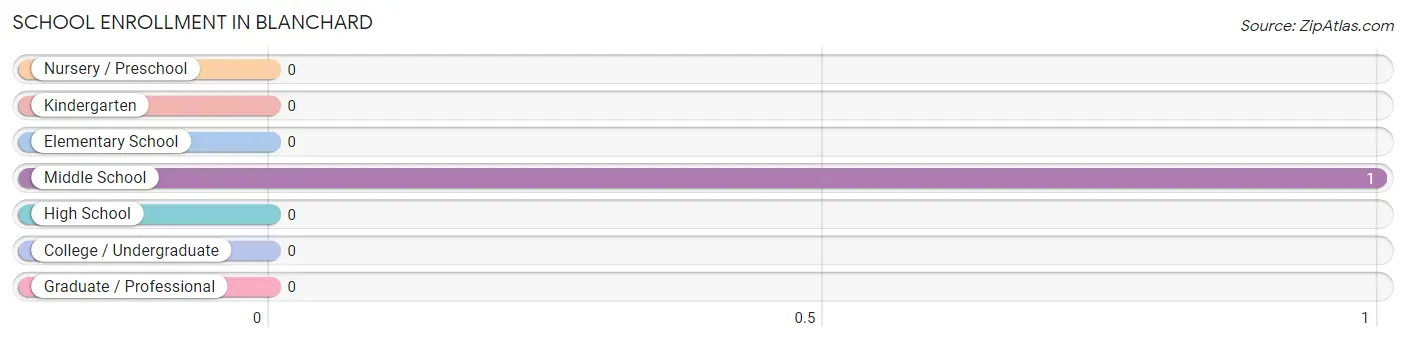
| School Level | # Students | % Students |
| Nursery / Preschool | 0 | 0.0% |
| Kindergarten | 0 | 0.0% |
| Elementary School | 0 | 0.0% |
| Middle School | 1 | 100.0% |
| High School | 0 | 0.0% |
| College / Undergraduate | 0 | 0.0% |
| Graduate / Professional | 0 | 0.0% |
| Total | 1 | 100.0% |
School Enrollment by Age by Funding Source in Blanchard
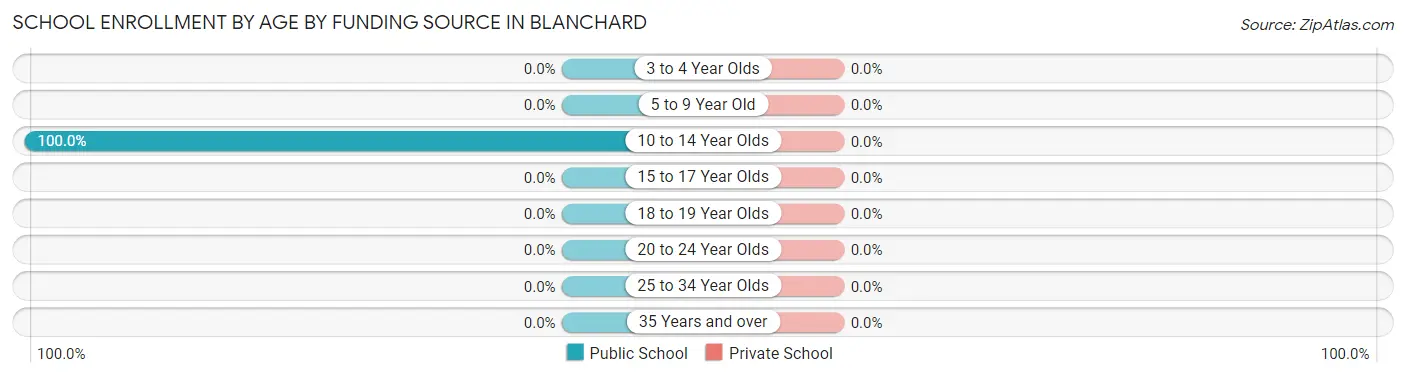
| Age Bracket | Public School | Private School |
| 3 to 4 Year Olds | 0 (0.0%) | 0 (0.0%) |
| 5 to 9 Year Old | 0 (0.0%) | 0 (0.0%) |
| 10 to 14 Year Olds | 1 (100.0%) | 0 (0.0%) |
| 15 to 17 Year Olds | 0 (0.0%) | 0 (0.0%) |
| 18 to 19 Year Olds | 0 (0.0%) | 0 (0.0%) |
| 20 to 24 Year Olds | 0 (0.0%) | 0 (0.0%) |
| 25 to 34 Year Olds | 0 (0.0%) | 0 (0.0%) |
| 35 Years and over | 0 (0.0%) | 0 (0.0%) |
| Total | 1 (100.0%) | 0 (0.0%) |
Educational Attainment by Field of Study in Blanchard
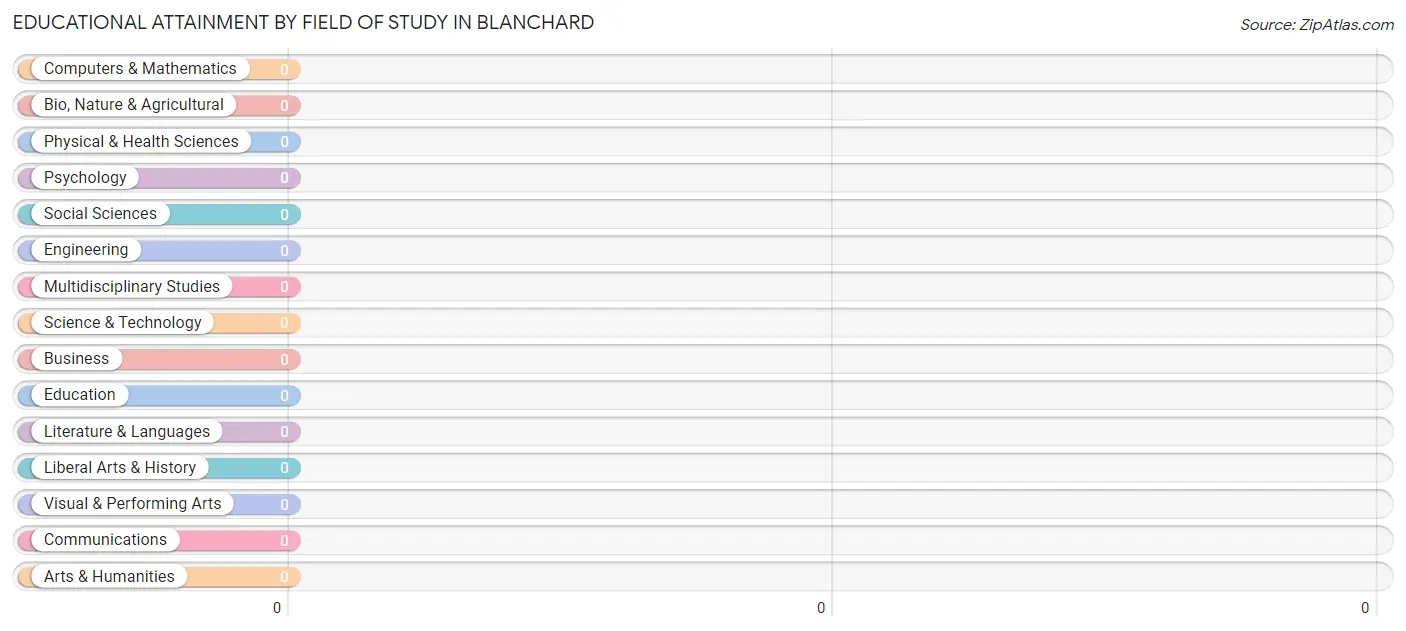
| Field of Study | # Graduates | % Graduates |
| Computers & Mathematics | 0 | 0.0% |
| Bio, Nature & Agricultural | 0 | 0.0% |
| Physical & Health Sciences | 0 | 0.0% |
| Psychology | 0 | 0.0% |
| Social Sciences | 0 | 0.0% |
| Engineering | 0 | 0.0% |
| Multidisciplinary Studies | 0 | 0.0% |
| Science & Technology | 0 | 0.0% |
| Business | 0 | 0.0% |
| Education | 0 | 0.0% |
| Literature & Languages | 0 | 0.0% |
| Liberal Arts & History | 0 | 0.0% |
| Visual & Performing Arts | 0 | 0.0% |
| Communications | 0 | 0.0% |
| Arts & Humanities | 0 | 0.0% |
| Total | 0 | 0.0% |
Transportation & Commute in Blanchard
Vehicle Availability by Sex in Blanchard
The most prevalent vehicle ownership categories in Blanchard are males with 4 vehicles (3, accounting for 50.0%) and females with 4 vehicles (0, making up 100.0%).
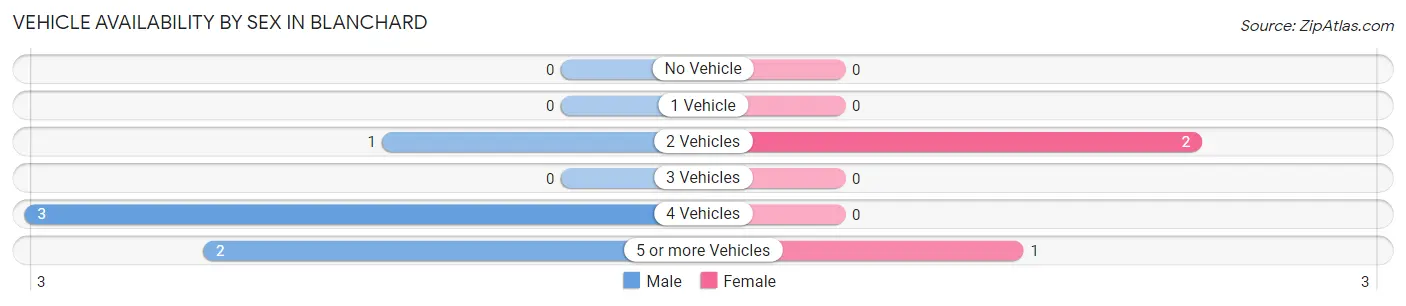
| Vehicles Available | Male | Female |
| No Vehicle | 0 (0.0%) | 0 (0.0%) |
| 1 Vehicle | 0 (0.0%) | 0 (0.0%) |
| 2 Vehicles | 1 (16.7%) | 2 (66.7%) |
| 3 Vehicles | 0 (0.0%) | 0 (0.0%) |
| 4 Vehicles | 3 (50.0%) | 0 (0.0%) |
| 5 or more Vehicles | 2 (33.3%) | 1 (33.3%) |
| Total | 6 (100.0%) | 3 (100.0%) |
Commute Time in Blanchard
The most frequently occuring commute durations in Blanchard are 25 to 29 minutes (7 commuters, 77.8%), 5 to 9 minutes (2 commuters, 22.2%), and less than 5 minutes (0 commuters, 0.0%).
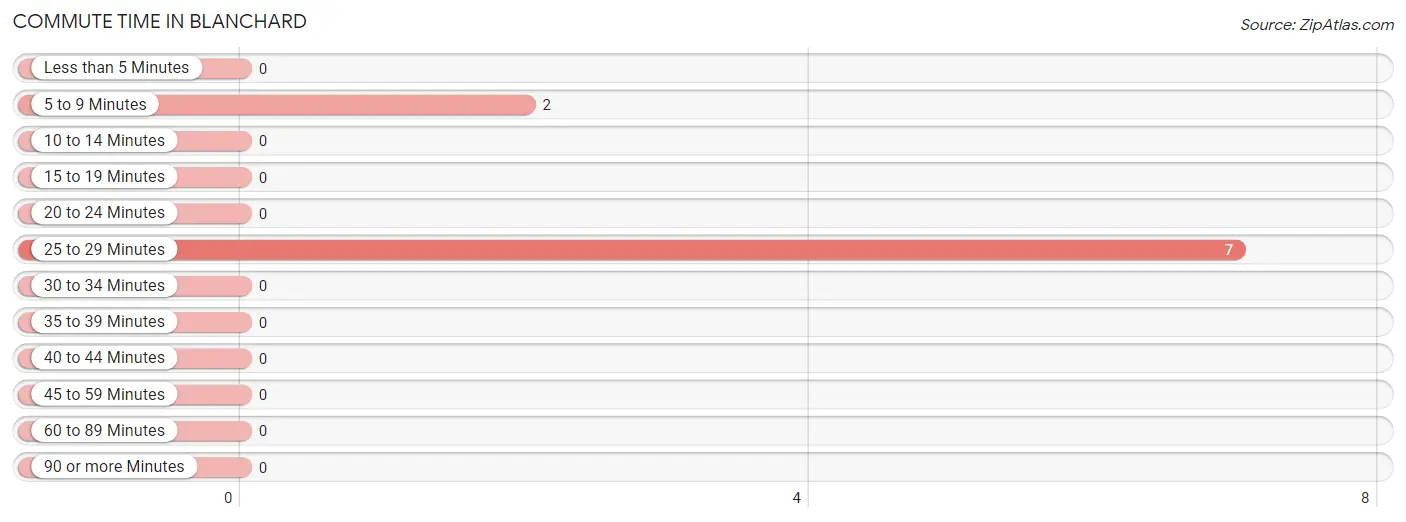
| Commute Time | # Commuters | % Commuters |
| Less than 5 Minutes | 0 | 0.0% |
| 5 to 9 Minutes | 2 | 22.2% |
| 10 to 14 Minutes | 0 | 0.0% |
| 15 to 19 Minutes | 0 | 0.0% |
| 20 to 24 Minutes | 0 | 0.0% |
| 25 to 29 Minutes | 7 | 77.8% |
| 30 to 34 Minutes | 0 | 0.0% |
| 35 to 39 Minutes | 0 | 0.0% |
| 40 to 44 Minutes | 0 | 0.0% |
| 45 to 59 Minutes | 0 | 0.0% |
| 60 to 89 Minutes | 0 | 0.0% |
| 90 or more Minutes | 0 | 0.0% |
Commute Time by Sex in Blanchard
The most common commute times in Blanchard are 25 to 29 minutes (4 commuters, 66.7%) for males and 25 to 29 minutes (3 commuters, 100.0%) for females.
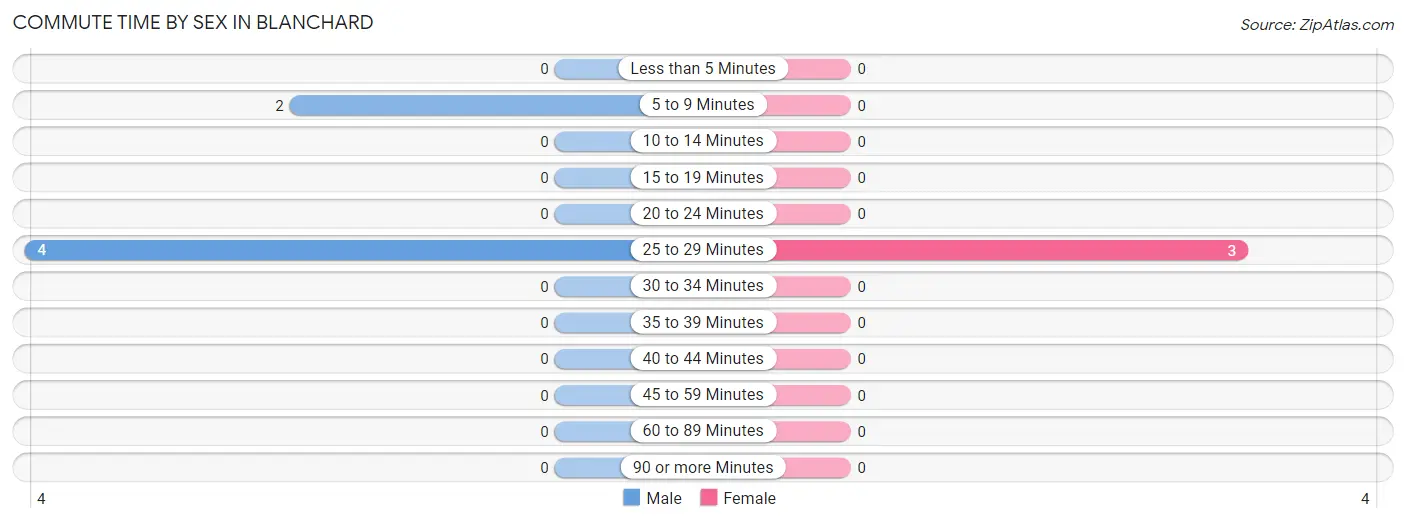
| Commute Time | Male | Female |
| Less than 5 Minutes | 0 (0.0%) | 0 (0.0%) |
| 5 to 9 Minutes | 2 (33.3%) | 0 (0.0%) |
| 10 to 14 Minutes | 0 (0.0%) | 0 (0.0%) |
| 15 to 19 Minutes | 0 (0.0%) | 0 (0.0%) |
| 20 to 24 Minutes | 0 (0.0%) | 0 (0.0%) |
| 25 to 29 Minutes | 4 (66.7%) | 3 (100.0%) |
| 30 to 34 Minutes | 0 (0.0%) | 0 (0.0%) |
| 35 to 39 Minutes | 0 (0.0%) | 0 (0.0%) |
| 40 to 44 Minutes | 0 (0.0%) | 0 (0.0%) |
| 45 to 59 Minutes | 0 (0.0%) | 0 (0.0%) |
| 60 to 89 Minutes | 0 (0.0%) | 0 (0.0%) |
| 90 or more Minutes | 0 (0.0%) | 0 (0.0%) |
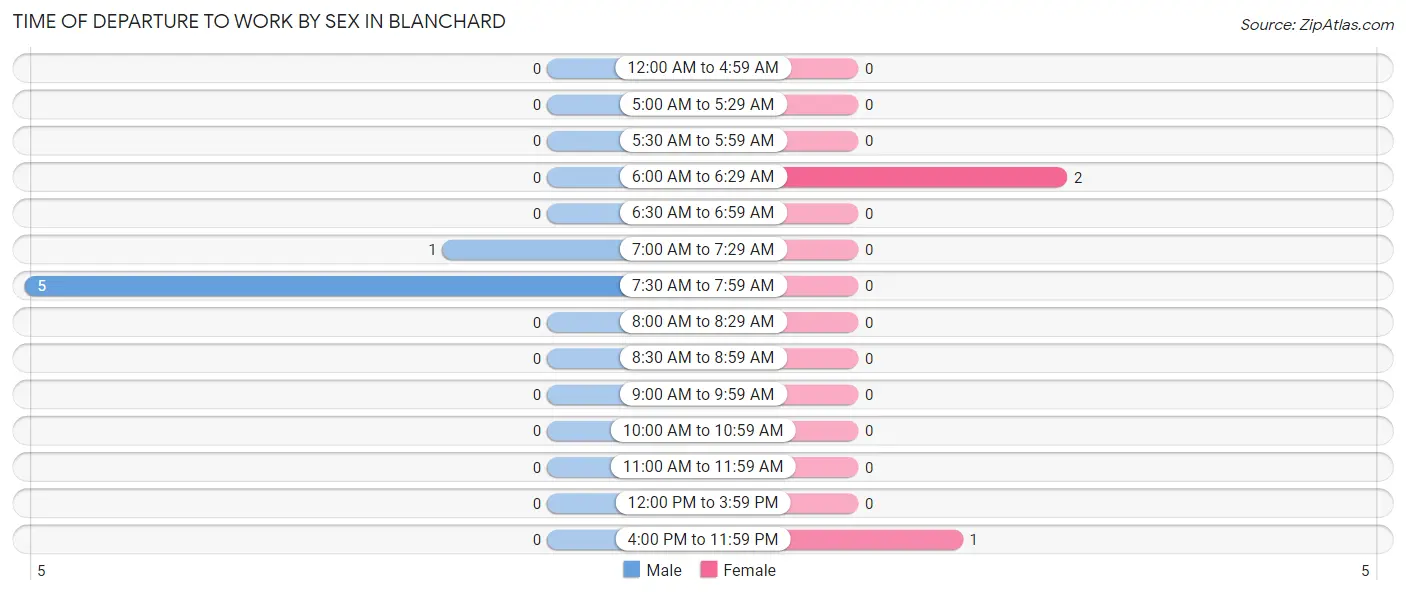
Time of Departure to Work by Sex in Blanchard
The most frequent times of departure to work in Blanchard are 7:30 AM to 7:59 AM (5, 83.3%) for males and 6:00 AM to 6:29 AM (2, 66.7%) for females.
| Time of Departure | Male | Female |
| 12:00 AM to 4:59 AM | 0 (0.0%) | 0 (0.0%) |
| 5:00 AM to 5:29 AM | 0 (0.0%) | 0 (0.0%) |
| 5:30 AM to 5:59 AM | 0 (0.0%) | 0 (0.0%) |
| 6:00 AM to 6:29 AM | 0 (0.0%) | 2 (66.7%) |
| 6:30 AM to 6:59 AM | 0 (0.0%) | 0 (0.0%) |
| 7:00 AM to 7:29 AM | 1 (16.7%) | 0 (0.0%) |
| 7:30 AM to 7:59 AM | 5 (83.3%) | 0 (0.0%) |
| 8:00 AM to 8:29 AM | 0 (0.0%) | 0 (0.0%) |
| 8:30 AM to 8:59 AM | 0 (0.0%) | 0 (0.0%) |
| 9:00 AM to 9:59 AM | 0 (0.0%) | 0 (0.0%) |
| 10:00 AM to 10:59 AM | 0 (0.0%) | 0 (0.0%) |
| 11:00 AM to 11:59 AM | 0 (0.0%) | 0 (0.0%) |
| 12:00 PM to 3:59 PM | 0 (0.0%) | 0 (0.0%) |
| 4:00 PM to 11:59 PM | 0 (0.0%) | 1 (33.3%) |
| Total | 6 (100.0%) | 3 (100.0%) |
Housing Occupancy in Blanchard
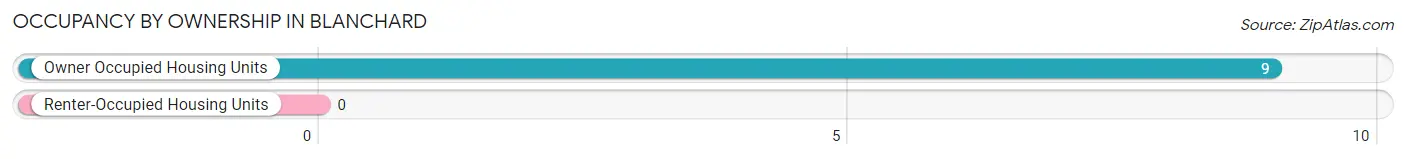
Occupancy by Ownership in Blanchard
Of the total 9 dwellings in Blanchard, owner-occupied units account for 9 (100.0%), while renter-occupied units make up 0 (0.0%).
| Occupancy | # Housing Units | % Housing Units |
| Owner Occupied Housing Units | 9 | 100.0% |
| Renter-Occupied Housing Units | 0 | 0.0% |
| Total Occupied Housing Units | 9 | 100.0% |
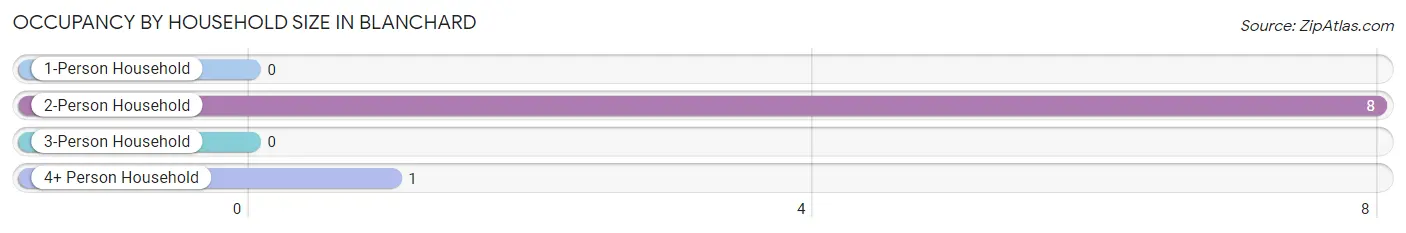
Occupancy by Household Size in Blanchard
| Household Size | # Housing Units | % Housing Units |
| 1-Person Household | 0 | 0.0% |
| 2-Person Household | 8 | 88.9% |
| 3-Person Household | 0 | 0.0% |
| 4+ Person Household | 1 | 11.1% |
| Total Housing Units | 9 | 100.0% |
Occupancy by Ownership by Household Size in Blanchard
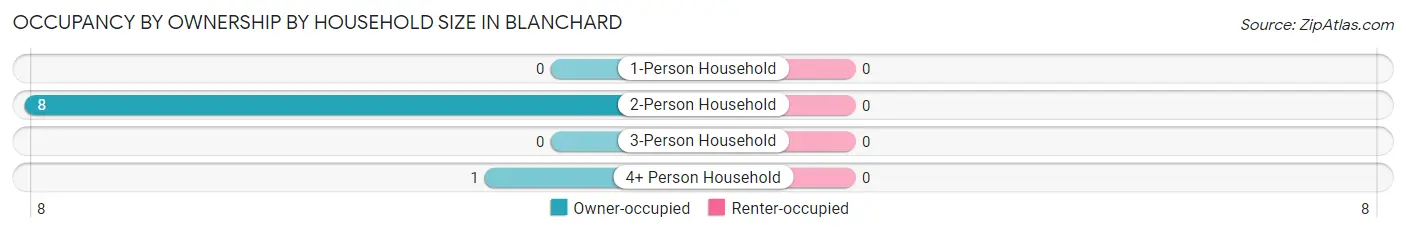
| Household Size | Owner-occupied | Renter-occupied |
| 1-Person Household | 0 (0.0%) | 0 (0.0%) |
| 2-Person Household | 8 (100.0%) | 0 (0.0%) |
| 3-Person Household | 0 (0.0%) | 0 (0.0%) |
| 4+ Person Household | 1 (100.0%) | 0 (0.0%) |
| Total Housing Units | 9 (100.0%) | 0 (0.0%) |
Occupancy by Educational Attainment in Blanchard
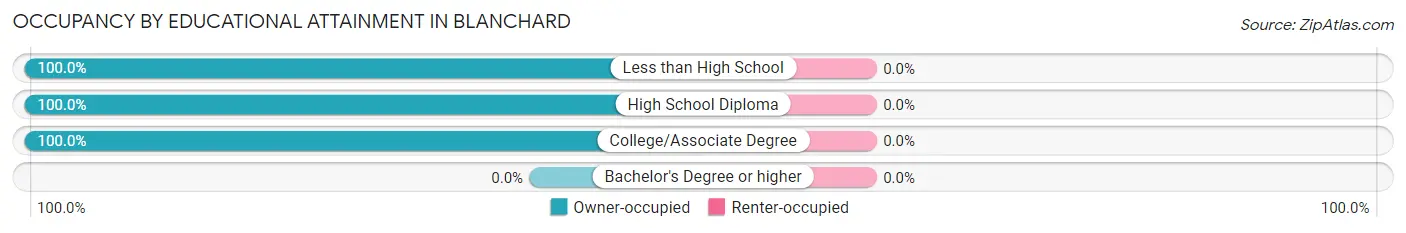
| Household Size | Owner-occupied | Renter-occupied |
| Less than High School | 1 (100.0%) | 0 (0.0%) |
| High School Diploma | 3 (100.0%) | 0 (0.0%) |
| College/Associate Degree | 5 (100.0%) | 0 (0.0%) |
| Bachelor's Degree or higher | 0 (0.0%) | 0 (0.0%) |
Occupancy by Age of Householder in Blanchard
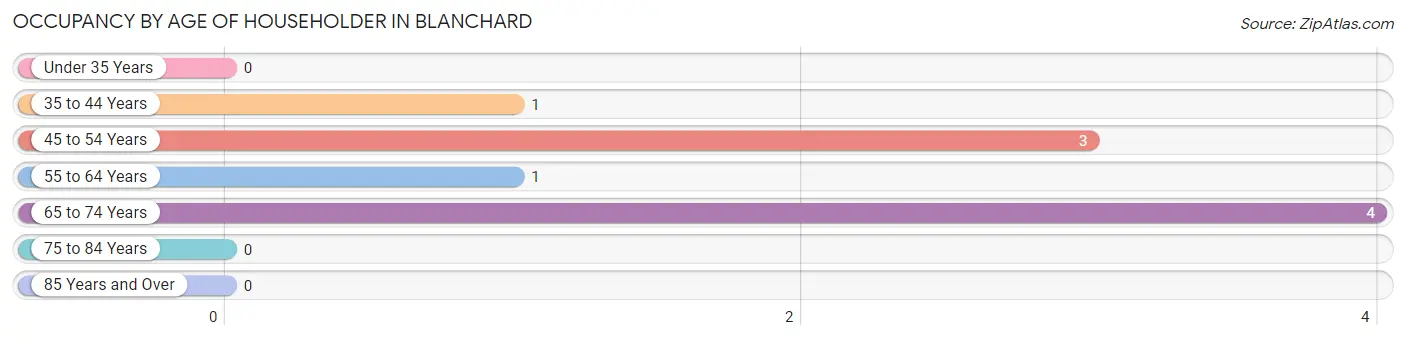
| Age Bracket | # Households | % Households |
| Under 35 Years | 0 | 0.0% |
| 35 to 44 Years | 1 | 11.1% |
| 45 to 54 Years | 3 | 33.3% |
| 55 to 64 Years | 1 | 11.1% |
| 65 to 74 Years | 4 | 44.4% |
| 75 to 84 Years | 0 | 0.0% |
| 85 Years and Over | 0 | 0.0% |
| Total | 9 | 100.0% |
Housing Finances in Blanchard
Median Income by Occupancy in Blanchard
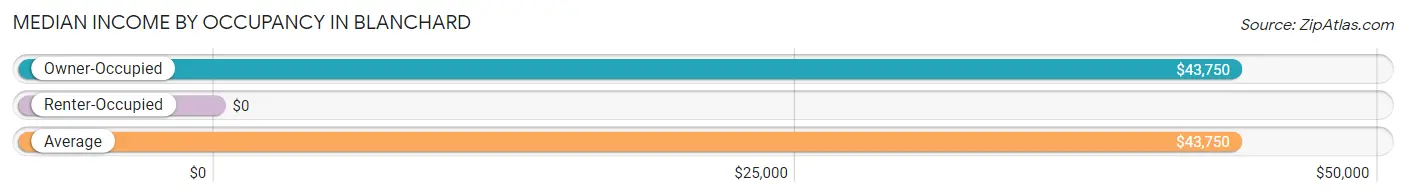
| Occupancy Type | # Households | Median Income |
| Owner-Occupied | 9 (100.0%) | $43,750 |
| Renter-Occupied | 0 (0.0%) | $0 |
| Average | 9 (100.0%) | $43,750 |
Occupancy by Householder Income Bracket in Blanchard
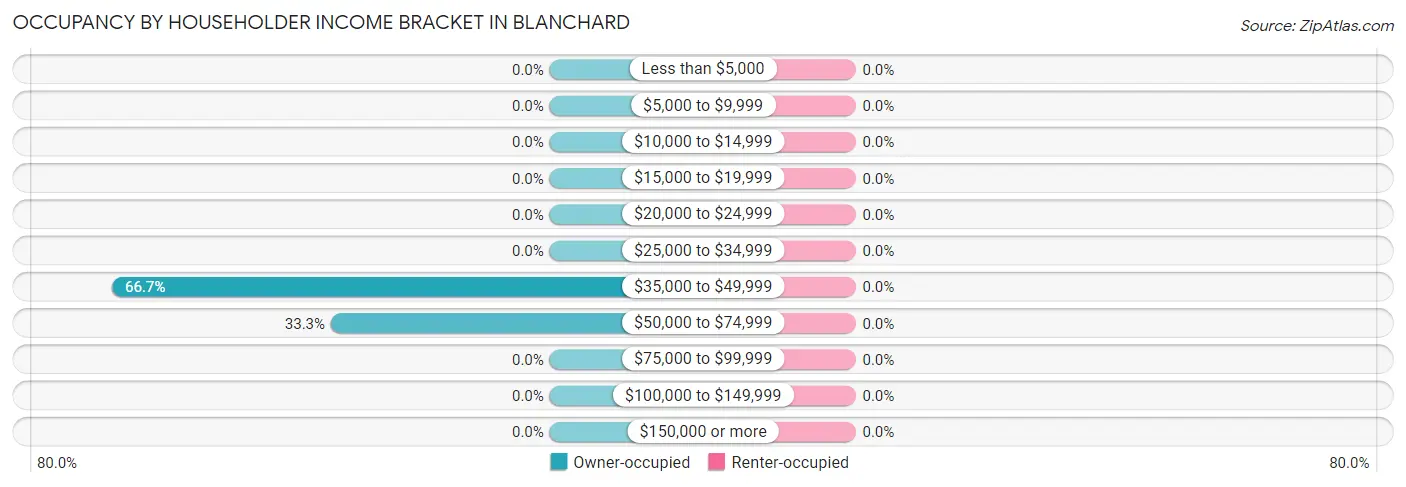
| Income Bracket | Owner-occupied | Renter-occupied |
| Less than $5,000 | 0 (0.0%) | 0 (0.0%) |
| $5,000 to $9,999 | 0 (0.0%) | 0 (0.0%) |
| $10,000 to $14,999 | 0 (0.0%) | 0 (0.0%) |
| $15,000 to $19,999 | 0 (0.0%) | 0 (0.0%) |
| $20,000 to $24,999 | 0 (0.0%) | 0 (0.0%) |
| $25,000 to $34,999 | 0 (0.0%) | 0 (0.0%) |
| $35,000 to $49,999 | 6 (66.7%) | 0 (0.0%) |
| $50,000 to $74,999 | 3 (33.3%) | 0 (0.0%) |
| $75,000 to $99,999 | 0 (0.0%) | 0 (0.0%) |
| $100,000 to $149,999 | 0 (0.0%) | 0 (0.0%) |
| $150,000 or more | 0 (0.0%) | 0 (0.0%) |
| Total | 9 (100.0%) | 0 (0.0%) |
Monthly Housing Cost Tiers in Blanchard
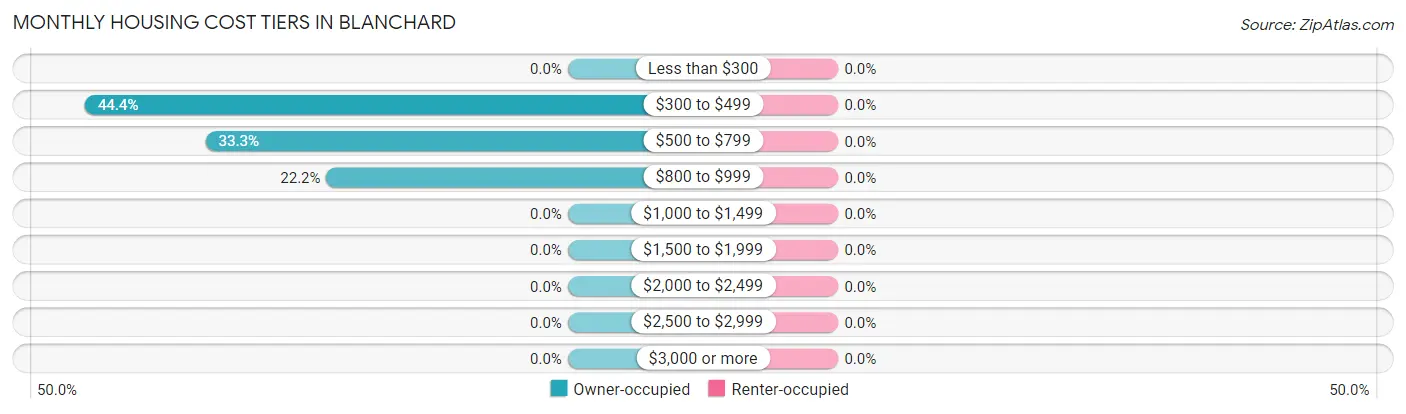
| Monthly Cost | Owner-occupied | Renter-occupied |
| Less than $300 | 0 (0.0%) | 0 (0.0%) |
| $300 to $499 | 4 (44.4%) | 0 (0.0%) |
| $500 to $799 | 3 (33.3%) | 0 (0.0%) |
| $800 to $999 | 2 (22.2%) | 0 (0.0%) |
| $1,000 to $1,499 | 0 (0.0%) | 0 (0.0%) |
| $1,500 to $1,999 | 0 (0.0%) | 0 (0.0%) |
| $2,000 to $2,499 | 0 (0.0%) | 0 (0.0%) |
| $2,500 to $2,999 | 0 (0.0%) | 0 (0.0%) |
| $3,000 or more | 0 (0.0%) | 0 (0.0%) |
| Total | 9 (100.0%) | 0 (0.0%) |
Physical Housing Characteristics in Blanchard
Housing Structures in Blanchard
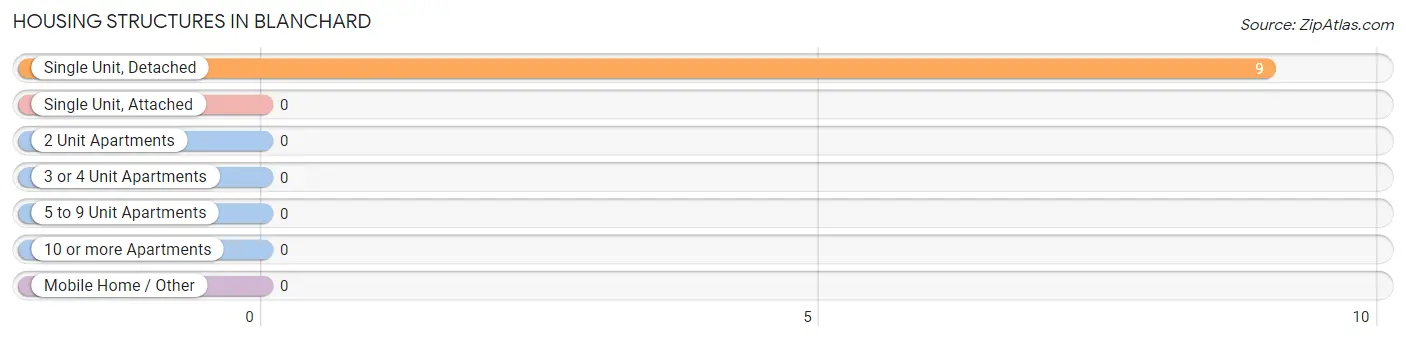
| Structure Type | # Housing Units | % Housing Units |
| Single Unit, Detached | 9 | 100.0% |
| Single Unit, Attached | 0 | 0.0% |
| 2 Unit Apartments | 0 | 0.0% |
| 3 or 4 Unit Apartments | 0 | 0.0% |
| 5 to 9 Unit Apartments | 0 | 0.0% |
| 10 or more Apartments | 0 | 0.0% |
| Mobile Home / Other | 0 | 0.0% |
| Total | 9 | 100.0% |
Housing Structures by Occupancy in Blanchard
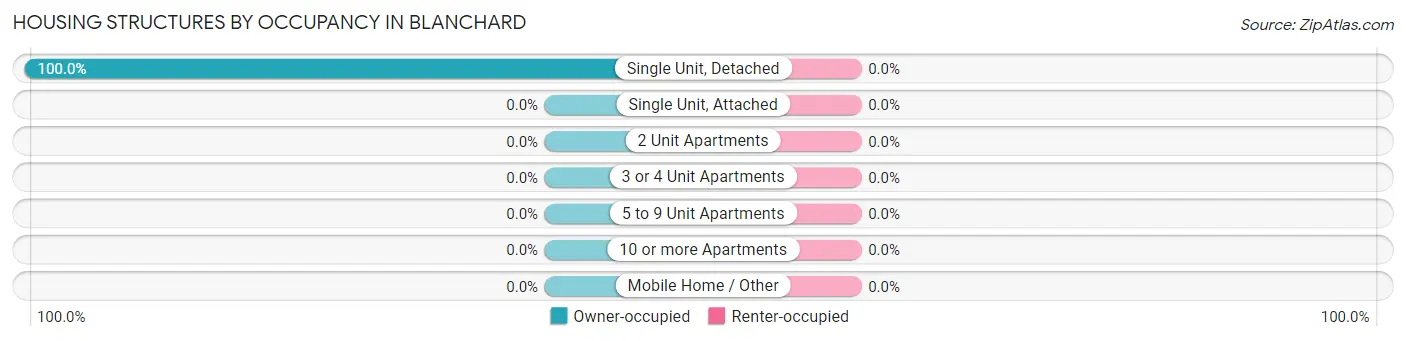
| Structure Type | Owner-occupied | Renter-occupied |
| Single Unit, Detached | 9 (100.0%) | 0 (0.0%) |
| Single Unit, Attached | 0 (0.0%) | 0 (0.0%) |
| 2 Unit Apartments | 0 (0.0%) | 0 (0.0%) |
| 3 or 4 Unit Apartments | 0 (0.0%) | 0 (0.0%) |
| 5 to 9 Unit Apartments | 0 (0.0%) | 0 (0.0%) |
| 10 or more Apartments | 0 (0.0%) | 0 (0.0%) |
| Mobile Home / Other | 0 (0.0%) | 0 (0.0%) |
| Total | 9 (100.0%) | 0 (0.0%) |
Housing Structures by Number of Rooms in Blanchard
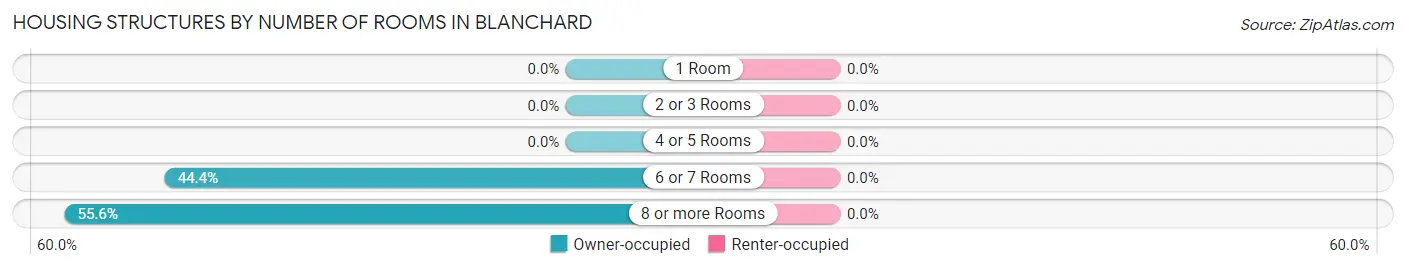
| Number of Rooms | Owner-occupied | Renter-occupied |
| 1 Room | 0 (0.0%) | 0 (0.0%) |
| 2 or 3 Rooms | 0 (0.0%) | 0 (0.0%) |
| 4 or 5 Rooms | 0 (0.0%) | 0 (0.0%) |
| 6 or 7 Rooms | 4 (44.4%) | 0 (0.0%) |
| 8 or more Rooms | 5 (55.6%) | 0 (0.0%) |
| Total | 9 (100.0%) | 0 (0.0%) |
Housing Structure by Heating Type in Blanchard
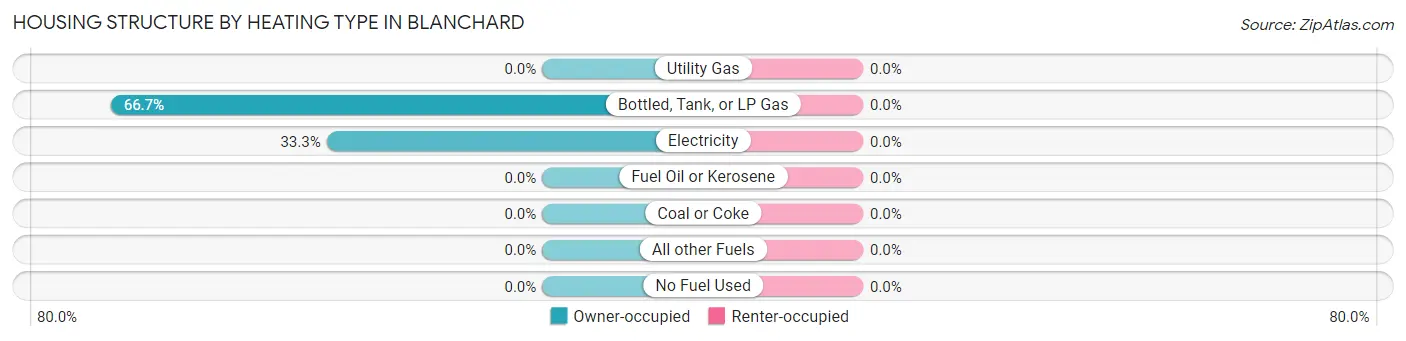
| Heating Type | Owner-occupied | Renter-occupied |
| Utility Gas | 0 (0.0%) | 0 (0.0%) |
| Bottled, Tank, or LP Gas | 6 (66.7%) | 0 (0.0%) |
| Electricity | 3 (33.3%) | 0 (0.0%) |
| Fuel Oil or Kerosene | 0 (0.0%) | 0 (0.0%) |
| Coal or Coke | 0 (0.0%) | 0 (0.0%) |
| All other Fuels | 0 (0.0%) | 0 (0.0%) |
| No Fuel Used | 0 (0.0%) | 0 (0.0%) |
| Total | 9 (100.0%) | 0 (0.0%) |
Household Vehicle Usage in Blanchard
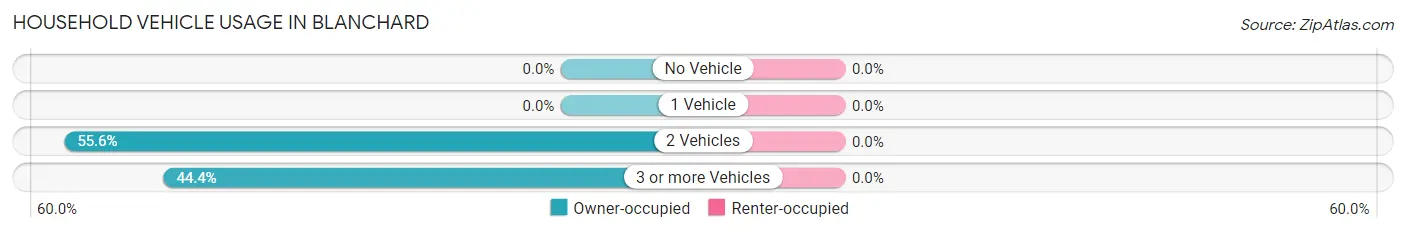
| Vehicles per Household | Owner-occupied | Renter-occupied |
| No Vehicle | 0 (0.0%) | 0 (0.0%) |
| 1 Vehicle | 0 (0.0%) | 0 (0.0%) |
| 2 Vehicles | 5 (55.6%) | 0 (0.0%) |
| 3 or more Vehicles | 4 (44.4%) | 0 (0.0%) |
| Total | 9 (100.0%) | 0 (0.0%) |
Real Estate & Mortgages in Blanchard
Real Estate and Mortgage Overview in Blanchard
| Characteristic | Without Mortgage | With Mortgage |
| Housing Units | 7 | 2 |
| Median Property Value | - | - |
| Median Household Income | - | - |
| Monthly Housing Costs | $392 | $0 |
| Real Estate Taxes | $450 | $0 |
Property Value by Mortgage Status in Blanchard
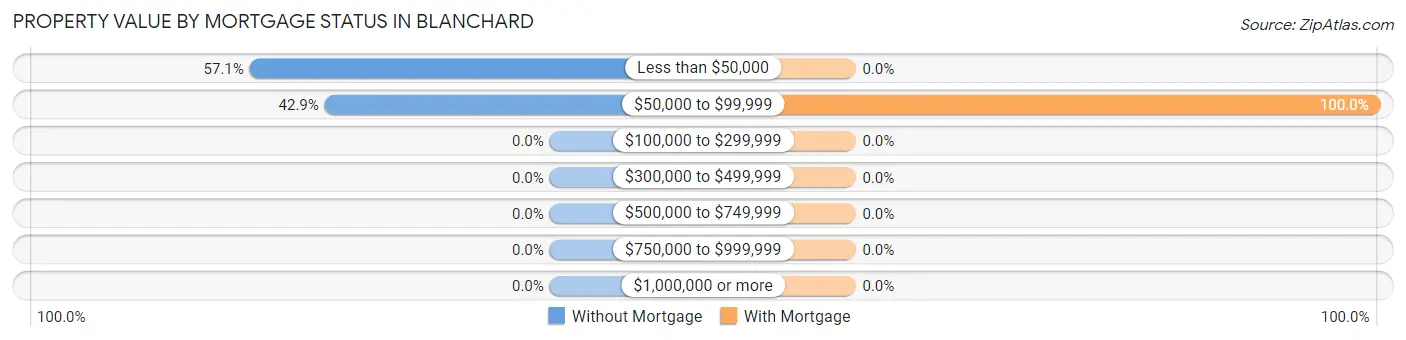
| Property Value | Without Mortgage | With Mortgage |
| Less than $50,000 | 4 (57.1%) | 0 (0.0%) |
| $50,000 to $99,999 | 3 (42.9%) | 2 (100.0%) |
| $100,000 to $299,999 | 0 (0.0%) | 0 (0.0%) |
| $300,000 to $499,999 | 0 (0.0%) | 0 (0.0%) |
| $500,000 to $749,999 | 0 (0.0%) | 0 (0.0%) |
| $750,000 to $999,999 | 0 (0.0%) | 0 (0.0%) |
| $1,000,000 or more | 0 (0.0%) | 0 (0.0%) |
| Total | 7 (100.0%) | 2 (100.0%) |
Household Income by Mortgage Status in Blanchard
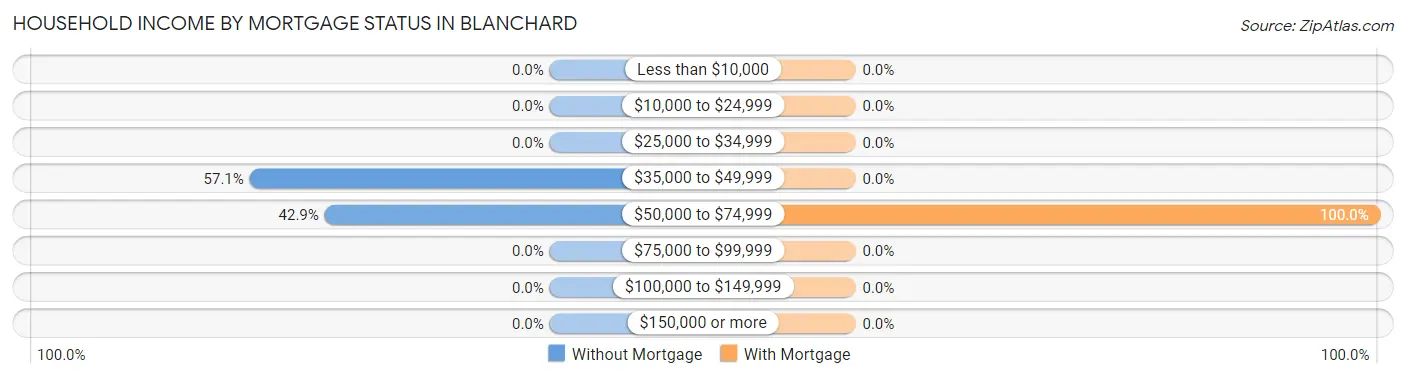
| Household Income | Without Mortgage | With Mortgage |
| Less than $10,000 | 0 (0.0%) | 0 (0.0%) |
| $10,000 to $24,999 | 0 (0.0%) | 0 (0.0%) |
| $25,000 to $34,999 | 0 (0.0%) | 0 (0.0%) |
| $35,000 to $49,999 | 4 (57.1%) | 0 (0.0%) |
| $50,000 to $74,999 | 3 (42.9%) | 2 (100.0%) |
| $75,000 to $99,999 | 0 (0.0%) | 0 (0.0%) |
| $100,000 to $149,999 | 0 (0.0%) | 0 (0.0%) |
| $150,000 or more | 0 (0.0%) | 0 (0.0%) |
| Total | 7 (100.0%) | 2 (100.0%) |
Property Value to Household Income Ratio in Blanchard
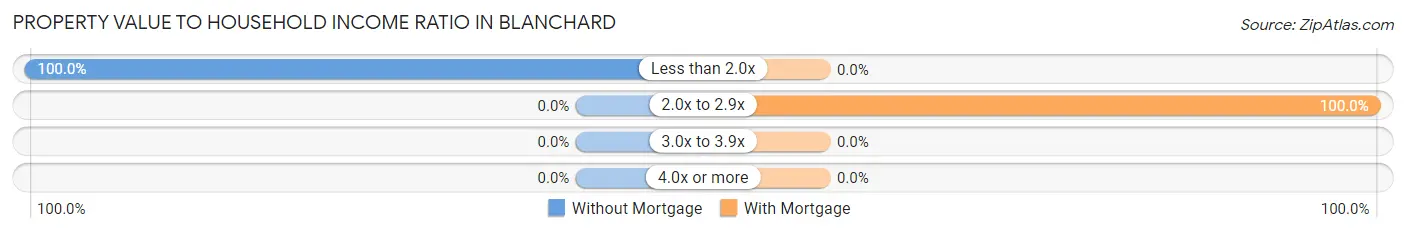
| Value-to-Income Ratio | Without Mortgage | With Mortgage |
| Less than 2.0x | 7 (100.0%) | 0 (0.0%) |
| 2.0x to 2.9x | 0 (0.0%) | 2 (100.0%) |
| 3.0x to 3.9x | 0 (0.0%) | 0 (0.0%) |
| 4.0x or more | 0 (0.0%) | 0 (0.0%) |
| Total | 7 (100.0%) | 2 (100.0%) |
Real Estate Taxes by Mortgage Status in Blanchard
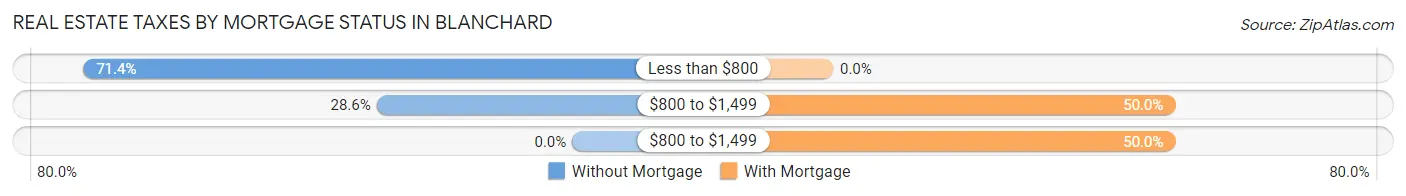
| Property Taxes | Without Mortgage | With Mortgage |
| Less than $800 | 5 (71.4%) | 0 (0.0%) |
| $800 to $1,499 | 2 (28.6%) | 1 (50.0%) |
| $800 to $1,499 | 0 (0.0%) | 1 (50.0%) |
| Total | 7 (100.0%) | 2 (100.0%) |
Health & Disability in Blanchard
Health Insurance Coverage by Age in Blanchard
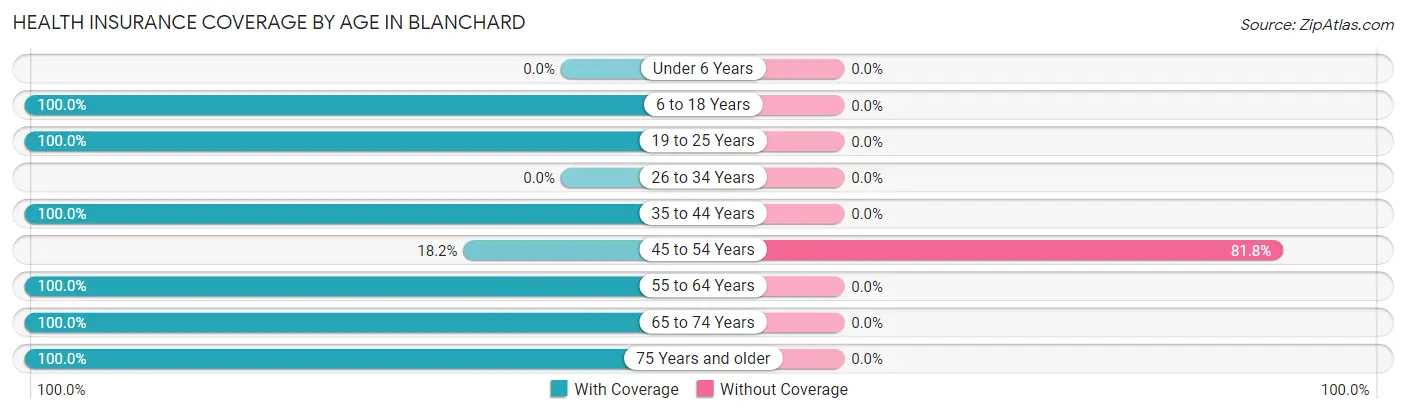
| Age Bracket | With Coverage | Without Coverage |
| Under 6 Years | 0 (0.0%) | 0 (0.0%) |
| 6 to 18 Years | 1 (100.0%) | 0 (0.0%) |
| 19 to 25 Years | 1 (100.0%) | 0 (0.0%) |
| 26 to 34 Years | 0 (0.0%) | 0 (0.0%) |
| 35 to 44 Years | 1 (100.0%) | 0 (0.0%) |
| 45 to 54 Years | 4 (18.2%) | 18 (81.8%) |
| 55 to 64 Years | 2 (100.0%) | 0 (0.0%) |
| 65 to 74 Years | 5 (100.0%) | 0 (0.0%) |
| 75 Years and older | 2 (100.0%) | 0 (0.0%) |
| Total | 16 (47.1%) | 18 (52.9%) |
Health Insurance Coverage by Citizenship Status in Blanchard
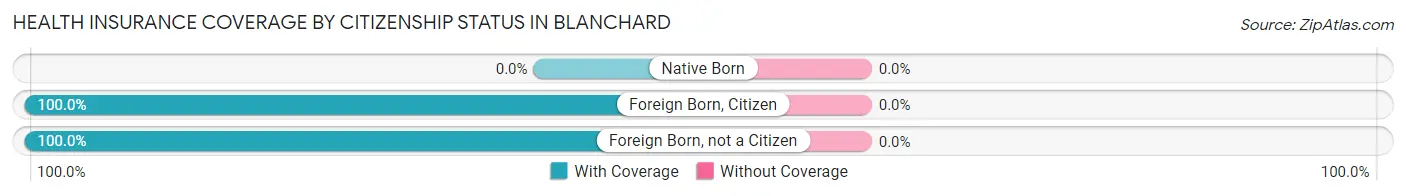
| Citizenship Status | With Coverage | Without Coverage |
| Native Born | 0 (0.0%) | 0 (0.0%) |
| Foreign Born, Citizen | 1 (100.0%) | 0 (0.0%) |
| Foreign Born, not a Citizen | 1 (100.0%) | 0 (0.0%) |
Health Insurance Coverage by Household Income in Blanchard
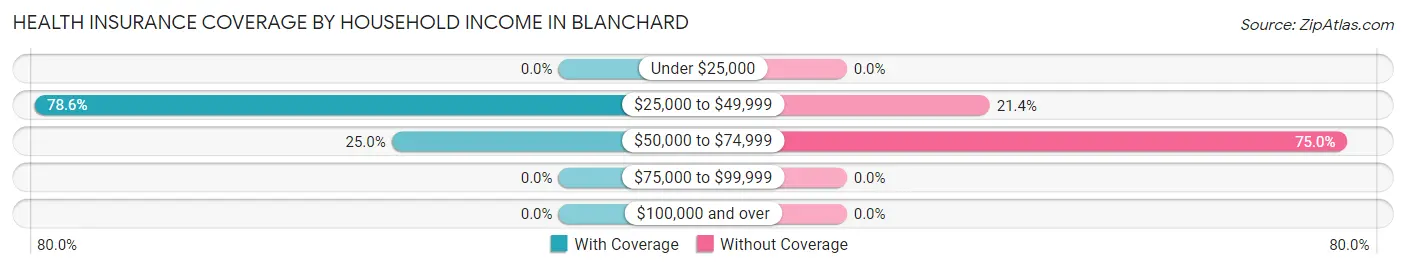
| Household Income | With Coverage | Without Coverage |
| Under $25,000 | 0 (0.0%) | 0 (0.0%) |
| $25,000 to $49,999 | 11 (78.6%) | 3 (21.4%) |
| $50,000 to $74,999 | 5 (25.0%) | 15 (75.0%) |
| $75,000 to $99,999 | 0 (0.0%) | 0 (0.0%) |
| $100,000 and over | 0 (0.0%) | 0 (0.0%) |
Public vs Private Health Insurance Coverage by Age in Blanchard
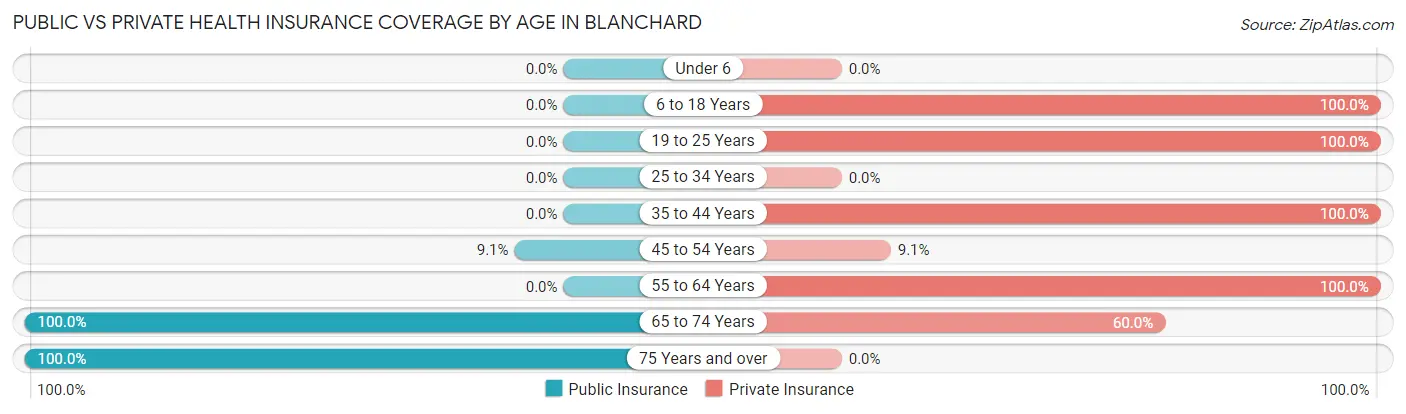
| Age Bracket | Public Insurance | Private Insurance |
| Under 6 | 0 (0.0%) | 0 (0.0%) |
| 6 to 18 Years | 0 (0.0%) | 1 (100.0%) |
| 19 to 25 Years | 0 (0.0%) | 1 (100.0%) |
| 25 to 34 Years | 0 (0.0%) | 0 (0.0%) |
| 35 to 44 Years | 0 (0.0%) | 1 (100.0%) |
| 45 to 54 Years | 2 (9.1%) | 2 (9.1%) |
| 55 to 64 Years | 0 (0.0%) | 2 (100.0%) |
| 65 to 74 Years | 5 (100.0%) | 3 (60.0%) |
| 75 Years and over | 2 (100.0%) | 0 (0.0%) |
| Total | 9 (26.5%) | 10 (29.4%) |
Disability Status by Sex by Age in Blanchard
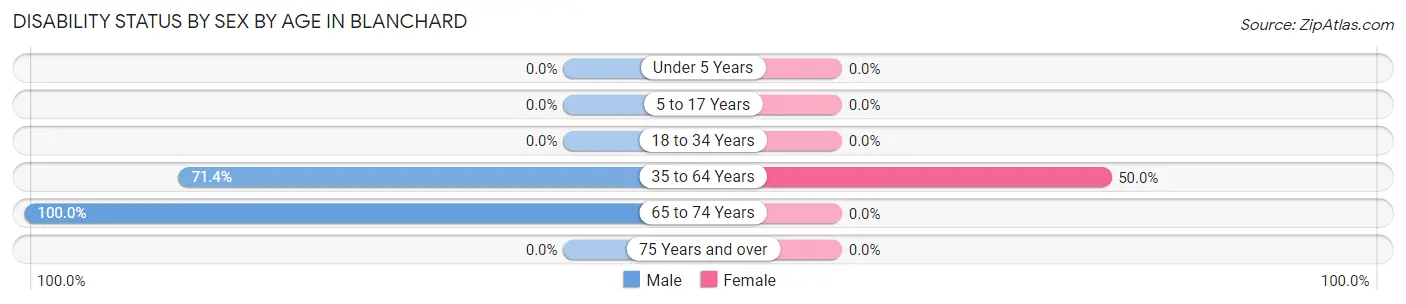
| Age Bracket | Male | Female |
| Under 5 Years | 0 (0.0%) | 0 (0.0%) |
| 5 to 17 Years | 0 (0.0%) | 0 (0.0%) |
| 18 to 34 Years | 0 (0.0%) | 0 (0.0%) |
| 35 to 64 Years | 15 (71.4%) | 2 (50.0%) |
| 65 to 74 Years | 1 (100.0%) | 0 (0.0%) |
| 75 Years and over | 0 (0.0%) | 0 (0.0%) |
Disability Class by Sex by Age in Blanchard
Disability Class: Hearing Difficulty
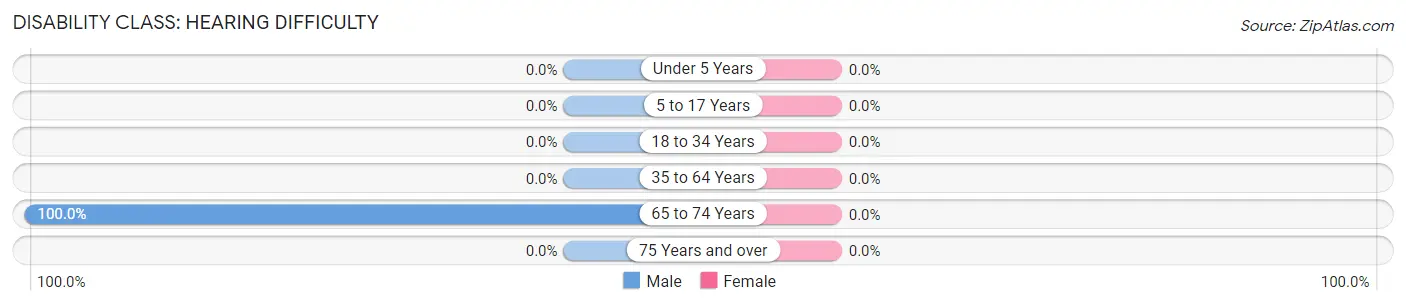
| Age Bracket | Male | Female |
| Under 5 Years | 0 (0.0%) | 0 (0.0%) |
| 5 to 17 Years | 0 (0.0%) | 0 (0.0%) |
| 18 to 34 Years | 0 (0.0%) | 0 (0.0%) |
| 35 to 64 Years | 0 (0.0%) | 0 (0.0%) |
| 65 to 74 Years | 1 (100.0%) | 0 (0.0%) |
| 75 Years and over | 0 (0.0%) | 0 (0.0%) |
Disability Class: Vision Difficulty
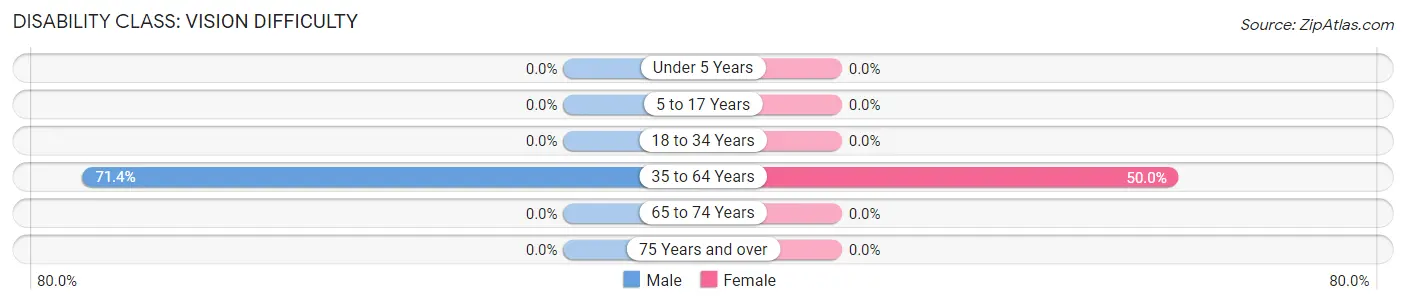
| Age Bracket | Male | Female |
| Under 5 Years | 0 (0.0%) | 0 (0.0%) |
| 5 to 17 Years | 0 (0.0%) | 0 (0.0%) |
| 18 to 34 Years | 0 (0.0%) | 0 (0.0%) |
| 35 to 64 Years | 15 (71.4%) | 2 (50.0%) |
| 65 to 74 Years | 0 (0.0%) | 0 (0.0%) |
| 75 Years and over | 0 (0.0%) | 0 (0.0%) |
Disability Class: Cognitive Difficulty
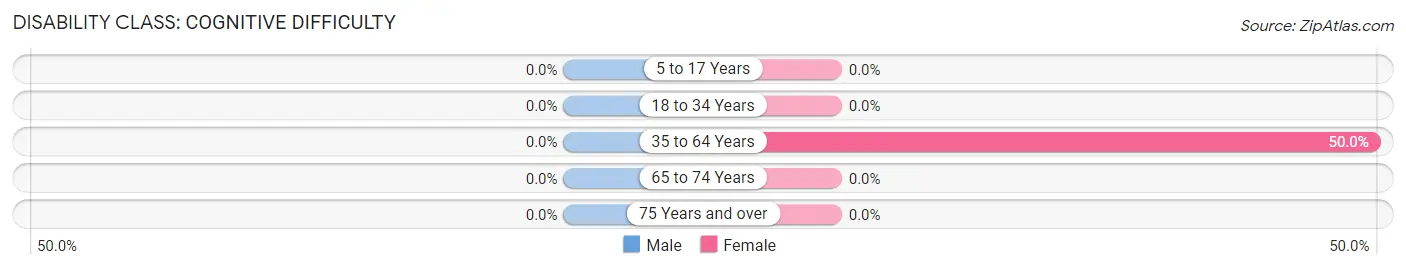
| Age Bracket | Male | Female |
| 5 to 17 Years | 0 (0.0%) | 0 (0.0%) |
| 18 to 34 Years | 0 (0.0%) | 0 (0.0%) |
| 35 to 64 Years | 0 (0.0%) | 2 (50.0%) |
| 65 to 74 Years | 0 (0.0%) | 0 (0.0%) |
| 75 Years and over | 0 (0.0%) | 0 (0.0%) |
Disability Class: Ambulatory Difficulty
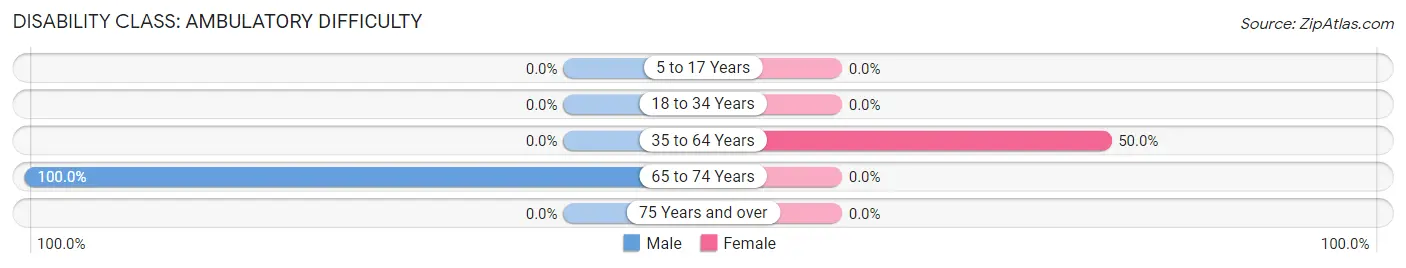
| Age Bracket | Male | Female |
| 5 to 17 Years | 0 (0.0%) | 0 (0.0%) |
| 18 to 34 Years | 0 (0.0%) | 0 (0.0%) |
| 35 to 64 Years | 0 (0.0%) | 2 (50.0%) |
| 65 to 74 Years | 1 (100.0%) | 0 (0.0%) |
| 75 Years and over | 0 (0.0%) | 0 (0.0%) |
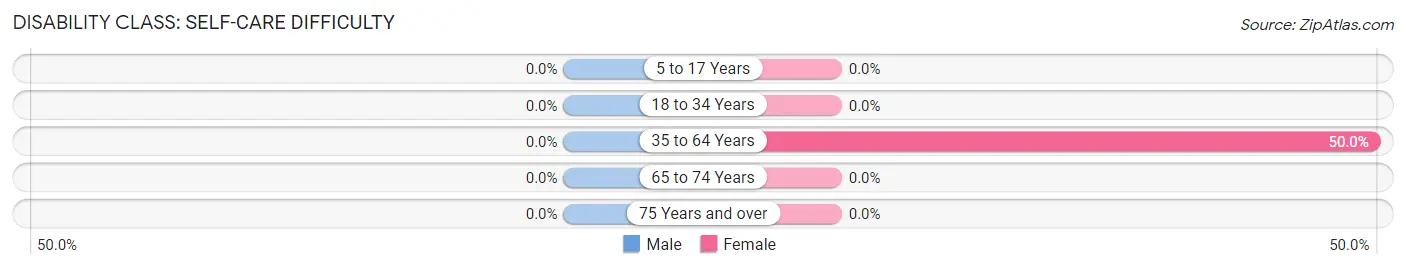
Disability Class: Self-Care Difficulty
| Age Bracket | Male | Female |
| 5 to 17 Years | 0 (0.0%) | 0 (0.0%) |
| 18 to 34 Years | 0 (0.0%) | 0 (0.0%) |
| 35 to 64 Years | 0 (0.0%) | 2 (50.0%) |
| 65 to 74 Years | 0 (0.0%) | 0 (0.0%) |
| 75 Years and over | 0 (0.0%) | 0 (0.0%) |
Technology Access in Blanchard
Computing Device Access in Blanchard
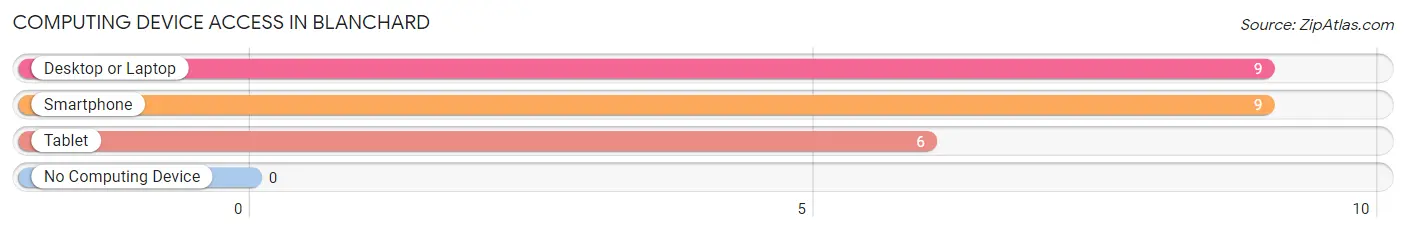
| Device Type | # Households | % Households |
| Desktop or Laptop | 9 | 100.0% |
| Smartphone | 9 | 100.0% |
| Tablet | 6 | 66.7% |
| No Computing Device | 0 | 0.0% |
| Total | 9 | 100.0% |
Internet Access in Blanchard
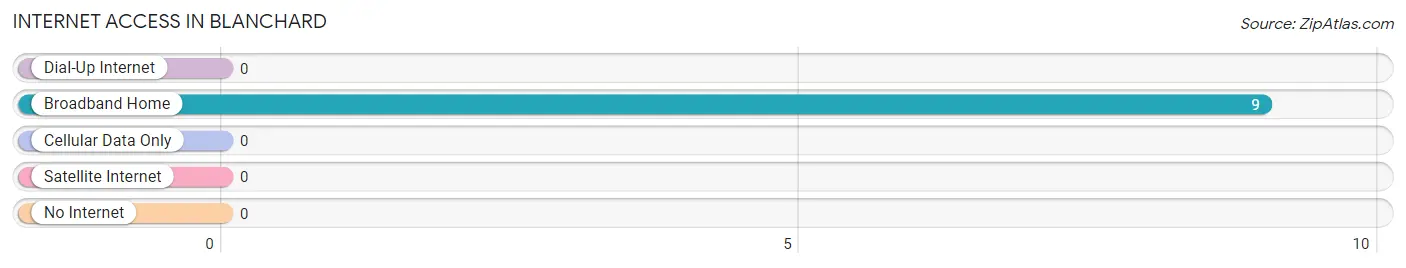
| Internet Type | # Households | % Households |
| Dial-Up Internet | 0 | 0.0% |
| Broadband Home | 9 | 100.0% |
| Cellular Data Only | 0 | 0.0% |
| Satellite Internet | 0 | 0.0% |
| No Internet | 0 | 0.0% |
| Total | 9 | 100.0% |
Blanchard Summary
Blanchard, Iowa is a small town located in the southwestern corner of the state, in the county of Pottawattamie. It is situated on the banks of the Missouri River, and is home to a population of just over 500 people. The town was founded in 1854, and has a rich history of farming, industry, and commerce.
Geographically, Blanchard is located in the Loess Hills region of Iowa, which is characterized by rolling hills and deep ravines. The town is situated on the Missouri River, and is surrounded by a number of small lakes and streams. The area is known for its rich soil, which is ideal for growing crops such as corn, soybeans, and hay.
The economy of Blanchard is largely based on agriculture. The town is home to several large farms, as well as a number of smaller family-owned operations. The town also has a number of businesses, including a grocery store, a hardware store, and a few restaurants. In addition, there are several small manufacturing companies located in the area.
The demographics of Blanchard are largely white, with a small percentage of African Americans and Hispanics. The median household income is around $45,000, and the median home value is around $100,000. The town has a low unemployment rate, and the majority of the population is employed in the agricultural sector.
Blanchard is a small town with a rich history and a strong sense of community. The town is home to a number of churches, and there are several parks and recreational areas in the area. The town is also home to a number of festivals and events throughout the year, including the annual Blanchard Days celebration.
Blanchard is a great place to live and work, and it is a great place to raise a family. The town has a strong sense of community, and the people are friendly and welcoming. The town is a great place to visit, and it is a great place to call home.
Common Questions
What is Per Capita Income in Blanchard?
Per Capita income in Blanchard is $33,865.
What is the Median Family Income in Blanchard?
Median Family Income in Blanchard is $43,750.
What is the Median Household income in Blanchard?
Median Household Income in Blanchard is $43,750.
What is Inequality or Gini Index in Blanchard?
Inequality or Gini Index in Blanchard is 0.12.
What is the Total Population of Blanchard?
Total Population of Blanchard is 34.
What is the Total Male Population of Blanchard?
Total Male Population of Blanchard is 26.
What is the Total Female Population of Blanchard?
Total Female Population of Blanchard is 8.
What is the Ratio of Males per 100 Females in Blanchard?
There are 325.00 Males per 100 Females in Blanchard.
What is the Ratio of Females per 100 Males in Blanchard?
There are 30.77 Females per 100 Males in Blanchard.
What is the Median Population Age in Blanchard?
Median Population Age in Blanchard is 48.9 Years.
What is the Average Family Size in Blanchard
Average Family Size in Blanchard is 3.8 People.
What is the Average Household Size in Blanchard
Average Household Size in Blanchard is 3.8 People.
How Large is the Labor Force in Blanchard?
There are 9 People in the Labor Forcein in Blanchard.
What is the Percentage of People in the Labor Force in Blanchard?
27.3% of People are in the Labor Force in Blanchard.