Badger, IA Map & Demographics
Badger Map
Badger Overview
$33,742
PER CAPITA INCOME
$97,188
AVG FAMILY INCOME
$72,250
AVG HOUSEHOLD INCOME
15.9%
WAGE / INCOME GAP [ % ]
84.1¢/ $1
WAGE / INCOME GAP [ $ ]
0.33
INEQUALITY / GINI INDEX
519
TOTAL POPULATION
241
MALE POPULATION
278
FEMALE POPULATION
86.69
MALES / 100 FEMALES
115.35
FEMALES / 100 MALES
41.5
MEDIAN AGE
3.1
AVG FAMILY SIZE
2.4
AVG HOUSEHOLD SIZE
300
LABOR FORCE [ PEOPLE ]
71.9%
PERCENT IN LABOR FORCE
4.3%
UNEMPLOYMENT RATE
Badger Zip Codes
Badger Area Codes
Income in Badger
Income Overview in Badger
Per Capita Income in Badger is $33,742, while median incomes of families and households are $97,188 and $72,250 respectively.
| Characteristic | Number | Measure |
| Per Capita Income | 519 | $33,742 |
| Median Family Income | 131 | $97,188 |
| Mean Family Income | 131 | $95,319 |
| Median Household Income | 215 | $72,250 |
| Mean Household Income | 215 | $78,765 |
| Income Deficit | 131 | $0 |
| Wage / Income Gap (%) | 519 | 15.85% |
| Wage / Income Gap ($) | 519 | 84.15¢ per $1 |
| Gini / Inequality Index | 519 | 0.33 |
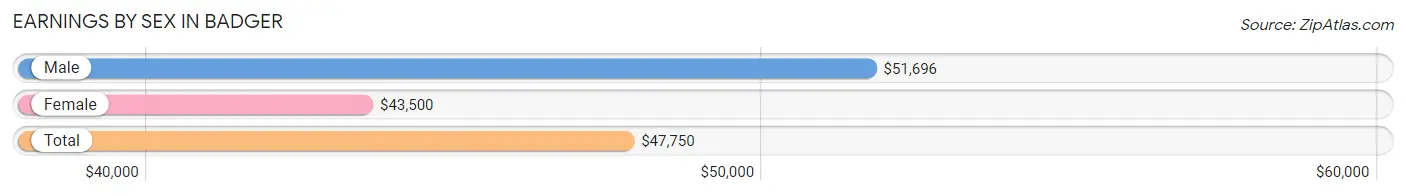
Earnings by Sex in Badger
Average Earnings in Badger are $47,750, $51,696 for men and $43,500 for women, a difference of 15.9%.
| Sex | Number | Average Earnings |
| Male | 163 (49.2%) | $51,696 |
| Female | 168 (50.8%) | $43,500 |
| Total | 331 (100.0%) | $47,750 |
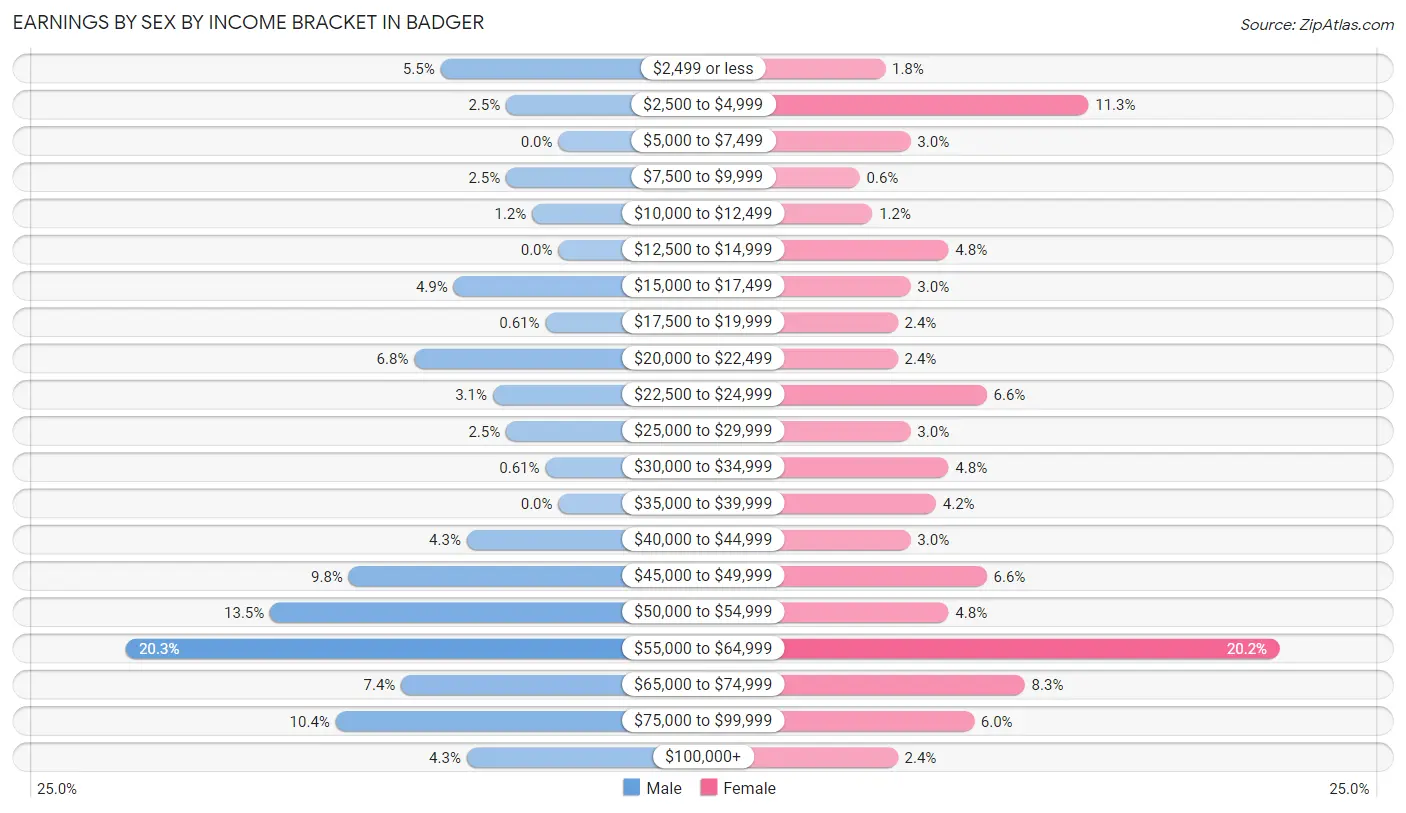
Earnings by Sex by Income Bracket in Badger
The most common earnings brackets in Badger are $55,000 to $64,999 for men (33 | 20.3%) and $55,000 to $64,999 for women (34 | 20.2%).
| Income | Male | Female |
| $2,499 or less | 9 (5.5%) | 3 (1.8%) |
| $2,500 to $4,999 | 4 (2.5%) | 19 (11.3%) |
| $5,000 to $7,499 | 0 (0.0%) | 5 (3.0%) |
| $7,500 to $9,999 | 4 (2.5%) | 1 (0.6%) |
| $10,000 to $12,499 | 2 (1.2%) | 2 (1.2%) |
| $12,500 to $14,999 | 0 (0.0%) | 8 (4.8%) |
| $15,000 to $17,499 | 8 (4.9%) | 5 (3.0%) |
| $17,500 to $19,999 | 1 (0.6%) | 4 (2.4%) |
| $20,000 to $22,499 | 11 (6.8%) | 4 (2.4%) |
| $22,500 to $24,999 | 5 (3.1%) | 11 (6.6%) |
| $25,000 to $29,999 | 4 (2.5%) | 5 (3.0%) |
| $30,000 to $34,999 | 1 (0.6%) | 8 (4.8%) |
| $35,000 to $39,999 | 0 (0.0%) | 7 (4.2%) |
| $40,000 to $44,999 | 7 (4.3%) | 5 (3.0%) |
| $45,000 to $49,999 | 16 (9.8%) | 11 (6.6%) |
| $50,000 to $54,999 | 22 (13.5%) | 8 (4.8%) |
| $55,000 to $64,999 | 33 (20.3%) | 34 (20.2%) |
| $65,000 to $74,999 | 12 (7.4%) | 14 (8.3%) |
| $75,000 to $99,999 | 17 (10.4%) | 10 (5.9%) |
| $100,000+ | 7 (4.3%) | 4 (2.4%) |
| Total | 163 (100.0%) | 168 (100.0%) |
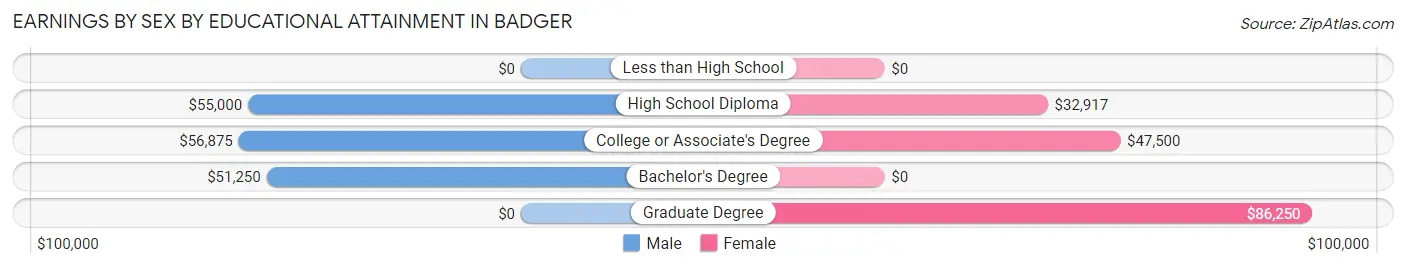
Earnings by Sex by Educational Attainment in Badger
Average earnings in Badger are $53,906 for men and $39,063 for women, a difference of 27.5%. Men with an educational attainment of college or associate's degree enjoy the highest average annual earnings of $56,875, while those with bachelor's degree education earn the least with $51,250. Women with an educational attainment of graduate degree earn the most with the average annual earnings of $86,250, while those with high school diploma education have the smallest earnings of $32,917.
| Educational Attainment | Male Income | Female Income |
| Less than High School | - | - |
| High School Diploma | $55,000 | $32,917 |
| College or Associate's Degree | $56,875 | $47,500 |
| Bachelor's Degree | $51,250 | $0 |
| Graduate Degree | - | - |
| Total | $53,906 | $39,063 |
Family Income in Badger
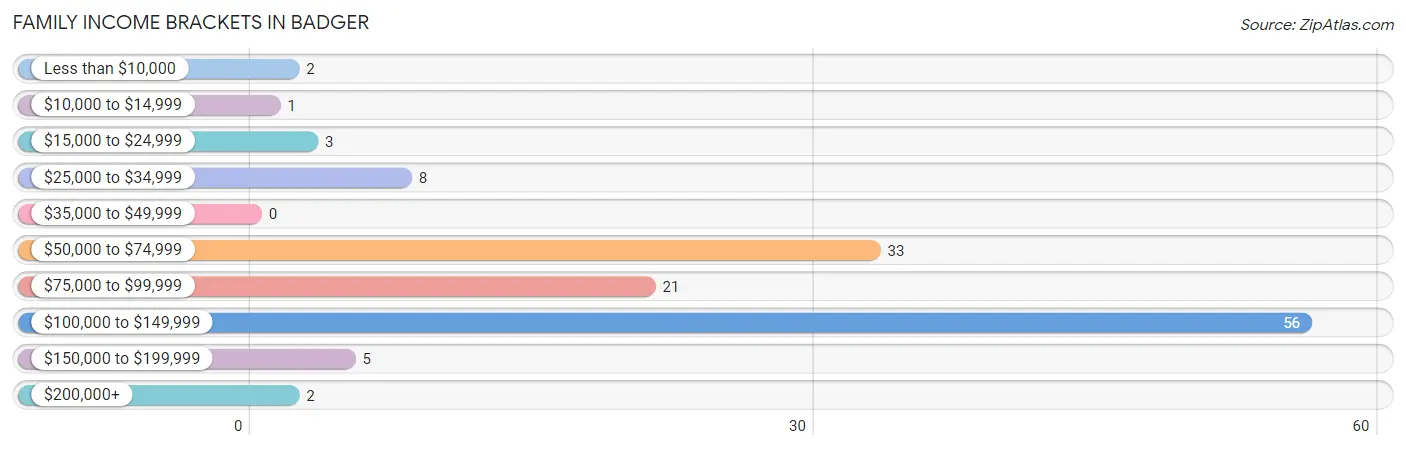
Family Income Brackets in Badger
According to the Badger family income data, there are 56 families falling into the $100,000 to $149,999 income range, which is the most common income bracket and makes up 42.7% of all families.
| Income Bracket | # Families | % Families |
| Less than $10,000 | 2 | 1.5% |
| $10,000 to $14,999 | 1 | 0.8% |
| $15,000 to $24,999 | 3 | 2.3% |
| $25,000 to $34,999 | 8 | 6.1% |
| $35,000 to $49,999 | 0 | 0.0% |
| $50,000 to $74,999 | 33 | 25.2% |
| $75,000 to $99,999 | 21 | 16.0% |
| $100,000 to $149,999 | 56 | 42.7% |
| $150,000 to $199,999 | 5 | 3.8% |
| $200,000+ | 2 | 1.5% |
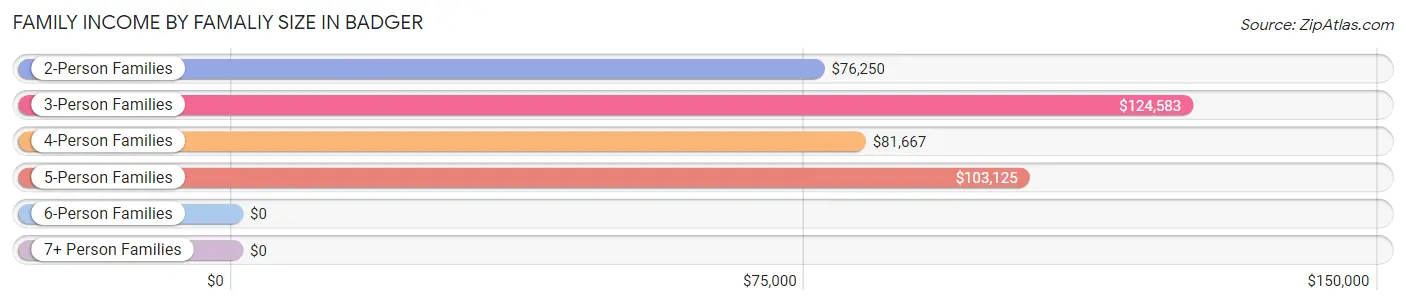
Family Income by Famaliy Size in Badger
3-person families (25 | 19.1%) account for the highest median family income in Badger with $124,583 per family, while 3-person families (25 | 19.1%) have the highest median income of $41,528 per family member.
| Income Bracket | # Families | Median Income |
| 2-Person Families | 66 (50.4%) | $76,250 |
| 3-Person Families | 25 (19.1%) | $124,583 |
| 4-Person Families | 28 (21.4%) | $81,667 |
| 5-Person Families | 7 (5.3%) | $103,125 |
| 6-Person Families | 2 (1.5%) | $0 |
| 7+ Person Families | 3 (2.3%) | $0 |
| Total | 131 (100.0%) | $97,188 |
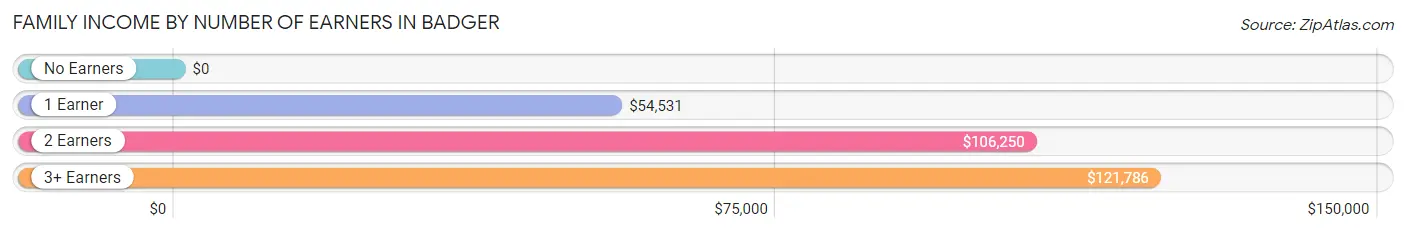
Family Income by Number of Earners in Badger
| Number of Earners | # Families | Median Income |
| No Earners | 6 (4.6%) | $0 |
| 1 Earner | 33 (25.2%) | $54,531 |
| 2 Earners | 68 (51.9%) | $106,250 |
| 3+ Earners | 24 (18.3%) | $121,786 |
| Total | 131 (100.0%) | $97,188 |
Household Income in Badger
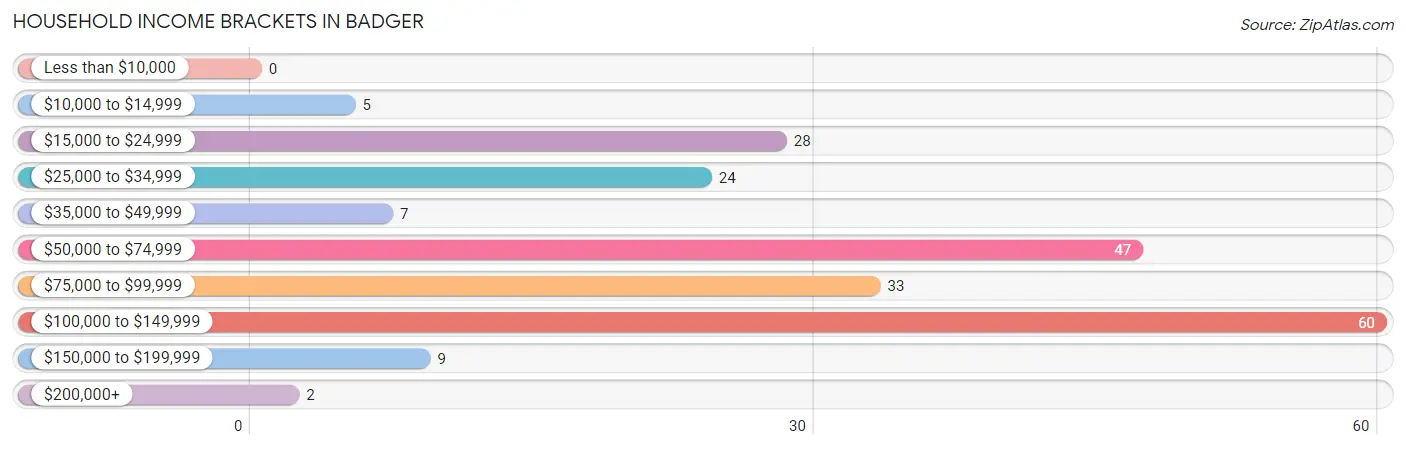
Household Income Brackets in Badger
With 60 households falling in the category, the $100,000 to $149,999 income range is the most frequent in Badger, accounting for 27.9% of all households.
| Income Bracket | # Households | % Households |
| Less than $10,000 | 0 | 0.0% |
| $10,000 to $14,999 | 5 | 2.3% |
| $15,000 to $24,999 | 28 | 13.0% |
| $25,000 to $34,999 | 24 | 11.2% |
| $35,000 to $49,999 | 7 | 3.3% |
| $50,000 to $74,999 | 47 | 21.9% |
| $75,000 to $99,999 | 33 | 15.3% |
| $100,000 to $149,999 | 60 | 27.9% |
| $150,000 to $199,999 | 9 | 4.2% |
| $200,000+ | 2 | 0.9% |
Household Income by Householder Age in Badger
The median household income in Badger is $72,250, with the highest median household income of $102,083 found in the 25 to 44 years age bracket for the primary householder. A total of 65 households (30.2%) fall into this category. Meanwhile, the 15 to 24 years age bracket for the primary householder has the lowest median household income of $0, with 2 households (0.9%) in this group.
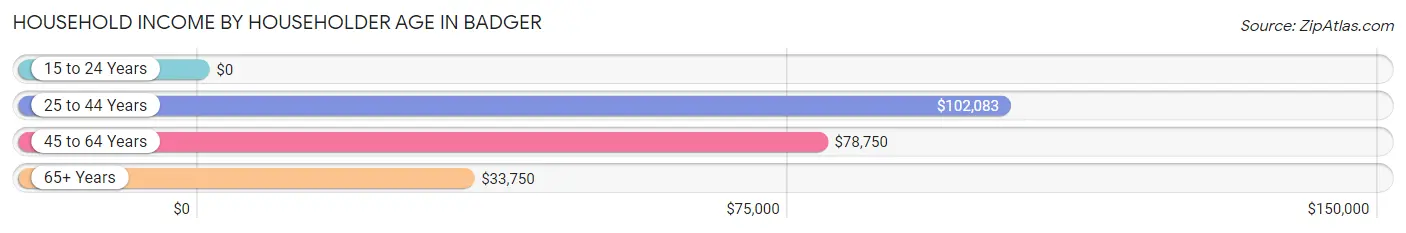
| Income Bracket | # Households | Median Income |
| 15 to 24 Years | 2 (0.9%) | $0 |
| 25 to 44 Years | 65 (30.2%) | $102,083 |
| 45 to 64 Years | 80 (37.2%) | $78,750 |
| 65+ Years | 68 (31.6%) | $33,750 |
| Total | 215 (100.0%) | $72,250 |
Poverty in Badger
Income Below Poverty by Sex and Age in Badger
With 3.7% poverty level for males and 5.4% for females among the residents of Badger, under 5 year old males and 15 year old females are the most vulnerable to poverty, with 2 males (15.4%) and 2 females (40.0%) in their respective age groups living below the poverty level.
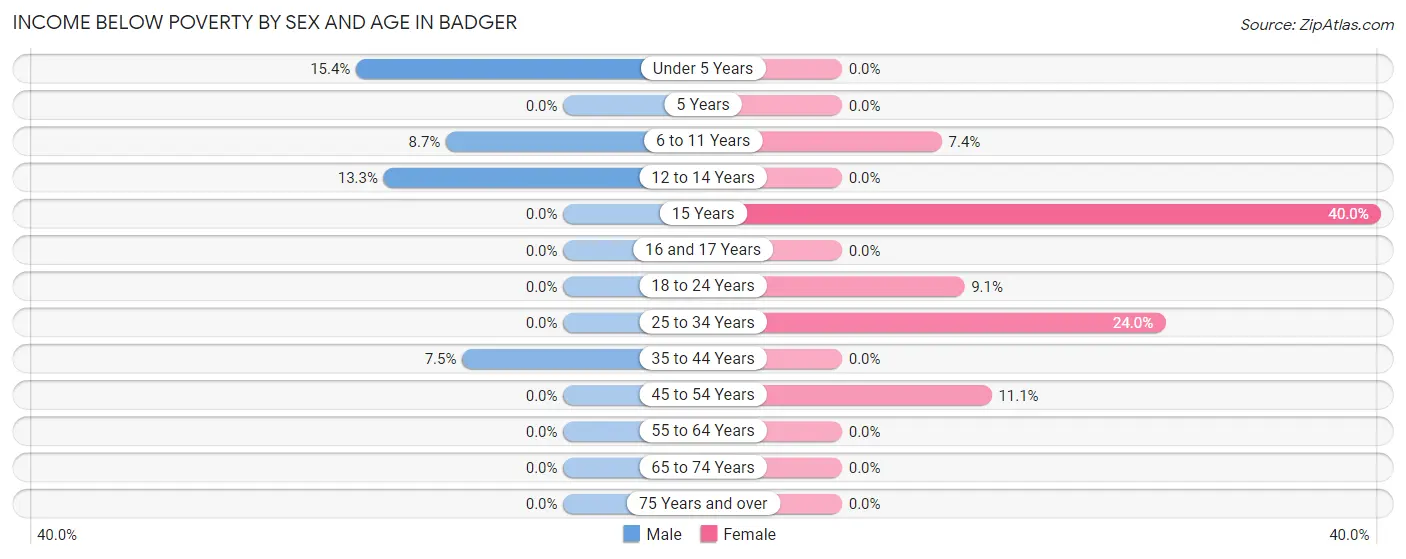
| Age Bracket | Male | Female |
| Under 5 Years | 2 (15.4%) | 0 (0.0%) |
| 5 Years | 0 (0.0%) | 0 (0.0%) |
| 6 to 11 Years | 2 (8.7%) | 2 (7.4%) |
| 12 to 14 Years | 2 (13.3%) | 0 (0.0%) |
| 15 Years | 0 (0.0%) | 2 (40.0%) |
| 16 and 17 Years | 0 (0.0%) | 0 (0.0%) |
| 18 to 24 Years | 0 (0.0%) | 2 (9.1%) |
| 25 to 34 Years | 0 (0.0%) | 6 (24.0%) |
| 35 to 44 Years | 3 (7.5%) | 0 (0.0%) |
| 45 to 54 Years | 0 (0.0%) | 3 (11.1%) |
| 55 to 64 Years | 0 (0.0%) | 0 (0.0%) |
| 65 to 74 Years | 0 (0.0%) | 0 (0.0%) |
| 75 Years and over | 0 (0.0%) | 0 (0.0%) |
| Total | 9 (3.7%) | 15 (5.4%) |
Income Above Poverty by Sex and Age in Badger
According to the poverty statistics in Badger, males aged 5 years and females aged under 5 years are the age groups that are most secure financially, with 100.0% of males and 100.0% of females in these age groups living above the poverty line.
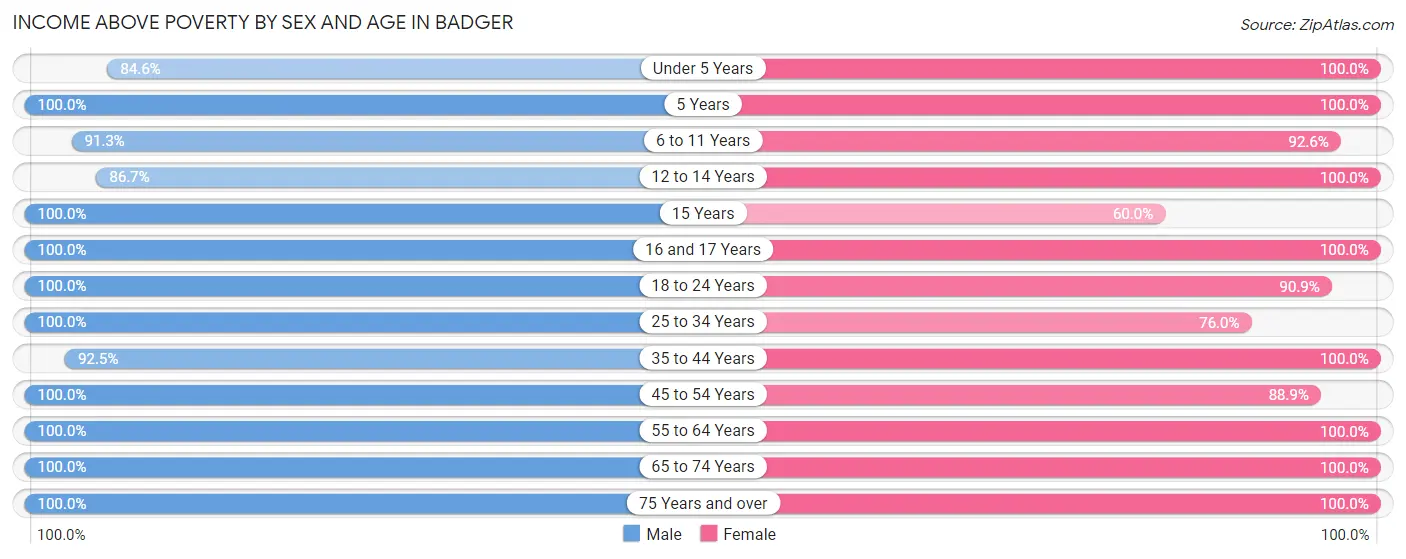
| Age Bracket | Male | Female |
| Under 5 Years | 11 (84.6%) | 8 (100.0%) |
| 5 Years | 1 (100.0%) | 4 (100.0%) |
| 6 to 11 Years | 21 (91.3%) | 25 (92.6%) |
| 12 to 14 Years | 13 (86.7%) | 2 (100.0%) |
| 15 Years | 4 (100.0%) | 3 (60.0%) |
| 16 and 17 Years | 7 (100.0%) | 14 (100.0%) |
| 18 to 24 Years | 11 (100.0%) | 20 (90.9%) |
| 25 to 34 Years | 31 (100.0%) | 19 (76.0%) |
| 35 to 44 Years | 37 (92.5%) | 41 (100.0%) |
| 45 to 54 Years | 27 (100.0%) | 24 (88.9%) |
| 55 to 64 Years | 42 (100.0%) | 39 (100.0%) |
| 65 to 74 Years | 21 (100.0%) | 45 (100.0%) |
| 75 Years and over | 6 (100.0%) | 19 (100.0%) |
| Total | 232 (96.3%) | 263 (94.6%) |
Income Below Poverty Among Married-Couple Families in Badger
The poverty statistics for married-couple families in Badger show that 1.0% or 1 of the total 104 families live below the poverty line. Families with 3 or 4 children have the highest poverty rate of 10.0%, comprising of 1 families. On the other hand, families with no children have the lowest poverty rate of 0.0%, which includes 0 families.
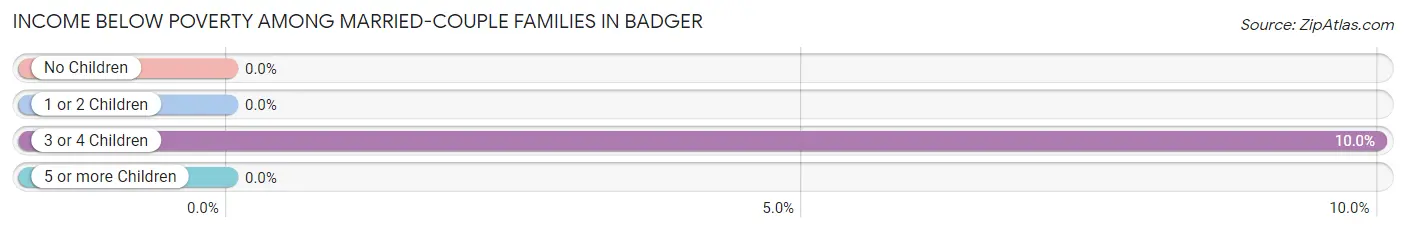
| Children | Above Poverty | Below Poverty |
| No Children | 62 (100.0%) | 0 (0.0%) |
| 1 or 2 Children | 32 (100.0%) | 0 (0.0%) |
| 3 or 4 Children | 9 (90.0%) | 1 (10.0%) |
| 5 or more Children | 0 (0.0%) | 0 (0.0%) |
| Total | 103 (99.0%) | 1 (1.0%) |
Income Below Poverty Among Single-Parent Households in Badger
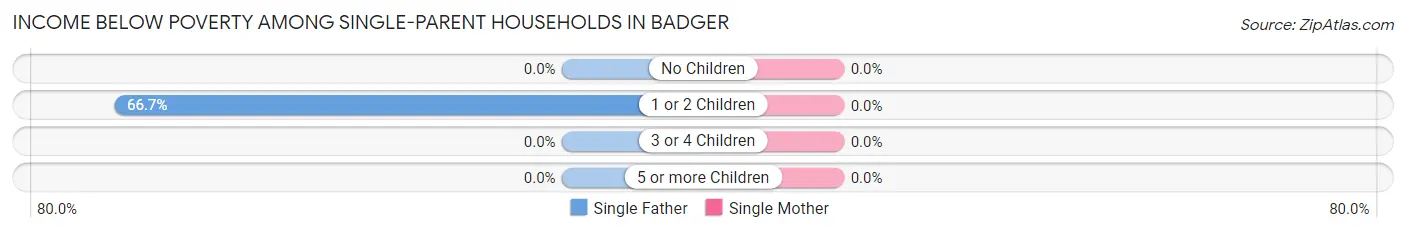
| Children | Single Father | Single Mother |
| No Children | 0 (0.0%) | 0 (0.0%) |
| 1 or 2 Children | 2 (66.7%) | 0 (0.0%) |
| 3 or 4 Children | 0 (0.0%) | 0 (0.0%) |
| 5 or more Children | 0 (0.0%) | 0 (0.0%) |
| Total | 2 (25.0%) | 0 (0.0%) |
Income Below Poverty Among Married-Couple vs Single-Parent Households in Badger
The poverty data for Badger shows that 1 of the married-couple family households (1.0%) and 2 of the single-parent households (7.4%) are living below the poverty level. Within the married-couple family households, those with 3 or 4 children have the highest poverty rate, with 1 households (10.0%) falling below the poverty line. Among the single-parent households, those with 1 or 2 children have the highest poverty rate, with 2 household (12.5%) living below poverty.
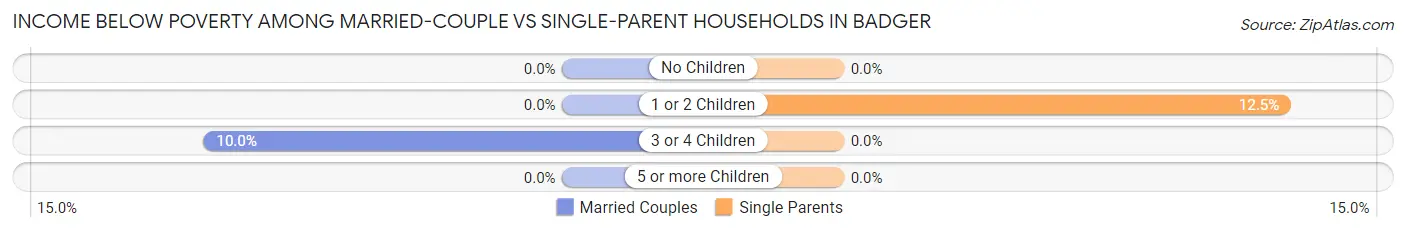
| Children | Married-Couple Families | Single-Parent Households |
| No Children | 0 (0.0%) | 0 (0.0%) |
| 1 or 2 Children | 0 (0.0%) | 2 (12.5%) |
| 3 or 4 Children | 1 (10.0%) | 0 (0.0%) |
| 5 or more Children | 0 (0.0%) | 0 (0.0%) |
| Total | 1 (1.0%) | 2 (7.4%) |
Race in Badger
The most populous races in Badger are White / Caucasian (510 | 98.3%), Hispanic or Latino (25 | 4.8%), and Asian (5 | 1.0%).
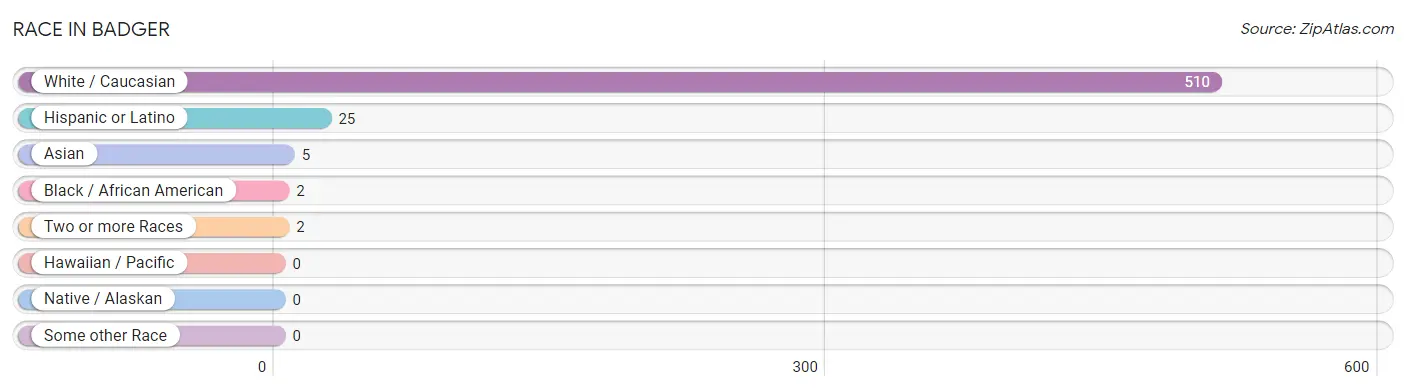
| Race | # Population | % Population |
| Asian | 5 | 1.0% |
| Black / African American | 2 | 0.4% |
| Hawaiian / Pacific | 0 | 0.0% |
| Hispanic or Latino | 25 | 4.8% |
| Native / Alaskan | 0 | 0.0% |
| White / Caucasian | 510 | 98.3% |
| Two or more Races | 2 | 0.4% |
| Some other Race | 0 | 0.0% |
| Total | 519 | 100.0% |
Ancestry in Badger
The most populous ancestries reported in Badger are German (168 | 32.4%), English (78 | 15.0%), Irish (49 | 9.4%), Norwegian (49 | 9.4%), and Dutch (26 | 5.0%), together accounting for 71.3% of all Badger residents.
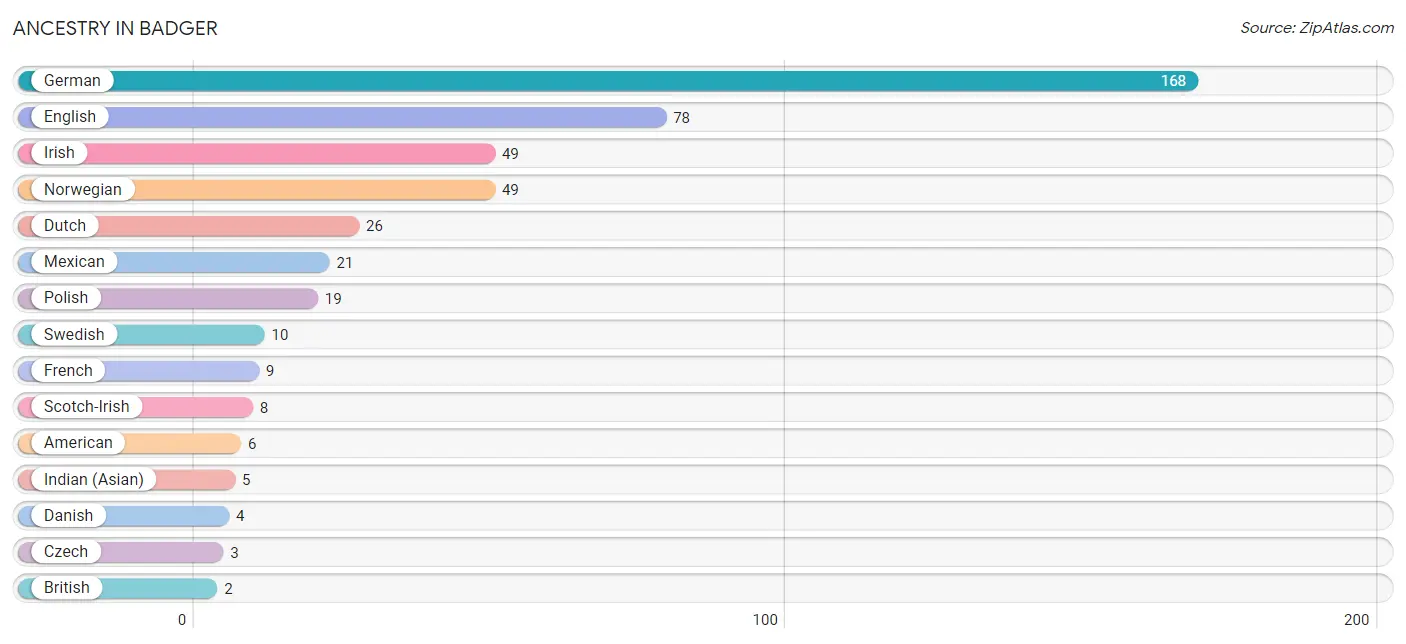
| Ancestry | # Population | % Population |
| American | 6 | 1.2% |
| British | 2 | 0.4% |
| Czech | 3 | 0.6% |
| Danish | 4 | 0.8% |
| Dutch | 26 | 5.0% |
| Eastern European | 2 | 0.4% |
| English | 78 | 15.0% |
| European | 2 | 0.4% |
| French | 9 | 1.7% |
| German | 168 | 32.4% |
| Hungarian | 2 | 0.4% |
| Indian (Asian) | 5 | 1.0% |
| Irish | 49 | 9.4% |
| Italian | 2 | 0.4% |
| Mexican | 21 | 4.1% |
| Norwegian | 49 | 9.4% |
| Polish | 19 | 3.7% |
| Scandinavian | 2 | 0.4% |
| Scotch-Irish | 8 | 1.5% |
| Swedish | 10 | 1.9% | View All 20 Rows |
Immigrants in Badger
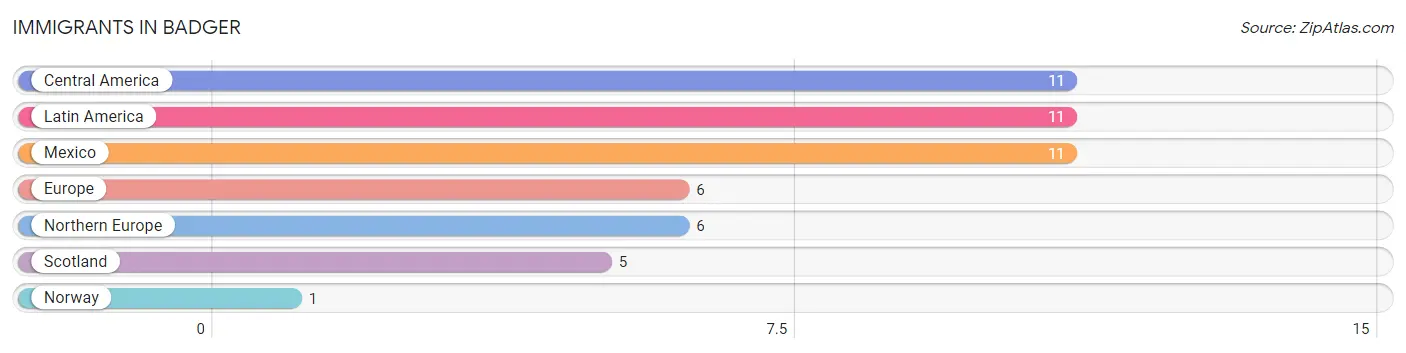
The most numerous immigrant groups reported in Badger came from Central America (11 | 2.1%), Latin America (11 | 2.1%), Mexico (11 | 2.1%), Europe (6 | 1.2%), and Northern Europe (6 | 1.2%), together accounting for 8.7% of all Badger residents.
| Immigration Origin | # Population | % Population |
| Central America | 11 | 2.1% |
| Europe | 6 | 1.2% |
| Latin America | 11 | 2.1% |
| Mexico | 11 | 2.1% |
| Northern Europe | 6 | 1.2% |
| Norway | 1 | 0.2% |
| Scotland | 5 | 1.0% | View All 7 Rows |
Sex and Age in Badger
Sex and Age in Badger
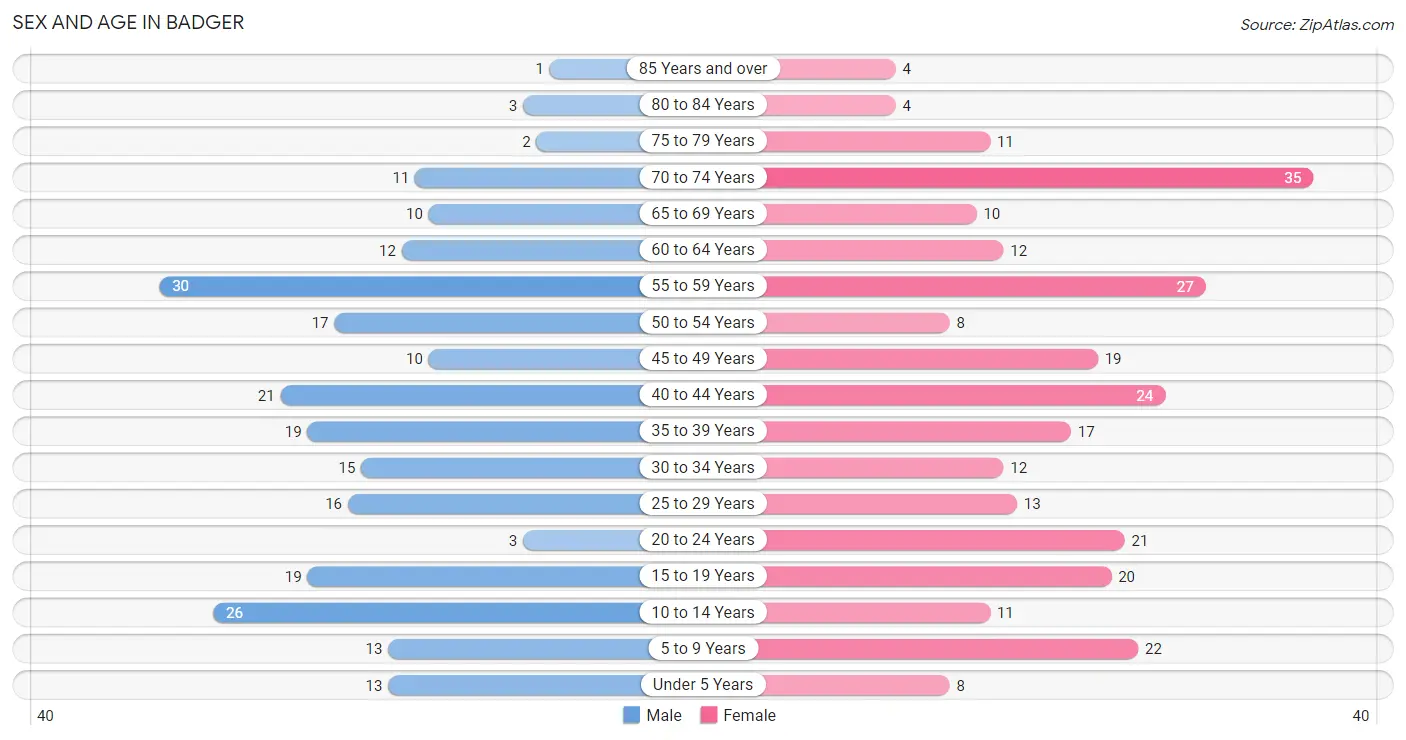
The most populous age groups in Badger are 55 to 59 Years (30 | 12.4%) for men and 70 to 74 Years (35 | 12.6%) for women.
| Age Bracket | Male | Female |
| Under 5 Years | 13 (5.4%) | 8 (2.9%) |
| 5 to 9 Years | 13 (5.4%) | 22 (7.9%) |
| 10 to 14 Years | 26 (10.8%) | 11 (4.0%) |
| 15 to 19 Years | 19 (7.9%) | 20 (7.2%) |
| 20 to 24 Years | 3 (1.2%) | 21 (7.5%) |
| 25 to 29 Years | 16 (6.6%) | 13 (4.7%) |
| 30 to 34 Years | 15 (6.2%) | 12 (4.3%) |
| 35 to 39 Years | 19 (7.9%) | 17 (6.1%) |
| 40 to 44 Years | 21 (8.7%) | 24 (8.6%) |
| 45 to 49 Years | 10 (4.2%) | 19 (6.8%) |
| 50 to 54 Years | 17 (7.0%) | 8 (2.9%) |
| 55 to 59 Years | 30 (12.4%) | 27 (9.7%) |
| 60 to 64 Years | 12 (5.0%) | 12 (4.3%) |
| 65 to 69 Years | 10 (4.2%) | 10 (3.6%) |
| 70 to 74 Years | 11 (4.6%) | 35 (12.6%) |
| 75 to 79 Years | 2 (0.8%) | 11 (4.0%) |
| 80 to 84 Years | 3 (1.2%) | 4 (1.4%) |
| 85 Years and over | 1 (0.4%) | 4 (1.4%) |
| Total | 241 (100.0%) | 278 (100.0%) |
Families and Households in Badger
Median Family Size in Badger
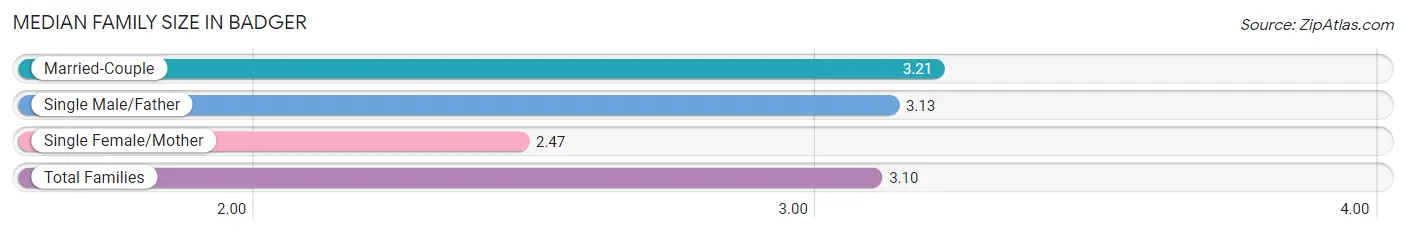
The median family size in Badger is 3.10 persons per family, with married-couple families (104 | 79.4%) accounting for the largest median family size of 3.21 persons per family. On the other hand, single female/mother families (19 | 14.5%) represent the smallest median family size with 2.47 persons per family.
| Family Type | # Families | Family Size |
| Married-Couple | 104 (79.4%) | 3.21 |
| Single Male/Father | 8 (6.1%) | 3.13 |
| Single Female/Mother | 19 (14.5%) | 2.47 |
| Total Families | 131 (100.0%) | 3.10 |
Median Household Size in Badger
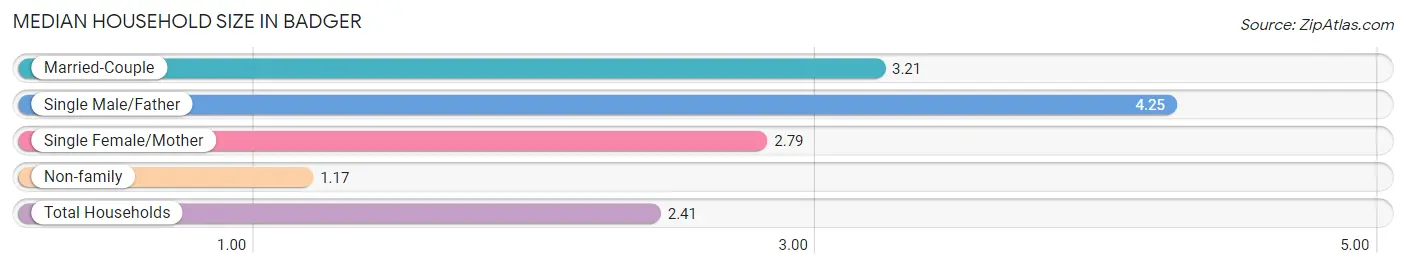
The median household size in Badger is 2.41 persons per household, with single male/father households (8 | 3.7%) accounting for the largest median household size of 4.25 persons per household. non-family households (84 | 39.1%) represent the smallest median household size with 1.17 persons per household.
| Household Type | # Households | Household Size |
| Married-Couple | 104 (48.4%) | 3.21 |
| Single Male/Father | 8 (3.7%) | 4.25 |
| Single Female/Mother | 19 (8.8%) | 2.79 |
| Non-family | 84 (39.1%) | 1.17 |
| Total Households | 215 (100.0%) | 2.41 |
Household Size by Marriage Status in Badger
Out of a total of 215 households in Badger, 131 (60.9%) are family households, while 84 (39.1%) are nonfamily households. The most numerous type of family households are 2-person households, comprising 56, and the most common type of nonfamily households are 1-person households, comprising 65.
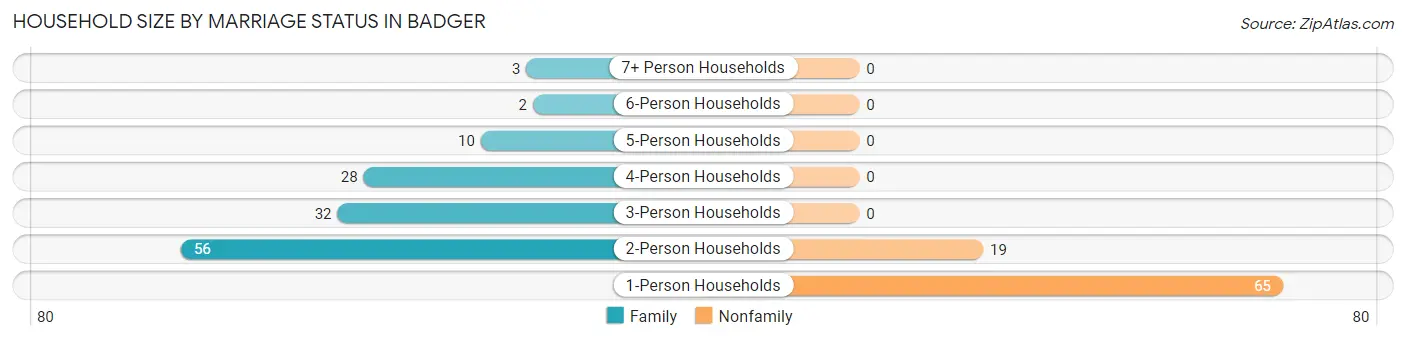
| Household Size | Family Households | Nonfamily Households |
| 1-Person Households | - | 65 (30.2%) |
| 2-Person Households | 56 (26.1%) | 19 (8.8%) |
| 3-Person Households | 32 (14.9%) | 0 (0.0%) |
| 4-Person Households | 28 (13.0%) | 0 (0.0%) |
| 5-Person Households | 10 (4.6%) | 0 (0.0%) |
| 6-Person Households | 2 (0.9%) | 0 (0.0%) |
| 7+ Person Households | 3 (1.4%) | 0 (0.0%) |
| Total | 131 (60.9%) | 84 (39.1%) |
Female Fertility in Badger
Fertility by Age in Badger
Average fertility rate in Badger is 24.0 births per 1,000 women. Women in the age bracket of 20 to 34 years have the highest fertility rate with 65.0 births per 1,000 women. Women in the age bracket of 20 to 34 years acount for 100.0% of all women with births.
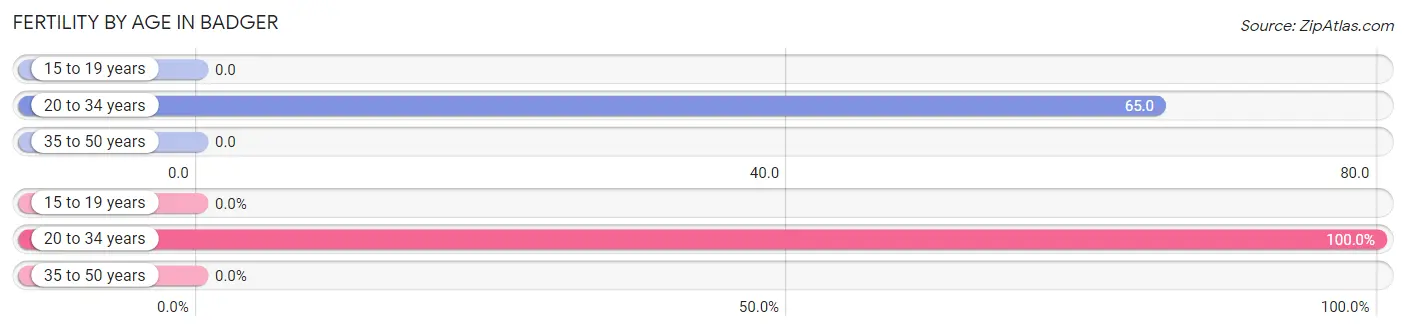
| Age Bracket | Women with Births | Births / 1,000 Women |
| 15 to 19 years | 0 (0.0%) | 0.0 |
| 20 to 34 years | 3 (100.0%) | 65.0 |
| 35 to 50 years | 0 (0.0%) | 0.0 |
| Total | 3 (100.0%) | 24.0 |
Fertility by Age by Marriage Status in Badger
66.7% of women with births (3) in Badger are married. The highest percentage of unmarried women with births falls into 20 to 34 years age bracket with 33.3% of them unmarried at the time of birth, while the lowest percentage of unmarried women with births belong to 20 to 34 years age bracket with 33.3% of them unmarried.
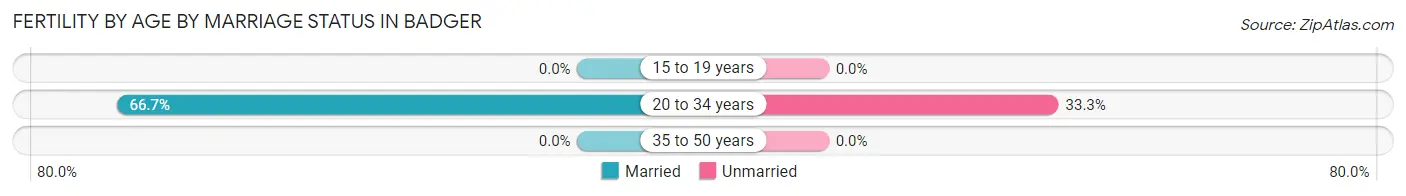
| Age Bracket | Married | Unmarried |
| 15 to 19 years | 0 (0.0%) | 0 (0.0%) |
| 20 to 34 years | 2 (66.7%) | 1 (33.3%) |
| 35 to 50 years | 0 (0.0%) | 0 (0.0%) |
| Total | 2 (66.7%) | 1 (33.3%) |
Fertility by Education in Badger
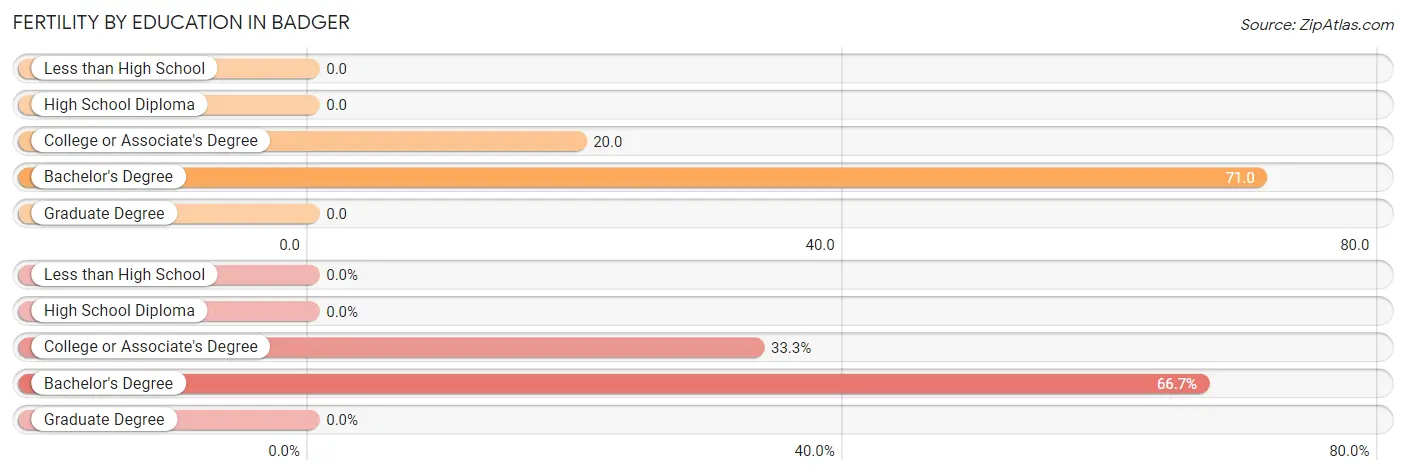
| Educational Attainment | Women with Births | Births / 1,000 Women |
| Less than High School | 0 (0.0%) | 0.0 |
| High School Diploma | 0 (0.0%) | 0.0 |
| College or Associate's Degree | 1 (33.3%) | 20.0 |
| Bachelor's Degree | 2 (66.7%) | 71.0 |
| Graduate Degree | 0 (0.0%) | 0.0 |
| Total | 3 (100.0%) | 24.0 |
Fertility by Education by Marriage Status in Badger
33.3% of women with births in Badger are unmarried. Women with the educational attainment of bachelor's degree are most likely to be married with 100.0% of them married at childbirth, while women with the educational attainment of college or associate's degree are least likely to be married with 100.0% of them unmarried at childbirth.
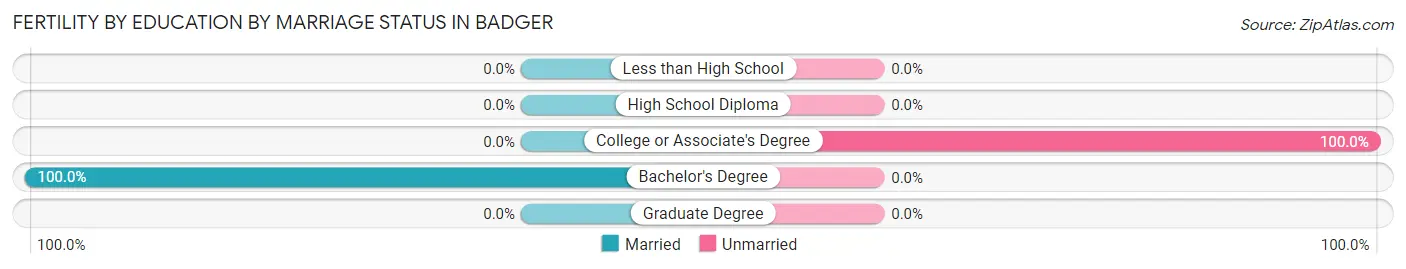
| Educational Attainment | Married | Unmarried |
| Less than High School | 0 (0.0%) | 0 (0.0%) |
| High School Diploma | 0 (0.0%) | 0 (0.0%) |
| College or Associate's Degree | 0 (0.0%) | 1 (100.0%) |
| Bachelor's Degree | 2 (100.0%) | 0 (0.0%) |
| Graduate Degree | 0 (0.0%) | 0 (0.0%) |
| Total | 2 (66.7%) | 1 (33.3%) |
Employment Characteristics in Badger
Employment by Class of Employer in Badger
Among the 283 employed individuals in Badger, private company employees (192 | 67.8%), not-for-profit organizations (28 | 9.9%), and local government employees (27 | 9.5%) make up the most common classes of employment.
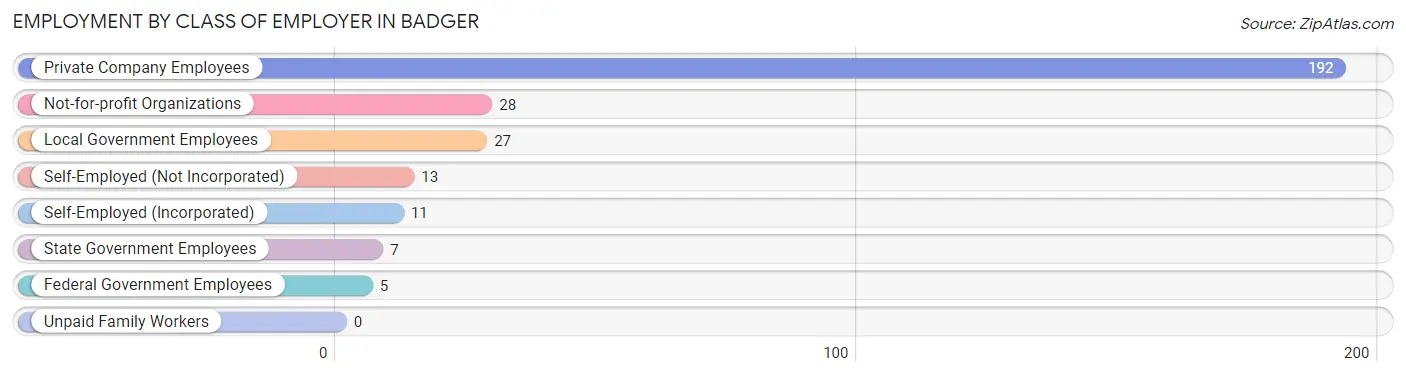
| Employer Class | # Employees | % Employees |
| Private Company Employees | 192 | 67.8% |
| Self-Employed (Incorporated) | 11 | 3.9% |
| Self-Employed (Not Incorporated) | 13 | 4.6% |
| Not-for-profit Organizations | 28 | 9.9% |
| Local Government Employees | 27 | 9.5% |
| State Government Employees | 7 | 2.5% |
| Federal Government Employees | 5 | 1.8% |
| Unpaid Family Workers | 0 | 0.0% |
| Total | 283 | 100.0% |
Employment Status by Age in Badger
According to the labor force statistics for Badger, out of the total population over 16 years of age (417), 71.9% or 300 individuals are in the labor force, with 4.3% or 13 of them unemployed. The age group with the highest labor force participation rate is 20 to 24 years, with 100.0% or 24 individuals in the labor force. Within the labor force, the 75 years and over age range has the highest percentage of unemployed individuals, with 33.3% or 2 of them being unemployed.
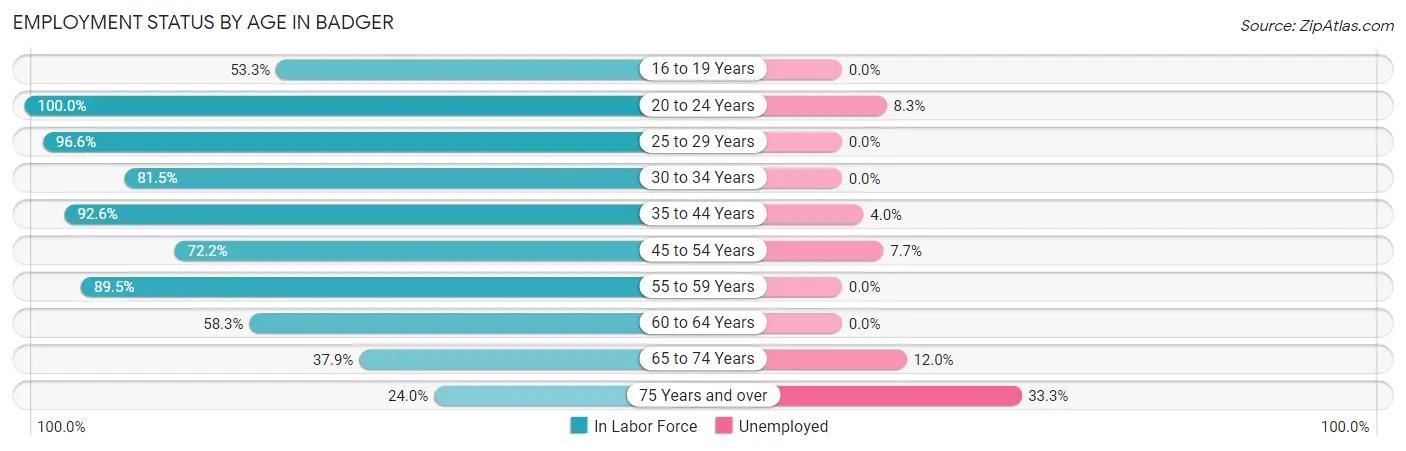
| Age Bracket | In Labor Force | Unemployed |
| 16 to 19 Years | 16 (53.3%) | 0 (0.0%) |
| 20 to 24 Years | 24 (100.0%) | 2 (8.3%) |
| 25 to 29 Years | 28 (96.6%) | 0 (0.0%) |
| 30 to 34 Years | 22 (81.5%) | 0 (0.0%) |
| 35 to 44 Years | 75 (92.6%) | 3 (4.0%) |
| 45 to 54 Years | 39 (72.2%) | 3 (7.7%) |
| 55 to 59 Years | 51 (89.5%) | 0 (0.0%) |
| 60 to 64 Years | 14 (58.3%) | 0 (0.0%) |
| 65 to 74 Years | 25 (37.9%) | 3 (12.0%) |
| 75 Years and over | 6 (24.0%) | 2 (33.3%) |
| Total | 300 (71.9%) | 13 (4.3%) |
Employment Status by Educational Attainment in Badger
According to labor force statistics for Badger, 84.2% of individuals (229) out of the total population between 25 and 64 years of age (272) are in the labor force, with 2.6% or 6 of them being unemployed. The group with the highest labor force participation rate are those with the educational attainment of bachelor's degree or higher, with 93.7% or 59 individuals in the labor force. Within the labor force, individuals with bachelor's degree or higher education have the highest percentage of unemployment, with 5.1% or 3 of them being unemployed.
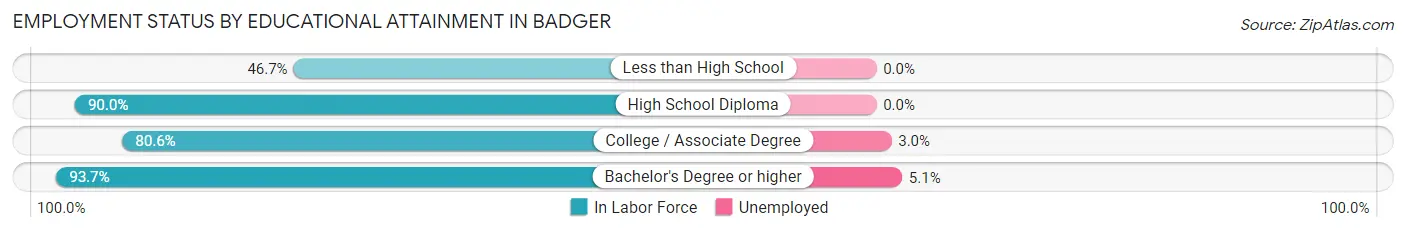
| Educational Attainment | In Labor Force | Unemployed |
| Less than High School | 7 (46.7%) | 0 (0.0%) |
| High School Diploma | 63 (90.0%) | 0 (0.0%) |
| College / Associate Degree | 100 (80.6%) | 4 (3.0%) |
| Bachelor's Degree or higher | 59 (93.7%) | 3 (5.1%) |
| Total | 229 (84.2%) | 7 (2.6%) |
Employment Occupations by Sex in Badger
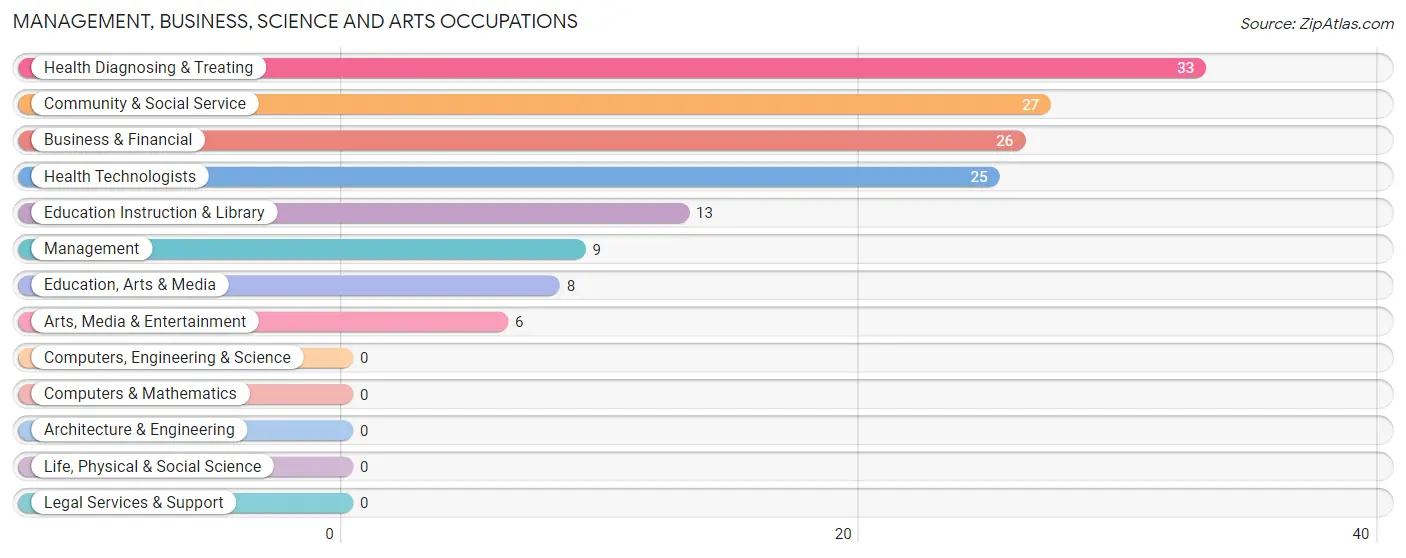
Management, Business, Science and Arts Occupations
The most common Management, Business, Science and Arts occupations in Badger are Health Diagnosing & Treating (33 | 11.5%), Community & Social Service (27 | 9.4%), Business & Financial (26 | 9.1%), Health Technologists (25 | 8.7%), and Education Instruction & Library (13 | 4.5%).
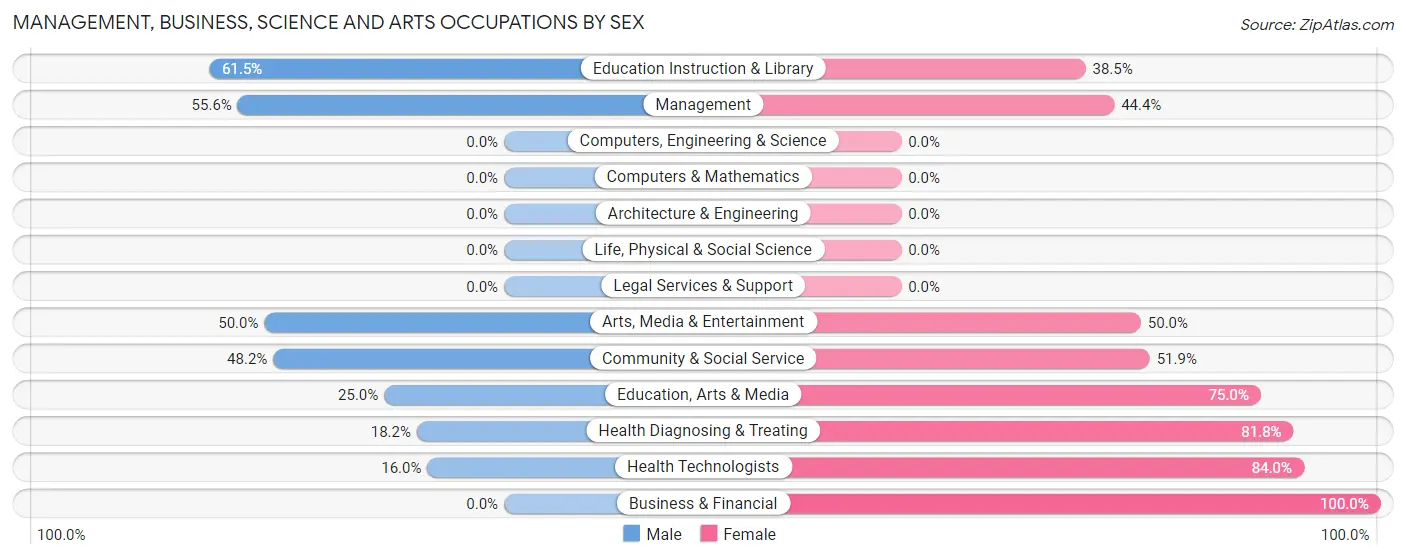
Management, Business, Science and Arts Occupations by Sex
Within the Management, Business, Science and Arts occupations in Badger, the most male-oriented occupations are Education Instruction & Library (61.5%), Management (55.6%), and Arts, Media & Entertainment (50.0%), while the most female-oriented occupations are Business & Financial (100.0%), Health Technologists (84.0%), and Health Diagnosing & Treating (81.8%).
| Occupation | Male | Female |
| Management | 5 (55.6%) | 4 (44.4%) |
| Business & Financial | 0 (0.0%) | 26 (100.0%) |
| Computers, Engineering & Science | 0 (0.0%) | 0 (0.0%) |
| Computers & Mathematics | 0 (0.0%) | 0 (0.0%) |
| Architecture & Engineering | 0 (0.0%) | 0 (0.0%) |
| Life, Physical & Social Science | 0 (0.0%) | 0 (0.0%) |
| Community & Social Service | 13 (48.1%) | 14 (51.8%) |
| Education, Arts & Media | 2 (25.0%) | 6 (75.0%) |
| Legal Services & Support | 0 (0.0%) | 0 (0.0%) |
| Education Instruction & Library | 8 (61.5%) | 5 (38.5%) |
| Arts, Media & Entertainment | 3 (50.0%) | 3 (50.0%) |
| Health Diagnosing & Treating | 6 (18.2%) | 27 (81.8%) |
| Health Technologists | 4 (16.0%) | 21 (84.0%) |
| Total (Category) | 24 (25.3%) | 71 (74.7%) |
| Total (Overall) | 154 (53.7%) | 133 (46.3%) |
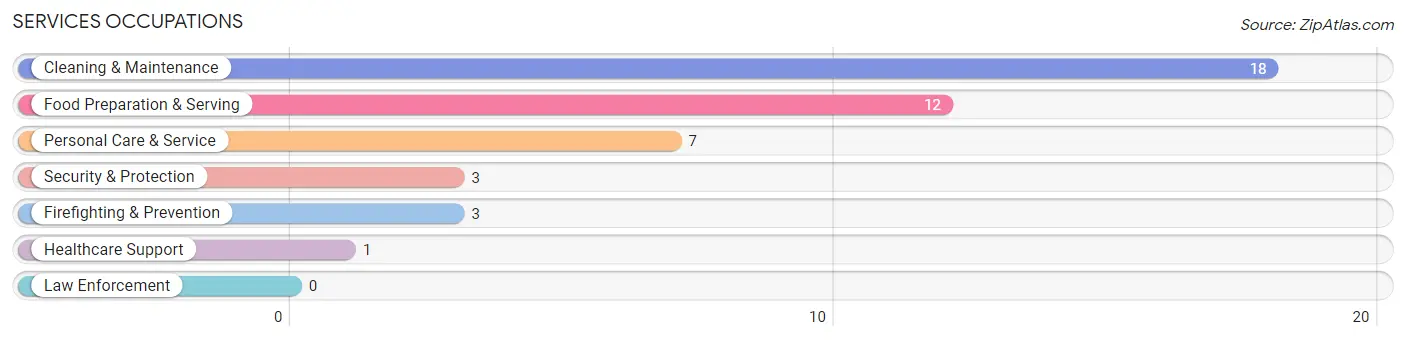
Services Occupations
The most common Services occupations in Badger are Cleaning & Maintenance (18 | 6.3%), Food Preparation & Serving (12 | 4.2%), Personal Care & Service (7 | 2.4%), Security & Protection (3 | 1.1%), and Firefighting & Prevention (3 | 1.1%).
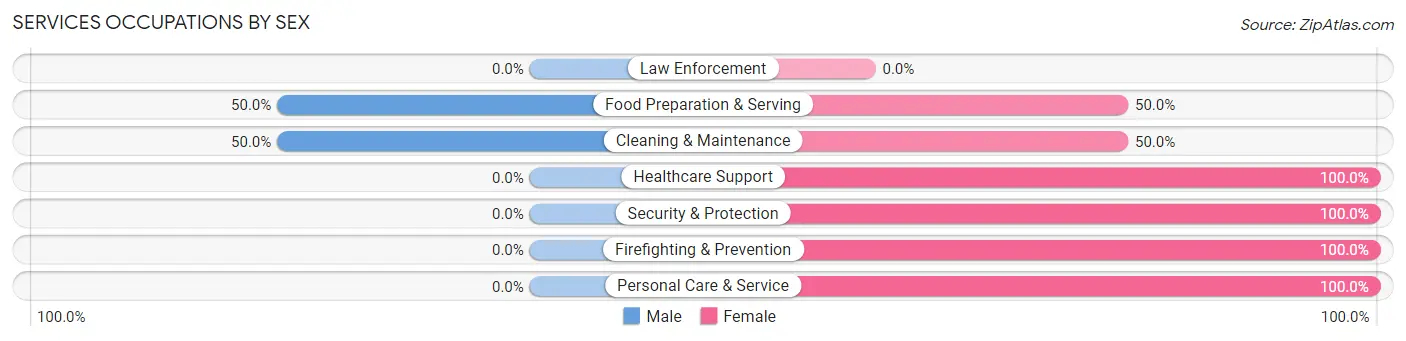
Services Occupations by Sex
Within the Services occupations in Badger, the most male-oriented occupations are Food Preparation & Serving (50.0%), and Cleaning & Maintenance (50.0%), while the most female-oriented occupations are Healthcare Support (100.0%), Security & Protection (100.0%), and Firefighting & Prevention (100.0%).
| Occupation | Male | Female |
| Healthcare Support | 0 (0.0%) | 1 (100.0%) |
| Security & Protection | 0 (0.0%) | 3 (100.0%) |
| Firefighting & Prevention | 0 (0.0%) | 3 (100.0%) |
| Law Enforcement | 0 (0.0%) | 0 (0.0%) |
| Food Preparation & Serving | 6 (50.0%) | 6 (50.0%) |
| Cleaning & Maintenance | 9 (50.0%) | 9 (50.0%) |
| Personal Care & Service | 0 (0.0%) | 7 (100.0%) |
| Total (Category) | 15 (36.6%) | 26 (63.4%) |
| Total (Overall) | 154 (53.7%) | 133 (46.3%) |
Sales and Office Occupations
The most common Sales and Office occupations in Badger are Sales & Related (22 | 7.7%), and Office & Administration (20 | 7.0%).
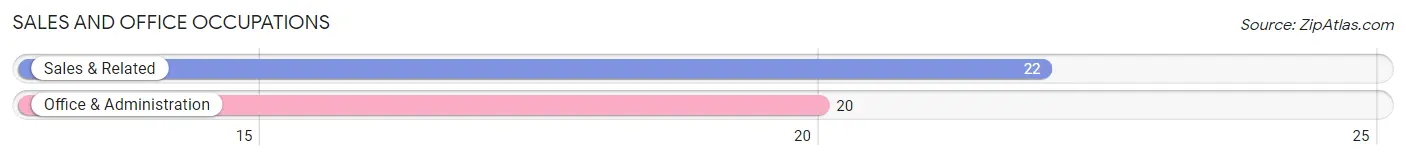
Sales and Office Occupations by Sex
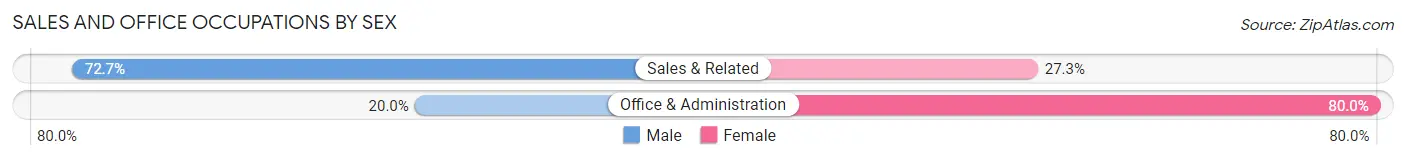
| Occupation | Male | Female |
| Sales & Related | 16 (72.7%) | 6 (27.3%) |
| Office & Administration | 4 (20.0%) | 16 (80.0%) |
| Total (Category) | 20 (47.6%) | 22 (52.4%) |
| Total (Overall) | 154 (53.7%) | 133 (46.3%) |
Natural Resources, Construction and Maintenance Occupations
The most common Natural Resources, Construction and Maintenance occupations in Badger are Construction & Extraction (35 | 12.2%), Installation, Maintenance & Repair (25 | 8.7%), and Farming, Fishing & Forestry (3 | 1.1%).
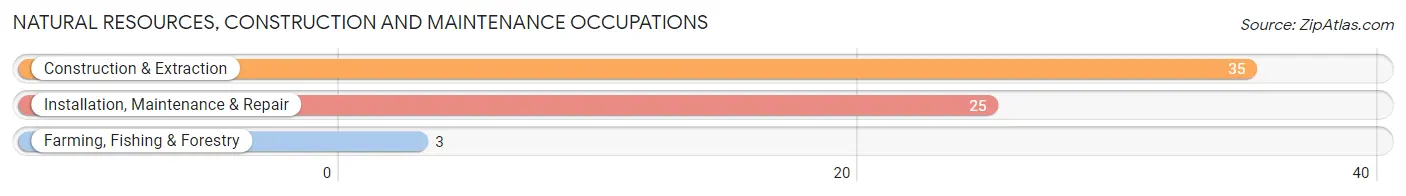
Natural Resources, Construction and Maintenance Occupations by Sex
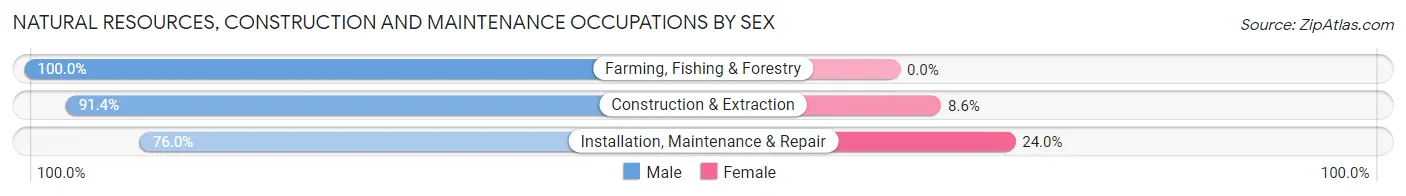
| Occupation | Male | Female |
| Farming, Fishing & Forestry | 3 (100.0%) | 0 (0.0%) |
| Construction & Extraction | 32 (91.4%) | 3 (8.6%) |
| Installation, Maintenance & Repair | 19 (76.0%) | 6 (24.0%) |
| Total (Category) | 54 (85.7%) | 9 (14.3%) |
| Total (Overall) | 154 (53.7%) | 133 (46.3%) |
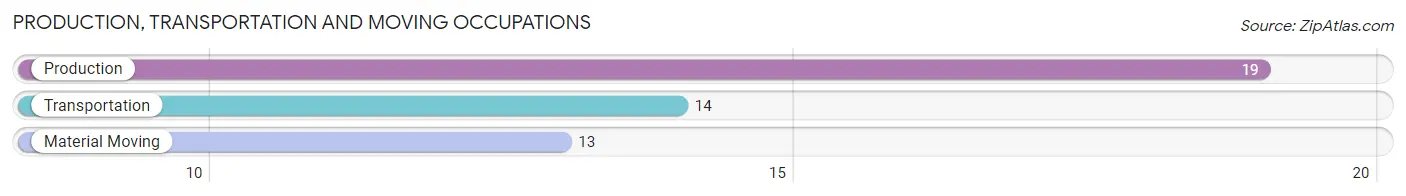
Production, Transportation and Moving Occupations
The most common Production, Transportation and Moving occupations in Badger are Production (19 | 6.6%), Transportation (14 | 4.9%), and Material Moving (13 | 4.5%).
Production, Transportation and Moving Occupations by Sex
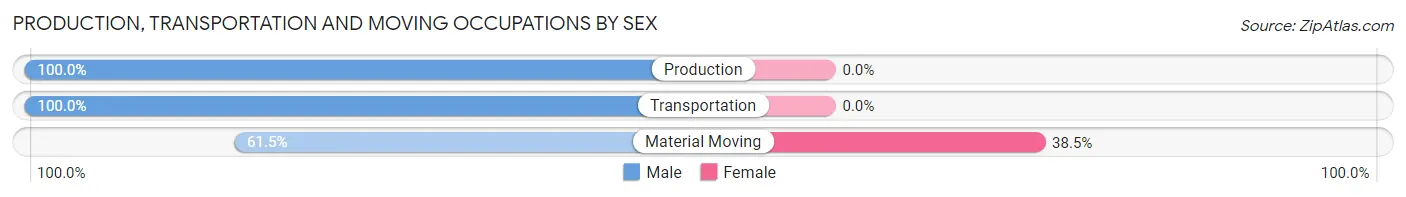
| Occupation | Male | Female |
| Production | 19 (100.0%) | 0 (0.0%) |
| Transportation | 14 (100.0%) | 0 (0.0%) |
| Material Moving | 8 (61.5%) | 5 (38.5%) |
| Total (Category) | 41 (89.1%) | 5 (10.9%) |
| Total (Overall) | 154 (53.7%) | 133 (46.3%) |
Employment Industries by Sex in Badger
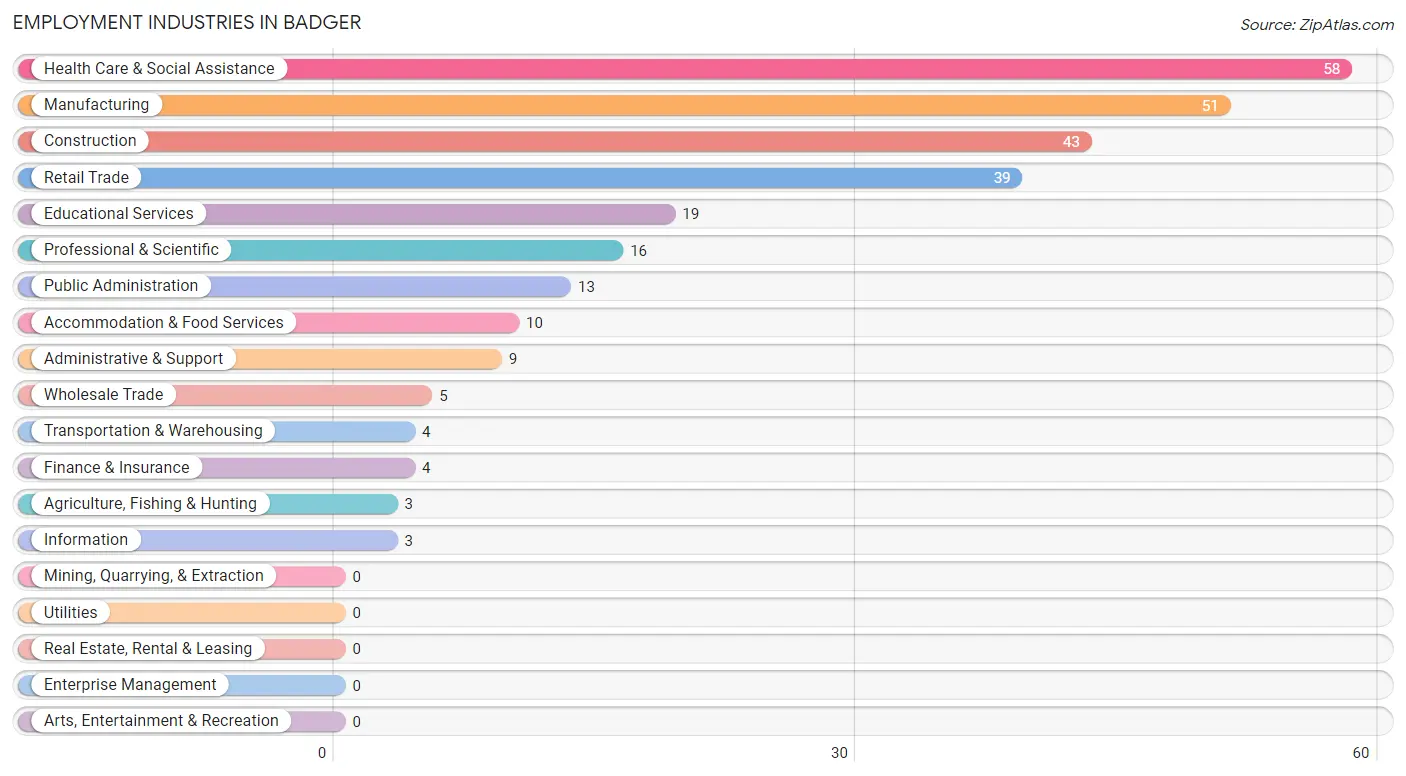
Employment Industries in Badger
The major employment industries in Badger include Health Care & Social Assistance (58 | 20.2%), Manufacturing (51 | 17.8%), Construction (43 | 15.0%), Retail Trade (39 | 13.6%), and Educational Services (19 | 6.6%).
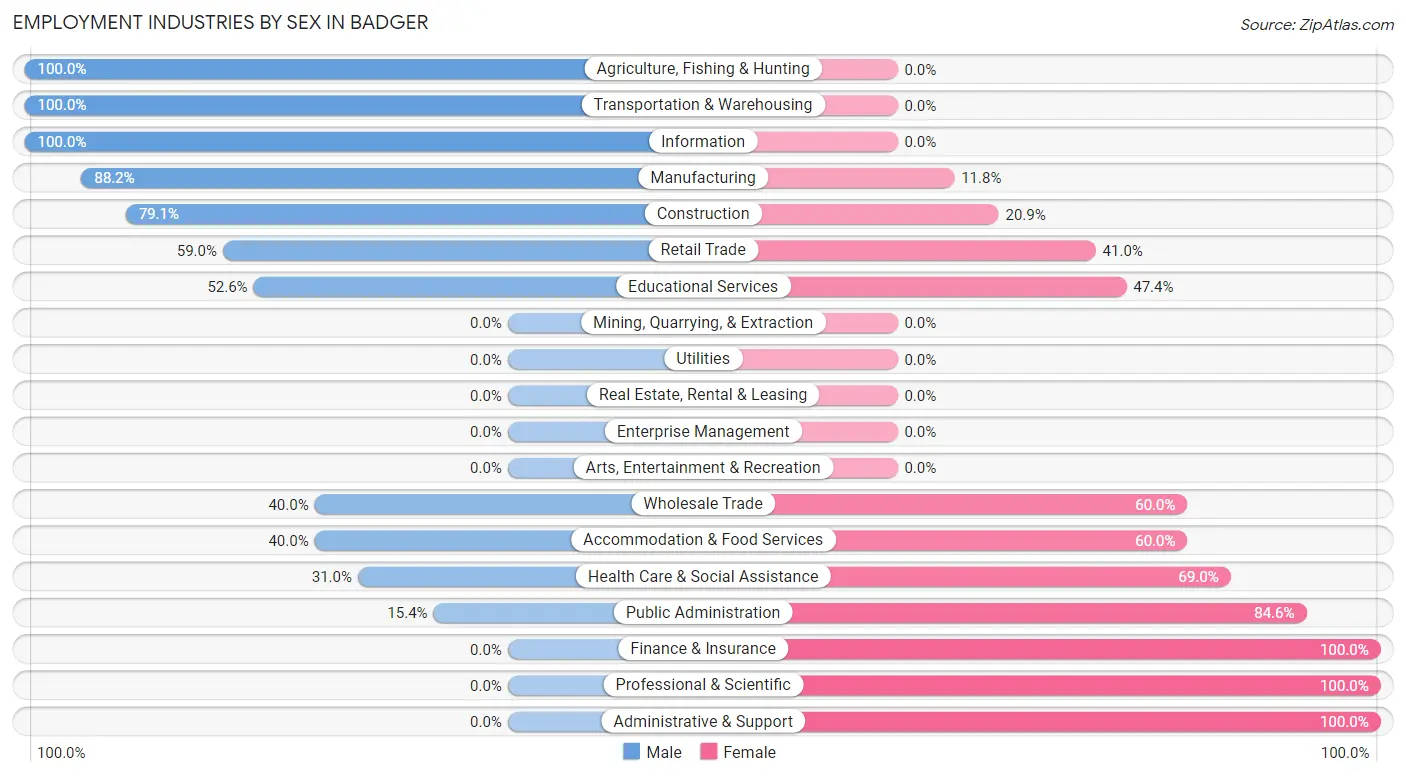
Employment Industries by Sex in Badger
The Badger industries that see more men than women are Agriculture, Fishing & Hunting (100.0%), Transportation & Warehousing (100.0%), and Information (100.0%), whereas the industries that tend to have a higher number of women are Finance & Insurance (100.0%), Professional & Scientific (100.0%), and Administrative & Support (100.0%).
| Industry | Male | Female |
| Agriculture, Fishing & Hunting | 3 (100.0%) | 0 (0.0%) |
| Mining, Quarrying, & Extraction | 0 (0.0%) | 0 (0.0%) |
| Construction | 34 (79.1%) | 9 (20.9%) |
| Manufacturing | 45 (88.2%) | 6 (11.8%) |
| Wholesale Trade | 2 (40.0%) | 3 (60.0%) |
| Retail Trade | 23 (59.0%) | 16 (41.0%) |
| Transportation & Warehousing | 4 (100.0%) | 0 (0.0%) |
| Utilities | 0 (0.0%) | 0 (0.0%) |
| Information | 3 (100.0%) | 0 (0.0%) |
| Finance & Insurance | 0 (0.0%) | 4 (100.0%) |
| Real Estate, Rental & Leasing | 0 (0.0%) | 0 (0.0%) |
| Professional & Scientific | 0 (0.0%) | 16 (100.0%) |
| Enterprise Management | 0 (0.0%) | 0 (0.0%) |
| Administrative & Support | 0 (0.0%) | 9 (100.0%) |
| Educational Services | 10 (52.6%) | 9 (47.4%) |
| Health Care & Social Assistance | 18 (31.0%) | 40 (69.0%) |
| Arts, Entertainment & Recreation | 0 (0.0%) | 0 (0.0%) |
| Accommodation & Food Services | 4 (40.0%) | 6 (60.0%) |
| Public Administration | 2 (15.4%) | 11 (84.6%) |
| Total | 154 (53.7%) | 133 (46.3%) |
Education in Badger
School Enrollment in Badger
The most common levels of schooling among the 123 students in Badger are middle school (35 | 28.5%), high school (30 | 24.4%), and elementary school (23 | 18.7%).
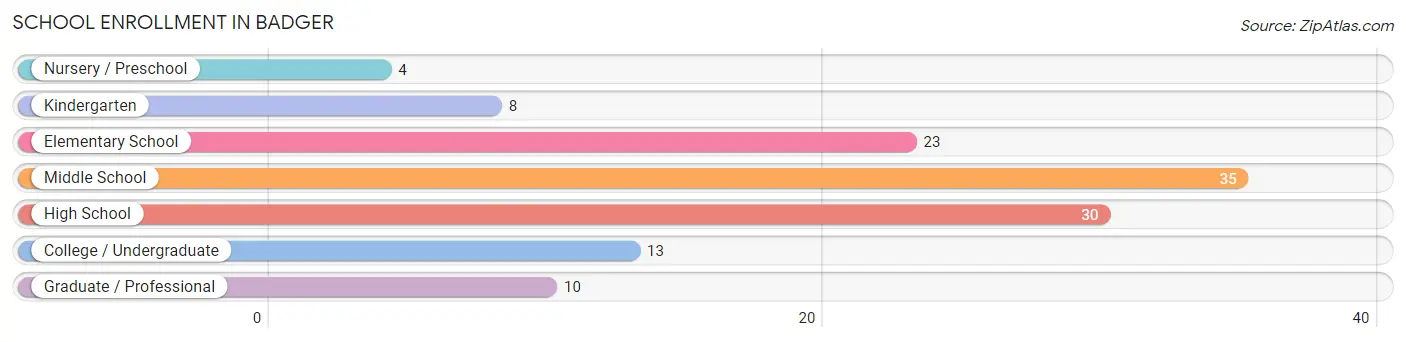
| School Level | # Students | % Students |
| Nursery / Preschool | 4 | 3.3% |
| Kindergarten | 8 | 6.5% |
| Elementary School | 23 | 18.7% |
| Middle School | 35 | 28.5% |
| High School | 30 | 24.4% |
| College / Undergraduate | 13 | 10.6% |
| Graduate / Professional | 10 | 8.1% |
| Total | 123 | 100.0% |
School Enrollment by Age by Funding Source in Badger
Out of a total of 123 students who are enrolled in schools in Badger, 21 (17.1%) attend a private institution, while the remaining 102 (82.9%) are enrolled in public schools. The age group of 35 years and over has the highest likelihood of being enrolled in private schools, with 2 (100.0% in the age bracket) enrolled. Conversely, the age group of 5 to 9 year old has the lowest likelihood of being enrolled in a private school, with 35 (100.0% in the age bracket) attending a public institution.
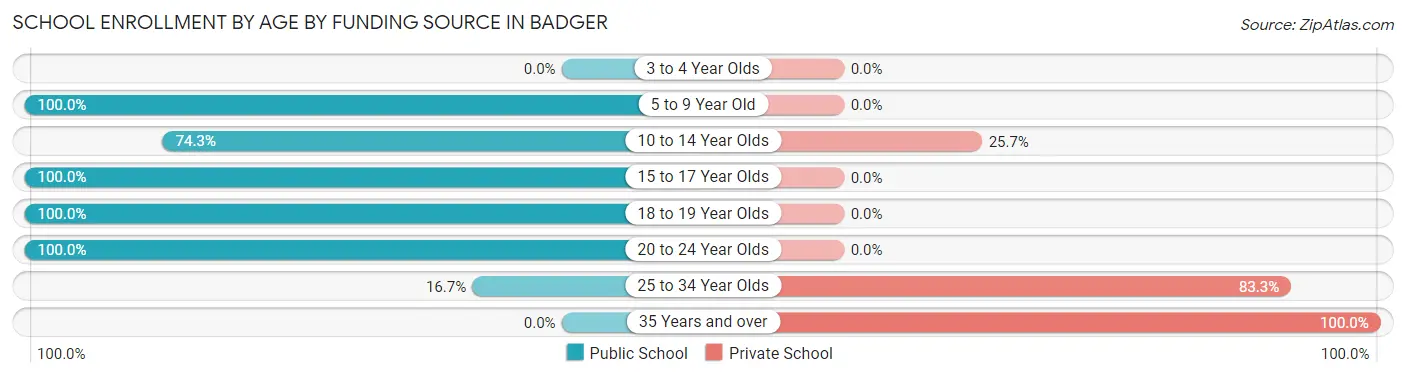
| Age Bracket | Public School | Private School |
| 3 to 4 Year Olds | 0 (0.0%) | 0 (0.0%) |
| 5 to 9 Year Old | 35 (100.0%) | 0 (0.0%) |
| 10 to 14 Year Olds | 26 (74.3%) | 9 (25.7%) |
| 15 to 17 Year Olds | 30 (100.0%) | 0 (0.0%) |
| 18 to 19 Year Olds | 8 (100.0%) | 0 (0.0%) |
| 20 to 24 Year Olds | 1 (100.0%) | 0 (0.0%) |
| 25 to 34 Year Olds | 2 (16.7%) | 10 (83.3%) |
| 35 Years and over | 0 (0.0%) | 2 (100.0%) |
| Total | 102 (82.9%) | 21 (17.1%) |
Educational Attainment by Field of Study in Badger
Business (23 | 29.5%), education (17 | 21.8%), science & technology (11 | 14.1%), literature & languages (10 | 12.8%), and liberal arts & history (7 | 9.0%) are the most common fields of study among 78 individuals in Badger who have obtained a bachelor's degree or higher.
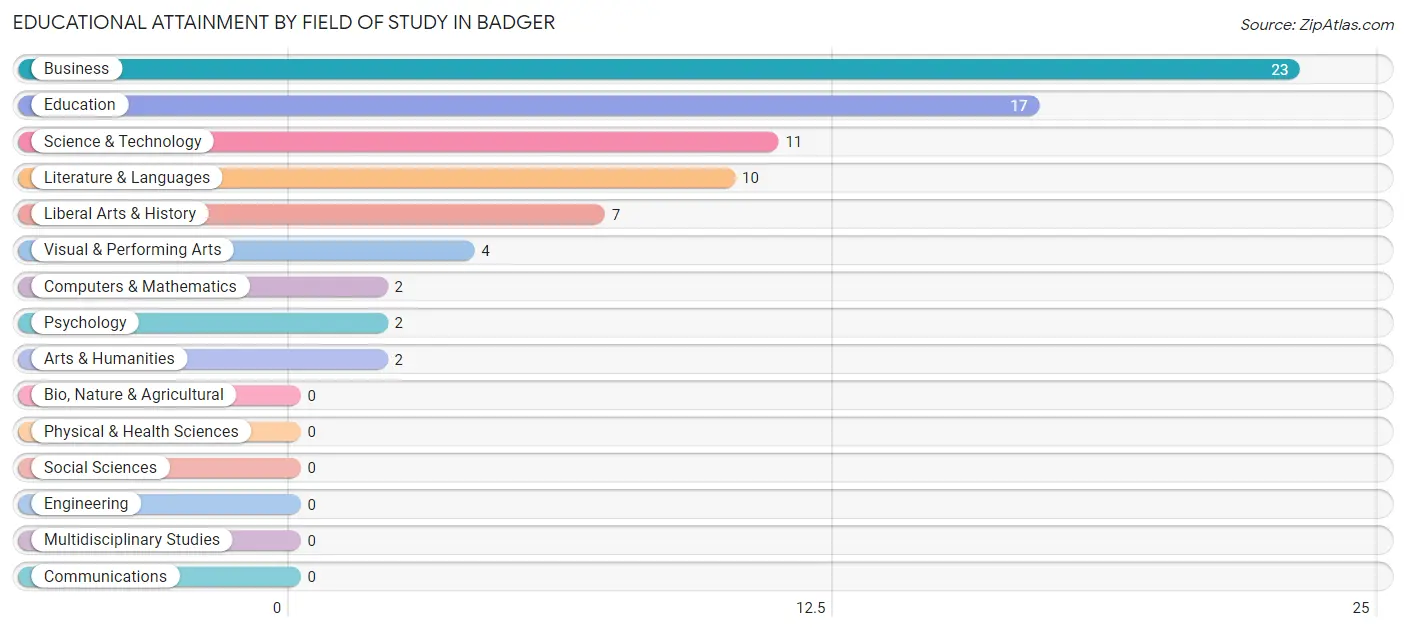
| Field of Study | # Graduates | % Graduates |
| Computers & Mathematics | 2 | 2.6% |
| Bio, Nature & Agricultural | 0 | 0.0% |
| Physical & Health Sciences | 0 | 0.0% |
| Psychology | 2 | 2.6% |
| Social Sciences | 0 | 0.0% |
| Engineering | 0 | 0.0% |
| Multidisciplinary Studies | 0 | 0.0% |
| Science & Technology | 11 | 14.1% |
| Business | 23 | 29.5% |
| Education | 17 | 21.8% |
| Literature & Languages | 10 | 12.8% |
| Liberal Arts & History | 7 | 9.0% |
| Visual & Performing Arts | 4 | 5.1% |
| Communications | 0 | 0.0% |
| Arts & Humanities | 2 | 2.6% |
| Total | 78 | 100.0% |
Transportation & Commute in Badger
Vehicle Availability by Sex in Badger
The most prevalent vehicle ownership categories in Badger are males with 2 vehicles (53, accounting for 35.3%) and females with 2 vehicles (56, making up 39.9%).
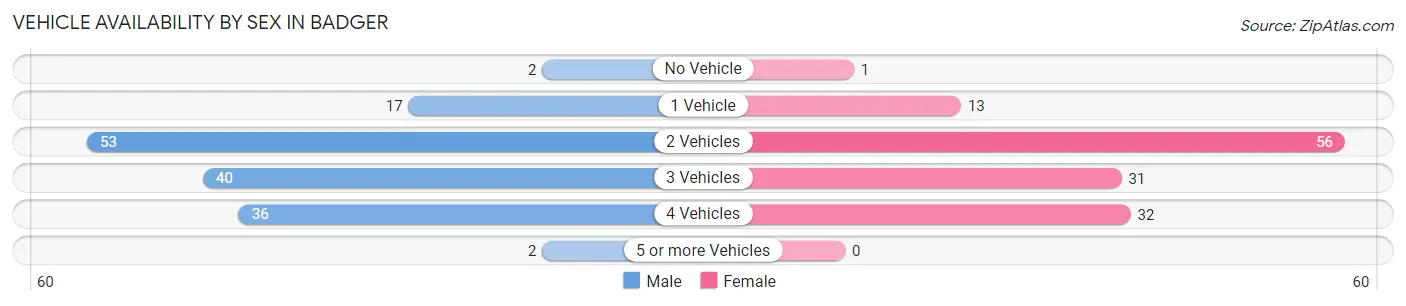
| Vehicles Available | Male | Female |
| No Vehicle | 2 (1.3%) | 1 (0.7%) |
| 1 Vehicle | 17 (11.3%) | 13 (9.8%) |
| 2 Vehicles | 53 (35.3%) | 56 (42.1%) |
| 3 Vehicles | 40 (26.7%) | 31 (23.3%) |
| 4 Vehicles | 36 (24.0%) | 32 (24.1%) |
| 5 or more Vehicles | 2 (1.3%) | 0 (0.0%) |
| Total | 150 (100.0%) | 133 (100.0%) |
Commute Time in Badger
The most frequently occuring commute durations in Badger are 15 to 19 minutes (97 commuters, 35.7%), 10 to 14 minutes (64 commuters, 23.5%), and 20 to 24 minutes (55 commuters, 20.2%).
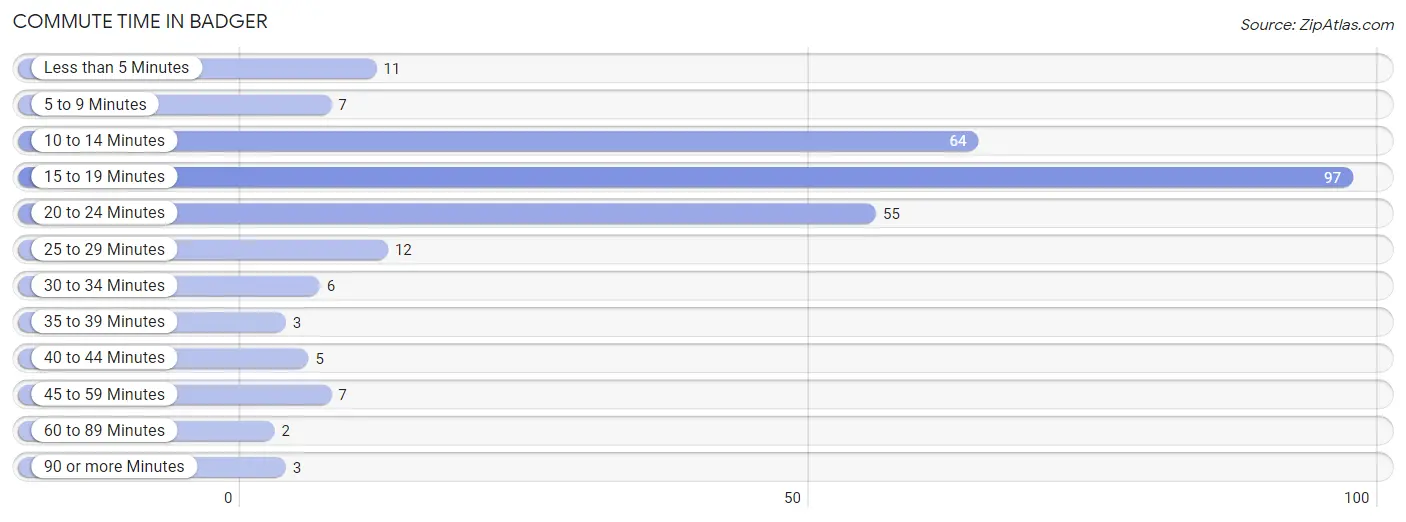
| Commute Time | # Commuters | % Commuters |
| Less than 5 Minutes | 11 | 4.0% |
| 5 to 9 Minutes | 7 | 2.6% |
| 10 to 14 Minutes | 64 | 23.5% |
| 15 to 19 Minutes | 97 | 35.7% |
| 20 to 24 Minutes | 55 | 20.2% |
| 25 to 29 Minutes | 12 | 4.4% |
| 30 to 34 Minutes | 6 | 2.2% |
| 35 to 39 Minutes | 3 | 1.1% |
| 40 to 44 Minutes | 5 | 1.8% |
| 45 to 59 Minutes | 7 | 2.6% |
| 60 to 89 Minutes | 2 | 0.7% |
| 90 or more Minutes | 3 | 1.1% |
Commute Time by Sex in Badger
The most common commute times in Badger are 10 to 14 minutes (44 commuters, 30.1%) for males and 15 to 19 minutes (54 commuters, 42.9%) for females.
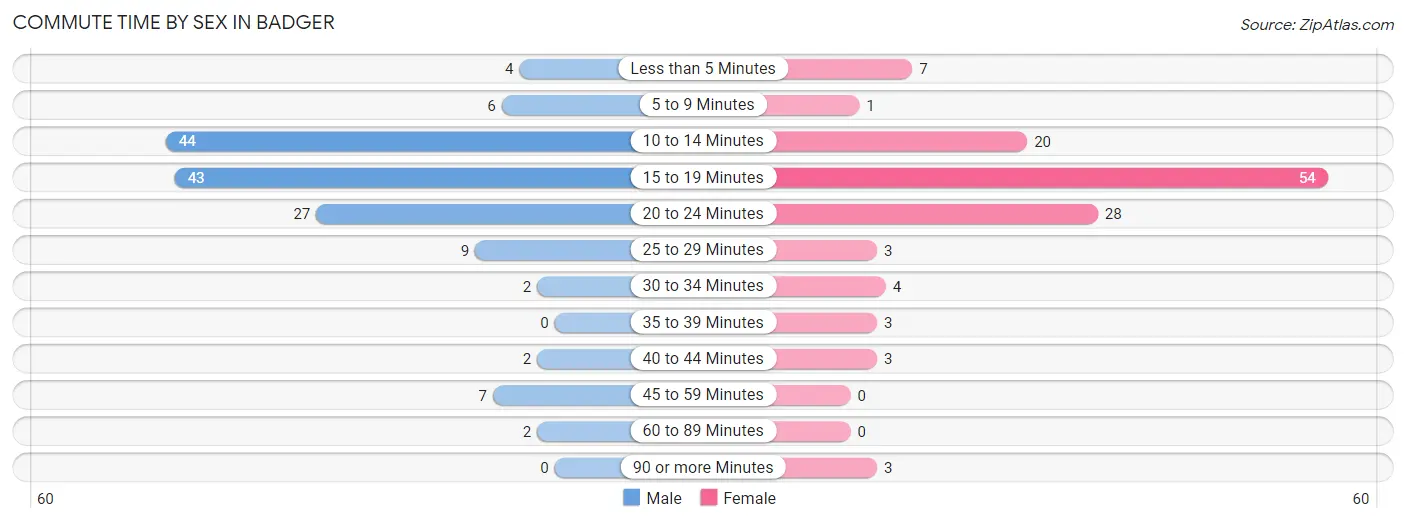
| Commute Time | Male | Female |
| Less than 5 Minutes | 4 (2.7%) | 7 (5.6%) |
| 5 to 9 Minutes | 6 (4.1%) | 1 (0.8%) |
| 10 to 14 Minutes | 44 (30.1%) | 20 (15.9%) |
| 15 to 19 Minutes | 43 (29.4%) | 54 (42.9%) |
| 20 to 24 Minutes | 27 (18.5%) | 28 (22.2%) |
| 25 to 29 Minutes | 9 (6.2%) | 3 (2.4%) |
| 30 to 34 Minutes | 2 (1.4%) | 4 (3.2%) |
| 35 to 39 Minutes | 0 (0.0%) | 3 (2.4%) |
| 40 to 44 Minutes | 2 (1.4%) | 3 (2.4%) |
| 45 to 59 Minutes | 7 (4.8%) | 0 (0.0%) |
| 60 to 89 Minutes | 2 (1.4%) | 0 (0.0%) |
| 90 or more Minutes | 0 (0.0%) | 3 (2.4%) |
Time of Departure to Work by Sex in Badger
The most frequent times of departure to work in Badger are 7:00 AM to 7:29 AM (29, 19.9%) for males and 7:30 AM to 7:59 AM (38, 30.2%) for females.
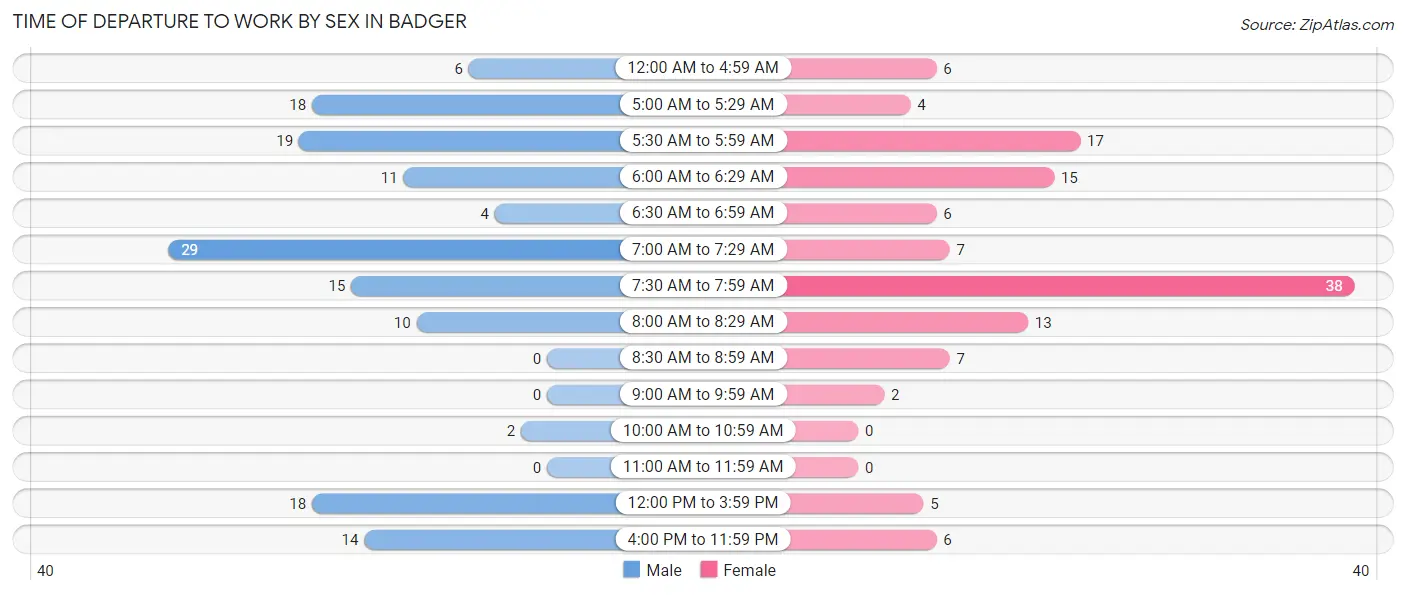
| Time of Departure | Male | Female |
| 12:00 AM to 4:59 AM | 6 (4.1%) | 6 (4.8%) |
| 5:00 AM to 5:29 AM | 18 (12.3%) | 4 (3.2%) |
| 5:30 AM to 5:59 AM | 19 (13.0%) | 17 (13.5%) |
| 6:00 AM to 6:29 AM | 11 (7.5%) | 15 (11.9%) |
| 6:30 AM to 6:59 AM | 4 (2.7%) | 6 (4.8%) |
| 7:00 AM to 7:29 AM | 29 (19.9%) | 7 (5.6%) |
| 7:30 AM to 7:59 AM | 15 (10.3%) | 38 (30.2%) |
| 8:00 AM to 8:29 AM | 10 (6.9%) | 13 (10.3%) |
| 8:30 AM to 8:59 AM | 0 (0.0%) | 7 (5.6%) |
| 9:00 AM to 9:59 AM | 0 (0.0%) | 2 (1.6%) |
| 10:00 AM to 10:59 AM | 2 (1.4%) | 0 (0.0%) |
| 11:00 AM to 11:59 AM | 0 (0.0%) | 0 (0.0%) |
| 12:00 PM to 3:59 PM | 18 (12.3%) | 5 (4.0%) |
| 4:00 PM to 11:59 PM | 14 (9.6%) | 6 (4.8%) |
| Total | 146 (100.0%) | 126 (100.0%) |
Housing Occupancy in Badger
Occupancy by Ownership in Badger
Of the total 215 dwellings in Badger, owner-occupied units account for 170 (79.1%), while renter-occupied units make up 45 (20.9%).
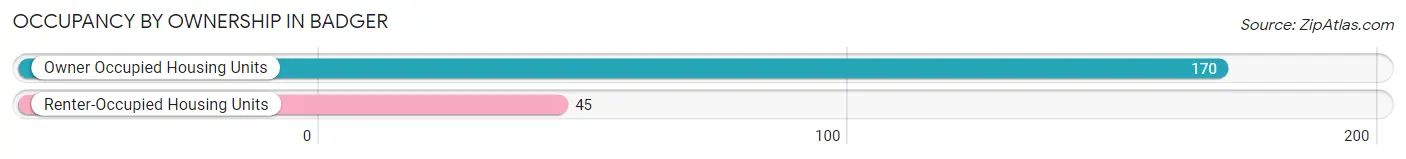
| Occupancy | # Housing Units | % Housing Units |
| Owner Occupied Housing Units | 170 | 79.1% |
| Renter-Occupied Housing Units | 45 | 20.9% |
| Total Occupied Housing Units | 215 | 100.0% |
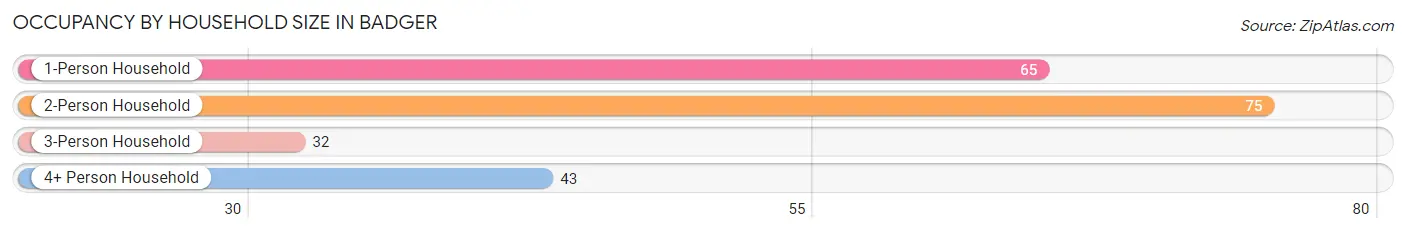
Occupancy by Household Size in Badger
| Household Size | # Housing Units | % Housing Units |
| 1-Person Household | 65 | 30.2% |
| 2-Person Household | 75 | 34.9% |
| 3-Person Household | 32 | 14.9% |
| 4+ Person Household | 43 | 20.0% |
| Total Housing Units | 215 | 100.0% |
Occupancy by Ownership by Household Size in Badger
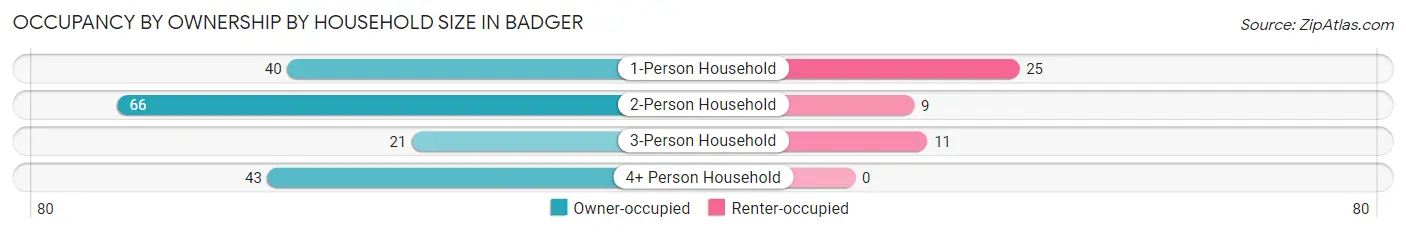
| Household Size | Owner-occupied | Renter-occupied |
| 1-Person Household | 40 (61.5%) | 25 (38.5%) |
| 2-Person Household | 66 (88.0%) | 9 (12.0%) |
| 3-Person Household | 21 (65.6%) | 11 (34.4%) |
| 4+ Person Household | 43 (100.0%) | 0 (0.0%) |
| Total Housing Units | 170 (79.1%) | 45 (20.9%) |
Occupancy by Educational Attainment in Badger
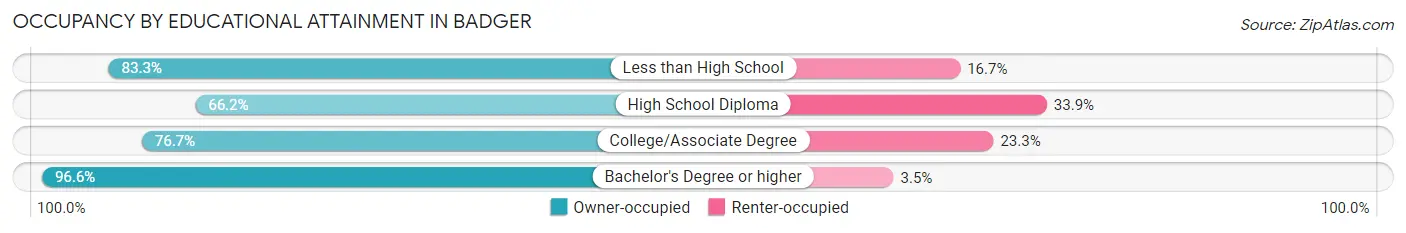
| Household Size | Owner-occupied | Renter-occupied |
| Less than High School | 5 (83.3%) | 1 (16.7%) |
| High School Diploma | 43 (66.1%) | 22 (33.9%) |
| College/Associate Degree | 66 (76.7%) | 20 (23.3%) |
| Bachelor's Degree or higher | 56 (96.6%) | 2 (3.5%) |
Occupancy by Age of Householder in Badger
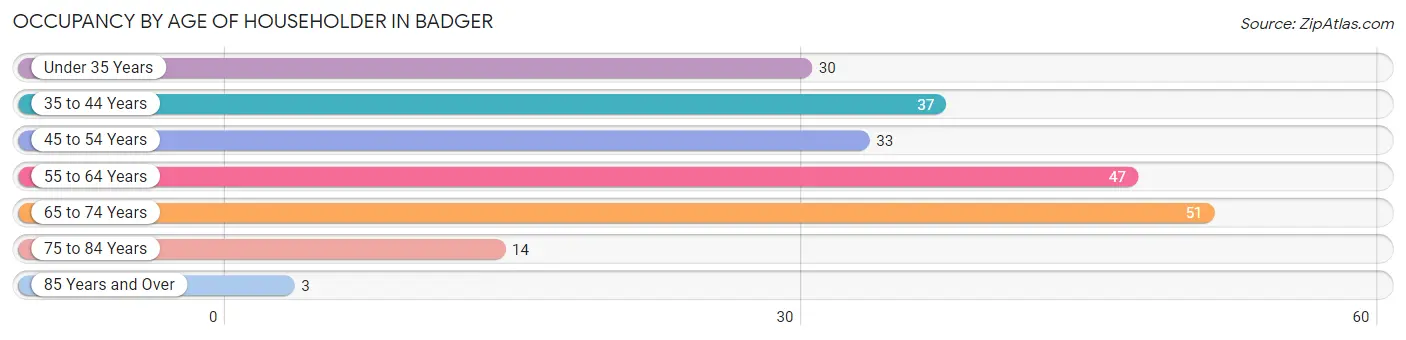
| Age Bracket | # Households | % Households |
| Under 35 Years | 30 | 14.0% |
| 35 to 44 Years | 37 | 17.2% |
| 45 to 54 Years | 33 | 15.3% |
| 55 to 64 Years | 47 | 21.9% |
| 65 to 74 Years | 51 | 23.7% |
| 75 to 84 Years | 14 | 6.5% |
| 85 Years and Over | 3 | 1.4% |
| Total | 215 | 100.0% |
Housing Finances in Badger
Median Income by Occupancy in Badger
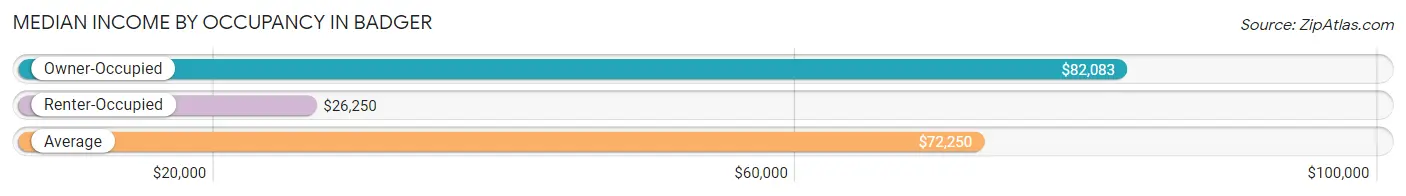
| Occupancy Type | # Households | Median Income |
| Owner-Occupied | 170 (79.1%) | $82,083 |
| Renter-Occupied | 45 (20.9%) | $26,250 |
| Average | 215 (100.0%) | $72,250 |
Occupancy by Householder Income Bracket in Badger
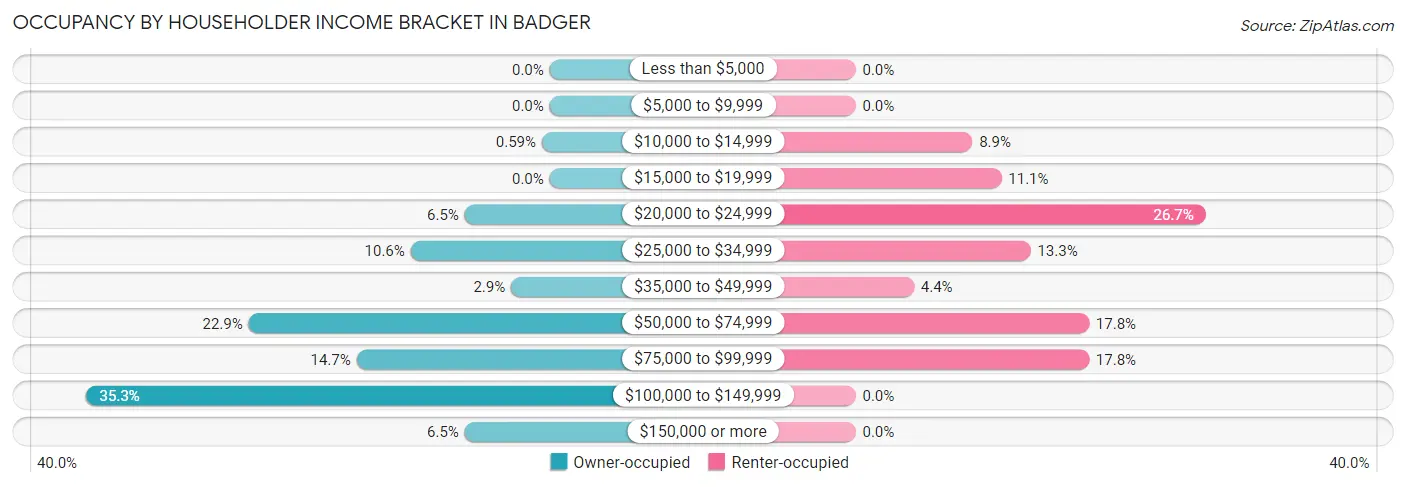
| Income Bracket | Owner-occupied | Renter-occupied |
| Less than $5,000 | 0 (0.0%) | 0 (0.0%) |
| $5,000 to $9,999 | 0 (0.0%) | 0 (0.0%) |
| $10,000 to $14,999 | 1 (0.6%) | 4 (8.9%) |
| $15,000 to $19,999 | 0 (0.0%) | 5 (11.1%) |
| $20,000 to $24,999 | 11 (6.5%) | 12 (26.7%) |
| $25,000 to $34,999 | 18 (10.6%) | 6 (13.3%) |
| $35,000 to $49,999 | 5 (2.9%) | 2 (4.4%) |
| $50,000 to $74,999 | 39 (22.9%) | 8 (17.8%) |
| $75,000 to $99,999 | 25 (14.7%) | 8 (17.8%) |
| $100,000 to $149,999 | 60 (35.3%) | 0 (0.0%) |
| $150,000 or more | 11 (6.5%) | 0 (0.0%) |
| Total | 170 (100.0%) | 45 (100.0%) |
Monthly Housing Cost Tiers in Badger
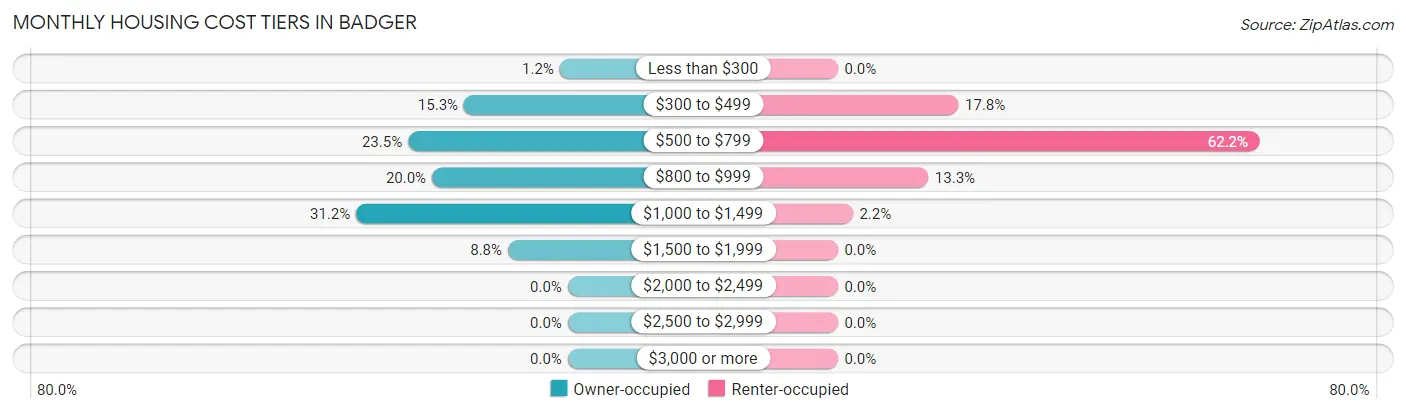
| Monthly Cost | Owner-occupied | Renter-occupied |
| Less than $300 | 2 (1.2%) | 0 (0.0%) |
| $300 to $499 | 26 (15.3%) | 8 (17.8%) |
| $500 to $799 | 40 (23.5%) | 28 (62.2%) |
| $800 to $999 | 34 (20.0%) | 6 (13.3%) |
| $1,000 to $1,499 | 53 (31.2%) | 1 (2.2%) |
| $1,500 to $1,999 | 15 (8.8%) | 0 (0.0%) |
| $2,000 to $2,499 | 0 (0.0%) | 0 (0.0%) |
| $2,500 to $2,999 | 0 (0.0%) | 0 (0.0%) |
| $3,000 or more | 0 (0.0%) | 0 (0.0%) |
| Total | 170 (100.0%) | 45 (100.0%) |
Physical Housing Characteristics in Badger
Housing Structures in Badger
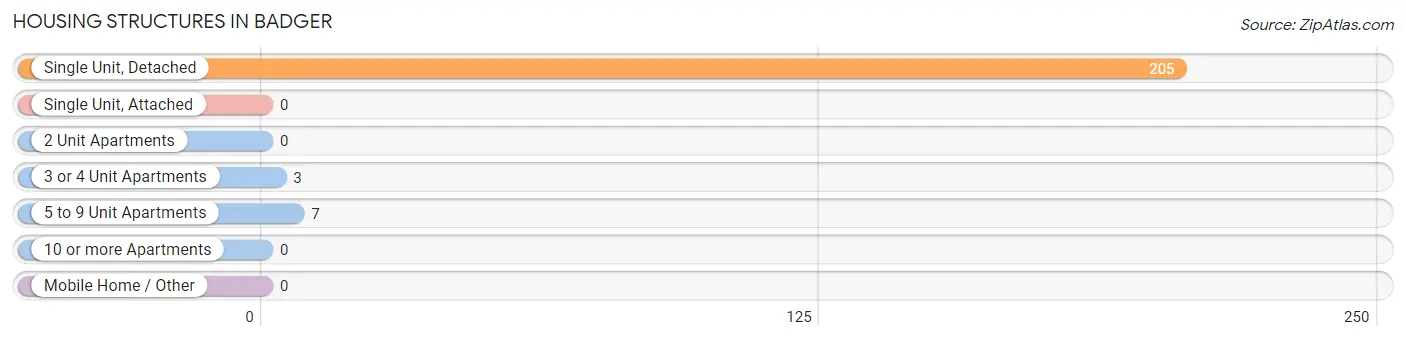
| Structure Type | # Housing Units | % Housing Units |
| Single Unit, Detached | 205 | 95.4% |
| Single Unit, Attached | 0 | 0.0% |
| 2 Unit Apartments | 0 | 0.0% |
| 3 or 4 Unit Apartments | 3 | 1.4% |
| 5 to 9 Unit Apartments | 7 | 3.3% |
| 10 or more Apartments | 0 | 0.0% |
| Mobile Home / Other | 0 | 0.0% |
| Total | 215 | 100.0% |
Housing Structures by Occupancy in Badger
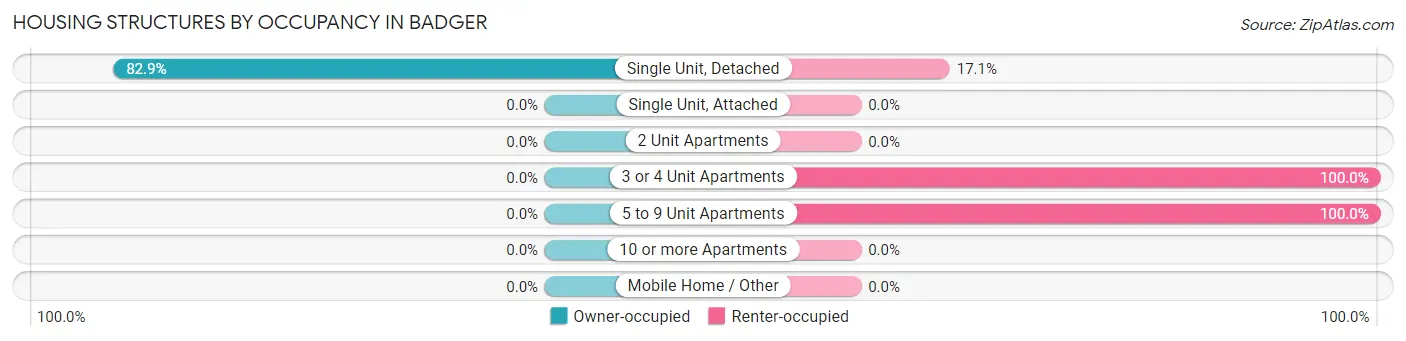
| Structure Type | Owner-occupied | Renter-occupied |
| Single Unit, Detached | 170 (82.9%) | 35 (17.1%) |
| Single Unit, Attached | 0 (0.0%) | 0 (0.0%) |
| 2 Unit Apartments | 0 (0.0%) | 0 (0.0%) |
| 3 or 4 Unit Apartments | 0 (0.0%) | 3 (100.0%) |
| 5 to 9 Unit Apartments | 0 (0.0%) | 7 (100.0%) |
| 10 or more Apartments | 0 (0.0%) | 0 (0.0%) |
| Mobile Home / Other | 0 (0.0%) | 0 (0.0%) |
| Total | 170 (79.1%) | 45 (20.9%) |
Housing Structures by Number of Rooms in Badger
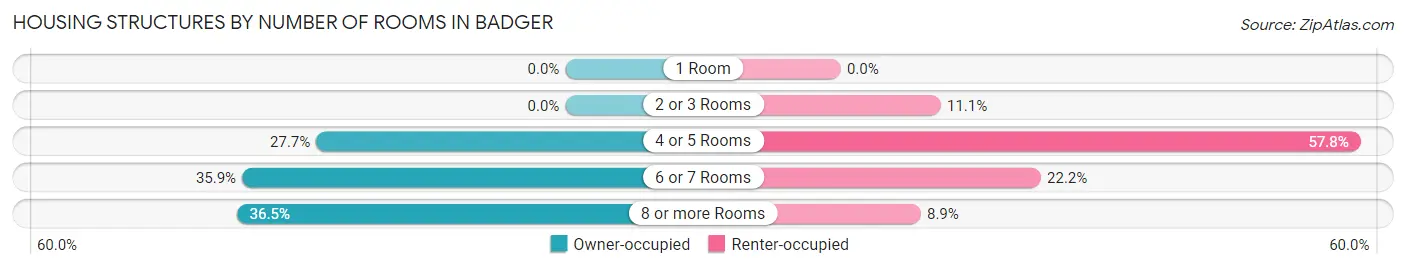
| Number of Rooms | Owner-occupied | Renter-occupied |
| 1 Room | 0 (0.0%) | 0 (0.0%) |
| 2 or 3 Rooms | 0 (0.0%) | 5 (11.1%) |
| 4 or 5 Rooms | 47 (27.7%) | 26 (57.8%) |
| 6 or 7 Rooms | 61 (35.9%) | 10 (22.2%) |
| 8 or more Rooms | 62 (36.5%) | 4 (8.9%) |
| Total | 170 (100.0%) | 45 (100.0%) |
Housing Structure by Heating Type in Badger
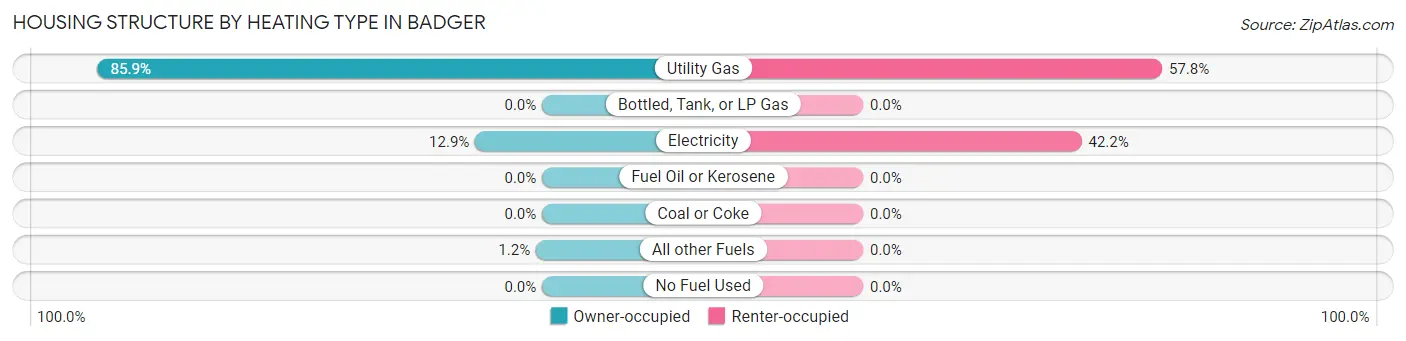
| Heating Type | Owner-occupied | Renter-occupied |
| Utility Gas | 146 (85.9%) | 26 (57.8%) |
| Bottled, Tank, or LP Gas | 0 (0.0%) | 0 (0.0%) |
| Electricity | 22 (12.9%) | 19 (42.2%) |
| Fuel Oil or Kerosene | 0 (0.0%) | 0 (0.0%) |
| Coal or Coke | 0 (0.0%) | 0 (0.0%) |
| All other Fuels | 2 (1.2%) | 0 (0.0%) |
| No Fuel Used | 0 (0.0%) | 0 (0.0%) |
| Total | 170 (100.0%) | 45 (100.0%) |
Household Vehicle Usage in Badger
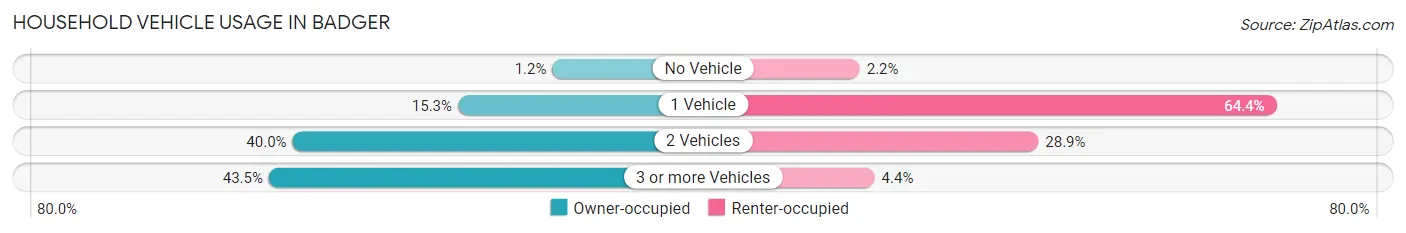
| Vehicles per Household | Owner-occupied | Renter-occupied |
| No Vehicle | 2 (1.2%) | 1 (2.2%) |
| 1 Vehicle | 26 (15.3%) | 29 (64.4%) |
| 2 Vehicles | 68 (40.0%) | 13 (28.9%) |
| 3 or more Vehicles | 74 (43.5%) | 2 (4.4%) |
| Total | 170 (100.0%) | 45 (100.0%) |
Real Estate & Mortgages in Badger
Real Estate and Mortgage Overview in Badger
| Characteristic | Without Mortgage | With Mortgage |
| Housing Units | 66 | 104 |
| Median Property Value | $137,500 | $113,600 |
| Median Household Income | $68,750 | $5 |
| Monthly Housing Costs | $553 | $0 |
| Real Estate Taxes | $1,864 | $0 |
Property Value by Mortgage Status in Badger
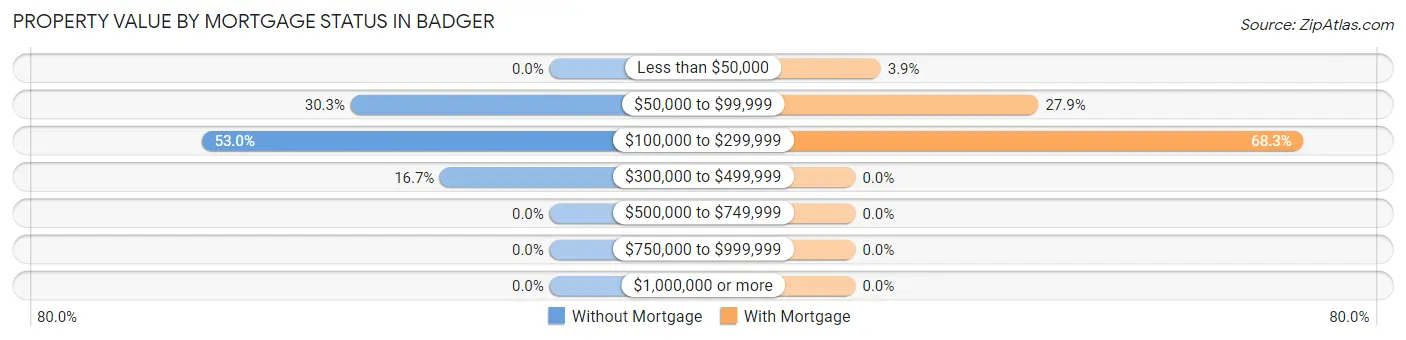
| Property Value | Without Mortgage | With Mortgage |
| Less than $50,000 | 0 (0.0%) | 4 (3.8%) |
| $50,000 to $99,999 | 20 (30.3%) | 29 (27.9%) |
| $100,000 to $299,999 | 35 (53.0%) | 71 (68.3%) |
| $300,000 to $499,999 | 11 (16.7%) | 0 (0.0%) |
| $500,000 to $749,999 | 0 (0.0%) | 0 (0.0%) |
| $750,000 to $999,999 | 0 (0.0%) | 0 (0.0%) |
| $1,000,000 or more | 0 (0.0%) | 0 (0.0%) |
| Total | 66 (100.0%) | 104 (100.0%) |
Household Income by Mortgage Status in Badger
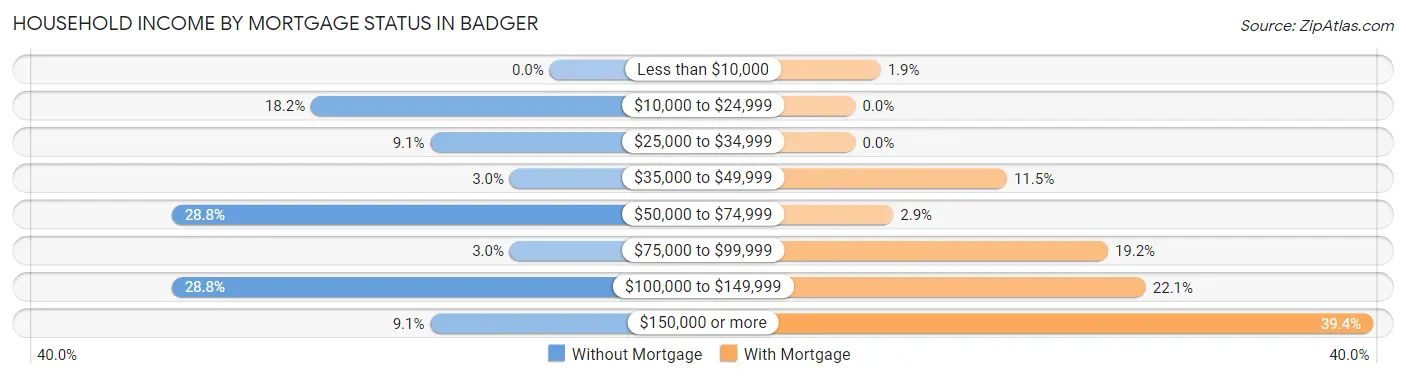
| Household Income | Without Mortgage | With Mortgage |
| Less than $10,000 | 0 (0.0%) | 2 (1.9%) |
| $10,000 to $24,999 | 12 (18.2%) | 0 (0.0%) |
| $25,000 to $34,999 | 6 (9.1%) | 0 (0.0%) |
| $35,000 to $49,999 | 2 (3.0%) | 12 (11.5%) |
| $50,000 to $74,999 | 19 (28.8%) | 3 (2.9%) |
| $75,000 to $99,999 | 2 (3.0%) | 20 (19.2%) |
| $100,000 to $149,999 | 19 (28.8%) | 23 (22.1%) |
| $150,000 or more | 6 (9.1%) | 41 (39.4%) |
| Total | 66 (100.0%) | 104 (100.0%) |
Property Value to Household Income Ratio in Badger
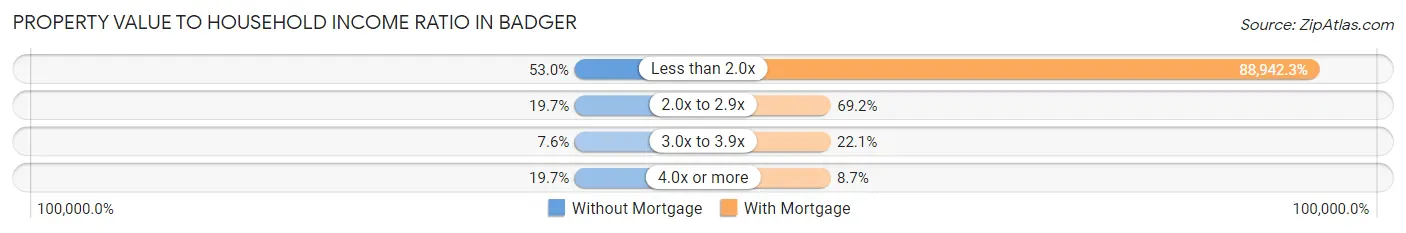
| Value-to-Income Ratio | Without Mortgage | With Mortgage |
| Less than 2.0x | 35 (53.0%) | 92,500 (88,942.3%) |
| 2.0x to 2.9x | 13 (19.7%) | 72 (69.2%) |
| 3.0x to 3.9x | 5 (7.6%) | 23 (22.1%) |
| 4.0x or more | 13 (19.7%) | 9 (8.6%) |
| Total | 66 (100.0%) | 104 (100.0%) |
Real Estate Taxes by Mortgage Status in Badger
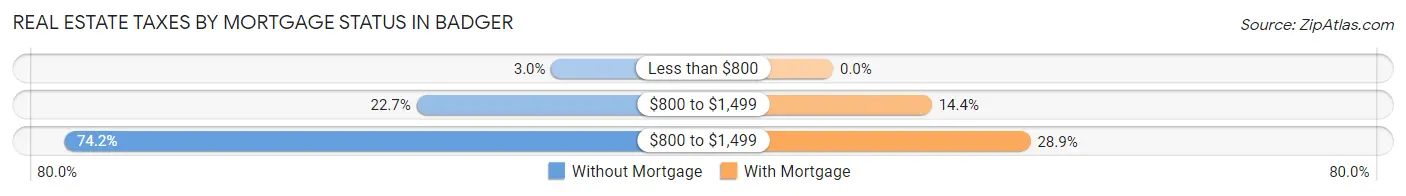
| Property Taxes | Without Mortgage | With Mortgage |
| Less than $800 | 2 (3.0%) | 0 (0.0%) |
| $800 to $1,499 | 15 (22.7%) | 15 (14.4%) |
| $800 to $1,499 | 49 (74.2%) | 30 (28.8%) |
| Total | 66 (100.0%) | 104 (100.0%) |
Health & Disability in Badger
Health Insurance Coverage by Age in Badger
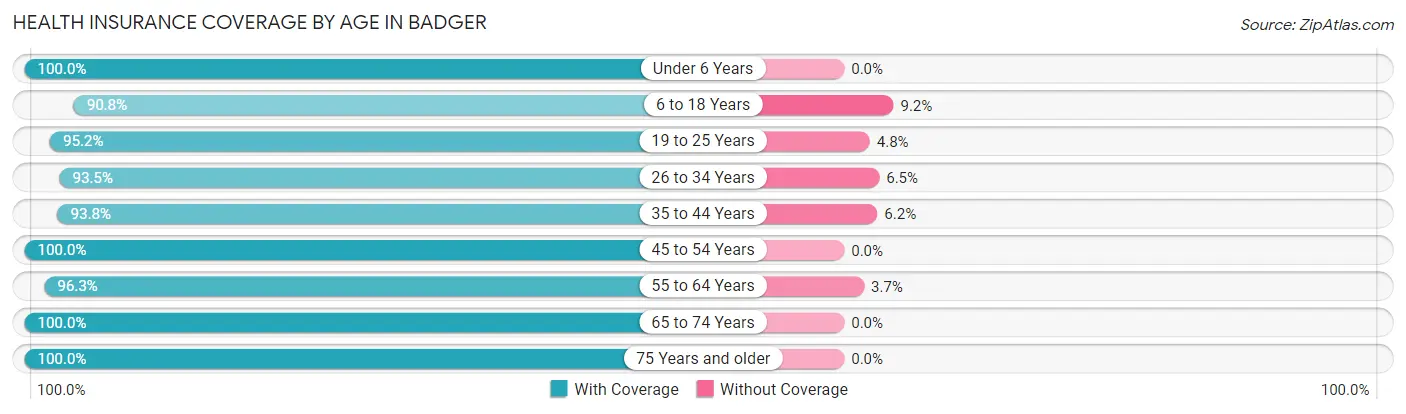
| Age Bracket | With Coverage | Without Coverage |
| Under 6 Years | 26 (100.0%) | 0 (0.0%) |
| 6 to 18 Years | 89 (90.8%) | 9 (9.2%) |
| 19 to 25 Years | 40 (95.2%) | 2 (4.8%) |
| 26 to 34 Years | 43 (93.5%) | 3 (6.5%) |
| 35 to 44 Years | 76 (93.8%) | 5 (6.2%) |
| 45 to 54 Years | 54 (100.0%) | 0 (0.0%) |
| 55 to 64 Years | 78 (96.3%) | 3 (3.7%) |
| 65 to 74 Years | 66 (100.0%) | 0 (0.0%) |
| 75 Years and older | 25 (100.0%) | 0 (0.0%) |
| Total | 497 (95.8%) | 22 (4.2%) |
Health Insurance Coverage by Citizenship Status in Badger
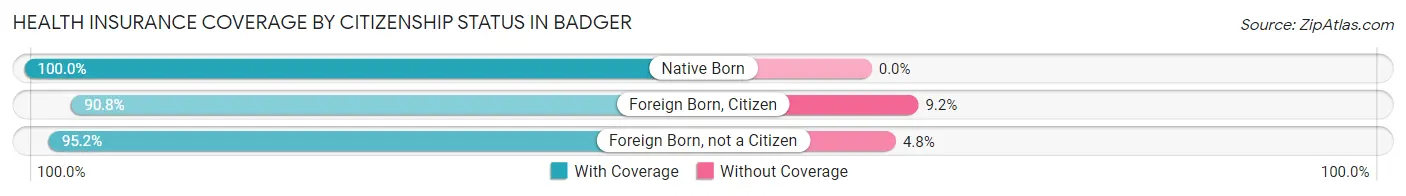
| Citizenship Status | With Coverage | Without Coverage |
| Native Born | 26 (100.0%) | 0 (0.0%) |
| Foreign Born, Citizen | 89 (90.8%) | 9 (9.2%) |
| Foreign Born, not a Citizen | 40 (95.2%) | 2 (4.8%) |
Health Insurance Coverage by Household Income in Badger
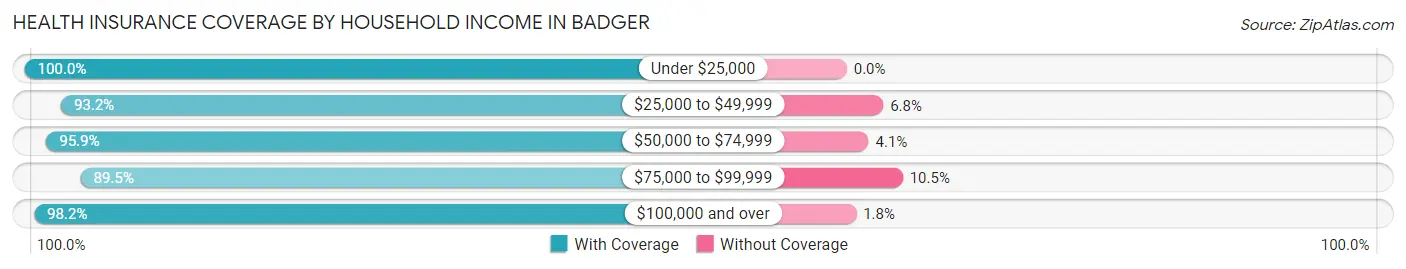
| Household Income | With Coverage | Without Coverage |
| Under $25,000 | 46 (100.0%) | 0 (0.0%) |
| $25,000 to $49,999 | 41 (93.2%) | 3 (6.8%) |
| $50,000 to $74,999 | 94 (95.9%) | 4 (4.1%) |
| $75,000 to $99,999 | 94 (89.5%) | 11 (10.5%) |
| $100,000 and over | 222 (98.2%) | 4 (1.8%) |
Public vs Private Health Insurance Coverage by Age in Badger
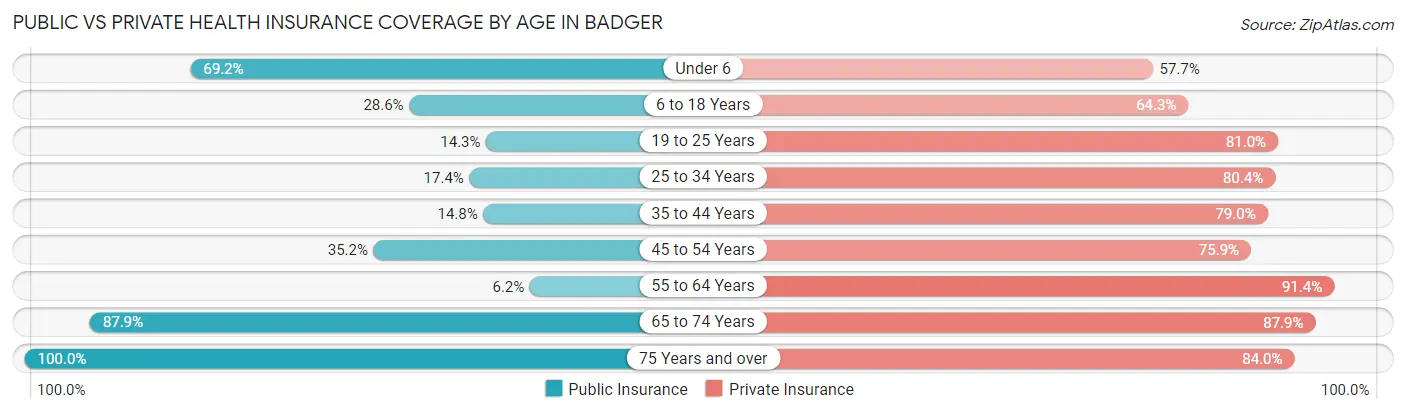
| Age Bracket | Public Insurance | Private Insurance |
| Under 6 | 18 (69.2%) | 15 (57.7%) |
| 6 to 18 Years | 28 (28.6%) | 63 (64.3%) |
| 19 to 25 Years | 6 (14.3%) | 34 (80.9%) |
| 25 to 34 Years | 8 (17.4%) | 37 (80.4%) |
| 35 to 44 Years | 12 (14.8%) | 64 (79.0%) |
| 45 to 54 Years | 19 (35.2%) | 41 (75.9%) |
| 55 to 64 Years | 5 (6.2%) | 74 (91.4%) |
| 65 to 74 Years | 58 (87.9%) | 58 (87.9%) |
| 75 Years and over | 25 (100.0%) | 21 (84.0%) |
| Total | 179 (34.5%) | 407 (78.4%) |
Disability Status by Sex by Age in Badger
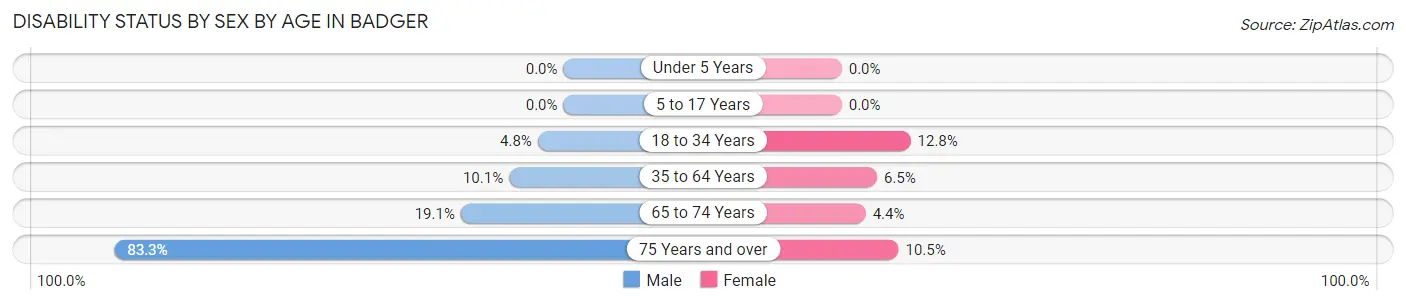
| Age Bracket | Male | Female |
| Under 5 Years | 0 (0.0%) | 0 (0.0%) |
| 5 to 17 Years | 0 (0.0%) | 0 (0.0%) |
| 18 to 34 Years | 2 (4.8%) | 6 (12.8%) |
| 35 to 64 Years | 11 (10.1%) | 7 (6.5%) |
| 65 to 74 Years | 4 (19.1%) | 2 (4.4%) |
| 75 Years and over | 5 (83.3%) | 2 (10.5%) |
Disability Class by Sex by Age in Badger
Disability Class: Hearing Difficulty
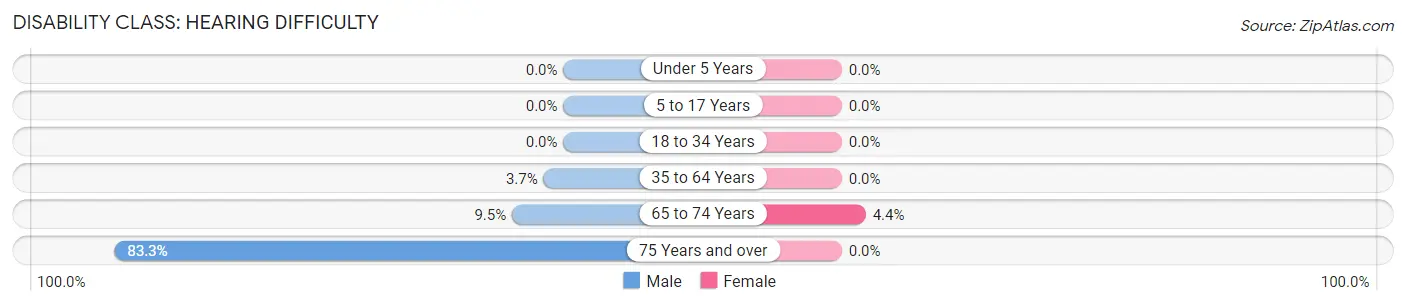
| Age Bracket | Male | Female |
| Under 5 Years | 0 (0.0%) | 0 (0.0%) |
| 5 to 17 Years | 0 (0.0%) | 0 (0.0%) |
| 18 to 34 Years | 0 (0.0%) | 0 (0.0%) |
| 35 to 64 Years | 4 (3.7%) | 0 (0.0%) |
| 65 to 74 Years | 2 (9.5%) | 2 (4.4%) |
| 75 Years and over | 5 (83.3%) | 0 (0.0%) |
Disability Class: Vision Difficulty
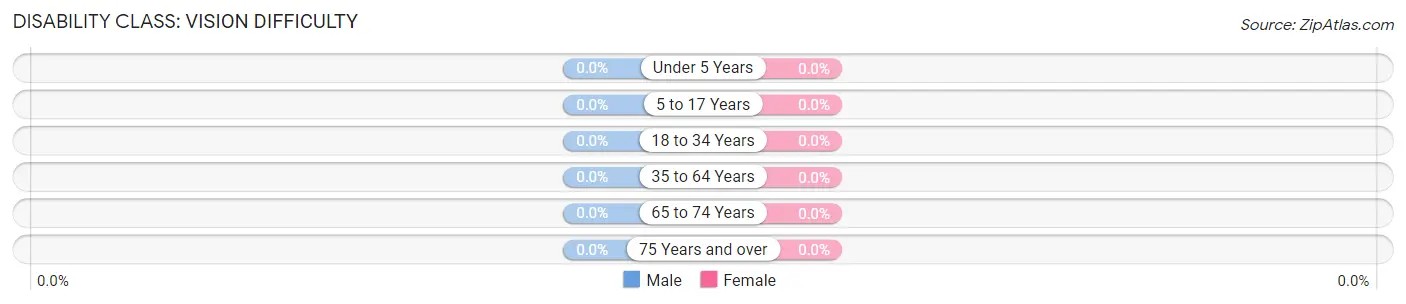
| Age Bracket | Male | Female |
| Under 5 Years | 0 (0.0%) | 0 (0.0%) |
| 5 to 17 Years | 0 (0.0%) | 0 (0.0%) |
| 18 to 34 Years | 0 (0.0%) | 0 (0.0%) |
| 35 to 64 Years | 0 (0.0%) | 0 (0.0%) |
| 65 to 74 Years | 0 (0.0%) | 0 (0.0%) |
| 75 Years and over | 0 (0.0%) | 0 (0.0%) |
Disability Class: Cognitive Difficulty
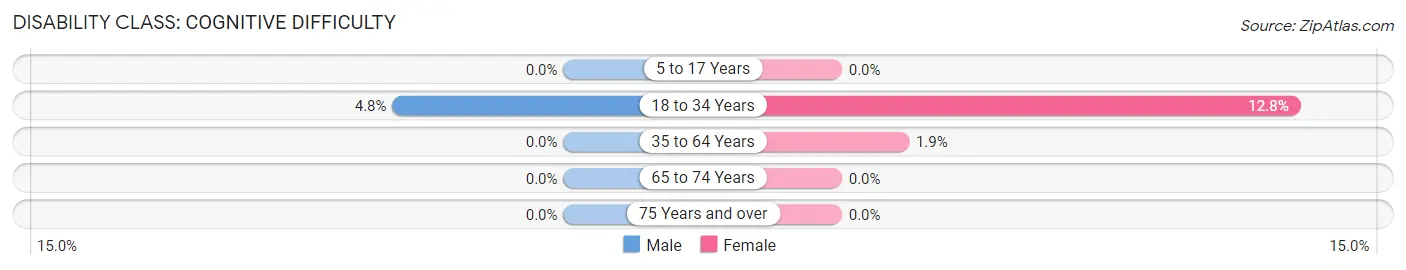
| Age Bracket | Male | Female |
| 5 to 17 Years | 0 (0.0%) | 0 (0.0%) |
| 18 to 34 Years | 2 (4.8%) | 6 (12.8%) |
| 35 to 64 Years | 0 (0.0%) | 2 (1.9%) |
| 65 to 74 Years | 0 (0.0%) | 0 (0.0%) |
| 75 Years and over | 0 (0.0%) | 0 (0.0%) |
Disability Class: Ambulatory Difficulty
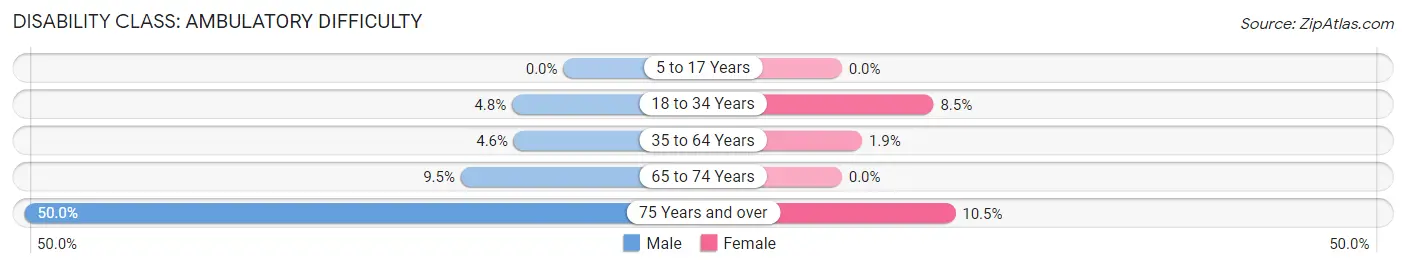
| Age Bracket | Male | Female |
| 5 to 17 Years | 0 (0.0%) | 0 (0.0%) |
| 18 to 34 Years | 2 (4.8%) | 4 (8.5%) |
| 35 to 64 Years | 5 (4.6%) | 2 (1.9%) |
| 65 to 74 Years | 2 (9.5%) | 0 (0.0%) |
| 75 Years and over | 3 (50.0%) | 2 (10.5%) |
Disability Class: Self-Care Difficulty
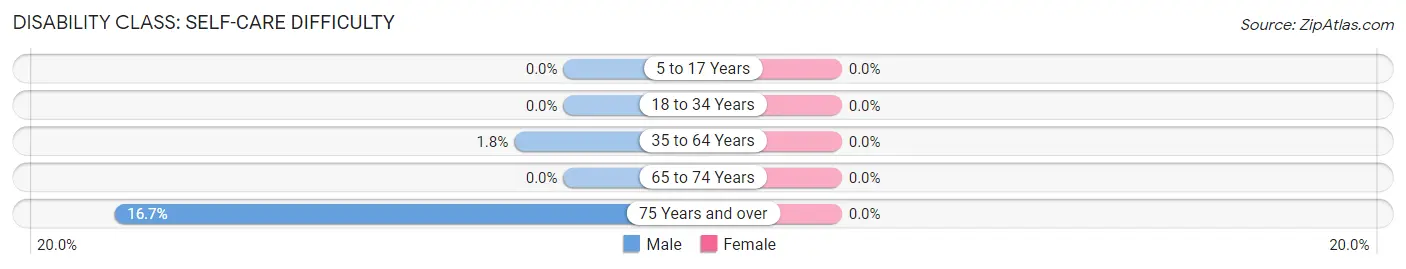
| Age Bracket | Male | Female |
| 5 to 17 Years | 0 (0.0%) | 0 (0.0%) |
| 18 to 34 Years | 0 (0.0%) | 0 (0.0%) |
| 35 to 64 Years | 2 (1.8%) | 0 (0.0%) |
| 65 to 74 Years | 0 (0.0%) | 0 (0.0%) |
| 75 Years and over | 1 (16.7%) | 0 (0.0%) |
Technology Access in Badger
Computing Device Access in Badger
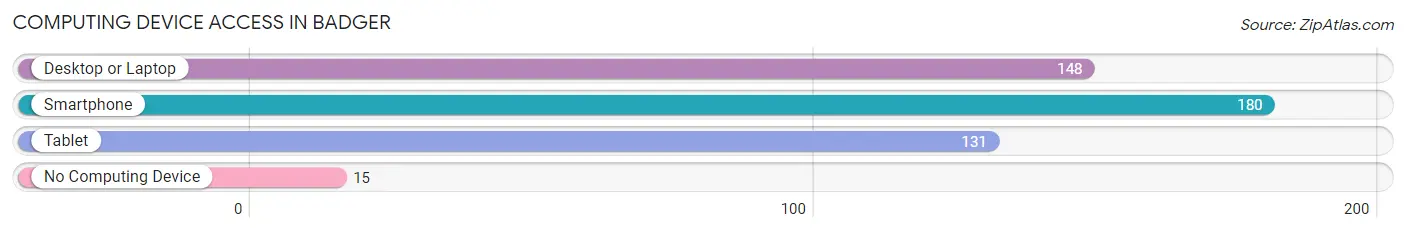
| Device Type | # Households | % Households |
| Desktop or Laptop | 148 | 68.8% |
| Smartphone | 180 | 83.7% |
| Tablet | 131 | 60.9% |
| No Computing Device | 15 | 7.0% |
| Total | 215 | 100.0% |
Internet Access in Badger
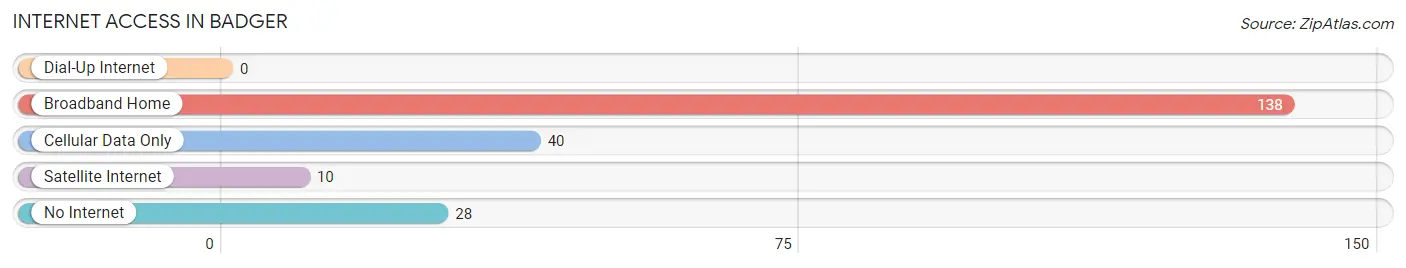
| Internet Type | # Households | % Households |
| Dial-Up Internet | 0 | 0.0% |
| Broadband Home | 138 | 64.2% |
| Cellular Data Only | 40 | 18.6% |
| Satellite Internet | 10 | 4.6% |
| No Internet | 28 | 13.0% |
| Total | 215 | 100.0% |
Badger Summary
Badger, Iowa is a small town located in the northwest corner of the state, in Pocahontas County. It is situated on the banks of the Des Moines River, and is surrounded by rolling hills and farmland. The town has a population of just over 500 people, and is a quiet, rural community.
History
Badger was founded in 1881 by a group of settlers from Wisconsin. The town was named after the badger, a small mammal native to the area. The settlers were attracted to the area by the abundance of timber and the potential for farming. The town quickly grew, and by the early 1900s, it had become a thriving community.
The town was home to a variety of businesses, including a general store, a blacksmith, a hotel, and a sawmill. The town also had a school, a post office, and a church. The town was connected to the outside world by a railroad line, which allowed for the transport of goods and people.
Geography
Badger is located in the northwest corner of Iowa, in Pocahontas County. It is situated on the banks of the Des Moines River, and is surrounded by rolling hills and farmland. The town is located about 30 miles from the state capital of Des Moines.
The town is located in a temperate climate, with hot summers and cold winters. The average temperature in the summer is around 75 degrees Fahrenheit, and the average temperature in the winter is around 25 degrees Fahrenheit. The town receives an average of 40 inches of precipitation per year.
Economy
The economy of Badger is largely based on agriculture. The town is surrounded by farmland, and many of the residents are involved in farming or related activities. The town also has a few small businesses, including a general store, a hardware store, and a restaurant.
The town is also home to a few manufacturing companies, including a furniture factory and a plastics factory. These companies provide jobs for many of the town’s residents.
Demographics
As of the 2010 census, the population of Badger was 514 people. The town is predominantly white, with 94.3% of the population identifying as white. The town also has a small Hispanic population, with 4.3% of the population identifying as Hispanic or Latino.
The median household income in Badger is $41,250, and the median home value is $90,000. The town has a poverty rate of 11.3%, which is slightly higher than the state average of 10.7%.
Badger is a small, rural town with a rich history and a strong sense of community. The town is surrounded by farmland, and the economy is largely based on agriculture. The town has a diverse population, and is a great place to live and work.
Common Questions
What is Per Capita Income in Badger?
Per Capita income in Badger is $33,742.
What is the Median Family Income in Badger?
Median Family Income in Badger is $97,188.
What is the Median Household income in Badger?
Median Household Income in Badger is $72,250.
What is Income or Wage Gap in Badger?
Income or Wage Gap in Badger is 15.9%.
Women in Badger earn 84.1 cents for every dollar earned by a man.
What is Inequality or Gini Index in Badger?
Inequality or Gini Index in Badger is 0.33.
What is the Total Population of Badger?
Total Population of Badger is 519.
What is the Total Male Population of Badger?
Total Male Population of Badger is 241.
What is the Total Female Population of Badger?
Total Female Population of Badger is 278.
What is the Ratio of Males per 100 Females in Badger?
There are 86.69 Males per 100 Females in Badger.
What is the Ratio of Females per 100 Males in Badger?
There are 115.35 Females per 100 Males in Badger.
What is the Median Population Age in Badger?
Median Population Age in Badger is 41.5 Years.
What is the Average Family Size in Badger
Average Family Size in Badger is 3.1 People.
What is the Average Household Size in Badger
Average Household Size in Badger is 2.4 People.
How Large is the Labor Force in Badger?
There are 300 People in the Labor Forcein in Badger.
What is the Percentage of People in the Labor Force in Badger?
71.9% of People are in the Labor Force in Badger.
What is the Unemployment Rate in Badger?
Unemployment Rate in Badger is 4.3%.