Auburn, IA Map & Demographics
Auburn Map
Auburn Overview
$33,393
PER CAPITA INCOME
$86,250
AVG FAMILY INCOME
$52,500
AVG HOUSEHOLD INCOME
25.3%
WAGE / INCOME GAP [ % ]
74.7¢/ $1
WAGE / INCOME GAP [ $ ]
0.41
INEQUALITY / GINI INDEX
157
TOTAL POPULATION
81
MALE POPULATION
76
FEMALE POPULATION
106.58
MALES / 100 FEMALES
93.83
FEMALES / 100 MALES
34.2
MEDIAN AGE
2.8
AVG FAMILY SIZE
2.0
AVG HOUSEHOLD SIZE
94
LABOR FORCE [ PEOPLE ]
73.4%
PERCENT IN LABOR FORCE
3.2%
UNEMPLOYMENT RATE
Auburn Zip Codes
Auburn Area Codes
Income in Auburn
Income Overview in Auburn
Per Capita Income in Auburn is $33,393, while median incomes of families and households are $86,250 and $52,500 respectively.
| Characteristic | Number | Measure |
| Per Capita Income | 157 | $33,393 |
| Median Family Income | 44 | $86,250 |
| Mean Family Income | 44 | $85,200 |
| Median Household Income | 78 | $52,500 |
| Mean Household Income | 78 | $71,682 |
| Income Deficit | 44 | $0 |
| Wage / Income Gap (%) | 157 | 25.31% |
| Wage / Income Gap ($) | 157 | 74.69¢ per $1 |
| Gini / Inequality Index | 157 | 0.41 |
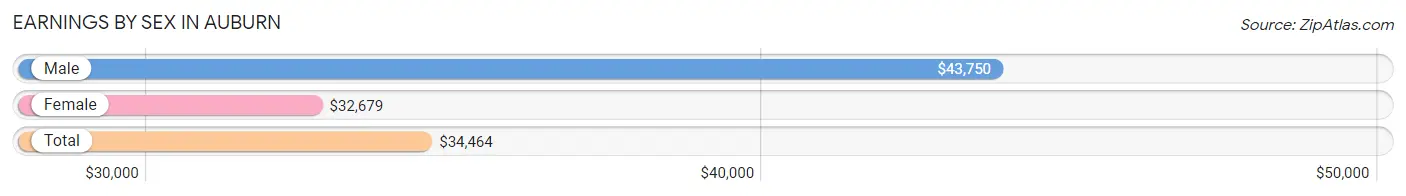
Earnings by Sex in Auburn
Average Earnings in Auburn are $34,464, $43,750 for men and $32,679 for women, a difference of 25.3%.
| Sex | Number | Average Earnings |
| Male | 52 (54.7%) | $43,750 |
| Female | 43 (45.3%) | $32,679 |
| Total | 95 (100.0%) | $34,464 |
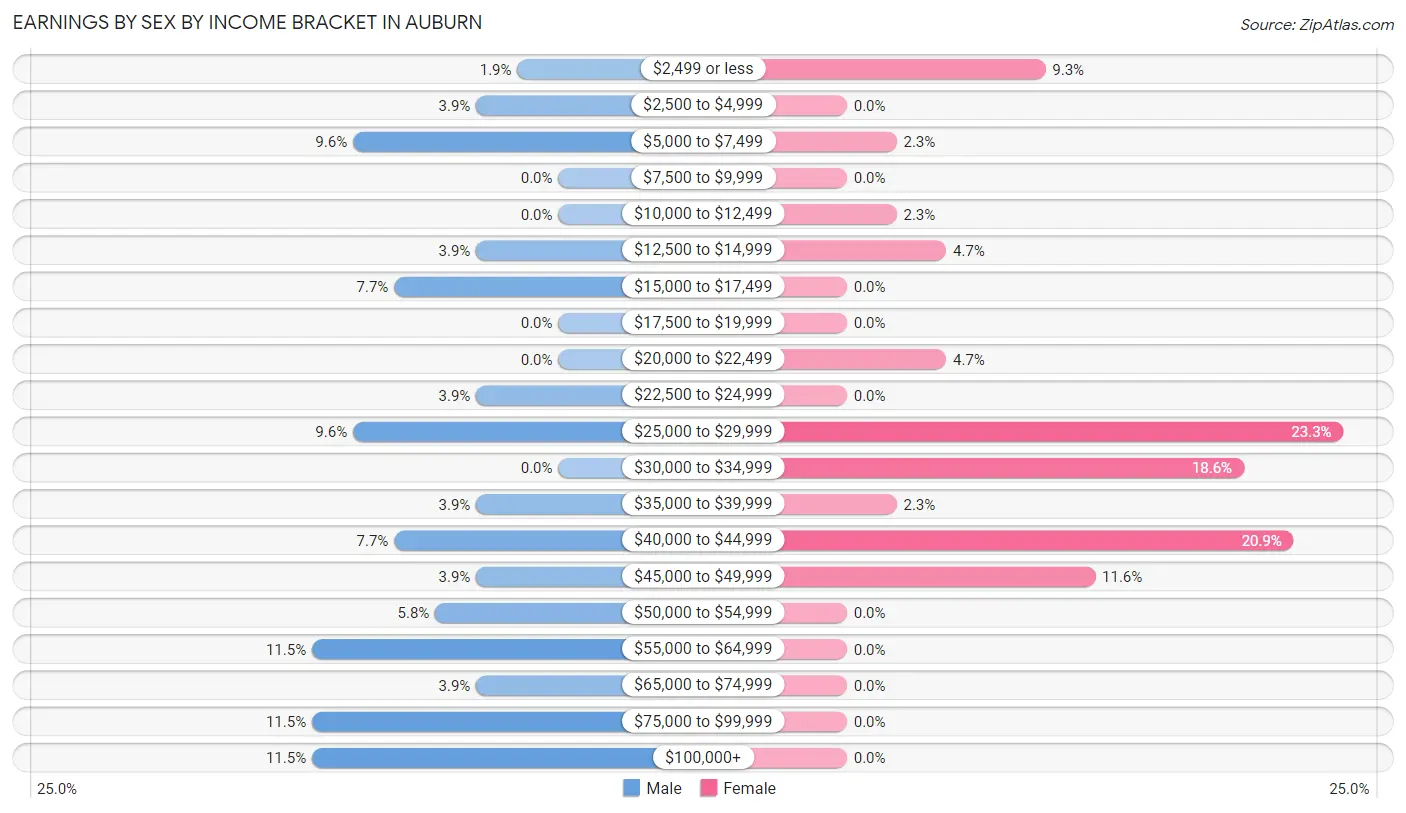
Earnings by Sex by Income Bracket in Auburn
The most common earnings brackets in Auburn are $55,000 to $64,999 for men (6 | 11.5%) and $25,000 to $29,999 for women (10 | 23.3%).
| Income | Male | Female |
| $2,499 or less | 1 (1.9%) | 4 (9.3%) |
| $2,500 to $4,999 | 2 (3.8%) | 0 (0.0%) |
| $5,000 to $7,499 | 5 (9.6%) | 1 (2.3%) |
| $7,500 to $9,999 | 0 (0.0%) | 0 (0.0%) |
| $10,000 to $12,499 | 0 (0.0%) | 1 (2.3%) |
| $12,500 to $14,999 | 2 (3.8%) | 2 (4.6%) |
| $15,000 to $17,499 | 4 (7.7%) | 0 (0.0%) |
| $17,500 to $19,999 | 0 (0.0%) | 0 (0.0%) |
| $20,000 to $22,499 | 0 (0.0%) | 2 (4.6%) |
| $22,500 to $24,999 | 2 (3.8%) | 0 (0.0%) |
| $25,000 to $29,999 | 5 (9.6%) | 10 (23.3%) |
| $30,000 to $34,999 | 0 (0.0%) | 8 (18.6%) |
| $35,000 to $39,999 | 2 (3.8%) | 1 (2.3%) |
| $40,000 to $44,999 | 4 (7.7%) | 9 (20.9%) |
| $45,000 to $49,999 | 2 (3.8%) | 5 (11.6%) |
| $50,000 to $54,999 | 3 (5.8%) | 0 (0.0%) |
| $55,000 to $64,999 | 6 (11.5%) | 0 (0.0%) |
| $65,000 to $74,999 | 2 (3.8%) | 0 (0.0%) |
| $75,000 to $99,999 | 6 (11.5%) | 0 (0.0%) |
| $100,000+ | 6 (11.5%) | 0 (0.0%) |
| Total | 52 (100.0%) | 43 (100.0%) |
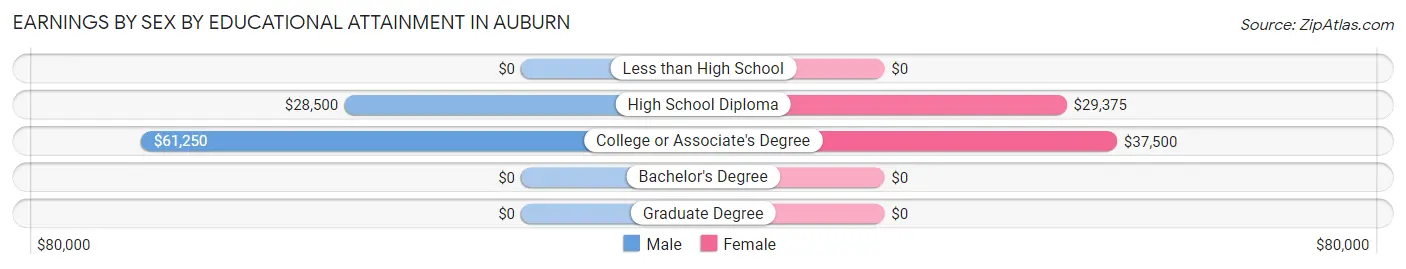
Earnings by Sex by Educational Attainment in Auburn
Average earnings in Auburn are $50,000 for men and $33,393 for women, a difference of 33.2%. Men with an educational attainment of college or associate's degree enjoy the highest average annual earnings of $61,250, while those with high school diploma education earn the least with $28,500. Women with an educational attainment of college or associate's degree earn the most with the average annual earnings of $37,500, while those with high school diploma education have the smallest earnings of $29,375.
| Educational Attainment | Male Income | Female Income |
| Less than High School | - | - |
| High School Diploma | $28,500 | $29,375 |
| College or Associate's Degree | $61,250 | $37,500 |
| Bachelor's Degree | - | - |
| Graduate Degree | - | - |
| Total | $50,000 | $33,393 |
Family Income in Auburn
Family Income Brackets in Auburn
According to the Auburn family income data, there are 11 families falling into the $100,000 to $149,999 income range, which is the most common income bracket and makes up 25.0% of all families.
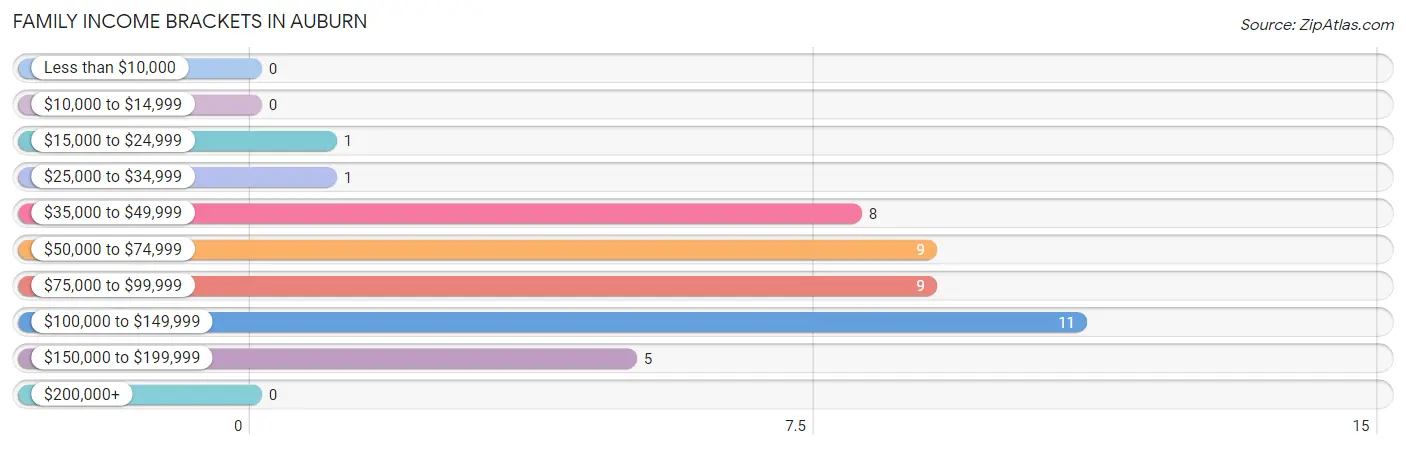
| Income Bracket | # Families | % Families |
| Less than $10,000 | 0 | 0.0% |
| $10,000 to $14,999 | 0 | 0.0% |
| $15,000 to $24,999 | 1 | 2.3% |
| $25,000 to $34,999 | 1 | 2.3% |
| $35,000 to $49,999 | 8 | 18.2% |
| $50,000 to $74,999 | 9 | 20.5% |
| $75,000 to $99,999 | 9 | 20.5% |
| $100,000 to $149,999 | 11 | 25.0% |
| $150,000 to $199,999 | 5 | 11.4% |
| $200,000+ | 0 | 0.0% |
Family Income by Famaliy Size in Auburn
4-person families (4 | 9.1%) account for the highest median family income in Auburn with $101,250 per family, while 2-person families (27 | 61.4%) have the highest median income of $44,062 per family member.
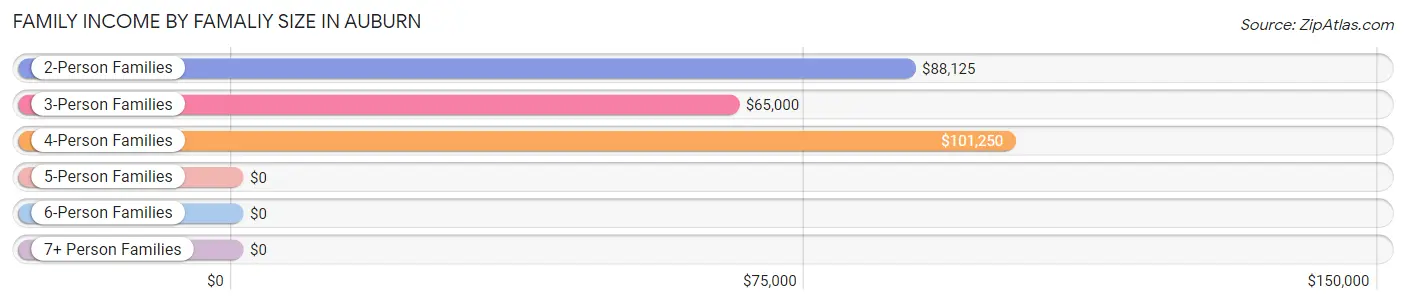
| Income Bracket | # Families | Median Income |
| 2-Person Families | 27 (61.4%) | $88,125 |
| 3-Person Families | 8 (18.2%) | $65,000 |
| 4-Person Families | 4 (9.1%) | $101,250 |
| 5-Person Families | 1 (2.3%) | $0 |
| 6-Person Families | 2 (4.5%) | $0 |
| 7+ Person Families | 2 (4.5%) | $0 |
| Total | 44 (100.0%) | $86,250 |
Family Income by Number of Earners in Auburn
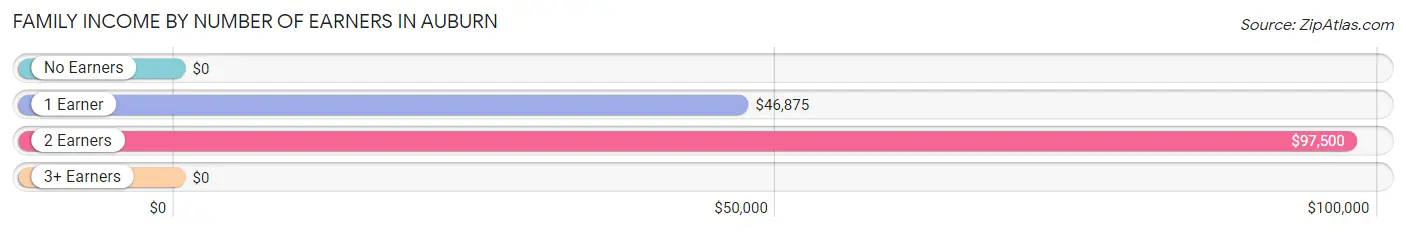
| Number of Earners | # Families | Median Income |
| No Earners | 1 (2.3%) | $0 |
| 1 Earner | 13 (29.5%) | $46,875 |
| 2 Earners | 28 (63.6%) | $97,500 |
| 3+ Earners | 2 (4.5%) | $0 |
| Total | 44 (100.0%) | $86,250 |
Household Income in Auburn
Household Income Brackets in Auburn
With 15 households falling in the category, the $35,000 to $49,999 income range is the most frequent in Auburn, accounting for 19.2% of all households. In contrast, only 1 households (1.3%) fall into the $15,000 to $24,999 income bracket, making it the least populous group.
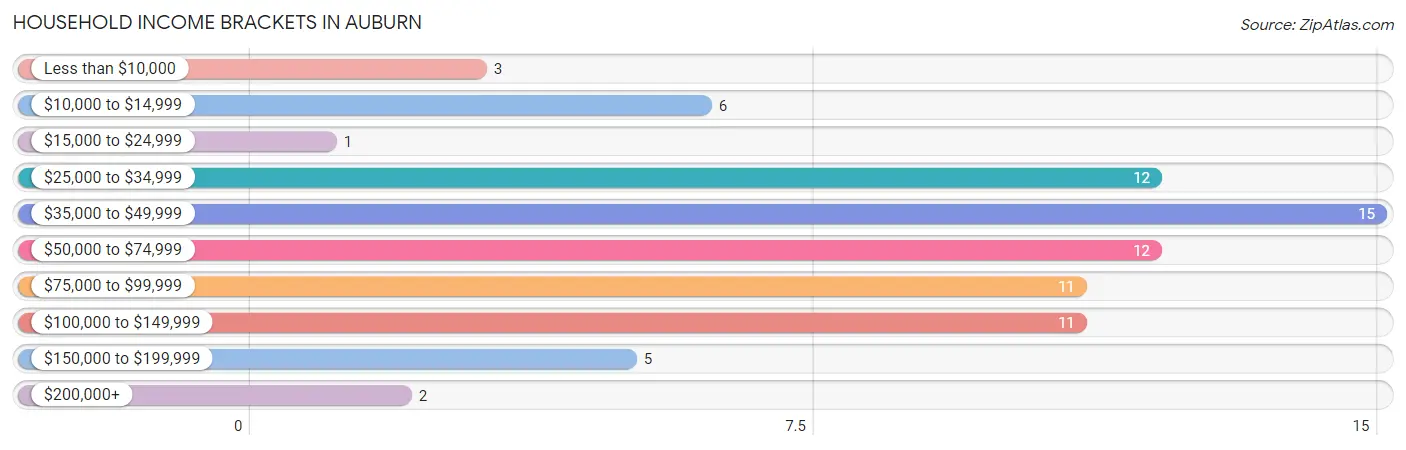
| Income Bracket | # Households | % Households |
| Less than $10,000 | 3 | 3.8% |
| $10,000 to $14,999 | 6 | 7.7% |
| $15,000 to $24,999 | 1 | 1.3% |
| $25,000 to $34,999 | 12 | 15.4% |
| $35,000 to $49,999 | 15 | 19.2% |
| $50,000 to $74,999 | 12 | 15.4% |
| $75,000 to $99,999 | 11 | 14.1% |
| $100,000 to $149,999 | 11 | 14.1% |
| $150,000 to $199,999 | 5 | 6.4% |
| $200,000+ | 2 | 2.6% |
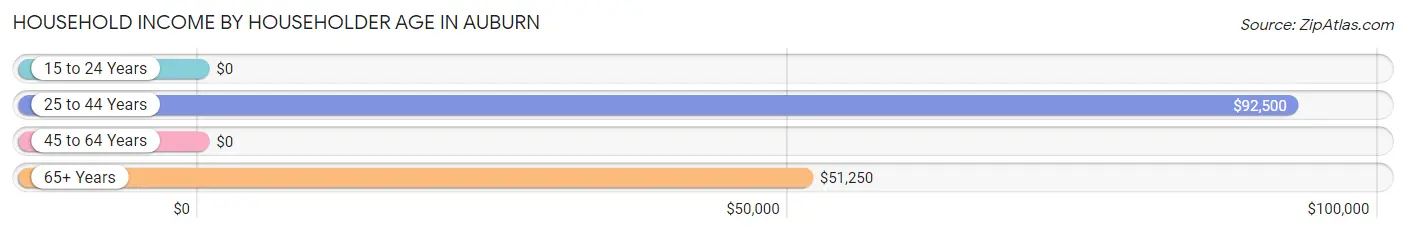
Household Income by Householder Age in Auburn
The median household income in Auburn is $52,500, with the highest median household income of $92,500 found in the 25 to 44 years age bracket for the primary householder. A total of 32 households (41.0%) fall into this category.
| Income Bracket | # Households | Median Income |
| 15 to 24 Years | 0 (0.0%) | $0 |
| 25 to 44 Years | 32 (41.0%) | $92,500 |
| 45 to 64 Years | 20 (25.6%) | $0 |
| 65+ Years | 26 (33.3%) | $51,250 |
| Total | 78 (100.0%) | $52,500 |
Poverty in Auburn
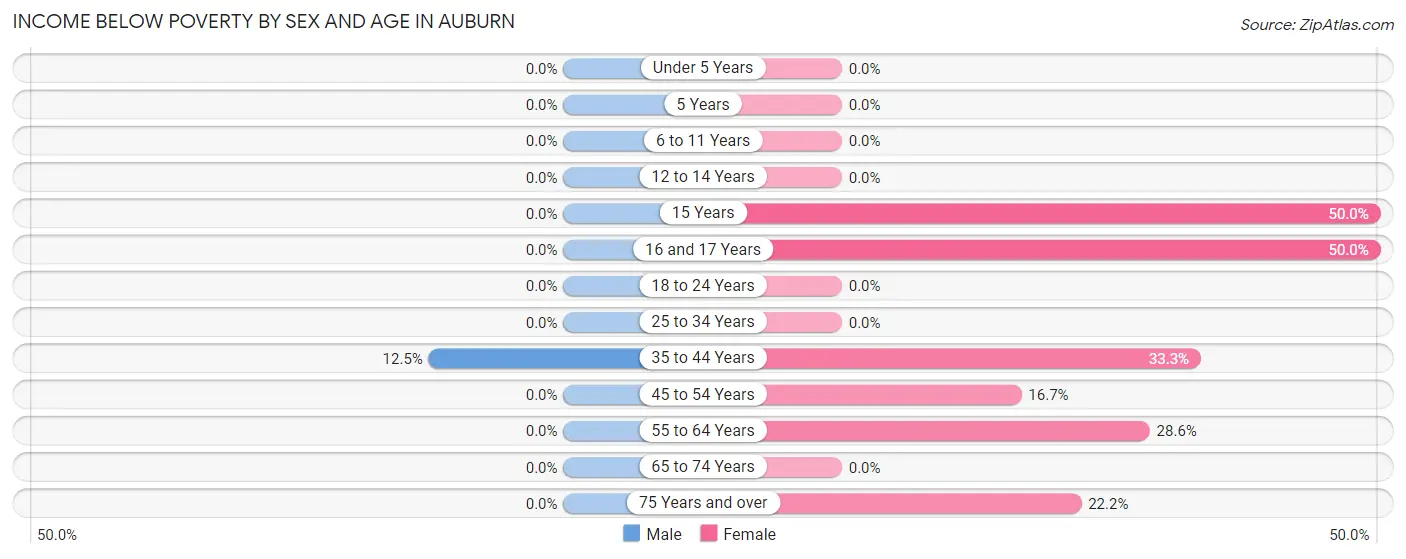
Income Below Poverty by Sex and Age in Auburn
With 1.2% poverty level for males and 13.2% for females among the residents of Auburn, 35 to 44 year old males and 15 year old females are the most vulnerable to poverty, with 1 males (12.5%) and 1 females (50.0%) in their respective age groups living below the poverty level.
| Age Bracket | Male | Female |
| Under 5 Years | 0 (0.0%) | 0 (0.0%) |
| 5 Years | 0 (0.0%) | 0 (0.0%) |
| 6 to 11 Years | 0 (0.0%) | 0 (0.0%) |
| 12 to 14 Years | 0 (0.0%) | 0 (0.0%) |
| 15 Years | 0 (0.0%) | 1 (50.0%) |
| 16 and 17 Years | 0 (0.0%) | 1 (50.0%) |
| 18 to 24 Years | 0 (0.0%) | 0 (0.0%) |
| 25 to 34 Years | 0 (0.0%) | 0 (0.0%) |
| 35 to 44 Years | 1 (12.5%) | 1 (33.3%) |
| 45 to 54 Years | 0 (0.0%) | 1 (16.7%) |
| 55 to 64 Years | 0 (0.0%) | 4 (28.6%) |
| 65 to 74 Years | 0 (0.0%) | 0 (0.0%) |
| 75 Years and over | 0 (0.0%) | 2 (22.2%) |
| Total | 1 (1.2%) | 10 (13.2%) |
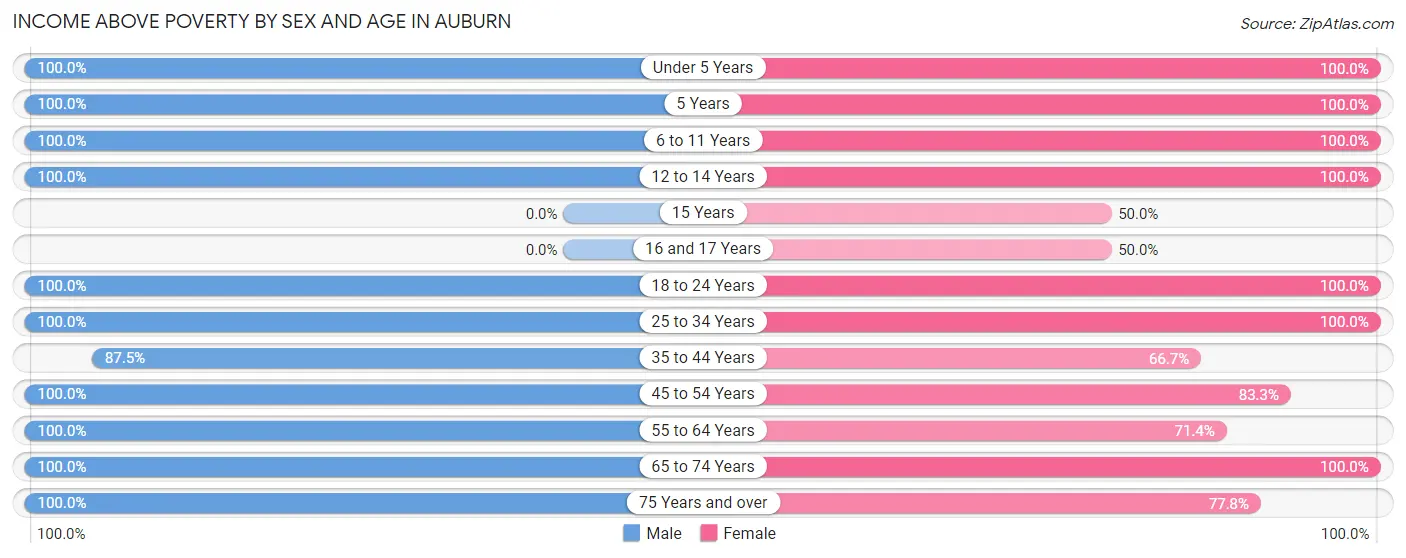
Income Above Poverty by Sex and Age in Auburn
According to the poverty statistics in Auburn, males aged under 5 years and females aged under 5 years are the age groups that are most secure financially, with 100.0% of males and 100.0% of females in these age groups living above the poverty line.
| Age Bracket | Male | Female |
| Under 5 Years | 6 (100.0%) | 2 (100.0%) |
| 5 Years | 1 (100.0%) | 2 (100.0%) |
| 6 to 11 Years | 6 (100.0%) | 8 (100.0%) |
| 12 to 14 Years | 1 (100.0%) | 1 (100.0%) |
| 15 Years | 0 (0.0%) | 1 (50.0%) |
| 16 and 17 Years | 0 (0.0%) | 1 (50.0%) |
| 18 to 24 Years | 6 (100.0%) | 2 (100.0%) |
| 25 to 34 Years | 22 (100.0%) | 20 (100.0%) |
| 35 to 44 Years | 7 (87.5%) | 2 (66.7%) |
| 45 to 54 Years | 3 (100.0%) | 5 (83.3%) |
| 55 to 64 Years | 8 (100.0%) | 10 (71.4%) |
| 65 to 74 Years | 11 (100.0%) | 5 (100.0%) |
| 75 Years and over | 9 (100.0%) | 7 (77.8%) |
| Total | 80 (98.8%) | 66 (86.8%) |
Income Below Poverty Among Married-Couple Families in Auburn
The poverty statistics for married-couple families in Auburn show that 2.7% or 1 of the total 37 families live below the poverty line. Families with 1 or 2 children have the highest poverty rate of 12.5%, comprising of 1 families. On the other hand, families with no children have the lowest poverty rate of 0.0%, which includes 0 families.
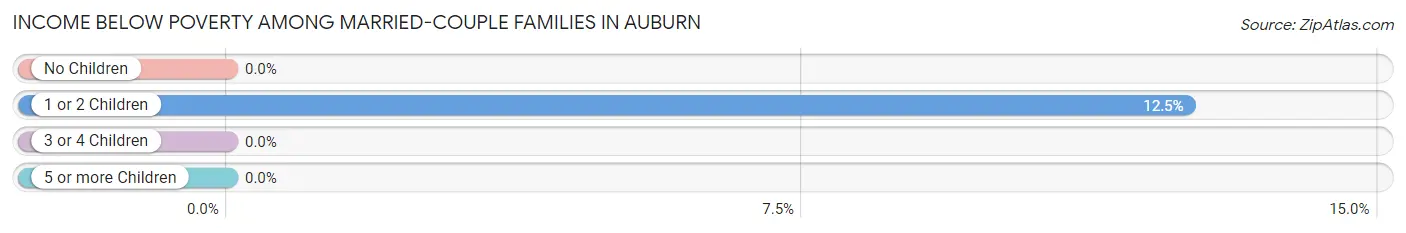
| Children | Above Poverty | Below Poverty |
| No Children | 25 (100.0%) | 0 (0.0%) |
| 1 or 2 Children | 7 (87.5%) | 1 (12.5%) |
| 3 or 4 Children | 2 (100.0%) | 0 (0.0%) |
| 5 or more Children | 2 (100.0%) | 0 (0.0%) |
| Total | 36 (97.3%) | 1 (2.7%) |
Income Below Poverty Among Single-Parent Households in Auburn
| Children | Single Father | Single Mother |
| No Children | 0 (0.0%) | 0 (0.0%) |
| 1 or 2 Children | 0 (0.0%) | 0 (0.0%) |
| 3 or 4 Children | 0 (0.0%) | 0 (0.0%) |
| 5 or more Children | 0 (0.0%) | 0 (0.0%) |
| Total | 0 (0.0%) | 0 (0.0%) |
Income Below Poverty Among Married-Couple vs Single-Parent Households in Auburn
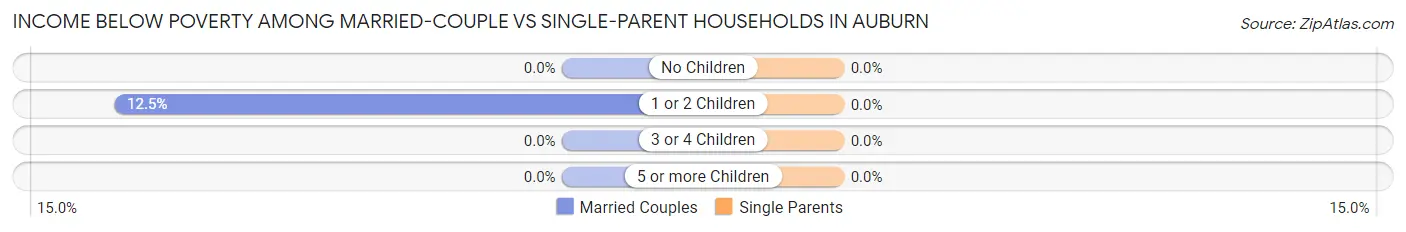
| Children | Married-Couple Families | Single-Parent Households |
| No Children | 0 (0.0%) | 0 (0.0%) |
| 1 or 2 Children | 1 (12.5%) | 0 (0.0%) |
| 3 or 4 Children | 0 (0.0%) | 0 (0.0%) |
| 5 or more Children | 0 (0.0%) | 0 (0.0%) |
| Total | 1 (2.7%) | 0 (0.0%) |
Race in Auburn
The most populous races in Auburn are White / Caucasian (152 | 96.8%), Hispanic or Latino (4 | 2.5%), and Black / African American (3 | 1.9%).
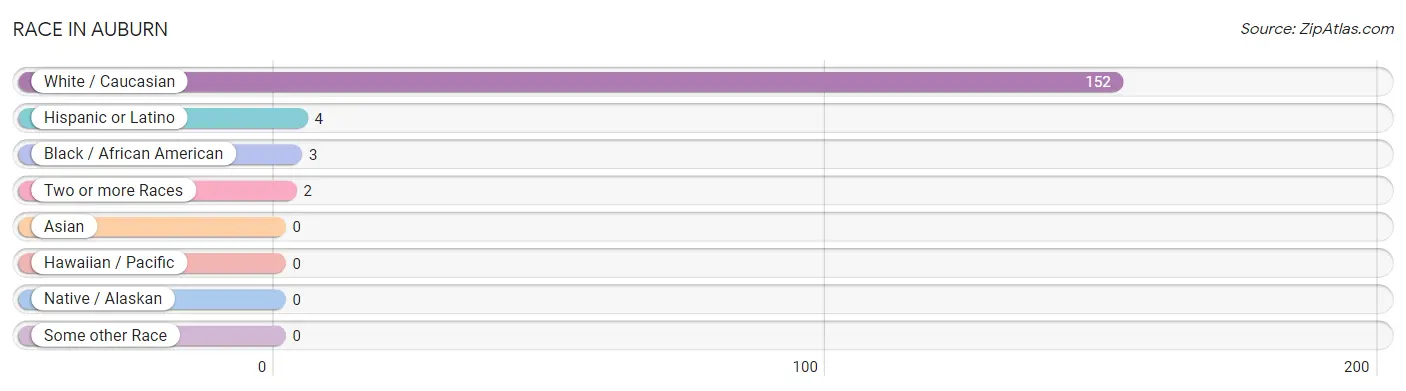
| Race | # Population | % Population |
| Asian | 0 | 0.0% |
| Black / African American | 3 | 1.9% |
| Hawaiian / Pacific | 0 | 0.0% |
| Hispanic or Latino | 4 | 2.5% |
| Native / Alaskan | 0 | 0.0% |
| White / Caucasian | 152 | 96.8% |
| Two or more Races | 2 | 1.3% |
| Some other Race | 0 | 0.0% |
| Total | 157 | 100.0% |
Ancestry in Auburn
The most populous ancestries reported in Auburn are German (75 | 47.8%), Irish (33 | 21.0%), American (8 | 5.1%), English (7 | 4.5%), and Dutch (6 | 3.8%), together accounting for 82.2% of all Auburn residents.
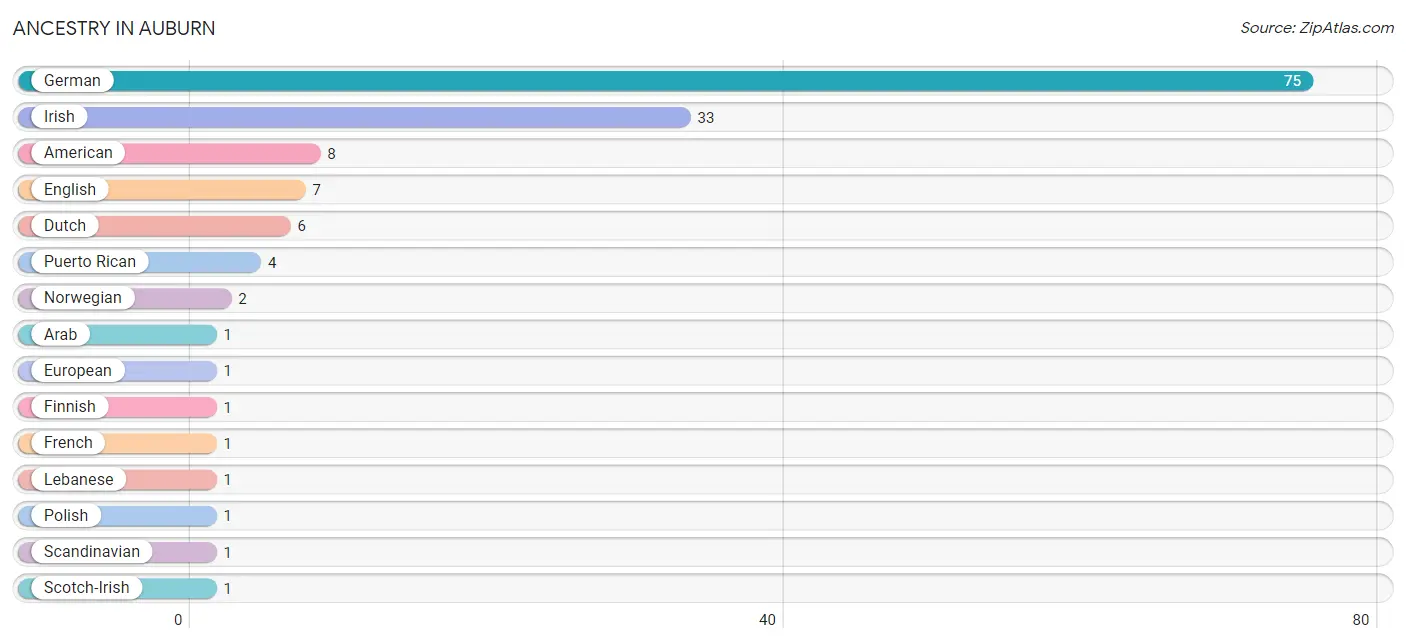
| Ancestry | # Population | % Population |
| American | 8 | 5.1% |
| Arab | 1 | 0.6% |
| Dutch | 6 | 3.8% |
| English | 7 | 4.5% |
| European | 1 | 0.6% |
| Finnish | 1 | 0.6% |
| French | 1 | 0.6% |
| German | 75 | 47.8% |
| Irish | 33 | 21.0% |
| Lebanese | 1 | 0.6% |
| Norwegian | 2 | 1.3% |
| Polish | 1 | 0.6% |
| Puerto Rican | 4 | 2.5% |
| Scandinavian | 1 | 0.6% |
| Scotch-Irish | 1 | 0.6% |
| Scottish | 1 | 0.6% | View All 16 Rows |
Immigrants in Auburn

| Immigration Origin | # Population | % Population | View All 0 Rows |
Sex and Age in Auburn
Sex and Age in Auburn
The most populous age groups in Auburn are 25 to 29 Years (15 | 18.5%) for men and 30 to 34 Years (11 | 14.5%) for women.
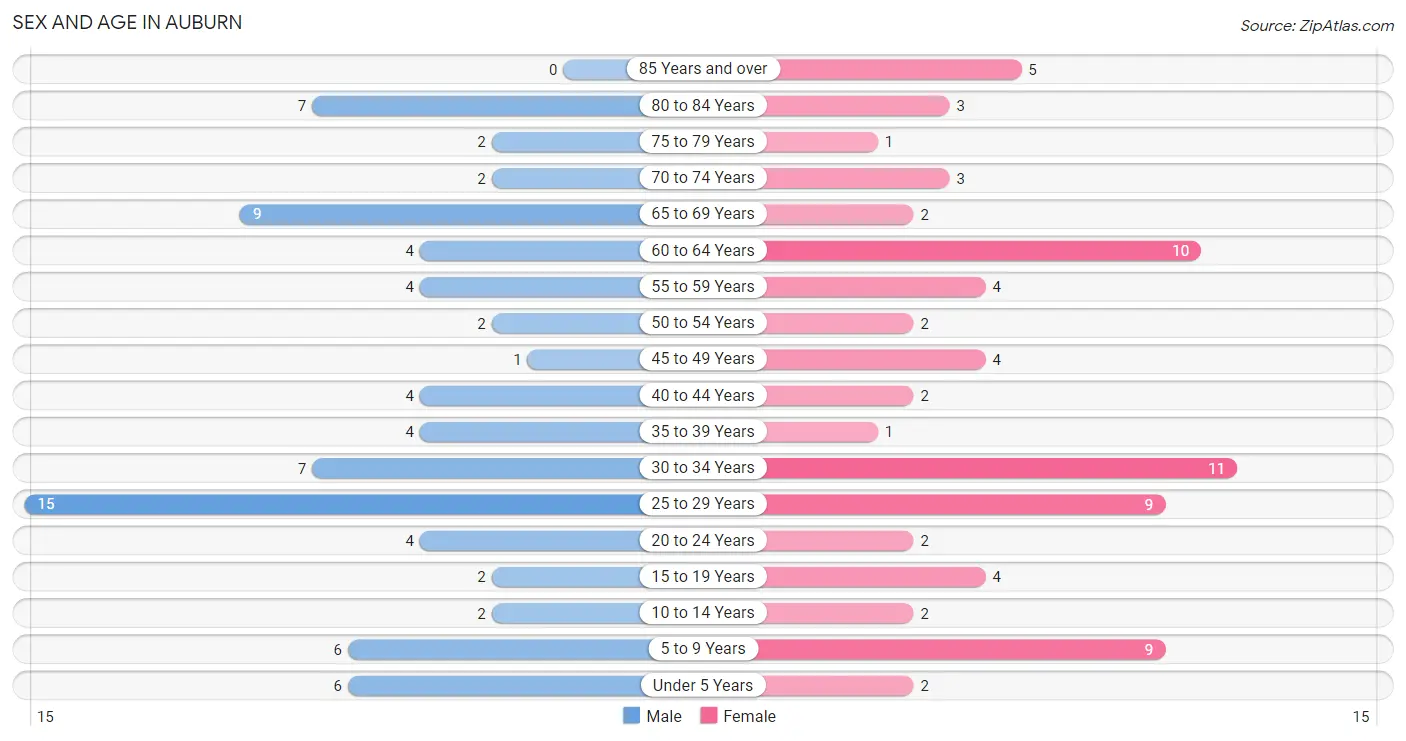
| Age Bracket | Male | Female |
| Under 5 Years | 6 (7.4%) | 2 (2.6%) |
| 5 to 9 Years | 6 (7.4%) | 9 (11.8%) |
| 10 to 14 Years | 2 (2.5%) | 2 (2.6%) |
| 15 to 19 Years | 2 (2.5%) | 4 (5.3%) |
| 20 to 24 Years | 4 (4.9%) | 2 (2.6%) |
| 25 to 29 Years | 15 (18.5%) | 9 (11.8%) |
| 30 to 34 Years | 7 (8.6%) | 11 (14.5%) |
| 35 to 39 Years | 4 (4.9%) | 1 (1.3%) |
| 40 to 44 Years | 4 (4.9%) | 2 (2.6%) |
| 45 to 49 Years | 1 (1.2%) | 4 (5.3%) |
| 50 to 54 Years | 2 (2.5%) | 2 (2.6%) |
| 55 to 59 Years | 4 (4.9%) | 4 (5.3%) |
| 60 to 64 Years | 4 (4.9%) | 10 (13.2%) |
| 65 to 69 Years | 9 (11.1%) | 2 (2.6%) |
| 70 to 74 Years | 2 (2.5%) | 3 (4.0%) |
| 75 to 79 Years | 2 (2.5%) | 1 (1.3%) |
| 80 to 84 Years | 7 (8.6%) | 3 (4.0%) |
| 85 Years and over | 0 (0.0%) | 5 (6.6%) |
| Total | 81 (100.0%) | 76 (100.0%) |
Families and Households in Auburn
Median Family Size in Auburn
The median family size in Auburn is 2.77 persons per family, with single female/mother families (4 | 9.1%) accounting for the largest median family size of 3.25 persons per family. On the other hand, single male/father families (3 | 6.8%) represent the smallest median family size with 2.67 persons per family.
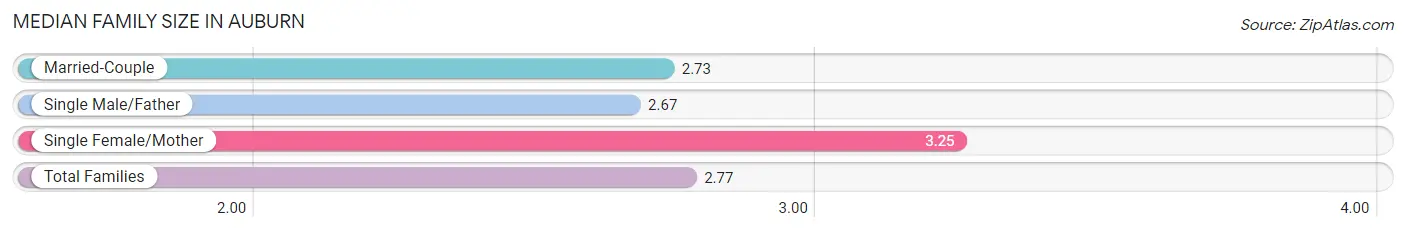
| Family Type | # Families | Family Size |
| Married-Couple | 37 (84.1%) | 2.73 |
| Single Male/Father | 3 (6.8%) | 2.67 |
| Single Female/Mother | 4 (9.1%) | 3.25 |
| Total Families | 44 (100.0%) | 2.77 |
Median Household Size in Auburn
The median household size in Auburn is 2.01 persons per household, with single female/mother households (4 | 5.1%) accounting for the largest median household size of 3.25 persons per household. non-family households (34 | 43.6%) represent the smallest median household size with 1.03 persons per household.
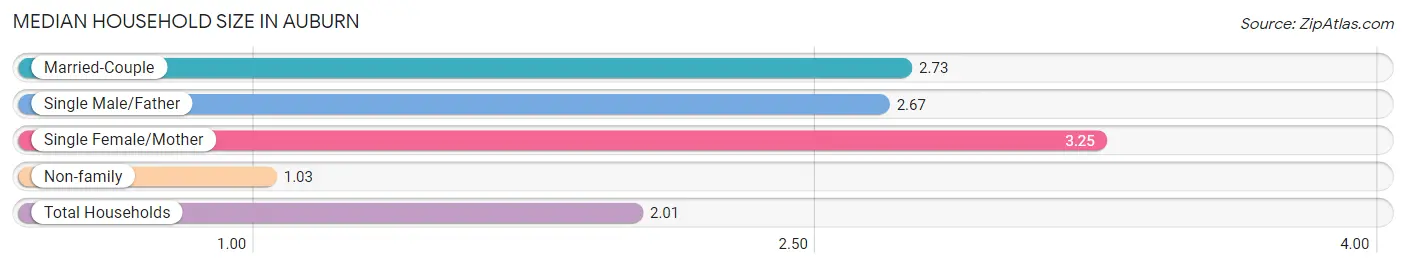
| Household Type | # Households | Household Size |
| Married-Couple | 37 (47.4%) | 2.73 |
| Single Male/Father | 3 (3.8%) | 2.67 |
| Single Female/Mother | 4 (5.1%) | 3.25 |
| Non-family | 34 (43.6%) | 1.03 |
| Total Households | 78 (100.0%) | 2.01 |
Household Size by Marriage Status in Auburn
Out of a total of 78 households in Auburn, 44 (56.4%) are family households, while 34 (43.6%) are nonfamily households. The most numerous type of family households are 2-person households, comprising 27, and the most common type of nonfamily households are 1-person households, comprising 32.
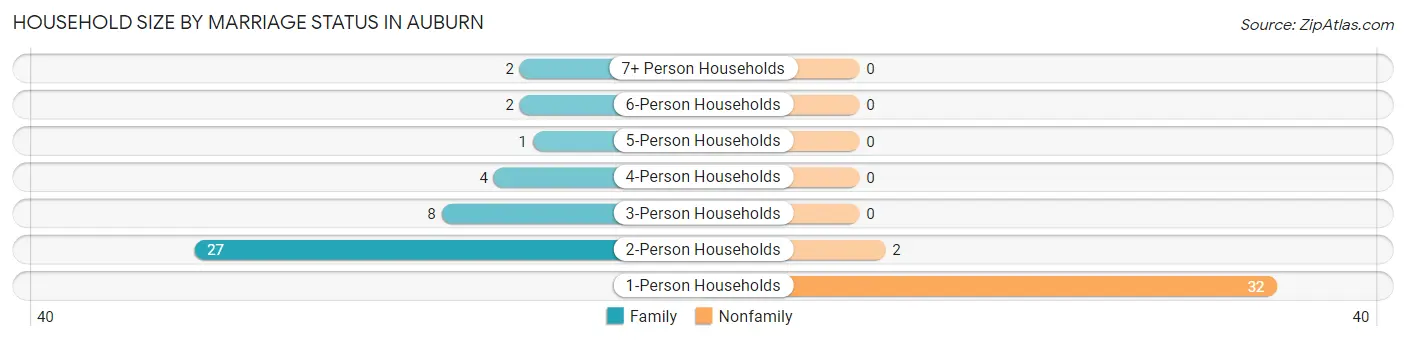
| Household Size | Family Households | Nonfamily Households |
| 1-Person Households | - | 32 (41.0%) |
| 2-Person Households | 27 (34.6%) | 2 (2.6%) |
| 3-Person Households | 8 (10.3%) | 0 (0.0%) |
| 4-Person Households | 4 (5.1%) | 0 (0.0%) |
| 5-Person Households | 1 (1.3%) | 0 (0.0%) |
| 6-Person Households | 2 (2.6%) | 0 (0.0%) |
| 7+ Person Households | 2 (2.6%) | 0 (0.0%) |
| Total | 44 (56.4%) | 34 (43.6%) |
Female Fertility in Auburn
Fertility by Age in Auburn
| Age Bracket | Women with Births | Births / 1,000 Women |
| 15 to 19 years | 0 (0.0%) | 0.0 |
| 20 to 34 years | 0 (0.0%) | 0.0 |
| 35 to 50 years | 0 (0.0%) | 0.0 |
| Total | 0 (0.0%) | 0.0 |
Fertility by Age by Marriage Status in Auburn
| Age Bracket | Married | Unmarried |
| 15 to 19 years | 0 (0.0%) | 0 (0.0%) |
| 20 to 34 years | 0 (0.0%) | 0 (0.0%) |
| 35 to 50 years | 0 (0.0%) | 0 (0.0%) |
| Total | 0 (0.0%) | 0 (0.0%) |
Fertility by Education in Auburn
| Educational Attainment | Women with Births | Births / 1,000 Women |
| Less than High School | 0 (0.0%) | 0.0 |
| High School Diploma | 0 (0.0%) | 0.0 |
| College or Associate's Degree | 0 (0.0%) | 0.0 |
| Bachelor's Degree | 0 (0.0%) | 0.0 |
| Graduate Degree | 0 (0.0%) | 0.0 |
| Total | 0 (0.0%) | 0.0 |
Fertility by Education by Marriage Status in Auburn
| Educational Attainment | Married | Unmarried |
| Less than High School | 0 (0.0%) | 0 (0.0%) |
| High School Diploma | 0 (0.0%) | 0 (0.0%) |
| College or Associate's Degree | 0 (0.0%) | 0 (0.0%) |
| Bachelor's Degree | 0 (0.0%) | 0 (0.0%) |
| Graduate Degree | 0 (0.0%) | 0 (0.0%) |
| Total | 0 (0.0%) | 0 (0.0%) |
Employment Characteristics in Auburn
Employment by Class of Employer in Auburn
Among the 91 employed individuals in Auburn, private company employees (58 | 63.7%), not-for-profit organizations (22 | 24.2%), and local government employees (5 | 5.5%) make up the most common classes of employment.
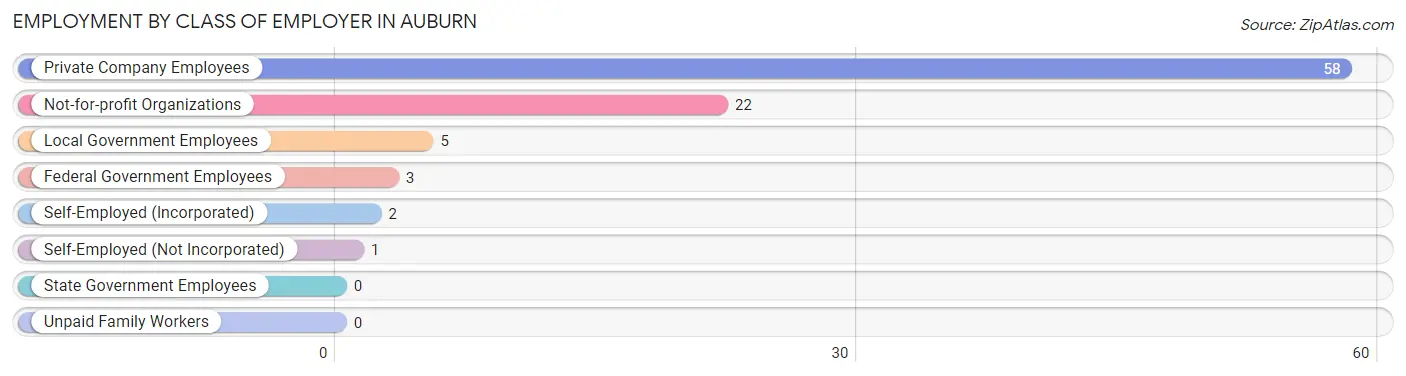
| Employer Class | # Employees | % Employees |
| Private Company Employees | 58 | 63.7% |
| Self-Employed (Incorporated) | 2 | 2.2% |
| Self-Employed (Not Incorporated) | 1 | 1.1% |
| Not-for-profit Organizations | 22 | 24.2% |
| Local Government Employees | 5 | 5.5% |
| State Government Employees | 0 | 0.0% |
| Federal Government Employees | 3 | 3.3% |
| Unpaid Family Workers | 0 | 0.0% |
| Total | 91 | 100.0% |
Employment Status by Age in Auburn
According to the labor force statistics for Auburn, out of the total population over 16 years of age (128), 73.4% or 94 individuals are in the labor force, with 3.2% or 3 of them unemployed. The age group with the highest labor force participation rate is 16 to 19 years, with 100.0% or 4 individuals in the labor force. Within the labor force, the 55 to 59 years age range has the highest percentage of unemployed individuals, with 40.0% or 2 of them being unemployed.
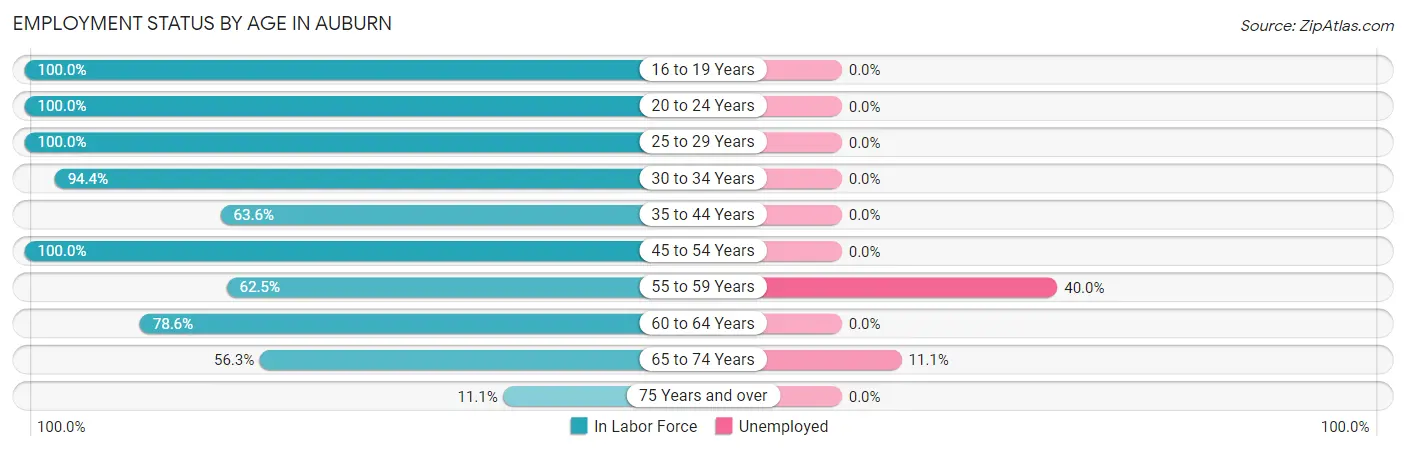
| Age Bracket | In Labor Force | Unemployed |
| 16 to 19 Years | 4 (100.0%) | 0 (0.0%) |
| 20 to 24 Years | 6 (100.0%) | 0 (0.0%) |
| 25 to 29 Years | 24 (100.0%) | 0 (0.0%) |
| 30 to 34 Years | 17 (94.4%) | 0 (0.0%) |
| 35 to 44 Years | 7 (63.6%) | 0 (0.0%) |
| 45 to 54 Years | 9 (100.0%) | 0 (0.0%) |
| 55 to 59 Years | 5 (62.5%) | 2 (40.0%) |
| 60 to 64 Years | 11 (78.6%) | 0 (0.0%) |
| 65 to 74 Years | 9 (56.3%) | 1 (11.1%) |
| 75 Years and over | 2 (11.1%) | 0 (0.0%) |
| Total | 94 (73.4%) | 3 (3.2%) |
Employment Status by Educational Attainment in Auburn
According to labor force statistics for Auburn, 86.9% of individuals (73) out of the total population between 25 and 64 years of age (84) are in the labor force, with 2.7% or 2 of them being unemployed. The group with the highest labor force participation rate are those with the educational attainment of college / associate degree, with 94.9% or 37 individuals in the labor force. Within the labor force, individuals with high school diploma education have the highest percentage of unemployment, with 12.5% or 2 of them being unemployed.
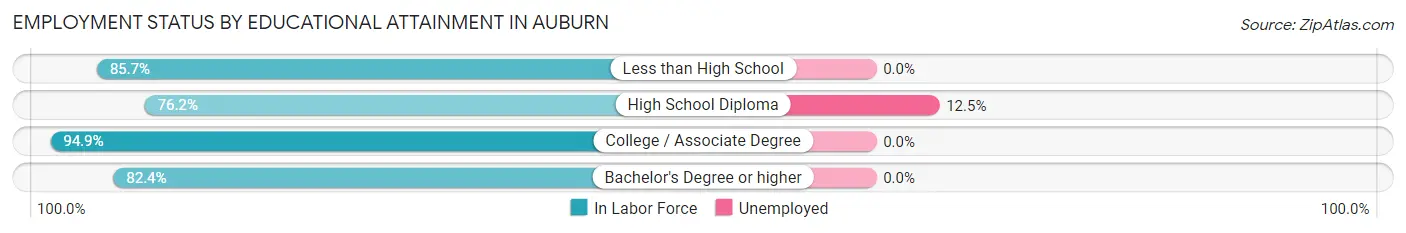
| Educational Attainment | In Labor Force | Unemployed |
| Less than High School | 6 (85.7%) | 0 (0.0%) |
| High School Diploma | 16 (76.2%) | 3 (12.5%) |
| College / Associate Degree | 37 (94.9%) | 0 (0.0%) |
| Bachelor's Degree or higher | 14 (82.4%) | 0 (0.0%) |
| Total | 73 (86.9%) | 2 (2.7%) |
Employment Occupations by Sex in Auburn
Management, Business, Science and Arts Occupations
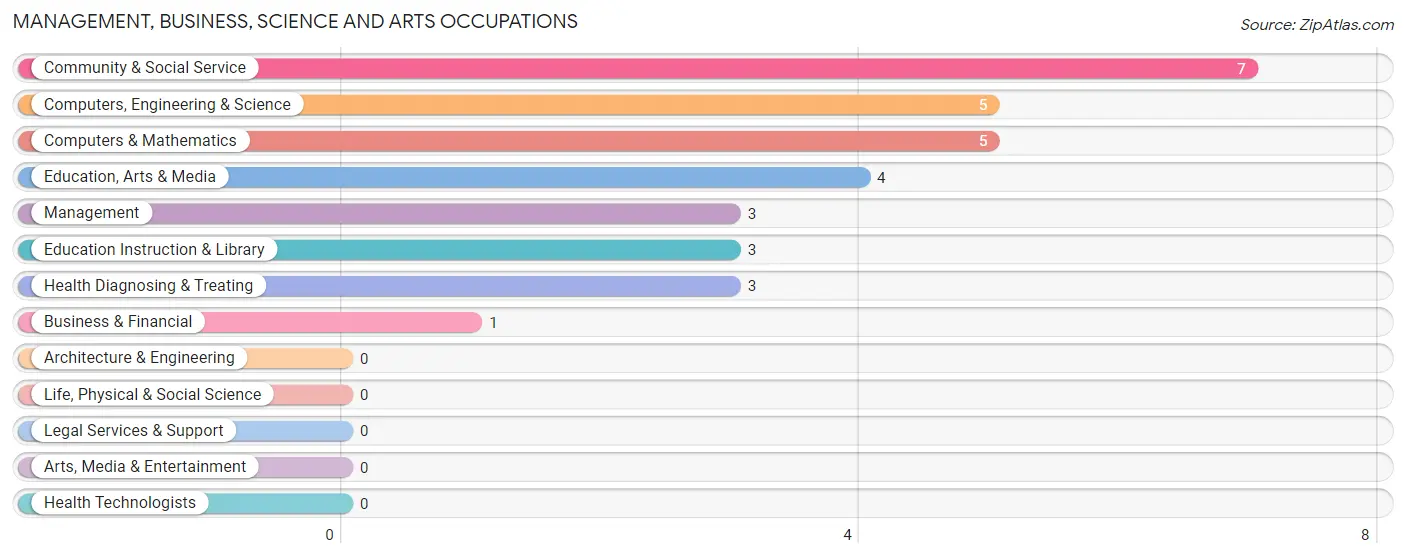
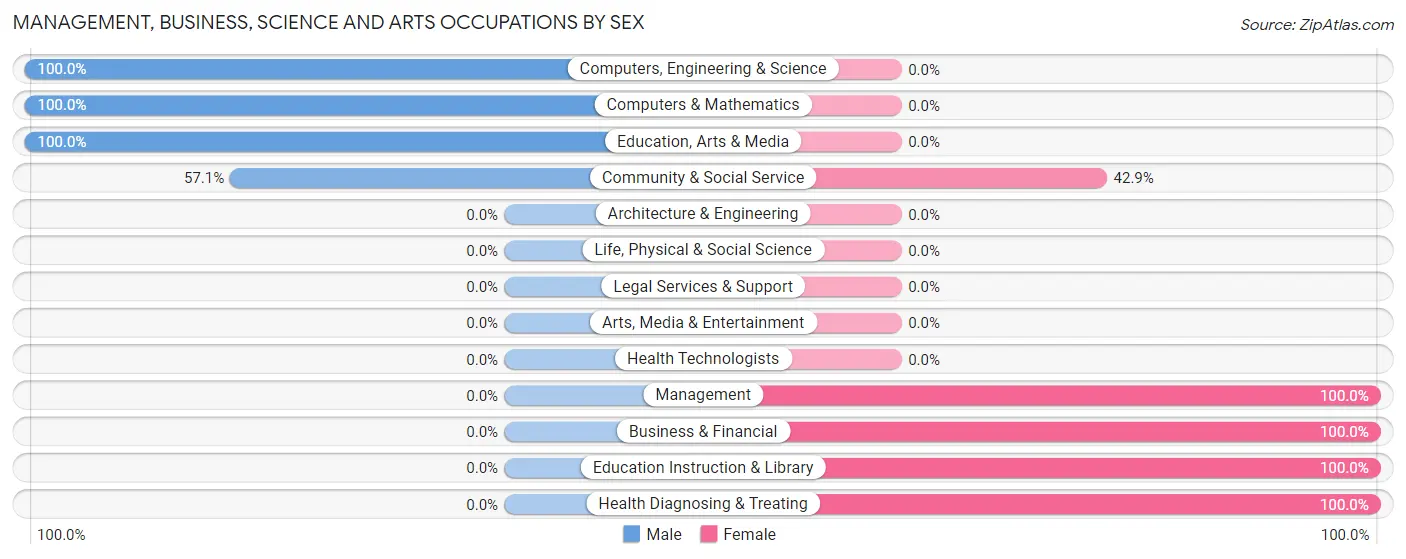
The most common Management, Business, Science and Arts occupations in Auburn are Community & Social Service (7 | 7.7%), Computers, Engineering & Science (5 | 5.5%), Computers & Mathematics (5 | 5.5%), Education, Arts & Media (4 | 4.4%), and Management (3 | 3.3%).
Management, Business, Science and Arts Occupations by Sex
Within the Management, Business, Science and Arts occupations in Auburn, the most male-oriented occupations are Computers, Engineering & Science (100.0%), Computers & Mathematics (100.0%), and Education, Arts & Media (100.0%), while the most female-oriented occupations are Management (100.0%), Business & Financial (100.0%), and Education Instruction & Library (100.0%).
| Occupation | Male | Female |
| Management | 0 (0.0%) | 3 (100.0%) |
| Business & Financial | 0 (0.0%) | 1 (100.0%) |
| Computers, Engineering & Science | 5 (100.0%) | 0 (0.0%) |
| Computers & Mathematics | 5 (100.0%) | 0 (0.0%) |
| Architecture & Engineering | 0 (0.0%) | 0 (0.0%) |
| Life, Physical & Social Science | 0 (0.0%) | 0 (0.0%) |
| Community & Social Service | 4 (57.1%) | 3 (42.9%) |
| Education, Arts & Media | 4 (100.0%) | 0 (0.0%) |
| Legal Services & Support | 0 (0.0%) | 0 (0.0%) |
| Education Instruction & Library | 0 (0.0%) | 3 (100.0%) |
| Arts, Media & Entertainment | 0 (0.0%) | 0 (0.0%) |
| Health Diagnosing & Treating | 0 (0.0%) | 3 (100.0%) |
| Health Technologists | 0 (0.0%) | 0 (0.0%) |
| Total (Category) | 9 (47.4%) | 10 (52.6%) |
| Total (Overall) | 50 (54.9%) | 41 (45.1%) |
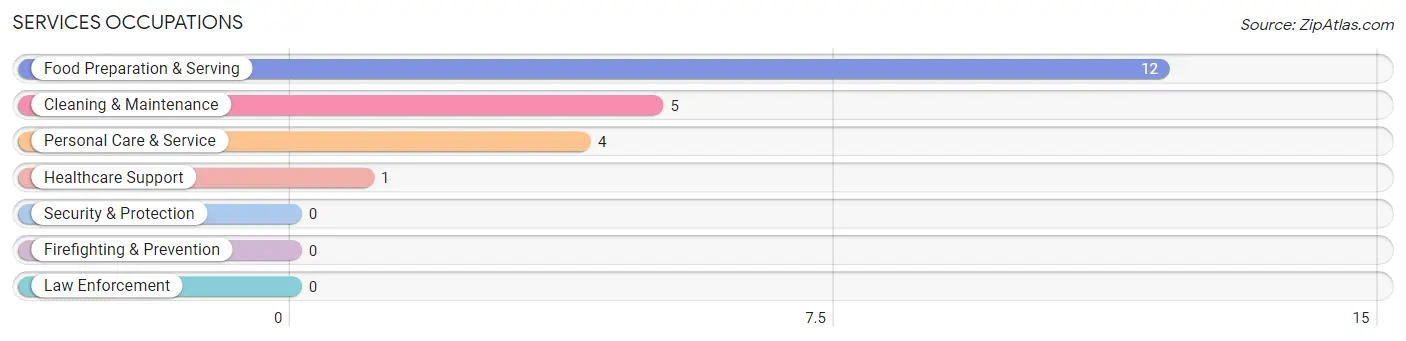
Services Occupations
The most common Services occupations in Auburn are Food Preparation & Serving (12 | 13.2%), Cleaning & Maintenance (5 | 5.5%), Personal Care & Service (4 | 4.4%), and Healthcare Support (1 | 1.1%).
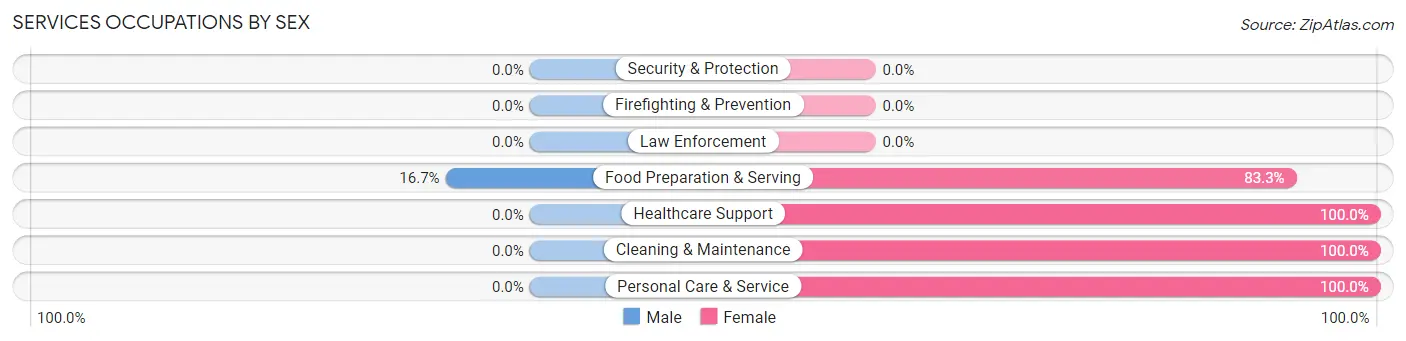
Services Occupations by Sex
| Occupation | Male | Female |
| Healthcare Support | 0 (0.0%) | 1 (100.0%) |
| Security & Protection | 0 (0.0%) | 0 (0.0%) |
| Firefighting & Prevention | 0 (0.0%) | 0 (0.0%) |
| Law Enforcement | 0 (0.0%) | 0 (0.0%) |
| Food Preparation & Serving | 2 (16.7%) | 10 (83.3%) |
| Cleaning & Maintenance | 0 (0.0%) | 5 (100.0%) |
| Personal Care & Service | 0 (0.0%) | 4 (100.0%) |
| Total (Category) | 2 (9.1%) | 20 (90.9%) |
| Total (Overall) | 50 (54.9%) | 41 (45.1%) |
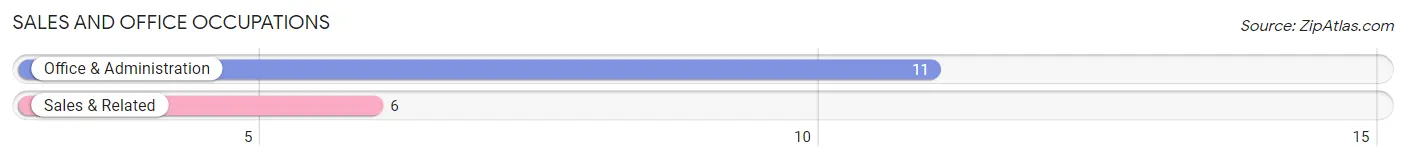
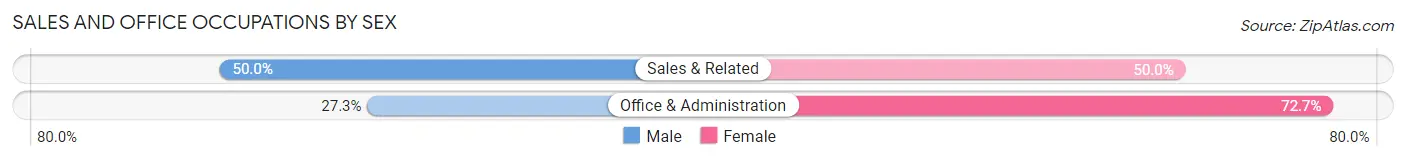
Sales and Office Occupations
The most common Sales and Office occupations in Auburn are Office & Administration (11 | 12.1%), and Sales & Related (6 | 6.6%).
Sales and Office Occupations by Sex
| Occupation | Male | Female |
| Sales & Related | 3 (50.0%) | 3 (50.0%) |
| Office & Administration | 3 (27.3%) | 8 (72.7%) |
| Total (Category) | 6 (35.3%) | 11 (64.7%) |
| Total (Overall) | 50 (54.9%) | 41 (45.1%) |
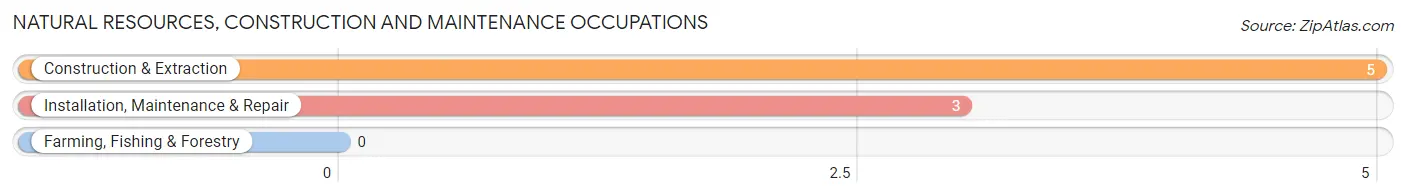
Natural Resources, Construction and Maintenance Occupations
The most common Natural Resources, Construction and Maintenance occupations in Auburn are Construction & Extraction (5 | 5.5%), and Installation, Maintenance & Repair (3 | 3.3%).
Natural Resources, Construction and Maintenance Occupations by Sex
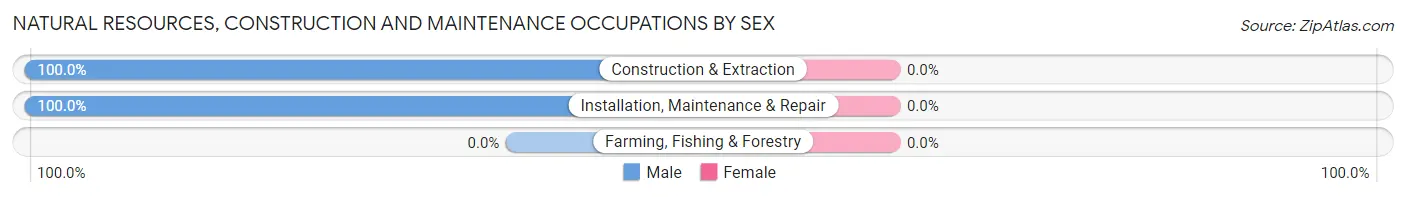
| Occupation | Male | Female |
| Farming, Fishing & Forestry | 0 (0.0%) | 0 (0.0%) |
| Construction & Extraction | 5 (100.0%) | 0 (0.0%) |
| Installation, Maintenance & Repair | 3 (100.0%) | 0 (0.0%) |
| Total (Category) | 8 (100.0%) | 0 (0.0%) |
| Total (Overall) | 50 (54.9%) | 41 (45.1%) |
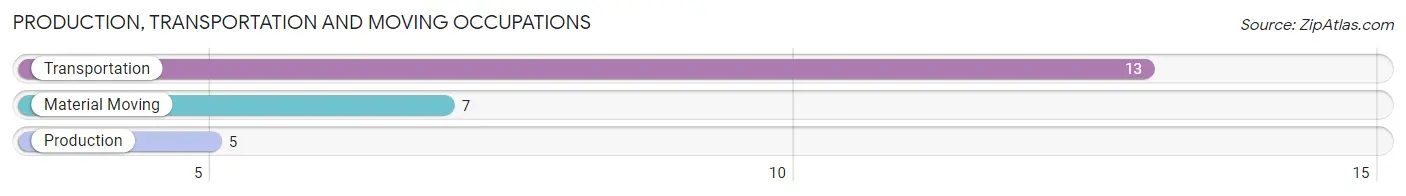
Production, Transportation and Moving Occupations
The most common Production, Transportation and Moving occupations in Auburn are Transportation (13 | 14.3%), Material Moving (7 | 7.7%), and Production (5 | 5.5%).
Production, Transportation and Moving Occupations by Sex
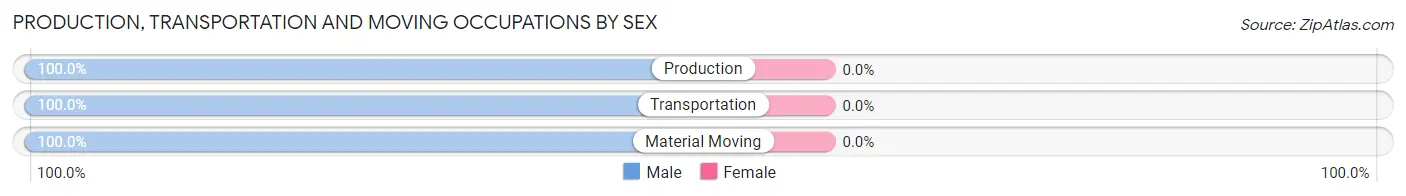
| Occupation | Male | Female |
| Production | 5 (100.0%) | 0 (0.0%) |
| Transportation | 13 (100.0%) | 0 (0.0%) |
| Material Moving | 7 (100.0%) | 0 (0.0%) |
| Total (Category) | 25 (100.0%) | 0 (0.0%) |
| Total (Overall) | 50 (54.9%) | 41 (45.1%) |
Employment Industries by Sex in Auburn
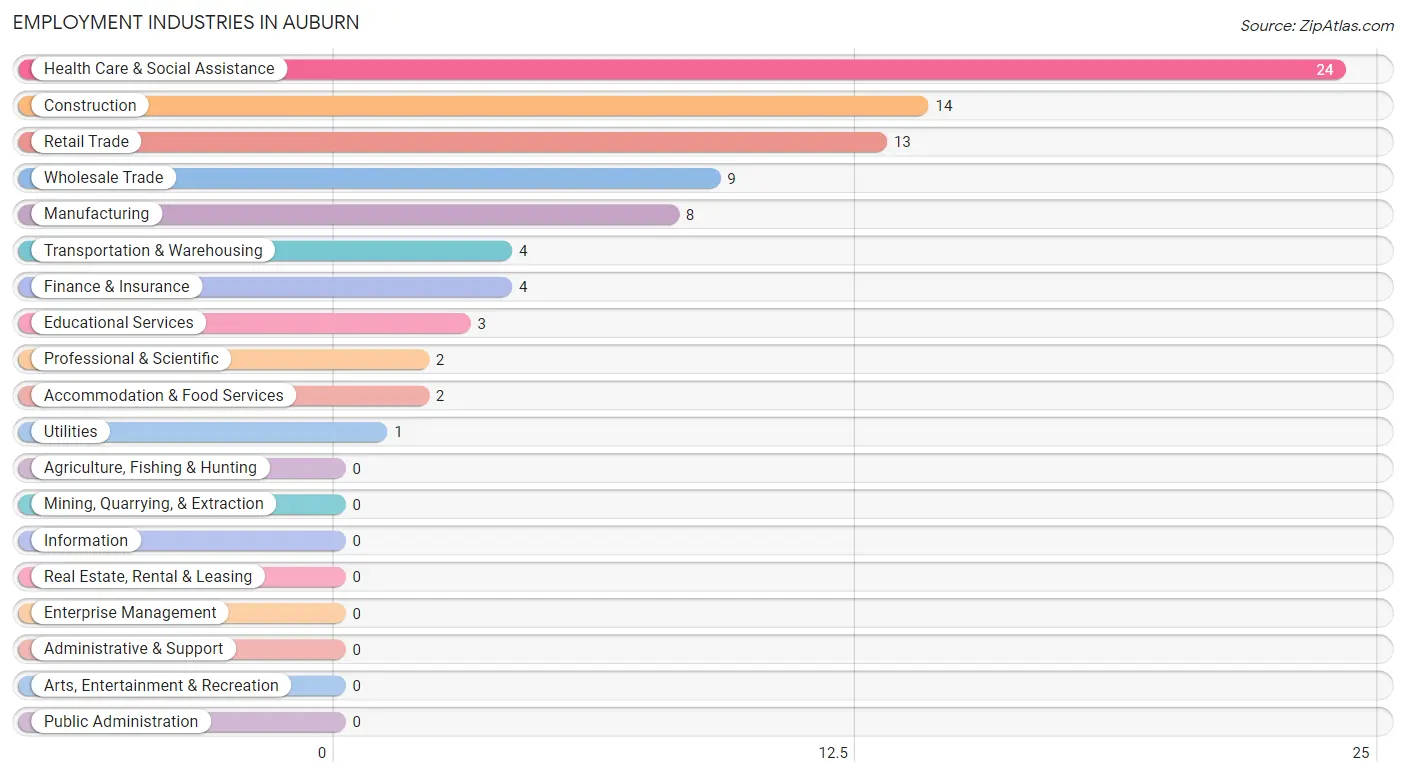
Employment Industries in Auburn
The major employment industries in Auburn include Health Care & Social Assistance (24 | 26.4%), Construction (14 | 15.4%), Retail Trade (13 | 14.3%), Wholesale Trade (9 | 9.9%), and Manufacturing (8 | 8.8%).
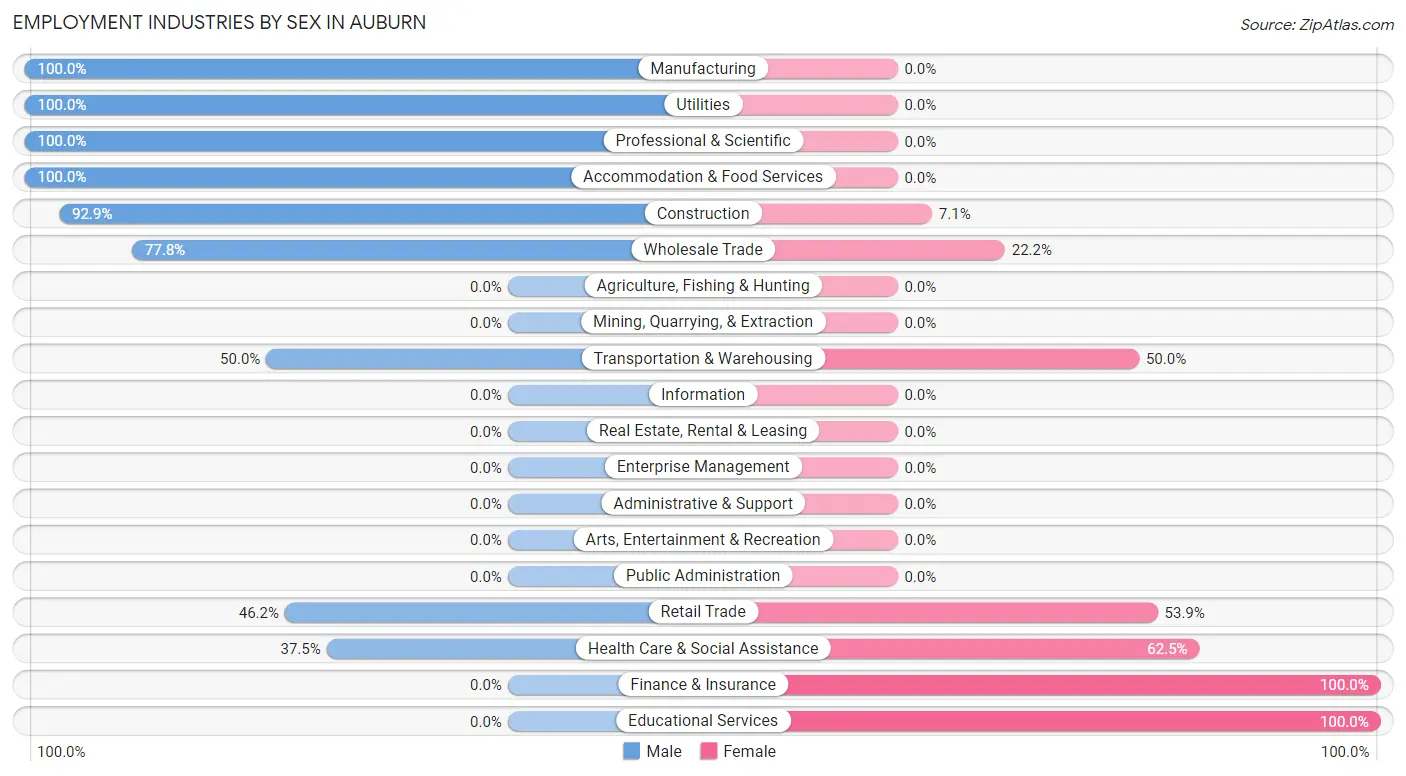
Employment Industries by Sex in Auburn
The Auburn industries that see more men than women are Manufacturing (100.0%), Utilities (100.0%), and Professional & Scientific (100.0%), whereas the industries that tend to have a higher number of women are Finance & Insurance (100.0%), Educational Services (100.0%), and Health Care & Social Assistance (62.5%).
| Industry | Male | Female |
| Agriculture, Fishing & Hunting | 0 (0.0%) | 0 (0.0%) |
| Mining, Quarrying, & Extraction | 0 (0.0%) | 0 (0.0%) |
| Construction | 13 (92.9%) | 1 (7.1%) |
| Manufacturing | 8 (100.0%) | 0 (0.0%) |
| Wholesale Trade | 7 (77.8%) | 2 (22.2%) |
| Retail Trade | 6 (46.2%) | 7 (53.8%) |
| Transportation & Warehousing | 2 (50.0%) | 2 (50.0%) |
| Utilities | 1 (100.0%) | 0 (0.0%) |
| Information | 0 (0.0%) | 0 (0.0%) |
| Finance & Insurance | 0 (0.0%) | 4 (100.0%) |
| Real Estate, Rental & Leasing | 0 (0.0%) | 0 (0.0%) |
| Professional & Scientific | 2 (100.0%) | 0 (0.0%) |
| Enterprise Management | 0 (0.0%) | 0 (0.0%) |
| Administrative & Support | 0 (0.0%) | 0 (0.0%) |
| Educational Services | 0 (0.0%) | 3 (100.0%) |
| Health Care & Social Assistance | 9 (37.5%) | 15 (62.5%) |
| Arts, Entertainment & Recreation | 0 (0.0%) | 0 (0.0%) |
| Accommodation & Food Services | 2 (100.0%) | 0 (0.0%) |
| Public Administration | 0 (0.0%) | 0 (0.0%) |
| Total | 50 (54.9%) | 41 (45.1%) |
Education in Auburn
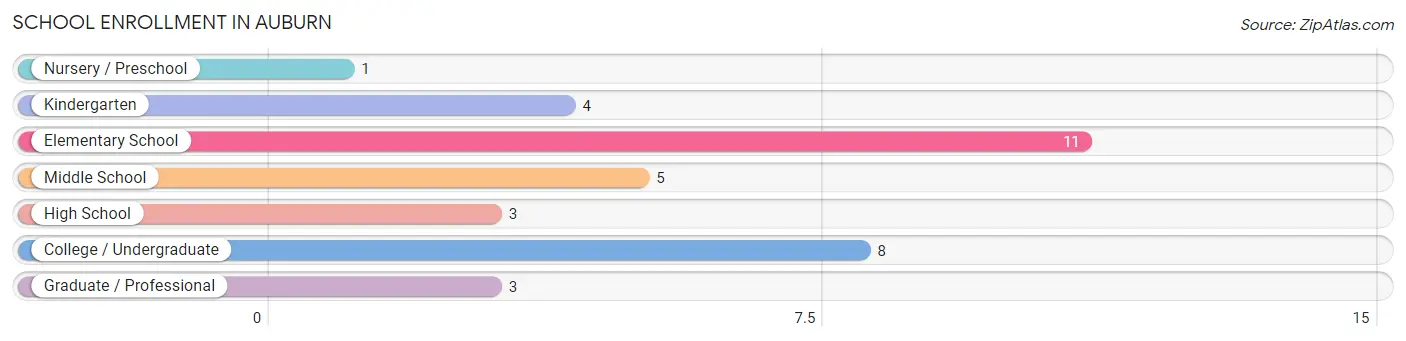
School Enrollment in Auburn
The most common levels of schooling among the 35 students in Auburn are elementary school (11 | 31.4%), college / undergraduate (8 | 22.9%), and middle school (5 | 14.3%).
| School Level | # Students | % Students |
| Nursery / Preschool | 1 | 2.9% |
| Kindergarten | 4 | 11.4% |
| Elementary School | 11 | 31.4% |
| Middle School | 5 | 14.3% |
| High School | 3 | 8.6% |
| College / Undergraduate | 8 | 22.9% |
| Graduate / Professional | 3 | 8.6% |
| Total | 35 | 100.0% |
School Enrollment by Age by Funding Source in Auburn
Out of a total of 35 students who are enrolled in schools in Auburn, 10 (28.6%) attend a private institution, while the remaining 25 (71.4%) are enrolled in public schools. The age group of 20 to 24 year olds has the highest likelihood of being enrolled in private schools, with 2 (100.0% in the age bracket) enrolled. Conversely, the age group of 3 to 4 year olds has the lowest likelihood of being enrolled in a private school, with 1 (100.0% in the age bracket) attending a public institution.
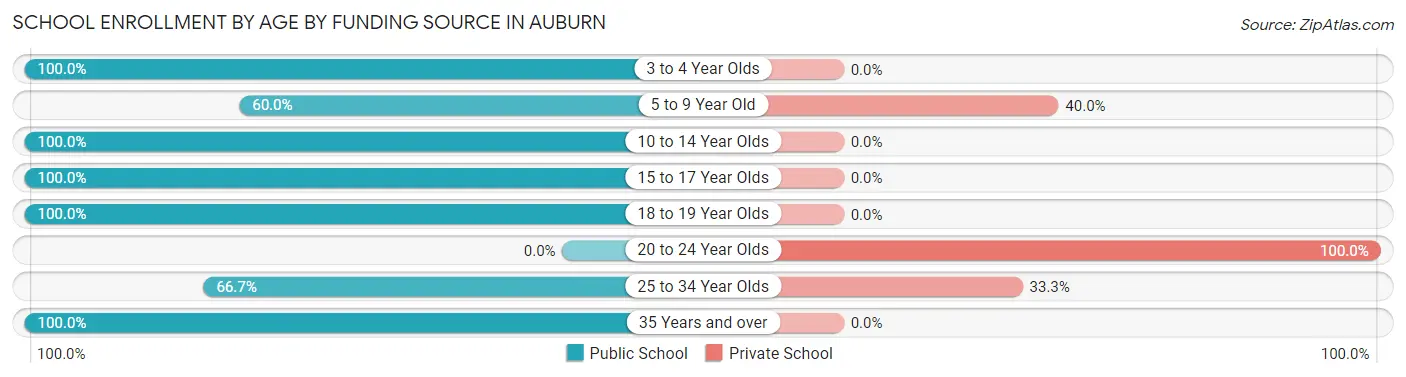
| Age Bracket | Public School | Private School |
| 3 to 4 Year Olds | 1 (100.0%) | 0 (0.0%) |
| 5 to 9 Year Old | 9 (60.0%) | 6 (40.0%) |
| 10 to 14 Year Olds | 4 (100.0%) | 0 (0.0%) |
| 15 to 17 Year Olds | 4 (100.0%) | 0 (0.0%) |
| 18 to 19 Year Olds | 2 (100.0%) | 0 (0.0%) |
| 20 to 24 Year Olds | 0 (0.0%) | 2 (100.0%) |
| 25 to 34 Year Olds | 4 (66.7%) | 2 (33.3%) |
| 35 Years and over | 1 (100.0%) | 0 (0.0%) |
| Total | 25 (71.4%) | 10 (28.6%) |
Educational Attainment by Field of Study in Auburn
Business (6 | 23.1%), engineering (5 | 19.2%), education (5 | 19.2%), bio, nature & agricultural (4 | 15.4%), and literature & languages (4 | 15.4%) are the most common fields of study among 26 individuals in Auburn who have obtained a bachelor's degree or higher.
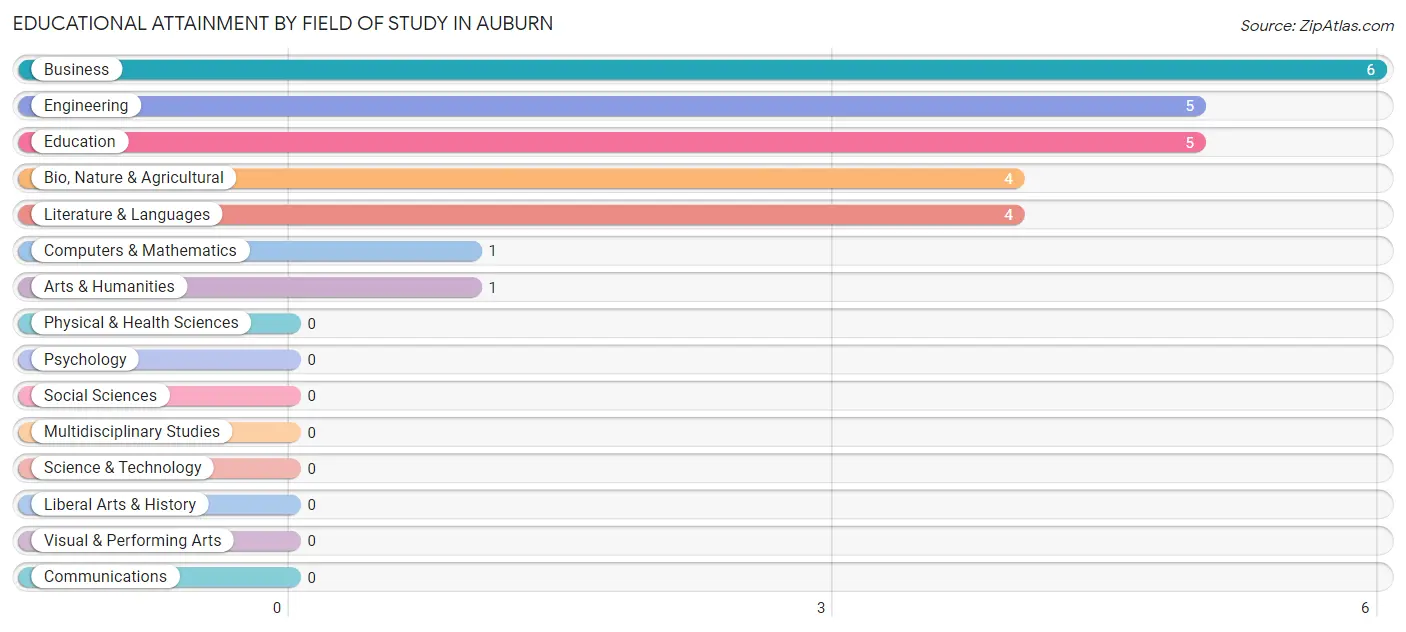
| Field of Study | # Graduates | % Graduates |
| Computers & Mathematics | 1 | 3.8% |
| Bio, Nature & Agricultural | 4 | 15.4% |
| Physical & Health Sciences | 0 | 0.0% |
| Psychology | 0 | 0.0% |
| Social Sciences | 0 | 0.0% |
| Engineering | 5 | 19.2% |
| Multidisciplinary Studies | 0 | 0.0% |
| Science & Technology | 0 | 0.0% |
| Business | 6 | 23.1% |
| Education | 5 | 19.2% |
| Literature & Languages | 4 | 15.4% |
| Liberal Arts & History | 0 | 0.0% |
| Visual & Performing Arts | 0 | 0.0% |
| Communications | 0 | 0.0% |
| Arts & Humanities | 1 | 3.8% |
| Total | 26 | 100.0% |
Transportation & Commute in Auburn
Vehicle Availability by Sex in Auburn
The most prevalent vehicle ownership categories in Auburn are males with 2 vehicles (20, accounting for 40.0%) and females with 2 vehicles (11, making up 48.8%).
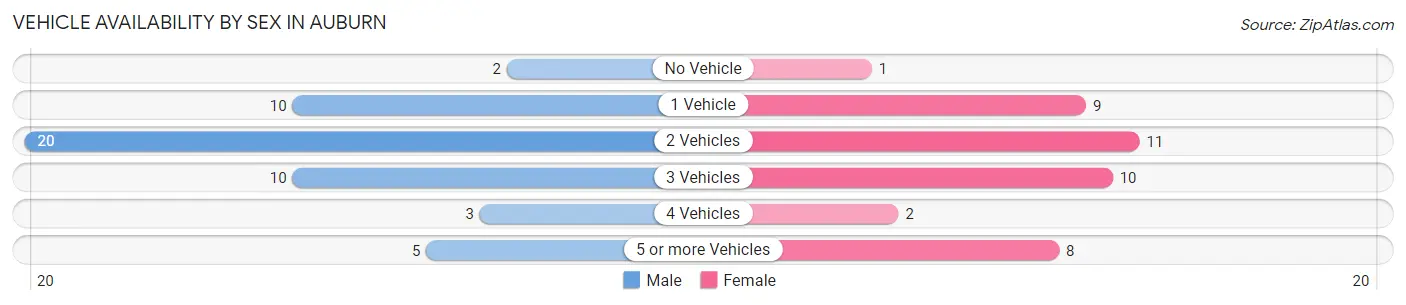
| Vehicles Available | Male | Female |
| No Vehicle | 2 (4.0%) | 1 (2.4%) |
| 1 Vehicle | 10 (20.0%) | 9 (22.0%) |
| 2 Vehicles | 20 (40.0%) | 11 (26.8%) |
| 3 Vehicles | 10 (20.0%) | 10 (24.4%) |
| 4 Vehicles | 3 (6.0%) | 2 (4.9%) |
| 5 or more Vehicles | 5 (10.0%) | 8 (19.5%) |
| Total | 50 (100.0%) | 41 (100.0%) |
Commute Time in Auburn
The most frequently occuring commute durations in Auburn are 20 to 24 minutes (20 commuters, 24.1%), 15 to 19 minutes (17 commuters, 20.5%), and 5 to 9 minutes (16 commuters, 19.3%).
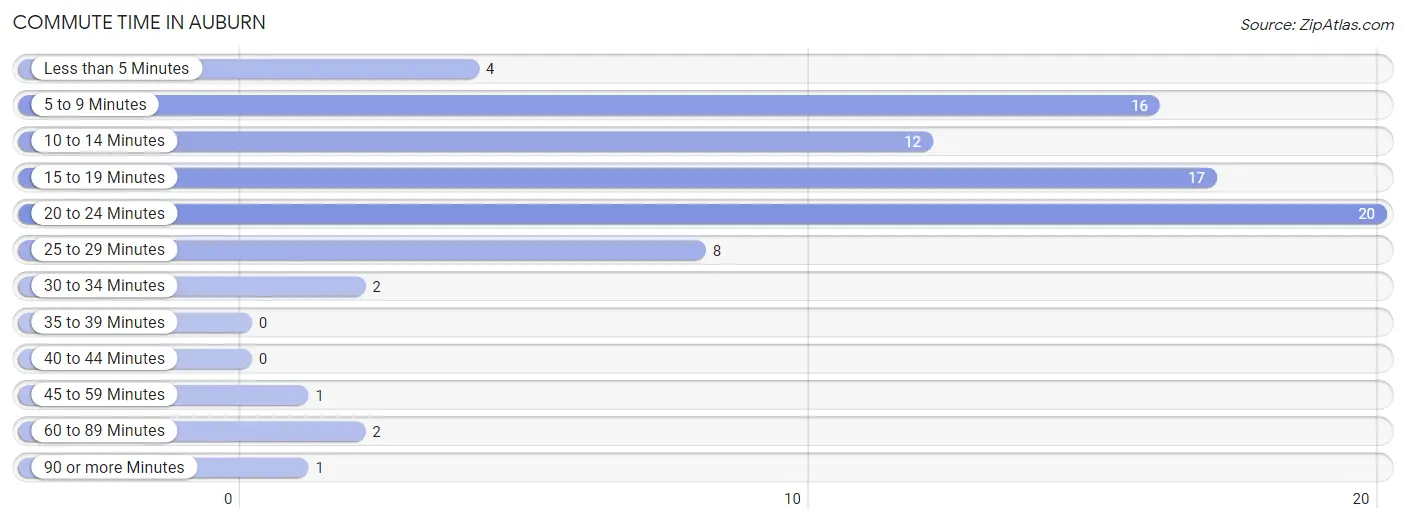
| Commute Time | # Commuters | % Commuters |
| Less than 5 Minutes | 4 | 4.8% |
| 5 to 9 Minutes | 16 | 19.3% |
| 10 to 14 Minutes | 12 | 14.5% |
| 15 to 19 Minutes | 17 | 20.5% |
| 20 to 24 Minutes | 20 | 24.1% |
| 25 to 29 Minutes | 8 | 9.6% |
| 30 to 34 Minutes | 2 | 2.4% |
| 35 to 39 Minutes | 0 | 0.0% |
| 40 to 44 Minutes | 0 | 0.0% |
| 45 to 59 Minutes | 1 | 1.2% |
| 60 to 89 Minutes | 2 | 2.4% |
| 90 or more Minutes | 1 | 1.2% |
Commute Time by Sex in Auburn
The most common commute times in Auburn are 5 to 9 minutes (11 commuters, 25.0%) for males and 20 to 24 minutes (10 commuters, 25.6%) for females.
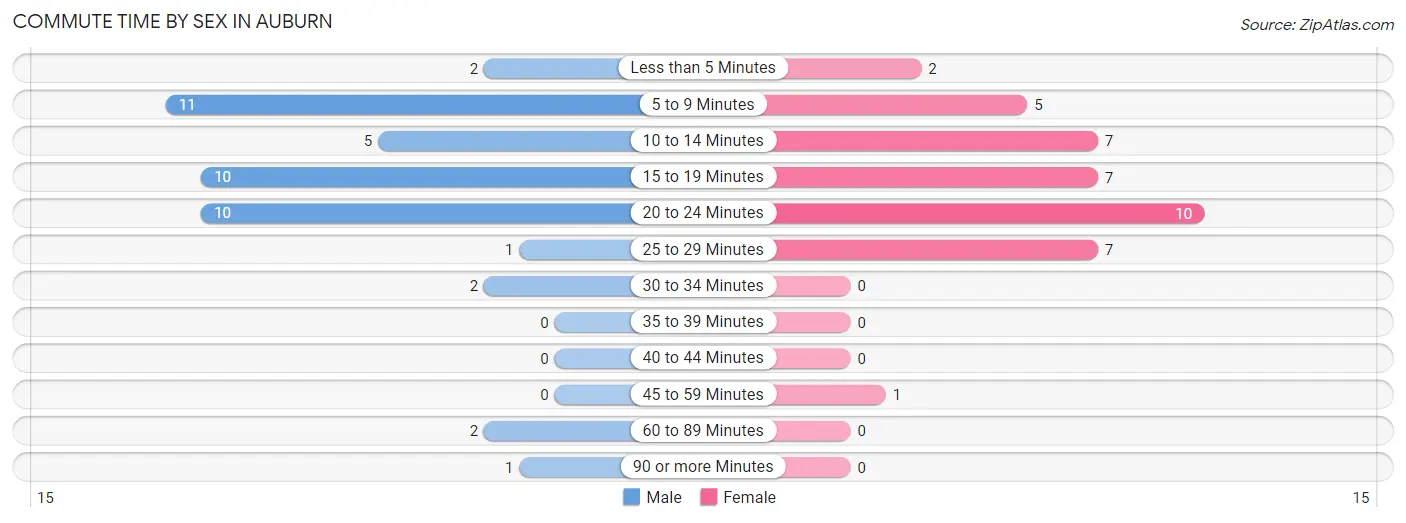
| Commute Time | Male | Female |
| Less than 5 Minutes | 2 (4.5%) | 2 (5.1%) |
| 5 to 9 Minutes | 11 (25.0%) | 5 (12.8%) |
| 10 to 14 Minutes | 5 (11.4%) | 7 (17.9%) |
| 15 to 19 Minutes | 10 (22.7%) | 7 (17.9%) |
| 20 to 24 Minutes | 10 (22.7%) | 10 (25.6%) |
| 25 to 29 Minutes | 1 (2.3%) | 7 (17.9%) |
| 30 to 34 Minutes | 2 (4.5%) | 0 (0.0%) |
| 35 to 39 Minutes | 0 (0.0%) | 0 (0.0%) |
| 40 to 44 Minutes | 0 (0.0%) | 0 (0.0%) |
| 45 to 59 Minutes | 0 (0.0%) | 1 (2.6%) |
| 60 to 89 Minutes | 2 (4.5%) | 0 (0.0%) |
| 90 or more Minutes | 1 (2.3%) | 0 (0.0%) |
Time of Departure to Work by Sex in Auburn
The most frequent times of departure to work in Auburn are 5:30 AM to 5:59 AM (13, 29.5%) for males and 7:00 AM to 7:29 AM (14, 35.9%) for females.
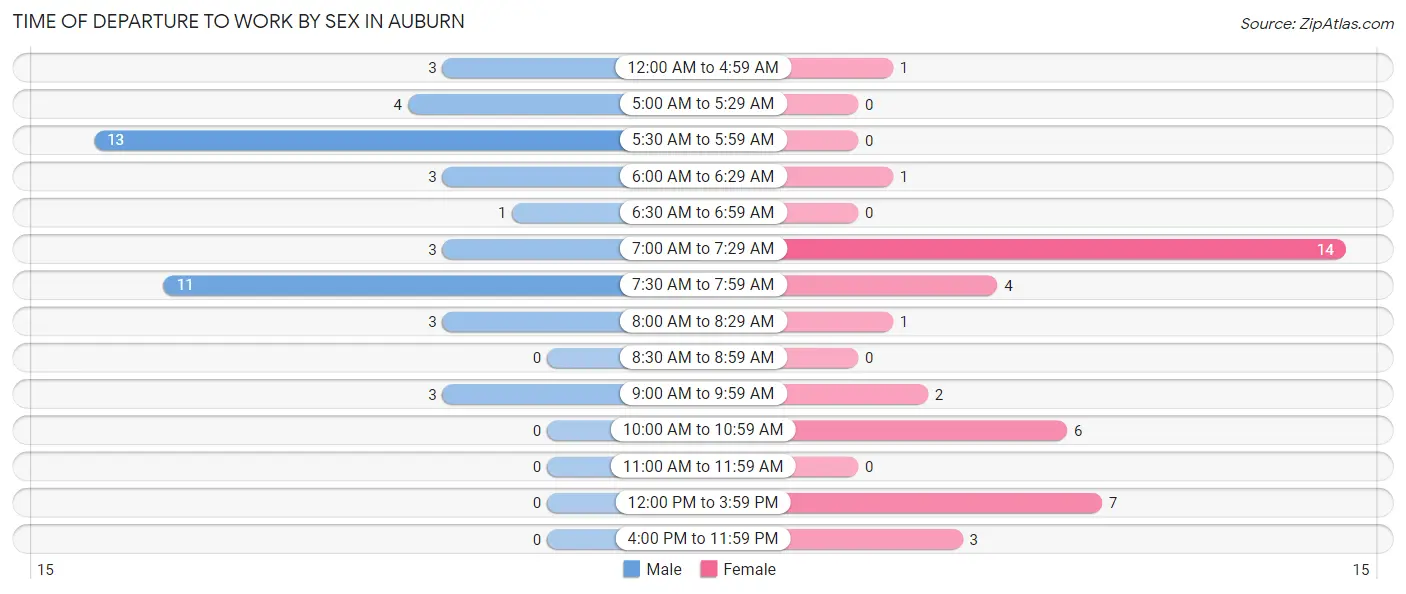
| Time of Departure | Male | Female |
| 12:00 AM to 4:59 AM | 3 (6.8%) | 1 (2.6%) |
| 5:00 AM to 5:29 AM | 4 (9.1%) | 0 (0.0%) |
| 5:30 AM to 5:59 AM | 13 (29.5%) | 0 (0.0%) |
| 6:00 AM to 6:29 AM | 3 (6.8%) | 1 (2.6%) |
| 6:30 AM to 6:59 AM | 1 (2.3%) | 0 (0.0%) |
| 7:00 AM to 7:29 AM | 3 (6.8%) | 14 (35.9%) |
| 7:30 AM to 7:59 AM | 11 (25.0%) | 4 (10.3%) |
| 8:00 AM to 8:29 AM | 3 (6.8%) | 1 (2.6%) |
| 8:30 AM to 8:59 AM | 0 (0.0%) | 0 (0.0%) |
| 9:00 AM to 9:59 AM | 3 (6.8%) | 2 (5.1%) |
| 10:00 AM to 10:59 AM | 0 (0.0%) | 6 (15.4%) |
| 11:00 AM to 11:59 AM | 0 (0.0%) | 0 (0.0%) |
| 12:00 PM to 3:59 PM | 0 (0.0%) | 7 (17.9%) |
| 4:00 PM to 11:59 PM | 0 (0.0%) | 3 (7.7%) |
| Total | 44 (100.0%) | 39 (100.0%) |
Housing Occupancy in Auburn
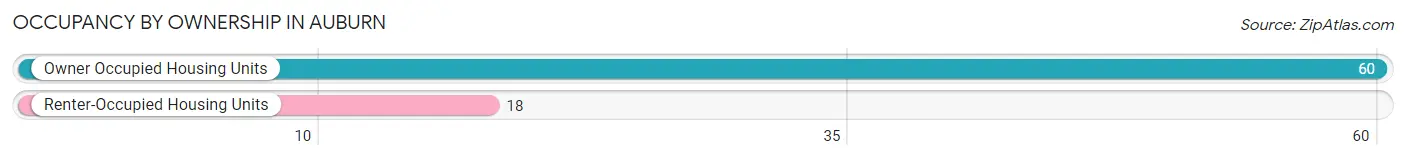
Occupancy by Ownership in Auburn
Of the total 78 dwellings in Auburn, owner-occupied units account for 60 (76.9%), while renter-occupied units make up 18 (23.1%).
| Occupancy | # Housing Units | % Housing Units |
| Owner Occupied Housing Units | 60 | 76.9% |
| Renter-Occupied Housing Units | 18 | 23.1% |
| Total Occupied Housing Units | 78 | 100.0% |
Occupancy by Household Size in Auburn
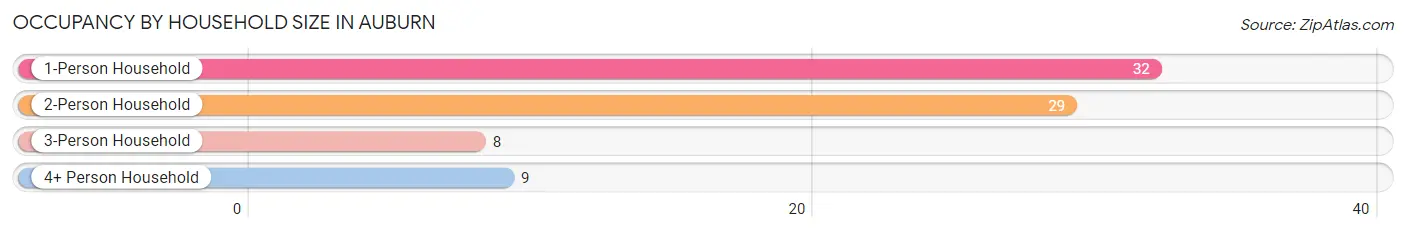
| Household Size | # Housing Units | % Housing Units |
| 1-Person Household | 32 | 41.0% |
| 2-Person Household | 29 | 37.2% |
| 3-Person Household | 8 | 10.3% |
| 4+ Person Household | 9 | 11.5% |
| Total Housing Units | 78 | 100.0% |
Occupancy by Ownership by Household Size in Auburn
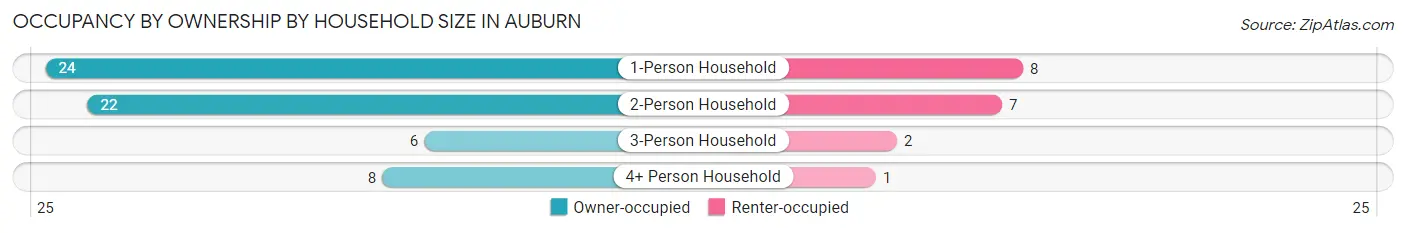
| Household Size | Owner-occupied | Renter-occupied |
| 1-Person Household | 24 (75.0%) | 8 (25.0%) |
| 2-Person Household | 22 (75.9%) | 7 (24.1%) |
| 3-Person Household | 6 (75.0%) | 2 (25.0%) |
| 4+ Person Household | 8 (88.9%) | 1 (11.1%) |
| Total Housing Units | 60 (76.9%) | 18 (23.1%) |
Occupancy by Educational Attainment in Auburn
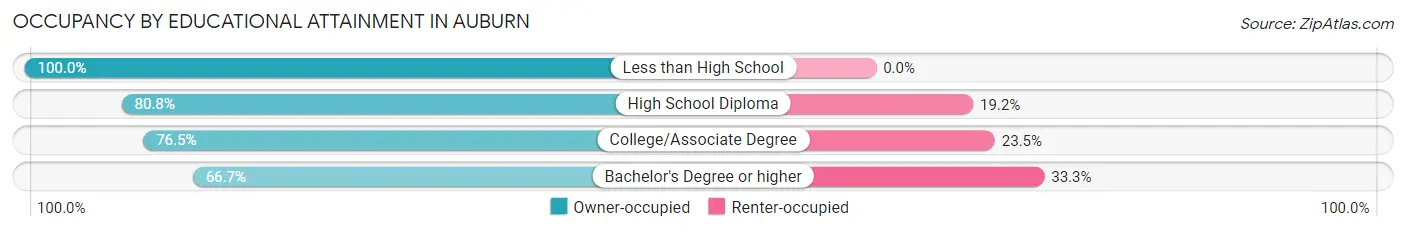
| Household Size | Owner-occupied | Renter-occupied |
| Less than High School | 3 (100.0%) | 0 (0.0%) |
| High School Diploma | 21 (80.8%) | 5 (19.2%) |
| College/Associate Degree | 26 (76.5%) | 8 (23.5%) |
| Bachelor's Degree or higher | 10 (66.7%) | 5 (33.3%) |
Occupancy by Age of Householder in Auburn
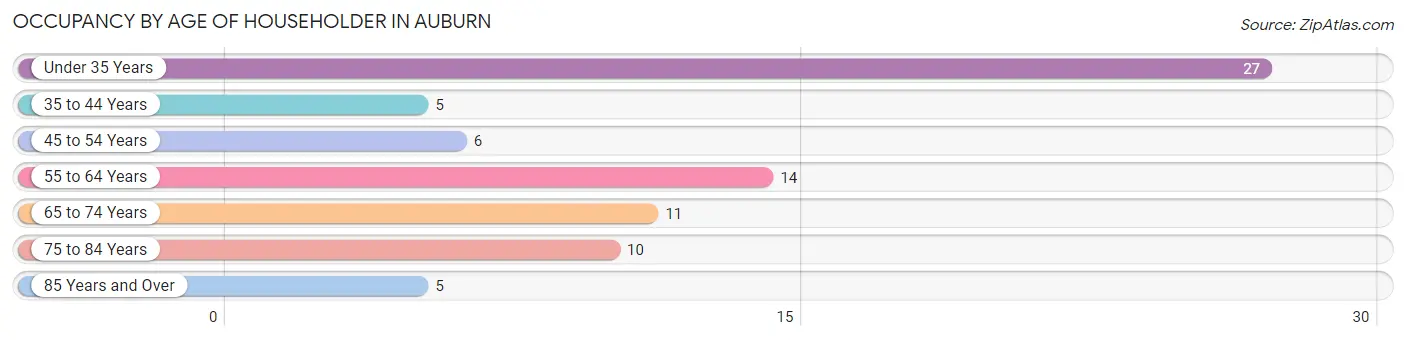
| Age Bracket | # Households | % Households |
| Under 35 Years | 27 | 34.6% |
| 35 to 44 Years | 5 | 6.4% |
| 45 to 54 Years | 6 | 7.7% |
| 55 to 64 Years | 14 | 17.9% |
| 65 to 74 Years | 11 | 14.1% |
| 75 to 84 Years | 10 | 12.8% |
| 85 Years and Over | 5 | 6.4% |
| Total | 78 | 100.0% |
Housing Finances in Auburn
Median Income by Occupancy in Auburn
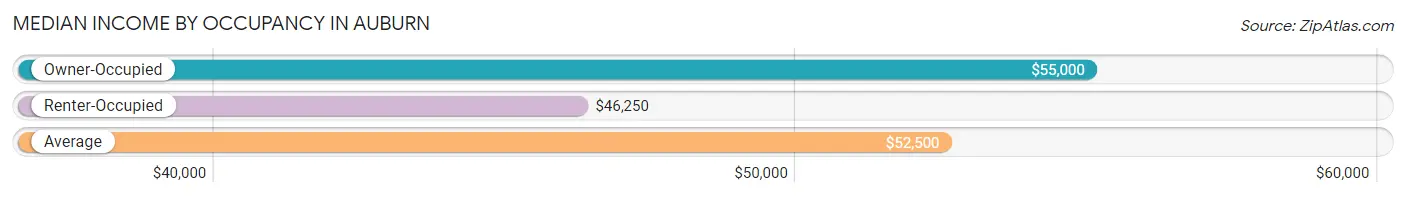
| Occupancy Type | # Households | Median Income |
| Owner-Occupied | 60 (76.9%) | $55,000 |
| Renter-Occupied | 18 (23.1%) | $46,250 |
| Average | 78 (100.0%) | $52,500 |
Occupancy by Householder Income Bracket in Auburn
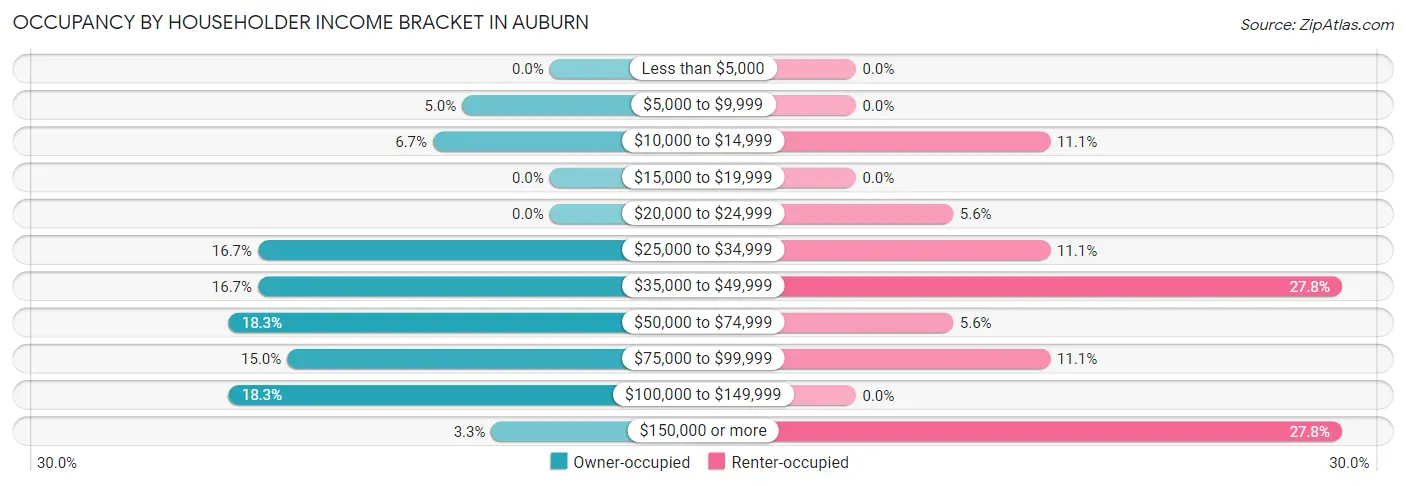
| Income Bracket | Owner-occupied | Renter-occupied |
| Less than $5,000 | 0 (0.0%) | 0 (0.0%) |
| $5,000 to $9,999 | 3 (5.0%) | 0 (0.0%) |
| $10,000 to $14,999 | 4 (6.7%) | 2 (11.1%) |
| $15,000 to $19,999 | 0 (0.0%) | 0 (0.0%) |
| $20,000 to $24,999 | 0 (0.0%) | 1 (5.6%) |
| $25,000 to $34,999 | 10 (16.7%) | 2 (11.1%) |
| $35,000 to $49,999 | 10 (16.7%) | 5 (27.8%) |
| $50,000 to $74,999 | 11 (18.3%) | 1 (5.6%) |
| $75,000 to $99,999 | 9 (15.0%) | 2 (11.1%) |
| $100,000 to $149,999 | 11 (18.3%) | 0 (0.0%) |
| $150,000 or more | 2 (3.3%) | 5 (27.8%) |
| Total | 60 (100.0%) | 18 (100.0%) |
Monthly Housing Cost Tiers in Auburn
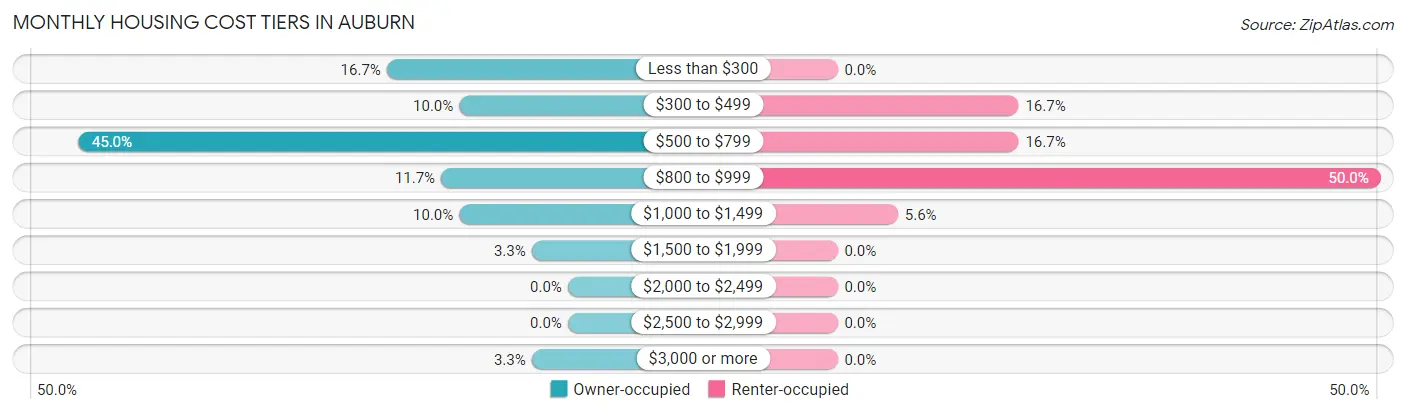
| Monthly Cost | Owner-occupied | Renter-occupied |
| Less than $300 | 10 (16.7%) | 0 (0.0%) |
| $300 to $499 | 6 (10.0%) | 3 (16.7%) |
| $500 to $799 | 27 (45.0%) | 3 (16.7%) |
| $800 to $999 | 7 (11.7%) | 9 (50.0%) |
| $1,000 to $1,499 | 6 (10.0%) | 1 (5.6%) |
| $1,500 to $1,999 | 2 (3.3%) | 0 (0.0%) |
| $2,000 to $2,499 | 0 (0.0%) | 0 (0.0%) |
| $2,500 to $2,999 | 0 (0.0%) | 0 (0.0%) |
| $3,000 or more | 2 (3.3%) | 0 (0.0%) |
| Total | 60 (100.0%) | 18 (100.0%) |
Physical Housing Characteristics in Auburn
Housing Structures in Auburn
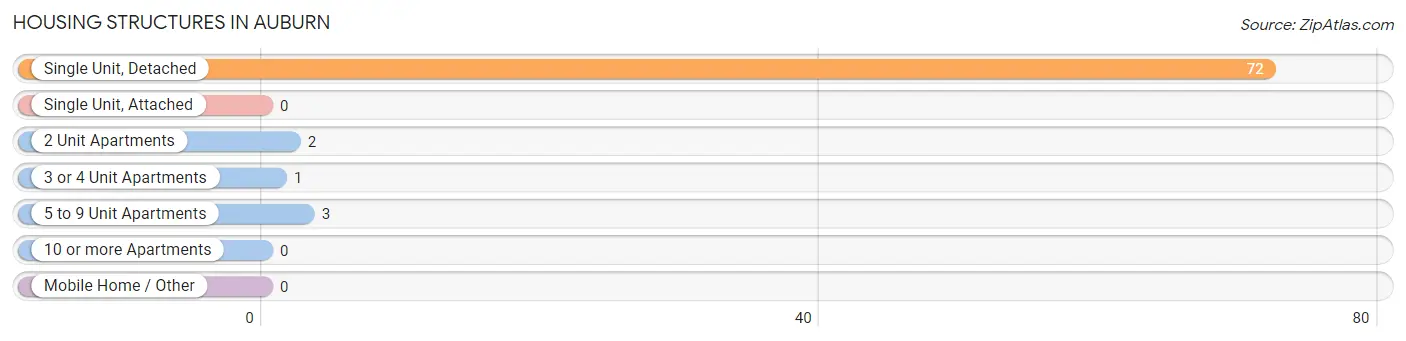
| Structure Type | # Housing Units | % Housing Units |
| Single Unit, Detached | 72 | 92.3% |
| Single Unit, Attached | 0 | 0.0% |
| 2 Unit Apartments | 2 | 2.6% |
| 3 or 4 Unit Apartments | 1 | 1.3% |
| 5 to 9 Unit Apartments | 3 | 3.8% |
| 10 or more Apartments | 0 | 0.0% |
| Mobile Home / Other | 0 | 0.0% |
| Total | 78 | 100.0% |
Housing Structures by Occupancy in Auburn
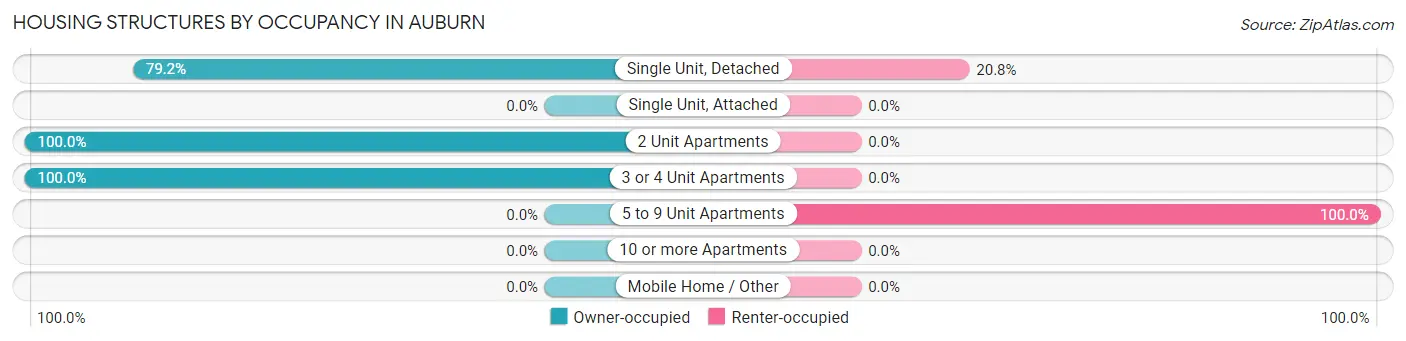
| Structure Type | Owner-occupied | Renter-occupied |
| Single Unit, Detached | 57 (79.2%) | 15 (20.8%) |
| Single Unit, Attached | 0 (0.0%) | 0 (0.0%) |
| 2 Unit Apartments | 2 (100.0%) | 0 (0.0%) |
| 3 or 4 Unit Apartments | 1 (100.0%) | 0 (0.0%) |
| 5 to 9 Unit Apartments | 0 (0.0%) | 3 (100.0%) |
| 10 or more Apartments | 0 (0.0%) | 0 (0.0%) |
| Mobile Home / Other | 0 (0.0%) | 0 (0.0%) |
| Total | 60 (76.9%) | 18 (23.1%) |
Housing Structures by Number of Rooms in Auburn
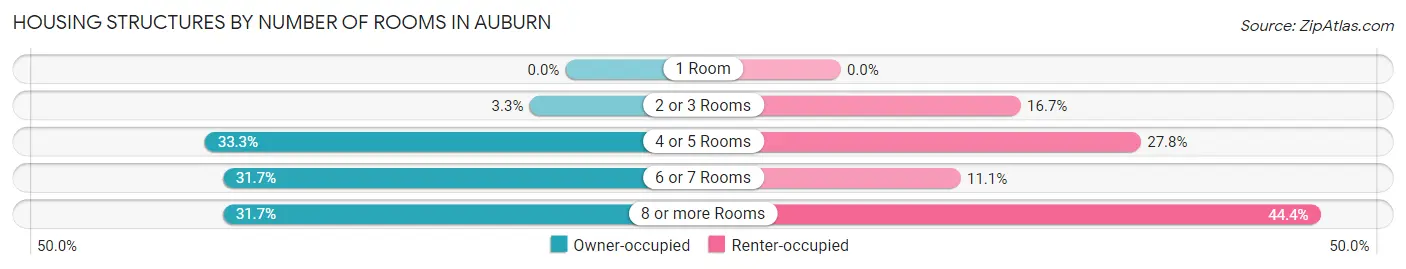
| Number of Rooms | Owner-occupied | Renter-occupied |
| 1 Room | 0 (0.0%) | 0 (0.0%) |
| 2 or 3 Rooms | 2 (3.3%) | 3 (16.7%) |
| 4 or 5 Rooms | 20 (33.3%) | 5 (27.8%) |
| 6 or 7 Rooms | 19 (31.7%) | 2 (11.1%) |
| 8 or more Rooms | 19 (31.7%) | 8 (44.4%) |
| Total | 60 (100.0%) | 18 (100.0%) |
Housing Structure by Heating Type in Auburn
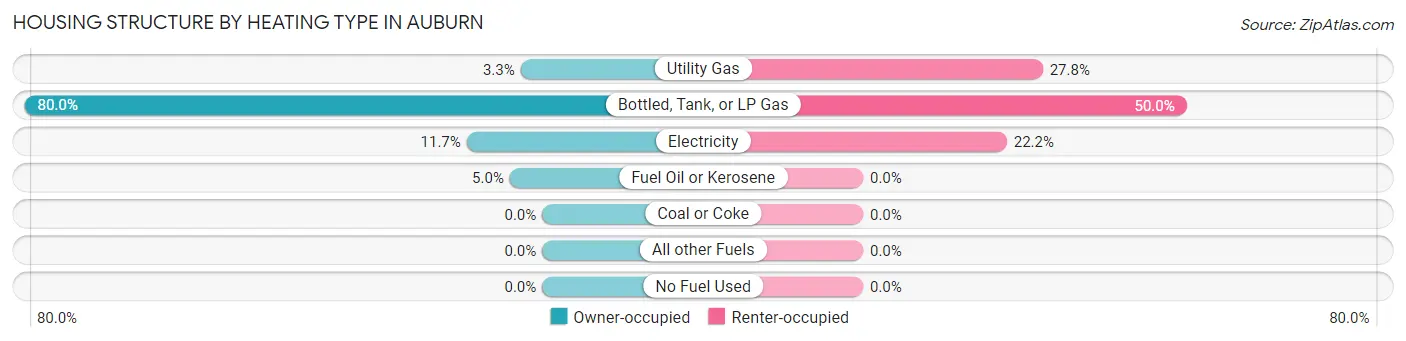
| Heating Type | Owner-occupied | Renter-occupied |
| Utility Gas | 2 (3.3%) | 5 (27.8%) |
| Bottled, Tank, or LP Gas | 48 (80.0%) | 9 (50.0%) |
| Electricity | 7 (11.7%) | 4 (22.2%) |
| Fuel Oil or Kerosene | 3 (5.0%) | 0 (0.0%) |
| Coal or Coke | 0 (0.0%) | 0 (0.0%) |
| All other Fuels | 0 (0.0%) | 0 (0.0%) |
| No Fuel Used | 0 (0.0%) | 0 (0.0%) |
| Total | 60 (100.0%) | 18 (100.0%) |
Household Vehicle Usage in Auburn
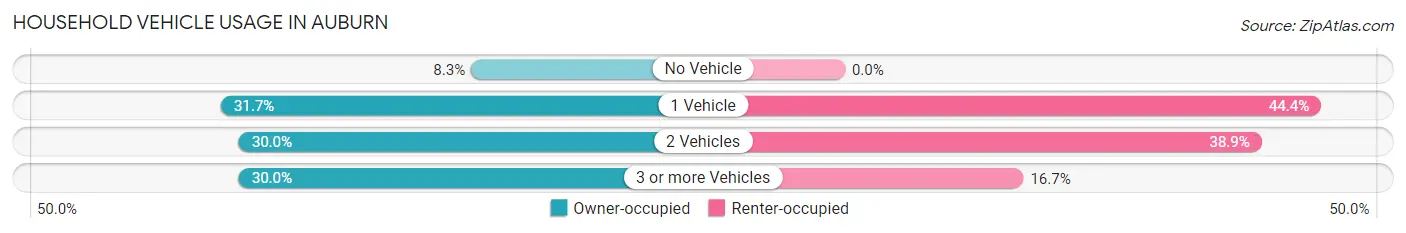
| Vehicles per Household | Owner-occupied | Renter-occupied |
| No Vehicle | 5 (8.3%) | 0 (0.0%) |
| 1 Vehicle | 19 (31.7%) | 8 (44.4%) |
| 2 Vehicles | 18 (30.0%) | 7 (38.9%) |
| 3 or more Vehicles | 18 (30.0%) | 3 (16.7%) |
| Total | 60 (100.0%) | 18 (100.0%) |
Real Estate & Mortgages in Auburn
Real Estate and Mortgage Overview in Auburn
| Characteristic | Without Mortgage | With Mortgage |
| Housing Units | 24 | 36 |
| Median Property Value | $85,000 | $73,800 |
| Median Household Income | $45,000 | $2 |
| Monthly Housing Costs | $360 | $2 |
| Real Estate Taxes | $1,028 | $5 |
Property Value by Mortgage Status in Auburn
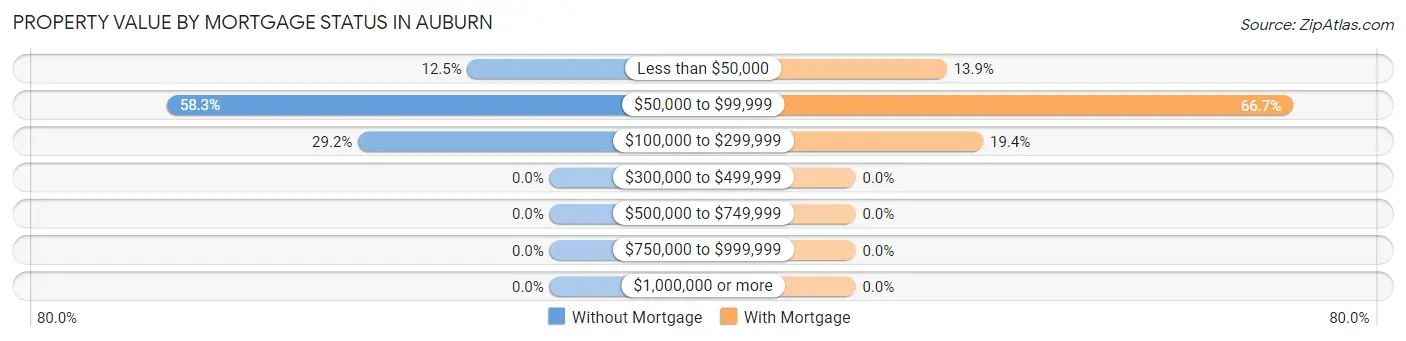
| Property Value | Without Mortgage | With Mortgage |
| Less than $50,000 | 3 (12.5%) | 5 (13.9%) |
| $50,000 to $99,999 | 14 (58.3%) | 24 (66.7%) |
| $100,000 to $299,999 | 7 (29.2%) | 7 (19.4%) |
| $300,000 to $499,999 | 0 (0.0%) | 0 (0.0%) |
| $500,000 to $749,999 | 0 (0.0%) | 0 (0.0%) |
| $750,000 to $999,999 | 0 (0.0%) | 0 (0.0%) |
| $1,000,000 or more | 0 (0.0%) | 0 (0.0%) |
| Total | 24 (100.0%) | 36 (100.0%) |
Household Income by Mortgage Status in Auburn
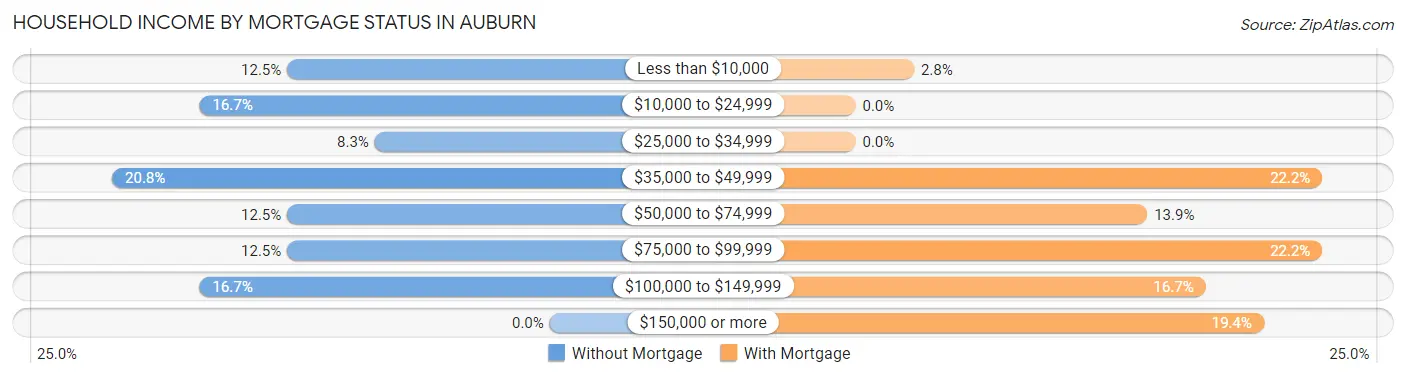
| Household Income | Without Mortgage | With Mortgage |
| Less than $10,000 | 3 (12.5%) | 1 (2.8%) |
| $10,000 to $24,999 | 4 (16.7%) | 0 (0.0%) |
| $25,000 to $34,999 | 2 (8.3%) | 0 (0.0%) |
| $35,000 to $49,999 | 5 (20.8%) | 8 (22.2%) |
| $50,000 to $74,999 | 3 (12.5%) | 5 (13.9%) |
| $75,000 to $99,999 | 3 (12.5%) | 8 (22.2%) |
| $100,000 to $149,999 | 4 (16.7%) | 6 (16.7%) |
| $150,000 or more | 0 (0.0%) | 7 (19.4%) |
| Total | 24 (100.0%) | 36 (100.0%) |
Property Value to Household Income Ratio in Auburn
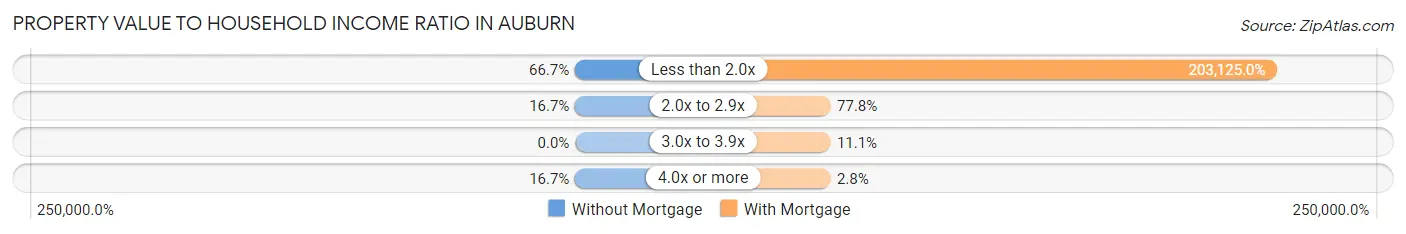
| Value-to-Income Ratio | Without Mortgage | With Mortgage |
| Less than 2.0x | 16 (66.7%) | 73,125 (203,125.0%) |
| 2.0x to 2.9x | 4 (16.7%) | 28 (77.8%) |
| 3.0x to 3.9x | 0 (0.0%) | 4 (11.1%) |
| 4.0x or more | 4 (16.7%) | 1 (2.8%) |
| Total | 24 (100.0%) | 36 (100.0%) |
Real Estate Taxes by Mortgage Status in Auburn
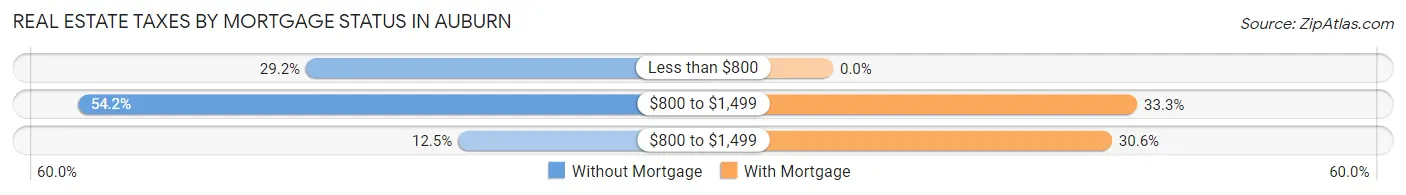
| Property Taxes | Without Mortgage | With Mortgage |
| Less than $800 | 7 (29.2%) | 0 (0.0%) |
| $800 to $1,499 | 13 (54.2%) | 12 (33.3%) |
| $800 to $1,499 | 3 (12.5%) | 11 (30.6%) |
| Total | 24 (100.0%) | 36 (100.0%) |
Health & Disability in Auburn
Health Insurance Coverage by Age in Auburn
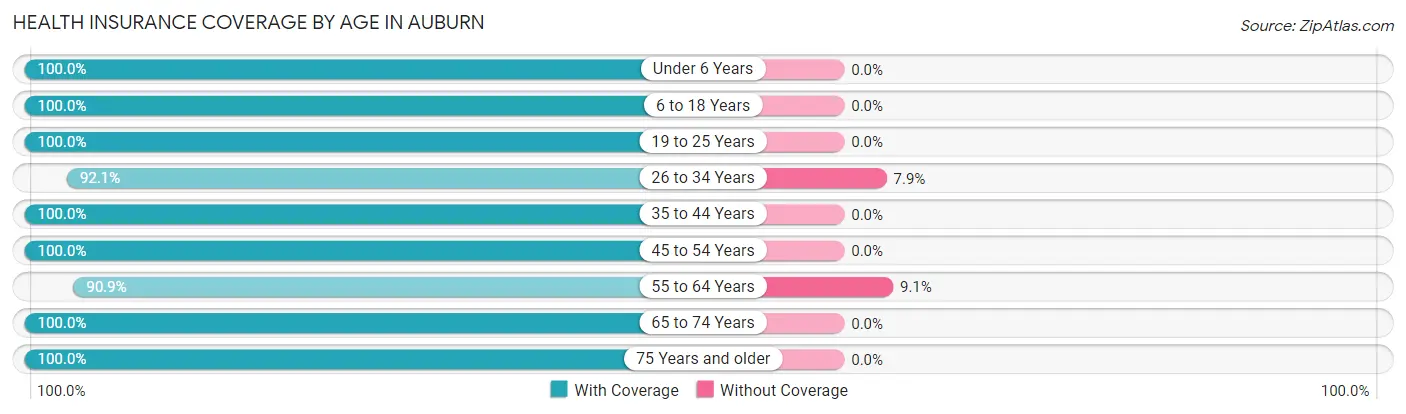
| Age Bracket | With Coverage | Without Coverage |
| Under 6 Years | 11 (100.0%) | 0 (0.0%) |
| 6 to 18 Years | 20 (100.0%) | 0 (0.0%) |
| 19 to 25 Years | 12 (100.0%) | 0 (0.0%) |
| 26 to 34 Years | 35 (92.1%) | 3 (7.9%) |
| 35 to 44 Years | 11 (100.0%) | 0 (0.0%) |
| 45 to 54 Years | 9 (100.0%) | 0 (0.0%) |
| 55 to 64 Years | 20 (90.9%) | 2 (9.1%) |
| 65 to 74 Years | 16 (100.0%) | 0 (0.0%) |
| 75 Years and older | 18 (100.0%) | 0 (0.0%) |
| Total | 152 (96.8%) | 5 (3.2%) |
Health Insurance Coverage by Citizenship Status in Auburn
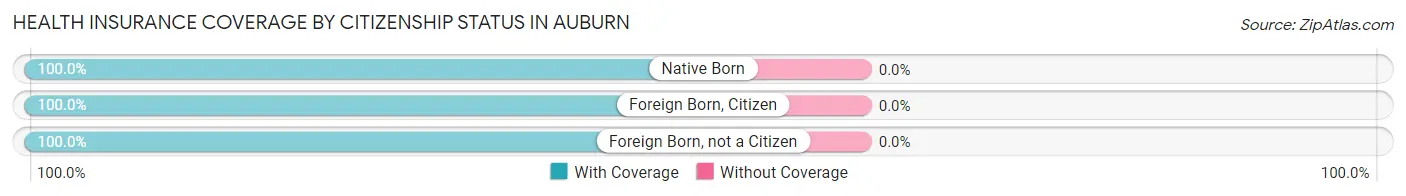
| Citizenship Status | With Coverage | Without Coverage |
| Native Born | 11 (100.0%) | 0 (0.0%) |
| Foreign Born, Citizen | 20 (100.0%) | 0 (0.0%) |
| Foreign Born, not a Citizen | 12 (100.0%) | 0 (0.0%) |
Health Insurance Coverage by Household Income in Auburn
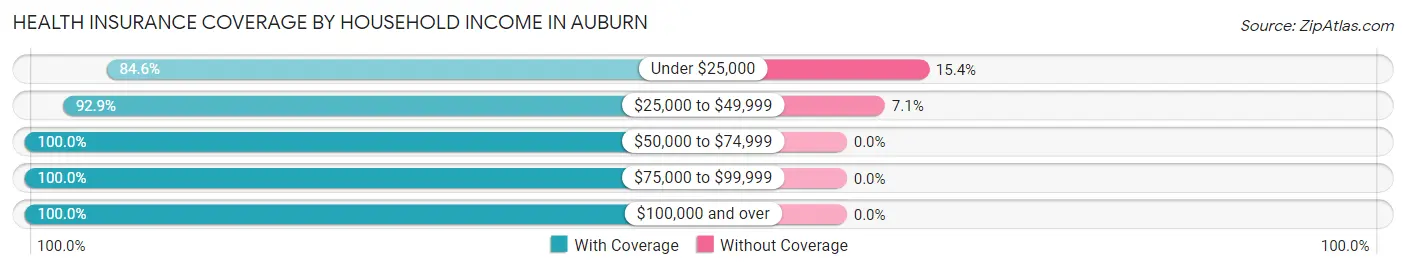
| Household Income | With Coverage | Without Coverage |
| Under $25,000 | 11 (84.6%) | 2 (15.4%) |
| $25,000 to $49,999 | 39 (92.9%) | 3 (7.1%) |
| $50,000 to $74,999 | 27 (100.0%) | 0 (0.0%) |
| $75,000 to $99,999 | 26 (100.0%) | 0 (0.0%) |
| $100,000 and over | 49 (100.0%) | 0 (0.0%) |
Public vs Private Health Insurance Coverage by Age in Auburn
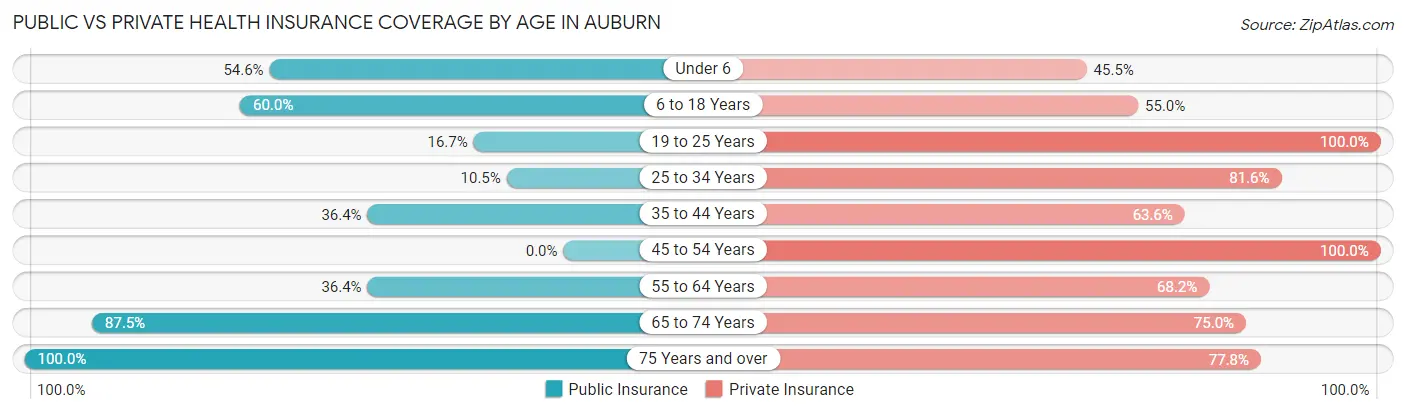
| Age Bracket | Public Insurance | Private Insurance |
| Under 6 | 6 (54.5%) | 5 (45.5%) |
| 6 to 18 Years | 12 (60.0%) | 11 (55.0%) |
| 19 to 25 Years | 2 (16.7%) | 12 (100.0%) |
| 25 to 34 Years | 4 (10.5%) | 31 (81.6%) |
| 35 to 44 Years | 4 (36.4%) | 7 (63.6%) |
| 45 to 54 Years | 0 (0.0%) | 9 (100.0%) |
| 55 to 64 Years | 8 (36.4%) | 15 (68.2%) |
| 65 to 74 Years | 14 (87.5%) | 12 (75.0%) |
| 75 Years and over | 18 (100.0%) | 14 (77.8%) |
| Total | 68 (43.3%) | 116 (73.9%) |
Disability Status by Sex by Age in Auburn
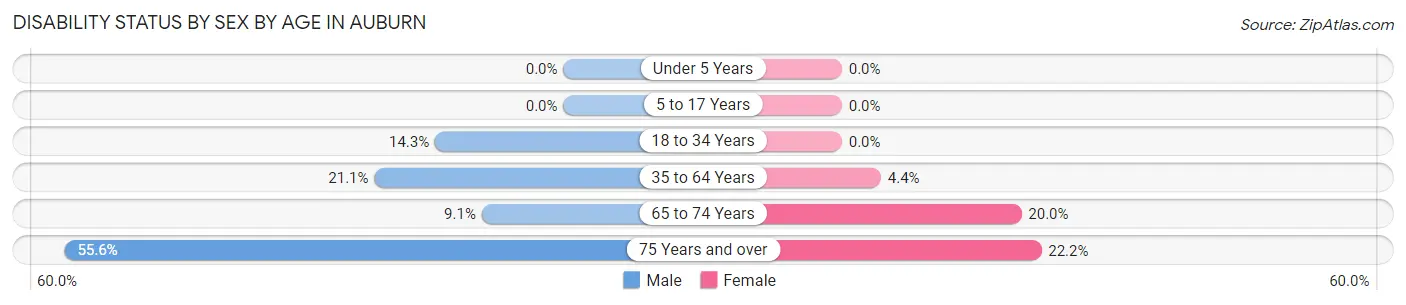
| Age Bracket | Male | Female |
| Under 5 Years | 0 (0.0%) | 0 (0.0%) |
| 5 to 17 Years | 0 (0.0%) | 0 (0.0%) |
| 18 to 34 Years | 4 (14.3%) | 0 (0.0%) |
| 35 to 64 Years | 4 (21.0%) | 1 (4.3%) |
| 65 to 74 Years | 1 (9.1%) | 1 (20.0%) |
| 75 Years and over | 5 (55.6%) | 2 (22.2%) |
Disability Class by Sex by Age in Auburn
Disability Class: Hearing Difficulty
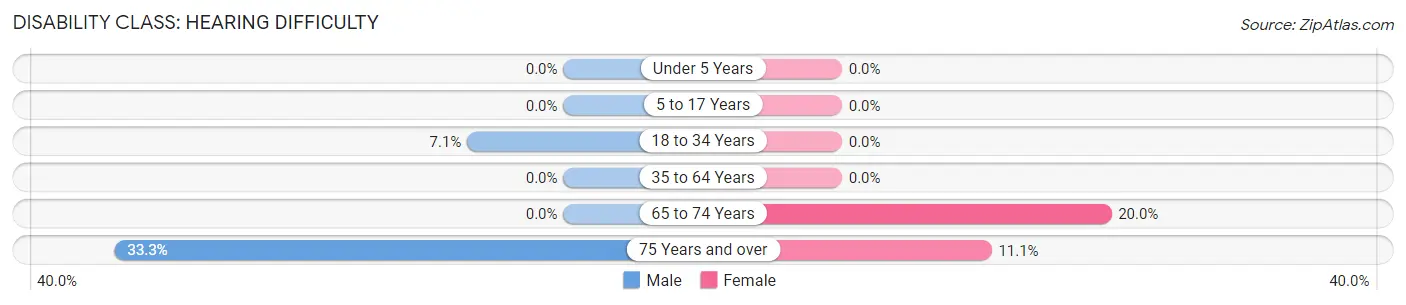
| Age Bracket | Male | Female |
| Under 5 Years | 0 (0.0%) | 0 (0.0%) |
| 5 to 17 Years | 0 (0.0%) | 0 (0.0%) |
| 18 to 34 Years | 2 (7.1%) | 0 (0.0%) |
| 35 to 64 Years | 0 (0.0%) | 0 (0.0%) |
| 65 to 74 Years | 0 (0.0%) | 1 (20.0%) |
| 75 Years and over | 3 (33.3%) | 1 (11.1%) |
Disability Class: Vision Difficulty
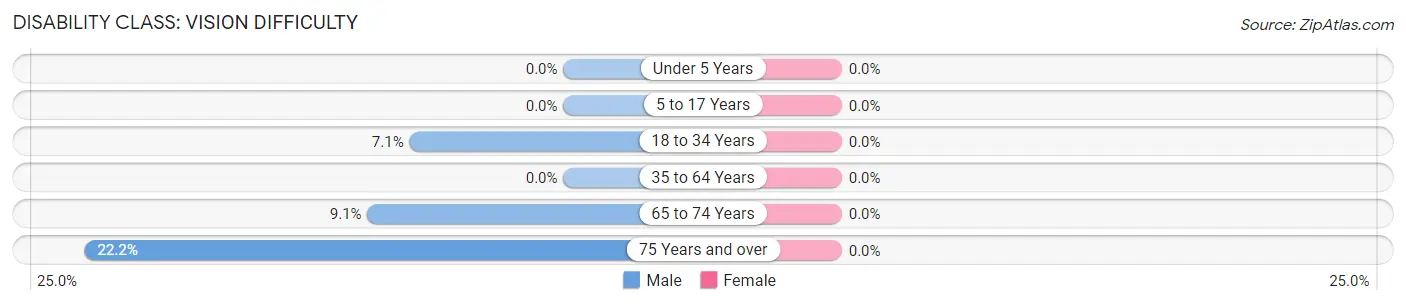
| Age Bracket | Male | Female |
| Under 5 Years | 0 (0.0%) | 0 (0.0%) |
| 5 to 17 Years | 0 (0.0%) | 0 (0.0%) |
| 18 to 34 Years | 2 (7.1%) | 0 (0.0%) |
| 35 to 64 Years | 0 (0.0%) | 0 (0.0%) |
| 65 to 74 Years | 1 (9.1%) | 0 (0.0%) |
| 75 Years and over | 2 (22.2%) | 0 (0.0%) |
Disability Class: Cognitive Difficulty
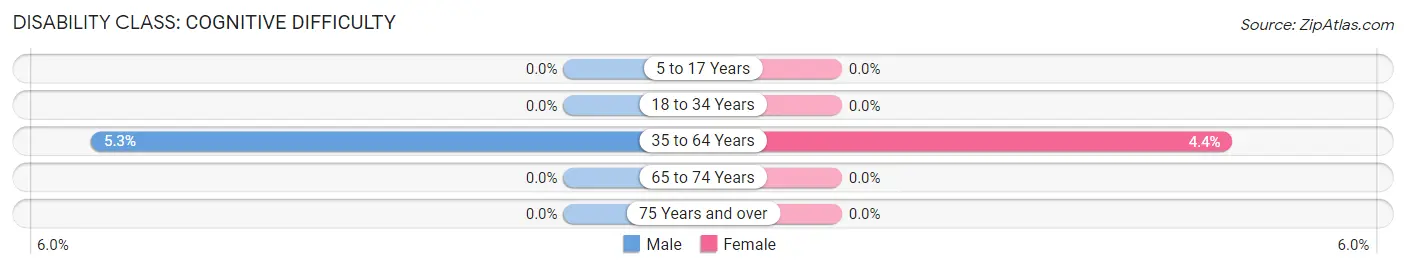
| Age Bracket | Male | Female |
| 5 to 17 Years | 0 (0.0%) | 0 (0.0%) |
| 18 to 34 Years | 0 (0.0%) | 0 (0.0%) |
| 35 to 64 Years | 1 (5.3%) | 1 (4.3%) |
| 65 to 74 Years | 0 (0.0%) | 0 (0.0%) |
| 75 Years and over | 0 (0.0%) | 0 (0.0%) |
Disability Class: Ambulatory Difficulty
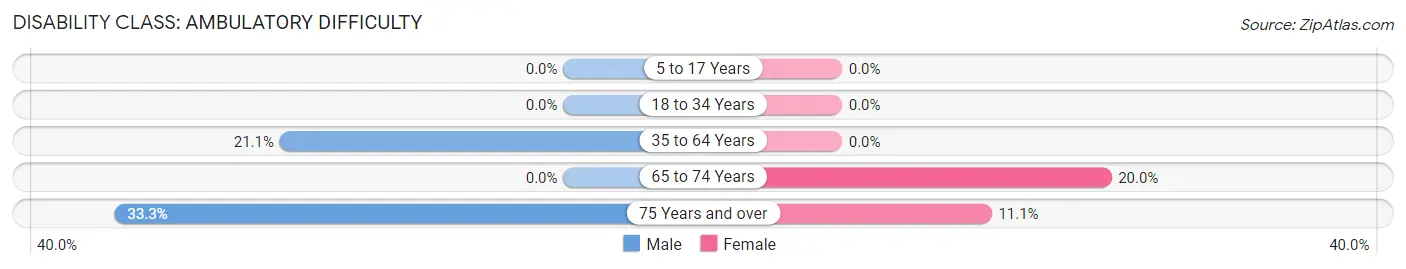
| Age Bracket | Male | Female |
| 5 to 17 Years | 0 (0.0%) | 0 (0.0%) |
| 18 to 34 Years | 0 (0.0%) | 0 (0.0%) |
| 35 to 64 Years | 4 (21.0%) | 0 (0.0%) |
| 65 to 74 Years | 0 (0.0%) | 1 (20.0%) |
| 75 Years and over | 3 (33.3%) | 1 (11.1%) |
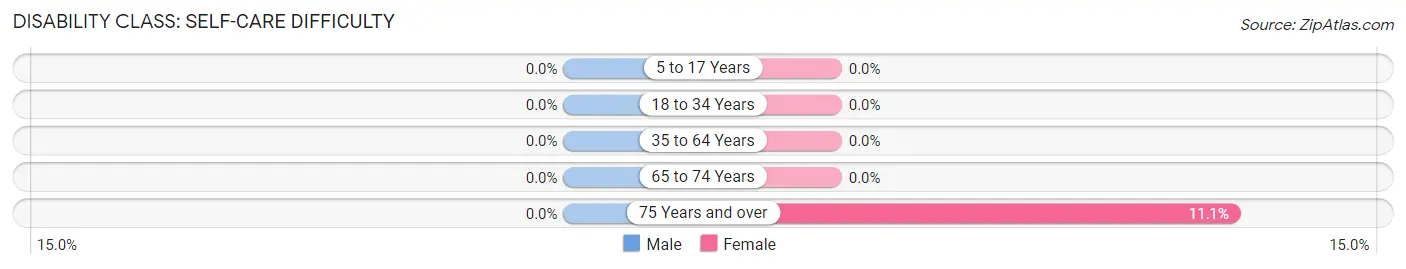
Disability Class: Self-Care Difficulty
| Age Bracket | Male | Female |
| 5 to 17 Years | 0 (0.0%) | 0 (0.0%) |
| 18 to 34 Years | 0 (0.0%) | 0 (0.0%) |
| 35 to 64 Years | 0 (0.0%) | 0 (0.0%) |
| 65 to 74 Years | 0 (0.0%) | 0 (0.0%) |
| 75 Years and over | 0 (0.0%) | 1 (11.1%) |
Technology Access in Auburn
Computing Device Access in Auburn
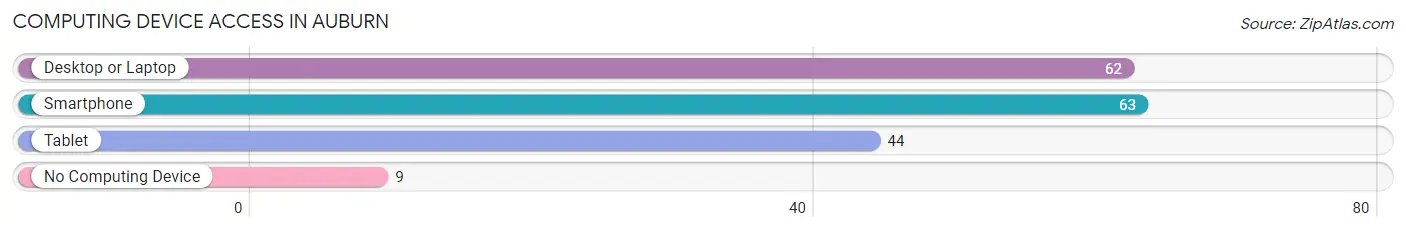
| Device Type | # Households | % Households |
| Desktop or Laptop | 62 | 79.5% |
| Smartphone | 63 | 80.8% |
| Tablet | 44 | 56.4% |
| No Computing Device | 9 | 11.5% |
| Total | 78 | 100.0% |
Internet Access in Auburn
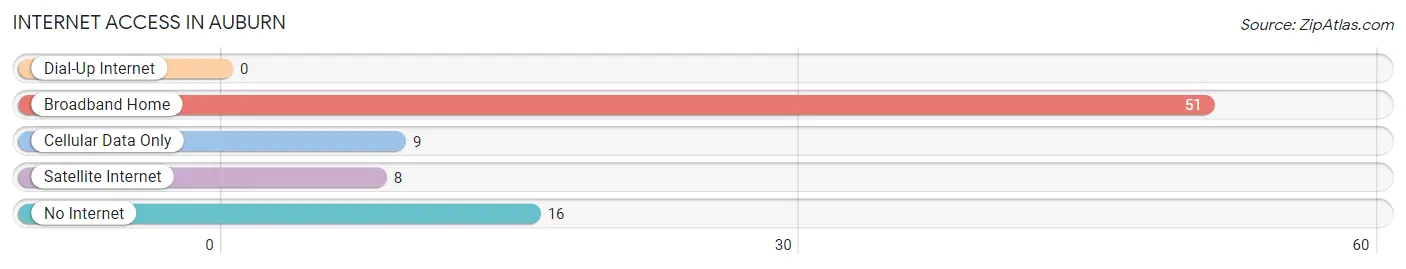
| Internet Type | # Households | % Households |
| Dial-Up Internet | 0 | 0.0% |
| Broadband Home | 51 | 65.4% |
| Cellular Data Only | 9 | 11.5% |
| Satellite Internet | 8 | 10.3% |
| No Internet | 16 | 20.5% |
| Total | 78 | 100.0% |
Auburn Summary
Auburn, Iowa is a small city located in the southeastern corner of the state, in Lee County. It is situated on the banks of the Mississippi River, and is part of the Quad Cities metropolitan area. The city has a population of approximately 1,500 people, and is known for its small-town charm and friendly atmosphere.
History
Auburn was founded in 1836 by a group of settlers from New York. The city was named after Auburn, New York, and was originally intended to be a trading post. The city quickly grew, and by the mid-1800s, it had become a major hub for riverboat traffic. In 1856, the city was incorporated, and it soon became a popular destination for travelers and settlers.
In the late 1800s, Auburn was a major center for the lumber industry. The city was home to several sawmills, and the lumber industry provided much of the city’s economic growth. In the early 1900s, the city’s economy shifted to agriculture, and it remains an important part of the local economy today.
Geography
Auburn is located in the southeastern corner of Iowa, in Lee County. It is situated on the banks of the Mississippi River, and is part of the Quad Cities metropolitan area. The city is located approximately 30 miles south of Davenport, and is bordered by the cities of Fort Madison and Keokuk.
The city has a total area of 1.3 square miles, all of which is land. The terrain is mostly flat, with some rolling hills in the surrounding area. The climate is humid continental, with hot summers and cold winters.
Economy
Auburn’s economy is largely based on agriculture. The city is home to several farms, and the surrounding area is known for its production of corn, soybeans, and other crops. The city is also home to several manufacturing companies, including a furniture factory and a plastics plant.
In addition to agriculture and manufacturing, Auburn is home to several small businesses. The city is home to several restaurants, shops, and other businesses. The city is also home to a small airport, which serves the surrounding area.
Demographics
As of the 2010 census, Auburn had a population of 1,500 people. The racial makeup of the city was 97.3% White, 0.7% African American, 0.3% Native American, 0.3% Asian, and 1.3% from other races. The median household income was $37,500, and the median family income was $45,000.
Auburn is a small city with a friendly atmosphere. The city is home to several churches, and the local school system is highly rated. The city is also home to several parks and recreational facilities, and is a popular destination for outdoor activities.
Common Questions
What is Per Capita Income in Auburn?
Per Capita income in Auburn is $33,393.
What is the Median Family Income in Auburn?
Median Family Income in Auburn is $86,250.
What is the Median Household income in Auburn?
Median Household Income in Auburn is $52,500.
What is Income or Wage Gap in Auburn?
Income or Wage Gap in Auburn is 25.3%.
Women in Auburn earn 74.7 cents for every dollar earned by a man.
What is Inequality or Gini Index in Auburn?
Inequality or Gini Index in Auburn is 0.41.
What is the Total Population of Auburn?
Total Population of Auburn is 157.
What is the Total Male Population of Auburn?
Total Male Population of Auburn is 81.
What is the Total Female Population of Auburn?
Total Female Population of Auburn is 76.
What is the Ratio of Males per 100 Females in Auburn?
There are 106.58 Males per 100 Females in Auburn.
What is the Ratio of Females per 100 Males in Auburn?
There are 93.83 Females per 100 Males in Auburn.
What is the Median Population Age in Auburn?
Median Population Age in Auburn is 34.2 Years.
What is the Average Family Size in Auburn
Average Family Size in Auburn is 2.8 People.
What is the Average Household Size in Auburn
Average Household Size in Auburn is 2.0 People.
How Large is the Labor Force in Auburn?
There are 94 People in the Labor Forcein in Auburn.
What is the Percentage of People in the Labor Force in Auburn?
73.4% of People are in the Labor Force in Auburn.
What is the Unemployment Rate in Auburn?
Unemployment Rate in Auburn is 3.2%.