Alta, IA Map & Demographics
Alta Map
Alta Overview
$29,608
PER CAPITA INCOME
$77,688
AVG FAMILY INCOME
$70,094
AVG HOUSEHOLD INCOME
19.1%
WAGE / INCOME GAP [ % ]
80.9¢/ $1
WAGE / INCOME GAP [ $ ]
$5,213
FAMILY INCOME DEFICIT
0.33
INEQUALITY / GINI INDEX
2,207
TOTAL POPULATION
1,116
MALE POPULATION
1,091
FEMALE POPULATION
102.29
MALES / 100 FEMALES
97.76
FEMALES / 100 MALES
36.7
MEDIAN AGE
3.5
AVG FAMILY SIZE
3.0
AVG HOUSEHOLD SIZE
1,190
LABOR FORCE [ PEOPLE ]
74.5%
PERCENT IN LABOR FORCE
15.4%
UNEMPLOYMENT RATE
Alta Zip Codes
Alta Area Codes
Income in Alta
Income Overview in Alta
Per Capita Income in Alta is $29,608, while median incomes of families and households are $77,688 and $70,094 respectively.
| Characteristic | Number | Measure |
| Per Capita Income | 2,207 | $29,608 |
| Median Family Income | 463 | $77,688 |
| Mean Family Income | 463 | $90,315 |
| Median Household Income | 723 | $70,094 |
| Mean Household Income | 723 | $82,385 |
| Income Deficit | 463 | $5,213 |
| Wage / Income Gap (%) | 2,207 | 19.14% |
| Wage / Income Gap ($) | 2,207 | 80.86¢ per $1 |
| Gini / Inequality Index | 2,207 | 0.33 |
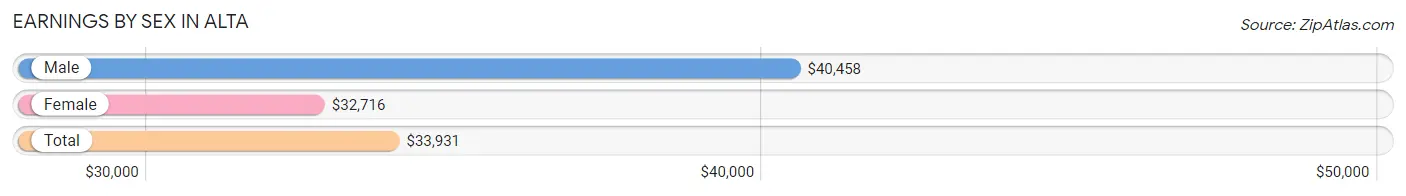
Earnings by Sex in Alta
Average Earnings in Alta are $33,931, $40,458 for men and $32,716 for women, a difference of 19.1%.
| Sex | Number | Average Earnings |
| Male | 697 (56.8%) | $40,458 |
| Female | 530 (43.2%) | $32,716 |
| Total | 1,227 (100.0%) | $33,931 |
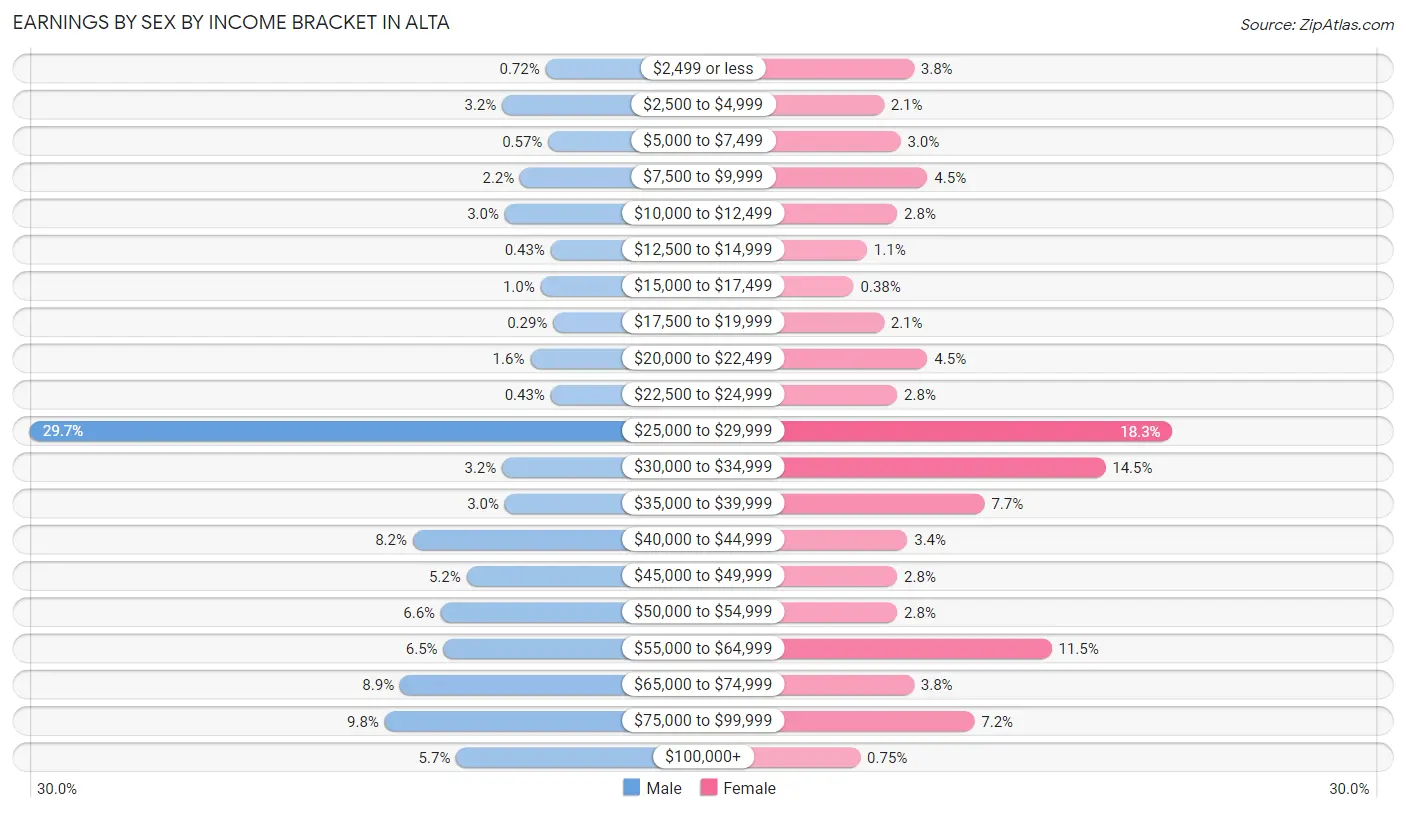
Earnings by Sex by Income Bracket in Alta
The most common earnings brackets in Alta are $25,000 to $29,999 for men (207 | 29.7%) and $25,000 to $29,999 for women (97 | 18.3%).
| Income | Male | Female |
| $2,499 or less | 5 (0.7%) | 20 (3.8%) |
| $2,500 to $4,999 | 22 (3.2%) | 11 (2.1%) |
| $5,000 to $7,499 | 4 (0.6%) | 16 (3.0%) |
| $7,500 to $9,999 | 15 (2.1%) | 24 (4.5%) |
| $10,000 to $12,499 | 21 (3.0%) | 15 (2.8%) |
| $12,500 to $14,999 | 3 (0.4%) | 6 (1.1%) |
| $15,000 to $17,499 | 7 (1.0%) | 2 (0.4%) |
| $17,500 to $19,999 | 2 (0.3%) | 11 (2.1%) |
| $20,000 to $22,499 | 11 (1.6%) | 24 (4.5%) |
| $22,500 to $24,999 | 3 (0.4%) | 15 (2.8%) |
| $25,000 to $29,999 | 207 (29.7%) | 97 (18.3%) |
| $30,000 to $34,999 | 22 (3.2%) | 77 (14.5%) |
| $35,000 to $39,999 | 21 (3.0%) | 41 (7.7%) |
| $40,000 to $44,999 | 57 (8.2%) | 18 (3.4%) |
| $45,000 to $49,999 | 36 (5.2%) | 15 (2.8%) |
| $50,000 to $54,999 | 46 (6.6%) | 15 (2.8%) |
| $55,000 to $64,999 | 45 (6.5%) | 61 (11.5%) |
| $65,000 to $74,999 | 62 (8.9%) | 20 (3.8%) |
| $75,000 to $99,999 | 68 (9.8%) | 38 (7.2%) |
| $100,000+ | 40 (5.7%) | 4 (0.7%) |
| Total | 697 (100.0%) | 530 (100.0%) |
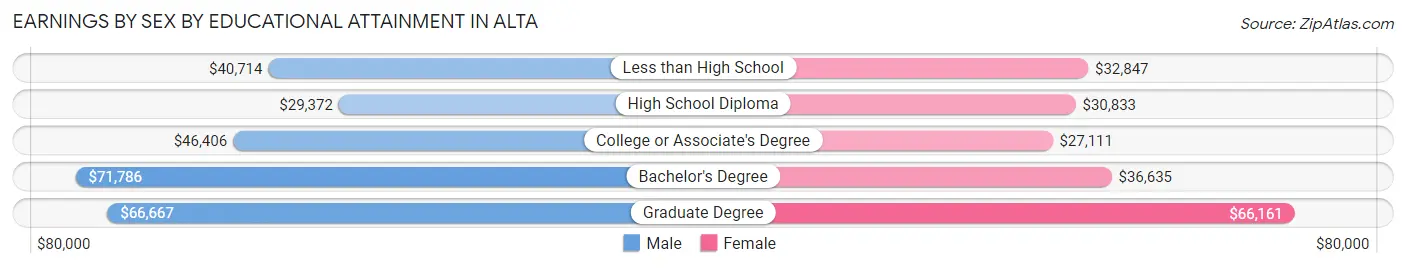
Earnings by Sex by Educational Attainment in Alta
Average earnings in Alta are $42,593 for men and $33,495 for women, a difference of 21.4%. Men with an educational attainment of bachelor's degree enjoy the highest average annual earnings of $71,786, while those with high school diploma education earn the least with $29,372. Women with an educational attainment of graduate degree earn the most with the average annual earnings of $66,161, while those with college or associate's degree education have the smallest earnings of $27,111.
| Educational Attainment | Male Income | Female Income |
| Less than High School | $40,714 | $32,847 |
| High School Diploma | $29,372 | $30,833 |
| College or Associate's Degree | $46,406 | $27,111 |
| Bachelor's Degree | $71,786 | $36,635 |
| Graduate Degree | $66,667 | $66,161 |
| Total | $42,593 | $33,495 |
Family Income in Alta
Family Income Brackets in Alta
According to the Alta family income data, there are 100 families falling into the $50,000 to $74,999 income range, which is the most common income bracket and makes up 21.6% of all families.
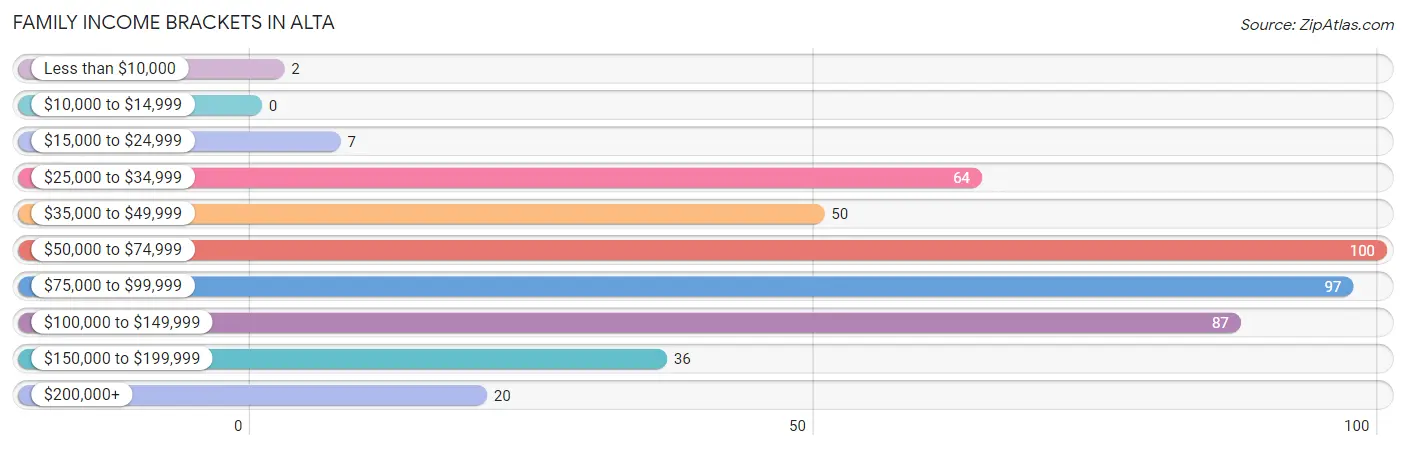
| Income Bracket | # Families | % Families |
| Less than $10,000 | 2 | 0.4% |
| $10,000 to $14,999 | 0 | 0.0% |
| $15,000 to $24,999 | 7 | 1.5% |
| $25,000 to $34,999 | 64 | 13.8% |
| $35,000 to $49,999 | 50 | 10.8% |
| $50,000 to $74,999 | 100 | 21.6% |
| $75,000 to $99,999 | 97 | 21.0% |
| $100,000 to $149,999 | 87 | 18.8% |
| $150,000 to $199,999 | 36 | 7.8% |
| $200,000+ | 20 | 4.3% |
Family Income by Famaliy Size in Alta
4-person families (63 | 13.6%) account for the highest median family income in Alta with $122,917 per family, while 2-person families (185 | 40.0%) have the highest median income of $35,052 per family member.
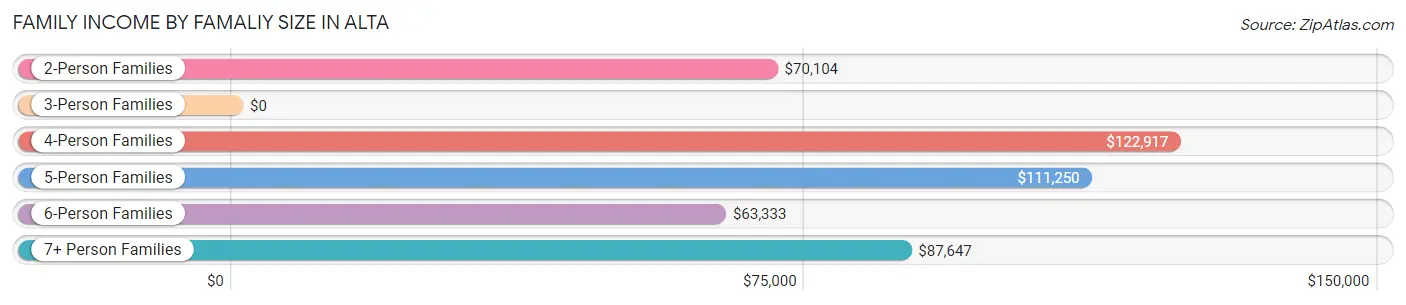
| Income Bracket | # Families | Median Income |
| 2-Person Families | 185 (40.0%) | $70,104 |
| 3-Person Families | 108 (23.3%) | $0 |
| 4-Person Families | 63 (13.6%) | $122,917 |
| 5-Person Families | 55 (11.9%) | $111,250 |
| 6-Person Families | 18 (3.9%) | $63,333 |
| 7+ Person Families | 34 (7.3%) | $87,647 |
| Total | 463 (100.0%) | $77,688 |
Family Income by Number of Earners in Alta
The median family income in Alta is $77,688, with families comprising 3+ earners (46) having the highest median family income of $131,667, while families with no earners (50) have the lowest median family income of $42,083, accounting for 9.9% and 10.8% of families, respectively.
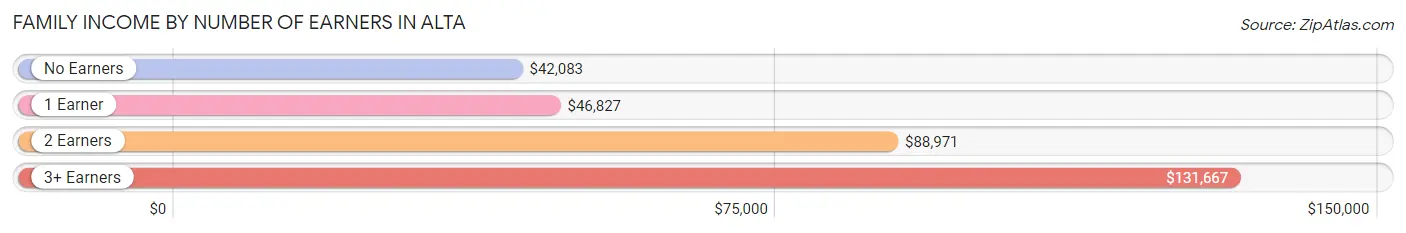
| Number of Earners | # Families | Median Income |
| No Earners | 50 (10.8%) | $42,083 |
| 1 Earner | 159 (34.3%) | $46,827 |
| 2 Earners | 208 (44.9%) | $88,971 |
| 3+ Earners | 46 (9.9%) | $131,667 |
| Total | 463 (100.0%) | $77,688 |
Household Income in Alta
Household Income Brackets in Alta
With 229 households falling in the category, the $50,000 to $74,999 income range is the most frequent in Alta, accounting for 31.7% of all households. In contrast, only 9 households (1.2%) fall into the less than $10,000 income bracket, making it the least populous group.
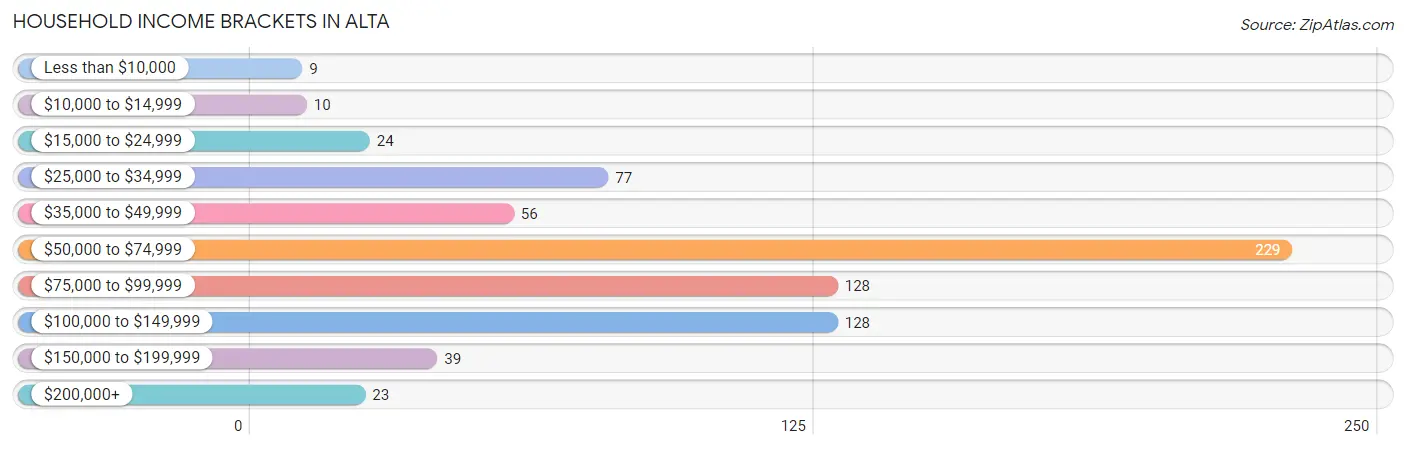
| Income Bracket | # Households | % Households |
| Less than $10,000 | 9 | 1.2% |
| $10,000 to $14,999 | 10 | 1.4% |
| $15,000 to $24,999 | 24 | 3.3% |
| $25,000 to $34,999 | 77 | 10.7% |
| $35,000 to $49,999 | 56 | 7.7% |
| $50,000 to $74,999 | 229 | 31.7% |
| $75,000 to $99,999 | 128 | 17.7% |
| $100,000 to $149,999 | 128 | 17.7% |
| $150,000 to $199,999 | 39 | 5.4% |
| $200,000+ | 23 | 3.2% |
Household Income by Householder Age in Alta
The median household income in Alta is $70,094, with the highest median household income of $78,958 found in the 25 to 44 years age bracket for the primary householder. A total of 295 households (40.8%) fall into this category. Meanwhile, the 15 to 24 years age bracket for the primary householder has the lowest median household income of $34,688, with 19 households (2.6%) in this group.
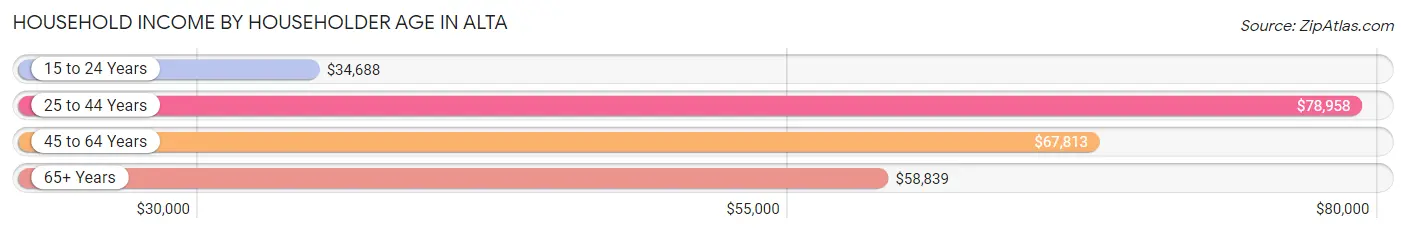
| Income Bracket | # Households | Median Income |
| 15 to 24 Years | 19 (2.6%) | $34,688 |
| 25 to 44 Years | 295 (40.8%) | $78,958 |
| 45 to 64 Years | 260 (36.0%) | $67,813 |
| 65+ Years | 149 (20.6%) | $58,839 |
| Total | 723 (100.0%) | $70,094 |
Poverty in Alta
Income Below Poverty by Sex and Age in Alta
With 4.9% poverty level for males and 4.3% for females among the residents of Alta, 6 to 11 year old males and 18 to 24 year old females are the most vulnerable to poverty, with 23 males (22.3%) and 14 females (15.7%) in their respective age groups living below the poverty level.
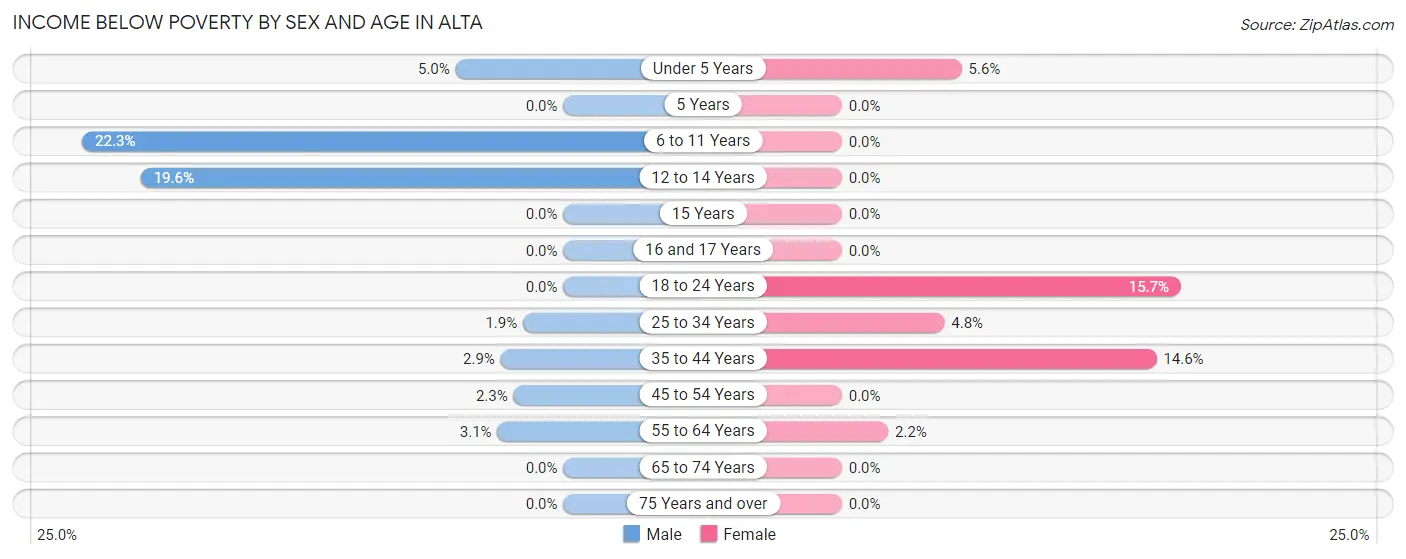
| Age Bracket | Male | Female |
| Under 5 Years | 5 (5.0%) | 3 (5.6%) |
| 5 Years | 0 (0.0%) | 0 (0.0%) |
| 6 to 11 Years | 23 (22.3%) | 0 (0.0%) |
| 12 to 14 Years | 10 (19.6%) | 0 (0.0%) |
| 15 Years | 0 (0.0%) | 0 (0.0%) |
| 16 and 17 Years | 0 (0.0%) | 0 (0.0%) |
| 18 to 24 Years | 0 (0.0%) | 14 (15.7%) |
| 25 to 34 Years | 2 (1.9%) | 5 (4.8%) |
| 35 to 44 Years | 5 (2.9%) | 20 (14.6%) |
| 45 to 54 Years | 6 (2.3%) | 0 (0.0%) |
| 55 to 64 Years | 3 (3.1%) | 4 (2.1%) |
| 65 to 74 Years | 0 (0.0%) | 0 (0.0%) |
| 75 Years and over | 0 (0.0%) | 0 (0.0%) |
| Total | 54 (4.9%) | 46 (4.3%) |
Income Above Poverty by Sex and Age in Alta
According to the poverty statistics in Alta, males aged 5 years and females aged 5 years are the age groups that are most secure financially, with 100.0% of males and 100.0% of females in these age groups living above the poverty line.
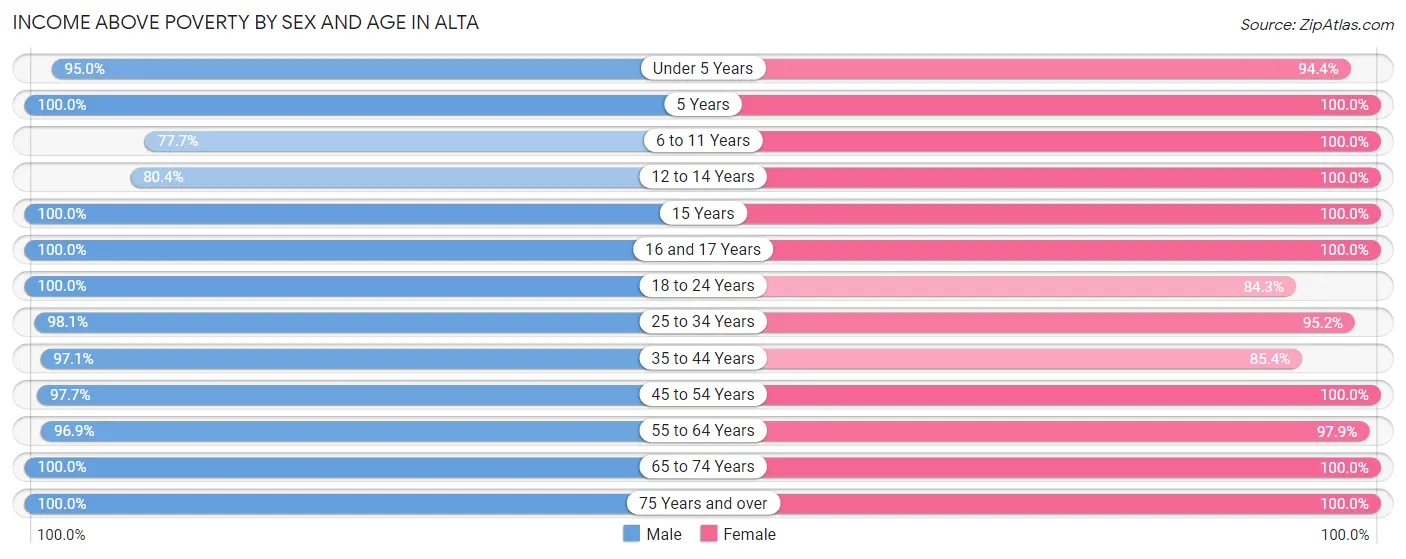
| Age Bracket | Male | Female |
| Under 5 Years | 95 (95.0%) | 51 (94.4%) |
| 5 Years | 12 (100.0%) | 13 (100.0%) |
| 6 to 11 Years | 80 (77.7%) | 130 (100.0%) |
| 12 to 14 Years | 41 (80.4%) | 70 (100.0%) |
| 15 Years | 11 (100.0%) | 32 (100.0%) |
| 16 and 17 Years | 39 (100.0%) | 43 (100.0%) |
| 18 to 24 Years | 29 (100.0%) | 75 (84.3%) |
| 25 to 34 Years | 105 (98.1%) | 100 (95.2%) |
| 35 to 44 Years | 167 (97.1%) | 117 (85.4%) |
| 45 to 54 Years | 254 (97.7%) | 69 (100.0%) |
| 55 to 64 Years | 95 (96.9%) | 182 (97.9%) |
| 65 to 74 Years | 56 (100.0%) | 63 (100.0%) |
| 75 Years and over | 58 (100.0%) | 77 (100.0%) |
| Total | 1,042 (95.1%) | 1,022 (95.7%) |
Income Below Poverty Among Married-Couple Families in Alta
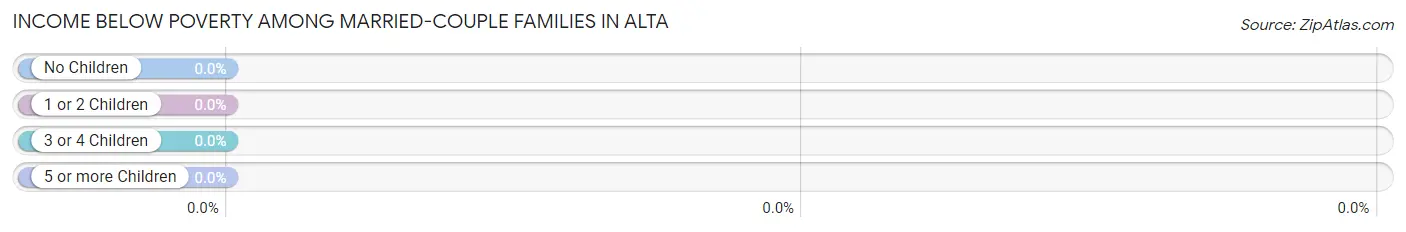
| Children | Above Poverty | Below Poverty |
| No Children | 160 (100.0%) | 0 (0.0%) |
| 1 or 2 Children | 100 (100.0%) | 0 (0.0%) |
| 3 or 4 Children | 52 (100.0%) | 0 (0.0%) |
| 5 or more Children | 33 (100.0%) | 0 (0.0%) |
| Total | 345 (100.0%) | 0 (0.0%) |
Income Below Poverty Among Single-Parent Households in Alta
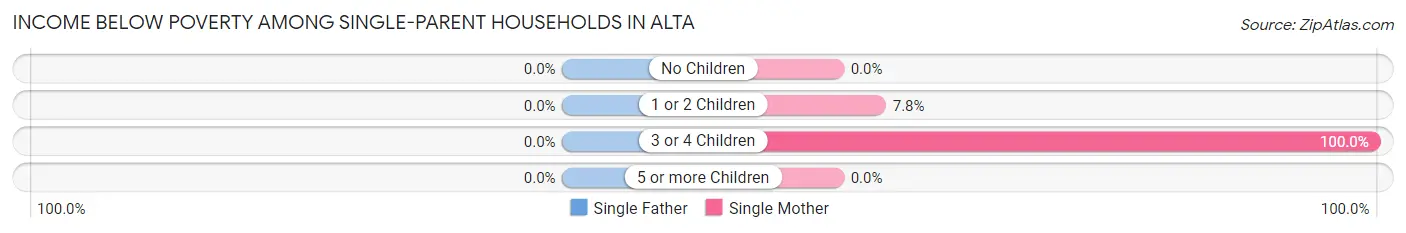
| Children | Single Father | Single Mother |
| No Children | 0 (0.0%) | 0 (0.0%) |
| 1 or 2 Children | 0 (0.0%) | 4 (7.8%) |
| 3 or 4 Children | 0 (0.0%) | 11 (100.0%) |
| 5 or more Children | 0 (0.0%) | 0 (0.0%) |
| Total | 0 (0.0%) | 15 (17.6%) |
Income Below Poverty Among Married-Couple vs Single-Parent Households in Alta
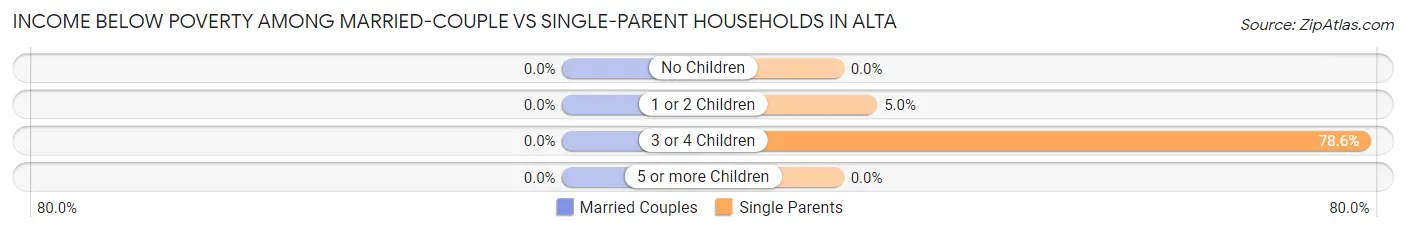
| Children | Married-Couple Families | Single-Parent Households |
| No Children | 0 (0.0%) | 0 (0.0%) |
| 1 or 2 Children | 0 (0.0%) | 4 (5.0%) |
| 3 or 4 Children | 0 (0.0%) | 11 (78.6%) |
| 5 or more Children | 0 (0.0%) | 0 (0.0%) |
| Total | 0 (0.0%) | 15 (12.7%) |
Race in Alta
The most populous races in Alta are White / Caucasian (1,606 | 72.8%), Hispanic or Latino (336 | 15.2%), and Asian (244 | 11.1%).
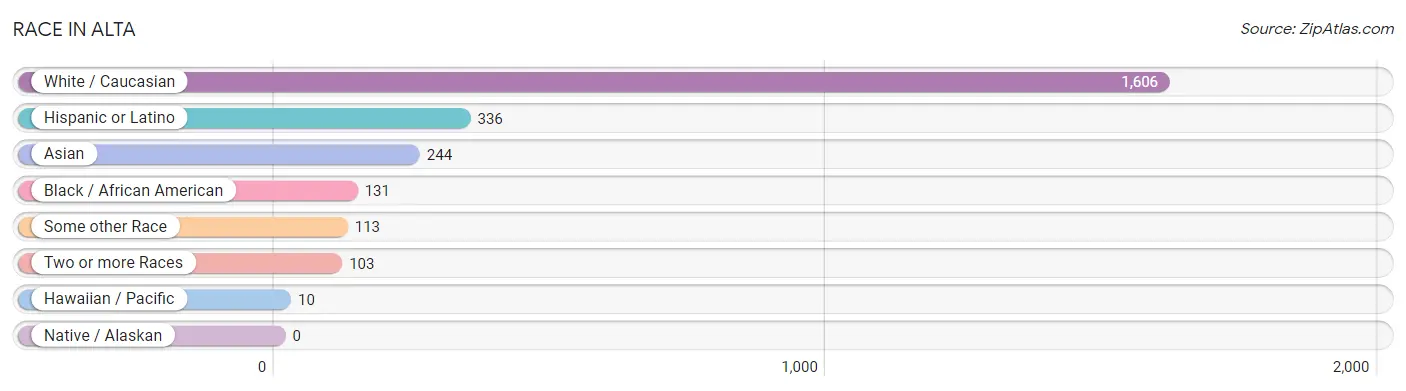
| Race | # Population | % Population |
| Asian | 244 | 11.1% |
| Black / African American | 131 | 5.9% |
| Hawaiian / Pacific | 10 | 0.4% |
| Hispanic or Latino | 336 | 15.2% |
| Native / Alaskan | 0 | 0.0% |
| White / Caucasian | 1,606 | 72.8% |
| Two or more Races | 103 | 4.7% |
| Some other Race | 113 | 5.1% |
| Total | 2,207 | 100.0% |
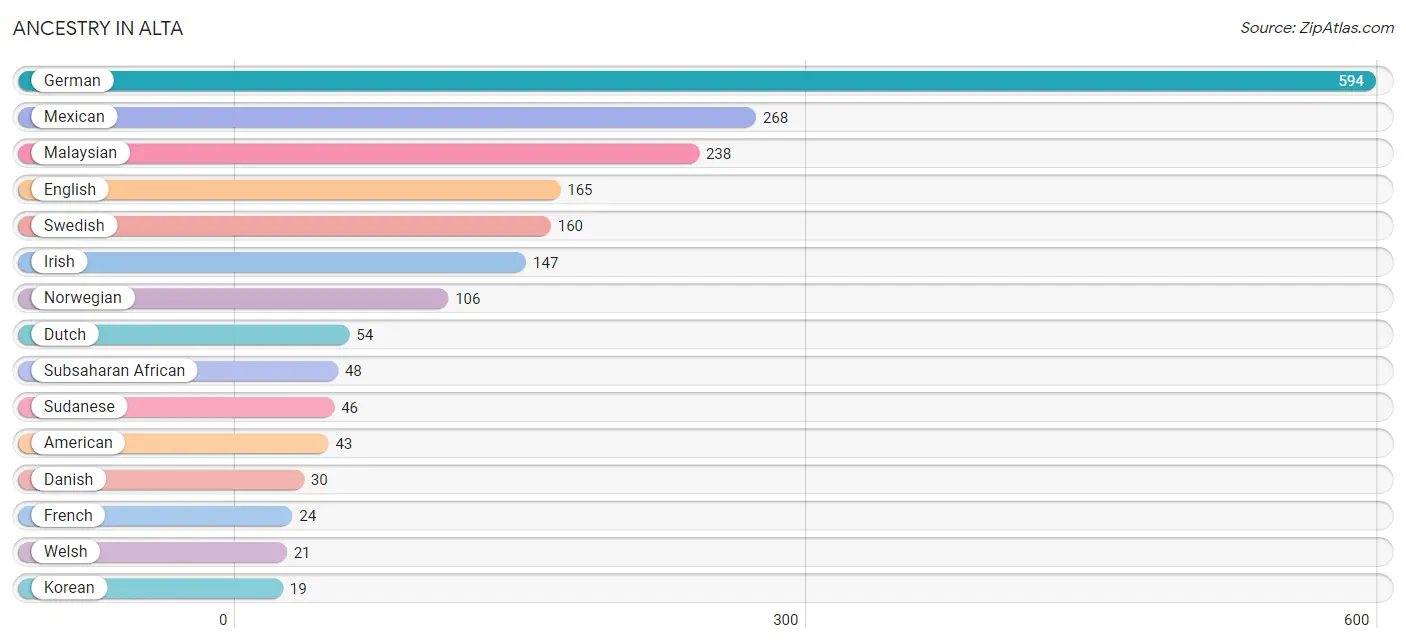
Ancestry in Alta
The most populous ancestries reported in Alta are German (594 | 26.9%), Mexican (268 | 12.1%), Malaysian (238 | 10.8%), English (165 | 7.5%), and Swedish (160 | 7.2%), together accounting for 64.6% of all Alta residents.
| Ancestry | # Population | % Population |
| African | 2 | 0.1% |
| American | 43 | 1.9% |
| Austrian | 2 | 0.1% |
| Bangladeshi | 6 | 0.3% |
| Central American | 10 | 0.4% |
| Colombian | 3 | 0.1% |
| Cuban | 9 | 0.4% |
| Czech | 13 | 0.6% |
| Danish | 30 | 1.4% |
| Dutch | 54 | 2.5% |
| English | 165 | 7.5% |
| European | 7 | 0.3% |
| French | 24 | 1.1% |
| German | 594 | 26.9% |
| Guatemalan | 7 | 0.3% |
| Honduran | 3 | 0.1% |
| Indian (Asian) | 3 | 0.1% |
| Irish | 147 | 6.7% |
| Italian | 6 | 0.3% |
| Korean | 19 | 0.9% |
| Malaysian | 238 | 10.8% |
| Mexican | 268 | 12.1% |
| Norwegian | 106 | 4.8% |
| Pennsylvania German | 3 | 0.1% |
| Polish | 11 | 0.5% |
| Puerto Rican | 4 | 0.2% |
| Scotch-Irish | 17 | 0.8% |
| Scottish | 2 | 0.1% |
| South American | 16 | 0.7% |
| Spaniard | 3 | 0.1% |
| Subsaharan African | 48 | 2.2% |
| Sudanese | 46 | 2.1% |
| Swedish | 160 | 7.2% |
| Venezuelan | 13 | 0.6% |
| Welsh | 21 | 0.9% | View All 35 Rows |
Immigrants in Alta
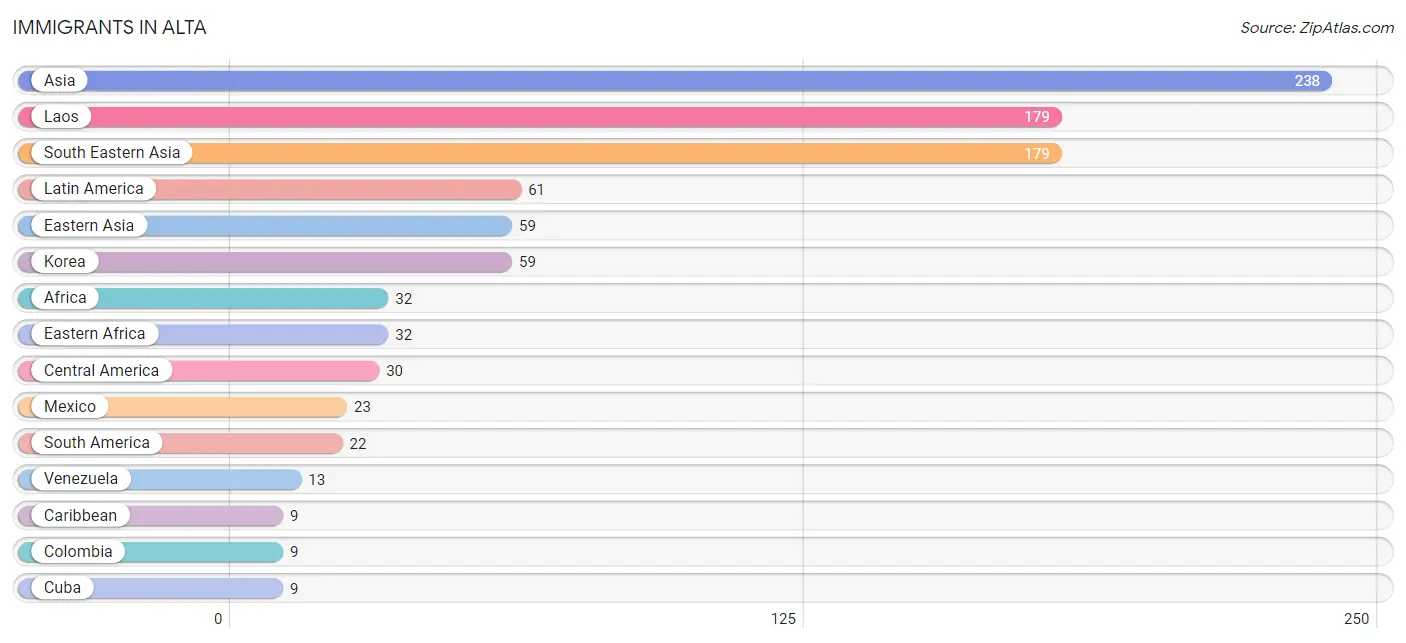
The most numerous immigrant groups reported in Alta came from Asia (238 | 10.8%), Laos (179 | 8.1%), South Eastern Asia (179 | 8.1%), Latin America (61 | 2.8%), and Eastern Asia (59 | 2.7%), together accounting for 32.4% of all Alta residents.
| Immigration Origin | # Population | % Population |
| Africa | 32 | 1.5% |
| Asia | 238 | 10.8% |
| Caribbean | 9 | 0.4% |
| Central America | 30 | 1.4% |
| Colombia | 9 | 0.4% |
| Cuba | 9 | 0.4% |
| Eastern Africa | 32 | 1.5% |
| Eastern Asia | 59 | 2.7% |
| Guatemala | 7 | 0.3% |
| Korea | 59 | 2.7% |
| Laos | 179 | 8.1% |
| Latin America | 61 | 2.8% |
| Mexico | 23 | 1.0% |
| Micronesia | 4 | 0.2% |
| Oceania | 4 | 0.2% |
| South America | 22 | 1.0% |
| South Eastern Asia | 179 | 8.1% |
| Venezuela | 13 | 0.6% | View All 18 Rows |
Sex and Age in Alta
Sex and Age in Alta
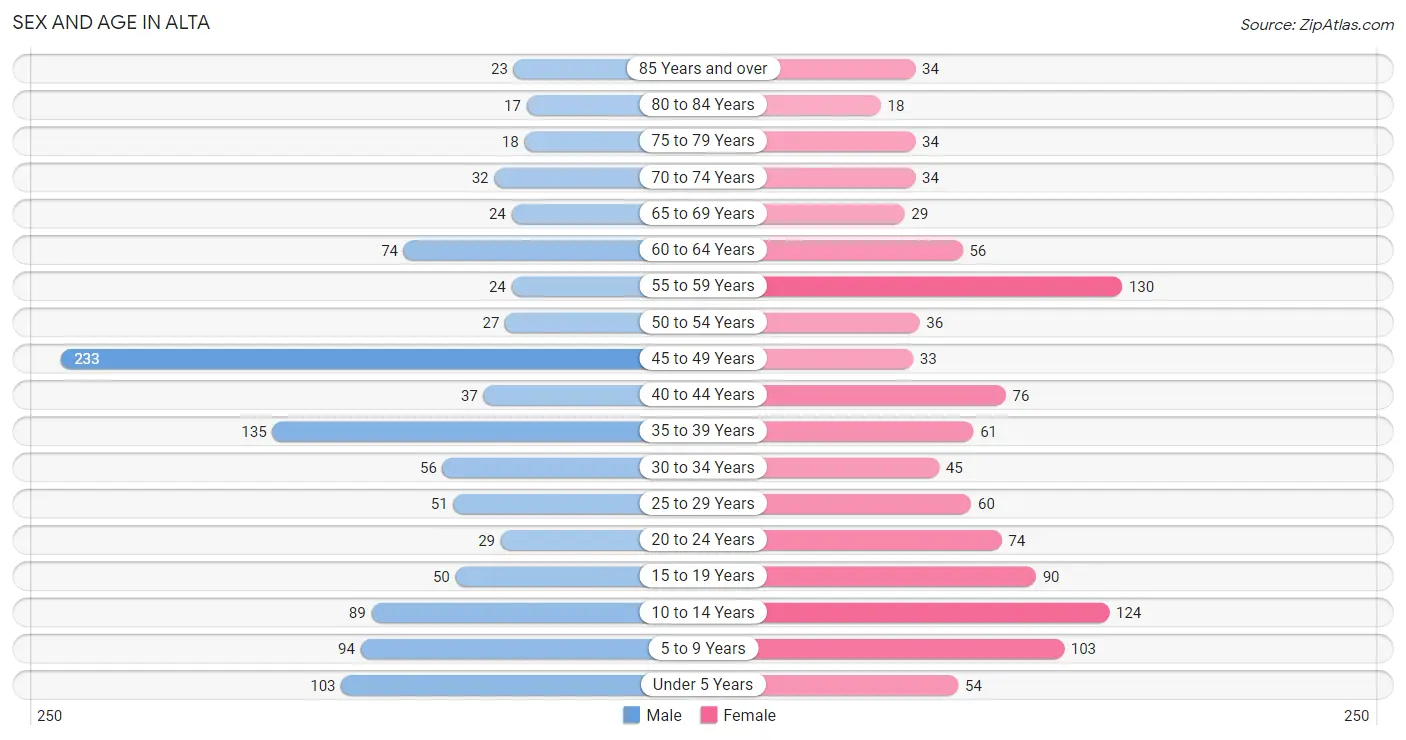
The most populous age groups in Alta are 45 to 49 Years (233 | 20.9%) for men and 55 to 59 Years (130 | 11.9%) for women.
| Age Bracket | Male | Female |
| Under 5 Years | 103 (9.2%) | 54 (5.0%) |
| 5 to 9 Years | 94 (8.4%) | 103 (9.4%) |
| 10 to 14 Years | 89 (8.0%) | 124 (11.4%) |
| 15 to 19 Years | 50 (4.5%) | 90 (8.3%) |
| 20 to 24 Years | 29 (2.6%) | 74 (6.8%) |
| 25 to 29 Years | 51 (4.6%) | 60 (5.5%) |
| 30 to 34 Years | 56 (5.0%) | 45 (4.1%) |
| 35 to 39 Years | 135 (12.1%) | 61 (5.6%) |
| 40 to 44 Years | 37 (3.3%) | 76 (7.0%) |
| 45 to 49 Years | 233 (20.9%) | 33 (3.0%) |
| 50 to 54 Years | 27 (2.4%) | 36 (3.3%) |
| 55 to 59 Years | 24 (2.1%) | 130 (11.9%) |
| 60 to 64 Years | 74 (6.6%) | 56 (5.1%) |
| 65 to 69 Years | 24 (2.1%) | 29 (2.7%) |
| 70 to 74 Years | 32 (2.9%) | 34 (3.1%) |
| 75 to 79 Years | 18 (1.6%) | 34 (3.1%) |
| 80 to 84 Years | 17 (1.5%) | 18 (1.7%) |
| 85 Years and over | 23 (2.1%) | 34 (3.1%) |
| Total | 1,116 (100.0%) | 1,091 (100.0%) |
Families and Households in Alta
Median Family Size in Alta
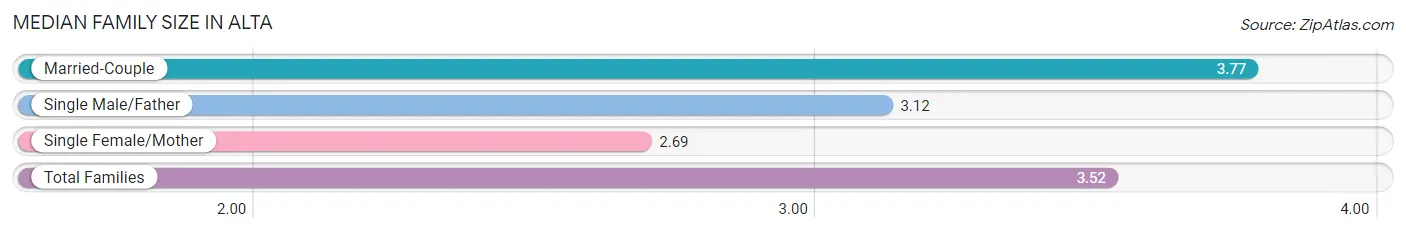
The median family size in Alta is 3.52 persons per family, with married-couple families (345 | 74.5%) accounting for the largest median family size of 3.77 persons per family. On the other hand, single female/mother families (85 | 18.4%) represent the smallest median family size with 2.69 persons per family.
| Family Type | # Families | Family Size |
| Married-Couple | 345 (74.5%) | 3.77 |
| Single Male/Father | 33 (7.1%) | 3.12 |
| Single Female/Mother | 85 (18.4%) | 2.69 |
| Total Families | 463 (100.0%) | 3.52 |
Median Household Size in Alta
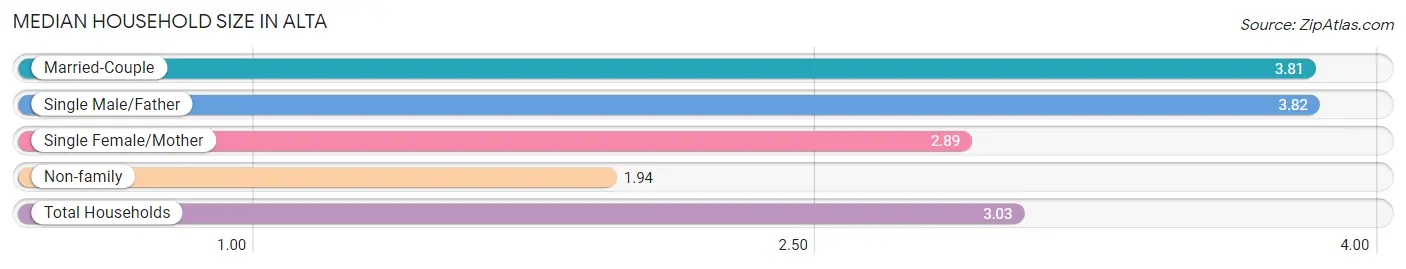
The median household size in Alta is 3.03 persons per household, with single male/father households (33 | 4.6%) accounting for the largest median household size of 3.82 persons per household. non-family households (260 | 36.0%) represent the smallest median household size with 1.94 persons per household.
| Household Type | # Households | Household Size |
| Married-Couple | 345 (47.7%) | 3.81 |
| Single Male/Father | 33 (4.6%) | 3.82 |
| Single Female/Mother | 85 (11.8%) | 2.89 |
| Non-family | 260 (36.0%) | 1.94 |
| Total Households | 723 (100.0%) | 3.03 |
Household Size by Marriage Status in Alta
Out of a total of 723 households in Alta, 463 (64.0%) are family households, while 260 (36.0%) are nonfamily households. The most numerous type of family households are 2-person households, comprising 164, and the most common type of nonfamily households are 1-person households, comprising 155.
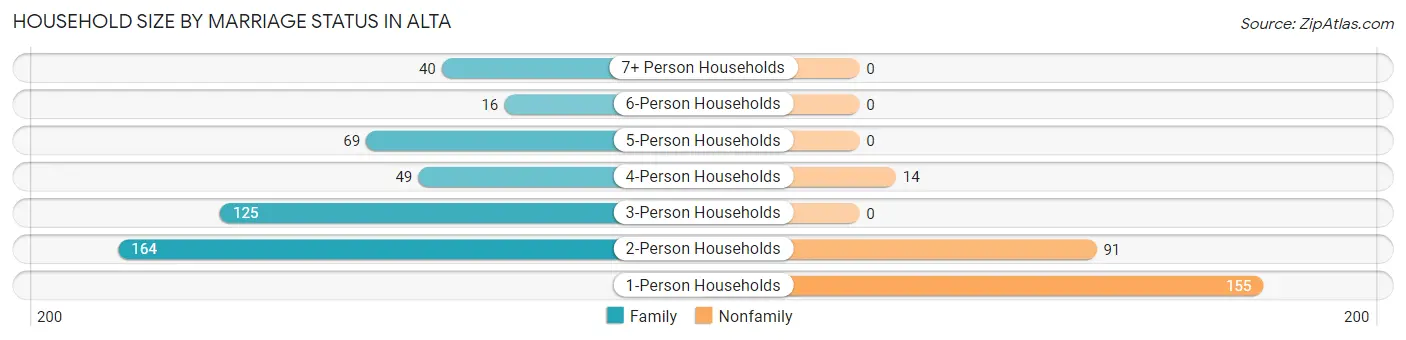
| Household Size | Family Households | Nonfamily Households |
| 1-Person Households | - | 155 (21.4%) |
| 2-Person Households | 164 (22.7%) | 91 (12.6%) |
| 3-Person Households | 125 (17.3%) | 0 (0.0%) |
| 4-Person Households | 49 (6.8%) | 14 (1.9%) |
| 5-Person Households | 69 (9.5%) | 0 (0.0%) |
| 6-Person Households | 16 (2.2%) | 0 (0.0%) |
| 7+ Person Households | 40 (5.5%) | 0 (0.0%) |
| Total | 463 (64.0%) | 260 (36.0%) |
Female Fertility in Alta
Fertility by Age in Alta
Average fertility rate in Alta is 75.0 births per 1,000 women. Women in the age bracket of 20 to 34 years have the highest fertility rate with 128.0 births per 1,000 women. Women in the age bracket of 20 to 34 years acount for 67.6% of all women with births.
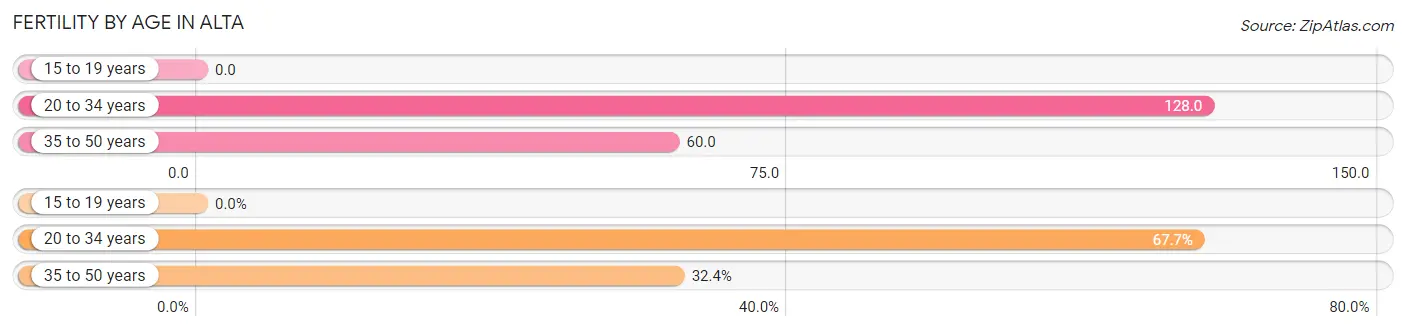
| Age Bracket | Women with Births | Births / 1,000 Women |
| 15 to 19 years | 0 (0.0%) | 0.0 |
| 20 to 34 years | 23 (67.6%) | 128.0 |
| 35 to 50 years | 11 (32.4%) | 60.0 |
| Total | 34 (100.0%) | 75.0 |
Fertility by Age by Marriage Status in Alta
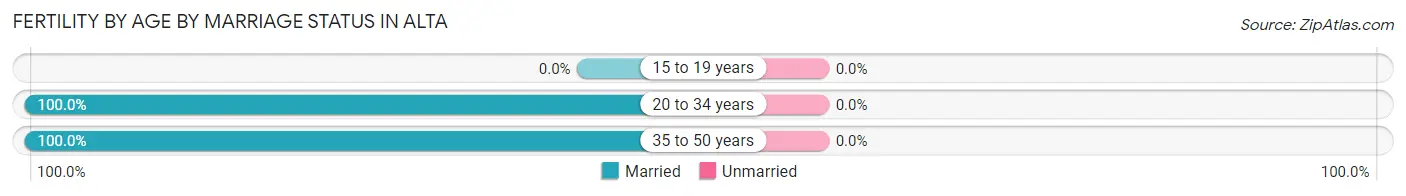
| Age Bracket | Married | Unmarried |
| 15 to 19 years | 0 (0.0%) | 0 (0.0%) |
| 20 to 34 years | 23 (100.0%) | 0 (0.0%) |
| 35 to 50 years | 11 (100.0%) | 0 (0.0%) |
| Total | 34 (100.0%) | 0 (0.0%) |
Fertility by Education in Alta
Average fertility rate in Alta is 75.0 births per 1,000 women. Women with the education attainment of college or associate's degree have the highest fertility rate of 98.0 births per 1,000 women, while women with the education attainment of high school diploma have the lowest fertility at 56.0 births per 1,000 women. Women with the education attainment of less than high school represent 32.4% of all women with births.
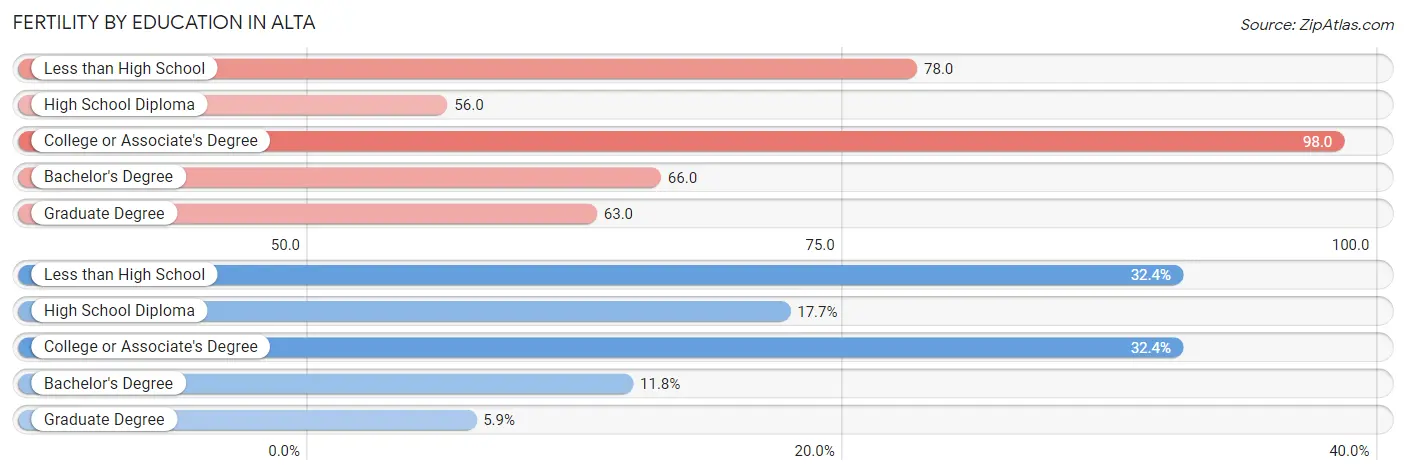
| Educational Attainment | Women with Births | Births / 1,000 Women |
| Less than High School | 11 (32.4%) | 78.0 |
| High School Diploma | 6 (17.6%) | 56.0 |
| College or Associate's Degree | 11 (32.4%) | 98.0 |
| Bachelor's Degree | 4 (11.8%) | 66.0 |
| Graduate Degree | 2 (5.9%) | 63.0 |
| Total | 34 (100.0%) | 75.0 |
Fertility by Education by Marriage Status in Alta
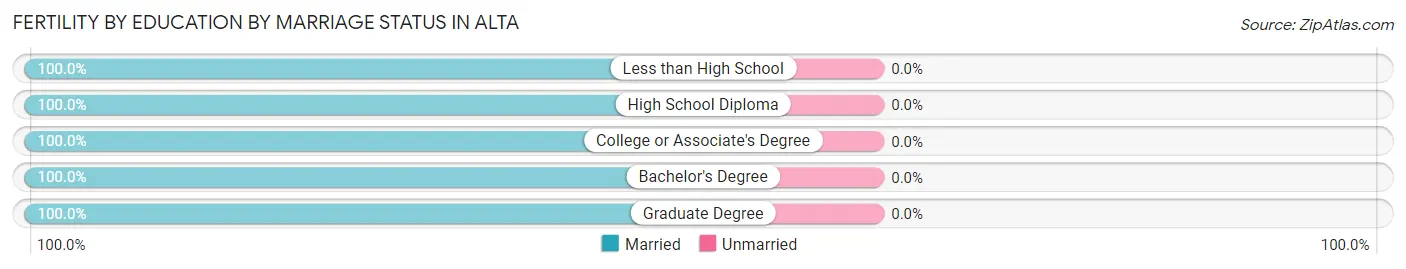
| Educational Attainment | Married | Unmarried |
| Less than High School | 11 (100.0%) | 0 (0.0%) |
| High School Diploma | 6 (100.0%) | 0 (0.0%) |
| College or Associate's Degree | 11 (100.0%) | 0 (0.0%) |
| Bachelor's Degree | 4 (100.0%) | 0 (0.0%) |
| Graduate Degree | 2 (100.0%) | 0 (0.0%) |
| Total | 34 (100.0%) | 0 (0.0%) |
Employment Characteristics in Alta
Employment by Class of Employer in Alta
Among the 996 employed individuals in Alta, private company employees (711 | 71.4%), not-for-profit organizations (98 | 9.8%), and local government employees (82 | 8.2%) make up the most common classes of employment.
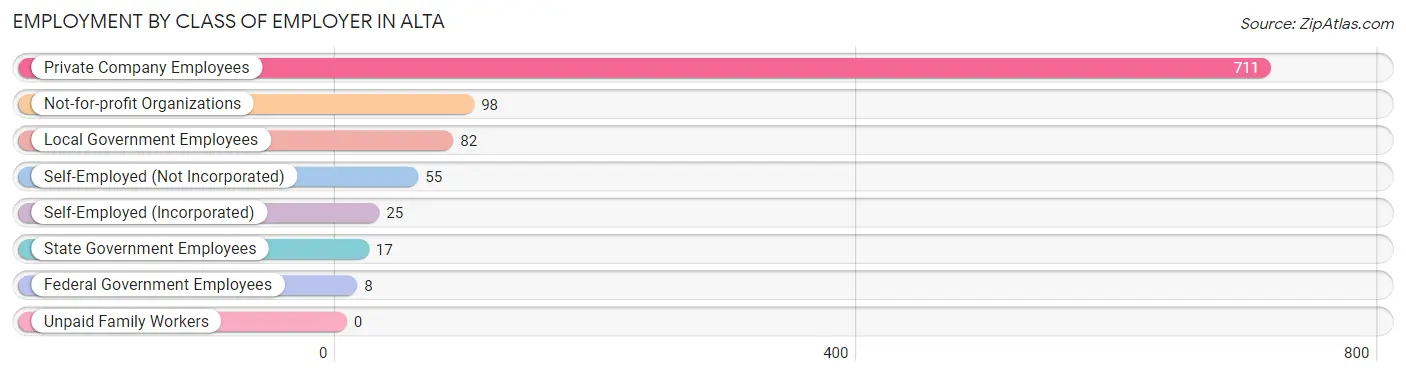
| Employer Class | # Employees | % Employees |
| Private Company Employees | 711 | 71.4% |
| Self-Employed (Incorporated) | 25 | 2.5% |
| Self-Employed (Not Incorporated) | 55 | 5.5% |
| Not-for-profit Organizations | 98 | 9.8% |
| Local Government Employees | 82 | 8.2% |
| State Government Employees | 17 | 1.7% |
| Federal Government Employees | 8 | 0.8% |
| Unpaid Family Workers | 0 | 0.0% |
| Total | 996 | 100.0% |
Employment Status by Age in Alta
According to the labor force statistics for Alta, out of the total population over 16 years of age (1,597), 74.5% or 1,190 individuals are in the labor force, with 15.4% or 183 of them unemployed. The age group with the highest labor force participation rate is 25 to 29 years, with 97.3% or 108 individuals in the labor force. Within the labor force, the 45 to 54 years age range has the highest percentage of unemployed individuals, with 57.2% or 179 of them being unemployed.
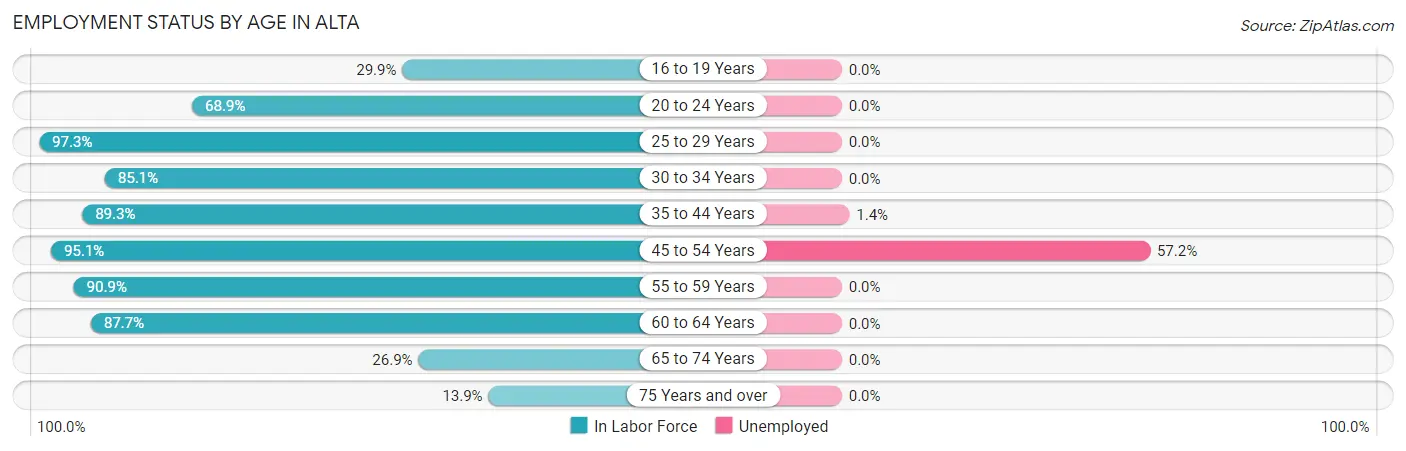
| Age Bracket | In Labor Force | Unemployed |
| 16 to 19 Years | 29 (29.9%) | 0 (0.0%) |
| 20 to 24 Years | 71 (68.9%) | 0 (0.0%) |
| 25 to 29 Years | 108 (97.3%) | 0 (0.0%) |
| 30 to 34 Years | 86 (85.1%) | 0 (0.0%) |
| 35 to 44 Years | 276 (89.3%) | 4 (1.4%) |
| 45 to 54 Years | 313 (95.1%) | 179 (57.2%) |
| 55 to 59 Years | 140 (90.9%) | 0 (0.0%) |
| 60 to 64 Years | 114 (87.7%) | 0 (0.0%) |
| 65 to 74 Years | 32 (26.9%) | 0 (0.0%) |
| 75 Years and over | 20 (13.9%) | 0 (0.0%) |
| Total | 1,190 (74.5%) | 183 (15.4%) |
Employment Status by Educational Attainment in Alta
According to labor force statistics for Alta, 91.4% of individuals (1,036) out of the total population between 25 and 64 years of age (1,134) are in the labor force, with 17.6% or 182 of them being unemployed. The group with the highest labor force participation rate are those with the educational attainment of bachelor's degree or higher, with 96.1% or 224 individuals in the labor force. Within the labor force, individuals with high school diploma education have the highest percentage of unemployment, with 41.2% or 183 of them being unemployed.
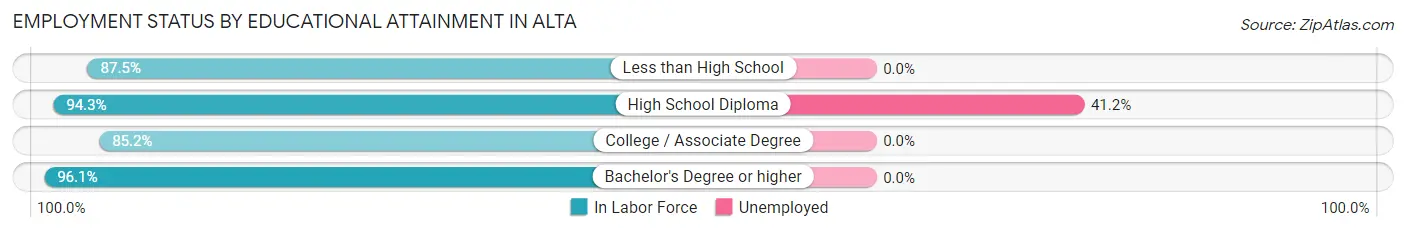
| Educational Attainment | In Labor Force | Unemployed |
| Less than High School | 98 (87.5%) | 0 (0.0%) |
| High School Diploma | 444 (94.3%) | 194 (41.2%) |
| College / Associate Degree | 271 (85.2%) | 0 (0.0%) |
| Bachelor's Degree or higher | 224 (96.1%) | 0 (0.0%) |
| Total | 1,036 (91.4%) | 200 (17.6%) |
Employment Occupations by Sex in Alta
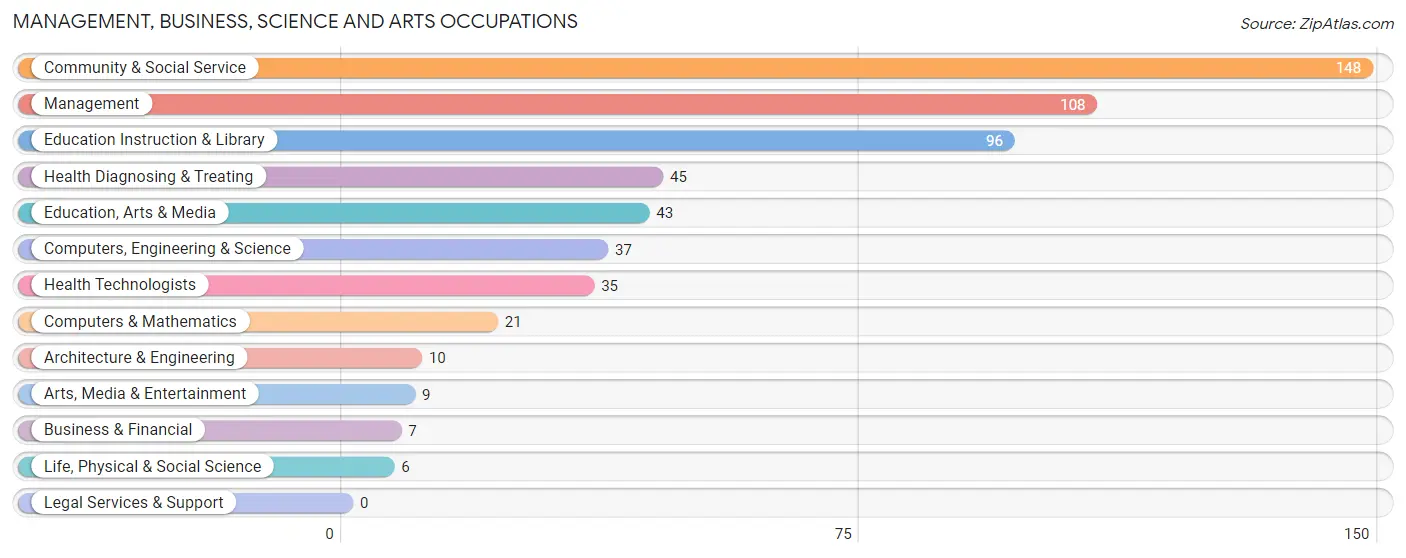
Management, Business, Science and Arts Occupations
The most common Management, Business, Science and Arts occupations in Alta are Community & Social Service (148 | 14.7%), Management (108 | 10.7%), Education Instruction & Library (96 | 9.5%), Health Diagnosing & Treating (45 | 4.5%), and Education, Arts & Media (43 | 4.3%).
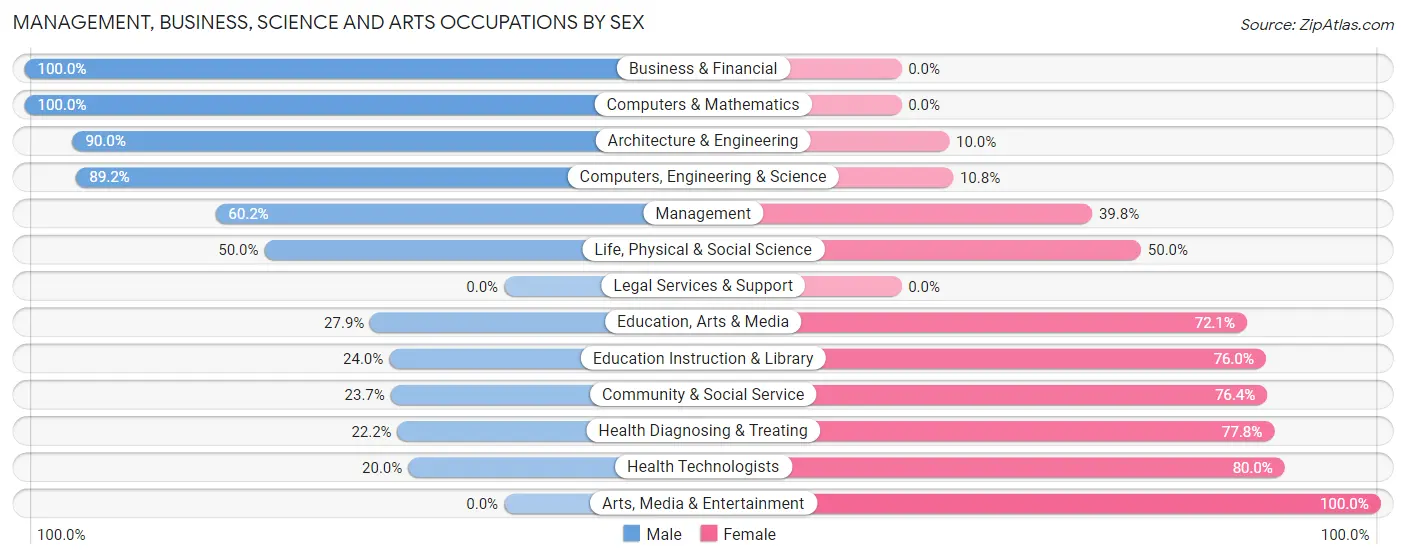
Management, Business, Science and Arts Occupations by Sex
Within the Management, Business, Science and Arts occupations in Alta, the most male-oriented occupations are Business & Financial (100.0%), Computers & Mathematics (100.0%), and Architecture & Engineering (90.0%), while the most female-oriented occupations are Arts, Media & Entertainment (100.0%), Health Technologists (80.0%), and Health Diagnosing & Treating (77.8%).
| Occupation | Male | Female |
| Management | 65 (60.2%) | 43 (39.8%) |
| Business & Financial | 7 (100.0%) | 0 (0.0%) |
| Computers, Engineering & Science | 33 (89.2%) | 4 (10.8%) |
| Computers & Mathematics | 21 (100.0%) | 0 (0.0%) |
| Architecture & Engineering | 9 (90.0%) | 1 (10.0%) |
| Life, Physical & Social Science | 3 (50.0%) | 3 (50.0%) |
| Community & Social Service | 35 (23.6%) | 113 (76.3%) |
| Education, Arts & Media | 12 (27.9%) | 31 (72.1%) |
| Legal Services & Support | 0 (0.0%) | 0 (0.0%) |
| Education Instruction & Library | 23 (24.0%) | 73 (76.0%) |
| Arts, Media & Entertainment | 0 (0.0%) | 9 (100.0%) |
| Health Diagnosing & Treating | 10 (22.2%) | 35 (77.8%) |
| Health Technologists | 7 (20.0%) | 28 (80.0%) |
| Total (Category) | 150 (43.5%) | 195 (56.5%) |
| Total (Overall) | 491 (48.8%) | 515 (51.2%) |
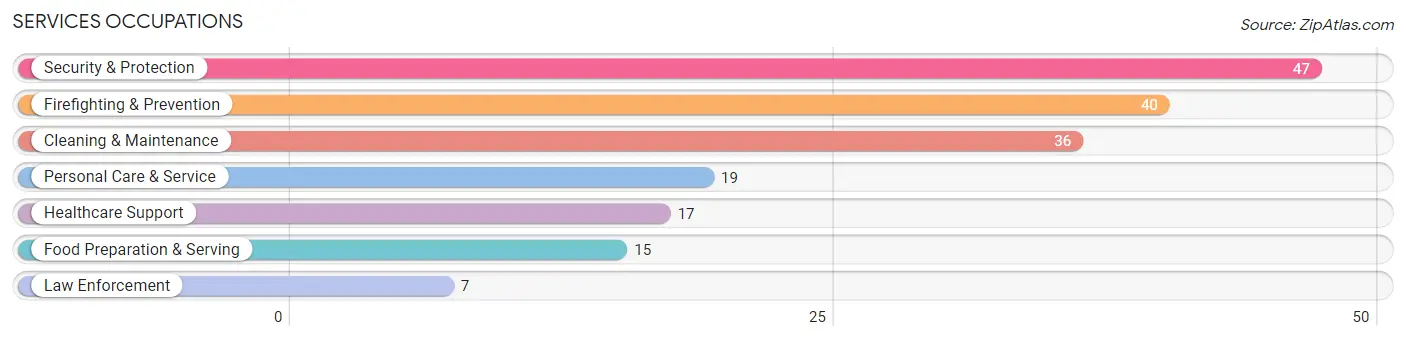
Services Occupations
The most common Services occupations in Alta are Security & Protection (47 | 4.7%), Firefighting & Prevention (40 | 4.0%), Cleaning & Maintenance (36 | 3.6%), Personal Care & Service (19 | 1.9%), and Healthcare Support (17 | 1.7%).
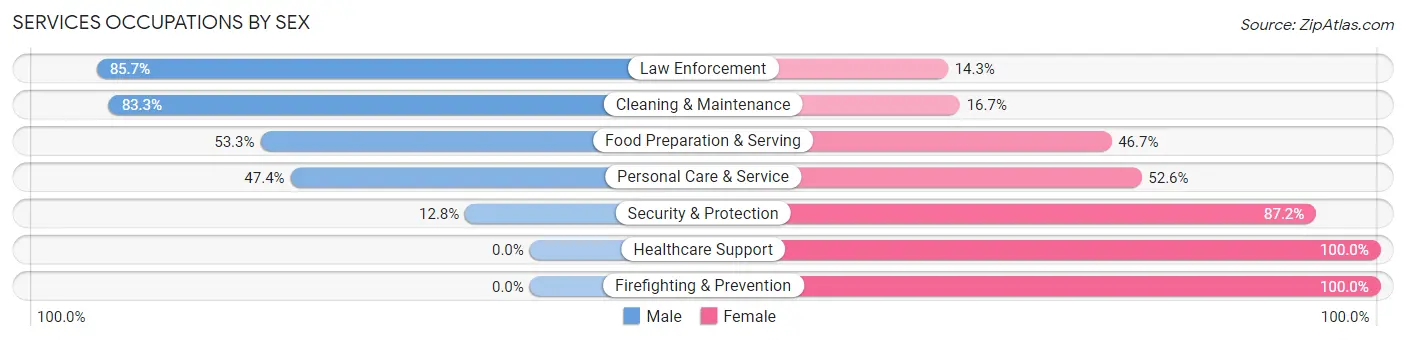
Services Occupations by Sex
Within the Services occupations in Alta, the most male-oriented occupations are Law Enforcement (85.7%), Cleaning & Maintenance (83.3%), and Food Preparation & Serving (53.3%), while the most female-oriented occupations are Healthcare Support (100.0%), Firefighting & Prevention (100.0%), and Security & Protection (87.2%).
| Occupation | Male | Female |
| Healthcare Support | 0 (0.0%) | 17 (100.0%) |
| Security & Protection | 6 (12.8%) | 41 (87.2%) |
| Firefighting & Prevention | 0 (0.0%) | 40 (100.0%) |
| Law Enforcement | 6 (85.7%) | 1 (14.3%) |
| Food Preparation & Serving | 8 (53.3%) | 7 (46.7%) |
| Cleaning & Maintenance | 30 (83.3%) | 6 (16.7%) |
| Personal Care & Service | 9 (47.4%) | 10 (52.6%) |
| Total (Category) | 53 (39.6%) | 81 (60.5%) |
| Total (Overall) | 491 (48.8%) | 515 (51.2%) |
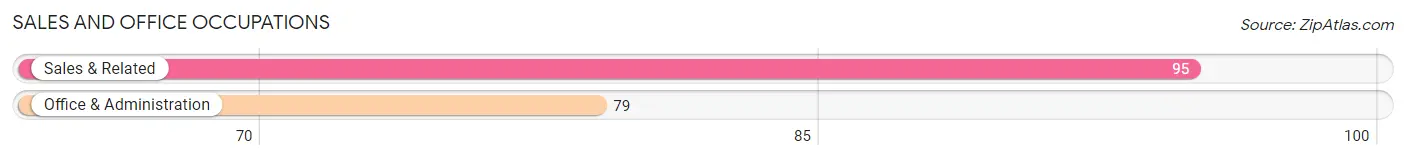
Sales and Office Occupations
The most common Sales and Office occupations in Alta are Sales & Related (95 | 9.4%), and Office & Administration (79 | 7.9%).
Sales and Office Occupations by Sex
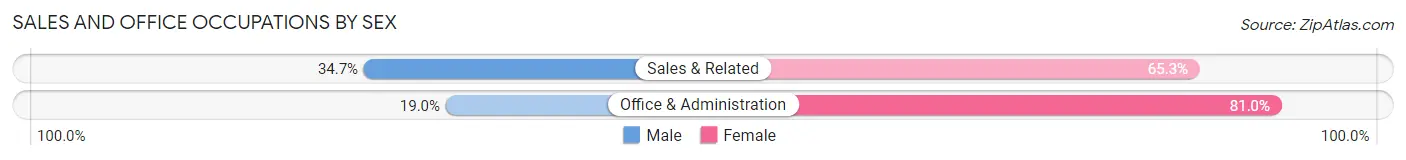
| Occupation | Male | Female |
| Sales & Related | 33 (34.7%) | 62 (65.3%) |
| Office & Administration | 15 (19.0%) | 64 (81.0%) |
| Total (Category) | 48 (27.6%) | 126 (72.4%) |
| Total (Overall) | 491 (48.8%) | 515 (51.2%) |
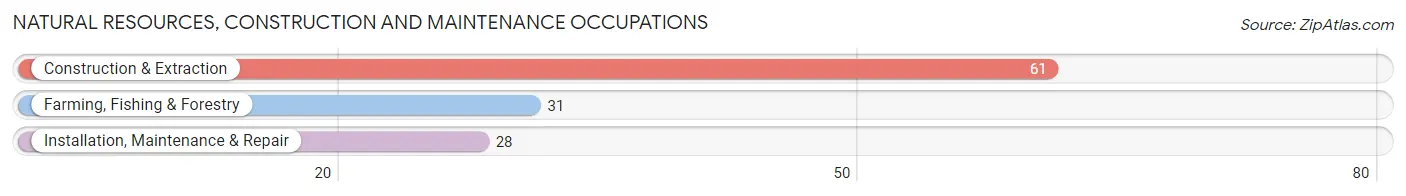
Natural Resources, Construction and Maintenance Occupations
The most common Natural Resources, Construction and Maintenance occupations in Alta are Construction & Extraction (61 | 6.1%), Farming, Fishing & Forestry (31 | 3.1%), and Installation, Maintenance & Repair (28 | 2.8%).
Natural Resources, Construction and Maintenance Occupations by Sex
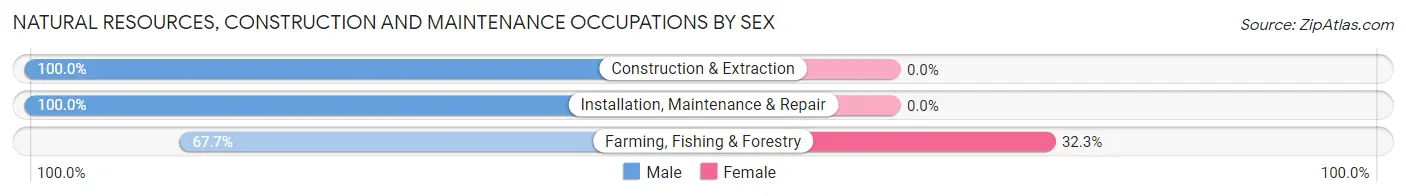
| Occupation | Male | Female |
| Farming, Fishing & Forestry | 21 (67.7%) | 10 (32.3%) |
| Construction & Extraction | 61 (100.0%) | 0 (0.0%) |
| Installation, Maintenance & Repair | 28 (100.0%) | 0 (0.0%) |
| Total (Category) | 110 (91.7%) | 10 (8.3%) |
| Total (Overall) | 491 (48.8%) | 515 (51.2%) |
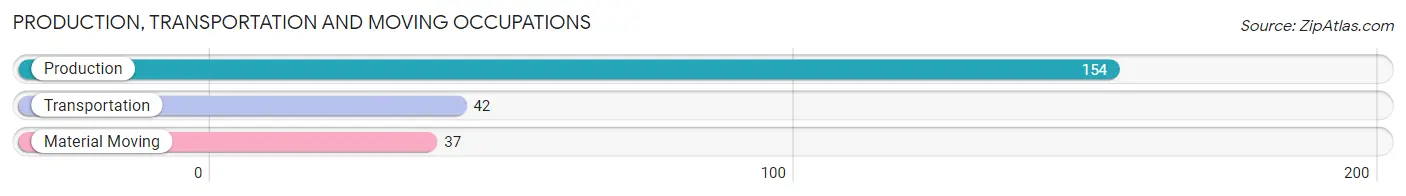
Production, Transportation and Moving Occupations
The most common Production, Transportation and Moving occupations in Alta are Production (154 | 15.3%), Transportation (42 | 4.2%), and Material Moving (37 | 3.7%).
Production, Transportation and Moving Occupations by Sex
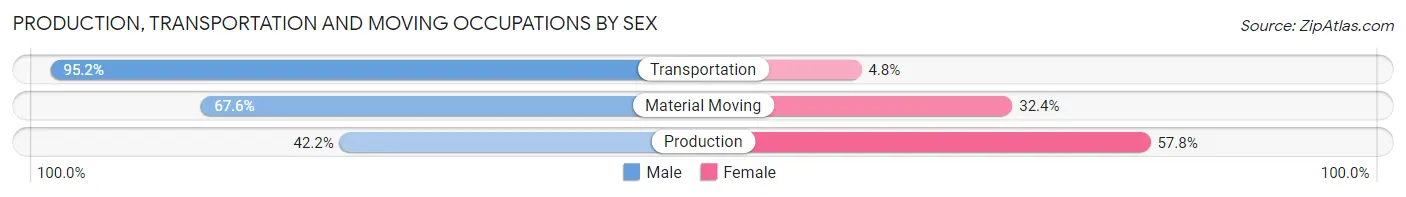
| Occupation | Male | Female |
| Production | 65 (42.2%) | 89 (57.8%) |
| Transportation | 40 (95.2%) | 2 (4.8%) |
| Material Moving | 25 (67.6%) | 12 (32.4%) |
| Total (Category) | 130 (55.8%) | 103 (44.2%) |
| Total (Overall) | 491 (48.8%) | 515 (51.2%) |
Employment Industries by Sex in Alta
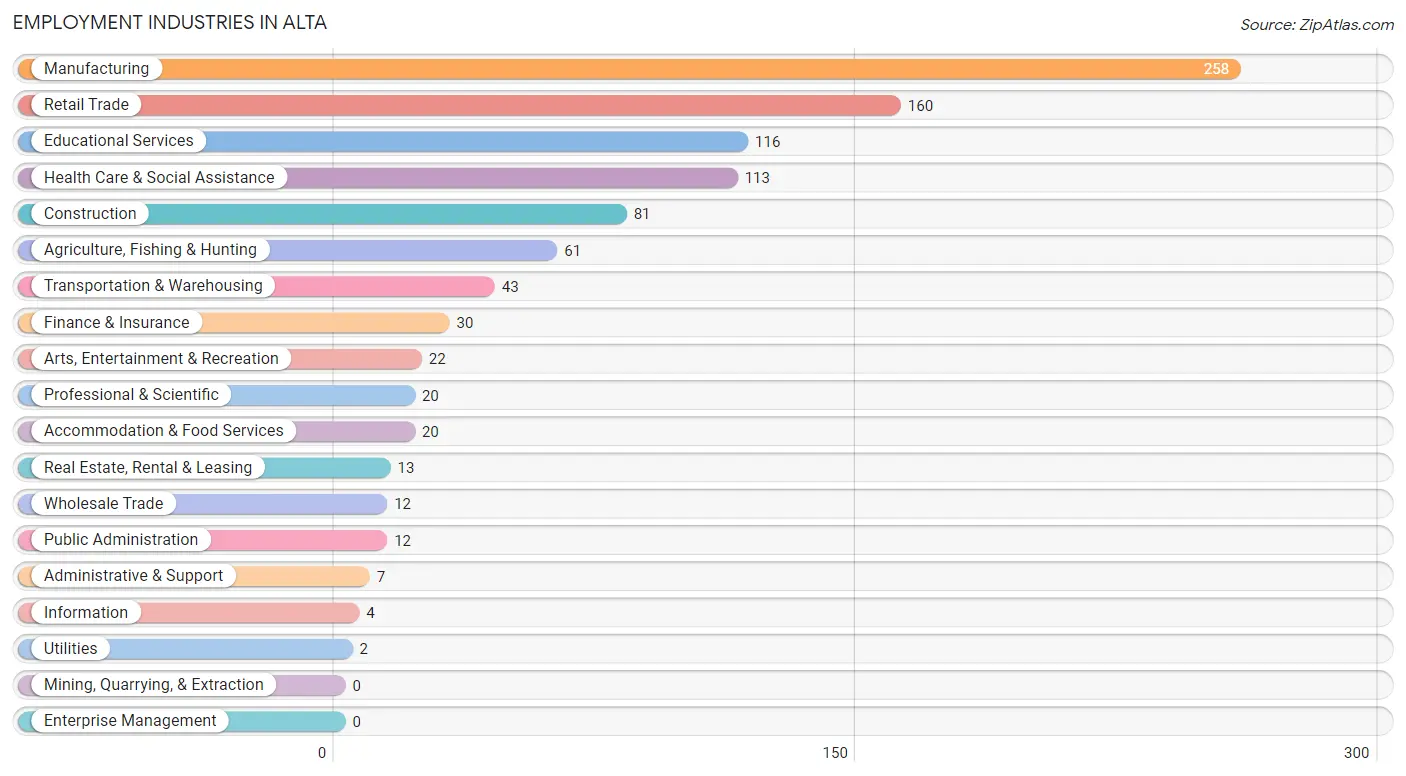
Employment Industries in Alta
The major employment industries in Alta include Manufacturing (258 | 25.7%), Retail Trade (160 | 15.9%), Educational Services (116 | 11.5%), Health Care & Social Assistance (113 | 11.2%), and Construction (81 | 8.1%).
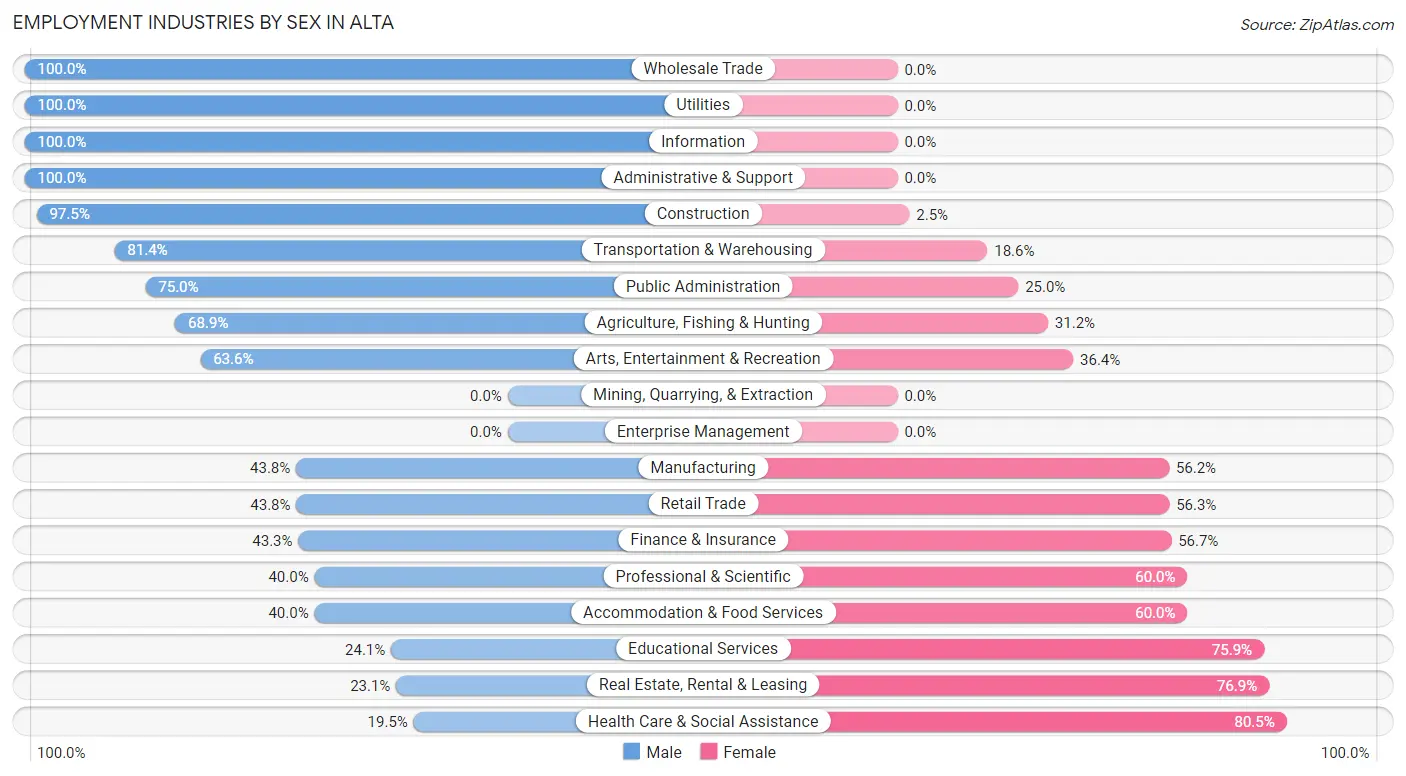
Employment Industries by Sex in Alta
The Alta industries that see more men than women are Wholesale Trade (100.0%), Utilities (100.0%), and Information (100.0%), whereas the industries that tend to have a higher number of women are Health Care & Social Assistance (80.5%), Real Estate, Rental & Leasing (76.9%), and Educational Services (75.9%).
| Industry | Male | Female |
| Agriculture, Fishing & Hunting | 42 (68.9%) | 19 (31.1%) |
| Mining, Quarrying, & Extraction | 0 (0.0%) | 0 (0.0%) |
| Construction | 79 (97.5%) | 2 (2.5%) |
| Manufacturing | 113 (43.8%) | 145 (56.2%) |
| Wholesale Trade | 12 (100.0%) | 0 (0.0%) |
| Retail Trade | 70 (43.8%) | 90 (56.2%) |
| Transportation & Warehousing | 35 (81.4%) | 8 (18.6%) |
| Utilities | 2 (100.0%) | 0 (0.0%) |
| Information | 4 (100.0%) | 0 (0.0%) |
| Finance & Insurance | 13 (43.3%) | 17 (56.7%) |
| Real Estate, Rental & Leasing | 3 (23.1%) | 10 (76.9%) |
| Professional & Scientific | 8 (40.0%) | 12 (60.0%) |
| Enterprise Management | 0 (0.0%) | 0 (0.0%) |
| Administrative & Support | 7 (100.0%) | 0 (0.0%) |
| Educational Services | 28 (24.1%) | 88 (75.9%) |
| Health Care & Social Assistance | 22 (19.5%) | 91 (80.5%) |
| Arts, Entertainment & Recreation | 14 (63.6%) | 8 (36.4%) |
| Accommodation & Food Services | 8 (40.0%) | 12 (60.0%) |
| Public Administration | 9 (75.0%) | 3 (25.0%) |
| Total | 491 (48.8%) | 515 (51.2%) |
Education in Alta
School Enrollment in Alta
The most common levels of schooling among the 667 students in Alta are middle school (181 | 27.1%), elementary school (162 | 24.3%), and high school (148 | 22.2%).
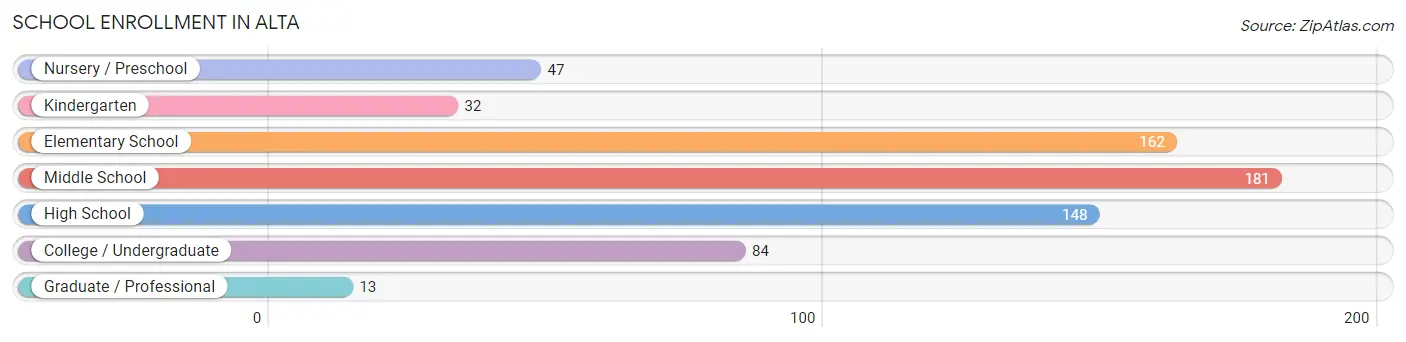
| School Level | # Students | % Students |
| Nursery / Preschool | 47 | 7.0% |
| Kindergarten | 32 | 4.8% |
| Elementary School | 162 | 24.3% |
| Middle School | 181 | 27.1% |
| High School | 148 | 22.2% |
| College / Undergraduate | 84 | 12.6% |
| Graduate / Professional | 13 | 1.9% |
| Total | 667 | 100.0% |
School Enrollment by Age by Funding Source in Alta
Out of a total of 667 students who are enrolled in schools in Alta, 58 (8.7%) attend a private institution, while the remaining 609 (91.3%) are enrolled in public schools. The age group of 35 years and over has the highest likelihood of being enrolled in private schools, with 9 (100.0% in the age bracket) enrolled. Conversely, the age group of 18 to 19 year olds has the lowest likelihood of being enrolled in a private school, with 13 (100.0% in the age bracket) attending a public institution.
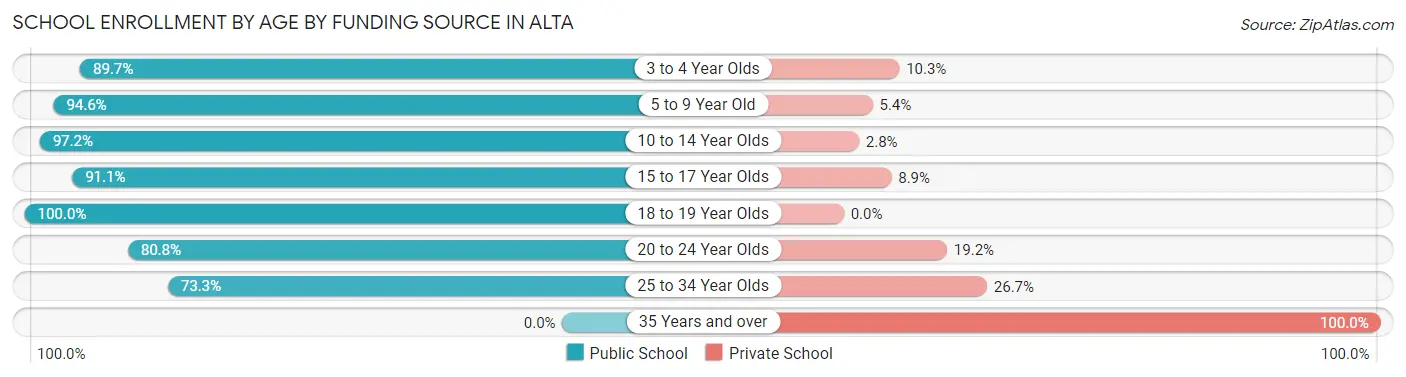
| Age Bracket | Public School | Private School |
| 3 to 4 Year Olds | 26 (89.7%) | 3 (10.3%) |
| 5 to 9 Year Old | 176 (94.6%) | 10 (5.4%) |
| 10 to 14 Year Olds | 207 (97.2%) | 6 (2.8%) |
| 15 to 17 Year Olds | 113 (91.1%) | 11 (8.9%) |
| 18 to 19 Year Olds | 13 (100.0%) | 0 (0.0%) |
| 20 to 24 Year Olds | 63 (80.8%) | 15 (19.2%) |
| 25 to 34 Year Olds | 11 (73.3%) | 4 (26.7%) |
| 35 Years and over | 0 (0.0%) | 9 (100.0%) |
| Total | 609 (91.3%) | 58 (8.7%) |
Educational Attainment by Field of Study in Alta
Education (92 | 27.8%), business (60 | 18.1%), arts & humanities (40 | 12.1%), bio, nature & agricultural (35 | 10.6%), and science & technology (29 | 8.8%) are the most common fields of study among 331 individuals in Alta who have obtained a bachelor's degree or higher.
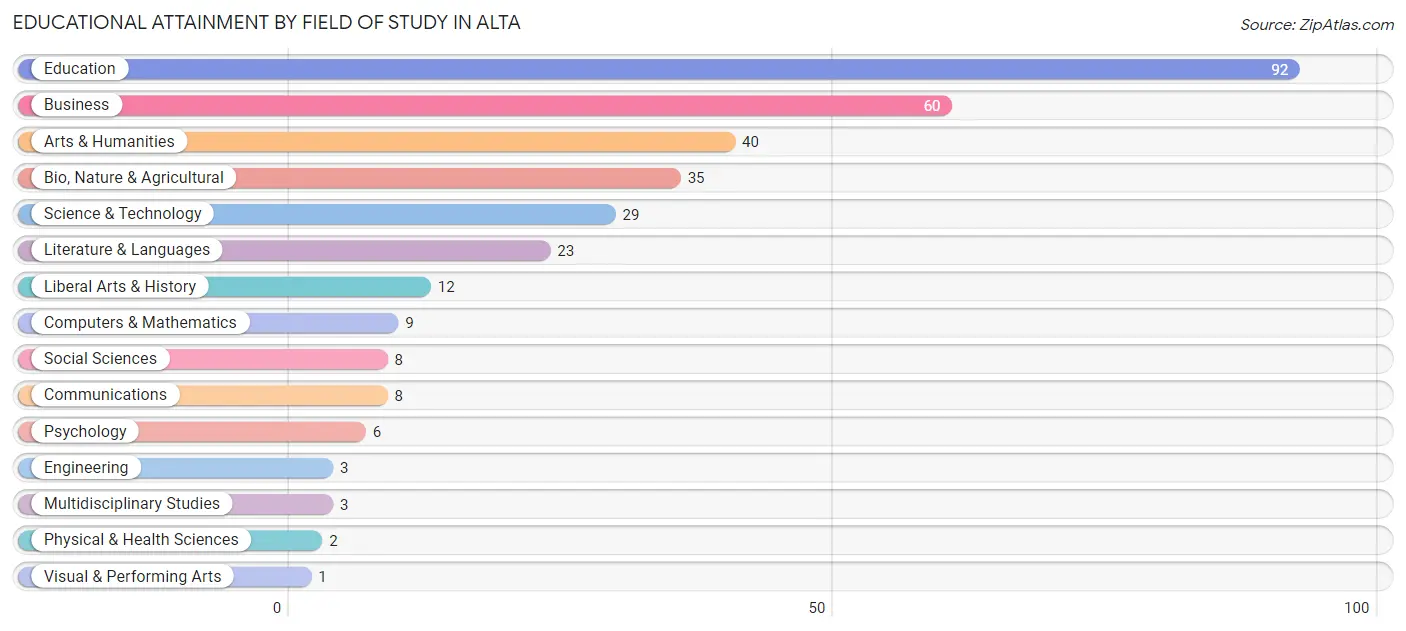
| Field of Study | # Graduates | % Graduates |
| Computers & Mathematics | 9 | 2.7% |
| Bio, Nature & Agricultural | 35 | 10.6% |
| Physical & Health Sciences | 2 | 0.6% |
| Psychology | 6 | 1.8% |
| Social Sciences | 8 | 2.4% |
| Engineering | 3 | 0.9% |
| Multidisciplinary Studies | 3 | 0.9% |
| Science & Technology | 29 | 8.8% |
| Business | 60 | 18.1% |
| Education | 92 | 27.8% |
| Literature & Languages | 23 | 7.0% |
| Liberal Arts & History | 12 | 3.6% |
| Visual & Performing Arts | 1 | 0.3% |
| Communications | 8 | 2.4% |
| Arts & Humanities | 40 | 12.1% |
| Total | 331 | 100.0% |
Transportation & Commute in Alta
Vehicle Availability by Sex in Alta
The most prevalent vehicle ownership categories in Alta are males with 2 vehicles (231, accounting for 47.2%) and females with 2 vehicles (181, making up 45.6%).
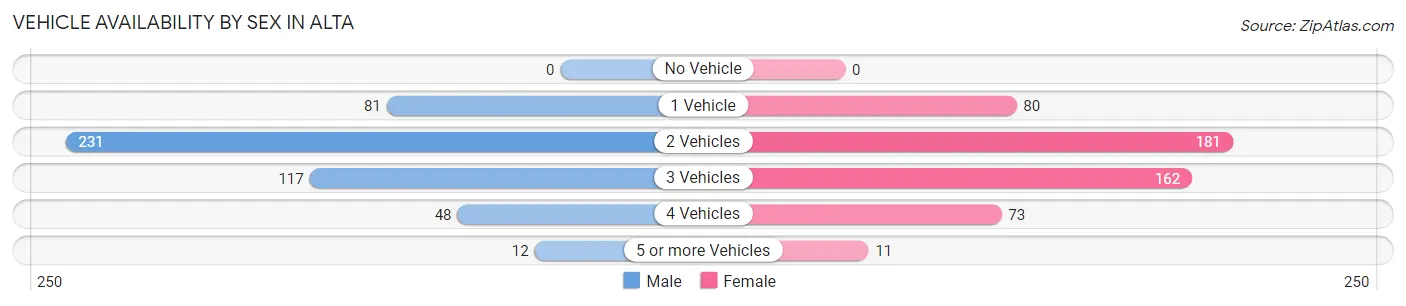
| Vehicles Available | Male | Female |
| No Vehicle | 0 (0.0%) | 0 (0.0%) |
| 1 Vehicle | 81 (16.6%) | 80 (15.8%) |
| 2 Vehicles | 231 (47.2%) | 181 (35.7%) |
| 3 Vehicles | 117 (23.9%) | 162 (32.0%) |
| 4 Vehicles | 48 (9.8%) | 73 (14.4%) |
| 5 or more Vehicles | 12 (2.5%) | 11 (2.2%) |
| Total | 489 (100.0%) | 507 (100.0%) |
Commute Time in Alta
The most frequently occuring commute durations in Alta are 10 to 14 minutes (333 commuters, 35.1%), 15 to 19 minutes (201 commuters, 21.2%), and 5 to 9 minutes (116 commuters, 12.2%).
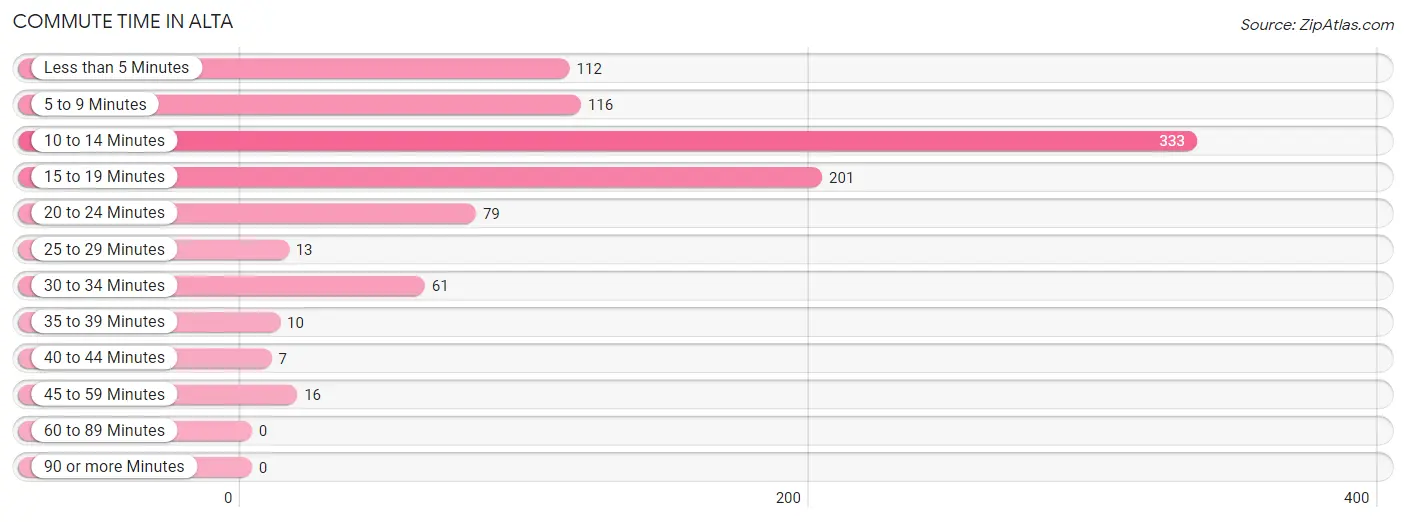
| Commute Time | # Commuters | % Commuters |
| Less than 5 Minutes | 112 | 11.8% |
| 5 to 9 Minutes | 116 | 12.2% |
| 10 to 14 Minutes | 333 | 35.1% |
| 15 to 19 Minutes | 201 | 21.2% |
| 20 to 24 Minutes | 79 | 8.3% |
| 25 to 29 Minutes | 13 | 1.4% |
| 30 to 34 Minutes | 61 | 6.4% |
| 35 to 39 Minutes | 10 | 1.1% |
| 40 to 44 Minutes | 7 | 0.7% |
| 45 to 59 Minutes | 16 | 1.7% |
| 60 to 89 Minutes | 0 | 0.0% |
| 90 or more Minutes | 0 | 0.0% |
Commute Time by Sex in Alta
The most common commute times in Alta are 10 to 14 minutes (117 commuters, 25.3%) for males and 10 to 14 minutes (216 commuters, 44.5%) for females.
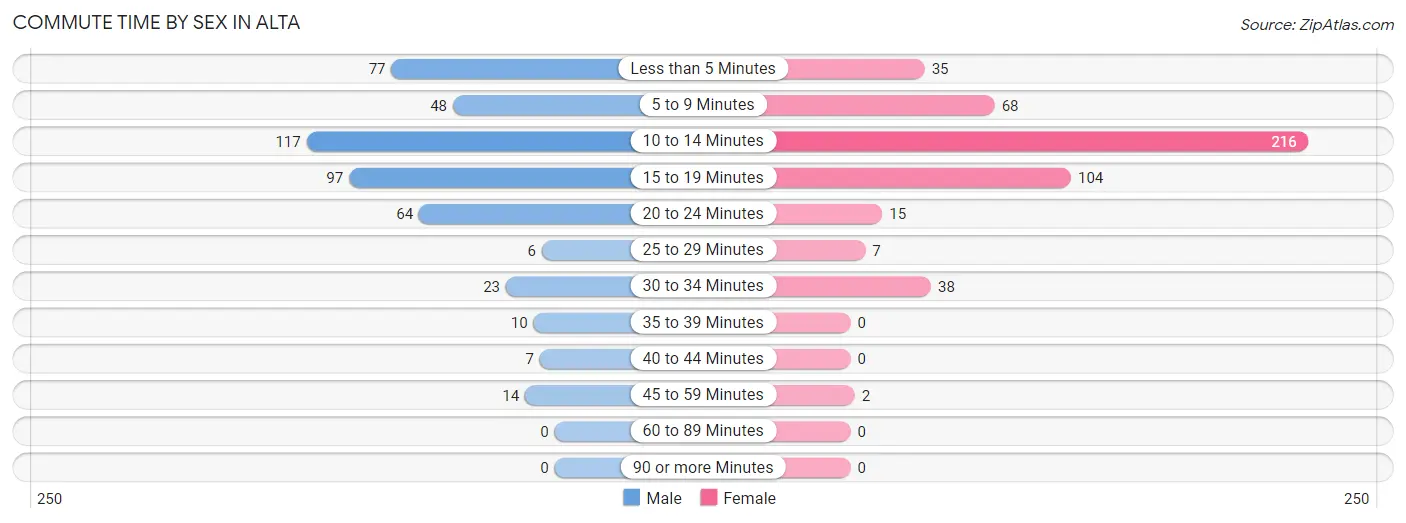
| Commute Time | Male | Female |
| Less than 5 Minutes | 77 (16.6%) | 35 (7.2%) |
| 5 to 9 Minutes | 48 (10.4%) | 68 (14.0%) |
| 10 to 14 Minutes | 117 (25.3%) | 216 (44.5%) |
| 15 to 19 Minutes | 97 (20.9%) | 104 (21.4%) |
| 20 to 24 Minutes | 64 (13.8%) | 15 (3.1%) |
| 25 to 29 Minutes | 6 (1.3%) | 7 (1.4%) |
| 30 to 34 Minutes | 23 (5.0%) | 38 (7.8%) |
| 35 to 39 Minutes | 10 (2.2%) | 0 (0.0%) |
| 40 to 44 Minutes | 7 (1.5%) | 0 (0.0%) |
| 45 to 59 Minutes | 14 (3.0%) | 2 (0.4%) |
| 60 to 89 Minutes | 0 (0.0%) | 0 (0.0%) |
| 90 or more Minutes | 0 (0.0%) | 0 (0.0%) |
Time of Departure to Work by Sex in Alta
The most frequent times of departure to work in Alta are 7:00 AM to 7:29 AM (67, 14.5%) for males and 7:30 AM to 7:59 AM (127, 26.2%) for females.
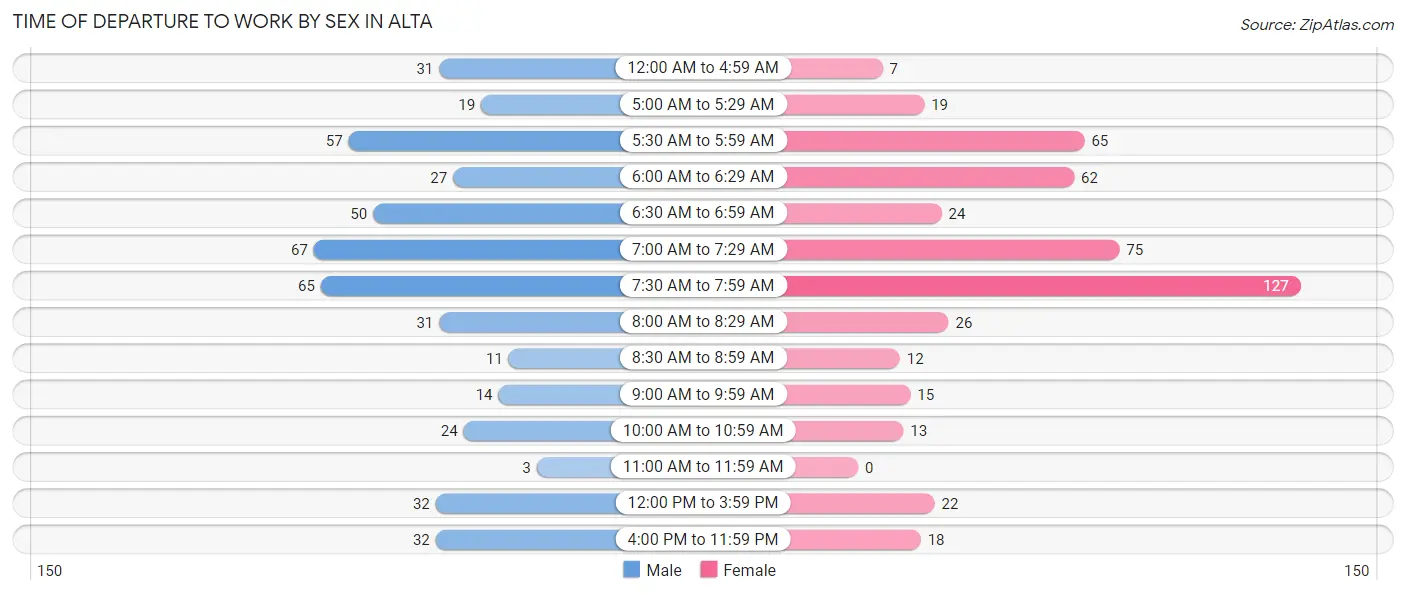
| Time of Departure | Male | Female |
| 12:00 AM to 4:59 AM | 31 (6.7%) | 7 (1.4%) |
| 5:00 AM to 5:29 AM | 19 (4.1%) | 19 (3.9%) |
| 5:30 AM to 5:59 AM | 57 (12.3%) | 65 (13.4%) |
| 6:00 AM to 6:29 AM | 27 (5.8%) | 62 (12.8%) |
| 6:30 AM to 6:59 AM | 50 (10.8%) | 24 (5.0%) |
| 7:00 AM to 7:29 AM | 67 (14.5%) | 75 (15.5%) |
| 7:30 AM to 7:59 AM | 65 (14.0%) | 127 (26.2%) |
| 8:00 AM to 8:29 AM | 31 (6.7%) | 26 (5.4%) |
| 8:30 AM to 8:59 AM | 11 (2.4%) | 12 (2.5%) |
| 9:00 AM to 9:59 AM | 14 (3.0%) | 15 (3.1%) |
| 10:00 AM to 10:59 AM | 24 (5.2%) | 13 (2.7%) |
| 11:00 AM to 11:59 AM | 3 (0.6%) | 0 (0.0%) |
| 12:00 PM to 3:59 PM | 32 (6.9%) | 22 (4.5%) |
| 4:00 PM to 11:59 PM | 32 (6.9%) | 18 (3.7%) |
| Total | 463 (100.0%) | 485 (100.0%) |
Housing Occupancy in Alta
Occupancy by Ownership in Alta
Of the total 723 dwellings in Alta, owner-occupied units account for 599 (82.9%), while renter-occupied units make up 124 (17.2%).
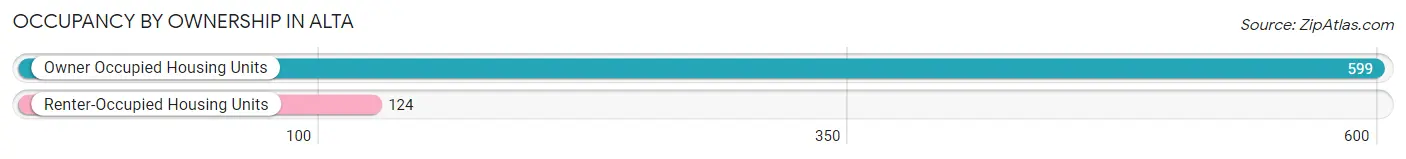
| Occupancy | # Housing Units | % Housing Units |
| Owner Occupied Housing Units | 599 | 82.9% |
| Renter-Occupied Housing Units | 124 | 17.2% |
| Total Occupied Housing Units | 723 | 100.0% |
Occupancy by Household Size in Alta
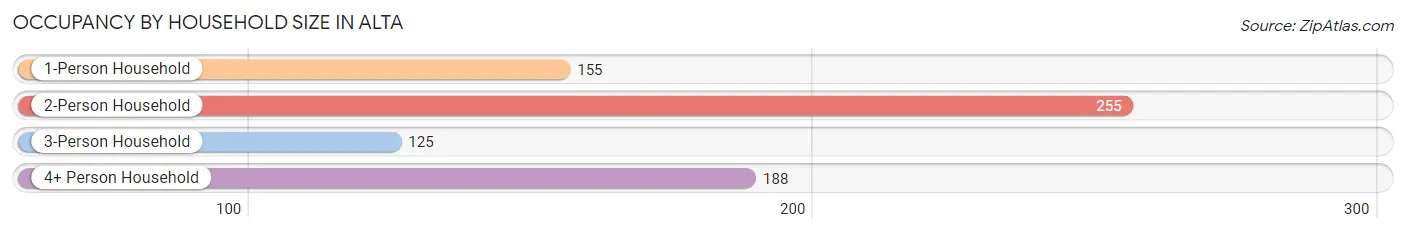
| Household Size | # Housing Units | % Housing Units |
| 1-Person Household | 155 | 21.4% |
| 2-Person Household | 255 | 35.3% |
| 3-Person Household | 125 | 17.3% |
| 4+ Person Household | 188 | 26.0% |
| Total Housing Units | 723 | 100.0% |
Occupancy by Ownership by Household Size in Alta
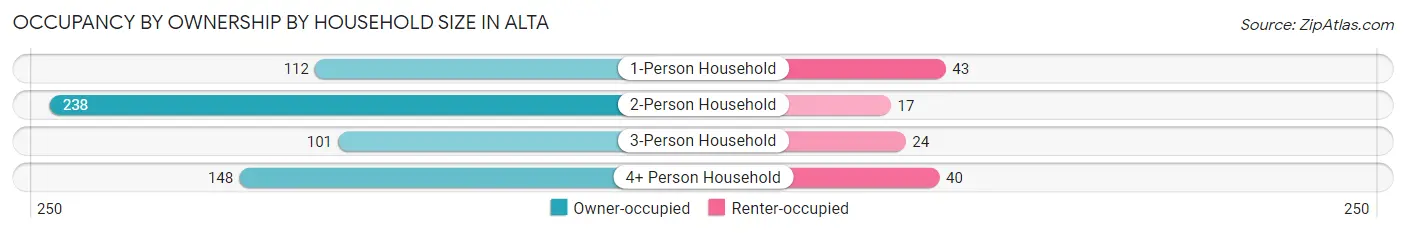
| Household Size | Owner-occupied | Renter-occupied |
| 1-Person Household | 112 (72.3%) | 43 (27.7%) |
| 2-Person Household | 238 (93.3%) | 17 (6.7%) |
| 3-Person Household | 101 (80.8%) | 24 (19.2%) |
| 4+ Person Household | 148 (78.7%) | 40 (21.3%) |
| Total Housing Units | 599 (82.9%) | 124 (17.2%) |
Occupancy by Educational Attainment in Alta
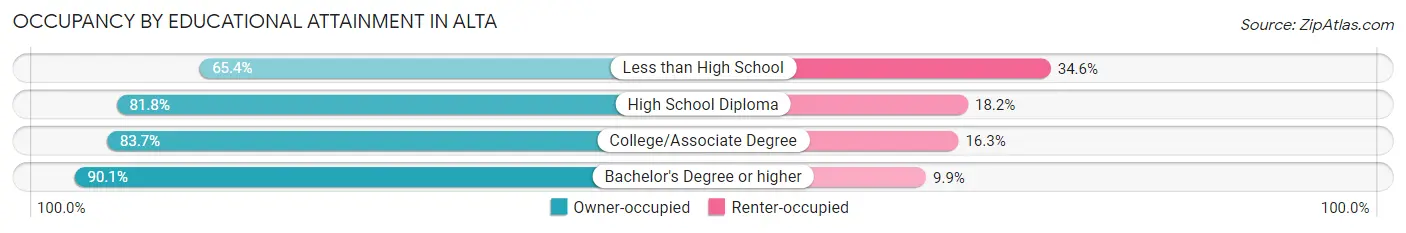
| Household Size | Owner-occupied | Renter-occupied |
| Less than High School | 51 (65.4%) | 27 (34.6%) |
| High School Diploma | 175 (81.8%) | 39 (18.2%) |
| College/Associate Degree | 200 (83.7%) | 39 (16.3%) |
| Bachelor's Degree or higher | 173 (90.1%) | 19 (9.9%) |
Occupancy by Age of Householder in Alta
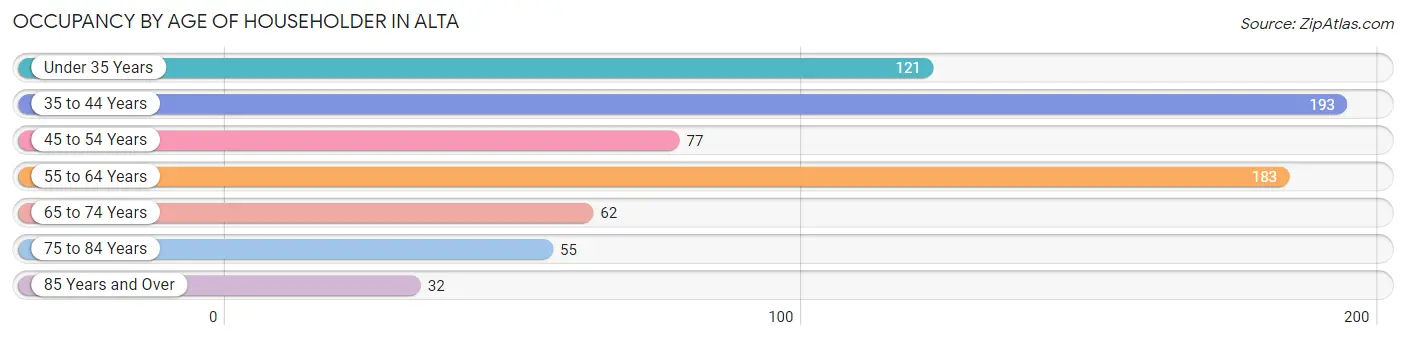
| Age Bracket | # Households | % Households |
| Under 35 Years | 121 | 16.7% |
| 35 to 44 Years | 193 | 26.7% |
| 45 to 54 Years | 77 | 10.6% |
| 55 to 64 Years | 183 | 25.3% |
| 65 to 74 Years | 62 | 8.6% |
| 75 to 84 Years | 55 | 7.6% |
| 85 Years and Over | 32 | 4.4% |
| Total | 723 | 100.0% |
Housing Finances in Alta
Median Income by Occupancy in Alta
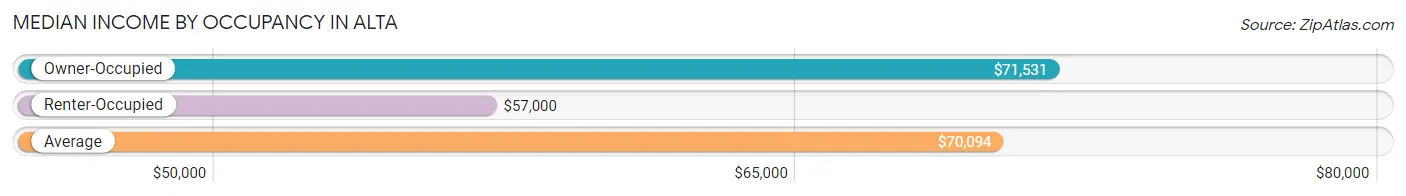
| Occupancy Type | # Households | Median Income |
| Owner-Occupied | 599 (82.9%) | $71,531 |
| Renter-Occupied | 124 (17.2%) | $57,000 |
| Average | 723 (100.0%) | $70,094 |
Occupancy by Householder Income Bracket in Alta
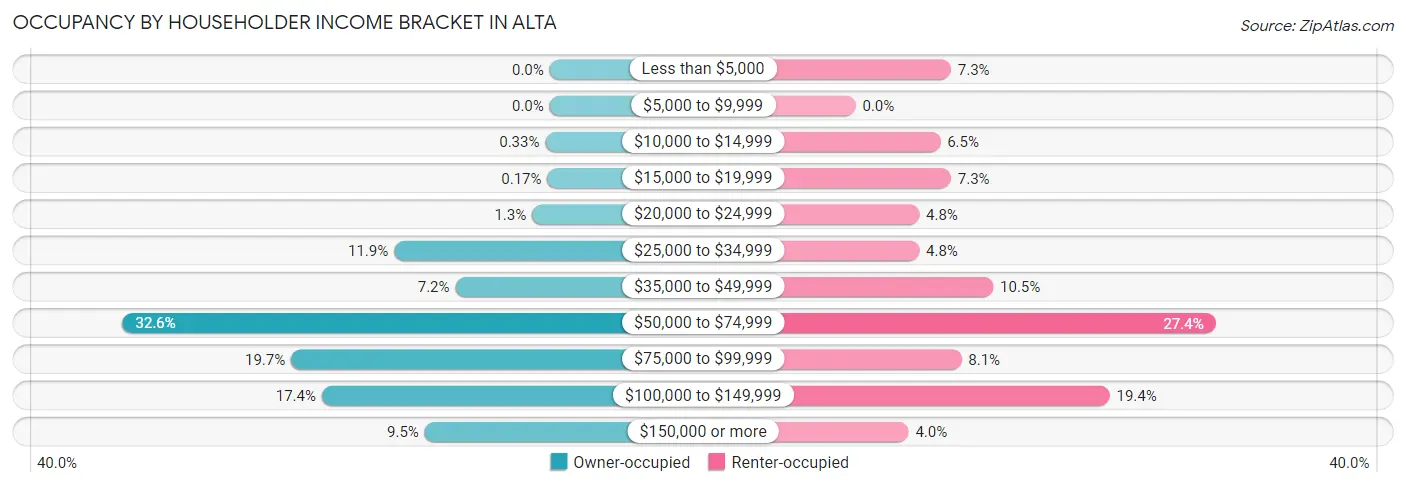
| Income Bracket | Owner-occupied | Renter-occupied |
| Less than $5,000 | 0 (0.0%) | 9 (7.3%) |
| $5,000 to $9,999 | 0 (0.0%) | 0 (0.0%) |
| $10,000 to $14,999 | 2 (0.3%) | 8 (6.5%) |
| $15,000 to $19,999 | 1 (0.2%) | 9 (7.3%) |
| $20,000 to $24,999 | 8 (1.3%) | 6 (4.8%) |
| $25,000 to $34,999 | 71 (11.8%) | 6 (4.8%) |
| $35,000 to $49,999 | 43 (7.2%) | 13 (10.5%) |
| $50,000 to $74,999 | 195 (32.6%) | 34 (27.4%) |
| $75,000 to $99,999 | 118 (19.7%) | 10 (8.1%) |
| $100,000 to $149,999 | 104 (17.4%) | 24 (19.4%) |
| $150,000 or more | 57 (9.5%) | 5 (4.0%) |
| Total | 599 (100.0%) | 124 (100.0%) |
Monthly Housing Cost Tiers in Alta
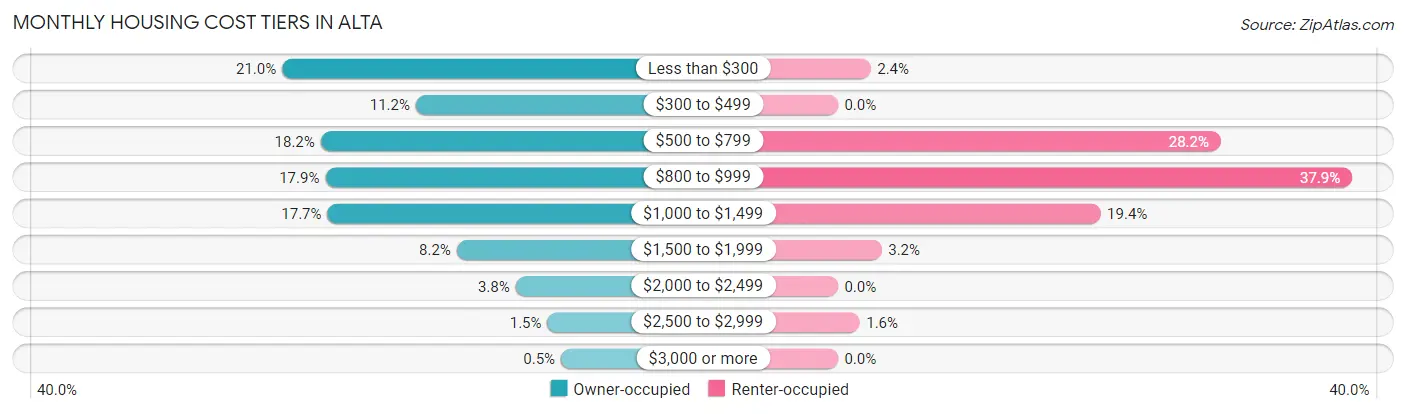
| Monthly Cost | Owner-occupied | Renter-occupied |
| Less than $300 | 126 (21.0%) | 3 (2.4%) |
| $300 to $499 | 67 (11.2%) | 0 (0.0%) |
| $500 to $799 | 109 (18.2%) | 35 (28.2%) |
| $800 to $999 | 107 (17.9%) | 47 (37.9%) |
| $1,000 to $1,499 | 106 (17.7%) | 24 (19.4%) |
| $1,500 to $1,999 | 49 (8.2%) | 4 (3.2%) |
| $2,000 to $2,499 | 23 (3.8%) | 0 (0.0%) |
| $2,500 to $2,999 | 9 (1.5%) | 2 (1.6%) |
| $3,000 or more | 3 (0.5%) | 0 (0.0%) |
| Total | 599 (100.0%) | 124 (100.0%) |
Physical Housing Characteristics in Alta
Housing Structures in Alta
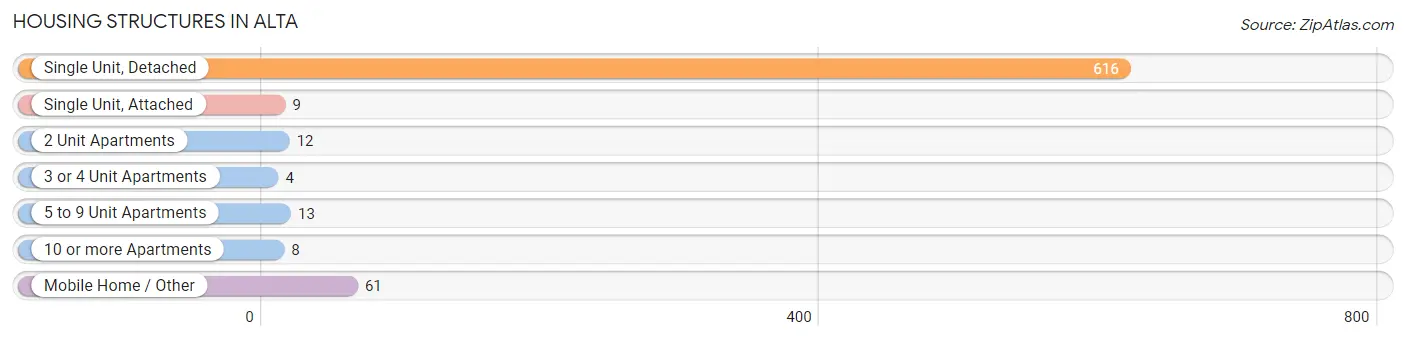
| Structure Type | # Housing Units | % Housing Units |
| Single Unit, Detached | 616 | 85.2% |
| Single Unit, Attached | 9 | 1.2% |
| 2 Unit Apartments | 12 | 1.7% |
| 3 or 4 Unit Apartments | 4 | 0.5% |
| 5 to 9 Unit Apartments | 13 | 1.8% |
| 10 or more Apartments | 8 | 1.1% |
| Mobile Home / Other | 61 | 8.4% |
| Total | 723 | 100.0% |
Housing Structures by Occupancy in Alta
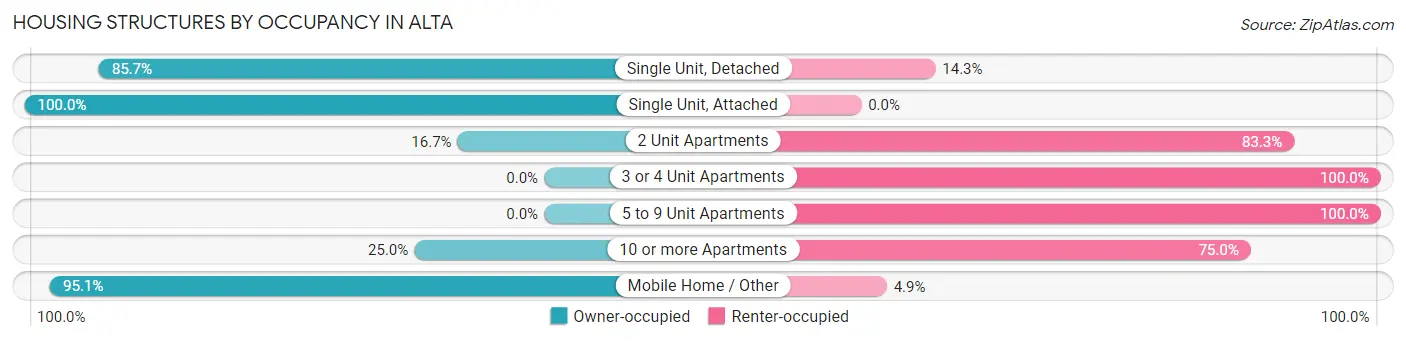
| Structure Type | Owner-occupied | Renter-occupied |
| Single Unit, Detached | 528 (85.7%) | 88 (14.3%) |
| Single Unit, Attached | 9 (100.0%) | 0 (0.0%) |
| 2 Unit Apartments | 2 (16.7%) | 10 (83.3%) |
| 3 or 4 Unit Apartments | 0 (0.0%) | 4 (100.0%) |
| 5 to 9 Unit Apartments | 0 (0.0%) | 13 (100.0%) |
| 10 or more Apartments | 2 (25.0%) | 6 (75.0%) |
| Mobile Home / Other | 58 (95.1%) | 3 (4.9%) |
| Total | 599 (82.9%) | 124 (17.2%) |
Housing Structures by Number of Rooms in Alta
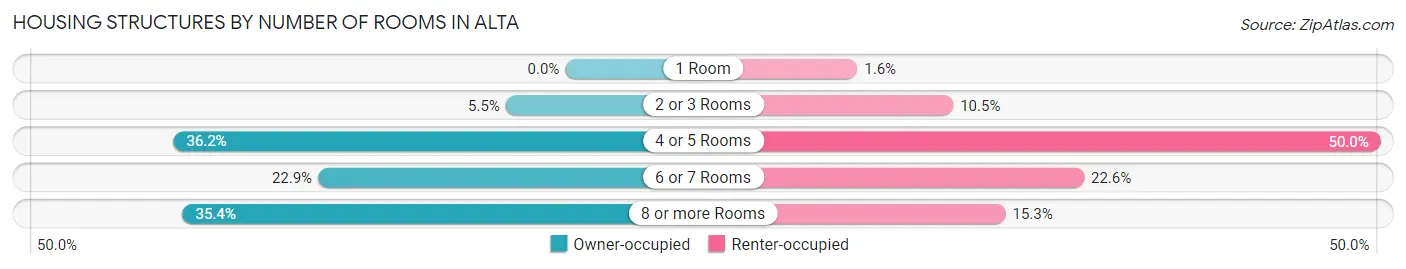
| Number of Rooms | Owner-occupied | Renter-occupied |
| 1 Room | 0 (0.0%) | 2 (1.6%) |
| 2 or 3 Rooms | 33 (5.5%) | 13 (10.5%) |
| 4 or 5 Rooms | 217 (36.2%) | 62 (50.0%) |
| 6 or 7 Rooms | 137 (22.9%) | 28 (22.6%) |
| 8 or more Rooms | 212 (35.4%) | 19 (15.3%) |
| Total | 599 (100.0%) | 124 (100.0%) |
Housing Structure by Heating Type in Alta
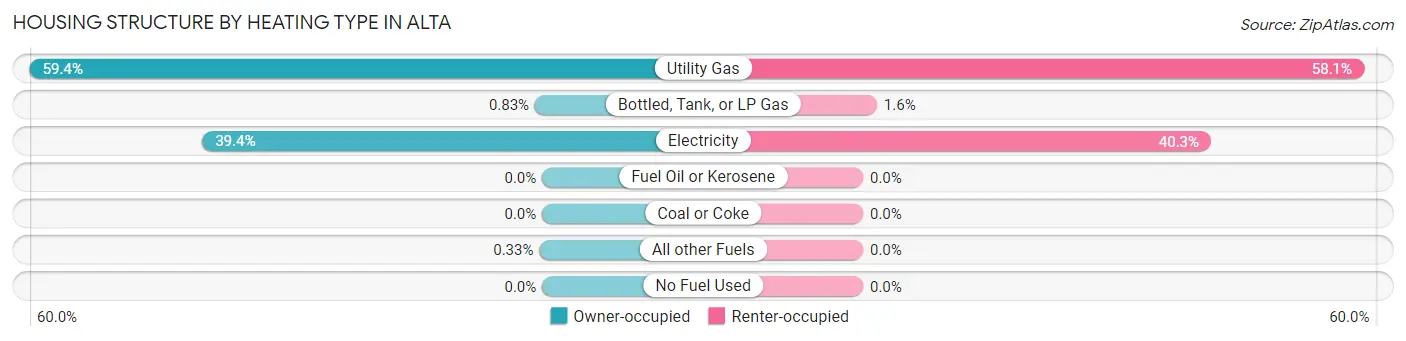
| Heating Type | Owner-occupied | Renter-occupied |
| Utility Gas | 356 (59.4%) | 72 (58.1%) |
| Bottled, Tank, or LP Gas | 5 (0.8%) | 2 (1.6%) |
| Electricity | 236 (39.4%) | 50 (40.3%) |
| Fuel Oil or Kerosene | 0 (0.0%) | 0 (0.0%) |
| Coal or Coke | 0 (0.0%) | 0 (0.0%) |
| All other Fuels | 2 (0.3%) | 0 (0.0%) |
| No Fuel Used | 0 (0.0%) | 0 (0.0%) |
| Total | 599 (100.0%) | 124 (100.0%) |
Household Vehicle Usage in Alta
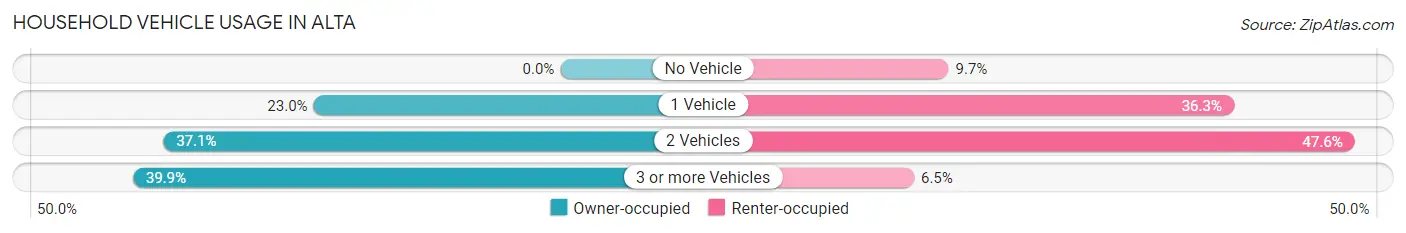
| Vehicles per Household | Owner-occupied | Renter-occupied |
| No Vehicle | 0 (0.0%) | 12 (9.7%) |
| 1 Vehicle | 138 (23.0%) | 45 (36.3%) |
| 2 Vehicles | 222 (37.1%) | 59 (47.6%) |
| 3 or more Vehicles | 239 (39.9%) | 8 (6.5%) |
| Total | 599 (100.0%) | 124 (100.0%) |
Real Estate & Mortgages in Alta
Real Estate and Mortgage Overview in Alta
| Characteristic | Without Mortgage | With Mortgage |
| Housing Units | 292 | 307 |
| Median Property Value | - | - |
| Median Household Income | $56,984 | $42 |
| Monthly Housing Costs | $405 | $3 |
| Real Estate Taxes | $914 | $0 |
Property Value by Mortgage Status in Alta
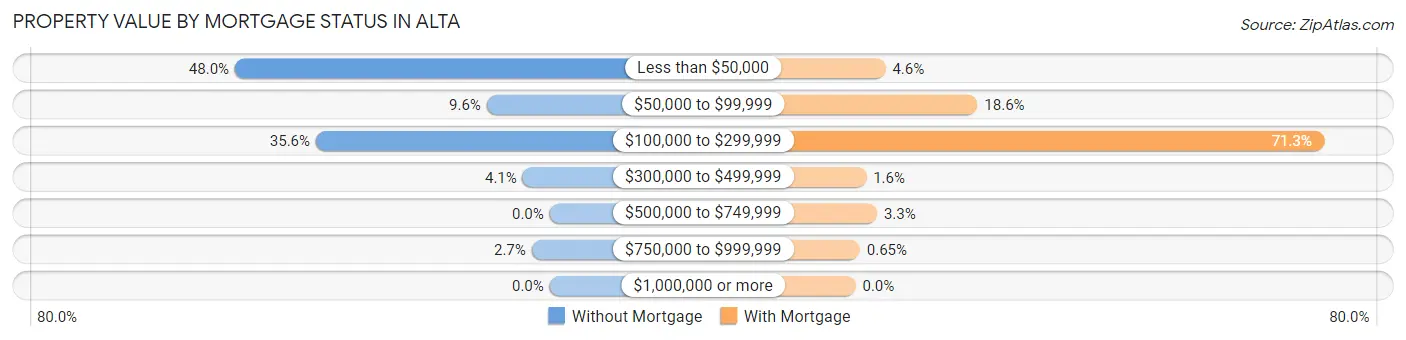
| Property Value | Without Mortgage | With Mortgage |
| Less than $50,000 | 140 (47.9%) | 14 (4.6%) |
| $50,000 to $99,999 | 28 (9.6%) | 57 (18.6%) |
| $100,000 to $299,999 | 104 (35.6%) | 219 (71.3%) |
| $300,000 to $499,999 | 12 (4.1%) | 5 (1.6%) |
| $500,000 to $749,999 | 0 (0.0%) | 10 (3.3%) |
| $750,000 to $999,999 | 8 (2.7%) | 2 (0.6%) |
| $1,000,000 or more | 0 (0.0%) | 0 (0.0%) |
| Total | 292 (100.0%) | 307 (100.0%) |
Household Income by Mortgage Status in Alta
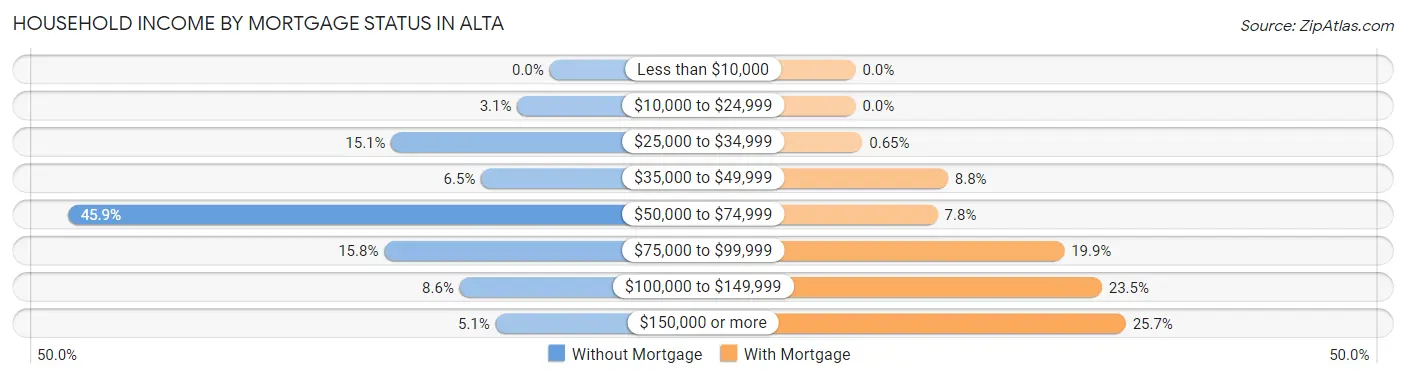
| Household Income | Without Mortgage | With Mortgage |
| Less than $10,000 | 0 (0.0%) | 0 (0.0%) |
| $10,000 to $24,999 | 9 (3.1%) | 0 (0.0%) |
| $25,000 to $34,999 | 44 (15.1%) | 2 (0.6%) |
| $35,000 to $49,999 | 19 (6.5%) | 27 (8.8%) |
| $50,000 to $74,999 | 134 (45.9%) | 24 (7.8%) |
| $75,000 to $99,999 | 46 (15.8%) | 61 (19.9%) |
| $100,000 to $149,999 | 25 (8.6%) | 72 (23.4%) |
| $150,000 or more | 15 (5.1%) | 79 (25.7%) |
| Total | 292 (100.0%) | 307 (100.0%) |
Property Value to Household Income Ratio in Alta
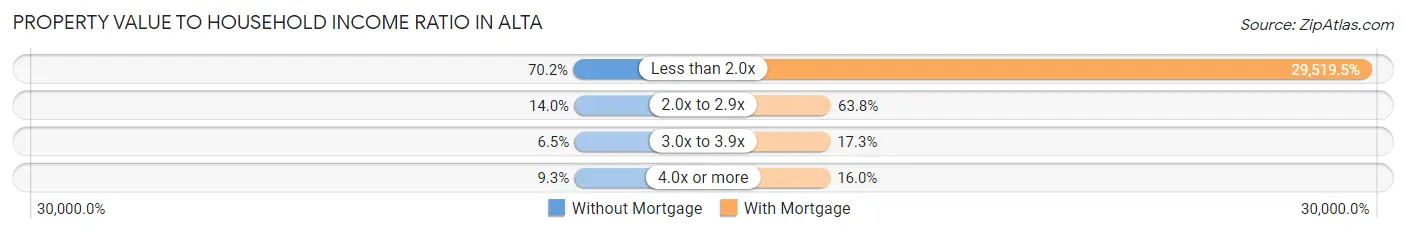
| Value-to-Income Ratio | Without Mortgage | With Mortgage |
| Less than 2.0x | 205 (70.2%) | 90,625 (29,519.5%) |
| 2.0x to 2.9x | 41 (14.0%) | 196 (63.8%) |
| 3.0x to 3.9x | 19 (6.5%) | 53 (17.3%) |
| 4.0x or more | 27 (9.2%) | 49 (16.0%) |
| Total | 292 (100.0%) | 307 (100.0%) |
Real Estate Taxes by Mortgage Status in Alta
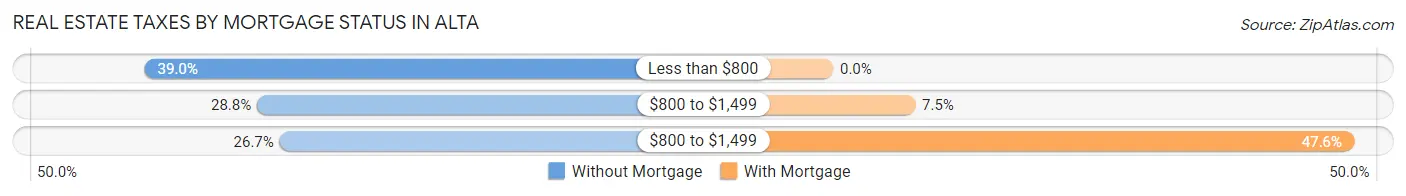
| Property Taxes | Without Mortgage | With Mortgage |
| Less than $800 | 114 (39.0%) | 0 (0.0%) |
| $800 to $1,499 | 84 (28.8%) | 23 (7.5%) |
| $800 to $1,499 | 78 (26.7%) | 146 (47.6%) |
| Total | 292 (100.0%) | 307 (100.0%) |
Health & Disability in Alta
Health Insurance Coverage by Age in Alta
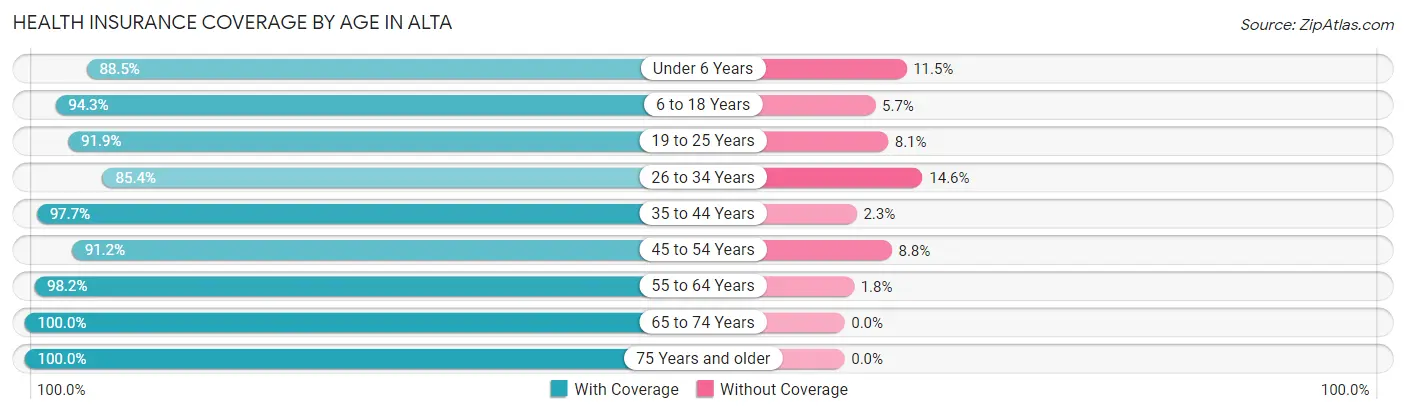
| Age Bracket | With Coverage | Without Coverage |
| Under 6 Years | 161 (88.5%) | 21 (11.5%) |
| 6 to 18 Years | 493 (94.3%) | 30 (5.7%) |
| 19 to 25 Years | 102 (91.9%) | 9 (8.1%) |
| 26 to 34 Years | 176 (85.4%) | 30 (14.6%) |
| 35 to 44 Years | 302 (97.7%) | 7 (2.3%) |
| 45 to 54 Years | 300 (91.2%) | 29 (8.8%) |
| 55 to 64 Years | 279 (98.2%) | 5 (1.8%) |
| 65 to 74 Years | 119 (100.0%) | 0 (0.0%) |
| 75 Years and older | 135 (100.0%) | 0 (0.0%) |
| Total | 2,067 (94.0%) | 131 (6.0%) |
Health Insurance Coverage by Citizenship Status in Alta
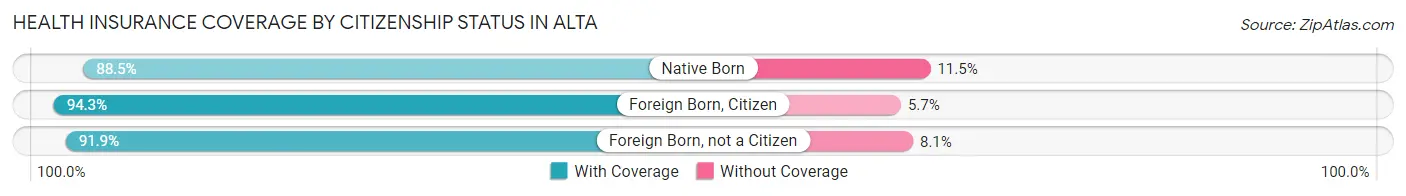
| Citizenship Status | With Coverage | Without Coverage |
| Native Born | 161 (88.5%) | 21 (11.5%) |
| Foreign Born, Citizen | 493 (94.3%) | 30 (5.7%) |
| Foreign Born, not a Citizen | 102 (91.9%) | 9 (8.1%) |
Health Insurance Coverage by Household Income in Alta
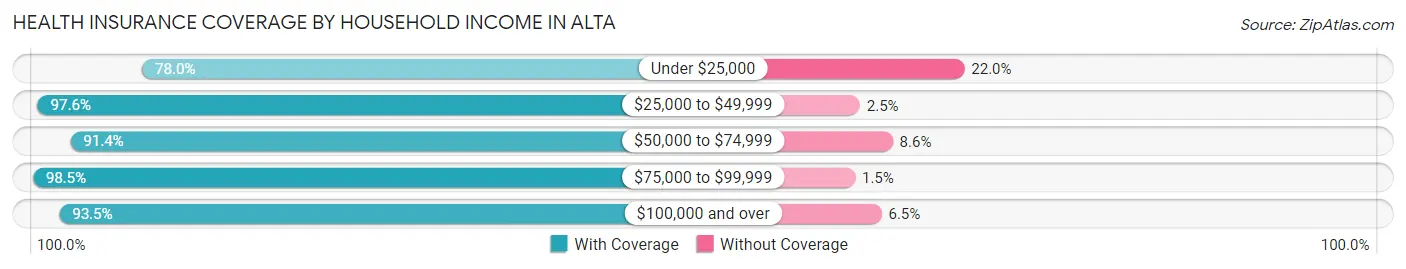
| Household Income | With Coverage | Without Coverage |
| Under $25,000 | 46 (78.0%) | 13 (22.0%) |
| $25,000 to $49,999 | 318 (97.6%) | 8 (2.5%) |
| $50,000 to $74,999 | 660 (91.4%) | 62 (8.6%) |
| $75,000 to $99,999 | 449 (98.5%) | 7 (1.5%) |
| $100,000 and over | 589 (93.5%) | 41 (6.5%) |
Public vs Private Health Insurance Coverage by Age in Alta
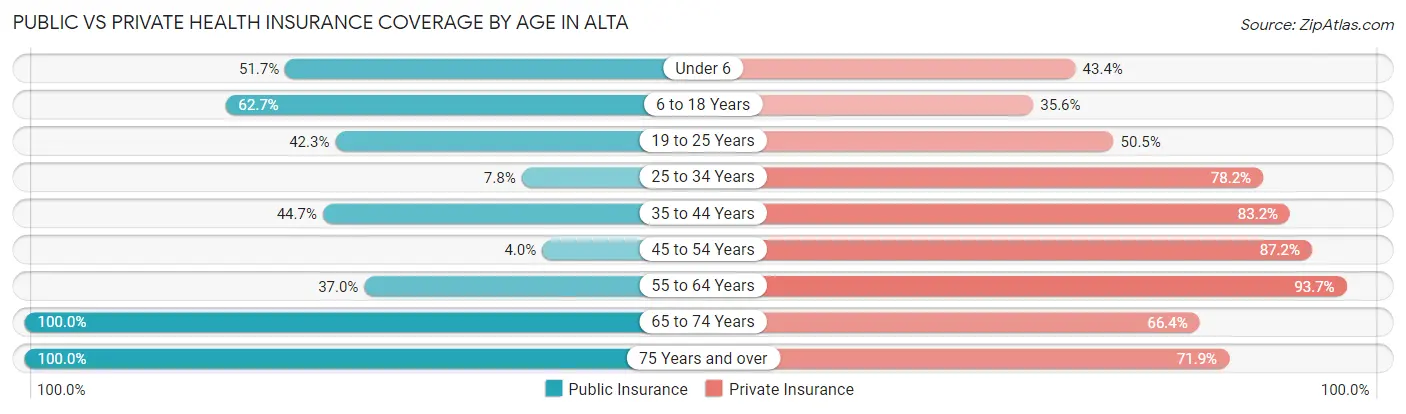
| Age Bracket | Public Insurance | Private Insurance |
| Under 6 | 94 (51.6%) | 79 (43.4%) |
| 6 to 18 Years | 328 (62.7%) | 186 (35.6%) |
| 19 to 25 Years | 47 (42.3%) | 56 (50.4%) |
| 25 to 34 Years | 16 (7.8%) | 161 (78.2%) |
| 35 to 44 Years | 138 (44.7%) | 257 (83.2%) |
| 45 to 54 Years | 13 (4.0%) | 287 (87.2%) |
| 55 to 64 Years | 105 (37.0%) | 266 (93.7%) |
| 65 to 74 Years | 119 (100.0%) | 79 (66.4%) |
| 75 Years and over | 135 (100.0%) | 97 (71.9%) |
| Total | 995 (45.3%) | 1,468 (66.8%) |
Disability Status by Sex by Age in Alta
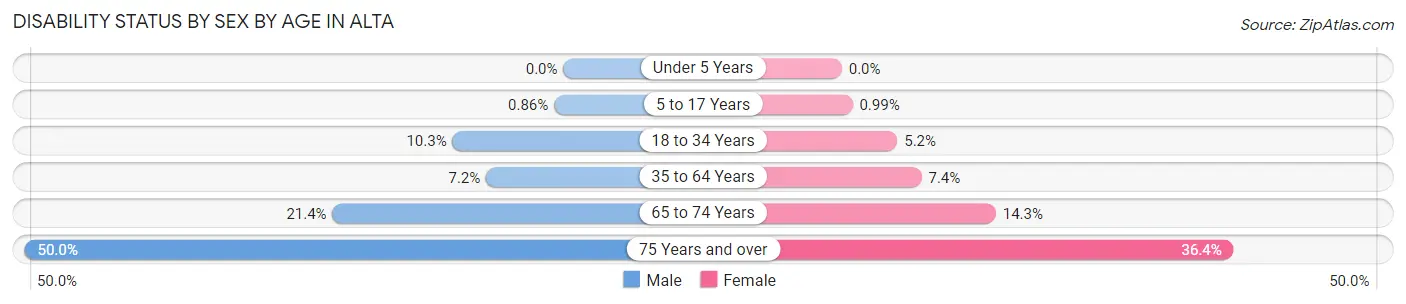
| Age Bracket | Male | Female |
| Under 5 Years | 0 (0.0%) | 0 (0.0%) |
| 5 to 17 Years | 2 (0.9%) | 3 (1.0%) |
| 18 to 34 Years | 14 (10.3%) | 10 (5.1%) |
| 35 to 64 Years | 38 (7.2%) | 29 (7.4%) |
| 65 to 74 Years | 12 (21.4%) | 9 (14.3%) |
| 75 Years and over | 29 (50.0%) | 28 (36.4%) |
Disability Class by Sex by Age in Alta
Disability Class: Hearing Difficulty
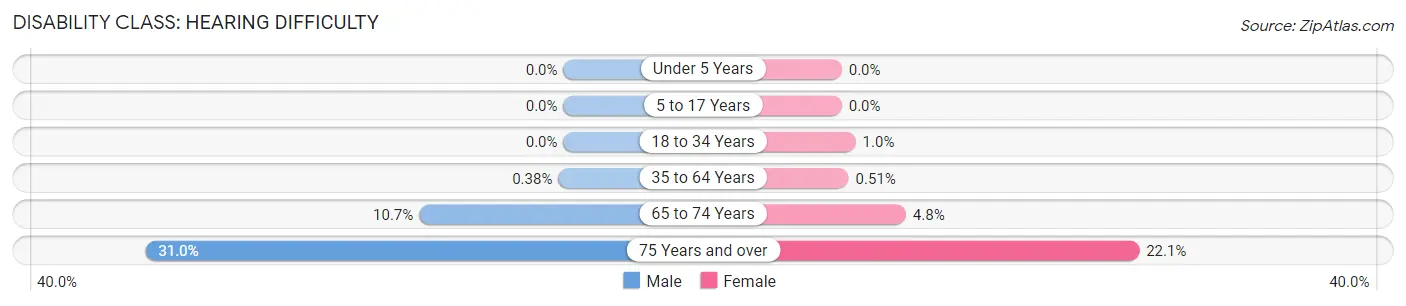
| Age Bracket | Male | Female |
| Under 5 Years | 0 (0.0%) | 0 (0.0%) |
| 5 to 17 Years | 0 (0.0%) | 0 (0.0%) |
| 18 to 34 Years | 0 (0.0%) | 2 (1.0%) |
| 35 to 64 Years | 2 (0.4%) | 2 (0.5%) |
| 65 to 74 Years | 6 (10.7%) | 3 (4.8%) |
| 75 Years and over | 18 (31.0%) | 17 (22.1%) |
Disability Class: Vision Difficulty
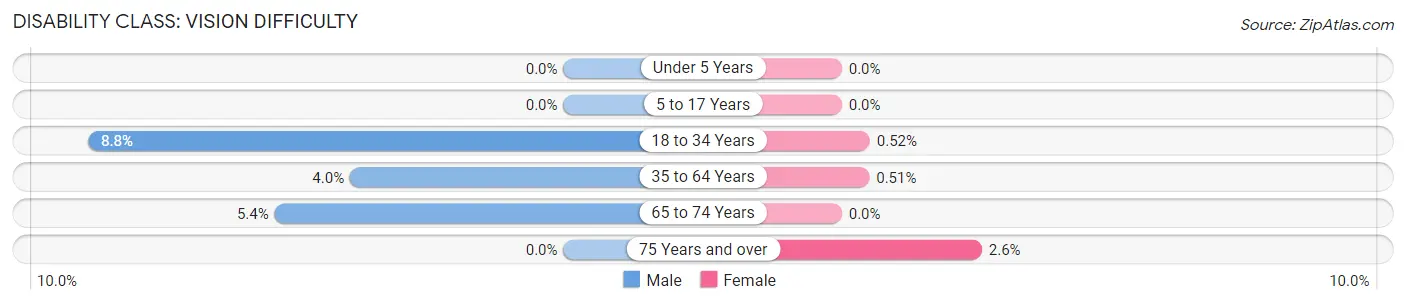
| Age Bracket | Male | Female |
| Under 5 Years | 0 (0.0%) | 0 (0.0%) |
| 5 to 17 Years | 0 (0.0%) | 0 (0.0%) |
| 18 to 34 Years | 12 (8.8%) | 1 (0.5%) |
| 35 to 64 Years | 21 (4.0%) | 2 (0.5%) |
| 65 to 74 Years | 3 (5.4%) | 0 (0.0%) |
| 75 Years and over | 0 (0.0%) | 2 (2.6%) |
Disability Class: Cognitive Difficulty
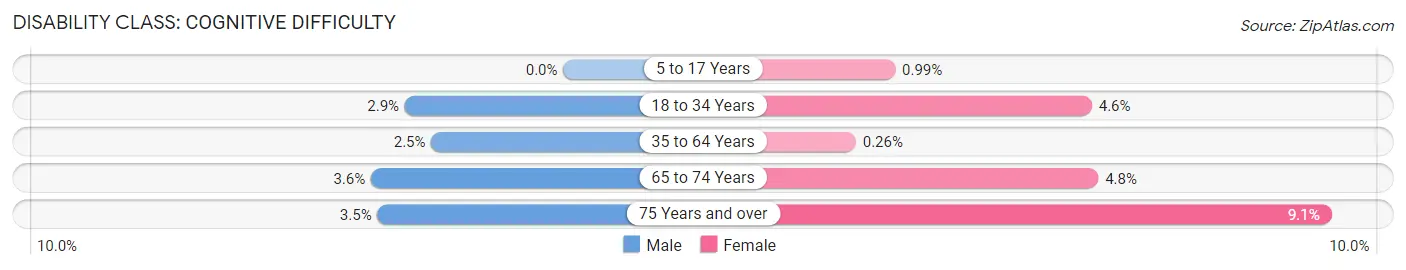
| Age Bracket | Male | Female |
| 5 to 17 Years | 0 (0.0%) | 3 (1.0%) |
| 18 to 34 Years | 4 (2.9%) | 9 (4.6%) |
| 35 to 64 Years | 13 (2.5%) | 1 (0.3%) |
| 65 to 74 Years | 2 (3.6%) | 3 (4.8%) |
| 75 Years and over | 2 (3.5%) | 7 (9.1%) |
Disability Class: Ambulatory Difficulty
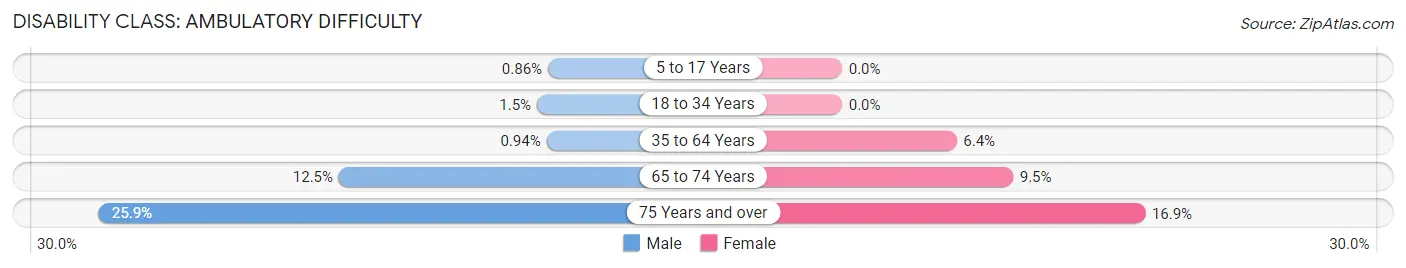
| Age Bracket | Male | Female |
| 5 to 17 Years | 2 (0.9%) | 0 (0.0%) |
| 18 to 34 Years | 2 (1.5%) | 0 (0.0%) |
| 35 to 64 Years | 5 (0.9%) | 25 (6.4%) |
| 65 to 74 Years | 7 (12.5%) | 6 (9.5%) |
| 75 Years and over | 15 (25.9%) | 13 (16.9%) |
Disability Class: Self-Care Difficulty
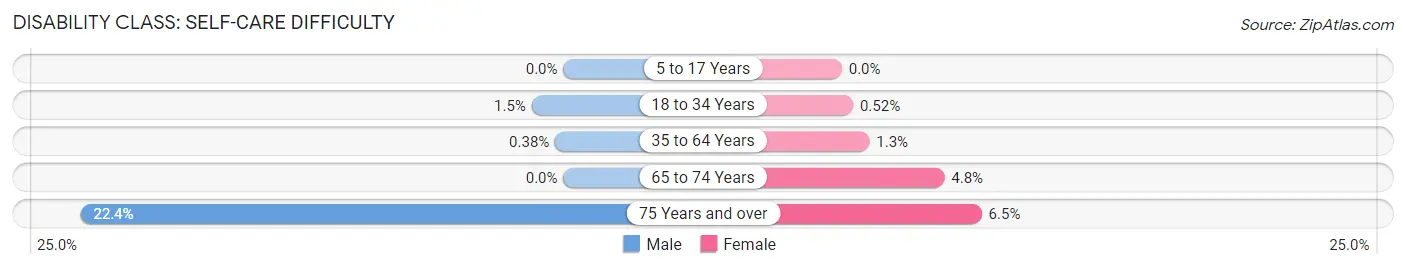
| Age Bracket | Male | Female |
| 5 to 17 Years | 0 (0.0%) | 0 (0.0%) |
| 18 to 34 Years | 2 (1.5%) | 1 (0.5%) |
| 35 to 64 Years | 2 (0.4%) | 5 (1.3%) |
| 65 to 74 Years | 0 (0.0%) | 3 (4.8%) |
| 75 Years and over | 13 (22.4%) | 5 (6.5%) |
Technology Access in Alta
Computing Device Access in Alta
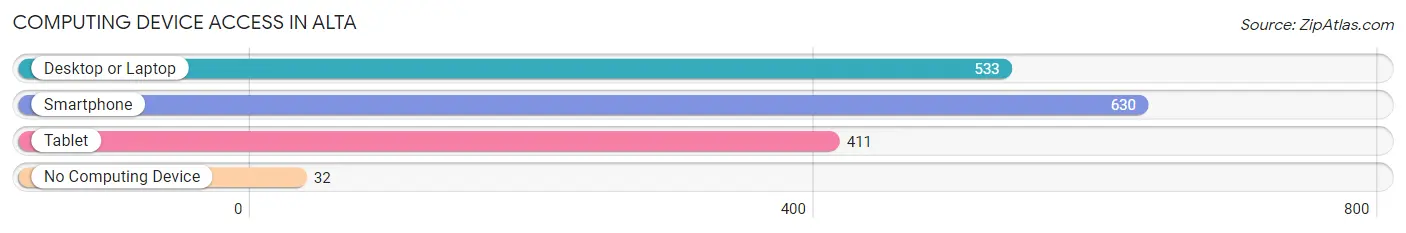
| Device Type | # Households | % Households |
| Desktop or Laptop | 533 | 73.7% |
| Smartphone | 630 | 87.1% |
| Tablet | 411 | 56.9% |
| No Computing Device | 32 | 4.4% |
| Total | 723 | 100.0% |
Internet Access in Alta
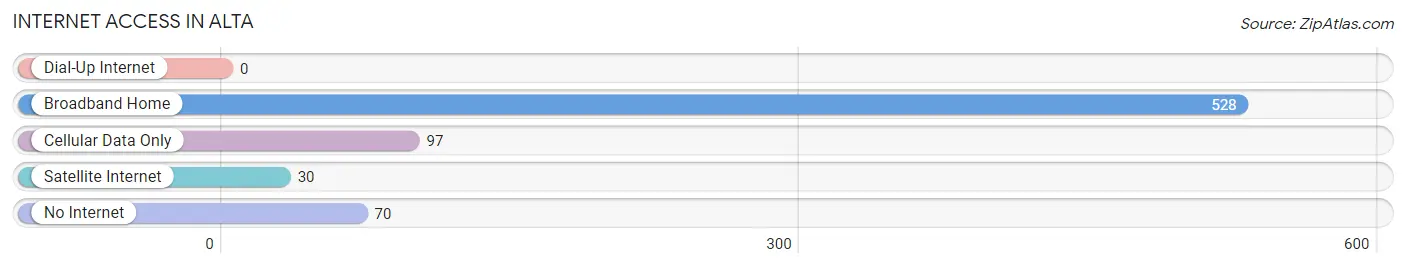
| Internet Type | # Households | % Households |
| Dial-Up Internet | 0 | 0.0% |
| Broadband Home | 528 | 73.0% |
| Cellular Data Only | 97 | 13.4% |
| Satellite Internet | 30 | 4.2% |
| No Internet | 70 | 9.7% |
| Total | 723 | 100.0% |
Alta Summary
Alta, Iowa is a small city located in Buena Vista County in the northwest corner of the state. It is situated on the Little Sioux River, and is part of the Storm Lake Metropolitan Statistical Area. The city has a population of 1,845 as of the 2010 census, and is the county seat of Buena Vista County.
Geography
Alta is located at 42°30'25" North, 95°14'45" West (42.506944, -95.245833). According to the United States Census Bureau, the city has a total area of 1.2 square miles (3.1 km2), all of it land.
The city is located in the rolling hills of the Loess Hills region of Iowa. The Little Sioux River flows through the city, and is a popular spot for fishing and canoeing. The city is also home to a number of parks, including the Alta City Park, which features a playground, picnic area, and a walking trail.
Economy
Alta’s economy is largely based on agriculture and manufacturing. The city is home to a number of agricultural businesses, including a feed mill, a grain elevator, and a dairy. The city is also home to a number of manufacturing businesses, including a plastics factory, a metal fabrication plant, and a machine shop.
The city is also home to a number of retail businesses, including a grocery store, a hardware store, and a variety of specialty shops. The city is also home to a number of restaurants, including a pizza parlor, a Mexican restaurant, and a steakhouse.
Demographics
As of the 2010 census, Alta had a population of 1,845. The racial makeup of the city was 95.2% White, 0.7% African American, 0.3% Native American, 0.3% Asian, 0.1% Pacific Islander, 1.7% from other races, and 1.7% from two or more races. Hispanic or Latino of any race were 3.3% of the population.
The median income for a household in the city was $41,250, and the median income for a family was $50,000. The per capita income for the city was $19,845. About 8.3% of families and 10.2% of the population were below the poverty line, including 14.2% of those under age 18 and 8.3% of those age 65 or over.
Education
Alta is served by the Alta-Aurelia Community School District, which consists of two elementary schools, one middle school, and one high school. The district also operates a preschool and a daycare center. The city is also home to a number of private schools, including a Catholic school and a Lutheran school.
Conclusion
Alta, Iowa is a small city located in Buena Vista County in the northwest corner of the state. It is situated on the Little Sioux River, and is part of the Storm Lake Metropolitan Statistical Area. The city has a population of 1,845 as of the 2010 census, and is the county seat of Buena Vista County. The city’s economy is largely based on agriculture and manufacturing, and the city is home to a number of retail businesses, restaurants, and private schools. Alta is served by the Alta-Aurelia Community School District, which consists of two elementary schools, one middle school, and one high school.
Common Questions
What is Per Capita Income in Alta?
Per Capita income in Alta is $29,608.
What is the Median Family Income in Alta?
Median Family Income in Alta is $77,688.
What is the Median Household income in Alta?
Median Household Income in Alta is $70,094.
What is Income or Wage Gap in Alta?
Income or Wage Gap in Alta is 19.1%.
Women in Alta earn 80.9 cents for every dollar earned by a man.
What is Family Income Deficit in Alta?
Family Income Deficit in Alta is $5,213.
Families that are below poverty line in Alta earn $5,213 less on average than the poverty threshold level.
What is Inequality or Gini Index in Alta?
Inequality or Gini Index in Alta is 0.33.
What is the Total Population of Alta?
Total Population of Alta is 2,207.
What is the Total Male Population of Alta?
Total Male Population of Alta is 1,116.
What is the Total Female Population of Alta?
Total Female Population of Alta is 1,091.
What is the Ratio of Males per 100 Females in Alta?
There are 102.29 Males per 100 Females in Alta.
What is the Ratio of Females per 100 Males in Alta?
There are 97.76 Females per 100 Males in Alta.
What is the Median Population Age in Alta?
Median Population Age in Alta is 36.7 Years.
What is the Average Family Size in Alta
Average Family Size in Alta is 3.5 People.
What is the Average Household Size in Alta
Average Household Size in Alta is 3.0 People.
How Large is the Labor Force in Alta?
There are 1,190 People in the Labor Forcein in Alta.
What is the Percentage of People in the Labor Force in Alta?
74.5% of People are in the Labor Force in Alta.
What is the Unemployment Rate in Alta?
Unemployment Rate in Alta is 15.4%.