Algona, IA Map & Demographics
Algona Map
Algona Overview
$32,410
PER CAPITA INCOME
$68,833
AVG FAMILY INCOME
$52,903
AVG HOUSEHOLD INCOME
40.0%
WAGE / INCOME GAP [ % ]
60.0¢/ $1
WAGE / INCOME GAP [ $ ]
0.37
INEQUALITY / GINI INDEX
5,443
TOTAL POPULATION
2,552
MALE POPULATION
2,891
FEMALE POPULATION
88.27
MALES / 100 FEMALES
113.28
FEMALES / 100 MALES
43.6
MEDIAN AGE
2.9
AVG FAMILY SIZE
2.1
AVG HOUSEHOLD SIZE
2,680
LABOR FORCE [ PEOPLE ]
59.3%
PERCENT IN LABOR FORCE
5.5%
UNEMPLOYMENT RATE
Algona Zip Codes
Algona Area Codes
Income in Algona
Income Overview in Algona
Per Capita Income in Algona is $32,410, while median incomes of families and households are $68,833 and $52,903 respectively.
| Characteristic | Number | Measure |
| Per Capita Income | 5,443 | $32,410 |
| Median Family Income | 1,212 | $68,833 |
| Mean Family Income | 1,212 | $80,973 |
| Median Household Income | 2,535 | $52,903 |
| Mean Household Income | 2,535 | $65,411 |
| Income Deficit | 1,212 | $0 |
| Wage / Income Gap (%) | 5,443 | 40.03% |
| Wage / Income Gap ($) | 5,443 | 59.97¢ per $1 |
| Gini / Inequality Index | 5,443 | 0.37 |
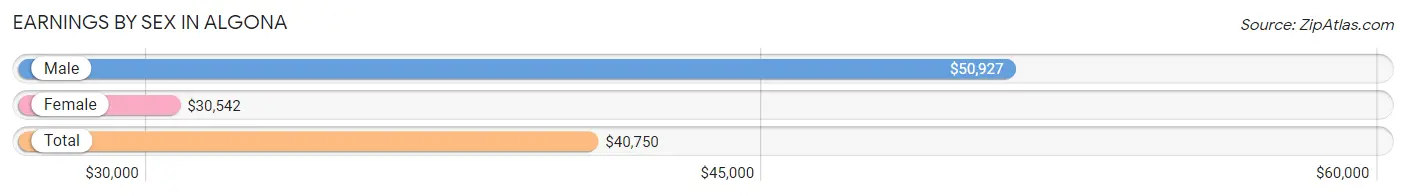
Earnings by Sex in Algona
Average Earnings in Algona are $40,750, $50,927 for men and $30,542 for women, a difference of 40.0%.
| Sex | Number | Average Earnings |
| Male | 1,435 (50.6%) | $50,927 |
| Female | 1,403 (49.4%) | $30,542 |
| Total | 2,838 (100.0%) | $40,750 |
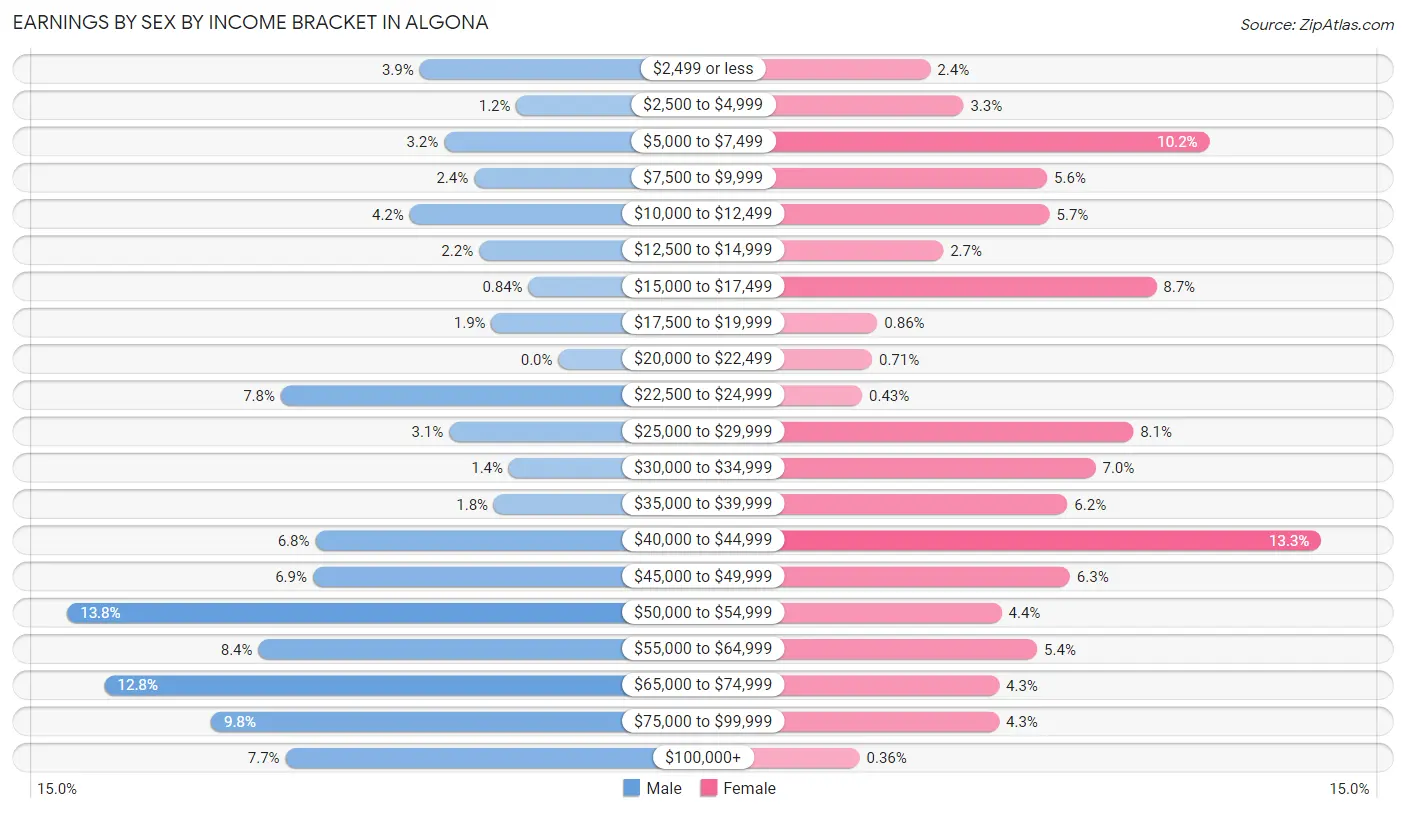
Earnings by Sex by Income Bracket in Algona
The most common earnings brackets in Algona are $50,000 to $54,999 for men (198 | 13.8%) and $40,000 to $44,999 for women (187 | 13.3%).
| Income | Male | Female |
| $2,499 or less | 56 (3.9%) | 33 (2.4%) |
| $2,500 to $4,999 | 17 (1.2%) | 46 (3.3%) |
| $5,000 to $7,499 | 46 (3.2%) | 143 (10.2%) |
| $7,500 to $9,999 | 34 (2.4%) | 79 (5.6%) |
| $10,000 to $12,499 | 60 (4.2%) | 80 (5.7%) |
| $12,500 to $14,999 | 32 (2.2%) | 38 (2.7%) |
| $15,000 to $17,499 | 12 (0.8%) | 122 (8.7%) |
| $17,500 to $19,999 | 27 (1.9%) | 12 (0.9%) |
| $20,000 to $22,499 | 0 (0.0%) | 10 (0.7%) |
| $22,500 to $24,999 | 112 (7.8%) | 6 (0.4%) |
| $25,000 to $29,999 | 44 (3.1%) | 113 (8.1%) |
| $30,000 to $34,999 | 20 (1.4%) | 98 (7.0%) |
| $35,000 to $39,999 | 26 (1.8%) | 87 (6.2%) |
| $40,000 to $44,999 | 98 (6.8%) | 187 (13.3%) |
| $45,000 to $49,999 | 99 (6.9%) | 88 (6.3%) |
| $50,000 to $54,999 | 198 (13.8%) | 61 (4.3%) |
| $55,000 to $64,999 | 121 (8.4%) | 75 (5.3%) |
| $65,000 to $74,999 | 183 (12.8%) | 60 (4.3%) |
| $75,000 to $99,999 | 140 (9.8%) | 60 (4.3%) |
| $100,000+ | 110 (7.7%) | 5 (0.4%) |
| Total | 1,435 (100.0%) | 1,403 (100.0%) |
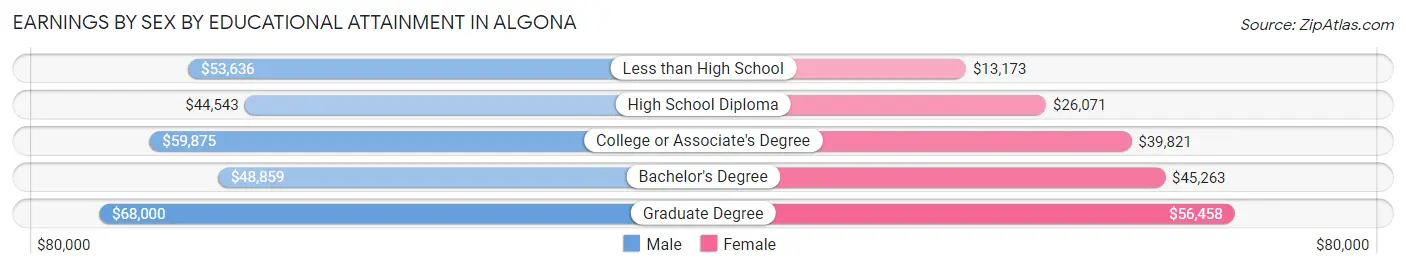
Earnings by Sex by Educational Attainment in Algona
Average earnings in Algona are $51,956 for men and $32,461 for women, a difference of 37.5%. Men with an educational attainment of graduate degree enjoy the highest average annual earnings of $68,000, while those with high school diploma education earn the least with $44,543. Women with an educational attainment of graduate degree earn the most with the average annual earnings of $56,458, while those with less than high school education have the smallest earnings of $13,173.
| Educational Attainment | Male Income | Female Income |
| Less than High School | $53,636 | $13,173 |
| High School Diploma | $44,543 | $26,071 |
| College or Associate's Degree | $59,875 | $39,821 |
| Bachelor's Degree | $48,859 | $45,263 |
| Graduate Degree | $68,000 | $56,458 |
| Total | $51,956 | $32,461 |
Family Income in Algona
Family Income Brackets in Algona
According to the Algona family income data, there are 298 families falling into the $100,000 to $149,999 income range, which is the most common income bracket and makes up 24.6% of all families.
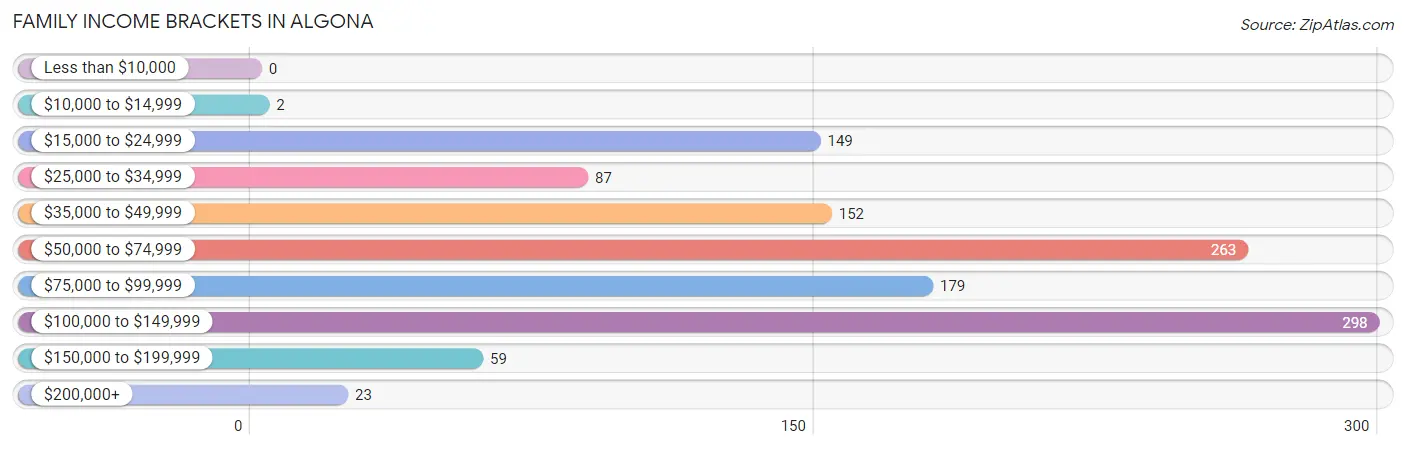
| Income Bracket | # Families | % Families |
| Less than $10,000 | 0 | 0.0% |
| $10,000 to $14,999 | 2 | 0.2% |
| $15,000 to $24,999 | 149 | 12.3% |
| $25,000 to $34,999 | 87 | 7.2% |
| $35,000 to $49,999 | 152 | 12.5% |
| $50,000 to $74,999 | 263 | 21.7% |
| $75,000 to $99,999 | 179 | 14.8% |
| $100,000 to $149,999 | 298 | 24.6% |
| $150,000 to $199,999 | 59 | 4.9% |
| $200,000+ | 23 | 1.9% |
Family Income by Famaliy Size in Algona
3-person families (153 | 12.6%) account for the highest median family income in Algona with $125,163 per family, while 3-person families (153 | 12.6%) have the highest median income of $41,721 per family member.
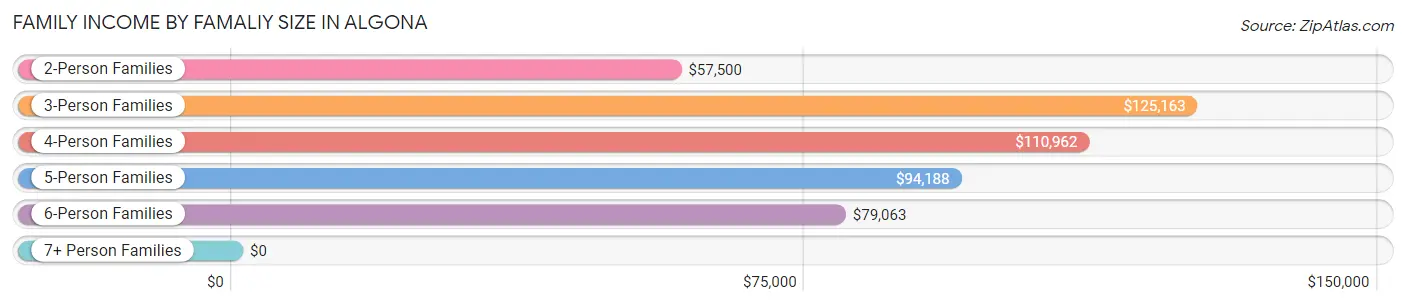
| Income Bracket | # Families | Median Income |
| 2-Person Families | 730 (60.2%) | $57,500 |
| 3-Person Families | 153 (12.6%) | $125,163 |
| 4-Person Families | 160 (13.2%) | $110,962 |
| 5-Person Families | 125 (10.3%) | $94,188 |
| 6-Person Families | 44 (3.6%) | $79,063 |
| 7+ Person Families | 0 (0.0%) | $0 |
| Total | 1,212 (100.0%) | $68,833 |
Family Income by Number of Earners in Algona
The median family income in Algona is $68,833, with families comprising 3+ earners (151) having the highest median family income of $114,750, while families with 1 earner (409) have the lowest median family income of $40,670, accounting for 12.5% and 33.8% of families, respectively.
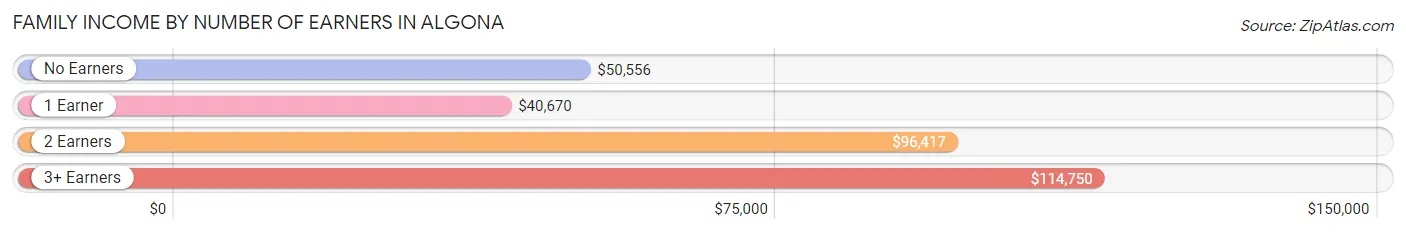
| Number of Earners | # Families | Median Income |
| No Earners | 244 (20.1%) | $50,556 |
| 1 Earner | 409 (33.8%) | $40,670 |
| 2 Earners | 408 (33.7%) | $96,417 |
| 3+ Earners | 151 (12.5%) | $114,750 |
| Total | 1,212 (100.0%) | $68,833 |
Household Income in Algona
Household Income Brackets in Algona
With 588 households falling in the category, the $50,000 to $74,999 income range is the most frequent in Algona, accounting for 23.2% of all households. In contrast, only 23 households (0.9%) fall into the $200,000+ income bracket, making it the least populous group.
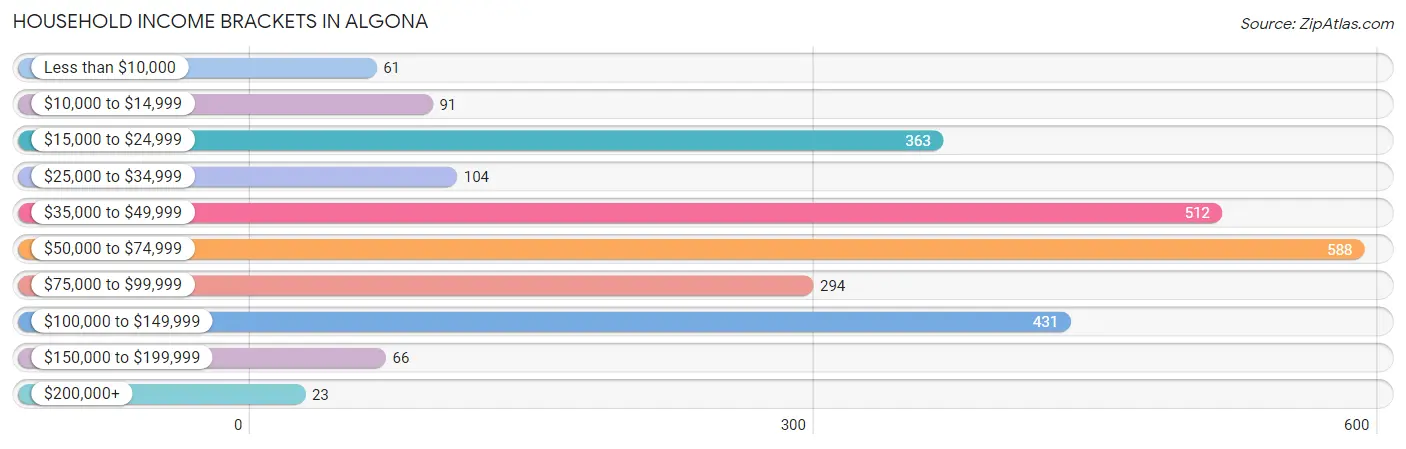
| Income Bracket | # Households | % Households |
| Less than $10,000 | 61 | 2.4% |
| $10,000 to $14,999 | 91 | 3.6% |
| $15,000 to $24,999 | 363 | 14.3% |
| $25,000 to $34,999 | 104 | 4.1% |
| $35,000 to $49,999 | 512 | 20.2% |
| $50,000 to $74,999 | 588 | 23.2% |
| $75,000 to $99,999 | 294 | 11.6% |
| $100,000 to $149,999 | 431 | 17.0% |
| $150,000 to $199,999 | 66 | 2.6% |
| $200,000+ | 23 | 0.9% |
Household Income by Householder Age in Algona
The median household income in Algona is $52,903, with the highest median household income of $69,077 found in the 45 to 64 years age bracket for the primary householder. A total of 812 households (32.0%) fall into this category. Meanwhile, the 65+ years age bracket for the primary householder has the lowest median household income of $39,814, with 903 households (35.6%) in this group.
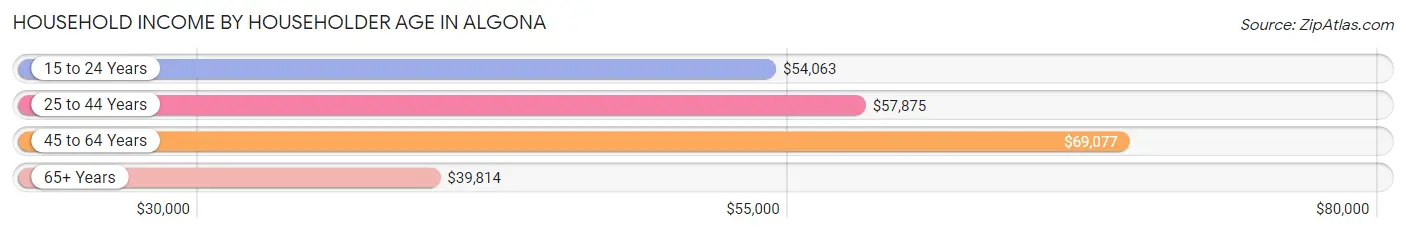
| Income Bracket | # Households | Median Income |
| 15 to 24 Years | 147 (5.8%) | $54,063 |
| 25 to 44 Years | 673 (26.6%) | $57,875 |
| 45 to 64 Years | 812 (32.0%) | $69,077 |
| 65+ Years | 903 (35.6%) | $39,814 |
| Total | 2,535 (100.0%) | $52,903 |
Poverty in Algona
Income Below Poverty by Sex and Age in Algona
With 8.1% poverty level for males and 12.3% for females among the residents of Algona, under 5 year old males and 12 to 14 year old females are the most vulnerable to poverty, with 67 males (37.4%) and 30 females (42.2%) in their respective age groups living below the poverty level.
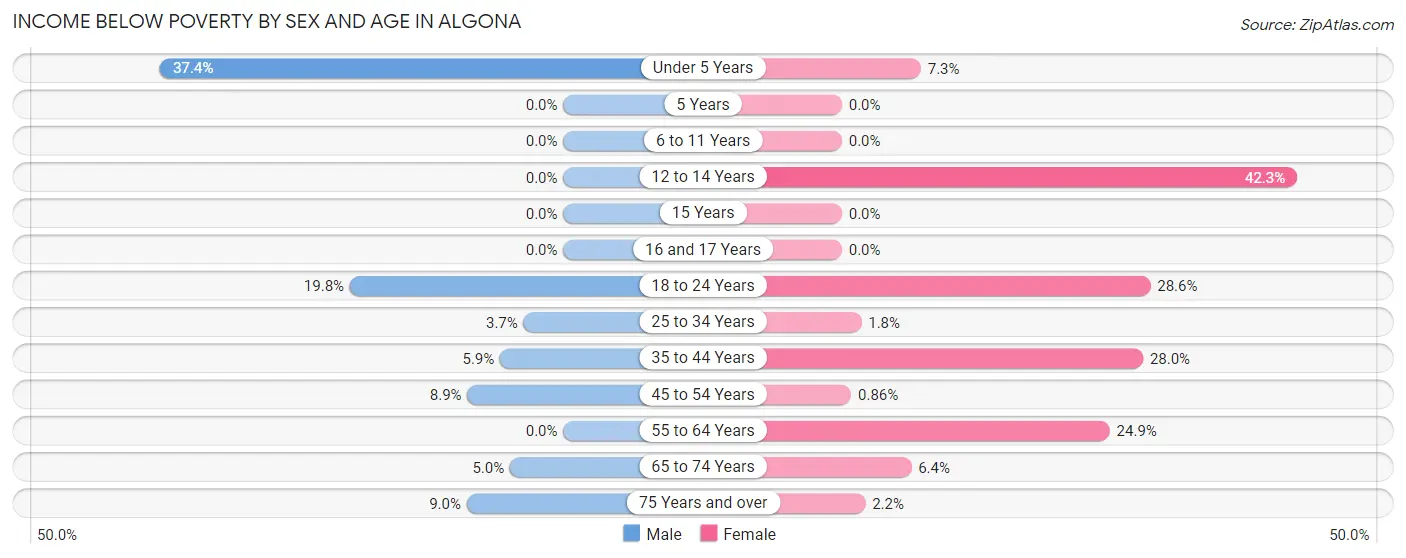
| Age Bracket | Male | Female |
| Under 5 Years | 67 (37.4%) | 11 (7.3%) |
| 5 Years | 0 (0.0%) | 0 (0.0%) |
| 6 to 11 Years | 0 (0.0%) | 0 (0.0%) |
| 12 to 14 Years | 0 (0.0%) | 30 (42.2%) |
| 15 Years | 0 (0.0%) | 0 (0.0%) |
| 16 and 17 Years | 0 (0.0%) | 0 (0.0%) |
| 18 to 24 Years | 41 (19.8%) | 75 (28.6%) |
| 25 to 34 Years | 9 (3.7%) | 5 (1.8%) |
| 35 to 44 Years | 22 (5.9%) | 97 (28.0%) |
| 45 to 54 Years | 29 (8.9%) | 2 (0.9%) |
| 55 to 64 Years | 0 (0.0%) | 88 (24.9%) |
| 65 to 74 Years | 9 (5.0%) | 23 (6.4%) |
| 75 Years and over | 24 (9.0%) | 10 (2.2%) |
| Total | 201 (8.1%) | 341 (12.3%) |
Income Above Poverty by Sex and Age in Algona
According to the poverty statistics in Algona, males aged 6 to 11 years and females aged 5 years are the age groups that are most secure financially, with 100.0% of males and 100.0% of females in these age groups living above the poverty line.
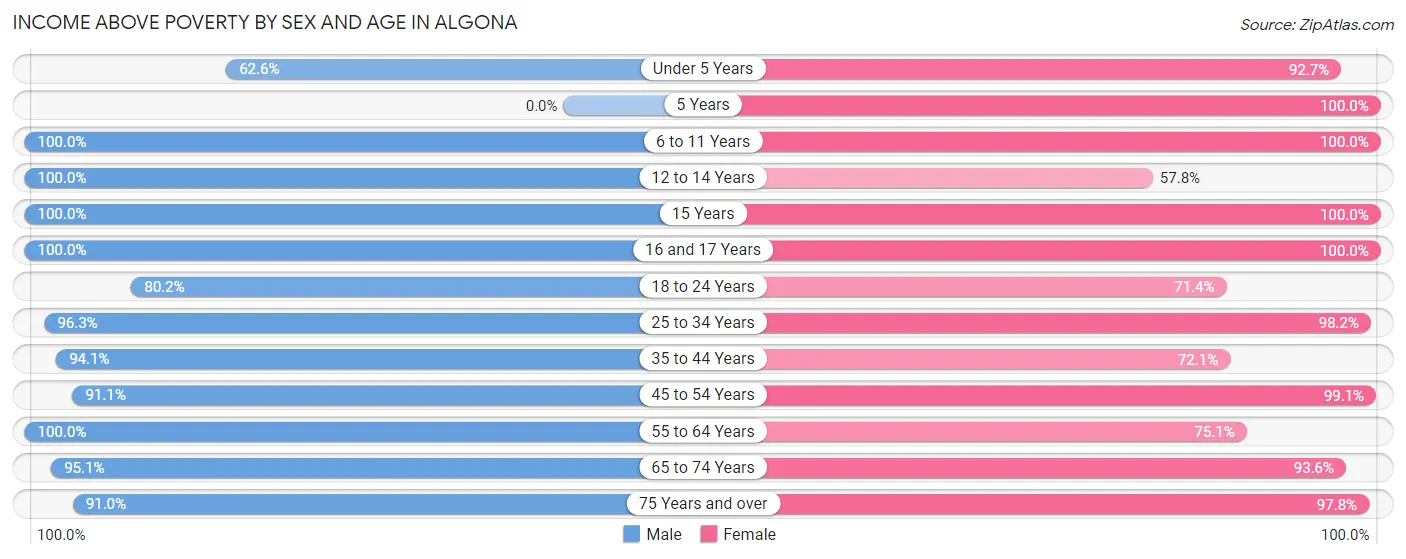
| Age Bracket | Male | Female |
| Under 5 Years | 112 (62.6%) | 139 (92.7%) |
| 5 Years | 0 (0.0%) | 35 (100.0%) |
| 6 to 11 Years | 177 (100.0%) | 166 (100.0%) |
| 12 to 14 Years | 78 (100.0%) | 41 (57.8%) |
| 15 Years | 49 (100.0%) | 18 (100.0%) |
| 16 and 17 Years | 73 (100.0%) | 39 (100.0%) |
| 18 to 24 Years | 166 (80.2%) | 187 (71.4%) |
| 25 to 34 Years | 235 (96.3%) | 271 (98.2%) |
| 35 to 44 Years | 353 (94.1%) | 250 (72.1%) |
| 45 to 54 Years | 297 (91.1%) | 231 (99.1%) |
| 55 to 64 Years | 322 (100.0%) | 266 (75.1%) |
| 65 to 74 Years | 173 (95.1%) | 334 (93.6%) |
| 75 Years and over | 244 (91.0%) | 451 (97.8%) |
| Total | 2,279 (91.9%) | 2,428 (87.7%) |
Income Below Poverty Among Married-Couple Families in Algona
The poverty statistics for married-couple families in Algona show that 0.2% or 2 of the total 935 families live below the poverty line. Families with no children have the highest poverty rate of 0.3%, comprising of 2 families. On the other hand, families with 1 or 2 children have the lowest poverty rate of 0.0%, which includes 0 families.
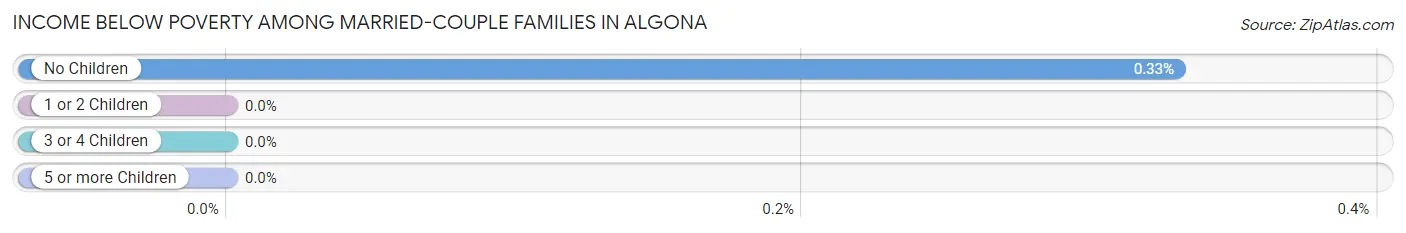
| Children | Above Poverty | Below Poverty |
| No Children | 610 (99.7%) | 2 (0.3%) |
| 1 or 2 Children | 222 (100.0%) | 0 (0.0%) |
| 3 or 4 Children | 101 (100.0%) | 0 (0.0%) |
| 5 or more Children | 0 (0.0%) | 0 (0.0%) |
| Total | 933 (99.8%) | 2 (0.2%) |
Income Below Poverty Among Single-Parent Households in Algona
According to the poverty data in Algona, 24.1% or 27 single-father households and 38.8% or 64 single-mother households are living below the poverty line. Among single-father households, those with 1 or 2 children have the highest poverty rate, with 27 households (26.5%) experiencing poverty. Likewise, among single-mother households, those with 1 or 2 children have the highest poverty rate, with 64 households (62.1%) falling below the poverty line.
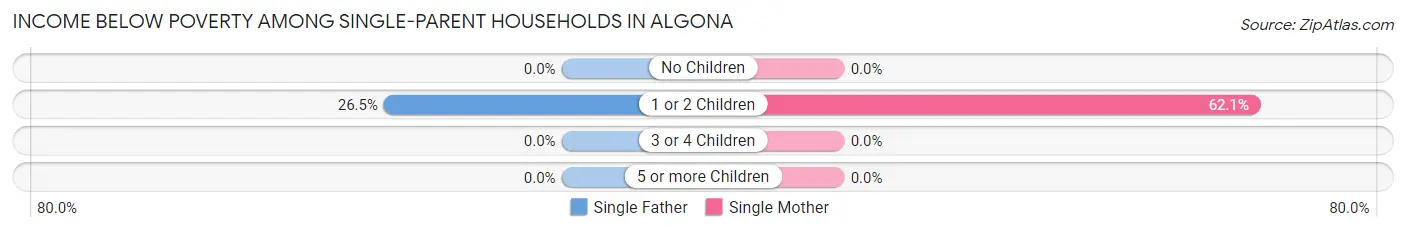
| Children | Single Father | Single Mother |
| No Children | 0 (0.0%) | 0 (0.0%) |
| 1 or 2 Children | 27 (26.5%) | 64 (62.1%) |
| 3 or 4 Children | 0 (0.0%) | 0 (0.0%) |
| 5 or more Children | 0 (0.0%) | 0 (0.0%) |
| Total | 27 (24.1%) | 64 (38.8%) |
Income Below Poverty Among Married-Couple vs Single-Parent Households in Algona
The poverty data for Algona shows that 2 of the married-couple family households (0.2%) and 91 of the single-parent households (32.9%) are living below the poverty level. Within the married-couple family households, those with no children have the highest poverty rate, with 2 households (0.3%) falling below the poverty line. Among the single-parent households, those with 1 or 2 children have the highest poverty rate, with 91 household (44.4%) living below poverty.
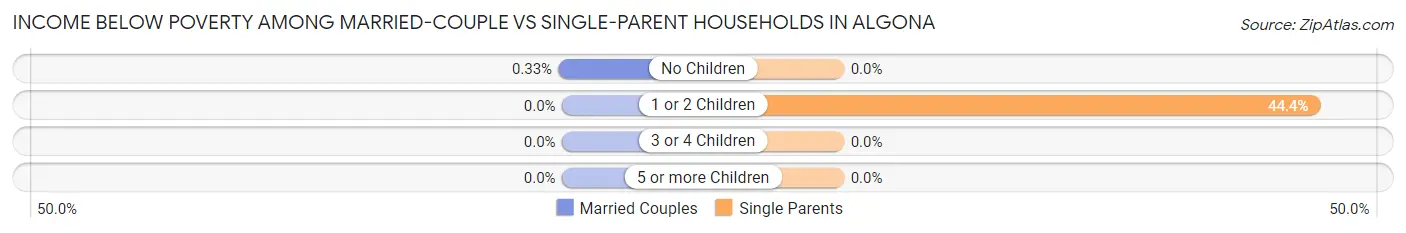
| Children | Married-Couple Families | Single-Parent Households |
| No Children | 2 (0.3%) | 0 (0.0%) |
| 1 or 2 Children | 0 (0.0%) | 91 (44.4%) |
| 3 or 4 Children | 0 (0.0%) | 0 (0.0%) |
| 5 or more Children | 0 (0.0%) | 0 (0.0%) |
| Total | 2 (0.2%) | 91 (32.9%) |
Race in Algona
The most populous races in Algona are White / Caucasian (4,921 | 90.4%), Hispanic or Latino (420 | 7.7%), and Some other Race (230 | 4.2%).
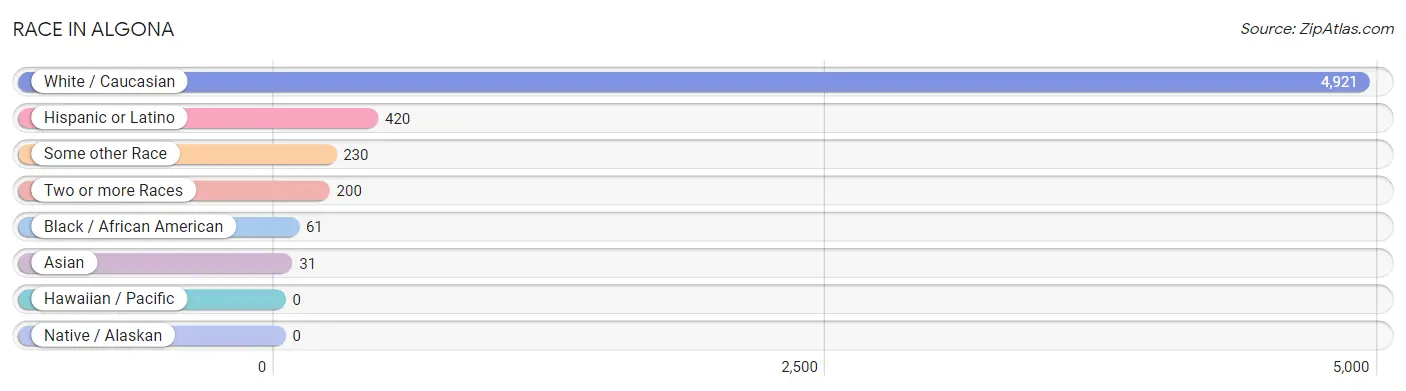
| Race | # Population | % Population |
| Asian | 31 | 0.6% |
| Black / African American | 61 | 1.1% |
| Hawaiian / Pacific | 0 | 0.0% |
| Hispanic or Latino | 420 | 7.7% |
| Native / Alaskan | 0 | 0.0% |
| White / Caucasian | 4,921 | 90.4% |
| Two or more Races | 200 | 3.7% |
| Some other Race | 230 | 4.2% |
| Total | 5,443 | 100.0% |
Ancestry in Algona
The most populous ancestries reported in Algona are German (2,356 | 43.3%), Irish (566 | 10.4%), Norwegian (463 | 8.5%), English (329 | 6.0%), and American (236 | 4.3%), together accounting for 72.6% of all Algona residents.
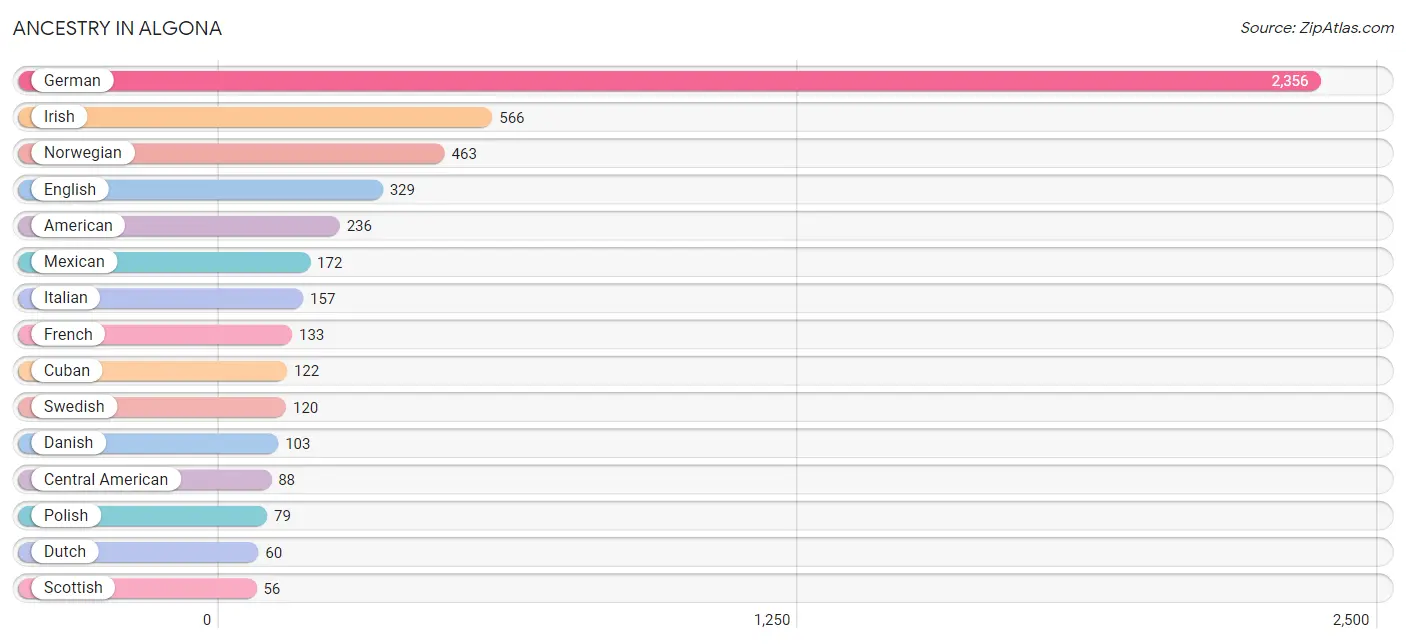
| Ancestry | # Population | % Population |
| American | 236 | 4.3% |
| Austrian | 8 | 0.2% |
| British | 11 | 0.2% |
| Burmese | 21 | 0.4% |
| Central American | 88 | 1.6% |
| Cherokee | 8 | 0.2% |
| Colombian | 1 | 0.0% |
| Cuban | 122 | 2.2% |
| Danish | 103 | 1.9% |
| Dutch | 60 | 1.1% |
| Ecuadorian | 37 | 0.7% |
| English | 329 | 6.0% |
| French | 133 | 2.4% |
| German | 2,356 | 43.3% |
| Guatemalan | 41 | 0.7% |
| Irish | 566 | 10.4% |
| Italian | 157 | 2.9% |
| Luxembourger | 41 | 0.7% |
| Malaysian | 20 | 0.4% |
| Mexican | 172 | 3.2% |
| Northern European | 8 | 0.2% |
| Norwegian | 463 | 8.5% |
| Pakistani | 20 | 0.4% |
| Panamanian | 39 | 0.7% |
| Polish | 79 | 1.5% |
| Salvadoran | 8 | 0.2% |
| Scandinavian | 17 | 0.3% |
| Scotch-Irish | 16 | 0.3% |
| Scottish | 56 | 1.0% |
| South American | 38 | 0.7% |
| Swedish | 120 | 2.2% |
| Swiss | 11 | 0.2% |
| Welsh | 38 | 0.7% | View All 33 Rows |
Immigrants in Algona
The most numerous immigrant groups reported in Algona came from Latin America (299 | 5.5%), Central America (209 | 3.8%), Mexico (146 | 2.7%), Caribbean (89 | 1.6%), and Cuba (89 | 1.6%), together accounting for 15.3% of all Algona residents.
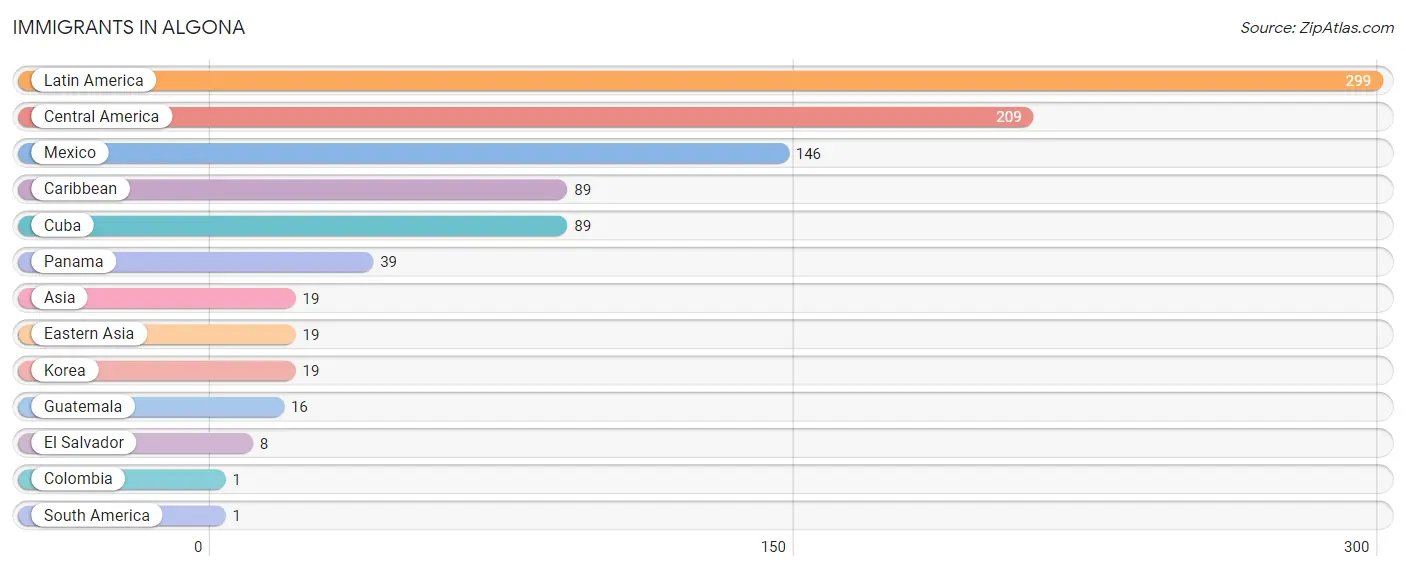
| Immigration Origin | # Population | % Population |
| Asia | 19 | 0.4% |
| Caribbean | 89 | 1.6% |
| Central America | 209 | 3.8% |
| Colombia | 1 | 0.0% |
| Cuba | 89 | 1.6% |
| Eastern Asia | 19 | 0.4% |
| El Salvador | 8 | 0.2% |
| Guatemala | 16 | 0.3% |
| Korea | 19 | 0.4% |
| Latin America | 299 | 5.5% |
| Mexico | 146 | 2.7% |
| Panama | 39 | 0.7% |
| South America | 1 | 0.0% | View All 13 Rows |
Sex and Age in Algona
Sex and Age in Algona
The most populous age groups in Algona are 35 to 39 Years (226 | 8.9%) for men and 85 Years and over (340 | 11.8%) for women.
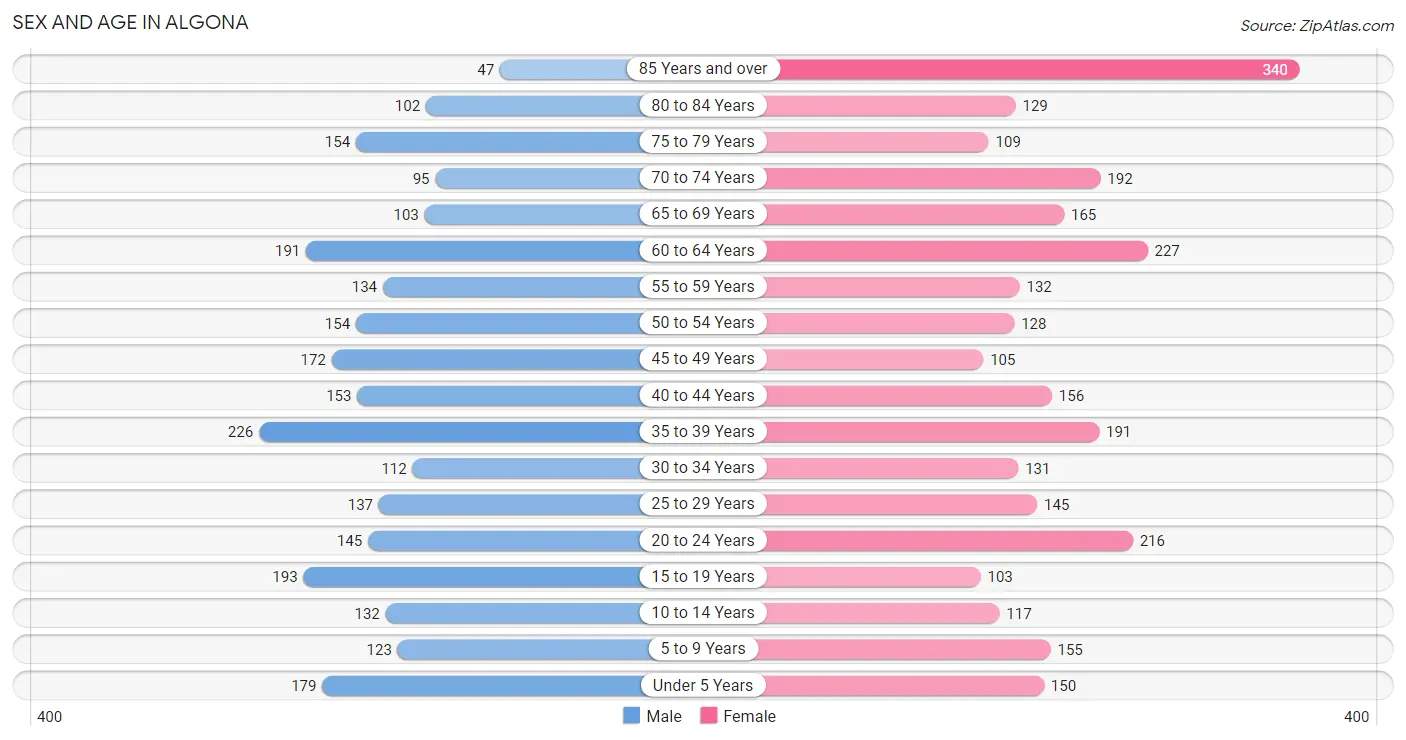
| Age Bracket | Male | Female |
| Under 5 Years | 179 (7.0%) | 150 (5.2%) |
| 5 to 9 Years | 123 (4.8%) | 155 (5.4%) |
| 10 to 14 Years | 132 (5.2%) | 117 (4.1%) |
| 15 to 19 Years | 193 (7.6%) | 103 (3.6%) |
| 20 to 24 Years | 145 (5.7%) | 216 (7.5%) |
| 25 to 29 Years | 137 (5.4%) | 145 (5.0%) |
| 30 to 34 Years | 112 (4.4%) | 131 (4.5%) |
| 35 to 39 Years | 226 (8.9%) | 191 (6.6%) |
| 40 to 44 Years | 153 (6.0%) | 156 (5.4%) |
| 45 to 49 Years | 172 (6.7%) | 105 (3.6%) |
| 50 to 54 Years | 154 (6.0%) | 128 (4.4%) |
| 55 to 59 Years | 134 (5.2%) | 132 (4.6%) |
| 60 to 64 Years | 191 (7.5%) | 227 (7.9%) |
| 65 to 69 Years | 103 (4.0%) | 165 (5.7%) |
| 70 to 74 Years | 95 (3.7%) | 192 (6.6%) |
| 75 to 79 Years | 154 (6.0%) | 109 (3.8%) |
| 80 to 84 Years | 102 (4.0%) | 129 (4.5%) |
| 85 Years and over | 47 (1.8%) | 340 (11.8%) |
| Total | 2,552 (100.0%) | 2,891 (100.0%) |
Families and Households in Algona
Median Family Size in Algona
The median family size in Algona is 2.90 persons per family, with married-couple families (935 | 77.1%) accounting for the largest median family size of 3.04 persons per family. On the other hand, single male/father families (112 | 9.2%) represent the smallest median family size with 2.04 persons per family.
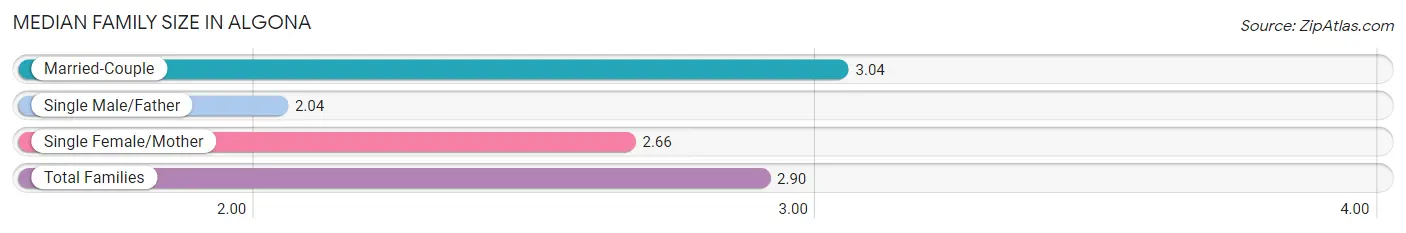
| Family Type | # Families | Family Size |
| Married-Couple | 935 (77.1%) | 3.04 |
| Single Male/Father | 112 (9.2%) | 2.04 |
| Single Female/Mother | 165 (13.6%) | 2.66 |
| Total Families | 1,212 (100.0%) | 2.90 |
Median Household Size in Algona
The median household size in Algona is 2.06 persons per household, with single female/mother households (165 | 6.5%) accounting for the largest median household size of 3.55 persons per household. non-family households (1,323 | 52.2%) represent the smallest median household size with 1.15 persons per household.
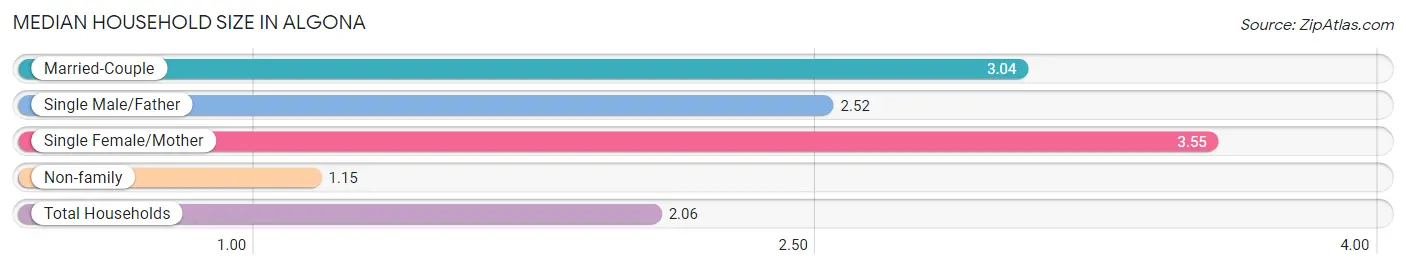
| Household Type | # Households | Household Size |
| Married-Couple | 935 (36.9%) | 3.04 |
| Single Male/Father | 112 (4.4%) | 2.52 |
| Single Female/Mother | 165 (6.5%) | 3.55 |
| Non-family | 1,323 (52.2%) | 1.15 |
| Total Households | 2,535 (100.0%) | 2.06 |
Household Size by Marriage Status in Algona
Out of a total of 2,535 households in Algona, 1,212 (47.8%) are family households, while 1,323 (52.2%) are nonfamily households. The most numerous type of family households are 2-person households, comprising 616, and the most common type of nonfamily households are 1-person households, comprising 1,165.
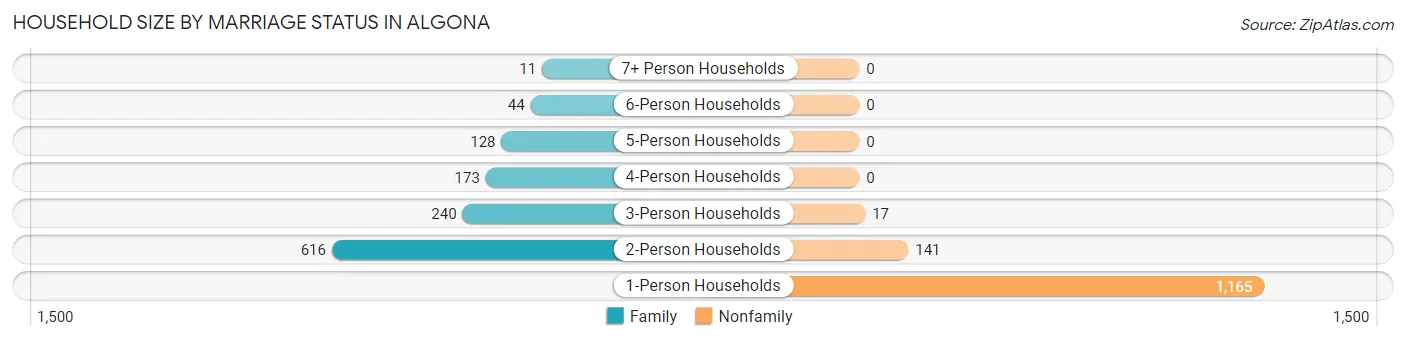
| Household Size | Family Households | Nonfamily Households |
| 1-Person Households | - | 1,165 (46.0%) |
| 2-Person Households | 616 (24.3%) | 141 (5.6%) |
| 3-Person Households | 240 (9.5%) | 17 (0.7%) |
| 4-Person Households | 173 (6.8%) | 0 (0.0%) |
| 5-Person Households | 128 (5.1%) | 0 (0.0%) |
| 6-Person Households | 44 (1.7%) | 0 (0.0%) |
| 7+ Person Households | 11 (0.4%) | 0 (0.0%) |
| Total | 1,212 (47.8%) | 1,323 (52.2%) |
Female Fertility in Algona
Fertility by Age in Algona
Average fertility rate in Algona is 41.0 births per 1,000 women. Women in the age bracket of 20 to 34 years have the highest fertility rate with 75.0 births per 1,000 women. Women in the age bracket of 20 to 34 years acount for 86.1% of all women with births.
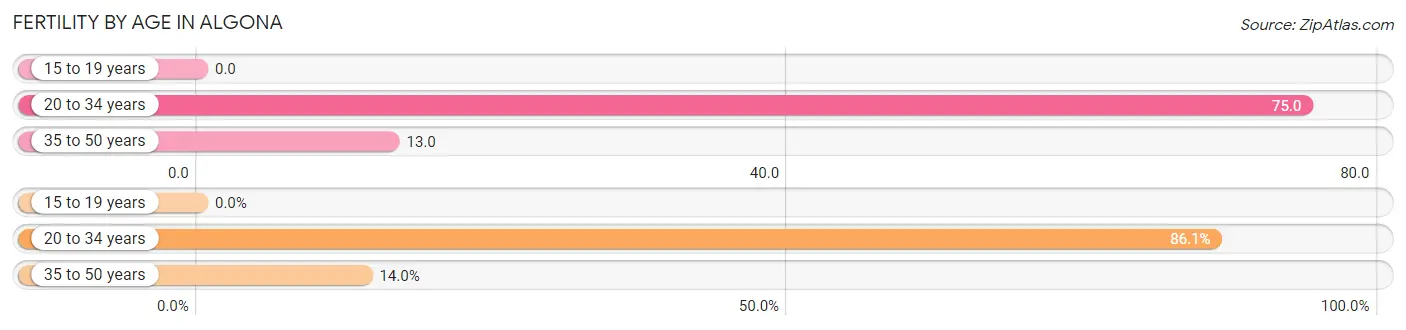
| Age Bracket | Women with Births | Births / 1,000 Women |
| 15 to 19 years | 0 (0.0%) | 0.0 |
| 20 to 34 years | 37 (86.1%) | 75.0 |
| 35 to 50 years | 6 (14.0%) | 13.0 |
| Total | 43 (100.0%) | 41.0 |
Fertility by Age by Marriage Status in Algona
53.5% of women with births (43) in Algona are married. The highest percentage of unmarried women with births falls into 35 to 50 years age bracket with 100.0% of them unmarried at the time of birth, while the lowest percentage of unmarried women with births belong to 20 to 34 years age bracket with 37.8% of them unmarried.
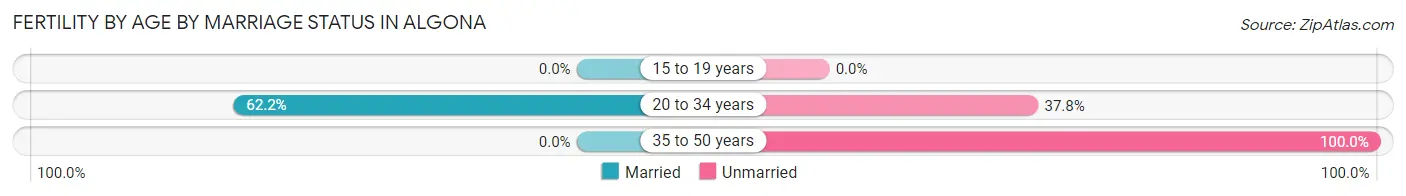
| Age Bracket | Married | Unmarried |
| 15 to 19 years | 0 (0.0%) | 0 (0.0%) |
| 20 to 34 years | 23 (62.2%) | 14 (37.8%) |
| 35 to 50 years | 0 (0.0%) | 6 (100.0%) |
| Total | 23 (53.5%) | 20 (46.5%) |
Fertility by Education in Algona
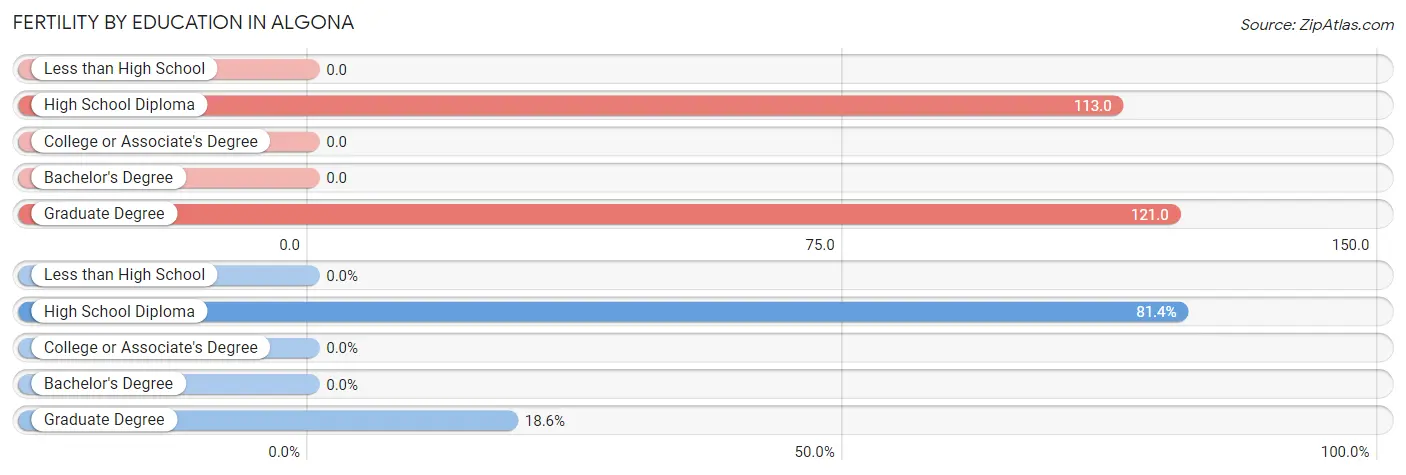
| Educational Attainment | Women with Births | Births / 1,000 Women |
| Less than High School | 0 (0.0%) | 0.0 |
| High School Diploma | 35 (81.4%) | 113.0 |
| College or Associate's Degree | 0 (0.0%) | 0.0 |
| Bachelor's Degree | 0 (0.0%) | 0.0 |
| Graduate Degree | 8 (18.6%) | 121.0 |
| Total | 43 (100.0%) | 41.0 |
Fertility by Education by Marriage Status in Algona
46.5% of women with births in Algona are unmarried. Women with the educational attainment of graduate degree are most likely to be married with 100.0% of them married at childbirth, while women with the educational attainment of high school diploma are least likely to be married with 57.1% of them unmarried at childbirth.
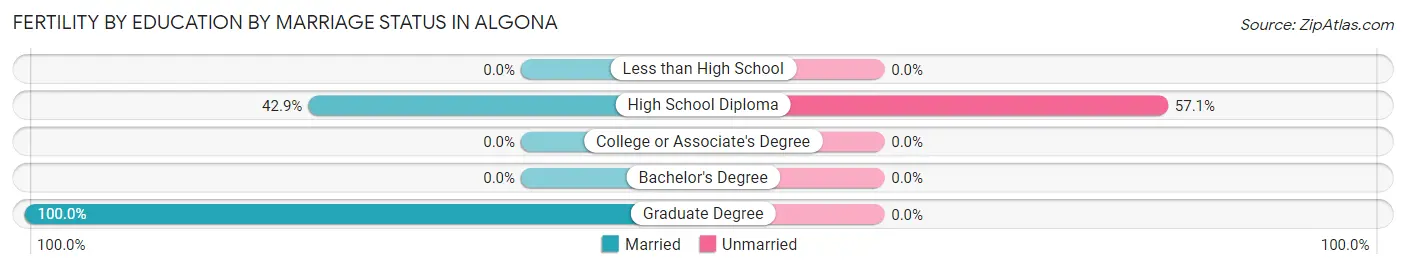
| Educational Attainment | Married | Unmarried |
| Less than High School | 0 (0.0%) | 0 (0.0%) |
| High School Diploma | 15 (42.9%) | 20 (57.1%) |
| College or Associate's Degree | 0 (0.0%) | 0 (0.0%) |
| Bachelor's Degree | 0 (0.0%) | 0 (0.0%) |
| Graduate Degree | 8 (100.0%) | 0 (0.0%) |
| Total | 23 (53.5%) | 20 (46.5%) |
Employment Characteristics in Algona
Employment by Class of Employer in Algona
Among the 2,515 employed individuals in Algona, private company employees (1,908 | 75.9%), self-employed (not incorporated) (231 | 9.2%), and local government employees (157 | 6.2%) make up the most common classes of employment.
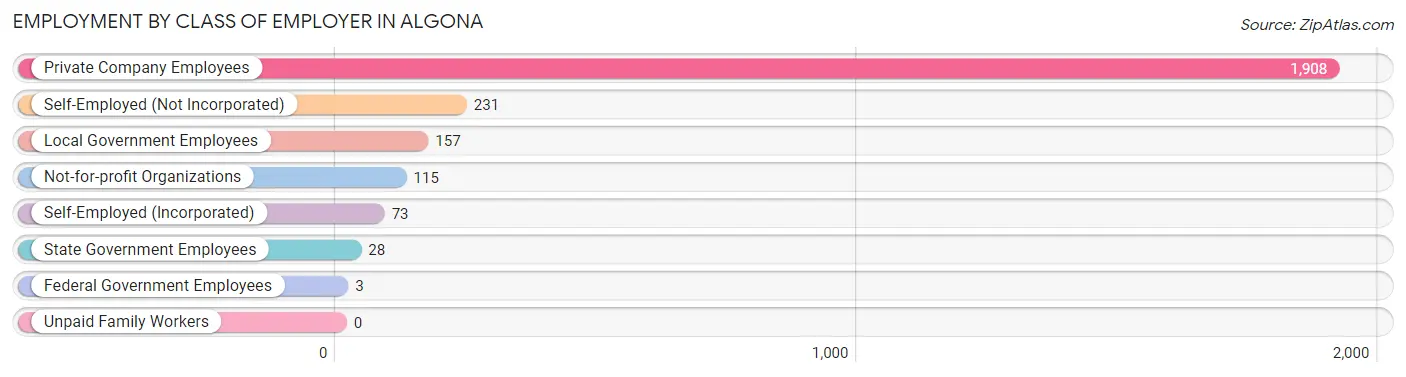
| Employer Class | # Employees | % Employees |
| Private Company Employees | 1,908 | 75.9% |
| Self-Employed (Incorporated) | 73 | 2.9% |
| Self-Employed (Not Incorporated) | 231 | 9.2% |
| Not-for-profit Organizations | 115 | 4.6% |
| Local Government Employees | 157 | 6.2% |
| State Government Employees | 28 | 1.1% |
| Federal Government Employees | 3 | 0.1% |
| Unpaid Family Workers | 0 | 0.0% |
| Total | 2,515 | 100.0% |
Employment Status by Age in Algona
According to the labor force statistics for Algona, out of the total population over 16 years of age (4,520), 59.3% or 2,680 individuals are in the labor force, with 5.5% or 147 of them unemployed. The age group with the highest labor force participation rate is 35 to 44 years, with 93.9% or 682 individuals in the labor force. Within the labor force, the 65 to 74 years age range has the highest percentage of unemployed individuals, with 20.3% or 24 of them being unemployed.
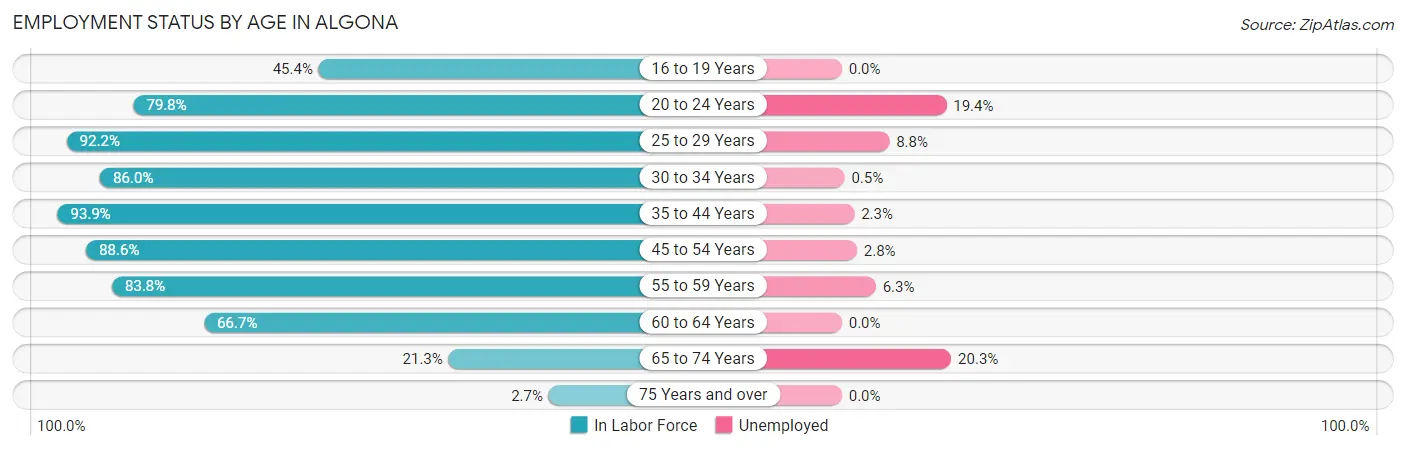
| Age Bracket | In Labor Force | Unemployed |
| 16 to 19 Years | 104 (45.4%) | 0 (0.0%) |
| 20 to 24 Years | 288 (79.8%) | 56 (19.4%) |
| 25 to 29 Years | 260 (92.2%) | 23 (8.8%) |
| 30 to 34 Years | 209 (86.0%) | 1 (0.5%) |
| 35 to 44 Years | 682 (93.9%) | 16 (2.3%) |
| 45 to 54 Years | 495 (88.6%) | 14 (2.8%) |
| 55 to 59 Years | 223 (83.8%) | 14 (6.3%) |
| 60 to 64 Years | 279 (66.7%) | 0 (0.0%) |
| 65 to 74 Years | 118 (21.3%) | 24 (20.3%) |
| 75 Years and over | 24 (2.7%) | 0 (0.0%) |
| Total | 2,680 (59.3%) | 147 (5.5%) |
Employment Status by Educational Attainment in Algona
According to labor force statistics for Algona, 86.1% of individuals (2,147) out of the total population between 25 and 64 years of age (2,494) are in the labor force, with 3.2% or 69 of them being unemployed. The group with the highest labor force participation rate are those with the educational attainment of less than high school, with 94.4% or 168 individuals in the labor force. Within the labor force, individuals with less than high school education have the highest percentage of unemployment, with 13.7% or 23 of them being unemployed.
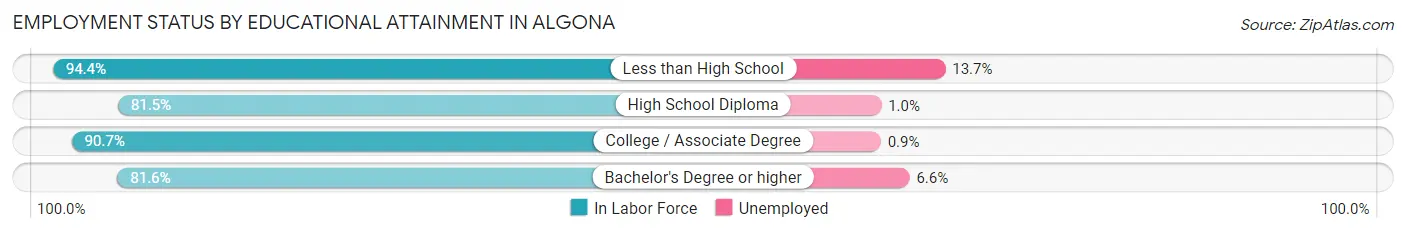
| Educational Attainment | In Labor Force | Unemployed |
| Less than High School | 168 (94.4%) | 24 (13.7%) |
| High School Diploma | 598 (81.5%) | 7 (1.0%) |
| College / Associate Degree | 909 (90.7%) | 9 (0.9%) |
| Bachelor's Degree or higher | 473 (81.6%) | 38 (6.6%) |
| Total | 2,147 (86.1%) | 80 (3.2%) |
Employment Occupations by Sex in Algona
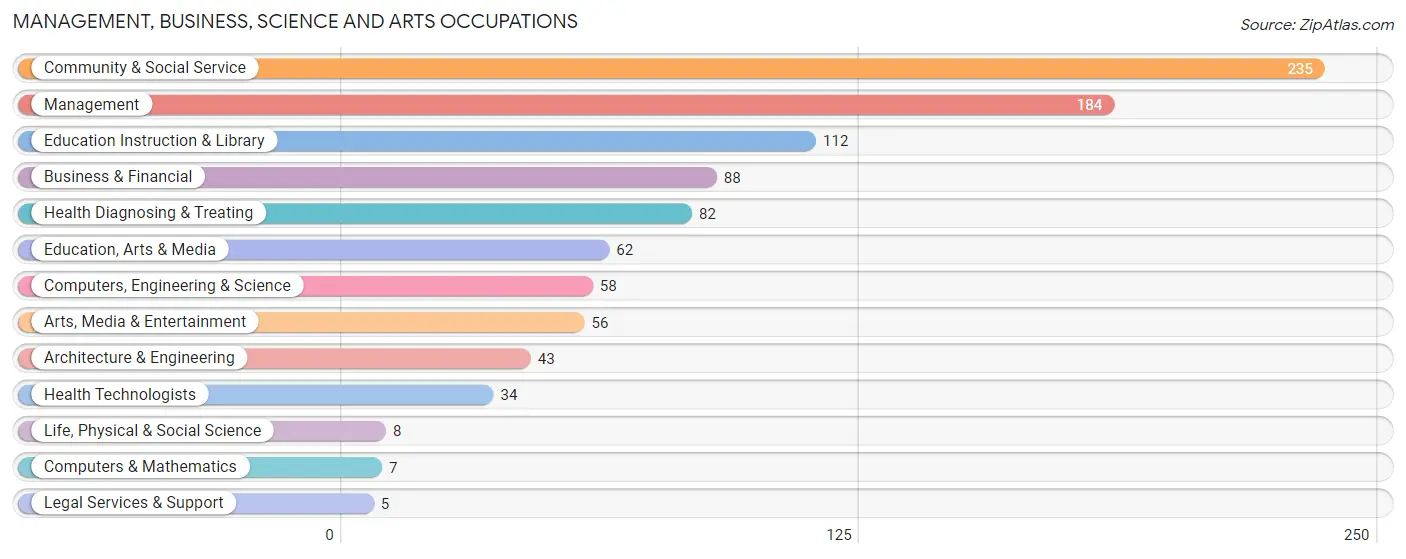
Management, Business, Science and Arts Occupations
The most common Management, Business, Science and Arts occupations in Algona are Community & Social Service (235 | 9.3%), Management (184 | 7.3%), Education Instruction & Library (112 | 4.4%), Business & Financial (88 | 3.5%), and Health Diagnosing & Treating (82 | 3.2%).
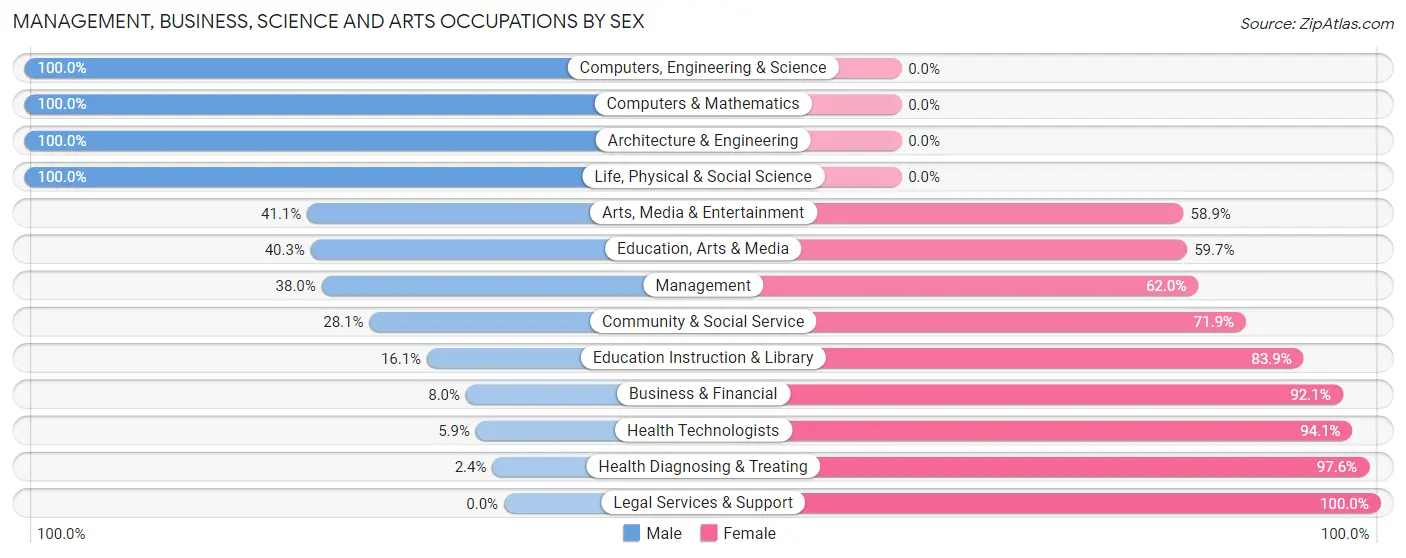
Management, Business, Science and Arts Occupations by Sex
Within the Management, Business, Science and Arts occupations in Algona, the most male-oriented occupations are Computers, Engineering & Science (100.0%), Computers & Mathematics (100.0%), and Architecture & Engineering (100.0%), while the most female-oriented occupations are Legal Services & Support (100.0%), Health Diagnosing & Treating (97.6%), and Health Technologists (94.1%).
| Occupation | Male | Female |
| Management | 70 (38.0%) | 114 (62.0%) |
| Business & Financial | 7 (8.0%) | 81 (92.0%) |
| Computers, Engineering & Science | 58 (100.0%) | 0 (0.0%) |
| Computers & Mathematics | 7 (100.0%) | 0 (0.0%) |
| Architecture & Engineering | 43 (100.0%) | 0 (0.0%) |
| Life, Physical & Social Science | 8 (100.0%) | 0 (0.0%) |
| Community & Social Service | 66 (28.1%) | 169 (71.9%) |
| Education, Arts & Media | 25 (40.3%) | 37 (59.7%) |
| Legal Services & Support | 0 (0.0%) | 5 (100.0%) |
| Education Instruction & Library | 18 (16.1%) | 94 (83.9%) |
| Arts, Media & Entertainment | 23 (41.1%) | 33 (58.9%) |
| Health Diagnosing & Treating | 2 (2.4%) | 80 (97.6%) |
| Health Technologists | 2 (5.9%) | 32 (94.1%) |
| Total (Category) | 203 (31.4%) | 444 (68.6%) |
| Total (Overall) | 1,299 (51.3%) | 1,235 (48.7%) |
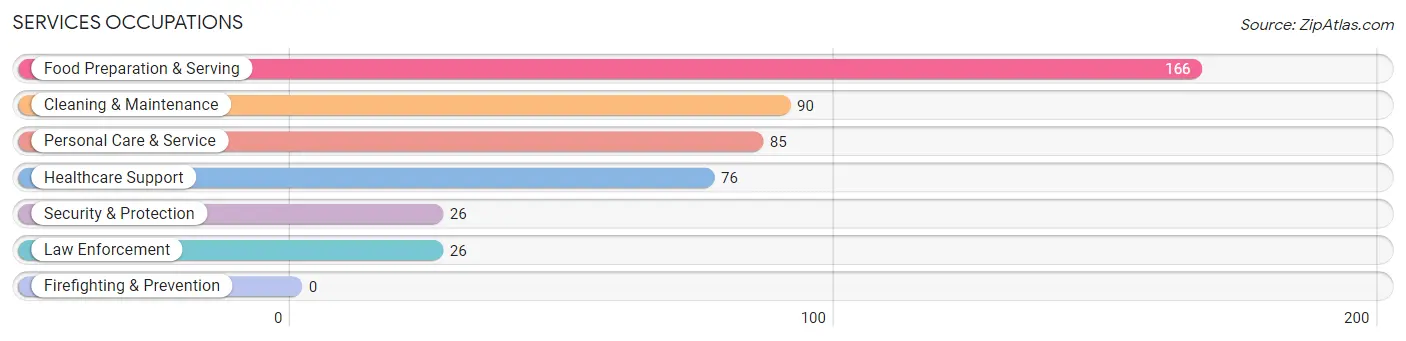
Services Occupations
The most common Services occupations in Algona are Food Preparation & Serving (166 | 6.6%), Cleaning & Maintenance (90 | 3.5%), Personal Care & Service (85 | 3.4%), Healthcare Support (76 | 3.0%), and Security & Protection (26 | 1.0%).
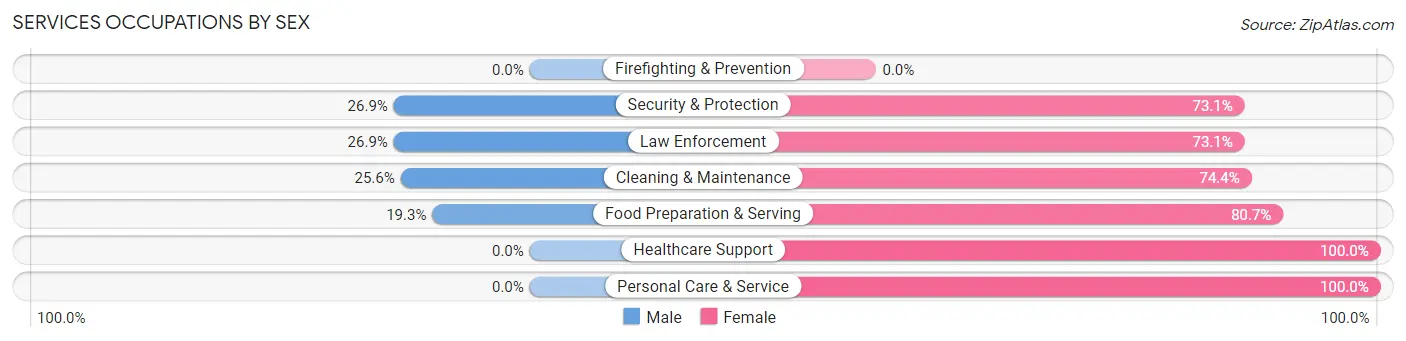
Services Occupations by Sex
Within the Services occupations in Algona, the most male-oriented occupations are Security & Protection (26.9%), Law Enforcement (26.9%), and Cleaning & Maintenance (25.6%), while the most female-oriented occupations are Healthcare Support (100.0%), Personal Care & Service (100.0%), and Food Preparation & Serving (80.7%).
| Occupation | Male | Female |
| Healthcare Support | 0 (0.0%) | 76 (100.0%) |
| Security & Protection | 7 (26.9%) | 19 (73.1%) |
| Firefighting & Prevention | 0 (0.0%) | 0 (0.0%) |
| Law Enforcement | 7 (26.9%) | 19 (73.1%) |
| Food Preparation & Serving | 32 (19.3%) | 134 (80.7%) |
| Cleaning & Maintenance | 23 (25.6%) | 67 (74.4%) |
| Personal Care & Service | 0 (0.0%) | 85 (100.0%) |
| Total (Category) | 62 (14.0%) | 381 (86.0%) |
| Total (Overall) | 1,299 (51.3%) | 1,235 (48.7%) |
Sales and Office Occupations
The most common Sales and Office occupations in Algona are Sales & Related (257 | 10.1%), and Office & Administration (237 | 9.3%).
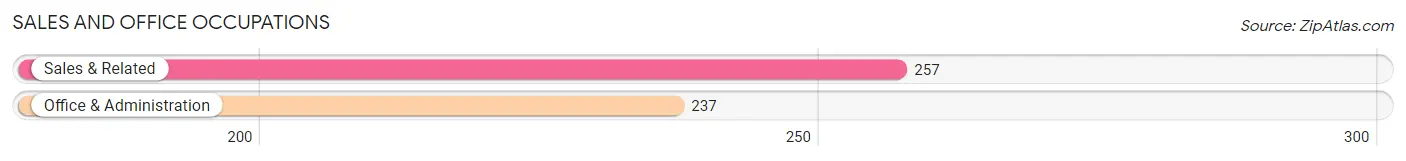
Sales and Office Occupations by Sex
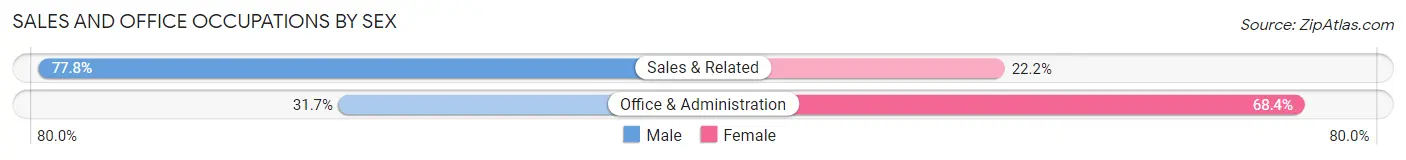
| Occupation | Male | Female |
| Sales & Related | 200 (77.8%) | 57 (22.2%) |
| Office & Administration | 75 (31.7%) | 162 (68.3%) |
| Total (Category) | 275 (55.7%) | 219 (44.3%) |
| Total (Overall) | 1,299 (51.3%) | 1,235 (48.7%) |
Natural Resources, Construction and Maintenance Occupations
The most common Natural Resources, Construction and Maintenance occupations in Algona are Installation, Maintenance & Repair (143 | 5.6%), Construction & Extraction (126 | 5.0%), and Farming, Fishing & Forestry (89 | 3.5%).
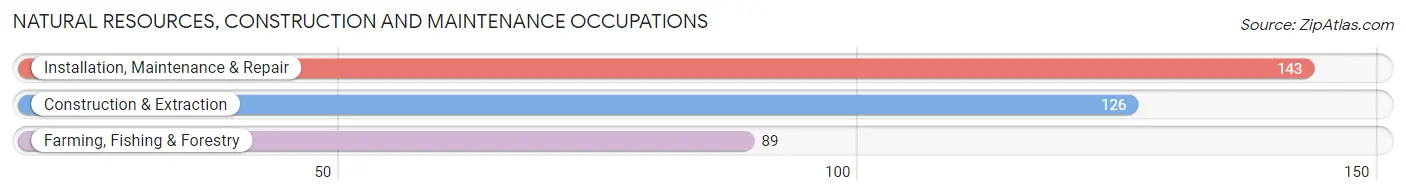
Natural Resources, Construction and Maintenance Occupations by Sex
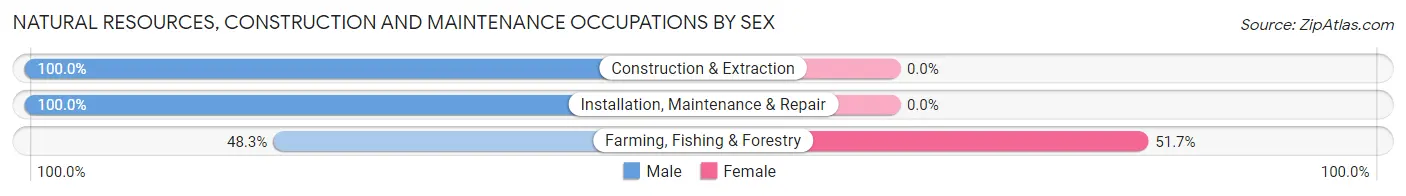
| Occupation | Male | Female |
| Farming, Fishing & Forestry | 43 (48.3%) | 46 (51.7%) |
| Construction & Extraction | 126 (100.0%) | 0 (0.0%) |
| Installation, Maintenance & Repair | 143 (100.0%) | 0 (0.0%) |
| Total (Category) | 312 (87.2%) | 46 (12.9%) |
| Total (Overall) | 1,299 (51.3%) | 1,235 (48.7%) |
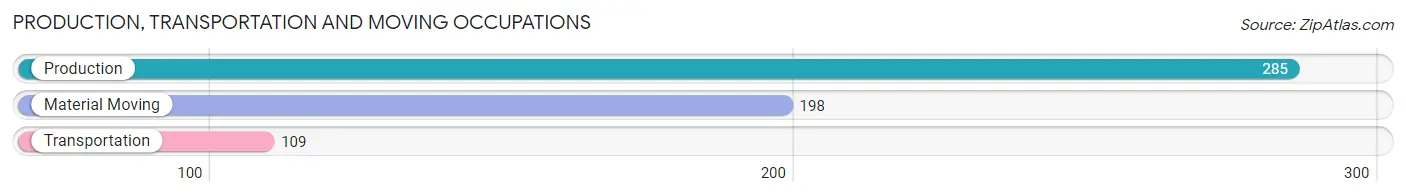
Production, Transportation and Moving Occupations
The most common Production, Transportation and Moving occupations in Algona are Production (285 | 11.3%), Material Moving (198 | 7.8%), and Transportation (109 | 4.3%).
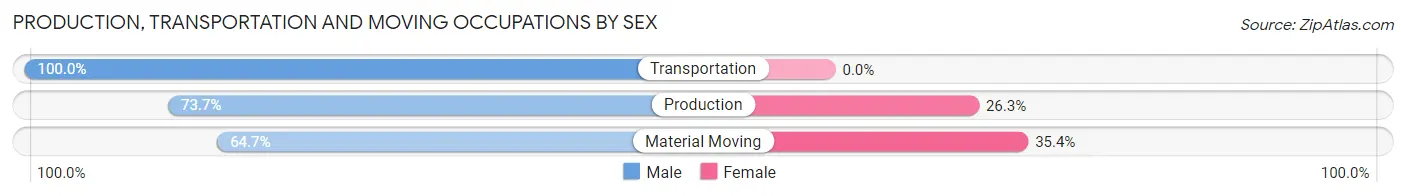
Production, Transportation and Moving Occupations by Sex
| Occupation | Male | Female |
| Production | 210 (73.7%) | 75 (26.3%) |
| Transportation | 109 (100.0%) | 0 (0.0%) |
| Material Moving | 128 (64.6%) | 70 (35.3%) |
| Total (Category) | 447 (75.5%) | 145 (24.5%) |
| Total (Overall) | 1,299 (51.3%) | 1,235 (48.7%) |
Employment Industries by Sex in Algona
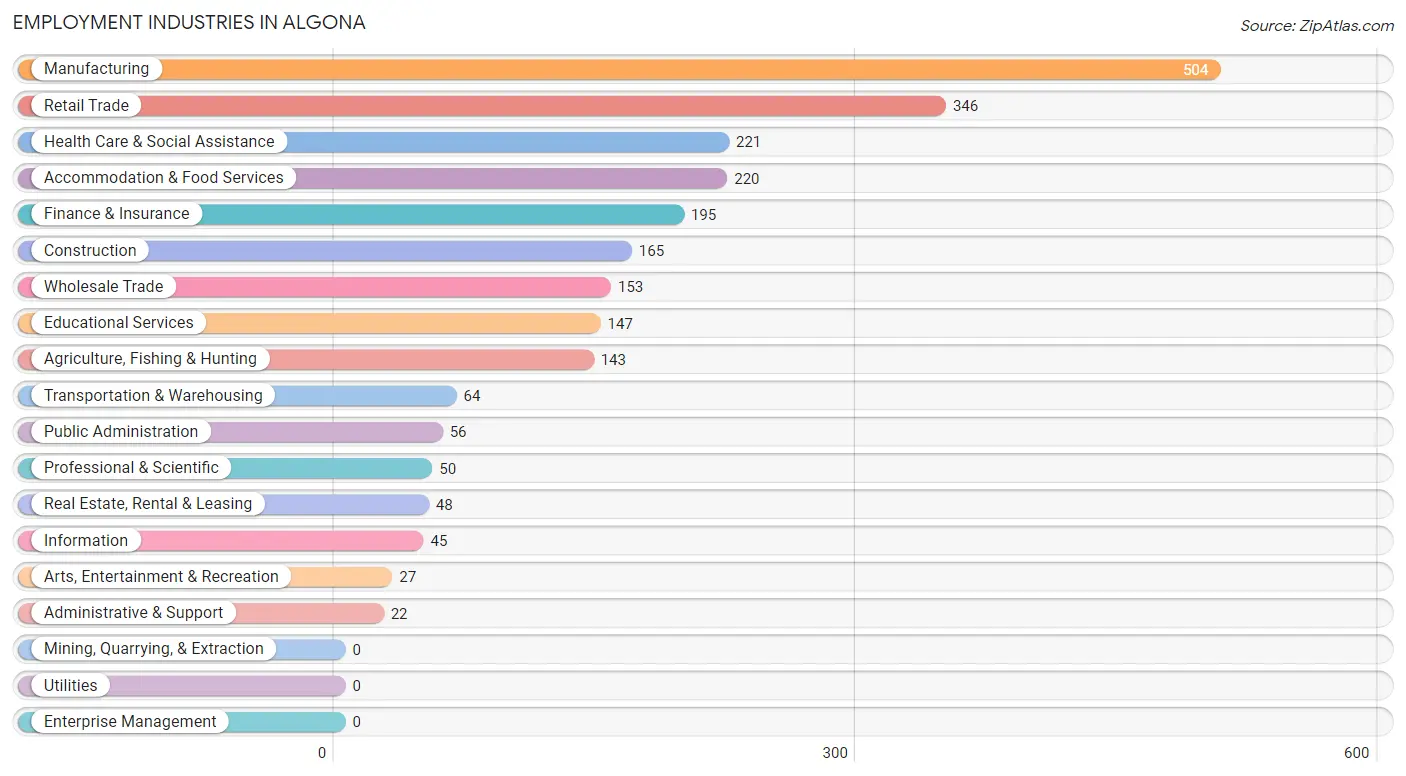
Employment Industries in Algona
The major employment industries in Algona include Manufacturing (504 | 19.9%), Retail Trade (346 | 13.7%), Health Care & Social Assistance (221 | 8.7%), Accommodation & Food Services (220 | 8.7%), and Finance & Insurance (195 | 7.7%).
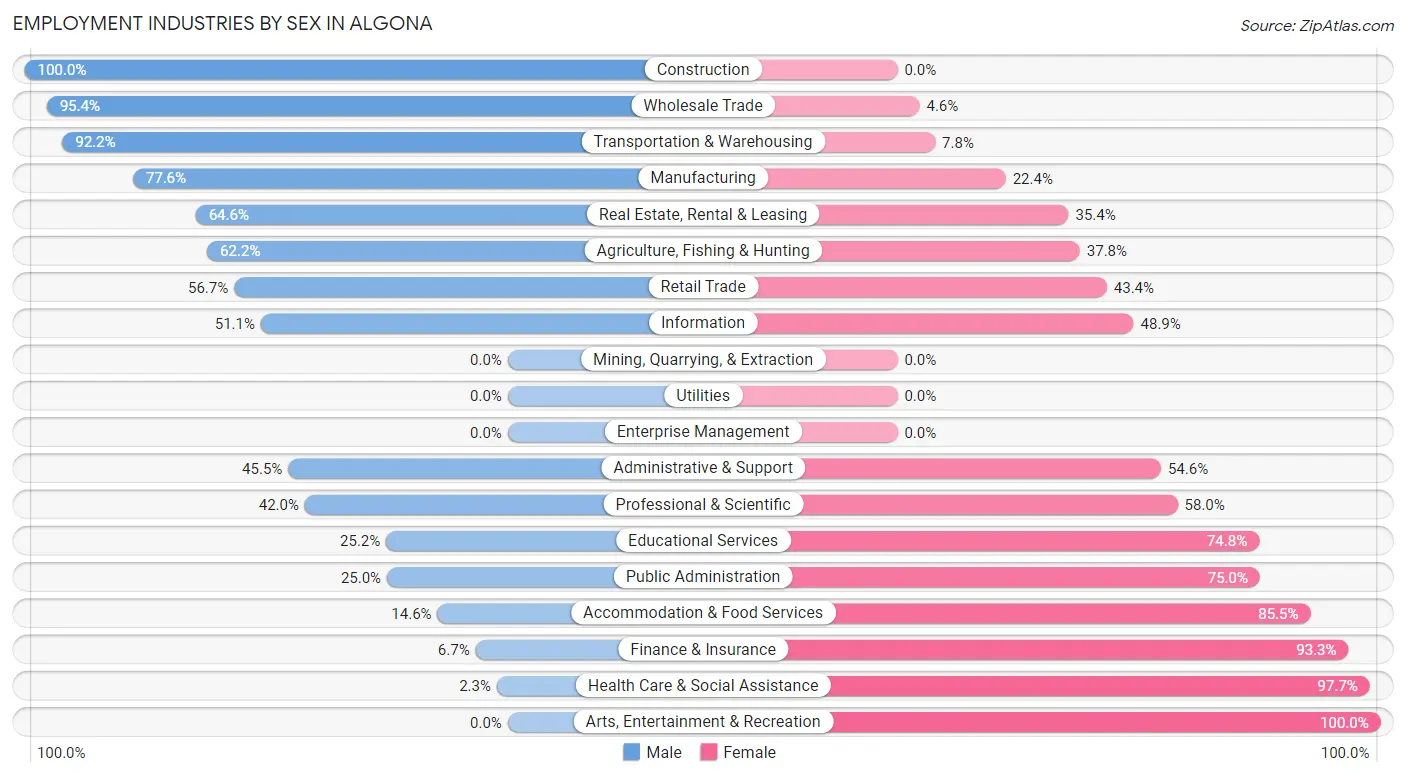
Employment Industries by Sex in Algona
The Algona industries that see more men than women are Construction (100.0%), Wholesale Trade (95.4%), and Transportation & Warehousing (92.2%), whereas the industries that tend to have a higher number of women are Arts, Entertainment & Recreation (100.0%), Health Care & Social Assistance (97.7%), and Finance & Insurance (93.3%).
| Industry | Male | Female |
| Agriculture, Fishing & Hunting | 89 (62.2%) | 54 (37.8%) |
| Mining, Quarrying, & Extraction | 0 (0.0%) | 0 (0.0%) |
| Construction | 165 (100.0%) | 0 (0.0%) |
| Manufacturing | 391 (77.6%) | 113 (22.4%) |
| Wholesale Trade | 146 (95.4%) | 7 (4.6%) |
| Retail Trade | 196 (56.7%) | 150 (43.3%) |
| Transportation & Warehousing | 59 (92.2%) | 5 (7.8%) |
| Utilities | 0 (0.0%) | 0 (0.0%) |
| Information | 23 (51.1%) | 22 (48.9%) |
| Finance & Insurance | 13 (6.7%) | 182 (93.3%) |
| Real Estate, Rental & Leasing | 31 (64.6%) | 17 (35.4%) |
| Professional & Scientific | 21 (42.0%) | 29 (58.0%) |
| Enterprise Management | 0 (0.0%) | 0 (0.0%) |
| Administrative & Support | 10 (45.5%) | 12 (54.5%) |
| Educational Services | 37 (25.2%) | 110 (74.8%) |
| Health Care & Social Assistance | 5 (2.3%) | 216 (97.7%) |
| Arts, Entertainment & Recreation | 0 (0.0%) | 27 (100.0%) |
| Accommodation & Food Services | 32 (14.5%) | 188 (85.5%) |
| Public Administration | 14 (25.0%) | 42 (75.0%) |
| Total | 1,299 (51.3%) | 1,235 (48.7%) |
Education in Algona
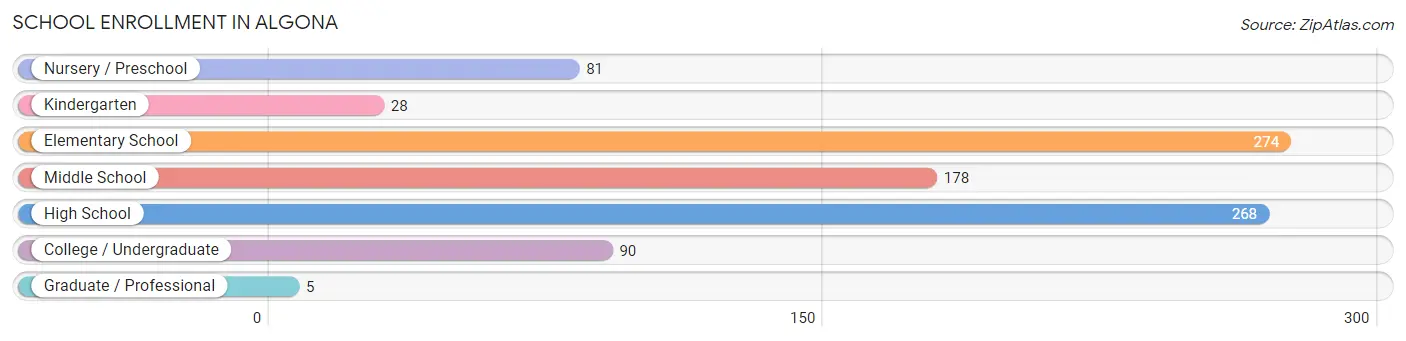
School Enrollment in Algona
The most common levels of schooling among the 924 students in Algona are elementary school (274 | 29.6%), high school (268 | 29.0%), and middle school (178 | 19.3%).
| School Level | # Students | % Students |
| Nursery / Preschool | 81 | 8.8% |
| Kindergarten | 28 | 3.0% |
| Elementary School | 274 | 29.6% |
| Middle School | 178 | 19.3% |
| High School | 268 | 29.0% |
| College / Undergraduate | 90 | 9.7% |
| Graduate / Professional | 5 | 0.5% |
| Total | 924 | 100.0% |
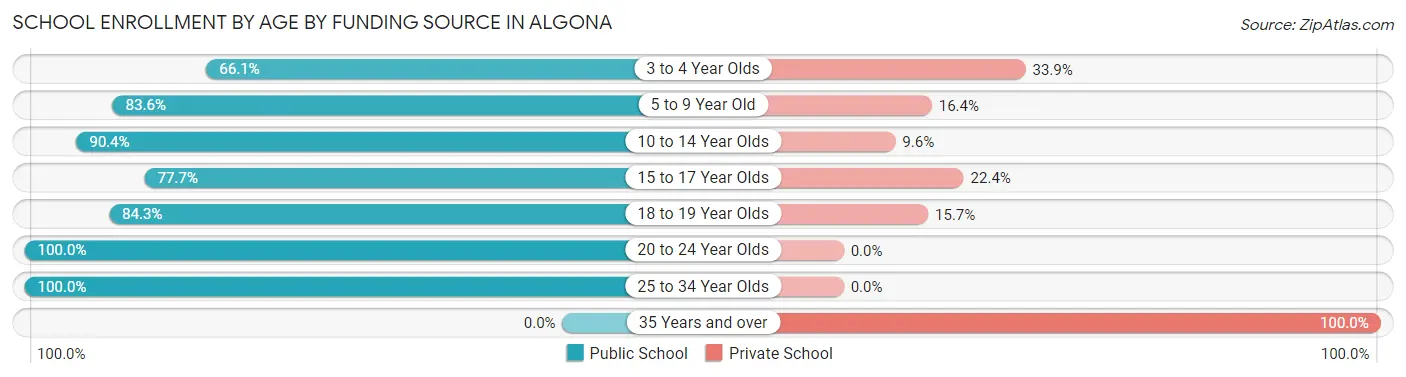
School Enrollment by Age by Funding Source in Algona
Out of a total of 924 students who are enrolled in schools in Algona, 150 (16.2%) attend a private institution, while the remaining 774 (83.8%) are enrolled in public schools. The age group of 35 years and over has the highest likelihood of being enrolled in private schools, with 8 (100.0% in the age bracket) enrolled. Conversely, the age group of 20 to 24 year olds has the lowest likelihood of being enrolled in a private school, with 43 (100.0% in the age bracket) attending a public institution.
| Age Bracket | Public School | Private School |
| 3 to 4 Year Olds | 41 (66.1%) | 21 (33.9%) |
| 5 to 9 Year Old | 219 (83.6%) | 43 (16.4%) |
| 10 to 14 Year Olds | 225 (90.4%) | 24 (9.6%) |
| 15 to 17 Year Olds | 139 (77.6%) | 40 (22.4%) |
| 18 to 19 Year Olds | 75 (84.3%) | 14 (15.7%) |
| 20 to 24 Year Olds | 43 (100.0%) | 0 (0.0%) |
| 25 to 34 Year Olds | 32 (100.0%) | 0 (0.0%) |
| 35 Years and over | 0 (0.0%) | 8 (100.0%) |
| Total | 774 (83.8%) | 150 (16.2%) |
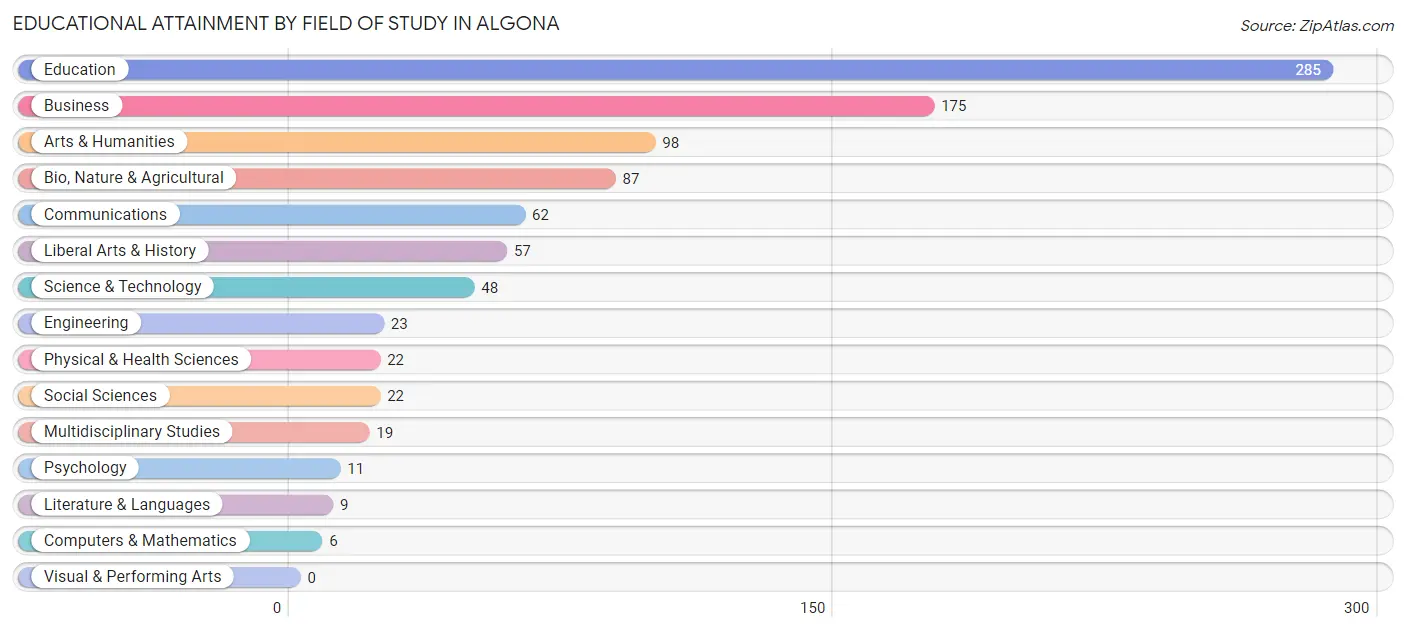
Educational Attainment by Field of Study in Algona
Education (285 | 30.8%), business (175 | 18.9%), arts & humanities (98 | 10.6%), bio, nature & agricultural (87 | 9.4%), and communications (62 | 6.7%) are the most common fields of study among 924 individuals in Algona who have obtained a bachelor's degree or higher.
| Field of Study | # Graduates | % Graduates |
| Computers & Mathematics | 6 | 0.6% |
| Bio, Nature & Agricultural | 87 | 9.4% |
| Physical & Health Sciences | 22 | 2.4% |
| Psychology | 11 | 1.2% |
| Social Sciences | 22 | 2.4% |
| Engineering | 23 | 2.5% |
| Multidisciplinary Studies | 19 | 2.1% |
| Science & Technology | 48 | 5.2% |
| Business | 175 | 18.9% |
| Education | 285 | 30.8% |
| Literature & Languages | 9 | 1.0% |
| Liberal Arts & History | 57 | 6.2% |
| Visual & Performing Arts | 0 | 0.0% |
| Communications | 62 | 6.7% |
| Arts & Humanities | 98 | 10.6% |
| Total | 924 | 100.0% |
Transportation & Commute in Algona
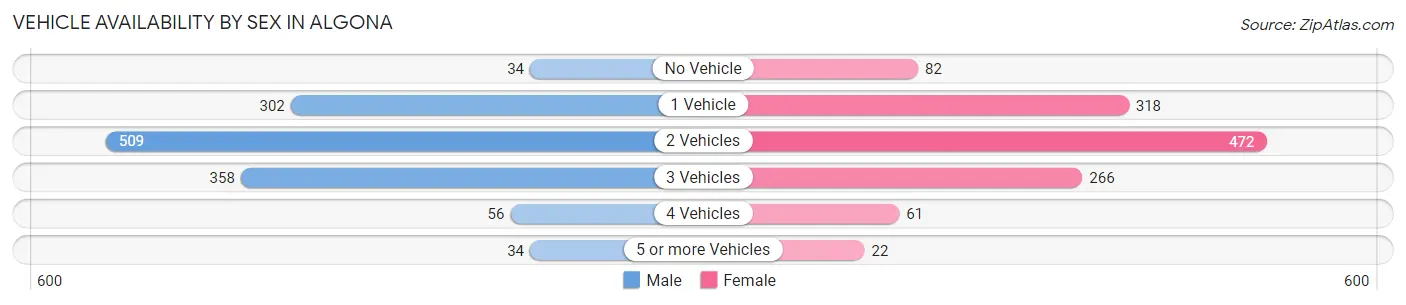
Vehicle Availability by Sex in Algona
The most prevalent vehicle ownership categories in Algona are males with 2 vehicles (509, accounting for 39.4%) and females with 2 vehicles (472, making up 41.7%).
| Vehicles Available | Male | Female |
| No Vehicle | 34 (2.6%) | 82 (6.7%) |
| 1 Vehicle | 302 (23.4%) | 318 (26.0%) |
| 2 Vehicles | 509 (39.4%) | 472 (38.7%) |
| 3 Vehicles | 358 (27.7%) | 266 (21.8%) |
| 4 Vehicles | 56 (4.3%) | 61 (5.0%) |
| 5 or more Vehicles | 34 (2.6%) | 22 (1.8%) |
| Total | 1,293 (100.0%) | 1,221 (100.0%) |
Commute Time in Algona
The most frequently occuring commute durations in Algona are 5 to 9 minutes (1,294 commuters, 54.4%), 10 to 14 minutes (237 commuters, 10.0%), and less than 5 minutes (216 commuters, 9.1%).
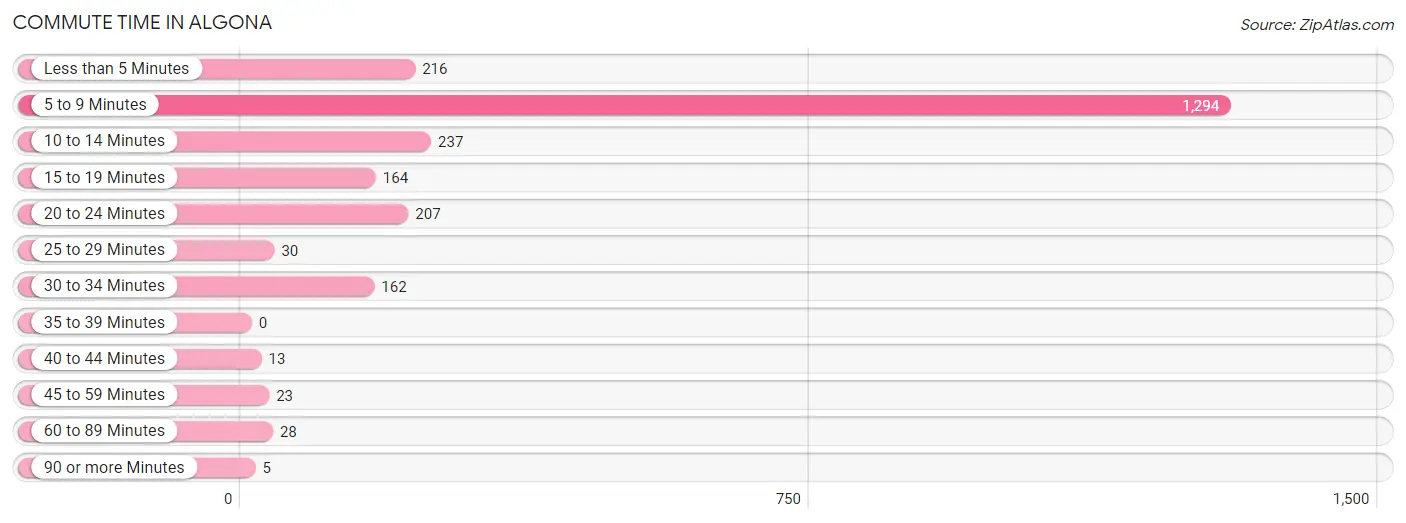
| Commute Time | # Commuters | % Commuters |
| Less than 5 Minutes | 216 | 9.1% |
| 5 to 9 Minutes | 1,294 | 54.4% |
| 10 to 14 Minutes | 237 | 10.0% |
| 15 to 19 Minutes | 164 | 6.9% |
| 20 to 24 Minutes | 207 | 8.7% |
| 25 to 29 Minutes | 30 | 1.3% |
| 30 to 34 Minutes | 162 | 6.8% |
| 35 to 39 Minutes | 0 | 0.0% |
| 40 to 44 Minutes | 13 | 0.5% |
| 45 to 59 Minutes | 23 | 1.0% |
| 60 to 89 Minutes | 28 | 1.2% |
| 90 or more Minutes | 5 | 0.2% |
Commute Time by Sex in Algona
The most common commute times in Algona are 5 to 9 minutes (567 commuters, 47.0%) for males and 5 to 9 minutes (727 commuters, 61.9%) for females.
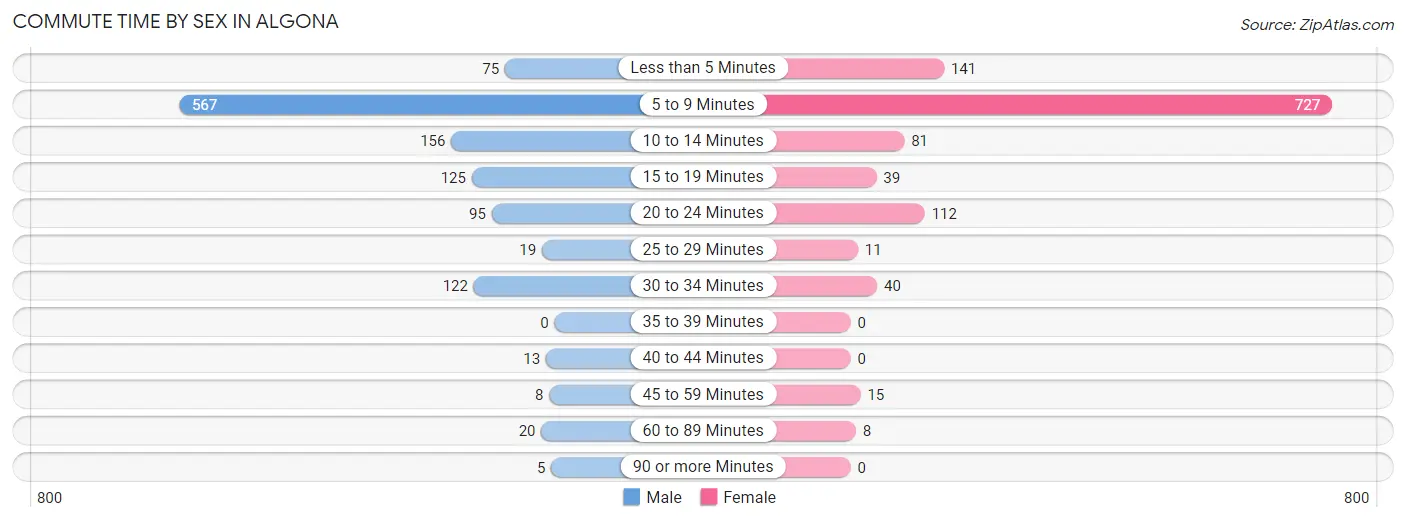
| Commute Time | Male | Female |
| Less than 5 Minutes | 75 (6.2%) | 141 (12.0%) |
| 5 to 9 Minutes | 567 (47.0%) | 727 (61.9%) |
| 10 to 14 Minutes | 156 (13.0%) | 81 (6.9%) |
| 15 to 19 Minutes | 125 (10.4%) | 39 (3.3%) |
| 20 to 24 Minutes | 95 (7.9%) | 112 (9.5%) |
| 25 to 29 Minutes | 19 (1.6%) | 11 (0.9%) |
| 30 to 34 Minutes | 122 (10.1%) | 40 (3.4%) |
| 35 to 39 Minutes | 0 (0.0%) | 0 (0.0%) |
| 40 to 44 Minutes | 13 (1.1%) | 0 (0.0%) |
| 45 to 59 Minutes | 8 (0.7%) | 15 (1.3%) |
| 60 to 89 Minutes | 20 (1.7%) | 8 (0.7%) |
| 90 or more Minutes | 5 (0.4%) | 0 (0.0%) |
Time of Departure to Work by Sex in Algona
The most frequent times of departure to work in Algona are 5:30 AM to 5:59 AM (170, 14.1%) for males and 7:30 AM to 7:59 AM (198, 16.9%) for females.
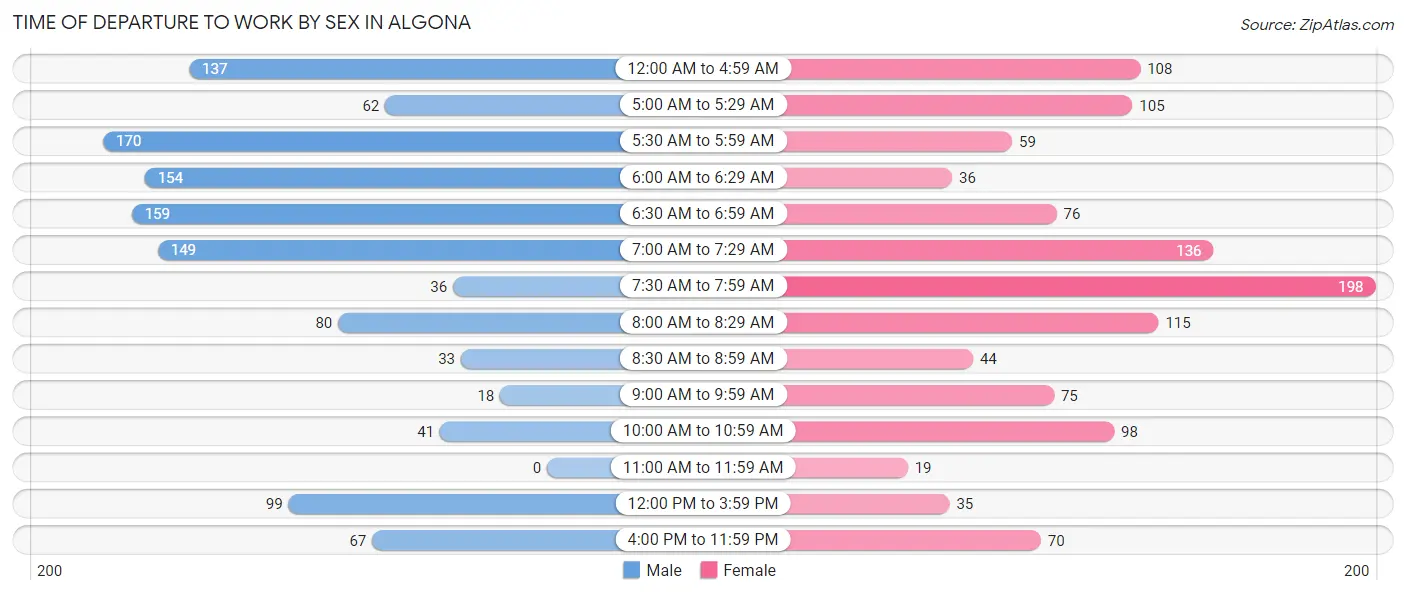
| Time of Departure | Male | Female |
| 12:00 AM to 4:59 AM | 137 (11.4%) | 108 (9.2%) |
| 5:00 AM to 5:29 AM | 62 (5.1%) | 105 (8.9%) |
| 5:30 AM to 5:59 AM | 170 (14.1%) | 59 (5.0%) |
| 6:00 AM to 6:29 AM | 154 (12.8%) | 36 (3.1%) |
| 6:30 AM to 6:59 AM | 159 (13.2%) | 76 (6.5%) |
| 7:00 AM to 7:29 AM | 149 (12.4%) | 136 (11.6%) |
| 7:30 AM to 7:59 AM | 36 (3.0%) | 198 (16.9%) |
| 8:00 AM to 8:29 AM | 80 (6.6%) | 115 (9.8%) |
| 8:30 AM to 8:59 AM | 33 (2.7%) | 44 (3.7%) |
| 9:00 AM to 9:59 AM | 18 (1.5%) | 75 (6.4%) |
| 10:00 AM to 10:59 AM | 41 (3.4%) | 98 (8.4%) |
| 11:00 AM to 11:59 AM | 0 (0.0%) | 19 (1.6%) |
| 12:00 PM to 3:59 PM | 99 (8.2%) | 35 (3.0%) |
| 4:00 PM to 11:59 PM | 67 (5.6%) | 70 (6.0%) |
| Total | 1,205 (100.0%) | 1,174 (100.0%) |
Housing Occupancy in Algona
Occupancy by Ownership in Algona
Of the total 2,535 dwellings in Algona, owner-occupied units account for 1,578 (62.3%), while renter-occupied units make up 957 (37.8%).
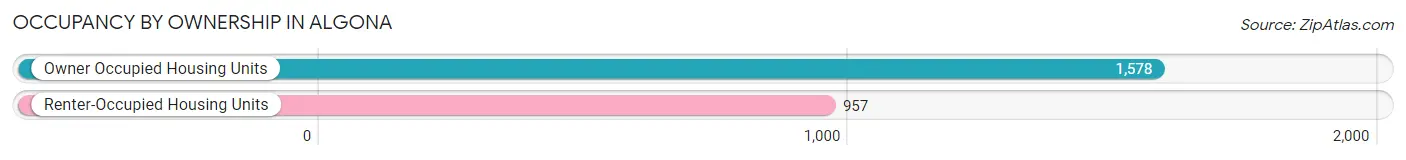
| Occupancy | # Housing Units | % Housing Units |
| Owner Occupied Housing Units | 1,578 | 62.3% |
| Renter-Occupied Housing Units | 957 | 37.8% |
| Total Occupied Housing Units | 2,535 | 100.0% |
Occupancy by Household Size in Algona
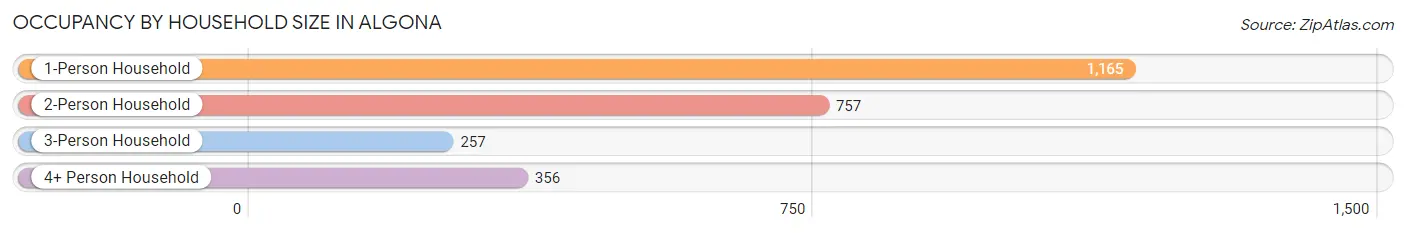
| Household Size | # Housing Units | % Housing Units |
| 1-Person Household | 1,165 | 46.0% |
| 2-Person Household | 757 | 29.9% |
| 3-Person Household | 257 | 10.1% |
| 4+ Person Household | 356 | 14.0% |
| Total Housing Units | 2,535 | 100.0% |
Occupancy by Ownership by Household Size in Algona
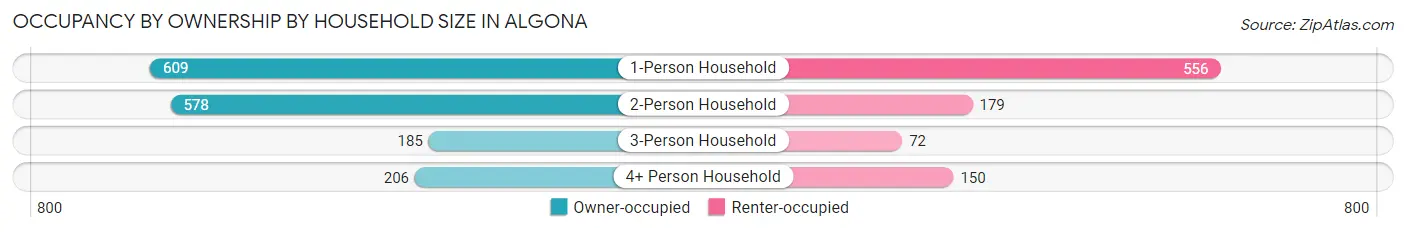
| Household Size | Owner-occupied | Renter-occupied |
| 1-Person Household | 609 (52.3%) | 556 (47.7%) |
| 2-Person Household | 578 (76.3%) | 179 (23.6%) |
| 3-Person Household | 185 (72.0%) | 72 (28.0%) |
| 4+ Person Household | 206 (57.9%) | 150 (42.1%) |
| Total Housing Units | 1,578 (62.3%) | 957 (37.8%) |
Occupancy by Educational Attainment in Algona
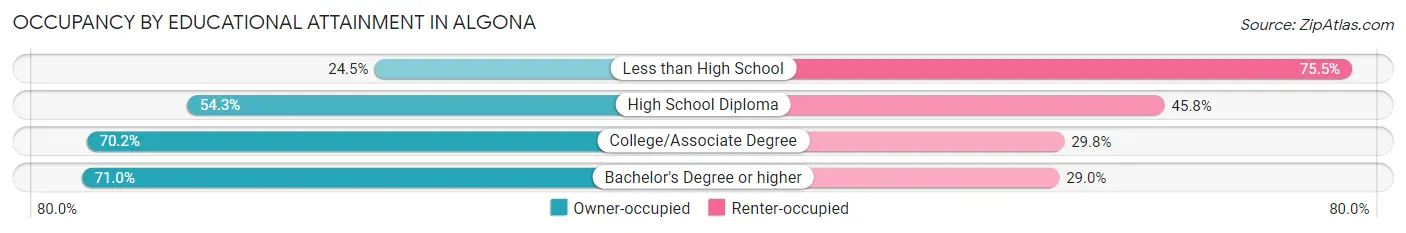
| Household Size | Owner-occupied | Renter-occupied |
| Less than High School | 40 (24.5%) | 123 (75.5%) |
| High School Diploma | 447 (54.2%) | 377 (45.8%) |
| College/Associate Degree | 668 (70.2%) | 284 (29.8%) |
| Bachelor's Degree or higher | 423 (71.0%) | 173 (29.0%) |
Occupancy by Age of Householder in Algona
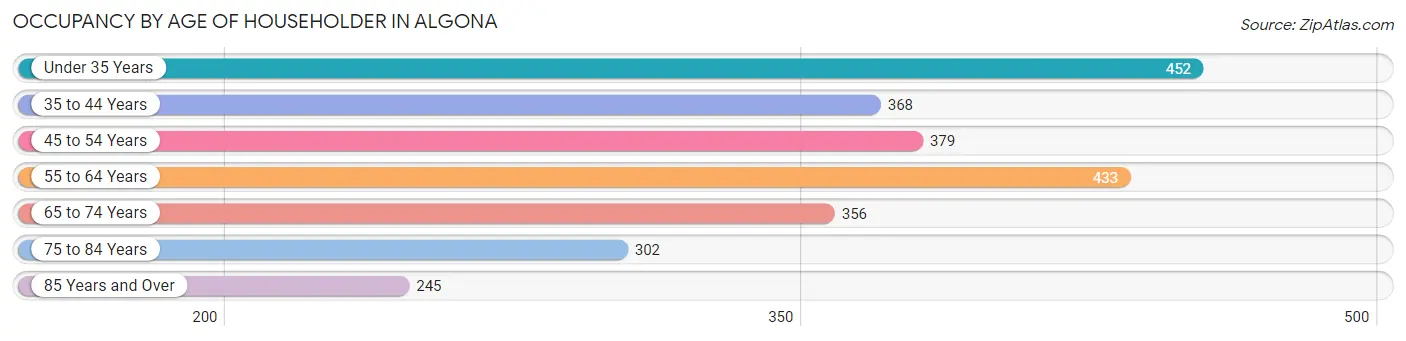
| Age Bracket | # Households | % Households |
| Under 35 Years | 452 | 17.8% |
| 35 to 44 Years | 368 | 14.5% |
| 45 to 54 Years | 379 | 14.9% |
| 55 to 64 Years | 433 | 17.1% |
| 65 to 74 Years | 356 | 14.0% |
| 75 to 84 Years | 302 | 11.9% |
| 85 Years and Over | 245 | 9.7% |
| Total | 2,535 | 100.0% |
Housing Finances in Algona
Median Income by Occupancy in Algona
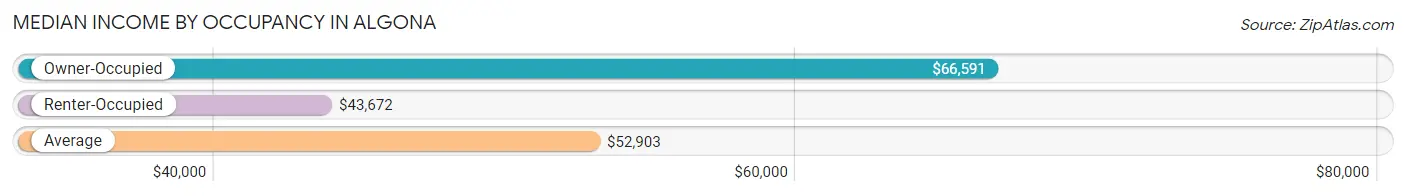
| Occupancy Type | # Households | Median Income |
| Owner-Occupied | 1,578 (62.3%) | $66,591 |
| Renter-Occupied | 957 (37.8%) | $43,672 |
| Average | 2,535 (100.0%) | $52,903 |
Occupancy by Householder Income Bracket in Algona
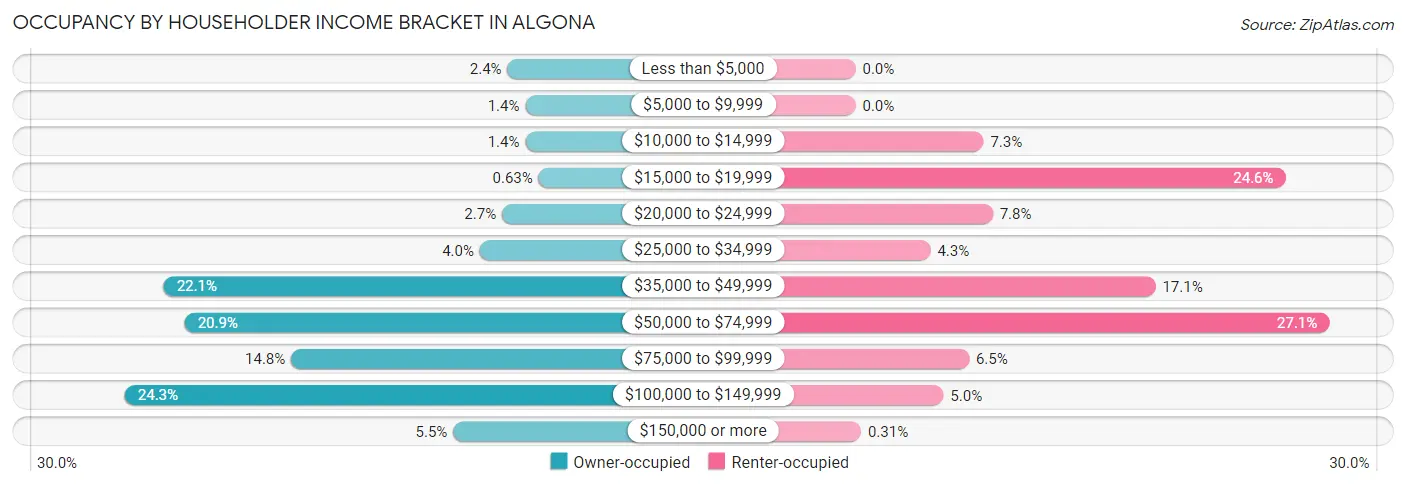
| Income Bracket | Owner-occupied | Renter-occupied |
| Less than $5,000 | 38 (2.4%) | 0 (0.0%) |
| $5,000 to $9,999 | 22 (1.4%) | 0 (0.0%) |
| $10,000 to $14,999 | 22 (1.4%) | 70 (7.3%) |
| $15,000 to $19,999 | 10 (0.6%) | 235 (24.6%) |
| $20,000 to $24,999 | 43 (2.7%) | 75 (7.8%) |
| $25,000 to $34,999 | 63 (4.0%) | 41 (4.3%) |
| $35,000 to $49,999 | 348 (22.1%) | 164 (17.1%) |
| $50,000 to $74,999 | 329 (20.8%) | 259 (27.1%) |
| $75,000 to $99,999 | 233 (14.8%) | 62 (6.5%) |
| $100,000 to $149,999 | 383 (24.3%) | 48 (5.0%) |
| $150,000 or more | 87 (5.5%) | 3 (0.3%) |
| Total | 1,578 (100.0%) | 957 (100.0%) |
Monthly Housing Cost Tiers in Algona
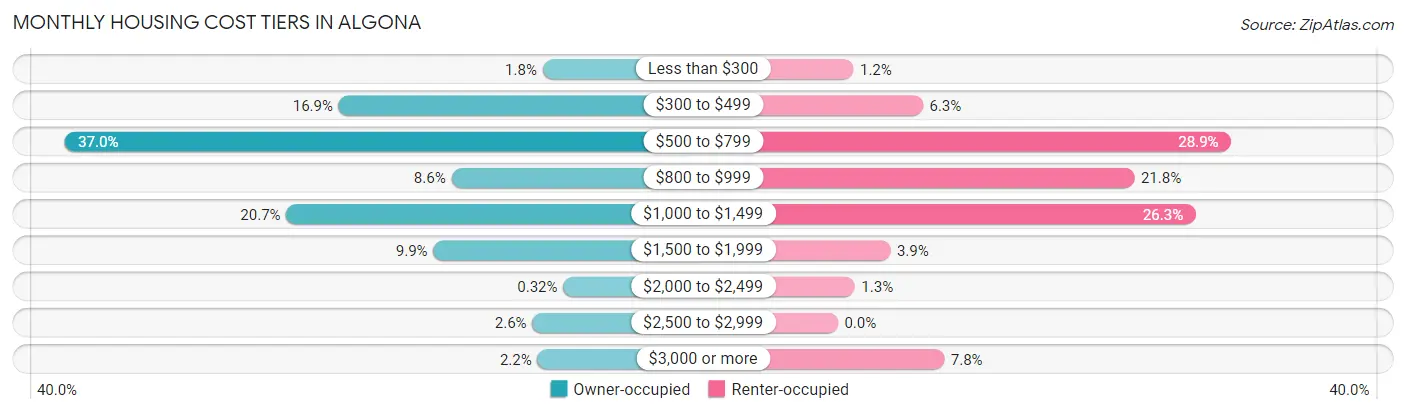
| Monthly Cost | Owner-occupied | Renter-occupied |
| Less than $300 | 29 (1.8%) | 11 (1.1%) |
| $300 to $499 | 266 (16.9%) | 60 (6.3%) |
| $500 to $799 | 584 (37.0%) | 277 (28.9%) |
| $800 to $999 | 135 (8.6%) | 209 (21.8%) |
| $1,000 to $1,499 | 327 (20.7%) | 252 (26.3%) |
| $1,500 to $1,999 | 156 (9.9%) | 37 (3.9%) |
| $2,000 to $2,499 | 5 (0.3%) | 12 (1.3%) |
| $2,500 to $2,999 | 41 (2.6%) | 0 (0.0%) |
| $3,000 or more | 35 (2.2%) | 75 (7.8%) |
| Total | 1,578 (100.0%) | 957 (100.0%) |
Physical Housing Characteristics in Algona
Housing Structures in Algona
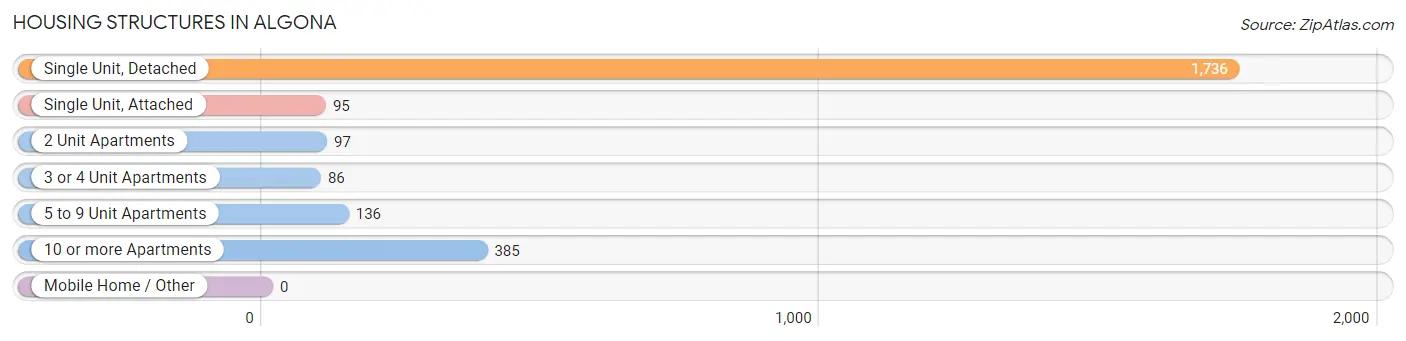
| Structure Type | # Housing Units | % Housing Units |
| Single Unit, Detached | 1,736 | 68.5% |
| Single Unit, Attached | 95 | 3.7% |
| 2 Unit Apartments | 97 | 3.8% |
| 3 or 4 Unit Apartments | 86 | 3.4% |
| 5 to 9 Unit Apartments | 136 | 5.4% |
| 10 or more Apartments | 385 | 15.2% |
| Mobile Home / Other | 0 | 0.0% |
| Total | 2,535 | 100.0% |
Housing Structures by Occupancy in Algona
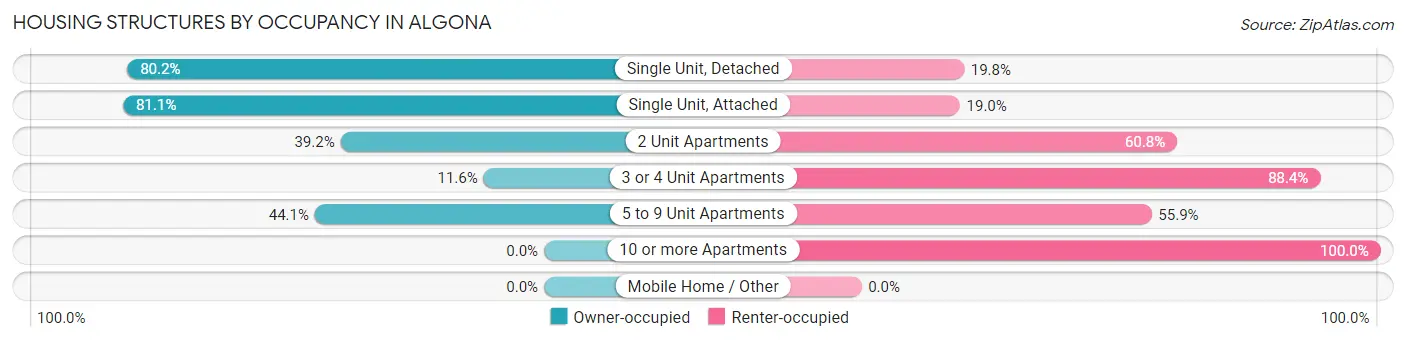
| Structure Type | Owner-occupied | Renter-occupied |
| Single Unit, Detached | 1,393 (80.2%) | 343 (19.8%) |
| Single Unit, Attached | 77 (81.0%) | 18 (19.0%) |
| 2 Unit Apartments | 38 (39.2%) | 59 (60.8%) |
| 3 or 4 Unit Apartments | 10 (11.6%) | 76 (88.4%) |
| 5 to 9 Unit Apartments | 60 (44.1%) | 76 (55.9%) |
| 10 or more Apartments | 0 (0.0%) | 385 (100.0%) |
| Mobile Home / Other | 0 (0.0%) | 0 (0.0%) |
| Total | 1,578 (62.3%) | 957 (37.8%) |
Housing Structures by Number of Rooms in Algona

| Number of Rooms | Owner-occupied | Renter-occupied |
| 1 Room | 0 (0.0%) | 0 (0.0%) |
| 2 or 3 Rooms | 36 (2.3%) | 333 (34.8%) |
| 4 or 5 Rooms | 505 (32.0%) | 413 (43.2%) |
| 6 or 7 Rooms | 509 (32.3%) | 167 (17.4%) |
| 8 or more Rooms | 528 (33.5%) | 44 (4.6%) |
| Total | 1,578 (100.0%) | 957 (100.0%) |
Housing Structure by Heating Type in Algona
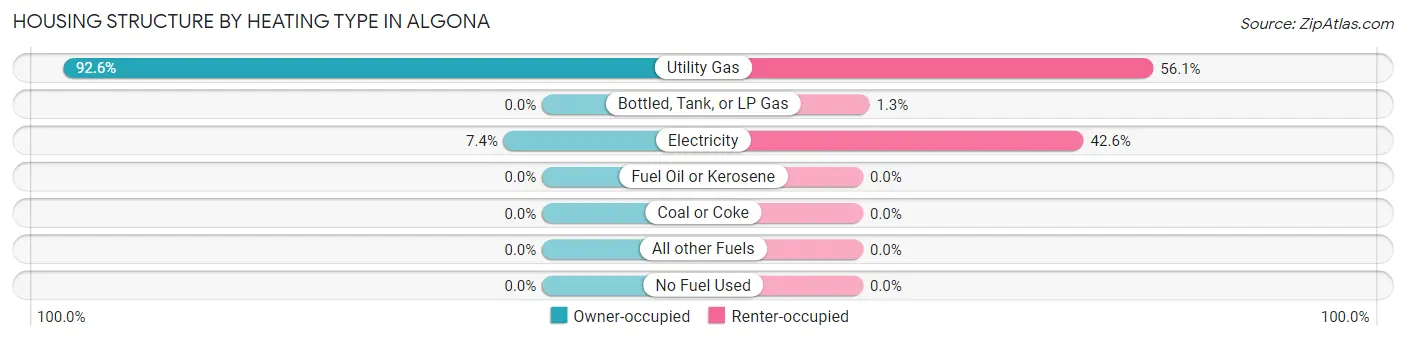
| Heating Type | Owner-occupied | Renter-occupied |
| Utility Gas | 1,461 (92.6%) | 537 (56.1%) |
| Bottled, Tank, or LP Gas | 0 (0.0%) | 12 (1.3%) |
| Electricity | 117 (7.4%) | 408 (42.6%) |
| Fuel Oil or Kerosene | 0 (0.0%) | 0 (0.0%) |
| Coal or Coke | 0 (0.0%) | 0 (0.0%) |
| All other Fuels | 0 (0.0%) | 0 (0.0%) |
| No Fuel Used | 0 (0.0%) | 0 (0.0%) |
| Total | 1,578 (100.0%) | 957 (100.0%) |
Household Vehicle Usage in Algona
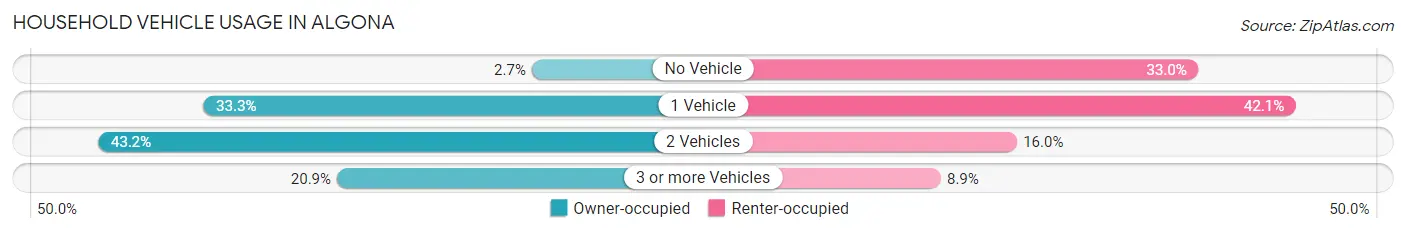
| Vehicles per Household | Owner-occupied | Renter-occupied |
| No Vehicle | 42 (2.7%) | 316 (33.0%) |
| 1 Vehicle | 526 (33.3%) | 403 (42.1%) |
| 2 Vehicles | 681 (43.2%) | 153 (16.0%) |
| 3 or more Vehicles | 329 (20.8%) | 85 (8.9%) |
| Total | 1,578 (100.0%) | 957 (100.0%) |
Real Estate & Mortgages in Algona
Real Estate and Mortgage Overview in Algona
| Characteristic | Without Mortgage | With Mortgage |
| Housing Units | 728 | 850 |
| Median Property Value | $156,000 | $136,700 |
| Median Household Income | $52,368 | $69 |
| Monthly Housing Costs | $568 | $35 |
| Real Estate Taxes | $2,482 | $55 |
Property Value by Mortgage Status in Algona
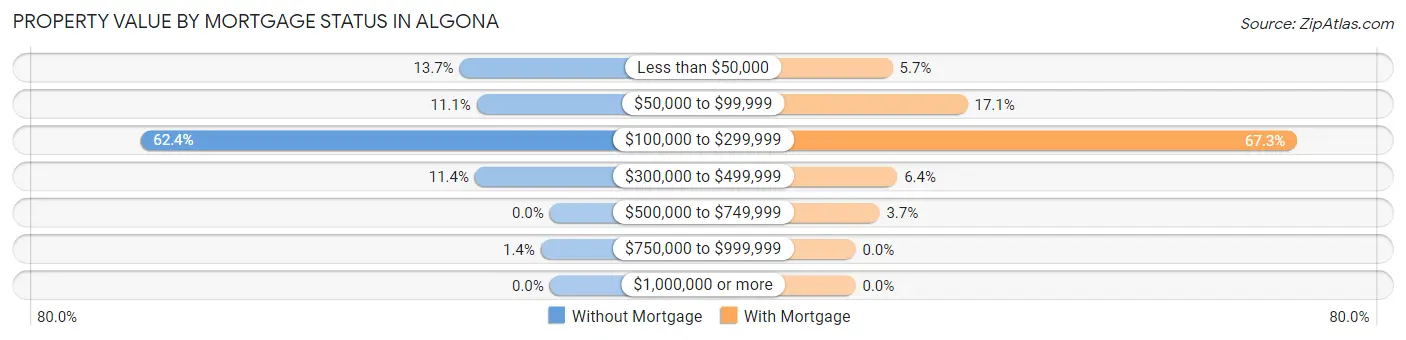
| Property Value | Without Mortgage | With Mortgage |
| Less than $50,000 | 100 (13.7%) | 48 (5.7%) |
| $50,000 to $99,999 | 81 (11.1%) | 145 (17.1%) |
| $100,000 to $299,999 | 454 (62.4%) | 572 (67.3%) |
| $300,000 to $499,999 | 83 (11.4%) | 54 (6.4%) |
| $500,000 to $749,999 | 0 (0.0%) | 31 (3.6%) |
| $750,000 to $999,999 | 10 (1.4%) | 0 (0.0%) |
| $1,000,000 or more | 0 (0.0%) | 0 (0.0%) |
| Total | 728 (100.0%) | 850 (100.0%) |
Household Income by Mortgage Status in Algona
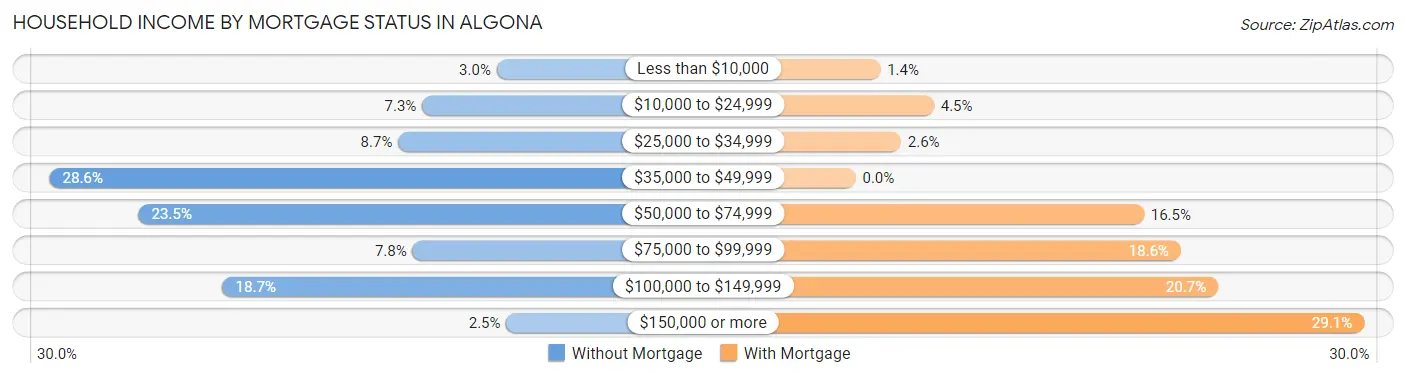
| Household Income | Without Mortgage | With Mortgage |
| Less than $10,000 | 22 (3.0%) | 12 (1.4%) |
| $10,000 to $24,999 | 53 (7.3%) | 38 (4.5%) |
| $25,000 to $34,999 | 63 (8.6%) | 22 (2.6%) |
| $35,000 to $49,999 | 208 (28.6%) | 0 (0.0%) |
| $50,000 to $74,999 | 171 (23.5%) | 140 (16.5%) |
| $75,000 to $99,999 | 57 (7.8%) | 158 (18.6%) |
| $100,000 to $149,999 | 136 (18.7%) | 176 (20.7%) |
| $150,000 or more | 18 (2.5%) | 247 (29.1%) |
| Total | 728 (100.0%) | 850 (100.0%) |
Property Value to Household Income Ratio in Algona
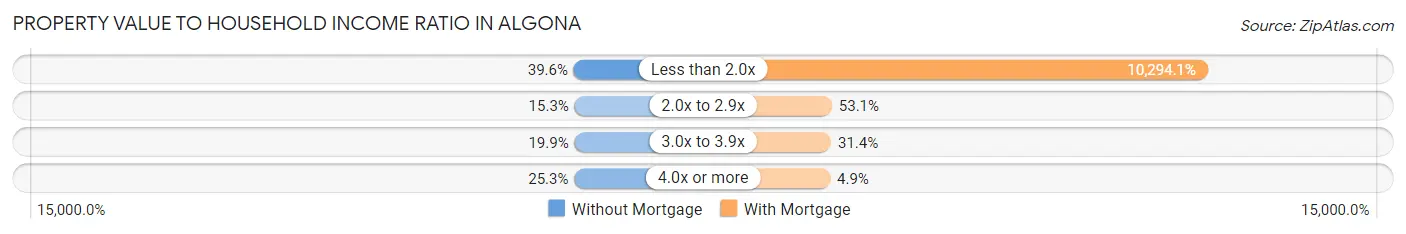
| Value-to-Income Ratio | Without Mortgage | With Mortgage |
| Less than 2.0x | 288 (39.6%) | 87,500 (10,294.1%) |
| 2.0x to 2.9x | 111 (15.2%) | 451 (53.1%) |
| 3.0x to 3.9x | 145 (19.9%) | 267 (31.4%) |
| 4.0x or more | 184 (25.3%) | 42 (4.9%) |
| Total | 728 (100.0%) | 850 (100.0%) |
Real Estate Taxes by Mortgage Status in Algona
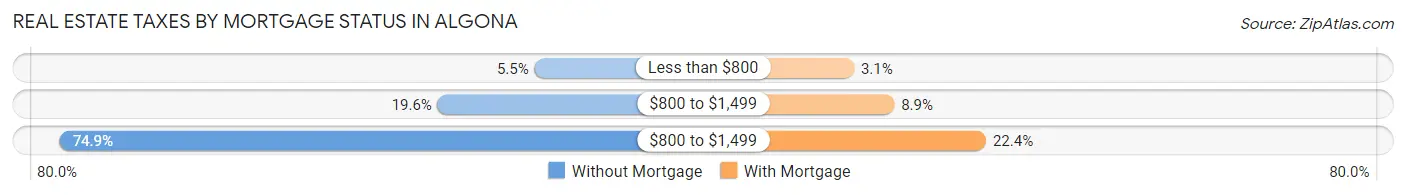
| Property Taxes | Without Mortgage | With Mortgage |
| Less than $800 | 40 (5.5%) | 26 (3.1%) |
| $800 to $1,499 | 143 (19.6%) | 76 (8.9%) |
| $800 to $1,499 | 545 (74.9%) | 190 (22.4%) |
| Total | 728 (100.0%) | 850 (100.0%) |
Health & Disability in Algona
Health Insurance Coverage by Age in Algona
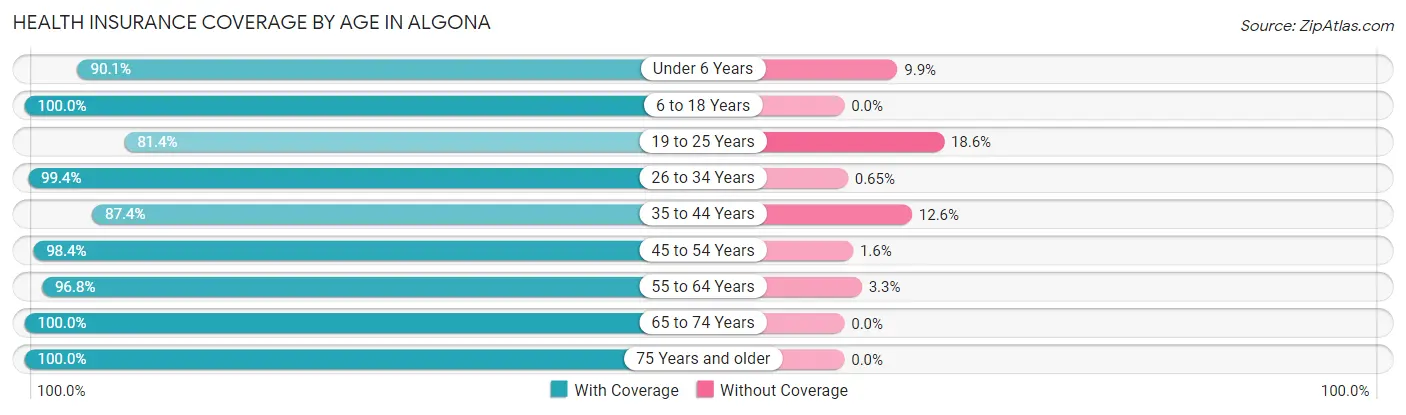
| Age Bracket | With Coverage | Without Coverage |
| Under 6 Years | 328 (90.1%) | 36 (9.9%) |
| 6 to 18 Years | 749 (100.0%) | 0 (0.0%) |
| 19 to 25 Years | 368 (81.4%) | 84 (18.6%) |
| 26 to 34 Years | 456 (99.4%) | 3 (0.6%) |
| 35 to 44 Years | 631 (87.4%) | 91 (12.6%) |
| 45 to 54 Years | 550 (98.4%) | 9 (1.6%) |
| 55 to 64 Years | 654 (96.8%) | 22 (3.3%) |
| 65 to 74 Years | 539 (100.0%) | 0 (0.0%) |
| 75 Years and older | 729 (100.0%) | 0 (0.0%) |
| Total | 5,004 (95.3%) | 245 (4.7%) |
Health Insurance Coverage by Citizenship Status in Algona
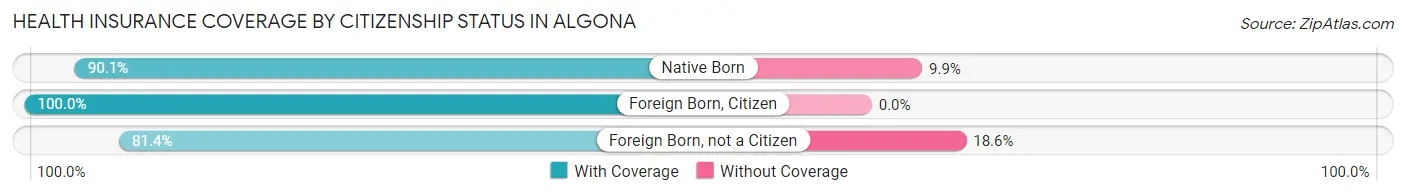
| Citizenship Status | With Coverage | Without Coverage |
| Native Born | 328 (90.1%) | 36 (9.9%) |
| Foreign Born, Citizen | 749 (100.0%) | 0 (0.0%) |
| Foreign Born, not a Citizen | 368 (81.4%) | 84 (18.6%) |
Health Insurance Coverage by Household Income in Algona
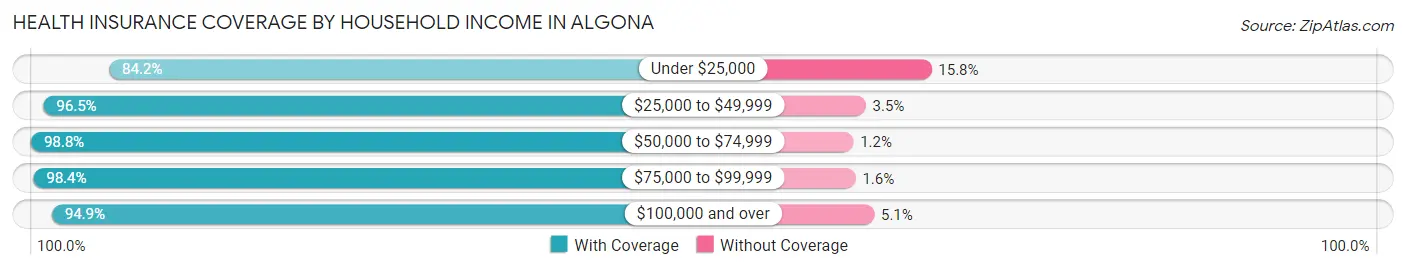
| Household Income | With Coverage | Without Coverage |
| Under $25,000 | 563 (84.2%) | 106 (15.8%) |
| $25,000 to $49,999 | 875 (96.5%) | 32 (3.5%) |
| $50,000 to $74,999 | 1,150 (98.8%) | 14 (1.2%) |
| $75,000 to $99,999 | 965 (98.4%) | 16 (1.6%) |
| $100,000 and over | 1,434 (94.9%) | 77 (5.1%) |
Public vs Private Health Insurance Coverage by Age in Algona
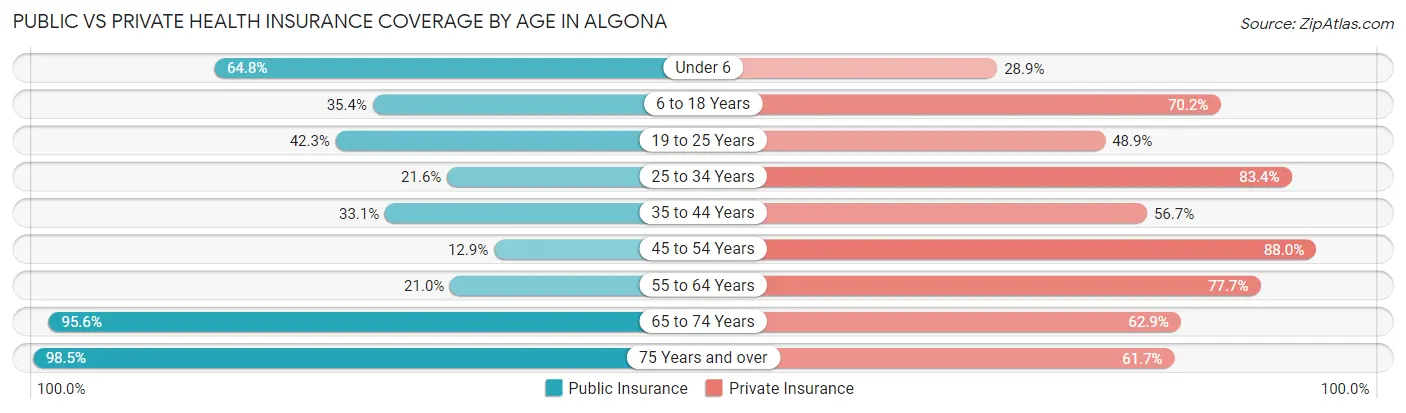
| Age Bracket | Public Insurance | Private Insurance |
| Under 6 | 236 (64.8%) | 105 (28.8%) |
| 6 to 18 Years | 265 (35.4%) | 526 (70.2%) |
| 19 to 25 Years | 191 (42.3%) | 221 (48.9%) |
| 25 to 34 Years | 99 (21.6%) | 383 (83.4%) |
| 35 to 44 Years | 239 (33.1%) | 409 (56.7%) |
| 45 to 54 Years | 72 (12.9%) | 492 (88.0%) |
| 55 to 64 Years | 142 (21.0%) | 525 (77.7%) |
| 65 to 74 Years | 515 (95.6%) | 339 (62.9%) |
| 75 Years and over | 718 (98.5%) | 450 (61.7%) |
| Total | 2,477 (47.2%) | 3,450 (65.7%) |
Disability Status by Sex by Age in Algona
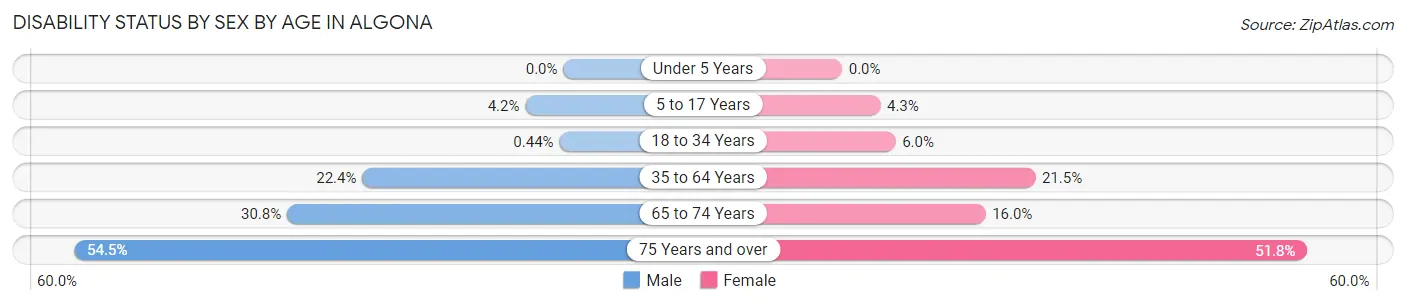
| Age Bracket | Male | Female |
| Under 5 Years | 0 (0.0%) | 0 (0.0%) |
| 5 to 17 Years | 16 (4.2%) | 14 (4.3%) |
| 18 to 34 Years | 2 (0.4%) | 32 (5.9%) |
| 35 to 64 Years | 229 (22.4%) | 201 (21.5%) |
| 65 to 74 Years | 56 (30.8%) | 57 (16.0%) |
| 75 Years and over | 146 (54.5%) | 239 (51.8%) |
Disability Class by Sex by Age in Algona
Disability Class: Hearing Difficulty
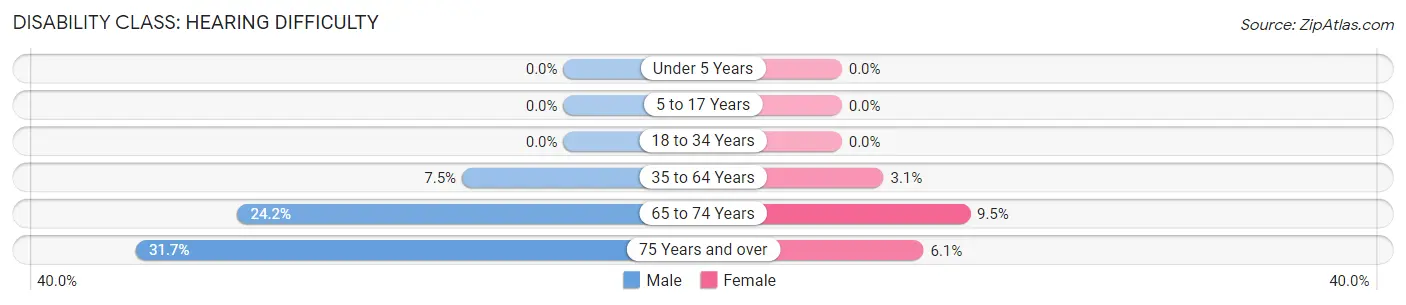
| Age Bracket | Male | Female |
| Under 5 Years | 0 (0.0%) | 0 (0.0%) |
| 5 to 17 Years | 0 (0.0%) | 0 (0.0%) |
| 18 to 34 Years | 0 (0.0%) | 0 (0.0%) |
| 35 to 64 Years | 77 (7.5%) | 29 (3.1%) |
| 65 to 74 Years | 44 (24.2%) | 34 (9.5%) |
| 75 Years and over | 85 (31.7%) | 28 (6.1%) |
Disability Class: Vision Difficulty
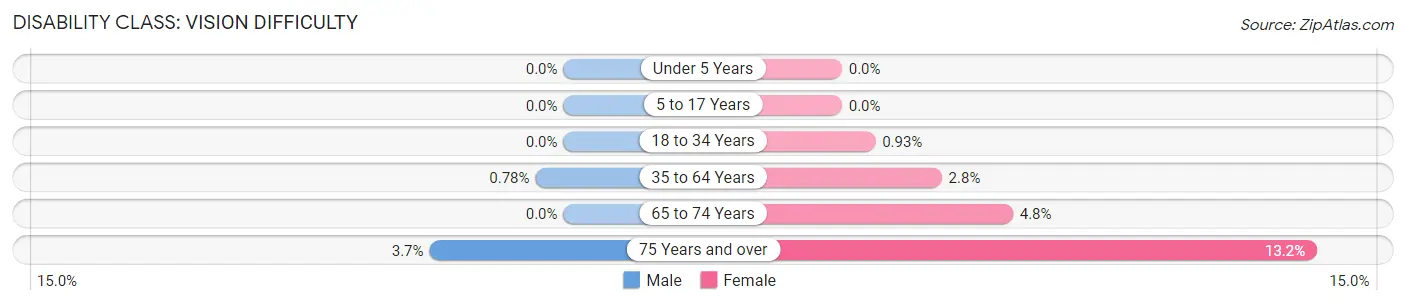
| Age Bracket | Male | Female |
| Under 5 Years | 0 (0.0%) | 0 (0.0%) |
| 5 to 17 Years | 0 (0.0%) | 0 (0.0%) |
| 18 to 34 Years | 0 (0.0%) | 5 (0.9%) |
| 35 to 64 Years | 8 (0.8%) | 26 (2.8%) |
| 65 to 74 Years | 0 (0.0%) | 17 (4.8%) |
| 75 Years and over | 10 (3.7%) | 61 (13.2%) |
Disability Class: Cognitive Difficulty
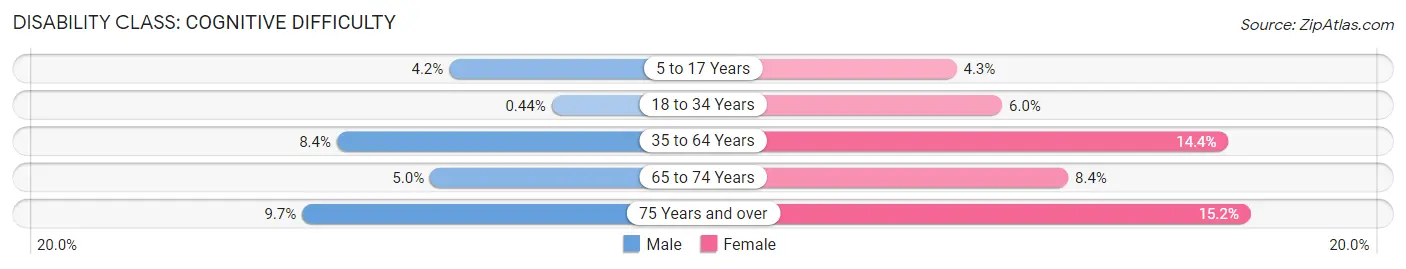
| Age Bracket | Male | Female |
| 5 to 17 Years | 16 (4.2%) | 14 (4.3%) |
| 18 to 34 Years | 2 (0.4%) | 32 (5.9%) |
| 35 to 64 Years | 86 (8.4%) | 134 (14.3%) |
| 65 to 74 Years | 9 (5.0%) | 30 (8.4%) |
| 75 Years and over | 26 (9.7%) | 70 (15.2%) |
Disability Class: Ambulatory Difficulty
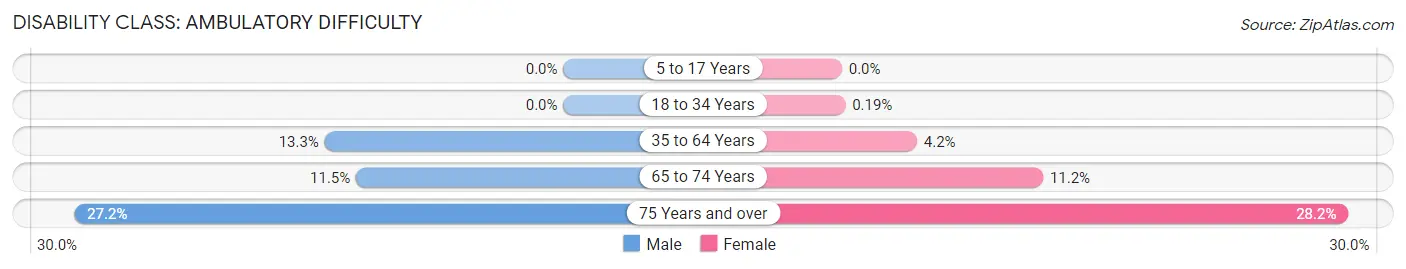
| Age Bracket | Male | Female |
| 5 to 17 Years | 0 (0.0%) | 0 (0.0%) |
| 18 to 34 Years | 0 (0.0%) | 1 (0.2%) |
| 35 to 64 Years | 136 (13.3%) | 39 (4.2%) |
| 65 to 74 Years | 21 (11.5%) | 40 (11.2%) |
| 75 Years and over | 73 (27.2%) | 130 (28.2%) |
Disability Class: Self-Care Difficulty
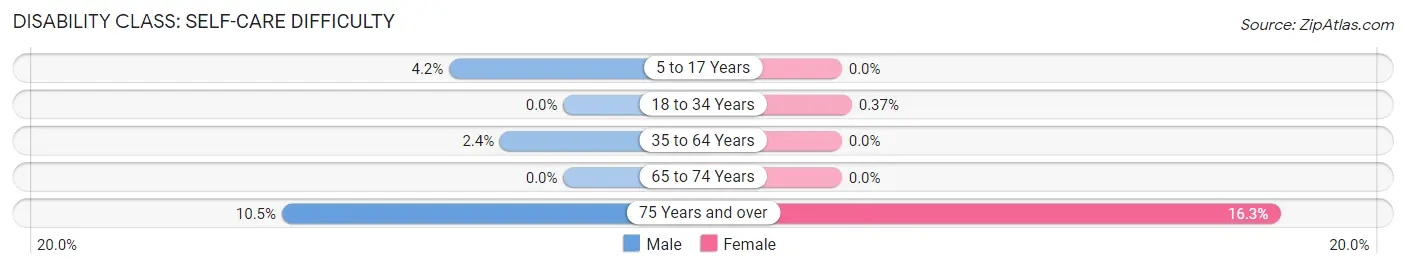
| Age Bracket | Male | Female |
| 5 to 17 Years | 16 (4.2%) | 0 (0.0%) |
| 18 to 34 Years | 0 (0.0%) | 2 (0.4%) |
| 35 to 64 Years | 24 (2.4%) | 0 (0.0%) |
| 65 to 74 Years | 0 (0.0%) | 0 (0.0%) |
| 75 Years and over | 28 (10.4%) | 75 (16.3%) |
Technology Access in Algona
Computing Device Access in Algona
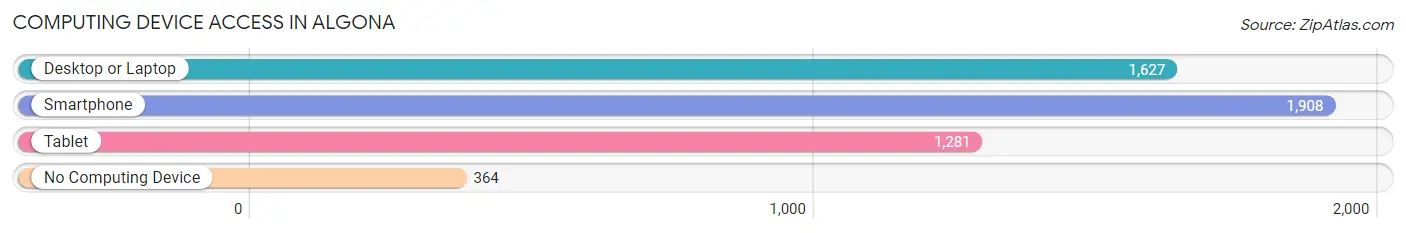
| Device Type | # Households | % Households |
| Desktop or Laptop | 1,627 | 64.2% |
| Smartphone | 1,908 | 75.3% |
| Tablet | 1,281 | 50.5% |
| No Computing Device | 364 | 14.4% |
| Total | 2,535 | 100.0% |
Internet Access in Algona
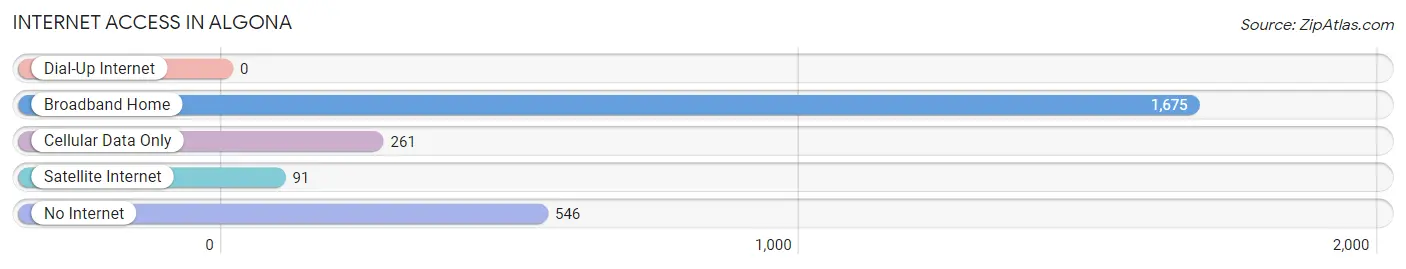
| Internet Type | # Households | % Households |
| Dial-Up Internet | 0 | 0.0% |
| Broadband Home | 1,675 | 66.1% |
| Cellular Data Only | 261 | 10.3% |
| Satellite Internet | 91 | 3.6% |
| No Internet | 546 | 21.5% |
| Total | 2,535 | 100.0% |
Algona Summary
Algona is a city located in Kossuth County, Iowa, United States. It is the county seat of Kossuth County and is located along the East Fork of the Des Moines River. The population was 5,560 at the 2010 census.
History
Algona was founded in 1854 by settlers from New England. The town was named after the Algonquin Indians, who were the original inhabitants of the area. The first settlers were mostly farmers and the town quickly grew to become a center of commerce and industry. The first post office was established in 1856 and the first newspaper, the Algona Courier, was established in 1858.
In 1867, the Chicago, Milwaukee & St. Paul Railroad arrived in Algona, connecting the town to the rest of the country. This allowed for the growth of the town and the establishment of several businesses, including a flour mill, a sawmill, a brickyard, and a brewery.
In 1872, the town was incorporated and the first mayor was elected. The town continued to grow and by the early 1900s, Algona had become a major agricultural center. The town was also home to several manufacturing companies, including a furniture factory, a canning factory, and a creamery.
Geography
Algona is located at the intersection of U.S. Route 169 and Iowa Highway 18 in Kossuth County. The city is situated on the East Fork of the Des Moines River and is surrounded by rolling hills and farmland. The city has a total area of 4.2 square miles, all of which is land.
Economy
Algona’s economy is largely based on agriculture and manufacturing. The city is home to several large agricultural companies, including Pioneer Hi-Bred International, Inc., a seed company, and Algona Feed & Grain, a feed mill. The city is also home to several manufacturing companies, including a furniture factory, a canning factory, and a creamery.
The city is also home to several retail stores, restaurants, and other businesses. The city is served by the Algona Municipal Airport, which offers flights to several cities in Iowa and Minnesota.
Demographics
As of the 2010 census, there were 5,560 people, 2,269 households, and 1,521 families residing in the city. The population density was 1,323.3 people per square mile. The racial makeup of the city was 97.2% White, 0.3% African American, 0.3% Native American, 0.4% Asian, 0.1% Pacific Islander, 0.7% from other races, and 0.9% from two or more races. Hispanic or Latino of any race were 2.2% of the population.
The median income for a household in the city was $41,944, and the median income for a family was $50,944. The per capita income for the city was $20,944. About 8.2% of families and 10.2% of the population were below the poverty line, including 14.2% of those under age 18 and 8.2% of those age 65 or over.
Common Questions
What is Per Capita Income in Algona?
Per Capita income in Algona is $32,410.
What is the Median Family Income in Algona?
Median Family Income in Algona is $68,833.
What is the Median Household income in Algona?
Median Household Income in Algona is $52,903.
What is Income or Wage Gap in Algona?
Income or Wage Gap in Algona is 40.0%.
Women in Algona earn 60.0 cents for every dollar earned by a man.
What is Inequality or Gini Index in Algona?
Inequality or Gini Index in Algona is 0.37.
What is the Total Population of Algona?
Total Population of Algona is 5,443.
What is the Total Male Population of Algona?
Total Male Population of Algona is 2,552.
What is the Total Female Population of Algona?
Total Female Population of Algona is 2,891.
What is the Ratio of Males per 100 Females in Algona?
There are 88.27 Males per 100 Females in Algona.
What is the Ratio of Females per 100 Males in Algona?
There are 113.28 Females per 100 Males in Algona.
What is the Median Population Age in Algona?
Median Population Age in Algona is 43.6 Years.
What is the Average Family Size in Algona
Average Family Size in Algona is 2.9 People.
What is the Average Household Size in Algona
Average Household Size in Algona is 2.1 People.
How Large is the Labor Force in Algona?
There are 2,680 People in the Labor Forcein in Algona.
What is the Percentage of People in the Labor Force in Algona?
59.3% of People are in the Labor Force in Algona.
What is the Unemployment Rate in Algona?
Unemployment Rate in Algona is 5.5%.