Albert City, IA Map & Demographics
Albert City Map
Albert City Overview
$36,348
PER CAPITA INCOME
$83,906
AVG FAMILY INCOME
$71,667
AVG HOUSEHOLD INCOME
55.4%
WAGE / INCOME GAP [ % ]
44.6¢/ $1
WAGE / INCOME GAP [ $ ]
0.44
INEQUALITY / GINI INDEX
666
TOTAL POPULATION
359
MALE POPULATION
307
FEMALE POPULATION
116.94
MALES / 100 FEMALES
85.52
FEMALES / 100 MALES
45.8
MEDIAN AGE
2.8
AVG FAMILY SIZE
2.2
AVG HOUSEHOLD SIZE
348
LABOR FORCE [ PEOPLE ]
61.7%
PERCENT IN LABOR FORCE
5.2%
UNEMPLOYMENT RATE
Albert City Zip Codes
Albert City Area Codes
Income in Albert City
Income Overview in Albert City
Per Capita Income in Albert City is $36,348, while median incomes of families and households are $83,906 and $71,667 respectively.
| Characteristic | Number | Measure |
| Per Capita Income | 666 | $36,348 |
| Median Family Income | 173 | $83,906 |
| Mean Family Income | 173 | $122,161 |
| Median Household Income | 280 | $71,667 |
| Mean Household Income | 280 | $97,686 |
| Income Deficit | 173 | $0 |
| Wage / Income Gap (%) | 666 | 55.44% |
| Wage / Income Gap ($) | 666 | 44.56¢ per $1 |
| Gini / Inequality Index | 666 | 0.44 |
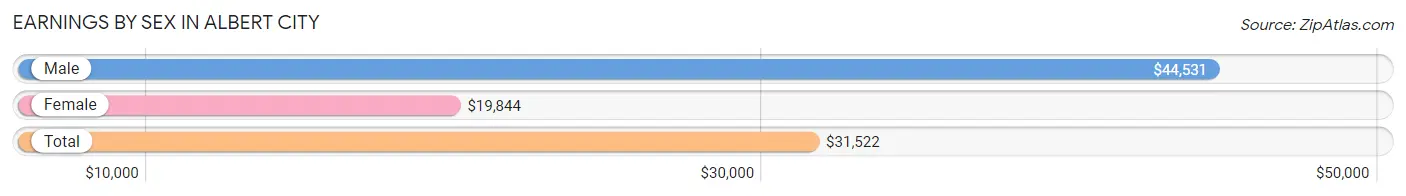
Earnings by Sex in Albert City
Average Earnings in Albert City are $31,522, $44,531 for men and $19,844 for women, a difference of 55.4%.
| Sex | Number | Average Earnings |
| Male | 199 (54.1%) | $44,531 |
| Female | 169 (45.9%) | $19,844 |
| Total | 368 (100.0%) | $31,522 |
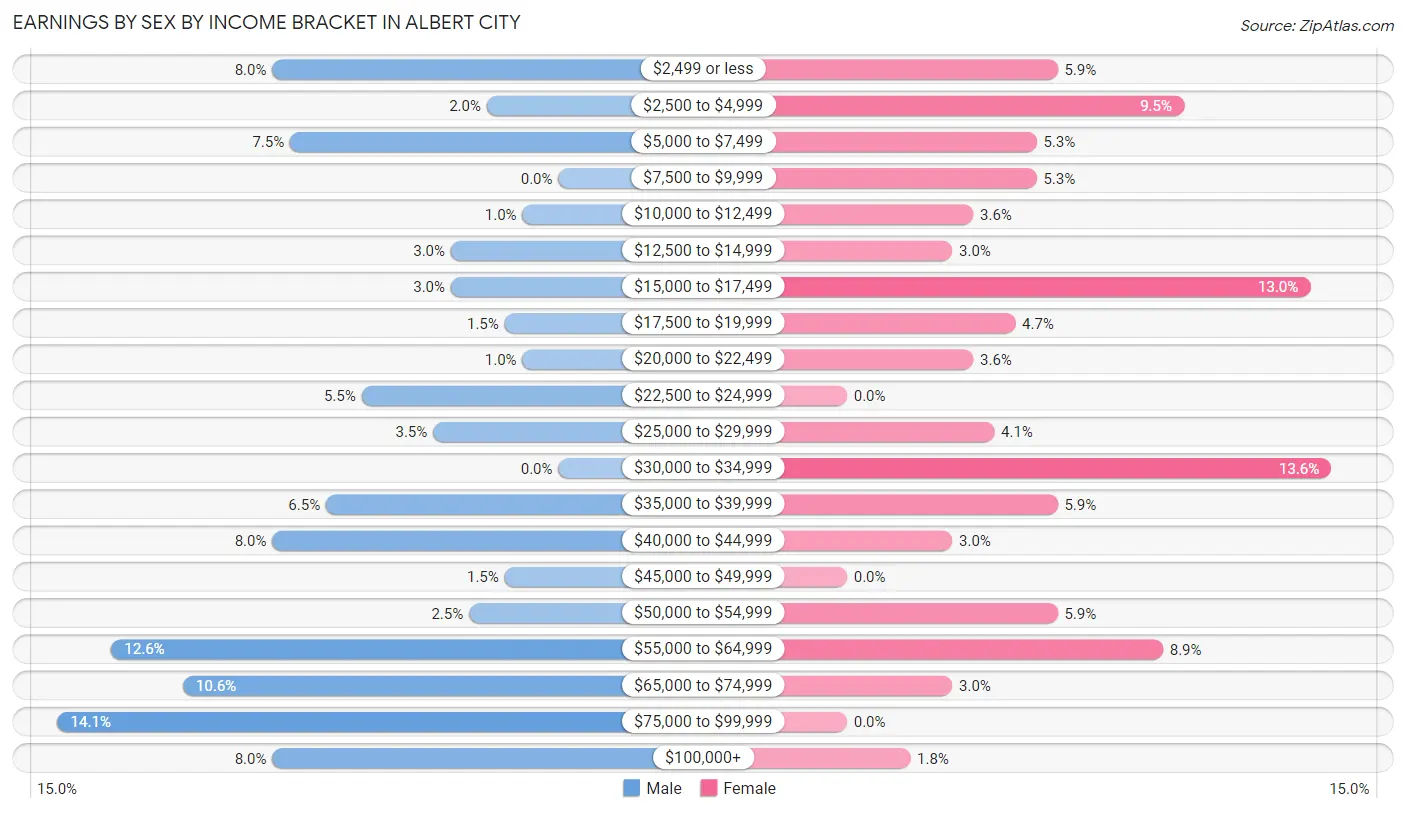
Earnings by Sex by Income Bracket in Albert City
The most common earnings brackets in Albert City are $75,000 to $99,999 for men (28 | 14.1%) and $30,000 to $34,999 for women (23 | 13.6%).
| Income | Male | Female |
| $2,499 or less | 16 (8.0%) | 10 (5.9%) |
| $2,500 to $4,999 | 4 (2.0%) | 16 (9.5%) |
| $5,000 to $7,499 | 15 (7.5%) | 9 (5.3%) |
| $7,500 to $9,999 | 0 (0.0%) | 9 (5.3%) |
| $10,000 to $12,499 | 2 (1.0%) | 6 (3.5%) |
| $12,500 to $14,999 | 6 (3.0%) | 5 (3.0%) |
| $15,000 to $17,499 | 6 (3.0%) | 22 (13.0%) |
| $17,500 to $19,999 | 3 (1.5%) | 8 (4.7%) |
| $20,000 to $22,499 | 2 (1.0%) | 6 (3.5%) |
| $22,500 to $24,999 | 11 (5.5%) | 0 (0.0%) |
| $25,000 to $29,999 | 7 (3.5%) | 7 (4.1%) |
| $30,000 to $34,999 | 0 (0.0%) | 23 (13.6%) |
| $35,000 to $39,999 | 13 (6.5%) | 10 (5.9%) |
| $40,000 to $44,999 | 16 (8.0%) | 5 (3.0%) |
| $45,000 to $49,999 | 3 (1.5%) | 0 (0.0%) |
| $50,000 to $54,999 | 5 (2.5%) | 10 (5.9%) |
| $55,000 to $64,999 | 25 (12.6%) | 15 (8.9%) |
| $65,000 to $74,999 | 21 (10.5%) | 5 (3.0%) |
| $75,000 to $99,999 | 28 (14.1%) | 0 (0.0%) |
| $100,000+ | 16 (8.0%) | 3 (1.8%) |
| Total | 199 (100.0%) | 169 (100.0%) |
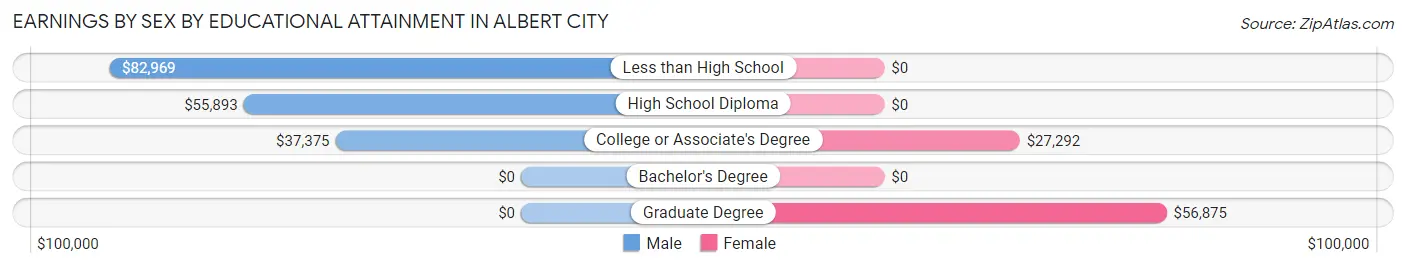
Earnings by Sex by Educational Attainment in Albert City
Average earnings in Albert City are $49,167 for men and $25,833 for women, a difference of 47.5%. Men with an educational attainment of less than high school enjoy the highest average annual earnings of $82,969, while those with college or associate's degree education earn the least with $37,375. Women with an educational attainment of graduate degree earn the most with the average annual earnings of $56,875, while those with college or associate's degree education have the smallest earnings of $27,292.
| Educational Attainment | Male Income | Female Income |
| Less than High School | $82,969 | $0 |
| High School Diploma | $55,893 | $0 |
| College or Associate's Degree | $37,375 | $27,292 |
| Bachelor's Degree | - | - |
| Graduate Degree | - | - |
| Total | $49,167 | $25,833 |
Family Income in Albert City
Family Income Brackets in Albert City
According to the Albert City family income data, there are 50 families falling into the $50,000 to $74,999 income range, which is the most common income bracket and makes up 28.9% of all families.
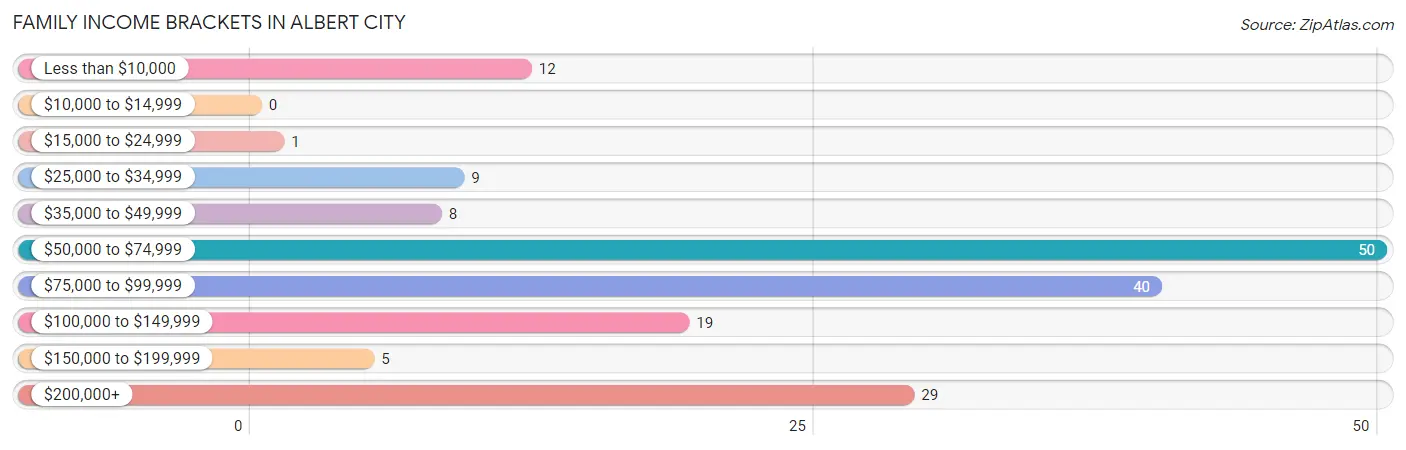
| Income Bracket | # Families | % Families |
| Less than $10,000 | 12 | 6.9% |
| $10,000 to $14,999 | 0 | 0.0% |
| $15,000 to $24,999 | 1 | 0.6% |
| $25,000 to $34,999 | 9 | 5.2% |
| $35,000 to $49,999 | 8 | 4.6% |
| $50,000 to $74,999 | 50 | 28.9% |
| $75,000 to $99,999 | 40 | 23.1% |
| $100,000 to $149,999 | 19 | 11.0% |
| $150,000 to $199,999 | 5 | 2.9% |
| $200,000+ | 29 | 16.8% |
Family Income by Famaliy Size in Albert City
5-person families (10 | 5.8%) account for the highest median family income in Albert City with $108,750 per family, while 2-person families (109 | 63.0%) have the highest median income of $44,375 per family member.
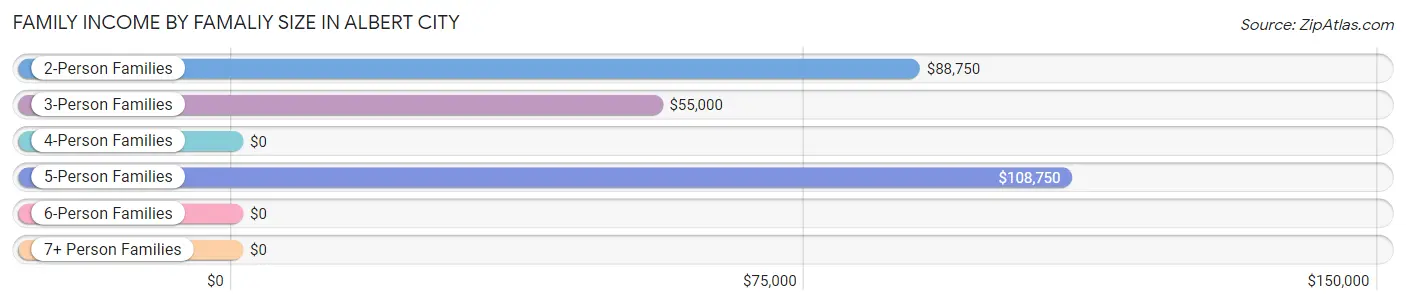
| Income Bracket | # Families | Median Income |
| 2-Person Families | 109 (63.0%) | $88,750 |
| 3-Person Families | 28 (16.2%) | $55,000 |
| 4-Person Families | 26 (15.0%) | $0 |
| 5-Person Families | 10 (5.8%) | $108,750 |
| 6-Person Families | 0 (0.0%) | $0 |
| 7+ Person Families | 0 (0.0%) | $0 |
| Total | 173 (100.0%) | $83,906 |
Family Income by Number of Earners in Albert City
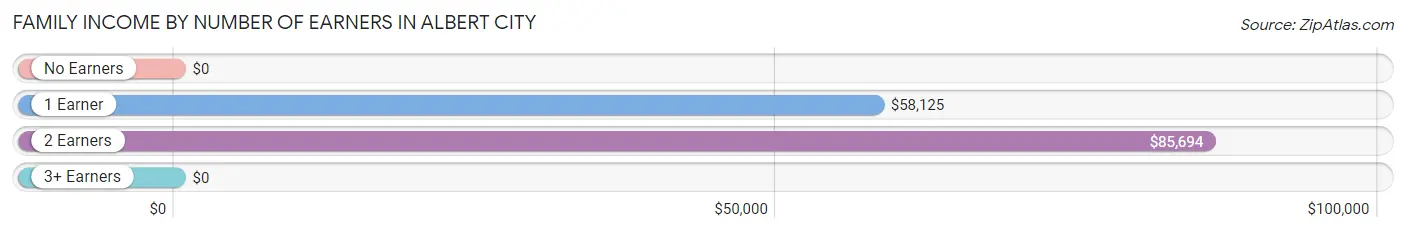
| Number of Earners | # Families | Median Income |
| No Earners | 47 (27.2%) | $0 |
| 1 Earner | 45 (26.0%) | $58,125 |
| 2 Earners | 73 (42.2%) | $85,694 |
| 3+ Earners | 8 (4.6%) | $0 |
| Total | 173 (100.0%) | $83,906 |
Household Income in Albert City
Household Income Brackets in Albert City
With 90 households falling in the category, the $50,000 to $74,999 income range is the most frequent in Albert City, accounting for 32.1% of all households. In contrast, only 5 households (1.8%) fall into the $10,000 to $14,999 income bracket, making it the least populous group.
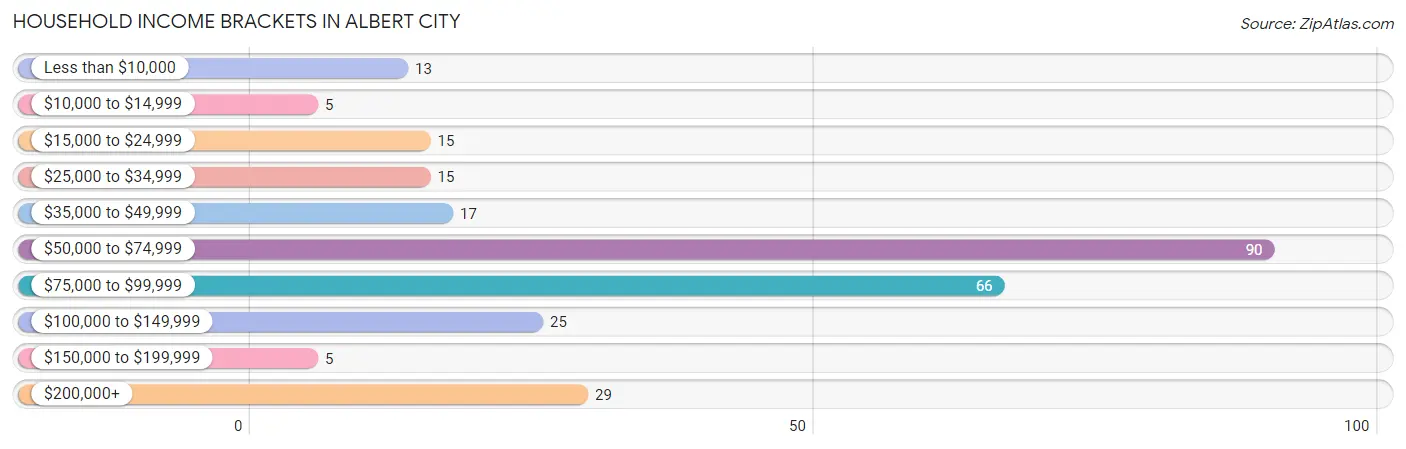
| Income Bracket | # Households | % Households |
| Less than $10,000 | 13 | 4.6% |
| $10,000 to $14,999 | 5 | 1.8% |
| $15,000 to $24,999 | 15 | 5.4% |
| $25,000 to $34,999 | 15 | 5.4% |
| $35,000 to $49,999 | 17 | 6.1% |
| $50,000 to $74,999 | 90 | 32.1% |
| $75,000 to $99,999 | 66 | 23.6% |
| $100,000 to $149,999 | 25 | 8.9% |
| $150,000 to $199,999 | 5 | 1.8% |
| $200,000+ | 29 | 10.4% |
Household Income by Householder Age in Albert City
The median household income in Albert City is $71,667, with the highest median household income of $76,389 found in the 25 to 44 years age bracket for the primary householder. A total of 72 households (25.7%) fall into this category. Meanwhile, the 15 to 24 years age bracket for the primary householder has the lowest median household income of $56,875, with 23 households (8.2%) in this group.
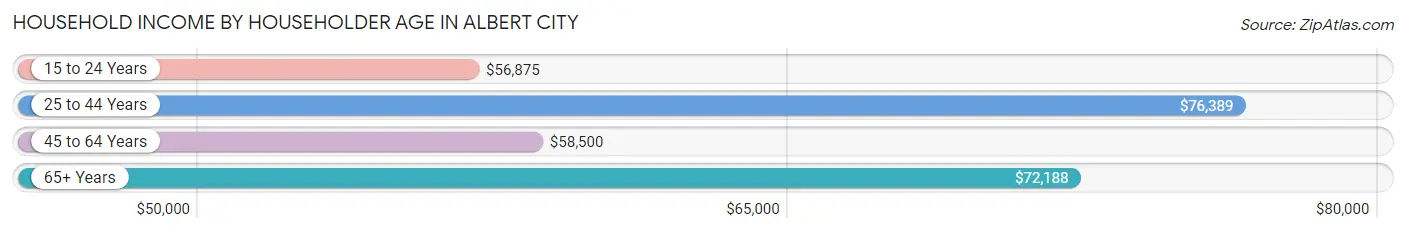
| Income Bracket | # Households | Median Income |
| 15 to 24 Years | 23 (8.2%) | $56,875 |
| 25 to 44 Years | 72 (25.7%) | $76,389 |
| 45 to 64 Years | 80 (28.6%) | $58,500 |
| 65+ Years | 105 (37.5%) | $72,188 |
| Total | 280 (100.0%) | $71,667 |
Poverty in Albert City
Income Below Poverty by Sex and Age in Albert City
With 12.5% poverty level for males and 10.8% for females among the residents of Albert City, under 5 year old males and 25 to 34 year old females are the most vulnerable to poverty, with 11 males (55.0%) and 14 females (43.8%) in their respective age groups living below the poverty level.
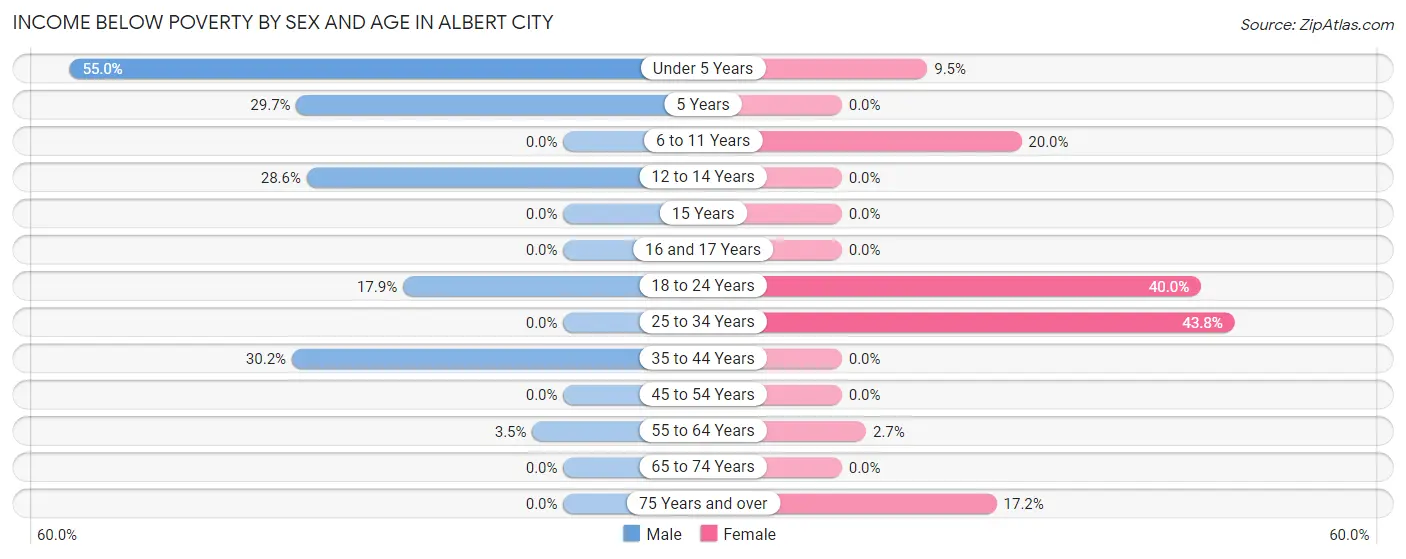
| Age Bracket | Male | Female |
| Under 5 Years | 11 (55.0%) | 2 (9.5%) |
| 5 Years | 11 (29.7%) | 0 (0.0%) |
| 6 to 11 Years | 0 (0.0%) | 1 (20.0%) |
| 12 to 14 Years | 2 (28.6%) | 0 (0.0%) |
| 15 Years | 0 (0.0%) | 0 (0.0%) |
| 16 and 17 Years | 0 (0.0%) | 0 (0.0%) |
| 18 to 24 Years | 5 (17.9%) | 8 (40.0%) |
| 25 to 34 Years | 0 (0.0%) | 14 (43.8%) |
| 35 to 44 Years | 13 (30.2%) | 0 (0.0%) |
| 45 to 54 Years | 0 (0.0%) | 0 (0.0%) |
| 55 to 64 Years | 1 (3.5%) | 1 (2.7%) |
| 65 to 74 Years | 0 (0.0%) | 0 (0.0%) |
| 75 Years and over | 0 (0.0%) | 5 (17.2%) |
| Total | 43 (12.5%) | 31 (10.8%) |
Income Above Poverty by Sex and Age in Albert City
According to the poverty statistics in Albert City, males aged 6 to 11 years and females aged 5 years are the age groups that are most secure financially, with 100.0% of males and 100.0% of females in these age groups living above the poverty line.
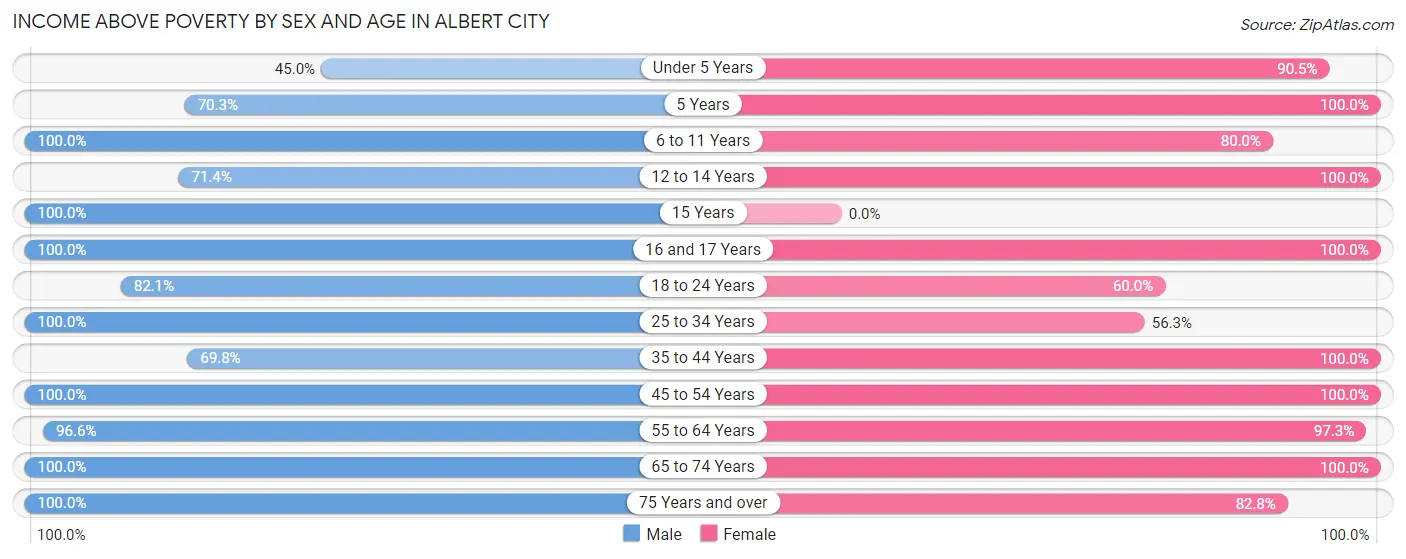
| Age Bracket | Male | Female |
| Under 5 Years | 9 (45.0%) | 19 (90.5%) |
| 5 Years | 26 (70.3%) | 1 (100.0%) |
| 6 to 11 Years | 7 (100.0%) | 4 (80.0%) |
| 12 to 14 Years | 5 (71.4%) | 2 (100.0%) |
| 15 Years | 2 (100.0%) | 0 (0.0%) |
| 16 and 17 Years | 7 (100.0%) | 15 (100.0%) |
| 18 to 24 Years | 23 (82.1%) | 12 (60.0%) |
| 25 to 34 Years | 46 (100.0%) | 18 (56.2%) |
| 35 to 44 Years | 30 (69.8%) | 29 (100.0%) |
| 45 to 54 Years | 39 (100.0%) | 34 (100.0%) |
| 55 to 64 Years | 28 (96.6%) | 36 (97.3%) |
| 65 to 74 Years | 44 (100.0%) | 61 (100.0%) |
| 75 Years and over | 35 (100.0%) | 24 (82.8%) |
| Total | 301 (87.5%) | 255 (89.2%) |
Income Below Poverty Among Married-Couple Families in Albert City
The poverty statistics for married-couple families in Albert City show that 8.8% or 13 of the total 147 families live below the poverty line. Families with 1 or 2 children have the highest poverty rate of 31.4%, comprising of 11 families. On the other hand, families with no children have the lowest poverty rate of 0.0%, which includes 0 families.
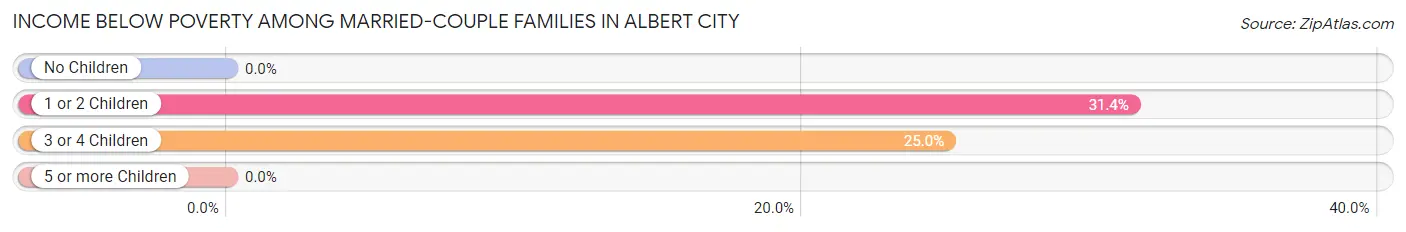
| Children | Above Poverty | Below Poverty |
| No Children | 104 (100.0%) | 0 (0.0%) |
| 1 or 2 Children | 24 (68.6%) | 11 (31.4%) |
| 3 or 4 Children | 6 (75.0%) | 2 (25.0%) |
| 5 or more Children | 0 (0.0%) | 0 (0.0%) |
| Total | 134 (91.2%) | 13 (8.8%) |
Income Below Poverty Among Single-Parent Households in Albert City
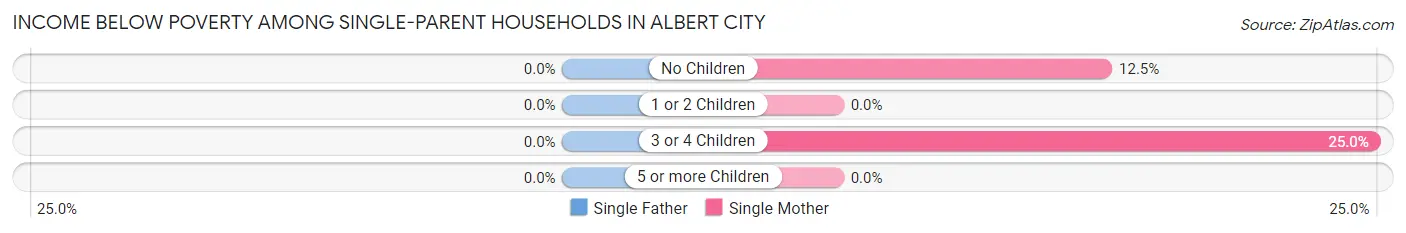
| Children | Single Father | Single Mother |
| No Children | 0 (0.0%) | 1 (12.5%) |
| 1 or 2 Children | 0 (0.0%) | 0 (0.0%) |
| 3 or 4 Children | 0 (0.0%) | 1 (25.0%) |
| 5 or more Children | 0 (0.0%) | 0 (0.0%) |
| Total | 0 (0.0%) | 2 (16.7%) |
Income Below Poverty Among Married-Couple vs Single-Parent Households in Albert City
The poverty data for Albert City shows that 13 of the married-couple family households (8.8%) and 2 of the single-parent households (7.7%) are living below the poverty level. Within the married-couple family households, those with 1 or 2 children have the highest poverty rate, with 11 households (31.4%) falling below the poverty line. Among the single-parent households, those with 3 or 4 children have the highest poverty rate, with 1 household (25.0%) living below poverty.
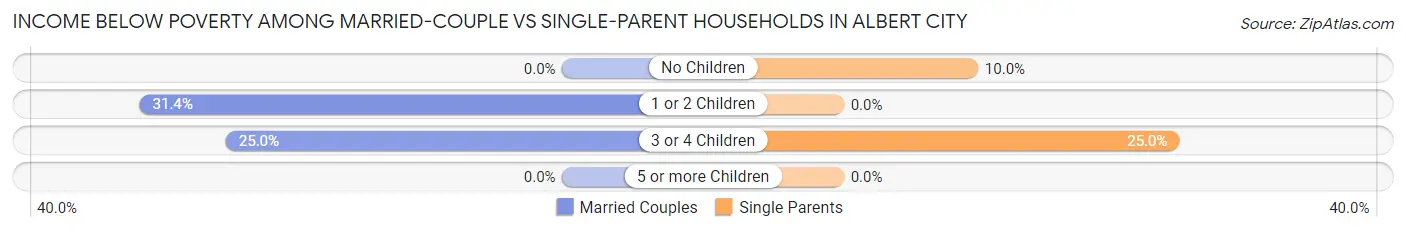
| Children | Married-Couple Families | Single-Parent Households |
| No Children | 0 (0.0%) | 1 (10.0%) |
| 1 or 2 Children | 11 (31.4%) | 0 (0.0%) |
| 3 or 4 Children | 2 (25.0%) | 1 (25.0%) |
| 5 or more Children | 0 (0.0%) | 0 (0.0%) |
| Total | 13 (8.8%) | 2 (7.7%) |
Race in Albert City
The most populous races in Albert City are White / Caucasian (620 | 93.1%), Hispanic or Latino (62 | 9.3%), and Some other Race (24 | 3.6%).
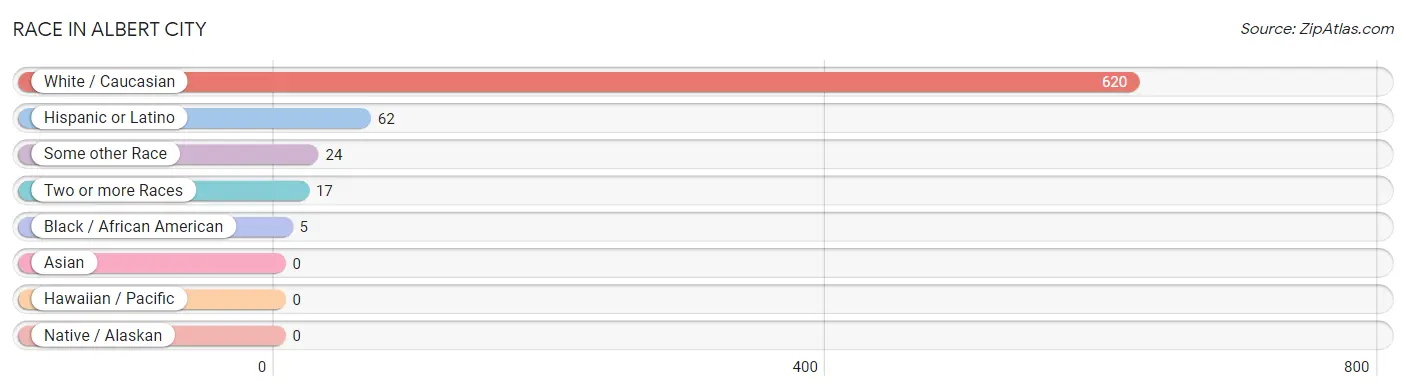
| Race | # Population | % Population |
| Asian | 0 | 0.0% |
| Black / African American | 5 | 0.7% |
| Hawaiian / Pacific | 0 | 0.0% |
| Hispanic or Latino | 62 | 9.3% |
| Native / Alaskan | 0 | 0.0% |
| White / Caucasian | 620 | 93.1% |
| Two or more Races | 17 | 2.5% |
| Some other Race | 24 | 3.6% |
| Total | 666 | 100.0% |
Ancestry in Albert City
The most populous ancestries reported in Albert City are German (252 | 37.8%), Swedish (80 | 12.0%), Irish (72 | 10.8%), Mexican (43 | 6.5%), and English (36 | 5.4%), together accounting for 72.5% of all Albert City residents.
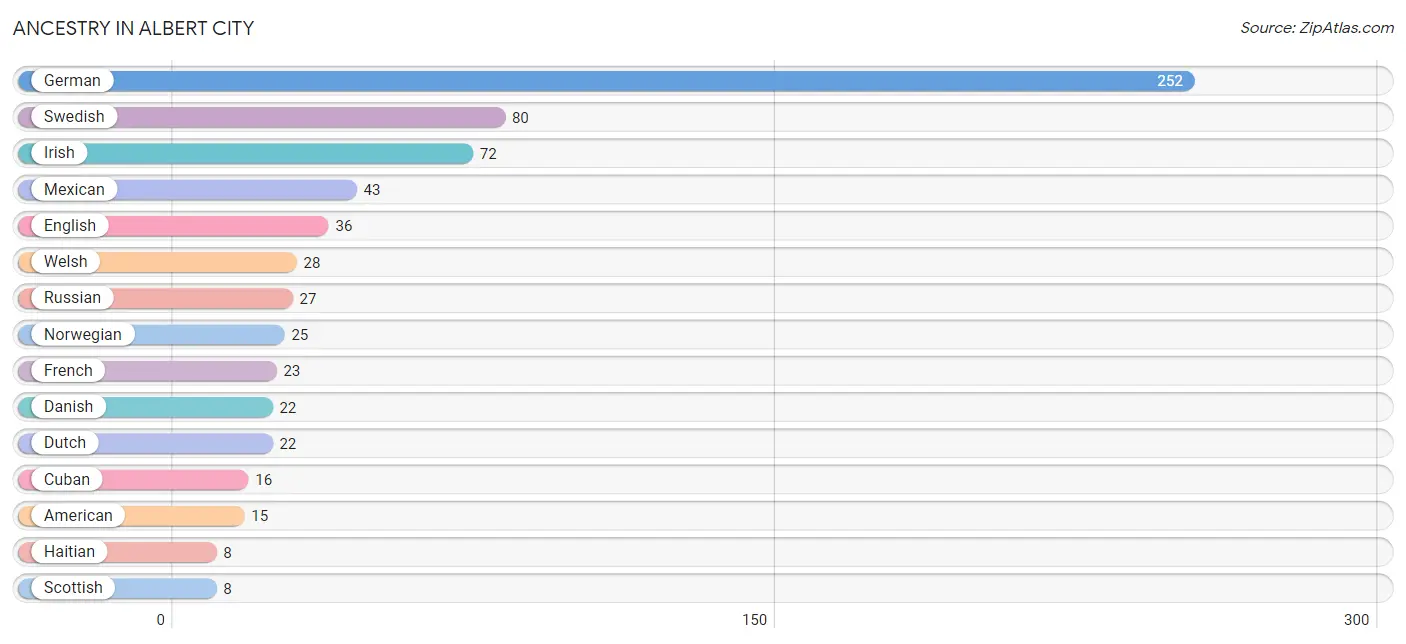
| Ancestry | # Population | % Population |
| American | 15 | 2.2% |
| British | 5 | 0.7% |
| Cuban | 16 | 2.4% |
| Czech | 3 | 0.4% |
| Danish | 22 | 3.3% |
| Dutch | 22 | 3.3% |
| Eastern European | 4 | 0.6% |
| English | 36 | 5.4% |
| European | 5 | 0.7% |
| French | 23 | 3.5% |
| German | 252 | 37.8% |
| Haitian | 8 | 1.2% |
| Irish | 72 | 10.8% |
| Italian | 2 | 0.3% |
| Mexican | 43 | 6.5% |
| Norwegian | 25 | 3.7% |
| Pennsylvania German | 2 | 0.3% |
| Polish | 6 | 0.9% |
| Puerto Rican | 3 | 0.4% |
| Russian | 27 | 4.1% |
| Scandinavian | 6 | 0.9% |
| Scottish | 8 | 1.2% |
| Swedish | 80 | 12.0% |
| Swiss | 2 | 0.3% |
| Welsh | 28 | 4.2% | View All 25 Rows |
Immigrants in Albert City
The most numerous immigrant groups reported in Albert City came from Latin America (48 | 7.2%), Caribbean (24 | 3.6%), Central America (24 | 3.6%), Mexico (24 | 3.6%), and Cuba (16 | 2.4%), together accounting for 20.4% of all Albert City residents.

| Immigration Origin | # Population | % Population |
| Caribbean | 24 | 3.6% |
| Central America | 24 | 3.6% |
| Cuba | 16 | 2.4% |
| Haiti | 8 | 1.2% |
| Latin America | 48 | 7.2% |
| Mexico | 24 | 3.6% | View All 6 Rows |
Sex and Age in Albert City
Sex and Age in Albert City
The most populous age groups in Albert City are 5 to 9 Years (37 | 10.3%) for men and 70 to 74 Years (46 | 15.0%) for women.
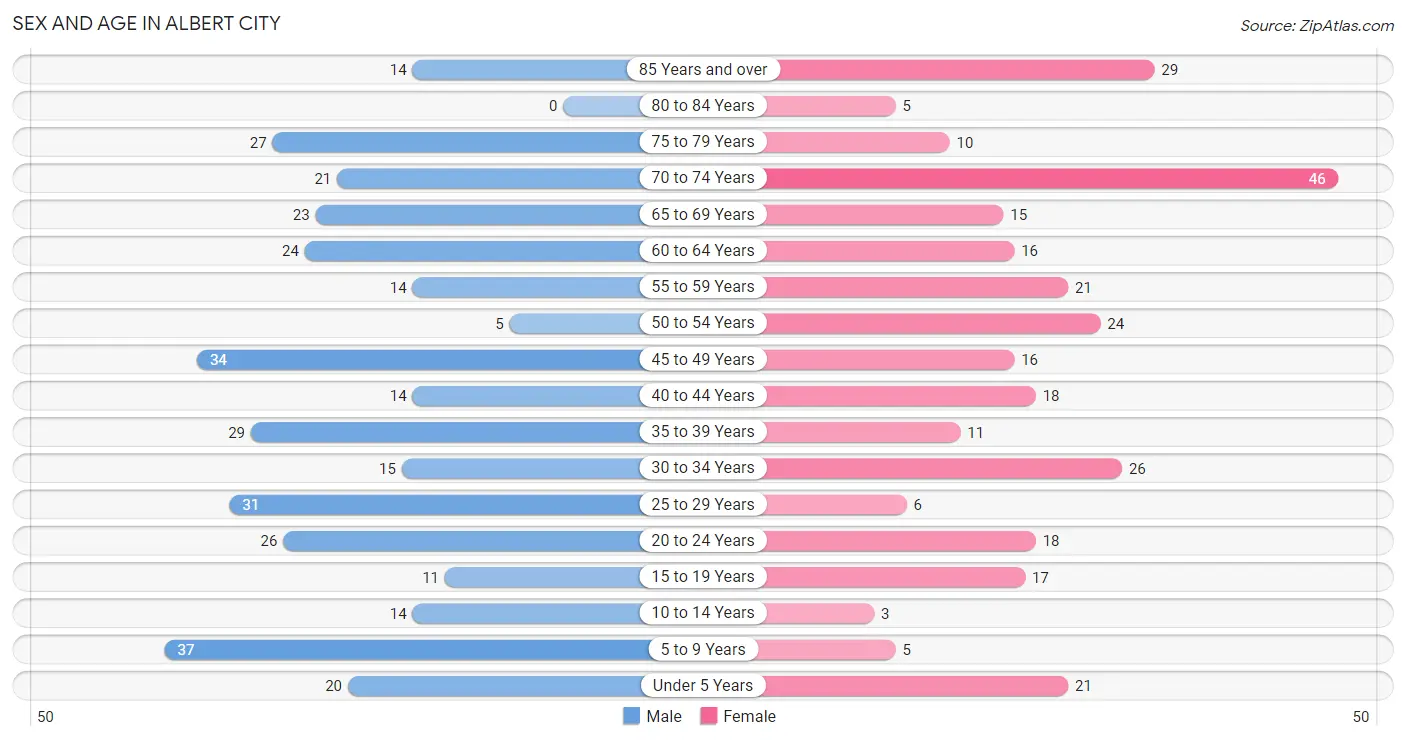
| Age Bracket | Male | Female |
| Under 5 Years | 20 (5.6%) | 21 (6.8%) |
| 5 to 9 Years | 37 (10.3%) | 5 (1.6%) |
| 10 to 14 Years | 14 (3.9%) | 3 (1.0%) |
| 15 to 19 Years | 11 (3.1%) | 17 (5.5%) |
| 20 to 24 Years | 26 (7.2%) | 18 (5.9%) |
| 25 to 29 Years | 31 (8.6%) | 6 (1.9%) |
| 30 to 34 Years | 15 (4.2%) | 26 (8.5%) |
| 35 to 39 Years | 29 (8.1%) | 11 (3.6%) |
| 40 to 44 Years | 14 (3.9%) | 18 (5.9%) |
| 45 to 49 Years | 34 (9.5%) | 16 (5.2%) |
| 50 to 54 Years | 5 (1.4%) | 24 (7.8%) |
| 55 to 59 Years | 14 (3.9%) | 21 (6.8%) |
| 60 to 64 Years | 24 (6.7%) | 16 (5.2%) |
| 65 to 69 Years | 23 (6.4%) | 15 (4.9%) |
| 70 to 74 Years | 21 (5.9%) | 46 (15.0%) |
| 75 to 79 Years | 27 (7.5%) | 10 (3.3%) |
| 80 to 84 Years | 0 (0.0%) | 5 (1.6%) |
| 85 Years and over | 14 (3.9%) | 29 (9.5%) |
| Total | 359 (100.0%) | 307 (100.0%) |
Families and Households in Albert City
Median Family Size in Albert City
The median family size in Albert City is 2.78 persons per family, with single female/mother families (12 | 6.9%) accounting for the largest median family size of 3.67 persons per family. On the other hand, married-couple families (147 | 85.0%) represent the smallest median family size with 2.66 persons per family.
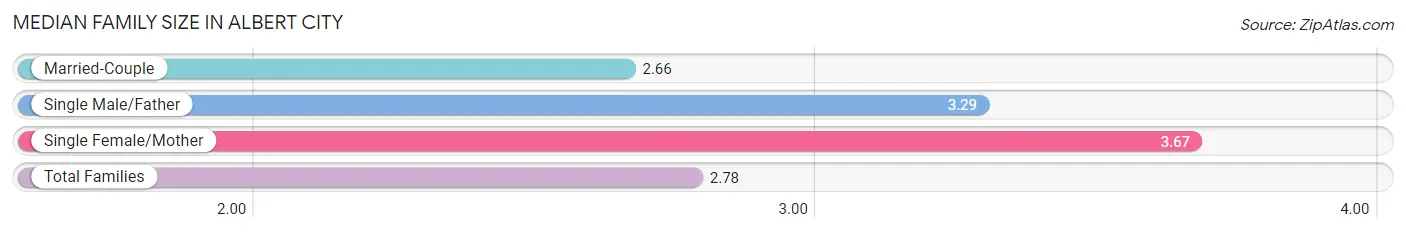
| Family Type | # Families | Family Size |
| Married-Couple | 147 (85.0%) | 2.66 |
| Single Male/Father | 14 (8.1%) | 3.29 |
| Single Female/Mother | 12 (6.9%) | 3.67 |
| Total Families | 173 (100.0%) | 2.78 |
Median Household Size in Albert City
The median household size in Albert City is 2.25 persons per household, with single male/father households (14 | 5.0%) accounting for the largest median household size of 4.21 persons per household. non-family households (107 | 38.2%) represent the smallest median household size with 1.22 persons per household.
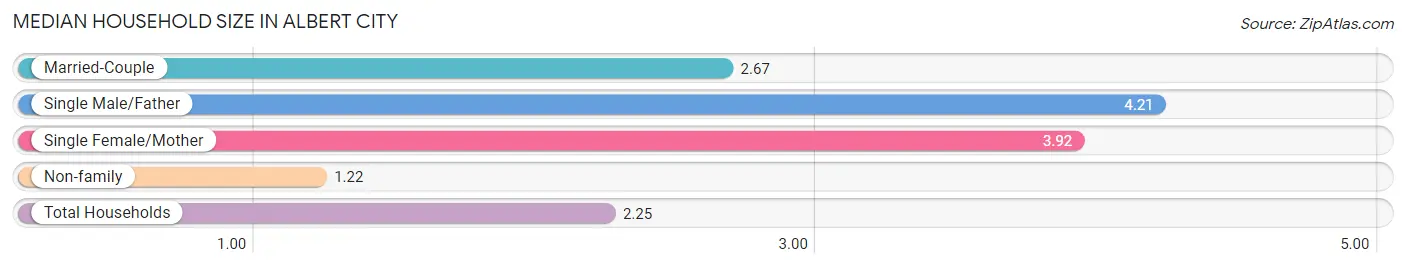
| Household Type | # Households | Household Size |
| Married-Couple | 147 (52.5%) | 2.67 |
| Single Male/Father | 14 (5.0%) | 4.21 |
| Single Female/Mother | 12 (4.3%) | 3.92 |
| Non-family | 107 (38.2%) | 1.22 |
| Total Households | 280 (100.0%) | 2.25 |
Household Size by Marriage Status in Albert City
Out of a total of 280 households in Albert City, 173 (61.8%) are family households, while 107 (38.2%) are nonfamily households. The most numerous type of family households are 2-person households, comprising 103, and the most common type of nonfamily households are 1-person households, comprising 74.
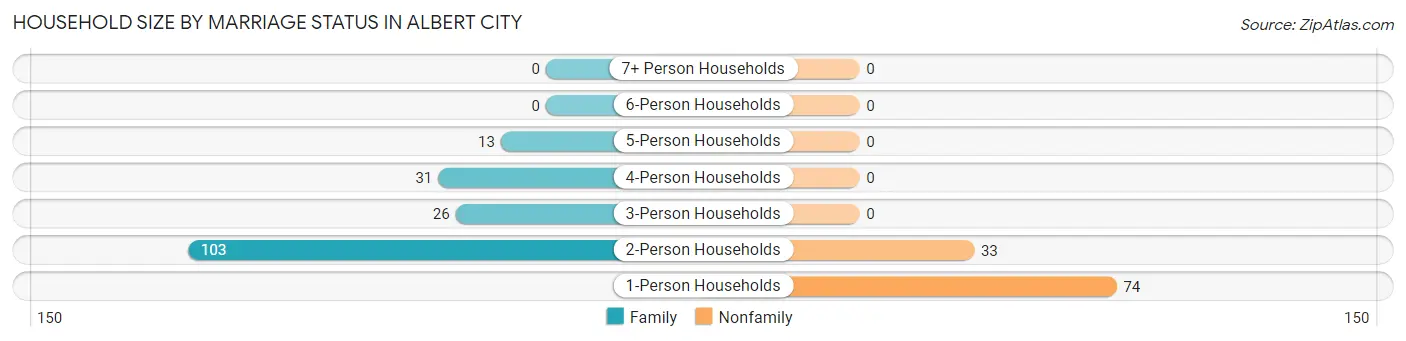
| Household Size | Family Households | Nonfamily Households |
| 1-Person Households | - | 74 (26.4%) |
| 2-Person Households | 103 (36.8%) | 33 (11.8%) |
| 3-Person Households | 26 (9.3%) | 0 (0.0%) |
| 4-Person Households | 31 (11.1%) | 0 (0.0%) |
| 5-Person Households | 13 (4.6%) | 0 (0.0%) |
| 6-Person Households | 0 (0.0%) | 0 (0.0%) |
| 7+ Person Households | 0 (0.0%) | 0 (0.0%) |
| Total | 173 (61.8%) | 107 (38.2%) |
Female Fertility in Albert City
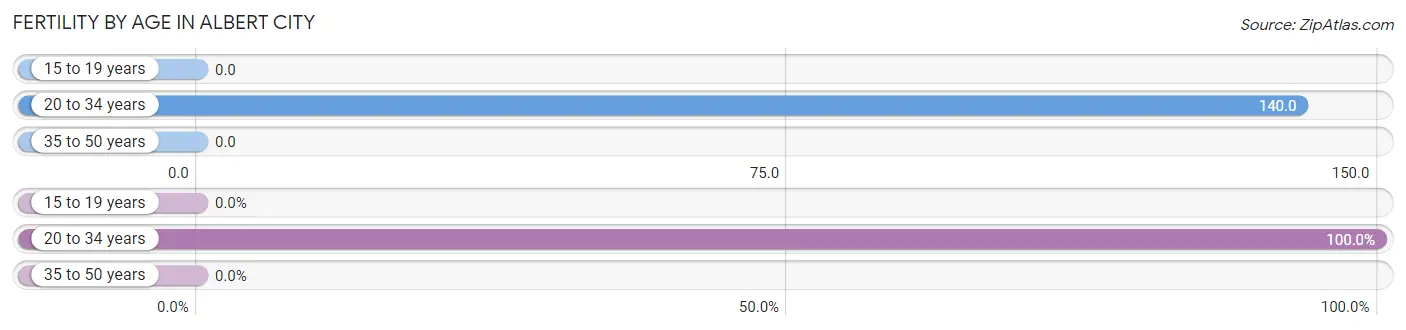
Fertility by Age in Albert City
Average fertility rate in Albert City is 59.0 births per 1,000 women. Women in the age bracket of 20 to 34 years have the highest fertility rate with 140.0 births per 1,000 women. Women in the age bracket of 20 to 34 years acount for 100.0% of all women with births.
| Age Bracket | Women with Births | Births / 1,000 Women |
| 15 to 19 years | 0 (0.0%) | 0.0 |
| 20 to 34 years | 7 (100.0%) | 140.0 |
| 35 to 50 years | 0 (0.0%) | 0.0 |
| Total | 7 (100.0%) | 59.0 |
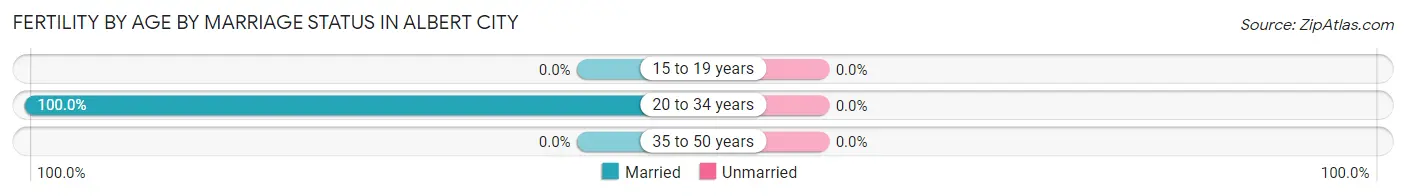
Fertility by Age by Marriage Status in Albert City
| Age Bracket | Married | Unmarried |
| 15 to 19 years | 0 (0.0%) | 0 (0.0%) |
| 20 to 34 years | 7 (100.0%) | 0 (0.0%) |
| 35 to 50 years | 0 (0.0%) | 0 (0.0%) |
| Total | 7 (100.0%) | 0 (0.0%) |
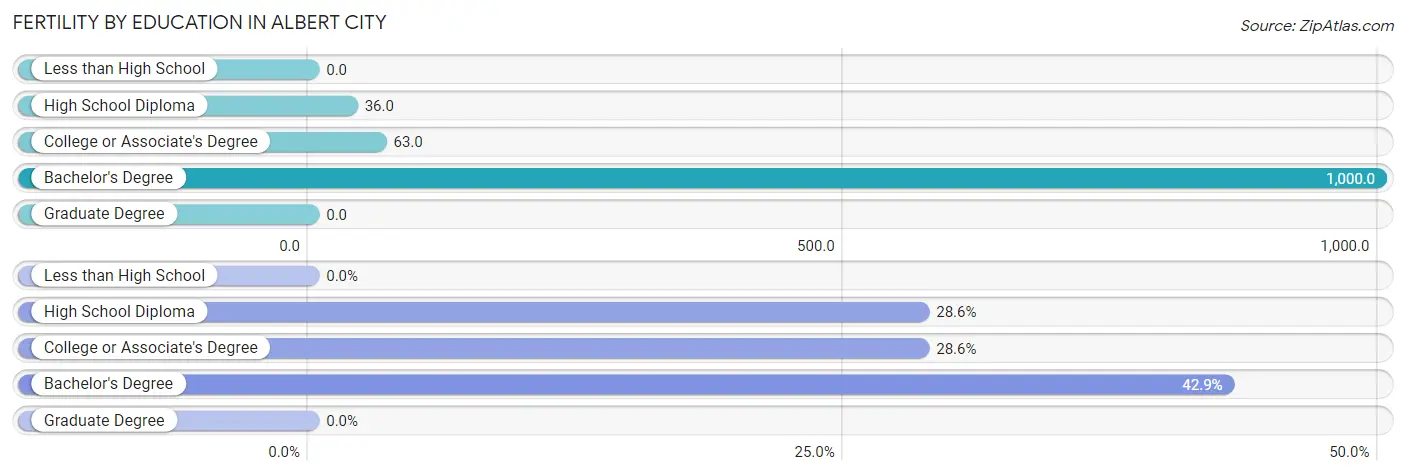
Fertility by Education in Albert City
| Educational Attainment | Women with Births | Births / 1,000 Women |
| Less than High School | 0 (0.0%) | 0.0 |
| High School Diploma | 2 (28.6%) | 36.0 |
| College or Associate's Degree | 2 (28.6%) | 63.0 |
| Bachelor's Degree | 3 (42.9%) | 1,000.0 |
| Graduate Degree | 0 (0.0%) | 0.0 |
| Total | 7 (100.0%) | 59.0 |
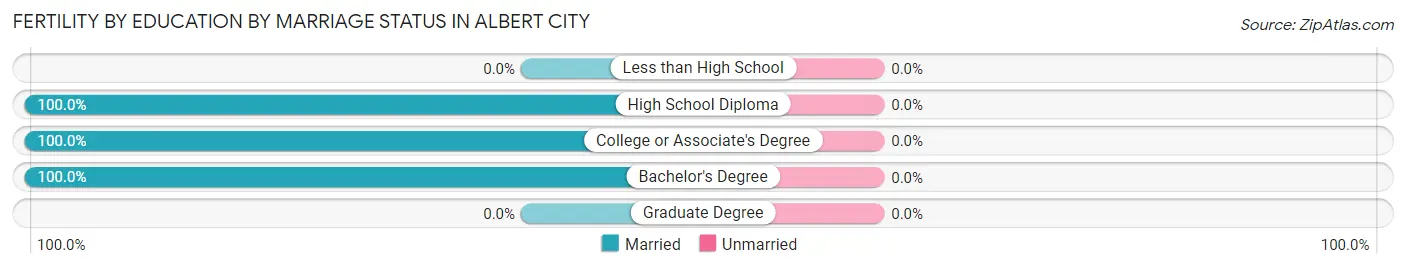
Fertility by Education by Marriage Status in Albert City
| Educational Attainment | Married | Unmarried |
| Less than High School | 0 (0.0%) | 0 (0.0%) |
| High School Diploma | 2 (100.0%) | 0 (0.0%) |
| College or Associate's Degree | 2 (100.0%) | 0 (0.0%) |
| Bachelor's Degree | 3 (100.0%) | 0 (0.0%) |
| Graduate Degree | 0 (0.0%) | 0 (0.0%) |
| Total | 7 (100.0%) | 0 (0.0%) |
Employment Characteristics in Albert City
Employment by Class of Employer in Albert City
Among the 327 employed individuals in Albert City, private company employees (257 | 78.6%), self-employed (not incorporated) (18 | 5.5%), and local government employees (16 | 4.9%) make up the most common classes of employment.
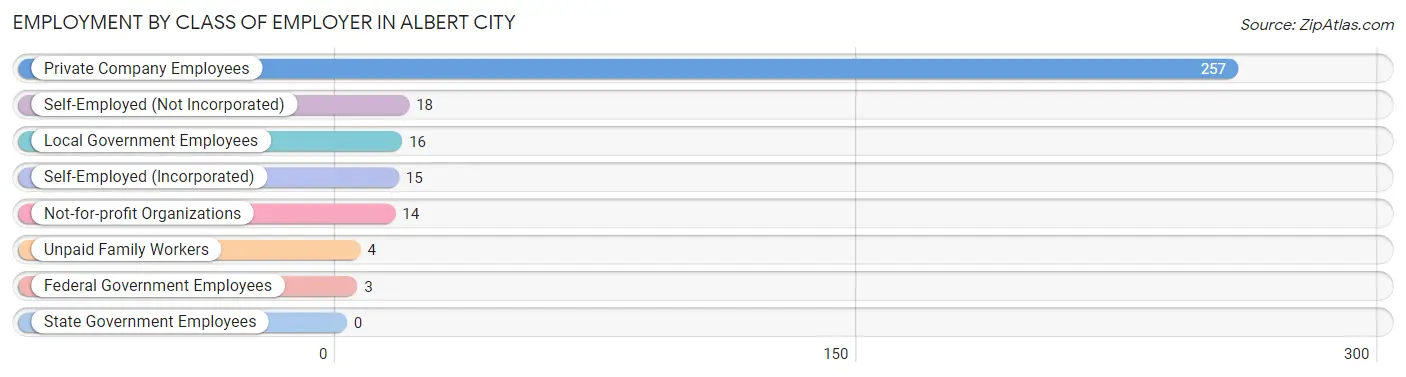
| Employer Class | # Employees | % Employees |
| Private Company Employees | 257 | 78.6% |
| Self-Employed (Incorporated) | 15 | 4.6% |
| Self-Employed (Not Incorporated) | 18 | 5.5% |
| Not-for-profit Organizations | 14 | 4.3% |
| Local Government Employees | 16 | 4.9% |
| State Government Employees | 0 | 0.0% |
| Federal Government Employees | 3 | 0.9% |
| Unpaid Family Workers | 4 | 1.2% |
| Total | 327 | 100.0% |
Employment Status by Age in Albert City
According to the labor force statistics for Albert City, out of the total population over 16 years of age (564), 61.7% or 348 individuals are in the labor force, with 5.2% or 18 of them unemployed. The age group with the highest labor force participation rate is 20 to 24 years, with 100.0% or 44 individuals in the labor force. Within the labor force, the 16 to 19 years age range has the highest percentage of unemployed individuals, with 35.0% or 7 of them being unemployed.
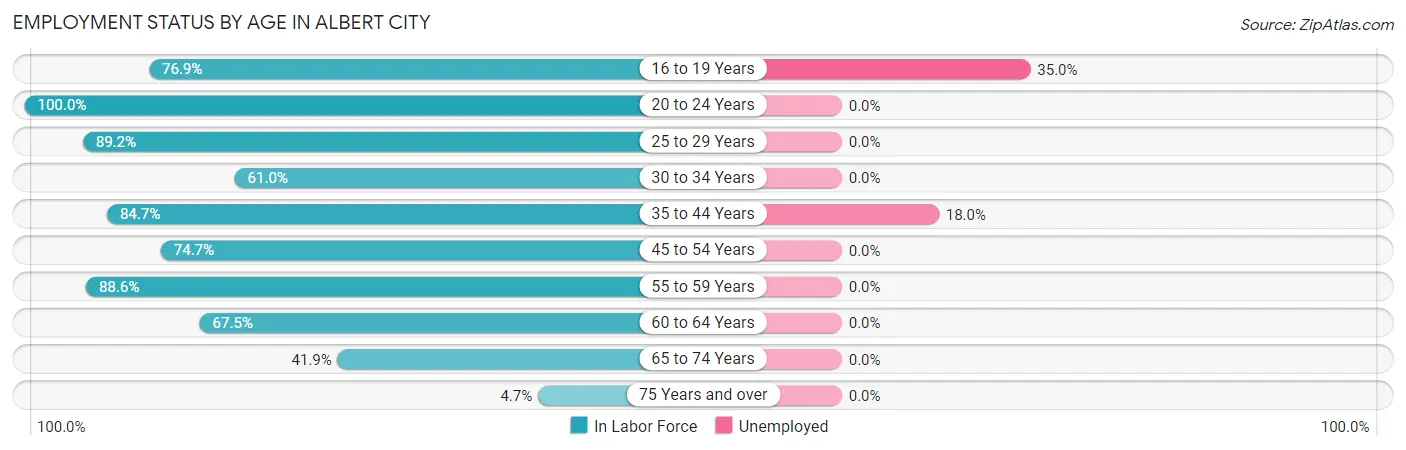
| Age Bracket | In Labor Force | Unemployed |
| 16 to 19 Years | 20 (76.9%) | 7 (35.0%) |
| 20 to 24 Years | 44 (100.0%) | 0 (0.0%) |
| 25 to 29 Years | 33 (89.2%) | 0 (0.0%) |
| 30 to 34 Years | 25 (61.0%) | 0 (0.0%) |
| 35 to 44 Years | 61 (84.7%) | 11 (18.0%) |
| 45 to 54 Years | 59 (74.7%) | 0 (0.0%) |
| 55 to 59 Years | 31 (88.6%) | 0 (0.0%) |
| 60 to 64 Years | 27 (67.5%) | 0 (0.0%) |
| 65 to 74 Years | 44 (41.9%) | 0 (0.0%) |
| 75 Years and over | 4 (4.7%) | 0 (0.0%) |
| Total | 348 (61.7%) | 18 (5.2%) |
Employment Status by Educational Attainment in Albert City
According to labor force statistics for Albert City, 77.6% of individuals (236) out of the total population between 25 and 64 years of age (304) are in the labor force, with 4.7% or 11 of them being unemployed. The group with the highest labor force participation rate are those with the educational attainment of bachelor's degree or higher, with 94.9% or 37 individuals in the labor force. Within the labor force, individuals with college / associate degree education have the highest percentage of unemployment, with 13.8% or 11 of them being unemployed.
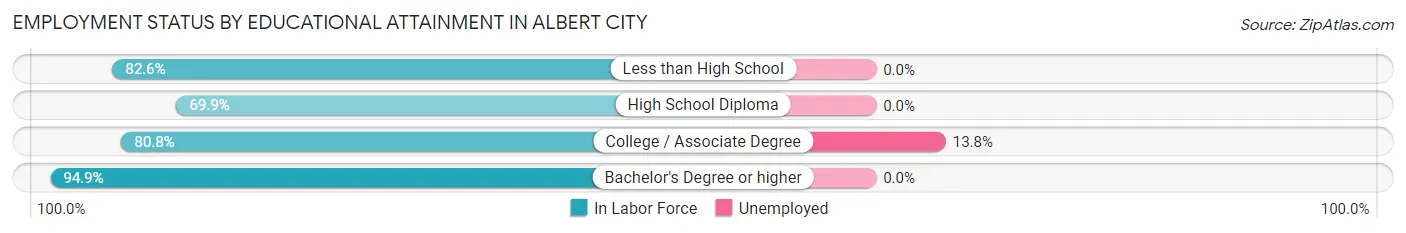
| Educational Attainment | In Labor Force | Unemployed |
| Less than High School | 19 (82.6%) | 0 (0.0%) |
| High School Diploma | 100 (69.9%) | 0 (0.0%) |
| College / Associate Degree | 80 (80.8%) | 14 (13.8%) |
| Bachelor's Degree or higher | 37 (94.9%) | 0 (0.0%) |
| Total | 236 (77.6%) | 14 (4.7%) |
Employment Occupations by Sex in Albert City
Management, Business, Science and Arts Occupations
The most common Management, Business, Science and Arts occupations in Albert City are Community & Social Service (22 | 6.7%), Education Instruction & Library (16 | 4.9%), Management (14 | 4.2%), Health Diagnosing & Treating (11 | 3.3%), and Computers, Engineering & Science (7 | 2.1%).
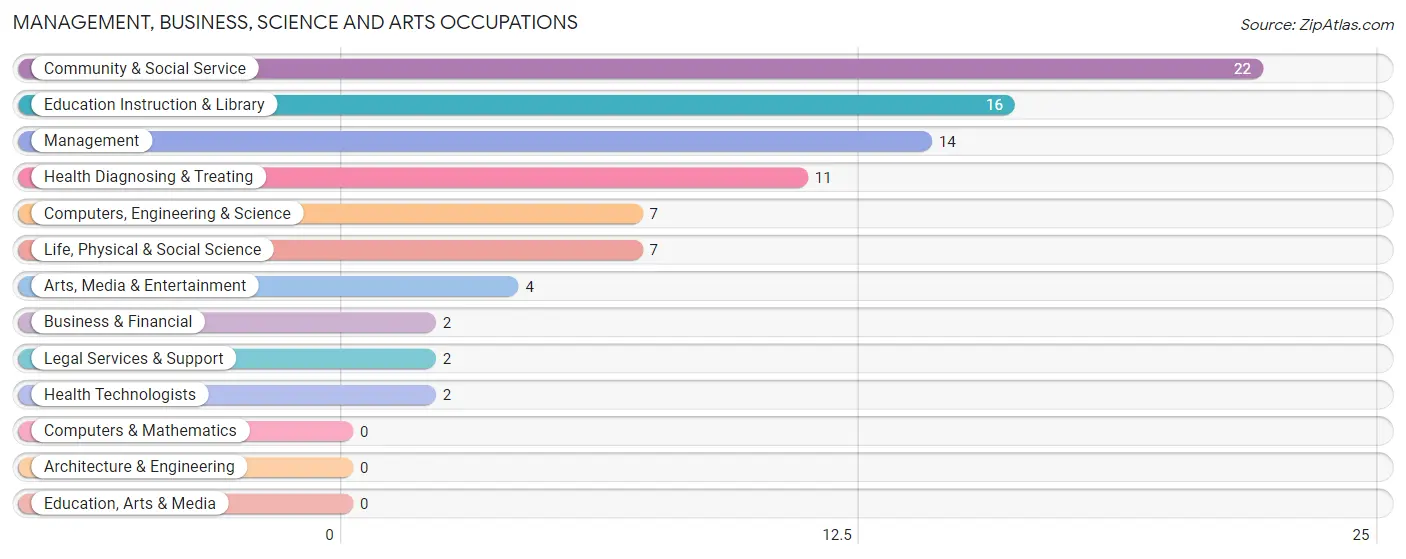
Management, Business, Science and Arts Occupations by Sex
Within the Management, Business, Science and Arts occupations in Albert City, the most male-oriented occupations are Business & Financial (100.0%), Arts, Media & Entertainment (100.0%), and Management (57.1%), while the most female-oriented occupations are Legal Services & Support (100.0%), Education Instruction & Library (100.0%), and Health Diagnosing & Treating (100.0%).
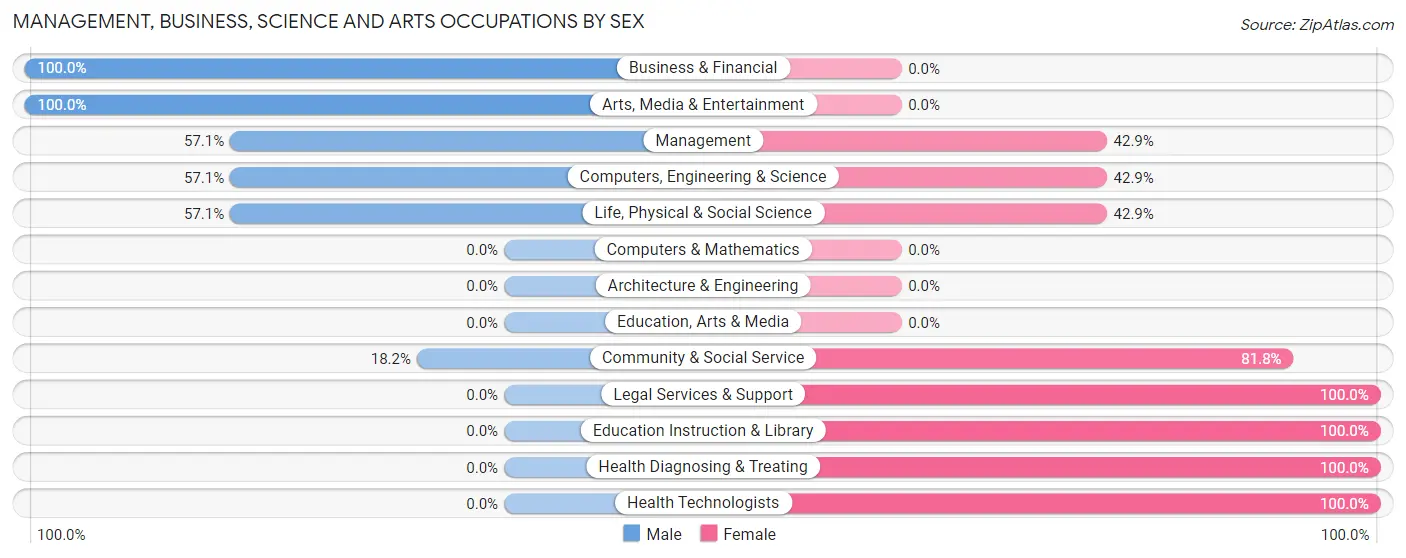
| Occupation | Male | Female |
| Management | 8 (57.1%) | 6 (42.9%) |
| Business & Financial | 2 (100.0%) | 0 (0.0%) |
| Computers, Engineering & Science | 4 (57.1%) | 3 (42.9%) |
| Computers & Mathematics | 0 (0.0%) | 0 (0.0%) |
| Architecture & Engineering | 0 (0.0%) | 0 (0.0%) |
| Life, Physical & Social Science | 4 (57.1%) | 3 (42.9%) |
| Community & Social Service | 4 (18.2%) | 18 (81.8%) |
| Education, Arts & Media | 0 (0.0%) | 0 (0.0%) |
| Legal Services & Support | 0 (0.0%) | 2 (100.0%) |
| Education Instruction & Library | 0 (0.0%) | 16 (100.0%) |
| Arts, Media & Entertainment | 4 (100.0%) | 0 (0.0%) |
| Health Diagnosing & Treating | 0 (0.0%) | 11 (100.0%) |
| Health Technologists | 0 (0.0%) | 2 (100.0%) |
| Total (Category) | 18 (32.1%) | 38 (67.9%) |
| Total (Overall) | 193 (58.5%) | 137 (41.5%) |
Services Occupations
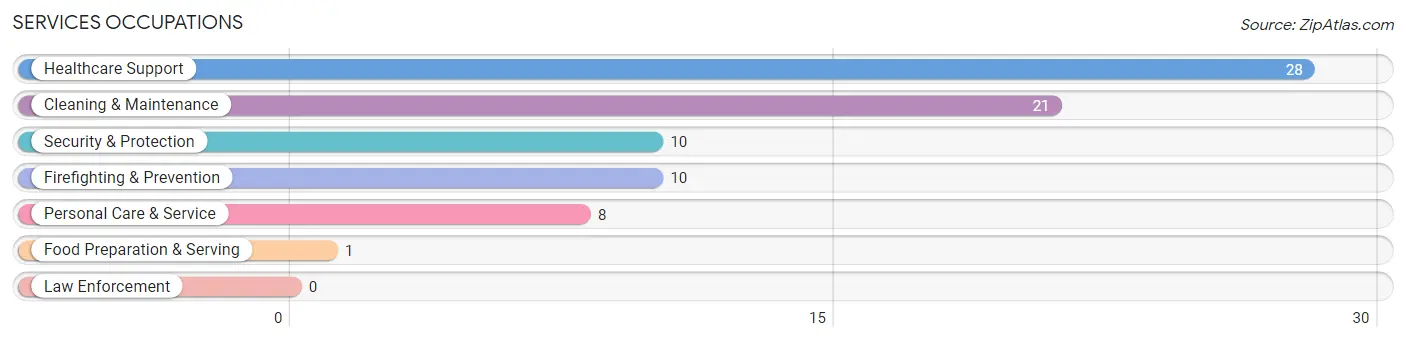
The most common Services occupations in Albert City are Healthcare Support (28 | 8.5%), Cleaning & Maintenance (21 | 6.4%), Security & Protection (10 | 3.0%), Firefighting & Prevention (10 | 3.0%), and Personal Care & Service (8 | 2.4%).
Services Occupations by Sex
Within the Services occupations in Albert City, the most male-oriented occupations are Security & Protection (100.0%), Firefighting & Prevention (100.0%), and Cleaning & Maintenance (90.5%), while the most female-oriented occupations are Food Preparation & Serving (100.0%), Personal Care & Service (100.0%), and Healthcare Support (89.3%).
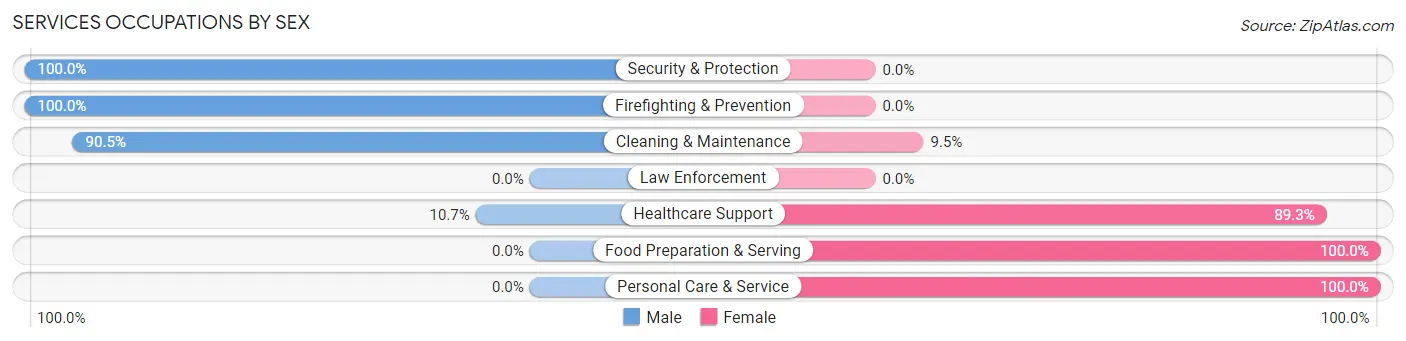
| Occupation | Male | Female |
| Healthcare Support | 3 (10.7%) | 25 (89.3%) |
| Security & Protection | 10 (100.0%) | 0 (0.0%) |
| Firefighting & Prevention | 10 (100.0%) | 0 (0.0%) |
| Law Enforcement | 0 (0.0%) | 0 (0.0%) |
| Food Preparation & Serving | 0 (0.0%) | 1 (100.0%) |
| Cleaning & Maintenance | 19 (90.5%) | 2 (9.5%) |
| Personal Care & Service | 0 (0.0%) | 8 (100.0%) |
| Total (Category) | 32 (47.1%) | 36 (52.9%) |
| Total (Overall) | 193 (58.5%) | 137 (41.5%) |
Sales and Office Occupations
The most common Sales and Office occupations in Albert City are Office & Administration (23 | 7.0%), and Sales & Related (13 | 3.9%).
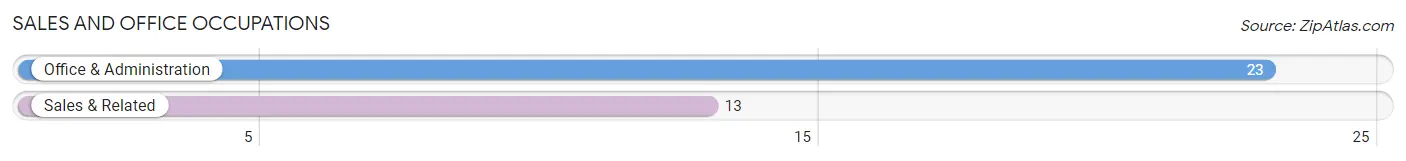
Sales and Office Occupations by Sex
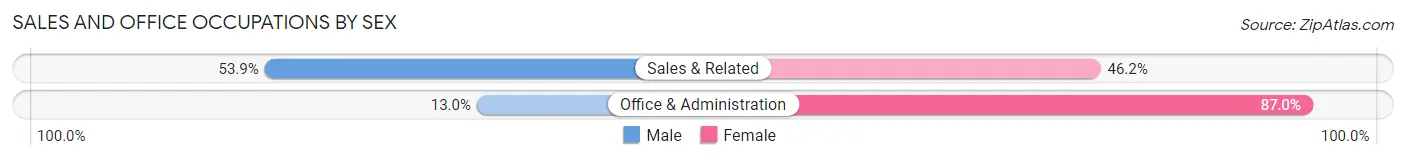
| Occupation | Male | Female |
| Sales & Related | 7 (53.8%) | 6 (46.2%) |
| Office & Administration | 3 (13.0%) | 20 (87.0%) |
| Total (Category) | 10 (27.8%) | 26 (72.2%) |
| Total (Overall) | 193 (58.5%) | 137 (41.5%) |
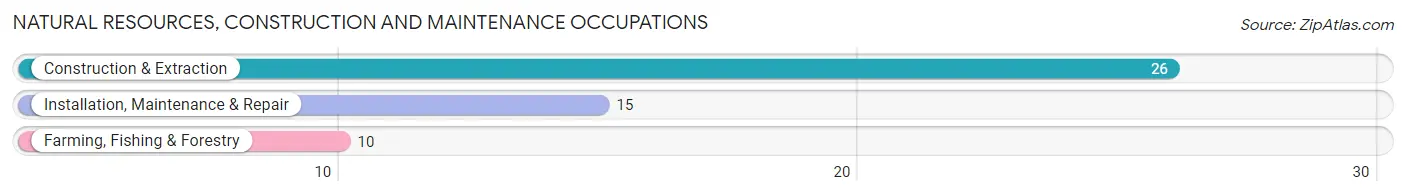
Natural Resources, Construction and Maintenance Occupations
The most common Natural Resources, Construction and Maintenance occupations in Albert City are Construction & Extraction (26 | 7.9%), Installation, Maintenance & Repair (15 | 4.5%), and Farming, Fishing & Forestry (10 | 3.0%).
Natural Resources, Construction and Maintenance Occupations by Sex
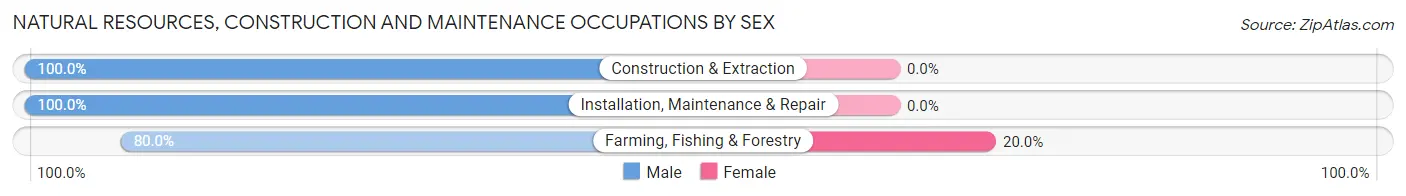
| Occupation | Male | Female |
| Farming, Fishing & Forestry | 8 (80.0%) | 2 (20.0%) |
| Construction & Extraction | 26 (100.0%) | 0 (0.0%) |
| Installation, Maintenance & Repair | 15 (100.0%) | 0 (0.0%) |
| Total (Category) | 49 (96.1%) | 2 (3.9%) |
| Total (Overall) | 193 (58.5%) | 137 (41.5%) |
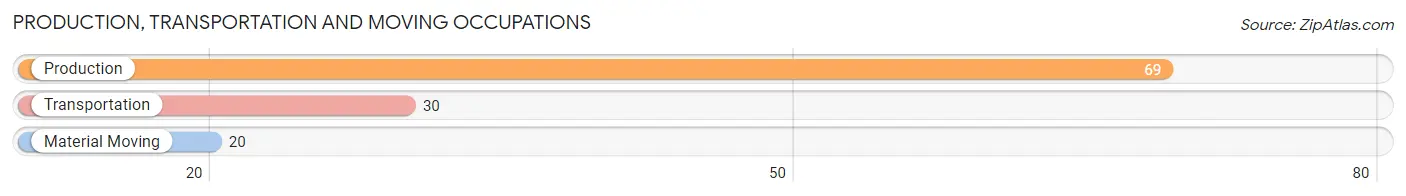
Production, Transportation and Moving Occupations
The most common Production, Transportation and Moving occupations in Albert City are Production (69 | 20.9%), Transportation (30 | 9.1%), and Material Moving (20 | 6.1%).
Production, Transportation and Moving Occupations by Sex
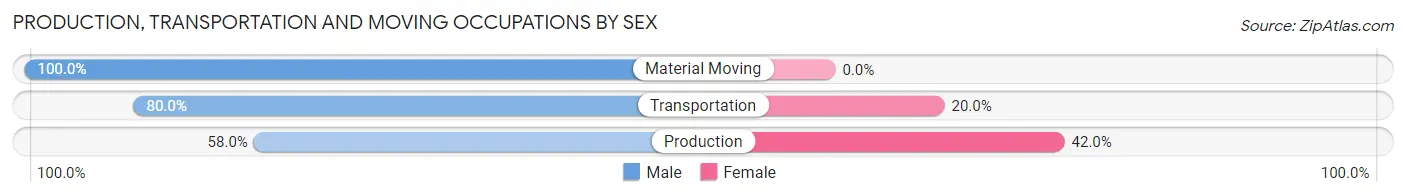
| Occupation | Male | Female |
| Production | 40 (58.0%) | 29 (42.0%) |
| Transportation | 24 (80.0%) | 6 (20.0%) |
| Material Moving | 20 (100.0%) | 0 (0.0%) |
| Total (Category) | 84 (70.6%) | 35 (29.4%) |
| Total (Overall) | 193 (58.5%) | 137 (41.5%) |
Employment Industries by Sex in Albert City
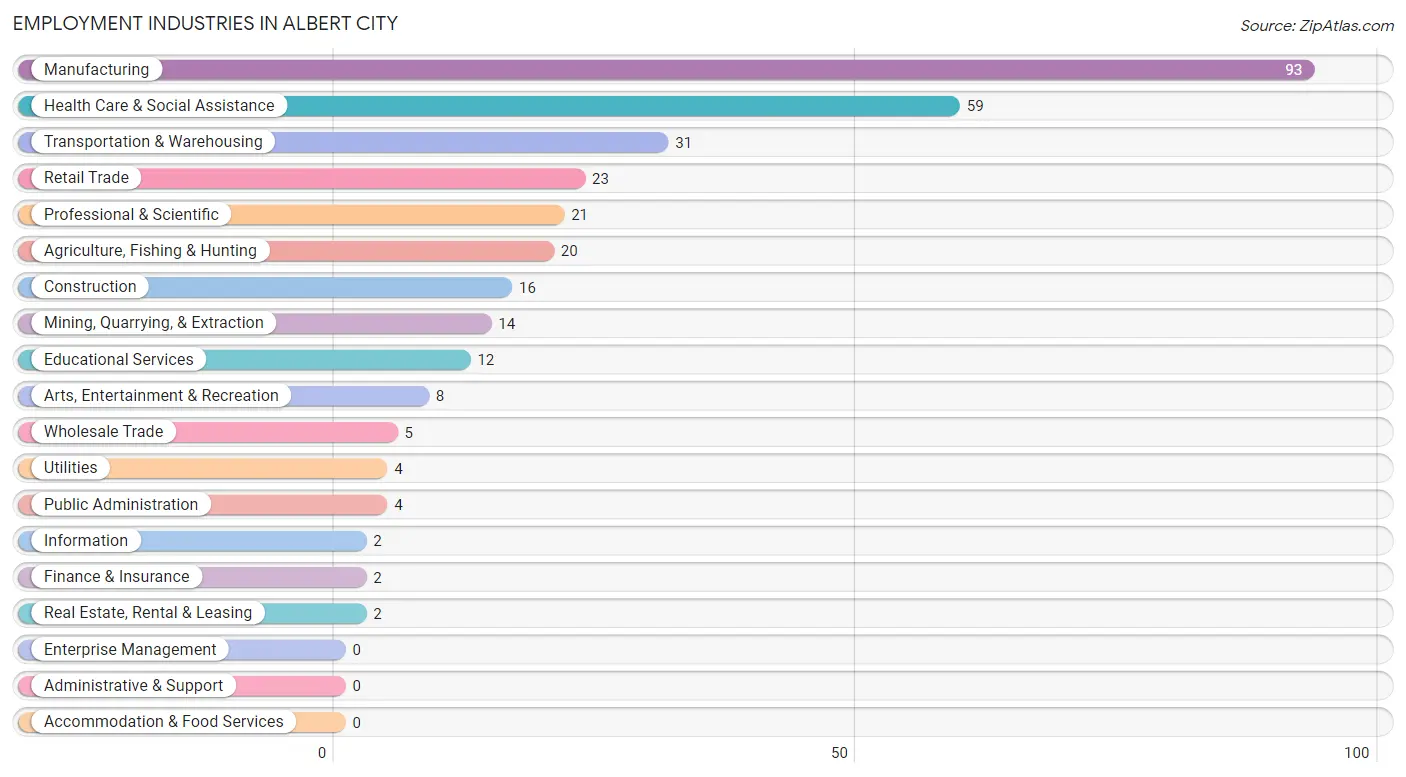
Employment Industries in Albert City
The major employment industries in Albert City include Manufacturing (93 | 28.2%), Health Care & Social Assistance (59 | 17.9%), Transportation & Warehousing (31 | 9.4%), Retail Trade (23 | 7.0%), and Professional & Scientific (21 | 6.4%).
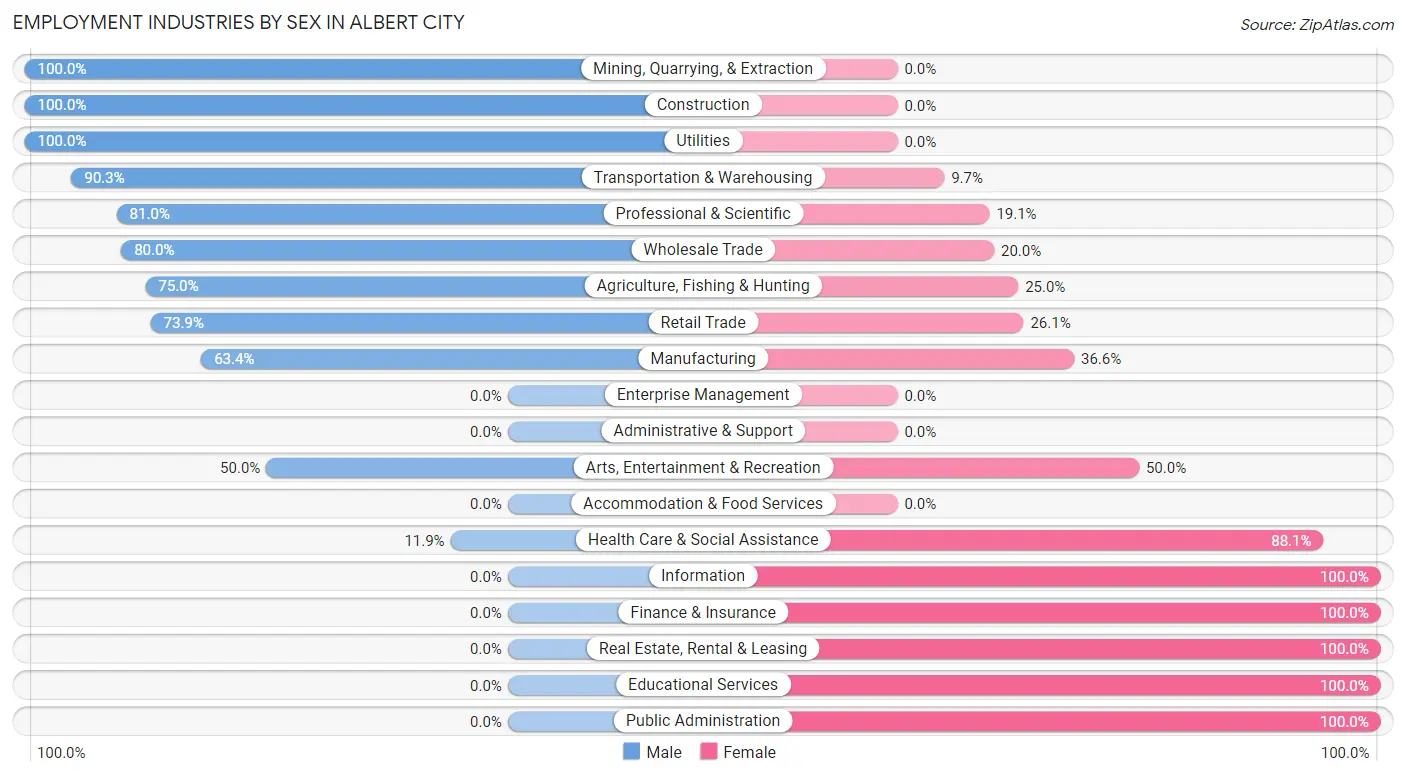
Employment Industries by Sex in Albert City
The Albert City industries that see more men than women are Mining, Quarrying, & Extraction (100.0%), Construction (100.0%), and Utilities (100.0%), whereas the industries that tend to have a higher number of women are Information (100.0%), Finance & Insurance (100.0%), and Real Estate, Rental & Leasing (100.0%).
| Industry | Male | Female |
| Agriculture, Fishing & Hunting | 15 (75.0%) | 5 (25.0%) |
| Mining, Quarrying, & Extraction | 14 (100.0%) | 0 (0.0%) |
| Construction | 16 (100.0%) | 0 (0.0%) |
| Manufacturing | 59 (63.4%) | 34 (36.6%) |
| Wholesale Trade | 4 (80.0%) | 1 (20.0%) |
| Retail Trade | 17 (73.9%) | 6 (26.1%) |
| Transportation & Warehousing | 28 (90.3%) | 3 (9.7%) |
| Utilities | 4 (100.0%) | 0 (0.0%) |
| Information | 0 (0.0%) | 2 (100.0%) |
| Finance & Insurance | 0 (0.0%) | 2 (100.0%) |
| Real Estate, Rental & Leasing | 0 (0.0%) | 2 (100.0%) |
| Professional & Scientific | 17 (80.9%) | 4 (19.1%) |
| Enterprise Management | 0 (0.0%) | 0 (0.0%) |
| Administrative & Support | 0 (0.0%) | 0 (0.0%) |
| Educational Services | 0 (0.0%) | 12 (100.0%) |
| Health Care & Social Assistance | 7 (11.9%) | 52 (88.1%) |
| Arts, Entertainment & Recreation | 4 (50.0%) | 4 (50.0%) |
| Accommodation & Food Services | 0 (0.0%) | 0 (0.0%) |
| Public Administration | 0 (0.0%) | 4 (100.0%) |
| Total | 193 (58.5%) | 137 (41.5%) |
Education in Albert City
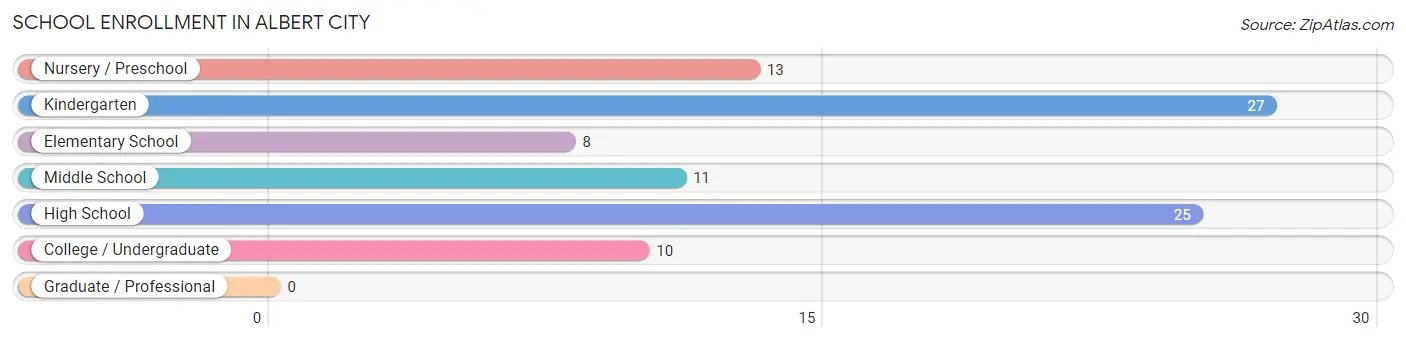
School Enrollment in Albert City
The most common levels of schooling among the 94 students in Albert City are kindergarten (27 | 28.7%), high school (25 | 26.6%), and nursery / preschool (13 | 13.8%).
| School Level | # Students | % Students |
| Nursery / Preschool | 13 | 13.8% |
| Kindergarten | 27 | 28.7% |
| Elementary School | 8 | 8.5% |
| Middle School | 11 | 11.7% |
| High School | 25 | 26.6% |
| College / Undergraduate | 10 | 10.6% |
| Graduate / Professional | 0 | 0.0% |
| Total | 94 | 100.0% |
School Enrollment by Age by Funding Source in Albert City
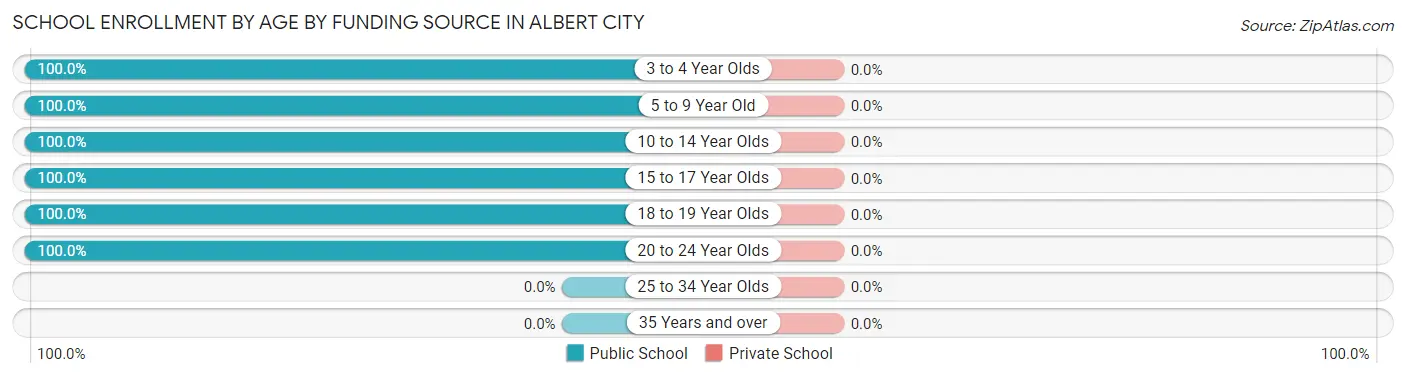
| Age Bracket | Public School | Private School |
| 3 to 4 Year Olds | 2 (100.0%) | 0 (0.0%) |
| 5 to 9 Year Old | 42 (100.0%) | 0 (0.0%) |
| 10 to 14 Year Olds | 17 (100.0%) | 0 (0.0%) |
| 15 to 17 Year Olds | 23 (100.0%) | 0 (0.0%) |
| 18 to 19 Year Olds | 2 (100.0%) | 0 (0.0%) |
| 20 to 24 Year Olds | 8 (100.0%) | 0 (0.0%) |
| 25 to 34 Year Olds | 0 (0.0%) | 0 (0.0%) |
| 35 Years and over | 0 (0.0%) | 0 (0.0%) |
| Total | 94 (100.0%) | 0 (0.0%) |
Educational Attainment by Field of Study in Albert City
Education (34 | 40.0%), arts & humanities (17 | 20.0%), business (12 | 14.1%), bio, nature & agricultural (8 | 9.4%), and computers & mathematics (5 | 5.9%) are the most common fields of study among 85 individuals in Albert City who have obtained a bachelor's degree or higher.
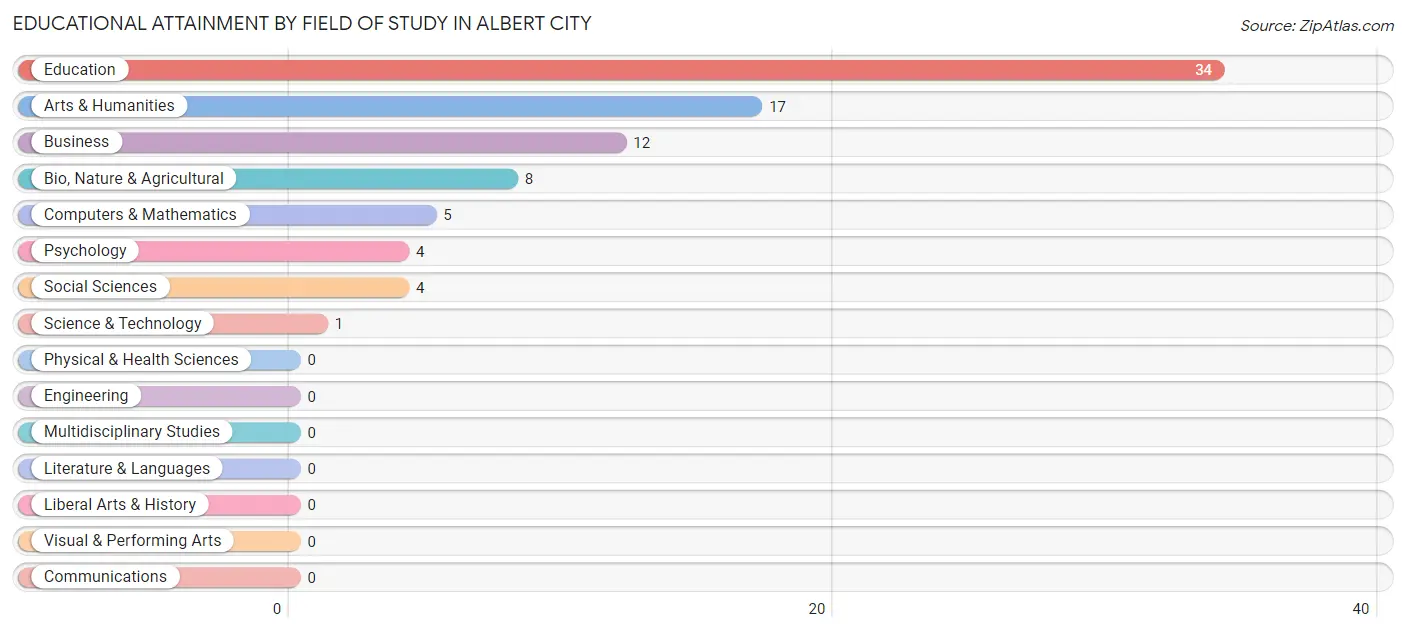
| Field of Study | # Graduates | % Graduates |
| Computers & Mathematics | 5 | 5.9% |
| Bio, Nature & Agricultural | 8 | 9.4% |
| Physical & Health Sciences | 0 | 0.0% |
| Psychology | 4 | 4.7% |
| Social Sciences | 4 | 4.7% |
| Engineering | 0 | 0.0% |
| Multidisciplinary Studies | 0 | 0.0% |
| Science & Technology | 1 | 1.2% |
| Business | 12 | 14.1% |
| Education | 34 | 40.0% |
| Literature & Languages | 0 | 0.0% |
| Liberal Arts & History | 0 | 0.0% |
| Visual & Performing Arts | 0 | 0.0% |
| Communications | 0 | 0.0% |
| Arts & Humanities | 17 | 20.0% |
| Total | 85 | 100.0% |
Transportation & Commute in Albert City
Vehicle Availability by Sex in Albert City
The most prevalent vehicle ownership categories in Albert City are males with 2 vehicles (91, accounting for 47.9%) and females with 2 vehicles (60, making up 66.4%).
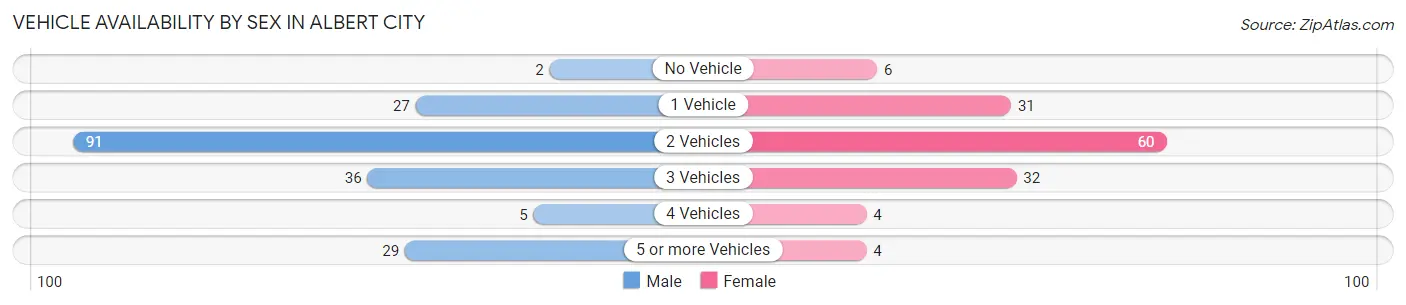
| Vehicles Available | Male | Female |
| No Vehicle | 2 (1.1%) | 6 (4.4%) |
| 1 Vehicle | 27 (14.2%) | 31 (22.6%) |
| 2 Vehicles | 91 (47.9%) | 60 (43.8%) |
| 3 Vehicles | 36 (19.0%) | 32 (23.4%) |
| 4 Vehicles | 5 (2.6%) | 4 (2.9%) |
| 5 or more Vehicles | 29 (15.3%) | 4 (2.9%) |
| Total | 190 (100.0%) | 137 (100.0%) |
Commute Time in Albert City
The most frequently occuring commute durations in Albert City are 30 to 34 minutes (60 commuters, 19.0%), 5 to 9 minutes (39 commuters, 12.3%), and less than 5 minutes (38 commuters, 12.0%).
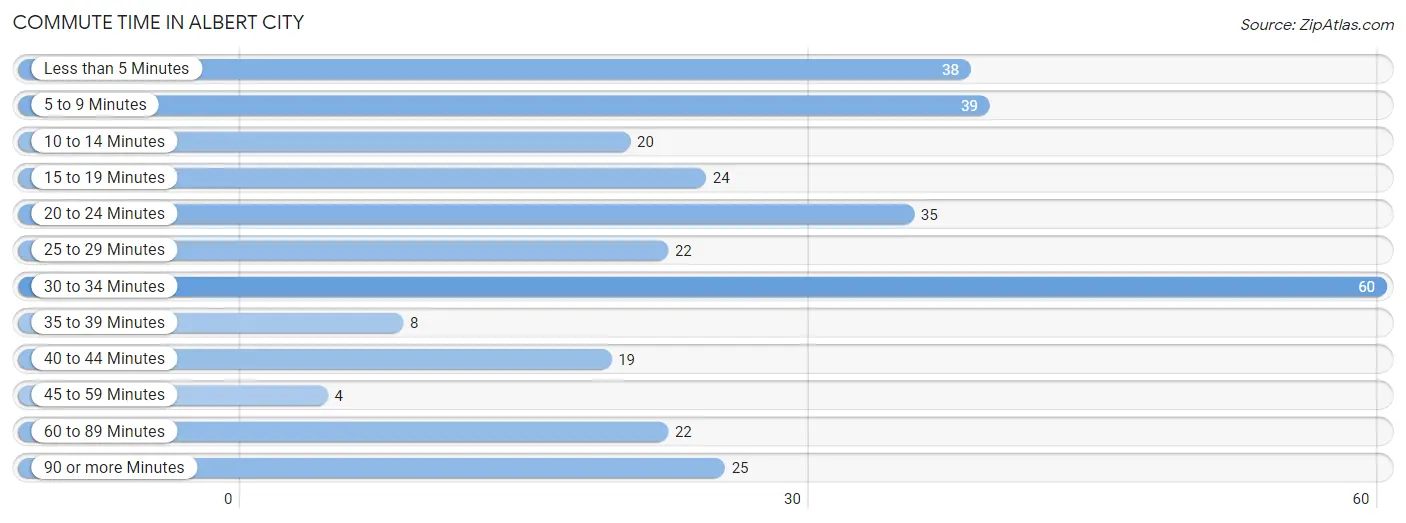
| Commute Time | # Commuters | % Commuters |
| Less than 5 Minutes | 38 | 12.0% |
| 5 to 9 Minutes | 39 | 12.3% |
| 10 to 14 Minutes | 20 | 6.3% |
| 15 to 19 Minutes | 24 | 7.6% |
| 20 to 24 Minutes | 35 | 11.1% |
| 25 to 29 Minutes | 22 | 7.0% |
| 30 to 34 Minutes | 60 | 19.0% |
| 35 to 39 Minutes | 8 | 2.5% |
| 40 to 44 Minutes | 19 | 6.0% |
| 45 to 59 Minutes | 4 | 1.3% |
| 60 to 89 Minutes | 22 | 7.0% |
| 90 or more Minutes | 25 | 7.9% |
Commute Time by Sex in Albert City
The most common commute times in Albert City are 30 to 34 minutes (39 commuters, 20.9%) for males and 5 to 9 minutes (26 commuters, 20.2%) for females.
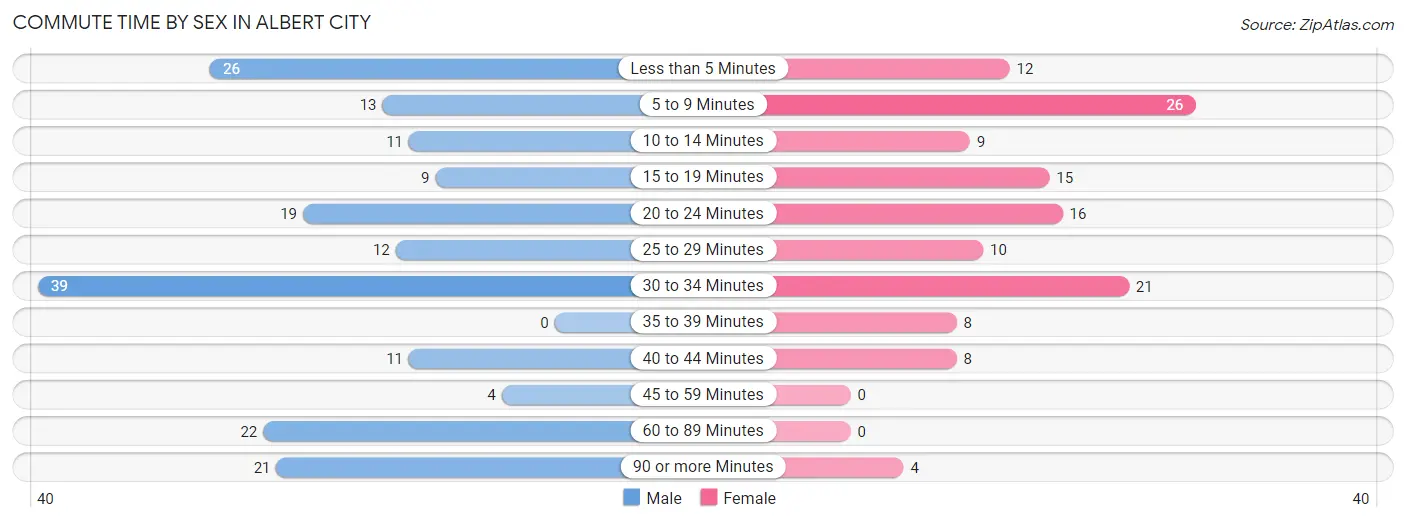
| Commute Time | Male | Female |
| Less than 5 Minutes | 26 (13.9%) | 12 (9.3%) |
| 5 to 9 Minutes | 13 (7.0%) | 26 (20.2%) |
| 10 to 14 Minutes | 11 (5.9%) | 9 (7.0%) |
| 15 to 19 Minutes | 9 (4.8%) | 15 (11.6%) |
| 20 to 24 Minutes | 19 (10.2%) | 16 (12.4%) |
| 25 to 29 Minutes | 12 (6.4%) | 10 (7.7%) |
| 30 to 34 Minutes | 39 (20.9%) | 21 (16.3%) |
| 35 to 39 Minutes | 0 (0.0%) | 8 (6.2%) |
| 40 to 44 Minutes | 11 (5.9%) | 8 (6.2%) |
| 45 to 59 Minutes | 4 (2.1%) | 0 (0.0%) |
| 60 to 89 Minutes | 22 (11.8%) | 0 (0.0%) |
| 90 or more Minutes | 21 (11.2%) | 4 (3.1%) |
Time of Departure to Work by Sex in Albert City
The most frequent times of departure to work in Albert City are 5:00 AM to 5:29 AM (31, 16.6%) for males and 4:00 PM to 11:59 PM (35, 27.1%) for females.
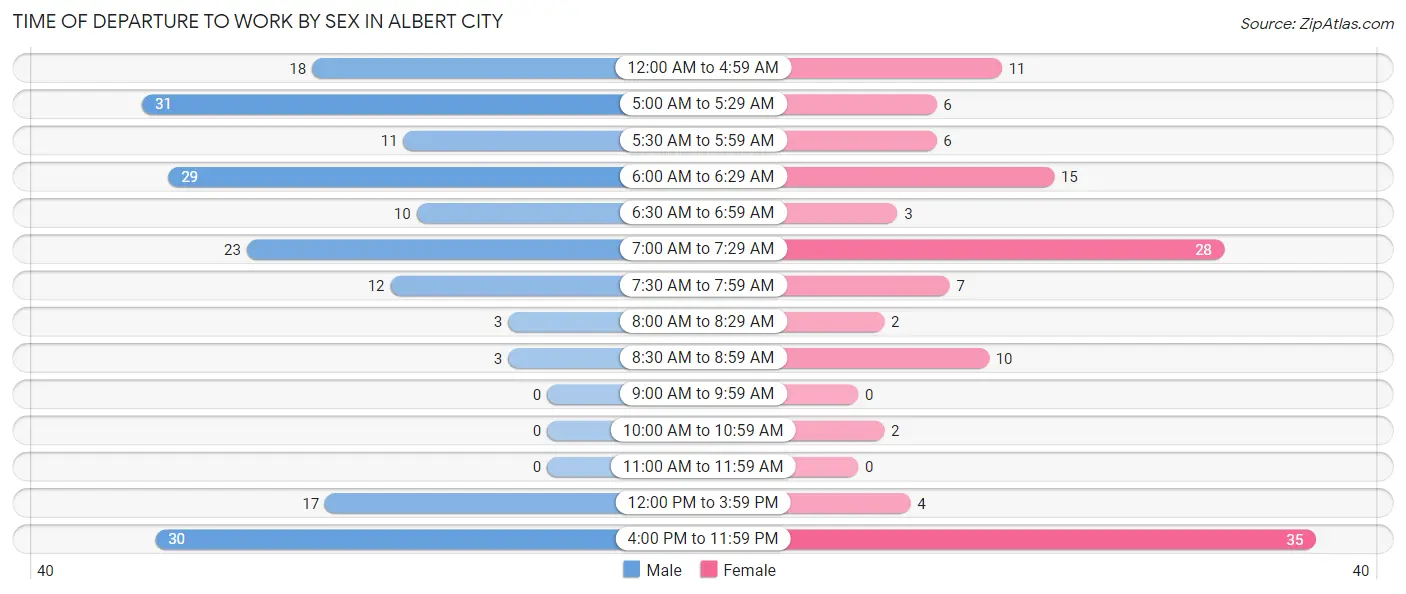
| Time of Departure | Male | Female |
| 12:00 AM to 4:59 AM | 18 (9.6%) | 11 (8.5%) |
| 5:00 AM to 5:29 AM | 31 (16.6%) | 6 (4.6%) |
| 5:30 AM to 5:59 AM | 11 (5.9%) | 6 (4.6%) |
| 6:00 AM to 6:29 AM | 29 (15.5%) | 15 (11.6%) |
| 6:30 AM to 6:59 AM | 10 (5.3%) | 3 (2.3%) |
| 7:00 AM to 7:29 AM | 23 (12.3%) | 28 (21.7%) |
| 7:30 AM to 7:59 AM | 12 (6.4%) | 7 (5.4%) |
| 8:00 AM to 8:29 AM | 3 (1.6%) | 2 (1.5%) |
| 8:30 AM to 8:59 AM | 3 (1.6%) | 10 (7.7%) |
| 9:00 AM to 9:59 AM | 0 (0.0%) | 0 (0.0%) |
| 10:00 AM to 10:59 AM | 0 (0.0%) | 2 (1.5%) |
| 11:00 AM to 11:59 AM | 0 (0.0%) | 0 (0.0%) |
| 12:00 PM to 3:59 PM | 17 (9.1%) | 4 (3.1%) |
| 4:00 PM to 11:59 PM | 30 (16.0%) | 35 (27.1%) |
| Total | 187 (100.0%) | 129 (100.0%) |
Housing Occupancy in Albert City
Occupancy by Ownership in Albert City
Of the total 280 dwellings in Albert City, owner-occupied units account for 204 (72.9%), while renter-occupied units make up 76 (27.1%).
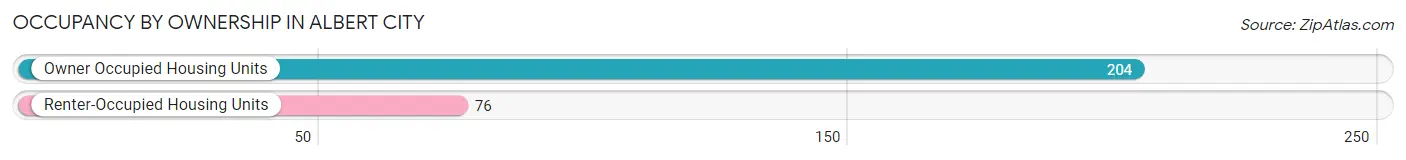
| Occupancy | # Housing Units | % Housing Units |
| Owner Occupied Housing Units | 204 | 72.9% |
| Renter-Occupied Housing Units | 76 | 27.1% |
| Total Occupied Housing Units | 280 | 100.0% |
Occupancy by Household Size in Albert City
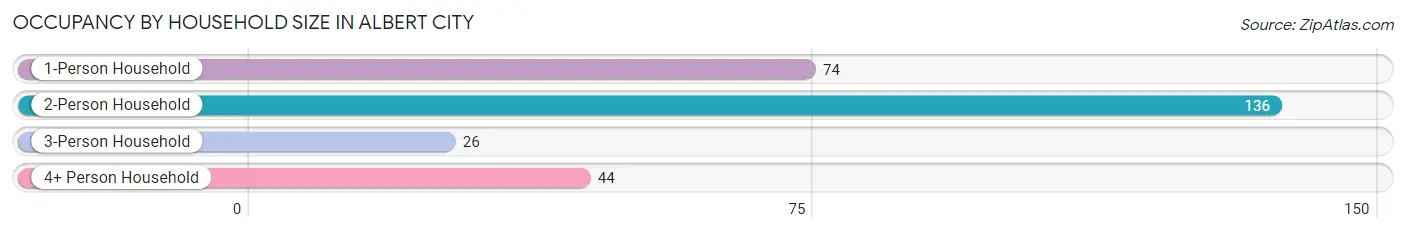
| Household Size | # Housing Units | % Housing Units |
| 1-Person Household | 74 | 26.4% |
| 2-Person Household | 136 | 48.6% |
| 3-Person Household | 26 | 9.3% |
| 4+ Person Household | 44 | 15.7% |
| Total Housing Units | 280 | 100.0% |
Occupancy by Ownership by Household Size in Albert City
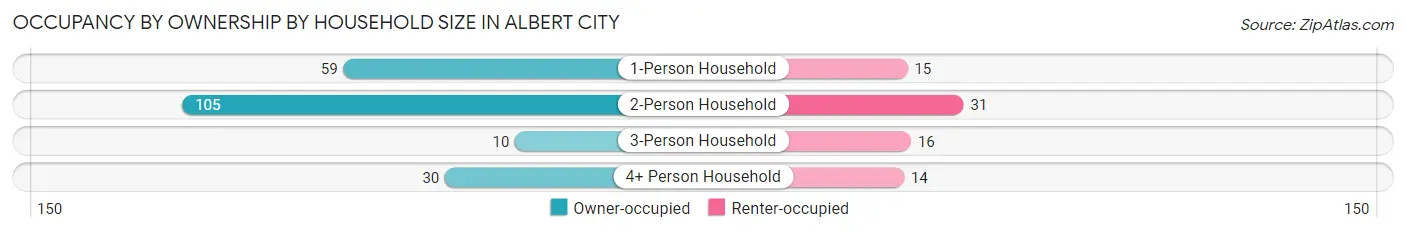
| Household Size | Owner-occupied | Renter-occupied |
| 1-Person Household | 59 (79.7%) | 15 (20.3%) |
| 2-Person Household | 105 (77.2%) | 31 (22.8%) |
| 3-Person Household | 10 (38.5%) | 16 (61.5%) |
| 4+ Person Household | 30 (68.2%) | 14 (31.8%) |
| Total Housing Units | 204 (72.9%) | 76 (27.1%) |
Occupancy by Educational Attainment in Albert City
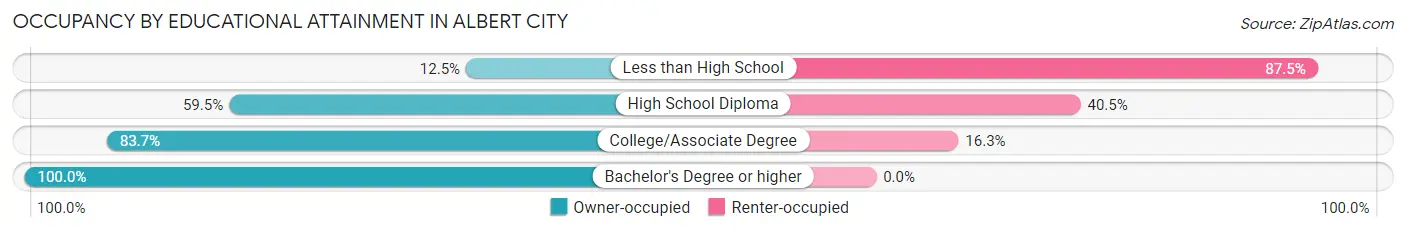
| Household Size | Owner-occupied | Renter-occupied |
| Less than High School | 2 (12.5%) | 14 (87.5%) |
| High School Diploma | 69 (59.5%) | 47 (40.5%) |
| College/Associate Degree | 77 (83.7%) | 15 (16.3%) |
| Bachelor's Degree or higher | 56 (100.0%) | 0 (0.0%) |
Occupancy by Age of Householder in Albert City
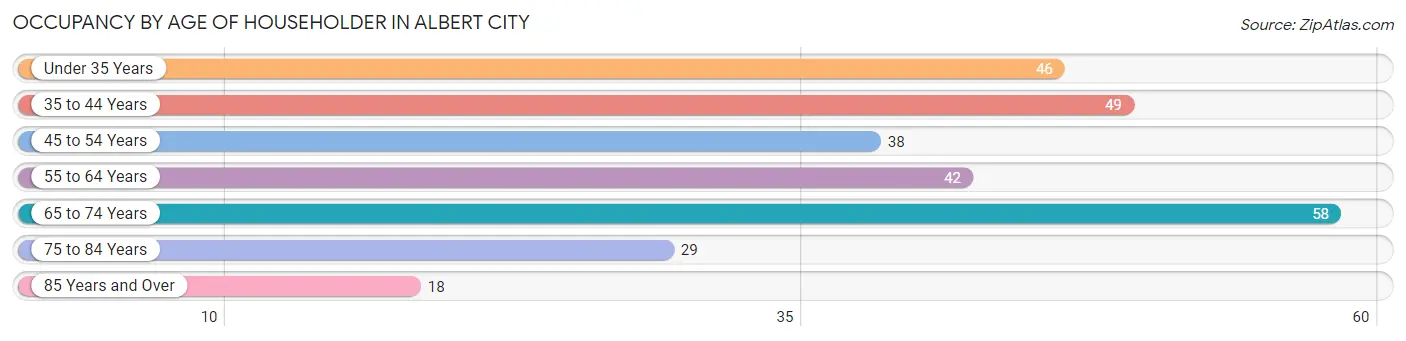
| Age Bracket | # Households | % Households |
| Under 35 Years | 46 | 16.4% |
| 35 to 44 Years | 49 | 17.5% |
| 45 to 54 Years | 38 | 13.6% |
| 55 to 64 Years | 42 | 15.0% |
| 65 to 74 Years | 58 | 20.7% |
| 75 to 84 Years | 29 | 10.4% |
| 85 Years and Over | 18 | 6.4% |
| Total | 280 | 100.0% |
Housing Finances in Albert City
Median Income by Occupancy in Albert City
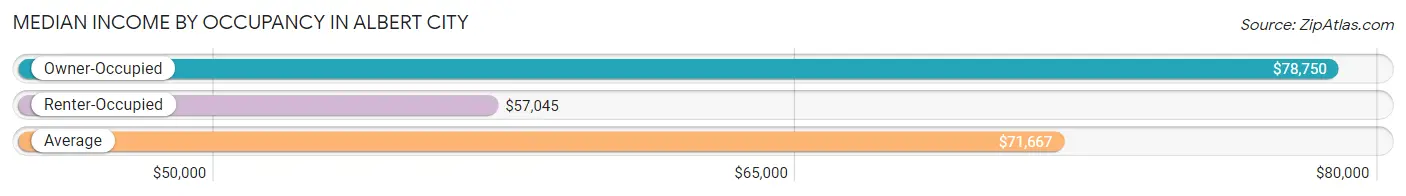
| Occupancy Type | # Households | Median Income |
| Owner-Occupied | 204 (72.9%) | $78,750 |
| Renter-Occupied | 76 (27.1%) | $57,045 |
| Average | 280 (100.0%) | $71,667 |
Occupancy by Householder Income Bracket in Albert City
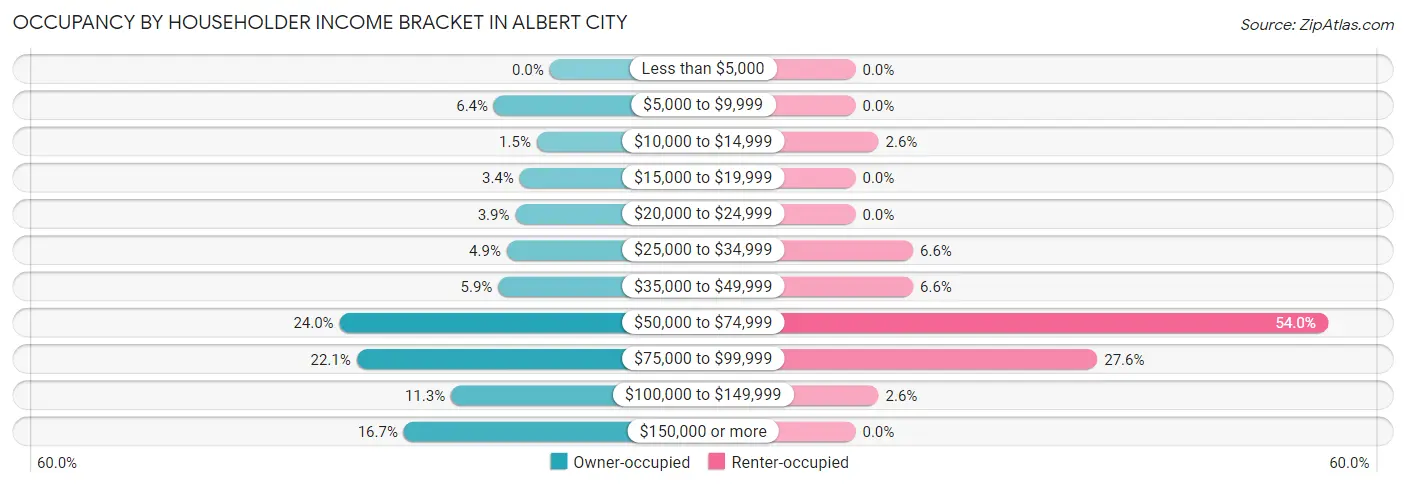
| Income Bracket | Owner-occupied | Renter-occupied |
| Less than $5,000 | 0 (0.0%) | 0 (0.0%) |
| $5,000 to $9,999 | 13 (6.4%) | 0 (0.0%) |
| $10,000 to $14,999 | 3 (1.5%) | 2 (2.6%) |
| $15,000 to $19,999 | 7 (3.4%) | 0 (0.0%) |
| $20,000 to $24,999 | 8 (3.9%) | 0 (0.0%) |
| $25,000 to $34,999 | 10 (4.9%) | 5 (6.6%) |
| $35,000 to $49,999 | 12 (5.9%) | 5 (6.6%) |
| $50,000 to $74,999 | 49 (24.0%) | 41 (53.9%) |
| $75,000 to $99,999 | 45 (22.1%) | 21 (27.6%) |
| $100,000 to $149,999 | 23 (11.3%) | 2 (2.6%) |
| $150,000 or more | 34 (16.7%) | 0 (0.0%) |
| Total | 204 (100.0%) | 76 (100.0%) |
Monthly Housing Cost Tiers in Albert City
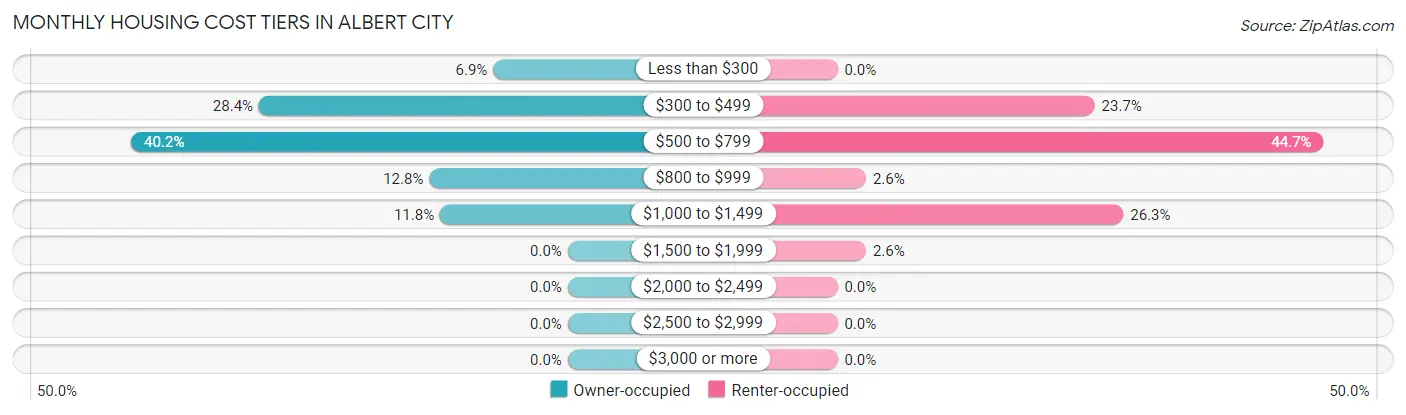
| Monthly Cost | Owner-occupied | Renter-occupied |
| Less than $300 | 14 (6.9%) | 0 (0.0%) |
| $300 to $499 | 58 (28.4%) | 18 (23.7%) |
| $500 to $799 | 82 (40.2%) | 34 (44.7%) |
| $800 to $999 | 26 (12.8%) | 2 (2.6%) |
| $1,000 to $1,499 | 24 (11.8%) | 20 (26.3%) |
| $1,500 to $1,999 | 0 (0.0%) | 2 (2.6%) |
| $2,000 to $2,499 | 0 (0.0%) | 0 (0.0%) |
| $2,500 to $2,999 | 0 (0.0%) | 0 (0.0%) |
| $3,000 or more | 0 (0.0%) | 0 (0.0%) |
| Total | 204 (100.0%) | 76 (100.0%) |
Physical Housing Characteristics in Albert City
Housing Structures in Albert City
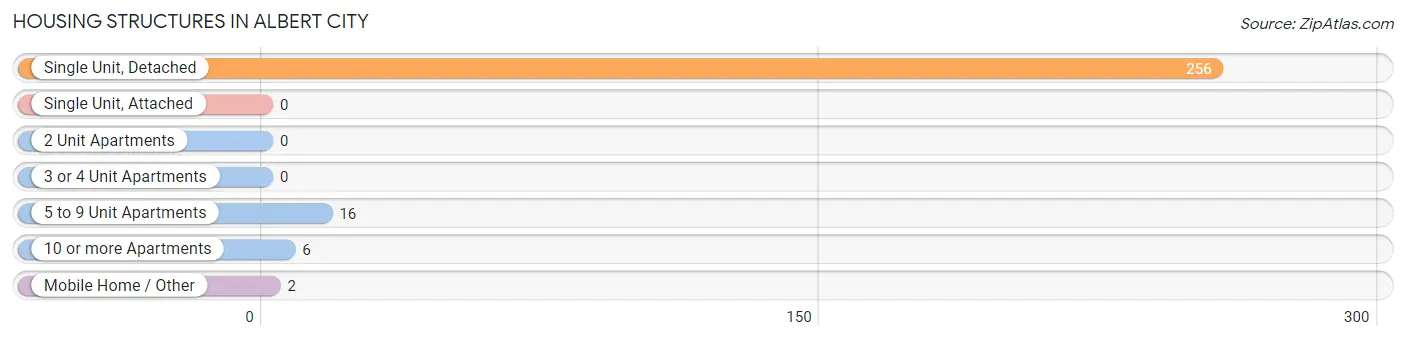
| Structure Type | # Housing Units | % Housing Units |
| Single Unit, Detached | 256 | 91.4% |
| Single Unit, Attached | 0 | 0.0% |
| 2 Unit Apartments | 0 | 0.0% |
| 3 or 4 Unit Apartments | 0 | 0.0% |
| 5 to 9 Unit Apartments | 16 | 5.7% |
| 10 or more Apartments | 6 | 2.1% |
| Mobile Home / Other | 2 | 0.7% |
| Total | 280 | 100.0% |
Housing Structures by Occupancy in Albert City
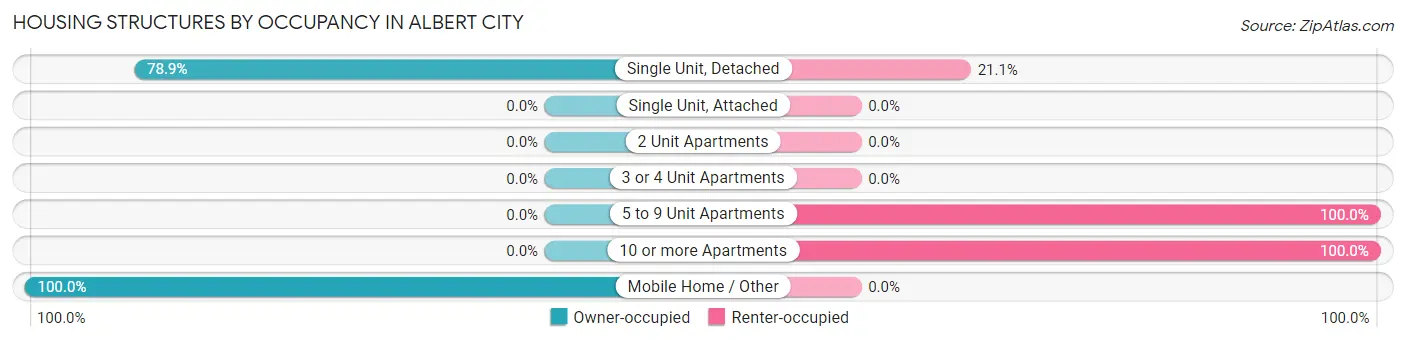
| Structure Type | Owner-occupied | Renter-occupied |
| Single Unit, Detached | 202 (78.9%) | 54 (21.1%) |
| Single Unit, Attached | 0 (0.0%) | 0 (0.0%) |
| 2 Unit Apartments | 0 (0.0%) | 0 (0.0%) |
| 3 or 4 Unit Apartments | 0 (0.0%) | 0 (0.0%) |
| 5 to 9 Unit Apartments | 0 (0.0%) | 16 (100.0%) |
| 10 or more Apartments | 0 (0.0%) | 6 (100.0%) |
| Mobile Home / Other | 2 (100.0%) | 0 (0.0%) |
| Total | 204 (72.9%) | 76 (27.1%) |
Housing Structures by Number of Rooms in Albert City
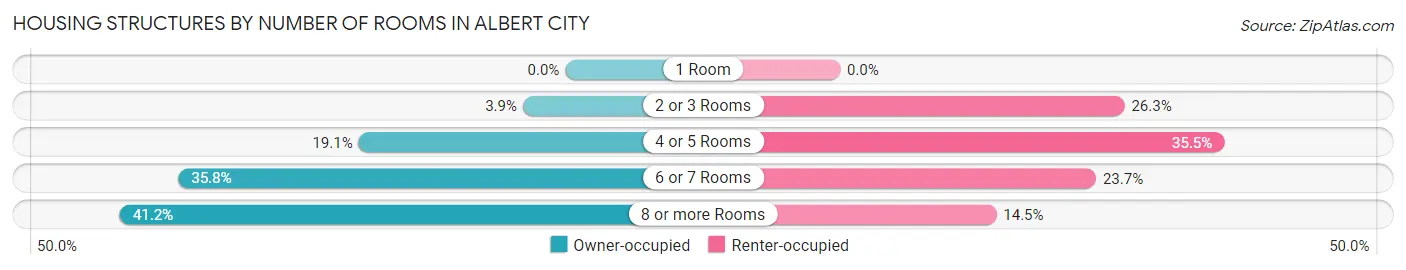
| Number of Rooms | Owner-occupied | Renter-occupied |
| 1 Room | 0 (0.0%) | 0 (0.0%) |
| 2 or 3 Rooms | 8 (3.9%) | 20 (26.3%) |
| 4 or 5 Rooms | 39 (19.1%) | 27 (35.5%) |
| 6 or 7 Rooms | 73 (35.8%) | 18 (23.7%) |
| 8 or more Rooms | 84 (41.2%) | 11 (14.5%) |
| Total | 204 (100.0%) | 76 (100.0%) |
Housing Structure by Heating Type in Albert City
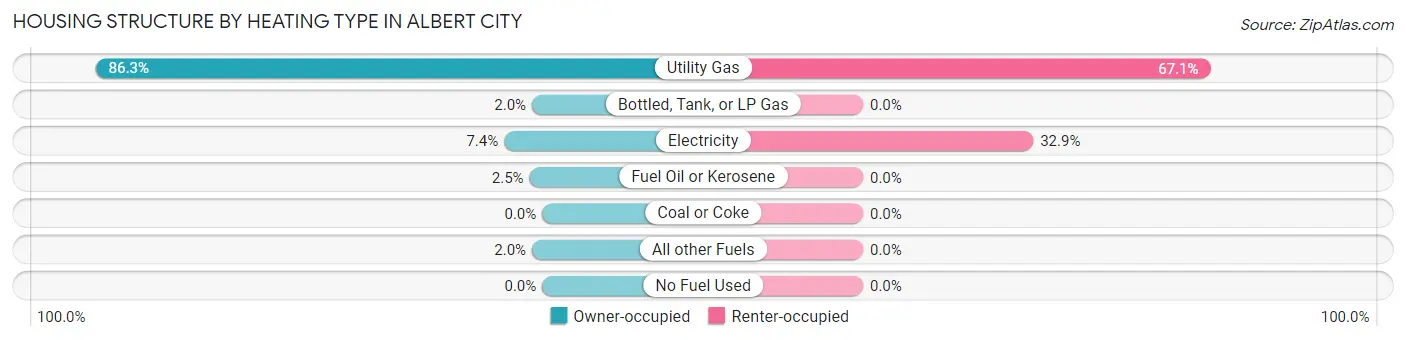
| Heating Type | Owner-occupied | Renter-occupied |
| Utility Gas | 176 (86.3%) | 51 (67.1%) |
| Bottled, Tank, or LP Gas | 4 (2.0%) | 0 (0.0%) |
| Electricity | 15 (7.3%) | 25 (32.9%) |
| Fuel Oil or Kerosene | 5 (2.5%) | 0 (0.0%) |
| Coal or Coke | 0 (0.0%) | 0 (0.0%) |
| All other Fuels | 4 (2.0%) | 0 (0.0%) |
| No Fuel Used | 0 (0.0%) | 0 (0.0%) |
| Total | 204 (100.0%) | 76 (100.0%) |
Household Vehicle Usage in Albert City
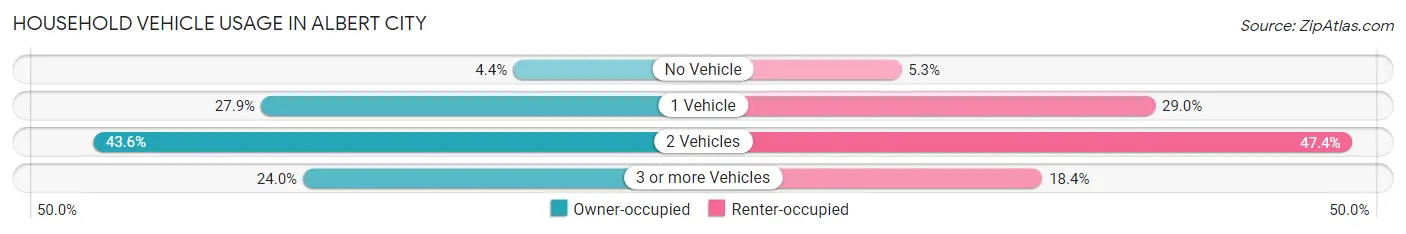
| Vehicles per Household | Owner-occupied | Renter-occupied |
| No Vehicle | 9 (4.4%) | 4 (5.3%) |
| 1 Vehicle | 57 (27.9%) | 22 (28.9%) |
| 2 Vehicles | 89 (43.6%) | 36 (47.4%) |
| 3 or more Vehicles | 49 (24.0%) | 14 (18.4%) |
| Total | 204 (100.0%) | 76 (100.0%) |
Real Estate & Mortgages in Albert City
Real Estate and Mortgage Overview in Albert City
| Characteristic | Without Mortgage | With Mortgage |
| Housing Units | 150 | 54 |
| Median Property Value | $86,400 | $72,500 |
| Median Household Income | $73,929 | $5 |
| Monthly Housing Costs | $523 | $0 |
| Real Estate Taxes | $953 | $0 |
Property Value by Mortgage Status in Albert City
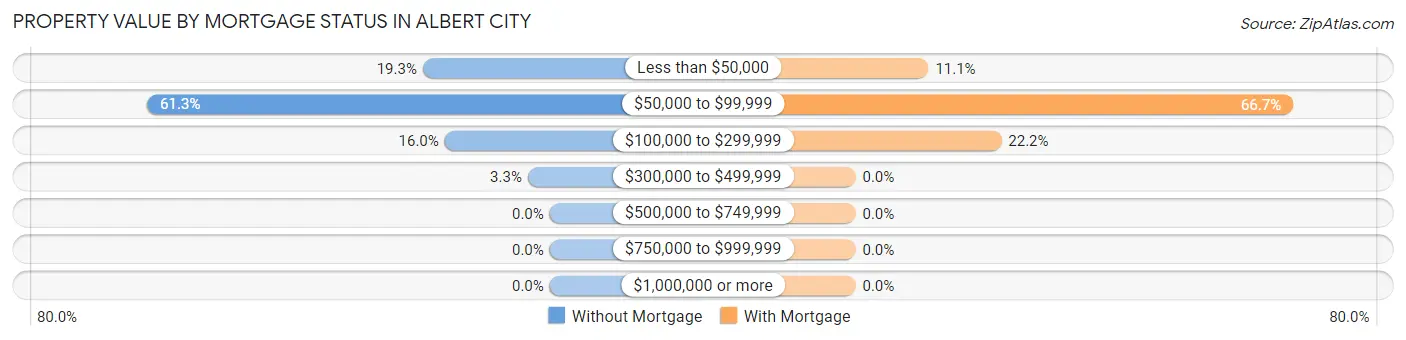
| Property Value | Without Mortgage | With Mortgage |
| Less than $50,000 | 29 (19.3%) | 6 (11.1%) |
| $50,000 to $99,999 | 92 (61.3%) | 36 (66.7%) |
| $100,000 to $299,999 | 24 (16.0%) | 12 (22.2%) |
| $300,000 to $499,999 | 5 (3.3%) | 0 (0.0%) |
| $500,000 to $749,999 | 0 (0.0%) | 0 (0.0%) |
| $750,000 to $999,999 | 0 (0.0%) | 0 (0.0%) |
| $1,000,000 or more | 0 (0.0%) | 0 (0.0%) |
| Total | 150 (100.0%) | 54 (100.0%) |
Household Income by Mortgage Status in Albert City
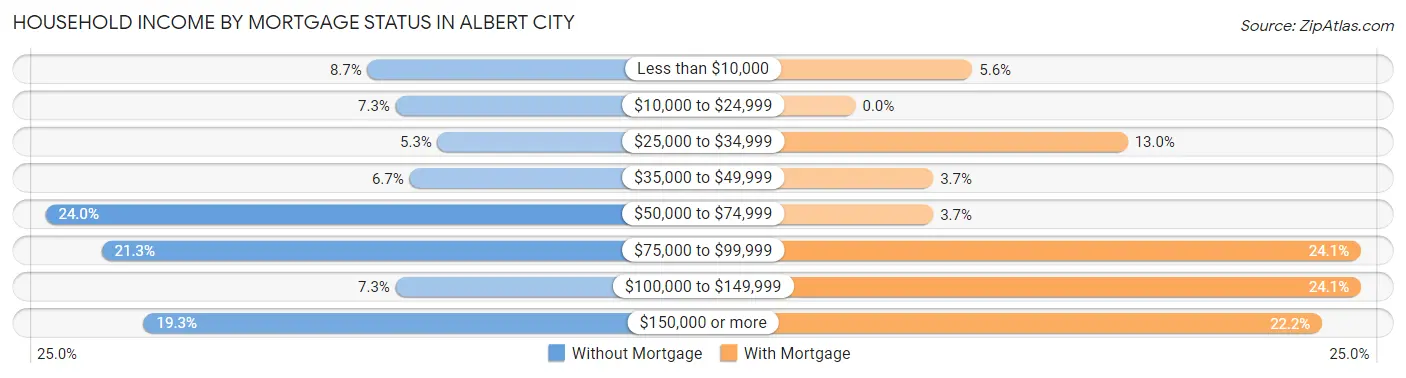
| Household Income | Without Mortgage | With Mortgage |
| Less than $10,000 | 13 (8.7%) | 3 (5.6%) |
| $10,000 to $24,999 | 11 (7.3%) | 0 (0.0%) |
| $25,000 to $34,999 | 8 (5.3%) | 7 (13.0%) |
| $35,000 to $49,999 | 10 (6.7%) | 2 (3.7%) |
| $50,000 to $74,999 | 36 (24.0%) | 2 (3.7%) |
| $75,000 to $99,999 | 32 (21.3%) | 13 (24.1%) |
| $100,000 to $149,999 | 11 (7.3%) | 13 (24.1%) |
| $150,000 or more | 29 (19.3%) | 12 (22.2%) |
| Total | 150 (100.0%) | 54 (100.0%) |
Property Value to Household Income Ratio in Albert City
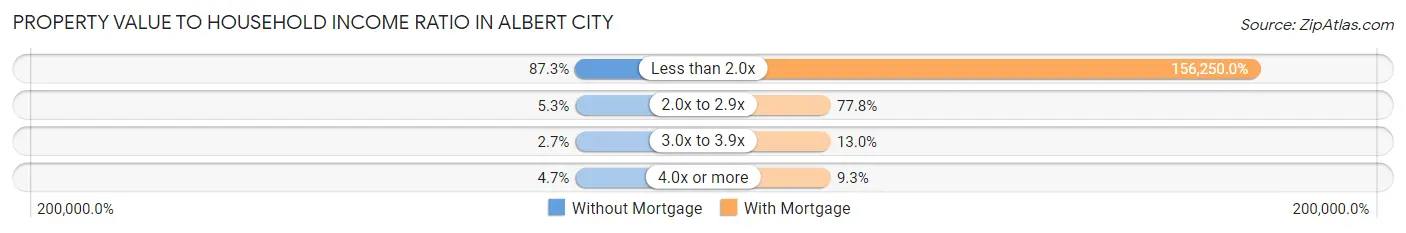
| Value-to-Income Ratio | Without Mortgage | With Mortgage |
| Less than 2.0x | 131 (87.3%) | 84,375 (156,250.0%) |
| 2.0x to 2.9x | 8 (5.3%) | 42 (77.8%) |
| 3.0x to 3.9x | 4 (2.7%) | 7 (13.0%) |
| 4.0x or more | 7 (4.7%) | 5 (9.3%) |
| Total | 150 (100.0%) | 54 (100.0%) |
Real Estate Taxes by Mortgage Status in Albert City
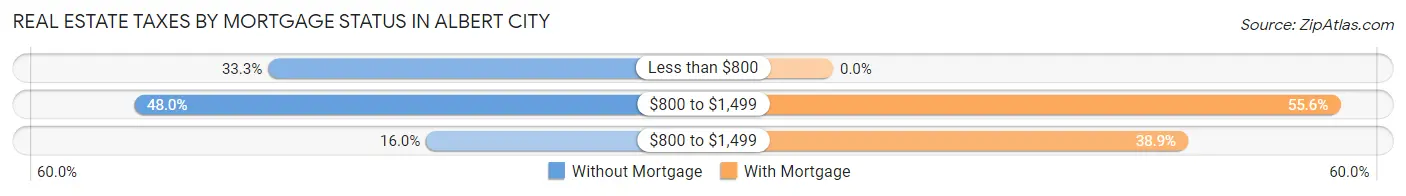
| Property Taxes | Without Mortgage | With Mortgage |
| Less than $800 | 50 (33.3%) | 0 (0.0%) |
| $800 to $1,499 | 72 (48.0%) | 30 (55.6%) |
| $800 to $1,499 | 24 (16.0%) | 21 (38.9%) |
| Total | 150 (100.0%) | 54 (100.0%) |
Health & Disability in Albert City
Health Insurance Coverage by Age in Albert City
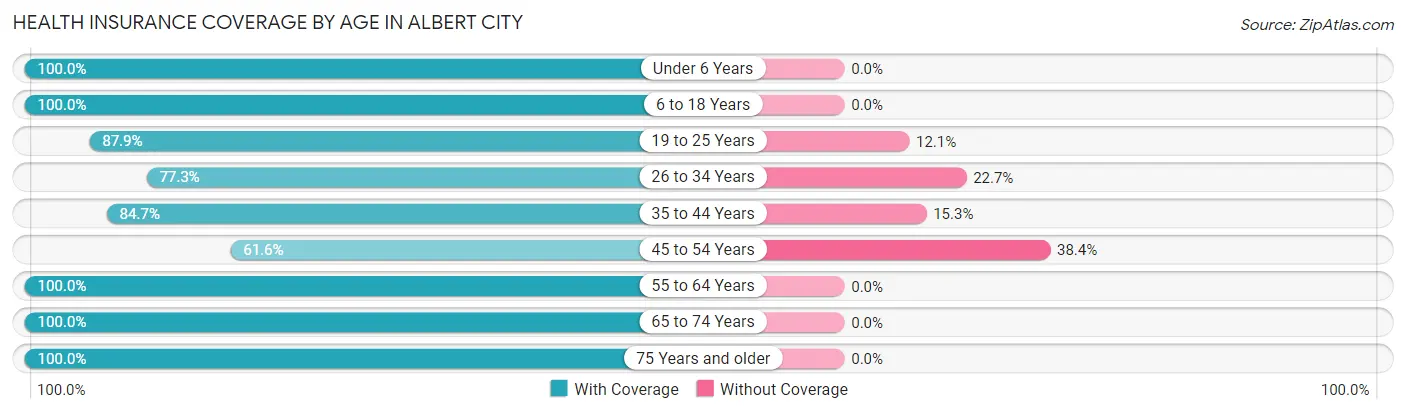
| Age Bracket | With Coverage | Without Coverage |
| Under 6 Years | 79 (100.0%) | 0 (0.0%) |
| 6 to 18 Years | 47 (100.0%) | 0 (0.0%) |
| 19 to 25 Years | 51 (87.9%) | 7 (12.1%) |
| 26 to 34 Years | 51 (77.3%) | 15 (22.7%) |
| 35 to 44 Years | 61 (84.7%) | 11 (15.3%) |
| 45 to 54 Years | 45 (61.6%) | 28 (38.4%) |
| 55 to 64 Years | 66 (100.0%) | 0 (0.0%) |
| 65 to 74 Years | 105 (100.0%) | 0 (0.0%) |
| 75 Years and older | 64 (100.0%) | 0 (0.0%) |
| Total | 569 (90.3%) | 61 (9.7%) |
Health Insurance Coverage by Citizenship Status in Albert City
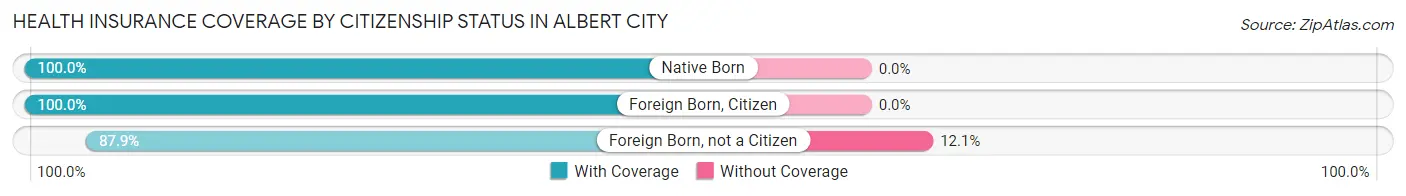
| Citizenship Status | With Coverage | Without Coverage |
| Native Born | 79 (100.0%) | 0 (0.0%) |
| Foreign Born, Citizen | 47 (100.0%) | 0 (0.0%) |
| Foreign Born, not a Citizen | 51 (87.9%) | 7 (12.1%) |
Health Insurance Coverage by Household Income in Albert City
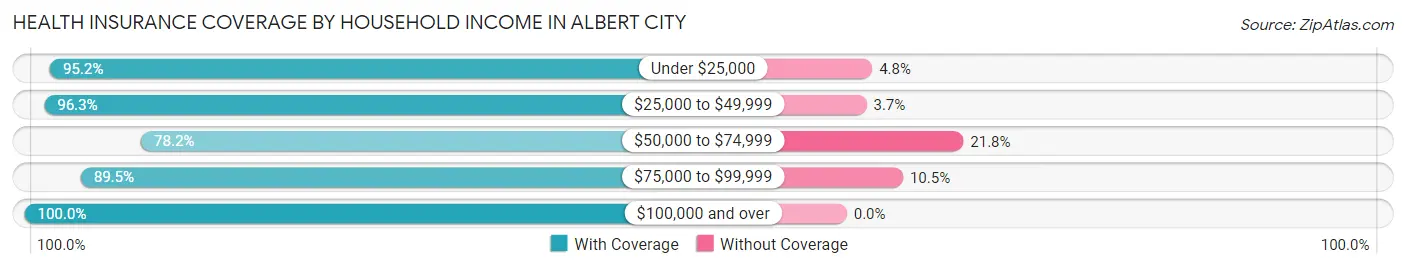
| Household Income | With Coverage | Without Coverage |
| Under $25,000 | 60 (95.2%) | 3 (4.8%) |
| $25,000 to $49,999 | 52 (96.3%) | 2 (3.7%) |
| $50,000 to $74,999 | 136 (78.2%) | 38 (21.8%) |
| $75,000 to $99,999 | 153 (89.5%) | 18 (10.5%) |
| $100,000 and over | 168 (100.0%) | 0 (0.0%) |
Public vs Private Health Insurance Coverage by Age in Albert City
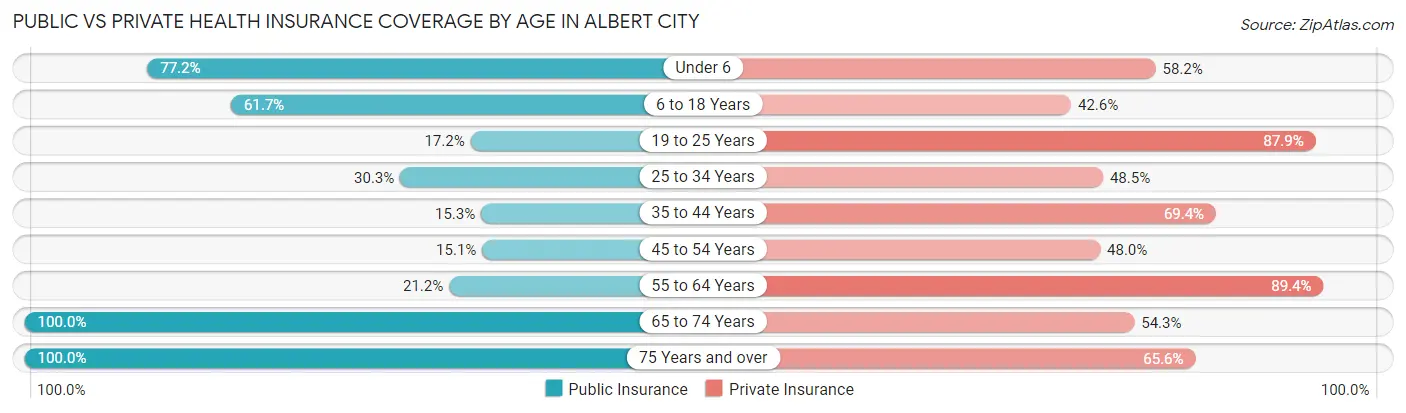
| Age Bracket | Public Insurance | Private Insurance |
| Under 6 | 61 (77.2%) | 46 (58.2%) |
| 6 to 18 Years | 29 (61.7%) | 20 (42.5%) |
| 19 to 25 Years | 10 (17.2%) | 51 (87.9%) |
| 25 to 34 Years | 20 (30.3%) | 32 (48.5%) |
| 35 to 44 Years | 11 (15.3%) | 50 (69.4%) |
| 45 to 54 Years | 11 (15.1%) | 35 (47.9%) |
| 55 to 64 Years | 14 (21.2%) | 59 (89.4%) |
| 65 to 74 Years | 105 (100.0%) | 57 (54.3%) |
| 75 Years and over | 64 (100.0%) | 42 (65.6%) |
| Total | 325 (51.6%) | 392 (62.2%) |
Disability Status by Sex by Age in Albert City
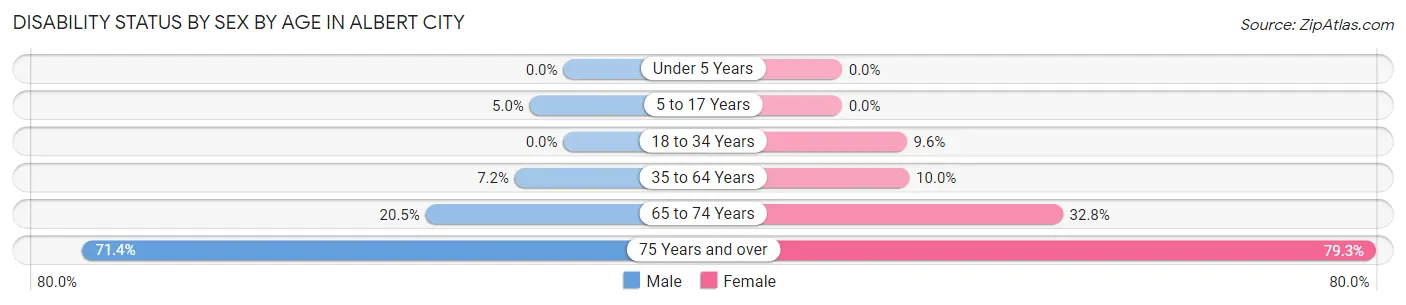
| Age Bracket | Male | Female |
| Under 5 Years | 0 (0.0%) | 0 (0.0%) |
| 5 to 17 Years | 3 (5.0%) | 0 (0.0%) |
| 18 to 34 Years | 0 (0.0%) | 5 (9.6%) |
| 35 to 64 Years | 8 (7.2%) | 10 (10.0%) |
| 65 to 74 Years | 9 (20.4%) | 20 (32.8%) |
| 75 Years and over | 25 (71.4%) | 23 (79.3%) |
Disability Class by Sex by Age in Albert City
Disability Class: Hearing Difficulty
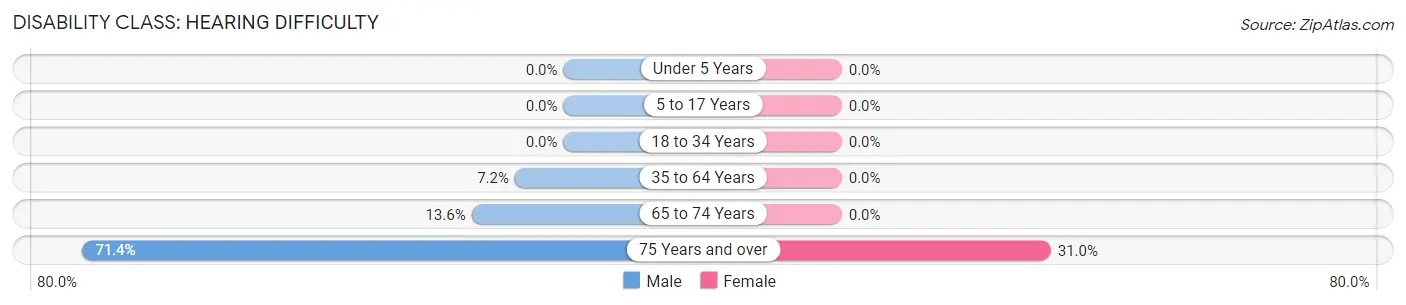
| Age Bracket | Male | Female |
| Under 5 Years | 0 (0.0%) | 0 (0.0%) |
| 5 to 17 Years | 0 (0.0%) | 0 (0.0%) |
| 18 to 34 Years | 0 (0.0%) | 0 (0.0%) |
| 35 to 64 Years | 8 (7.2%) | 0 (0.0%) |
| 65 to 74 Years | 6 (13.6%) | 0 (0.0%) |
| 75 Years and over | 25 (71.4%) | 9 (31.0%) |
Disability Class: Vision Difficulty
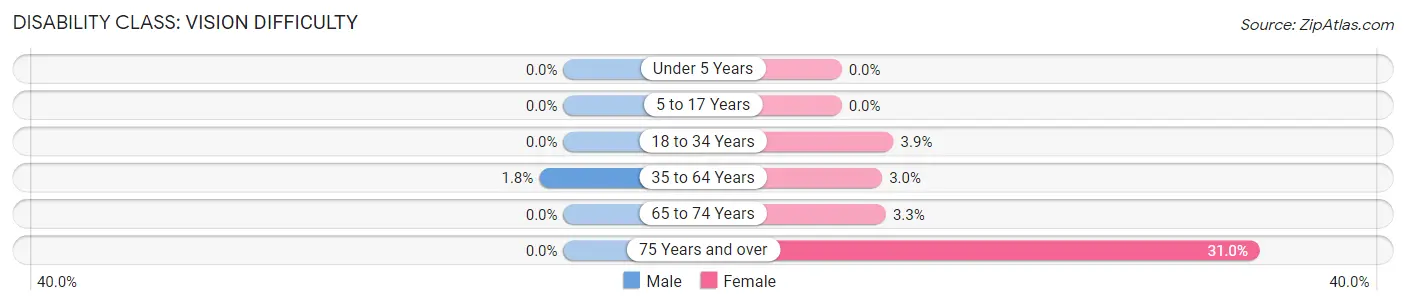
| Age Bracket | Male | Female |
| Under 5 Years | 0 (0.0%) | 0 (0.0%) |
| 5 to 17 Years | 0 (0.0%) | 0 (0.0%) |
| 18 to 34 Years | 0 (0.0%) | 2 (3.8%) |
| 35 to 64 Years | 2 (1.8%) | 3 (3.0%) |
| 65 to 74 Years | 0 (0.0%) | 2 (3.3%) |
| 75 Years and over | 0 (0.0%) | 9 (31.0%) |
Disability Class: Cognitive Difficulty
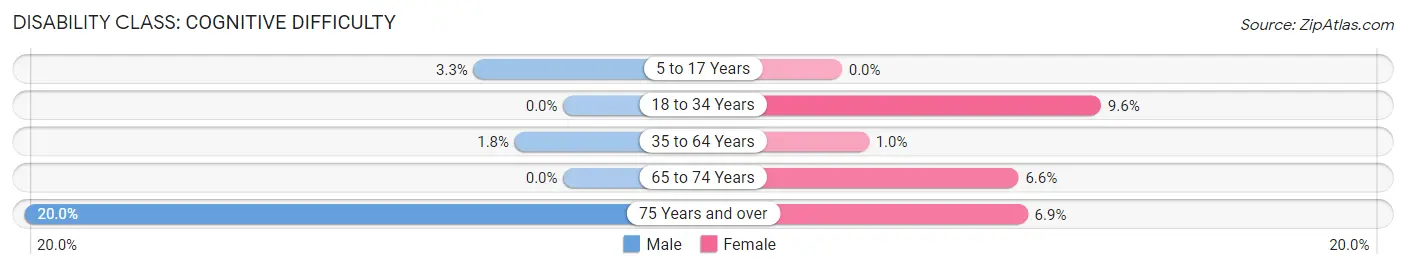
| Age Bracket | Male | Female |
| 5 to 17 Years | 2 (3.3%) | 0 (0.0%) |
| 18 to 34 Years | 0 (0.0%) | 5 (9.6%) |
| 35 to 64 Years | 2 (1.8%) | 1 (1.0%) |
| 65 to 74 Years | 0 (0.0%) | 4 (6.6%) |
| 75 Years and over | 7 (20.0%) | 2 (6.9%) |
Disability Class: Ambulatory Difficulty
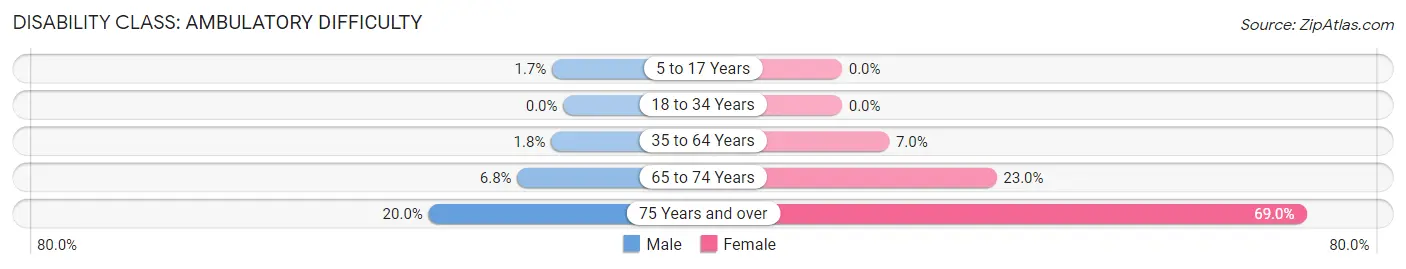
| Age Bracket | Male | Female |
| 5 to 17 Years | 1 (1.7%) | 0 (0.0%) |
| 18 to 34 Years | 0 (0.0%) | 0 (0.0%) |
| 35 to 64 Years | 2 (1.8%) | 7 (7.0%) |
| 65 to 74 Years | 3 (6.8%) | 14 (23.0%) |
| 75 Years and over | 7 (20.0%) | 20 (69.0%) |
Disability Class: Self-Care Difficulty
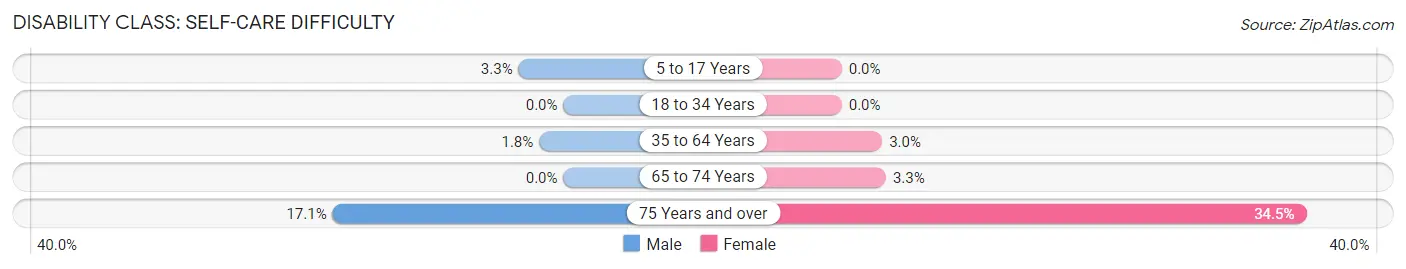
| Age Bracket | Male | Female |
| 5 to 17 Years | 2 (3.3%) | 0 (0.0%) |
| 18 to 34 Years | 0 (0.0%) | 0 (0.0%) |
| 35 to 64 Years | 2 (1.8%) | 3 (3.0%) |
| 65 to 74 Years | 0 (0.0%) | 2 (3.3%) |
| 75 Years and over | 6 (17.1%) | 10 (34.5%) |
Technology Access in Albert City
Computing Device Access in Albert City
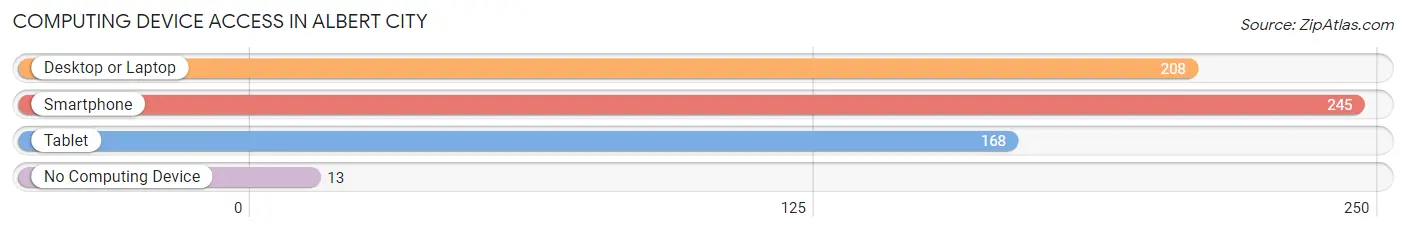
| Device Type | # Households | % Households |
| Desktop or Laptop | 208 | 74.3% |
| Smartphone | 245 | 87.5% |
| Tablet | 168 | 60.0% |
| No Computing Device | 13 | 4.6% |
| Total | 280 | 100.0% |
Internet Access in Albert City
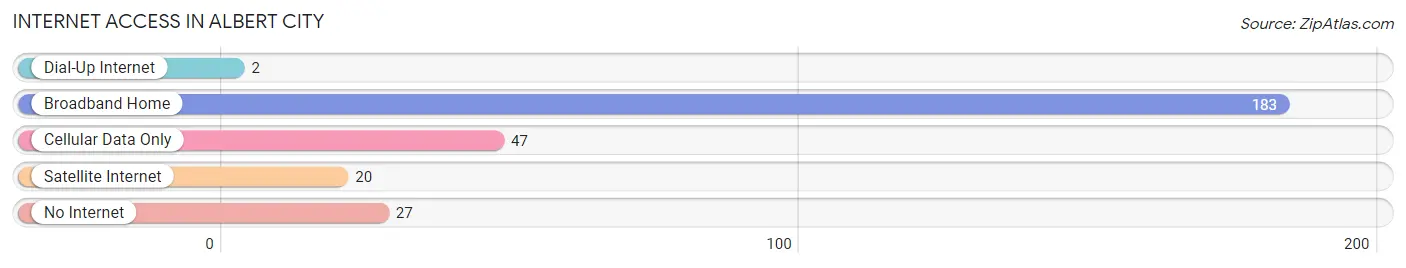
| Internet Type | # Households | % Households |
| Dial-Up Internet | 2 | 0.7% |
| Broadband Home | 183 | 65.4% |
| Cellular Data Only | 47 | 16.8% |
| Satellite Internet | 20 | 7.1% |
| No Internet | 27 | 9.6% |
| Total | 280 | 100.0% |
Albert City Summary
Albert City is a small city located in Buena Vista County, Iowa. It is situated on the banks of the Little Sioux River, and is part of the Storm Lake Metropolitan Statistical Area. The city has a population of approximately 1,000 people, and is known for its rural charm and friendly atmosphere.
Geography
Albert City is located in the northwest corner of Buena Vista County, Iowa. It is situated on the banks of the Little Sioux River, and is part of the Storm Lake Metropolitan Statistical Area. The city is located at an elevation of 1,072 feet above sea level. The city has a total area of 0.9 square miles, all of which is land.
The climate in Albert City is classified as humid continental, with hot summers and cold winters. The average temperature in the summer is around 75 degrees Fahrenheit, and the average temperature in the winter is around 20 degrees Fahrenheit. The average annual precipitation is around 30 inches.
History
Albert City was founded in 1881 by Albert and Mary Ann Smith. The city was named after Albert Smith, who was a prominent local businessman. The city was incorporated in 1883, and the first post office was established in 1884.
The city grew rapidly in the late 19th and early 20th centuries, and by 1910, the population had grown to over 1,000 people. The city was home to several businesses, including a bank, a hotel, a newspaper, and a variety of stores.
In the mid-20th century, the city began to decline as the population shifted to larger cities. The population dropped to just over 500 people by the 1970s. However, in recent years, the city has seen a resurgence in population and economic activity.
Economy
The economy of Albert City is largely based on agriculture and tourism. The city is home to several farms, which produce a variety of crops, including corn, soybeans, and hay. The city is also home to several tourist attractions, including the Albert City Historical Museum and the Albert City Speedway.
The city is also home to several small businesses, including restaurants, retail stores, and service providers. The city is served by several major highways, including Interstate 90 and U.S. Route 20.
Demographics
As of the 2010 census, the population of Albert City was 1,000 people. The racial makeup of the city was 97.2% White, 0.7% African American, 0.2% Native American, 0.2% Asian, 0.2% from other races, and 1.7% from two or more races. Hispanic or Latino of any race were 1.2% of the population.
The median household income in Albert City was $41,250, and the median family income was $48,750. The per capita income was $19,945. About 11.2% of families and 14.2% of the population were below the poverty line, including 18.2% of those under age 18 and 8.2% of those age 65 or over.
Conclusion
Albert City is a small city located in Buena Vista County, Iowa. It is situated on the banks of the Little Sioux River, and is part of the Storm Lake Metropolitan Statistical Area. The city has a population of approximately 1,000 people, and is known for its rural charm and friendly atmosphere. The economy of Albert City is largely based on agriculture and tourism, and the city is home to several small businesses. The population of Albert City is predominantly White, with a small percentage of African American, Native American, and Asian residents. The median household income in Albert City is $41,250, and the median family income is $48,750.
Common Questions
What is Per Capita Income in Albert City?
Per Capita income in Albert City is $36,348.
What is the Median Family Income in Albert City?
Median Family Income in Albert City is $83,906.
What is the Median Household income in Albert City?
Median Household Income in Albert City is $71,667.
What is Income or Wage Gap in Albert City?
Income or Wage Gap in Albert City is 55.4%.
Women in Albert City earn 44.6 cents for every dollar earned by a man.
What is Inequality or Gini Index in Albert City?
Inequality or Gini Index in Albert City is 0.44.
What is the Total Population of Albert City?
Total Population of Albert City is 666.
What is the Total Male Population of Albert City?
Total Male Population of Albert City is 359.
What is the Total Female Population of Albert City?
Total Female Population of Albert City is 307.
What is the Ratio of Males per 100 Females in Albert City?
There are 116.94 Males per 100 Females in Albert City.
What is the Ratio of Females per 100 Males in Albert City?
There are 85.52 Females per 100 Males in Albert City.
What is the Median Population Age in Albert City?
Median Population Age in Albert City is 45.8 Years.
What is the Average Family Size in Albert City
Average Family Size in Albert City is 2.8 People.
What is the Average Household Size in Albert City
Average Household Size in Albert City is 2.2 People.
How Large is the Labor Force in Albert City?
There are 348 People in the Labor Forcein in Albert City.
What is the Percentage of People in the Labor Force in Albert City?
61.7% of People are in the Labor Force in Albert City.
What is the Unemployment Rate in Albert City?
Unemployment Rate in Albert City is 5.2%.