Woodland, GA Map & Demographics
Woodland Map
Woodland Overview
$21,979
PER CAPITA INCOME
$53,500
AVG FAMILY INCOME
$31,850
AVG HOUSEHOLD INCOME
9.4%
WAGE / INCOME GAP [ % ]
90.6¢/ $1
WAGE / INCOME GAP [ $ ]
0.44
INEQUALITY / GINI INDEX
296
TOTAL POPULATION
127
MALE POPULATION
169
FEMALE POPULATION
75.15
MALES / 100 FEMALES
133.07
FEMALES / 100 MALES
58.8
MEDIAN AGE
2.6
AVG FAMILY SIZE
2.0
AVG HOUSEHOLD SIZE
99
LABOR FORCE [ PEOPLE ]
38.4%
PERCENT IN LABOR FORCE
10.1%
UNEMPLOYMENT RATE
Woodland Zip Codes
Woodland Area Codes
Income in Woodland
Income Overview in Woodland
Per Capita Income in Woodland is $21,979, while median incomes of families and households are $53,500 and $31,850 respectively.
| Characteristic | Number | Measure |
| Per Capita Income | 296 | $21,979 |
| Median Family Income | 66 | $53,500 |
| Mean Family Income | 66 | $59,241 |
| Median Household Income | 151 | $31,850 |
| Mean Household Income | 151 | $43,495 |
| Income Deficit | 66 | $0 |
| Wage / Income Gap (%) | 296 | 9.41% |
| Wage / Income Gap ($) | 296 | 90.59¢ per $1 |
| Gini / Inequality Index | 296 | 0.44 |
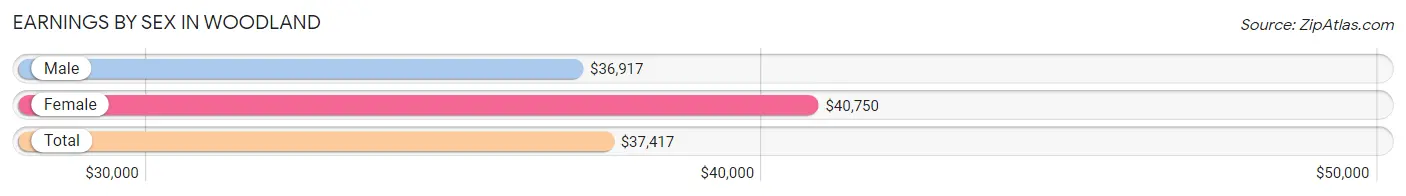
Earnings by Sex in Woodland
Average Earnings in Woodland are $37,417, $36,917 for men and $40,750 for women, a difference of 9.4%.
| Sex | Number | Average Earnings |
| Male | 53 (55.8%) | $36,917 |
| Female | 42 (44.2%) | $40,750 |
| Total | 95 (100.0%) | $37,417 |
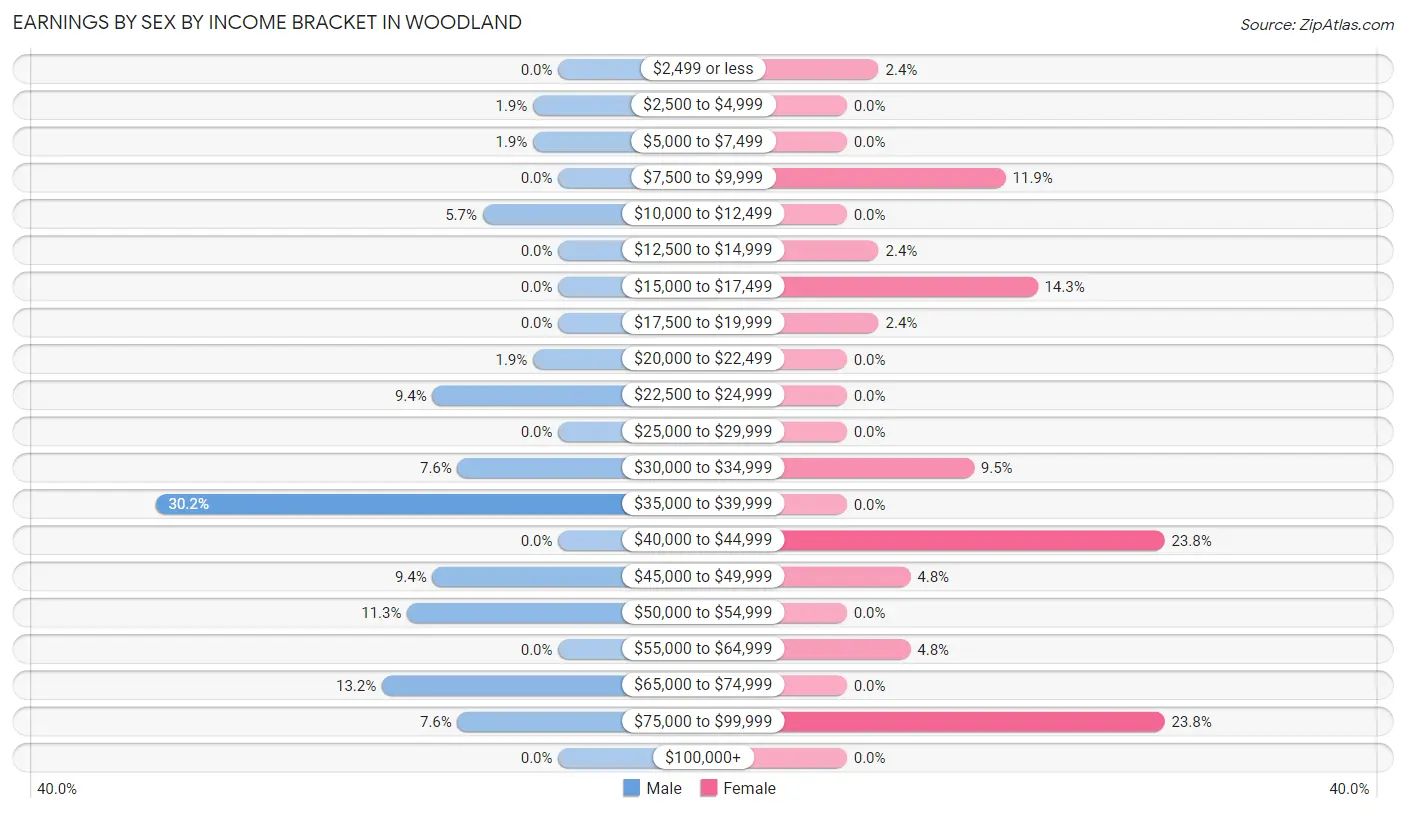
Earnings by Sex by Income Bracket in Woodland
The most common earnings brackets in Woodland are $35,000 to $39,999 for men (16 | 30.2%) and $40,000 to $44,999 for women (10 | 23.8%).
| Income | Male | Female |
| $2,499 or less | 0 (0.0%) | 1 (2.4%) |
| $2,500 to $4,999 | 1 (1.9%) | 0 (0.0%) |
| $5,000 to $7,499 | 1 (1.9%) | 0 (0.0%) |
| $7,500 to $9,999 | 0 (0.0%) | 5 (11.9%) |
| $10,000 to $12,499 | 3 (5.7%) | 0 (0.0%) |
| $12,500 to $14,999 | 0 (0.0%) | 1 (2.4%) |
| $15,000 to $17,499 | 0 (0.0%) | 6 (14.3%) |
| $17,500 to $19,999 | 0 (0.0%) | 1 (2.4%) |
| $20,000 to $22,499 | 1 (1.9%) | 0 (0.0%) |
| $22,500 to $24,999 | 5 (9.4%) | 0 (0.0%) |
| $25,000 to $29,999 | 0 (0.0%) | 0 (0.0%) |
| $30,000 to $34,999 | 4 (7.5%) | 4 (9.5%) |
| $35,000 to $39,999 | 16 (30.2%) | 0 (0.0%) |
| $40,000 to $44,999 | 0 (0.0%) | 10 (23.8%) |
| $45,000 to $49,999 | 5 (9.4%) | 2 (4.8%) |
| $50,000 to $54,999 | 6 (11.3%) | 0 (0.0%) |
| $55,000 to $64,999 | 0 (0.0%) | 2 (4.8%) |
| $65,000 to $74,999 | 7 (13.2%) | 0 (0.0%) |
| $75,000 to $99,999 | 4 (7.5%) | 10 (23.8%) |
| $100,000+ | 0 (0.0%) | 0 (0.0%) |
| Total | 53 (100.0%) | 42 (100.0%) |
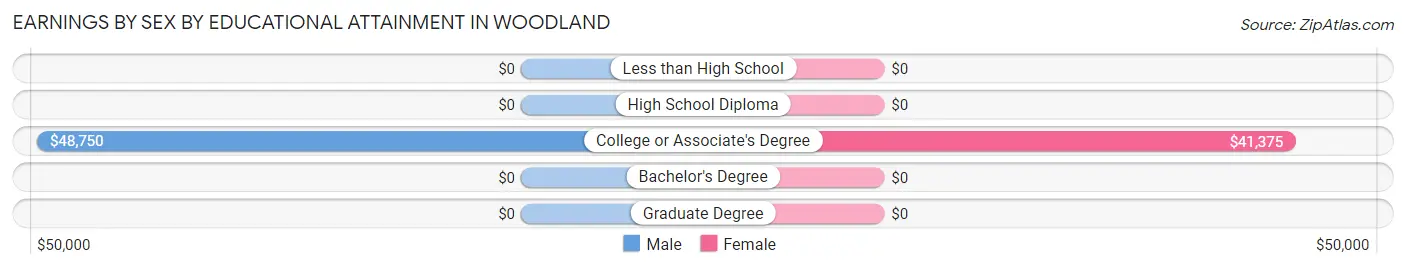
Earnings by Sex by Educational Attainment in Woodland
Average earnings in Woodland are $37,167 for men and $40,875 for women, a difference of 9.1%. Men with an educational attainment of college or associate's degree enjoy the highest average annual earnings of $48,750, while those with college or associate's degree education earn the least with $48,750. Women with an educational attainment of college or associate's degree earn the most with the average annual earnings of $41,375, while those with college or associate's degree education have the smallest earnings of $41,375.
| Educational Attainment | Male Income | Female Income |
| Less than High School | - | - |
| High School Diploma | - | - |
| College or Associate's Degree | $48,750 | $41,375 |
| Bachelor's Degree | - | - |
| Graduate Degree | - | - |
| Total | $37,167 | $40,875 |
Family Income in Woodland
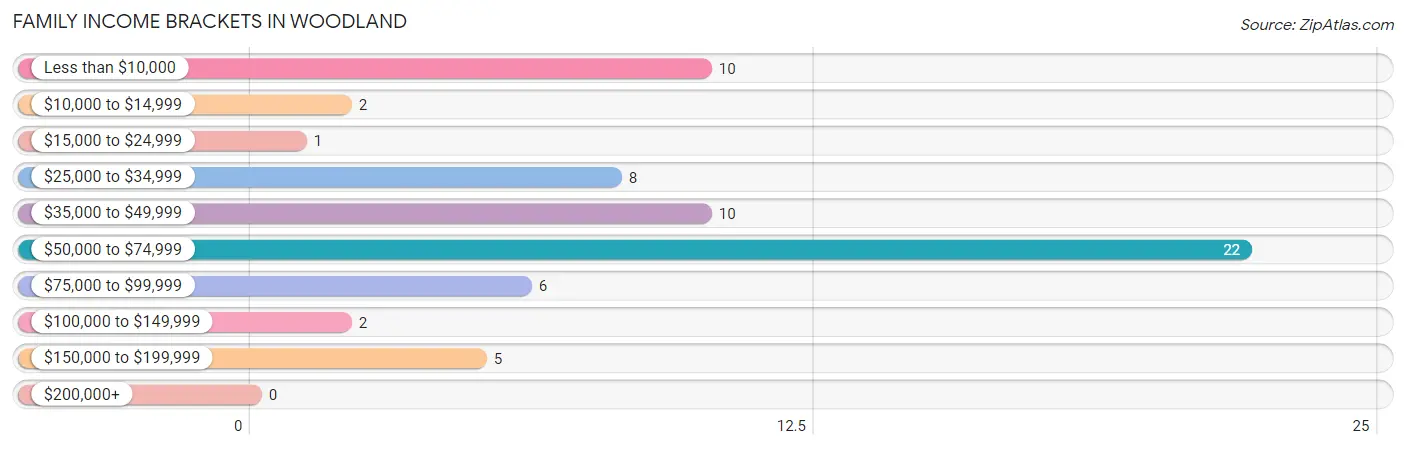
Family Income Brackets in Woodland
According to the Woodland family income data, there are 22 families falling into the $50,000 to $74,999 income range, which is the most common income bracket and makes up 33.3% of all families.
| Income Bracket | # Families | % Families |
| Less than $10,000 | 10 | 15.2% |
| $10,000 to $14,999 | 2 | 3.0% |
| $15,000 to $24,999 | 1 | 1.5% |
| $25,000 to $34,999 | 8 | 12.1% |
| $35,000 to $49,999 | 10 | 15.2% |
| $50,000 to $74,999 | 22 | 33.3% |
| $75,000 to $99,999 | 6 | 9.1% |
| $100,000 to $149,999 | 2 | 3.0% |
| $150,000 to $199,999 | 5 | 7.6% |
| $200,000+ | 0 | 0.0% |
Family Income by Famaliy Size in Woodland
| Income Bracket | # Families | Median Income |
| 2-Person Families | 39 (59.1%) | $0 |
| 3-Person Families | 15 (22.7%) | $0 |
| 4-Person Families | 6 (9.1%) | $0 |
| 5-Person Families | 0 (0.0%) | $0 |
| 6-Person Families | 6 (9.1%) | $0 |
| 7+ Person Families | 0 (0.0%) | $0 |
| Total | 66 (100.0%) | $53,500 |
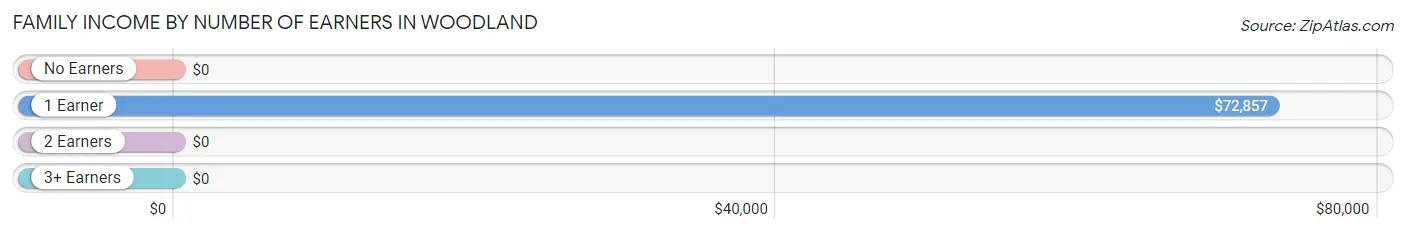
Family Income by Number of Earners in Woodland
| Number of Earners | # Families | Median Income |
| No Earners | 24 (36.4%) | $0 |
| 1 Earner | 26 (39.4%) | $72,857 |
| 2 Earners | 16 (24.2%) | $0 |
| 3+ Earners | 0 (0.0%) | $0 |
| Total | 66 (100.0%) | $53,500 |
Household Income in Woodland
Household Income Brackets in Woodland
With 27 households falling in the category, the $25,000 to $34,999 income range is the most frequent in Woodland, accounting for 17.9% of all households.
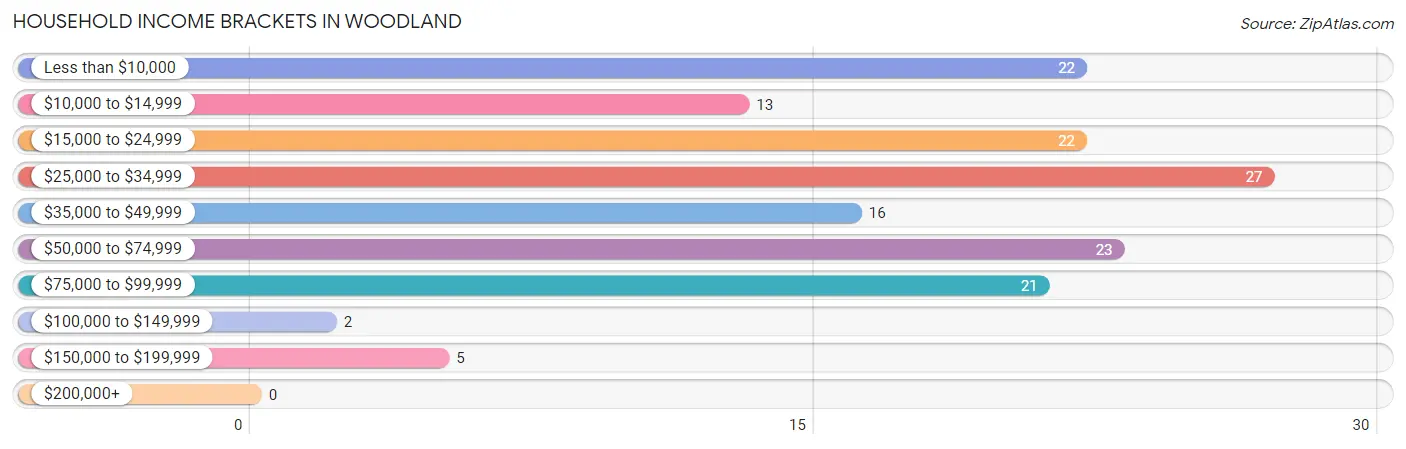
| Income Bracket | # Households | % Households |
| Less than $10,000 | 22 | 14.6% |
| $10,000 to $14,999 | 13 | 8.6% |
| $15,000 to $24,999 | 22 | 14.6% |
| $25,000 to $34,999 | 27 | 17.9% |
| $35,000 to $49,999 | 16 | 10.6% |
| $50,000 to $74,999 | 23 | 15.2% |
| $75,000 to $99,999 | 21 | 13.9% |
| $100,000 to $149,999 | 2 | 1.3% |
| $150,000 to $199,999 | 5 | 3.3% |
| $200,000+ | 0 | 0.0% |
Household Income by Householder Age in Woodland
The median household income in Woodland is $31,850, with the highest median household income of $78,750 found in the 25 to 44 years age bracket for the primary householder. A total of 27 households (17.9%) fall into this category. Meanwhile, the 15 to 24 years age bracket for the primary householder has the lowest median household income of $0, with 1 households (0.7%) in this group.
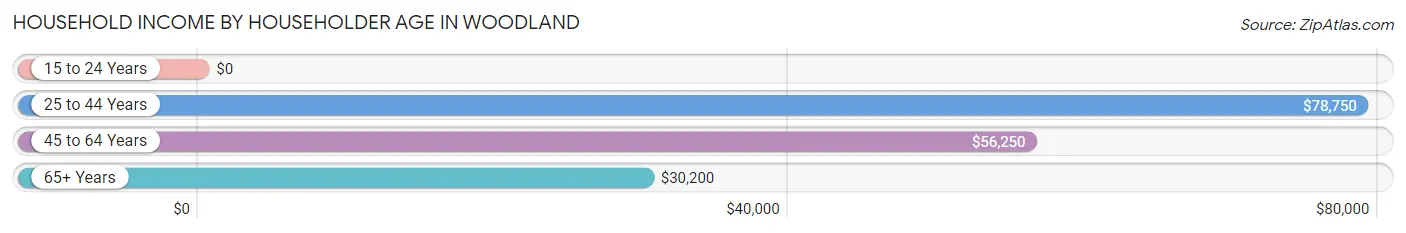
| Income Bracket | # Households | Median Income |
| 15 to 24 Years | 1 (0.7%) | $0 |
| 25 to 44 Years | 27 (17.9%) | $78,750 |
| 45 to 64 Years | 45 (29.8%) | $56,250 |
| 65+ Years | 78 (51.7%) | $30,200 |
| Total | 151 (100.0%) | $31,850 |
Poverty in Woodland
Income Below Poverty by Sex and Age in Woodland
With 26.8% poverty level for males and 24.7% for females among the residents of Woodland, under 5 year old males and 18 to 24 year old females are the most vulnerable to poverty, with 6 males (100.0%) and 11 females (100.0%) in their respective age groups living below the poverty level.
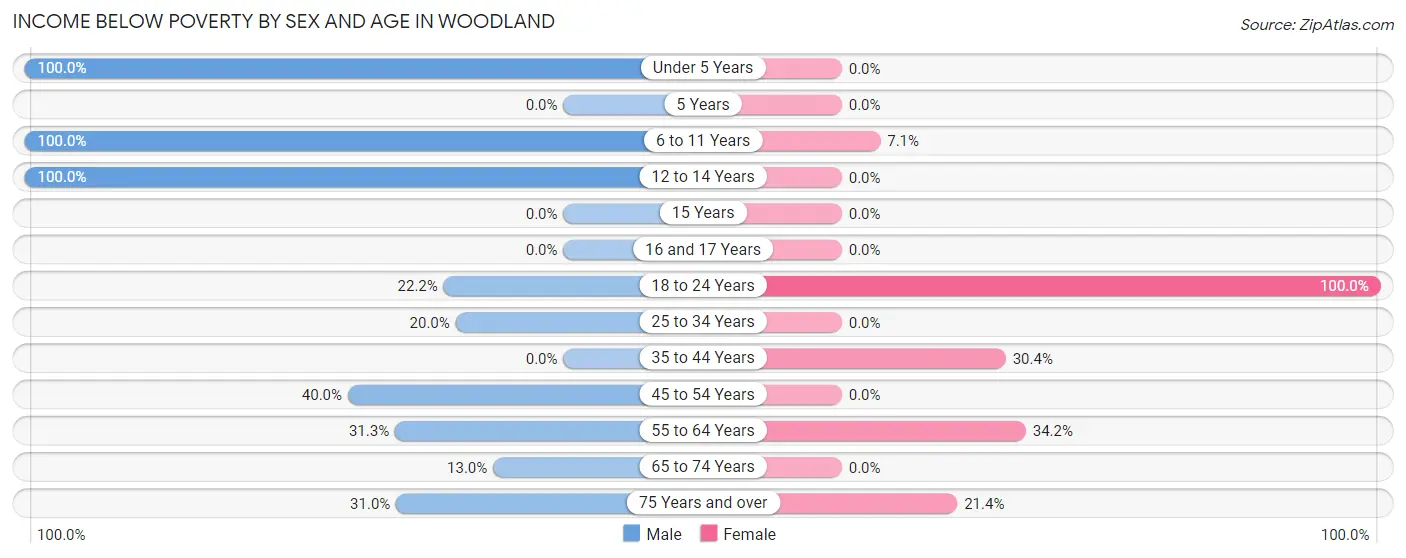
| Age Bracket | Male | Female |
| Under 5 Years | 6 (100.0%) | 0 (0.0%) |
| 5 Years | 0 (0.0%) | 0 (0.0%) |
| 6 to 11 Years | 2 (100.0%) | 1 (7.1%) |
| 12 to 14 Years | 1 (100.0%) | 0 (0.0%) |
| 15 Years | 0 (0.0%) | 0 (0.0%) |
| 16 and 17 Years | 0 (0.0%) | 0 (0.0%) |
| 18 to 24 Years | 2 (22.2%) | 11 (100.0%) |
| 25 to 34 Years | 4 (20.0%) | 0 (0.0%) |
| 35 to 44 Years | 0 (0.0%) | 7 (30.4%) |
| 45 to 54 Years | 2 (40.0%) | 0 (0.0%) |
| 55 to 64 Years | 5 (31.2%) | 14 (34.2%) |
| 65 to 74 Years | 3 (13.0%) | 0 (0.0%) |
| 75 Years and over | 9 (31.0%) | 6 (21.4%) |
| Total | 34 (26.8%) | 39 (24.7%) |
Income Above Poverty by Sex and Age in Woodland
According to the poverty statistics in Woodland, males aged 35 to 44 years and females aged under 5 years are the age groups that are most secure financially, with 100.0% of males and 100.0% of females in these age groups living above the poverty line.
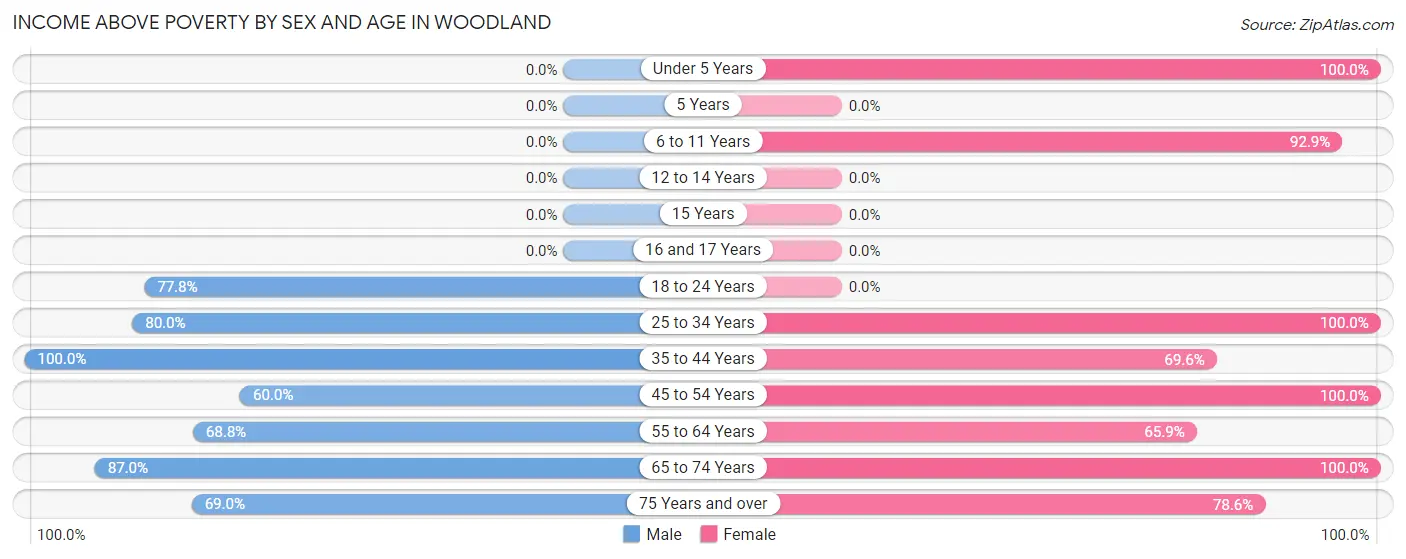
| Age Bracket | Male | Female |
| Under 5 Years | 0 (0.0%) | 4 (100.0%) |
| 5 Years | 0 (0.0%) | 0 (0.0%) |
| 6 to 11 Years | 0 (0.0%) | 13 (92.9%) |
| 12 to 14 Years | 0 (0.0%) | 0 (0.0%) |
| 15 Years | 0 (0.0%) | 0 (0.0%) |
| 16 and 17 Years | 0 (0.0%) | 0 (0.0%) |
| 18 to 24 Years | 7 (77.8%) | 0 (0.0%) |
| 25 to 34 Years | 16 (80.0%) | 5 (100.0%) |
| 35 to 44 Years | 16 (100.0%) | 16 (69.6%) |
| 45 to 54 Years | 3 (60.0%) | 5 (100.0%) |
| 55 to 64 Years | 11 (68.8%) | 27 (65.8%) |
| 65 to 74 Years | 20 (87.0%) | 27 (100.0%) |
| 75 Years and over | 20 (69.0%) | 22 (78.6%) |
| Total | 93 (73.2%) | 119 (75.3%) |
Income Below Poverty Among Married-Couple Families in Woodland
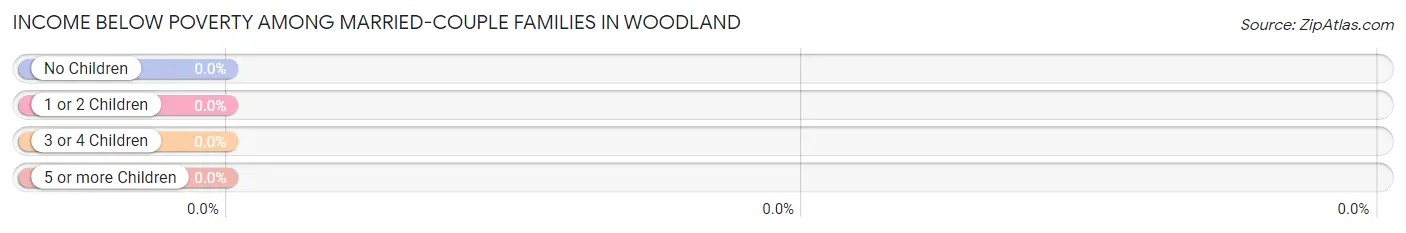
| Children | Above Poverty | Below Poverty |
| No Children | 38 (100.0%) | 0 (0.0%) |
| 1 or 2 Children | 5 (100.0%) | 0 (0.0%) |
| 3 or 4 Children | 0 (0.0%) | 0 (0.0%) |
| 5 or more Children | 0 (0.0%) | 0 (0.0%) |
| Total | 43 (100.0%) | 0 (0.0%) |
Income Below Poverty Among Single-Parent Households in Woodland
According to the poverty data in Woodland, 100.0% or 9 single-father households and 64.3% or 9 single-mother households are living below the poverty line. Among single-father households, those with no children have the highest poverty rate, with 9 households (100.0%) experiencing poverty. Likewise, among single-mother households, those with no children have the highest poverty rate, with 2 households (100.0%) falling below the poverty line.
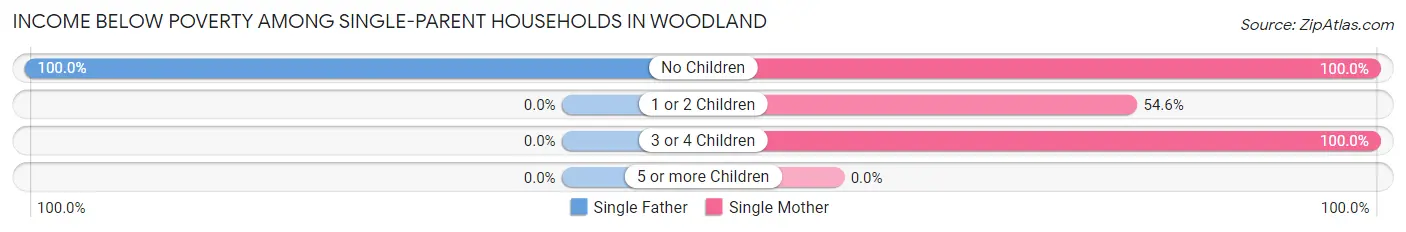
| Children | Single Father | Single Mother |
| No Children | 9 (100.0%) | 2 (100.0%) |
| 1 or 2 Children | 0 (0.0%) | 6 (54.5%) |
| 3 or 4 Children | 0 (0.0%) | 1 (100.0%) |
| 5 or more Children | 0 (0.0%) | 0 (0.0%) |
| Total | 9 (100.0%) | 9 (64.3%) |
Income Below Poverty Among Married-Couple vs Single-Parent Households in Woodland
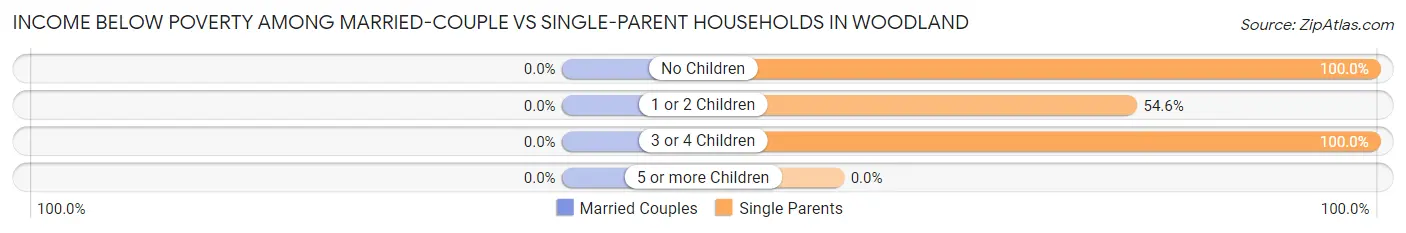
| Children | Married-Couple Families | Single-Parent Households |
| No Children | 0 (0.0%) | 11 (100.0%) |
| 1 or 2 Children | 0 (0.0%) | 6 (54.5%) |
| 3 or 4 Children | 0 (0.0%) | 1 (100.0%) |
| 5 or more Children | 0 (0.0%) | 0 (0.0%) |
| Total | 0 (0.0%) | 18 (78.3%) |
Race in Woodland
The most populous races in Woodland are White / Caucasian (142 | 48.0%), Black / African American (141 | 47.6%), and Two or more Races (11 | 3.7%).
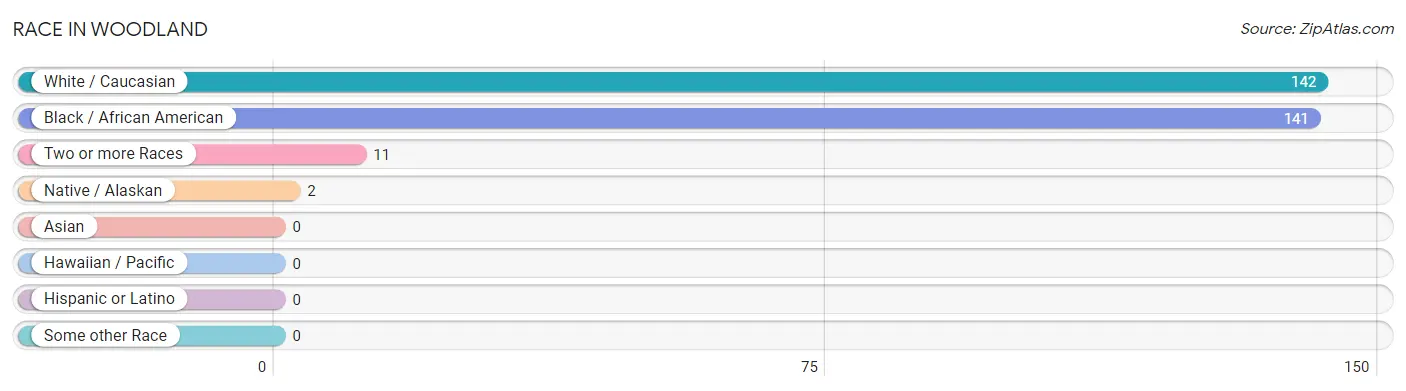
| Race | # Population | % Population |
| Asian | 0 | 0.0% |
| Black / African American | 141 | 47.6% |
| Hawaiian / Pacific | 0 | 0.0% |
| Hispanic or Latino | 0 | 0.0% |
| Native / Alaskan | 2 | 0.7% |
| White / Caucasian | 142 | 48.0% |
| Two or more Races | 11 | 3.7% |
| Some other Race | 0 | 0.0% |
| Total | 296 | 100.0% |
Ancestry in Woodland
The most populous ancestries reported in Woodland are Irish (34 | 11.5%), American (33 | 11.2%), English (18 | 6.1%), African (13 | 4.4%), and Subsaharan African (13 | 4.4%), together accounting for 37.5% of all Woodland residents.
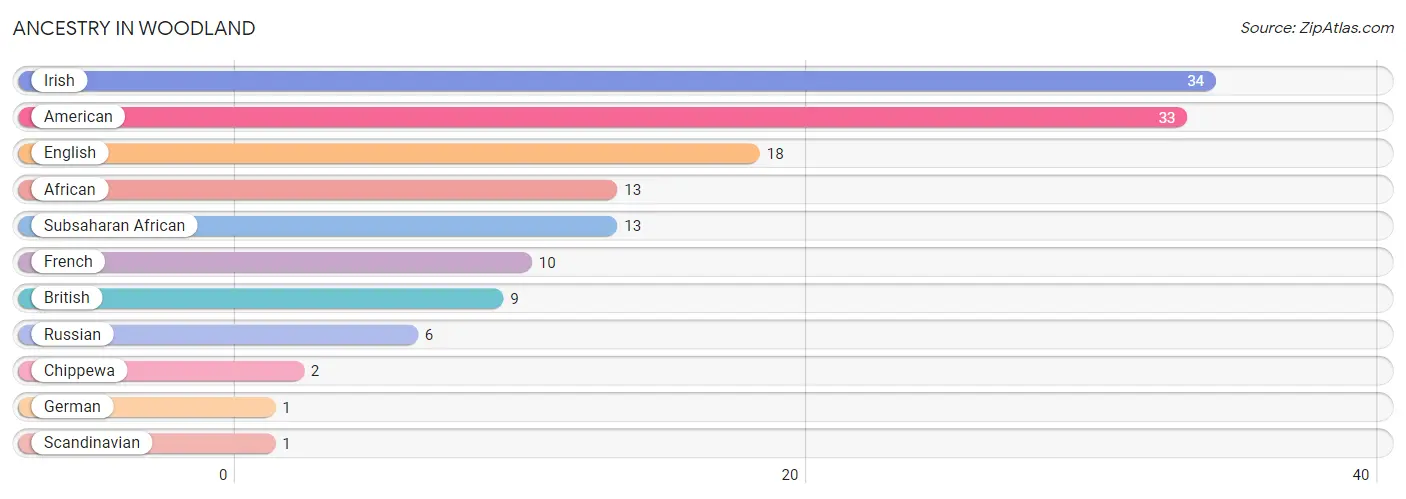
| Ancestry | # Population | % Population |
| African | 13 | 4.4% |
| American | 33 | 11.2% |
| British | 9 | 3.0% |
| Chippewa | 2 | 0.7% |
| English | 18 | 6.1% |
| French | 10 | 3.4% |
| German | 1 | 0.3% |
| Irish | 34 | 11.5% |
| Russian | 6 | 2.0% |
| Scandinavian | 1 | 0.3% |
| Subsaharan African | 13 | 4.4% | View All 11 Rows |
Immigrants in Woodland

| Immigration Origin | # Population | % Population | View All 0 Rows |
Sex and Age in Woodland
Sex and Age in Woodland
The most populous age groups in Woodland are 30 to 34 Years (20 | 15.8%) for men and 60 to 64 Years (28 | 16.6%) for women.
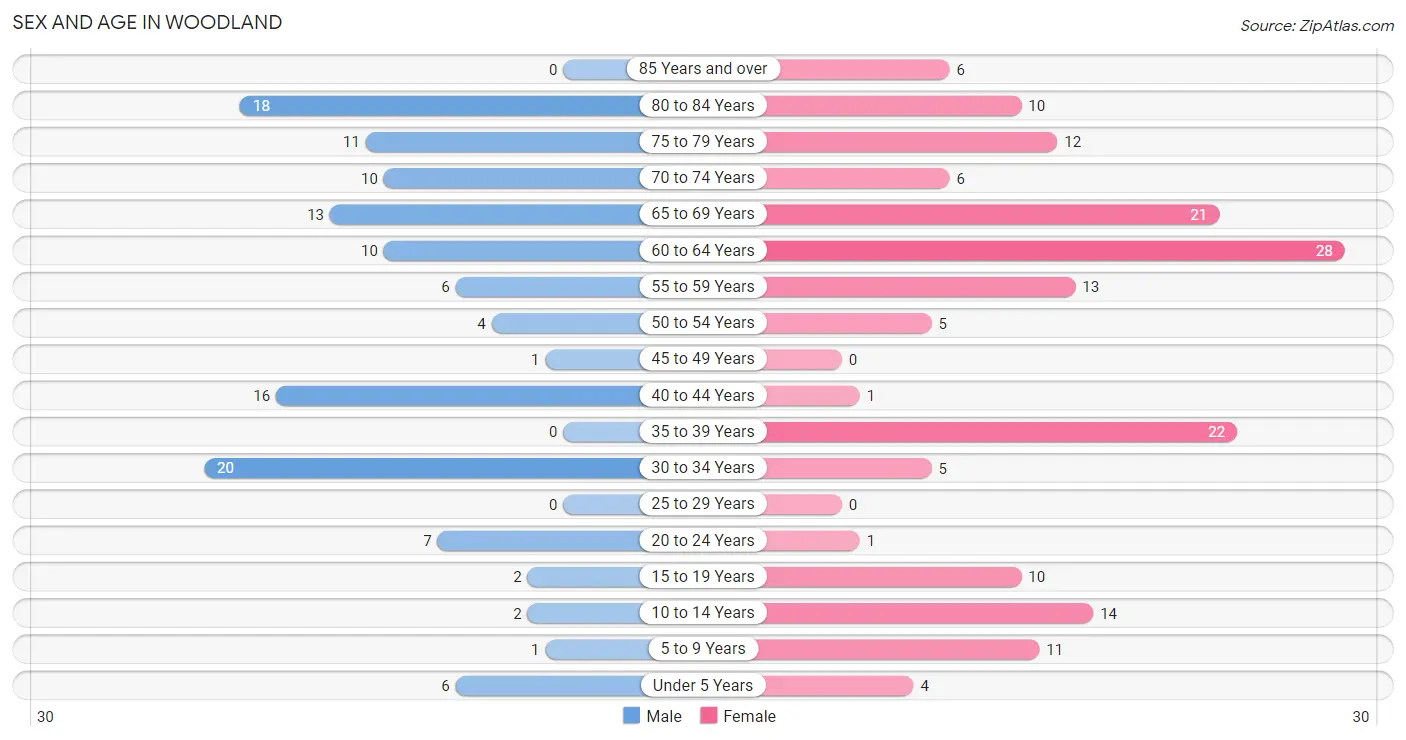
| Age Bracket | Male | Female |
| Under 5 Years | 6 (4.7%) | 4 (2.4%) |
| 5 to 9 Years | 1 (0.8%) | 11 (6.5%) |
| 10 to 14 Years | 2 (1.6%) | 14 (8.3%) |
| 15 to 19 Years | 2 (1.6%) | 10 (5.9%) |
| 20 to 24 Years | 7 (5.5%) | 1 (0.6%) |
| 25 to 29 Years | 0 (0.0%) | 0 (0.0%) |
| 30 to 34 Years | 20 (15.8%) | 5 (3.0%) |
| 35 to 39 Years | 0 (0.0%) | 22 (13.0%) |
| 40 to 44 Years | 16 (12.6%) | 1 (0.6%) |
| 45 to 49 Years | 1 (0.8%) | 0 (0.0%) |
| 50 to 54 Years | 4 (3.2%) | 5 (3.0%) |
| 55 to 59 Years | 6 (4.7%) | 13 (7.7%) |
| 60 to 64 Years | 10 (7.9%) | 28 (16.6%) |
| 65 to 69 Years | 13 (10.2%) | 21 (12.4%) |
| 70 to 74 Years | 10 (7.9%) | 6 (3.5%) |
| 75 to 79 Years | 11 (8.7%) | 12 (7.1%) |
| 80 to 84 Years | 18 (14.2%) | 10 (5.9%) |
| 85 Years and over | 0 (0.0%) | 6 (3.5%) |
| Total | 127 (100.0%) | 169 (100.0%) |
Families and Households in Woodland
Median Family Size in Woodland
The median family size in Woodland is 2.64 persons per family, with single female/mother families (14 | 21.2%) accounting for the largest median family size of 3.64 persons per family. On the other hand, single male/father families (9 | 13.6%) represent the smallest median family size with 1.22 persons per family.
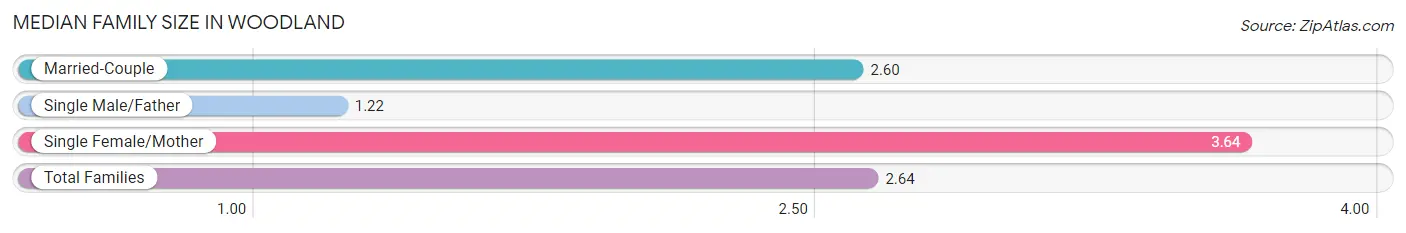
| Family Type | # Families | Family Size |
| Married-Couple | 43 (65.1%) | 2.60 |
| Single Male/Father | 9 (13.6%) | 1.22 |
| Single Female/Mother | 14 (21.2%) | 3.64 |
| Total Families | 66 (100.0%) | 2.64 |
Median Household Size in Woodland
The median household size in Woodland is 1.96 persons per household, with single female/mother households (14 | 9.3%) accounting for the largest median household size of 5.43 persons per household. non-family households (85 | 56.3%) represent the smallest median household size with 1.14 persons per household.
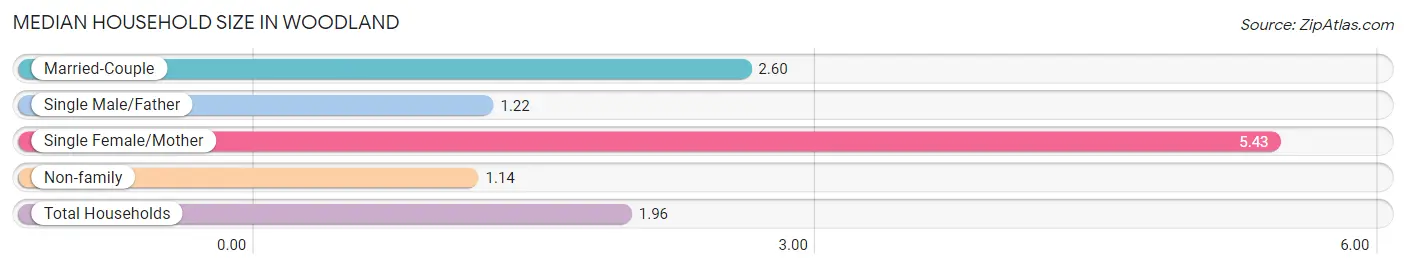
| Household Type | # Households | Household Size |
| Married-Couple | 43 (28.5%) | 2.60 |
| Single Male/Father | 9 (6.0%) | 1.22 |
| Single Female/Mother | 14 (9.3%) | 5.43 |
| Non-family | 85 (56.3%) | 1.14 |
| Total Households | 151 (100.0%) | 1.96 |
Household Size by Marriage Status in Woodland
Out of a total of 151 households in Woodland, 66 (43.7%) are family households, while 85 (56.3%) are nonfamily households. The most numerous type of family households are 2-person households, comprising 37, and the most common type of nonfamily households are 1-person households, comprising 75.
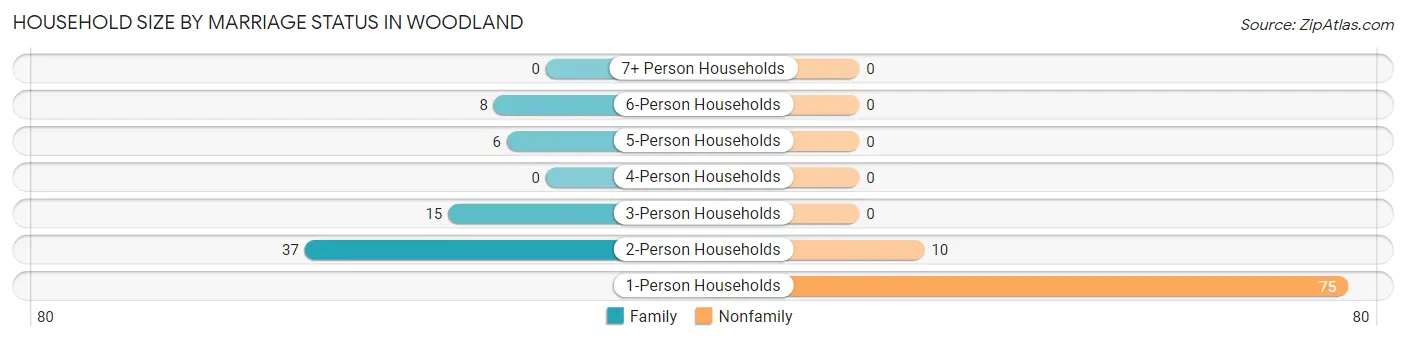
| Household Size | Family Households | Nonfamily Households |
| 1-Person Households | - | 75 (49.7%) |
| 2-Person Households | 37 (24.5%) | 10 (6.6%) |
| 3-Person Households | 15 (9.9%) | 0 (0.0%) |
| 4-Person Households | 0 (0.0%) | 0 (0.0%) |
| 5-Person Households | 6 (4.0%) | 0 (0.0%) |
| 6-Person Households | 8 (5.3%) | 0 (0.0%) |
| 7+ Person Households | 0 (0.0%) | 0 (0.0%) |
| Total | 66 (43.7%) | 85 (56.3%) |
Female Fertility in Woodland
Fertility by Age in Woodland
Average fertility rate in Woodland is 154.0 births per 1,000 women. Women in the age bracket of 35 to 50 years have the highest fertility rate with 261.0 births per 1,000 women. Women in the age bracket of 35 to 50 years acount for 100.0% of all women with births.
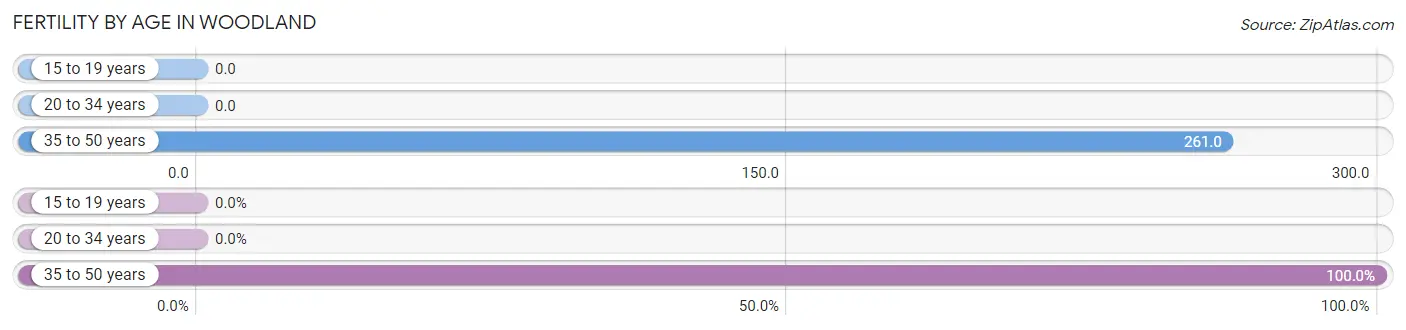
| Age Bracket | Women with Births | Births / 1,000 Women |
| 15 to 19 years | 0 (0.0%) | 0.0 |
| 20 to 34 years | 0 (0.0%) | 0.0 |
| 35 to 50 years | 6 (100.0%) | 261.0 |
| Total | 6 (100.0%) | 154.0 |
Fertility by Age by Marriage Status in Woodland
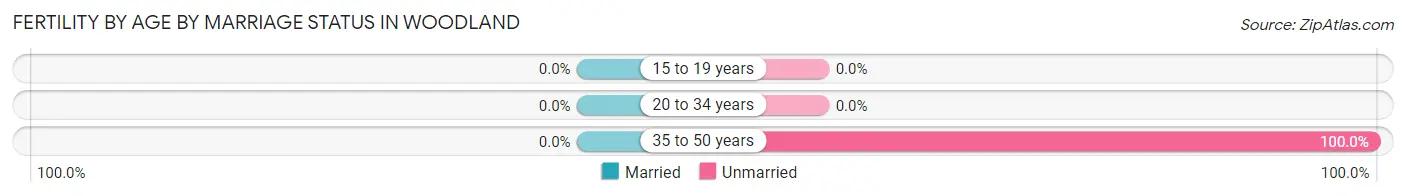
| Age Bracket | Married | Unmarried |
| 15 to 19 years | 0 (0.0%) | 0 (0.0%) |
| 20 to 34 years | 0 (0.0%) | 0 (0.0%) |
| 35 to 50 years | 0 (0.0%) | 6 (100.0%) |
| Total | 0 (0.0%) | 6 (100.0%) |
Fertility by Education in Woodland
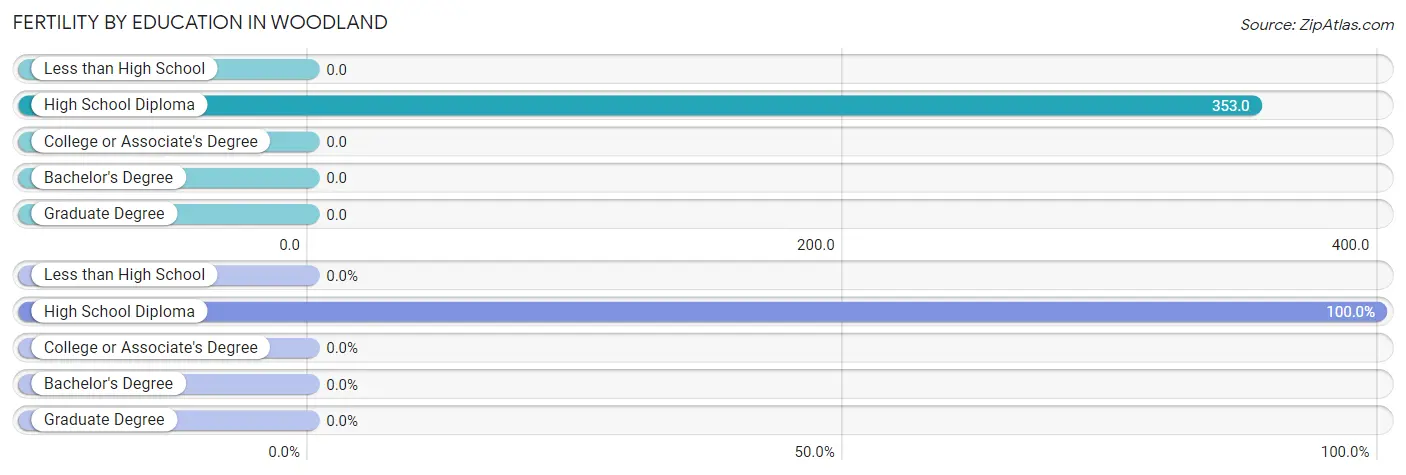
| Educational Attainment | Women with Births | Births / 1,000 Women |
| Less than High School | 0 (0.0%) | 0.0 |
| High School Diploma | 6 (100.0%) | 353.0 |
| College or Associate's Degree | 0 (0.0%) | 0.0 |
| Bachelor's Degree | 0 (0.0%) | 0.0 |
| Graduate Degree | 0 (0.0%) | 0.0 |
| Total | 6 (100.0%) | 154.0 |
Fertility by Education by Marriage Status in Woodland
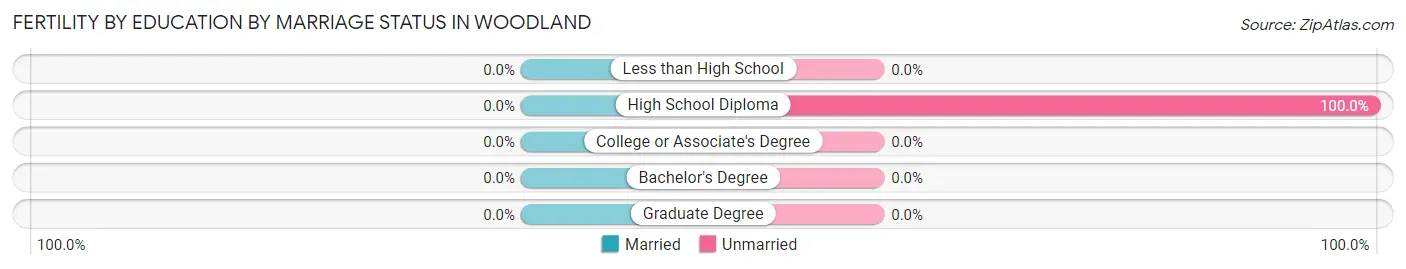
| Educational Attainment | Married | Unmarried |
| Less than High School | 0 (0.0%) | 0 (0.0%) |
| High School Diploma | 0 (0.0%) | 6 (100.0%) |
| College or Associate's Degree | 0 (0.0%) | 0 (0.0%) |
| Bachelor's Degree | 0 (0.0%) | 0 (0.0%) |
| Graduate Degree | 0 (0.0%) | 0 (0.0%) |
| Total | 0 (0.0%) | 6 (100.0%) |
Employment Characteristics in Woodland
Employment by Class of Employer in Woodland
Among the 89 employed individuals in Woodland, private company employees (62 | 69.7%), self-employed (not incorporated) (13 | 14.6%), and not-for-profit organizations (5 | 5.6%) make up the most common classes of employment.
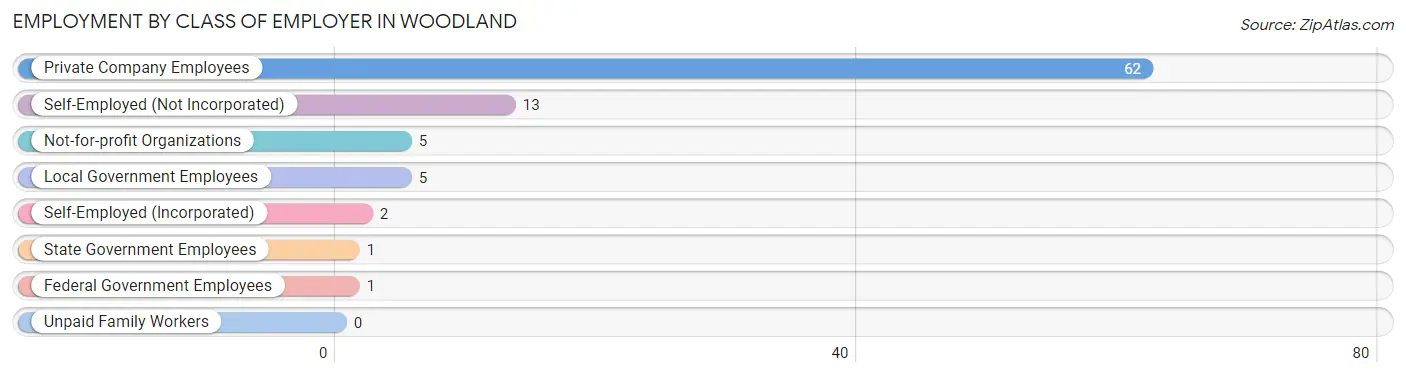
| Employer Class | # Employees | % Employees |
| Private Company Employees | 62 | 69.7% |
| Self-Employed (Incorporated) | 2 | 2.2% |
| Self-Employed (Not Incorporated) | 13 | 14.6% |
| Not-for-profit Organizations | 5 | 5.6% |
| Local Government Employees | 5 | 5.6% |
| State Government Employees | 1 | 1.1% |
| Federal Government Employees | 1 | 1.1% |
| Unpaid Family Workers | 0 | 0.0% |
| Total | 89 | 100.0% |
Employment Status by Age in Woodland
According to the labor force statistics for Woodland, out of the total population over 16 years of age (258), 38.4% or 99 individuals are in the labor force, with 10.1% or 10 of them unemployed. The age group with the highest labor force participation rate is 35 to 44 years, with 97.4% or 38 individuals in the labor force. Within the labor force, the 16 to 19 years age range has the highest percentage of unemployed individuals, with 100.0% or 10 of them being unemployed.
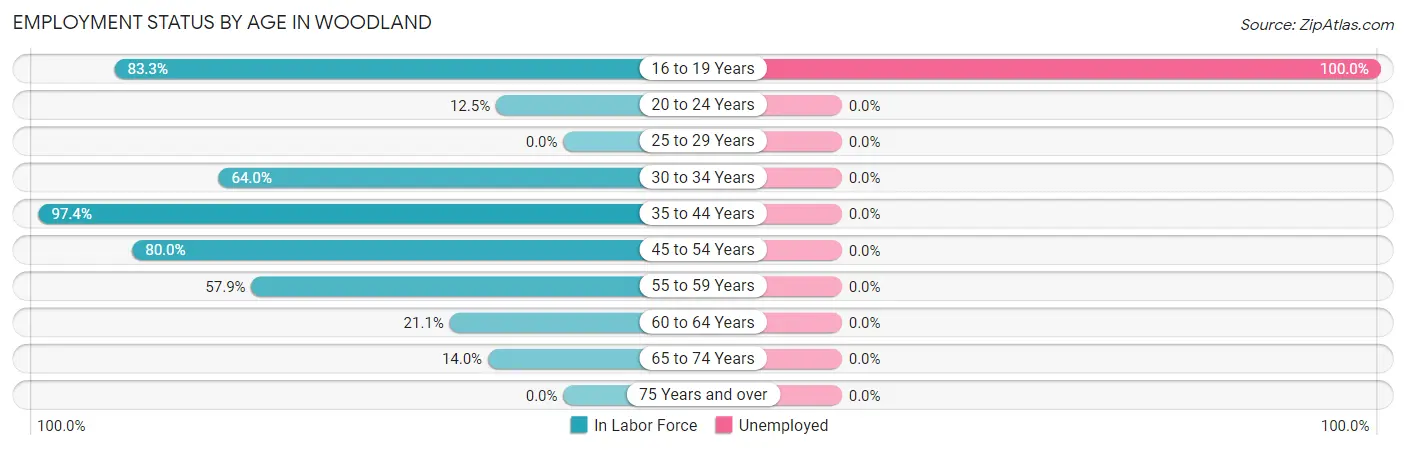
| Age Bracket | In Labor Force | Unemployed |
| 16 to 19 Years | 10 (83.3%) | 10 (100.0%) |
| 20 to 24 Years | 1 (12.5%) | 0 (0.0%) |
| 25 to 29 Years | 0 (0.0%) | 0 (0.0%) |
| 30 to 34 Years | 16 (64.0%) | 0 (0.0%) |
| 35 to 44 Years | 38 (97.4%) | 0 (0.0%) |
| 45 to 54 Years | 8 (80.0%) | 0 (0.0%) |
| 55 to 59 Years | 11 (57.9%) | 0 (0.0%) |
| 60 to 64 Years | 8 (21.1%) | 0 (0.0%) |
| 65 to 74 Years | 7 (14.0%) | 0 (0.0%) |
| 75 Years and over | 0 (0.0%) | 0 (0.0%) |
| Total | 99 (38.4%) | 10 (10.1%) |
Employment Status by Educational Attainment in Woodland
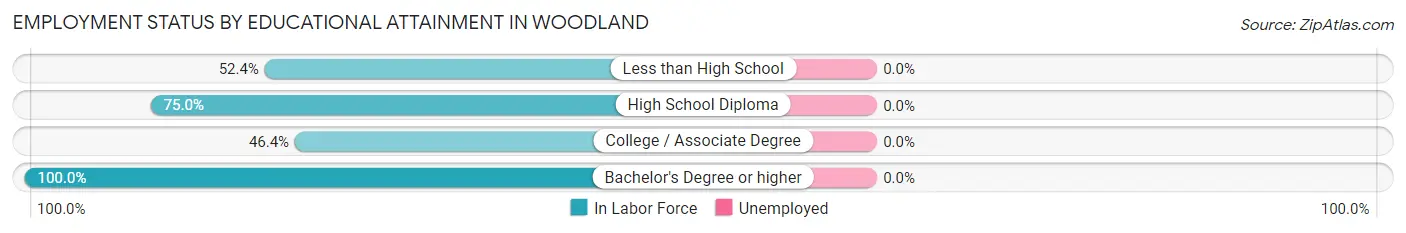
| Educational Attainment | In Labor Force | Unemployed |
| Less than High School | 11 (52.4%) | 0 (0.0%) |
| High School Diploma | 30 (75.0%) | 0 (0.0%) |
| College / Associate Degree | 26 (46.4%) | 0 (0.0%) |
| Bachelor's Degree or higher | 14 (100.0%) | 0 (0.0%) |
| Total | 81 (61.8%) | 0 (0.0%) |
Employment Occupations by Sex in Woodland
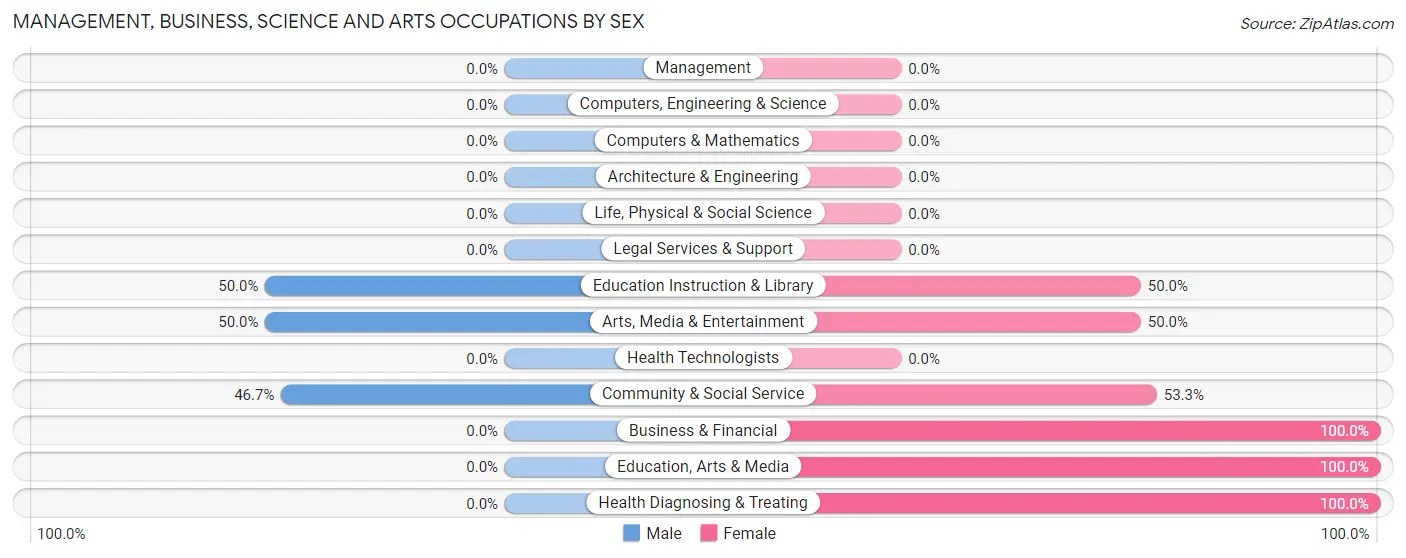
Management, Business, Science and Arts Occupations
The most common Management, Business, Science and Arts occupations in Woodland are Community & Social Service (15 | 16.9%), Arts, Media & Entertainment (12 | 13.5%), Business & Financial (10 | 11.2%), Education Instruction & Library (2 | 2.2%), and Education, Arts & Media (1 | 1.1%).
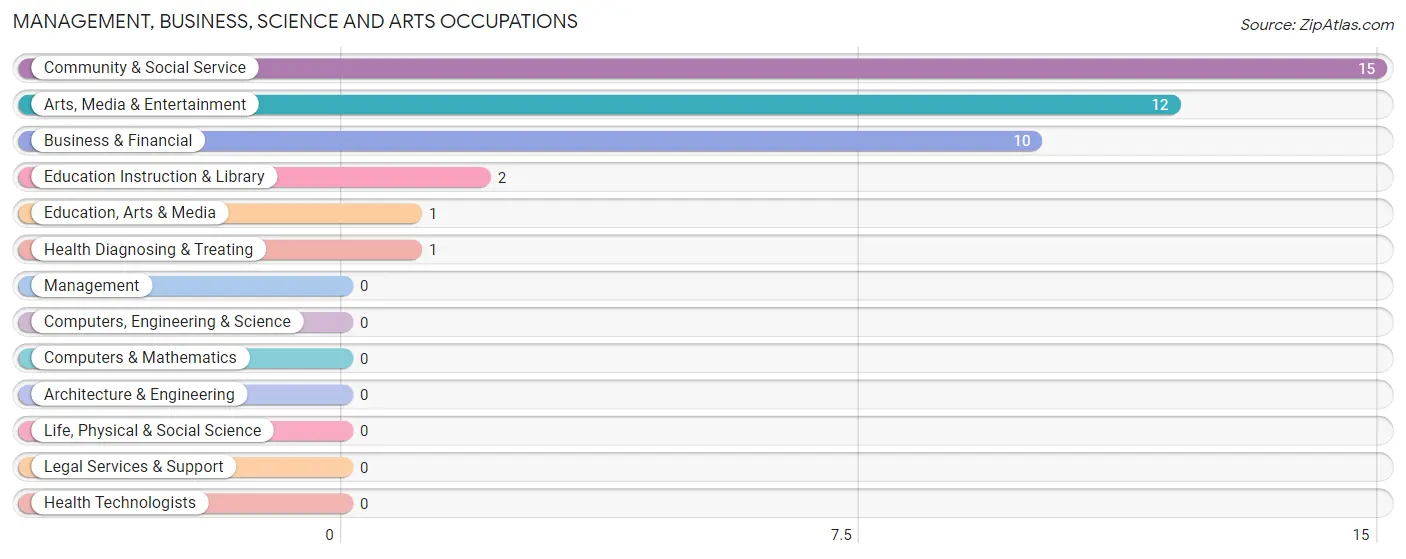
Management, Business, Science and Arts Occupations by Sex
Within the Management, Business, Science and Arts occupations in Woodland, the most male-oriented occupations are Education Instruction & Library (50.0%), Arts, Media & Entertainment (50.0%), and Community & Social Service (46.7%), while the most female-oriented occupations are Business & Financial (100.0%), Education, Arts & Media (100.0%), and Health Diagnosing & Treating (100.0%).
| Occupation | Male | Female |
| Management | 0 (0.0%) | 0 (0.0%) |
| Business & Financial | 0 (0.0%) | 10 (100.0%) |
| Computers, Engineering & Science | 0 (0.0%) | 0 (0.0%) |
| Computers & Mathematics | 0 (0.0%) | 0 (0.0%) |
| Architecture & Engineering | 0 (0.0%) | 0 (0.0%) |
| Life, Physical & Social Science | 0 (0.0%) | 0 (0.0%) |
| Community & Social Service | 7 (46.7%) | 8 (53.3%) |
| Education, Arts & Media | 0 (0.0%) | 1 (100.0%) |
| Legal Services & Support | 0 (0.0%) | 0 (0.0%) |
| Education Instruction & Library | 1 (50.0%) | 1 (50.0%) |
| Arts, Media & Entertainment | 6 (50.0%) | 6 (50.0%) |
| Health Diagnosing & Treating | 0 (0.0%) | 1 (100.0%) |
| Health Technologists | 0 (0.0%) | 0 (0.0%) |
| Total (Category) | 7 (26.9%) | 19 (73.1%) |
| Total (Overall) | 48 (53.9%) | 41 (46.1%) |
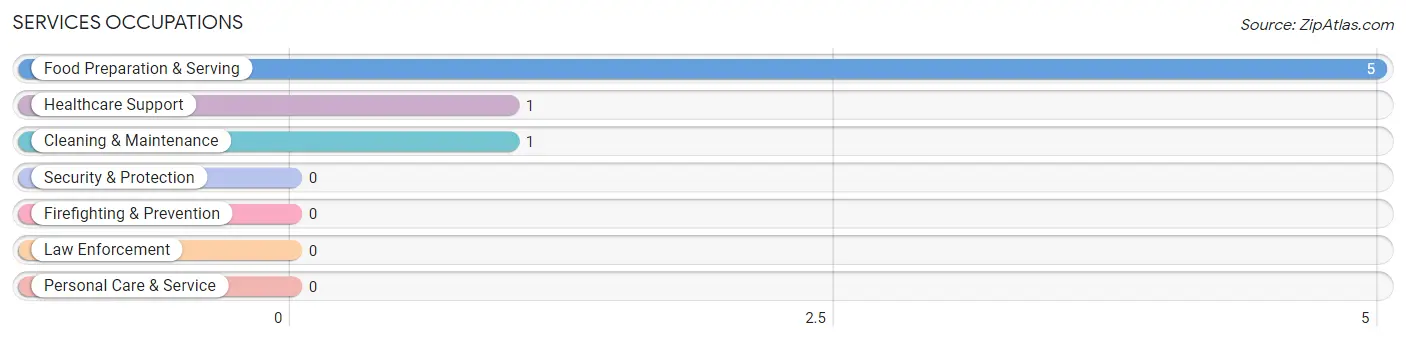
Services Occupations
The most common Services occupations in Woodland are Food Preparation & Serving (5 | 5.6%), Healthcare Support (1 | 1.1%), and Cleaning & Maintenance (1 | 1.1%).
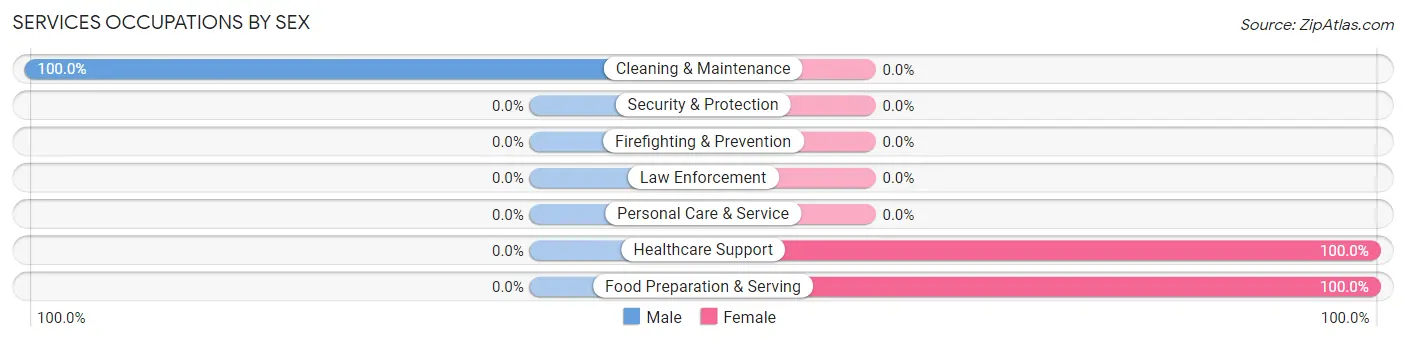
Services Occupations by Sex
| Occupation | Male | Female |
| Healthcare Support | 0 (0.0%) | 1 (100.0%) |
| Security & Protection | 0 (0.0%) | 0 (0.0%) |
| Firefighting & Prevention | 0 (0.0%) | 0 (0.0%) |
| Law Enforcement | 0 (0.0%) | 0 (0.0%) |
| Food Preparation & Serving | 0 (0.0%) | 5 (100.0%) |
| Cleaning & Maintenance | 1 (100.0%) | 0 (0.0%) |
| Personal Care & Service | 0 (0.0%) | 0 (0.0%) |
| Total (Category) | 1 (14.3%) | 6 (85.7%) |
| Total (Overall) | 48 (53.9%) | 41 (46.1%) |
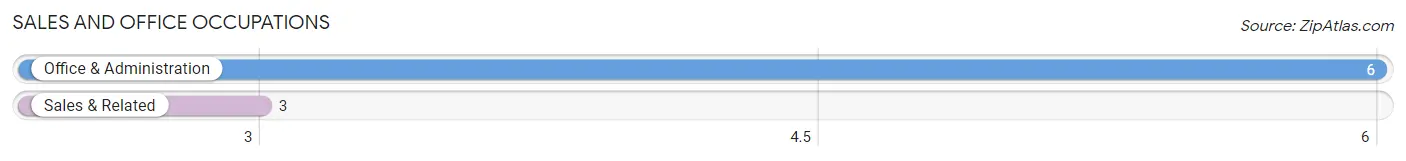
Sales and Office Occupations
The most common Sales and Office occupations in Woodland are Office & Administration (6 | 6.7%), and Sales & Related (3 | 3.4%).
Sales and Office Occupations by Sex
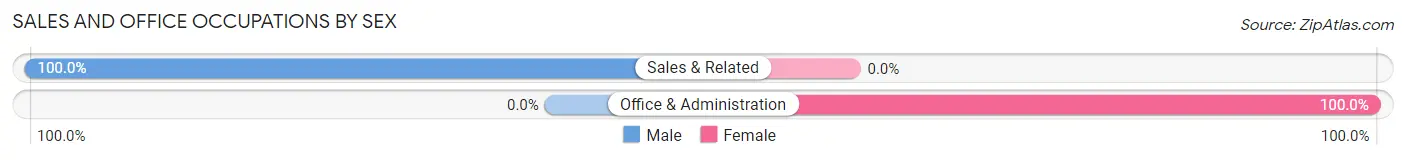
| Occupation | Male | Female |
| Sales & Related | 3 (100.0%) | 0 (0.0%) |
| Office & Administration | 0 (0.0%) | 6 (100.0%) |
| Total (Category) | 3 (33.3%) | 6 (66.7%) |
| Total (Overall) | 48 (53.9%) | 41 (46.1%) |
Natural Resources, Construction and Maintenance Occupations
The most common Natural Resources, Construction and Maintenance occupations in Woodland are , and Installation, Maintenance & Repair (5 | 5.6%).
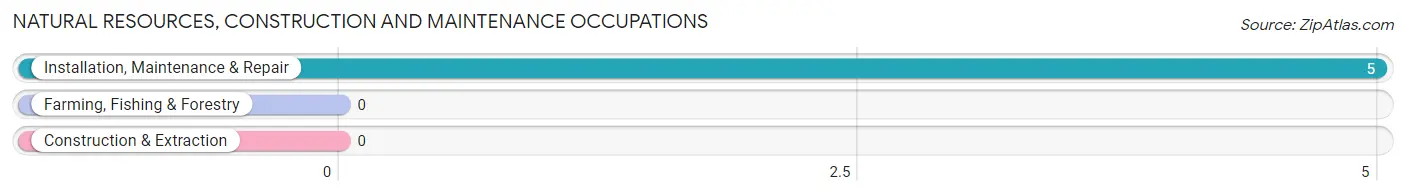
Natural Resources, Construction and Maintenance Occupations by Sex
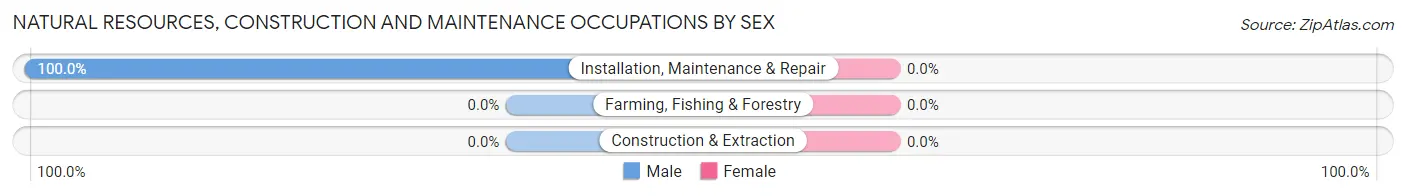
| Occupation | Male | Female |
| Farming, Fishing & Forestry | 0 (0.0%) | 0 (0.0%) |
| Construction & Extraction | 0 (0.0%) | 0 (0.0%) |
| Installation, Maintenance & Repair | 5 (100.0%) | 0 (0.0%) |
| Total (Category) | 5 (100.0%) | 0 (0.0%) |
| Total (Overall) | 48 (53.9%) | 41 (46.1%) |
Production, Transportation and Moving Occupations
The most common Production, Transportation and Moving occupations in Woodland are Production (25 | 28.1%), Material Moving (9 | 10.1%), and Transportation (8 | 9.0%).
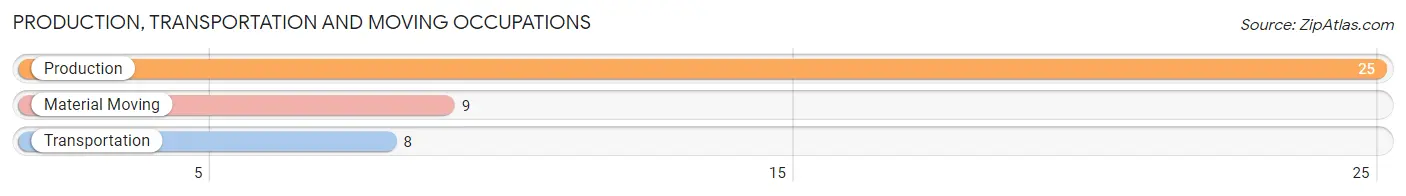
Production, Transportation and Moving Occupations by Sex
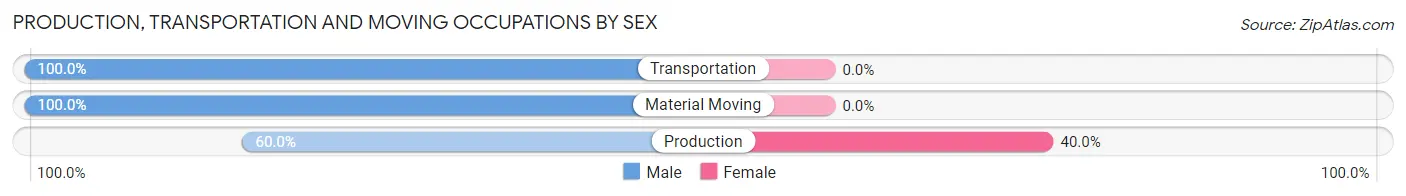
| Occupation | Male | Female |
| Production | 15 (60.0%) | 10 (40.0%) |
| Transportation | 8 (100.0%) | 0 (0.0%) |
| Material Moving | 9 (100.0%) | 0 (0.0%) |
| Total (Category) | 32 (76.2%) | 10 (23.8%) |
| Total (Overall) | 48 (53.9%) | 41 (46.1%) |
Employment Industries by Sex in Woodland
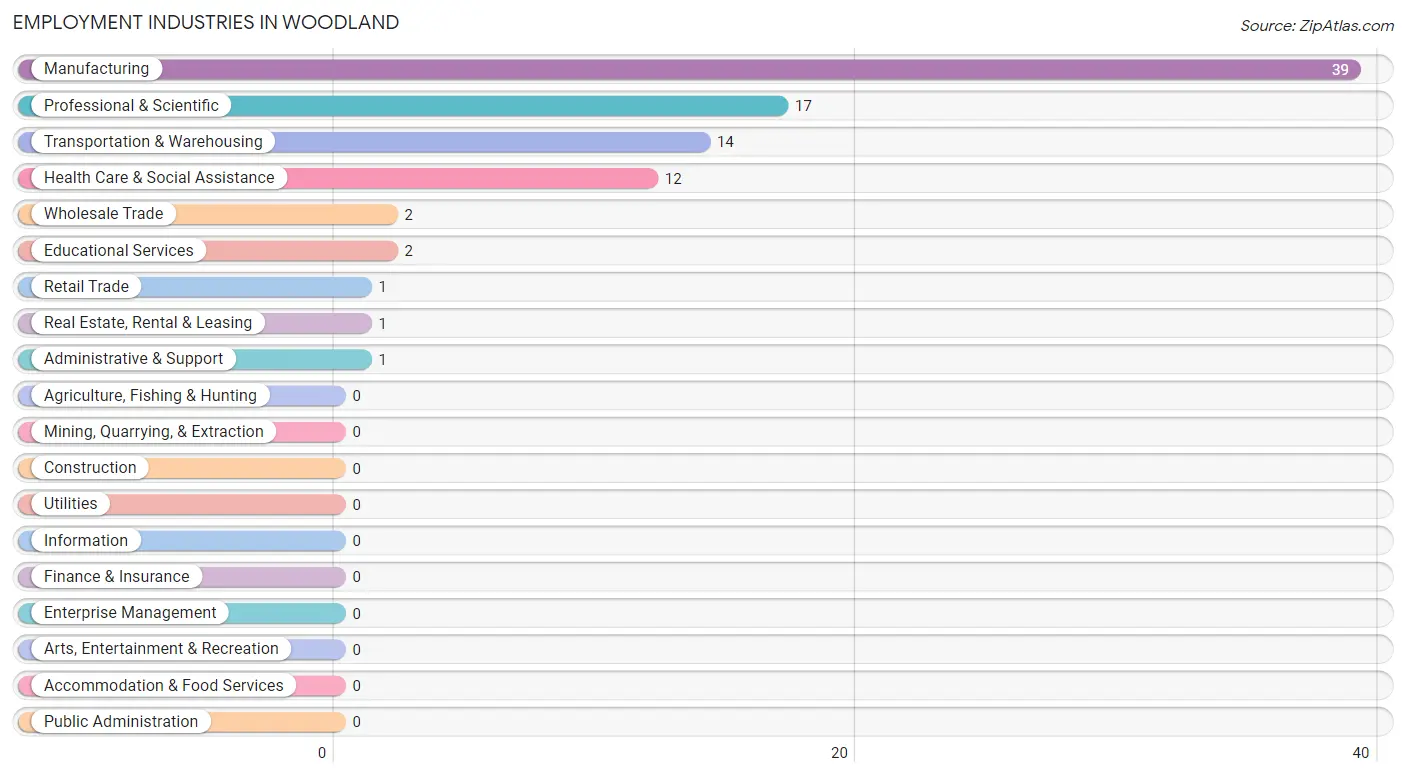
Employment Industries in Woodland
The major employment industries in Woodland include Manufacturing (39 | 43.8%), Professional & Scientific (17 | 19.1%), Transportation & Warehousing (14 | 15.7%), Health Care & Social Assistance (12 | 13.5%), and Wholesale Trade (2 | 2.2%).
Employment Industries by Sex in Woodland
The Woodland industries that see more men than women are Wholesale Trade (100.0%), Retail Trade (100.0%), and Real Estate, Rental & Leasing (100.0%), whereas the industries that tend to have a higher number of women are Health Care & Social Assistance (100.0%), Professional & Scientific (64.7%), and Educational Services (50.0%).
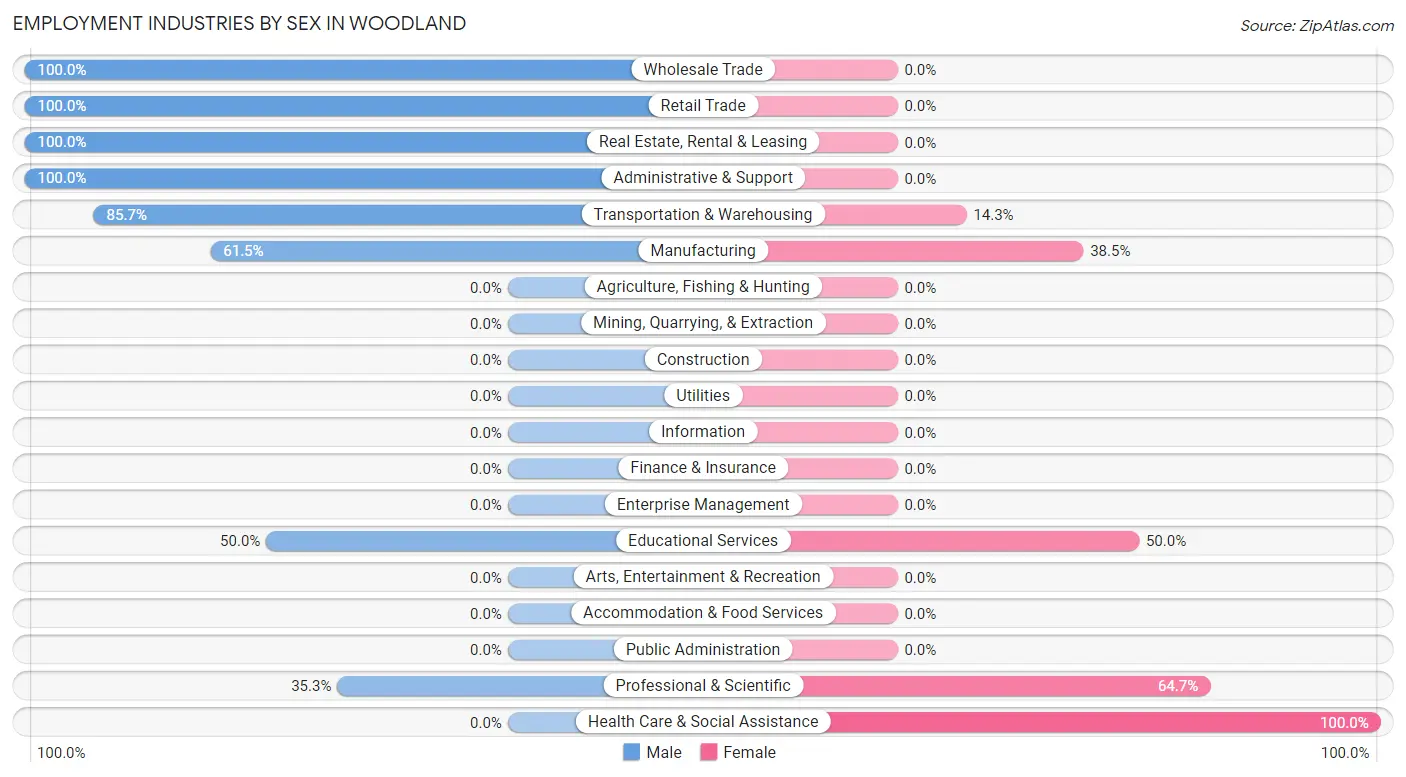
| Industry | Male | Female |
| Agriculture, Fishing & Hunting | 0 (0.0%) | 0 (0.0%) |
| Mining, Quarrying, & Extraction | 0 (0.0%) | 0 (0.0%) |
| Construction | 0 (0.0%) | 0 (0.0%) |
| Manufacturing | 24 (61.5%) | 15 (38.5%) |
| Wholesale Trade | 2 (100.0%) | 0 (0.0%) |
| Retail Trade | 1 (100.0%) | 0 (0.0%) |
| Transportation & Warehousing | 12 (85.7%) | 2 (14.3%) |
| Utilities | 0 (0.0%) | 0 (0.0%) |
| Information | 0 (0.0%) | 0 (0.0%) |
| Finance & Insurance | 0 (0.0%) | 0 (0.0%) |
| Real Estate, Rental & Leasing | 1 (100.0%) | 0 (0.0%) |
| Professional & Scientific | 6 (35.3%) | 11 (64.7%) |
| Enterprise Management | 0 (0.0%) | 0 (0.0%) |
| Administrative & Support | 1 (100.0%) | 0 (0.0%) |
| Educational Services | 1 (50.0%) | 1 (50.0%) |
| Health Care & Social Assistance | 0 (0.0%) | 12 (100.0%) |
| Arts, Entertainment & Recreation | 0 (0.0%) | 0 (0.0%) |
| Accommodation & Food Services | 0 (0.0%) | 0 (0.0%) |
| Public Administration | 0 (0.0%) | 0 (0.0%) |
| Total | 48 (53.9%) | 41 (46.1%) |
Education in Woodland
School Enrollment in Woodland
The most common levels of schooling among the 42 students in Woodland are elementary school (17 | 40.5%), high school (11 | 26.2%), and middle school (10 | 23.8%).
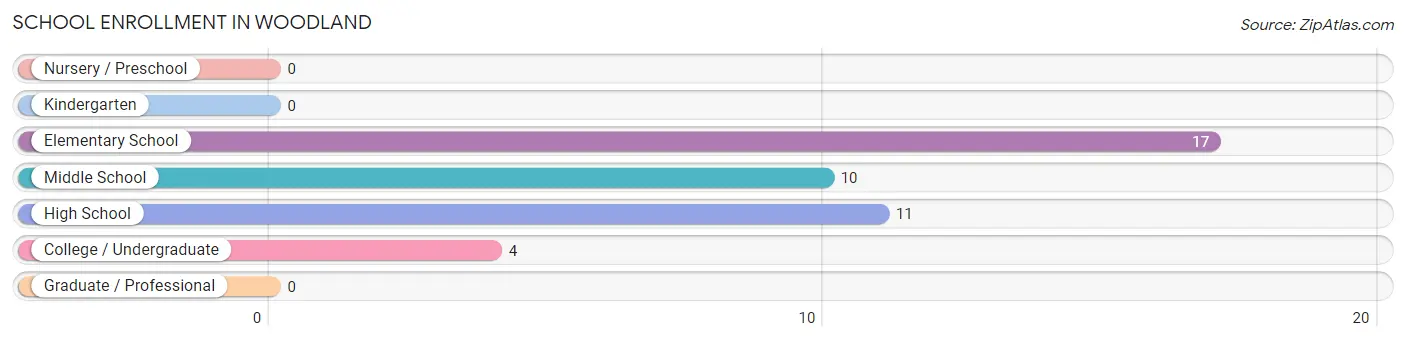
| School Level | # Students | % Students |
| Nursery / Preschool | 0 | 0.0% |
| Kindergarten | 0 | 0.0% |
| Elementary School | 17 | 40.5% |
| Middle School | 10 | 23.8% |
| High School | 11 | 26.2% |
| College / Undergraduate | 4 | 9.5% |
| Graduate / Professional | 0 | 0.0% |
| Total | 42 | 100.0% |
School Enrollment by Age by Funding Source in Woodland
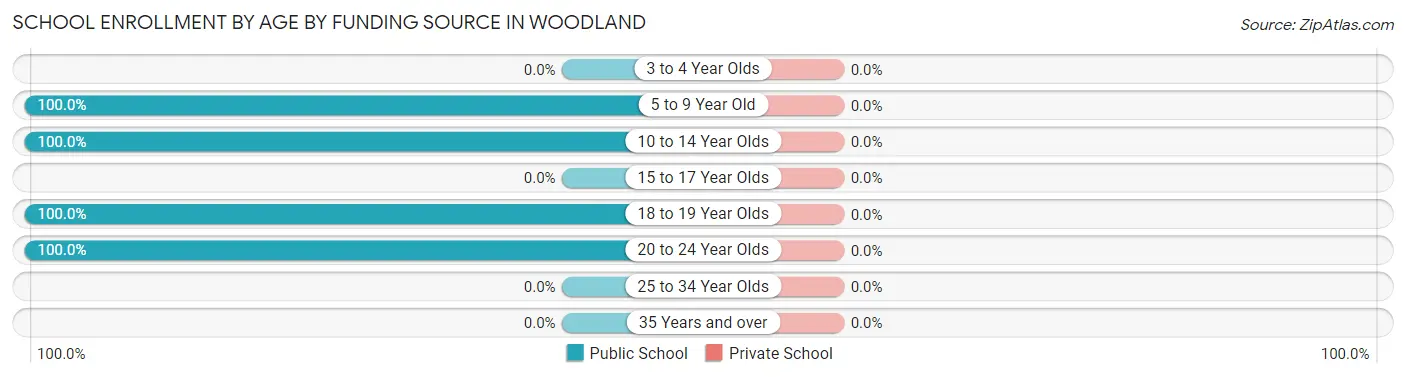
| Age Bracket | Public School | Private School |
| 3 to 4 Year Olds | 0 (0.0%) | 0 (0.0%) |
| 5 to 9 Year Old | 12 (100.0%) | 0 (0.0%) |
| 10 to 14 Year Olds | 16 (100.0%) | 0 (0.0%) |
| 15 to 17 Year Olds | 0 (0.0%) | 0 (0.0%) |
| 18 to 19 Year Olds | 10 (100.0%) | 0 (0.0%) |
| 20 to 24 Year Olds | 4 (100.0%) | 0 (0.0%) |
| 25 to 34 Year Olds | 0 (0.0%) | 0 (0.0%) |
| 35 Years and over | 0 (0.0%) | 0 (0.0%) |
| Total | 42 (100.0%) | 0 (0.0%) |
Educational Attainment by Field of Study in Woodland
Social sciences (6 | 37.5%), communications (5 | 31.2%), business (3 | 18.8%), psychology (1 | 6.2%), and education (1 | 6.2%) are the most common fields of study among 16 individuals in Woodland who have obtained a bachelor's degree or higher.
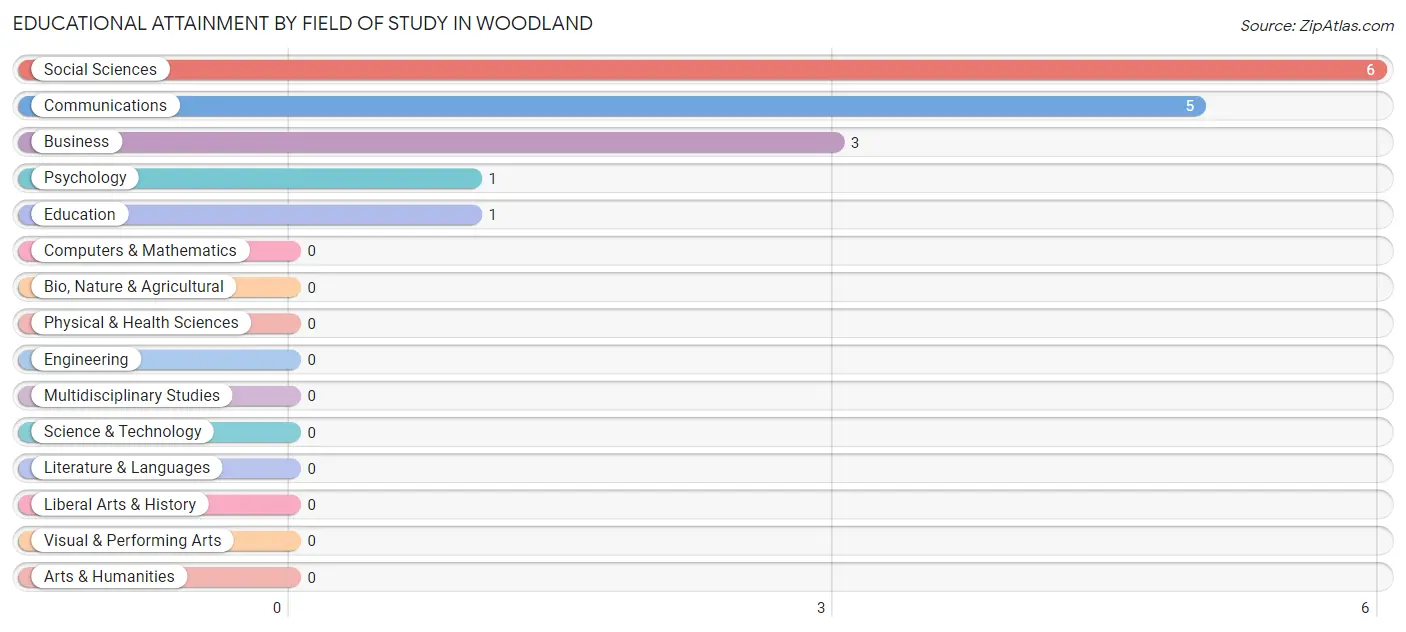
| Field of Study | # Graduates | % Graduates |
| Computers & Mathematics | 0 | 0.0% |
| Bio, Nature & Agricultural | 0 | 0.0% |
| Physical & Health Sciences | 0 | 0.0% |
| Psychology | 1 | 6.2% |
| Social Sciences | 6 | 37.5% |
| Engineering | 0 | 0.0% |
| Multidisciplinary Studies | 0 | 0.0% |
| Science & Technology | 0 | 0.0% |
| Business | 3 | 18.8% |
| Education | 1 | 6.2% |
| Literature & Languages | 0 | 0.0% |
| Liberal Arts & History | 0 | 0.0% |
| Visual & Performing Arts | 0 | 0.0% |
| Communications | 5 | 31.2% |
| Arts & Humanities | 0 | 0.0% |
| Total | 16 | 100.0% |
Transportation & Commute in Woodland
Vehicle Availability by Sex in Woodland
The most prevalent vehicle ownership categories in Woodland are males with 3 vehicles (19, accounting for 39.6%) and females with 3 vehicles (21, making up 46.3%).
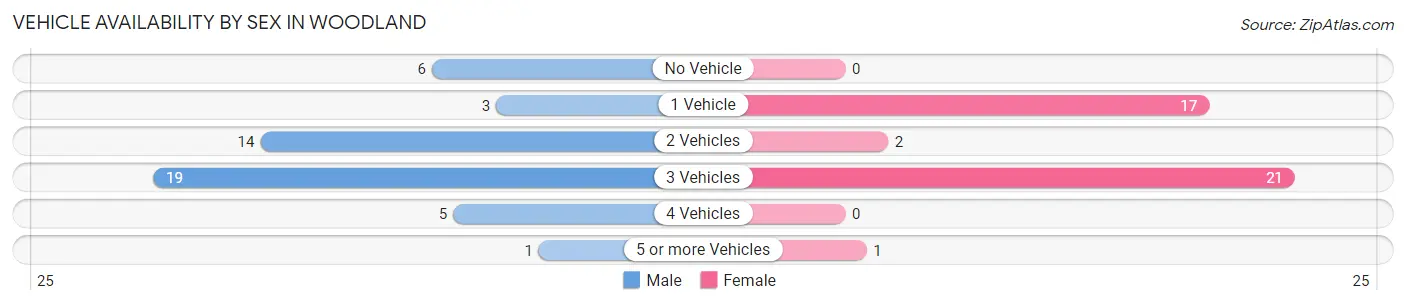
| Vehicles Available | Male | Female |
| No Vehicle | 6 (12.5%) | 0 (0.0%) |
| 1 Vehicle | 3 (6.2%) | 17 (41.5%) |
| 2 Vehicles | 14 (29.2%) | 2 (4.9%) |
| 3 Vehicles | 19 (39.6%) | 21 (51.2%) |
| 4 Vehicles | 5 (10.4%) | 0 (0.0%) |
| 5 or more Vehicles | 1 (2.1%) | 1 (2.4%) |
| Total | 48 (100.0%) | 41 (100.0%) |
Commute Time in Woodland
The most frequently occuring commute durations in Woodland are 60 to 89 minutes (26 commuters, 33.8%), 30 to 34 minutes (15 commuters, 19.5%), and 20 to 24 minutes (9 commuters, 11.7%).
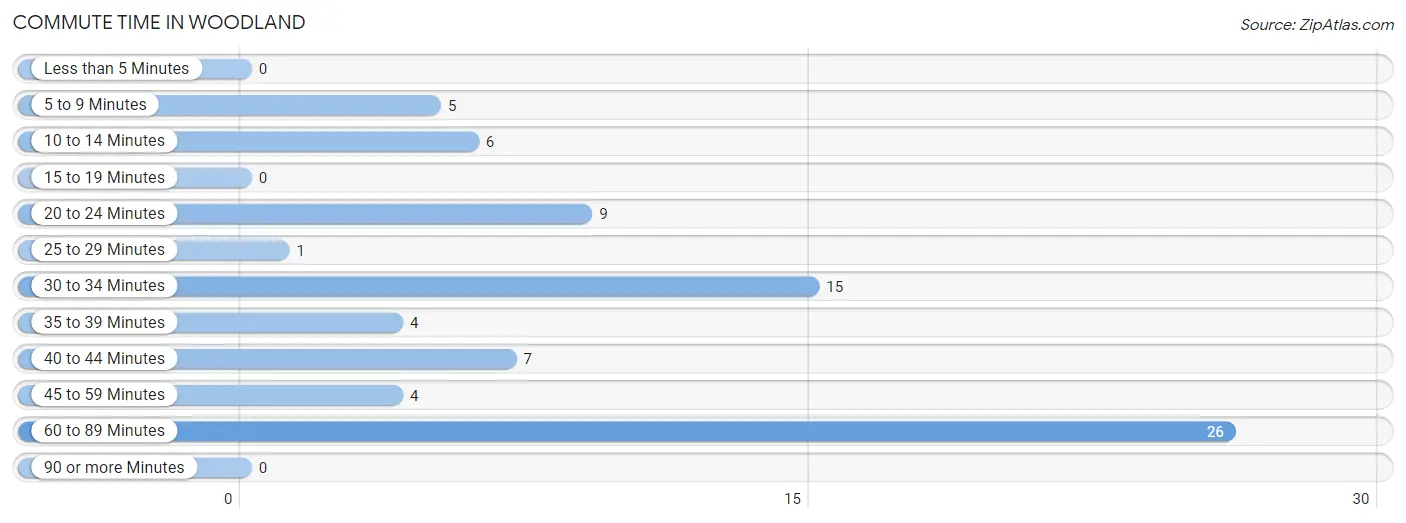
| Commute Time | # Commuters | % Commuters |
| Less than 5 Minutes | 0 | 0.0% |
| 5 to 9 Minutes | 5 | 6.5% |
| 10 to 14 Minutes | 6 | 7.8% |
| 15 to 19 Minutes | 0 | 0.0% |
| 20 to 24 Minutes | 9 | 11.7% |
| 25 to 29 Minutes | 1 | 1.3% |
| 30 to 34 Minutes | 15 | 19.5% |
| 35 to 39 Minutes | 4 | 5.2% |
| 40 to 44 Minutes | 7 | 9.1% |
| 45 to 59 Minutes | 4 | 5.2% |
| 60 to 89 Minutes | 26 | 33.8% |
| 90 or more Minutes | 0 | 0.0% |
Commute Time by Sex in Woodland
The most common commute times in Woodland are 60 to 89 minutes (15 commuters, 35.7%) for males and 60 to 89 minutes (11 commuters, 31.4%) for females.
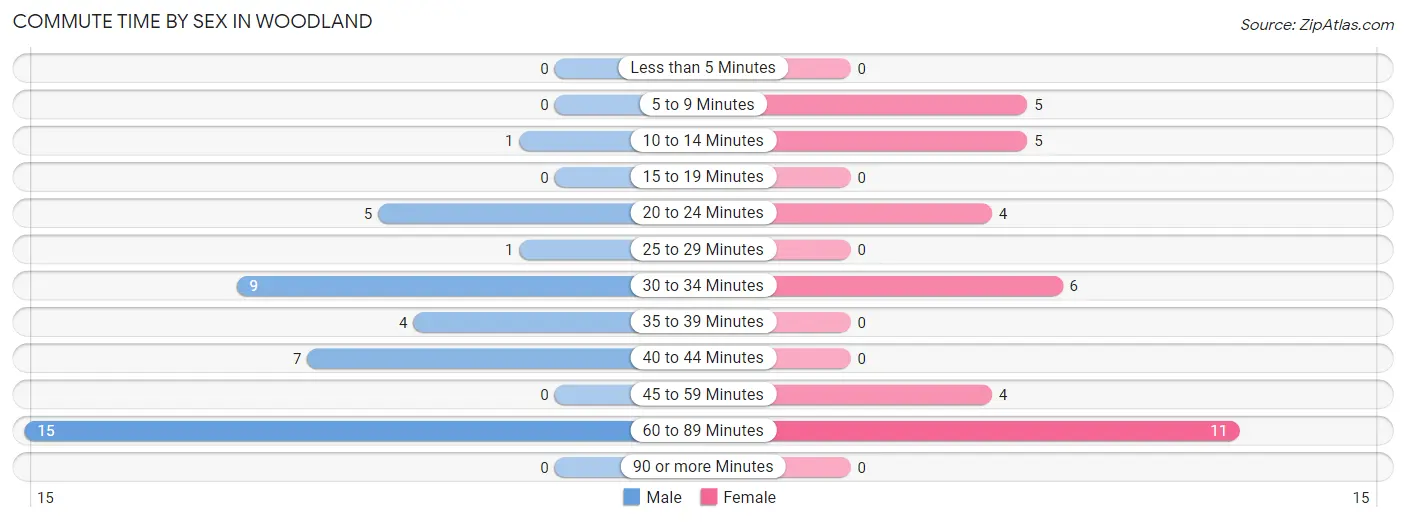
| Commute Time | Male | Female |
| Less than 5 Minutes | 0 (0.0%) | 0 (0.0%) |
| 5 to 9 Minutes | 0 (0.0%) | 5 (14.3%) |
| 10 to 14 Minutes | 1 (2.4%) | 5 (14.3%) |
| 15 to 19 Minutes | 0 (0.0%) | 0 (0.0%) |
| 20 to 24 Minutes | 5 (11.9%) | 4 (11.4%) |
| 25 to 29 Minutes | 1 (2.4%) | 0 (0.0%) |
| 30 to 34 Minutes | 9 (21.4%) | 6 (17.1%) |
| 35 to 39 Minutes | 4 (9.5%) | 0 (0.0%) |
| 40 to 44 Minutes | 7 (16.7%) | 0 (0.0%) |
| 45 to 59 Minutes | 0 (0.0%) | 4 (11.4%) |
| 60 to 89 Minutes | 15 (35.7%) | 11 (31.4%) |
| 90 or more Minutes | 0 (0.0%) | 0 (0.0%) |
Time of Departure to Work by Sex in Woodland
The most frequent times of departure to work in Woodland are 6:30 AM to 6:59 AM (14, 33.3%) for males and 5:00 AM to 5:29 AM (10, 28.6%) for females.
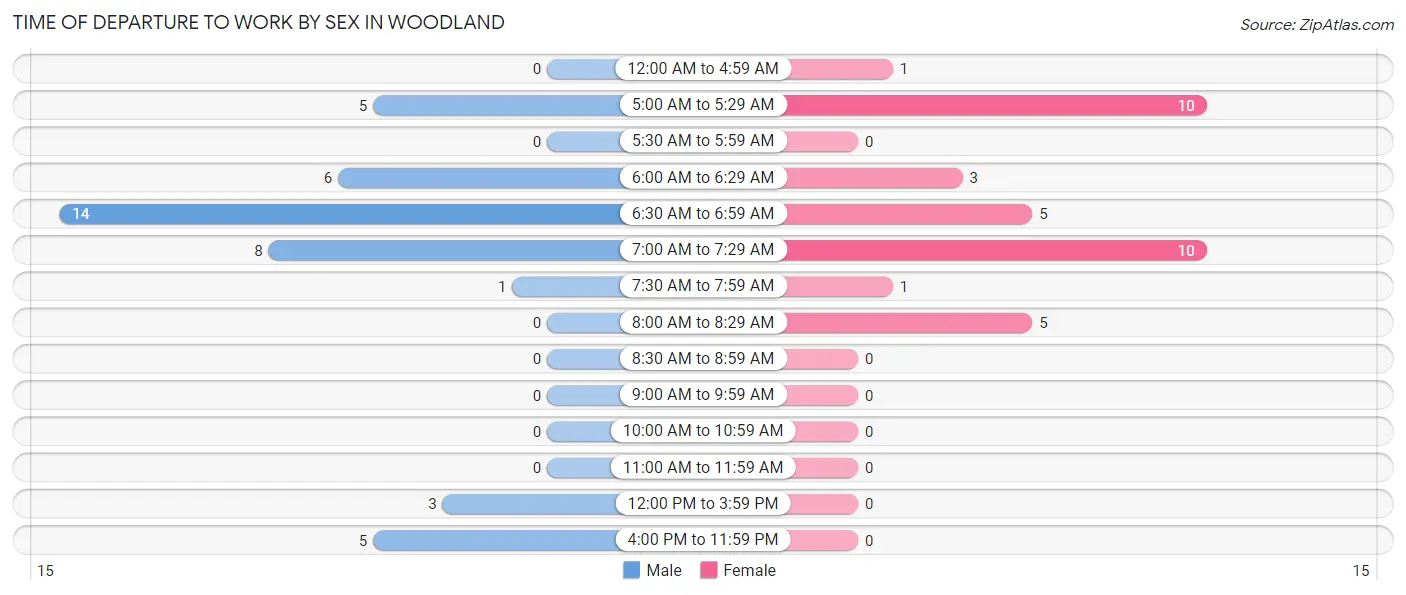
| Time of Departure | Male | Female |
| 12:00 AM to 4:59 AM | 0 (0.0%) | 1 (2.9%) |
| 5:00 AM to 5:29 AM | 5 (11.9%) | 10 (28.6%) |
| 5:30 AM to 5:59 AM | 0 (0.0%) | 0 (0.0%) |
| 6:00 AM to 6:29 AM | 6 (14.3%) | 3 (8.6%) |
| 6:30 AM to 6:59 AM | 14 (33.3%) | 5 (14.3%) |
| 7:00 AM to 7:29 AM | 8 (19.1%) | 10 (28.6%) |
| 7:30 AM to 7:59 AM | 1 (2.4%) | 1 (2.9%) |
| 8:00 AM to 8:29 AM | 0 (0.0%) | 5 (14.3%) |
| 8:30 AM to 8:59 AM | 0 (0.0%) | 0 (0.0%) |
| 9:00 AM to 9:59 AM | 0 (0.0%) | 0 (0.0%) |
| 10:00 AM to 10:59 AM | 0 (0.0%) | 0 (0.0%) |
| 11:00 AM to 11:59 AM | 0 (0.0%) | 0 (0.0%) |
| 12:00 PM to 3:59 PM | 3 (7.1%) | 0 (0.0%) |
| 4:00 PM to 11:59 PM | 5 (11.9%) | 0 (0.0%) |
| Total | 42 (100.0%) | 35 (100.0%) |
Housing Occupancy in Woodland
Occupancy by Ownership in Woodland
Of the total 151 dwellings in Woodland, owner-occupied units account for 118 (78.1%), while renter-occupied units make up 33 (21.8%).
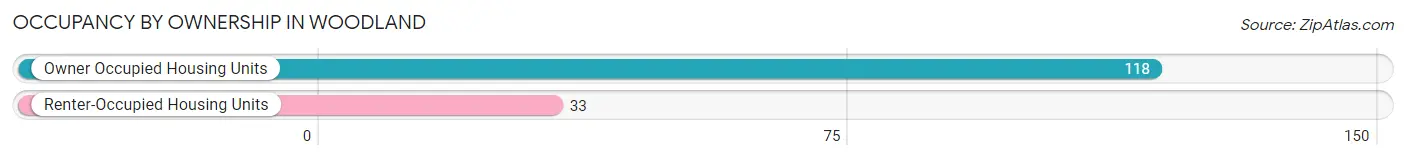
| Occupancy | # Housing Units | % Housing Units |
| Owner Occupied Housing Units | 118 | 78.1% |
| Renter-Occupied Housing Units | 33 | 21.8% |
| Total Occupied Housing Units | 151 | 100.0% |
Occupancy by Household Size in Woodland
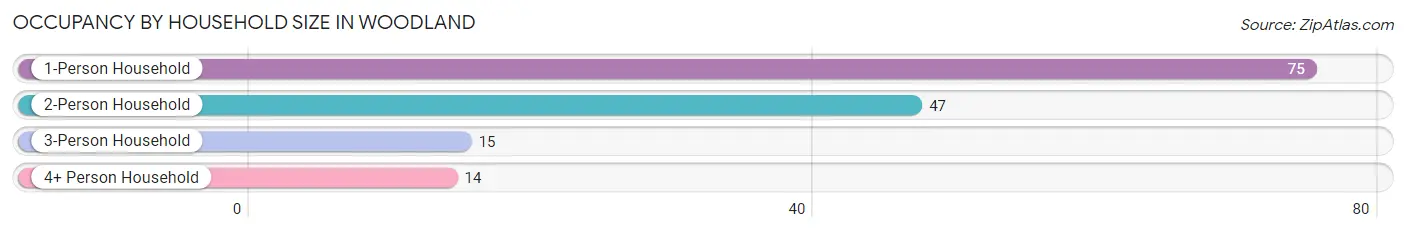
| Household Size | # Housing Units | % Housing Units |
| 1-Person Household | 75 | 49.7% |
| 2-Person Household | 47 | 31.1% |
| 3-Person Household | 15 | 9.9% |
| 4+ Person Household | 14 | 9.3% |
| Total Housing Units | 151 | 100.0% |
Occupancy by Ownership by Household Size in Woodland
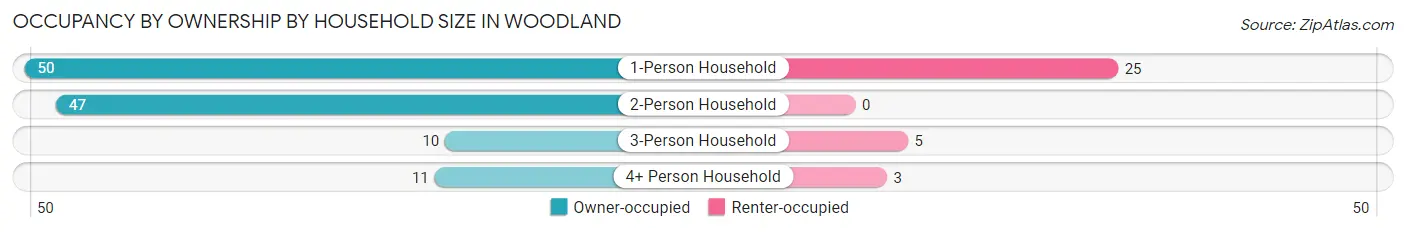
| Household Size | Owner-occupied | Renter-occupied |
| 1-Person Household | 50 (66.7%) | 25 (33.3%) |
| 2-Person Household | 47 (100.0%) | 0 (0.0%) |
| 3-Person Household | 10 (66.7%) | 5 (33.3%) |
| 4+ Person Household | 11 (78.6%) | 3 (21.4%) |
| Total Housing Units | 118 (78.1%) | 33 (21.8%) |
Occupancy by Educational Attainment in Woodland
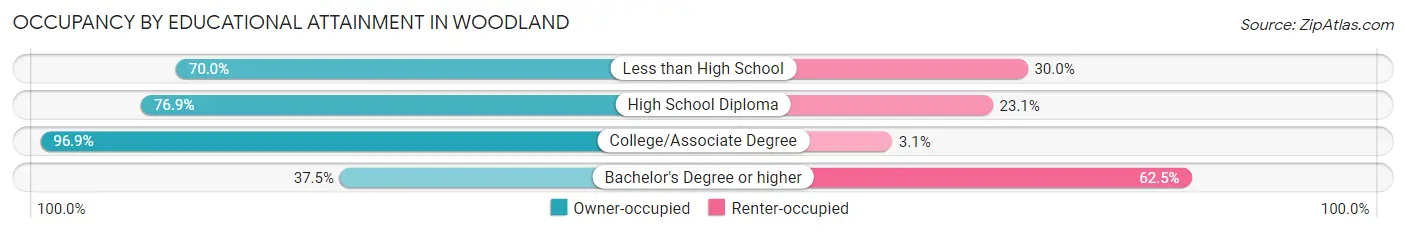
| Household Size | Owner-occupied | Renter-occupied |
| Less than High School | 14 (70.0%) | 6 (30.0%) |
| High School Diploma | 70 (76.9%) | 21 (23.1%) |
| College/Associate Degree | 31 (96.9%) | 1 (3.1%) |
| Bachelor's Degree or higher | 3 (37.5%) | 5 (62.5%) |
Occupancy by Age of Householder in Woodland
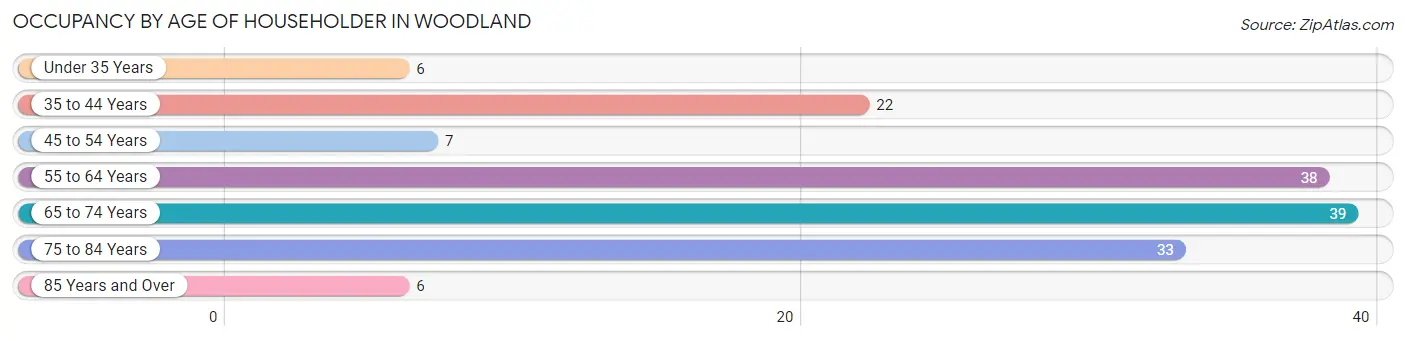
| Age Bracket | # Households | % Households |
| Under 35 Years | 6 | 4.0% |
| 35 to 44 Years | 22 | 14.6% |
| 45 to 54 Years | 7 | 4.6% |
| 55 to 64 Years | 38 | 25.2% |
| 65 to 74 Years | 39 | 25.8% |
| 75 to 84 Years | 33 | 21.8% |
| 85 Years and Over | 6 | 4.0% |
| Total | 151 | 100.0% |
Housing Finances in Woodland
Median Income by Occupancy in Woodland
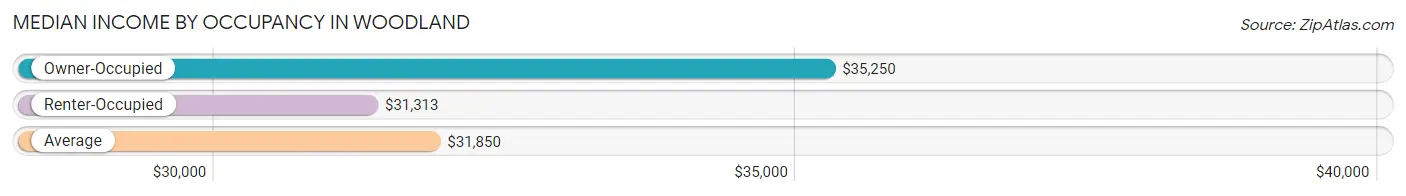
| Occupancy Type | # Households | Median Income |
| Owner-Occupied | 118 (78.1%) | $35,250 |
| Renter-Occupied | 33 (21.8%) | $31,313 |
| Average | 151 (100.0%) | $31,850 |
Occupancy by Householder Income Bracket in Woodland
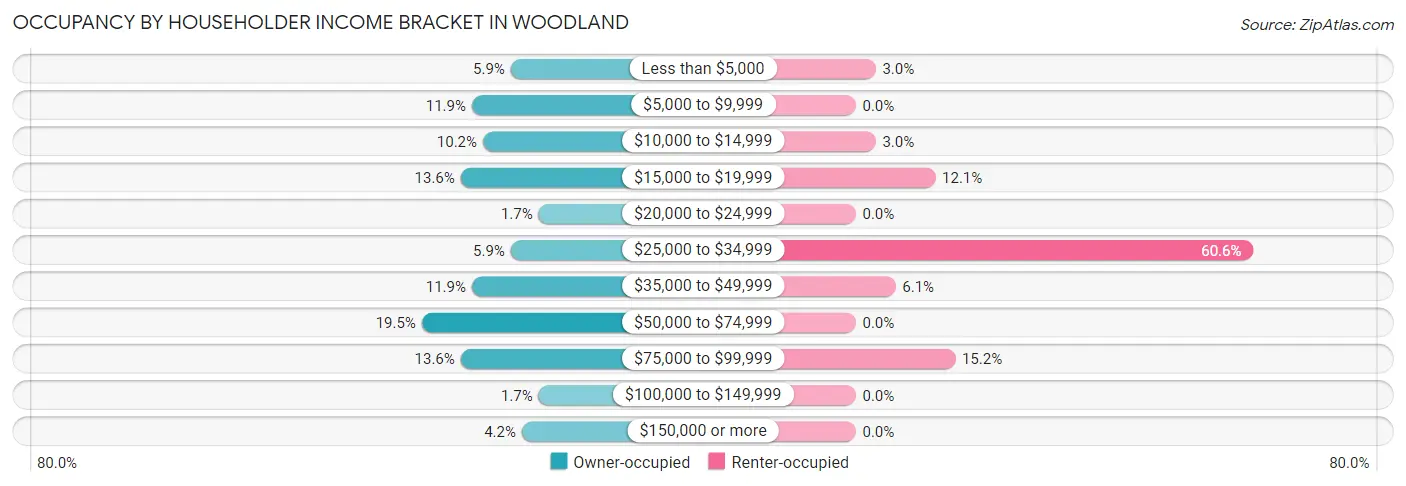
| Income Bracket | Owner-occupied | Renter-occupied |
| Less than $5,000 | 7 (5.9%) | 1 (3.0%) |
| $5,000 to $9,999 | 14 (11.9%) | 0 (0.0%) |
| $10,000 to $14,999 | 12 (10.2%) | 1 (3.0%) |
| $15,000 to $19,999 | 16 (13.6%) | 4 (12.1%) |
| $20,000 to $24,999 | 2 (1.7%) | 0 (0.0%) |
| $25,000 to $34,999 | 7 (5.9%) | 20 (60.6%) |
| $35,000 to $49,999 | 14 (11.9%) | 2 (6.1%) |
| $50,000 to $74,999 | 23 (19.5%) | 0 (0.0%) |
| $75,000 to $99,999 | 16 (13.6%) | 5 (15.1%) |
| $100,000 to $149,999 | 2 (1.7%) | 0 (0.0%) |
| $150,000 or more | 5 (4.2%) | 0 (0.0%) |
| Total | 118 (100.0%) | 33 (100.0%) |
Monthly Housing Cost Tiers in Woodland
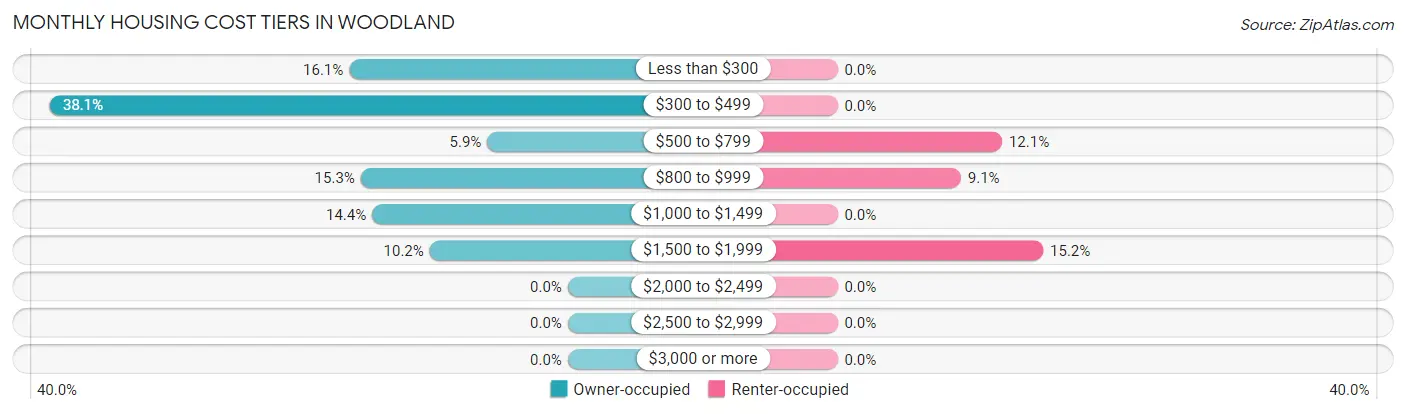
| Monthly Cost | Owner-occupied | Renter-occupied |
| Less than $300 | 19 (16.1%) | 0 (0.0%) |
| $300 to $499 | 45 (38.1%) | 0 (0.0%) |
| $500 to $799 | 7 (5.9%) | 4 (12.1%) |
| $800 to $999 | 18 (15.2%) | 3 (9.1%) |
| $1,000 to $1,499 | 17 (14.4%) | 0 (0.0%) |
| $1,500 to $1,999 | 12 (10.2%) | 5 (15.1%) |
| $2,000 to $2,499 | 0 (0.0%) | 0 (0.0%) |
| $2,500 to $2,999 | 0 (0.0%) | 0 (0.0%) |
| $3,000 or more | 0 (0.0%) | 0 (0.0%) |
| Total | 118 (100.0%) | 33 (100.0%) |
Physical Housing Characteristics in Woodland
Housing Structures in Woodland
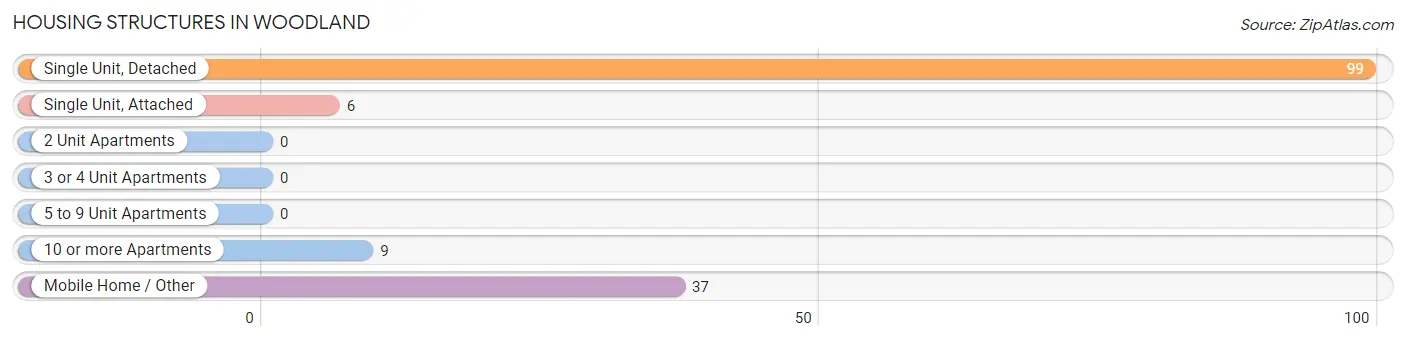
| Structure Type | # Housing Units | % Housing Units |
| Single Unit, Detached | 99 | 65.6% |
| Single Unit, Attached | 6 | 4.0% |
| 2 Unit Apartments | 0 | 0.0% |
| 3 or 4 Unit Apartments | 0 | 0.0% |
| 5 to 9 Unit Apartments | 0 | 0.0% |
| 10 or more Apartments | 9 | 6.0% |
| Mobile Home / Other | 37 | 24.5% |
| Total | 151 | 100.0% |
Housing Structures by Occupancy in Woodland
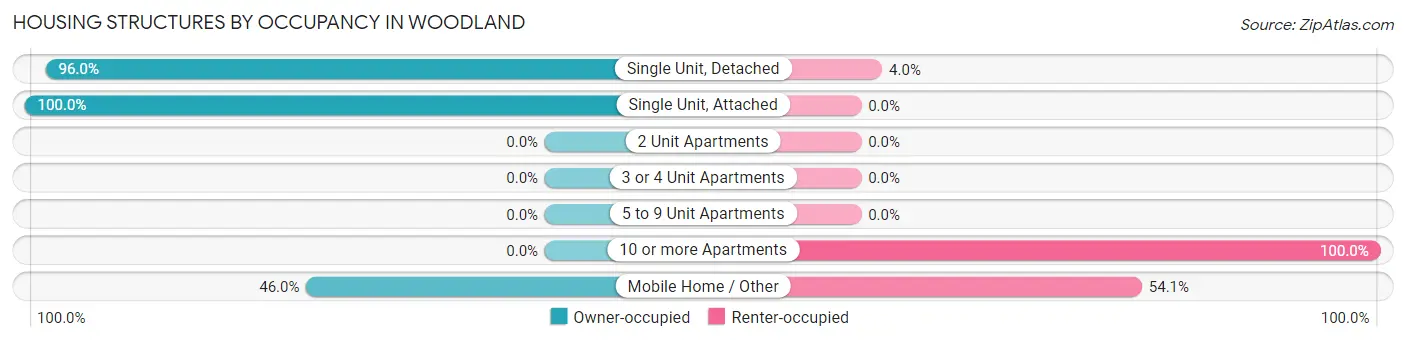
| Structure Type | Owner-occupied | Renter-occupied |
| Single Unit, Detached | 95 (96.0%) | 4 (4.0%) |
| Single Unit, Attached | 6 (100.0%) | 0 (0.0%) |
| 2 Unit Apartments | 0 (0.0%) | 0 (0.0%) |
| 3 or 4 Unit Apartments | 0 (0.0%) | 0 (0.0%) |
| 5 to 9 Unit Apartments | 0 (0.0%) | 0 (0.0%) |
| 10 or more Apartments | 0 (0.0%) | 9 (100.0%) |
| Mobile Home / Other | 17 (46.0%) | 20 (54.0%) |
| Total | 118 (78.1%) | 33 (21.8%) |
Housing Structures by Number of Rooms in Woodland
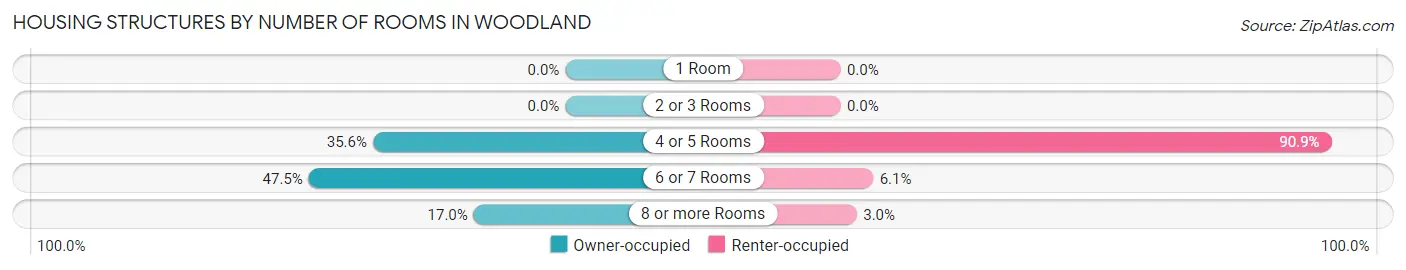
| Number of Rooms | Owner-occupied | Renter-occupied |
| 1 Room | 0 (0.0%) | 0 (0.0%) |
| 2 or 3 Rooms | 0 (0.0%) | 0 (0.0%) |
| 4 or 5 Rooms | 42 (35.6%) | 30 (90.9%) |
| 6 or 7 Rooms | 56 (47.5%) | 2 (6.1%) |
| 8 or more Rooms | 20 (17.0%) | 1 (3.0%) |
| Total | 118 (100.0%) | 33 (100.0%) |
Housing Structure by Heating Type in Woodland
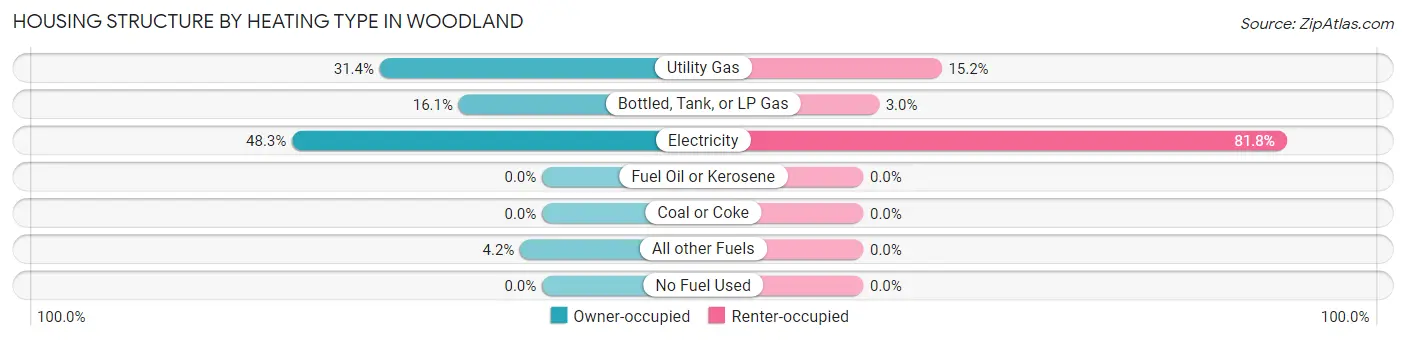
| Heating Type | Owner-occupied | Renter-occupied |
| Utility Gas | 37 (31.4%) | 5 (15.1%) |
| Bottled, Tank, or LP Gas | 19 (16.1%) | 1 (3.0%) |
| Electricity | 57 (48.3%) | 27 (81.8%) |
| Fuel Oil or Kerosene | 0 (0.0%) | 0 (0.0%) |
| Coal or Coke | 0 (0.0%) | 0 (0.0%) |
| All other Fuels | 5 (4.2%) | 0 (0.0%) |
| No Fuel Used | 0 (0.0%) | 0 (0.0%) |
| Total | 118 (100.0%) | 33 (100.0%) |
Household Vehicle Usage in Woodland
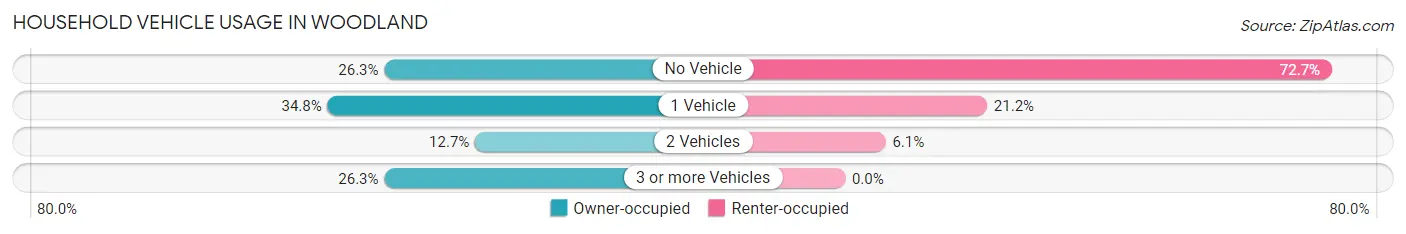
| Vehicles per Household | Owner-occupied | Renter-occupied |
| No Vehicle | 31 (26.3%) | 24 (72.7%) |
| 1 Vehicle | 41 (34.7%) | 7 (21.2%) |
| 2 Vehicles | 15 (12.7%) | 2 (6.1%) |
| 3 or more Vehicles | 31 (26.3%) | 0 (0.0%) |
| Total | 118 (100.0%) | 33 (100.0%) |
Real Estate & Mortgages in Woodland
Real Estate and Mortgage Overview in Woodland
| Characteristic | Without Mortgage | With Mortgage |
| Housing Units | 70 | 48 |
| Median Property Value | - | - |
| Median Household Income | $15,500 | $5 |
| Monthly Housing Costs | $342 | $0 |
| Real Estate Taxes | $406 | $0 |
Property Value by Mortgage Status in Woodland
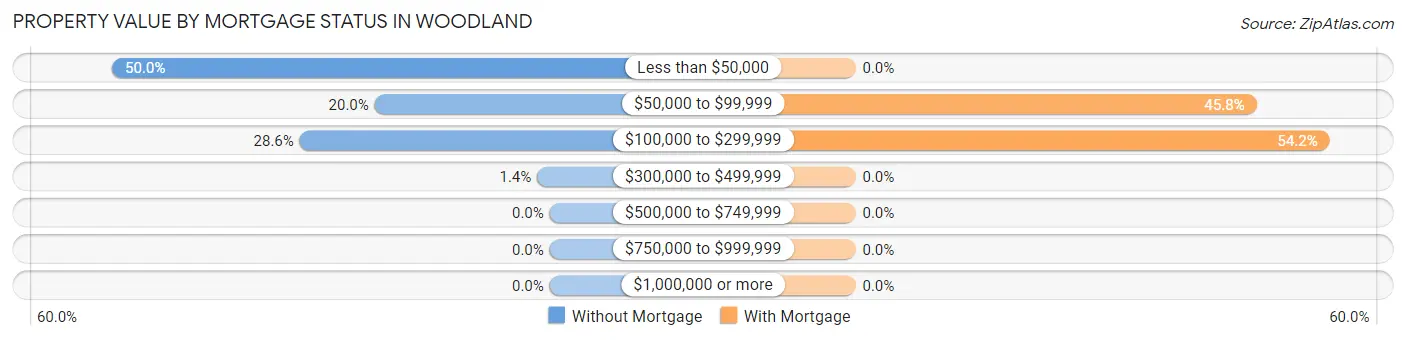
| Property Value | Without Mortgage | With Mortgage |
| Less than $50,000 | 35 (50.0%) | 0 (0.0%) |
| $50,000 to $99,999 | 14 (20.0%) | 22 (45.8%) |
| $100,000 to $299,999 | 20 (28.6%) | 26 (54.2%) |
| $300,000 to $499,999 | 1 (1.4%) | 0 (0.0%) |
| $500,000 to $749,999 | 0 (0.0%) | 0 (0.0%) |
| $750,000 to $999,999 | 0 (0.0%) | 0 (0.0%) |
| $1,000,000 or more | 0 (0.0%) | 0 (0.0%) |
| Total | 70 (100.0%) | 48 (100.0%) |
Household Income by Mortgage Status in Woodland
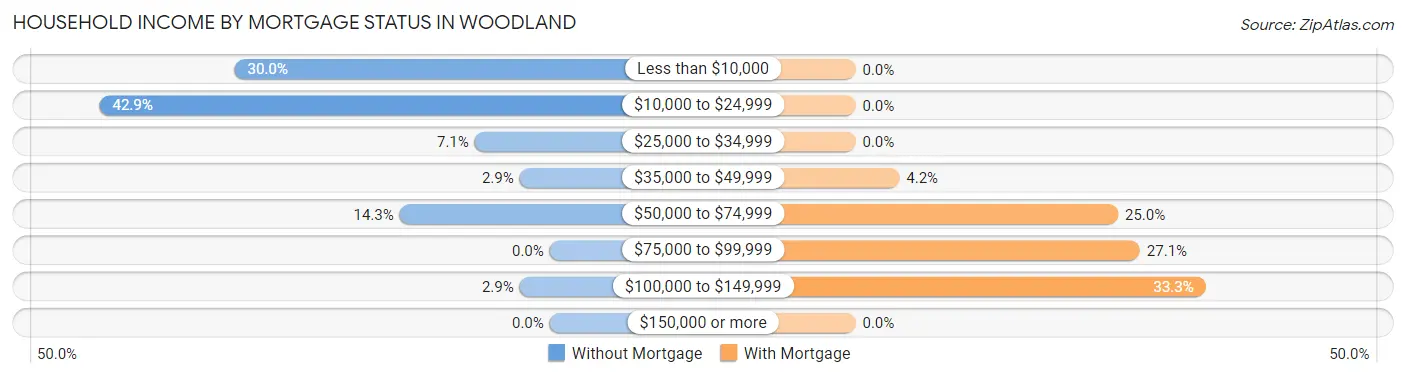
| Household Income | Without Mortgage | With Mortgage |
| Less than $10,000 | 21 (30.0%) | 0 (0.0%) |
| $10,000 to $24,999 | 30 (42.9%) | 0 (0.0%) |
| $25,000 to $34,999 | 5 (7.1%) | 0 (0.0%) |
| $35,000 to $49,999 | 2 (2.9%) | 2 (4.2%) |
| $50,000 to $74,999 | 10 (14.3%) | 12 (25.0%) |
| $75,000 to $99,999 | 0 (0.0%) | 13 (27.1%) |
| $100,000 to $149,999 | 2 (2.9%) | 16 (33.3%) |
| $150,000 or more | 0 (0.0%) | 0 (0.0%) |
| Total | 70 (100.0%) | 48 (100.0%) |
Property Value to Household Income Ratio in Woodland
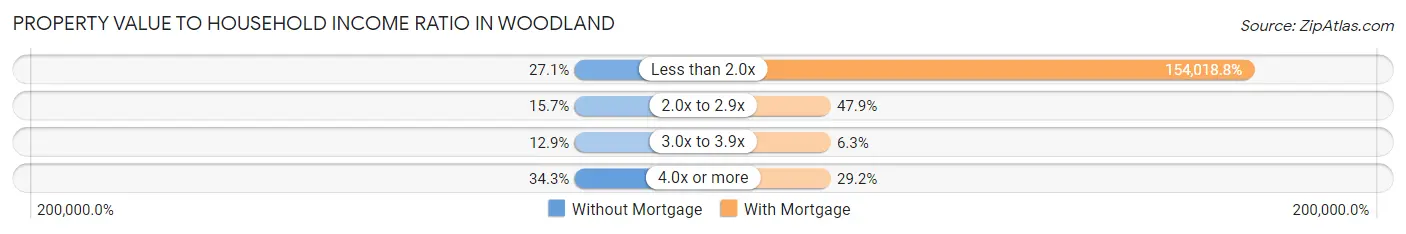
| Value-to-Income Ratio | Without Mortgage | With Mortgage |
| Less than 2.0x | 19 (27.1%) | 73,929 (154,018.8%) |
| 2.0x to 2.9x | 11 (15.7%) | 23 (47.9%) |
| 3.0x to 3.9x | 9 (12.9%) | 3 (6.2%) |
| 4.0x or more | 24 (34.3%) | 14 (29.2%) |
| Total | 70 (100.0%) | 48 (100.0%) |
Real Estate Taxes by Mortgage Status in Woodland
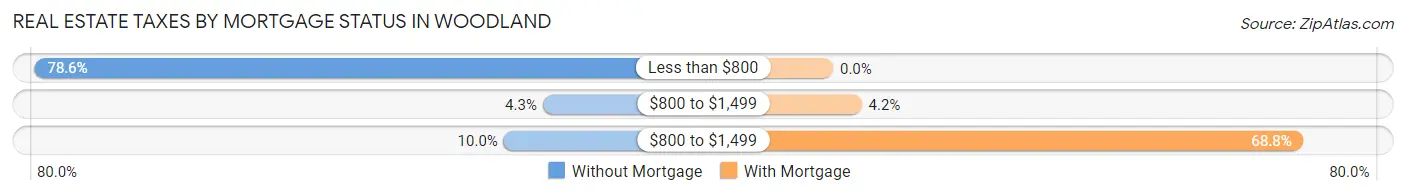
| Property Taxes | Without Mortgage | With Mortgage |
| Less than $800 | 55 (78.6%) | 0 (0.0%) |
| $800 to $1,499 | 3 (4.3%) | 2 (4.2%) |
| $800 to $1,499 | 7 (10.0%) | 33 (68.8%) |
| Total | 70 (100.0%) | 48 (100.0%) |
Health & Disability in Woodland
Health Insurance Coverage by Age in Woodland
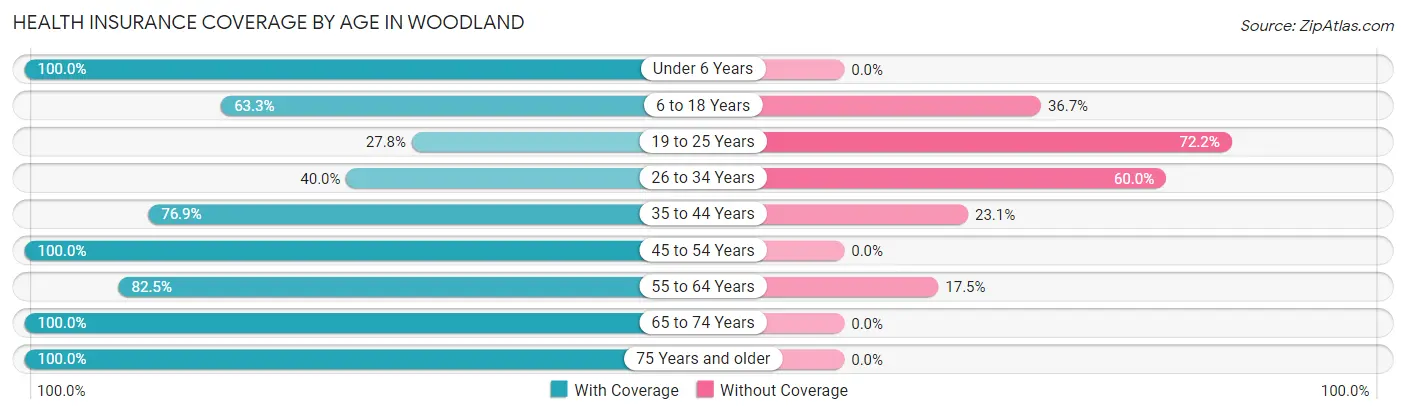
| Age Bracket | With Coverage | Without Coverage |
| Under 6 Years | 10 (100.0%) | 0 (0.0%) |
| 6 to 18 Years | 19 (63.3%) | 11 (36.7%) |
| 19 to 25 Years | 5 (27.8%) | 13 (72.2%) |
| 26 to 34 Years | 10 (40.0%) | 15 (60.0%) |
| 35 to 44 Years | 30 (76.9%) | 9 (23.1%) |
| 45 to 54 Years | 10 (100.0%) | 0 (0.0%) |
| 55 to 64 Years | 47 (82.5%) | 10 (17.5%) |
| 65 to 74 Years | 50 (100.0%) | 0 (0.0%) |
| 75 Years and older | 57 (100.0%) | 0 (0.0%) |
| Total | 238 (80.4%) | 58 (19.6%) |
Health Insurance Coverage by Citizenship Status in Woodland
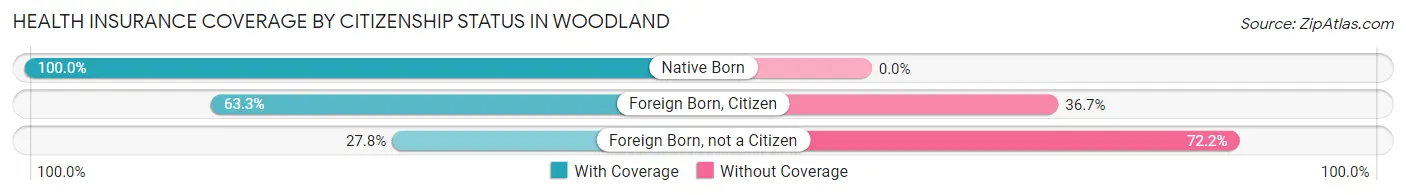
| Citizenship Status | With Coverage | Without Coverage |
| Native Born | 10 (100.0%) | 0 (0.0%) |
| Foreign Born, Citizen | 19 (63.3%) | 11 (36.7%) |
| Foreign Born, not a Citizen | 5 (27.8%) | 13 (72.2%) |
Health Insurance Coverage by Household Income in Woodland
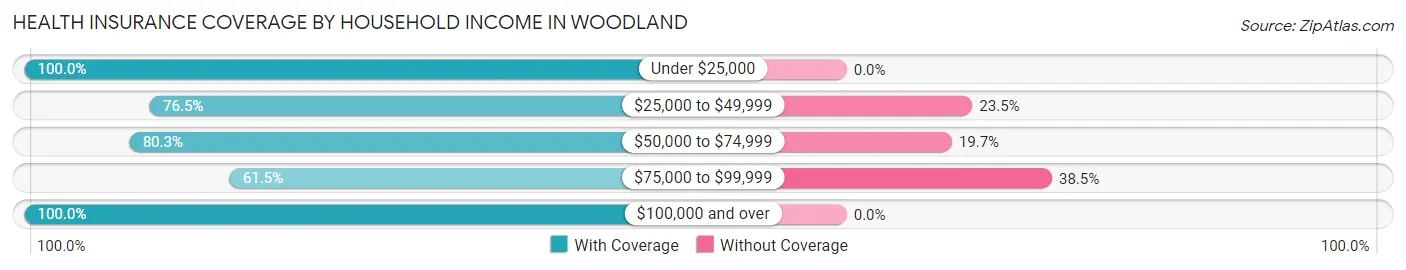
| Household Income | With Coverage | Without Coverage |
| Under $25,000 | 66 (100.0%) | 0 (0.0%) |
| $25,000 to $49,999 | 65 (76.5%) | 20 (23.5%) |
| $50,000 to $74,999 | 53 (80.3%) | 13 (19.7%) |
| $75,000 to $99,999 | 40 (61.5%) | 25 (38.5%) |
| $100,000 and over | 14 (100.0%) | 0 (0.0%) |
Public vs Private Health Insurance Coverage by Age in Woodland
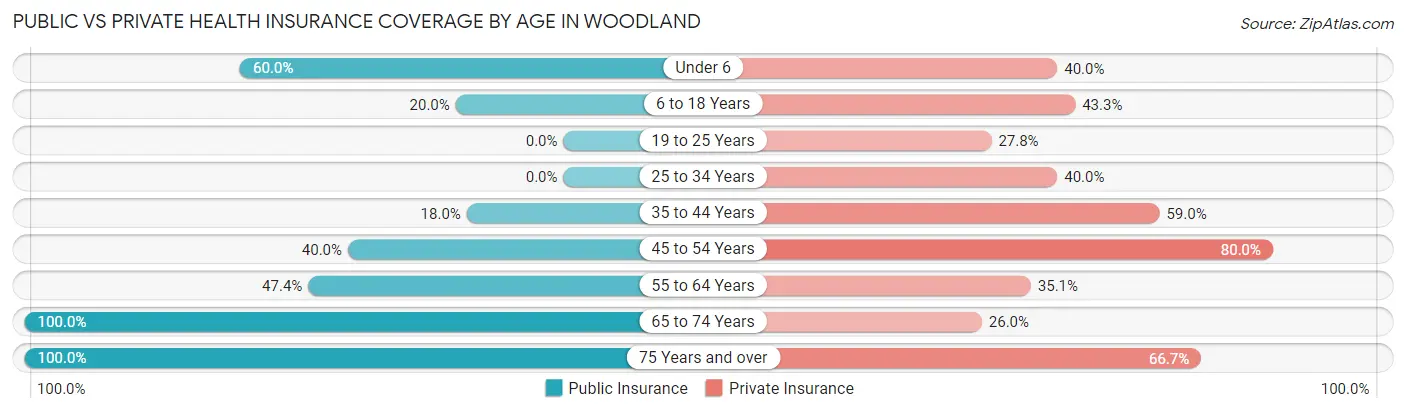
| Age Bracket | Public Insurance | Private Insurance |
| Under 6 | 6 (60.0%) | 4 (40.0%) |
| 6 to 18 Years | 6 (20.0%) | 13 (43.3%) |
| 19 to 25 Years | 0 (0.0%) | 5 (27.8%) |
| 25 to 34 Years | 0 (0.0%) | 10 (40.0%) |
| 35 to 44 Years | 7 (17.9%) | 23 (59.0%) |
| 45 to 54 Years | 4 (40.0%) | 8 (80.0%) |
| 55 to 64 Years | 27 (47.4%) | 20 (35.1%) |
| 65 to 74 Years | 50 (100.0%) | 13 (26.0%) |
| 75 Years and over | 57 (100.0%) | 38 (66.7%) |
| Total | 157 (53.0%) | 134 (45.3%) |
Disability Status by Sex by Age in Woodland
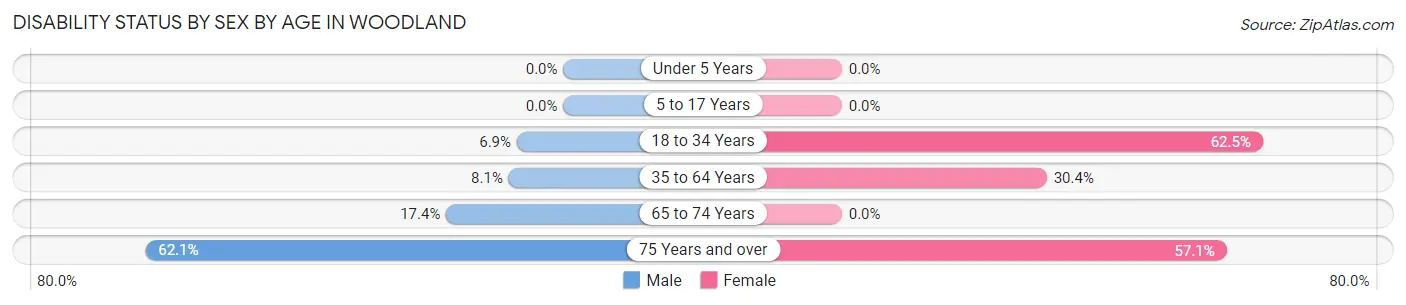
| Age Bracket | Male | Female |
| Under 5 Years | 0 (0.0%) | 0 (0.0%) |
| 5 to 17 Years | 0 (0.0%) | 0 (0.0%) |
| 18 to 34 Years | 2 (6.9%) | 10 (62.5%) |
| 35 to 64 Years | 3 (8.1%) | 21 (30.4%) |
| 65 to 74 Years | 4 (17.4%) | 0 (0.0%) |
| 75 Years and over | 18 (62.1%) | 16 (57.1%) |
Disability Class by Sex by Age in Woodland
Disability Class: Hearing Difficulty
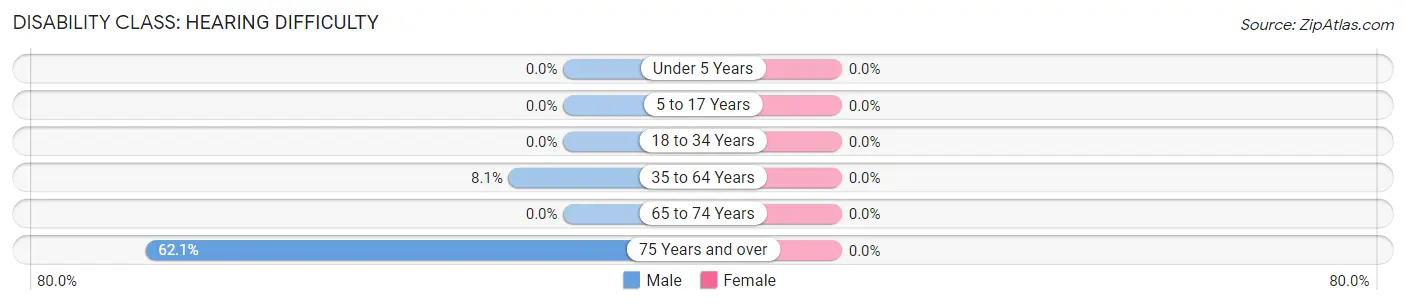
| Age Bracket | Male | Female |
| Under 5 Years | 0 (0.0%) | 0 (0.0%) |
| 5 to 17 Years | 0 (0.0%) | 0 (0.0%) |
| 18 to 34 Years | 0 (0.0%) | 0 (0.0%) |
| 35 to 64 Years | 3 (8.1%) | 0 (0.0%) |
| 65 to 74 Years | 0 (0.0%) | 0 (0.0%) |
| 75 Years and over | 18 (62.1%) | 0 (0.0%) |
Disability Class: Vision Difficulty
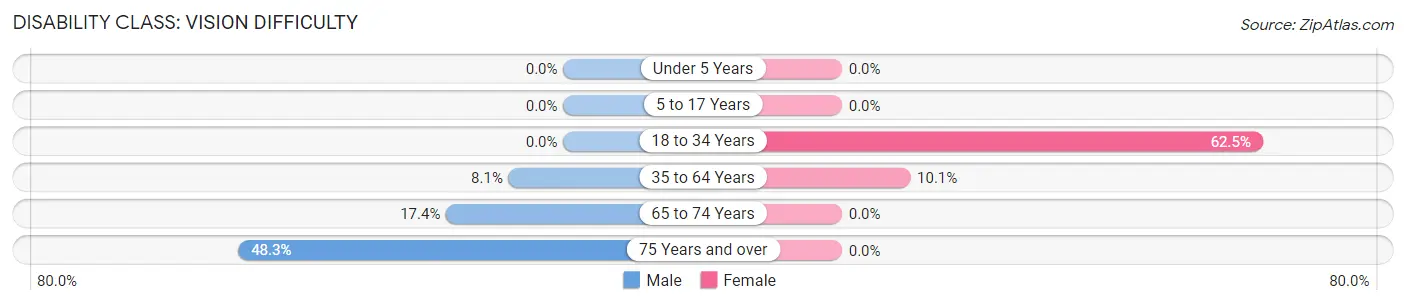
| Age Bracket | Male | Female |
| Under 5 Years | 0 (0.0%) | 0 (0.0%) |
| 5 to 17 Years | 0 (0.0%) | 0 (0.0%) |
| 18 to 34 Years | 0 (0.0%) | 10 (62.5%) |
| 35 to 64 Years | 3 (8.1%) | 7 (10.1%) |
| 65 to 74 Years | 4 (17.4%) | 0 (0.0%) |
| 75 Years and over | 14 (48.3%) | 0 (0.0%) |
Disability Class: Cognitive Difficulty
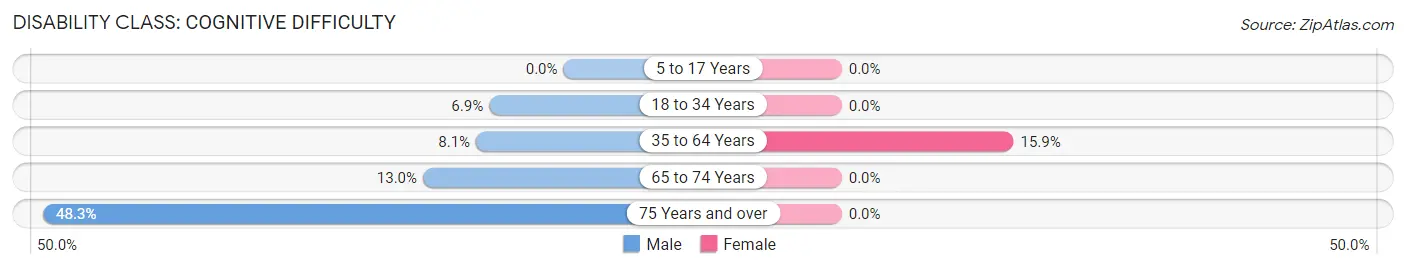
| Age Bracket | Male | Female |
| 5 to 17 Years | 0 (0.0%) | 0 (0.0%) |
| 18 to 34 Years | 2 (6.9%) | 0 (0.0%) |
| 35 to 64 Years | 3 (8.1%) | 11 (15.9%) |
| 65 to 74 Years | 3 (13.0%) | 0 (0.0%) |
| 75 Years and over | 14 (48.3%) | 0 (0.0%) |
Disability Class: Ambulatory Difficulty
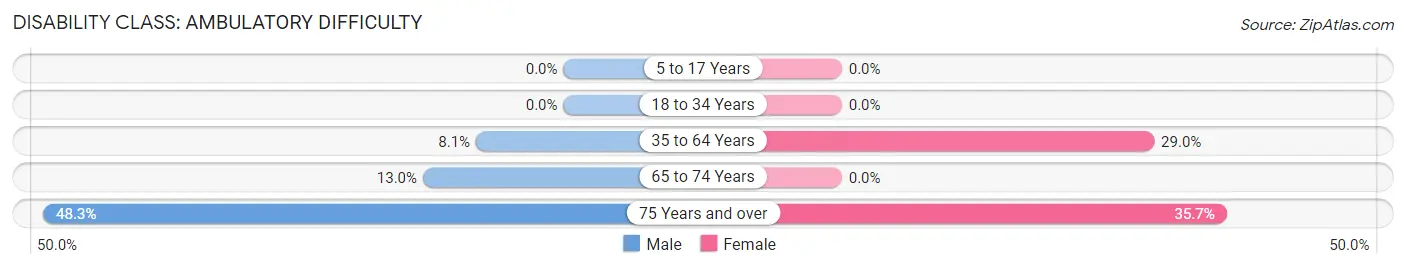
| Age Bracket | Male | Female |
| 5 to 17 Years | 0 (0.0%) | 0 (0.0%) |
| 18 to 34 Years | 0 (0.0%) | 0 (0.0%) |
| 35 to 64 Years | 3 (8.1%) | 20 (29.0%) |
| 65 to 74 Years | 3 (13.0%) | 0 (0.0%) |
| 75 Years and over | 14 (48.3%) | 10 (35.7%) |
Disability Class: Self-Care Difficulty
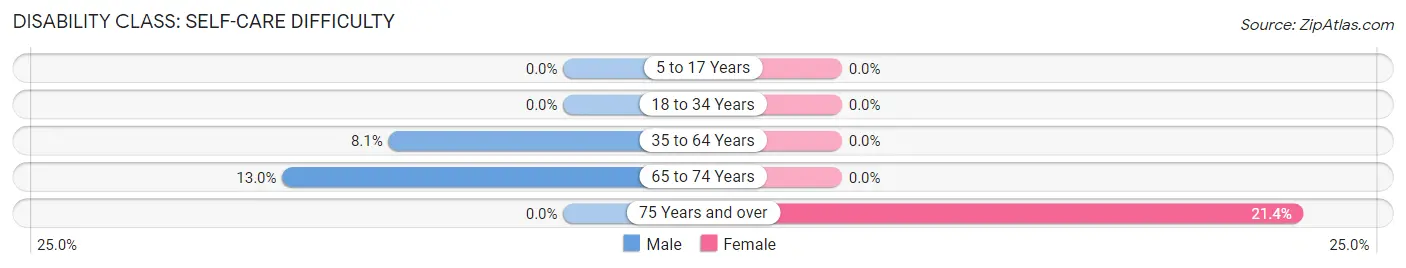
| Age Bracket | Male | Female |
| 5 to 17 Years | 0 (0.0%) | 0 (0.0%) |
| 18 to 34 Years | 0 (0.0%) | 0 (0.0%) |
| 35 to 64 Years | 3 (8.1%) | 0 (0.0%) |
| 65 to 74 Years | 3 (13.0%) | 0 (0.0%) |
| 75 Years and over | 0 (0.0%) | 6 (21.4%) |
Technology Access in Woodland
Computing Device Access in Woodland
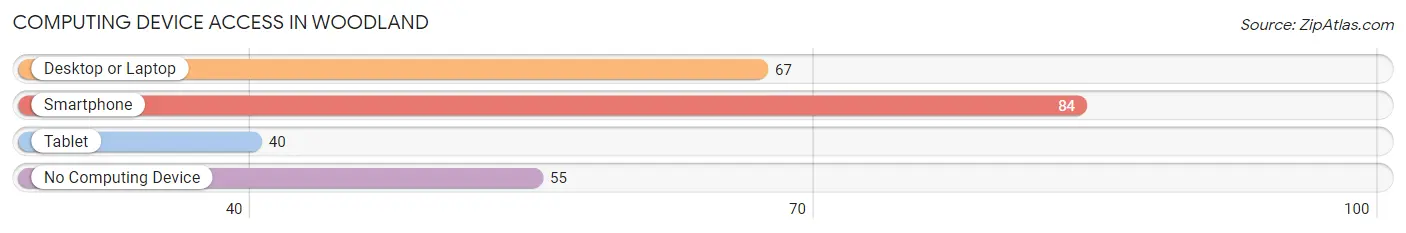
| Device Type | # Households | % Households |
| Desktop or Laptop | 67 | 44.4% |
| Smartphone | 84 | 55.6% |
| Tablet | 40 | 26.5% |
| No Computing Device | 55 | 36.4% |
| Total | 151 | 100.0% |
Internet Access in Woodland
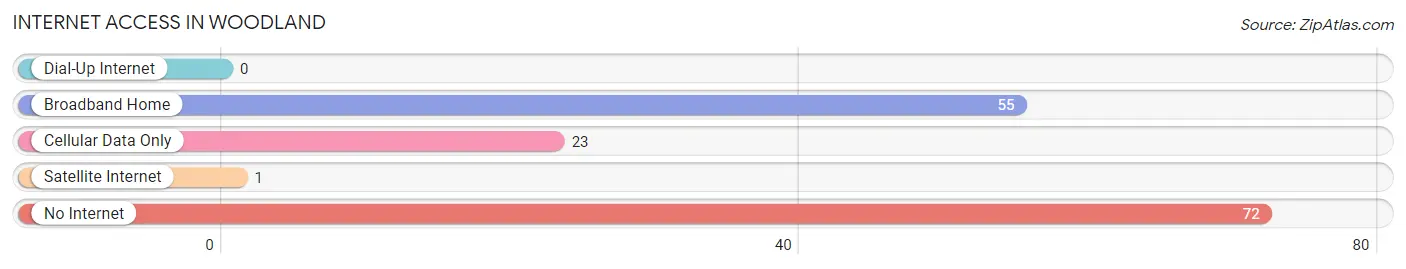
| Internet Type | # Households | % Households |
| Dial-Up Internet | 0 | 0.0% |
| Broadband Home | 55 | 36.4% |
| Cellular Data Only | 23 | 15.2% |
| Satellite Internet | 1 | 0.7% |
| No Internet | 72 | 47.7% |
| Total | 151 | 100.0% |
Woodland Summary
Woodland, Georgia is a small town located in the northwest corner of Georgia, in the foothills of the Appalachian Mountains. It is situated in the Chattahoochee National Forest, and is part of the Chattahoochee-Oconee National Forest. The town is located in the county of Walker, and is part of the Chattanooga, Tennessee-Georgia Metropolitan Statistical Area.
History
Woodland was first settled in the early 1800s by settlers from North Carolina and Virginia. The town was originally known as “Woodland Station”, and was a stop on the Western and Atlantic Railroad. The town was officially incorporated in 1887, and was named after the nearby Woodland Creek.
Geography
Woodland is located in the northwest corner of Georgia, in the foothills of the Appalachian Mountains. It is situated in the Chattahoochee National Forest, and is part of the Chattahoochee-Oconee National Forest. The town is located in the county of Walker, and is part of the Chattanooga, Tennessee-Georgia Metropolitan Statistical Area. The town is located at an elevation of 1,068 feet above sea level.
The town is located in a rural area, and is surrounded by forests and rolling hills. The town is located near the Georgia-Tennessee border, and is approximately 30 miles from Chattanooga, Tennessee.
Economy
The economy of Woodland is largely based on agriculture and forestry. The town is home to several farms, and the surrounding area is home to many timber companies. The town is also home to several small businesses, including a grocery store, a hardware store, and a few restaurants.
The town is also home to a few manufacturing companies, including a furniture manufacturer and a plastics manufacturer. The town is also home to a few small technology companies, including a software development company and a web design company.
Demographics
As of the 2010 census, the population of Woodland was 1,845. The racial makeup of the town was 95.3% White, 0.7% African American, 0.3% Native American, 0.2% Asian, 0.1% Pacific Islander, 1.7% from other races, and 1.9% from two or more races. Hispanic or Latino of any race were 3.2% of the population.
The median household income in Woodland was $37,917, and the median family income was $45,938. The per capita income for the town was $18,945. About 11.3% of families and 14.2% of the population were below the poverty line, including 18.2% of those under age 18 and 8.3% of those age 65 or over.
Woodland is a small town with a rich history and a strong economy. The town is home to many farms and timber companies, as well as several small businesses. The town is also home to a few manufacturing companies and technology companies. The town has a diverse population, with a median household income of $37,917.
Common Questions
What is Per Capita Income in Woodland?
Per Capita income in Woodland is $21,979.
What is the Median Family Income in Woodland?
Median Family Income in Woodland is $53,500.
What is the Median Household income in Woodland?
Median Household Income in Woodland is $31,850.
What is Income or Wage Gap in Woodland?
Income or Wage Gap in Woodland is 9.4%.
Women in Woodland earn 90.6 cents for every dollar earned by a man.
What is Inequality or Gini Index in Woodland?
Inequality or Gini Index in Woodland is 0.44.
What is the Total Population of Woodland?
Total Population of Woodland is 296.
What is the Total Male Population of Woodland?
Total Male Population of Woodland is 127.
What is the Total Female Population of Woodland?
Total Female Population of Woodland is 169.
What is the Ratio of Males per 100 Females in Woodland?
There are 75.15 Males per 100 Females in Woodland.
What is the Ratio of Females per 100 Males in Woodland?
There are 133.07 Females per 100 Males in Woodland.
What is the Median Population Age in Woodland?
Median Population Age in Woodland is 58.8 Years.
What is the Average Family Size in Woodland
Average Family Size in Woodland is 2.6 People.
What is the Average Household Size in Woodland
Average Household Size in Woodland is 2.0 People.
How Large is the Labor Force in Woodland?
There are 99 People in the Labor Forcein in Woodland.
What is the Percentage of People in the Labor Force in Woodland?
38.4% of People are in the Labor Force in Woodland.
What is the Unemployment Rate in Woodland?
Unemployment Rate in Woodland is 10.1%.