Uvalda, GA Map & Demographics
Uvalda Map
Uvalda Overview
$58,211
PER CAPITA INCOME
$95,417
AVG FAMILY INCOME
$65,192
AVG HOUSEHOLD INCOME
0.63
INEQUALITY / GINI INDEX
387
TOTAL POPULATION
159
MALE POPULATION
228
FEMALE POPULATION
69.74
MALES / 100 FEMALES
143.40
FEMALES / 100 MALES
42.9
MEDIAN AGE
2.4
AVG FAMILY SIZE
2.0
AVG HOUSEHOLD SIZE
196
LABOR FORCE [ PEOPLE ]
58.7%
PERCENT IN LABOR FORCE
8.2%
UNEMPLOYMENT RATE
Uvalda Zip Codes
Uvalda Area Codes
Income in Uvalda
Income Overview in Uvalda
Per Capita Income in Uvalda is $58,211, while median incomes of families and households are $95,417 and $65,192 respectively.
| Characteristic | Number | Measure |
| Per Capita Income | 387 | $58,211 |
| Median Family Income | 133 | $95,417 |
| Mean Family Income | 133 | $203,192 |
| Median Household Income | 190 | $65,192 |
| Mean Household Income | 190 | $153,764 |
| Income Deficit | 133 | $0 |
| Wage / Income Gap (%) | 387 | 0.00% |
| Wage / Income Gap ($) | 387 | 100.00¢ per $1 |
| Gini / Inequality Index | 387 | 0.63 |
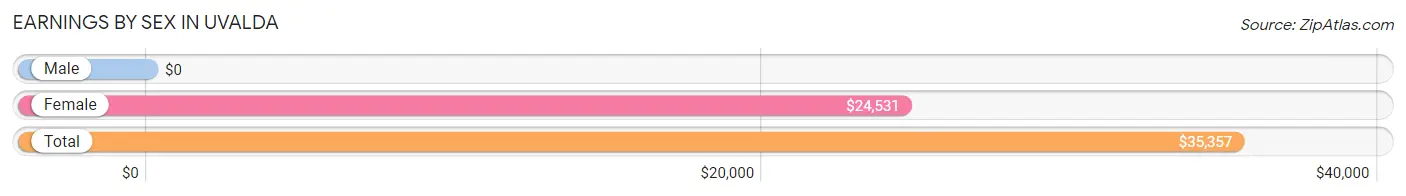
Earnings by Sex in Uvalda
| Sex | Number | Average Earnings |
| Male | 95 (46.6%) | $0 |
| Female | 109 (53.4%) | $24,531 |
| Total | 204 (100.0%) | $35,357 |
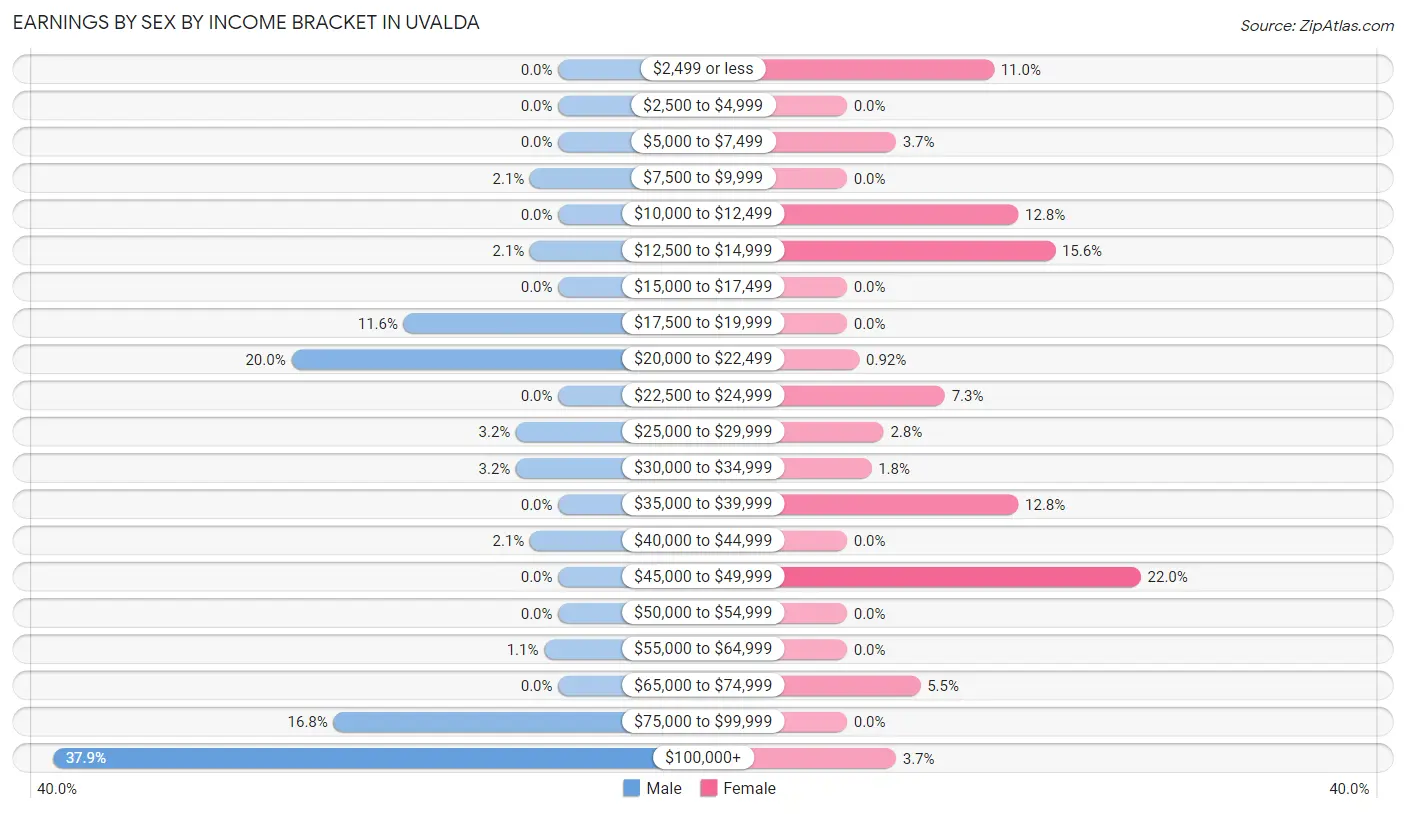
Earnings by Sex by Income Bracket in Uvalda
The most common earnings brackets in Uvalda are $100,000+ for men (36 | 37.9%) and $45,000 to $49,999 for women (24 | 22.0%).
| Income | Male | Female |
| $2,499 or less | 0 (0.0%) | 12 (11.0%) |
| $2,500 to $4,999 | 0 (0.0%) | 0 (0.0%) |
| $5,000 to $7,499 | 0 (0.0%) | 4 (3.7%) |
| $7,500 to $9,999 | 2 (2.1%) | 0 (0.0%) |
| $10,000 to $12,499 | 0 (0.0%) | 14 (12.8%) |
| $12,500 to $14,999 | 2 (2.1%) | 17 (15.6%) |
| $15,000 to $17,499 | 0 (0.0%) | 0 (0.0%) |
| $17,500 to $19,999 | 11 (11.6%) | 0 (0.0%) |
| $20,000 to $22,499 | 19 (20.0%) | 1 (0.9%) |
| $22,500 to $24,999 | 0 (0.0%) | 8 (7.3%) |
| $25,000 to $29,999 | 3 (3.2%) | 3 (2.8%) |
| $30,000 to $34,999 | 3 (3.2%) | 2 (1.8%) |
| $35,000 to $39,999 | 0 (0.0%) | 14 (12.8%) |
| $40,000 to $44,999 | 2 (2.1%) | 0 (0.0%) |
| $45,000 to $49,999 | 0 (0.0%) | 24 (22.0%) |
| $50,000 to $54,999 | 0 (0.0%) | 0 (0.0%) |
| $55,000 to $64,999 | 1 (1.1%) | 0 (0.0%) |
| $65,000 to $74,999 | 0 (0.0%) | 6 (5.5%) |
| $75,000 to $99,999 | 16 (16.8%) | 0 (0.0%) |
| $100,000+ | 36 (37.9%) | 4 (3.7%) |
| Total | 95 (100.0%) | 109 (100.0%) |
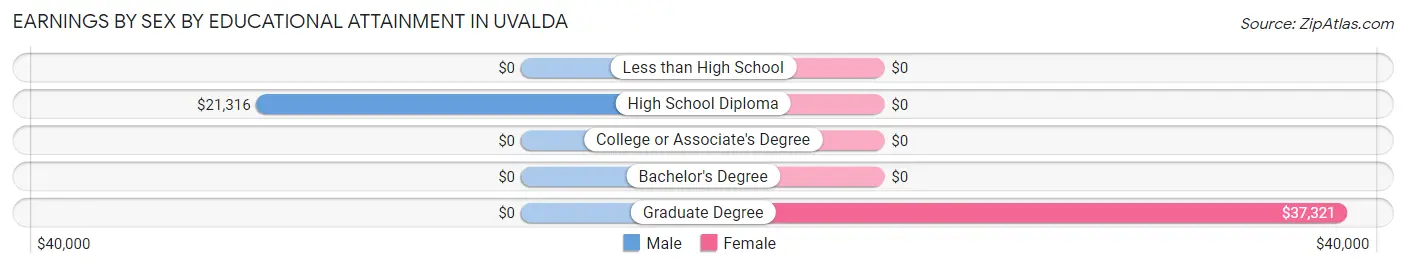
Earnings by Sex by Educational Attainment in Uvalda
| Educational Attainment | Male Income | Female Income |
| Less than High School | - | - |
| High School Diploma | $21,316 | $0 |
| College or Associate's Degree | - | - |
| Bachelor's Degree | - | - |
| Graduate Degree | - | - |
| Total | - | - |
Family Income in Uvalda
Family Income Brackets in Uvalda
According to the Uvalda family income data, there are 43 families falling into the $200,000+ income range, which is the most common income bracket and makes up 32.3% of all families.
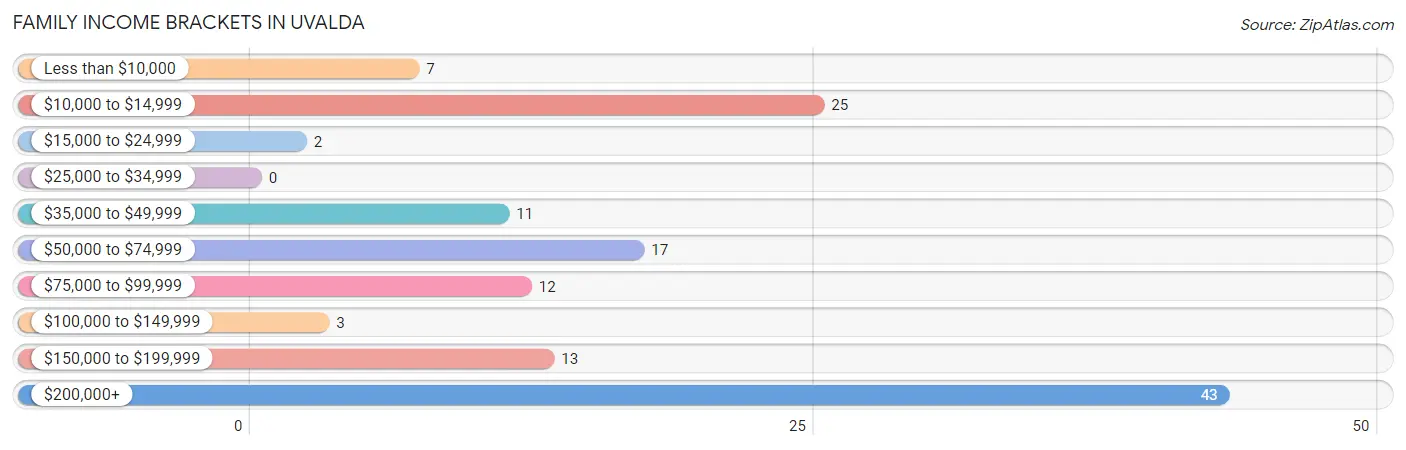
| Income Bracket | # Families | % Families |
| Less than $10,000 | 7 | 5.3% |
| $10,000 to $14,999 | 25 | 18.8% |
| $15,000 to $24,999 | 2 | 1.5% |
| $25,000 to $34,999 | 0 | 0.0% |
| $35,000 to $49,999 | 11 | 8.3% |
| $50,000 to $74,999 | 17 | 12.8% |
| $75,000 to $99,999 | 12 | 9.0% |
| $100,000 to $149,999 | 3 | 2.3% |
| $150,000 to $199,999 | 13 | 9.8% |
| $200,000+ | 43 | 32.3% |
Family Income by Famaliy Size in Uvalda
2-person families (83 | 62.4%) account for the highest median family income in Uvalda with $220,625 per family, while 2-person families (83 | 62.4%) have the highest median income of $110,312 per family member.
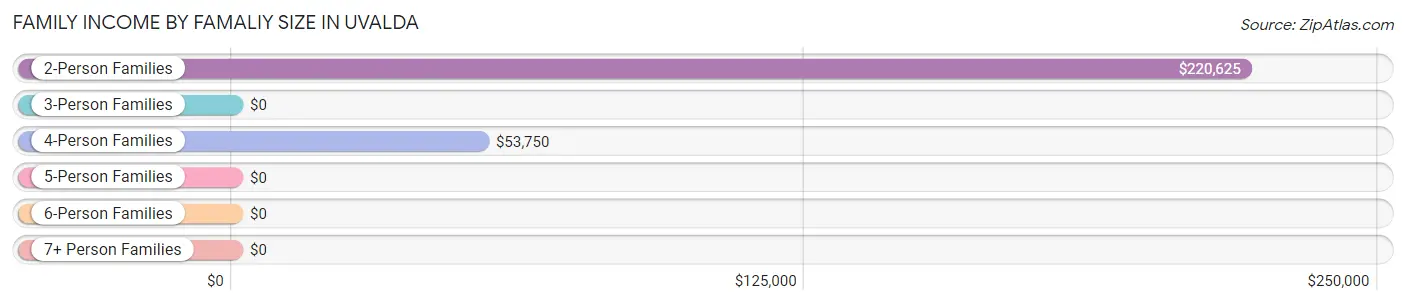
| Income Bracket | # Families | Median Income |
| 2-Person Families | 83 (62.4%) | $220,625 |
| 3-Person Families | 38 (28.6%) | $0 |
| 4-Person Families | 12 (9.0%) | $53,750 |
| 5-Person Families | 0 (0.0%) | $0 |
| 6-Person Families | 0 (0.0%) | $0 |
| 7+ Person Families | 0 (0.0%) | $0 |
| Total | 133 (100.0%) | $95,417 |
Family Income by Number of Earners in Uvalda
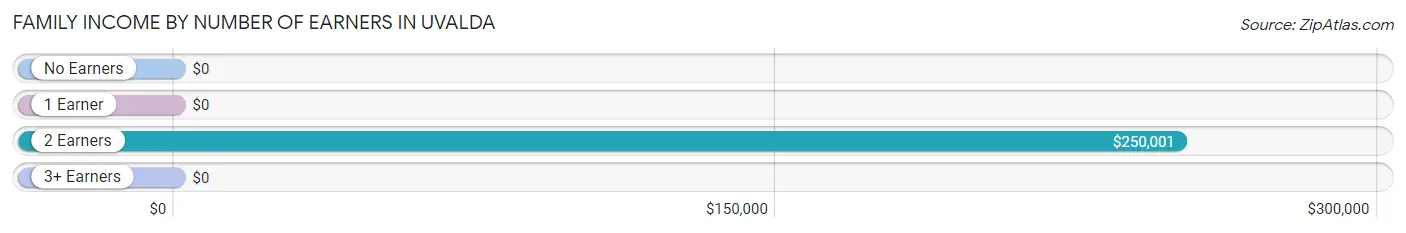
| Number of Earners | # Families | Median Income |
| No Earners | 22 (16.5%) | $0 |
| 1 Earner | 50 (37.6%) | $0 |
| 2 Earners | 58 (43.6%) | $250,001 |
| 3+ Earners | 3 (2.3%) | $0 |
| Total | 133 (100.0%) | $95,417 |
Household Income in Uvalda
Household Income Brackets in Uvalda
With 43 households falling in the category, the $200,000+ income range is the most frequent in Uvalda, accounting for 22.6% of all households. In contrast, only 3 households (1.6%) fall into the $100,000 to $149,999 income bracket, making it the least populous group.
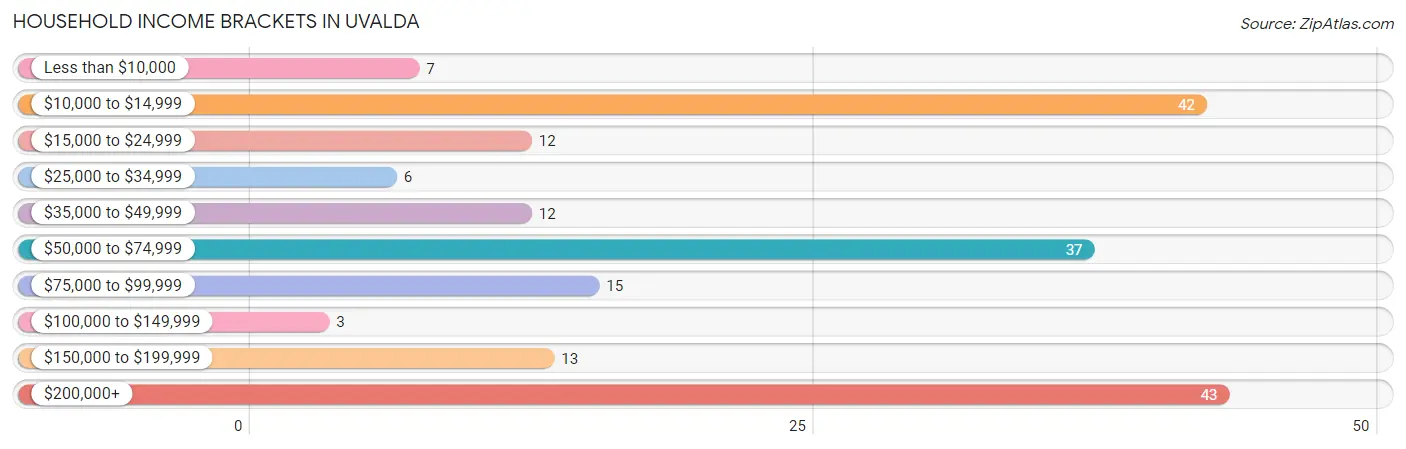
| Income Bracket | # Households | % Households |
| Less than $10,000 | 7 | 3.7% |
| $10,000 to $14,999 | 42 | 22.1% |
| $15,000 to $24,999 | 12 | 6.3% |
| $25,000 to $34,999 | 6 | 3.2% |
| $35,000 to $49,999 | 12 | 6.3% |
| $50,000 to $74,999 | 37 | 19.5% |
| $75,000 to $99,999 | 15 | 7.9% |
| $100,000 to $149,999 | 3 | 1.6% |
| $150,000 to $199,999 | 13 | 6.8% |
| $200,000+ | 43 | 22.6% |
Household Income by Householder Age in Uvalda
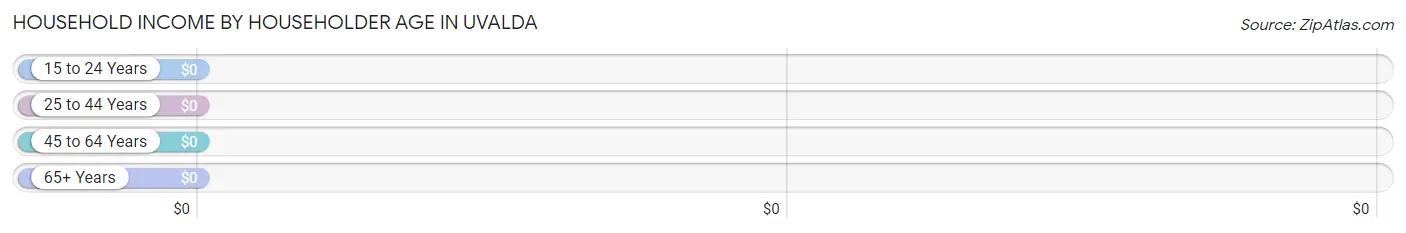
| Income Bracket | # Households | Median Income |
| 15 to 24 Years | 10 (5.3%) | $0 |
| 25 to 44 Years | 66 (34.7%) | $0 |
| 45 to 64 Years | 45 (23.7%) | $0 |
| 65+ Years | 69 (36.3%) | $0 |
| Total | 190 (100.0%) | $65,192 |
Poverty in Uvalda
Income Below Poverty by Sex and Age in Uvalda
With 11.3% poverty level for males and 29.4% for females among the residents of Uvalda, under 5 year old males and under 5 year old females are the most vulnerable to poverty, with 6 males (60.0%) and 13 females (100.0%) in their respective age groups living below the poverty level.
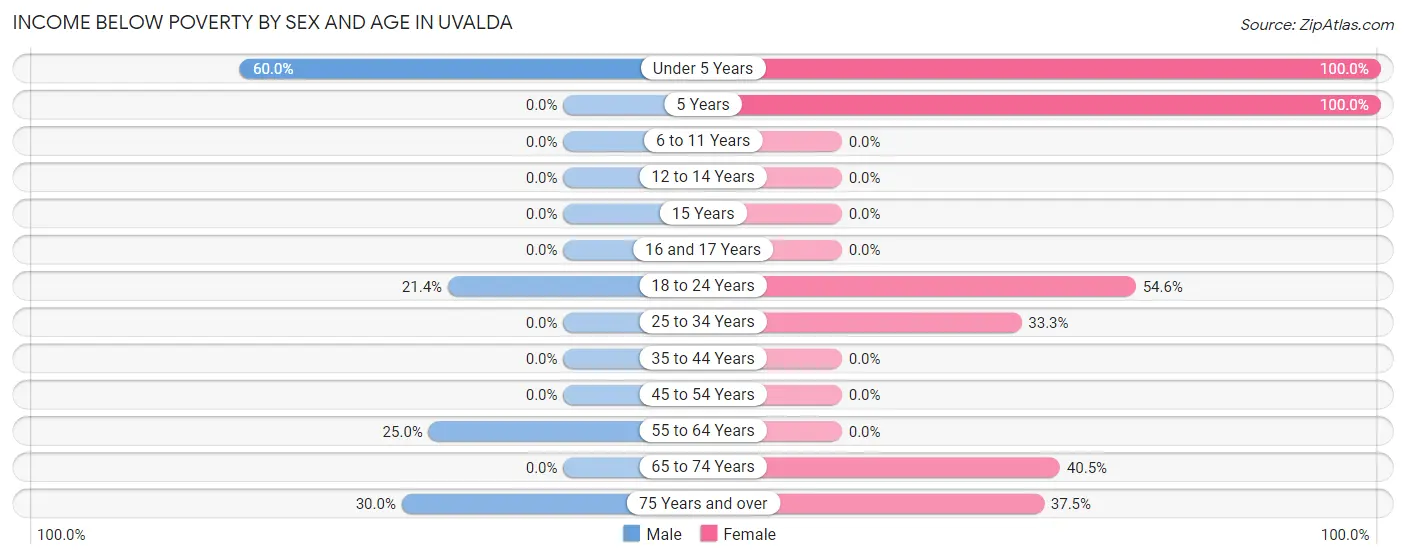
| Age Bracket | Male | Female |
| Under 5 Years | 6 (60.0%) | 13 (100.0%) |
| 5 Years | 0 (0.0%) | 8 (100.0%) |
| 6 to 11 Years | 0 (0.0%) | 0 (0.0%) |
| 12 to 14 Years | 0 (0.0%) | 0 (0.0%) |
| 15 Years | 0 (0.0%) | 0 (0.0%) |
| 16 and 17 Years | 0 (0.0%) | 0 (0.0%) |
| 18 to 24 Years | 3 (21.4%) | 6 (54.5%) |
| 25 to 34 Years | 0 (0.0%) | 14 (33.3%) |
| 35 to 44 Years | 0 (0.0%) | 0 (0.0%) |
| 45 to 54 Years | 0 (0.0%) | 0 (0.0%) |
| 55 to 64 Years | 6 (25.0%) | 0 (0.0%) |
| 65 to 74 Years | 0 (0.0%) | 17 (40.5%) |
| 75 Years and over | 3 (30.0%) | 9 (37.5%) |
| Total | 18 (11.3%) | 67 (29.4%) |
Income Above Poverty by Sex and Age in Uvalda
According to the poverty statistics in Uvalda, males aged 5 years and females aged 12 to 14 years are the age groups that are most secure financially, with 100.0% of males and 100.0% of females in these age groups living above the poverty line.
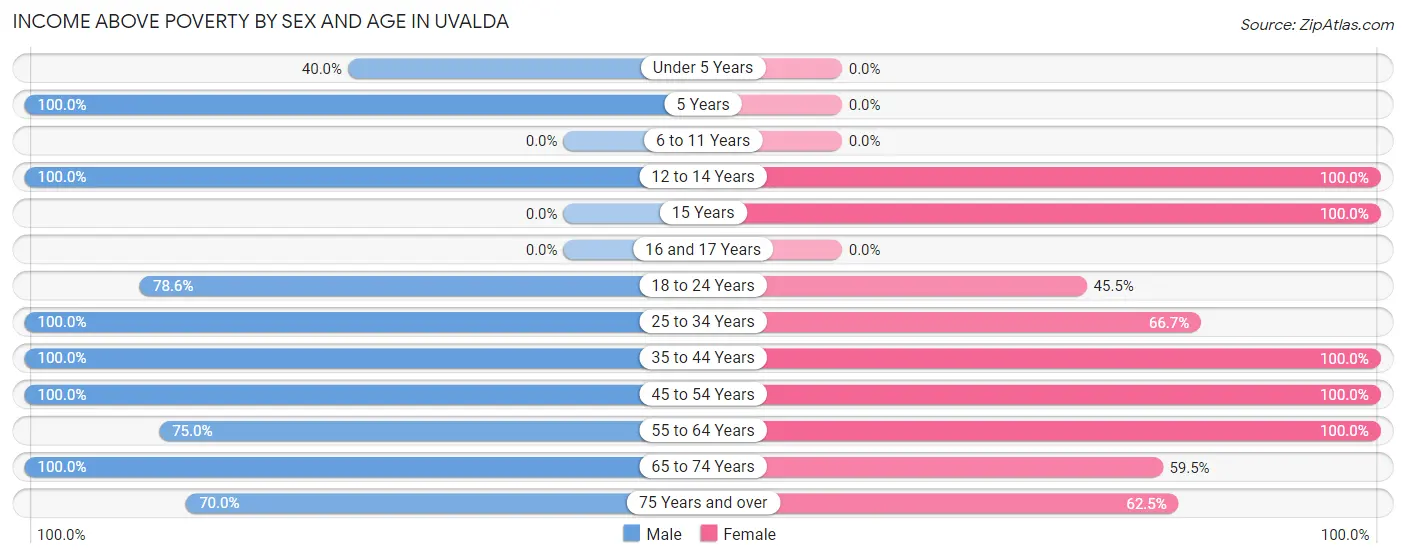
| Age Bracket | Male | Female |
| Under 5 Years | 4 (40.0%) | 0 (0.0%) |
| 5 Years | 3 (100.0%) | 0 (0.0%) |
| 6 to 11 Years | 0 (0.0%) | 0 (0.0%) |
| 12 to 14 Years | 6 (100.0%) | 9 (100.0%) |
| 15 Years | 0 (0.0%) | 4 (100.0%) |
| 16 and 17 Years | 0 (0.0%) | 0 (0.0%) |
| 18 to 24 Years | 11 (78.6%) | 5 (45.5%) |
| 25 to 34 Years | 2 (100.0%) | 28 (66.7%) |
| 35 to 44 Years | 56 (100.0%) | 33 (100.0%) |
| 45 to 54 Years | 18 (100.0%) | 27 (100.0%) |
| 55 to 64 Years | 18 (75.0%) | 15 (100.0%) |
| 65 to 74 Years | 16 (100.0%) | 25 (59.5%) |
| 75 Years and over | 7 (70.0%) | 15 (62.5%) |
| Total | 141 (88.7%) | 161 (70.6%) |
Income Below Poverty Among Married-Couple Families in Uvalda
The poverty statistics for married-couple families in Uvalda show that 2.2% or 2 of the total 89 families live below the poverty line. Families with 1 or 2 children have the highest poverty rate of 50.0%, comprising of 2 families. On the other hand, families with no children have the lowest poverty rate of 0.0%, which includes 0 families.
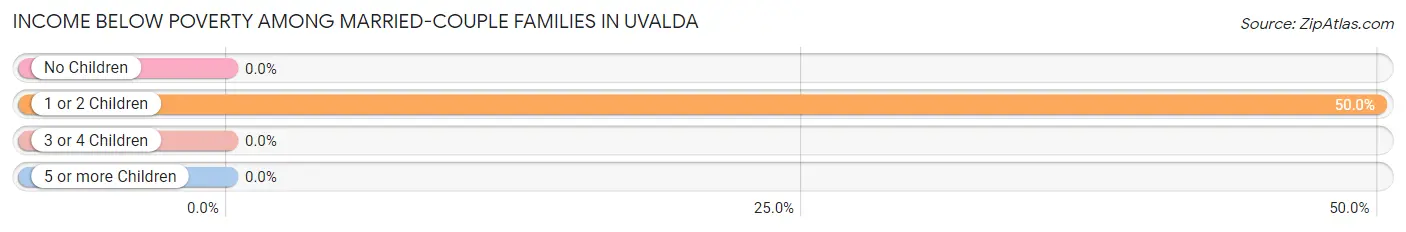
| Children | Above Poverty | Below Poverty |
| No Children | 85 (100.0%) | 0 (0.0%) |
| 1 or 2 Children | 2 (50.0%) | 2 (50.0%) |
| 3 or 4 Children | 0 (0.0%) | 0 (0.0%) |
| 5 or more Children | 0 (0.0%) | 0 (0.0%) |
| Total | 87 (97.8%) | 2 (2.2%) |
Income Below Poverty Among Single-Parent Households in Uvalda
According to the poverty data in Uvalda, 50.0% or 3 single-father households and 71.1% or 27 single-mother households are living below the poverty line. Among single-father households, those with no children have the highest poverty rate, with 3 households (100.0%) experiencing poverty. Likewise, among single-mother households, those with 1 or 2 children have the highest poverty rate, with 24 households (72.7%) falling below the poverty line.
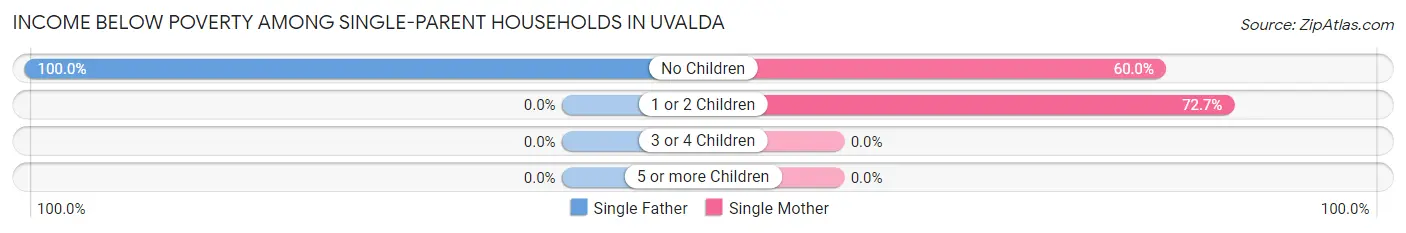
| Children | Single Father | Single Mother |
| No Children | 3 (100.0%) | 3 (60.0%) |
| 1 or 2 Children | 0 (0.0%) | 24 (72.7%) |
| 3 or 4 Children | 0 (0.0%) | 0 (0.0%) |
| 5 or more Children | 0 (0.0%) | 0 (0.0%) |
| Total | 3 (50.0%) | 27 (71.1%) |
Income Below Poverty Among Married-Couple vs Single-Parent Households in Uvalda
The poverty data for Uvalda shows that 2 of the married-couple family households (2.2%) and 30 of the single-parent households (68.2%) are living below the poverty level. Within the married-couple family households, those with 1 or 2 children have the highest poverty rate, with 2 households (50.0%) falling below the poverty line. Among the single-parent households, those with no children have the highest poverty rate, with 6 household (75.0%) living below poverty.
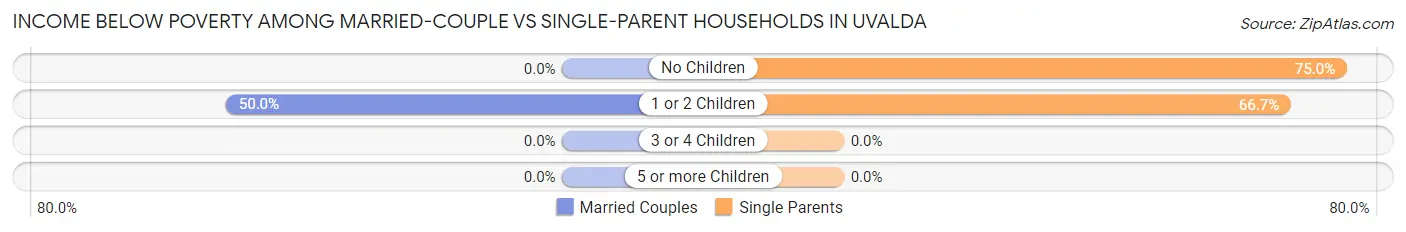
| Children | Married-Couple Families | Single-Parent Households |
| No Children | 0 (0.0%) | 6 (75.0%) |
| 1 or 2 Children | 2 (50.0%) | 24 (66.7%) |
| 3 or 4 Children | 0 (0.0%) | 0 (0.0%) |
| 5 or more Children | 0 (0.0%) | 0 (0.0%) |
| Total | 2 (2.2%) | 30 (68.2%) |
Race in Uvalda
The most populous races in Uvalda are White / Caucasian (218 | 56.3%), Black / African American (141 | 36.4%), and Hispanic or Latino (58 | 15.0%).
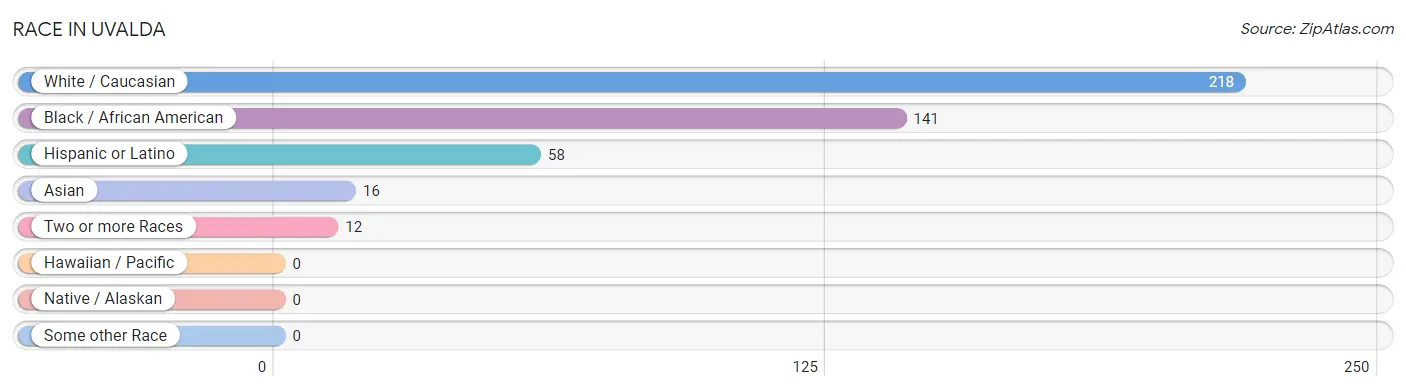
| Race | # Population | % Population |
| Asian | 16 | 4.1% |
| Black / African American | 141 | 36.4% |
| Hawaiian / Pacific | 0 | 0.0% |
| Hispanic or Latino | 58 | 15.0% |
| Native / Alaskan | 0 | 0.0% |
| White / Caucasian | 218 | 56.3% |
| Two or more Races | 12 | 3.1% |
| Some other Race | 0 | 0.0% |
| Total | 387 | 100.0% |
Ancestry in Uvalda
The most populous ancestries reported in Uvalda are American (42 | 10.8%), Irish (41 | 10.6%), Scottish (37 | 9.6%), English (24 | 6.2%), and Mexican (22 | 5.7%), together accounting for 42.9% of all Uvalda residents.
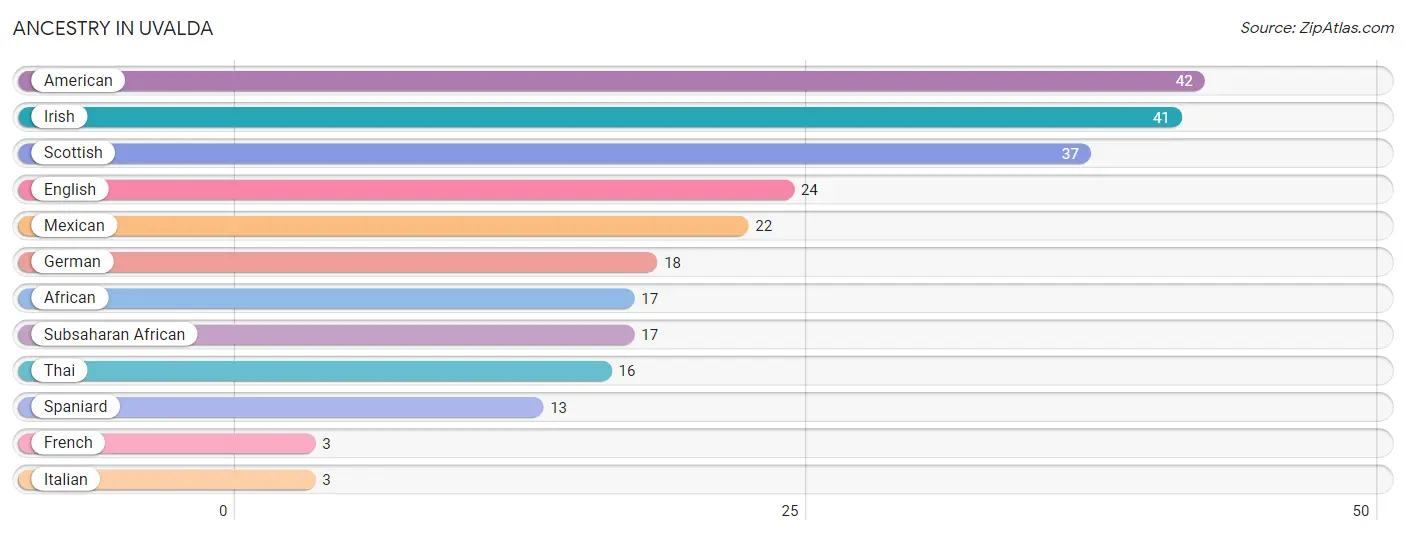
| Ancestry | # Population | % Population |
| African | 17 | 4.4% |
| American | 42 | 10.8% |
| English | 24 | 6.2% |
| French | 3 | 0.8% |
| German | 18 | 4.6% |
| Irish | 41 | 10.6% |
| Italian | 3 | 0.8% |
| Mexican | 22 | 5.7% |
| Scottish | 37 | 9.6% |
| Spaniard | 13 | 3.4% |
| Subsaharan African | 17 | 4.4% |
| Thai | 16 | 4.1% | View All 12 Rows |
Immigrants in Uvalda
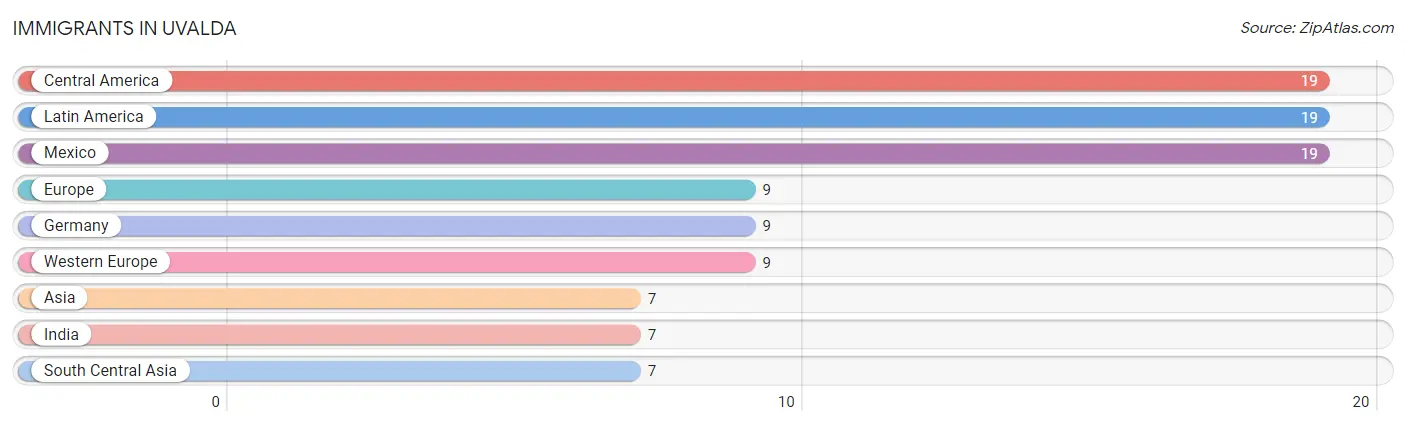
The most numerous immigrant groups reported in Uvalda came from Central America (19 | 4.9%), Latin America (19 | 4.9%), Mexico (19 | 4.9%), Europe (9 | 2.3%), and Germany (9 | 2.3%), together accounting for 19.4% of all Uvalda residents.
| Immigration Origin | # Population | % Population |
| Asia | 7 | 1.8% |
| Central America | 19 | 4.9% |
| Europe | 9 | 2.3% |
| Germany | 9 | 2.3% |
| India | 7 | 1.8% |
| Latin America | 19 | 4.9% |
| Mexico | 19 | 4.9% |
| South Central Asia | 7 | 1.8% |
| Western Europe | 9 | 2.3% | View All 9 Rows |
Sex and Age in Uvalda
Sex and Age in Uvalda
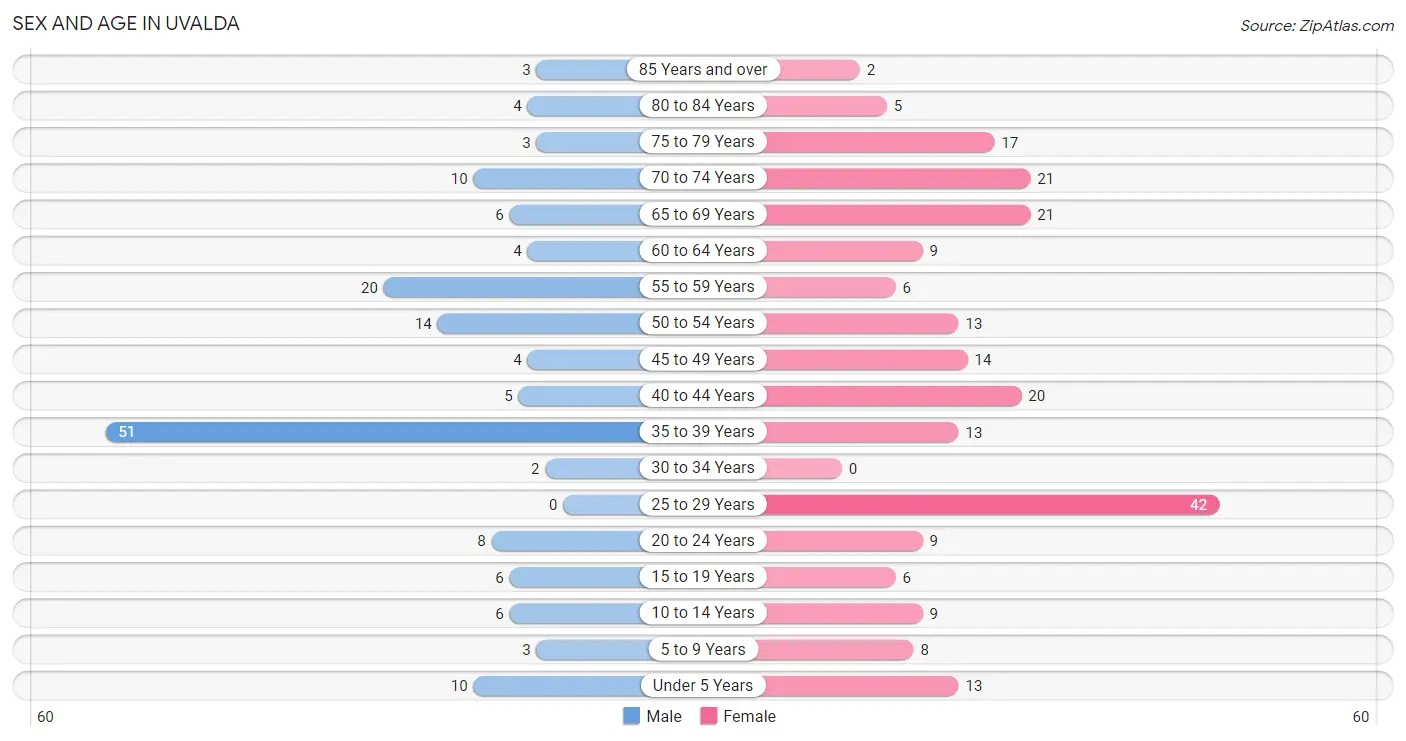
The most populous age groups in Uvalda are 35 to 39 Years (51 | 32.1%) for men and 25 to 29 Years (42 | 18.4%) for women.
| Age Bracket | Male | Female |
| Under 5 Years | 10 (6.3%) | 13 (5.7%) |
| 5 to 9 Years | 3 (1.9%) | 8 (3.5%) |
| 10 to 14 Years | 6 (3.8%) | 9 (4.0%) |
| 15 to 19 Years | 6 (3.8%) | 6 (2.6%) |
| 20 to 24 Years | 8 (5.0%) | 9 (4.0%) |
| 25 to 29 Years | 0 (0.0%) | 42 (18.4%) |
| 30 to 34 Years | 2 (1.3%) | 0 (0.0%) |
| 35 to 39 Years | 51 (32.1%) | 13 (5.7%) |
| 40 to 44 Years | 5 (3.1%) | 20 (8.8%) |
| 45 to 49 Years | 4 (2.5%) | 14 (6.1%) |
| 50 to 54 Years | 14 (8.8%) | 13 (5.7%) |
| 55 to 59 Years | 20 (12.6%) | 6 (2.6%) |
| 60 to 64 Years | 4 (2.5%) | 9 (4.0%) |
| 65 to 69 Years | 6 (3.8%) | 21 (9.2%) |
| 70 to 74 Years | 10 (6.3%) | 21 (9.2%) |
| 75 to 79 Years | 3 (1.9%) | 17 (7.5%) |
| 80 to 84 Years | 4 (2.5%) | 5 (2.2%) |
| 85 Years and over | 3 (1.9%) | 2 (0.9%) |
| Total | 159 (100.0%) | 228 (100.0%) |
Families and Households in Uvalda
Median Family Size in Uvalda
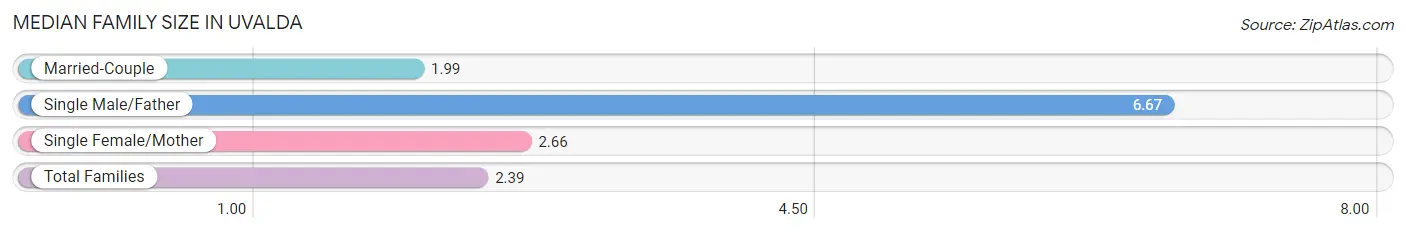
The median family size in Uvalda is 2.39 persons per family, with single male/father families (6 | 4.5%) accounting for the largest median family size of 6.67 persons per family. On the other hand, married-couple families (89 | 66.9%) represent the smallest median family size with 1.99 persons per family.
| Family Type | # Families | Family Size |
| Married-Couple | 89 (66.9%) | 1.99 |
| Single Male/Father | 6 (4.5%) | 6.67 |
| Single Female/Mother | 38 (28.6%) | 2.66 |
| Total Families | 133 (100.0%) | 2.39 |
Median Household Size in Uvalda
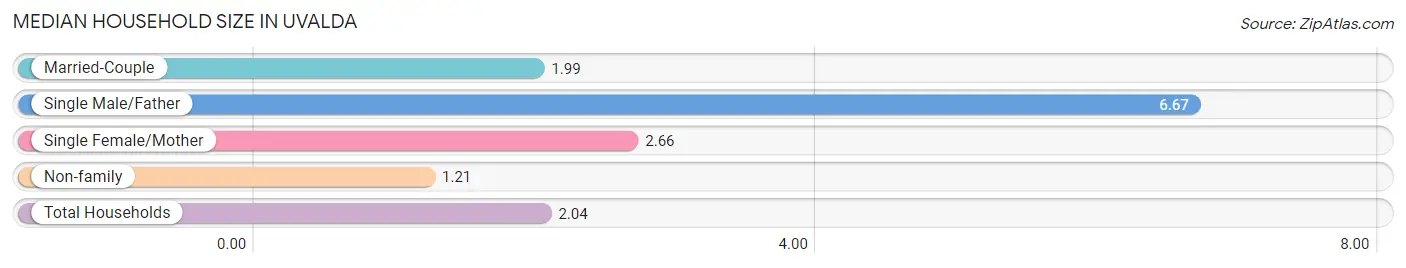
The median household size in Uvalda is 2.04 persons per household, with single male/father households (6 | 3.2%) accounting for the largest median household size of 6.67 persons per household. non-family households (57 | 30.0%) represent the smallest median household size with 1.21 persons per household.
| Household Type | # Households | Household Size |
| Married-Couple | 89 (46.8%) | 1.99 |
| Single Male/Father | 6 (3.2%) | 6.67 |
| Single Female/Mother | 38 (20.0%) | 2.66 |
| Non-family | 57 (30.0%) | 1.21 |
| Total Households | 190 (100.0%) | 2.04 |
Household Size by Marriage Status in Uvalda
Out of a total of 190 households in Uvalda, 133 (70.0%) are family households, while 57 (30.0%) are nonfamily households. The most numerous type of family households are 2-person households, comprising 83, and the most common type of nonfamily households are 1-person households, comprising 43.
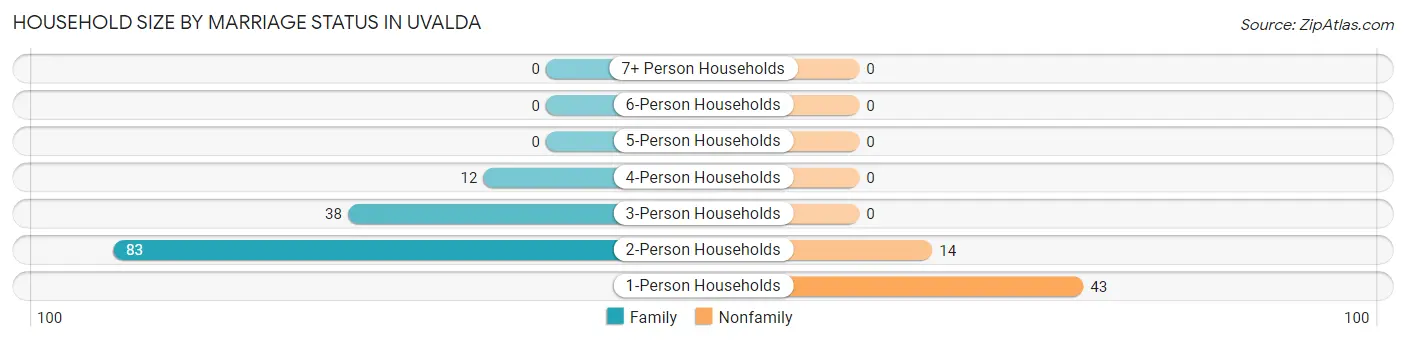
| Household Size | Family Households | Nonfamily Households |
| 1-Person Households | - | 43 (22.6%) |
| 2-Person Households | 83 (43.7%) | 14 (7.4%) |
| 3-Person Households | 38 (20.0%) | 0 (0.0%) |
| 4-Person Households | 12 (6.3%) | 0 (0.0%) |
| 5-Person Households | 0 (0.0%) | 0 (0.0%) |
| 6-Person Households | 0 (0.0%) | 0 (0.0%) |
| 7+ Person Households | 0 (0.0%) | 0 (0.0%) |
| Total | 133 (70.0%) | 57 (30.0%) |
Female Fertility in Uvalda
Fertility by Age in Uvalda
Average fertility rate in Uvalda is 19.0 births per 1,000 women. Women in the age bracket of 20 to 34 years have the highest fertility rate with 39.0 births per 1,000 women. Women in the age bracket of 20 to 34 years acount for 100.0% of all women with births.
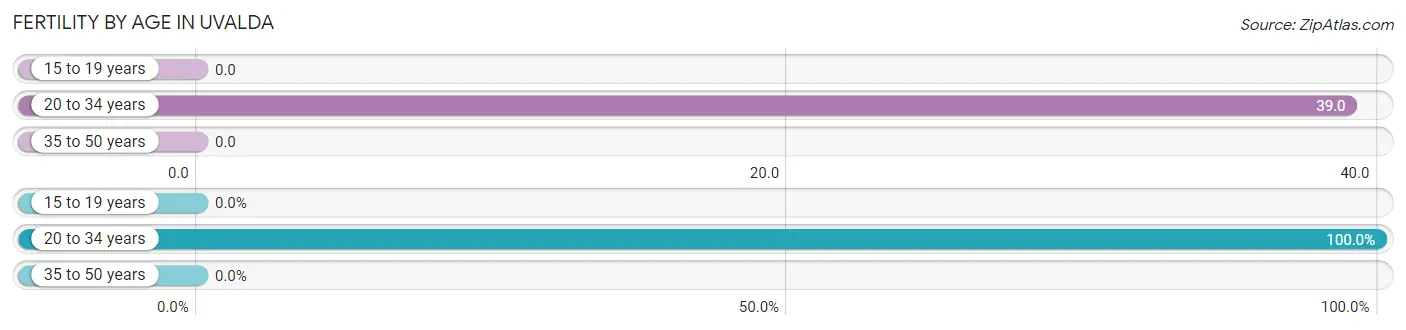
| Age Bracket | Women with Births | Births / 1,000 Women |
| 15 to 19 years | 0 (0.0%) | 0.0 |
| 20 to 34 years | 2 (100.0%) | 39.0 |
| 35 to 50 years | 0 (0.0%) | 0.0 |
| Total | 2 (100.0%) | 19.0 |
Fertility by Age by Marriage Status in Uvalda
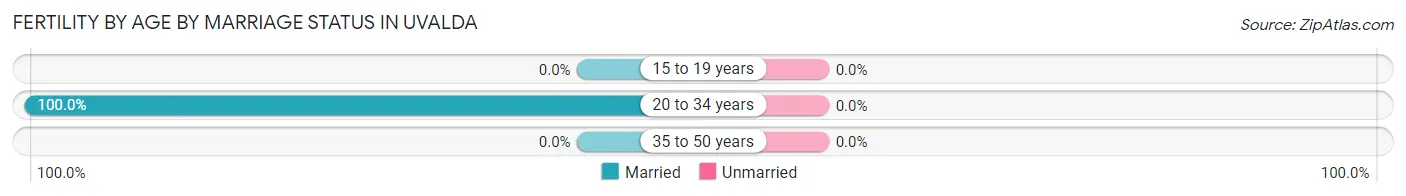
| Age Bracket | Married | Unmarried |
| 15 to 19 years | 0 (0.0%) | 0 (0.0%) |
| 20 to 34 years | 2 (100.0%) | 0 (0.0%) |
| 35 to 50 years | 0 (0.0%) | 0 (0.0%) |
| Total | 2 (100.0%) | 0 (0.0%) |
Fertility by Education in Uvalda
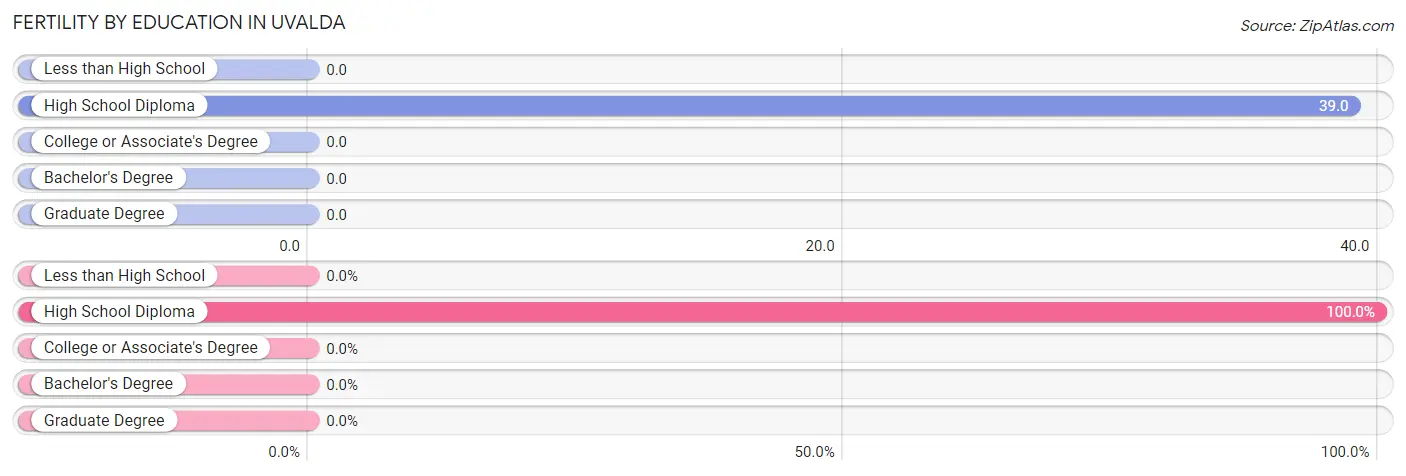
| Educational Attainment | Women with Births | Births / 1,000 Women |
| Less than High School | 0 (0.0%) | 0.0 |
| High School Diploma | 2 (100.0%) | 39.0 |
| College or Associate's Degree | 0 (0.0%) | 0.0 |
| Bachelor's Degree | 0 (0.0%) | 0.0 |
| Graduate Degree | 0 (0.0%) | 0.0 |
| Total | 2 (100.0%) | 19.0 |
Fertility by Education by Marriage Status in Uvalda
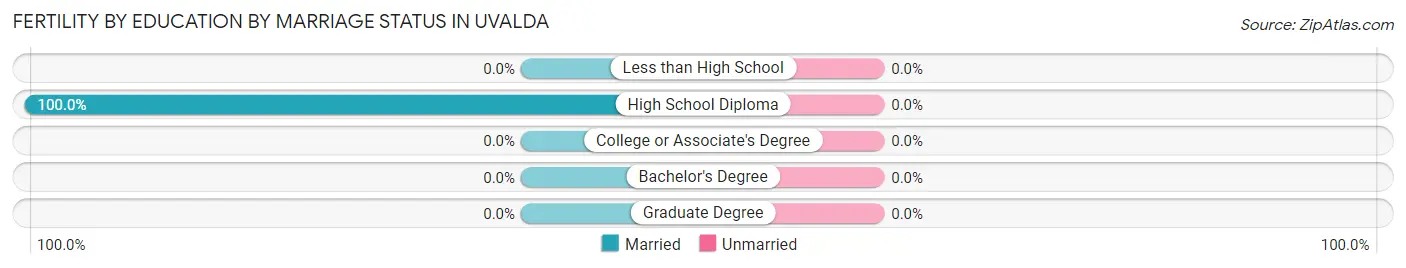
| Educational Attainment | Married | Unmarried |
| Less than High School | 0 (0.0%) | 0 (0.0%) |
| High School Diploma | 2 (100.0%) | 0 (0.0%) |
| College or Associate's Degree | 0 (0.0%) | 0 (0.0%) |
| Bachelor's Degree | 0 (0.0%) | 0 (0.0%) |
| Graduate Degree | 0 (0.0%) | 0 (0.0%) |
| Total | 2 (100.0%) | 0 (0.0%) |
Employment Characteristics in Uvalda
Employment by Class of Employer in Uvalda
Among the 176 employed individuals in Uvalda, private company employees (121 | 68.8%), self-employed (incorporated) (32 | 18.2%), and self-employed (not incorporated) (12 | 6.8%) make up the most common classes of employment.
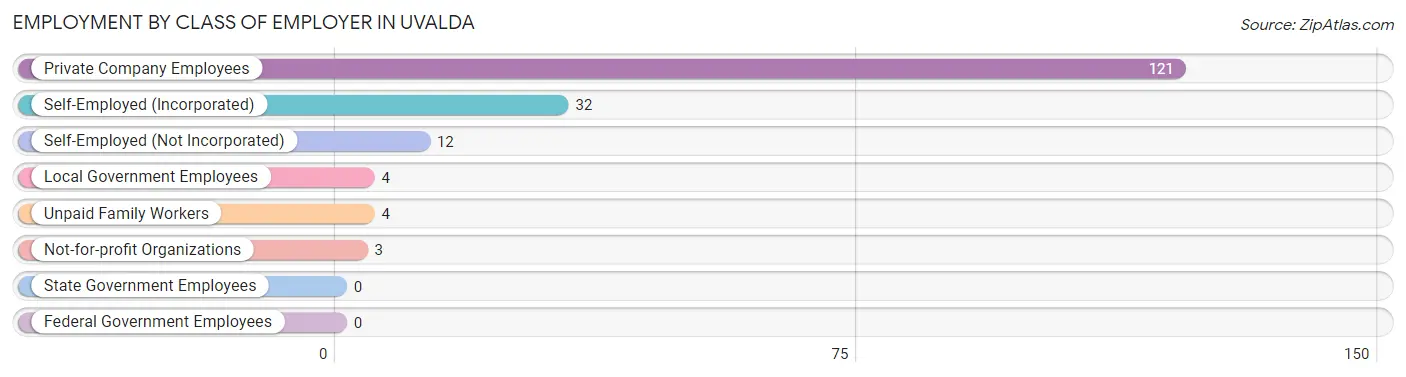
| Employer Class | # Employees | % Employees |
| Private Company Employees | 121 | 68.8% |
| Self-Employed (Incorporated) | 32 | 18.2% |
| Self-Employed (Not Incorporated) | 12 | 6.8% |
| Not-for-profit Organizations | 3 | 1.7% |
| Local Government Employees | 4 | 2.3% |
| State Government Employees | 0 | 0.0% |
| Federal Government Employees | 0 | 0.0% |
| Unpaid Family Workers | 4 | 2.3% |
| Total | 176 | 100.0% |
Employment Status by Age in Uvalda
According to the labor force statistics for Uvalda, out of the total population over 16 years of age (334), 58.7% or 196 individuals are in the labor force, with 8.2% or 16 of them unemployed. The age group with the highest labor force participation rate is 16 to 19 years, with 100.0% or 8 individuals in the labor force. Within the labor force, the 55 to 59 years age range has the highest percentage of unemployed individuals, with 83.3% or 5 of them being unemployed.
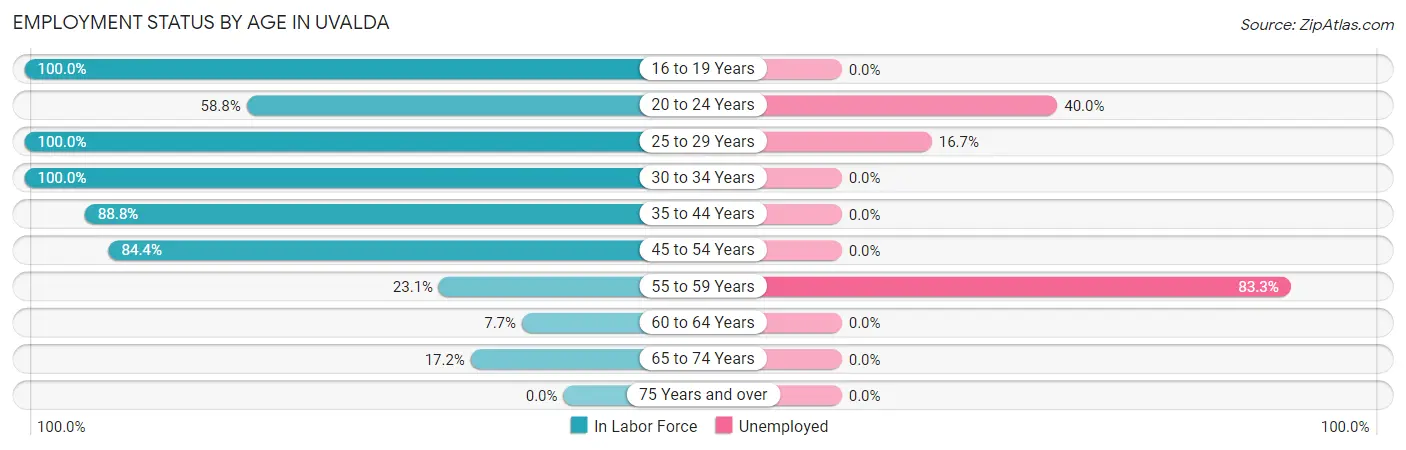
| Age Bracket | In Labor Force | Unemployed |
| 16 to 19 Years | 8 (100.0%) | 0 (0.0%) |
| 20 to 24 Years | 10 (58.8%) | 4 (40.0%) |
| 25 to 29 Years | 42 (100.0%) | 7 (16.7%) |
| 30 to 34 Years | 2 (100.0%) | 0 (0.0%) |
| 35 to 44 Years | 79 (88.8%) | 0 (0.0%) |
| 45 to 54 Years | 38 (84.4%) | 0 (0.0%) |
| 55 to 59 Years | 6 (23.1%) | 5 (83.3%) |
| 60 to 64 Years | 1 (7.7%) | 0 (0.0%) |
| 65 to 74 Years | 10 (17.2%) | 0 (0.0%) |
| 75 Years and over | 0 (0.0%) | 0 (0.0%) |
| Total | 196 (58.7%) | 16 (8.2%) |
Employment Status by Educational Attainment in Uvalda
According to labor force statistics for Uvalda, 77.4% of individuals (168) out of the total population between 25 and 64 years of age (217) are in the labor force, with 7.1% or 12 of them being unemployed. The group with the highest labor force participation rate are those with the educational attainment of high school diploma, with 87.7% or 71 individuals in the labor force. Within the labor force, individuals with less than high school education have the highest percentage of unemployment, with 71.4% or 5 of them being unemployed.
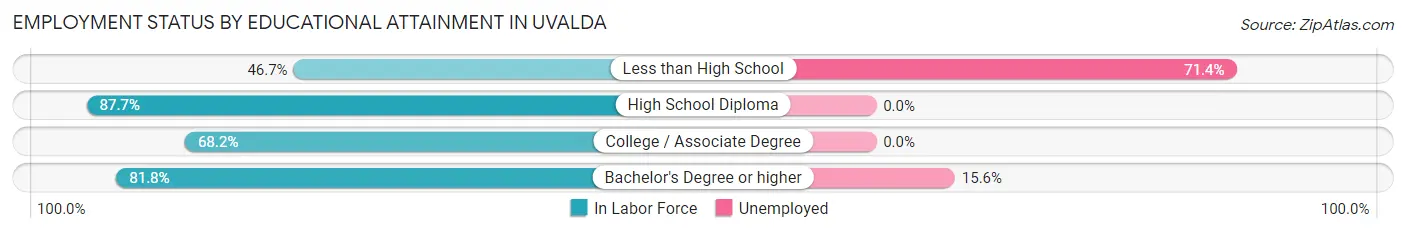
| Educational Attainment | In Labor Force | Unemployed |
| Less than High School | 7 (46.7%) | 11 (71.4%) |
| High School Diploma | 71 (87.7%) | 0 (0.0%) |
| College / Associate Degree | 45 (68.2%) | 0 (0.0%) |
| Bachelor's Degree or higher | 45 (81.8%) | 9 (15.6%) |
| Total | 168 (77.4%) | 15 (7.1%) |
Employment Occupations by Sex in Uvalda
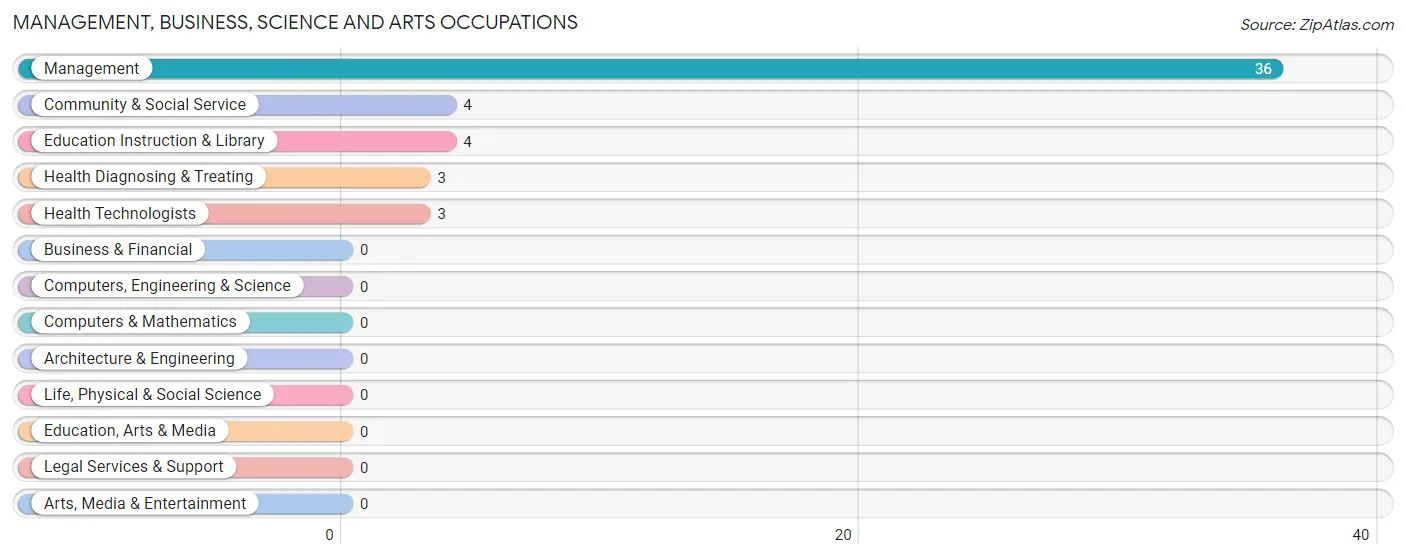
Management, Business, Science and Arts Occupations
The most common Management, Business, Science and Arts occupations in Uvalda are Management (36 | 20.0%), Community & Social Service (4 | 2.2%), Education Instruction & Library (4 | 2.2%), Health Diagnosing & Treating (3 | 1.7%), and Health Technologists (3 | 1.7%).
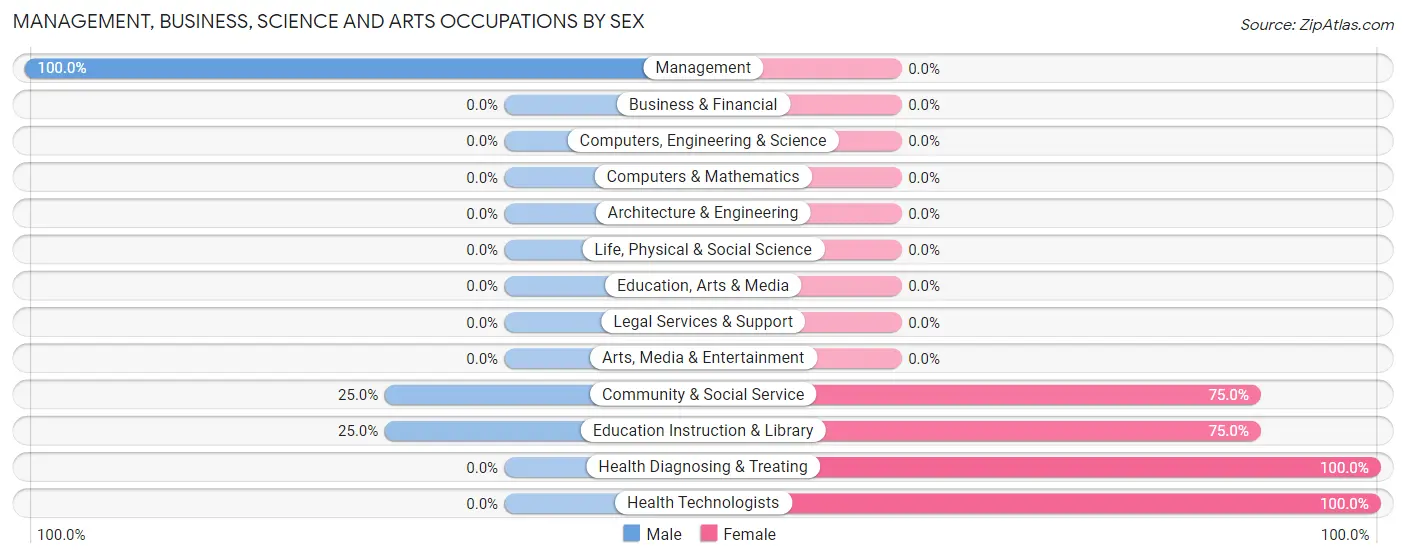
Management, Business, Science and Arts Occupations by Sex
Within the Management, Business, Science and Arts occupations in Uvalda, the most male-oriented occupations are Management (100.0%), Community & Social Service (25.0%), and Education Instruction & Library (25.0%), while the most female-oriented occupations are Health Diagnosing & Treating (100.0%), Health Technologists (100.0%), and Community & Social Service (75.0%).
| Occupation | Male | Female |
| Management | 36 (100.0%) | 0 (0.0%) |
| Business & Financial | 0 (0.0%) | 0 (0.0%) |
| Computers, Engineering & Science | 0 (0.0%) | 0 (0.0%) |
| Computers & Mathematics | 0 (0.0%) | 0 (0.0%) |
| Architecture & Engineering | 0 (0.0%) | 0 (0.0%) |
| Life, Physical & Social Science | 0 (0.0%) | 0 (0.0%) |
| Community & Social Service | 1 (25.0%) | 3 (75.0%) |
| Education, Arts & Media | 0 (0.0%) | 0 (0.0%) |
| Legal Services & Support | 0 (0.0%) | 0 (0.0%) |
| Education Instruction & Library | 1 (25.0%) | 3 (75.0%) |
| Arts, Media & Entertainment | 0 (0.0%) | 0 (0.0%) |
| Health Diagnosing & Treating | 0 (0.0%) | 3 (100.0%) |
| Health Technologists | 0 (0.0%) | 3 (100.0%) |
| Total (Category) | 37 (86.1%) | 6 (14.0%) |
| Total (Overall) | 95 (52.8%) | 85 (47.2%) |
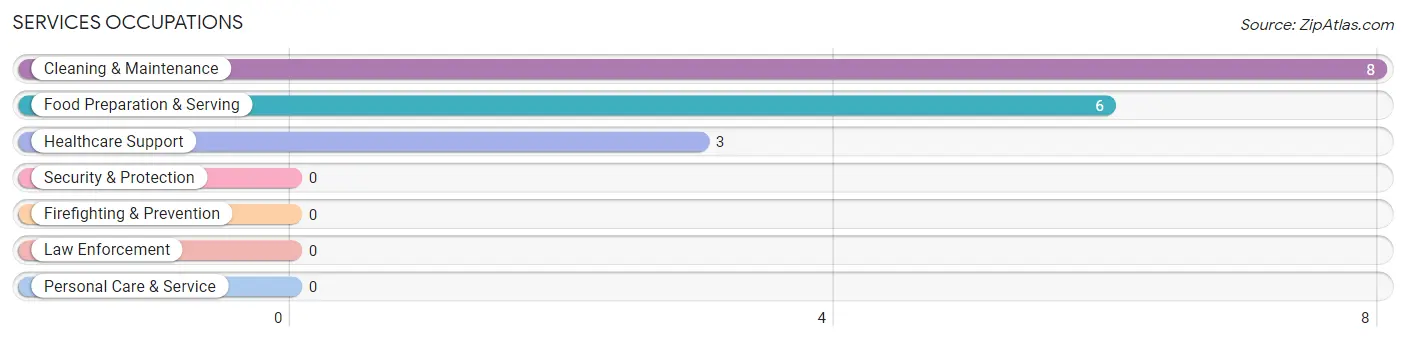
Services Occupations
The most common Services occupations in Uvalda are Cleaning & Maintenance (8 | 4.4%), Food Preparation & Serving (6 | 3.3%), and Healthcare Support (3 | 1.7%).
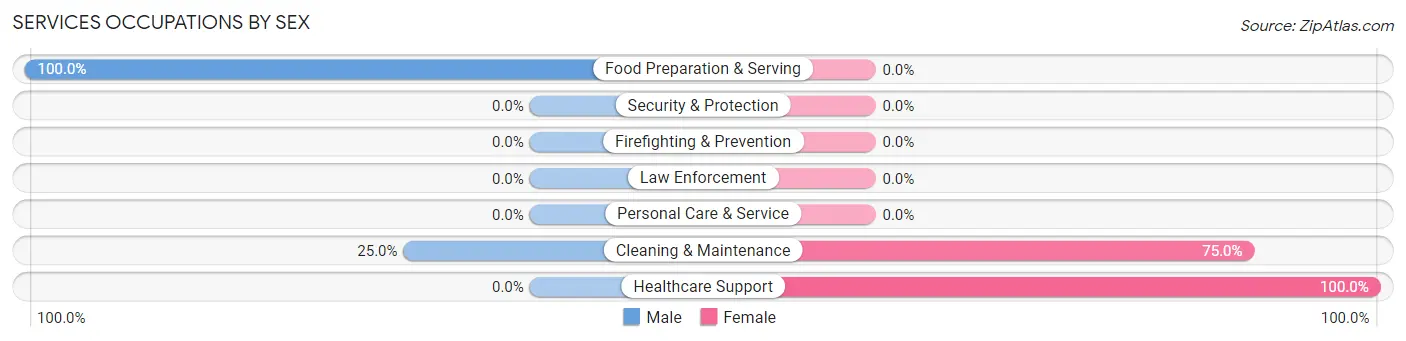
Services Occupations by Sex
Within the Services occupations in Uvalda, the most male-oriented occupations are Food Preparation & Serving (100.0%), and Cleaning & Maintenance (25.0%), while the most female-oriented occupations are Healthcare Support (100.0%), and Cleaning & Maintenance (75.0%).
| Occupation | Male | Female |
| Healthcare Support | 0 (0.0%) | 3 (100.0%) |
| Security & Protection | 0 (0.0%) | 0 (0.0%) |
| Firefighting & Prevention | 0 (0.0%) | 0 (0.0%) |
| Law Enforcement | 0 (0.0%) | 0 (0.0%) |
| Food Preparation & Serving | 6 (100.0%) | 0 (0.0%) |
| Cleaning & Maintenance | 2 (25.0%) | 6 (75.0%) |
| Personal Care & Service | 0 (0.0%) | 0 (0.0%) |
| Total (Category) | 8 (47.1%) | 9 (52.9%) |
| Total (Overall) | 95 (52.8%) | 85 (47.2%) |
Sales and Office Occupations
The most common Sales and Office occupations in Uvalda are Office & Administration (19 | 10.6%), and Sales & Related (15 | 8.3%).
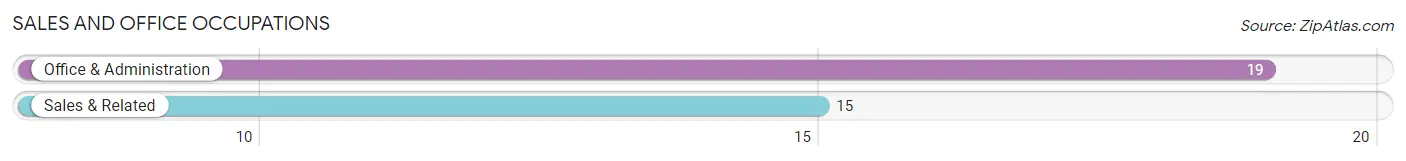
Sales and Office Occupations by Sex
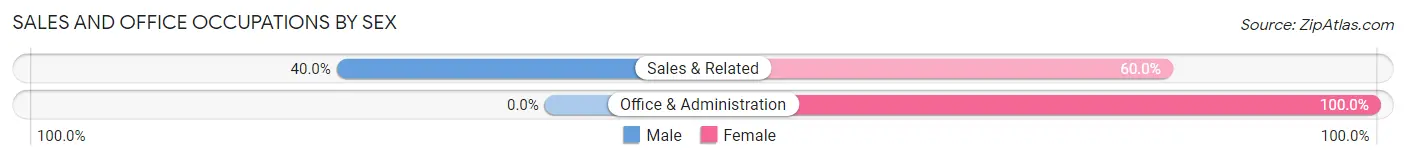
| Occupation | Male | Female |
| Sales & Related | 6 (40.0%) | 9 (60.0%) |
| Office & Administration | 0 (0.0%) | 19 (100.0%) |
| Total (Category) | 6 (17.6%) | 28 (82.4%) |
| Total (Overall) | 95 (52.8%) | 85 (47.2%) |
Natural Resources, Construction and Maintenance Occupations
The most common Natural Resources, Construction and Maintenance occupations in Uvalda are , and Construction & Extraction (20 | 11.1%).

Natural Resources, Construction and Maintenance Occupations by Sex
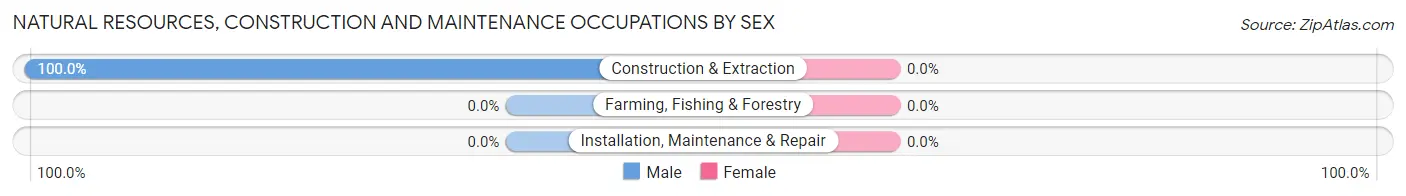
| Occupation | Male | Female |
| Farming, Fishing & Forestry | 0 (0.0%) | 0 (0.0%) |
| Construction & Extraction | 20 (100.0%) | 0 (0.0%) |
| Installation, Maintenance & Repair | 0 (0.0%) | 0 (0.0%) |
| Total (Category) | 20 (100.0%) | 0 (0.0%) |
| Total (Overall) | 95 (52.8%) | 85 (47.2%) |
Production, Transportation and Moving Occupations
The most common Production, Transportation and Moving occupations in Uvalda are Production (53 | 29.4%), Transportation (7 | 3.9%), and Material Moving (6 | 3.3%).
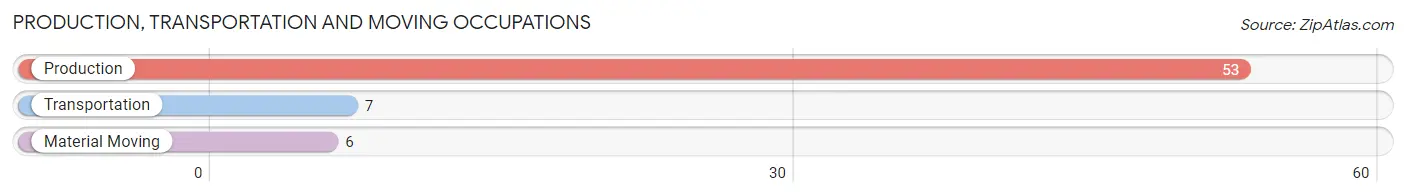
Production, Transportation and Moving Occupations by Sex
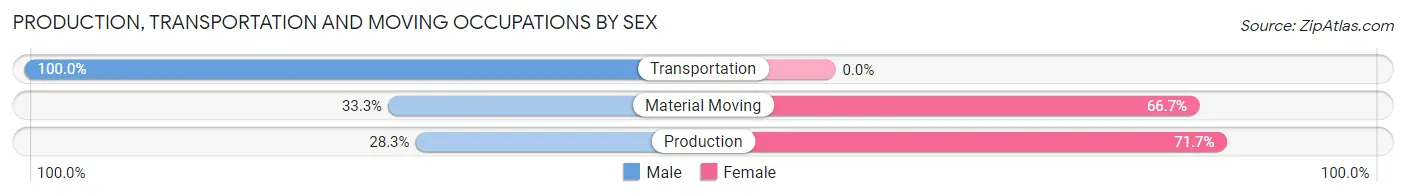
| Occupation | Male | Female |
| Production | 15 (28.3%) | 38 (71.7%) |
| Transportation | 7 (100.0%) | 0 (0.0%) |
| Material Moving | 2 (33.3%) | 4 (66.7%) |
| Total (Category) | 24 (36.4%) | 42 (63.6%) |
| Total (Overall) | 95 (52.8%) | 85 (47.2%) |
Employment Industries by Sex in Uvalda
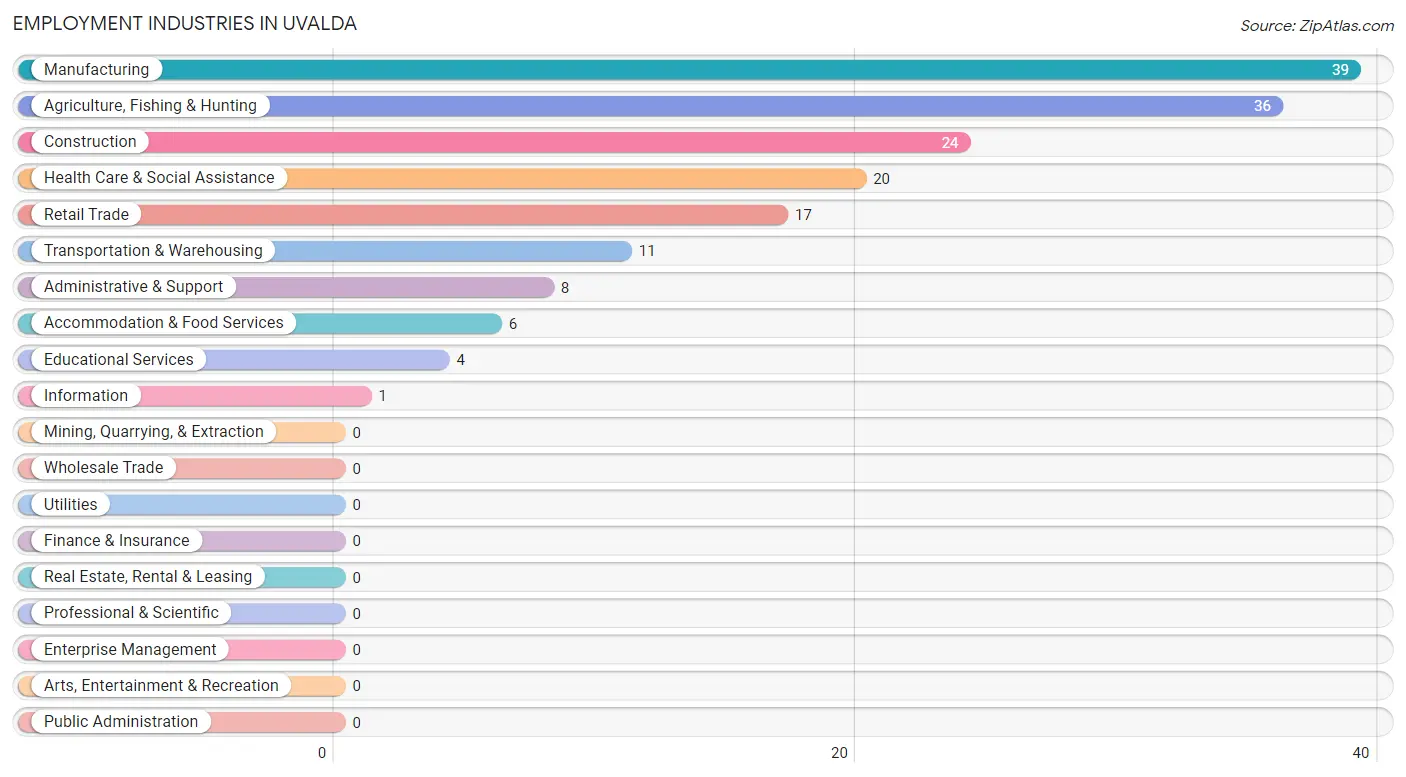
Employment Industries in Uvalda
The major employment industries in Uvalda include Manufacturing (39 | 21.7%), Agriculture, Fishing & Hunting (36 | 20.0%), Construction (24 | 13.3%), Health Care & Social Assistance (20 | 11.1%), and Retail Trade (17 | 9.4%).
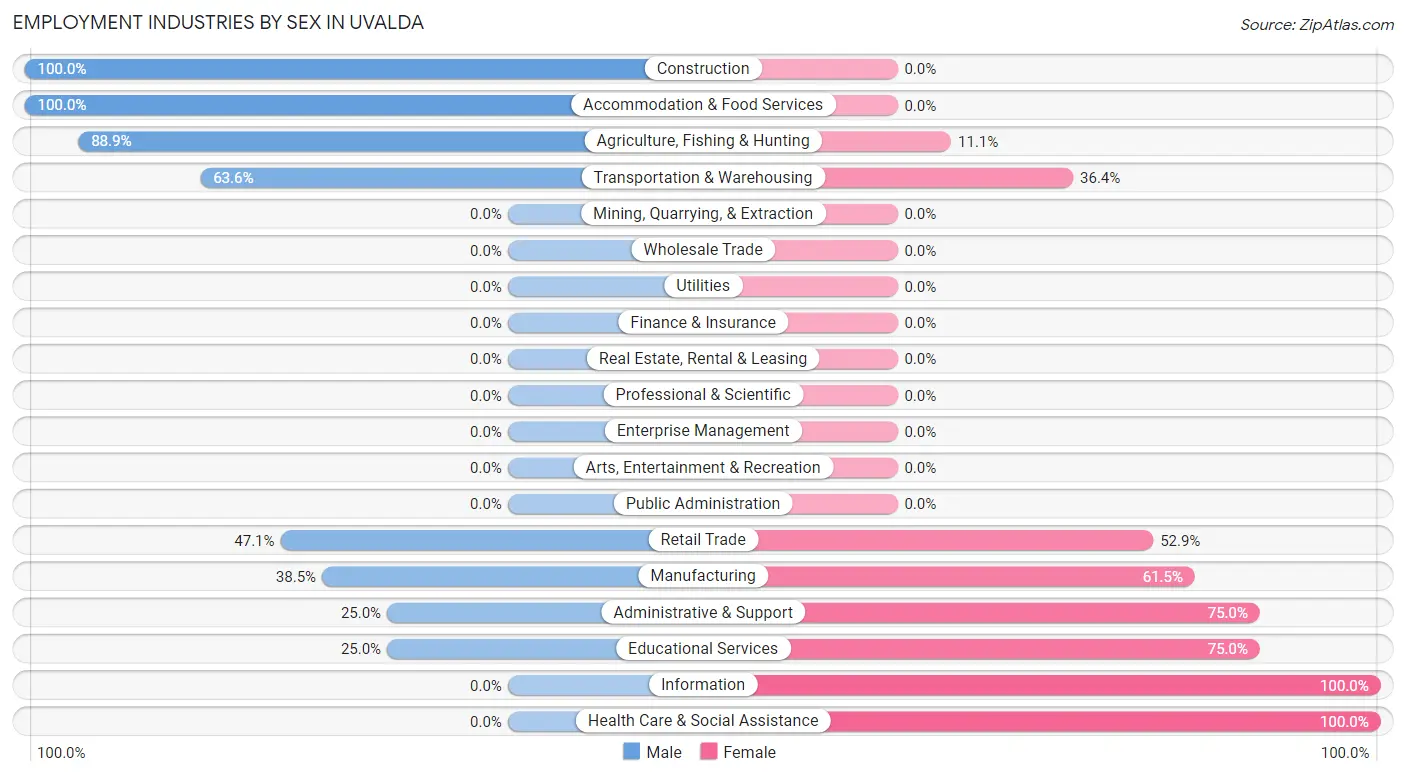
Employment Industries by Sex in Uvalda
The Uvalda industries that see more men than women are Construction (100.0%), Accommodation & Food Services (100.0%), and Agriculture, Fishing & Hunting (88.9%), whereas the industries that tend to have a higher number of women are Information (100.0%), Health Care & Social Assistance (100.0%), and Administrative & Support (75.0%).
| Industry | Male | Female |
| Agriculture, Fishing & Hunting | 32 (88.9%) | 4 (11.1%) |
| Mining, Quarrying, & Extraction | 0 (0.0%) | 0 (0.0%) |
| Construction | 24 (100.0%) | 0 (0.0%) |
| Manufacturing | 15 (38.5%) | 24 (61.5%) |
| Wholesale Trade | 0 (0.0%) | 0 (0.0%) |
| Retail Trade | 8 (47.1%) | 9 (52.9%) |
| Transportation & Warehousing | 7 (63.6%) | 4 (36.4%) |
| Utilities | 0 (0.0%) | 0 (0.0%) |
| Information | 0 (0.0%) | 1 (100.0%) |
| Finance & Insurance | 0 (0.0%) | 0 (0.0%) |
| Real Estate, Rental & Leasing | 0 (0.0%) | 0 (0.0%) |
| Professional & Scientific | 0 (0.0%) | 0 (0.0%) |
| Enterprise Management | 0 (0.0%) | 0 (0.0%) |
| Administrative & Support | 2 (25.0%) | 6 (75.0%) |
| Educational Services | 1 (25.0%) | 3 (75.0%) |
| Health Care & Social Assistance | 0 (0.0%) | 20 (100.0%) |
| Arts, Entertainment & Recreation | 0 (0.0%) | 0 (0.0%) |
| Accommodation & Food Services | 6 (100.0%) | 0 (0.0%) |
| Public Administration | 0 (0.0%) | 0 (0.0%) |
| Total | 95 (52.8%) | 85 (47.2%) |
Education in Uvalda
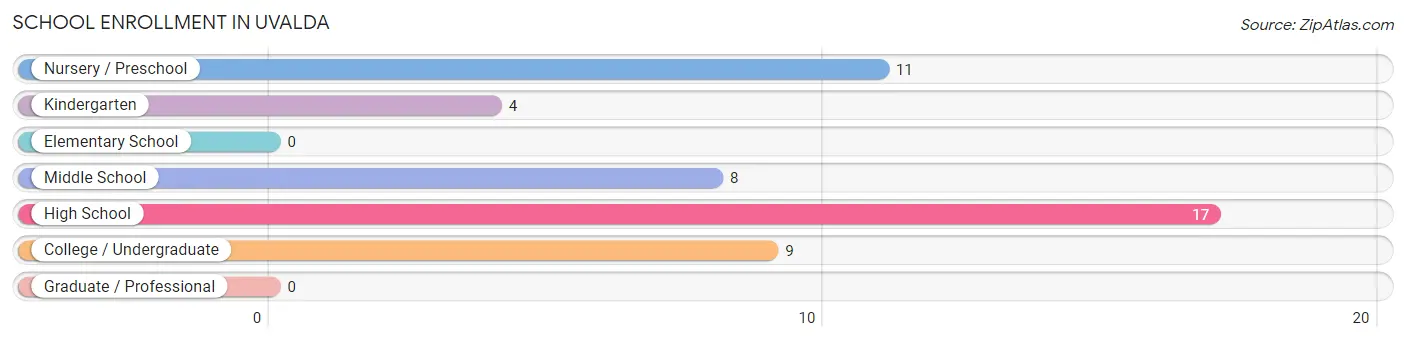
School Enrollment in Uvalda
The most common levels of schooling among the 49 students in Uvalda are high school (17 | 34.7%), nursery / preschool (11 | 22.5%), and college / undergraduate (9 | 18.4%).
| School Level | # Students | % Students |
| Nursery / Preschool | 11 | 22.5% |
| Kindergarten | 4 | 8.2% |
| Elementary School | 0 | 0.0% |
| Middle School | 8 | 16.3% |
| High School | 17 | 34.7% |
| College / Undergraduate | 9 | 18.4% |
| Graduate / Professional | 0 | 0.0% |
| Total | 49 | 100.0% |
School Enrollment by Age by Funding Source in Uvalda
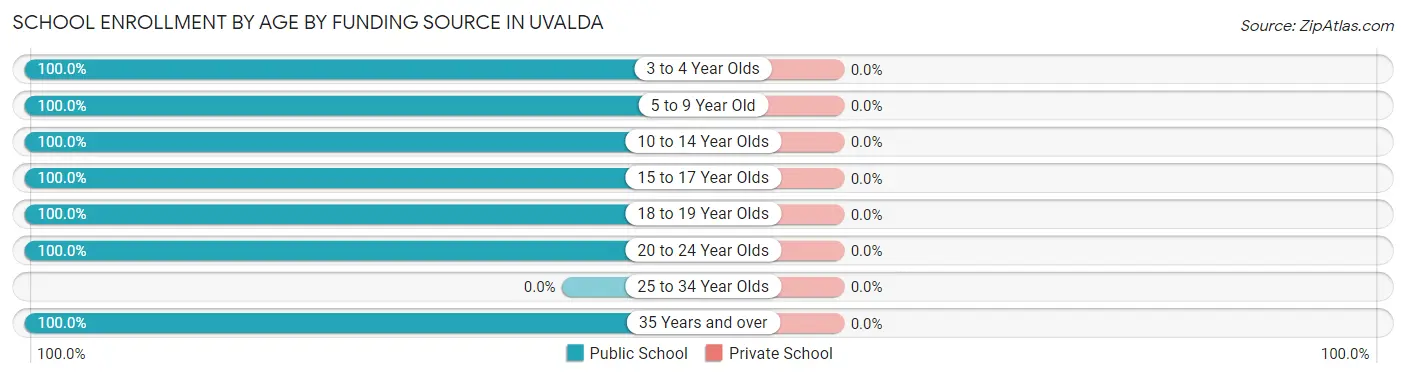
| Age Bracket | Public School | Private School |
| 3 to 4 Year Olds | 4 (100.0%) | 0 (0.0%) |
| 5 to 9 Year Old | 11 (100.0%) | 0 (0.0%) |
| 10 to 14 Year Olds | 15 (100.0%) | 0 (0.0%) |
| 15 to 17 Year Olds | 4 (100.0%) | 0 (0.0%) |
| 18 to 19 Year Olds | 6 (100.0%) | 0 (0.0%) |
| 20 to 24 Year Olds | 3 (100.0%) | 0 (0.0%) |
| 25 to 34 Year Olds | 0 (0.0%) | 0 (0.0%) |
| 35 Years and over | 6 (100.0%) | 0 (0.0%) |
| Total | 49 (100.0%) | 0 (0.0%) |
Educational Attainment by Field of Study in Uvalda
Business (32 | 43.2%), science & technology (19 | 25.7%), communications (7 | 9.5%), arts & humanities (6 | 8.1%), and engineering (4 | 5.4%) are the most common fields of study among 74 individuals in Uvalda who have obtained a bachelor's degree or higher.
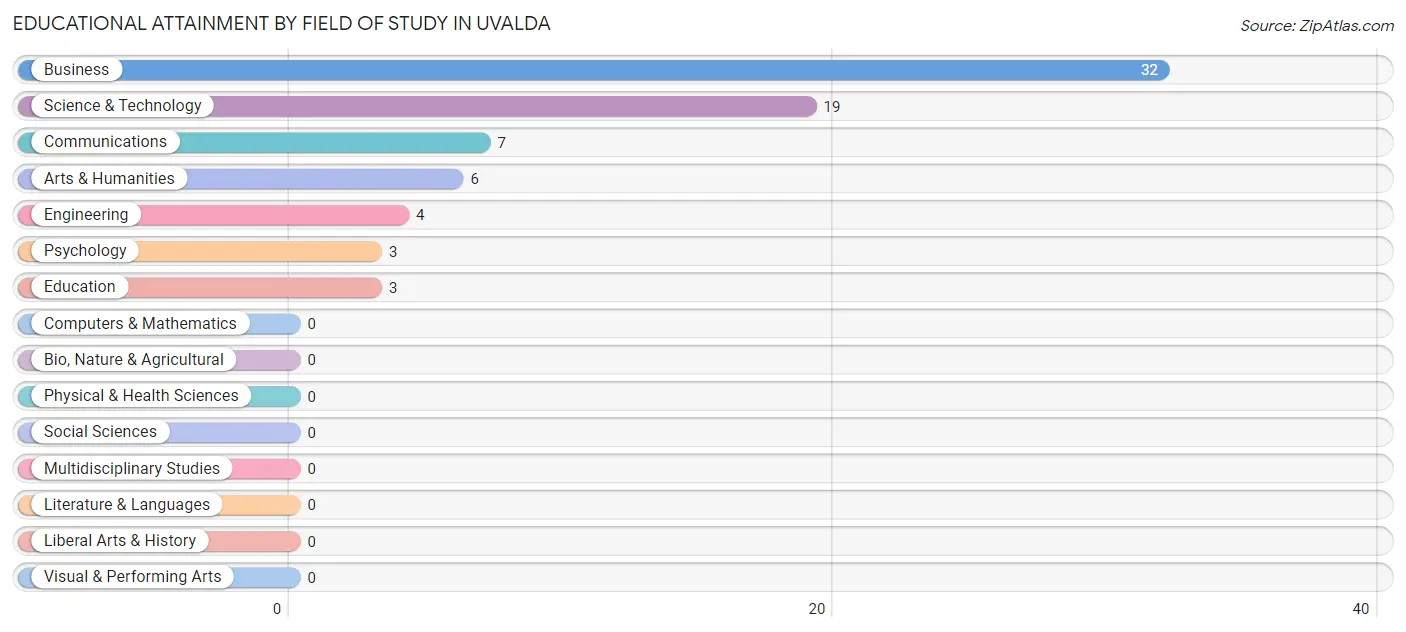
| Field of Study | # Graduates | % Graduates |
| Computers & Mathematics | 0 | 0.0% |
| Bio, Nature & Agricultural | 0 | 0.0% |
| Physical & Health Sciences | 0 | 0.0% |
| Psychology | 3 | 4.1% |
| Social Sciences | 0 | 0.0% |
| Engineering | 4 | 5.4% |
| Multidisciplinary Studies | 0 | 0.0% |
| Science & Technology | 19 | 25.7% |
| Business | 32 | 43.2% |
| Education | 3 | 4.1% |
| Literature & Languages | 0 | 0.0% |
| Liberal Arts & History | 0 | 0.0% |
| Visual & Performing Arts | 0 | 0.0% |
| Communications | 7 | 9.5% |
| Arts & Humanities | 6 | 8.1% |
| Total | 74 | 100.0% |
Transportation & Commute in Uvalda
Vehicle Availability by Sex in Uvalda
The most prevalent vehicle ownership categories in Uvalda are males with 3 vehicles (55, accounting for 60.4%) and females with 3 vehicles (11, making up 64.7%).
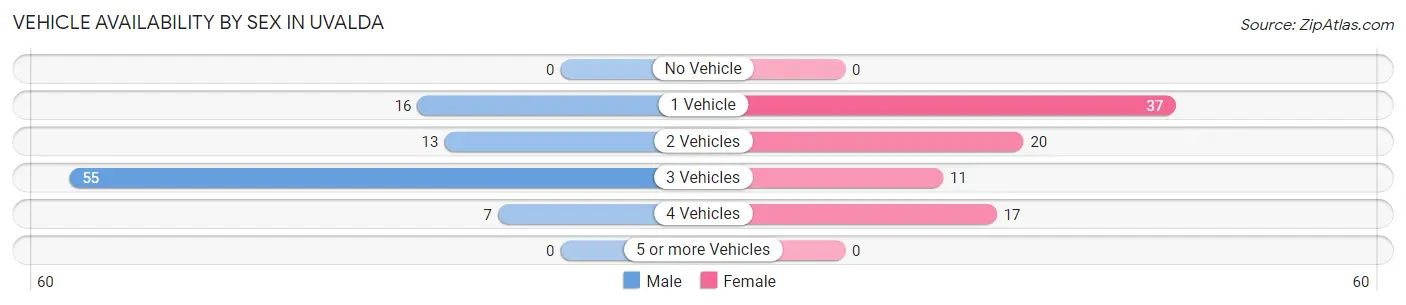
| Vehicles Available | Male | Female |
| No Vehicle | 0 (0.0%) | 0 (0.0%) |
| 1 Vehicle | 16 (17.6%) | 37 (43.5%) |
| 2 Vehicles | 13 (14.3%) | 20 (23.5%) |
| 3 Vehicles | 55 (60.4%) | 11 (12.9%) |
| 4 Vehicles | 7 (7.7%) | 17 (20.0%) |
| 5 or more Vehicles | 0 (0.0%) | 0 (0.0%) |
| Total | 91 (100.0%) | 85 (100.0%) |
Commute Time in Uvalda
The most frequently occuring commute durations in Uvalda are 5 to 9 minutes (39 commuters, 24.5%), 30 to 34 minutes (37 commuters, 23.3%), and 20 to 24 minutes (32 commuters, 20.1%).
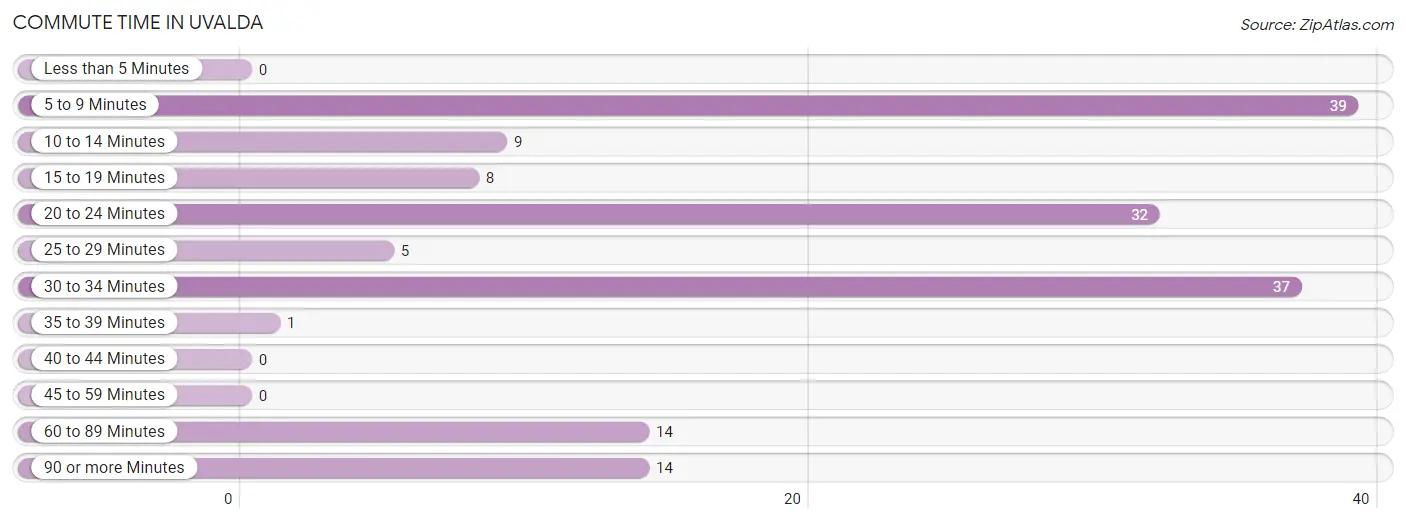
| Commute Time | # Commuters | % Commuters |
| Less than 5 Minutes | 0 | 0.0% |
| 5 to 9 Minutes | 39 | 24.5% |
| 10 to 14 Minutes | 9 | 5.7% |
| 15 to 19 Minutes | 8 | 5.0% |
| 20 to 24 Minutes | 32 | 20.1% |
| 25 to 29 Minutes | 5 | 3.1% |
| 30 to 34 Minutes | 37 | 23.3% |
| 35 to 39 Minutes | 1 | 0.6% |
| 40 to 44 Minutes | 0 | 0.0% |
| 45 to 59 Minutes | 0 | 0.0% |
| 60 to 89 Minutes | 14 | 8.8% |
| 90 or more Minutes | 14 | 8.8% |
Commute Time by Sex in Uvalda
The most common commute times in Uvalda are 5 to 9 minutes (33 commuters, 42.3%) for males and 30 to 34 minutes (30 commuters, 37.0%) for females.
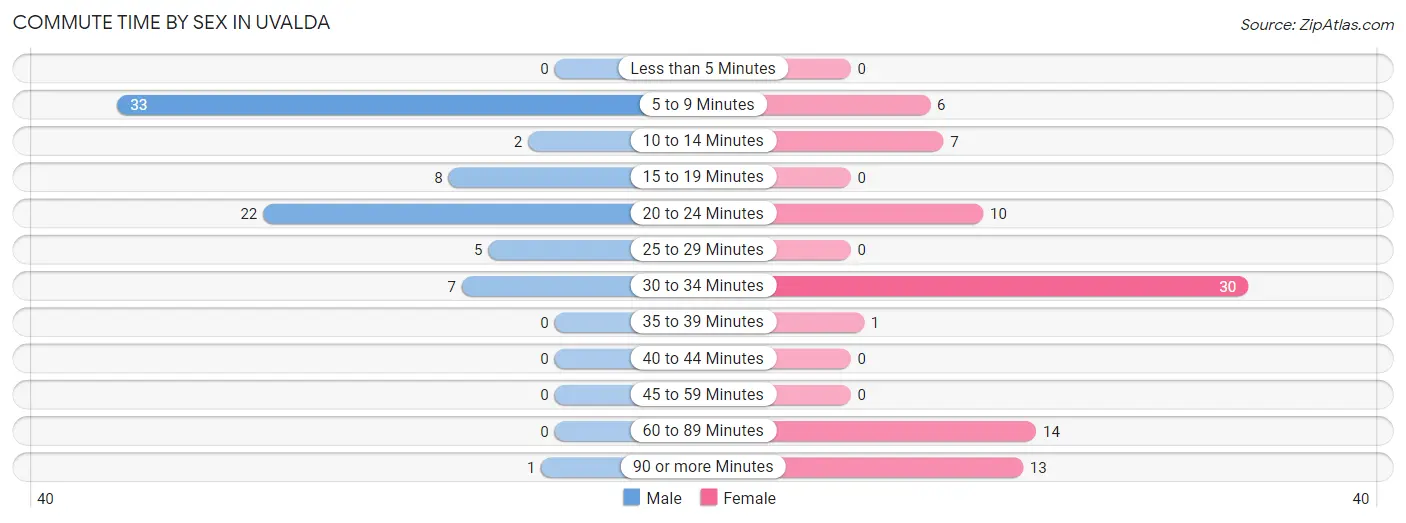
| Commute Time | Male | Female |
| Less than 5 Minutes | 0 (0.0%) | 0 (0.0%) |
| 5 to 9 Minutes | 33 (42.3%) | 6 (7.4%) |
| 10 to 14 Minutes | 2 (2.6%) | 7 (8.6%) |
| 15 to 19 Minutes | 8 (10.3%) | 0 (0.0%) |
| 20 to 24 Minutes | 22 (28.2%) | 10 (12.3%) |
| 25 to 29 Minutes | 5 (6.4%) | 0 (0.0%) |
| 30 to 34 Minutes | 7 (9.0%) | 30 (37.0%) |
| 35 to 39 Minutes | 0 (0.0%) | 1 (1.2%) |
| 40 to 44 Minutes | 0 (0.0%) | 0 (0.0%) |
| 45 to 59 Minutes | 0 (0.0%) | 0 (0.0%) |
| 60 to 89 Minutes | 0 (0.0%) | 14 (17.3%) |
| 90 or more Minutes | 1 (1.3%) | 13 (16.1%) |
Time of Departure to Work by Sex in Uvalda
The most frequent times of departure to work in Uvalda are 5:30 AM to 5:59 AM (51, 65.4%) for males and 4:00 PM to 11:59 PM (20, 24.7%) for females.
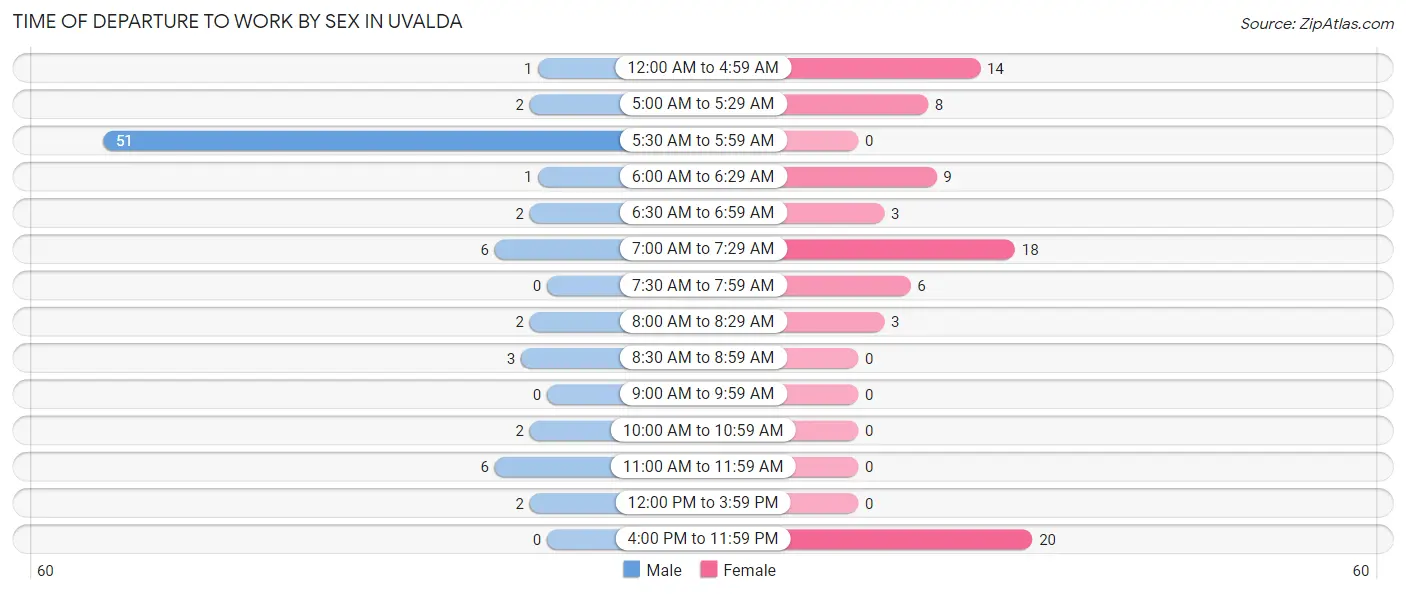
| Time of Departure | Male | Female |
| 12:00 AM to 4:59 AM | 1 (1.3%) | 14 (17.3%) |
| 5:00 AM to 5:29 AM | 2 (2.6%) | 8 (9.9%) |
| 5:30 AM to 5:59 AM | 51 (65.4%) | 0 (0.0%) |
| 6:00 AM to 6:29 AM | 1 (1.3%) | 9 (11.1%) |
| 6:30 AM to 6:59 AM | 2 (2.6%) | 3 (3.7%) |
| 7:00 AM to 7:29 AM | 6 (7.7%) | 18 (22.2%) |
| 7:30 AM to 7:59 AM | 0 (0.0%) | 6 (7.4%) |
| 8:00 AM to 8:29 AM | 2 (2.6%) | 3 (3.7%) |
| 8:30 AM to 8:59 AM | 3 (3.8%) | 0 (0.0%) |
| 9:00 AM to 9:59 AM | 0 (0.0%) | 0 (0.0%) |
| 10:00 AM to 10:59 AM | 2 (2.6%) | 0 (0.0%) |
| 11:00 AM to 11:59 AM | 6 (7.7%) | 0 (0.0%) |
| 12:00 PM to 3:59 PM | 2 (2.6%) | 0 (0.0%) |
| 4:00 PM to 11:59 PM | 0 (0.0%) | 20 (24.7%) |
| Total | 78 (100.0%) | 81 (100.0%) |
Housing Occupancy in Uvalda
Occupancy by Ownership in Uvalda
Of the total 190 dwellings in Uvalda, owner-occupied units account for 144 (75.8%), while renter-occupied units make up 46 (24.2%).
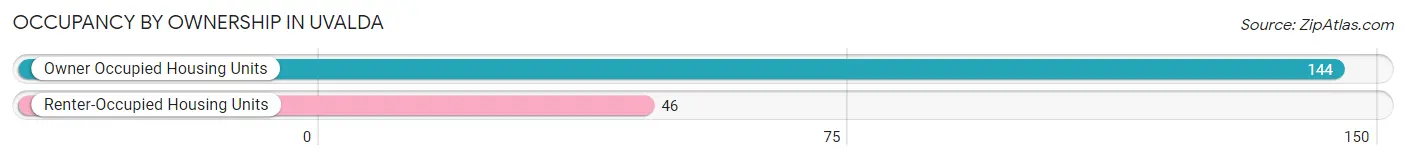
| Occupancy | # Housing Units | % Housing Units |
| Owner Occupied Housing Units | 144 | 75.8% |
| Renter-Occupied Housing Units | 46 | 24.2% |
| Total Occupied Housing Units | 190 | 100.0% |
Occupancy by Household Size in Uvalda
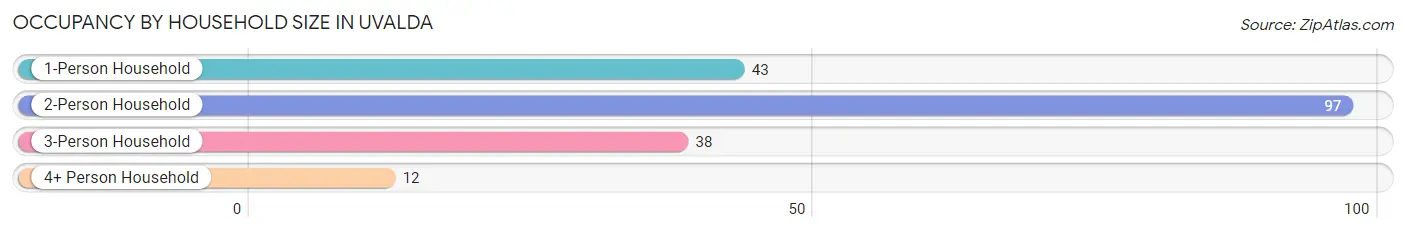
| Household Size | # Housing Units | % Housing Units |
| 1-Person Household | 43 | 22.6% |
| 2-Person Household | 97 | 51.0% |
| 3-Person Household | 38 | 20.0% |
| 4+ Person Household | 12 | 6.3% |
| Total Housing Units | 190 | 100.0% |
Occupancy by Ownership by Household Size in Uvalda
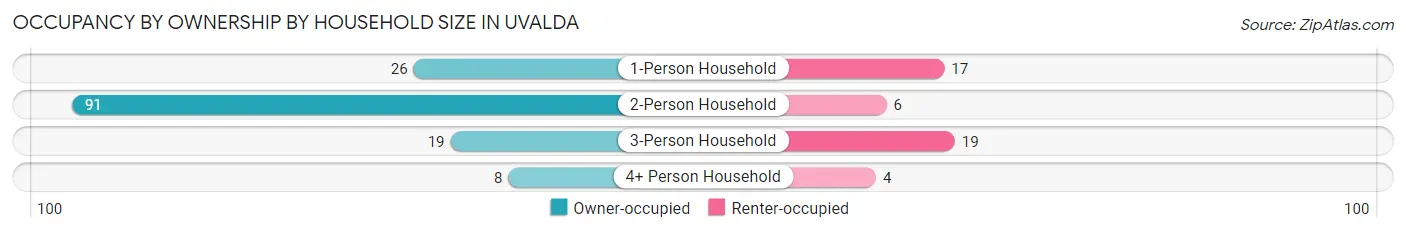
| Household Size | Owner-occupied | Renter-occupied |
| 1-Person Household | 26 (60.5%) | 17 (39.5%) |
| 2-Person Household | 91 (93.8%) | 6 (6.2%) |
| 3-Person Household | 19 (50.0%) | 19 (50.0%) |
| 4+ Person Household | 8 (66.7%) | 4 (33.3%) |
| Total Housing Units | 144 (75.8%) | 46 (24.2%) |
Occupancy by Educational Attainment in Uvalda
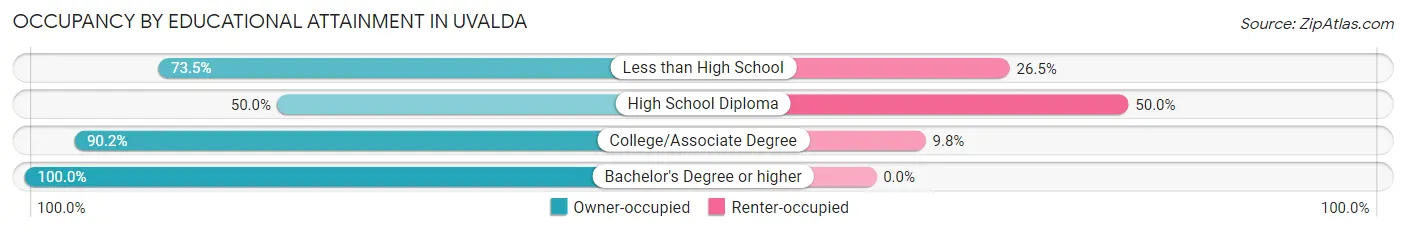
| Household Size | Owner-occupied | Renter-occupied |
| Less than High School | 25 (73.5%) | 9 (26.5%) |
| High School Diploma | 32 (50.0%) | 32 (50.0%) |
| College/Associate Degree | 46 (90.2%) | 5 (9.8%) |
| Bachelor's Degree or higher | 41 (100.0%) | 0 (0.0%) |
Occupancy by Age of Householder in Uvalda
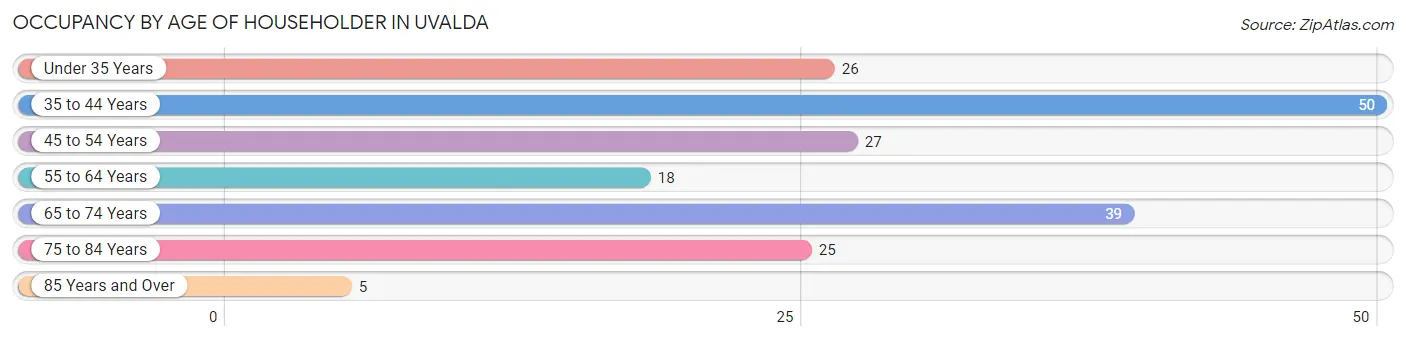
| Age Bracket | # Households | % Households |
| Under 35 Years | 26 | 13.7% |
| 35 to 44 Years | 50 | 26.3% |
| 45 to 54 Years | 27 | 14.2% |
| 55 to 64 Years | 18 | 9.5% |
| 65 to 74 Years | 39 | 20.5% |
| 75 to 84 Years | 25 | 13.2% |
| 85 Years and Over | 5 | 2.6% |
| Total | 190 | 100.0% |
Housing Finances in Uvalda
Median Income by Occupancy in Uvalda
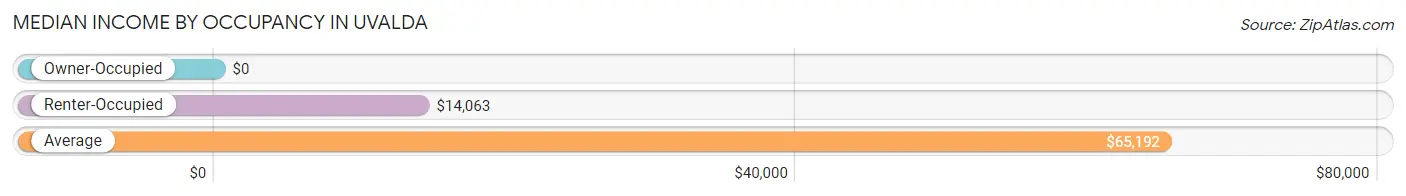
| Occupancy Type | # Households | Median Income |
| Owner-Occupied | 144 (75.8%) | $0 |
| Renter-Occupied | 46 (24.2%) | $14,063 |
| Average | 190 (100.0%) | $65,192 |
Occupancy by Householder Income Bracket in Uvalda
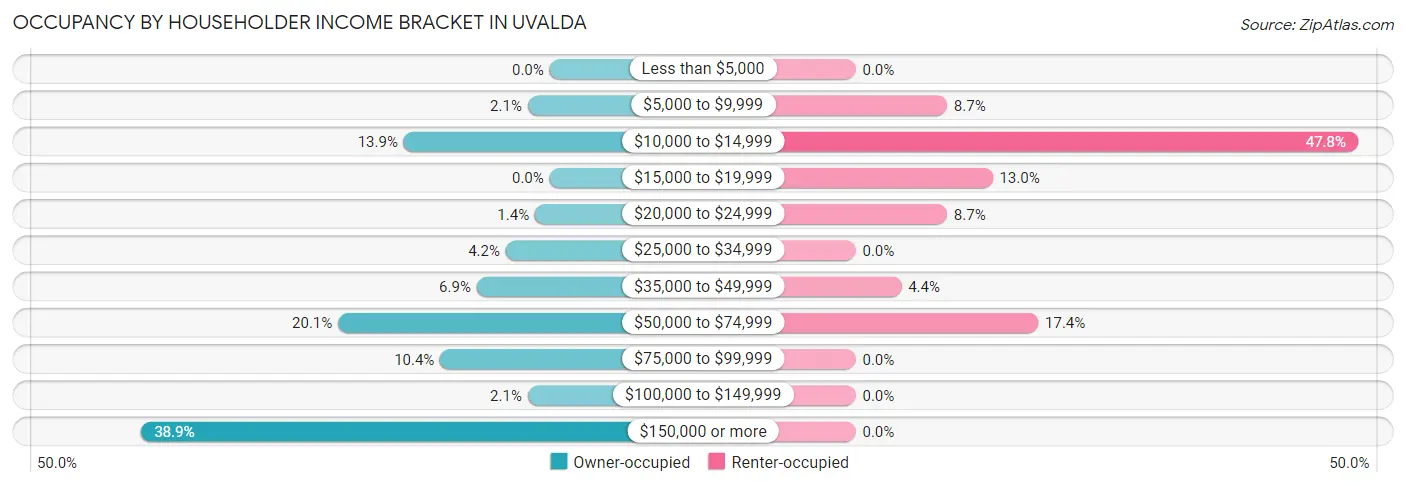
| Income Bracket | Owner-occupied | Renter-occupied |
| Less than $5,000 | 0 (0.0%) | 0 (0.0%) |
| $5,000 to $9,999 | 3 (2.1%) | 4 (8.7%) |
| $10,000 to $14,999 | 20 (13.9%) | 22 (47.8%) |
| $15,000 to $19,999 | 0 (0.0%) | 6 (13.0%) |
| $20,000 to $24,999 | 2 (1.4%) | 4 (8.7%) |
| $25,000 to $34,999 | 6 (4.2%) | 0 (0.0%) |
| $35,000 to $49,999 | 10 (6.9%) | 2 (4.3%) |
| $50,000 to $74,999 | 29 (20.1%) | 8 (17.4%) |
| $75,000 to $99,999 | 15 (10.4%) | 0 (0.0%) |
| $100,000 to $149,999 | 3 (2.1%) | 0 (0.0%) |
| $150,000 or more | 56 (38.9%) | 0 (0.0%) |
| Total | 144 (100.0%) | 46 (100.0%) |
Monthly Housing Cost Tiers in Uvalda
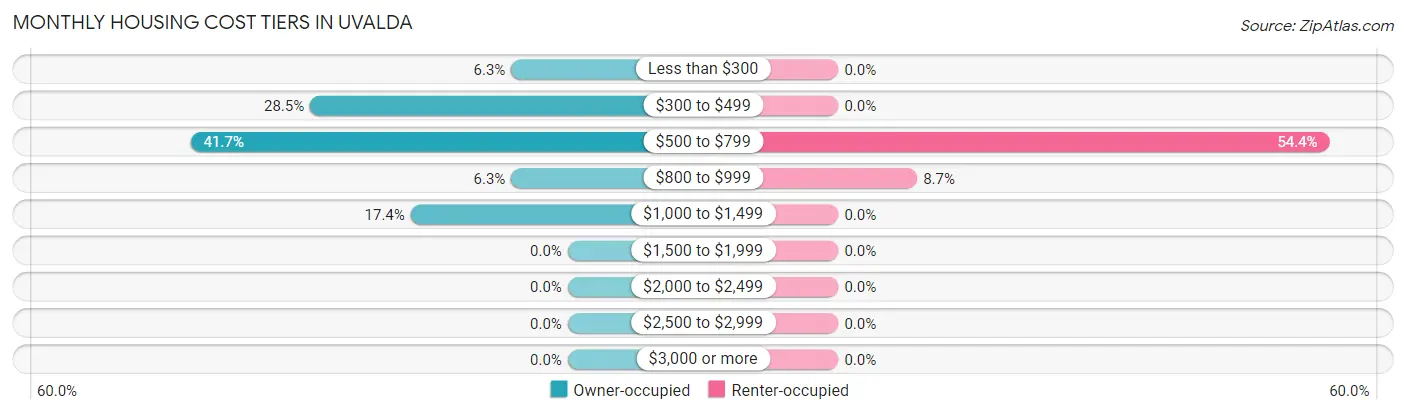
| Monthly Cost | Owner-occupied | Renter-occupied |
| Less than $300 | 9 (6.2%) | 0 (0.0%) |
| $300 to $499 | 41 (28.5%) | 0 (0.0%) |
| $500 to $799 | 60 (41.7%) | 25 (54.3%) |
| $800 to $999 | 9 (6.2%) | 4 (8.7%) |
| $1,000 to $1,499 | 25 (17.4%) | 0 (0.0%) |
| $1,500 to $1,999 | 0 (0.0%) | 0 (0.0%) |
| $2,000 to $2,499 | 0 (0.0%) | 0 (0.0%) |
| $2,500 to $2,999 | 0 (0.0%) | 0 (0.0%) |
| $3,000 or more | 0 (0.0%) | 0 (0.0%) |
| Total | 144 (100.0%) | 46 (100.0%) |
Physical Housing Characteristics in Uvalda
Housing Structures in Uvalda
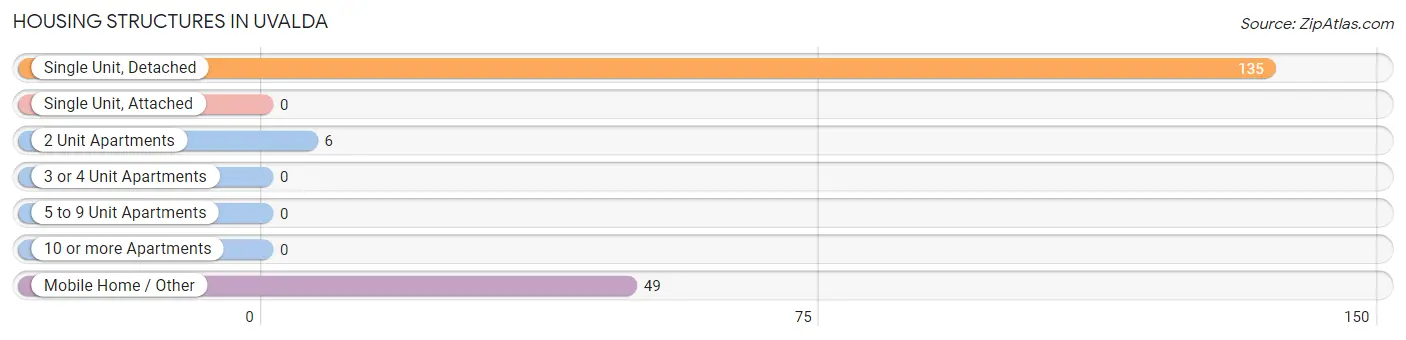
| Structure Type | # Housing Units | % Housing Units |
| Single Unit, Detached | 135 | 71.1% |
| Single Unit, Attached | 0 | 0.0% |
| 2 Unit Apartments | 6 | 3.2% |
| 3 or 4 Unit Apartments | 0 | 0.0% |
| 5 to 9 Unit Apartments | 0 | 0.0% |
| 10 or more Apartments | 0 | 0.0% |
| Mobile Home / Other | 49 | 25.8% |
| Total | 190 | 100.0% |
Housing Structures by Occupancy in Uvalda
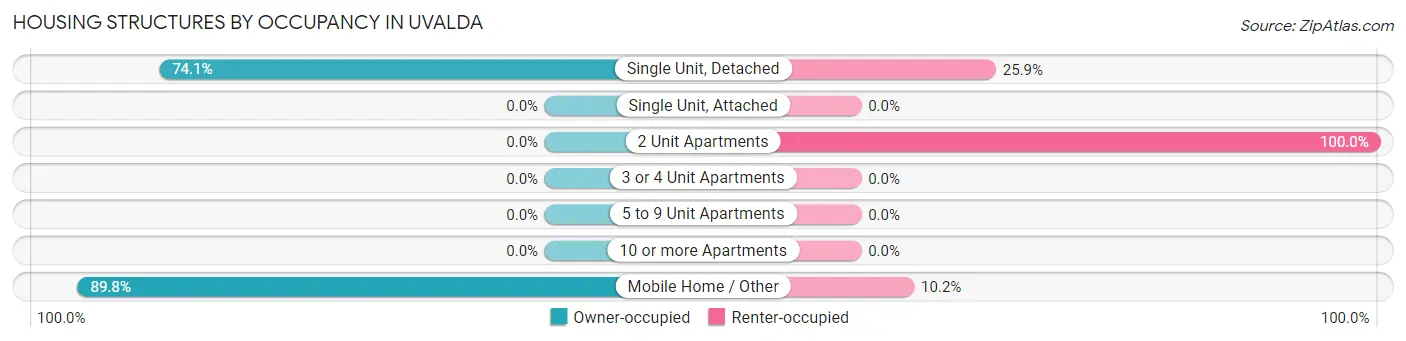
| Structure Type | Owner-occupied | Renter-occupied |
| Single Unit, Detached | 100 (74.1%) | 35 (25.9%) |
| Single Unit, Attached | 0 (0.0%) | 0 (0.0%) |
| 2 Unit Apartments | 0 (0.0%) | 6 (100.0%) |
| 3 or 4 Unit Apartments | 0 (0.0%) | 0 (0.0%) |
| 5 to 9 Unit Apartments | 0 (0.0%) | 0 (0.0%) |
| 10 or more Apartments | 0 (0.0%) | 0 (0.0%) |
| Mobile Home / Other | 44 (89.8%) | 5 (10.2%) |
| Total | 144 (75.8%) | 46 (24.2%) |
Housing Structures by Number of Rooms in Uvalda
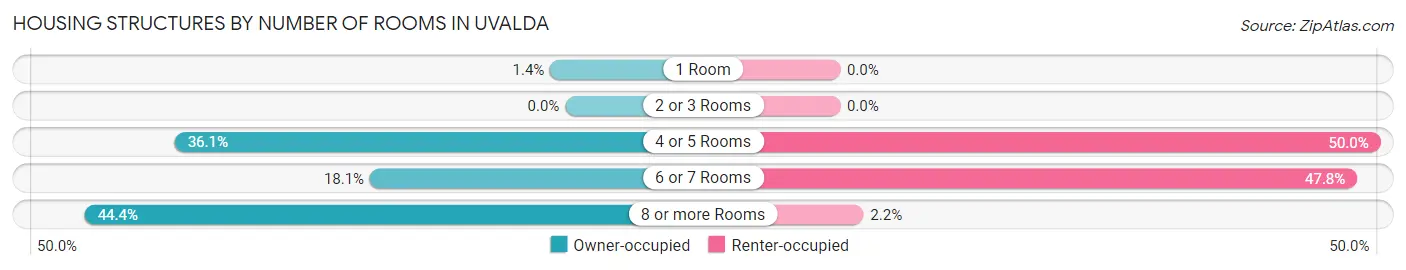
| Number of Rooms | Owner-occupied | Renter-occupied |
| 1 Room | 2 (1.4%) | 0 (0.0%) |
| 2 or 3 Rooms | 0 (0.0%) | 0 (0.0%) |
| 4 or 5 Rooms | 52 (36.1%) | 23 (50.0%) |
| 6 or 7 Rooms | 26 (18.1%) | 22 (47.8%) |
| 8 or more Rooms | 64 (44.4%) | 1 (2.2%) |
| Total | 144 (100.0%) | 46 (100.0%) |
Housing Structure by Heating Type in Uvalda
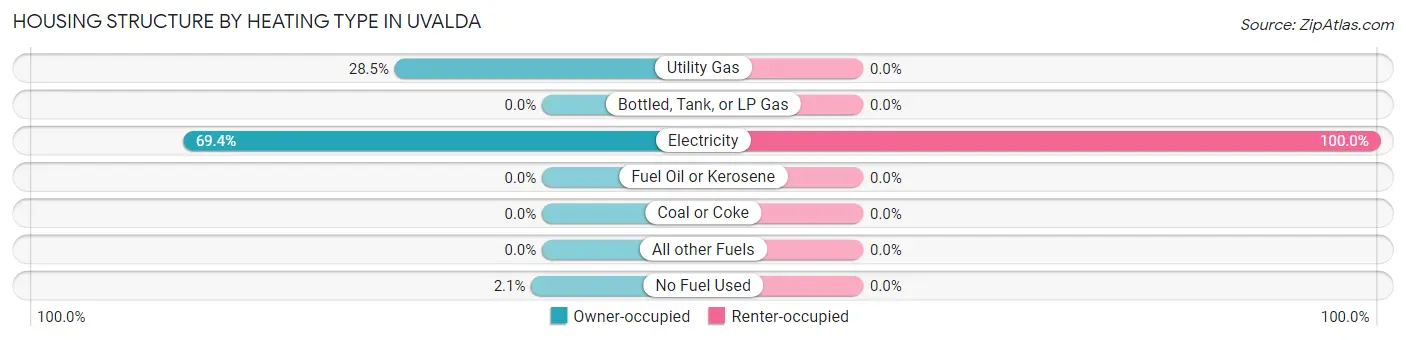
| Heating Type | Owner-occupied | Renter-occupied |
| Utility Gas | 41 (28.5%) | 0 (0.0%) |
| Bottled, Tank, or LP Gas | 0 (0.0%) | 0 (0.0%) |
| Electricity | 100 (69.4%) | 46 (100.0%) |
| Fuel Oil or Kerosene | 0 (0.0%) | 0 (0.0%) |
| Coal or Coke | 0 (0.0%) | 0 (0.0%) |
| All other Fuels | 0 (0.0%) | 0 (0.0%) |
| No Fuel Used | 3 (2.1%) | 0 (0.0%) |
| Total | 144 (100.0%) | 46 (100.0%) |
Household Vehicle Usage in Uvalda
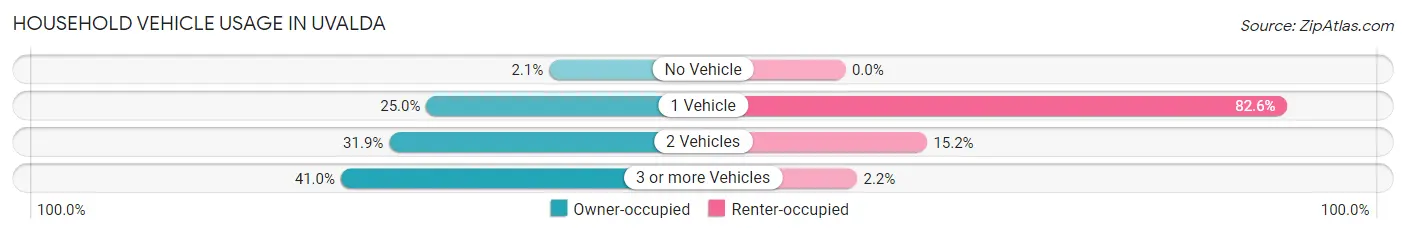
| Vehicles per Household | Owner-occupied | Renter-occupied |
| No Vehicle | 3 (2.1%) | 0 (0.0%) |
| 1 Vehicle | 36 (25.0%) | 38 (82.6%) |
| 2 Vehicles | 46 (31.9%) | 7 (15.2%) |
| 3 or more Vehicles | 59 (41.0%) | 1 (2.2%) |
| Total | 144 (100.0%) | 46 (100.0%) |
Real Estate & Mortgages in Uvalda
Real Estate and Mortgage Overview in Uvalda
| Characteristic | Without Mortgage | With Mortgage |
| Housing Units | 84 | 60 |
| Median Property Value | $128,800 | $91,400 |
| Median Household Income | - | - |
| Monthly Housing Costs | $469 | $0 |
| Real Estate Taxes | - | - |
Property Value by Mortgage Status in Uvalda
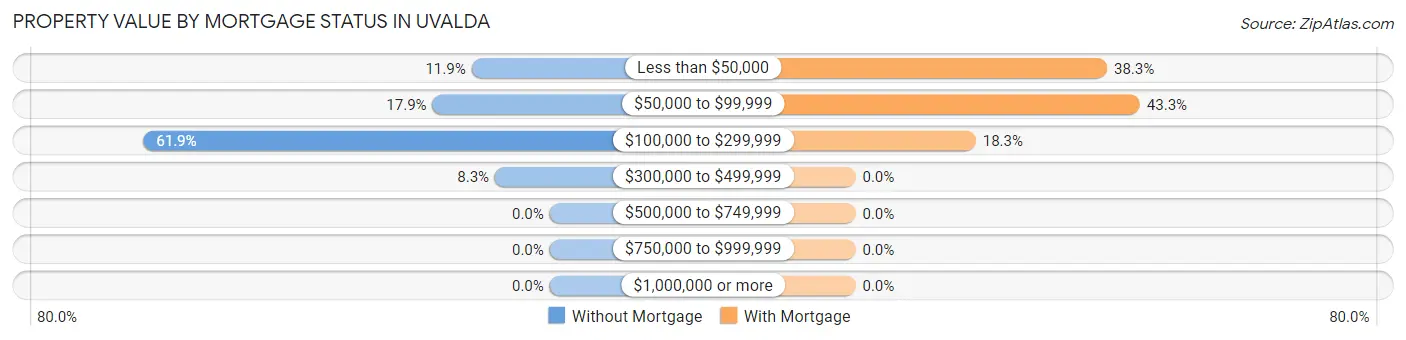
| Property Value | Without Mortgage | With Mortgage |
| Less than $50,000 | 10 (11.9%) | 23 (38.3%) |
| $50,000 to $99,999 | 15 (17.9%) | 26 (43.3%) |
| $100,000 to $299,999 | 52 (61.9%) | 11 (18.3%) |
| $300,000 to $499,999 | 7 (8.3%) | 0 (0.0%) |
| $500,000 to $749,999 | 0 (0.0%) | 0 (0.0%) |
| $750,000 to $999,999 | 0 (0.0%) | 0 (0.0%) |
| $1,000,000 or more | 0 (0.0%) | 0 (0.0%) |
| Total | 84 (100.0%) | 60 (100.0%) |
Household Income by Mortgage Status in Uvalda
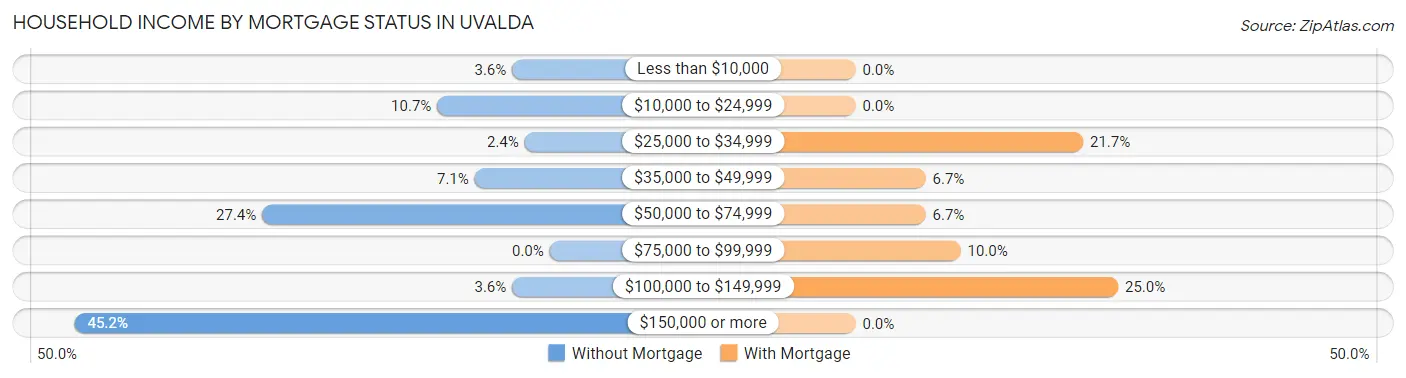
| Household Income | Without Mortgage | With Mortgage |
| Less than $10,000 | 3 (3.6%) | 0 (0.0%) |
| $10,000 to $24,999 | 9 (10.7%) | 0 (0.0%) |
| $25,000 to $34,999 | 2 (2.4%) | 13 (21.7%) |
| $35,000 to $49,999 | 6 (7.1%) | 4 (6.7%) |
| $50,000 to $74,999 | 23 (27.4%) | 4 (6.7%) |
| $75,000 to $99,999 | 0 (0.0%) | 6 (10.0%) |
| $100,000 to $149,999 | 3 (3.6%) | 15 (25.0%) |
| $150,000 or more | 38 (45.2%) | 0 (0.0%) |
| Total | 84 (100.0%) | 60 (100.0%) |
Property Value to Household Income Ratio in Uvalda
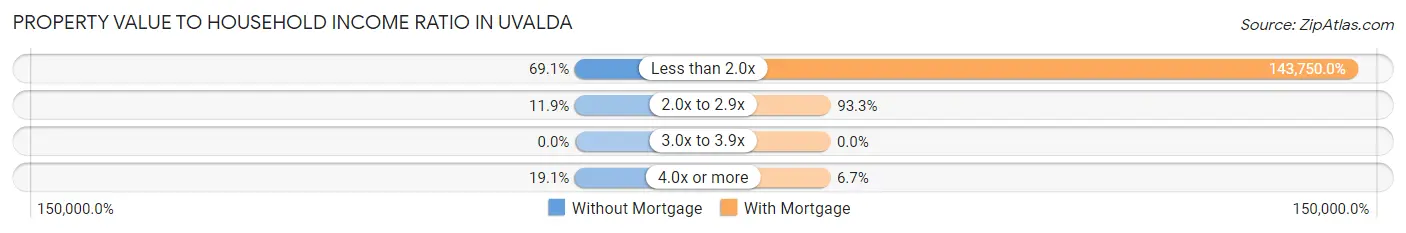
| Value-to-Income Ratio | Without Mortgage | With Mortgage |
| Less than 2.0x | 58 (69.1%) | 86,250 (143,750.0%) |
| 2.0x to 2.9x | 10 (11.9%) | 56 (93.3%) |
| 3.0x to 3.9x | 0 (0.0%) | 0 (0.0%) |
| 4.0x or more | 16 (19.1%) | 4 (6.7%) |
| Total | 84 (100.0%) | 60 (100.0%) |
Real Estate Taxes by Mortgage Status in Uvalda
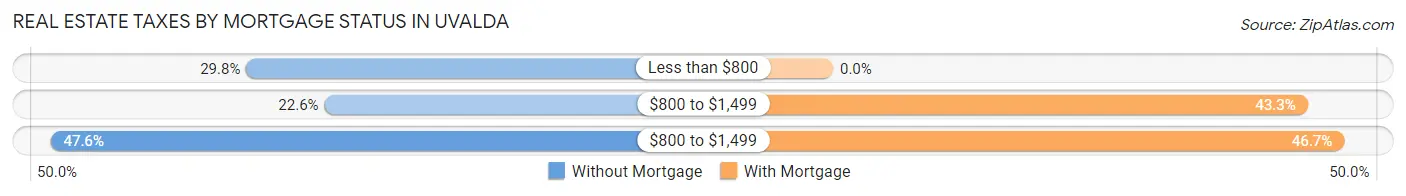
| Property Taxes | Without Mortgage | With Mortgage |
| Less than $800 | 25 (29.8%) | 0 (0.0%) |
| $800 to $1,499 | 19 (22.6%) | 26 (43.3%) |
| $800 to $1,499 | 40 (47.6%) | 28 (46.7%) |
| Total | 84 (100.0%) | 60 (100.0%) |
Health & Disability in Uvalda
Health Insurance Coverage by Age in Uvalda
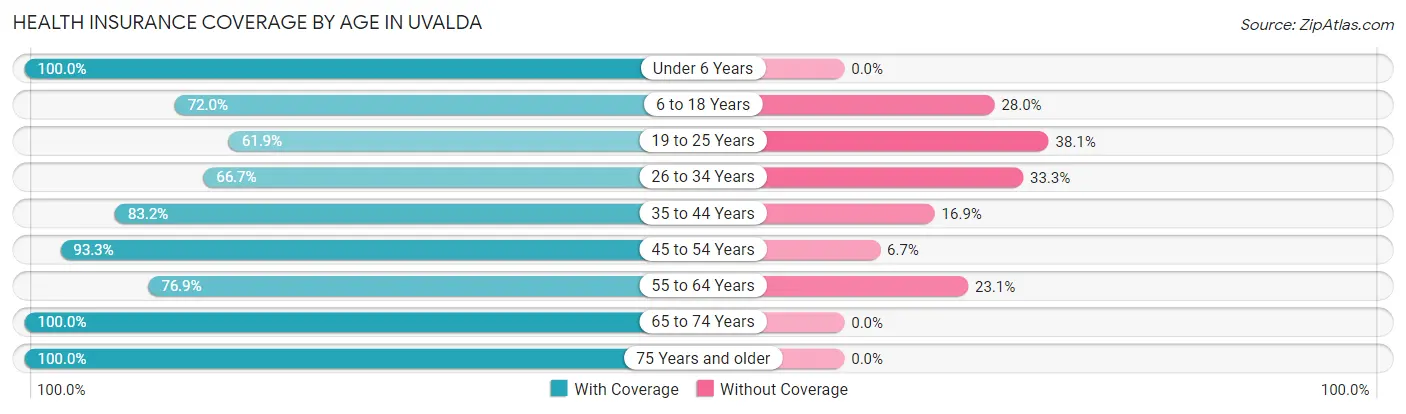
| Age Bracket | With Coverage | Without Coverage |
| Under 6 Years | 34 (100.0%) | 0 (0.0%) |
| 6 to 18 Years | 18 (72.0%) | 7 (28.0%) |
| 19 to 25 Years | 26 (61.9%) | 16 (38.1%) |
| 26 to 34 Years | 14 (66.7%) | 7 (33.3%) |
| 35 to 44 Years | 74 (83.2%) | 15 (16.9%) |
| 45 to 54 Years | 42 (93.3%) | 3 (6.7%) |
| 55 to 64 Years | 30 (76.9%) | 9 (23.1%) |
| 65 to 74 Years | 58 (100.0%) | 0 (0.0%) |
| 75 Years and older | 34 (100.0%) | 0 (0.0%) |
| Total | 330 (85.3%) | 57 (14.7%) |
Health Insurance Coverage by Citizenship Status in Uvalda
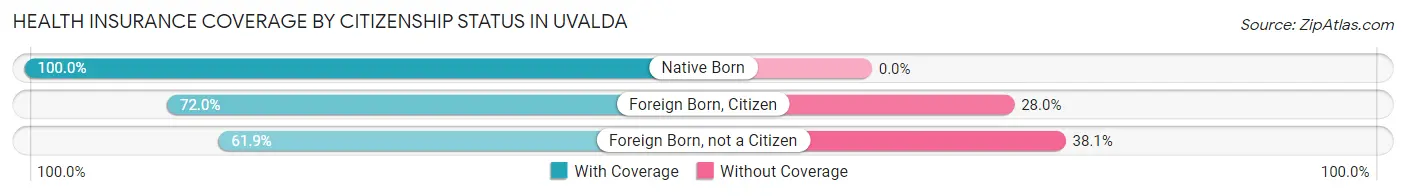
| Citizenship Status | With Coverage | Without Coverage |
| Native Born | 34 (100.0%) | 0 (0.0%) |
| Foreign Born, Citizen | 18 (72.0%) | 7 (28.0%) |
| Foreign Born, not a Citizen | 26 (61.9%) | 16 (38.1%) |
Health Insurance Coverage by Household Income in Uvalda
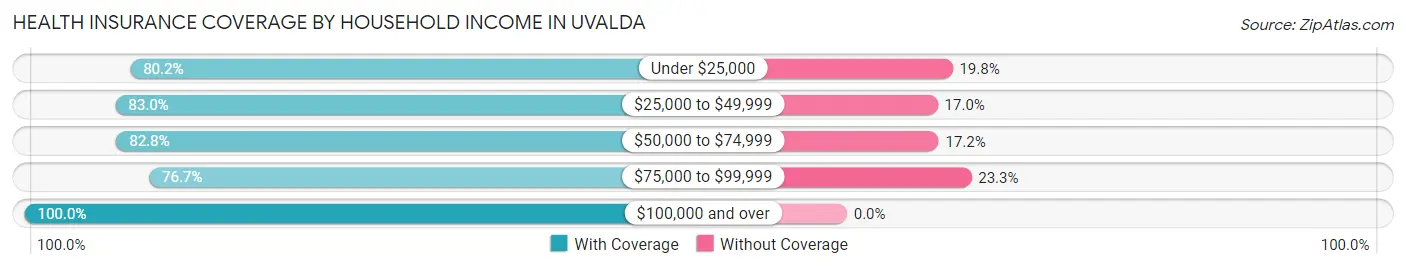
| Household Income | With Coverage | Without Coverage |
| Under $25,000 | 81 (80.2%) | 20 (19.8%) |
| $25,000 to $49,999 | 39 (83.0%) | 8 (17.0%) |
| $50,000 to $74,999 | 106 (82.8%) | 22 (17.2%) |
| $75,000 to $99,999 | 23 (76.7%) | 7 (23.3%) |
| $100,000 and over | 81 (100.0%) | 0 (0.0%) |
Public vs Private Health Insurance Coverage by Age in Uvalda
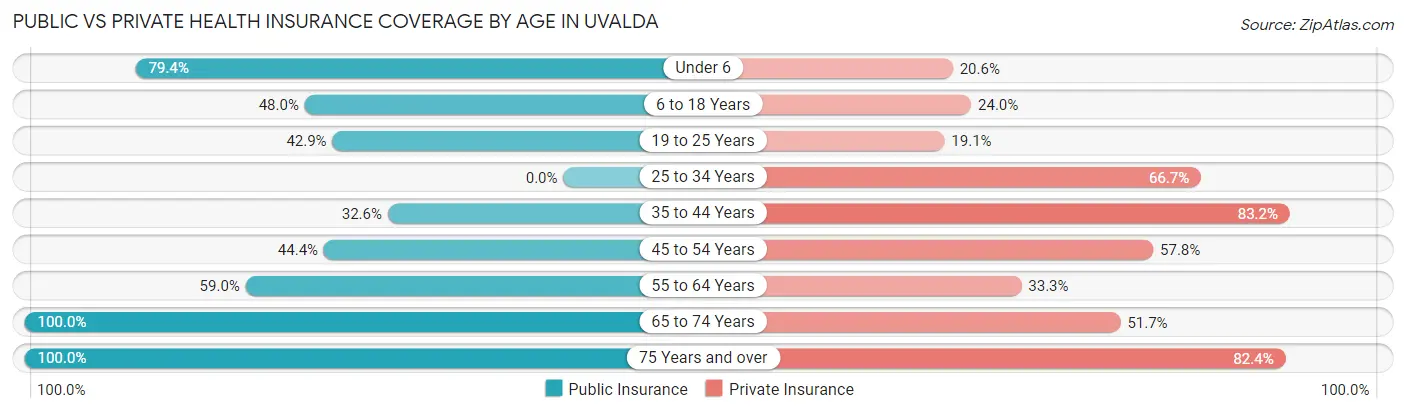
| Age Bracket | Public Insurance | Private Insurance |
| Under 6 | 27 (79.4%) | 7 (20.6%) |
| 6 to 18 Years | 12 (48.0%) | 6 (24.0%) |
| 19 to 25 Years | 18 (42.9%) | 8 (19.1%) |
| 25 to 34 Years | 0 (0.0%) | 14 (66.7%) |
| 35 to 44 Years | 29 (32.6%) | 74 (83.2%) |
| 45 to 54 Years | 20 (44.4%) | 26 (57.8%) |
| 55 to 64 Years | 23 (59.0%) | 13 (33.3%) |
| 65 to 74 Years | 58 (100.0%) | 30 (51.7%) |
| 75 Years and over | 34 (100.0%) | 28 (82.4%) |
| Total | 221 (57.1%) | 206 (53.2%) |
Disability Status by Sex by Age in Uvalda
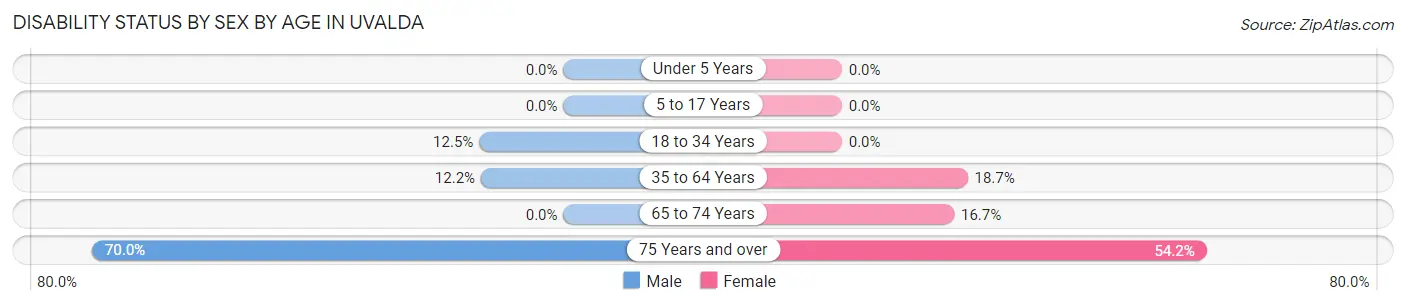
| Age Bracket | Male | Female |
| Under 5 Years | 0 (0.0%) | 0 (0.0%) |
| 5 to 17 Years | 0 (0.0%) | 0 (0.0%) |
| 18 to 34 Years | 2 (12.5%) | 0 (0.0%) |
| 35 to 64 Years | 12 (12.2%) | 14 (18.7%) |
| 65 to 74 Years | 0 (0.0%) | 7 (16.7%) |
| 75 Years and over | 7 (70.0%) | 13 (54.2%) |
Disability Class by Sex by Age in Uvalda
Disability Class: Hearing Difficulty
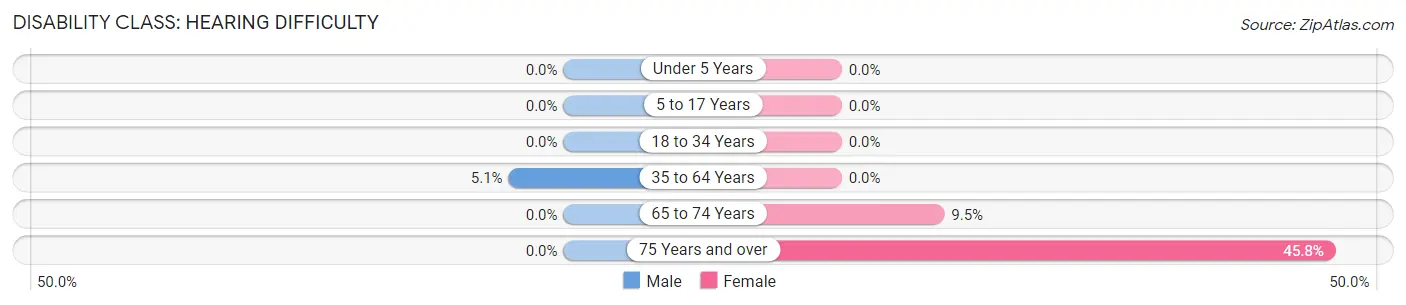
| Age Bracket | Male | Female |
| Under 5 Years | 0 (0.0%) | 0 (0.0%) |
| 5 to 17 Years | 0 (0.0%) | 0 (0.0%) |
| 18 to 34 Years | 0 (0.0%) | 0 (0.0%) |
| 35 to 64 Years | 5 (5.1%) | 0 (0.0%) |
| 65 to 74 Years | 0 (0.0%) | 4 (9.5%) |
| 75 Years and over | 0 (0.0%) | 11 (45.8%) |
Disability Class: Vision Difficulty
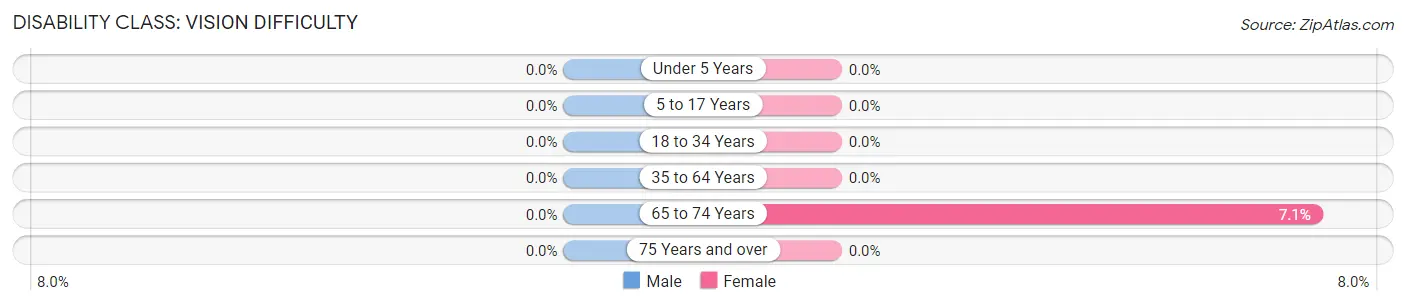
| Age Bracket | Male | Female |
| Under 5 Years | 0 (0.0%) | 0 (0.0%) |
| 5 to 17 Years | 0 (0.0%) | 0 (0.0%) |
| 18 to 34 Years | 0 (0.0%) | 0 (0.0%) |
| 35 to 64 Years | 0 (0.0%) | 0 (0.0%) |
| 65 to 74 Years | 0 (0.0%) | 3 (7.1%) |
| 75 Years and over | 0 (0.0%) | 0 (0.0%) |
Disability Class: Cognitive Difficulty
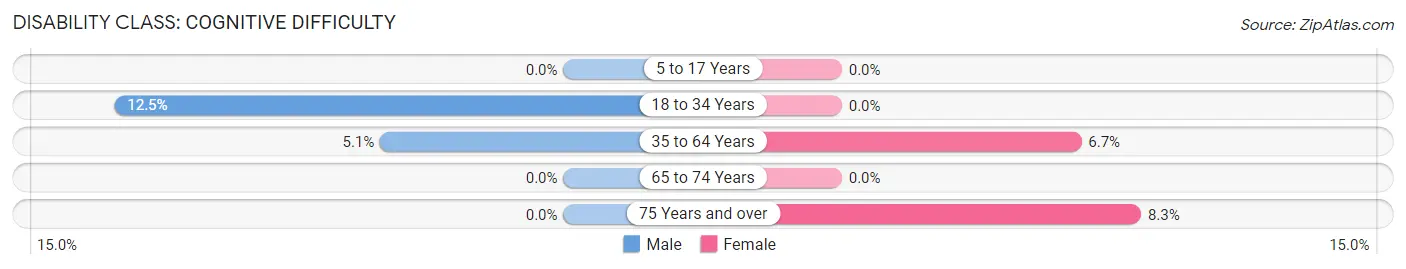
| Age Bracket | Male | Female |
| 5 to 17 Years | 0 (0.0%) | 0 (0.0%) |
| 18 to 34 Years | 2 (12.5%) | 0 (0.0%) |
| 35 to 64 Years | 5 (5.1%) | 5 (6.7%) |
| 65 to 74 Years | 0 (0.0%) | 0 (0.0%) |
| 75 Years and over | 0 (0.0%) | 2 (8.3%) |
Disability Class: Ambulatory Difficulty
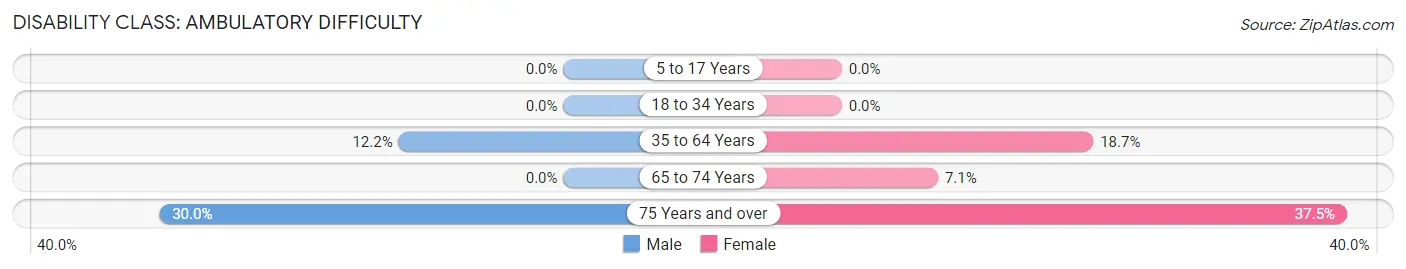
| Age Bracket | Male | Female |
| 5 to 17 Years | 0 (0.0%) | 0 (0.0%) |
| 18 to 34 Years | 0 (0.0%) | 0 (0.0%) |
| 35 to 64 Years | 12 (12.2%) | 14 (18.7%) |
| 65 to 74 Years | 0 (0.0%) | 3 (7.1%) |
| 75 Years and over | 3 (30.0%) | 9 (37.5%) |
Disability Class: Self-Care Difficulty
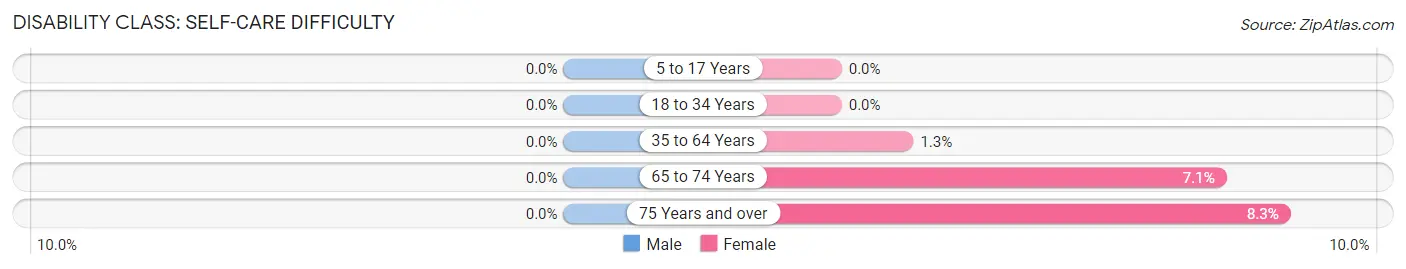
| Age Bracket | Male | Female |
| 5 to 17 Years | 0 (0.0%) | 0 (0.0%) |
| 18 to 34 Years | 0 (0.0%) | 0 (0.0%) |
| 35 to 64 Years | 0 (0.0%) | 1 (1.3%) |
| 65 to 74 Years | 0 (0.0%) | 3 (7.1%) |
| 75 Years and over | 0 (0.0%) | 2 (8.3%) |
Technology Access in Uvalda
Computing Device Access in Uvalda
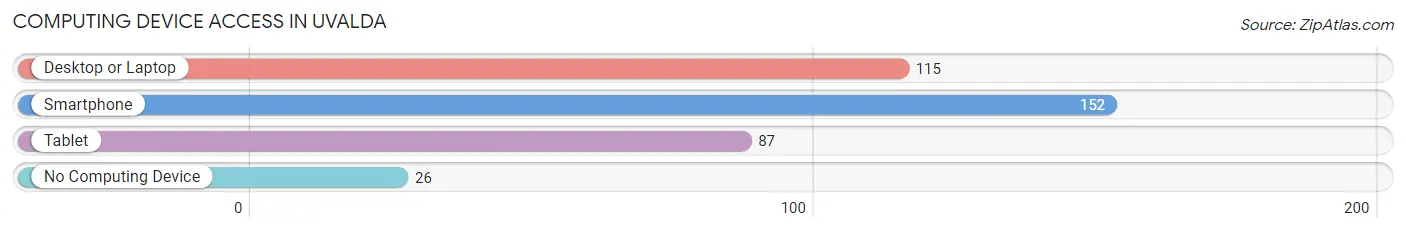
| Device Type | # Households | % Households |
| Desktop or Laptop | 115 | 60.5% |
| Smartphone | 152 | 80.0% |
| Tablet | 87 | 45.8% |
| No Computing Device | 26 | 13.7% |
| Total | 190 | 100.0% |
Internet Access in Uvalda
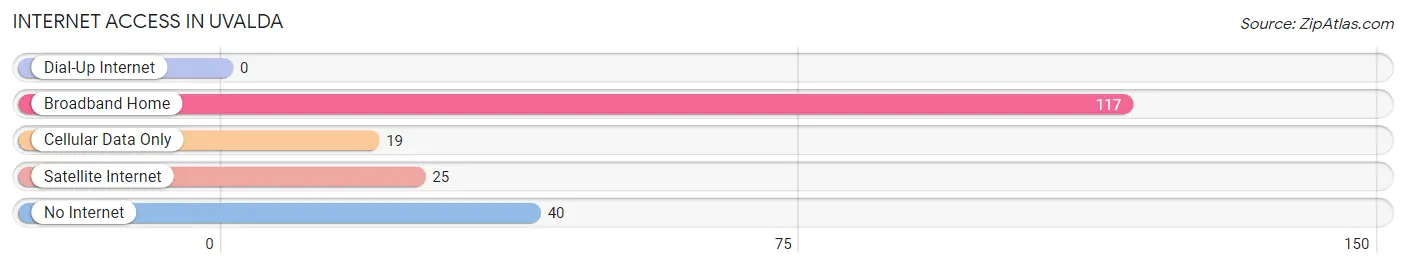
| Internet Type | # Households | % Households |
| Dial-Up Internet | 0 | 0.0% |
| Broadband Home | 117 | 61.6% |
| Cellular Data Only | 19 | 10.0% |
| Satellite Internet | 25 | 13.2% |
| No Internet | 40 | 21.0% |
| Total | 190 | 100.0% |
Uvalda Summary
Uvalda is a small town located in Montgomery County, Georgia, United States. It is situated in the southeastern part of the state, about 40 miles south of Macon and about 60 miles north of Savannah. The population of Uvalda was estimated to be 545 in 2019.
History
Uvalda was founded in 1872 by a group of settlers from the nearby town of Vidalia. The town was named after the nearby Uvalda River, which was named after a Native American chief. The town was incorporated in 1883 and was the first town in Montgomery County to be incorporated.
The town was a major center of the cotton industry in the late 19th and early 20th centuries. The town was also home to a number of sawmills and gristmills. In the early 20th century, the town was home to a number of stores, a hotel, a bank, and a post office.
Geography
Uvalda is located in the southeastern part of Montgomery County, Georgia. It is situated at the intersection of U.S. Route 221 and Georgia State Route 56. The town is located about 40 miles south of Macon and about 60 miles north of Savannah.
The town is situated in a rural area and is surrounded by farmland. The town is located in the Piedmont region of Georgia and is characterized by rolling hills and forests. The town is located near the Oconee National Forest and the Ocmulgee River.
Economy
The economy of Uvalda is largely based on agriculture. The town is home to a number of farms that produce cotton, corn, soybeans, and other crops. The town is also home to a number of sawmills and gristmills.
The town is also home to a number of small businesses, including restaurants, stores, and other services. The town is also home to a number of manufacturing companies, including a furniture factory and a woodworking plant.
Demographics
The population of Uvalda was estimated to be 545 in 2019. The town is predominantly white, with about 90% of the population being white. The town is also home to a small African American population, with about 5% of the population being African American. The town is also home to a small Hispanic population, with about 3% of the population being Hispanic.
The median household income in Uvalda is $35,000, and the median home value is $90,000. The town has a poverty rate of about 20%, and the unemployment rate is about 5%. The town is served by the Montgomery County School District.
Conclusion
Uvalda is a small town located in Montgomery County, Georgia. The town was founded in 1872 and was the first town in the county to be incorporated. The town is situated in a rural area and is surrounded by farmland. The economy of Uvalda is largely based on agriculture, and the town is home to a number of small businesses. The population of Uvalda was estimated to be 545 in 2019, and the town is predominantly white. The median household income in Uvalda is $35,000, and the median home value is $90,000.
Common Questions
What is Per Capita Income in Uvalda?
Per Capita income in Uvalda is $58,211.
What is the Median Family Income in Uvalda?
Median Family Income in Uvalda is $95,417.
What is the Median Household income in Uvalda?
Median Household Income in Uvalda is $65,192.
What is Inequality or Gini Index in Uvalda?
Inequality or Gini Index in Uvalda is 0.63.
What is the Total Population of Uvalda?
Total Population of Uvalda is 387.
What is the Total Male Population of Uvalda?
Total Male Population of Uvalda is 159.
What is the Total Female Population of Uvalda?
Total Female Population of Uvalda is 228.
What is the Ratio of Males per 100 Females in Uvalda?
There are 69.74 Males per 100 Females in Uvalda.
What is the Ratio of Females per 100 Males in Uvalda?
There are 143.40 Females per 100 Males in Uvalda.
What is the Median Population Age in Uvalda?
Median Population Age in Uvalda is 42.9 Years.
What is the Average Family Size in Uvalda
Average Family Size in Uvalda is 2.4 People.
What is the Average Household Size in Uvalda
Average Household Size in Uvalda is 2.0 People.
How Large is the Labor Force in Uvalda?
There are 196 People in the Labor Forcein in Uvalda.
What is the Percentage of People in the Labor Force in Uvalda?
58.7% of People are in the Labor Force in Uvalda.
What is the Unemployment Rate in Uvalda?
Unemployment Rate in Uvalda is 8.2%.