Union Point, GA Map & Demographics
Union Point Map
Union Point Overview
$22,477
PER CAPITA INCOME
$48,843
AVG FAMILY INCOME
$47,963
AVG HOUSEHOLD INCOME
19.9%
WAGE / INCOME GAP [ % ]
80.1¢/ $1
WAGE / INCOME GAP [ $ ]
0.48
INEQUALITY / GINI INDEX
1,661
TOTAL POPULATION
835
MALE POPULATION
826
FEMALE POPULATION
101.09
MALES / 100 FEMALES
98.92
FEMALES / 100 MALES
36.0
MEDIAN AGE
3.7
AVG FAMILY SIZE
3.2
AVG HOUSEHOLD SIZE
626
LABOR FORCE [ PEOPLE ]
54.7%
PERCENT IN LABOR FORCE
0.8%
UNEMPLOYMENT RATE
Union Point Zip Codes
Union Point Area Codes
Income in Union Point
Income Overview in Union Point
Per Capita Income in Union Point is $22,477, while median incomes of families and households are $48,843 and $47,963 respectively.
| Characteristic | Number | Measure |
| Per Capita Income | 1,661 | $22,477 |
| Median Family Income | 397 | $48,843 |
| Mean Family Income | 397 | $72,635 |
| Median Household Income | 504 | $47,963 |
| Mean Household Income | 504 | $69,465 |
| Income Deficit | 397 | $0 |
| Wage / Income Gap (%) | 1,661 | 19.90% |
| Wage / Income Gap ($) | 1,661 | 80.10¢ per $1 |
| Gini / Inequality Index | 1,661 | 0.48 |
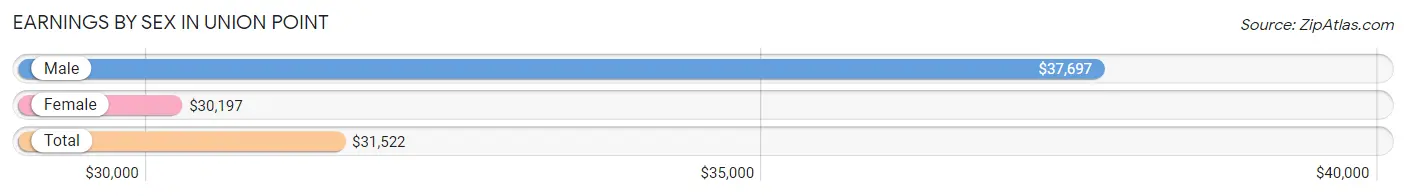
Earnings by Sex in Union Point
Average Earnings in Union Point are $31,522, $37,697 for men and $30,197 for women, a difference of 19.9%.
| Sex | Number | Average Earnings |
| Male | 293 (46.5%) | $37,697 |
| Female | 337 (53.5%) | $30,197 |
| Total | 630 (100.0%) | $31,522 |
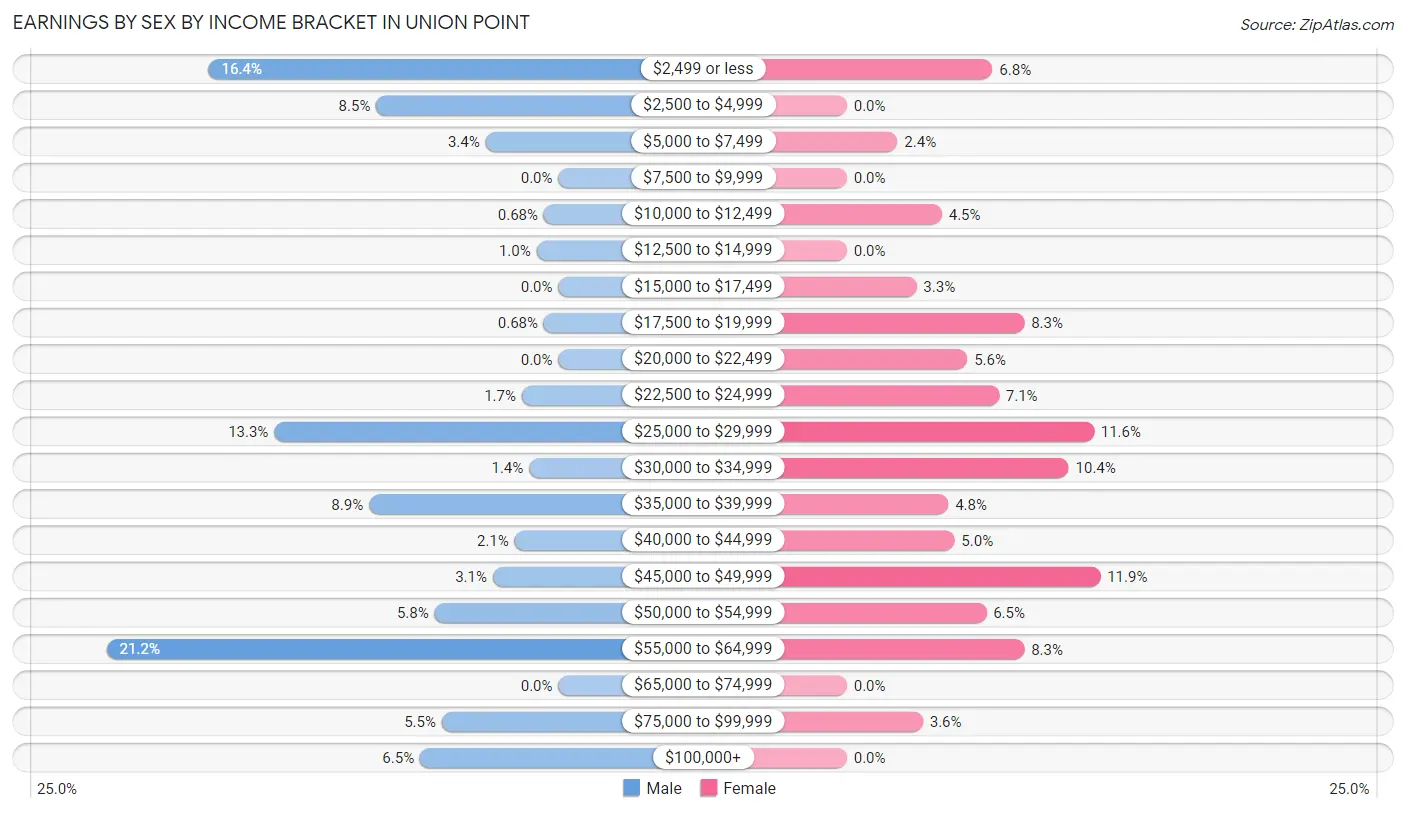
Earnings by Sex by Income Bracket in Union Point
The most common earnings brackets in Union Point are $55,000 to $64,999 for men (62 | 21.2%) and $45,000 to $49,999 for women (40 | 11.9%).
| Income | Male | Female |
| $2,499 or less | 48 (16.4%) | 23 (6.8%) |
| $2,500 to $4,999 | 25 (8.5%) | 0 (0.0%) |
| $5,000 to $7,499 | 10 (3.4%) | 8 (2.4%) |
| $7,500 to $9,999 | 0 (0.0%) | 0 (0.0%) |
| $10,000 to $12,499 | 2 (0.7%) | 15 (4.4%) |
| $12,500 to $14,999 | 3 (1.0%) | 0 (0.0%) |
| $15,000 to $17,499 | 0 (0.0%) | 11 (3.3%) |
| $17,500 to $19,999 | 2 (0.7%) | 28 (8.3%) |
| $20,000 to $22,499 | 0 (0.0%) | 19 (5.6%) |
| $22,500 to $24,999 | 5 (1.7%) | 24 (7.1%) |
| $25,000 to $29,999 | 39 (13.3%) | 39 (11.6%) |
| $30,000 to $34,999 | 4 (1.4%) | 35 (10.4%) |
| $35,000 to $39,999 | 26 (8.9%) | 16 (4.8%) |
| $40,000 to $44,999 | 6 (2.1%) | 17 (5.0%) |
| $45,000 to $49,999 | 9 (3.1%) | 40 (11.9%) |
| $50,000 to $54,999 | 17 (5.8%) | 22 (6.5%) |
| $55,000 to $64,999 | 62 (21.2%) | 28 (8.3%) |
| $65,000 to $74,999 | 0 (0.0%) | 0 (0.0%) |
| $75,000 to $99,999 | 16 (5.5%) | 12 (3.6%) |
| $100,000+ | 19 (6.5%) | 0 (0.0%) |
| Total | 293 (100.0%) | 337 (100.0%) |
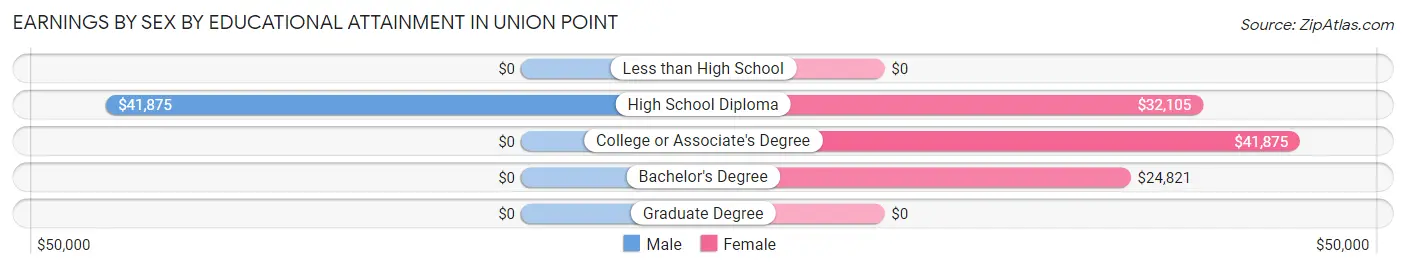
Earnings by Sex by Educational Attainment in Union Point
Average earnings in Union Point are $38,026 for men and $31,711 for women, a difference of 16.6%. Men with an educational attainment of high school diploma enjoy the highest average annual earnings of $41,875, while those with high school diploma education earn the least with $41,875. Women with an educational attainment of college or associate's degree earn the most with the average annual earnings of $41,875, while those with bachelor's degree education have the smallest earnings of $24,821.
| Educational Attainment | Male Income | Female Income |
| Less than High School | - | - |
| High School Diploma | $41,875 | $32,105 |
| College or Associate's Degree | - | - |
| Bachelor's Degree | - | - |
| Graduate Degree | - | - |
| Total | $38,026 | $31,711 |
Family Income in Union Point
Family Income Brackets in Union Point
According to the Union Point family income data, there are 84 families falling into the $35,000 to $49,999 income range, which is the most common income bracket and makes up 21.2% of all families. Conversely, the $10,000 to $14,999 income bracket is the least frequent group with only 5 families (1.3%) belonging to this category.
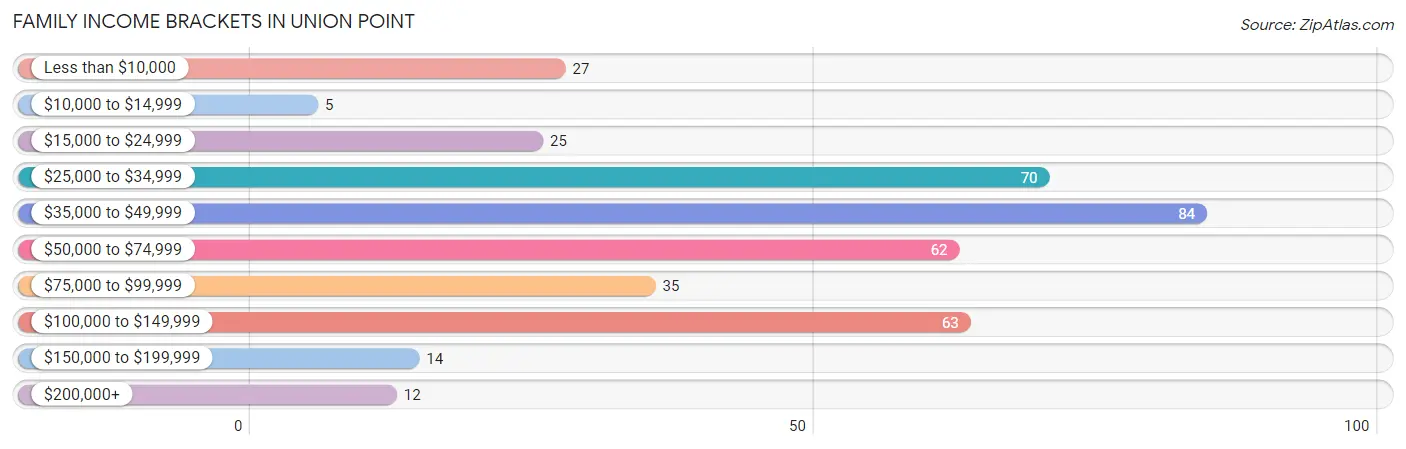
| Income Bracket | # Families | % Families |
| Less than $10,000 | 27 | 6.8% |
| $10,000 to $14,999 | 5 | 1.3% |
| $15,000 to $24,999 | 25 | 6.3% |
| $25,000 to $34,999 | 70 | 17.6% |
| $35,000 to $49,999 | 84 | 21.2% |
| $50,000 to $74,999 | 62 | 15.6% |
| $75,000 to $99,999 | 35 | 8.8% |
| $100,000 to $149,999 | 63 | 15.9% |
| $150,000 to $199,999 | 14 | 3.5% |
| $200,000+ | 12 | 3.0% |
Family Income by Famaliy Size in Union Point
2-person families (142 | 35.8%) account for the highest median family income in Union Point with $66,786 per family, while 2-person families (142 | 35.8%) have the highest median income of $33,393 per family member.
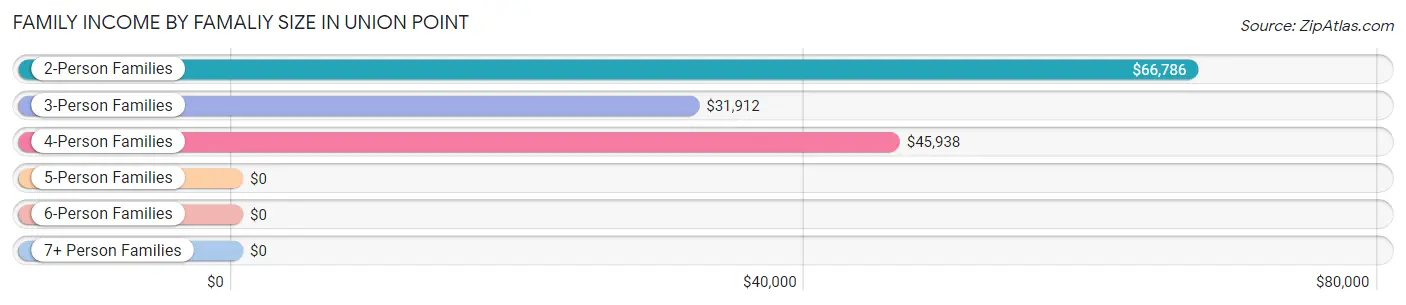
| Income Bracket | # Families | Median Income |
| 2-Person Families | 142 (35.8%) | $66,786 |
| 3-Person Families | 130 (32.8%) | $31,912 |
| 4-Person Families | 77 (19.4%) | $45,938 |
| 5-Person Families | 18 (4.5%) | $0 |
| 6-Person Families | 8 (2.0%) | $0 |
| 7+ Person Families | 22 (5.5%) | $0 |
| Total | 397 (100.0%) | $48,843 |
Family Income by Number of Earners in Union Point
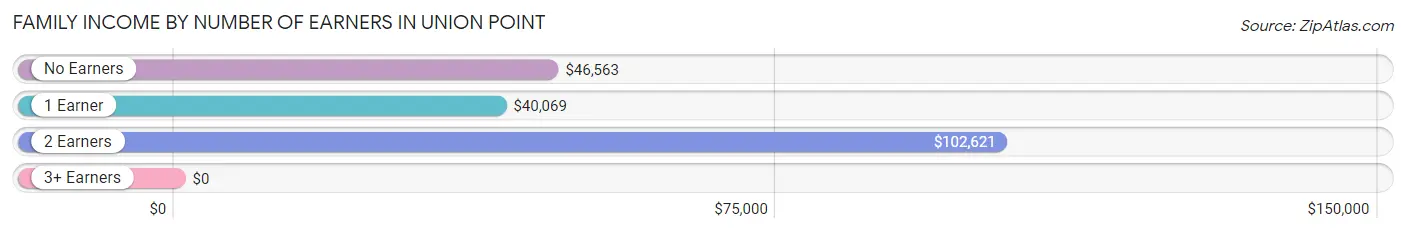
| Number of Earners | # Families | Median Income |
| No Earners | 33 (8.3%) | $46,563 |
| 1 Earner | 239 (60.2%) | $40,069 |
| 2 Earners | 117 (29.5%) | $102,621 |
| 3+ Earners | 8 (2.0%) | $0 |
| Total | 397 (100.0%) | $48,843 |
Household Income in Union Point
Household Income Brackets in Union Point
With 99 households falling in the category, the $50,000 to $74,999 income range is the most frequent in Union Point, accounting for 19.6% of all households. In contrast, only 14 households (2.8%) fall into the $200,000+ income bracket, making it the least populous group.
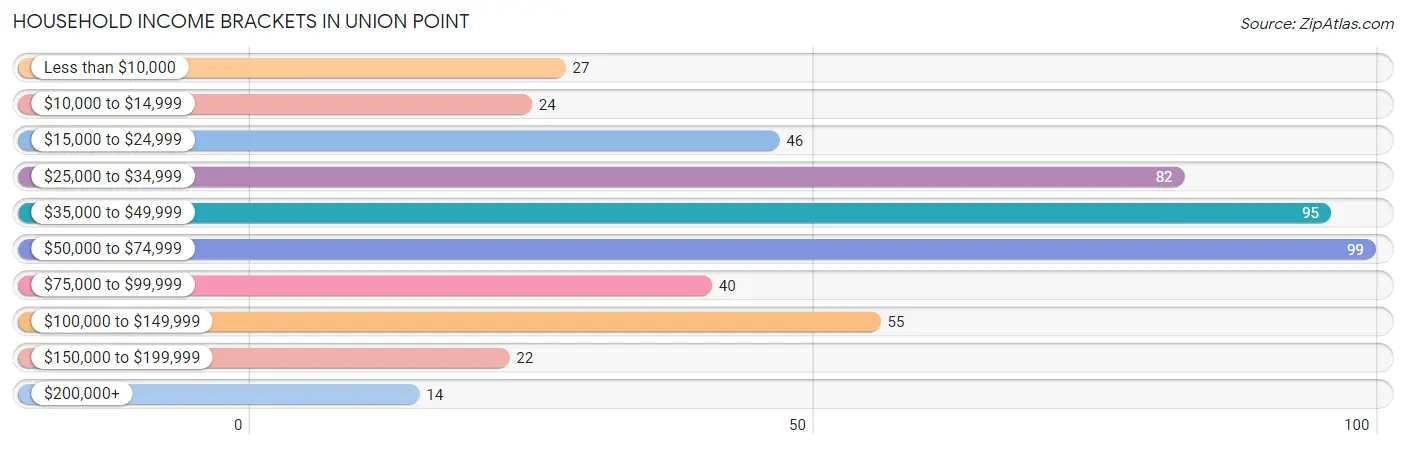
| Income Bracket | # Households | % Households |
| Less than $10,000 | 27 | 5.4% |
| $10,000 to $14,999 | 24 | 4.8% |
| $15,000 to $24,999 | 46 | 9.1% |
| $25,000 to $34,999 | 82 | 16.3% |
| $35,000 to $49,999 | 95 | 18.8% |
| $50,000 to $74,999 | 99 | 19.6% |
| $75,000 to $99,999 | 40 | 7.9% |
| $100,000 to $149,999 | 55 | 10.9% |
| $150,000 to $199,999 | 22 | 4.4% |
| $200,000+ | 14 | 2.8% |
Household Income by Householder Age in Union Point
The median household income in Union Point is $47,963, with the highest median household income of $65,658 found in the 45 to 64 years age bracket for the primary householder. A total of 166 households (32.9%) fall into this category. Meanwhile, the 15 to 24 years age bracket for the primary householder has the lowest median household income of $0, with 13 households (2.6%) in this group.
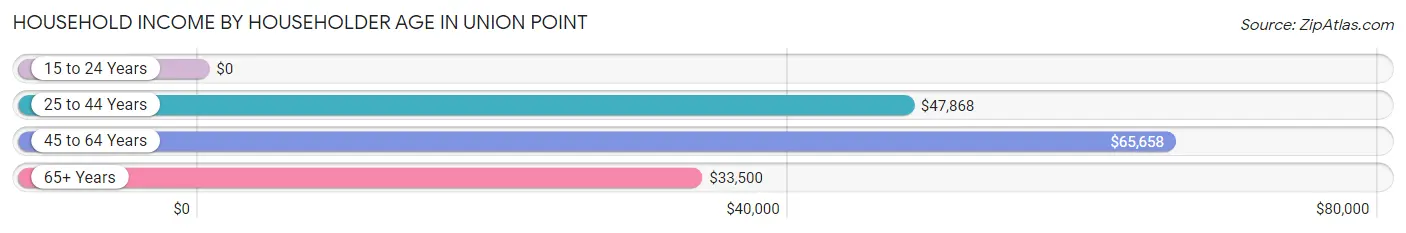
| Income Bracket | # Households | Median Income |
| 15 to 24 Years | 13 (2.6%) | $0 |
| 25 to 44 Years | 179 (35.5%) | $47,868 |
| 45 to 64 Years | 166 (32.9%) | $65,658 |
| 65+ Years | 146 (29.0%) | $33,500 |
| Total | 504 (100.0%) | $47,963 |
Poverty in Union Point
Income Below Poverty by Sex and Age in Union Point
With 14.5% poverty level for males and 20.9% for females among the residents of Union Point, 16 and 17 year old males and 12 to 14 year old females are the most vulnerable to poverty, with 9 males (75.0%) and 18 females (64.3%) in their respective age groups living below the poverty level.
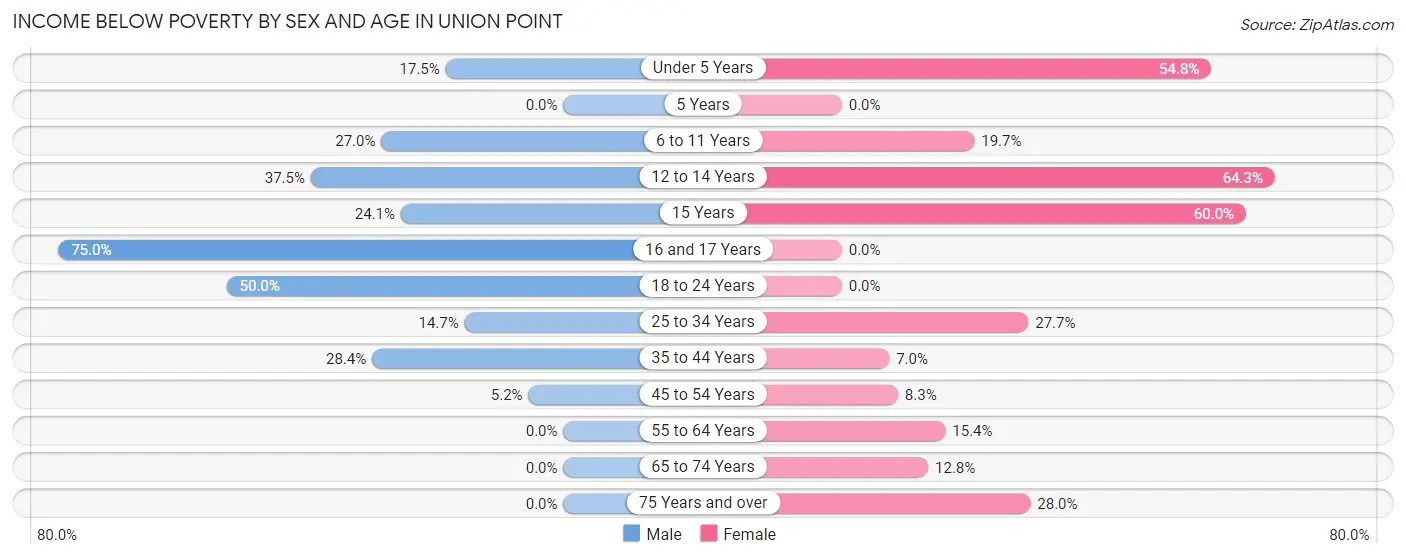
| Age Bracket | Male | Female |
| Under 5 Years | 18 (17.5%) | 34 (54.8%) |
| 5 Years | 0 (0.0%) | 0 (0.0%) |
| 6 to 11 Years | 30 (27.0%) | 24 (19.7%) |
| 12 to 14 Years | 9 (37.5%) | 18 (64.3%) |
| 15 Years | 7 (24.1%) | 9 (60.0%) |
| 16 and 17 Years | 9 (75.0%) | 0 (0.0%) |
| 18 to 24 Years | 5 (50.0%) | 0 (0.0%) |
| 25 to 34 Years | 11 (14.7%) | 36 (27.7%) |
| 35 to 44 Years | 25 (28.4%) | 10 (7.0%) |
| 45 to 54 Years | 4 (5.2%) | 3 (8.3%) |
| 55 to 64 Years | 0 (0.0%) | 16 (15.4%) |
| 65 to 74 Years | 0 (0.0%) | 10 (12.8%) |
| 75 Years and over | 0 (0.0%) | 7 (28.0%) |
| Total | 118 (14.5%) | 167 (20.9%) |
Income Above Poverty by Sex and Age in Union Point
According to the poverty statistics in Union Point, males aged 5 years and females aged 5 years are the age groups that are most secure financially, with 100.0% of males and 100.0% of females in these age groups living above the poverty line.
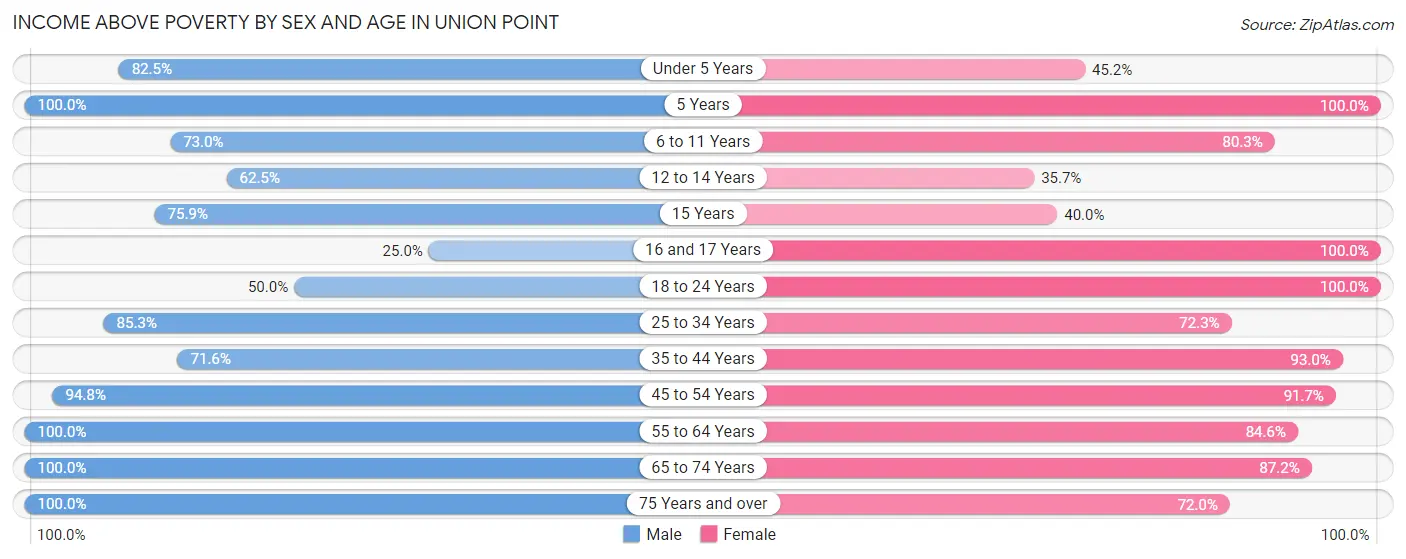
| Age Bracket | Male | Female |
| Under 5 Years | 85 (82.5%) | 28 (45.2%) |
| 5 Years | 7 (100.0%) | 15 (100.0%) |
| 6 to 11 Years | 81 (73.0%) | 98 (80.3%) |
| 12 to 14 Years | 15 (62.5%) | 10 (35.7%) |
| 15 Years | 22 (75.9%) | 6 (40.0%) |
| 16 and 17 Years | 3 (25.0%) | 6 (100.0%) |
| 18 to 24 Years | 5 (50.0%) | 35 (100.0%) |
| 25 to 34 Years | 64 (85.3%) | 94 (72.3%) |
| 35 to 44 Years | 63 (71.6%) | 132 (93.0%) |
| 45 to 54 Years | 73 (94.8%) | 33 (91.7%) |
| 55 to 64 Years | 124 (100.0%) | 88 (84.6%) |
| 65 to 74 Years | 118 (100.0%) | 68 (87.2%) |
| 75 Years and over | 33 (100.0%) | 18 (72.0%) |
| Total | 693 (85.5%) | 631 (79.1%) |
Income Below Poverty Among Married-Couple Families in Union Point
The poverty statistics for married-couple families in Union Point show that 9.4% or 23 of the total 244 families live below the poverty line. Families with 1 or 2 children have the highest poverty rate of 35.6%, comprising of 21 families. On the other hand, families with no children have the lowest poverty rate of 0.0%, which includes 0 families.
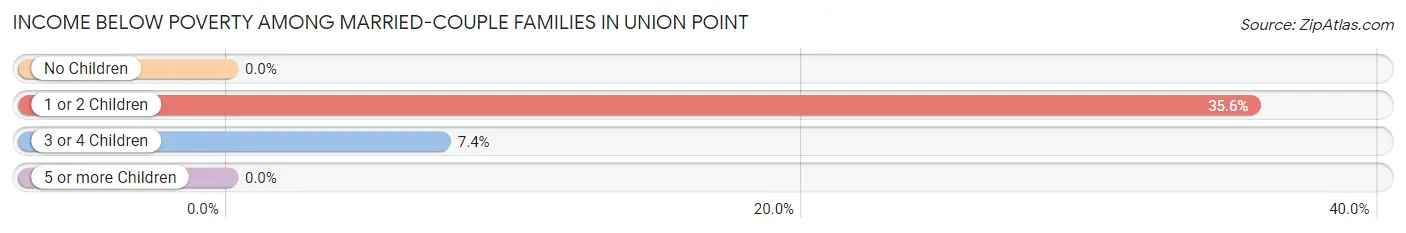
| Children | Above Poverty | Below Poverty |
| No Children | 158 (100.0%) | 0 (0.0%) |
| 1 or 2 Children | 38 (64.4%) | 21 (35.6%) |
| 3 or 4 Children | 25 (92.6%) | 2 (7.4%) |
| 5 or more Children | 0 (0.0%) | 0 (0.0%) |
| Total | 221 (90.6%) | 23 (9.4%) |
Income Below Poverty Among Single-Parent Households in Union Point
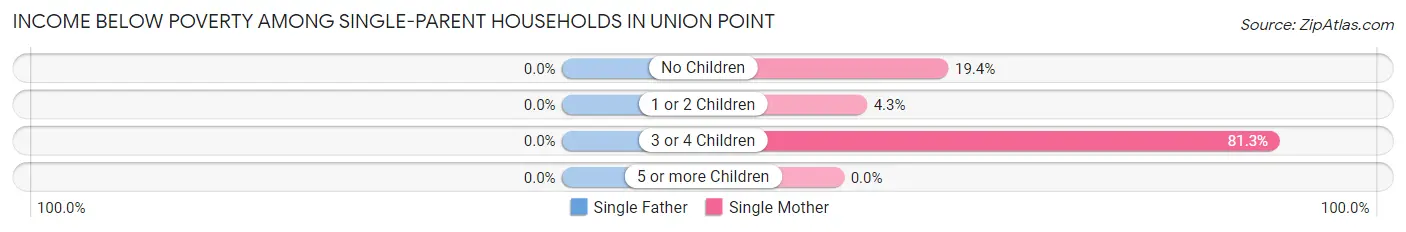
| Children | Single Father | Single Mother |
| No Children | 0 (0.0%) | 7 (19.4%) |
| 1 or 2 Children | 0 (0.0%) | 4 (4.3%) |
| 3 or 4 Children | 0 (0.0%) | 13 (81.2%) |
| 5 or more Children | 0 (0.0%) | 0 (0.0%) |
| Total | 0 (0.0%) | 24 (16.6%) |
Income Below Poverty Among Married-Couple vs Single-Parent Households in Union Point
The poverty data for Union Point shows that 23 of the married-couple family households (9.4%) and 24 of the single-parent households (15.7%) are living below the poverty level. Within the married-couple family households, those with 1 or 2 children have the highest poverty rate, with 21 households (35.6%) falling below the poverty line. Among the single-parent households, those with 3 or 4 children have the highest poverty rate, with 13 household (81.2%) living below poverty.
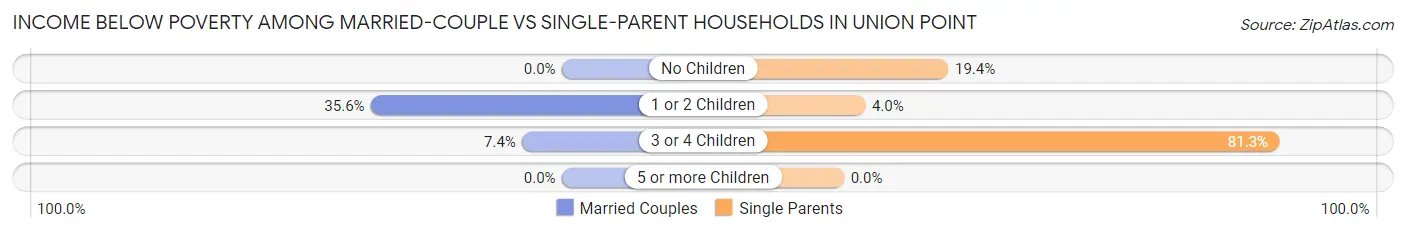
| Children | Married-Couple Families | Single-Parent Households |
| No Children | 0 (0.0%) | 7 (19.4%) |
| 1 or 2 Children | 21 (35.6%) | 4 (4.0%) |
| 3 or 4 Children | 2 (7.4%) | 13 (81.2%) |
| 5 or more Children | 0 (0.0%) | 0 (0.0%) |
| Total | 23 (9.4%) | 24 (15.7%) |
Race in Union Point
The most populous races in Union Point are Black / African American (912 | 54.9%), White / Caucasian (544 | 32.8%), and Hispanic or Latino (129 | 7.8%).
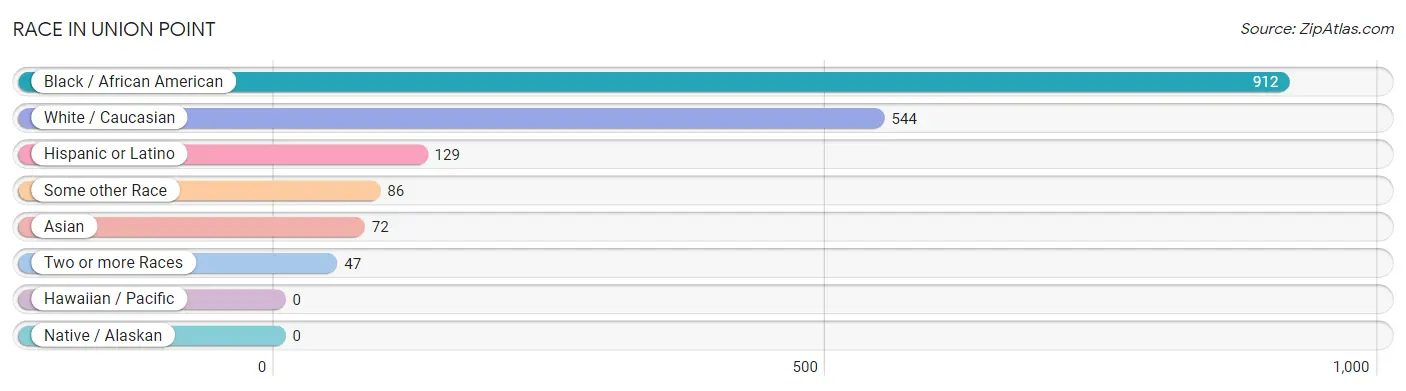
| Race | # Population | % Population |
| Asian | 72 | 4.3% |
| Black / African American | 912 | 54.9% |
| Hawaiian / Pacific | 0 | 0.0% |
| Hispanic or Latino | 129 | 7.8% |
| Native / Alaskan | 0 | 0.0% |
| White / Caucasian | 544 | 32.8% |
| Two or more Races | 47 | 2.8% |
| Some other Race | 86 | 5.2% |
| Total | 1,661 | 100.0% |
Ancestry in Union Point
The most populous ancestries reported in Union Point are Mexican (129 | 7.8%), American (103 | 6.2%), Korean (72 | 4.3%), Irish (71 | 4.3%), and English (68 | 4.1%), together accounting for 26.7% of all Union Point residents.
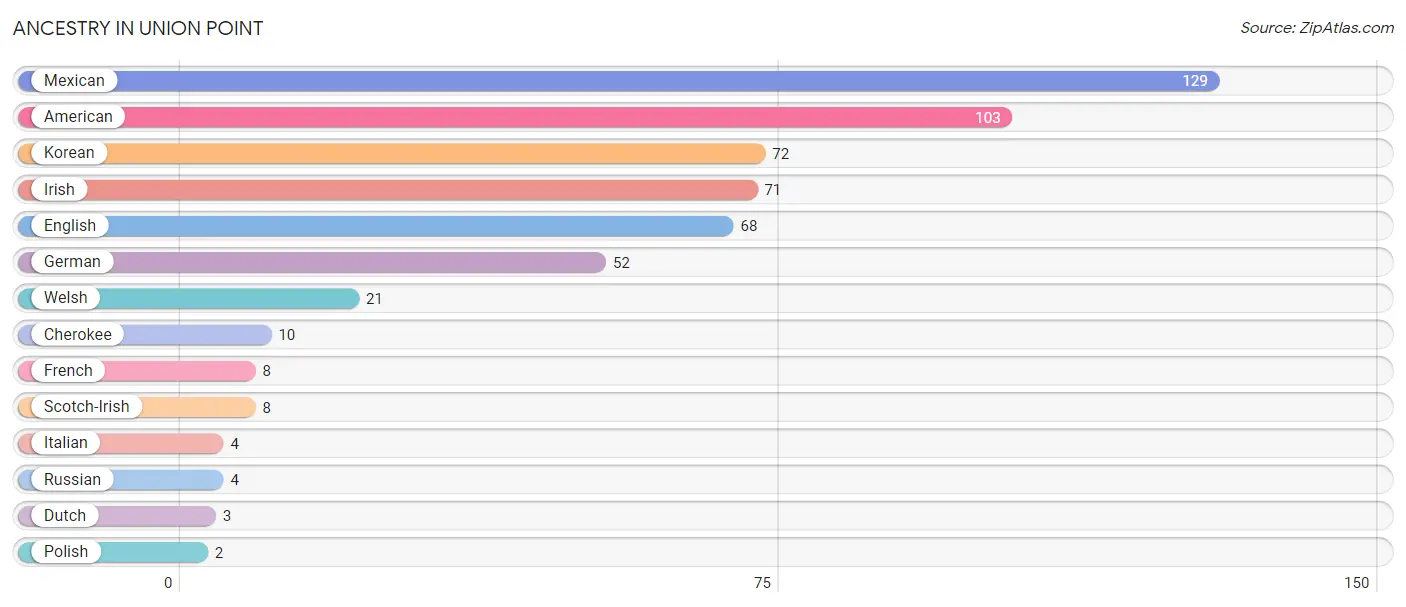
| Ancestry | # Population | % Population |
| American | 103 | 6.2% |
| Cherokee | 10 | 0.6% |
| Dutch | 3 | 0.2% |
| English | 68 | 4.1% |
| French | 8 | 0.5% |
| German | 52 | 3.1% |
| Irish | 71 | 4.3% |
| Italian | 4 | 0.2% |
| Korean | 72 | 4.3% |
| Mexican | 129 | 7.8% |
| Polish | 2 | 0.1% |
| Russian | 4 | 0.2% |
| Scotch-Irish | 8 | 0.5% |
| Welsh | 21 | 1.3% | View All 14 Rows |
Immigrants in Union Point
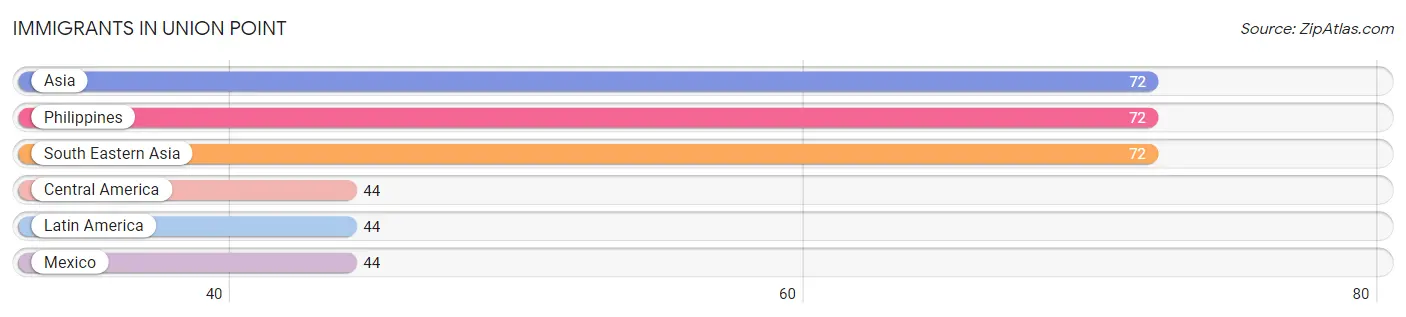
The most numerous immigrant groups reported in Union Point came from Asia (72 | 4.3%), Philippines (72 | 4.3%), South Eastern Asia (72 | 4.3%), Central America (44 | 2.6%), and Latin America (44 | 2.6%), together accounting for 18.3% of all Union Point residents.
| Immigration Origin | # Population | % Population |
| Asia | 72 | 4.3% |
| Central America | 44 | 2.6% |
| Latin America | 44 | 2.6% |
| Mexico | 44 | 2.6% |
| Philippines | 72 | 4.3% |
| South Eastern Asia | 72 | 4.3% | View All 6 Rows |
Sex and Age in Union Point
Sex and Age in Union Point
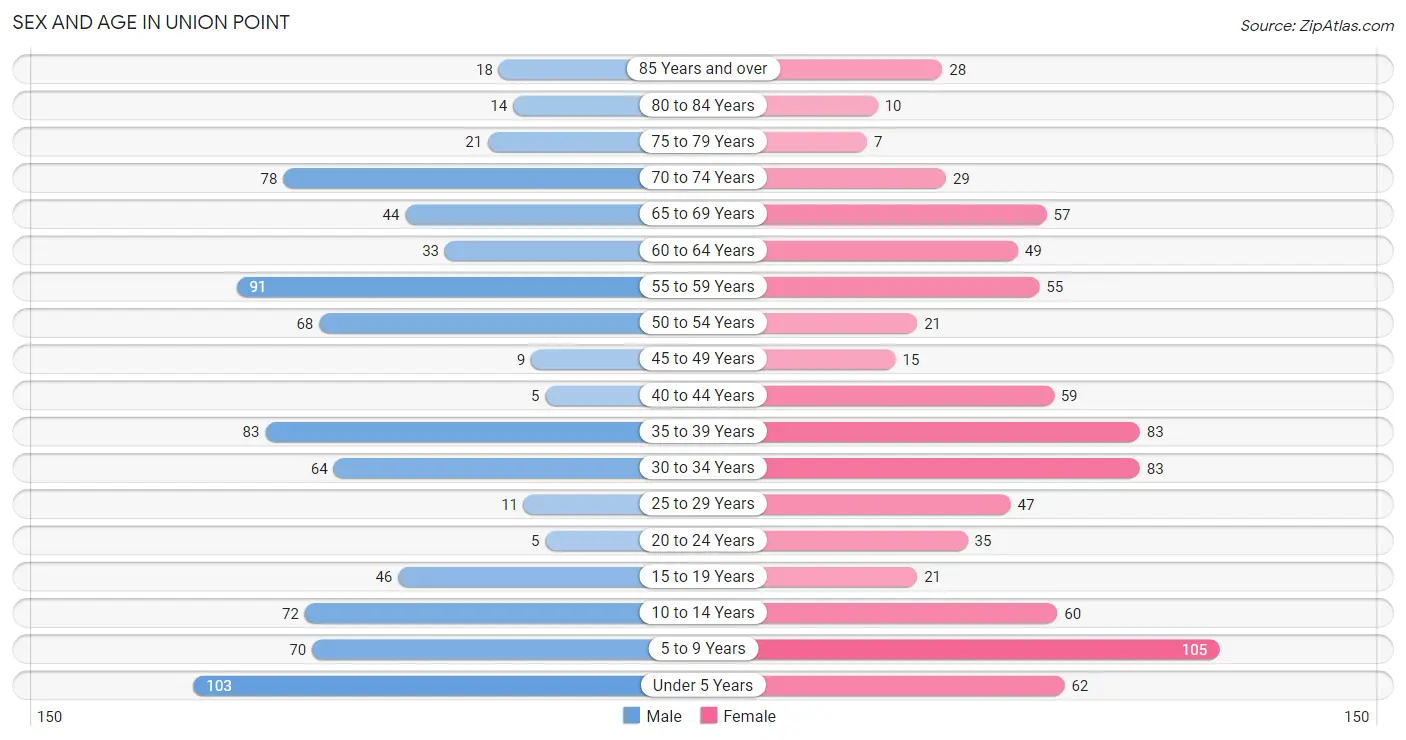
The most populous age groups in Union Point are Under 5 Years (103 | 12.3%) for men and 5 to 9 Years (105 | 12.7%) for women.
| Age Bracket | Male | Female |
| Under 5 Years | 103 (12.3%) | 62 (7.5%) |
| 5 to 9 Years | 70 (8.4%) | 105 (12.7%) |
| 10 to 14 Years | 72 (8.6%) | 60 (7.3%) |
| 15 to 19 Years | 46 (5.5%) | 21 (2.5%) |
| 20 to 24 Years | 5 (0.6%) | 35 (4.2%) |
| 25 to 29 Years | 11 (1.3%) | 47 (5.7%) |
| 30 to 34 Years | 64 (7.7%) | 83 (10.1%) |
| 35 to 39 Years | 83 (9.9%) | 83 (10.1%) |
| 40 to 44 Years | 5 (0.6%) | 59 (7.1%) |
| 45 to 49 Years | 9 (1.1%) | 15 (1.8%) |
| 50 to 54 Years | 68 (8.1%) | 21 (2.5%) |
| 55 to 59 Years | 91 (10.9%) | 55 (6.7%) |
| 60 to 64 Years | 33 (4.0%) | 49 (5.9%) |
| 65 to 69 Years | 44 (5.3%) | 57 (6.9%) |
| 70 to 74 Years | 78 (9.3%) | 29 (3.5%) |
| 75 to 79 Years | 21 (2.5%) | 7 (0.9%) |
| 80 to 84 Years | 14 (1.7%) | 10 (1.2%) |
| 85 Years and over | 18 (2.2%) | 28 (3.4%) |
| Total | 835 (100.0%) | 826 (100.0%) |
Families and Households in Union Point
Median Family Size in Union Point
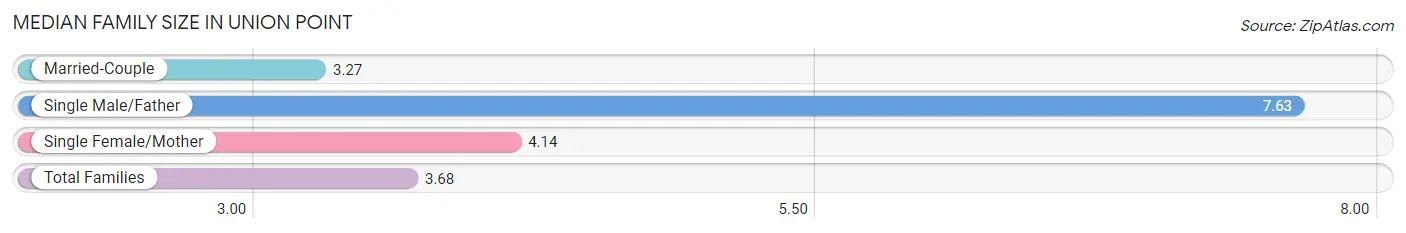
The median family size in Union Point is 3.68 persons per family, with single male/father families (8 | 2.0%) accounting for the largest median family size of 7.63 persons per family. On the other hand, married-couple families (244 | 61.5%) represent the smallest median family size with 3.27 persons per family.
| Family Type | # Families | Family Size |
| Married-Couple | 244 (61.5%) | 3.27 |
| Single Male/Father | 8 (2.0%) | 7.63 |
| Single Female/Mother | 145 (36.5%) | 4.14 |
| Total Families | 397 (100.0%) | 3.68 |
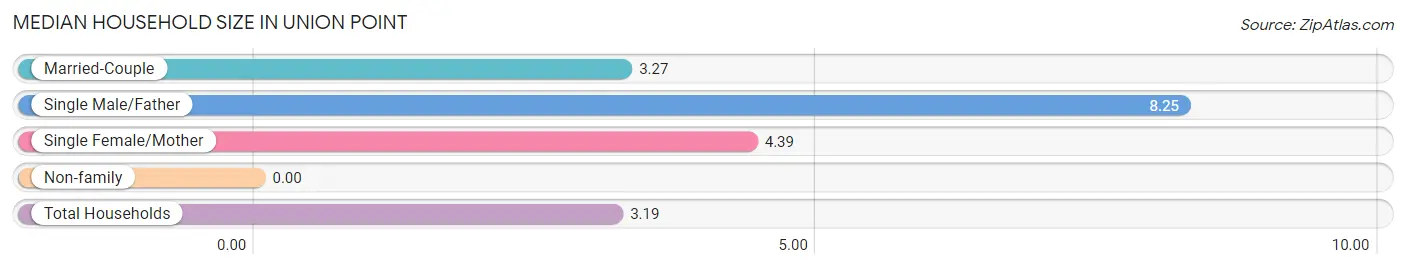
Median Household Size in Union Point
| Household Type | # Households | Household Size |
| Married-Couple | 244 (48.4%) | 3.27 |
| Single Male/Father | 8 (1.6%) | 8.25 |
| Single Female/Mother | 145 (28.8%) | 4.39 |
| Non-family | 107 (21.2%) | - |
| Total Households | 504 (100.0%) | 3.19 |
Household Size by Marriage Status in Union Point
Out of a total of 504 households in Union Point, 397 (78.8%) are family households, while 107 (21.2%) are nonfamily households. The most numerous type of family households are 2-person households, comprising 142, and the most common type of nonfamily households are 1-person households, comprising 107.
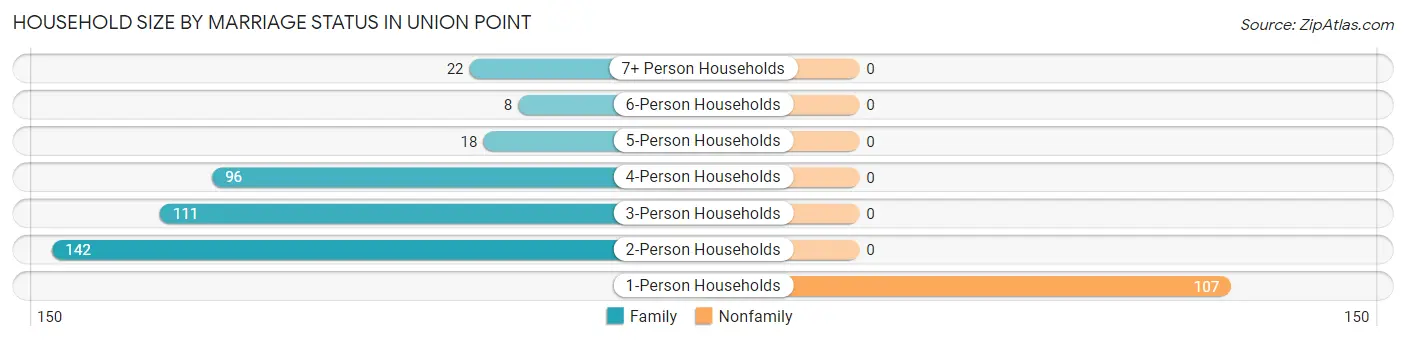
| Household Size | Family Households | Nonfamily Households |
| 1-Person Households | - | 107 (21.2%) |
| 2-Person Households | 142 (28.2%) | 0 (0.0%) |
| 3-Person Households | 111 (22.0%) | 0 (0.0%) |
| 4-Person Households | 96 (19.1%) | 0 (0.0%) |
| 5-Person Households | 18 (3.6%) | 0 (0.0%) |
| 6-Person Households | 8 (1.6%) | 0 (0.0%) |
| 7+ Person Households | 22 (4.4%) | 0 (0.0%) |
| Total | 397 (78.8%) | 107 (21.2%) |
Female Fertility in Union Point
Fertility by Age in Union Point
Average fertility rate in Union Point is 6.0 births per 1,000 women. Women in the age bracket of 35 to 50 years have the highest fertility rate with 13.0 births per 1,000 women. Women in the age bracket of 35 to 50 years acount for 100.0% of all women with births.
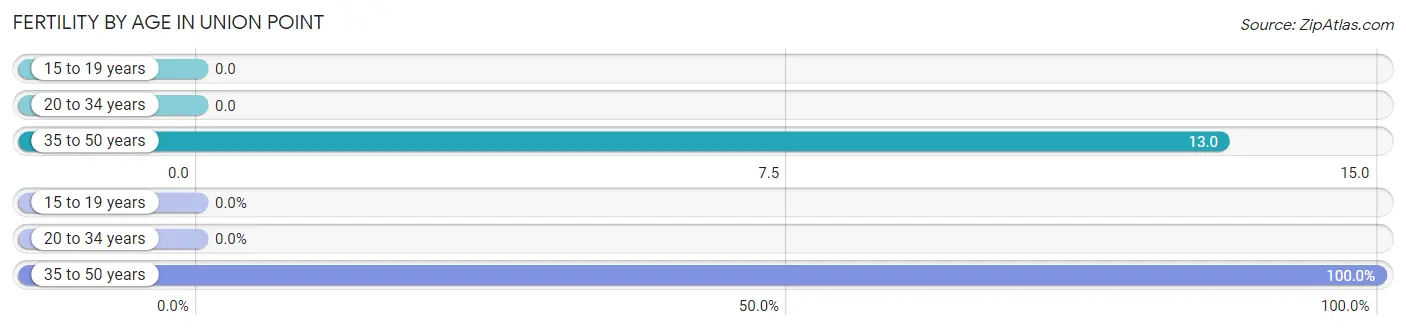
| Age Bracket | Women with Births | Births / 1,000 Women |
| 15 to 19 years | 0 (0.0%) | 0.0 |
| 20 to 34 years | 0 (0.0%) | 0.0 |
| 35 to 50 years | 2 (100.0%) | 13.0 |
| Total | 2 (100.0%) | 6.0 |
Fertility by Age by Marriage Status in Union Point
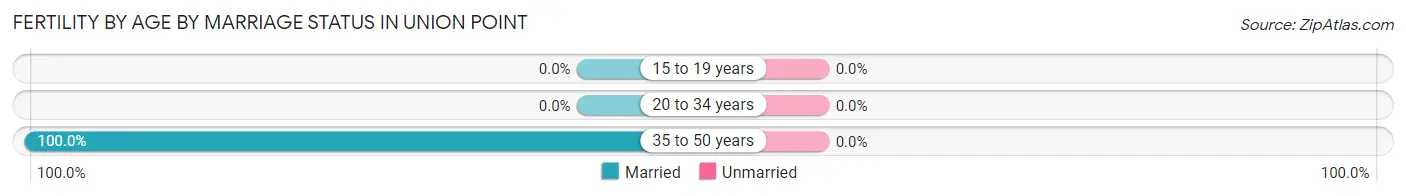
| Age Bracket | Married | Unmarried |
| 15 to 19 years | 0 (0.0%) | 0 (0.0%) |
| 20 to 34 years | 0 (0.0%) | 0 (0.0%) |
| 35 to 50 years | 2 (100.0%) | 0 (0.0%) |
| Total | 2 (100.0%) | 0 (0.0%) |
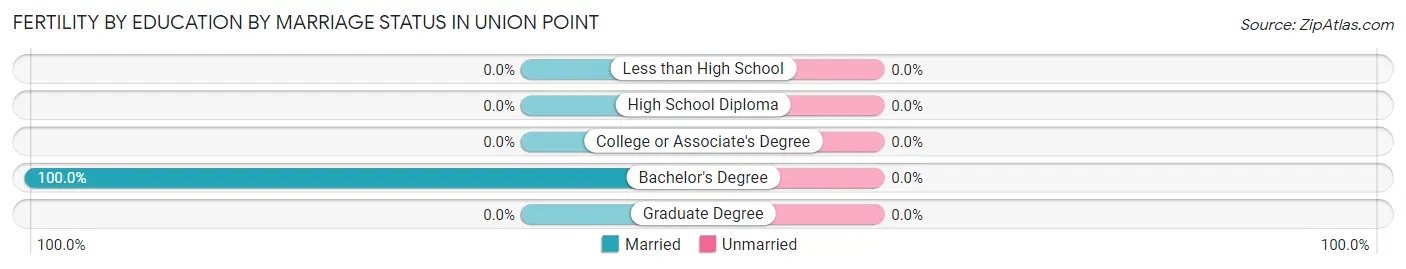
Fertility by Education in Union Point
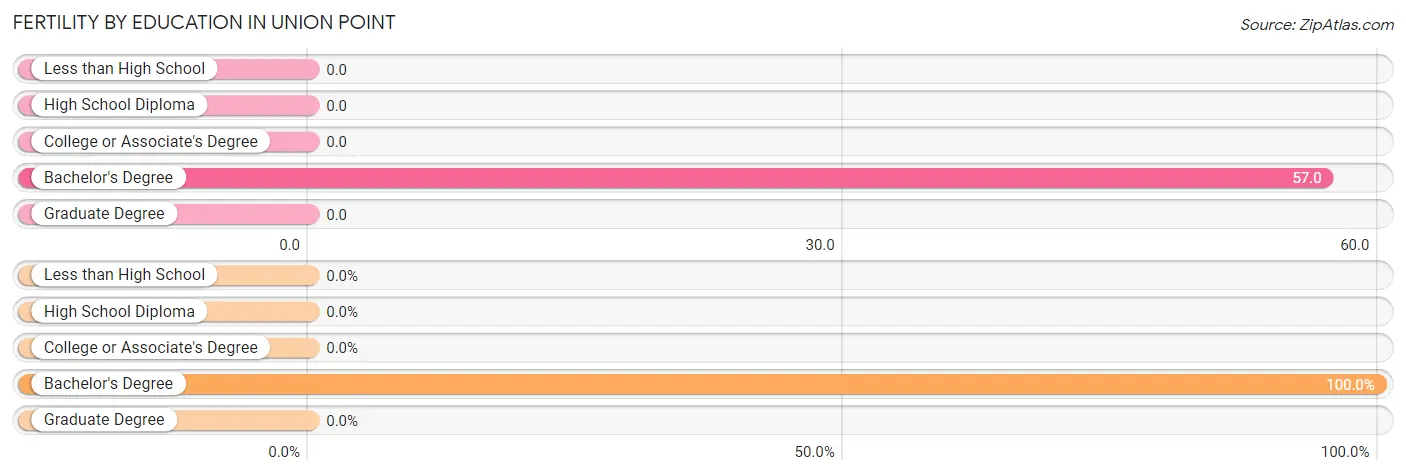
| Educational Attainment | Women with Births | Births / 1,000 Women |
| Less than High School | 0 (0.0%) | 0.0 |
| High School Diploma | 0 (0.0%) | 0.0 |
| College or Associate's Degree | 0 (0.0%) | 0.0 |
| Bachelor's Degree | 2 (100.0%) | 57.0 |
| Graduate Degree | 0 (0.0%) | 0.0 |
| Total | 2 (100.0%) | 6.0 |
Fertility by Education by Marriage Status in Union Point
| Educational Attainment | Married | Unmarried |
| Less than High School | 0 (0.0%) | 0 (0.0%) |
| High School Diploma | 0 (0.0%) | 0 (0.0%) |
| College or Associate's Degree | 0 (0.0%) | 0 (0.0%) |
| Bachelor's Degree | 2 (100.0%) | 0 (0.0%) |
| Graduate Degree | 0 (0.0%) | 0 (0.0%) |
| Total | 2 (100.0%) | 0 (0.0%) |
Employment Characteristics in Union Point
Employment by Class of Employer in Union Point
Among the 614 employed individuals in Union Point, private company employees (420 | 68.4%), local government employees (87 | 14.2%), and state government employees (44 | 7.2%) make up the most common classes of employment.
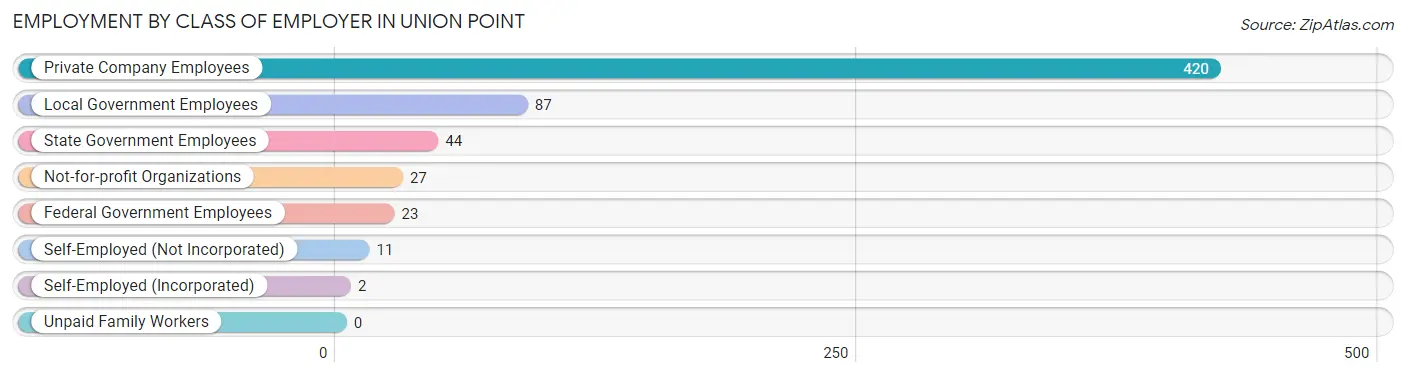
| Employer Class | # Employees | % Employees |
| Private Company Employees | 420 | 68.4% |
| Self-Employed (Incorporated) | 2 | 0.3% |
| Self-Employed (Not Incorporated) | 11 | 1.8% |
| Not-for-profit Organizations | 27 | 4.4% |
| Local Government Employees | 87 | 14.2% |
| State Government Employees | 44 | 7.2% |
| Federal Government Employees | 23 | 3.7% |
| Unpaid Family Workers | 0 | 0.0% |
| Total | 614 | 100.0% |
Employment Status by Age in Union Point
According to the labor force statistics for Union Point, out of the total population over 16 years of age (1,145), 54.7% or 626 individuals are in the labor force, with 0.8% or 5 of them unemployed. The age group with the highest labor force participation rate is 35 to 44 years, with 85.7% or 197 individuals in the labor force. Within the labor force, the 16 to 19 years age range has the highest percentage of unemployed individuals, with 45.5% or 5 of them being unemployed.
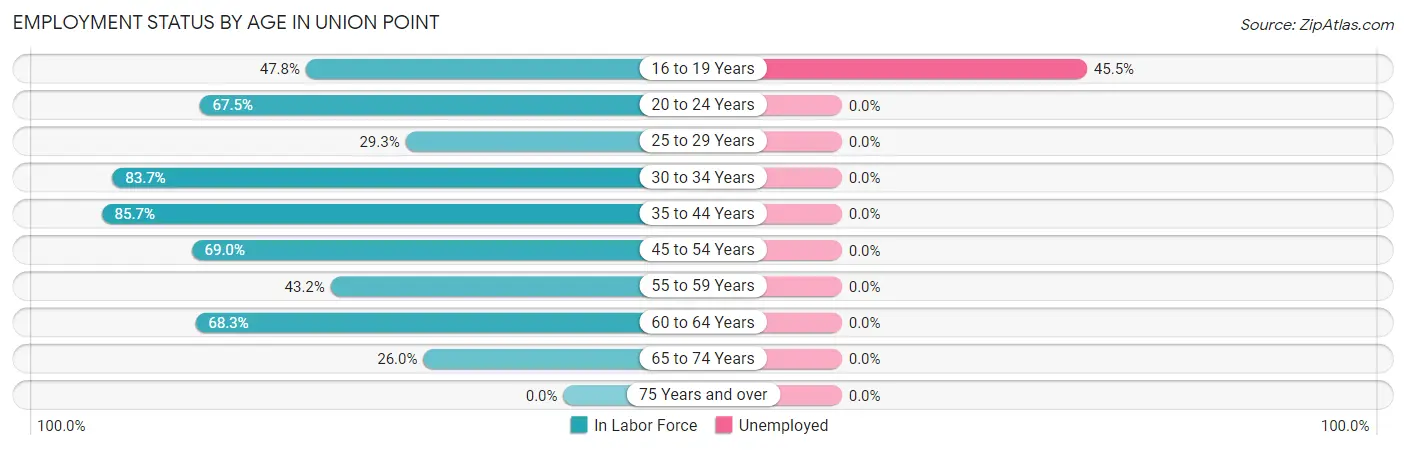
| Age Bracket | In Labor Force | Unemployed |
| 16 to 19 Years | 11 (47.8%) | 5 (45.5%) |
| 20 to 24 Years | 27 (67.5%) | 0 (0.0%) |
| 25 to 29 Years | 17 (29.3%) | 0 (0.0%) |
| 30 to 34 Years | 123 (83.7%) | 0 (0.0%) |
| 35 to 44 Years | 197 (85.7%) | 0 (0.0%) |
| 45 to 54 Years | 78 (69.0%) | 0 (0.0%) |
| 55 to 59 Years | 63 (43.2%) | 0 (0.0%) |
| 60 to 64 Years | 56 (68.3%) | 0 (0.0%) |
| 65 to 74 Years | 54 (26.0%) | 0 (0.0%) |
| 75 Years and over | 0 (0.0%) | 0 (0.0%) |
| Total | 626 (54.7%) | 5 (0.8%) |
Employment Status by Educational Attainment in Union Point
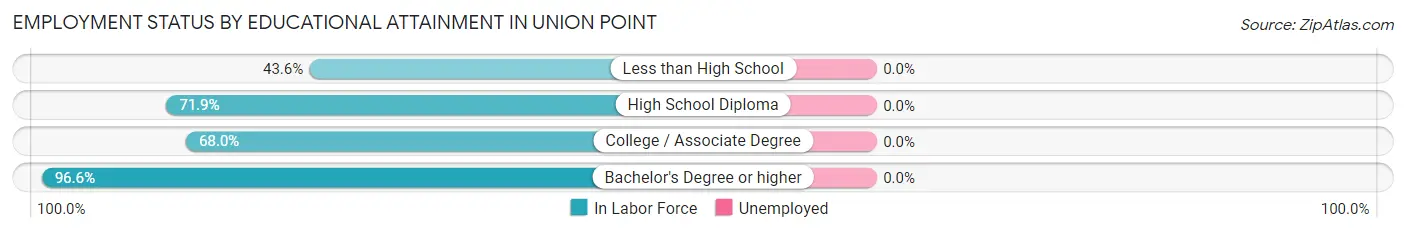
| Educational Attainment | In Labor Force | Unemployed |
| Less than High School | 44 (43.6%) | 0 (0.0%) |
| High School Diploma | 263 (71.9%) | 0 (0.0%) |
| College / Associate Degree | 170 (68.0%) | 0 (0.0%) |
| Bachelor's Degree or higher | 57 (96.6%) | 0 (0.0%) |
| Total | 534 (68.8%) | 0 (0.0%) |
Employment Occupations by Sex in Union Point
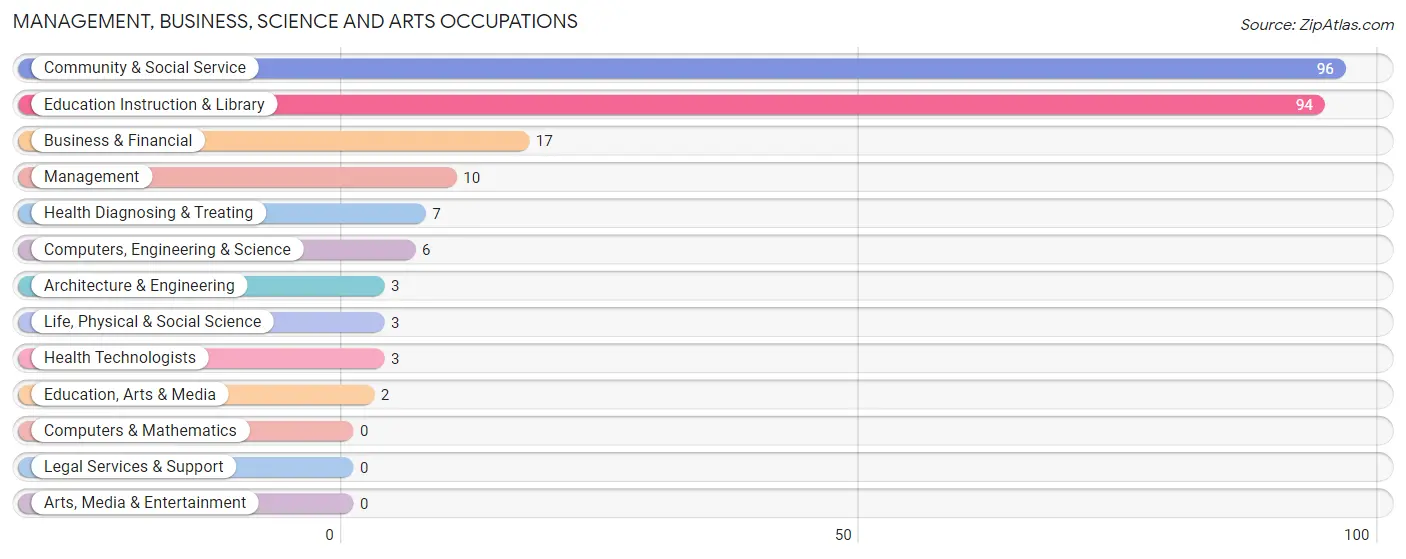
Management, Business, Science and Arts Occupations
The most common Management, Business, Science and Arts occupations in Union Point are Community & Social Service (96 | 15.5%), Education Instruction & Library (94 | 15.1%), Business & Financial (17 | 2.7%), Management (10 | 1.6%), and Health Diagnosing & Treating (7 | 1.1%).
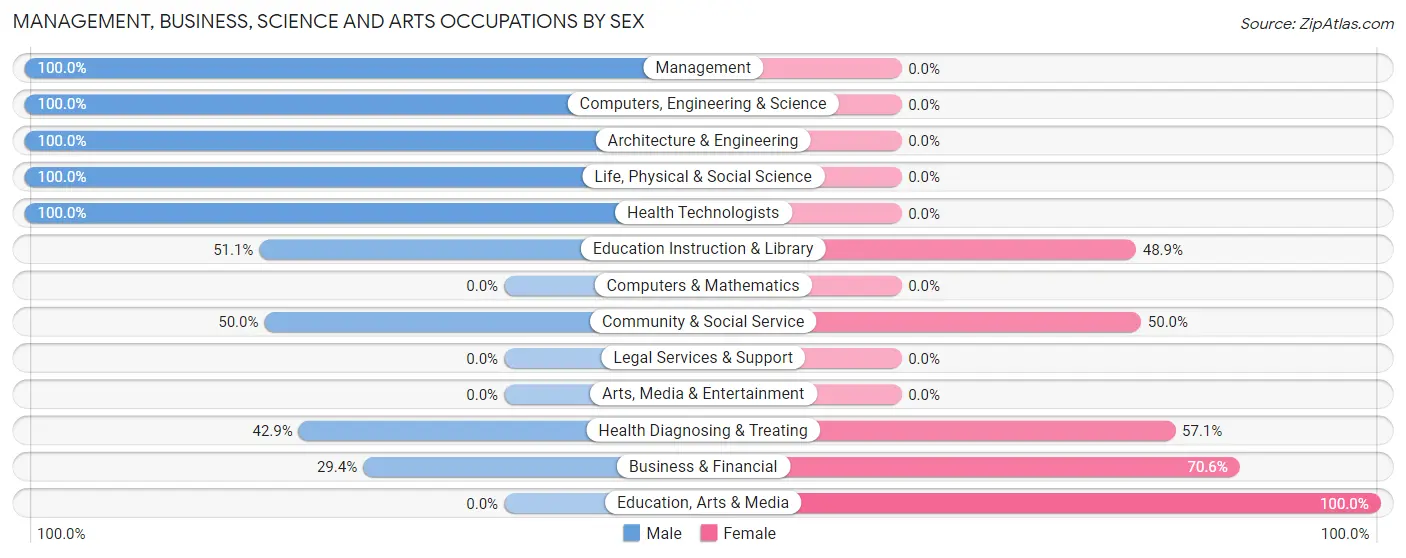
Management, Business, Science and Arts Occupations by Sex
Within the Management, Business, Science and Arts occupations in Union Point, the most male-oriented occupations are Management (100.0%), Computers, Engineering & Science (100.0%), and Architecture & Engineering (100.0%), while the most female-oriented occupations are Education, Arts & Media (100.0%), Business & Financial (70.6%), and Health Diagnosing & Treating (57.1%).
| Occupation | Male | Female |
| Management | 10 (100.0%) | 0 (0.0%) |
| Business & Financial | 5 (29.4%) | 12 (70.6%) |
| Computers, Engineering & Science | 6 (100.0%) | 0 (0.0%) |
| Computers & Mathematics | 0 (0.0%) | 0 (0.0%) |
| Architecture & Engineering | 3 (100.0%) | 0 (0.0%) |
| Life, Physical & Social Science | 3 (100.0%) | 0 (0.0%) |
| Community & Social Service | 48 (50.0%) | 48 (50.0%) |
| Education, Arts & Media | 0 (0.0%) | 2 (100.0%) |
| Legal Services & Support | 0 (0.0%) | 0 (0.0%) |
| Education Instruction & Library | 48 (51.1%) | 46 (48.9%) |
| Arts, Media & Entertainment | 0 (0.0%) | 0 (0.0%) |
| Health Diagnosing & Treating | 3 (42.9%) | 4 (57.1%) |
| Health Technologists | 3 (100.0%) | 0 (0.0%) |
| Total (Category) | 72 (52.9%) | 64 (47.1%) |
| Total (Overall) | 291 (46.9%) | 330 (53.1%) |
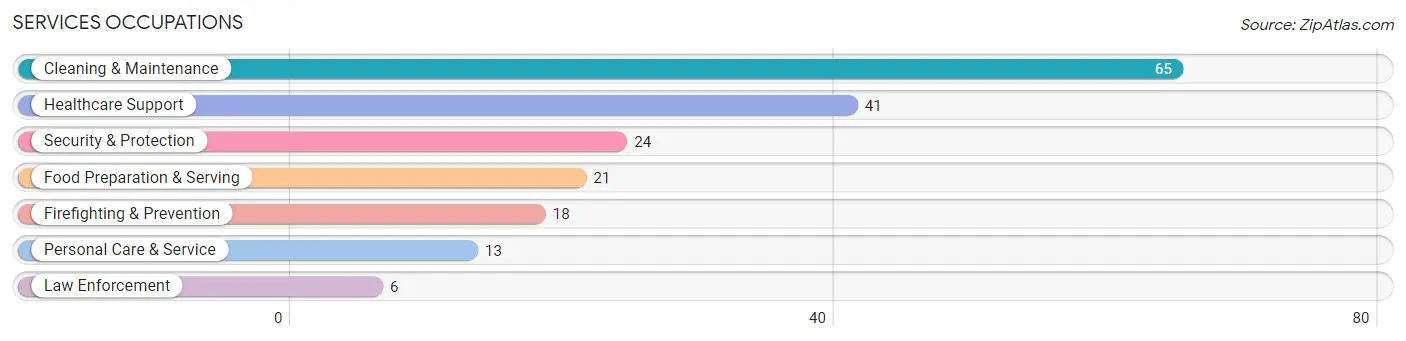
Services Occupations
The most common Services occupations in Union Point are Cleaning & Maintenance (65 | 10.5%), Healthcare Support (41 | 6.6%), Security & Protection (24 | 3.9%), Food Preparation & Serving (21 | 3.4%), and Firefighting & Prevention (18 | 2.9%).
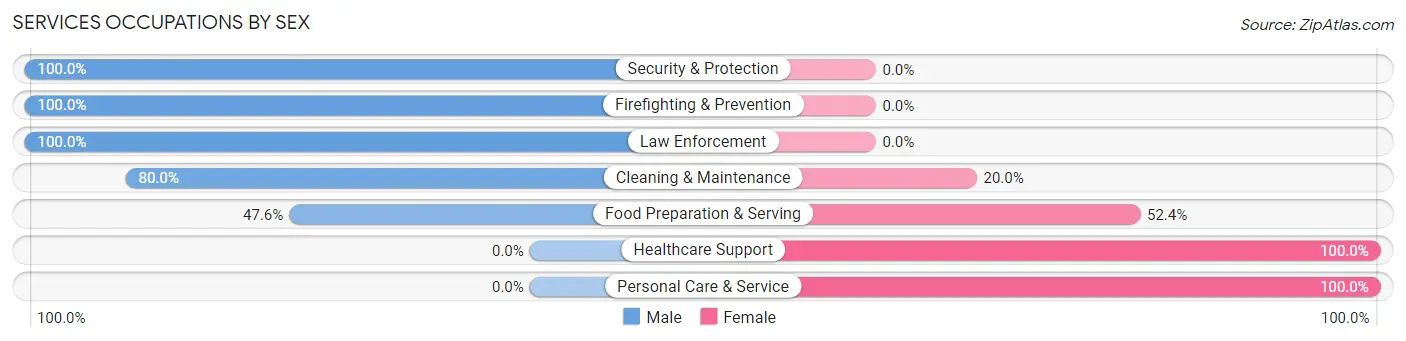
Services Occupations by Sex
Within the Services occupations in Union Point, the most male-oriented occupations are Security & Protection (100.0%), Firefighting & Prevention (100.0%), and Law Enforcement (100.0%), while the most female-oriented occupations are Healthcare Support (100.0%), Personal Care & Service (100.0%), and Food Preparation & Serving (52.4%).
| Occupation | Male | Female |
| Healthcare Support | 0 (0.0%) | 41 (100.0%) |
| Security & Protection | 24 (100.0%) | 0 (0.0%) |
| Firefighting & Prevention | 18 (100.0%) | 0 (0.0%) |
| Law Enforcement | 6 (100.0%) | 0 (0.0%) |
| Food Preparation & Serving | 10 (47.6%) | 11 (52.4%) |
| Cleaning & Maintenance | 52 (80.0%) | 13 (20.0%) |
| Personal Care & Service | 0 (0.0%) | 13 (100.0%) |
| Total (Category) | 86 (52.4%) | 78 (47.6%) |
| Total (Overall) | 291 (46.9%) | 330 (53.1%) |
Sales and Office Occupations
The most common Sales and Office occupations in Union Point are Office & Administration (100 | 16.1%), and Sales & Related (63 | 10.1%).
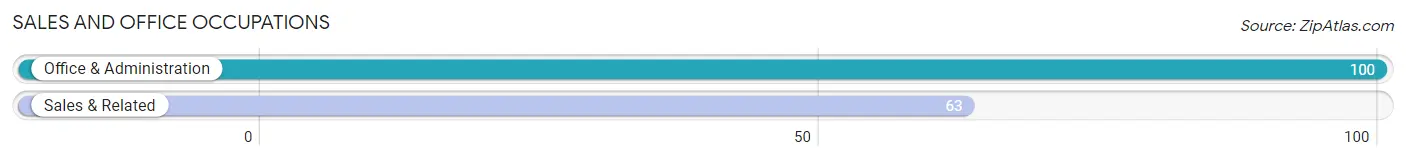
Sales and Office Occupations by Sex
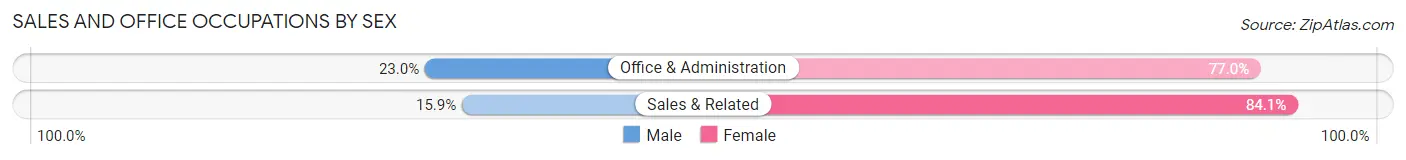
| Occupation | Male | Female |
| Sales & Related | 10 (15.9%) | 53 (84.1%) |
| Office & Administration | 23 (23.0%) | 77 (77.0%) |
| Total (Category) | 33 (20.3%) | 130 (79.7%) |
| Total (Overall) | 291 (46.9%) | 330 (53.1%) |
Natural Resources, Construction and Maintenance Occupations
The most common Natural Resources, Construction and Maintenance occupations in Union Point are Construction & Extraction (30 | 4.8%), and Installation, Maintenance & Repair (18 | 2.9%).
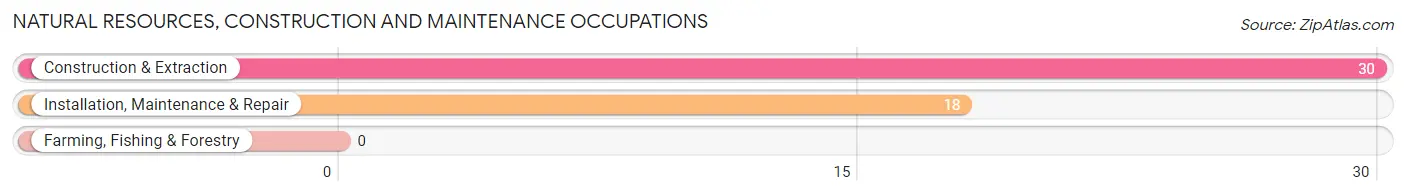
Natural Resources, Construction and Maintenance Occupations by Sex
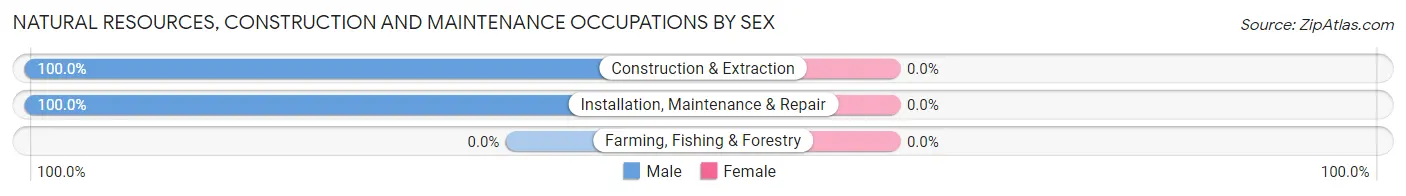
| Occupation | Male | Female |
| Farming, Fishing & Forestry | 0 (0.0%) | 0 (0.0%) |
| Construction & Extraction | 30 (100.0%) | 0 (0.0%) |
| Installation, Maintenance & Repair | 18 (100.0%) | 0 (0.0%) |
| Total (Category) | 48 (100.0%) | 0 (0.0%) |
| Total (Overall) | 291 (46.9%) | 330 (53.1%) |
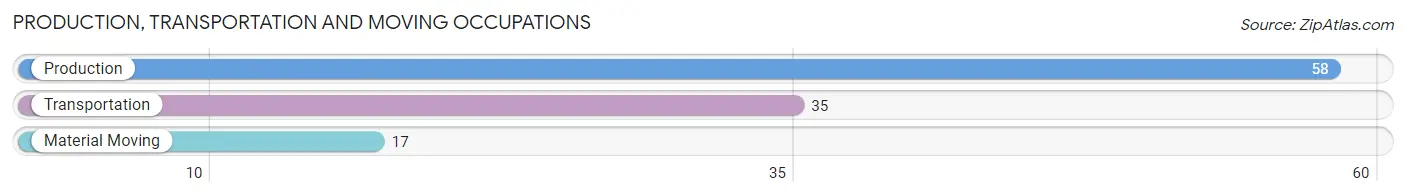
Production, Transportation and Moving Occupations
The most common Production, Transportation and Moving occupations in Union Point are Production (58 | 9.3%), Transportation (35 | 5.6%), and Material Moving (17 | 2.7%).
Production, Transportation and Moving Occupations by Sex
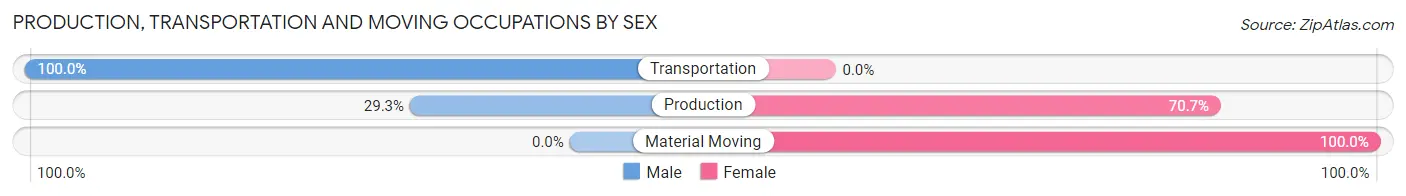
| Occupation | Male | Female |
| Production | 17 (29.3%) | 41 (70.7%) |
| Transportation | 35 (100.0%) | 0 (0.0%) |
| Material Moving | 0 (0.0%) | 17 (100.0%) |
| Total (Category) | 52 (47.3%) | 58 (52.7%) |
| Total (Overall) | 291 (46.9%) | 330 (53.1%) |
Employment Industries by Sex in Union Point
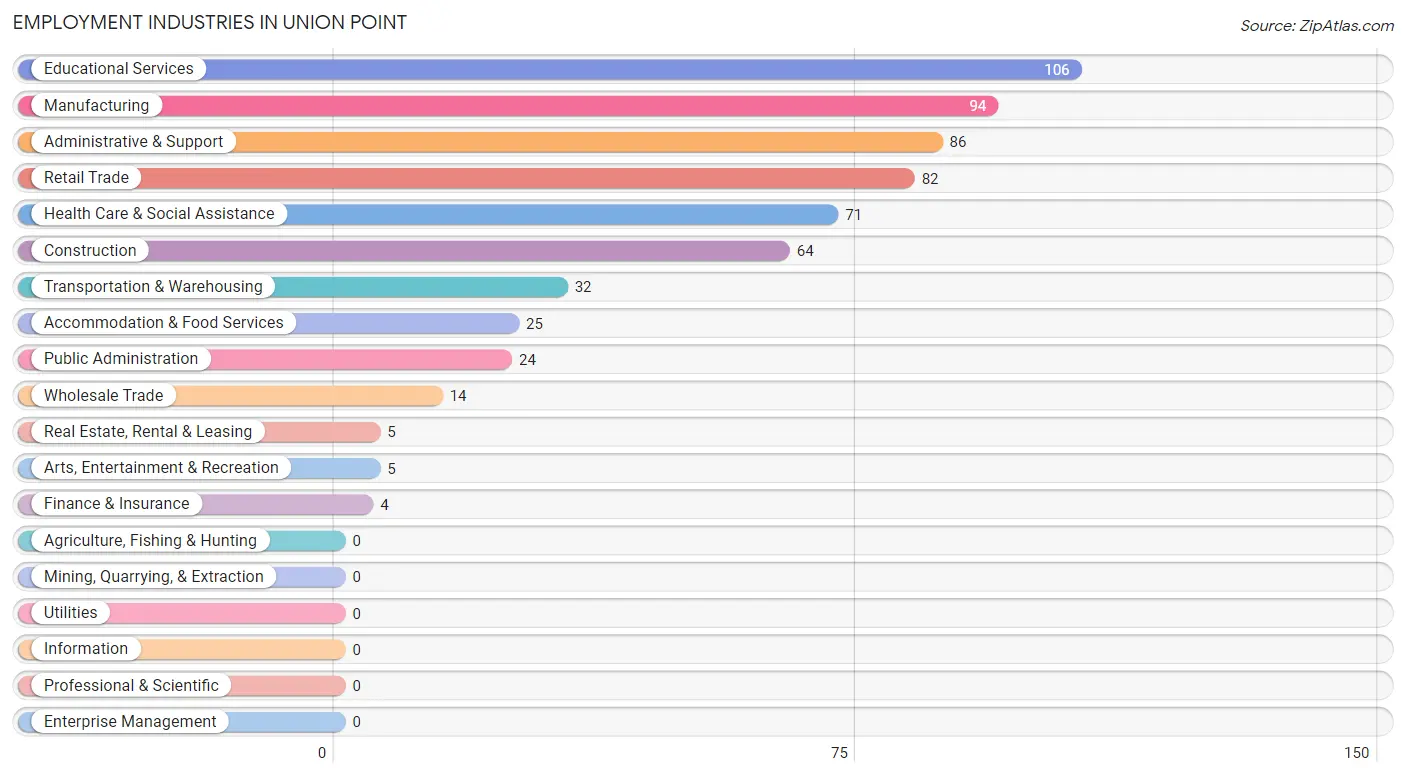
Employment Industries in Union Point
The major employment industries in Union Point include Educational Services (106 | 17.1%), Manufacturing (94 | 15.1%), Administrative & Support (86 | 13.9%), Retail Trade (82 | 13.2%), and Health Care & Social Assistance (71 | 11.4%).
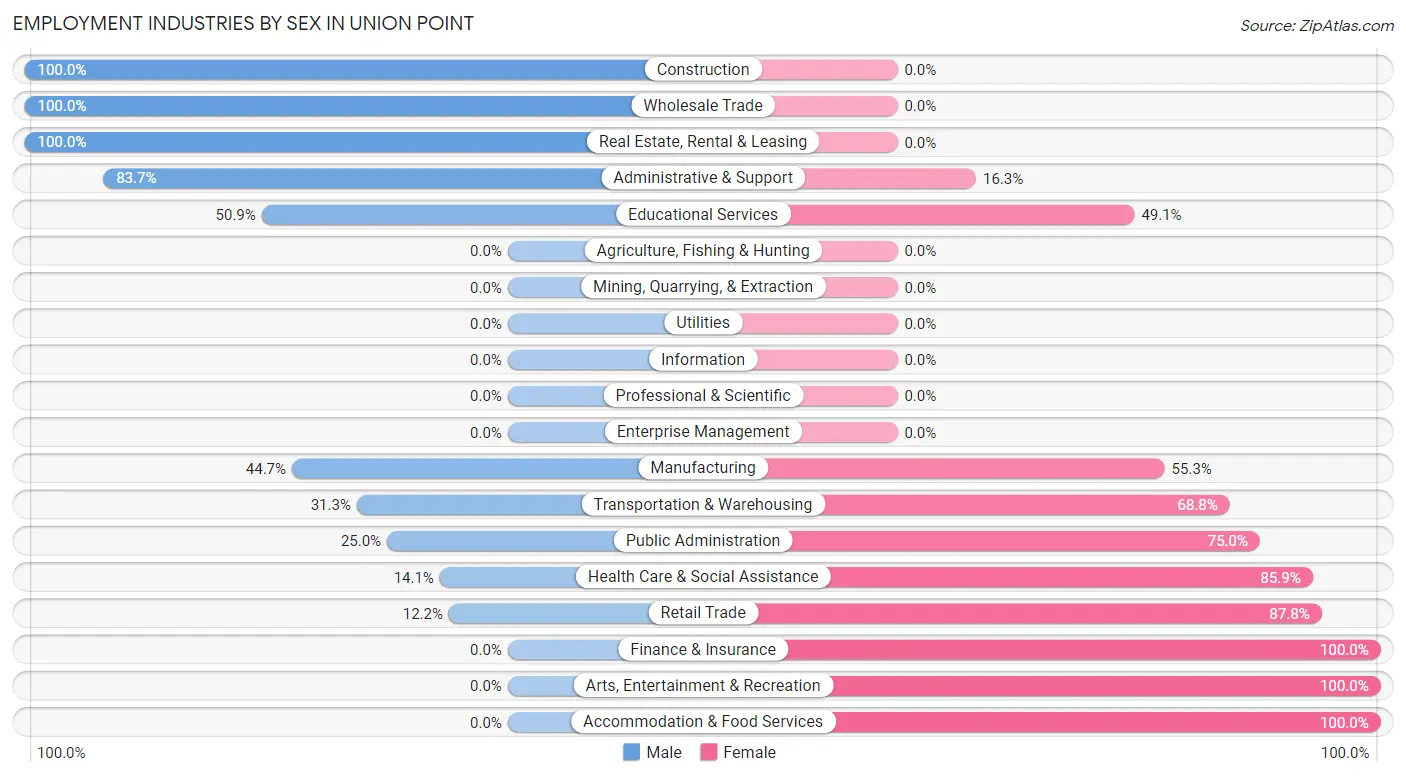
Employment Industries by Sex in Union Point
The Union Point industries that see more men than women are Construction (100.0%), Wholesale Trade (100.0%), and Real Estate, Rental & Leasing (100.0%), whereas the industries that tend to have a higher number of women are Finance & Insurance (100.0%), Arts, Entertainment & Recreation (100.0%), and Accommodation & Food Services (100.0%).
| Industry | Male | Female |
| Agriculture, Fishing & Hunting | 0 (0.0%) | 0 (0.0%) |
| Mining, Quarrying, & Extraction | 0 (0.0%) | 0 (0.0%) |
| Construction | 64 (100.0%) | 0 (0.0%) |
| Manufacturing | 42 (44.7%) | 52 (55.3%) |
| Wholesale Trade | 14 (100.0%) | 0 (0.0%) |
| Retail Trade | 10 (12.2%) | 72 (87.8%) |
| Transportation & Warehousing | 10 (31.2%) | 22 (68.8%) |
| Utilities | 0 (0.0%) | 0 (0.0%) |
| Information | 0 (0.0%) | 0 (0.0%) |
| Finance & Insurance | 0 (0.0%) | 4 (100.0%) |
| Real Estate, Rental & Leasing | 5 (100.0%) | 0 (0.0%) |
| Professional & Scientific | 0 (0.0%) | 0 (0.0%) |
| Enterprise Management | 0 (0.0%) | 0 (0.0%) |
| Administrative & Support | 72 (83.7%) | 14 (16.3%) |
| Educational Services | 54 (50.9%) | 52 (49.1%) |
| Health Care & Social Assistance | 10 (14.1%) | 61 (85.9%) |
| Arts, Entertainment & Recreation | 0 (0.0%) | 5 (100.0%) |
| Accommodation & Food Services | 0 (0.0%) | 25 (100.0%) |
| Public Administration | 6 (25.0%) | 18 (75.0%) |
| Total | 291 (46.9%) | 330 (53.1%) |
Education in Union Point
School Enrollment in Union Point
The most common levels of schooling among the 427 students in Union Point are middle school (112 | 26.2%), elementary school (106 | 24.8%), and kindergarten (96 | 22.5%).
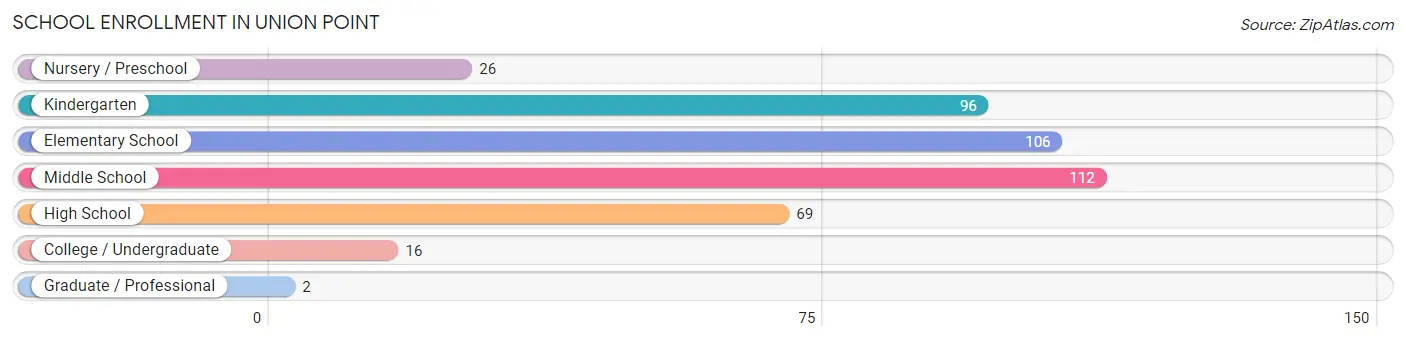
| School Level | # Students | % Students |
| Nursery / Preschool | 26 | 6.1% |
| Kindergarten | 96 | 22.5% |
| Elementary School | 106 | 24.8% |
| Middle School | 112 | 26.2% |
| High School | 69 | 16.2% |
| College / Undergraduate | 16 | 3.7% |
| Graduate / Professional | 2 | 0.5% |
| Total | 427 | 100.0% |
School Enrollment by Age by Funding Source in Union Point
Out of a total of 427 students who are enrolled in schools in Union Point, 58 (13.6%) attend a private institution, while the remaining 369 (86.4%) are enrolled in public schools. The age group of 20 to 24 year olds has the highest likelihood of being enrolled in private schools, with 8 (61.5% in the age bracket) enrolled. Conversely, the age group of 35 years and over has the lowest likelihood of being enrolled in a private school, with 5 (100.0% in the age bracket) attending a public institution.
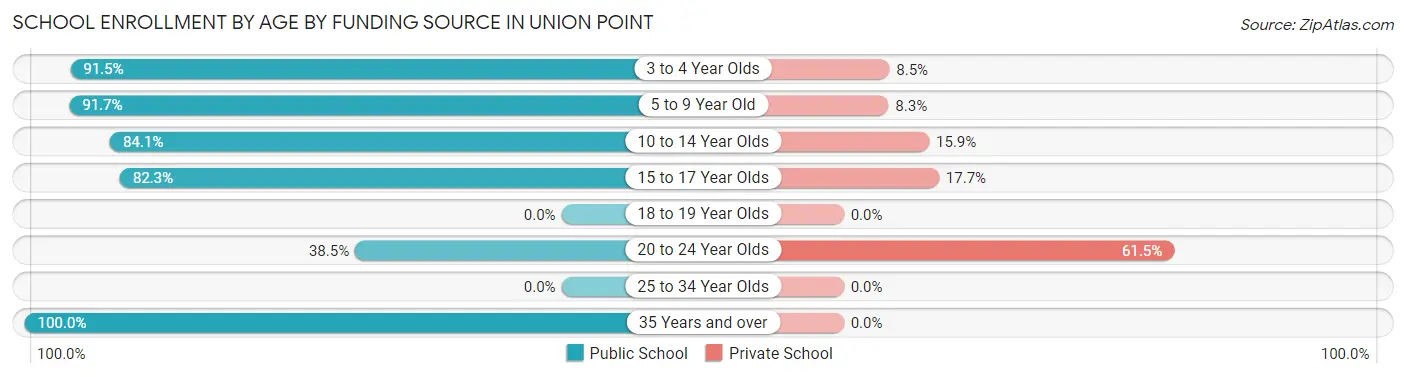
| Age Bracket | Public School | Private School |
| 3 to 4 Year Olds | 43 (91.5%) | 4 (8.5%) |
| 5 to 9 Year Old | 154 (91.7%) | 14 (8.3%) |
| 10 to 14 Year Olds | 111 (84.1%) | 21 (15.9%) |
| 15 to 17 Year Olds | 51 (82.3%) | 11 (17.7%) |
| 18 to 19 Year Olds | 0 (0.0%) | 0 (0.0%) |
| 20 to 24 Year Olds | 5 (38.5%) | 8 (61.5%) |
| 25 to 34 Year Olds | 0 (0.0%) | 0 (0.0%) |
| 35 Years and over | 5 (100.0%) | 0 (0.0%) |
| Total | 369 (86.4%) | 58 (13.6%) |
Educational Attainment by Field of Study in Union Point
Arts & humanities (18 | 23.7%), education (15 | 19.7%), business (14 | 18.4%), social sciences (12 | 15.8%), and communications (8 | 10.5%) are the most common fields of study among 76 individuals in Union Point who have obtained a bachelor's degree or higher.
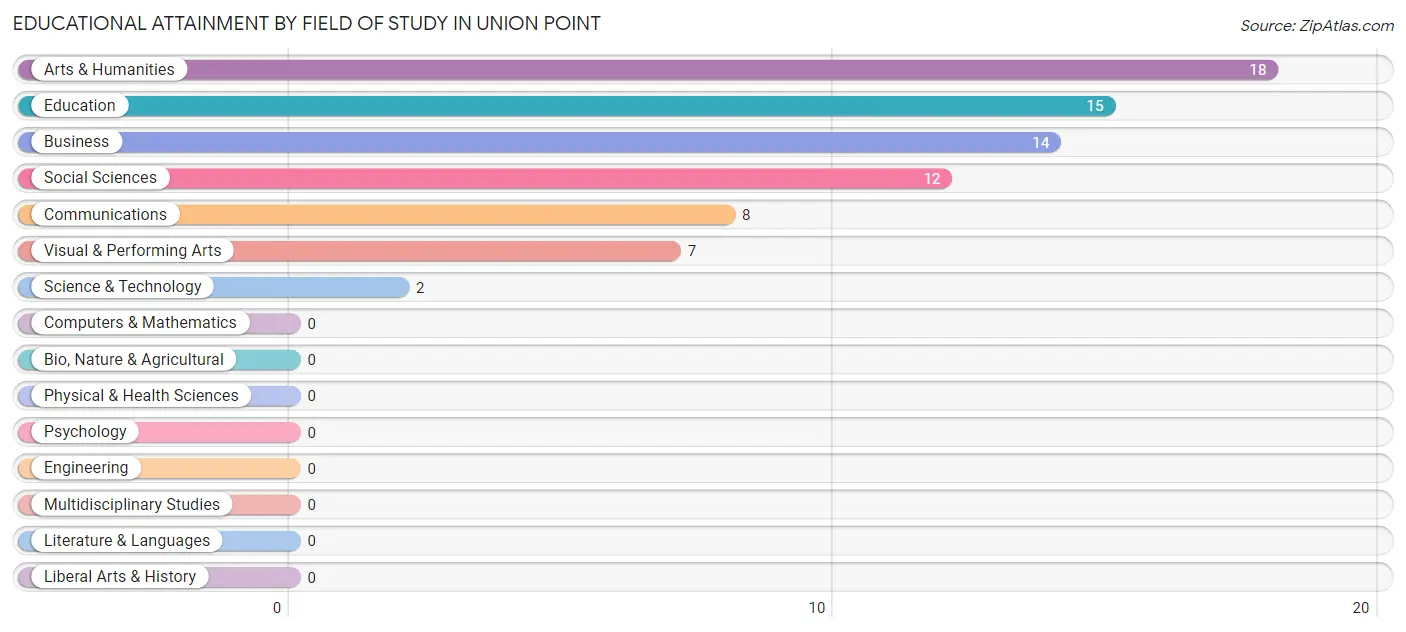
| Field of Study | # Graduates | % Graduates |
| Computers & Mathematics | 0 | 0.0% |
| Bio, Nature & Agricultural | 0 | 0.0% |
| Physical & Health Sciences | 0 | 0.0% |
| Psychology | 0 | 0.0% |
| Social Sciences | 12 | 15.8% |
| Engineering | 0 | 0.0% |
| Multidisciplinary Studies | 0 | 0.0% |
| Science & Technology | 2 | 2.6% |
| Business | 14 | 18.4% |
| Education | 15 | 19.7% |
| Literature & Languages | 0 | 0.0% |
| Liberal Arts & History | 0 | 0.0% |
| Visual & Performing Arts | 7 | 9.2% |
| Communications | 8 | 10.5% |
| Arts & Humanities | 18 | 23.7% |
| Total | 76 | 100.0% |
Transportation & Commute in Union Point
Vehicle Availability by Sex in Union Point
The most prevalent vehicle ownership categories in Union Point are males with 4 vehicles (86, accounting for 29.5%) and females with 4 vehicles (25, making up 26.6%).
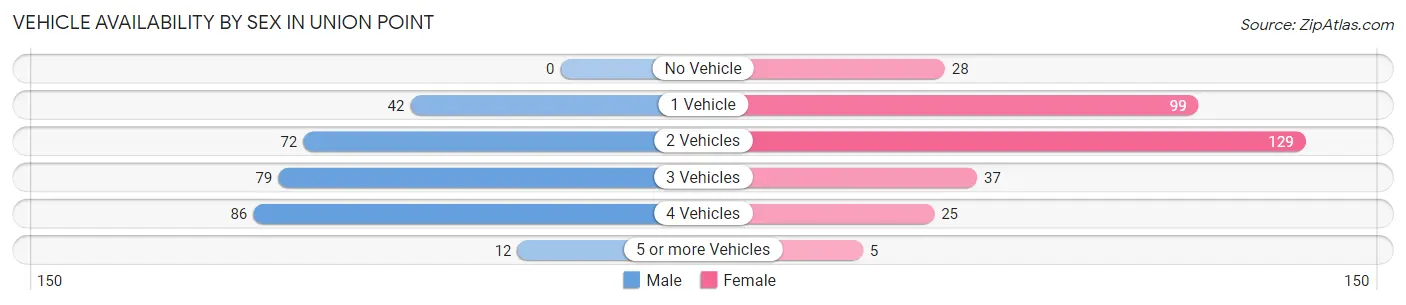
| Vehicles Available | Male | Female |
| No Vehicle | 0 (0.0%) | 28 (8.7%) |
| 1 Vehicle | 42 (14.4%) | 99 (30.6%) |
| 2 Vehicles | 72 (24.7%) | 129 (39.9%) |
| 3 Vehicles | 79 (27.2%) | 37 (11.5%) |
| 4 Vehicles | 86 (29.5%) | 25 (7.7%) |
| 5 or more Vehicles | 12 (4.1%) | 5 (1.5%) |
| Total | 291 (100.0%) | 323 (100.0%) |
Commute Time in Union Point
The most frequently occuring commute durations in Union Point are 30 to 34 minutes (105 commuters, 17.8%), 15 to 19 minutes (103 commuters, 17.5%), and 20 to 24 minutes (70 commuters, 11.9%).
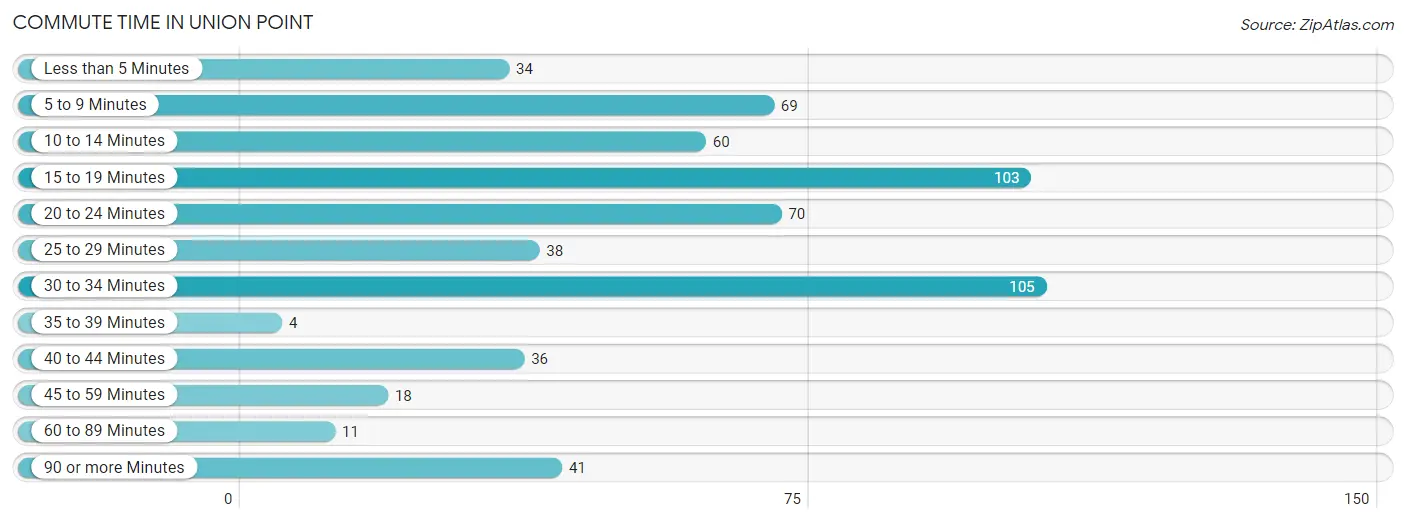
| Commute Time | # Commuters | % Commuters |
| Less than 5 Minutes | 34 | 5.8% |
| 5 to 9 Minutes | 69 | 11.7% |
| 10 to 14 Minutes | 60 | 10.2% |
| 15 to 19 Minutes | 103 | 17.5% |
| 20 to 24 Minutes | 70 | 11.9% |
| 25 to 29 Minutes | 38 | 6.5% |
| 30 to 34 Minutes | 105 | 17.8% |
| 35 to 39 Minutes | 4 | 0.7% |
| 40 to 44 Minutes | 36 | 6.1% |
| 45 to 59 Minutes | 18 | 3.1% |
| 60 to 89 Minutes | 11 | 1.9% |
| 90 or more Minutes | 41 | 7.0% |
Commute Time by Sex in Union Point
The most common commute times in Union Point are 20 to 24 minutes (63 commuters, 22.3%) for males and 30 to 34 minutes (97 commuters, 31.7%) for females.
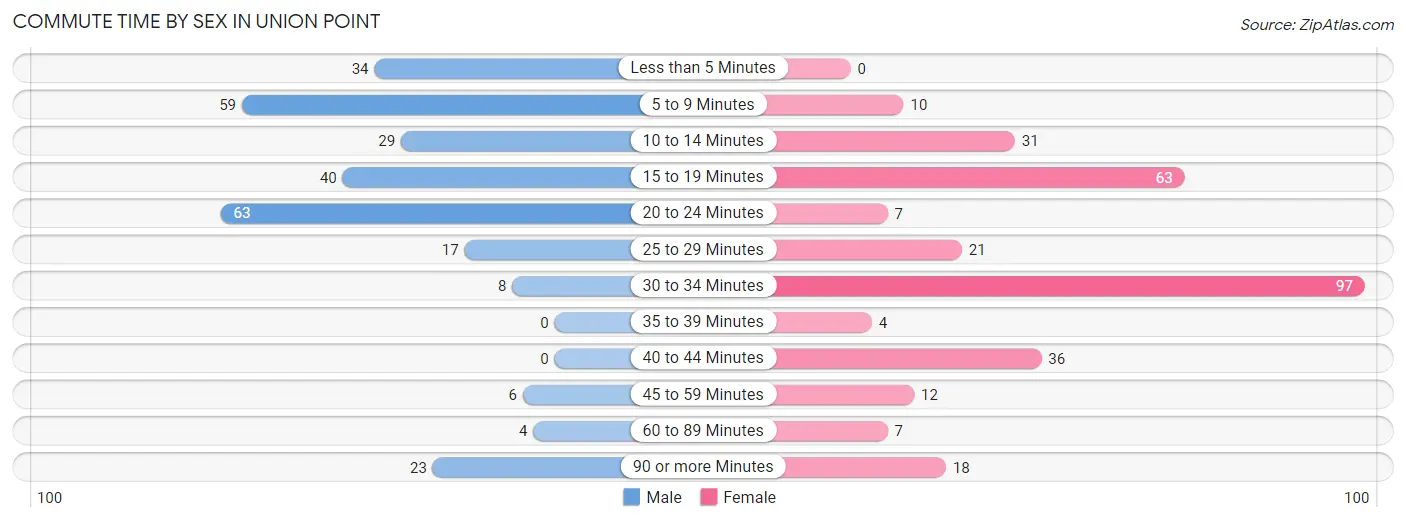
| Commute Time | Male | Female |
| Less than 5 Minutes | 34 (12.0%) | 0 (0.0%) |
| 5 to 9 Minutes | 59 (20.8%) | 10 (3.3%) |
| 10 to 14 Minutes | 29 (10.2%) | 31 (10.1%) |
| 15 to 19 Minutes | 40 (14.1%) | 63 (20.6%) |
| 20 to 24 Minutes | 63 (22.3%) | 7 (2.3%) |
| 25 to 29 Minutes | 17 (6.0%) | 21 (6.9%) |
| 30 to 34 Minutes | 8 (2.8%) | 97 (31.7%) |
| 35 to 39 Minutes | 0 (0.0%) | 4 (1.3%) |
| 40 to 44 Minutes | 0 (0.0%) | 36 (11.8%) |
| 45 to 59 Minutes | 6 (2.1%) | 12 (3.9%) |
| 60 to 89 Minutes | 4 (1.4%) | 7 (2.3%) |
| 90 or more Minutes | 23 (8.1%) | 18 (5.9%) |
Time of Departure to Work by Sex in Union Point
The most frequent times of departure to work in Union Point are 6:00 AM to 6:29 AM (127, 44.9%) for males and 7:00 AM to 7:29 AM (70, 22.9%) for females.
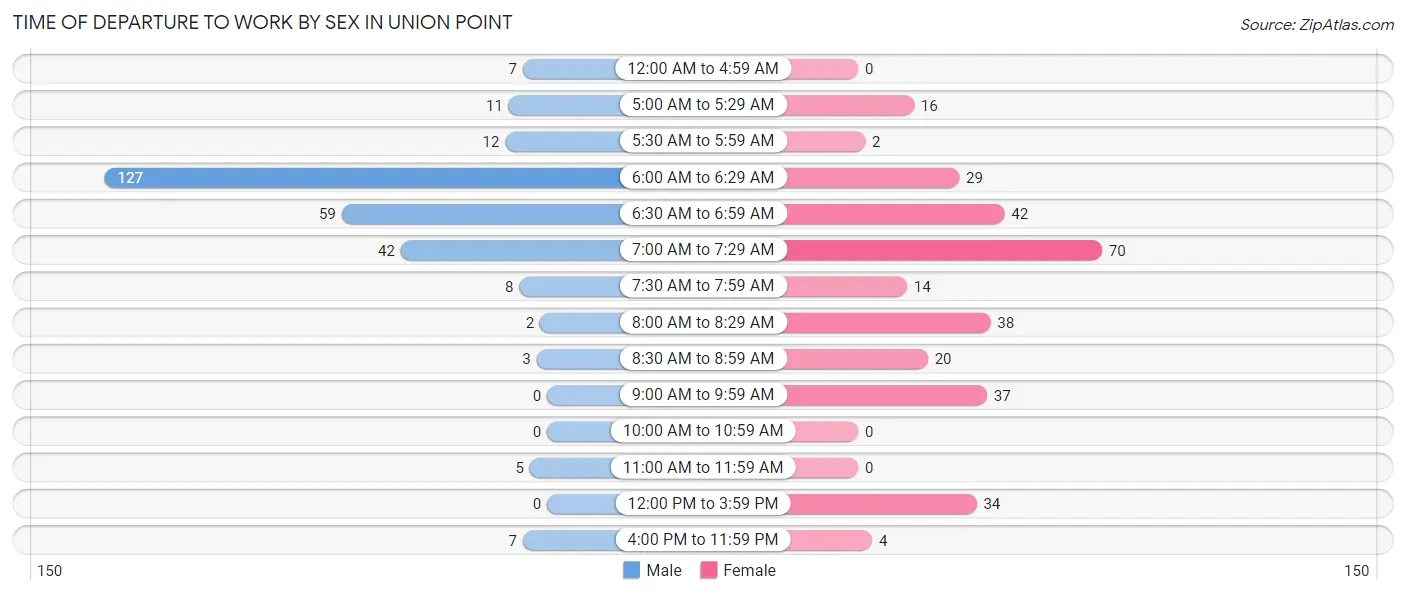
| Time of Departure | Male | Female |
| 12:00 AM to 4:59 AM | 7 (2.5%) | 0 (0.0%) |
| 5:00 AM to 5:29 AM | 11 (3.9%) | 16 (5.2%) |
| 5:30 AM to 5:59 AM | 12 (4.2%) | 2 (0.6%) |
| 6:00 AM to 6:29 AM | 127 (44.9%) | 29 (9.5%) |
| 6:30 AM to 6:59 AM | 59 (20.8%) | 42 (13.7%) |
| 7:00 AM to 7:29 AM | 42 (14.8%) | 70 (22.9%) |
| 7:30 AM to 7:59 AM | 8 (2.8%) | 14 (4.6%) |
| 8:00 AM to 8:29 AM | 2 (0.7%) | 38 (12.4%) |
| 8:30 AM to 8:59 AM | 3 (1.1%) | 20 (6.5%) |
| 9:00 AM to 9:59 AM | 0 (0.0%) | 37 (12.1%) |
| 10:00 AM to 10:59 AM | 0 (0.0%) | 0 (0.0%) |
| 11:00 AM to 11:59 AM | 5 (1.8%) | 0 (0.0%) |
| 12:00 PM to 3:59 PM | 0 (0.0%) | 34 (11.1%) |
| 4:00 PM to 11:59 PM | 7 (2.5%) | 4 (1.3%) |
| Total | 283 (100.0%) | 306 (100.0%) |
Housing Occupancy in Union Point
Occupancy by Ownership in Union Point
Of the total 504 dwellings in Union Point, owner-occupied units account for 285 (56.6%), while renter-occupied units make up 219 (43.4%).
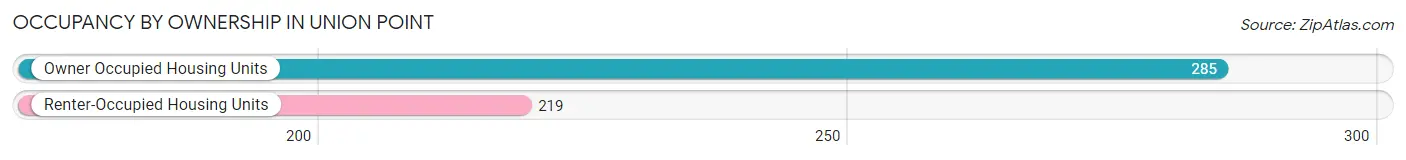
| Occupancy | # Housing Units | % Housing Units |
| Owner Occupied Housing Units | 285 | 56.6% |
| Renter-Occupied Housing Units | 219 | 43.4% |
| Total Occupied Housing Units | 504 | 100.0% |
Occupancy by Household Size in Union Point
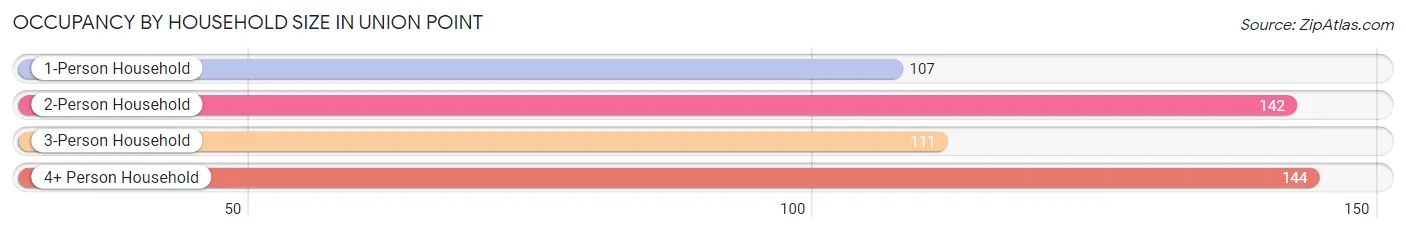
| Household Size | # Housing Units | % Housing Units |
| 1-Person Household | 107 | 21.2% |
| 2-Person Household | 142 | 28.2% |
| 3-Person Household | 111 | 22.0% |
| 4+ Person Household | 144 | 28.6% |
| Total Housing Units | 504 | 100.0% |
Occupancy by Ownership by Household Size in Union Point
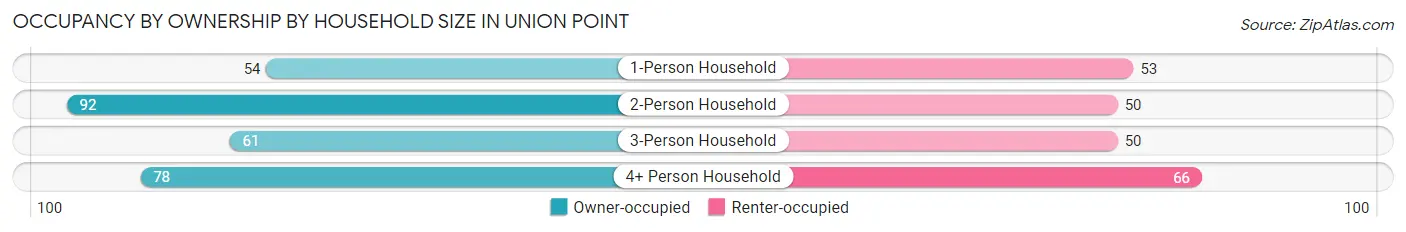
| Household Size | Owner-occupied | Renter-occupied |
| 1-Person Household | 54 (50.5%) | 53 (49.5%) |
| 2-Person Household | 92 (64.8%) | 50 (35.2%) |
| 3-Person Household | 61 (54.9%) | 50 (45.1%) |
| 4+ Person Household | 78 (54.2%) | 66 (45.8%) |
| Total Housing Units | 285 (56.6%) | 219 (43.4%) |
Occupancy by Educational Attainment in Union Point
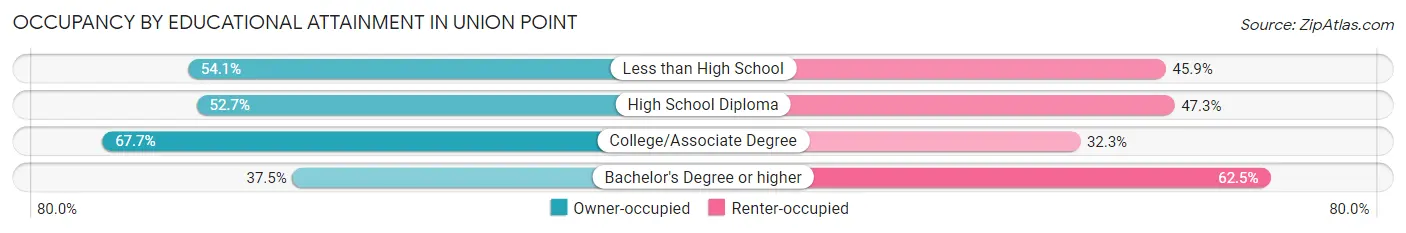
| Household Size | Owner-occupied | Renter-occupied |
| Less than High School | 33 (54.1%) | 28 (45.9%) |
| High School Diploma | 126 (52.7%) | 113 (47.3%) |
| College/Associate Degree | 111 (67.7%) | 53 (32.3%) |
| Bachelor's Degree or higher | 15 (37.5%) | 25 (62.5%) |
Occupancy by Age of Householder in Union Point
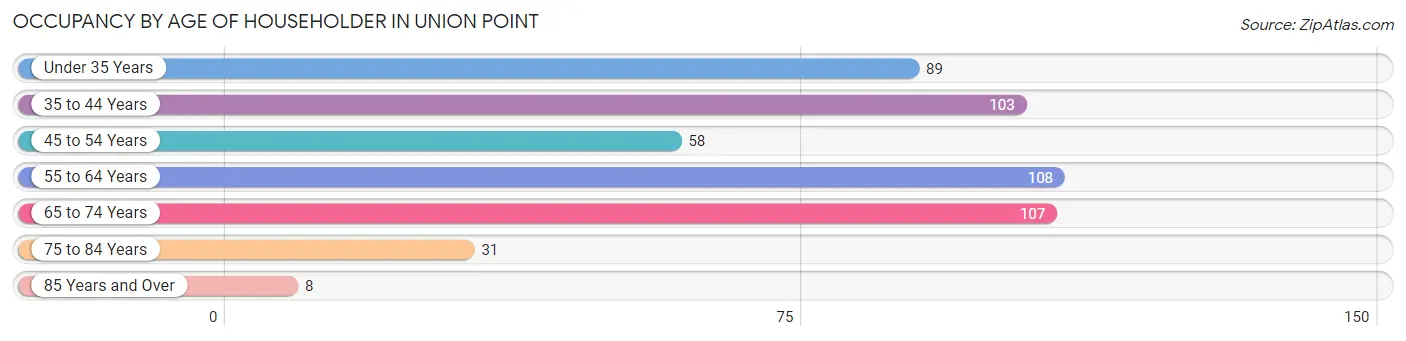
| Age Bracket | # Households | % Households |
| Under 35 Years | 89 | 17.7% |
| 35 to 44 Years | 103 | 20.4% |
| 45 to 54 Years | 58 | 11.5% |
| 55 to 64 Years | 108 | 21.4% |
| 65 to 74 Years | 107 | 21.2% |
| 75 to 84 Years | 31 | 6.1% |
| 85 Years and Over | 8 | 1.6% |
| Total | 504 | 100.0% |
Housing Finances in Union Point
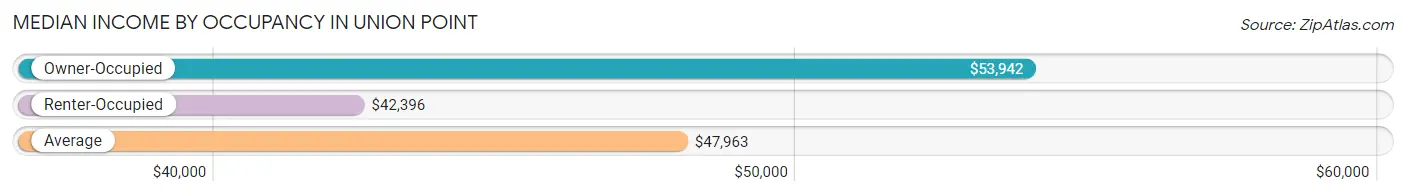
Median Income by Occupancy in Union Point
| Occupancy Type | # Households | Median Income |
| Owner-Occupied | 285 (56.6%) | $53,942 |
| Renter-Occupied | 219 (43.4%) | $42,396 |
| Average | 504 (100.0%) | $47,963 |
Occupancy by Householder Income Bracket in Union Point
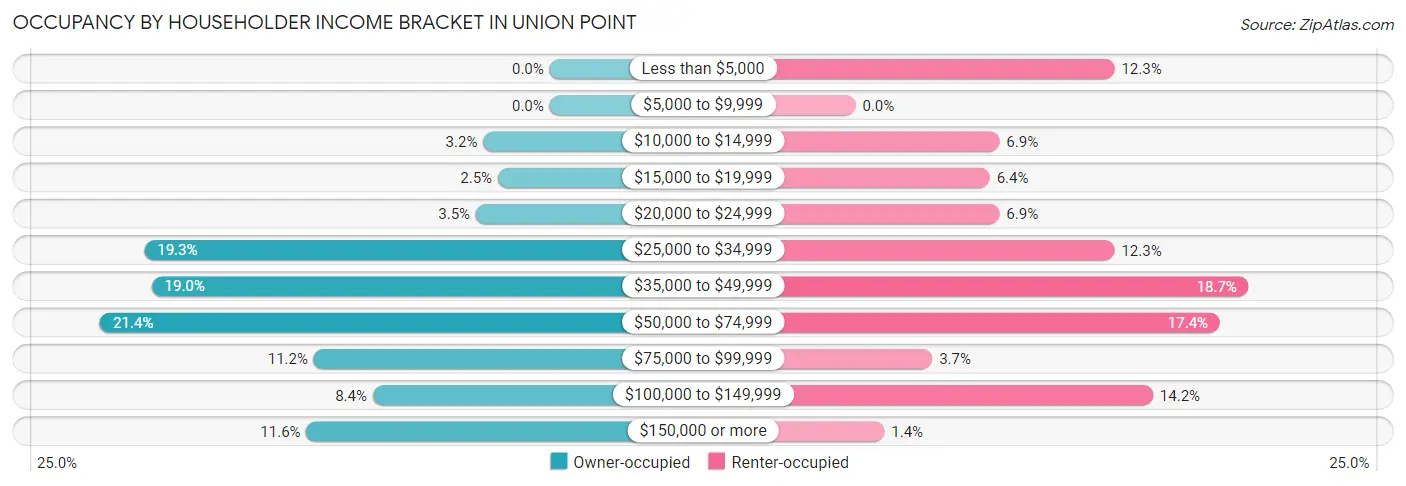
| Income Bracket | Owner-occupied | Renter-occupied |
| Less than $5,000 | 0 (0.0%) | 27 (12.3%) |
| $5,000 to $9,999 | 0 (0.0%) | 0 (0.0%) |
| $10,000 to $14,999 | 9 (3.2%) | 15 (6.9%) |
| $15,000 to $19,999 | 7 (2.5%) | 14 (6.4%) |
| $20,000 to $24,999 | 10 (3.5%) | 15 (6.9%) |
| $25,000 to $34,999 | 55 (19.3%) | 27 (12.3%) |
| $35,000 to $49,999 | 54 (19.0%) | 41 (18.7%) |
| $50,000 to $74,999 | 61 (21.4%) | 38 (17.3%) |
| $75,000 to $99,999 | 32 (11.2%) | 8 (3.6%) |
| $100,000 to $149,999 | 24 (8.4%) | 31 (14.2%) |
| $150,000 or more | 33 (11.6%) | 3 (1.4%) |
| Total | 285 (100.0%) | 219 (100.0%) |
Monthly Housing Cost Tiers in Union Point
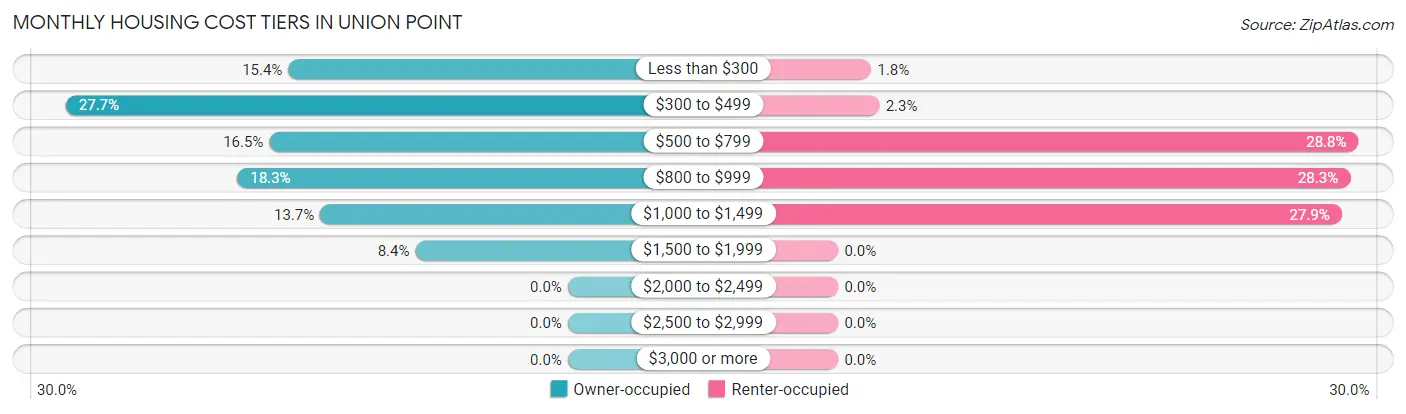
| Monthly Cost | Owner-occupied | Renter-occupied |
| Less than $300 | 44 (15.4%) | 4 (1.8%) |
| $300 to $499 | 79 (27.7%) | 5 (2.3%) |
| $500 to $799 | 47 (16.5%) | 63 (28.8%) |
| $800 to $999 | 52 (18.2%) | 62 (28.3%) |
| $1,000 to $1,499 | 39 (13.7%) | 61 (27.9%) |
| $1,500 to $1,999 | 24 (8.4%) | 0 (0.0%) |
| $2,000 to $2,499 | 0 (0.0%) | 0 (0.0%) |
| $2,500 to $2,999 | 0 (0.0%) | 0 (0.0%) |
| $3,000 or more | 0 (0.0%) | 0 (0.0%) |
| Total | 285 (100.0%) | 219 (100.0%) |
Physical Housing Characteristics in Union Point
Housing Structures in Union Point
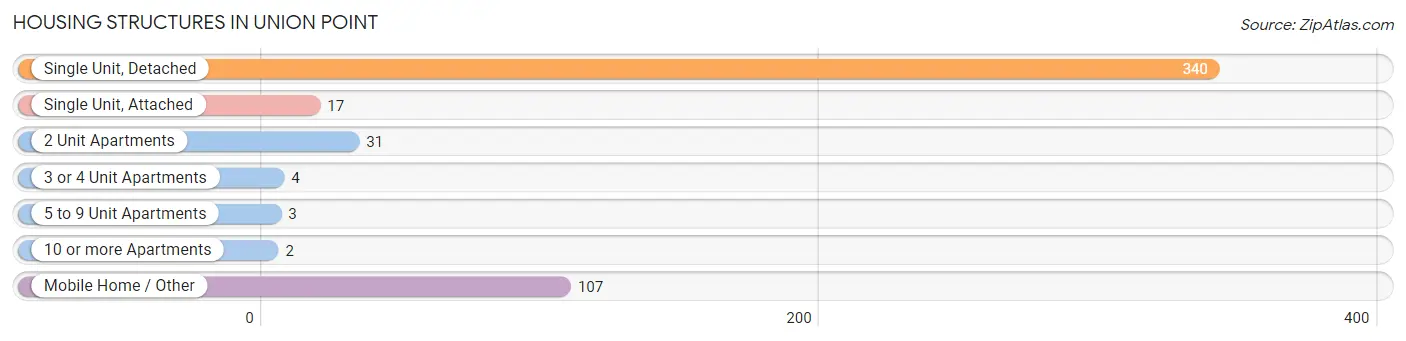
| Structure Type | # Housing Units | % Housing Units |
| Single Unit, Detached | 340 | 67.5% |
| Single Unit, Attached | 17 | 3.4% |
| 2 Unit Apartments | 31 | 6.1% |
| 3 or 4 Unit Apartments | 4 | 0.8% |
| 5 to 9 Unit Apartments | 3 | 0.6% |
| 10 or more Apartments | 2 | 0.4% |
| Mobile Home / Other | 107 | 21.2% |
| Total | 504 | 100.0% |
Housing Structures by Occupancy in Union Point
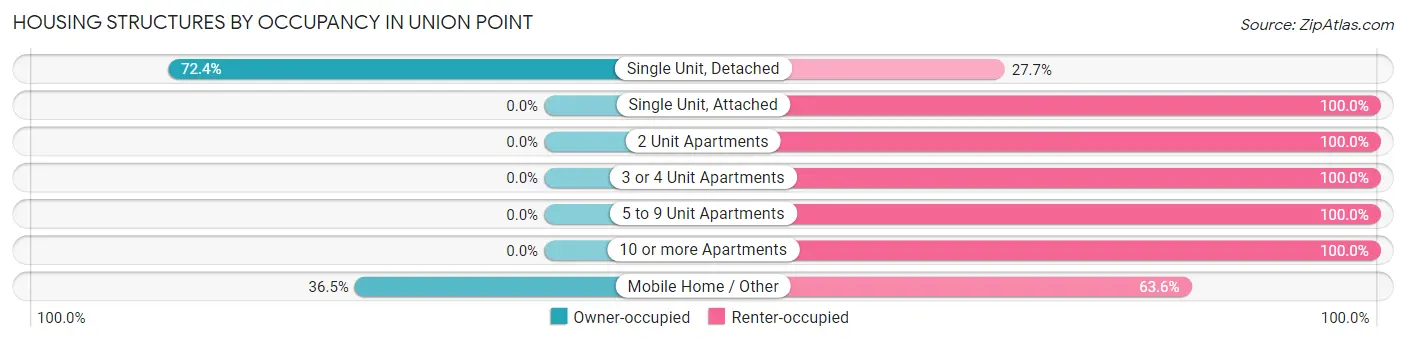
| Structure Type | Owner-occupied | Renter-occupied |
| Single Unit, Detached | 246 (72.4%) | 94 (27.7%) |
| Single Unit, Attached | 0 (0.0%) | 17 (100.0%) |
| 2 Unit Apartments | 0 (0.0%) | 31 (100.0%) |
| 3 or 4 Unit Apartments | 0 (0.0%) | 4 (100.0%) |
| 5 to 9 Unit Apartments | 0 (0.0%) | 3 (100.0%) |
| 10 or more Apartments | 0 (0.0%) | 2 (100.0%) |
| Mobile Home / Other | 39 (36.4%) | 68 (63.5%) |
| Total | 285 (56.6%) | 219 (43.4%) |
Housing Structures by Number of Rooms in Union Point
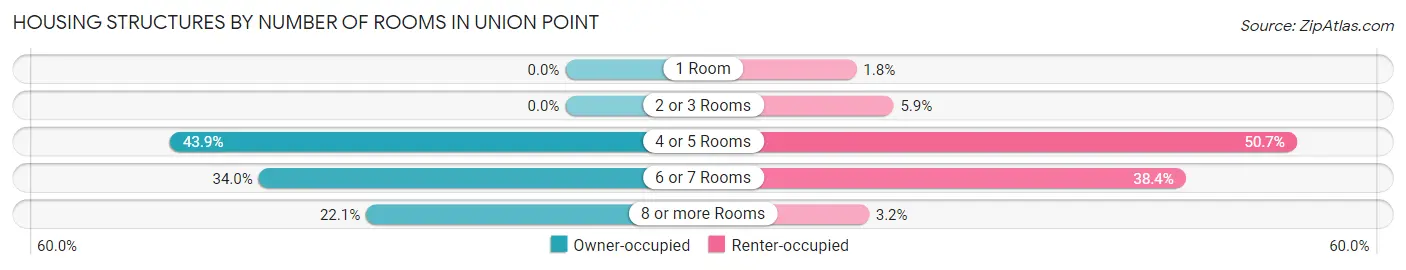
| Number of Rooms | Owner-occupied | Renter-occupied |
| 1 Room | 0 (0.0%) | 4 (1.8%) |
| 2 or 3 Rooms | 0 (0.0%) | 13 (5.9%) |
| 4 or 5 Rooms | 125 (43.9%) | 111 (50.7%) |
| 6 or 7 Rooms | 97 (34.0%) | 84 (38.4%) |
| 8 or more Rooms | 63 (22.1%) | 7 (3.2%) |
| Total | 285 (100.0%) | 219 (100.0%) |
Housing Structure by Heating Type in Union Point
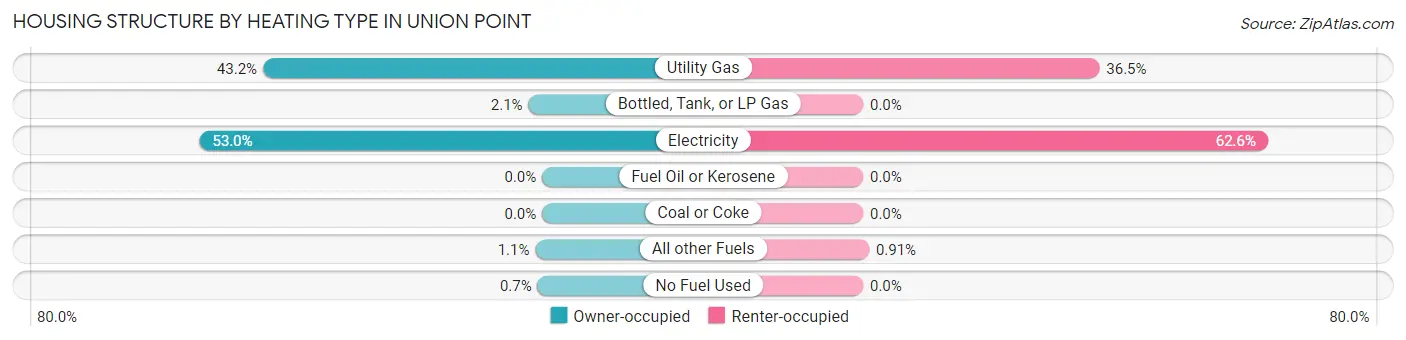
| Heating Type | Owner-occupied | Renter-occupied |
| Utility Gas | 123 (43.2%) | 80 (36.5%) |
| Bottled, Tank, or LP Gas | 6 (2.1%) | 0 (0.0%) |
| Electricity | 151 (53.0%) | 137 (62.6%) |
| Fuel Oil or Kerosene | 0 (0.0%) | 0 (0.0%) |
| Coal or Coke | 0 (0.0%) | 0 (0.0%) |
| All other Fuels | 3 (1.1%) | 2 (0.9%) |
| No Fuel Used | 2 (0.7%) | 0 (0.0%) |
| Total | 285 (100.0%) | 219 (100.0%) |
Household Vehicle Usage in Union Point
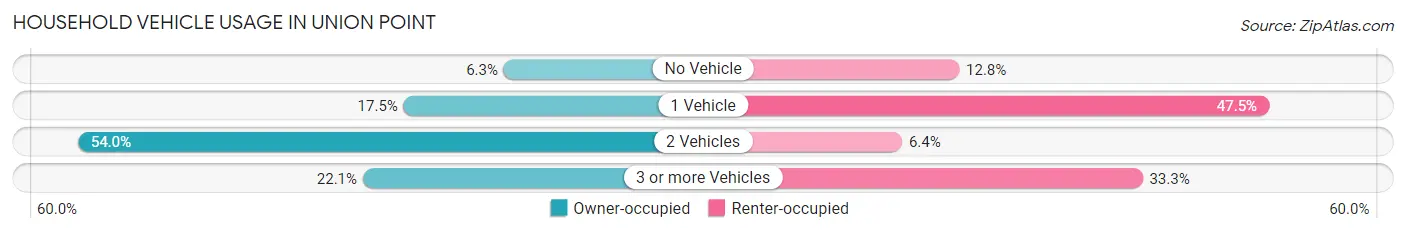
| Vehicles per Household | Owner-occupied | Renter-occupied |
| No Vehicle | 18 (6.3%) | 28 (12.8%) |
| 1 Vehicle | 50 (17.5%) | 104 (47.5%) |
| 2 Vehicles | 154 (54.0%) | 14 (6.4%) |
| 3 or more Vehicles | 63 (22.1%) | 73 (33.3%) |
| Total | 285 (100.0%) | 219 (100.0%) |
Real Estate & Mortgages in Union Point
Real Estate and Mortgage Overview in Union Point
| Characteristic | Without Mortgage | With Mortgage |
| Housing Units | 175 | 110 |
| Median Property Value | $85,000 | $103,600 |
| Median Household Income | $56,042 | $4 |
| Monthly Housing Costs | $428 | $0 |
| Real Estate Taxes | $800 | $0 |
Property Value by Mortgage Status in Union Point

| Property Value | Without Mortgage | With Mortgage |
| Less than $50,000 | 42 (24.0%) | 22 (20.0%) |
| $50,000 to $99,999 | 84 (48.0%) | 30 (27.3%) |
| $100,000 to $299,999 | 47 (26.9%) | 54 (49.1%) |
| $300,000 to $499,999 | 0 (0.0%) | 4 (3.6%) |
| $500,000 to $749,999 | 0 (0.0%) | 0 (0.0%) |
| $750,000 to $999,999 | 2 (1.1%) | 0 (0.0%) |
| $1,000,000 or more | 0 (0.0%) | 0 (0.0%) |
| Total | 175 (100.0%) | 110 (100.0%) |
Household Income by Mortgage Status in Union Point
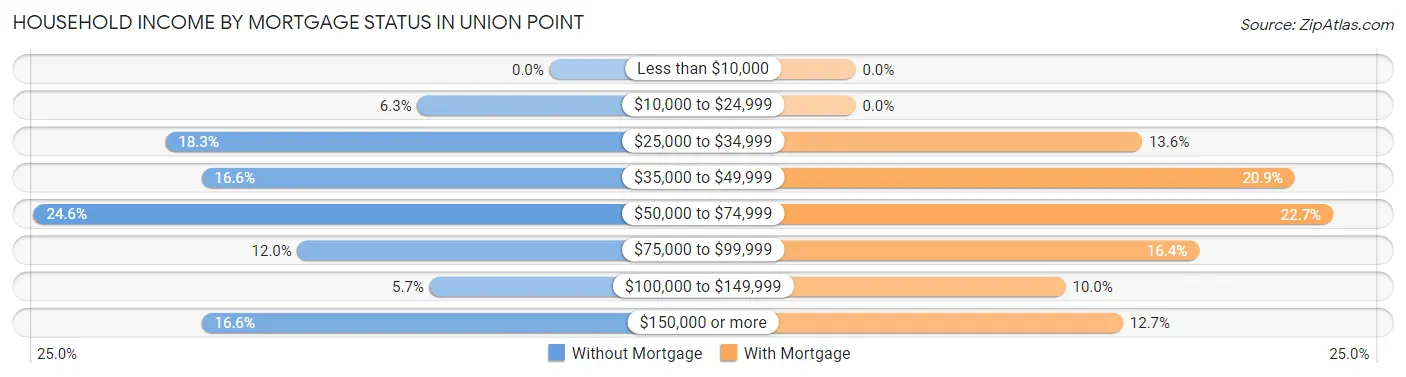
| Household Income | Without Mortgage | With Mortgage |
| Less than $10,000 | 0 (0.0%) | 0 (0.0%) |
| $10,000 to $24,999 | 11 (6.3%) | 0 (0.0%) |
| $25,000 to $34,999 | 32 (18.3%) | 15 (13.6%) |
| $35,000 to $49,999 | 29 (16.6%) | 23 (20.9%) |
| $50,000 to $74,999 | 43 (24.6%) | 25 (22.7%) |
| $75,000 to $99,999 | 21 (12.0%) | 18 (16.4%) |
| $100,000 to $149,999 | 10 (5.7%) | 11 (10.0%) |
| $150,000 or more | 29 (16.6%) | 14 (12.7%) |
| Total | 175 (100.0%) | 110 (100.0%) |
Property Value to Household Income Ratio in Union Point
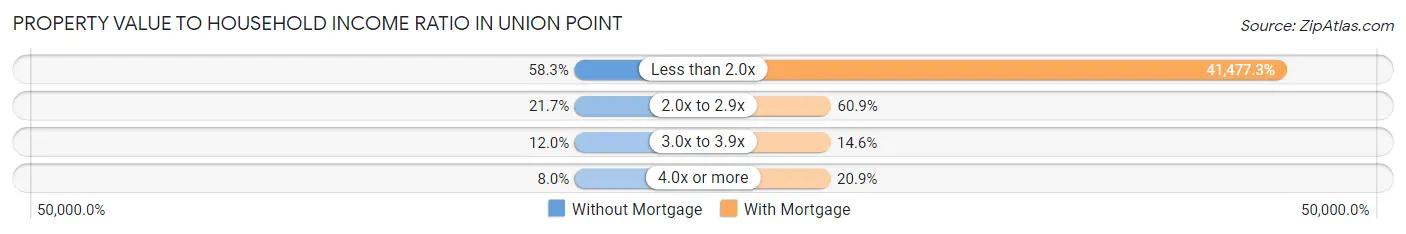
| Value-to-Income Ratio | Without Mortgage | With Mortgage |
| Less than 2.0x | 102 (58.3%) | 45,625 (41,477.3%) |
| 2.0x to 2.9x | 38 (21.7%) | 67 (60.9%) |
| 3.0x to 3.9x | 21 (12.0%) | 16 (14.5%) |
| 4.0x or more | 14 (8.0%) | 23 (20.9%) |
| Total | 175 (100.0%) | 110 (100.0%) |
Real Estate Taxes by Mortgage Status in Union Point
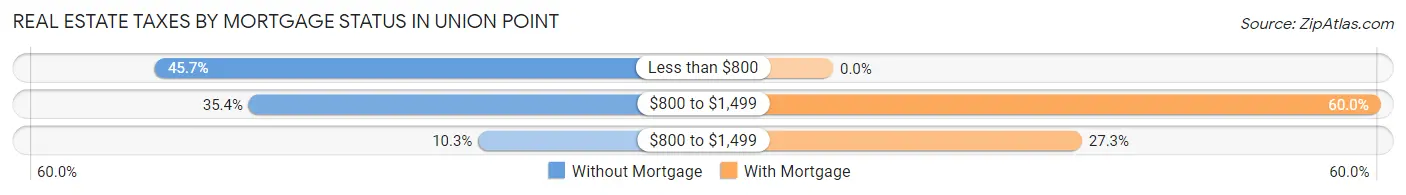
| Property Taxes | Without Mortgage | With Mortgage |
| Less than $800 | 80 (45.7%) | 0 (0.0%) |
| $800 to $1,499 | 62 (35.4%) | 66 (60.0%) |
| $800 to $1,499 | 18 (10.3%) | 30 (27.3%) |
| Total | 175 (100.0%) | 110 (100.0%) |
Health & Disability in Union Point
Health Insurance Coverage by Age in Union Point
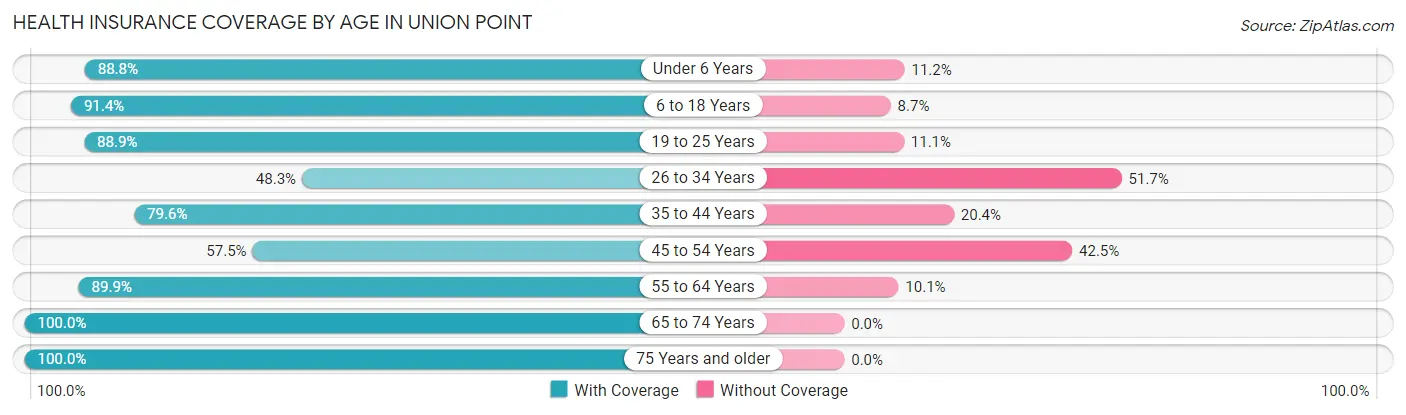
| Age Bracket | With Coverage | Without Coverage |
| Under 6 Years | 166 (88.8%) | 21 (11.2%) |
| 6 to 18 Years | 317 (91.3%) | 30 (8.6%) |
| 19 to 25 Years | 40 (88.9%) | 5 (11.1%) |
| 26 to 34 Years | 99 (48.3%) | 106 (51.7%) |
| 35 to 44 Years | 183 (79.6%) | 47 (20.4%) |
| 45 to 54 Years | 65 (57.5%) | 48 (42.5%) |
| 55 to 64 Years | 205 (89.9%) | 23 (10.1%) |
| 65 to 74 Years | 196 (100.0%) | 0 (0.0%) |
| 75 Years and older | 58 (100.0%) | 0 (0.0%) |
| Total | 1,329 (82.6%) | 280 (17.4%) |
Health Insurance Coverage by Citizenship Status in Union Point
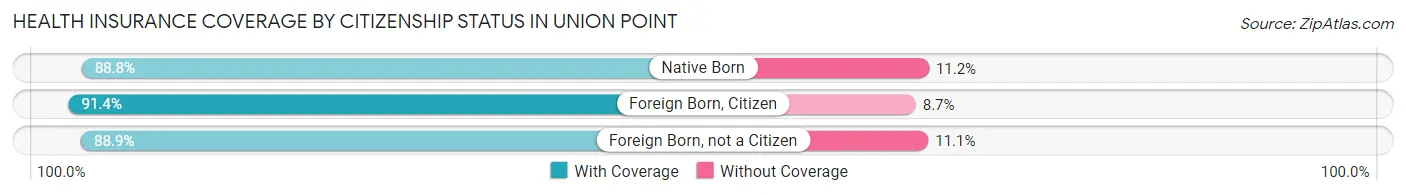
| Citizenship Status | With Coverage | Without Coverage |
| Native Born | 166 (88.8%) | 21 (11.2%) |
| Foreign Born, Citizen | 317 (91.3%) | 30 (8.6%) |
| Foreign Born, not a Citizen | 40 (88.9%) | 5 (11.1%) |
Health Insurance Coverage by Household Income in Union Point
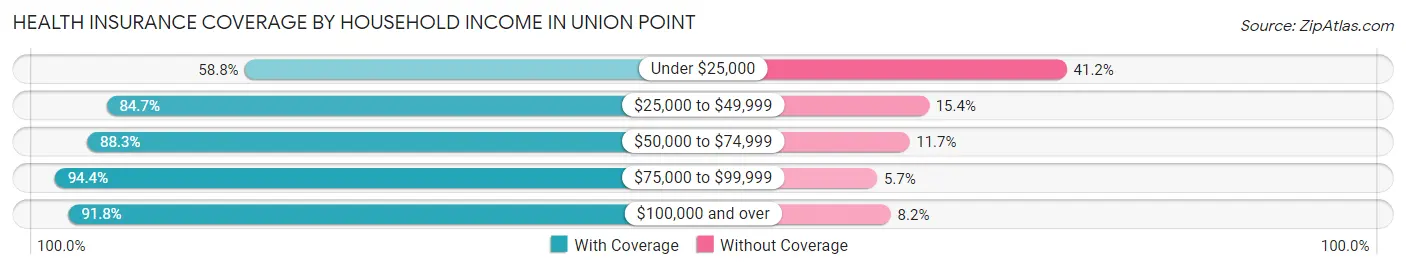
| Household Income | With Coverage | Without Coverage |
| Under $25,000 | 190 (58.8%) | 133 (41.2%) |
| $25,000 to $49,999 | 397 (84.7%) | 72 (15.3%) |
| $50,000 to $74,999 | 279 (88.3%) | 37 (11.7%) |
| $75,000 to $99,999 | 117 (94.4%) | 7 (5.7%) |
| $100,000 and over | 346 (91.8%) | 31 (8.2%) |
Public vs Private Health Insurance Coverage by Age in Union Point
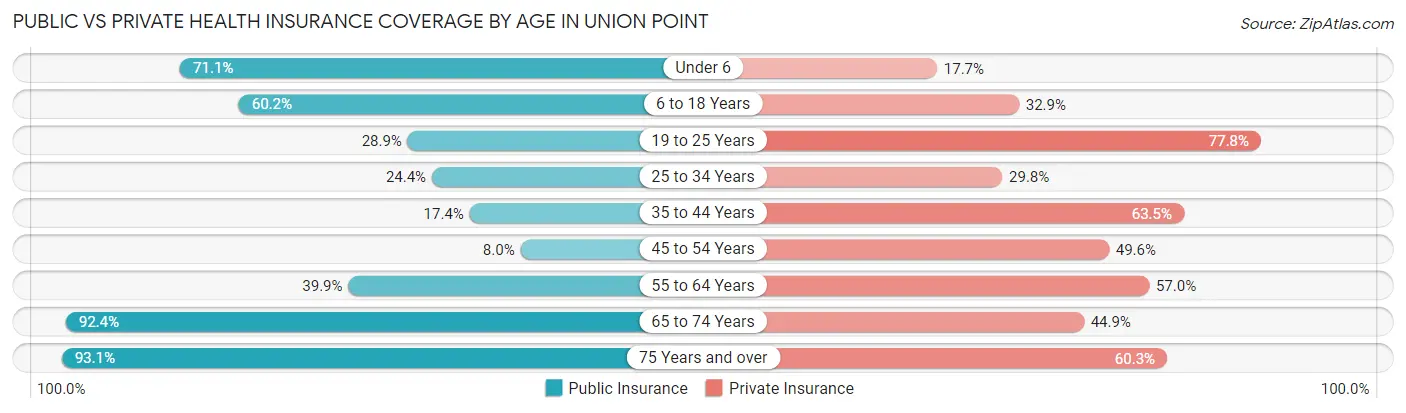
| Age Bracket | Public Insurance | Private Insurance |
| Under 6 | 133 (71.1%) | 33 (17.6%) |
| 6 to 18 Years | 209 (60.2%) | 114 (32.9%) |
| 19 to 25 Years | 13 (28.9%) | 35 (77.8%) |
| 25 to 34 Years | 50 (24.4%) | 61 (29.8%) |
| 35 to 44 Years | 40 (17.4%) | 146 (63.5%) |
| 45 to 54 Years | 9 (8.0%) | 56 (49.6%) |
| 55 to 64 Years | 91 (39.9%) | 130 (57.0%) |
| 65 to 74 Years | 181 (92.3%) | 88 (44.9%) |
| 75 Years and over | 54 (93.1%) | 35 (60.3%) |
| Total | 780 (48.5%) | 698 (43.4%) |
Disability Status by Sex by Age in Union Point
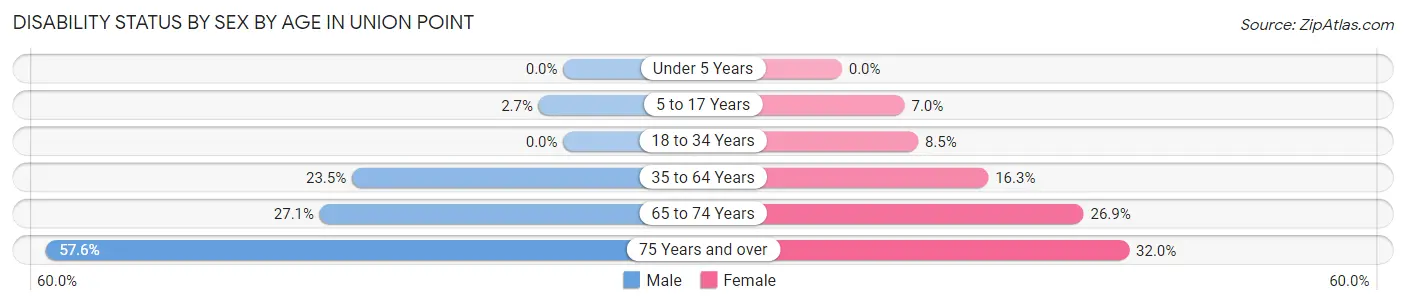
| Age Bracket | Male | Female |
| Under 5 Years | 0 (0.0%) | 0 (0.0%) |
| 5 to 17 Years | 5 (2.7%) | 13 (7.0%) |
| 18 to 34 Years | 0 (0.0%) | 14 (8.5%) |
| 35 to 64 Years | 68 (23.5%) | 46 (16.3%) |
| 65 to 74 Years | 32 (27.1%) | 21 (26.9%) |
| 75 Years and over | 19 (57.6%) | 8 (32.0%) |
Disability Class by Sex by Age in Union Point
Disability Class: Hearing Difficulty
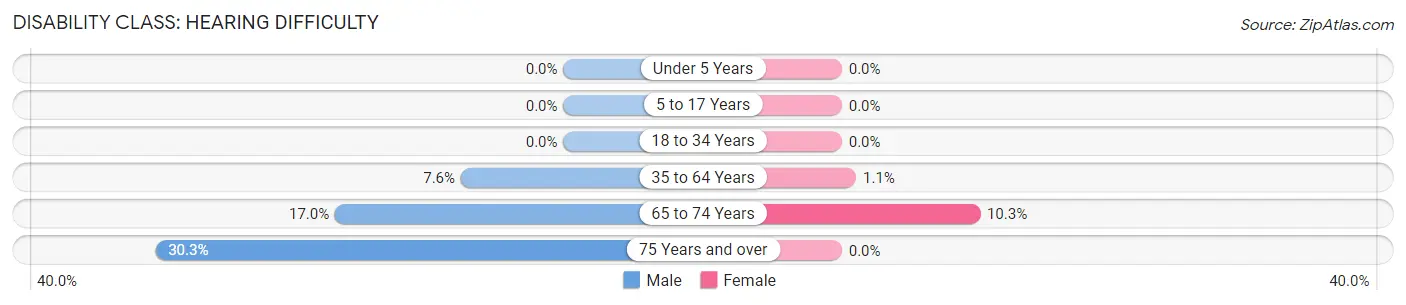
| Age Bracket | Male | Female |
| Under 5 Years | 0 (0.0%) | 0 (0.0%) |
| 5 to 17 Years | 0 (0.0%) | 0 (0.0%) |
| 18 to 34 Years | 0 (0.0%) | 0 (0.0%) |
| 35 to 64 Years | 22 (7.6%) | 3 (1.1%) |
| 65 to 74 Years | 20 (17.0%) | 8 (10.3%) |
| 75 Years and over | 10 (30.3%) | 0 (0.0%) |
Disability Class: Vision Difficulty
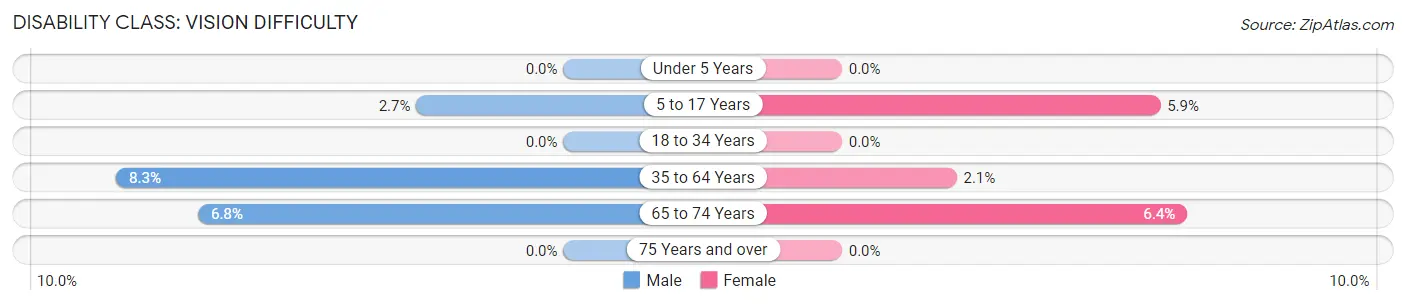
| Age Bracket | Male | Female |
| Under 5 Years | 0 (0.0%) | 0 (0.0%) |
| 5 to 17 Years | 5 (2.7%) | 11 (5.9%) |
| 18 to 34 Years | 0 (0.0%) | 0 (0.0%) |
| 35 to 64 Years | 24 (8.3%) | 6 (2.1%) |
| 65 to 74 Years | 8 (6.8%) | 5 (6.4%) |
| 75 Years and over | 0 (0.0%) | 0 (0.0%) |
Disability Class: Cognitive Difficulty
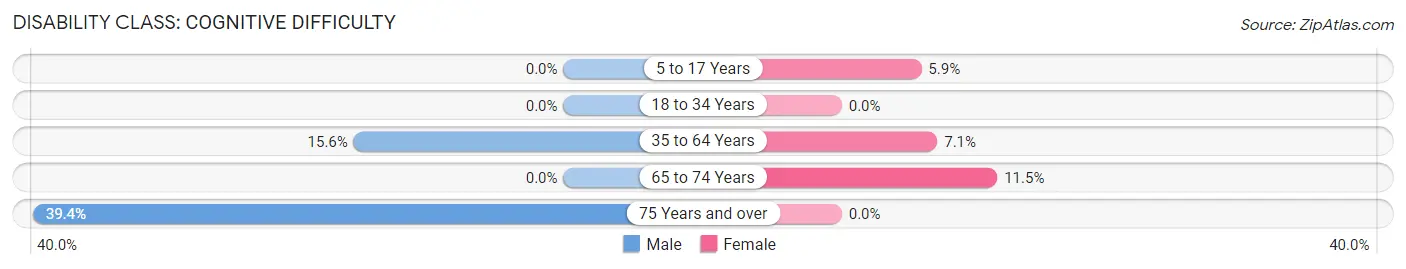
| Age Bracket | Male | Female |
| 5 to 17 Years | 0 (0.0%) | 11 (5.9%) |
| 18 to 34 Years | 0 (0.0%) | 0 (0.0%) |
| 35 to 64 Years | 45 (15.6%) | 20 (7.1%) |
| 65 to 74 Years | 0 (0.0%) | 9 (11.5%) |
| 75 Years and over | 13 (39.4%) | 0 (0.0%) |
Disability Class: Ambulatory Difficulty
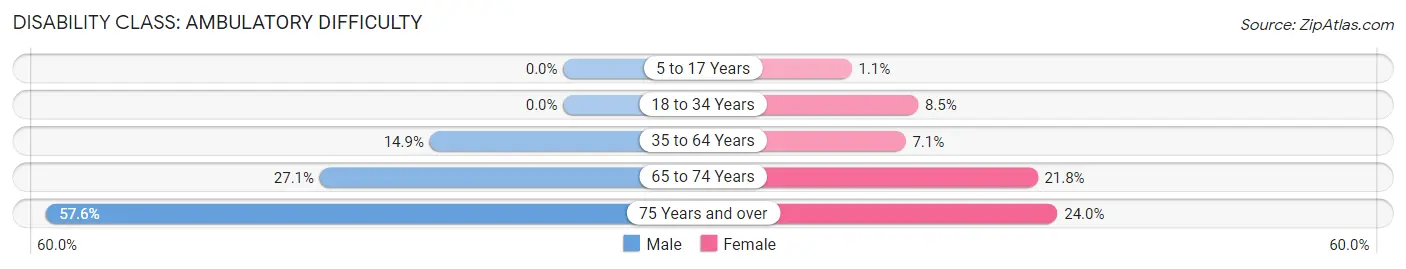
| Age Bracket | Male | Female |
| 5 to 17 Years | 0 (0.0%) | 2 (1.1%) |
| 18 to 34 Years | 0 (0.0%) | 14 (8.5%) |
| 35 to 64 Years | 43 (14.9%) | 20 (7.1%) |
| 65 to 74 Years | 32 (27.1%) | 17 (21.8%) |
| 75 Years and over | 19 (57.6%) | 6 (24.0%) |
Disability Class: Self-Care Difficulty
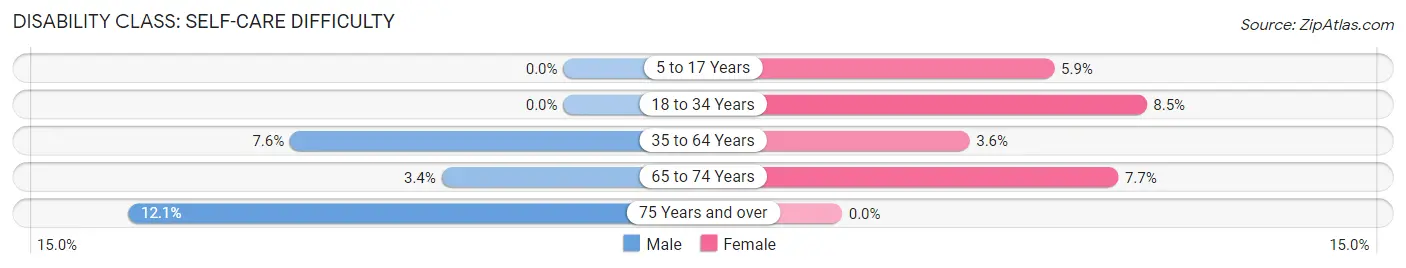
| Age Bracket | Male | Female |
| 5 to 17 Years | 0 (0.0%) | 11 (5.9%) |
| 18 to 34 Years | 0 (0.0%) | 14 (8.5%) |
| 35 to 64 Years | 22 (7.6%) | 10 (3.5%) |
| 65 to 74 Years | 4 (3.4%) | 6 (7.7%) |
| 75 Years and over | 4 (12.1%) | 0 (0.0%) |
Technology Access in Union Point
Computing Device Access in Union Point
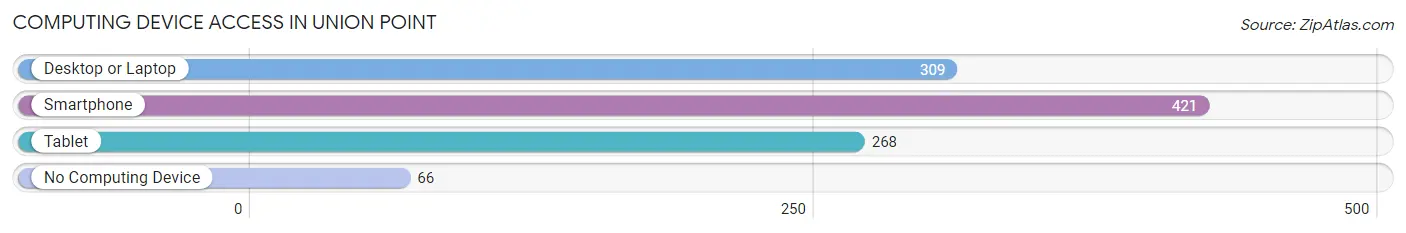
| Device Type | # Households | % Households |
| Desktop or Laptop | 309 | 61.3% |
| Smartphone | 421 | 83.5% |
| Tablet | 268 | 53.2% |
| No Computing Device | 66 | 13.1% |
| Total | 504 | 100.0% |
Internet Access in Union Point
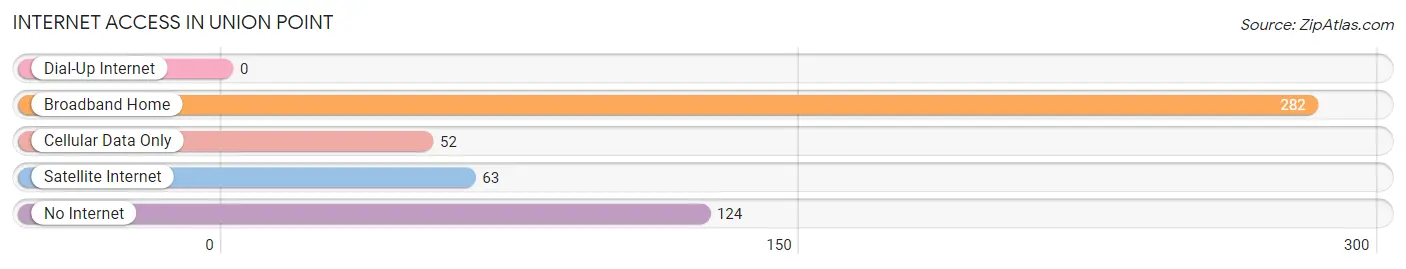
| Internet Type | # Households | % Households |
| Dial-Up Internet | 0 | 0.0% |
| Broadband Home | 282 | 55.9% |
| Cellular Data Only | 52 | 10.3% |
| Satellite Internet | 63 | 12.5% |
| No Internet | 124 | 24.6% |
| Total | 504 | 100.0% |
Union Point Summary
History
Union Point, Georgia is a small town located in Greene County, Georgia. It was founded in 1820 and is the county seat of Greene County. The town was named after the Union Point Railroad, which was built in 1845 and connected the town to Athens and Augusta. The town was also the site of a major Civil War battle in 1864, when Union forces under General William T. Sherman attacked Confederate forces under General Joseph E. Johnston. The battle resulted in a Confederate victory, but the town was destroyed in the process.
In the late 19th century, Union Point became a major center for cotton production and processing. The town was home to several cotton mills, and the town's economy was largely based on the cotton industry. The town also had a thriving business district, with several stores, banks, and other businesses.
In the early 20th century, Union Point began to decline as the cotton industry moved away from the area. The town's economy shifted to agriculture, and the town's population began to decline. By the 1950s, the town's population had dropped to just over 1,000 people.
Geography
Union Point is located in Greene County, Georgia, about 50 miles east of Atlanta. The town is situated on the Oconee River, and is surrounded by rolling hills and farmland. The town is located at an elevation of about 500 feet above sea level.
The climate in Union Point is mild and humid, with hot summers and mild winters. The average annual temperature is around 70 degrees Fahrenheit, and the average annual precipitation is around 50 inches.
Economy
Union Point's economy is largely based on agriculture. The town is home to several farms, and the surrounding area is known for its production of cotton, corn, soybeans, and other crops. The town also has several small businesses, including restaurants, stores, and other services.
The town is also home to several manufacturing companies, including a paper mill and a furniture factory. The town is also home to a number of small businesses, including a grocery store, a hardware store, and a pharmacy.
Demographics
As of the 2010 census, Union Point had a population of 1,717 people. The racial makeup of the town was 79.3% White, 17.2% African American, 0.3% Native American, 0.3% Asian, 0.1% Pacific Islander, and 2.8% from other races. Hispanic or Latino of any race were 2.2% of the population.
The median household income in Union Point was $30,938, and the median family income was $37,917. The per capita income in Union Point was $17,845. About 17.2% of families and 20.2% of the population were below the poverty line, including 28.3% of those under age 18 and 15.2% of those age 65 or over.
Common Questions
What is Per Capita Income in Union Point?
Per Capita income in Union Point is $22,477.
What is the Median Family Income in Union Point?
Median Family Income in Union Point is $48,843.
What is the Median Household income in Union Point?
Median Household Income in Union Point is $47,963.
What is Income or Wage Gap in Union Point?
Income or Wage Gap in Union Point is 19.9%.
Women in Union Point earn 80.1 cents for every dollar earned by a man.
What is Inequality or Gini Index in Union Point?
Inequality or Gini Index in Union Point is 0.48.
What is the Total Population of Union Point?
Total Population of Union Point is 1,661.
What is the Total Male Population of Union Point?
Total Male Population of Union Point is 835.
What is the Total Female Population of Union Point?
Total Female Population of Union Point is 826.
What is the Ratio of Males per 100 Females in Union Point?
There are 101.09 Males per 100 Females in Union Point.
What is the Ratio of Females per 100 Males in Union Point?
There are 98.92 Females per 100 Males in Union Point.
What is the Median Population Age in Union Point?
Median Population Age in Union Point is 36.0 Years.
What is the Average Family Size in Union Point
Average Family Size in Union Point is 3.7 People.
What is the Average Household Size in Union Point
Average Household Size in Union Point is 3.2 People.
How Large is the Labor Force in Union Point?
There are 626 People in the Labor Forcein in Union Point.
What is the Percentage of People in the Labor Force in Union Point?
54.7% of People are in the Labor Force in Union Point.
What is the Unemployment Rate in Union Point?
Unemployment Rate in Union Point is 0.8%.