Tybee Island, GA Map & Demographics
Tybee Island Map
Tybee Island Overview
$50,889
PER CAPITA INCOME
$135,055
AVG FAMILY INCOME
$101,289
AVG HOUSEHOLD INCOME
16.6%
WAGE / INCOME GAP [ % ]
83.4¢/ $1
WAGE / INCOME GAP [ $ ]
0.39
INEQUALITY / GINI INDEX
3,126
TOTAL POPULATION
1,460
MALE POPULATION
1,666
FEMALE POPULATION
87.64
MALES / 100 FEMALES
114.11
FEMALES / 100 MALES
61.4
MEDIAN AGE
2.4
AVG FAMILY SIZE
2.1
AVG HOUSEHOLD SIZE
1,269
LABOR FORCE [ PEOPLE ]
44.3%
PERCENT IN LABOR FORCE
3.6%
UNEMPLOYMENT RATE
Tybee Island Zip Codes
Tybee Island Area Codes
Income in Tybee Island
Income Overview in Tybee Island
Per Capita Income in Tybee Island is $50,889, while median incomes of families and households are $135,055 and $101,289 respectively.
| Characteristic | Number | Measure |
| Per Capita Income | 3,126 | $50,889 |
| Median Family Income | 1,078 | $135,055 |
| Mean Family Income | 1,078 | $133,122 |
| Median Household Income | 1,457 | $101,289 |
| Mean Household Income | 1,457 | $112,367 |
| Income Deficit | 1,078 | $0 |
| Wage / Income Gap (%) | 3,126 | 16.58% |
| Wage / Income Gap ($) | 3,126 | 83.42¢ per $1 |
| Gini / Inequality Index | 3,126 | 0.39 |
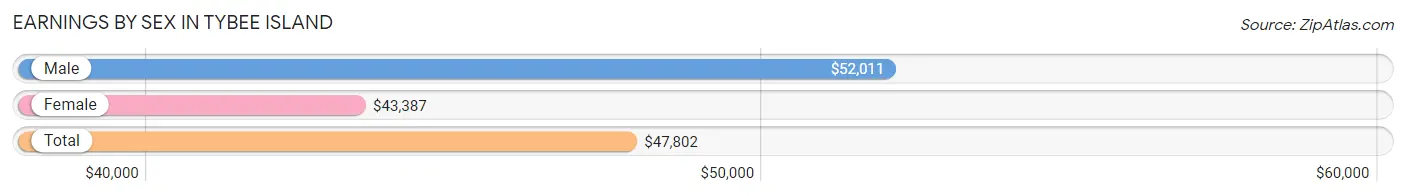
Earnings by Sex in Tybee Island
Average Earnings in Tybee Island are $47,802, $52,011 for men and $43,387 for women, a difference of 16.6%.
| Sex | Number | Average Earnings |
| Male | 849 (54.5%) | $52,011 |
| Female | 710 (45.5%) | $43,387 |
| Total | 1,559 (100.0%) | $47,802 |
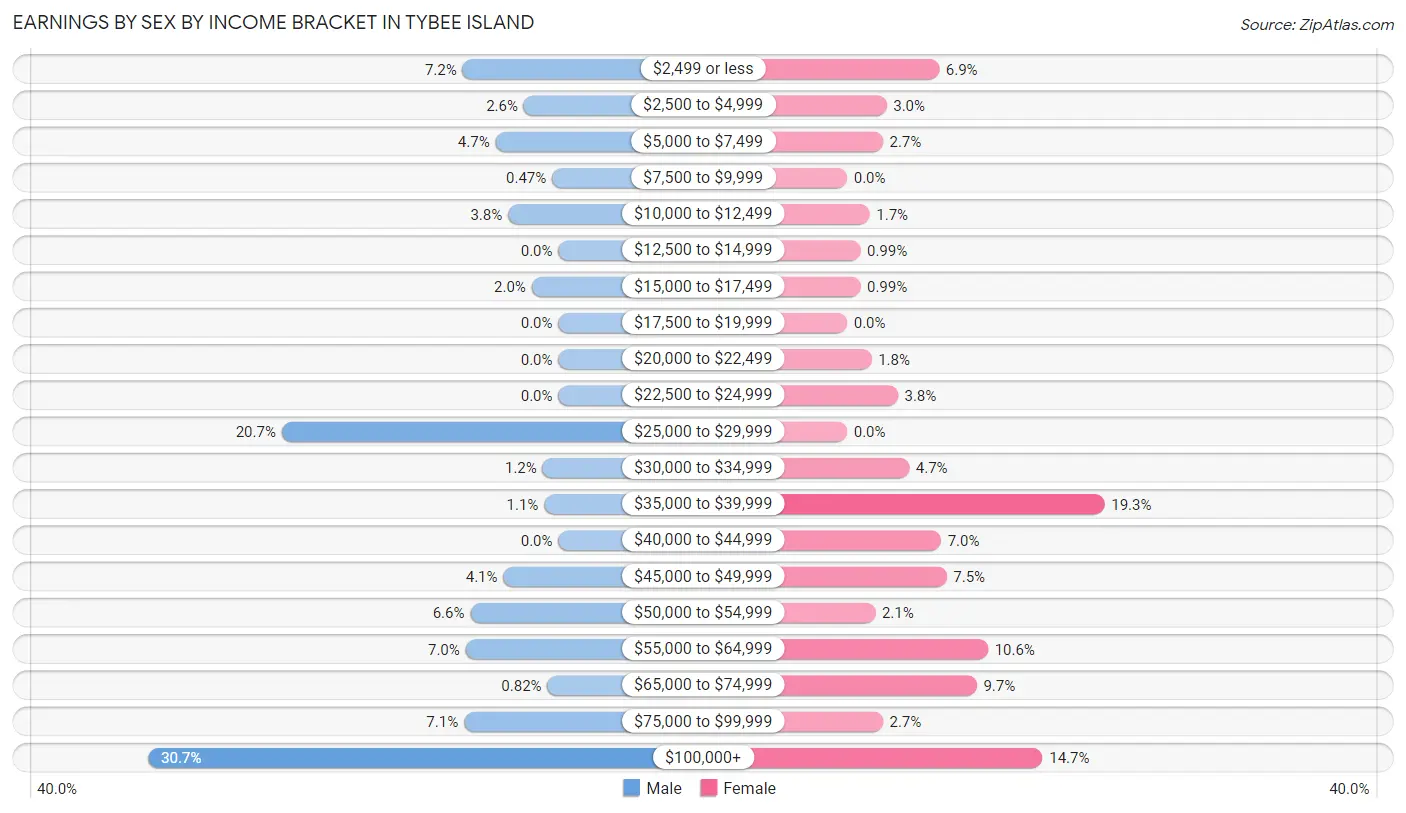
Earnings by Sex by Income Bracket in Tybee Island
The most common earnings brackets in Tybee Island are $100,000+ for men (261 | 30.7%) and $35,000 to $39,999 for women (137 | 19.3%).
| Income | Male | Female |
| $2,499 or less | 61 (7.2%) | 49 (6.9%) |
| $2,500 to $4,999 | 22 (2.6%) | 21 (3.0%) |
| $5,000 to $7,499 | 40 (4.7%) | 19 (2.7%) |
| $7,500 to $9,999 | 4 (0.5%) | 0 (0.0%) |
| $10,000 to $12,499 | 32 (3.8%) | 12 (1.7%) |
| $12,500 to $14,999 | 0 (0.0%) | 7 (1.0%) |
| $15,000 to $17,499 | 17 (2.0%) | 7 (1.0%) |
| $17,500 to $19,999 | 0 (0.0%) | 0 (0.0%) |
| $20,000 to $22,499 | 0 (0.0%) | 13 (1.8%) |
| $22,500 to $24,999 | 0 (0.0%) | 27 (3.8%) |
| $25,000 to $29,999 | 176 (20.7%) | 0 (0.0%) |
| $30,000 to $34,999 | 10 (1.2%) | 33 (4.6%) |
| $35,000 to $39,999 | 9 (1.1%) | 137 (19.3%) |
| $40,000 to $44,999 | 0 (0.0%) | 50 (7.0%) |
| $45,000 to $49,999 | 35 (4.1%) | 53 (7.5%) |
| $50,000 to $54,999 | 56 (6.6%) | 15 (2.1%) |
| $55,000 to $64,999 | 59 (7.0%) | 75 (10.6%) |
| $65,000 to $74,999 | 7 (0.8%) | 69 (9.7%) |
| $75,000 to $99,999 | 60 (7.1%) | 19 (2.7%) |
| $100,000+ | 261 (30.7%) | 104 (14.6%) |
| Total | 849 (100.0%) | 710 (100.0%) |
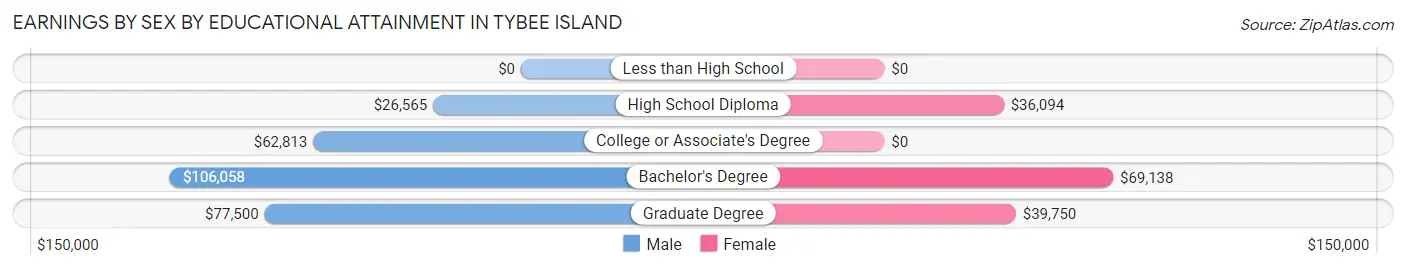
Earnings by Sex by Educational Attainment in Tybee Island
Average earnings in Tybee Island are $57,820 for men and $44,839 for women, a difference of 22.5%. Men with an educational attainment of bachelor's degree enjoy the highest average annual earnings of $106,058, while those with high school diploma education earn the least with $26,565. Women with an educational attainment of bachelor's degree earn the most with the average annual earnings of $69,138, while those with high school diploma education have the smallest earnings of $36,094.
| Educational Attainment | Male Income | Female Income |
| Less than High School | - | - |
| High School Diploma | $26,565 | $36,094 |
| College or Associate's Degree | $62,813 | $0 |
| Bachelor's Degree | $106,058 | $69,138 |
| Graduate Degree | $77,500 | $39,750 |
| Total | $57,820 | $44,839 |
Family Income in Tybee Island
Family Income Brackets in Tybee Island
According to the Tybee Island family income data, there are 347 families falling into the $100,000 to $149,999 income range, which is the most common income bracket and makes up 32.2% of all families.
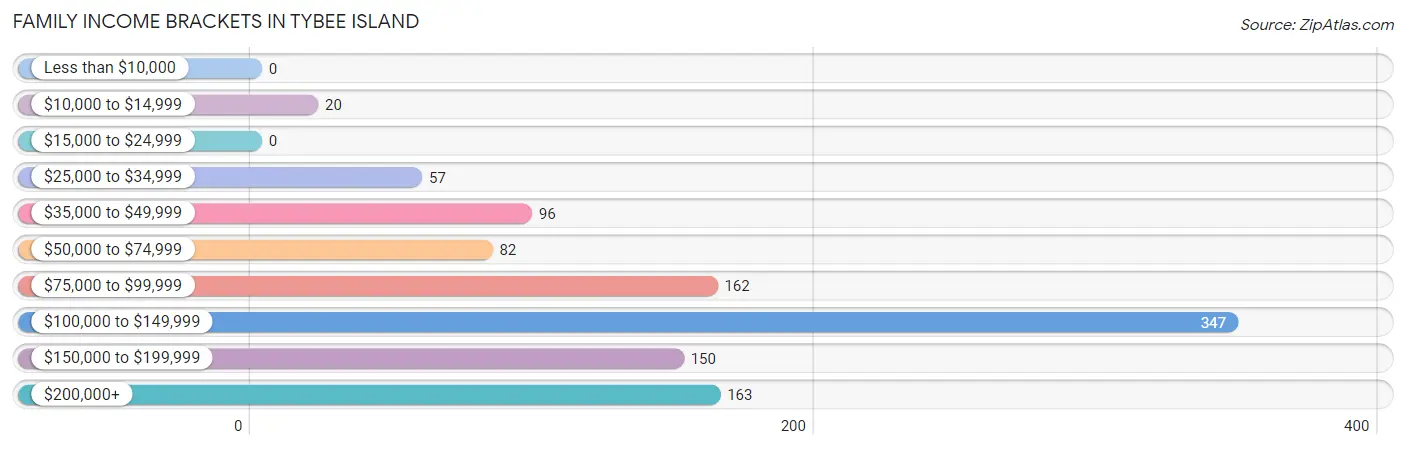
| Income Bracket | # Families | % Families |
| Less than $10,000 | 0 | 0.0% |
| $10,000 to $14,999 | 20 | 1.9% |
| $15,000 to $24,999 | 0 | 0.0% |
| $25,000 to $34,999 | 57 | 5.3% |
| $35,000 to $49,999 | 96 | 8.9% |
| $50,000 to $74,999 | 82 | 7.6% |
| $75,000 to $99,999 | 162 | 15.0% |
| $100,000 to $149,999 | 347 | 32.2% |
| $150,000 to $199,999 | 150 | 13.9% |
| $200,000+ | 163 | 15.1% |
Family Income by Famaliy Size in Tybee Island
3-person families (296 | 27.5%) account for the highest median family income in Tybee Island with $136,952 per family, while 2-person families (672 | 62.3%) have the highest median income of $49,708 per family member.
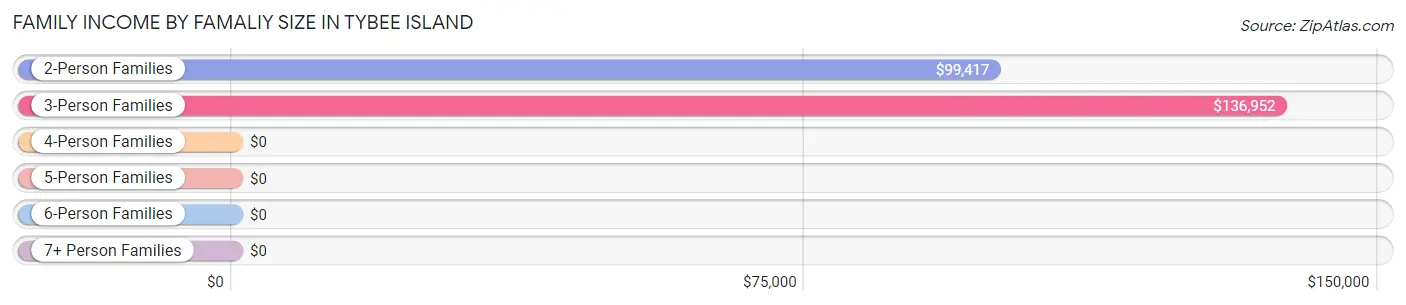
| Income Bracket | # Families | Median Income |
| 2-Person Families | 672 (62.3%) | $99,417 |
| 3-Person Families | 296 (27.5%) | $136,952 |
| 4-Person Families | 90 (8.4%) | $0 |
| 5-Person Families | 20 (1.9%) | $0 |
| 6-Person Families | 0 (0.0%) | $0 |
| 7+ Person Families | 0 (0.0%) | $0 |
| Total | 1,078 (100.0%) | $135,055 |
Family Income by Number of Earners in Tybee Island
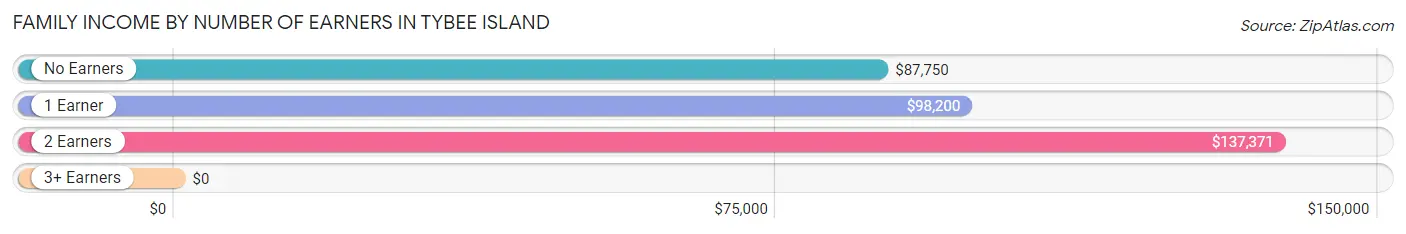
| Number of Earners | # Families | Median Income |
| No Earners | 278 (25.8%) | $87,750 |
| 1 Earner | 262 (24.3%) | $98,200 |
| 2 Earners | 496 (46.0%) | $137,371 |
| 3+ Earners | 42 (3.9%) | $0 |
| Total | 1,078 (100.0%) | $135,055 |
Household Income in Tybee Island
Household Income Brackets in Tybee Island
With 423 households falling in the category, the $100,000 to $149,999 income range is the most frequent in Tybee Island, accounting for 29.0% of all households. In contrast, only 28 households (1.9%) fall into the $10,000 to $14,999 income bracket, making it the least populous group.
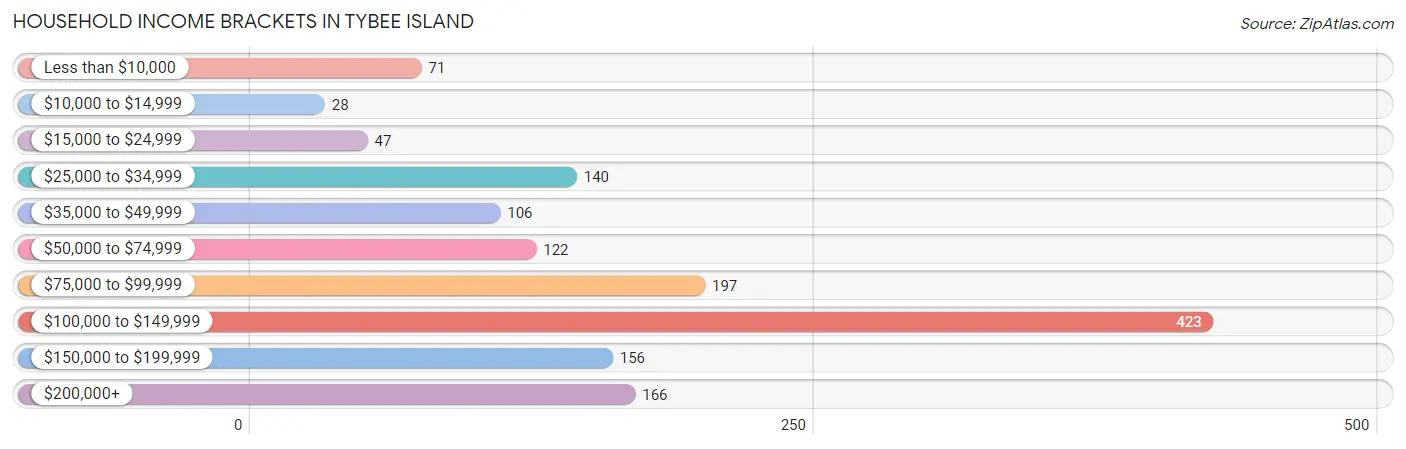
| Income Bracket | # Households | % Households |
| Less than $10,000 | 71 | 4.9% |
| $10,000 to $14,999 | 28 | 1.9% |
| $15,000 to $24,999 | 47 | 3.2% |
| $25,000 to $34,999 | 140 | 9.6% |
| $35,000 to $49,999 | 106 | 7.3% |
| $50,000 to $74,999 | 122 | 8.4% |
| $75,000 to $99,999 | 197 | 13.5% |
| $100,000 to $149,999 | 423 | 29.0% |
| $150,000 to $199,999 | 156 | 10.7% |
| $200,000+ | 166 | 11.4% |
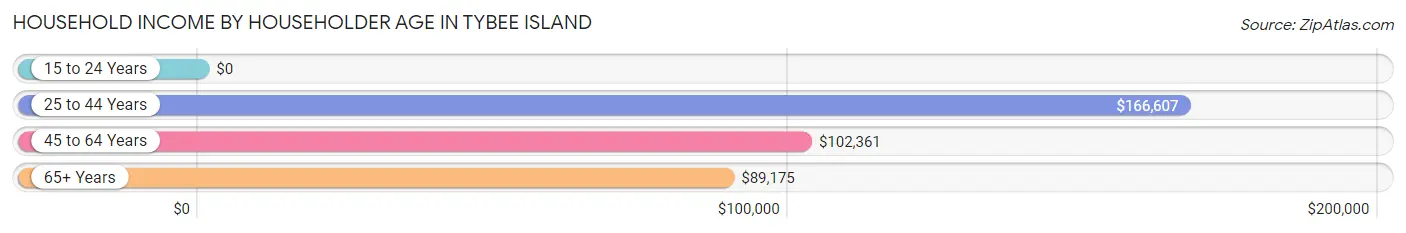
Household Income by Householder Age in Tybee Island
The median household income in Tybee Island is $101,289, with the highest median household income of $166,607 found in the 25 to 44 years age bracket for the primary householder. A total of 193 households (13.3%) fall into this category.
| Income Bracket | # Households | Median Income |
| 15 to 24 Years | 0 (0.0%) | $0 |
| 25 to 44 Years | 193 (13.3%) | $166,607 |
| 45 to 64 Years | 545 (37.4%) | $102,361 |
| 65+ Years | 719 (49.3%) | $89,175 |
| Total | 1,457 (100.0%) | $101,289 |
Poverty in Tybee Island
Income Below Poverty by Sex and Age in Tybee Island
With 4.2% poverty level for males and 4.4% for females among the residents of Tybee Island, 6 to 11 year old males and 12 to 14 year old females are the most vulnerable to poverty, with 12 males (100.0%) and 12 females (40.0%) in their respective age groups living below the poverty level.
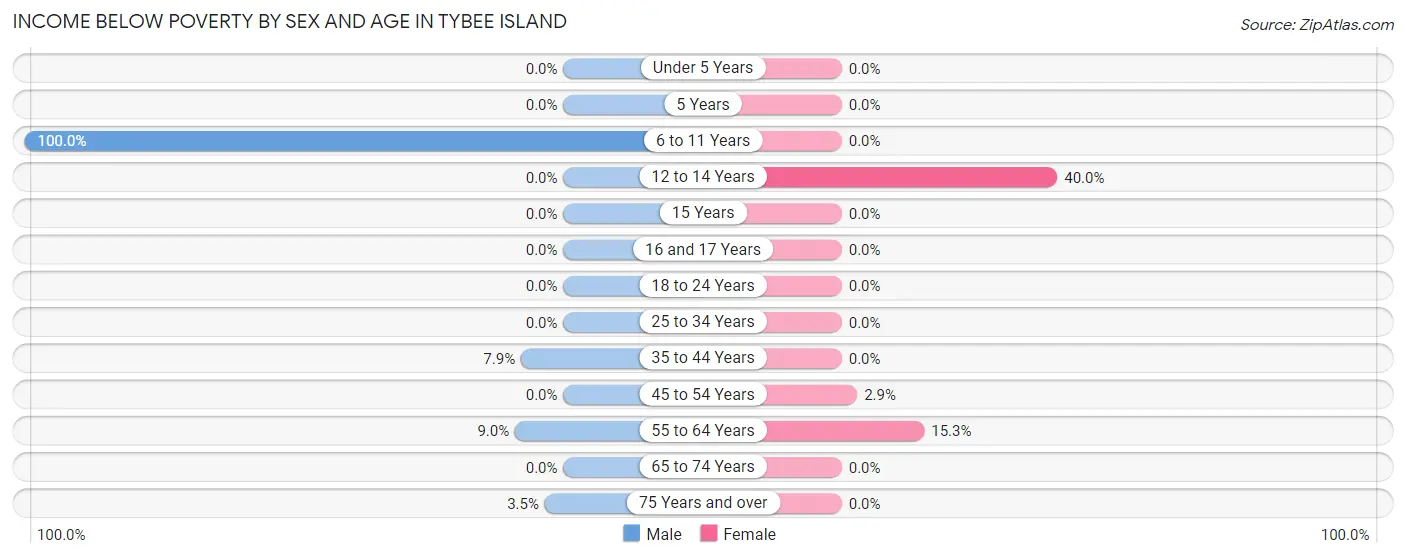
| Age Bracket | Male | Female |
| Under 5 Years | 0 (0.0%) | 0 (0.0%) |
| 5 Years | 0 (0.0%) | 0 (0.0%) |
| 6 to 11 Years | 12 (100.0%) | 0 (0.0%) |
| 12 to 14 Years | 0 (0.0%) | 12 (40.0%) |
| 15 Years | 0 (0.0%) | 0 (0.0%) |
| 16 and 17 Years | 0 (0.0%) | 0 (0.0%) |
| 18 to 24 Years | 0 (0.0%) | 0 (0.0%) |
| 25 to 34 Years | 0 (0.0%) | 0 (0.0%) |
| 35 to 44 Years | 11 (7.9%) | 0 (0.0%) |
| 45 to 54 Years | 0 (0.0%) | 7 (2.9%) |
| 55 to 64 Years | 26 (9.0%) | 51 (15.3%) |
| 65 to 74 Years | 0 (0.0%) | 0 (0.0%) |
| 75 Years and over | 10 (3.5%) | 0 (0.0%) |
| Total | 59 (4.2%) | 70 (4.4%) |
Income Above Poverty by Sex and Age in Tybee Island
According to the poverty statistics in Tybee Island, males aged under 5 years and females aged under 5 years are the age groups that are most secure financially, with 100.0% of males and 100.0% of females in these age groups living above the poverty line.
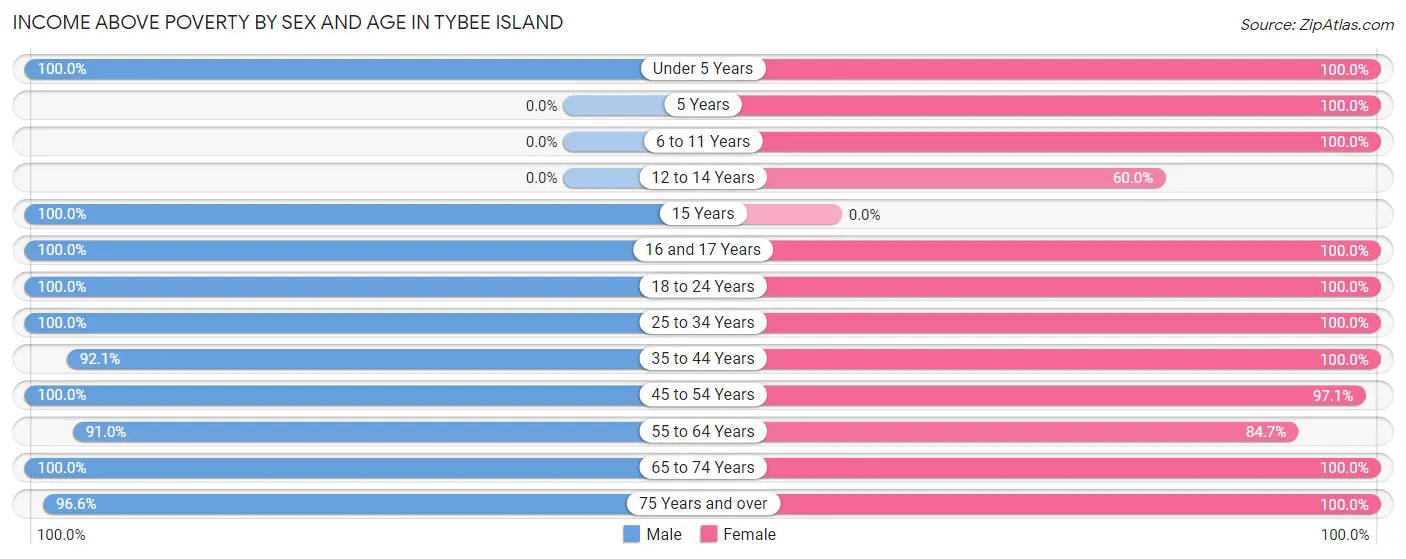
| Age Bracket | Male | Female |
| Under 5 Years | 93 (100.0%) | 42 (100.0%) |
| 5 Years | 0 (0.0%) | 33 (100.0%) |
| 6 to 11 Years | 0 (0.0%) | 45 (100.0%) |
| 12 to 14 Years | 0 (0.0%) | 18 (60.0%) |
| 15 Years | 7 (100.0%) | 0 (0.0%) |
| 16 and 17 Years | 70 (100.0%) | 42 (100.0%) |
| 18 to 24 Years | 38 (100.0%) | 38 (100.0%) |
| 25 to 34 Years | 10 (100.0%) | 77 (100.0%) |
| 35 to 44 Years | 129 (92.1%) | 137 (100.0%) |
| 45 to 54 Years | 108 (100.0%) | 237 (97.1%) |
| 55 to 64 Years | 264 (91.0%) | 282 (84.7%) |
| 65 to 74 Years | 347 (100.0%) | 379 (100.0%) |
| 75 Years and over | 280 (96.6%) | 206 (100.0%) |
| Total | 1,346 (95.8%) | 1,536 (95.6%) |
Income Below Poverty Among Married-Couple Families in Tybee Island
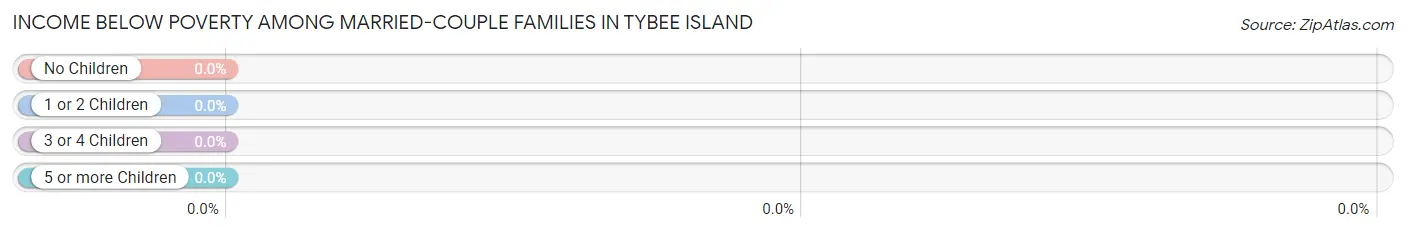
| Children | Above Poverty | Below Poverty |
| No Children | 755 (100.0%) | 0 (0.0%) |
| 1 or 2 Children | 157 (100.0%) | 0 (0.0%) |
| 3 or 4 Children | 20 (100.0%) | 0 (0.0%) |
| 5 or more Children | 0 (0.0%) | 0 (0.0%) |
| Total | 932 (100.0%) | 0 (0.0%) |
Income Below Poverty Among Single-Parent Households in Tybee Island
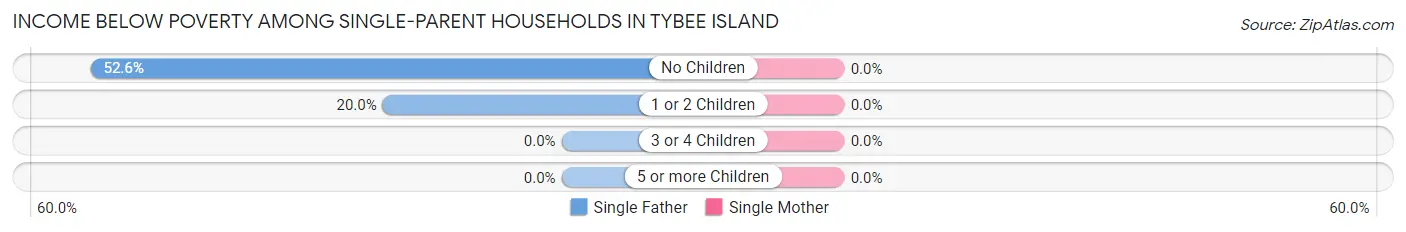
| Children | Single Father | Single Mother |
| No Children | 10 (52.6%) | 0 (0.0%) |
| 1 or 2 Children | 11 (20.0%) | 0 (0.0%) |
| 3 or 4 Children | 0 (0.0%) | 0 (0.0%) |
| 5 or more Children | 0 (0.0%) | 0 (0.0%) |
| Total | 21 (28.4%) | 0 (0.0%) |
Income Below Poverty Among Married-Couple vs Single-Parent Households in Tybee Island
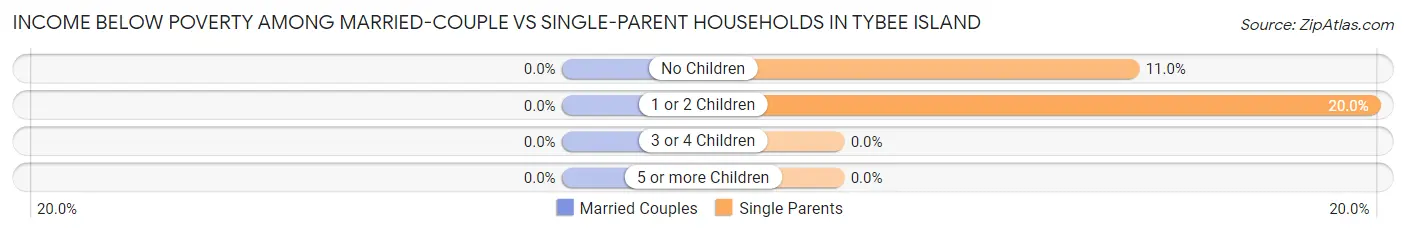
| Children | Married-Couple Families | Single-Parent Households |
| No Children | 0 (0.0%) | 10 (11.0%) |
| 1 or 2 Children | 0 (0.0%) | 11 (20.0%) |
| 3 or 4 Children | 0 (0.0%) | 0 (0.0%) |
| 5 or more Children | 0 (0.0%) | 0 (0.0%) |
| Total | 0 (0.0%) | 21 (14.4%) |
Race in Tybee Island
The most populous races in Tybee Island are White / Caucasian (2,928 | 93.7%), Black / African American (110 | 3.5%), and Two or more Races (88 | 2.8%).
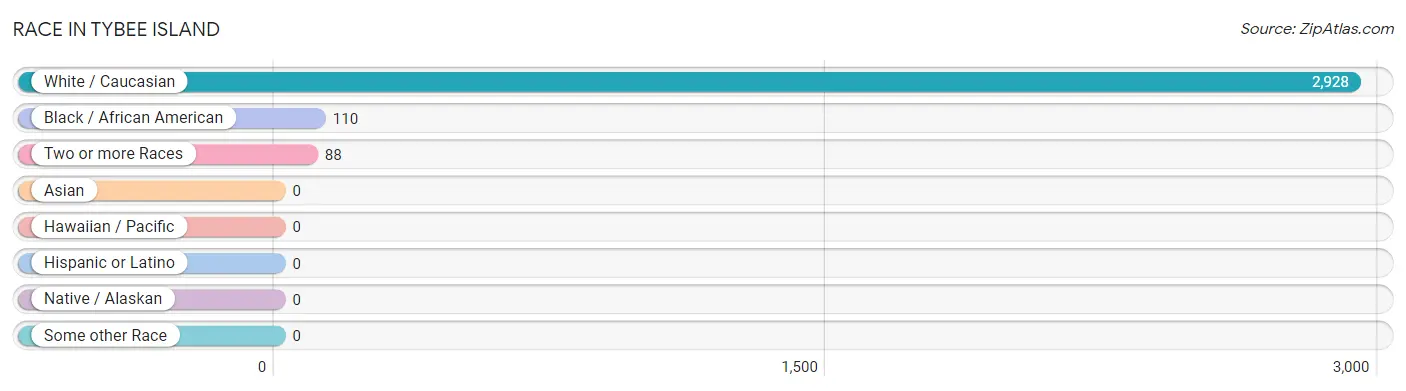
| Race | # Population | % Population |
| Asian | 0 | 0.0% |
| Black / African American | 110 | 3.5% |
| Hawaiian / Pacific | 0 | 0.0% |
| Hispanic or Latino | 0 | 0.0% |
| Native / Alaskan | 0 | 0.0% |
| White / Caucasian | 2,928 | 93.7% |
| Two or more Races | 88 | 2.8% |
| Some other Race | 0 | 0.0% |
| Total | 3,126 | 100.0% |
Ancestry in Tybee Island
The most populous ancestries reported in Tybee Island are English (375 | 12.0%), Irish (374 | 12.0%), German (355 | 11.4%), American (200 | 6.4%), and Italian (155 | 5.0%), together accounting for 46.7% of all Tybee Island residents.
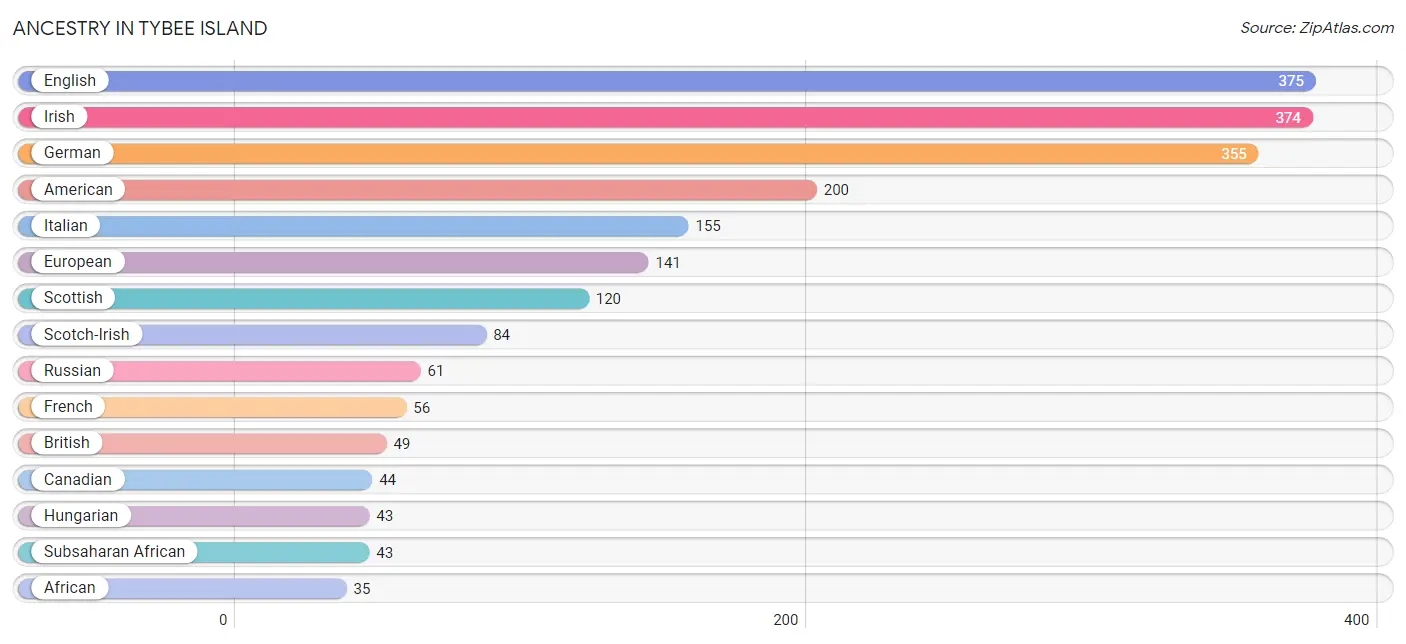
| Ancestry | # Population | % Population |
| African | 35 | 1.1% |
| American | 200 | 6.4% |
| British | 49 | 1.6% |
| Canadian | 44 | 1.4% |
| Cape Verdean | 8 | 0.3% |
| Eastern European | 10 | 0.3% |
| English | 375 | 12.0% |
| European | 141 | 4.5% |
| French | 56 | 1.8% |
| French Canadian | 11 | 0.4% |
| German | 355 | 11.4% |
| Hungarian | 43 | 1.4% |
| Irish | 374 | 12.0% |
| Italian | 155 | 5.0% |
| Norwegian | 11 | 0.4% |
| Polish | 27 | 0.9% |
| Portuguese | 34 | 1.1% |
| Russian | 61 | 1.9% |
| Scandinavian | 29 | 0.9% |
| Scotch-Irish | 84 | 2.7% |
| Scottish | 120 | 3.8% |
| Slovene | 11 | 0.4% |
| Subsaharan African | 43 | 1.4% |
| Ukrainian | 9 | 0.3% |
| Welsh | 34 | 1.1% | View All 25 Rows |
Immigrants in Tybee Island
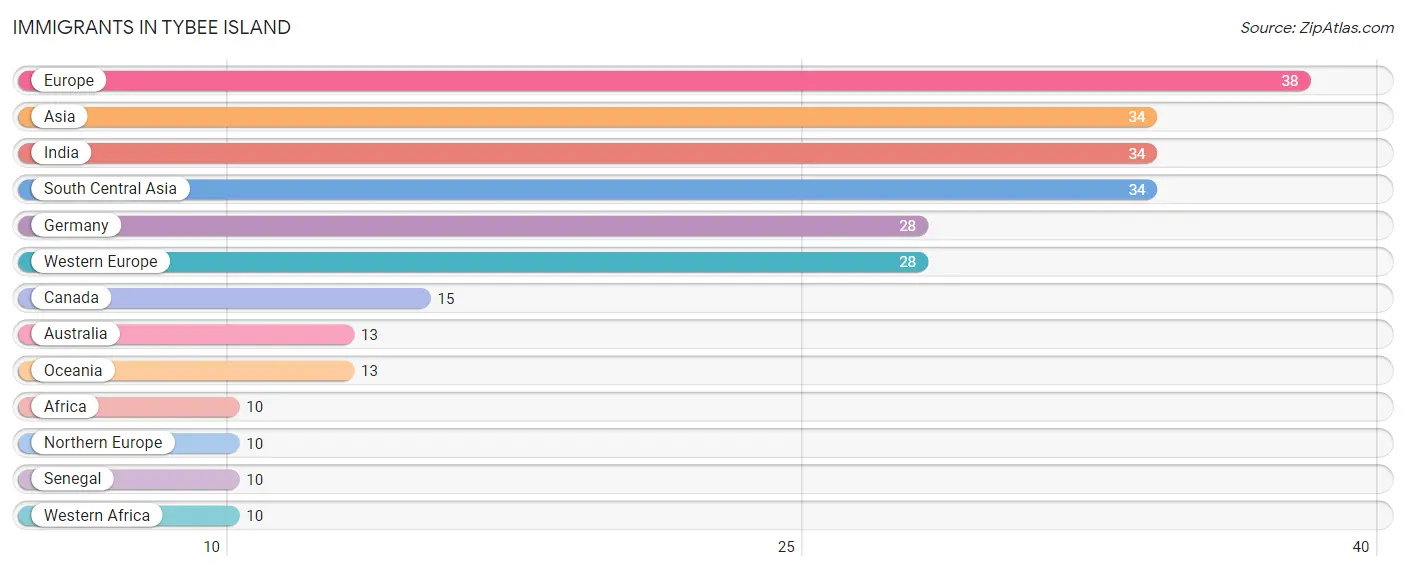
The most numerous immigrant groups reported in Tybee Island came from Europe (38 | 1.2%), Asia (34 | 1.1%), India (34 | 1.1%), South Central Asia (34 | 1.1%), and Germany (28 | 0.9%), together accounting for 5.4% of all Tybee Island residents.
| Immigration Origin | # Population | % Population |
| Africa | 10 | 0.3% |
| Asia | 34 | 1.1% |
| Australia | 13 | 0.4% |
| Canada | 15 | 0.5% |
| Europe | 38 | 1.2% |
| Germany | 28 | 0.9% |
| India | 34 | 1.1% |
| Northern Europe | 10 | 0.3% |
| Oceania | 13 | 0.4% |
| Senegal | 10 | 0.3% |
| South Central Asia | 34 | 1.1% |
| Western Africa | 10 | 0.3% |
| Western Europe | 28 | 0.9% | View All 13 Rows |
Sex and Age in Tybee Island
Sex and Age in Tybee Island
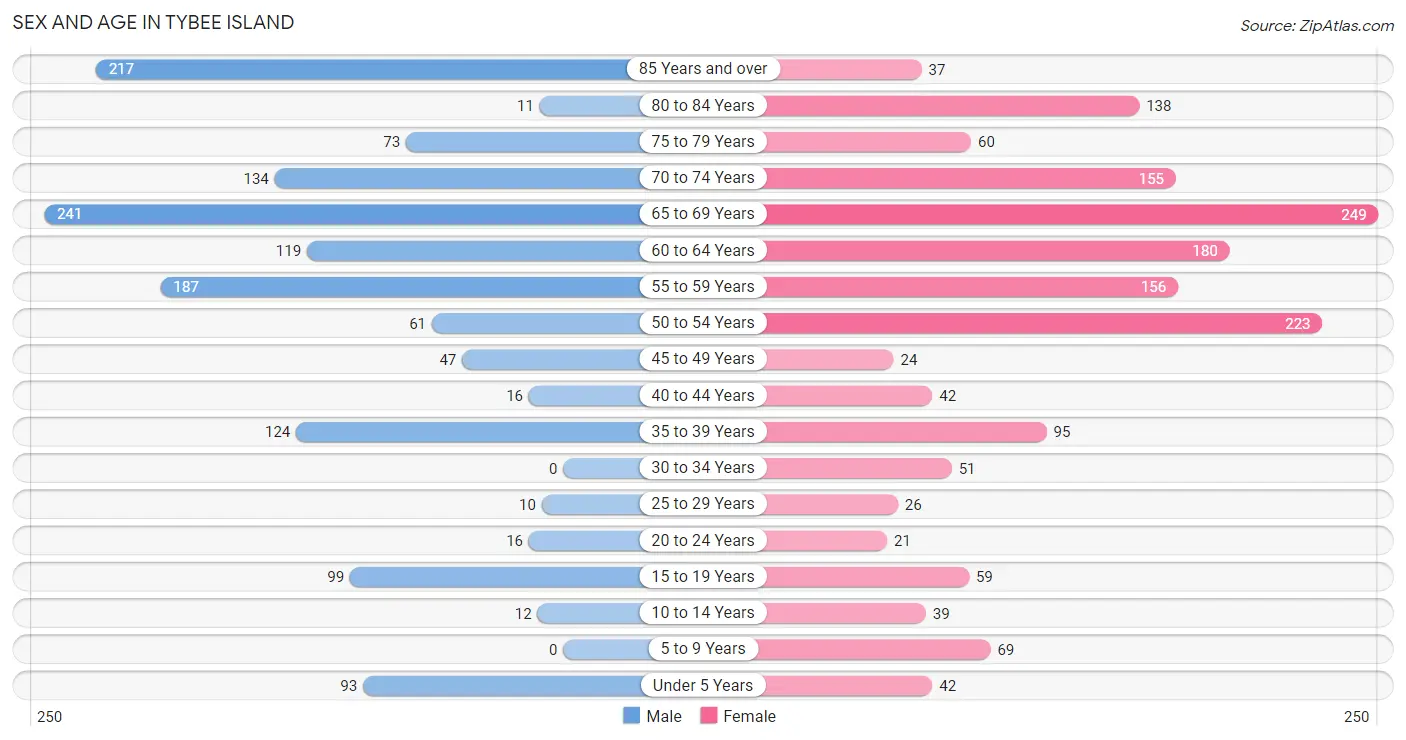
The most populous age groups in Tybee Island are 65 to 69 Years (241 | 16.5%) for men and 65 to 69 Years (249 | 14.9%) for women.
| Age Bracket | Male | Female |
| Under 5 Years | 93 (6.4%) | 42 (2.5%) |
| 5 to 9 Years | 0 (0.0%) | 69 (4.1%) |
| 10 to 14 Years | 12 (0.8%) | 39 (2.3%) |
| 15 to 19 Years | 99 (6.8%) | 59 (3.5%) |
| 20 to 24 Years | 16 (1.1%) | 21 (1.3%) |
| 25 to 29 Years | 10 (0.7%) | 26 (1.6%) |
| 30 to 34 Years | 0 (0.0%) | 51 (3.1%) |
| 35 to 39 Years | 124 (8.5%) | 95 (5.7%) |
| 40 to 44 Years | 16 (1.1%) | 42 (2.5%) |
| 45 to 49 Years | 47 (3.2%) | 24 (1.4%) |
| 50 to 54 Years | 61 (4.2%) | 223 (13.4%) |
| 55 to 59 Years | 187 (12.8%) | 156 (9.4%) |
| 60 to 64 Years | 119 (8.2%) | 180 (10.8%) |
| 65 to 69 Years | 241 (16.5%) | 249 (14.9%) |
| 70 to 74 Years | 134 (9.2%) | 155 (9.3%) |
| 75 to 79 Years | 73 (5.0%) | 60 (3.6%) |
| 80 to 84 Years | 11 (0.7%) | 138 (8.3%) |
| 85 Years and over | 217 (14.9%) | 37 (2.2%) |
| Total | 1,460 (100.0%) | 1,666 (100.0%) |
Families and Households in Tybee Island
Median Family Size in Tybee Island
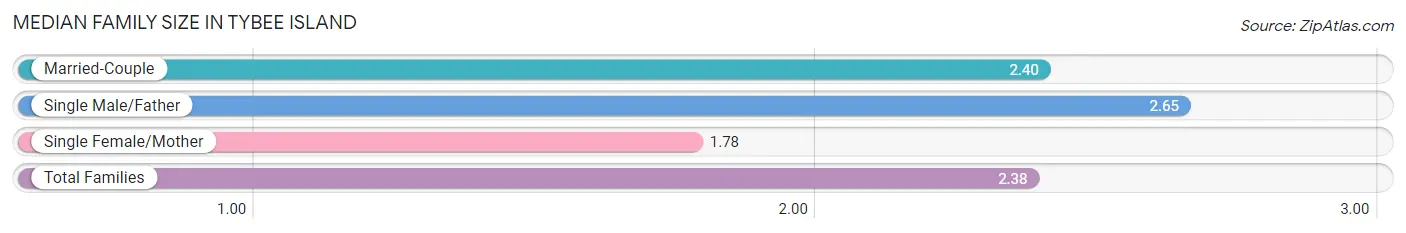
The median family size in Tybee Island is 2.38 persons per family, with single male/father families (74 | 6.9%) accounting for the largest median family size of 2.65 persons per family. On the other hand, single female/mother families (72 | 6.7%) represent the smallest median family size with 1.78 persons per family.
| Family Type | # Families | Family Size |
| Married-Couple | 932 (86.5%) | 2.40 |
| Single Male/Father | 74 (6.9%) | 2.65 |
| Single Female/Mother | 72 (6.7%) | 1.78 |
| Total Families | 1,078 (100.0%) | 2.38 |
Median Household Size in Tybee Island
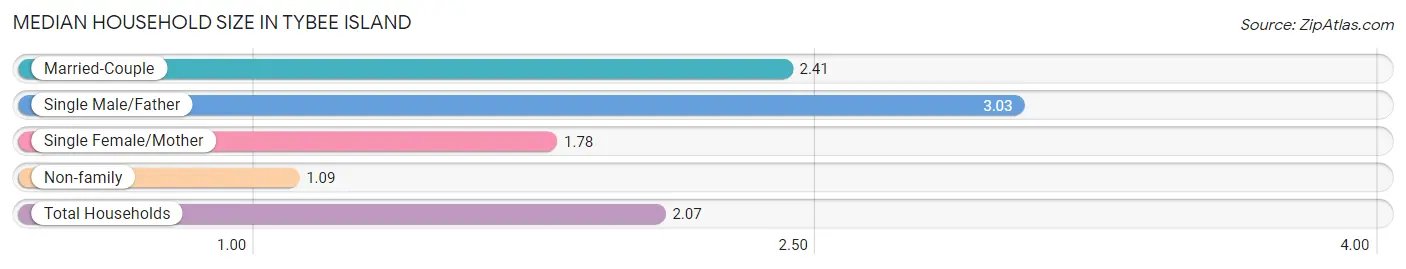
The median household size in Tybee Island is 2.07 persons per household, with single male/father households (74 | 5.1%) accounting for the largest median household size of 3.03 persons per household. non-family households (379 | 26.0%) represent the smallest median household size with 1.09 persons per household.
| Household Type | # Households | Household Size |
| Married-Couple | 932 (64.0%) | 2.41 |
| Single Male/Father | 74 (5.1%) | 3.03 |
| Single Female/Mother | 72 (4.9%) | 1.78 |
| Non-family | 379 (26.0%) | 1.09 |
| Total Households | 1,457 (100.0%) | 2.07 |
Household Size by Marriage Status in Tybee Island
Out of a total of 1,457 households in Tybee Island, 1,078 (74.0%) are family households, while 379 (26.0%) are nonfamily households. The most numerous type of family households are 2-person households, comprising 672, and the most common type of nonfamily households are 1-person households, comprising 349.
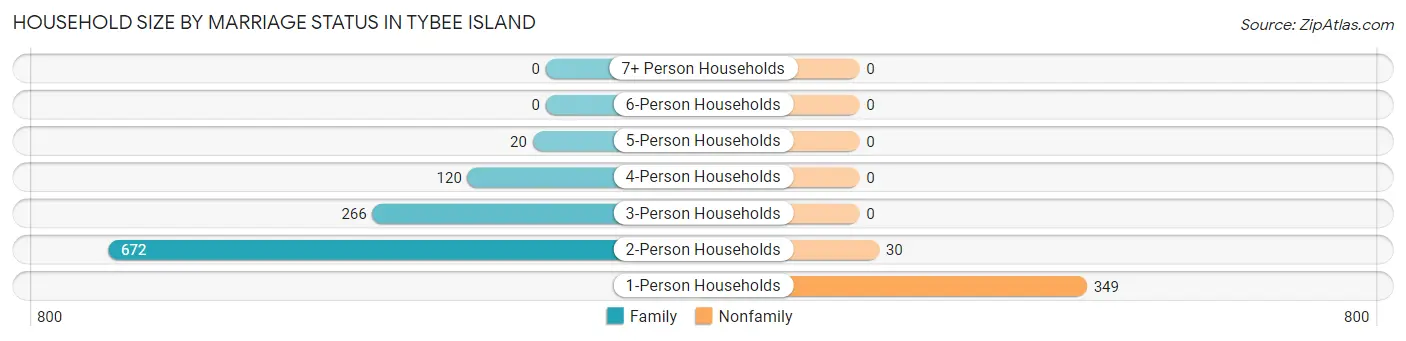
| Household Size | Family Households | Nonfamily Households |
| 1-Person Households | - | 349 (23.9%) |
| 2-Person Households | 672 (46.1%) | 30 (2.1%) |
| 3-Person Households | 266 (18.3%) | 0 (0.0%) |
| 4-Person Households | 120 (8.2%) | 0 (0.0%) |
| 5-Person Households | 20 (1.4%) | 0 (0.0%) |
| 6-Person Households | 0 (0.0%) | 0 (0.0%) |
| 7+ Person Households | 0 (0.0%) | 0 (0.0%) |
| Total | 1,078 (74.0%) | 379 (26.0%) |
Female Fertility in Tybee Island
Fertility by Age in Tybee Island
| Age Bracket | Women with Births | Births / 1,000 Women |
| 15 to 19 years | 0 (0.0%) | 0.0 |
| 20 to 34 years | 0 (0.0%) | 0.0 |
| 35 to 50 years | 0 (0.0%) | 0.0 |
| Total | 0 (0.0%) | 0.0 |
Fertility by Age by Marriage Status in Tybee Island
| Age Bracket | Married | Unmarried |
| 15 to 19 years | 0 (0.0%) | 0 (0.0%) |
| 20 to 34 years | 0 (0.0%) | 0 (0.0%) |
| 35 to 50 years | 0 (0.0%) | 0 (0.0%) |
| Total | 0 (0.0%) | 0 (0.0%) |
Fertility by Education in Tybee Island
| Educational Attainment | Women with Births | Births / 1,000 Women |
| Less than High School | 0 (0.0%) | 0.0 |
| High School Diploma | 0 (0.0%) | 0.0 |
| College or Associate's Degree | 0 (0.0%) | 0.0 |
| Bachelor's Degree | 0 (0.0%) | 0.0 |
| Graduate Degree | 0 (0.0%) | 0.0 |
| Total | 0 (0.0%) | 0.0 |
Fertility by Education by Marriage Status in Tybee Island
| Educational Attainment | Married | Unmarried |
| Less than High School | 0 (0.0%) | 0 (0.0%) |
| High School Diploma | 0 (0.0%) | 0 (0.0%) |
| College or Associate's Degree | 0 (0.0%) | 0 (0.0%) |
| Bachelor's Degree | 0 (0.0%) | 0 (0.0%) |
| Graduate Degree | 0 (0.0%) | 0 (0.0%) |
| Total | 0 (0.0%) | 0 (0.0%) |
Employment Characteristics in Tybee Island
Employment by Class of Employer in Tybee Island
Among the 1,224 employed individuals in Tybee Island, private company employees (744 | 60.8%), not-for-profit organizations (114 | 9.3%), and self-employed (incorporated) (105 | 8.6%) make up the most common classes of employment.
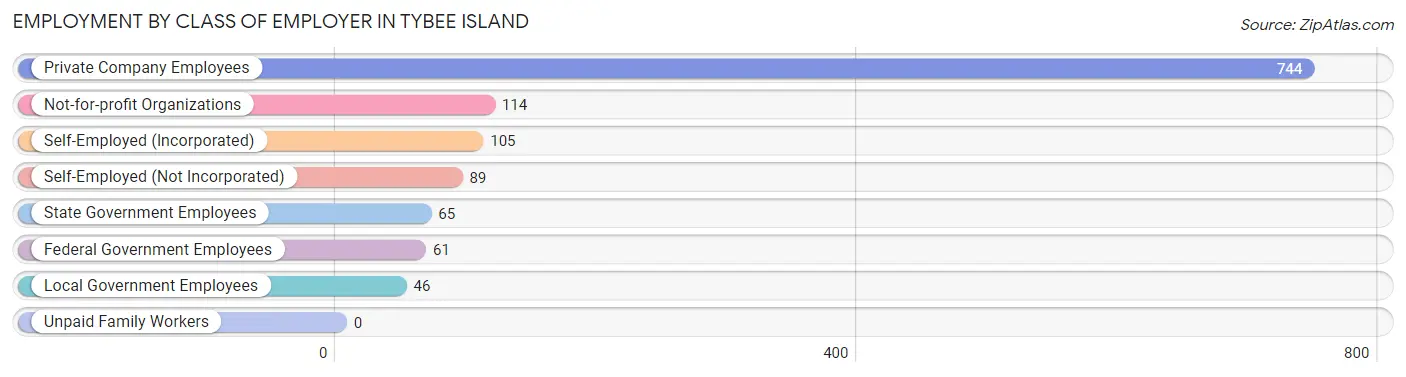
| Employer Class | # Employees | % Employees |
| Private Company Employees | 744 | 60.8% |
| Self-Employed (Incorporated) | 105 | 8.6% |
| Self-Employed (Not Incorporated) | 89 | 7.3% |
| Not-for-profit Organizations | 114 | 9.3% |
| Local Government Employees | 46 | 3.8% |
| State Government Employees | 65 | 5.3% |
| Federal Government Employees | 61 | 5.0% |
| Unpaid Family Workers | 0 | 0.0% |
| Total | 1,224 | 100.0% |
Employment Status by Age in Tybee Island
According to the labor force statistics for Tybee Island, out of the total population over 16 years of age (2,864), 44.3% or 1,269 individuals are in the labor force, with 3.6% or 46 of them unemployed. The age group with the highest labor force participation rate is 25 to 29 years, with 100.0% or 36 individuals in the labor force. Within the labor force, the 45 to 54 years age range has the highest percentage of unemployed individuals, with 9.8% or 31 of them being unemployed.
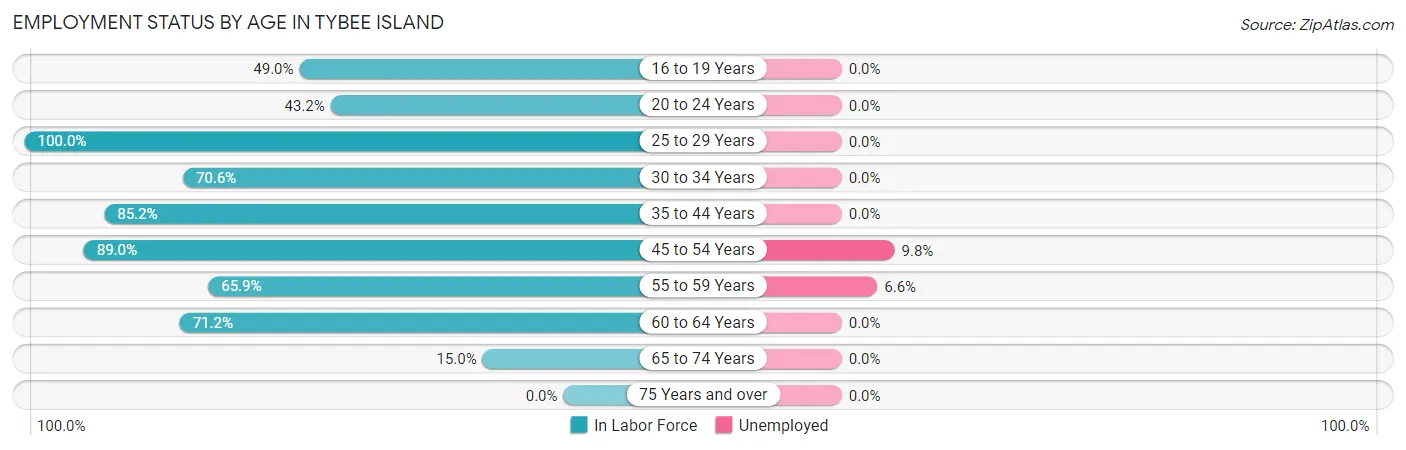
| Age Bracket | In Labor Force | Unemployed |
| 16 to 19 Years | 74 (49.0%) | 0 (0.0%) |
| 20 to 24 Years | 16 (43.2%) | 0 (0.0%) |
| 25 to 29 Years | 36 (100.0%) | 0 (0.0%) |
| 30 to 34 Years | 36 (70.6%) | 0 (0.0%) |
| 35 to 44 Years | 236 (85.2%) | 0 (0.0%) |
| 45 to 54 Years | 316 (89.0%) | 31 (9.8%) |
| 55 to 59 Years | 226 (65.9%) | 15 (6.6%) |
| 60 to 64 Years | 213 (71.2%) | 0 (0.0%) |
| 65 to 74 Years | 117 (15.0%) | 0 (0.0%) |
| 75 Years and over | 0 (0.0%) | 0 (0.0%) |
| Total | 1,269 (44.3%) | 46 (3.6%) |
Employment Status by Educational Attainment in Tybee Island
According to labor force statistics for Tybee Island, 78.1% of individuals (1,063) out of the total population between 25 and 64 years of age (1,361) are in the labor force, with 4.3% or 46 of them being unemployed. The group with the highest labor force participation rate are those with the educational attainment of less than high school, with 88.6% or 31 individuals in the labor force. Within the labor force, individuals with high school diploma education have the highest percentage of unemployment, with 7.3% or 15 of them being unemployed.
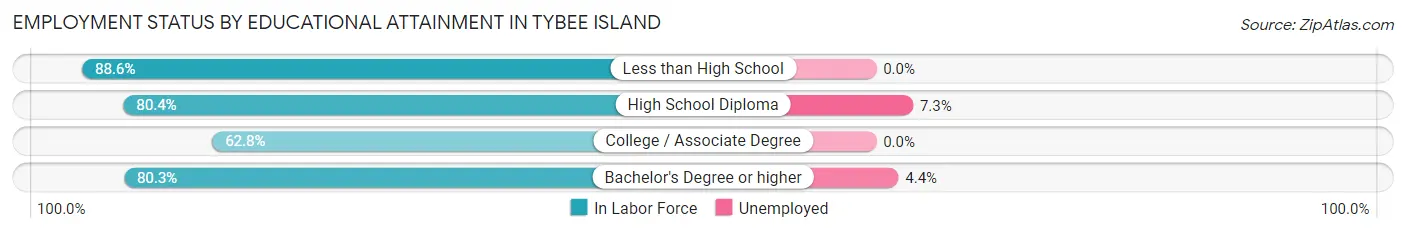
| Educational Attainment | In Labor Force | Unemployed |
| Less than High School | 31 (88.6%) | 0 (0.0%) |
| High School Diploma | 205 (80.4%) | 19 (7.3%) |
| College / Associate Degree | 120 (62.8%) | 0 (0.0%) |
| Bachelor's Degree or higher | 707 (80.3%) | 39 (4.4%) |
| Total | 1,063 (78.1%) | 59 (4.3%) |
Employment Occupations by Sex in Tybee Island
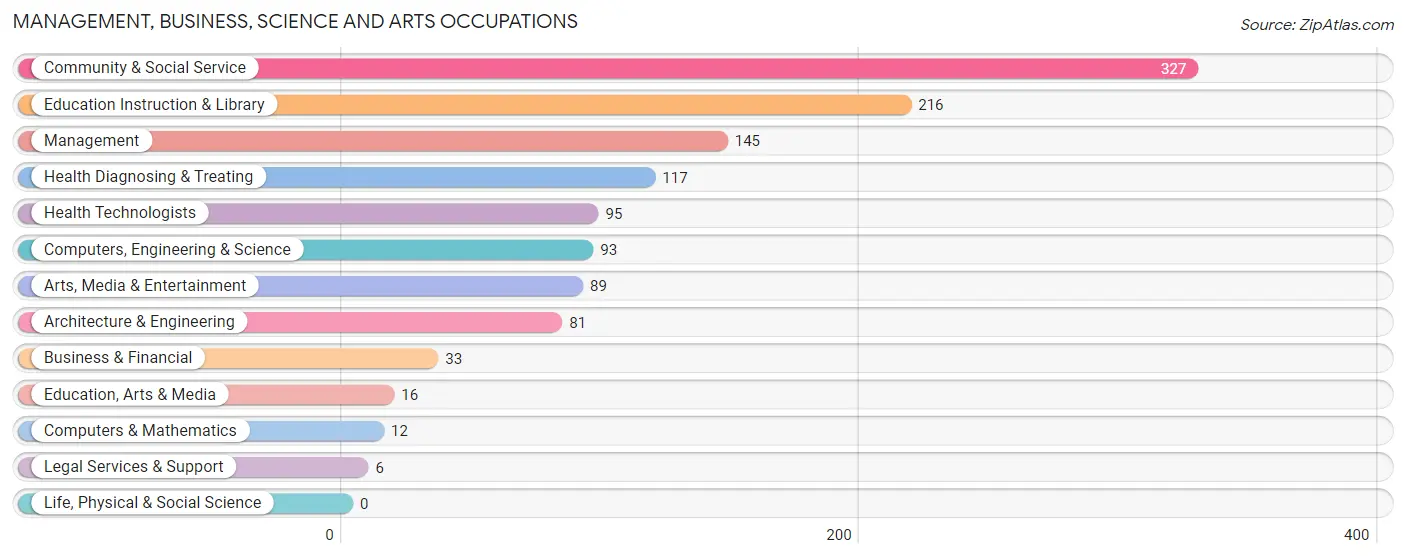
Management, Business, Science and Arts Occupations
The most common Management, Business, Science and Arts occupations in Tybee Island are Community & Social Service (327 | 26.7%), Education Instruction & Library (216 | 17.6%), Management (145 | 11.8%), Health Diagnosing & Treating (117 | 9.6%), and Health Technologists (95 | 7.8%).
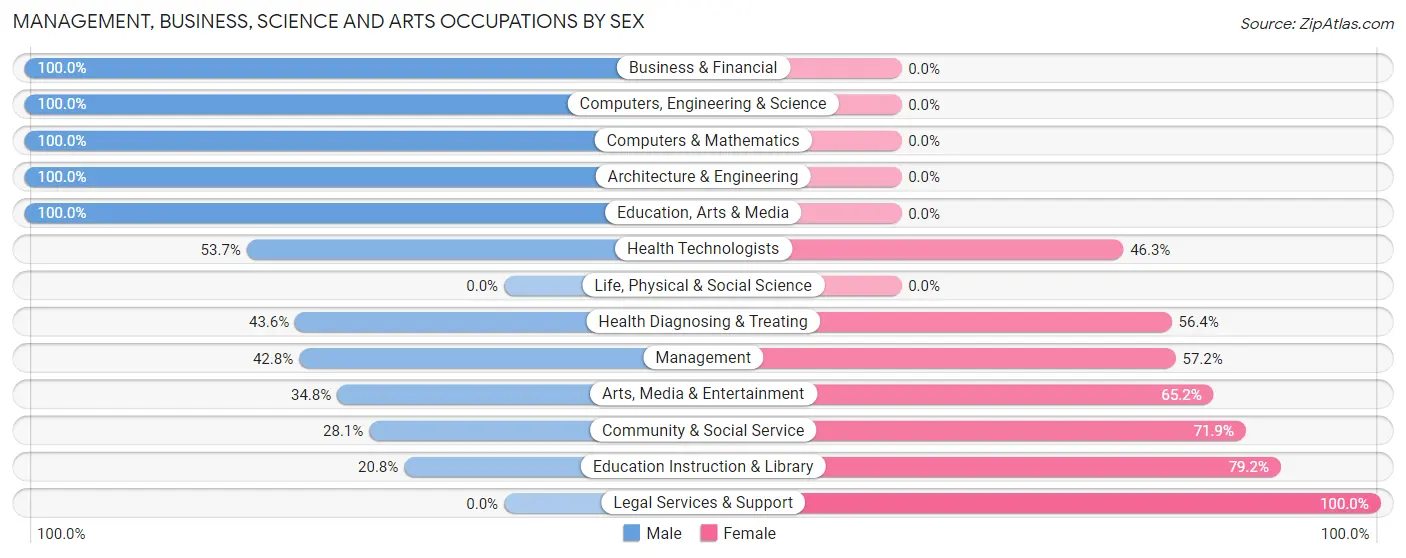
Management, Business, Science and Arts Occupations by Sex
Within the Management, Business, Science and Arts occupations in Tybee Island, the most male-oriented occupations are Business & Financial (100.0%), Computers, Engineering & Science (100.0%), and Computers & Mathematics (100.0%), while the most female-oriented occupations are Legal Services & Support (100.0%), Education Instruction & Library (79.2%), and Community & Social Service (71.9%).
| Occupation | Male | Female |
| Management | 62 (42.8%) | 83 (57.2%) |
| Business & Financial | 33 (100.0%) | 0 (0.0%) |
| Computers, Engineering & Science | 93 (100.0%) | 0 (0.0%) |
| Computers & Mathematics | 12 (100.0%) | 0 (0.0%) |
| Architecture & Engineering | 81 (100.0%) | 0 (0.0%) |
| Life, Physical & Social Science | 0 (0.0%) | 0 (0.0%) |
| Community & Social Service | 92 (28.1%) | 235 (71.9%) |
| Education, Arts & Media | 16 (100.0%) | 0 (0.0%) |
| Legal Services & Support | 0 (0.0%) | 6 (100.0%) |
| Education Instruction & Library | 45 (20.8%) | 171 (79.2%) |
| Arts, Media & Entertainment | 31 (34.8%) | 58 (65.2%) |
| Health Diagnosing & Treating | 51 (43.6%) | 66 (56.4%) |
| Health Technologists | 51 (53.7%) | 44 (46.3%) |
| Total (Category) | 331 (46.3%) | 384 (53.7%) |
| Total (Overall) | 603 (49.3%) | 621 (50.7%) |
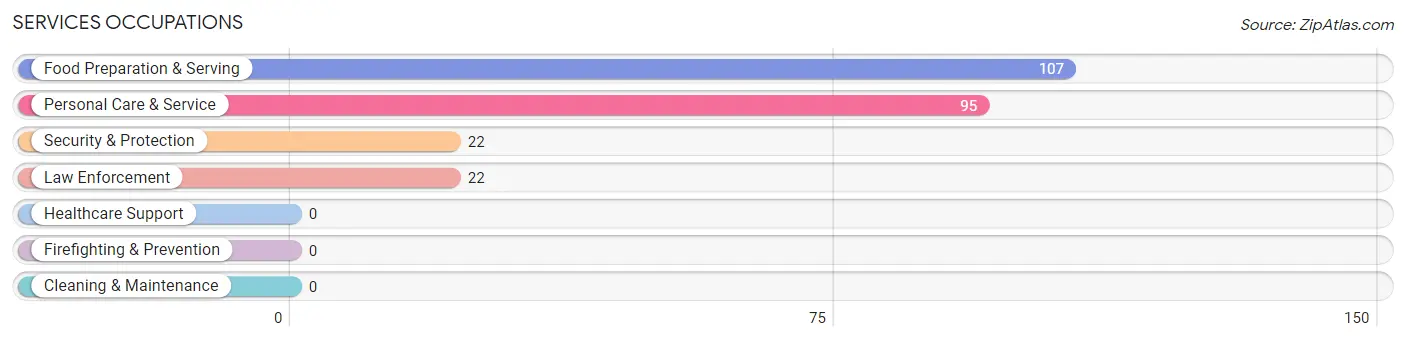
Services Occupations
The most common Services occupations in Tybee Island are Food Preparation & Serving (107 | 8.7%), Personal Care & Service (95 | 7.8%), Security & Protection (22 | 1.8%), and Law Enforcement (22 | 1.8%).
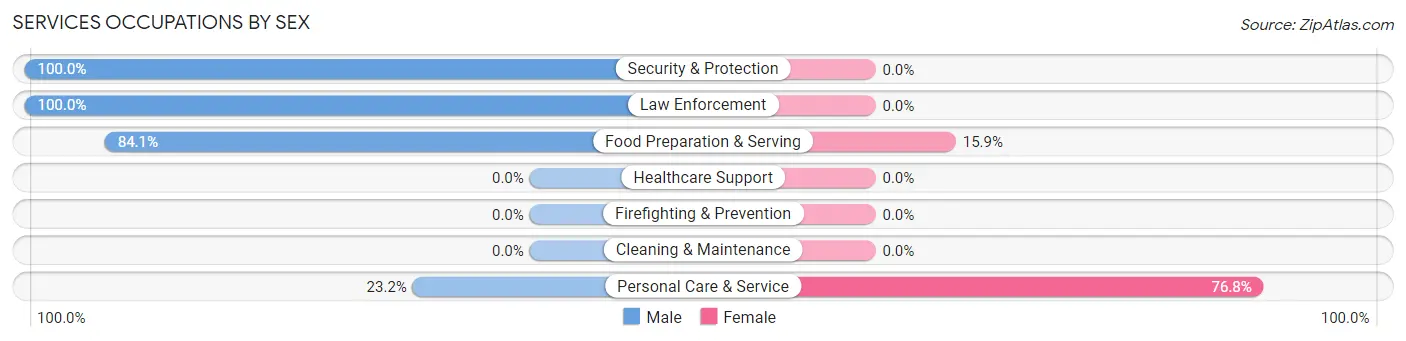
Services Occupations by Sex
Within the Services occupations in Tybee Island, the most male-oriented occupations are Security & Protection (100.0%), Law Enforcement (100.0%), and Food Preparation & Serving (84.1%), while the most female-oriented occupations are Personal Care & Service (76.8%), and Food Preparation & Serving (15.9%).
| Occupation | Male | Female |
| Healthcare Support | 0 (0.0%) | 0 (0.0%) |
| Security & Protection | 22 (100.0%) | 0 (0.0%) |
| Firefighting & Prevention | 0 (0.0%) | 0 (0.0%) |
| Law Enforcement | 22 (100.0%) | 0 (0.0%) |
| Food Preparation & Serving | 90 (84.1%) | 17 (15.9%) |
| Cleaning & Maintenance | 0 (0.0%) | 0 (0.0%) |
| Personal Care & Service | 22 (23.2%) | 73 (76.8%) |
| Total (Category) | 134 (59.8%) | 90 (40.2%) |
| Total (Overall) | 603 (49.3%) | 621 (50.7%) |
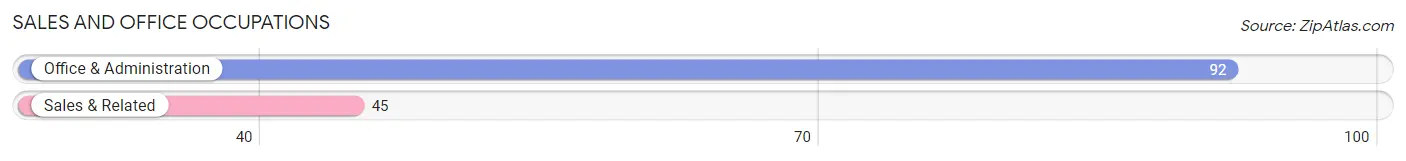
Sales and Office Occupations
The most common Sales and Office occupations in Tybee Island are Office & Administration (92 | 7.5%), and Sales & Related (45 | 3.7%).
Sales and Office Occupations by Sex
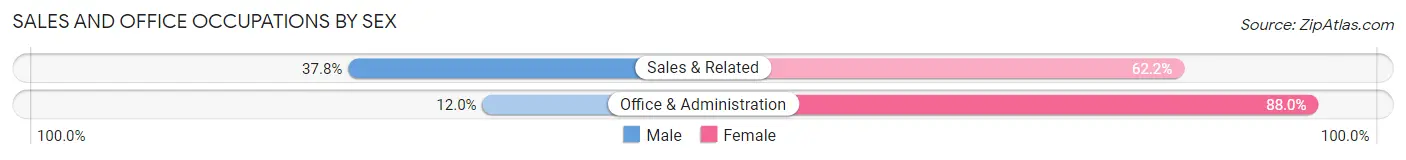
| Occupation | Male | Female |
| Sales & Related | 17 (37.8%) | 28 (62.2%) |
| Office & Administration | 11 (12.0%) | 81 (88.0%) |
| Total (Category) | 28 (20.4%) | 109 (79.6%) |
| Total (Overall) | 603 (49.3%) | 621 (50.7%) |
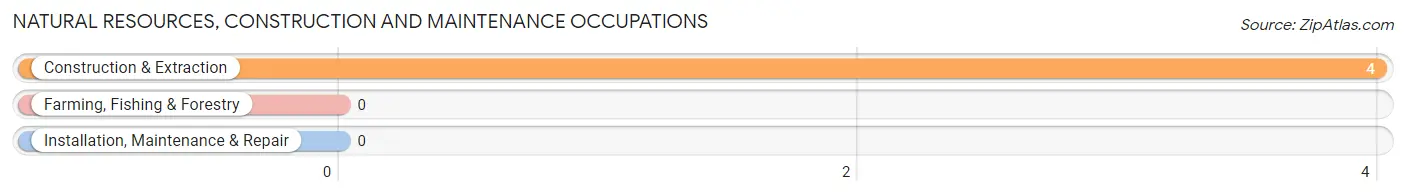
Natural Resources, Construction and Maintenance Occupations
The most common Natural Resources, Construction and Maintenance occupations in Tybee Island are , and Construction & Extraction (4 | 0.3%).
Natural Resources, Construction and Maintenance Occupations by Sex
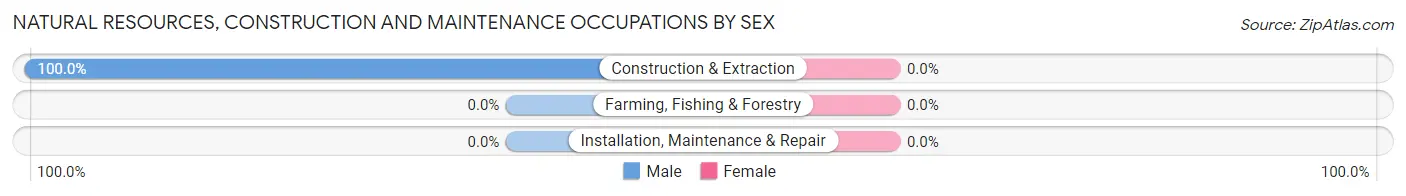
| Occupation | Male | Female |
| Farming, Fishing & Forestry | 0 (0.0%) | 0 (0.0%) |
| Construction & Extraction | 4 (100.0%) | 0 (0.0%) |
| Installation, Maintenance & Repair | 0 (0.0%) | 0 (0.0%) |
| Total (Category) | 4 (100.0%) | 0 (0.0%) |
| Total (Overall) | 603 (49.3%) | 621 (50.7%) |
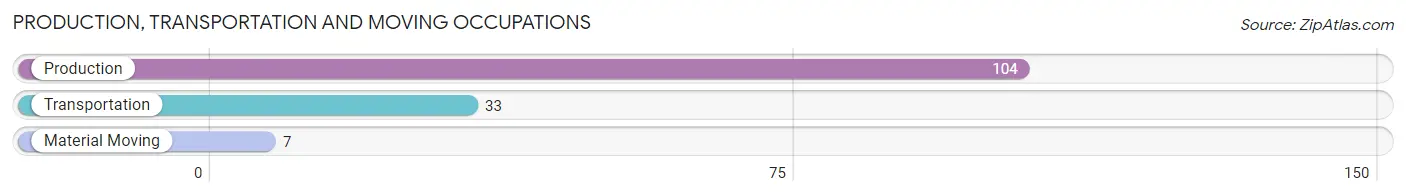
Production, Transportation and Moving Occupations
The most common Production, Transportation and Moving occupations in Tybee Island are Production (104 | 8.5%), Transportation (33 | 2.7%), and Material Moving (7 | 0.6%).
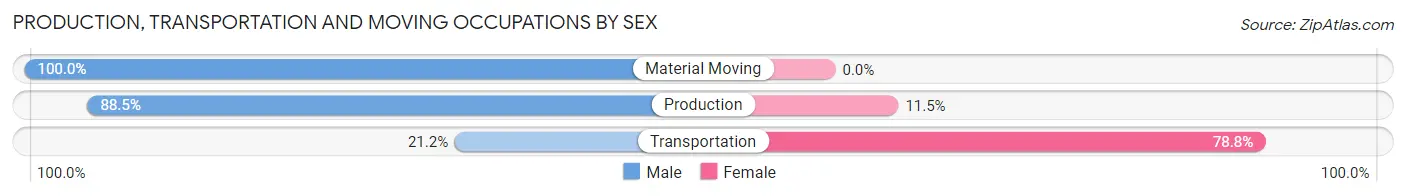
Production, Transportation and Moving Occupations by Sex
| Occupation | Male | Female |
| Production | 92 (88.5%) | 12 (11.5%) |
| Transportation | 7 (21.2%) | 26 (78.8%) |
| Material Moving | 7 (100.0%) | 0 (0.0%) |
| Total (Category) | 106 (73.6%) | 38 (26.4%) |
| Total (Overall) | 603 (49.3%) | 621 (50.7%) |
Employment Industries by Sex in Tybee Island
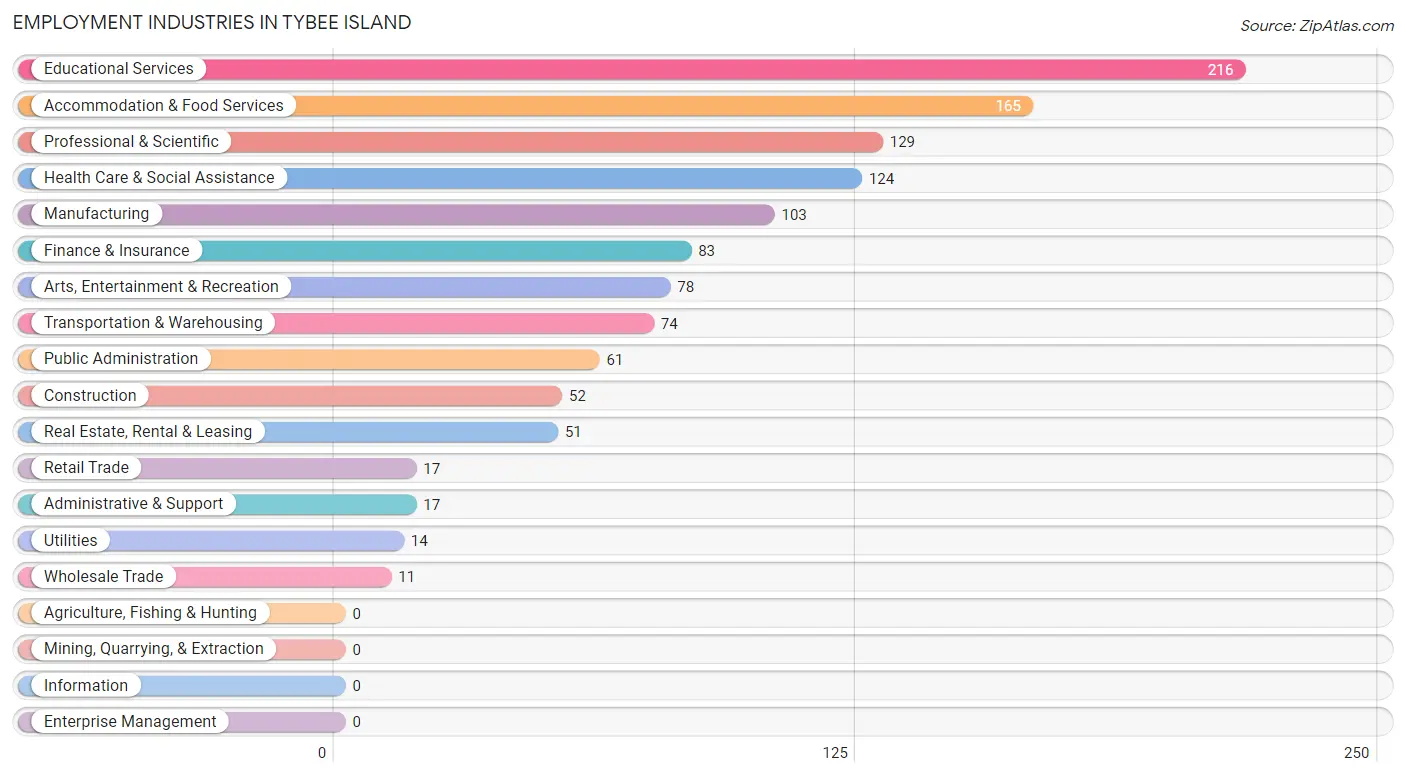
Employment Industries in Tybee Island
The major employment industries in Tybee Island include Educational Services (216 | 17.6%), Accommodation & Food Services (165 | 13.5%), Professional & Scientific (129 | 10.5%), Health Care & Social Assistance (124 | 10.1%), and Manufacturing (103 | 8.4%).
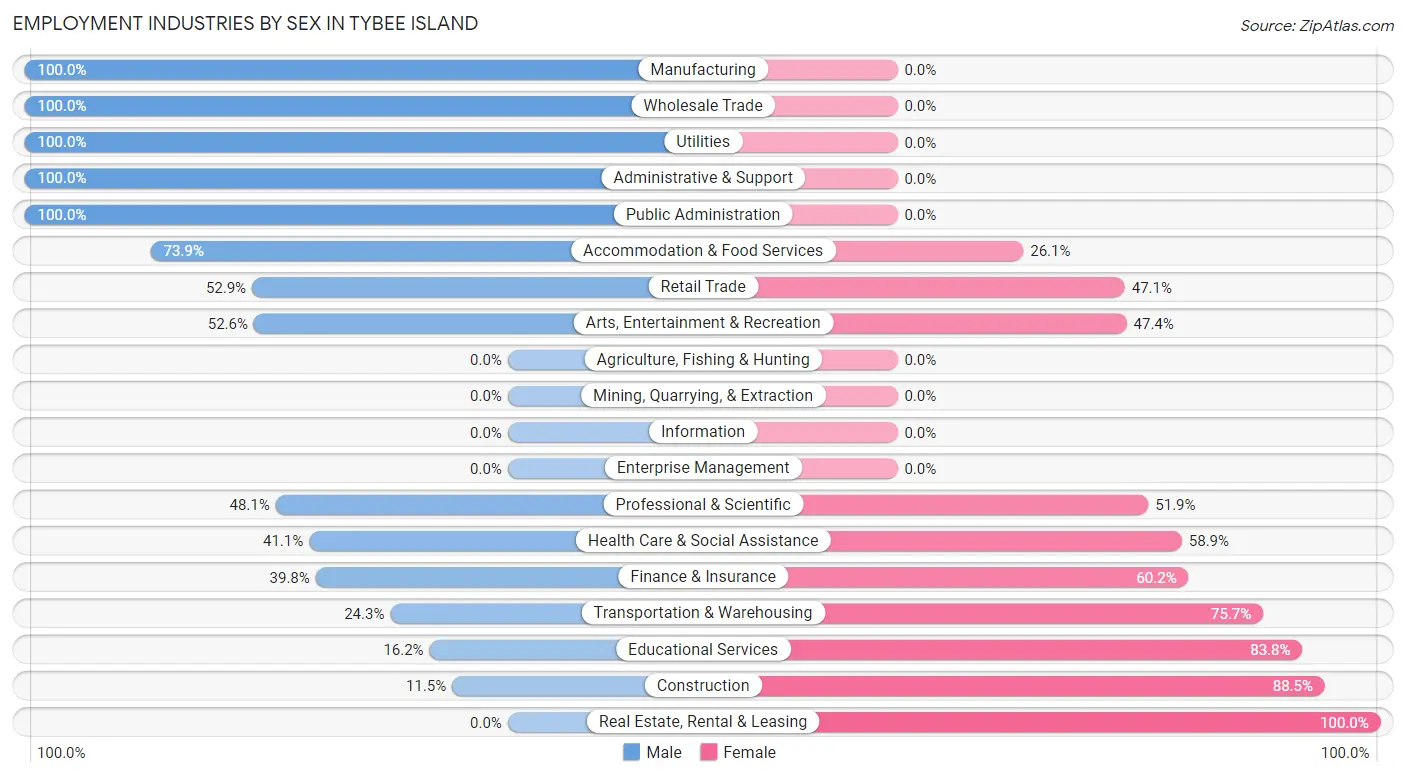
Employment Industries by Sex in Tybee Island
The Tybee Island industries that see more men than women are Manufacturing (100.0%), Wholesale Trade (100.0%), and Utilities (100.0%), whereas the industries that tend to have a higher number of women are Real Estate, Rental & Leasing (100.0%), Construction (88.5%), and Educational Services (83.8%).
| Industry | Male | Female |
| Agriculture, Fishing & Hunting | 0 (0.0%) | 0 (0.0%) |
| Mining, Quarrying, & Extraction | 0 (0.0%) | 0 (0.0%) |
| Construction | 6 (11.5%) | 46 (88.5%) |
| Manufacturing | 103 (100.0%) | 0 (0.0%) |
| Wholesale Trade | 11 (100.0%) | 0 (0.0%) |
| Retail Trade | 9 (52.9%) | 8 (47.1%) |
| Transportation & Warehousing | 18 (24.3%) | 56 (75.7%) |
| Utilities | 14 (100.0%) | 0 (0.0%) |
| Information | 0 (0.0%) | 0 (0.0%) |
| Finance & Insurance | 33 (39.8%) | 50 (60.2%) |
| Real Estate, Rental & Leasing | 0 (0.0%) | 51 (100.0%) |
| Professional & Scientific | 62 (48.1%) | 67 (51.9%) |
| Enterprise Management | 0 (0.0%) | 0 (0.0%) |
| Administrative & Support | 17 (100.0%) | 0 (0.0%) |
| Educational Services | 35 (16.2%) | 181 (83.8%) |
| Health Care & Social Assistance | 51 (41.1%) | 73 (58.9%) |
| Arts, Entertainment & Recreation | 41 (52.6%) | 37 (47.4%) |
| Accommodation & Food Services | 122 (73.9%) | 43 (26.1%) |
| Public Administration | 61 (100.0%) | 0 (0.0%) |
| Total | 603 (49.3%) | 621 (50.7%) |
Education in Tybee Island
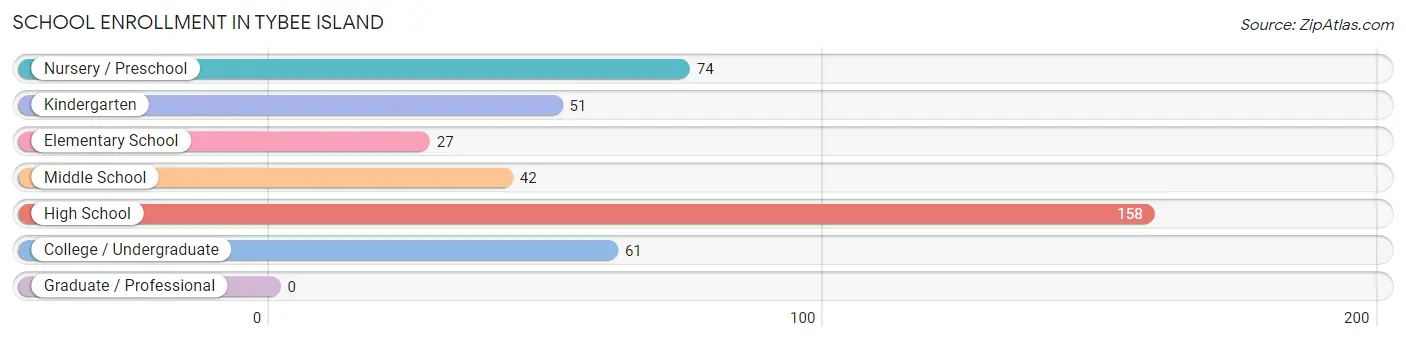
School Enrollment in Tybee Island
The most common levels of schooling among the 413 students in Tybee Island are high school (158 | 38.3%), nursery / preschool (74 | 17.9%), and college / undergraduate (61 | 14.8%).
| School Level | # Students | % Students |
| Nursery / Preschool | 74 | 17.9% |
| Kindergarten | 51 | 12.3% |
| Elementary School | 27 | 6.5% |
| Middle School | 42 | 10.2% |
| High School | 158 | 38.3% |
| College / Undergraduate | 61 | 14.8% |
| Graduate / Professional | 0 | 0.0% |
| Total | 413 | 100.0% |
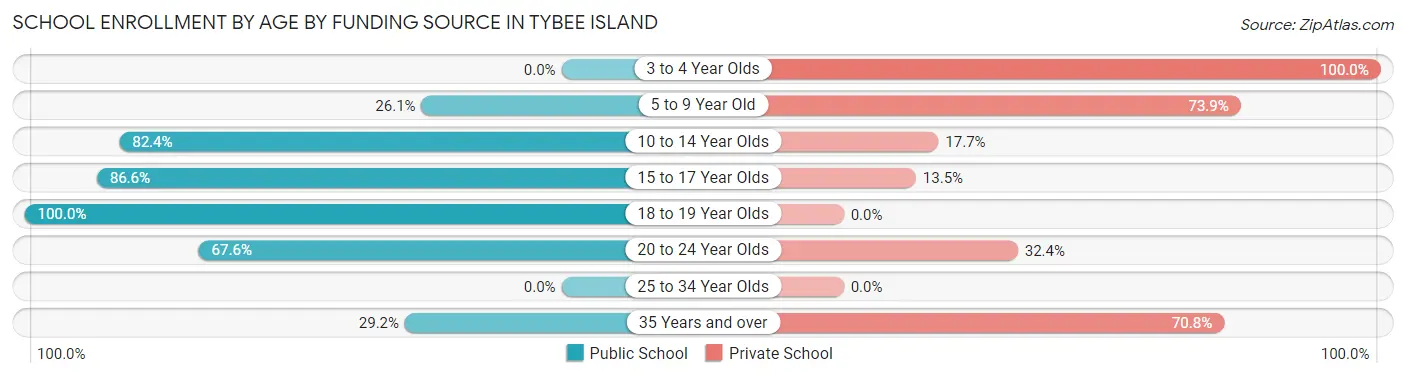
School Enrollment by Age by Funding Source in Tybee Island
Out of a total of 413 students who are enrolled in schools in Tybee Island, 179 (43.3%) attend a private institution, while the remaining 234 (56.7%) are enrolled in public schools. The age group of 3 to 4 year olds has the highest likelihood of being enrolled in private schools, with 74 (100.0% in the age bracket) enrolled. Conversely, the age group of 18 to 19 year olds has the lowest likelihood of being enrolled in a private school, with 39 (100.0% in the age bracket) attending a public institution.
| Age Bracket | Public School | Private School |
| 3 to 4 Year Olds | 0 (0.0%) | 74 (100.0%) |
| 5 to 9 Year Old | 18 (26.1%) | 51 (73.9%) |
| 10 to 14 Year Olds | 42 (82.4%) | 9 (17.6%) |
| 15 to 17 Year Olds | 103 (86.6%) | 16 (13.5%) |
| 18 to 19 Year Olds | 39 (100.0%) | 0 (0.0%) |
| 20 to 24 Year Olds | 25 (67.6%) | 12 (32.4%) |
| 25 to 34 Year Olds | 0 (0.0%) | 0 (0.0%) |
| 35 Years and over | 7 (29.2%) | 17 (70.8%) |
| Total | 234 (56.7%) | 179 (43.3%) |
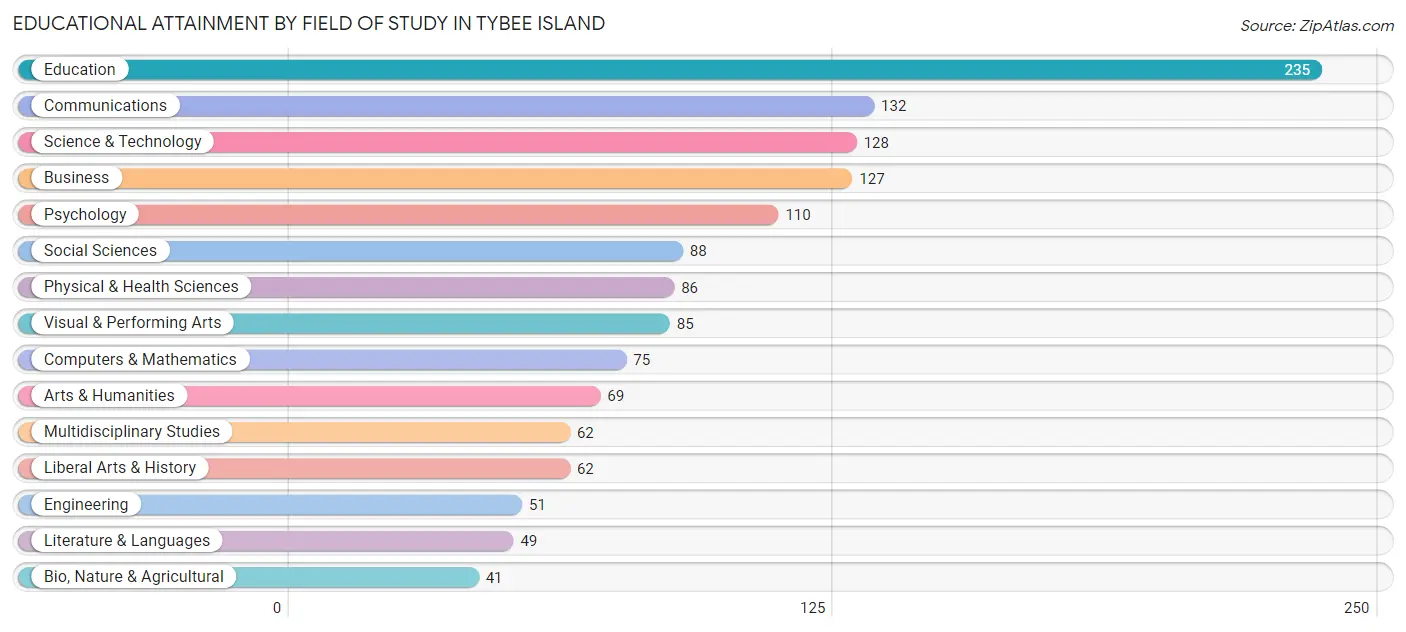
Educational Attainment by Field of Study in Tybee Island
Education (235 | 16.8%), communications (132 | 9.4%), science & technology (128 | 9.1%), business (127 | 9.1%), and psychology (110 | 7.9%) are the most common fields of study among 1,400 individuals in Tybee Island who have obtained a bachelor's degree or higher.
| Field of Study | # Graduates | % Graduates |
| Computers & Mathematics | 75 | 5.4% |
| Bio, Nature & Agricultural | 41 | 2.9% |
| Physical & Health Sciences | 86 | 6.1% |
| Psychology | 110 | 7.9% |
| Social Sciences | 88 | 6.3% |
| Engineering | 51 | 3.6% |
| Multidisciplinary Studies | 62 | 4.4% |
| Science & Technology | 128 | 9.1% |
| Business | 127 | 9.1% |
| Education | 235 | 16.8% |
| Literature & Languages | 49 | 3.5% |
| Liberal Arts & History | 62 | 4.4% |
| Visual & Performing Arts | 85 | 6.1% |
| Communications | 132 | 9.4% |
| Arts & Humanities | 69 | 4.9% |
| Total | 1,400 | 100.0% |
Transportation & Commute in Tybee Island
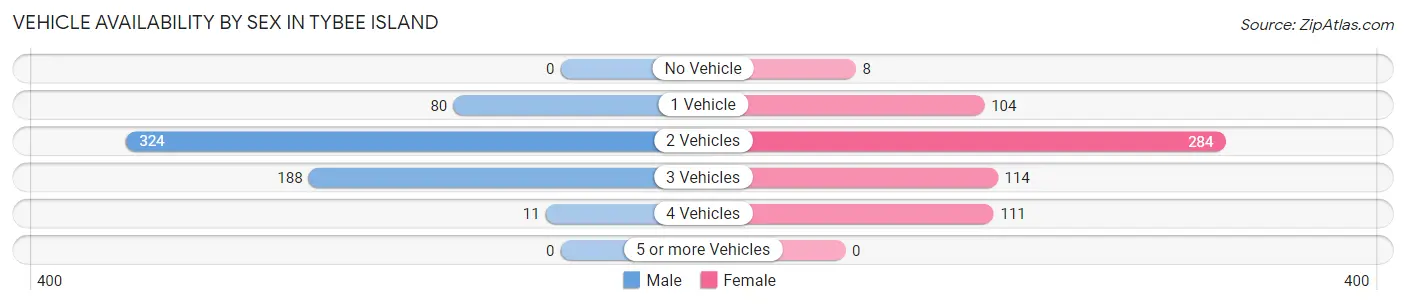
Vehicle Availability by Sex in Tybee Island
The most prevalent vehicle ownership categories in Tybee Island are males with 2 vehicles (324, accounting for 53.7%) and females with 2 vehicles (284, making up 52.2%).
| Vehicles Available | Male | Female |
| No Vehicle | 0 (0.0%) | 8 (1.3%) |
| 1 Vehicle | 80 (13.3%) | 104 (16.8%) |
| 2 Vehicles | 324 (53.7%) | 284 (45.7%) |
| 3 Vehicles | 188 (31.2%) | 114 (18.4%) |
| 4 Vehicles | 11 (1.8%) | 111 (17.9%) |
| 5 or more Vehicles | 0 (0.0%) | 0 (0.0%) |
| Total | 603 (100.0%) | 621 (100.0%) |
Commute Time in Tybee Island
The most frequently occuring commute durations in Tybee Island are 30 to 34 minutes (304 commuters, 30.8%), 5 to 9 minutes (176 commuters, 17.8%), and 10 to 14 minutes (84 commuters, 8.5%).
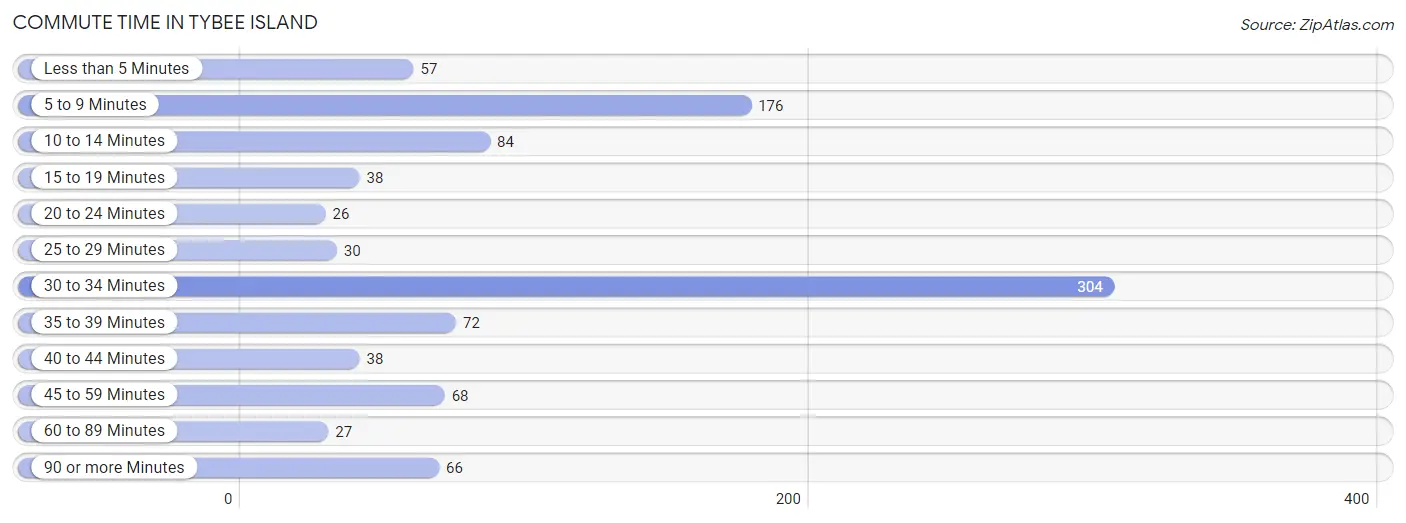
| Commute Time | # Commuters | % Commuters |
| Less than 5 Minutes | 57 | 5.8% |
| 5 to 9 Minutes | 176 | 17.8% |
| 10 to 14 Minutes | 84 | 8.5% |
| 15 to 19 Minutes | 38 | 3.8% |
| 20 to 24 Minutes | 26 | 2.6% |
| 25 to 29 Minutes | 30 | 3.0% |
| 30 to 34 Minutes | 304 | 30.8% |
| 35 to 39 Minutes | 72 | 7.3% |
| 40 to 44 Minutes | 38 | 3.8% |
| 45 to 59 Minutes | 68 | 6.9% |
| 60 to 89 Minutes | 27 | 2.7% |
| 90 or more Minutes | 66 | 6.7% |
Commute Time by Sex in Tybee Island
The most common commute times in Tybee Island are 5 to 9 minutes (102 commuters, 22.4%) for males and 30 to 34 minutes (282 commuters, 53.2%) for females.
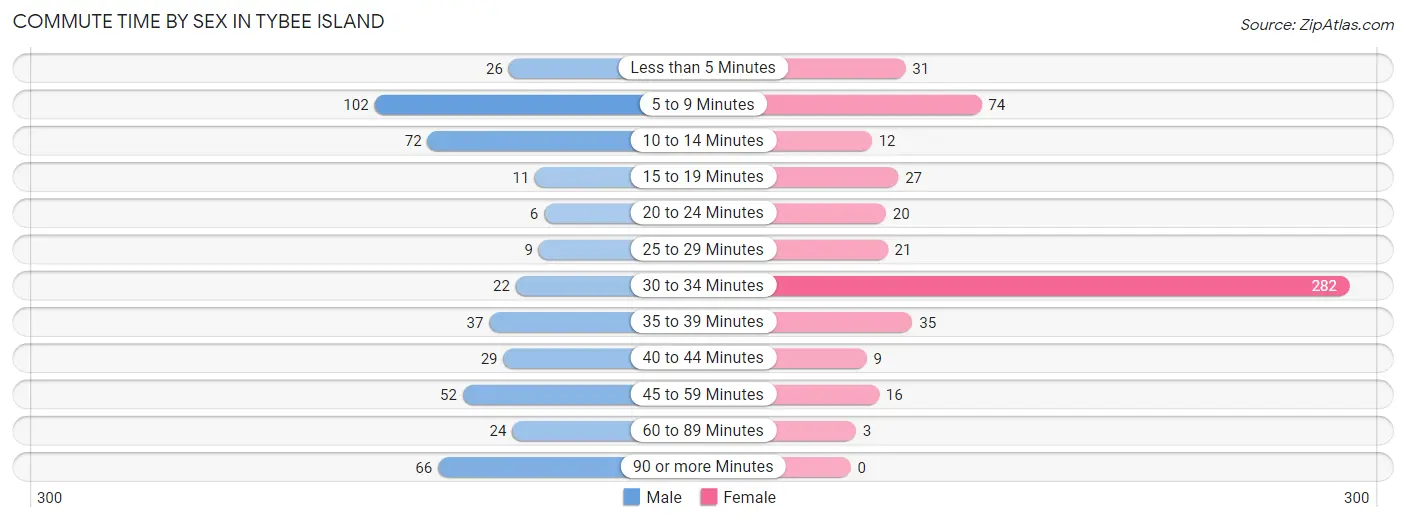
| Commute Time | Male | Female |
| Less than 5 Minutes | 26 (5.7%) | 31 (5.9%) |
| 5 to 9 Minutes | 102 (22.4%) | 74 (14.0%) |
| 10 to 14 Minutes | 72 (15.8%) | 12 (2.3%) |
| 15 to 19 Minutes | 11 (2.4%) | 27 (5.1%) |
| 20 to 24 Minutes | 6 (1.3%) | 20 (3.8%) |
| 25 to 29 Minutes | 9 (2.0%) | 21 (4.0%) |
| 30 to 34 Minutes | 22 (4.8%) | 282 (53.2%) |
| 35 to 39 Minutes | 37 (8.1%) | 35 (6.6%) |
| 40 to 44 Minutes | 29 (6.4%) | 9 (1.7%) |
| 45 to 59 Minutes | 52 (11.4%) | 16 (3.0%) |
| 60 to 89 Minutes | 24 (5.3%) | 3 (0.6%) |
| 90 or more Minutes | 66 (14.5%) | 0 (0.0%) |
Time of Departure to Work by Sex in Tybee Island
The most frequent times of departure to work in Tybee Island are 7:00 AM to 7:29 AM (92, 20.2%) for males and 7:00 AM to 7:29 AM (158, 29.8%) for females.
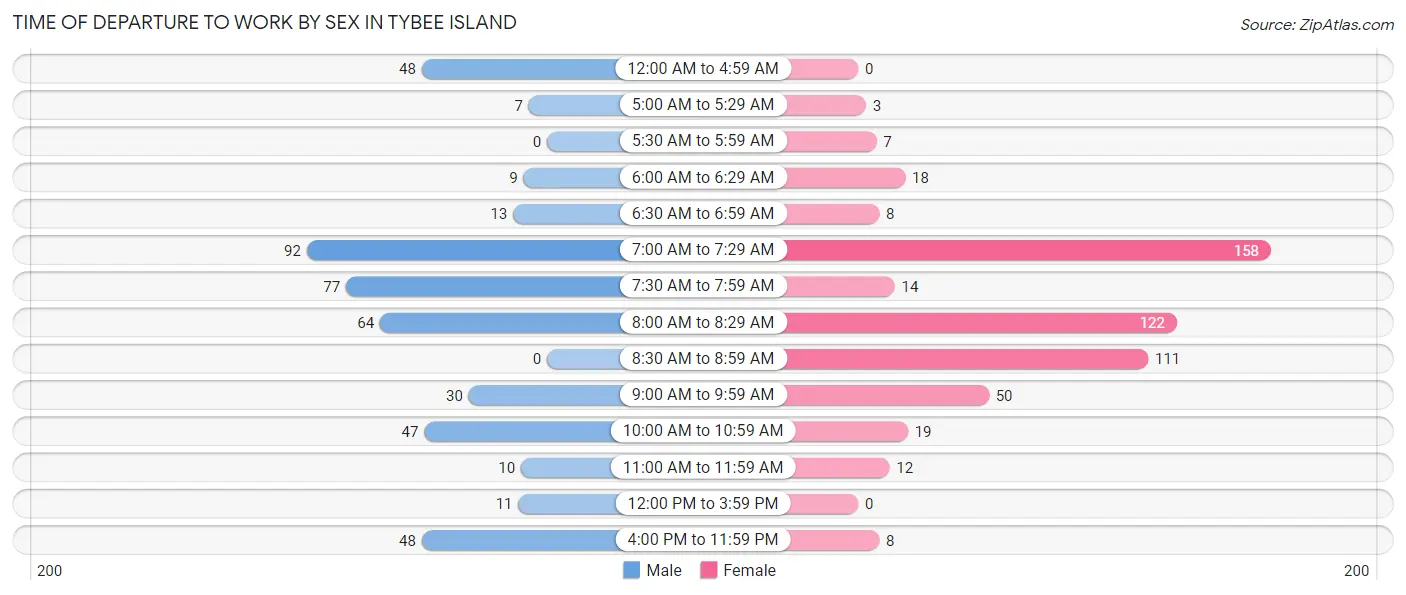
| Time of Departure | Male | Female |
| 12:00 AM to 4:59 AM | 48 (10.5%) | 0 (0.0%) |
| 5:00 AM to 5:29 AM | 7 (1.5%) | 3 (0.6%) |
| 5:30 AM to 5:59 AM | 0 (0.0%) | 7 (1.3%) |
| 6:00 AM to 6:29 AM | 9 (2.0%) | 18 (3.4%) |
| 6:30 AM to 6:59 AM | 13 (2.9%) | 8 (1.5%) |
| 7:00 AM to 7:29 AM | 92 (20.2%) | 158 (29.8%) |
| 7:30 AM to 7:59 AM | 77 (16.9%) | 14 (2.6%) |
| 8:00 AM to 8:29 AM | 64 (14.0%) | 122 (23.0%) |
| 8:30 AM to 8:59 AM | 0 (0.0%) | 111 (20.9%) |
| 9:00 AM to 9:59 AM | 30 (6.6%) | 50 (9.4%) |
| 10:00 AM to 10:59 AM | 47 (10.3%) | 19 (3.6%) |
| 11:00 AM to 11:59 AM | 10 (2.2%) | 12 (2.3%) |
| 12:00 PM to 3:59 PM | 11 (2.4%) | 0 (0.0%) |
| 4:00 PM to 11:59 PM | 48 (10.5%) | 8 (1.5%) |
| Total | 456 (100.0%) | 530 (100.0%) |
Housing Occupancy in Tybee Island
Occupancy by Ownership in Tybee Island
Of the total 1,457 dwellings in Tybee Island, owner-occupied units account for 1,307 (89.7%), while renter-occupied units make up 150 (10.3%).
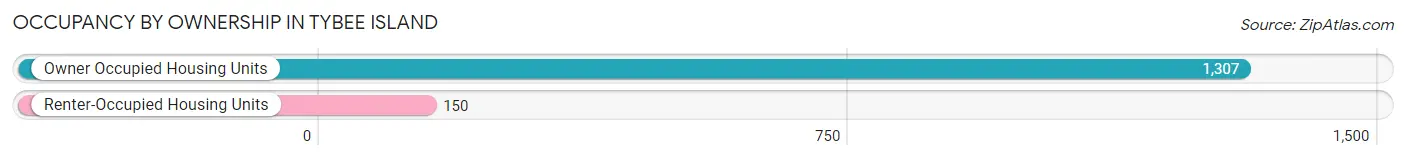
| Occupancy | # Housing Units | % Housing Units |
| Owner Occupied Housing Units | 1,307 | 89.7% |
| Renter-Occupied Housing Units | 150 | 10.3% |
| Total Occupied Housing Units | 1,457 | 100.0% |
Occupancy by Household Size in Tybee Island
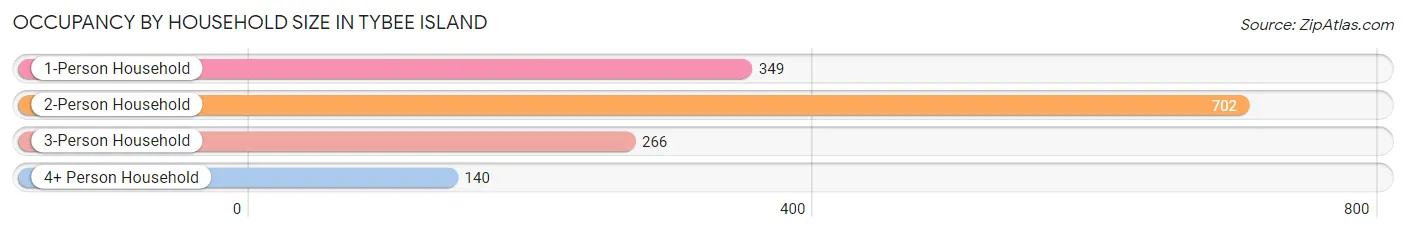
| Household Size | # Housing Units | % Housing Units |
| 1-Person Household | 349 | 23.9% |
| 2-Person Household | 702 | 48.2% |
| 3-Person Household | 266 | 18.3% |
| 4+ Person Household | 140 | 9.6% |
| Total Housing Units | 1,457 | 100.0% |
Occupancy by Ownership by Household Size in Tybee Island
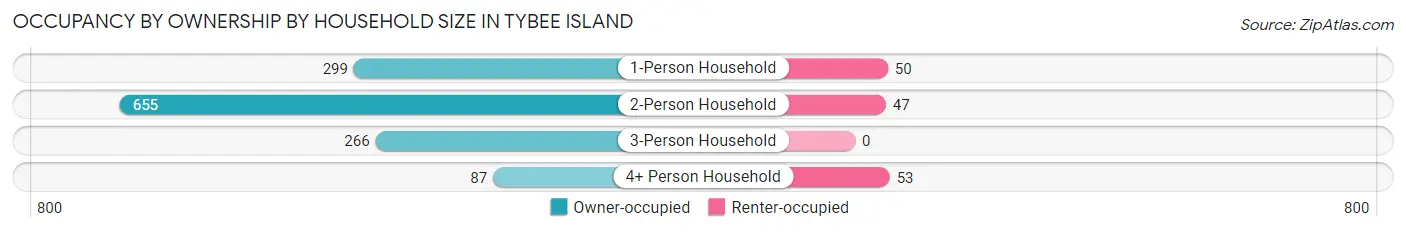
| Household Size | Owner-occupied | Renter-occupied |
| 1-Person Household | 299 (85.7%) | 50 (14.3%) |
| 2-Person Household | 655 (93.3%) | 47 (6.7%) |
| 3-Person Household | 266 (100.0%) | 0 (0.0%) |
| 4+ Person Household | 87 (62.1%) | 53 (37.9%) |
| Total Housing Units | 1,307 (89.7%) | 150 (10.3%) |
Occupancy by Educational Attainment in Tybee Island
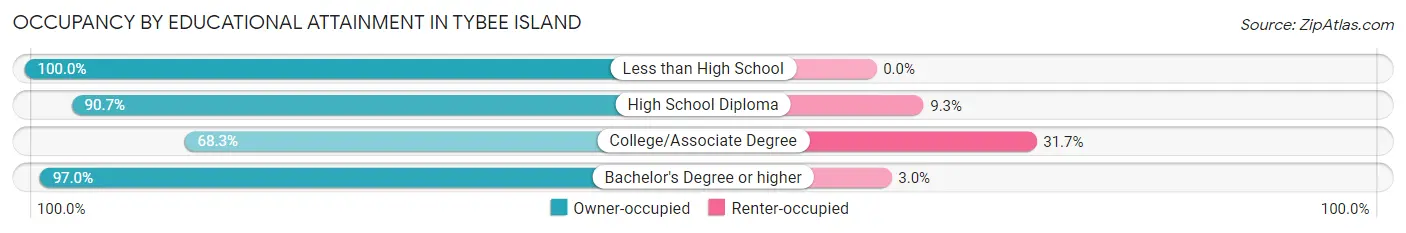
| Household Size | Owner-occupied | Renter-occupied |
| Less than High School | 37 (100.0%) | 0 (0.0%) |
| High School Diploma | 330 (90.7%) | 34 (9.3%) |
| College/Associate Degree | 200 (68.3%) | 93 (31.7%) |
| Bachelor's Degree or higher | 740 (97.0%) | 23 (3.0%) |
Occupancy by Age of Householder in Tybee Island
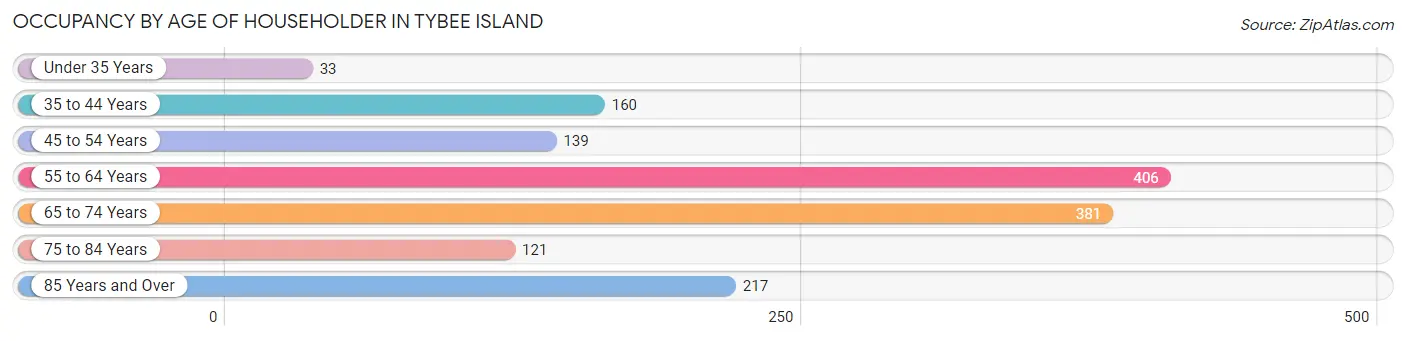
| Age Bracket | # Households | % Households |
| Under 35 Years | 33 | 2.3% |
| 35 to 44 Years | 160 | 11.0% |
| 45 to 54 Years | 139 | 9.5% |
| 55 to 64 Years | 406 | 27.9% |
| 65 to 74 Years | 381 | 26.2% |
| 75 to 84 Years | 121 | 8.3% |
| 85 Years and Over | 217 | 14.9% |
| Total | 1,457 | 100.0% |
Housing Finances in Tybee Island
Median Income by Occupancy in Tybee Island
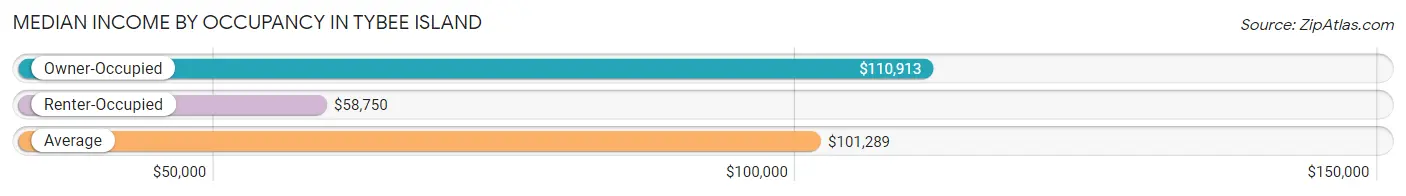
| Occupancy Type | # Households | Median Income |
| Owner-Occupied | 1,307 (89.7%) | $110,913 |
| Renter-Occupied | 150 (10.3%) | $58,750 |
| Average | 1,457 (100.0%) | $101,289 |
Occupancy by Householder Income Bracket in Tybee Island
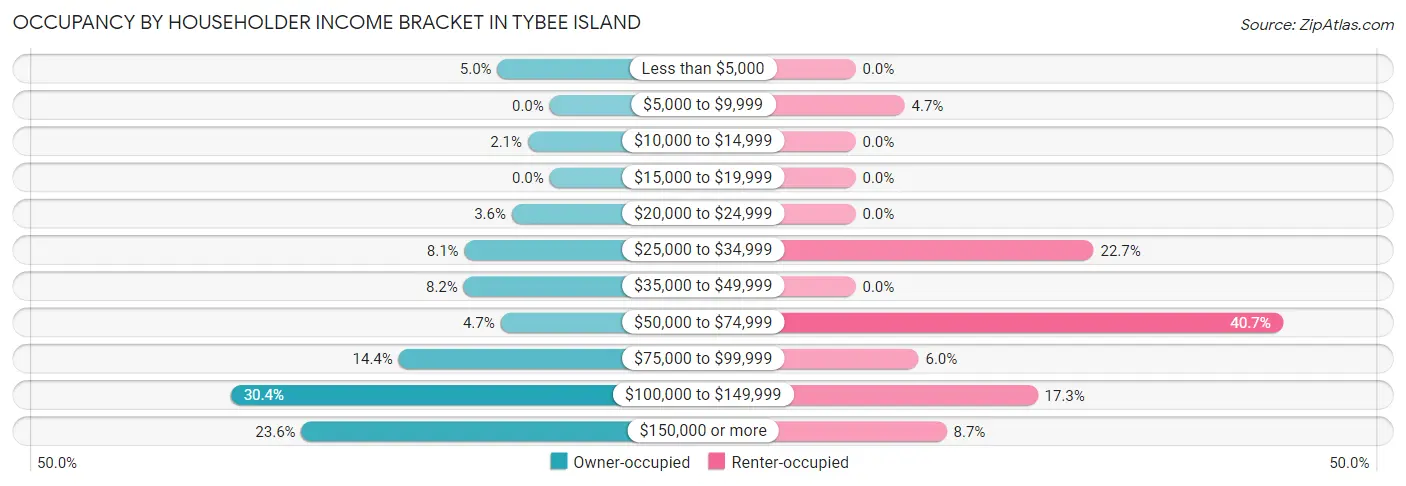
| Income Bracket | Owner-occupied | Renter-occupied |
| Less than $5,000 | 65 (5.0%) | 0 (0.0%) |
| $5,000 to $9,999 | 0 (0.0%) | 7 (4.7%) |
| $10,000 to $14,999 | 27 (2.1%) | 0 (0.0%) |
| $15,000 to $19,999 | 0 (0.0%) | 0 (0.0%) |
| $20,000 to $24,999 | 47 (3.6%) | 0 (0.0%) |
| $25,000 to $34,999 | 106 (8.1%) | 34 (22.7%) |
| $35,000 to $49,999 | 107 (8.2%) | 0 (0.0%) |
| $50,000 to $74,999 | 61 (4.7%) | 61 (40.7%) |
| $75,000 to $99,999 | 188 (14.4%) | 9 (6.0%) |
| $100,000 to $149,999 | 397 (30.4%) | 26 (17.3%) |
| $150,000 or more | 309 (23.6%) | 13 (8.7%) |
| Total | 1,307 (100.0%) | 150 (100.0%) |
Monthly Housing Cost Tiers in Tybee Island
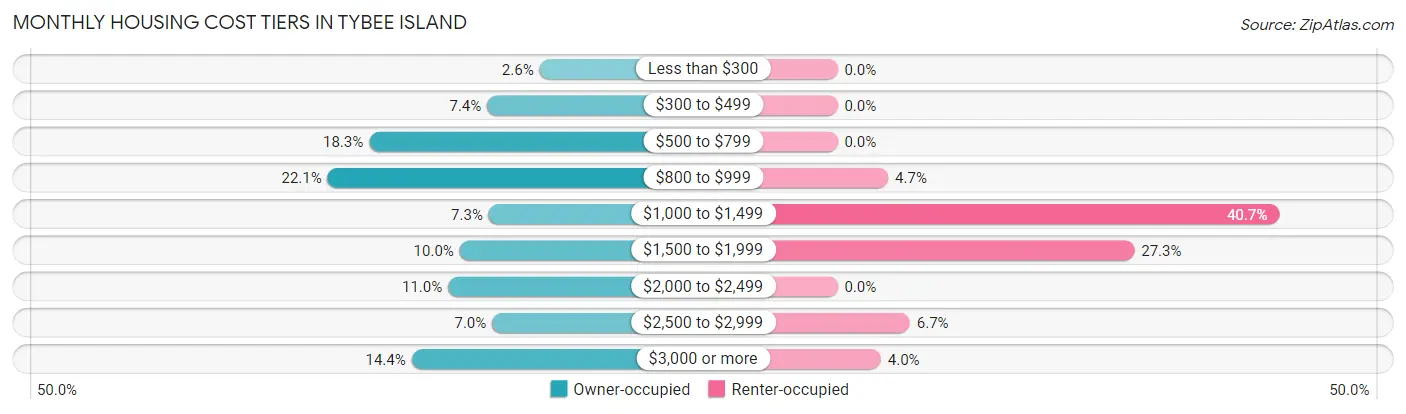
| Monthly Cost | Owner-occupied | Renter-occupied |
| Less than $300 | 34 (2.6%) | 0 (0.0%) |
| $300 to $499 | 97 (7.4%) | 0 (0.0%) |
| $500 to $799 | 239 (18.3%) | 0 (0.0%) |
| $800 to $999 | 289 (22.1%) | 7 (4.7%) |
| $1,000 to $1,499 | 95 (7.3%) | 61 (40.7%) |
| $1,500 to $1,999 | 130 (10.0%) | 41 (27.3%) |
| $2,000 to $2,499 | 144 (11.0%) | 0 (0.0%) |
| $2,500 to $2,999 | 91 (7.0%) | 10 (6.7%) |
| $3,000 or more | 188 (14.4%) | 6 (4.0%) |
| Total | 1,307 (100.0%) | 150 (100.0%) |
Physical Housing Characteristics in Tybee Island
Housing Structures in Tybee Island
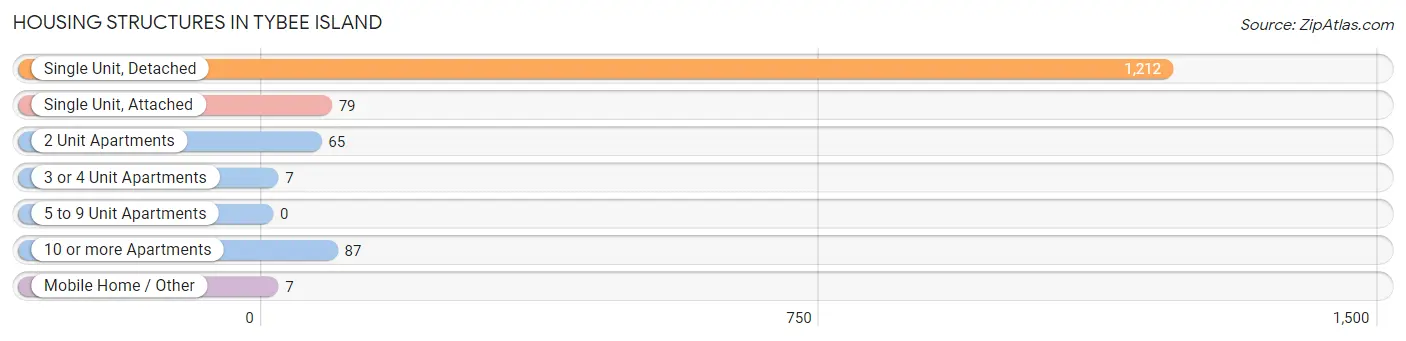
| Structure Type | # Housing Units | % Housing Units |
| Single Unit, Detached | 1,212 | 83.2% |
| Single Unit, Attached | 79 | 5.4% |
| 2 Unit Apartments | 65 | 4.5% |
| 3 or 4 Unit Apartments | 7 | 0.5% |
| 5 to 9 Unit Apartments | 0 | 0.0% |
| 10 or more Apartments | 87 | 6.0% |
| Mobile Home / Other | 7 | 0.5% |
| Total | 1,457 | 100.0% |
Housing Structures by Occupancy in Tybee Island
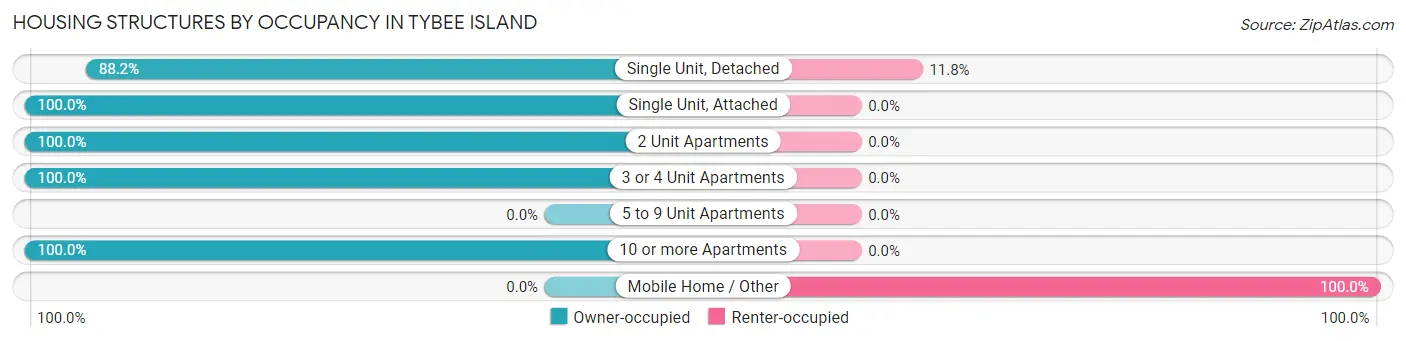
| Structure Type | Owner-occupied | Renter-occupied |
| Single Unit, Detached | 1,069 (88.2%) | 143 (11.8%) |
| Single Unit, Attached | 79 (100.0%) | 0 (0.0%) |
| 2 Unit Apartments | 65 (100.0%) | 0 (0.0%) |
| 3 or 4 Unit Apartments | 7 (100.0%) | 0 (0.0%) |
| 5 to 9 Unit Apartments | 0 (0.0%) | 0 (0.0%) |
| 10 or more Apartments | 87 (100.0%) | 0 (0.0%) |
| Mobile Home / Other | 0 (0.0%) | 7 (100.0%) |
| Total | 1,307 (89.7%) | 150 (10.3%) |
Housing Structures by Number of Rooms in Tybee Island
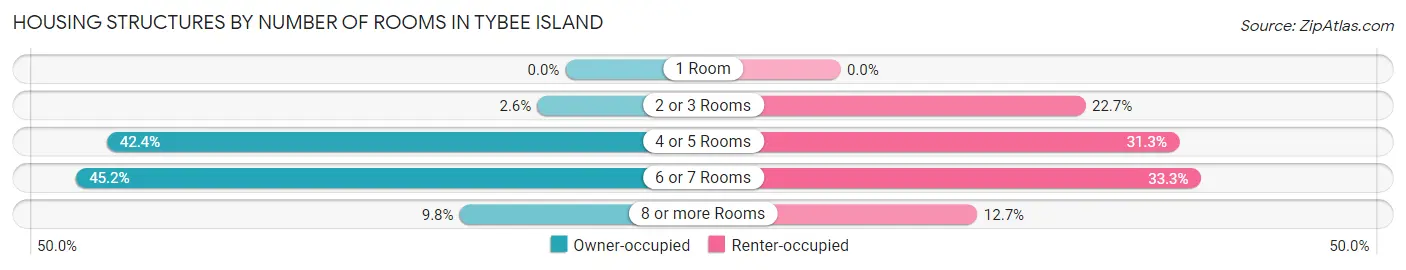
| Number of Rooms | Owner-occupied | Renter-occupied |
| 1 Room | 0 (0.0%) | 0 (0.0%) |
| 2 or 3 Rooms | 34 (2.6%) | 34 (22.7%) |
| 4 or 5 Rooms | 554 (42.4%) | 47 (31.3%) |
| 6 or 7 Rooms | 591 (45.2%) | 50 (33.3%) |
| 8 or more Rooms | 128 (9.8%) | 19 (12.7%) |
| Total | 1,307 (100.0%) | 150 (100.0%) |
Housing Structure by Heating Type in Tybee Island
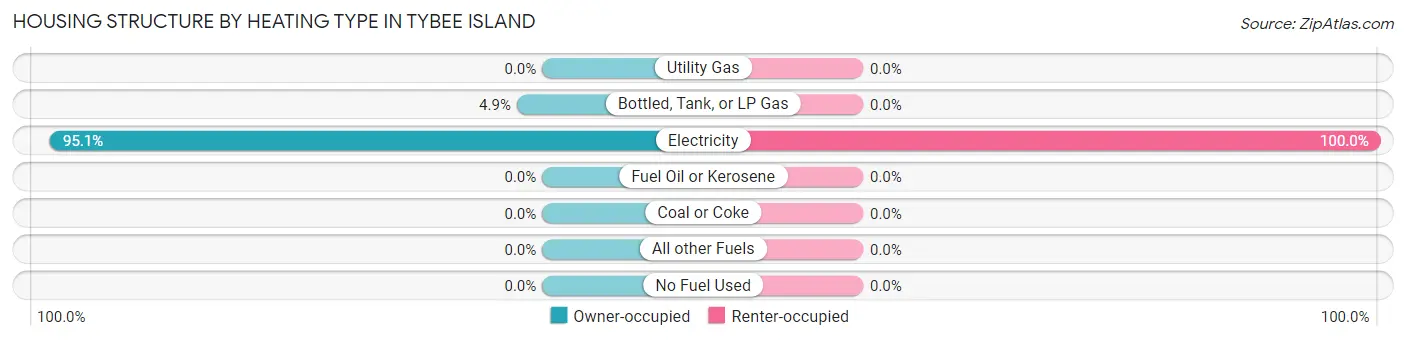
| Heating Type | Owner-occupied | Renter-occupied |
| Utility Gas | 0 (0.0%) | 0 (0.0%) |
| Bottled, Tank, or LP Gas | 64 (4.9%) | 0 (0.0%) |
| Electricity | 1,243 (95.1%) | 150 (100.0%) |
| Fuel Oil or Kerosene | 0 (0.0%) | 0 (0.0%) |
| Coal or Coke | 0 (0.0%) | 0 (0.0%) |
| All other Fuels | 0 (0.0%) | 0 (0.0%) |
| No Fuel Used | 0 (0.0%) | 0 (0.0%) |
| Total | 1,307 (100.0%) | 150 (100.0%) |
Household Vehicle Usage in Tybee Island
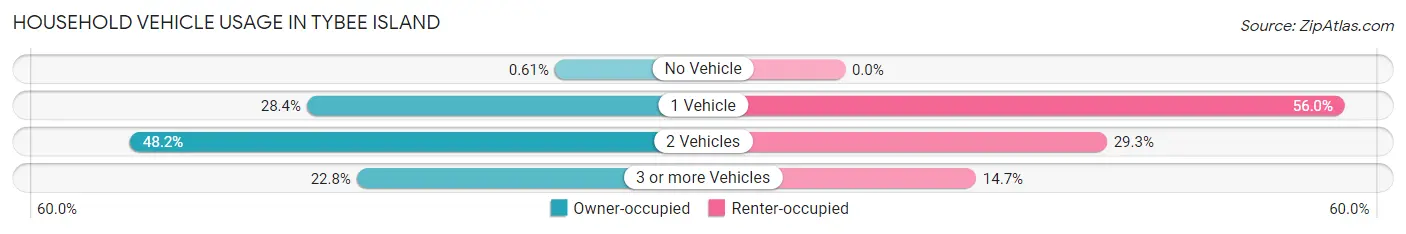
| Vehicles per Household | Owner-occupied | Renter-occupied |
| No Vehicle | 8 (0.6%) | 0 (0.0%) |
| 1 Vehicle | 371 (28.4%) | 84 (56.0%) |
| 2 Vehicles | 630 (48.2%) | 44 (29.3%) |
| 3 or more Vehicles | 298 (22.8%) | 22 (14.7%) |
| Total | 1,307 (100.0%) | 150 (100.0%) |
Real Estate & Mortgages in Tybee Island
Real Estate and Mortgage Overview in Tybee Island
| Characteristic | Without Mortgage | With Mortgage |
| Housing Units | 787 | 520 |
| Median Property Value | $538,700 | $596,700 |
| Median Household Income | $89,835 | $239 |
| Monthly Housing Costs | $830 | $188 |
| Real Estate Taxes | $3,916 | $0 |
Property Value by Mortgage Status in Tybee Island
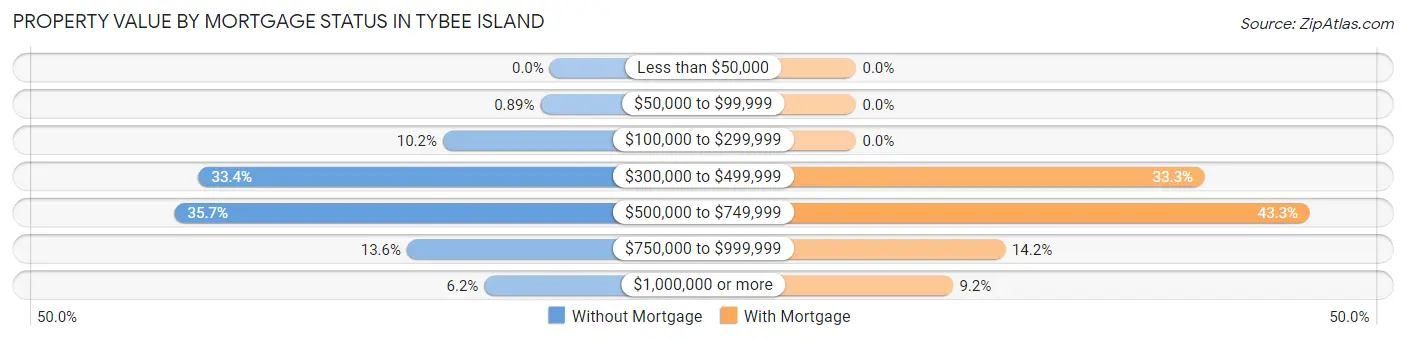
| Property Value | Without Mortgage | With Mortgage |
| Less than $50,000 | 0 (0.0%) | 0 (0.0%) |
| $50,000 to $99,999 | 7 (0.9%) | 0 (0.0%) |
| $100,000 to $299,999 | 80 (10.2%) | 0 (0.0%) |
| $300,000 to $499,999 | 263 (33.4%) | 173 (33.3%) |
| $500,000 to $749,999 | 281 (35.7%) | 225 (43.3%) |
| $750,000 to $999,999 | 107 (13.6%) | 74 (14.2%) |
| $1,000,000 or more | 49 (6.2%) | 48 (9.2%) |
| Total | 787 (100.0%) | 520 (100.0%) |
Household Income by Mortgage Status in Tybee Island
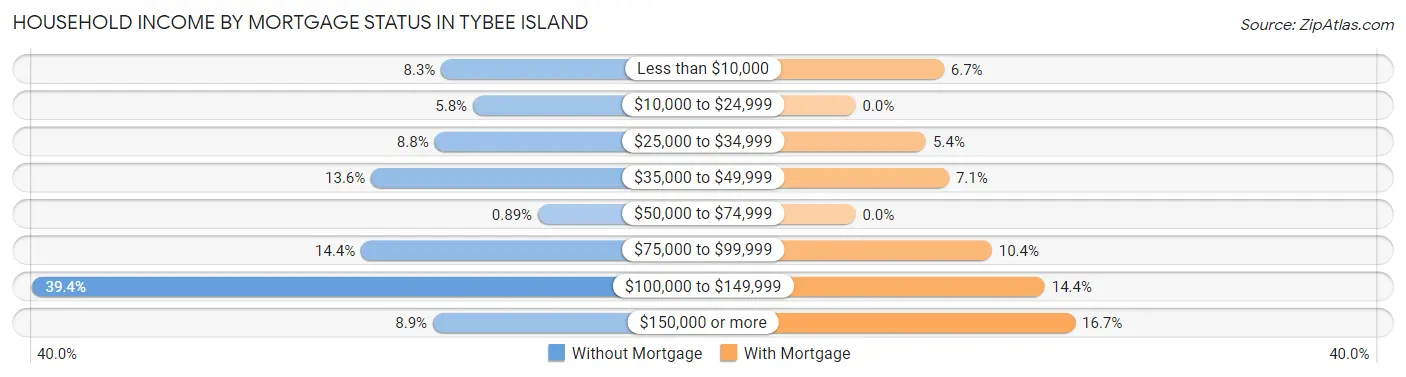
| Household Income | Without Mortgage | With Mortgage |
| Less than $10,000 | 65 (8.3%) | 35 (6.7%) |
| $10,000 to $24,999 | 46 (5.8%) | 0 (0.0%) |
| $25,000 to $34,999 | 69 (8.8%) | 28 (5.4%) |
| $35,000 to $49,999 | 107 (13.6%) | 37 (7.1%) |
| $50,000 to $74,999 | 7 (0.9%) | 0 (0.0%) |
| $75,000 to $99,999 | 113 (14.4%) | 54 (10.4%) |
| $100,000 to $149,999 | 310 (39.4%) | 75 (14.4%) |
| $150,000 or more | 70 (8.9%) | 87 (16.7%) |
| Total | 787 (100.0%) | 520 (100.0%) |
Property Value to Household Income Ratio in Tybee Island
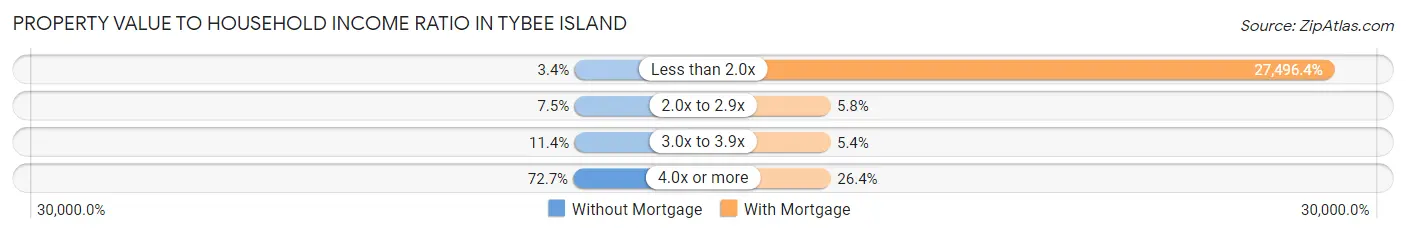
| Value-to-Income Ratio | Without Mortgage | With Mortgage |
| Less than 2.0x | 27 (3.4%) | 142,981 (27,496.4%) |
| 2.0x to 2.9x | 59 (7.5%) | 30 (5.8%) |
| 3.0x to 3.9x | 90 (11.4%) | 28 (5.4%) |
| 4.0x or more | 572 (72.7%) | 137 (26.4%) |
| Total | 787 (100.0%) | 520 (100.0%) |
Real Estate Taxes by Mortgage Status in Tybee Island
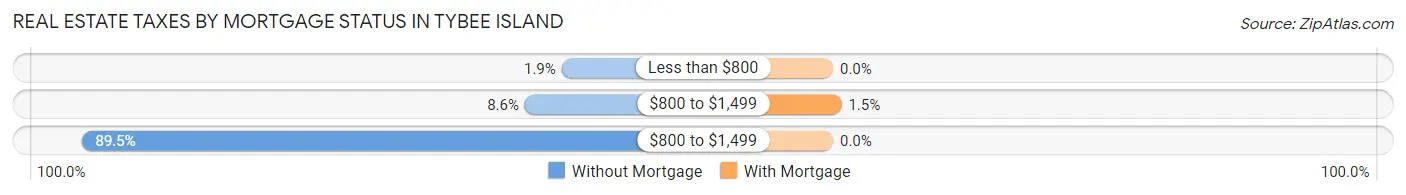
| Property Taxes | Without Mortgage | With Mortgage |
| Less than $800 | 15 (1.9%) | 0 (0.0%) |
| $800 to $1,499 | 68 (8.6%) | 8 (1.5%) |
| $800 to $1,499 | 704 (89.4%) | 0 (0.0%) |
| Total | 787 (100.0%) | 520 (100.0%) |
Health & Disability in Tybee Island
Health Insurance Coverage by Age in Tybee Island
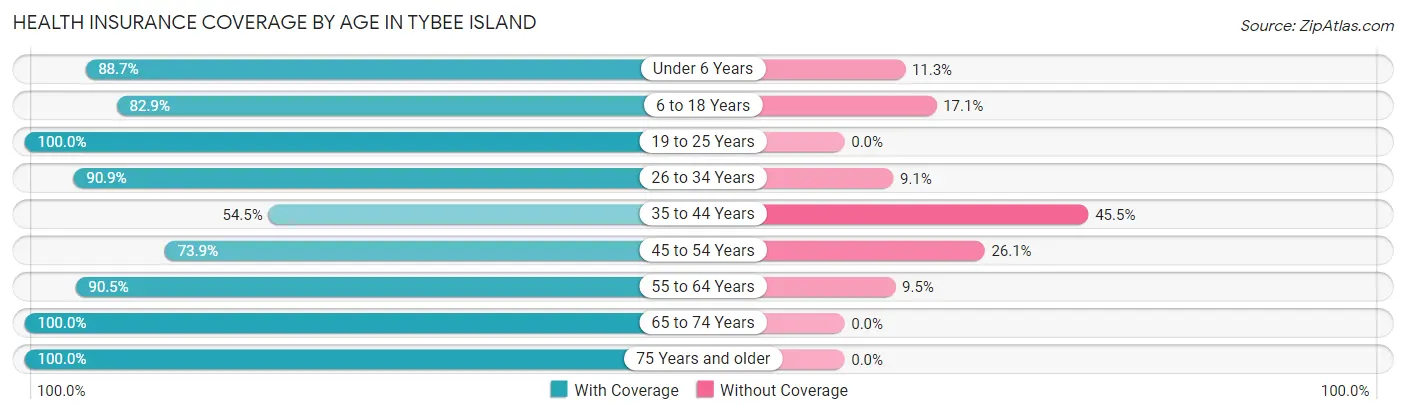
| Age Bracket | With Coverage | Without Coverage |
| Under 6 Years | 149 (88.7%) | 19 (11.3%) |
| 6 to 18 Years | 203 (82.9%) | 42 (17.1%) |
| 19 to 25 Years | 47 (100.0%) | 0 (0.0%) |
| 26 to 34 Years | 70 (90.9%) | 7 (9.1%) |
| 35 to 44 Years | 151 (54.5%) | 126 (45.5%) |
| 45 to 54 Years | 260 (73.9%) | 92 (26.1%) |
| 55 to 64 Years | 564 (90.5%) | 59 (9.5%) |
| 65 to 74 Years | 726 (100.0%) | 0 (0.0%) |
| 75 Years and older | 496 (100.0%) | 0 (0.0%) |
| Total | 2,666 (88.5%) | 345 (11.5%) |
Health Insurance Coverage by Citizenship Status in Tybee Island
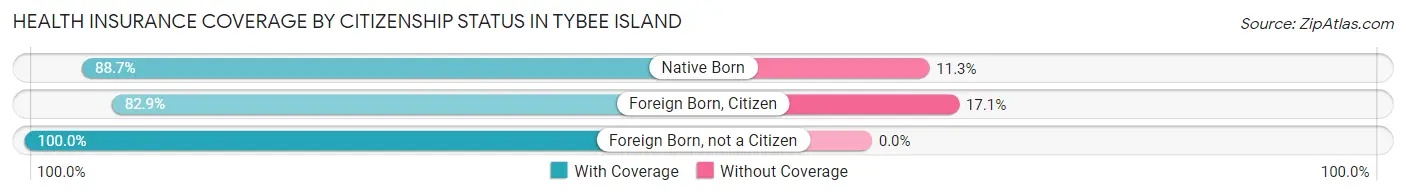
| Citizenship Status | With Coverage | Without Coverage |
| Native Born | 149 (88.7%) | 19 (11.3%) |
| Foreign Born, Citizen | 203 (82.9%) | 42 (17.1%) |
| Foreign Born, not a Citizen | 47 (100.0%) | 0 (0.0%) |
Health Insurance Coverage by Household Income in Tybee Island
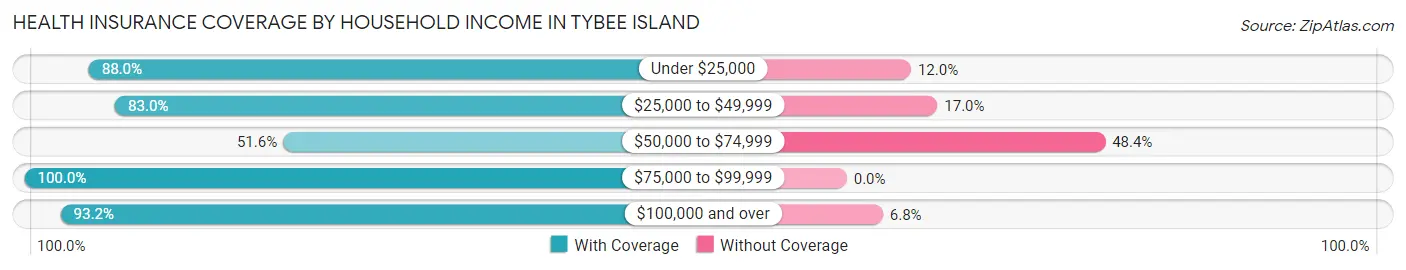
| Household Income | With Coverage | Without Coverage |
| Under $25,000 | 139 (88.0%) | 19 (12.0%) |
| $25,000 to $49,999 | 406 (83.0%) | 83 (17.0%) |
| $50,000 to $74,999 | 130 (51.6%) | 122 (48.4%) |
| $75,000 to $99,999 | 322 (100.0%) | 0 (0.0%) |
| $100,000 and over | 1,669 (93.2%) | 121 (6.8%) |
Public vs Private Health Insurance Coverage by Age in Tybee Island
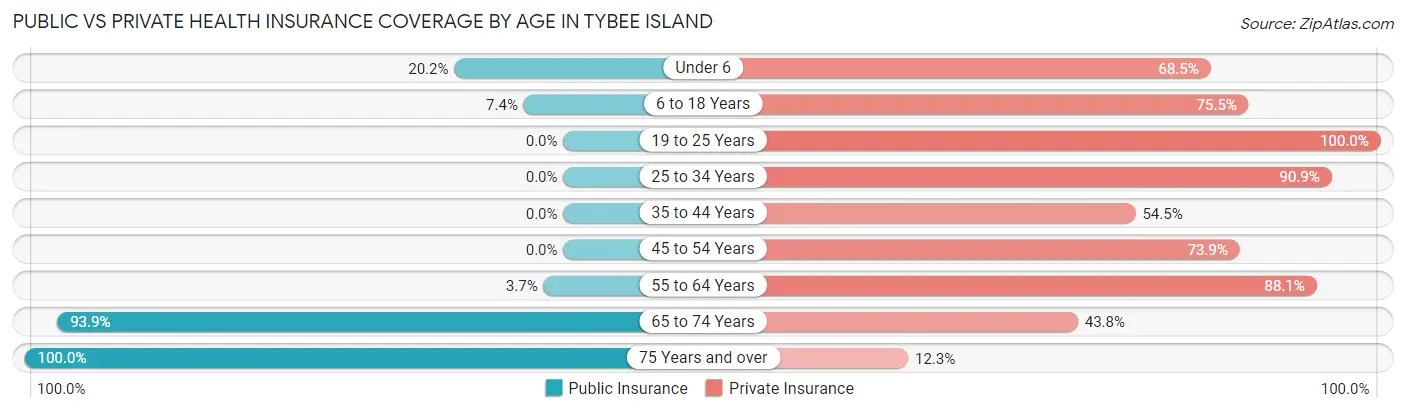
| Age Bracket | Public Insurance | Private Insurance |
| Under 6 | 34 (20.2%) | 115 (68.4%) |
| 6 to 18 Years | 18 (7.3%) | 185 (75.5%) |
| 19 to 25 Years | 0 (0.0%) | 47 (100.0%) |
| 25 to 34 Years | 0 (0.0%) | 70 (90.9%) |
| 35 to 44 Years | 0 (0.0%) | 151 (54.5%) |
| 45 to 54 Years | 0 (0.0%) | 260 (73.9%) |
| 55 to 64 Years | 23 (3.7%) | 549 (88.1%) |
| 65 to 74 Years | 682 (93.9%) | 318 (43.8%) |
| 75 Years and over | 496 (100.0%) | 61 (12.3%) |
| Total | 1,253 (41.6%) | 1,756 (58.3%) |
Disability Status by Sex by Age in Tybee Island
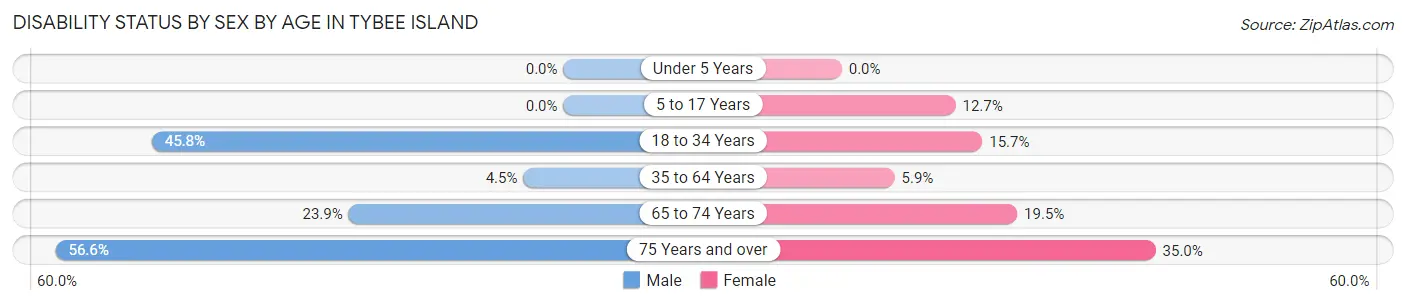
| Age Bracket | Male | Female |
| Under 5 Years | 0 (0.0%) | 0 (0.0%) |
| 5 to 17 Years | 0 (0.0%) | 19 (12.7%) |
| 18 to 34 Years | 22 (45.8%) | 18 (15.7%) |
| 35 to 64 Years | 24 (4.5%) | 42 (5.9%) |
| 65 to 74 Years | 83 (23.9%) | 74 (19.5%) |
| 75 Years and over | 164 (56.6%) | 72 (34.9%) |
Disability Class by Sex by Age in Tybee Island
Disability Class: Hearing Difficulty
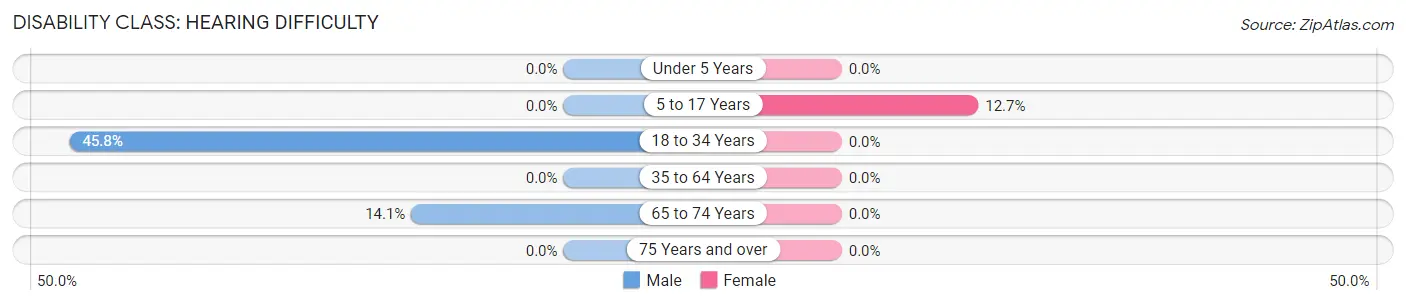
| Age Bracket | Male | Female |
| Under 5 Years | 0 (0.0%) | 0 (0.0%) |
| 5 to 17 Years | 0 (0.0%) | 19 (12.7%) |
| 18 to 34 Years | 22 (45.8%) | 0 (0.0%) |
| 35 to 64 Years | 0 (0.0%) | 0 (0.0%) |
| 65 to 74 Years | 49 (14.1%) | 0 (0.0%) |
| 75 Years and over | 0 (0.0%) | 0 (0.0%) |
Disability Class: Vision Difficulty
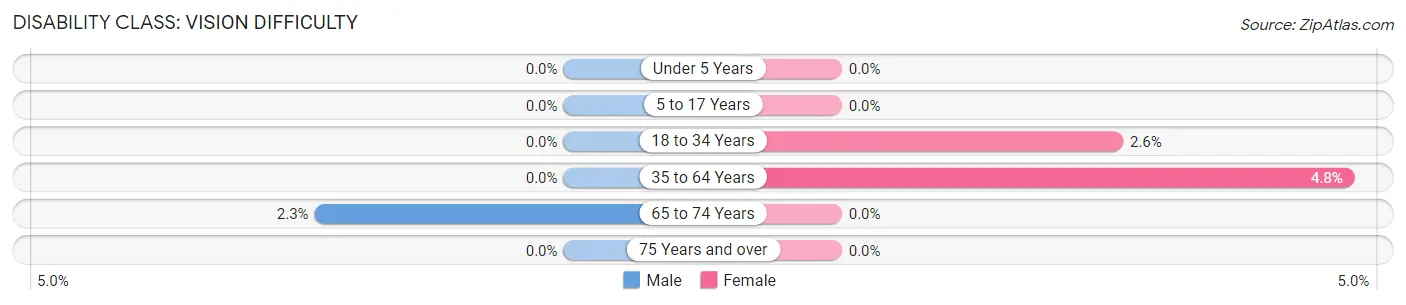
| Age Bracket | Male | Female |
| Under 5 Years | 0 (0.0%) | 0 (0.0%) |
| 5 to 17 Years | 0 (0.0%) | 0 (0.0%) |
| 18 to 34 Years | 0 (0.0%) | 3 (2.6%) |
| 35 to 64 Years | 0 (0.0%) | 34 (4.8%) |
| 65 to 74 Years | 8 (2.3%) | 0 (0.0%) |
| 75 Years and over | 0 (0.0%) | 0 (0.0%) |
Disability Class: Cognitive Difficulty
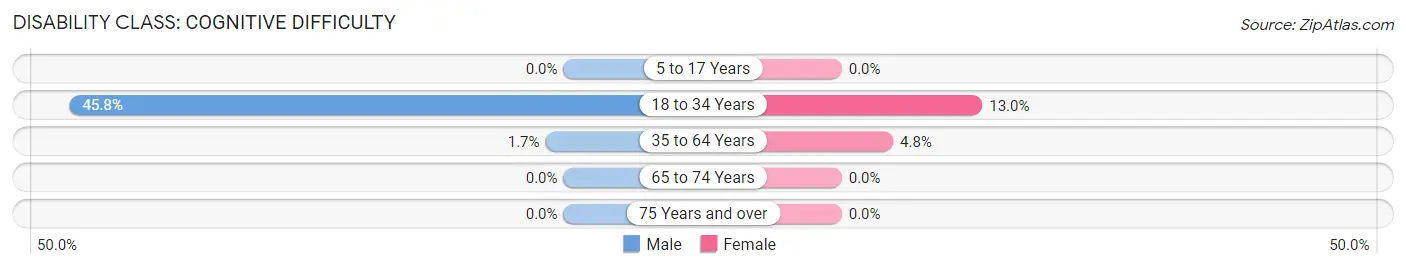
| Age Bracket | Male | Female |
| 5 to 17 Years | 0 (0.0%) | 0 (0.0%) |
| 18 to 34 Years | 22 (45.8%) | 15 (13.0%) |
| 35 to 64 Years | 9 (1.7%) | 34 (4.8%) |
| 65 to 74 Years | 0 (0.0%) | 0 (0.0%) |
| 75 Years and over | 0 (0.0%) | 0 (0.0%) |
Disability Class: Ambulatory Difficulty
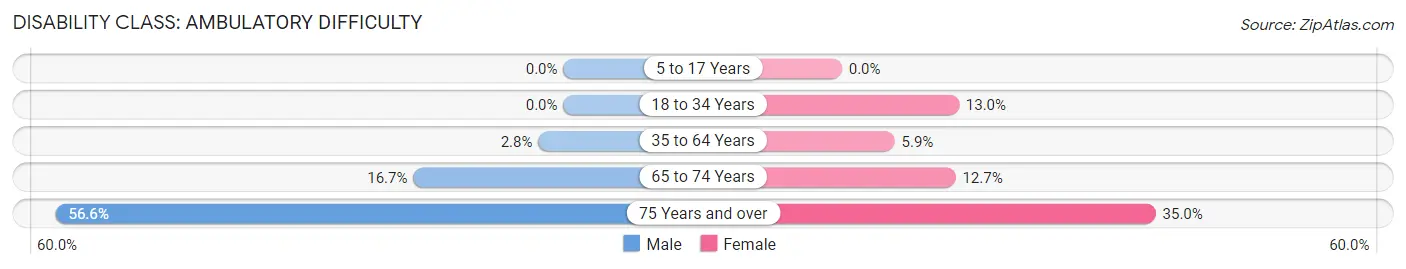
| Age Bracket | Male | Female |
| 5 to 17 Years | 0 (0.0%) | 0 (0.0%) |
| 18 to 34 Years | 0 (0.0%) | 15 (13.0%) |
| 35 to 64 Years | 15 (2.8%) | 42 (5.9%) |
| 65 to 74 Years | 58 (16.7%) | 48 (12.7%) |
| 75 Years and over | 164 (56.6%) | 72 (34.9%) |
Disability Class: Self-Care Difficulty
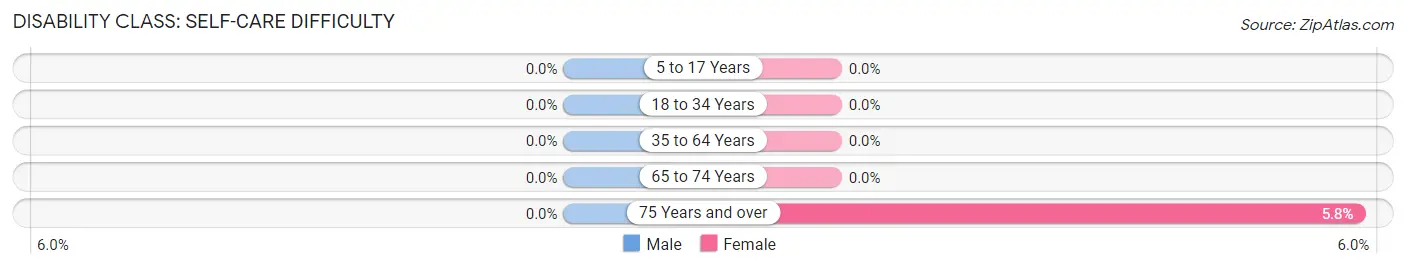
| Age Bracket | Male | Female |
| 5 to 17 Years | 0 (0.0%) | 0 (0.0%) |
| 18 to 34 Years | 0 (0.0%) | 0 (0.0%) |
| 35 to 64 Years | 0 (0.0%) | 0 (0.0%) |
| 65 to 74 Years | 0 (0.0%) | 0 (0.0%) |
| 75 Years and over | 0 (0.0%) | 12 (5.8%) |
Technology Access in Tybee Island
Computing Device Access in Tybee Island
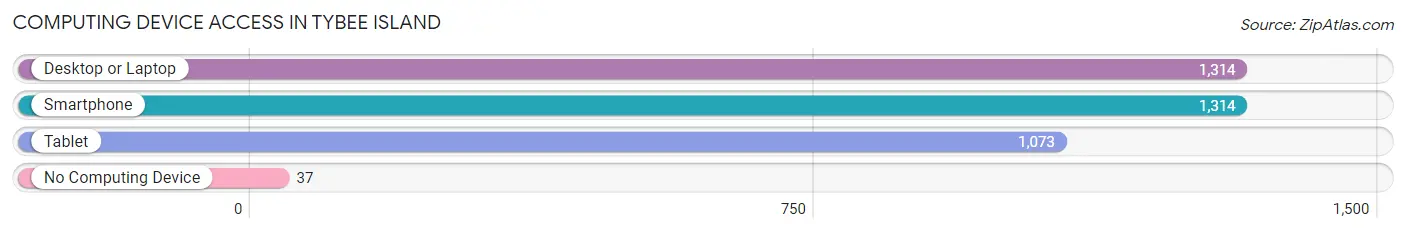
| Device Type | # Households | % Households |
| Desktop or Laptop | 1,314 | 90.2% |
| Smartphone | 1,314 | 90.2% |
| Tablet | 1,073 | 73.6% |
| No Computing Device | 37 | 2.5% |
| Total | 1,457 | 100.0% |
Internet Access in Tybee Island
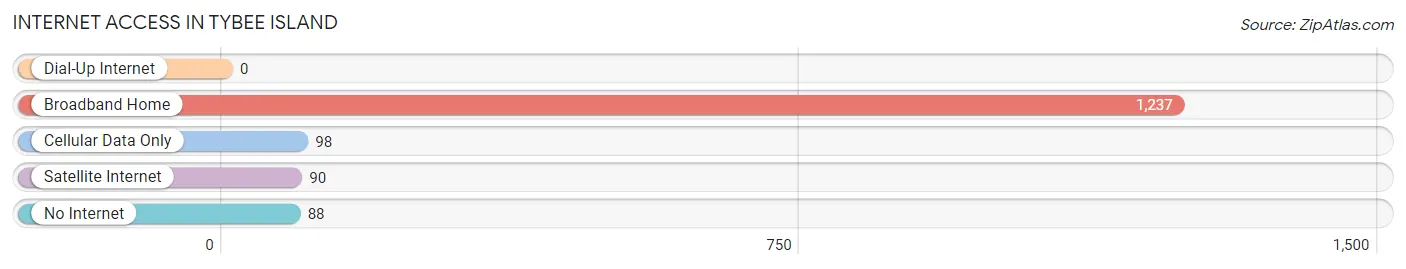
| Internet Type | # Households | % Households |
| Dial-Up Internet | 0 | 0.0% |
| Broadband Home | 1,237 | 84.9% |
| Cellular Data Only | 98 | 6.7% |
| Satellite Internet | 90 | 6.2% |
| No Internet | 88 | 6.0% |
| Total | 1,457 | 100.0% |
Tybee Island Summary
Tybee Island is a small barrier island located off the coast of Georgia, just east of Savannah. It is the easternmost point in the state and is known for its beautiful beaches, historic sites, and laid-back atmosphere. The island is home to a variety of wildlife, including sea turtles, dolphins, and shorebirds. It is also a popular destination for tourists, who come to enjoy the island’s many attractions.
History
Tybee Island has a long and varied history. The island was first inhabited by Native Americans, who called it “Ossabaw”. The first European settlers arrived in the late 1600s, and the island was named “Tybee” after the local Native American tribe. In 1733, the island was granted to James Oglethorpe, the founder of the Georgia colony.
In the late 1700s, the island became a popular destination for wealthy plantation owners, who built grand homes and estates. During the Civil War, the island was occupied by Union forces, and many of the homes and buildings were destroyed. After the war, the island was slowly rebuilt and became a popular vacation destination.
Geography
Tybee Island is located off the coast of Georgia, just east of Savannah. It is the easternmost point in the state and is bordered by the Atlantic Ocean to the east and the Savannah River to the west. The island is approximately three miles long and one mile wide, and is connected to the mainland by a causeway.
The island is made up of a variety of habitats, including salt marshes, tidal creeks, and sandy beaches. The island is also home to a variety of wildlife, including sea turtles, dolphins, and shorebirds.
Economy
The economy of Tybee Island is largely based on tourism. The island is a popular destination for beachgoers, who come to enjoy the island’s many attractions. The island is also home to a variety of restaurants, shops, and hotels. In addition, the island is home to a number of art galleries, museums, and historic sites.
Demographics
As of the 2010 census, the population of Tybee Island was 2,990. The population is largely white (90.2%), with a small percentage of African Americans (4.2%) and Hispanics (2.3%). The median household income is $50,945, and the median age is 44.
Conclusion
Tybee Island is a small barrier island located off the coast of Georgia, just east of Savannah. It is the easternmost point in the state and is known for its beautiful beaches, historic sites, and laid-back atmosphere. The island is home to a variety of wildlife, including sea turtles, dolphins, and shorebirds. It is also a popular destination for tourists, who come to enjoy the island’s many attractions. The economy of Tybee Island is largely based on tourism, and the population is largely white.
Common Questions
What is Per Capita Income in Tybee Island?
Per Capita income in Tybee Island is $50,889.
What is the Median Family Income in Tybee Island?
Median Family Income in Tybee Island is $135,055.
What is the Median Household income in Tybee Island?
Median Household Income in Tybee Island is $101,289.
What is Income or Wage Gap in Tybee Island?
Income or Wage Gap in Tybee Island is 16.6%.
Women in Tybee Island earn 83.4 cents for every dollar earned by a man.
What is Inequality or Gini Index in Tybee Island?
Inequality or Gini Index in Tybee Island is 0.39.
What is the Total Population of Tybee Island?
Total Population of Tybee Island is 3,126.
What is the Total Male Population of Tybee Island?
Total Male Population of Tybee Island is 1,460.
What is the Total Female Population of Tybee Island?
Total Female Population of Tybee Island is 1,666.
What is the Ratio of Males per 100 Females in Tybee Island?
There are 87.64 Males per 100 Females in Tybee Island.
What is the Ratio of Females per 100 Males in Tybee Island?
There are 114.11 Females per 100 Males in Tybee Island.
What is the Median Population Age in Tybee Island?
Median Population Age in Tybee Island is 61.4 Years.
What is the Average Family Size in Tybee Island
Average Family Size in Tybee Island is 2.4 People.
What is the Average Household Size in Tybee Island
Average Household Size in Tybee Island is 2.1 People.
How Large is the Labor Force in Tybee Island?
There are 1,269 People in the Labor Forcein in Tybee Island.
What is the Percentage of People in the Labor Force in Tybee Island?
44.3% of People are in the Labor Force in Tybee Island.
What is the Unemployment Rate in Tybee Island?
Unemployment Rate in Tybee Island is 3.6%.