Thomasville, GA Map & Demographics
Thomasville Map
Thomasville Overview
$33,578
PER CAPITA INCOME
$65,941
AVG FAMILY INCOME
$45,789
AVG HOUSEHOLD INCOME
27.8%
WAGE / INCOME GAP [ % ]
72.2¢/ $1
WAGE / INCOME GAP [ $ ]
$11,333
FAMILY INCOME DEFICIT
0.53
INEQUALITY / GINI INDEX
18,744
TOTAL POPULATION
8,668
MALE POPULATION
10,076
FEMALE POPULATION
86.03
MALES / 100 FEMALES
116.24
FEMALES / 100 MALES
36.2
MEDIAN AGE
3.0
AVG FAMILY SIZE
2.4
AVG HOUSEHOLD SIZE
9,103
LABOR FORCE [ PEOPLE ]
62.3%
PERCENT IN LABOR FORCE
4.5%
UNEMPLOYMENT RATE
Thomasville Area Codes
Income in Thomasville
Income Overview in Thomasville
Per Capita Income in Thomasville is $33,578, while median incomes of families and households are $65,941 and $45,789 respectively.
| Characteristic | Number | Measure |
| Per Capita Income | 18,744 | $33,578 |
| Median Family Income | 4,999 | $65,941 |
| Mean Family Income | 4,999 | $95,336 |
| Median Household Income | 7,751 | $45,789 |
| Mean Household Income | 7,751 | $76,984 |
| Income Deficit | 4,999 | $11,333 |
| Wage / Income Gap (%) | 18,744 | 27.78% |
| Wage / Income Gap ($) | 18,744 | 72.22¢ per $1 |
| Gini / Inequality Index | 18,744 | 0.53 |
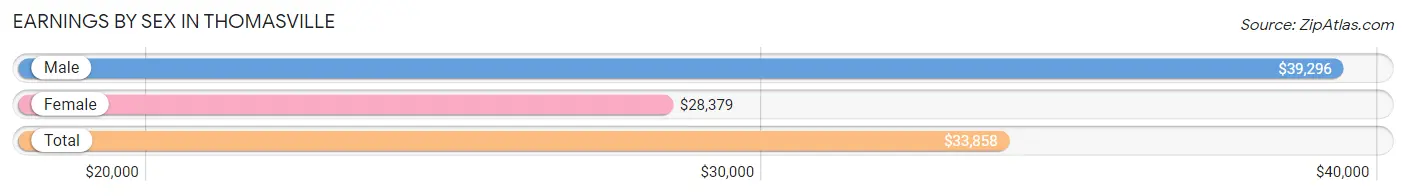
Earnings by Sex in Thomasville
Average Earnings in Thomasville are $33,858, $39,296 for men and $28,379 for women, a difference of 27.8%.
| Sex | Number | Average Earnings |
| Male | 4,533 (49.0%) | $39,296 |
| Female | 4,724 (51.0%) | $28,379 |
| Total | 9,257 (100.0%) | $33,858 |
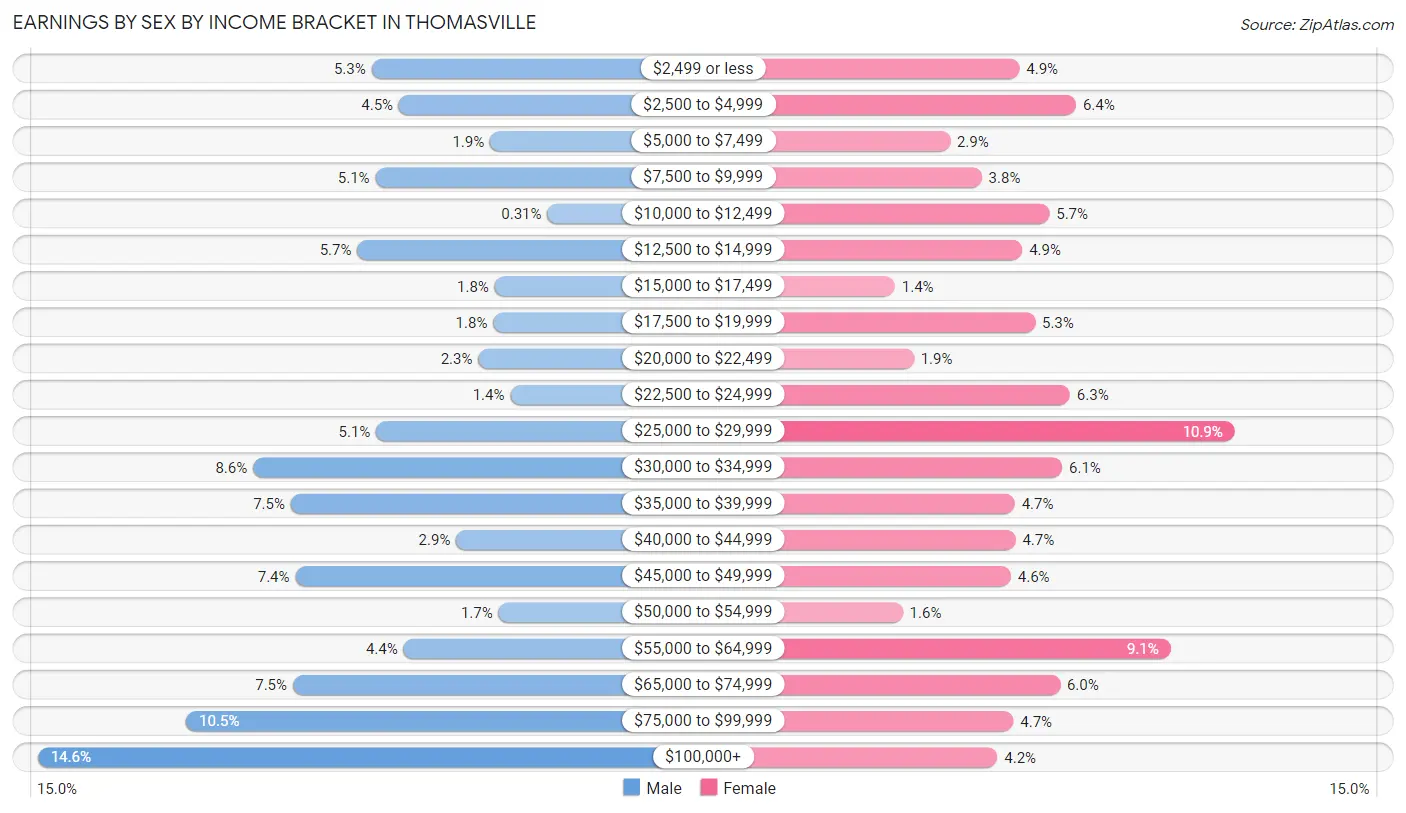
Earnings by Sex by Income Bracket in Thomasville
The most common earnings brackets in Thomasville are $100,000+ for men (663 | 14.6%) and $25,000 to $29,999 for women (515 | 10.9%).
| Income | Male | Female |
| $2,499 or less | 238 (5.2%) | 229 (4.9%) |
| $2,500 to $4,999 | 203 (4.5%) | 304 (6.4%) |
| $5,000 to $7,499 | 87 (1.9%) | 137 (2.9%) |
| $7,500 to $9,999 | 233 (5.1%) | 179 (3.8%) |
| $10,000 to $12,499 | 14 (0.3%) | 269 (5.7%) |
| $12,500 to $14,999 | 256 (5.7%) | 233 (4.9%) |
| $15,000 to $17,499 | 81 (1.8%) | 64 (1.3%) |
| $17,500 to $19,999 | 83 (1.8%) | 250 (5.3%) |
| $20,000 to $22,499 | 102 (2.2%) | 89 (1.9%) |
| $22,500 to $24,999 | 61 (1.3%) | 296 (6.3%) |
| $25,000 to $29,999 | 232 (5.1%) | 515 (10.9%) |
| $30,000 to $34,999 | 389 (8.6%) | 286 (6.0%) |
| $35,000 to $39,999 | 341 (7.5%) | 223 (4.7%) |
| $40,000 to $44,999 | 130 (2.9%) | 224 (4.7%) |
| $45,000 to $49,999 | 335 (7.4%) | 218 (4.6%) |
| $50,000 to $54,999 | 76 (1.7%) | 74 (1.6%) |
| $55,000 to $64,999 | 197 (4.3%) | 430 (9.1%) |
| $65,000 to $74,999 | 338 (7.5%) | 283 (6.0%) |
| $75,000 to $99,999 | 474 (10.5%) | 221 (4.7%) |
| $100,000+ | 663 (14.6%) | 200 (4.2%) |
| Total | 4,533 (100.0%) | 4,724 (100.0%) |
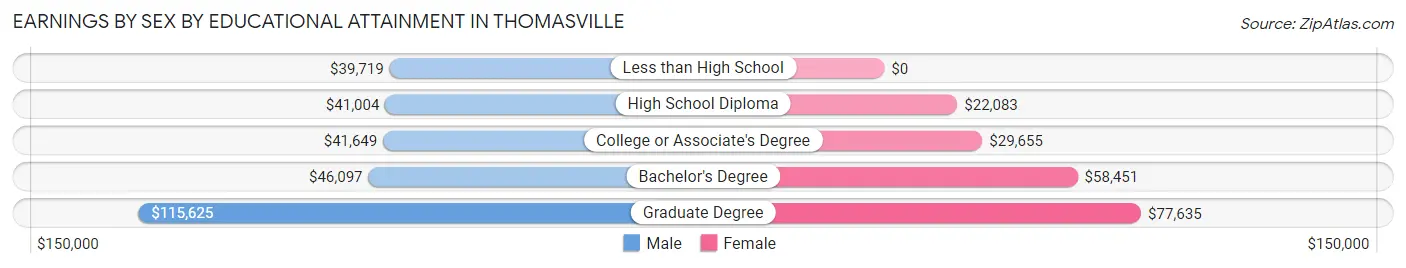
Earnings by Sex by Educational Attainment in Thomasville
Average earnings in Thomasville are $46,813 for men and $31,274 for women, a difference of 33.2%. Men with an educational attainment of graduate degree enjoy the highest average annual earnings of $115,625, while those with less than high school education earn the least with $39,719. Women with an educational attainment of graduate degree earn the most with the average annual earnings of $77,635, while those with high school diploma education have the smallest earnings of $22,083.
| Educational Attainment | Male Income | Female Income |
| Less than High School | $39,719 | $0 |
| High School Diploma | $41,004 | $22,083 |
| College or Associate's Degree | $41,649 | $29,655 |
| Bachelor's Degree | $46,097 | $58,451 |
| Graduate Degree | $115,625 | $77,635 |
| Total | $46,813 | $31,274 |
Family Income in Thomasville
Family Income Brackets in Thomasville
According to the Thomasville family income data, there are 815 families falling into the $50,000 to $74,999 income range, which is the most common income bracket and makes up 16.3% of all families. Conversely, the $150,000 to $199,999 income bracket is the least frequent group with only 280 families (5.6%) belonging to this category.
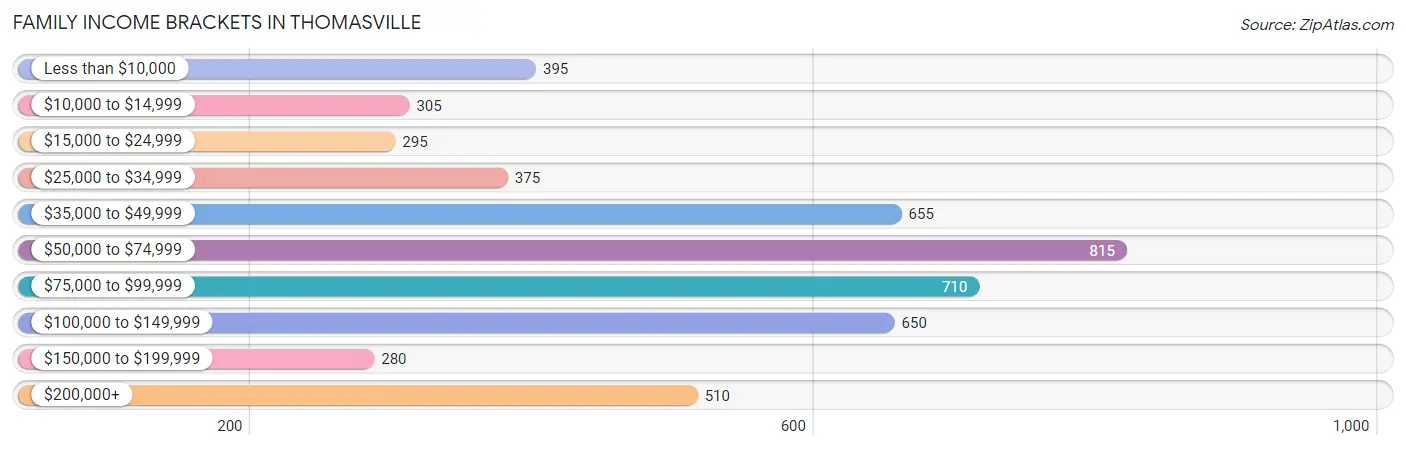
| Income Bracket | # Families | % Families |
| Less than $10,000 | 395 | 7.9% |
| $10,000 to $14,999 | 305 | 6.1% |
| $15,000 to $24,999 | 295 | 5.9% |
| $25,000 to $34,999 | 375 | 7.5% |
| $35,000 to $49,999 | 655 | 13.1% |
| $50,000 to $74,999 | 815 | 16.3% |
| $75,000 to $99,999 | 710 | 14.2% |
| $100,000 to $149,999 | 650 | 13.0% |
| $150,000 to $199,999 | 280 | 5.6% |
| $200,000+ | 510 | 10.2% |
Family Income by Famaliy Size in Thomasville
7+ person families (64 | 1.3%) account for the highest median family income in Thomasville with $97,000 per family, while 2-person families (2,613 | 52.3%) have the highest median income of $29,096 per family member.
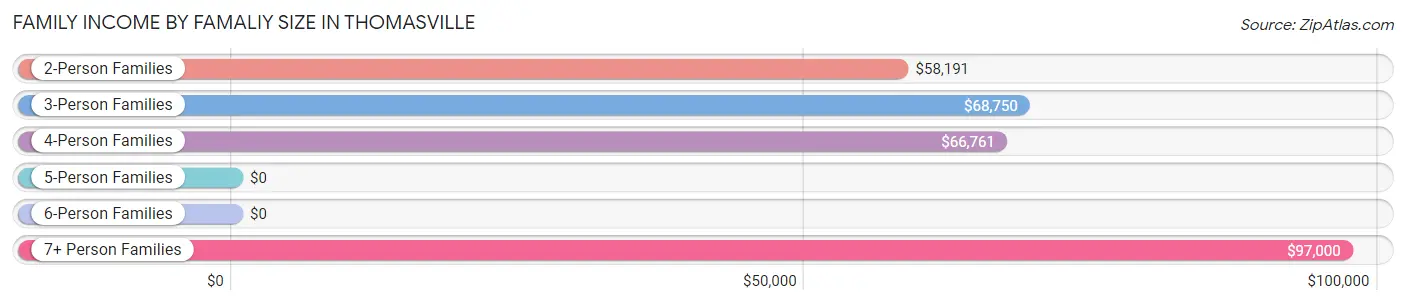
| Income Bracket | # Families | Median Income |
| 2-Person Families | 2,613 (52.3%) | $58,191 |
| 3-Person Families | 1,128 (22.6%) | $68,750 |
| 4-Person Families | 890 (17.8%) | $66,761 |
| 5-Person Families | 243 (4.9%) | $0 |
| 6-Person Families | 61 (1.2%) | $0 |
| 7+ Person Families | 64 (1.3%) | $97,000 |
| Total | 4,999 (100.0%) | $65,941 |
Family Income by Number of Earners in Thomasville
The median family income in Thomasville is $65,941, with families comprising 3+ earners (369) having the highest median family income of $112,125, while families with no earners (843) have the lowest median family income of $35,359, accounting for 7.4% and 16.9% of families, respectively.
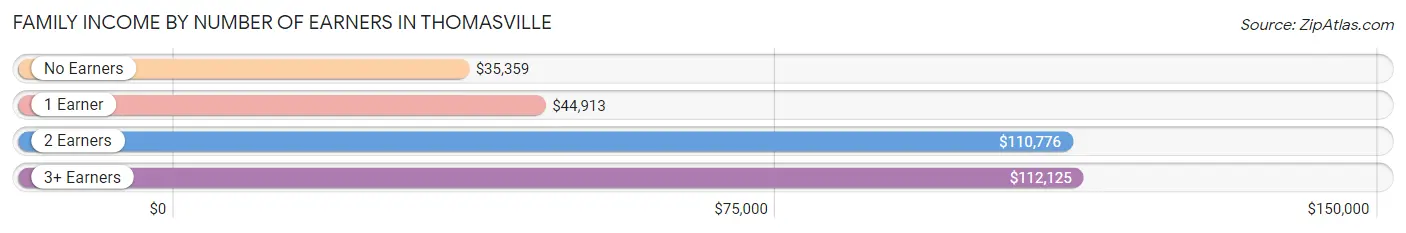
| Number of Earners | # Families | Median Income |
| No Earners | 843 (16.9%) | $35,359 |
| 1 Earner | 1,967 (39.4%) | $44,913 |
| 2 Earners | 1,820 (36.4%) | $110,776 |
| 3+ Earners | 369 (7.4%) | $112,125 |
| Total | 4,999 (100.0%) | $65,941 |
Household Income in Thomasville
Household Income Brackets in Thomasville
With 1,186 households falling in the category, the $50,000 to $74,999 income range is the most frequent in Thomasville, accounting for 15.3% of all households. In contrast, only 310 households (4.0%) fall into the $150,000 to $199,999 income bracket, making it the least populous group.
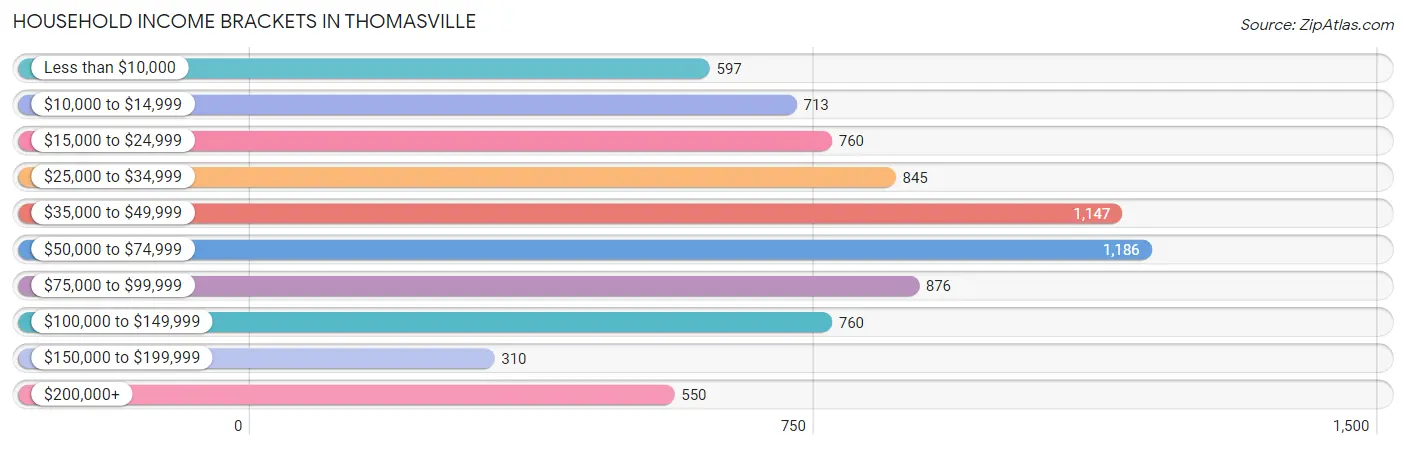
| Income Bracket | # Households | % Households |
| Less than $10,000 | 597 | 7.7% |
| $10,000 to $14,999 | 713 | 9.2% |
| $15,000 to $24,999 | 760 | 9.8% |
| $25,000 to $34,999 | 845 | 10.9% |
| $35,000 to $49,999 | 1,147 | 14.8% |
| $50,000 to $74,999 | 1,186 | 15.3% |
| $75,000 to $99,999 | 876 | 11.3% |
| $100,000 to $149,999 | 760 | 9.8% |
| $150,000 to $199,999 | 310 | 4.0% |
| $200,000+ | 550 | 7.1% |
Household Income by Householder Age in Thomasville
The median household income in Thomasville is $45,789, with the highest median household income of $66,676 found in the 45 to 64 years age bracket for the primary householder. A total of 2,782 households (35.9%) fall into this category. Meanwhile, the 15 to 24 years age bracket for the primary householder has the lowest median household income of $24,097, with 485 households (6.3%) in this group.
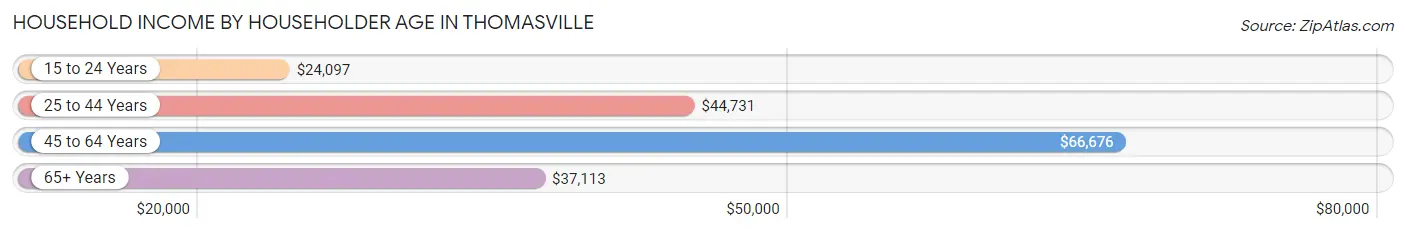
| Income Bracket | # Households | Median Income |
| 15 to 24 Years | 485 (6.3%) | $24,097 |
| 25 to 44 Years | 2,456 (31.7%) | $44,731 |
| 45 to 64 Years | 2,782 (35.9%) | $66,676 |
| 65+ Years | 2,028 (26.2%) | $37,113 |
| Total | 7,751 (100.0%) | $45,789 |
Poverty in Thomasville
Income Below Poverty by Sex and Age in Thomasville
With 19.8% poverty level for males and 22.8% for females among the residents of Thomasville, under 5 year old males and 15 year old females are the most vulnerable to poverty, with 310 males (44.8%) and 129 females (66.8%) in their respective age groups living below the poverty level.
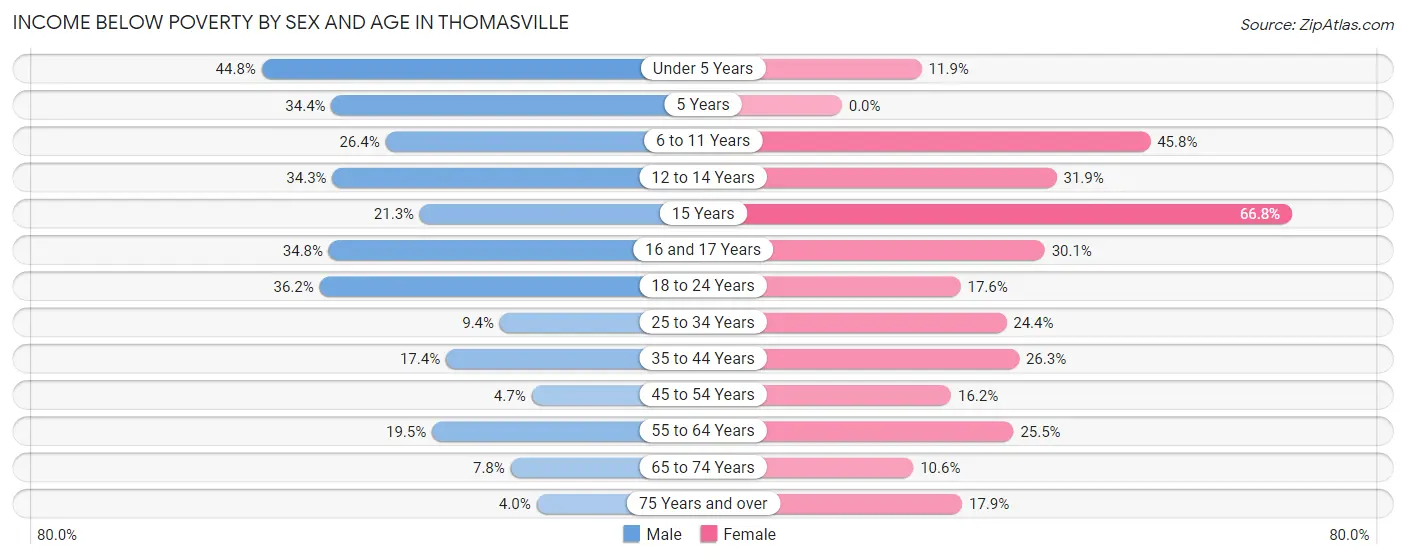
| Age Bracket | Male | Female |
| Under 5 Years | 310 (44.8%) | 77 (11.9%) |
| 5 Years | 52 (34.4%) | 0 (0.0%) |
| 6 to 11 Years | 201 (26.4%) | 333 (45.8%) |
| 12 to 14 Years | 96 (34.3%) | 103 (31.9%) |
| 15 Years | 49 (21.3%) | 129 (66.8%) |
| 16 and 17 Years | 117 (34.8%) | 72 (30.1%) |
| 18 to 24 Years | 290 (36.2%) | 161 (17.6%) |
| 25 to 34 Years | 110 (9.4%) | 355 (24.4%) |
| 35 to 44 Years | 157 (17.4%) | 272 (26.3%) |
| 45 to 54 Years | 46 (4.7%) | 207 (16.2%) |
| 55 to 64 Years | 179 (19.5%) | 302 (25.5%) |
| 65 to 74 Years | 67 (7.8%) | 111 (10.6%) |
| 75 Years and over | 19 (4.0%) | 135 (17.9%) |
| Total | 1,693 (19.8%) | 2,257 (22.8%) |
Income Above Poverty by Sex and Age in Thomasville
According to the poverty statistics in Thomasville, males aged 75 years and over and females aged 5 years are the age groups that are most secure financially, with 96.0% of males and 100.0% of females in these age groups living above the poverty line.
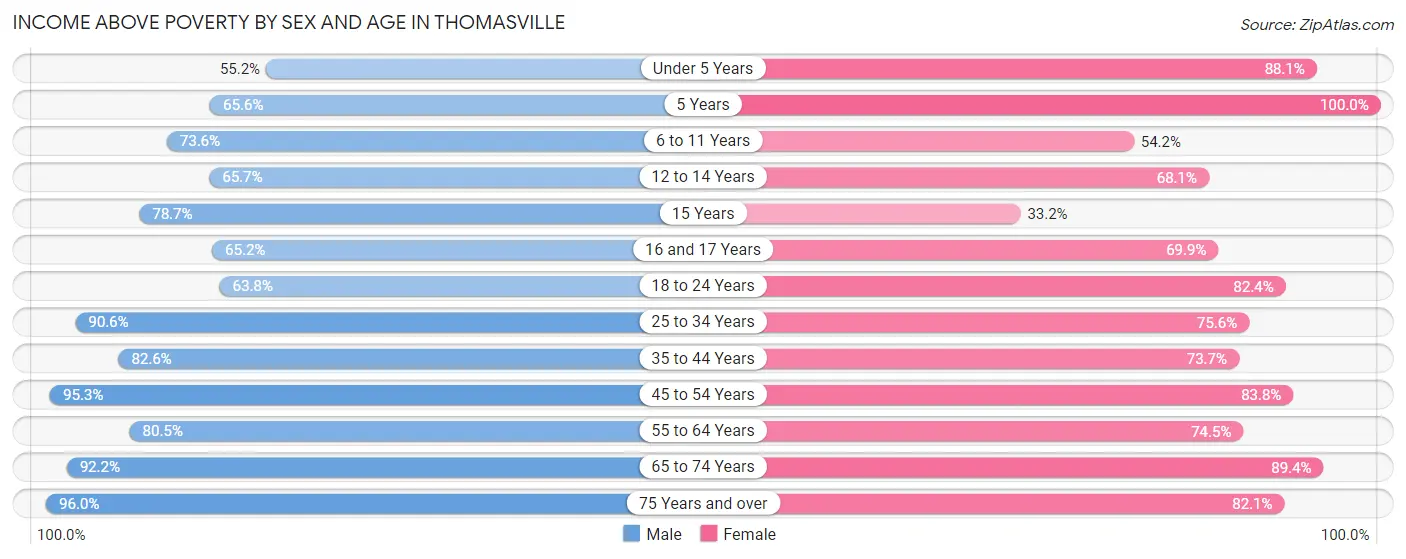
| Age Bracket | Male | Female |
| Under 5 Years | 382 (55.2%) | 572 (88.1%) |
| 5 Years | 99 (65.6%) | 110 (100.0%) |
| 6 to 11 Years | 560 (73.6%) | 394 (54.2%) |
| 12 to 14 Years | 184 (65.7%) | 220 (68.1%) |
| 15 Years | 181 (78.7%) | 64 (33.2%) |
| 16 and 17 Years | 219 (65.2%) | 167 (69.9%) |
| 18 to 24 Years | 511 (63.8%) | 752 (82.4%) |
| 25 to 34 Years | 1,056 (90.6%) | 1,099 (75.6%) |
| 35 to 44 Years | 744 (82.6%) | 762 (73.7%) |
| 45 to 54 Years | 926 (95.3%) | 1,069 (83.8%) |
| 55 to 64 Years | 739 (80.5%) | 883 (74.5%) |
| 65 to 74 Years | 789 (92.2%) | 935 (89.4%) |
| 75 Years and over | 457 (96.0%) | 621 (82.1%) |
| Total | 6,847 (80.2%) | 7,648 (77.2%) |
Income Below Poverty Among Married-Couple Families in Thomasville
The poverty statistics for married-couple families in Thomasville show that 3.5% or 94 of the total 2,679 families live below the poverty line. Families with 1 or 2 children have the highest poverty rate of 5.2%, comprising of 39 families. On the other hand, families with 3 or 4 children have the lowest poverty rate of 0.0%, which includes 0 families.
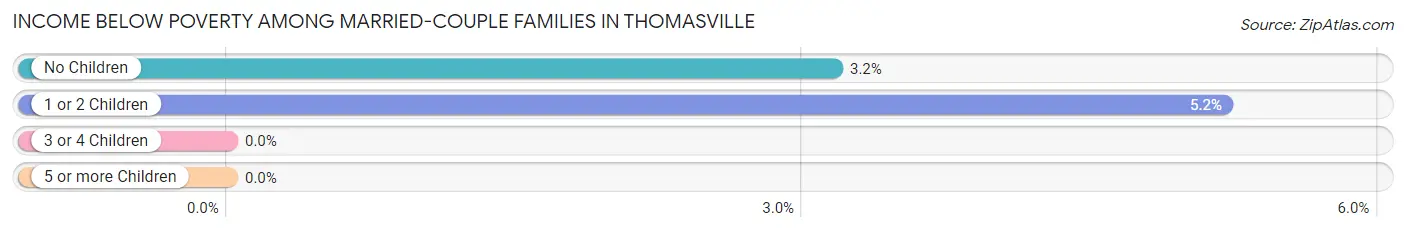
| Children | Above Poverty | Below Poverty |
| No Children | 1,686 (96.8%) | 55 (3.2%) |
| 1 or 2 Children | 711 (94.8%) | 39 (5.2%) |
| 3 or 4 Children | 156 (100.0%) | 0 (0.0%) |
| 5 or more Children | 32 (100.0%) | 0 (0.0%) |
| Total | 2,585 (96.5%) | 94 (3.5%) |
Income Below Poverty Among Single-Parent Households in Thomasville
According to the poverty data in Thomasville, 23.4% or 106 single-father households and 39.0% or 728 single-mother households are living below the poverty line. Among single-father households, those with 1 or 2 children have the highest poverty rate, with 101 households (35.1%) experiencing poverty. Likewise, among single-mother households, those with 3 or 4 children have the highest poverty rate, with 209 households (62.2%) falling below the poverty line.
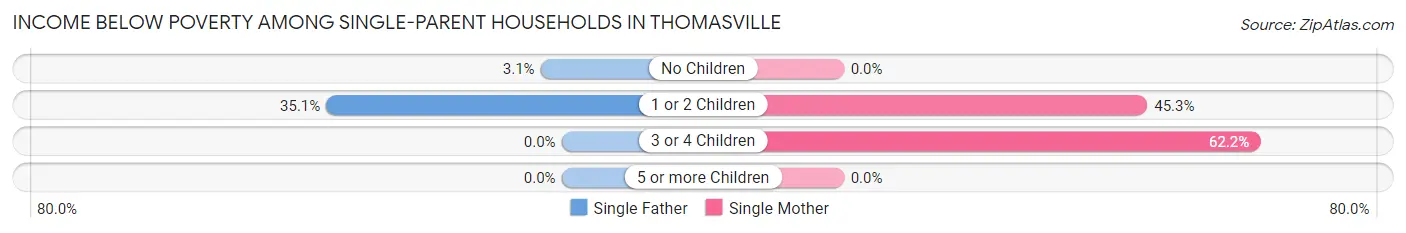
| Children | Single Father | Single Mother |
| No Children | 5 (3.1%) | 0 (0.0%) |
| 1 or 2 Children | 101 (35.1%) | 519 (45.3%) |
| 3 or 4 Children | 0 (0.0%) | 209 (62.2%) |
| 5 or more Children | 0 (0.0%) | 0 (0.0%) |
| Total | 106 (23.4%) | 728 (39.0%) |
Income Below Poverty Among Married-Couple vs Single-Parent Households in Thomasville
The poverty data for Thomasville shows that 94 of the married-couple family households (3.5%) and 834 of the single-parent households (35.9%) are living below the poverty level. Within the married-couple family households, those with 1 or 2 children have the highest poverty rate, with 39 households (5.2%) falling below the poverty line. Among the single-parent households, those with 3 or 4 children have the highest poverty rate, with 209 household (60.9%) living below poverty.
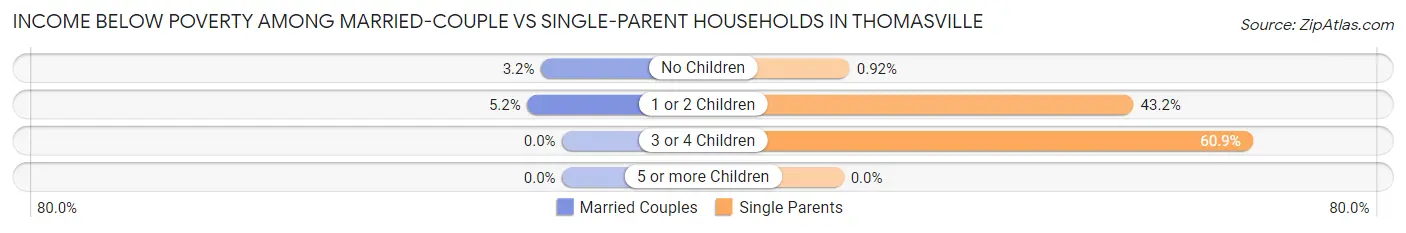
| Children | Married-Couple Families | Single-Parent Households |
| No Children | 55 (3.2%) | 5 (0.9%) |
| 1 or 2 Children | 39 (5.2%) | 620 (43.2%) |
| 3 or 4 Children | 0 (0.0%) | 209 (60.9%) |
| 5 or more Children | 0 (0.0%) | 0 (0.0%) |
| Total | 94 (3.5%) | 834 (35.9%) |
Race in Thomasville
The most populous races in Thomasville are Black / African American (10,403 | 55.5%), White / Caucasian (7,798 | 41.6%), and Two or more Races (373 | 2.0%).
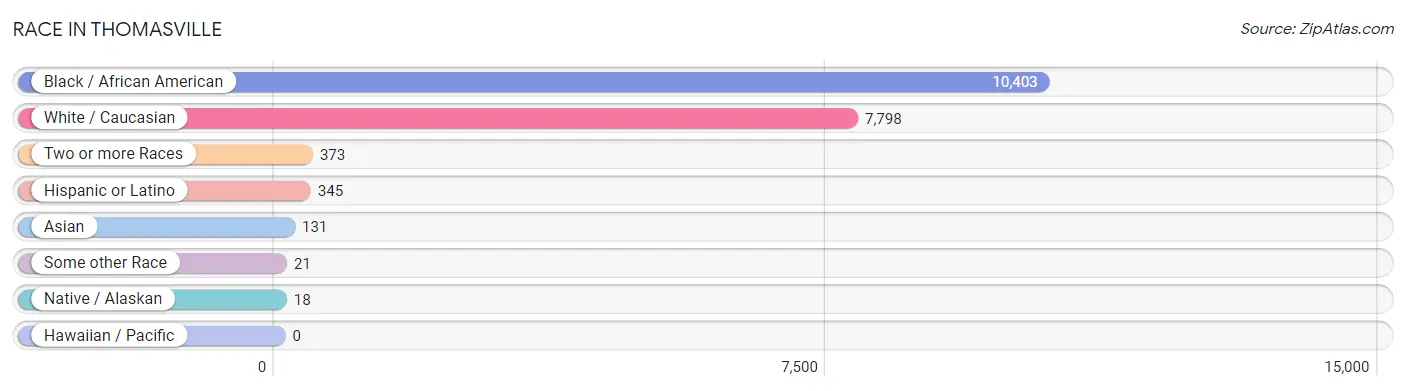
| Race | # Population | % Population |
| Asian | 131 | 0.7% |
| Black / African American | 10,403 | 55.5% |
| Hawaiian / Pacific | 0 | 0.0% |
| Hispanic or Latino | 345 | 1.8% |
| Native / Alaskan | 18 | 0.1% |
| White / Caucasian | 7,798 | 41.6% |
| Two or more Races | 373 | 2.0% |
| Some other Race | 21 | 0.1% |
| Total | 18,744 | 100.0% |
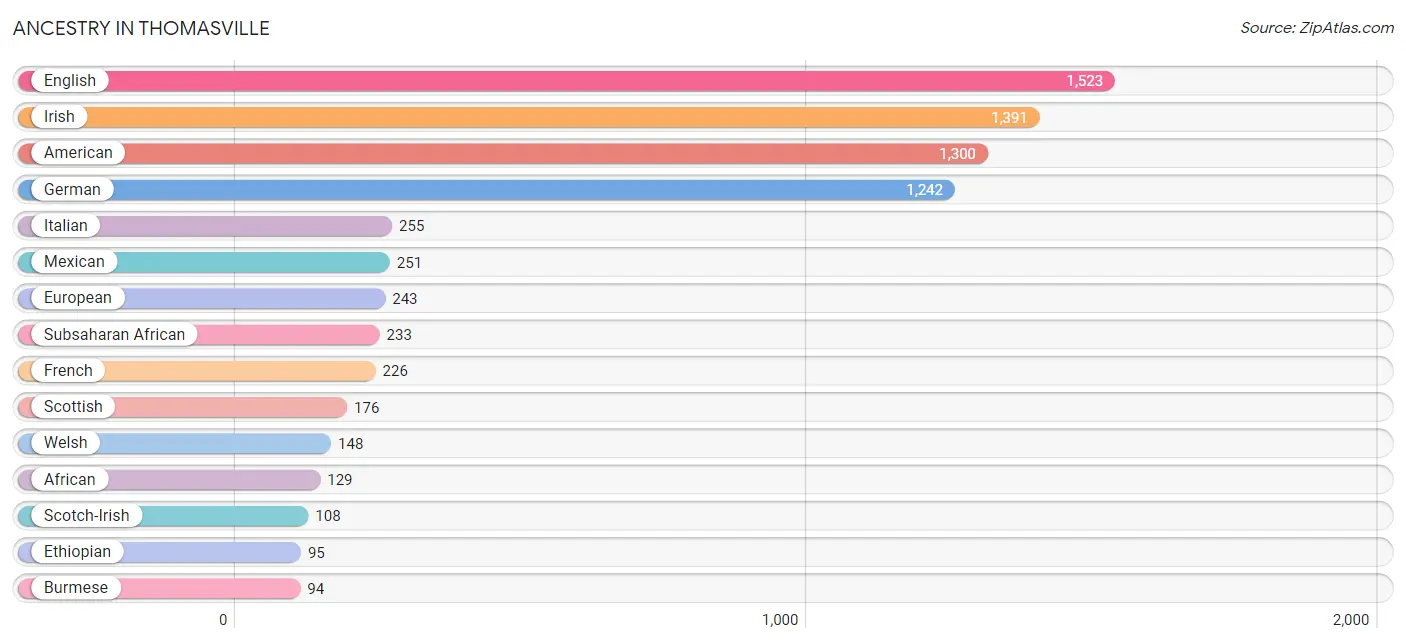
Ancestry in Thomasville
The most populous ancestries reported in Thomasville are English (1,523 | 8.1%), Irish (1,391 | 7.4%), American (1,300 | 6.9%), German (1,242 | 6.6%), and Italian (255 | 1.4%), together accounting for 30.5% of all Thomasville residents.
| Ancestry | # Population | % Population |
| African | 129 | 0.7% |
| American | 1,300 | 6.9% |
| Belizean | 19 | 0.1% |
| British | 51 | 0.3% |
| Burmese | 94 | 0.5% |
| Cajun | 9 | 0.1% |
| Canadian | 71 | 0.4% |
| Cherokee | 51 | 0.3% |
| Choctaw | 32 | 0.2% |
| Creek | 48 | 0.3% |
| Cuban | 6 | 0.0% |
| Danish | 53 | 0.3% |
| Dutch | 50 | 0.3% |
| Eastern European | 36 | 0.2% |
| English | 1,523 | 8.1% |
| Ethiopian | 95 | 0.5% |
| European | 243 | 1.3% |
| French | 226 | 1.2% |
| French Canadian | 11 | 0.1% |
| German | 1,242 | 6.6% |
| Greek | 51 | 0.3% |
| Haitian | 2 | 0.0% |
| Hungarian | 5 | 0.0% |
| Indian (Asian) | 14 | 0.1% |
| Iranian | 34 | 0.2% |
| Irish | 1,391 | 7.4% |
| Israeli | 35 | 0.2% |
| Italian | 255 | 1.4% |
| Jamaican | 2 | 0.0% |
| Korean | 75 | 0.4% |
| Malaysian | 2 | 0.0% |
| Menominee | 18 | 0.1% |
| Mexican | 251 | 1.3% |
| Native Hawaiian | 14 | 0.1% |
| Nigerian | 9 | 0.1% |
| Northern European | 35 | 0.2% |
| Norwegian | 64 | 0.3% |
| Pakistani | 2 | 0.0% |
| Polish | 11 | 0.1% |
| Puerto Rican | 19 | 0.1% |
| Russian | 33 | 0.2% |
| Samoan | 36 | 0.2% |
| Scotch-Irish | 108 | 0.6% |
| Scottish | 176 | 0.9% |
| Slavic | 20 | 0.1% |
| Spaniard | 7 | 0.0% |
| Spanish | 62 | 0.3% |
| Subsaharan African | 233 | 1.2% |
| Swedish | 65 | 0.4% |
| Swiss | 75 | 0.4% |
| Ukrainian | 2 | 0.0% |
| Welsh | 148 | 0.8% | View All 52 Rows |
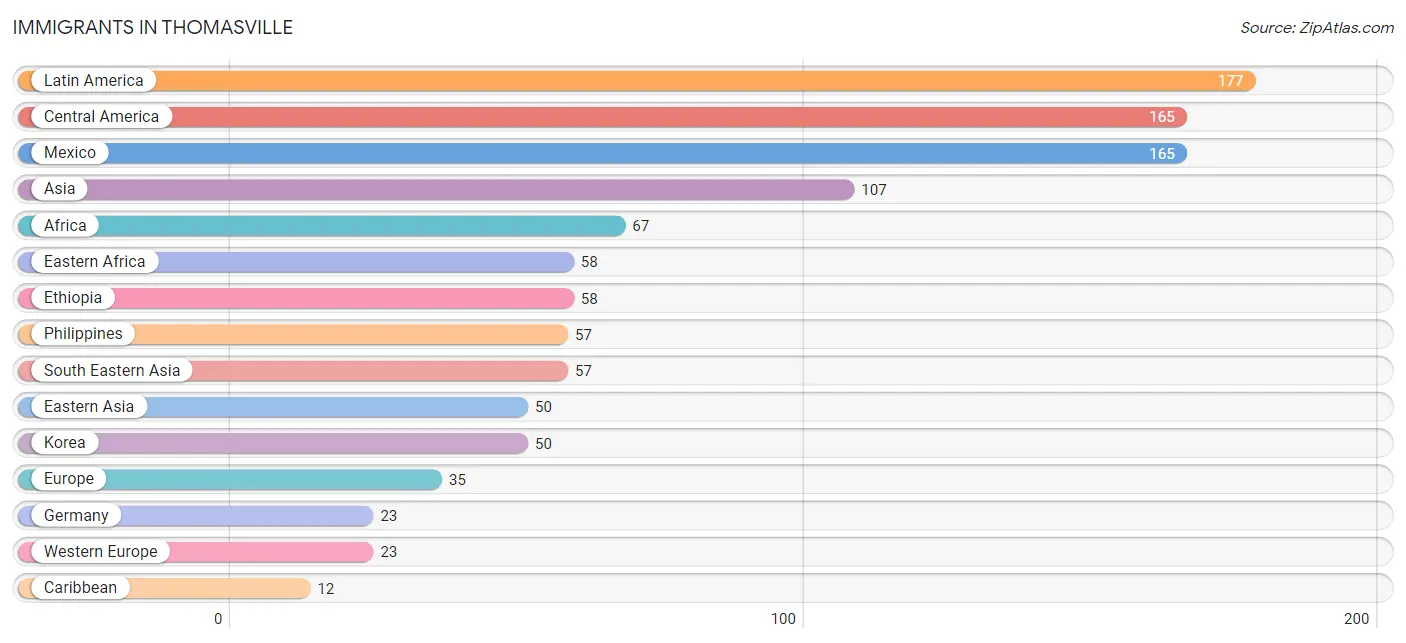
Immigrants in Thomasville
The most numerous immigrant groups reported in Thomasville came from Latin America (177 | 0.9%), Central America (165 | 0.9%), Mexico (165 | 0.9%), Asia (107 | 0.6%), and Africa (67 | 0.4%), together accounting for 3.6% of all Thomasville residents.
| Immigration Origin | # Population | % Population |
| Africa | 67 | 0.4% |
| Asia | 107 | 0.6% |
| Caribbean | 12 | 0.1% |
| Central America | 165 | 0.9% |
| Eastern Africa | 58 | 0.3% |
| Eastern Asia | 50 | 0.3% |
| Eastern Europe | 12 | 0.1% |
| Ethiopia | 58 | 0.3% |
| Europe | 35 | 0.2% |
| Germany | 23 | 0.1% |
| Haiti | 2 | 0.0% |
| Hungary | 5 | 0.0% |
| Jamaica | 10 | 0.1% |
| Korea | 50 | 0.3% |
| Latin America | 177 | 0.9% |
| Mexico | 165 | 0.9% |
| Nigeria | 9 | 0.1% |
| Philippines | 57 | 0.3% |
| Russia | 5 | 0.0% |
| South Eastern Asia | 57 | 0.3% |
| Ukraine | 2 | 0.0% |
| Western Africa | 9 | 0.1% |
| Western Europe | 23 | 0.1% | View All 23 Rows |
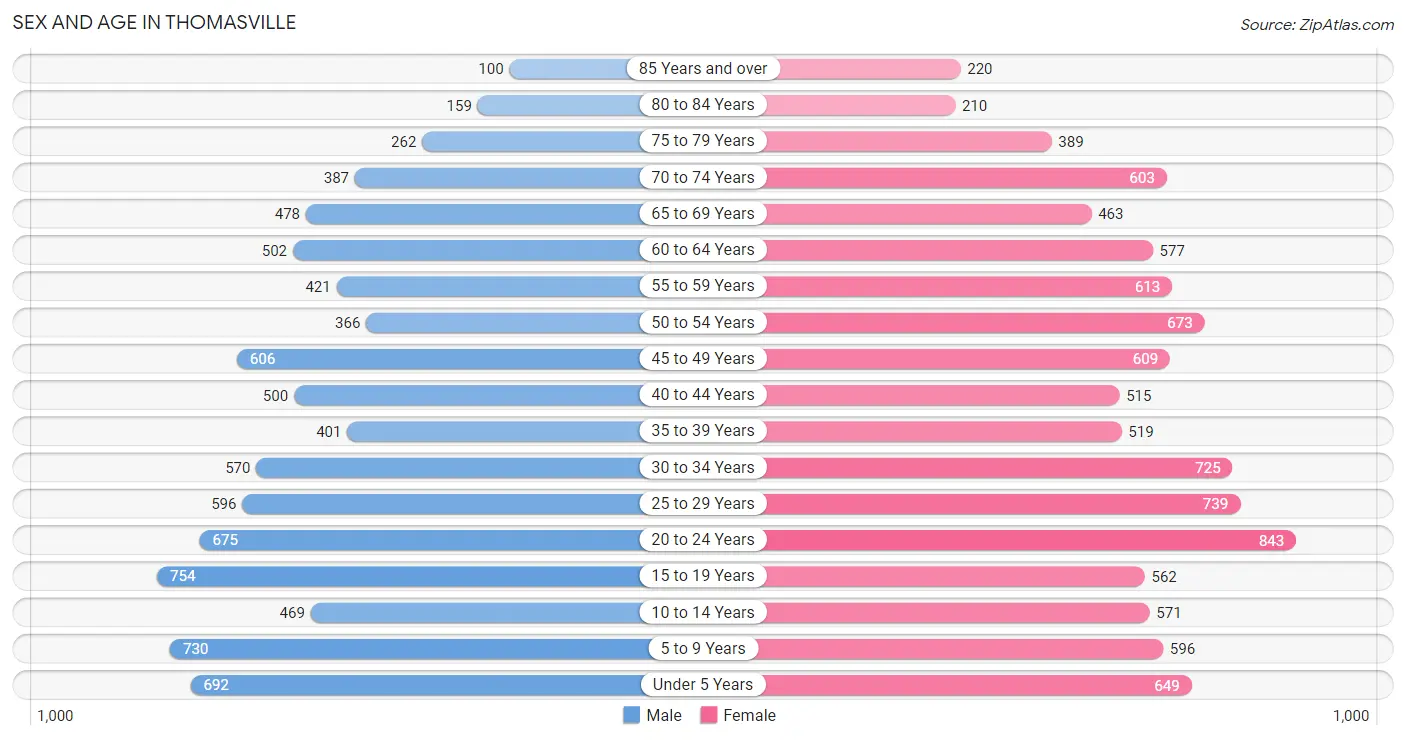
Sex and Age in Thomasville
Sex and Age in Thomasville
The most populous age groups in Thomasville are 15 to 19 Years (754 | 8.7%) for men and 20 to 24 Years (843 | 8.4%) for women.
| Age Bracket | Male | Female |
| Under 5 Years | 692 (8.0%) | 649 (6.4%) |
| 5 to 9 Years | 730 (8.4%) | 596 (5.9%) |
| 10 to 14 Years | 469 (5.4%) | 571 (5.7%) |
| 15 to 19 Years | 754 (8.7%) | 562 (5.6%) |
| 20 to 24 Years | 675 (7.8%) | 843 (8.4%) |
| 25 to 29 Years | 596 (6.9%) | 739 (7.3%) |
| 30 to 34 Years | 570 (6.6%) | 725 (7.2%) |
| 35 to 39 Years | 401 (4.6%) | 519 (5.1%) |
| 40 to 44 Years | 500 (5.8%) | 515 (5.1%) |
| 45 to 49 Years | 606 (7.0%) | 609 (6.0%) |
| 50 to 54 Years | 366 (4.2%) | 673 (6.7%) |
| 55 to 59 Years | 421 (4.9%) | 613 (6.1%) |
| 60 to 64 Years | 502 (5.8%) | 577 (5.7%) |
| 65 to 69 Years | 478 (5.5%) | 463 (4.6%) |
| 70 to 74 Years | 387 (4.5%) | 603 (6.0%) |
| 75 to 79 Years | 262 (3.0%) | 389 (3.9%) |
| 80 to 84 Years | 159 (1.8%) | 210 (2.1%) |
| 85 Years and over | 100 (1.1%) | 220 (2.2%) |
| Total | 8,668 (100.0%) | 10,076 (100.0%) |
Families and Households in Thomasville
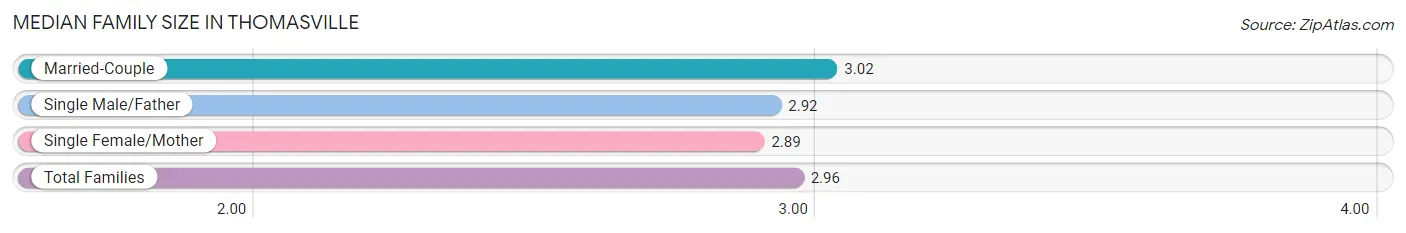
Median Family Size in Thomasville
The median family size in Thomasville is 2.96 persons per family, with married-couple families (2,679 | 53.6%) accounting for the largest median family size of 3.02 persons per family. On the other hand, single female/mother families (1,866 | 37.3%) represent the smallest median family size with 2.89 persons per family.
| Family Type | # Families | Family Size |
| Married-Couple | 2,679 (53.6%) | 3.02 |
| Single Male/Father | 454 (9.1%) | 2.92 |
| Single Female/Mother | 1,866 (37.3%) | 2.89 |
| Total Families | 4,999 (100.0%) | 2.96 |
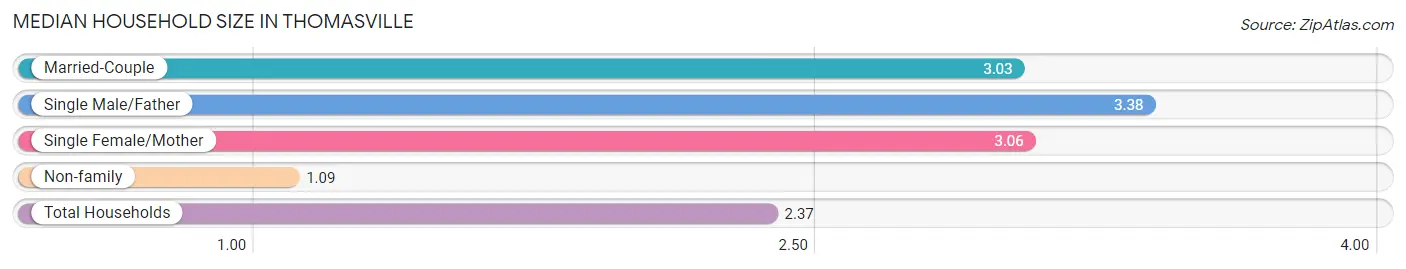
Median Household Size in Thomasville
The median household size in Thomasville is 2.37 persons per household, with single male/father households (454 | 5.9%) accounting for the largest median household size of 3.38 persons per household. non-family households (2,752 | 35.5%) represent the smallest median household size with 1.09 persons per household.
| Household Type | # Households | Household Size |
| Married-Couple | 2,679 (34.6%) | 3.03 |
| Single Male/Father | 454 (5.9%) | 3.38 |
| Single Female/Mother | 1,866 (24.1%) | 3.06 |
| Non-family | 2,752 (35.5%) | 1.09 |
| Total Households | 7,751 (100.0%) | 2.37 |
Household Size by Marriage Status in Thomasville
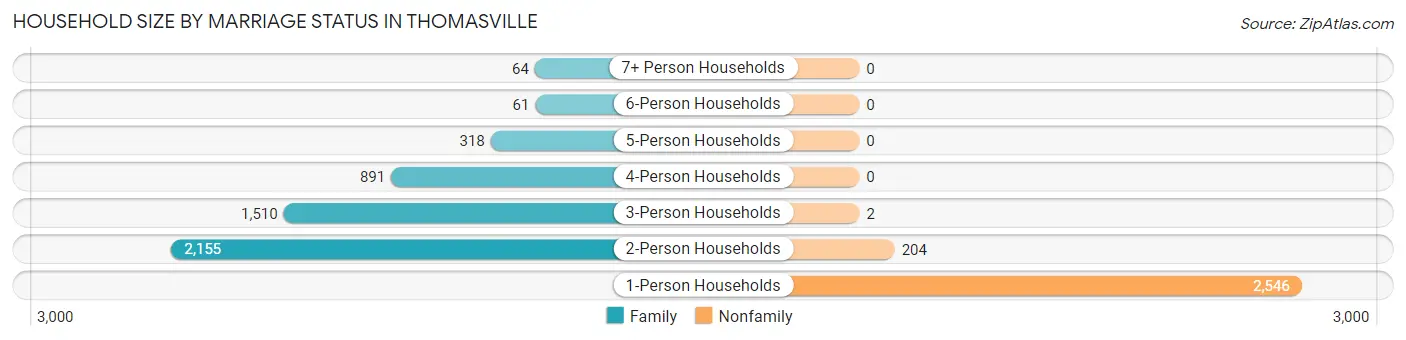
Out of a total of 7,751 households in Thomasville, 4,999 (64.5%) are family households, while 2,752 (35.5%) are nonfamily households. The most numerous type of family households are 2-person households, comprising 2,155, and the most common type of nonfamily households are 1-person households, comprising 2,546.
| Household Size | Family Households | Nonfamily Households |
| 1-Person Households | - | 2,546 (32.9%) |
| 2-Person Households | 2,155 (27.8%) | 204 (2.6%) |
| 3-Person Households | 1,510 (19.5%) | 2 (0.0%) |
| 4-Person Households | 891 (11.5%) | 0 (0.0%) |
| 5-Person Households | 318 (4.1%) | 0 (0.0%) |
| 6-Person Households | 61 (0.8%) | 0 (0.0%) |
| 7+ Person Households | 64 (0.8%) | 0 (0.0%) |
| Total | 4,999 (64.5%) | 2,752 (35.5%) |
Female Fertility in Thomasville
Fertility by Age in Thomasville
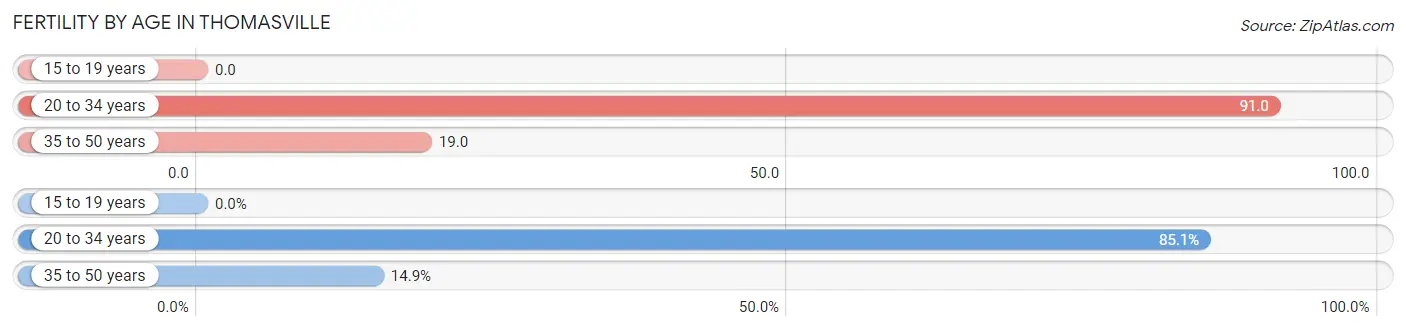
Average fertility rate in Thomasville is 52.0 births per 1,000 women. Women in the age bracket of 20 to 34 years have the highest fertility rate with 91.0 births per 1,000 women. Women in the age bracket of 20 to 34 years acount for 85.1% of all women with births.
| Age Bracket | Women with Births | Births / 1,000 Women |
| 15 to 19 years | 0 (0.0%) | 0.0 |
| 20 to 34 years | 211 (85.1%) | 91.0 |
| 35 to 50 years | 37 (14.9%) | 19.0 |
| Total | 248 (100.0%) | 52.0 |
Fertility by Age by Marriage Status in Thomasville
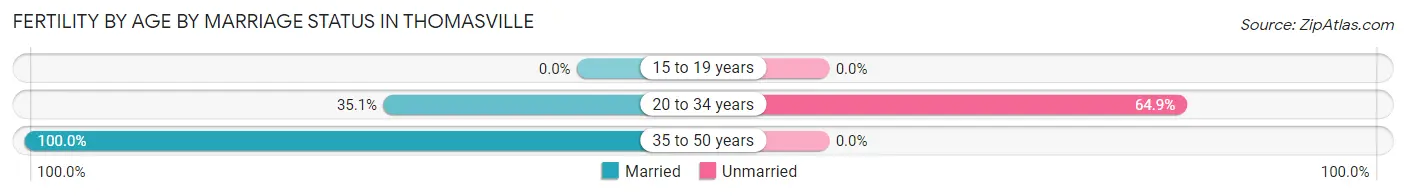
44.8% of women with births (248) in Thomasville are married. The highest percentage of unmarried women with births falls into 20 to 34 years age bracket with 64.9% of them unmarried at the time of birth, while the lowest percentage of unmarried women with births belong to 35 to 50 years age bracket with 0.0% of them unmarried.
| Age Bracket | Married | Unmarried |
| 15 to 19 years | 0 (0.0%) | 0 (0.0%) |
| 20 to 34 years | 74 (35.1%) | 137 (64.9%) |
| 35 to 50 years | 37 (100.0%) | 0 (0.0%) |
| Total | 111 (44.8%) | 137 (55.2%) |
Fertility by Education in Thomasville
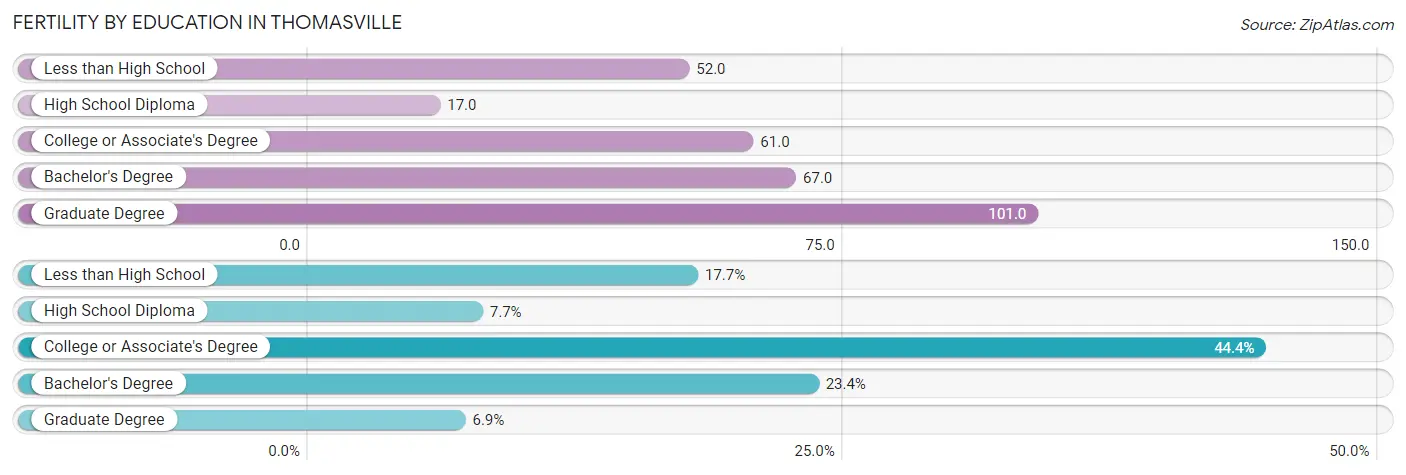
Average fertility rate in Thomasville is 52.0 births per 1,000 women. Women with the education attainment of graduate degree have the highest fertility rate of 101.0 births per 1,000 women, while women with the education attainment of high school diploma have the lowest fertility at 17.0 births per 1,000 women. Women with the education attainment of college or associate's degree represent 44.4% of all women with births.
| Educational Attainment | Women with Births | Births / 1,000 Women |
| Less than High School | 44 (17.7%) | 52.0 |
| High School Diploma | 19 (7.7%) | 17.0 |
| College or Associate's Degree | 110 (44.4%) | 61.0 |
| Bachelor's Degree | 58 (23.4%) | 67.0 |
| Graduate Degree | 17 (6.9%) | 101.0 |
| Total | 248 (100.0%) | 52.0 |
Fertility by Education by Marriage Status in Thomasville
55.2% of women with births in Thomasville are unmarried. Women with the educational attainment of graduate degree are most likely to be married with 100.0% of them married at childbirth, while women with the educational attainment of less than high school are least likely to be married with 100.0% of them unmarried at childbirth.
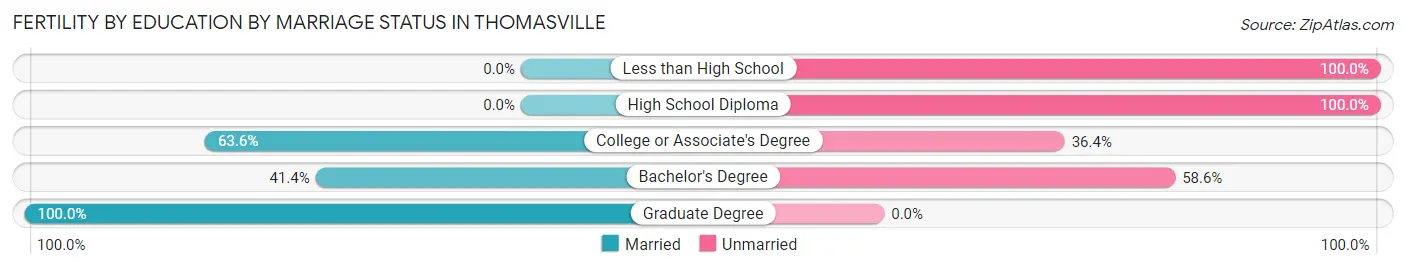
| Educational Attainment | Married | Unmarried |
| Less than High School | 0 (0.0%) | 44 (100.0%) |
| High School Diploma | 0 (0.0%) | 19 (100.0%) |
| College or Associate's Degree | 70 (63.6%) | 40 (36.4%) |
| Bachelor's Degree | 24 (41.4%) | 34 (58.6%) |
| Graduate Degree | 17 (100.0%) | 0 (0.0%) |
| Total | 111 (44.8%) | 137 (55.2%) |
Employment Characteristics in Thomasville
Employment by Class of Employer in Thomasville
Among the 8,348 employed individuals in Thomasville, private company employees (5,335 | 63.9%), not-for-profit organizations (886 | 10.6%), and local government employees (652 | 7.8%) make up the most common classes of employment.
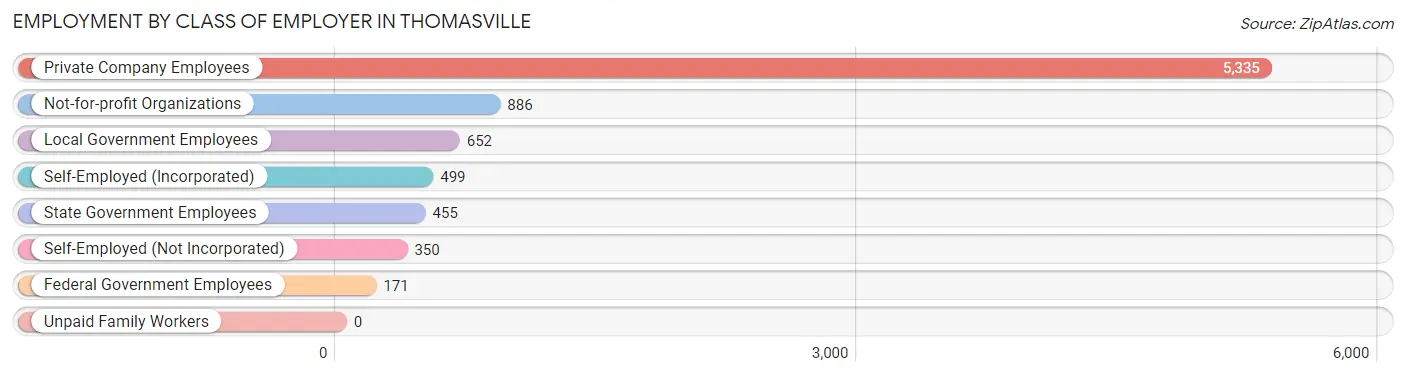
| Employer Class | # Employees | % Employees |
| Private Company Employees | 5,335 | 63.9% |
| Self-Employed (Incorporated) | 499 | 6.0% |
| Self-Employed (Not Incorporated) | 350 | 4.2% |
| Not-for-profit Organizations | 886 | 10.6% |
| Local Government Employees | 652 | 7.8% |
| State Government Employees | 455 | 5.4% |
| Federal Government Employees | 171 | 2.1% |
| Unpaid Family Workers | 0 | 0.0% |
| Total | 8,348 | 100.0% |
Employment Status by Age in Thomasville
According to the labor force statistics for Thomasville, out of the total population over 16 years of age (14,611), 62.3% or 9,103 individuals are in the labor force, with 4.5% or 410 of them unemployed. The age group with the highest labor force participation rate is 30 to 34 years, with 92.7% or 1,200 individuals in the labor force. Within the labor force, the 16 to 19 years age range has the highest percentage of unemployed individuals, with 22.1% or 50 of them being unemployed.
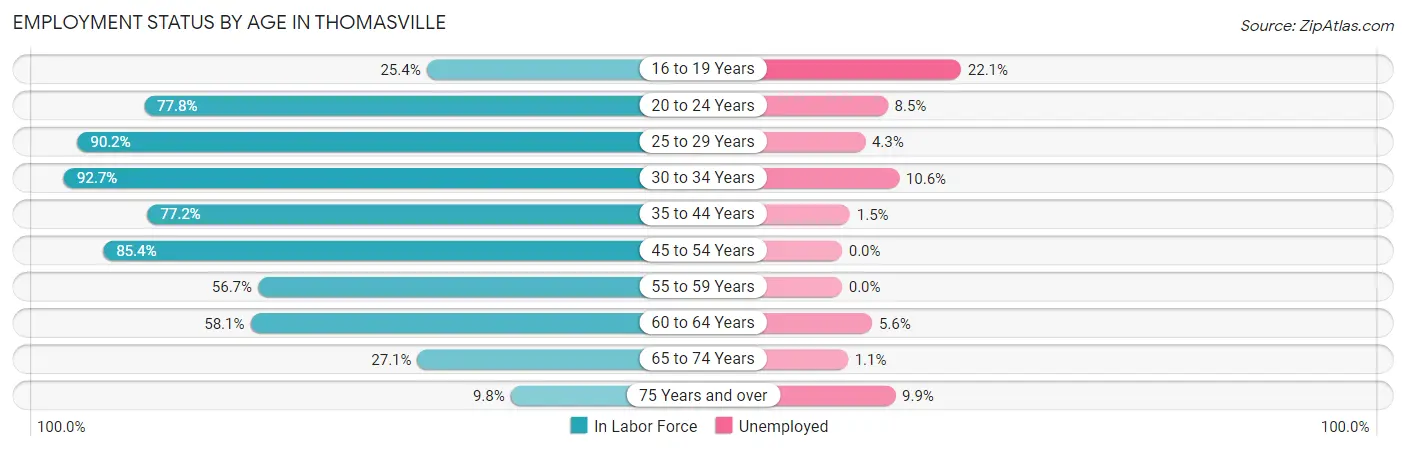
| Age Bracket | In Labor Force | Unemployed |
| 16 to 19 Years | 226 (25.4%) | 50 (22.1%) |
| 20 to 24 Years | 1,181 (77.8%) | 100 (8.5%) |
| 25 to 29 Years | 1,204 (90.2%) | 52 (4.3%) |
| 30 to 34 Years | 1,200 (92.7%) | 127 (10.6%) |
| 35 to 44 Years | 1,494 (77.2%) | 22 (1.5%) |
| 45 to 54 Years | 1,925 (85.4%) | 0 (0.0%) |
| 55 to 59 Years | 586 (56.7%) | 0 (0.0%) |
| 60 to 64 Years | 627 (58.1%) | 35 (5.6%) |
| 65 to 74 Years | 523 (27.1%) | 6 (1.1%) |
| 75 Years and over | 131 (9.8%) | 13 (9.9%) |
| Total | 9,103 (62.3%) | 410 (4.5%) |
Employment Status by Educational Attainment in Thomasville
According to labor force statistics for Thomasville, 78.8% of individuals (7,038) out of the total population between 25 and 64 years of age (8,932) are in the labor force, with 3.4% or 239 of them being unemployed. The group with the highest labor force participation rate are those with the educational attainment of bachelor's degree or higher, with 91.3% or 2,135 individuals in the labor force. Within the labor force, individuals with less than high school education have the highest percentage of unemployment, with 18.3% or 99 of them being unemployed.
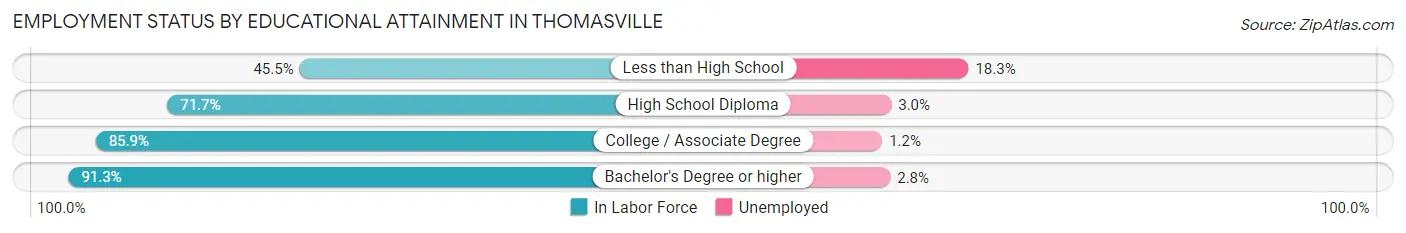
| Educational Attainment | In Labor Force | Unemployed |
| Less than High School | 540 (45.5%) | 217 (18.3%) |
| High School Diploma | 1,430 (71.7%) | 60 (3.0%) |
| College / Associate Degree | 2,932 (85.9%) | 41 (1.2%) |
| Bachelor's Degree or higher | 2,135 (91.3%) | 65 (2.8%) |
| Total | 7,038 (78.8%) | 304 (3.4%) |
Employment Occupations by Sex in Thomasville
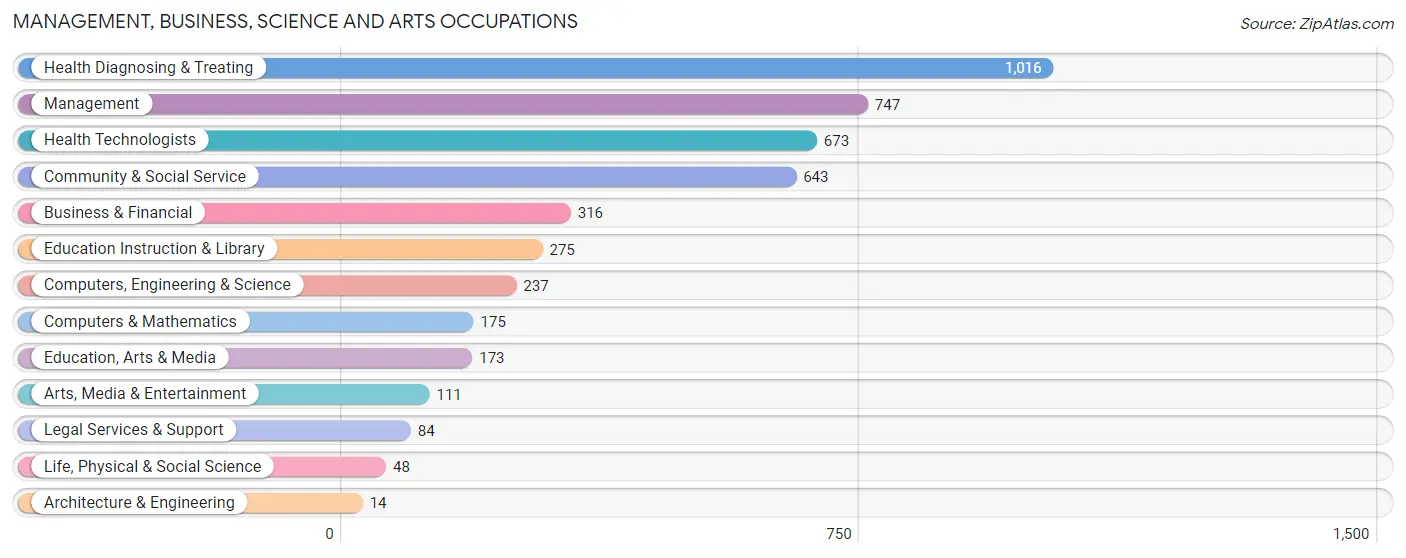
Management, Business, Science and Arts Occupations
The most common Management, Business, Science and Arts occupations in Thomasville are Health Diagnosing & Treating (1,016 | 11.7%), Management (747 | 8.6%), Health Technologists (673 | 7.7%), Community & Social Service (643 | 7.4%), and Business & Financial (316 | 3.6%).
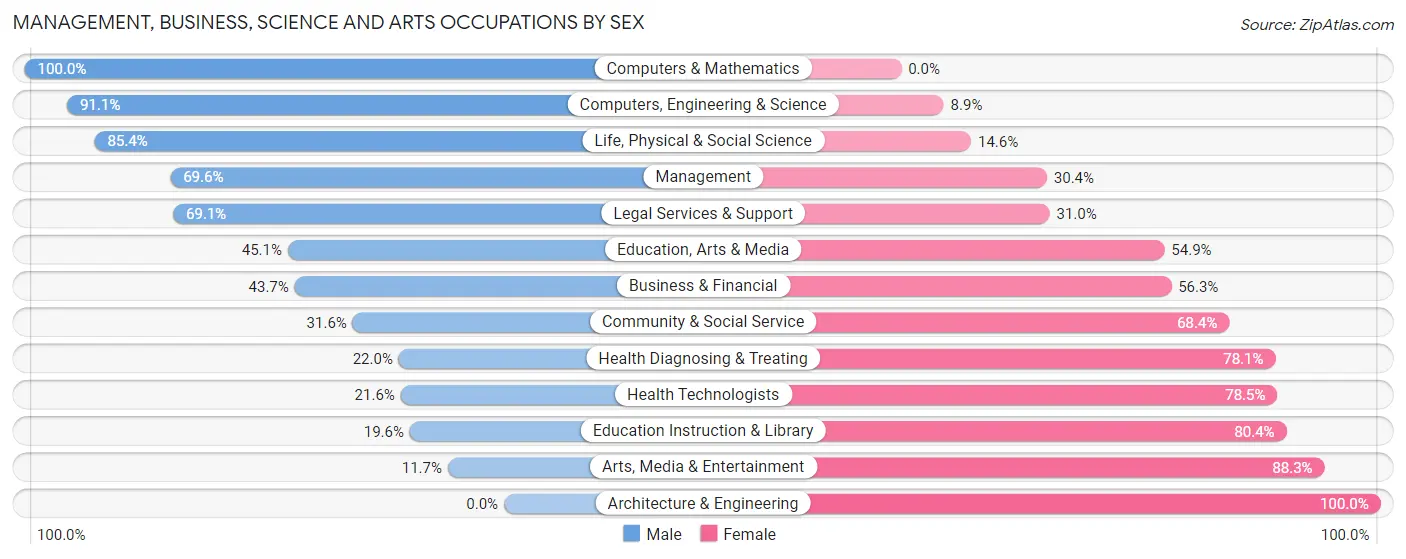
Management, Business, Science and Arts Occupations by Sex
Within the Management, Business, Science and Arts occupations in Thomasville, the most male-oriented occupations are Computers & Mathematics (100.0%), Computers, Engineering & Science (91.1%), and Life, Physical & Social Science (85.4%), while the most female-oriented occupations are Architecture & Engineering (100.0%), Arts, Media & Entertainment (88.3%), and Education Instruction & Library (80.4%).
| Occupation | Male | Female |
| Management | 520 (69.6%) | 227 (30.4%) |
| Business & Financial | 138 (43.7%) | 178 (56.3%) |
| Computers, Engineering & Science | 216 (91.1%) | 21 (8.9%) |
| Computers & Mathematics | 175 (100.0%) | 0 (0.0%) |
| Architecture & Engineering | 0 (0.0%) | 14 (100.0%) |
| Life, Physical & Social Science | 41 (85.4%) | 7 (14.6%) |
| Community & Social Service | 203 (31.6%) | 440 (68.4%) |
| Education, Arts & Media | 78 (45.1%) | 95 (54.9%) |
| Legal Services & Support | 58 (69.1%) | 26 (30.9%) |
| Education Instruction & Library | 54 (19.6%) | 221 (80.4%) |
| Arts, Media & Entertainment | 13 (11.7%) | 98 (88.3%) |
| Health Diagnosing & Treating | 223 (22.0%) | 793 (78.0%) |
| Health Technologists | 145 (21.5%) | 528 (78.4%) |
| Total (Category) | 1,300 (43.9%) | 1,659 (56.1%) |
| Total (Overall) | 4,217 (48.5%) | 4,468 (51.4%) |
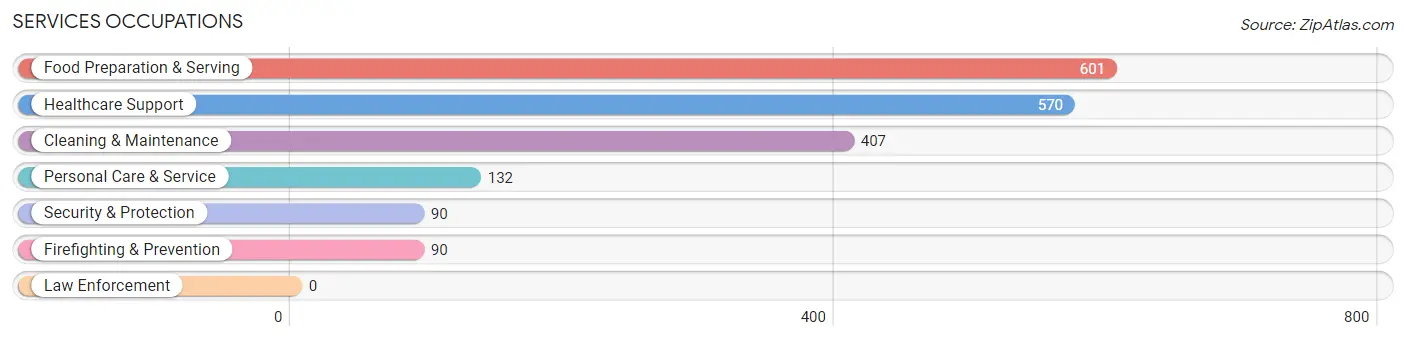
Services Occupations
The most common Services occupations in Thomasville are Food Preparation & Serving (601 | 6.9%), Healthcare Support (570 | 6.6%), Cleaning & Maintenance (407 | 4.7%), Personal Care & Service (132 | 1.5%), and Security & Protection (90 | 1.0%).
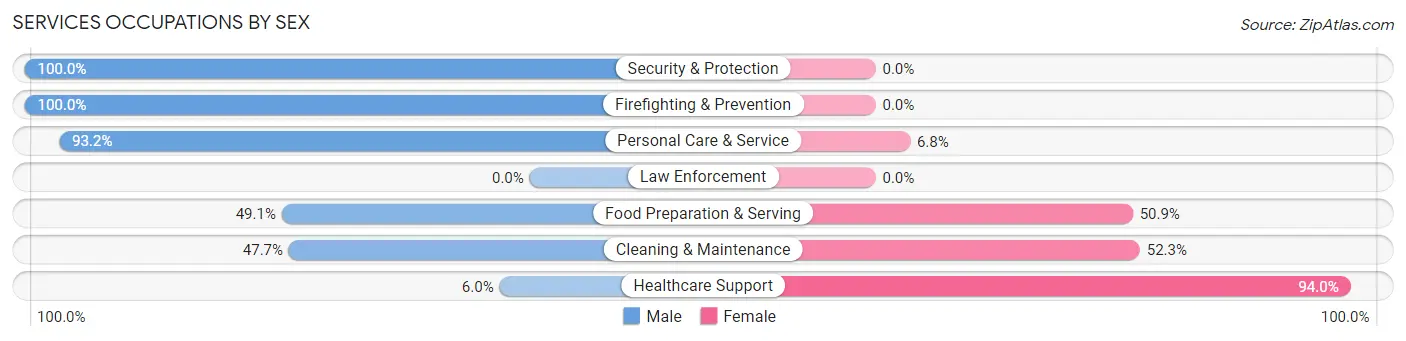
Services Occupations by Sex
Within the Services occupations in Thomasville, the most male-oriented occupations are Security & Protection (100.0%), Firefighting & Prevention (100.0%), and Personal Care & Service (93.2%), while the most female-oriented occupations are Healthcare Support (94.0%), Cleaning & Maintenance (52.3%), and Food Preparation & Serving (50.9%).
| Occupation | Male | Female |
| Healthcare Support | 34 (6.0%) | 536 (94.0%) |
| Security & Protection | 90 (100.0%) | 0 (0.0%) |
| Firefighting & Prevention | 90 (100.0%) | 0 (0.0%) |
| Law Enforcement | 0 (0.0%) | 0 (0.0%) |
| Food Preparation & Serving | 295 (49.1%) | 306 (50.9%) |
| Cleaning & Maintenance | 194 (47.7%) | 213 (52.3%) |
| Personal Care & Service | 123 (93.2%) | 9 (6.8%) |
| Total (Category) | 736 (40.9%) | 1,064 (59.1%) |
| Total (Overall) | 4,217 (48.5%) | 4,468 (51.4%) |
Sales and Office Occupations
The most common Sales and Office occupations in Thomasville are Office & Administration (1,109 | 12.8%), and Sales & Related (857 | 9.9%).

Sales and Office Occupations by Sex
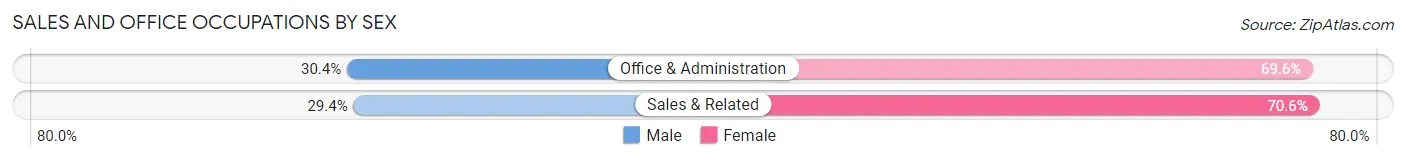
| Occupation | Male | Female |
| Sales & Related | 252 (29.4%) | 605 (70.6%) |
| Office & Administration | 337 (30.4%) | 772 (69.6%) |
| Total (Category) | 589 (30.0%) | 1,377 (70.0%) |
| Total (Overall) | 4,217 (48.5%) | 4,468 (51.4%) |
Natural Resources, Construction and Maintenance Occupations
The most common Natural Resources, Construction and Maintenance occupations in Thomasville are Construction & Extraction (308 | 3.5%), Installation, Maintenance & Repair (212 | 2.4%), and Farming, Fishing & Forestry (137 | 1.6%).

Natural Resources, Construction and Maintenance Occupations by Sex
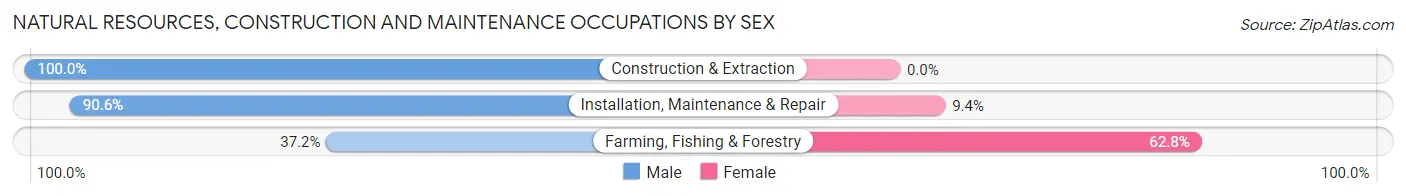
| Occupation | Male | Female |
| Farming, Fishing & Forestry | 51 (37.2%) | 86 (62.8%) |
| Construction & Extraction | 308 (100.0%) | 0 (0.0%) |
| Installation, Maintenance & Repair | 192 (90.6%) | 20 (9.4%) |
| Total (Category) | 551 (83.9%) | 106 (16.1%) |
| Total (Overall) | 4,217 (48.5%) | 4,468 (51.4%) |
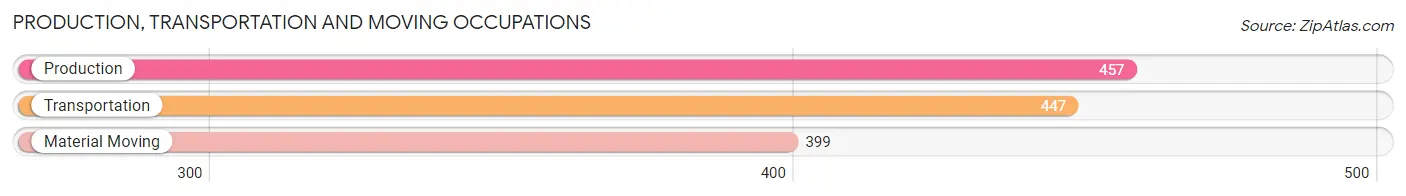
Production, Transportation and Moving Occupations
The most common Production, Transportation and Moving occupations in Thomasville are Production (457 | 5.3%), Transportation (447 | 5.1%), and Material Moving (399 | 4.6%).
Production, Transportation and Moving Occupations by Sex
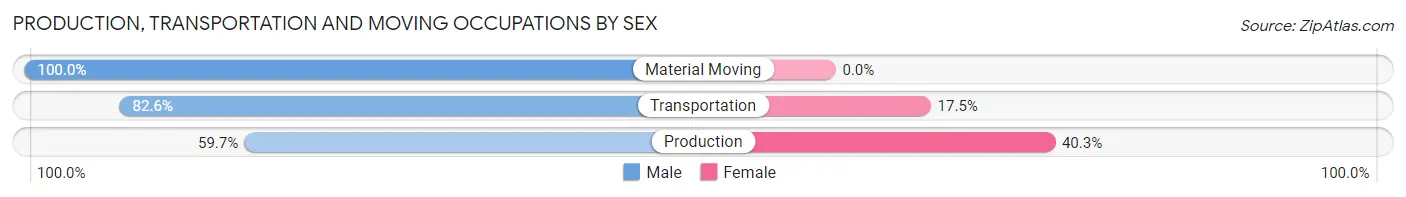
| Occupation | Male | Female |
| Production | 273 (59.7%) | 184 (40.3%) |
| Transportation | 369 (82.6%) | 78 (17.4%) |
| Material Moving | 399 (100.0%) | 0 (0.0%) |
| Total (Category) | 1,041 (79.9%) | 262 (20.1%) |
| Total (Overall) | 4,217 (48.5%) | 4,468 (51.4%) |
Employment Industries by Sex in Thomasville
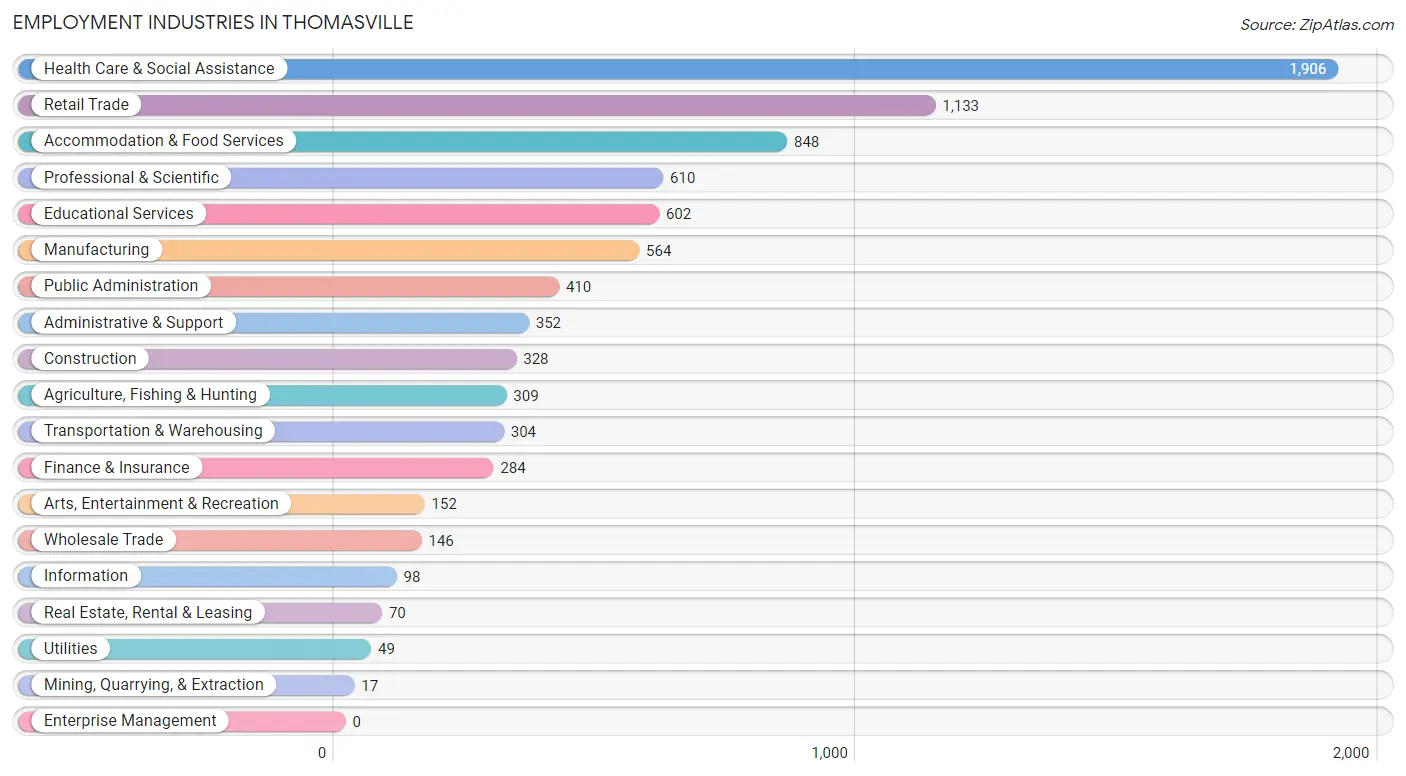
Employment Industries in Thomasville
The major employment industries in Thomasville include Health Care & Social Assistance (1,906 | 22.0%), Retail Trade (1,133 | 13.1%), Accommodation & Food Services (848 | 9.8%), Professional & Scientific (610 | 7.0%), and Educational Services (602 | 6.9%).
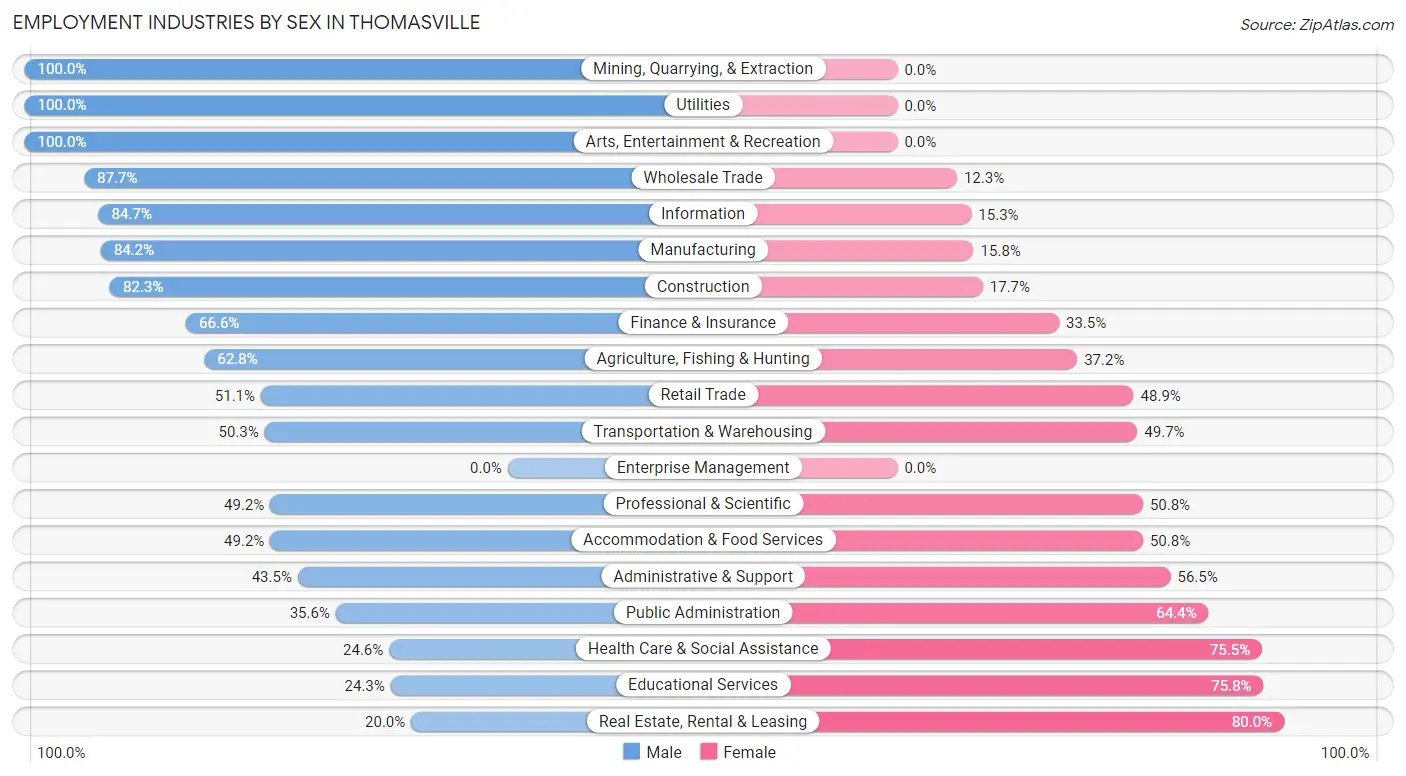
Employment Industries by Sex in Thomasville
The Thomasville industries that see more men than women are Mining, Quarrying, & Extraction (100.0%), Utilities (100.0%), and Arts, Entertainment & Recreation (100.0%), whereas the industries that tend to have a higher number of women are Real Estate, Rental & Leasing (80.0%), Educational Services (75.7%), and Health Care & Social Assistance (75.4%).
| Industry | Male | Female |
| Agriculture, Fishing & Hunting | 194 (62.8%) | 115 (37.2%) |
| Mining, Quarrying, & Extraction | 17 (100.0%) | 0 (0.0%) |
| Construction | 270 (82.3%) | 58 (17.7%) |
| Manufacturing | 475 (84.2%) | 89 (15.8%) |
| Wholesale Trade | 128 (87.7%) | 18 (12.3%) |
| Retail Trade | 579 (51.1%) | 554 (48.9%) |
| Transportation & Warehousing | 153 (50.3%) | 151 (49.7%) |
| Utilities | 49 (100.0%) | 0 (0.0%) |
| Information | 83 (84.7%) | 15 (15.3%) |
| Finance & Insurance | 189 (66.5%) | 95 (33.5%) |
| Real Estate, Rental & Leasing | 14 (20.0%) | 56 (80.0%) |
| Professional & Scientific | 300 (49.2%) | 310 (50.8%) |
| Enterprise Management | 0 (0.0%) | 0 (0.0%) |
| Administrative & Support | 153 (43.5%) | 199 (56.5%) |
| Educational Services | 146 (24.2%) | 456 (75.7%) |
| Health Care & Social Assistance | 468 (24.5%) | 1,438 (75.4%) |
| Arts, Entertainment & Recreation | 152 (100.0%) | 0 (0.0%) |
| Accommodation & Food Services | 417 (49.2%) | 431 (50.8%) |
| Public Administration | 146 (35.6%) | 264 (64.4%) |
| Total | 4,217 (48.5%) | 4,468 (51.4%) |
Education in Thomasville
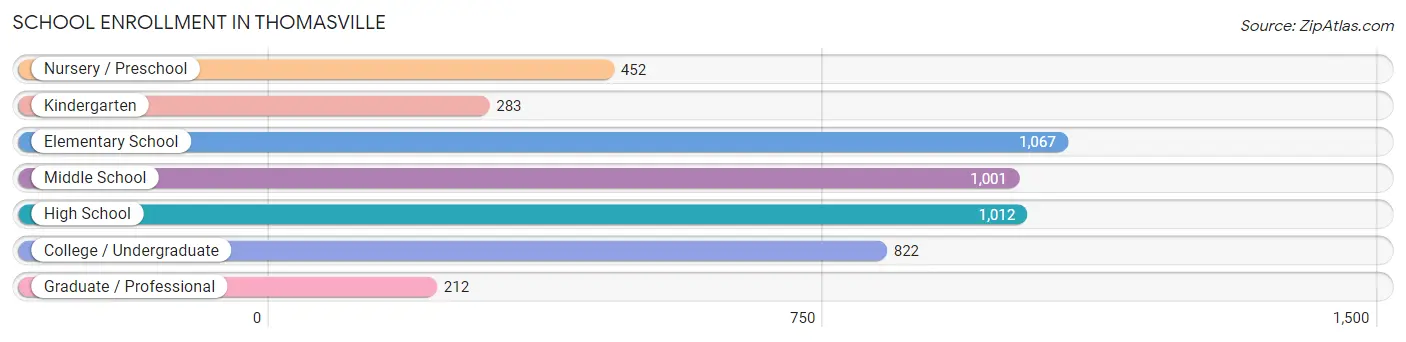
School Enrollment in Thomasville
The most common levels of schooling among the 4,849 students in Thomasville are elementary school (1,067 | 22.0%), high school (1,012 | 20.9%), and middle school (1,001 | 20.6%).
| School Level | # Students | % Students |
| Nursery / Preschool | 452 | 9.3% |
| Kindergarten | 283 | 5.8% |
| Elementary School | 1,067 | 22.0% |
| Middle School | 1,001 | 20.6% |
| High School | 1,012 | 20.9% |
| College / Undergraduate | 822 | 17.0% |
| Graduate / Professional | 212 | 4.4% |
| Total | 4,849 | 100.0% |
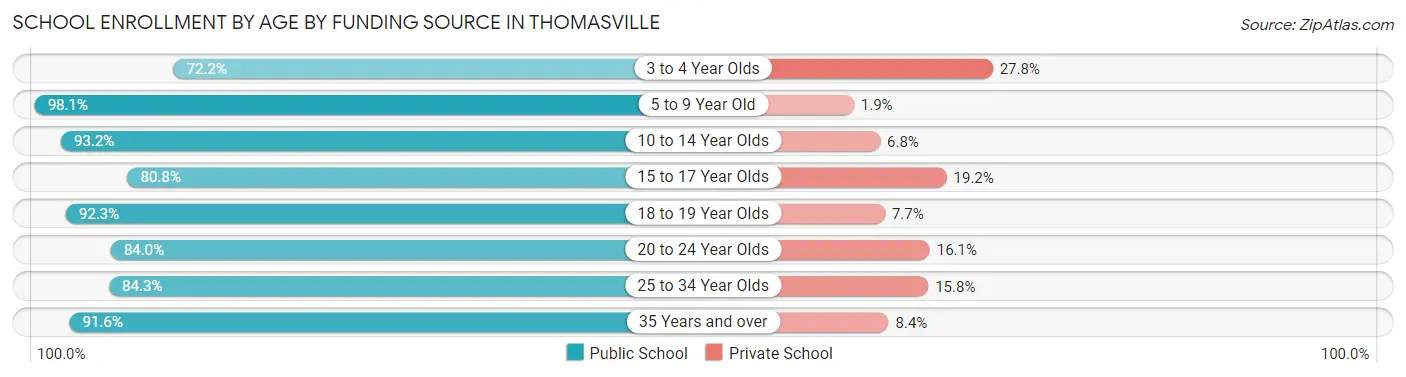
School Enrollment by Age by Funding Source in Thomasville
Out of a total of 4,849 students who are enrolled in schools in Thomasville, 538 (11.1%) attend a private institution, while the remaining 4,311 (88.9%) are enrolled in public schools. The age group of 3 to 4 year olds has the highest likelihood of being enrolled in private schools, with 108 (27.8% in the age bracket) enrolled. Conversely, the age group of 5 to 9 year old has the lowest likelihood of being enrolled in a private school, with 1,301 (98.1% in the age bracket) attending a public institution.
| Age Bracket | Public School | Private School |
| 3 to 4 Year Olds | 281 (72.2%) | 108 (27.8%) |
| 5 to 9 Year Old | 1,301 (98.1%) | 25 (1.9%) |
| 10 to 14 Year Olds | 962 (93.2%) | 70 (6.8%) |
| 15 to 17 Year Olds | 814 (80.8%) | 193 (19.2%) |
| 18 to 19 Year Olds | 168 (92.3%) | 14 (7.7%) |
| 20 to 24 Year Olds | 272 (84.0%) | 52 (16.1%) |
| 25 to 34 Year Olds | 305 (84.3%) | 57 (15.8%) |
| 35 Years and over | 208 (91.6%) | 19 (8.4%) |
| Total | 4,311 (88.9%) | 538 (11.1%) |
Educational Attainment by Field of Study in Thomasville
Business (901 | 26.2%), science & technology (506 | 14.7%), education (451 | 13.1%), communications (304 | 8.8%), and bio, nature & agricultural (190 | 5.5%) are the most common fields of study among 3,442 individuals in Thomasville who have obtained a bachelor's degree or higher.
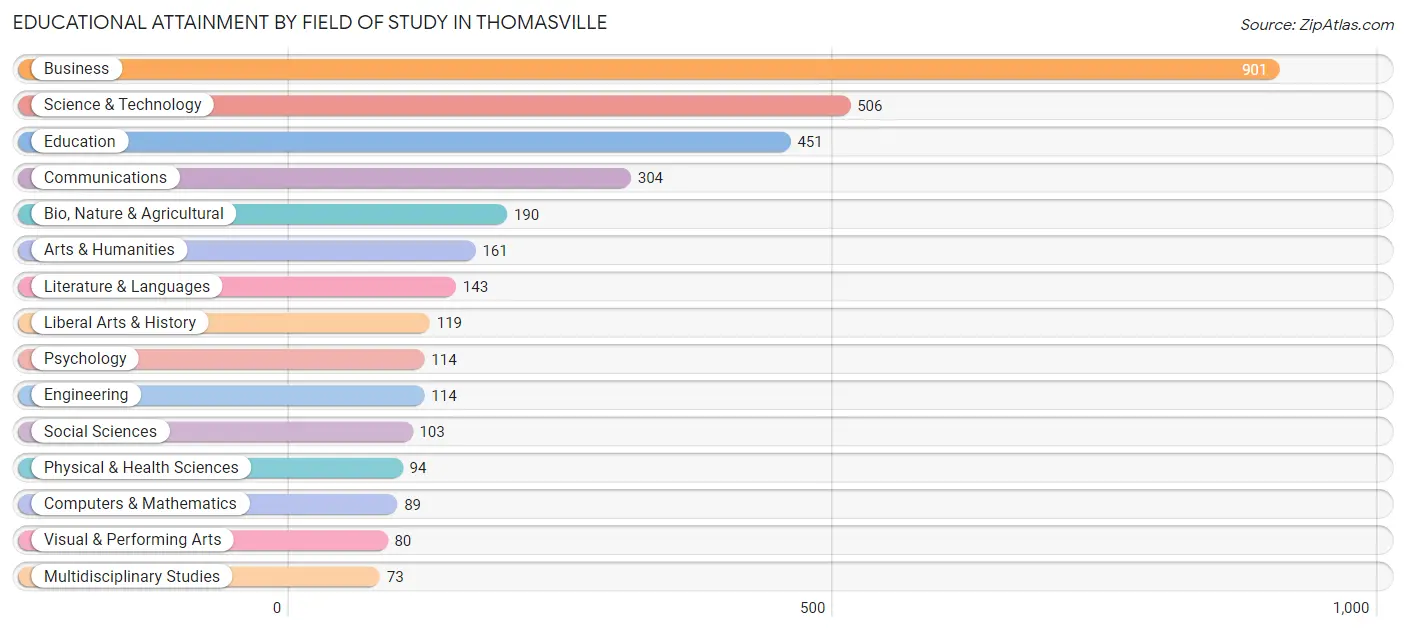
| Field of Study | # Graduates | % Graduates |
| Computers & Mathematics | 89 | 2.6% |
| Bio, Nature & Agricultural | 190 | 5.5% |
| Physical & Health Sciences | 94 | 2.7% |
| Psychology | 114 | 3.3% |
| Social Sciences | 103 | 3.0% |
| Engineering | 114 | 3.3% |
| Multidisciplinary Studies | 73 | 2.1% |
| Science & Technology | 506 | 14.7% |
| Business | 901 | 26.2% |
| Education | 451 | 13.1% |
| Literature & Languages | 143 | 4.2% |
| Liberal Arts & History | 119 | 3.5% |
| Visual & Performing Arts | 80 | 2.3% |
| Communications | 304 | 8.8% |
| Arts & Humanities | 161 | 4.7% |
| Total | 3,442 | 100.0% |
Transportation & Commute in Thomasville
Vehicle Availability by Sex in Thomasville
The most prevalent vehicle ownership categories in Thomasville are males with 2 vehicles (1,832, accounting for 46.4%) and females with 2 vehicles (1,623, making up 42.5%).
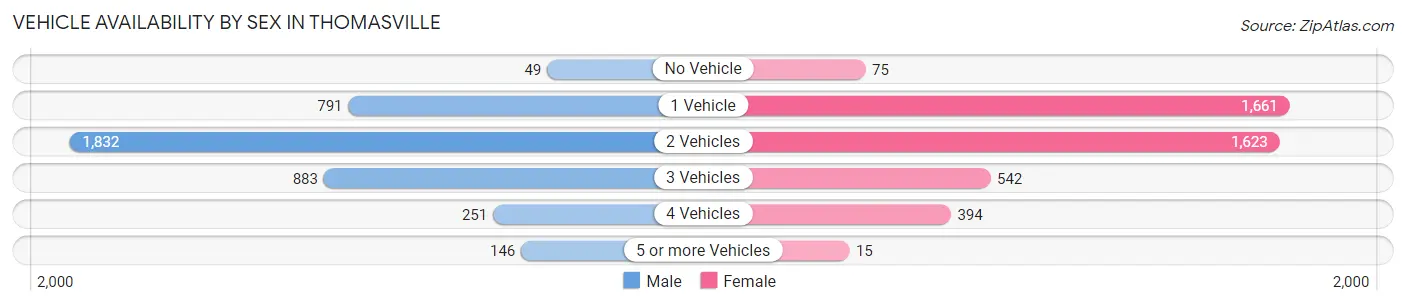
| Vehicles Available | Male | Female |
| No Vehicle | 49 (1.2%) | 75 (1.7%) |
| 1 Vehicle | 791 (20.0%) | 1,661 (38.5%) |
| 2 Vehicles | 1,832 (46.4%) | 1,623 (37.7%) |
| 3 Vehicles | 883 (22.3%) | 542 (12.6%) |
| 4 Vehicles | 251 (6.4%) | 394 (9.1%) |
| 5 or more Vehicles | 146 (3.7%) | 15 (0.4%) |
| Total | 3,952 (100.0%) | 4,310 (100.0%) |
Commute Time in Thomasville
The most frequently occuring commute durations in Thomasville are 5 to 9 minutes (2,410 commuters, 30.9%), 10 to 14 minutes (1,903 commuters, 24.4%), and 15 to 19 minutes (1,072 commuters, 13.8%).
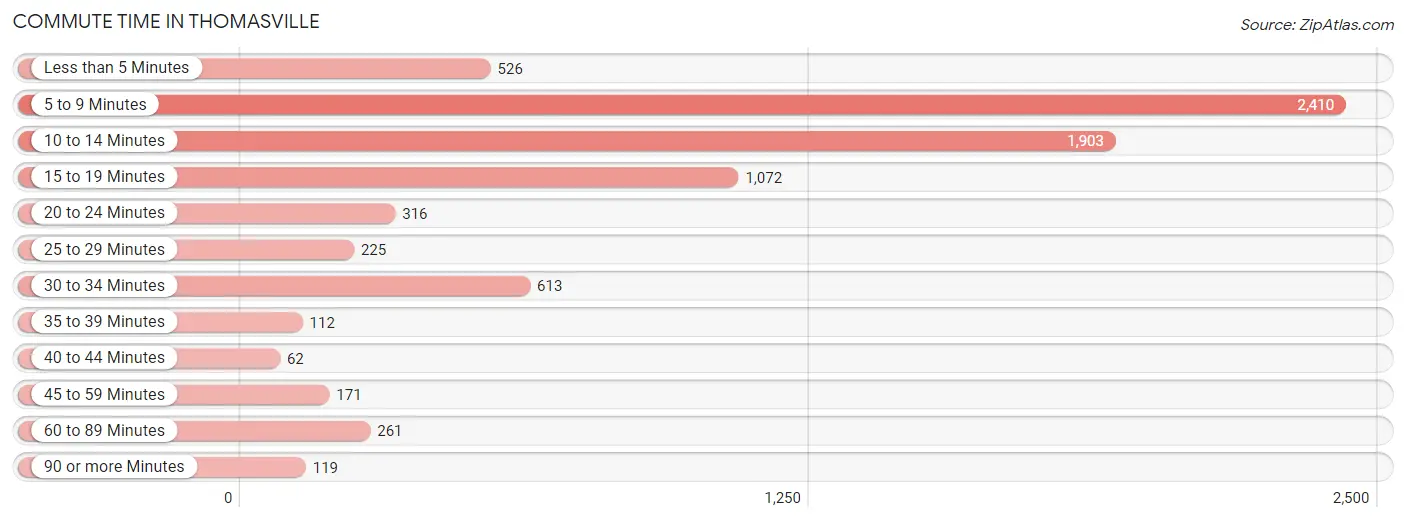
| Commute Time | # Commuters | % Commuters |
| Less than 5 Minutes | 526 | 6.8% |
| 5 to 9 Minutes | 2,410 | 30.9% |
| 10 to 14 Minutes | 1,903 | 24.4% |
| 15 to 19 Minutes | 1,072 | 13.8% |
| 20 to 24 Minutes | 316 | 4.1% |
| 25 to 29 Minutes | 225 | 2.9% |
| 30 to 34 Minutes | 613 | 7.9% |
| 35 to 39 Minutes | 112 | 1.4% |
| 40 to 44 Minutes | 62 | 0.8% |
| 45 to 59 Minutes | 171 | 2.2% |
| 60 to 89 Minutes | 261 | 3.4% |
| 90 or more Minutes | 119 | 1.5% |
Commute Time by Sex in Thomasville
The most common commute times in Thomasville are 5 to 9 minutes (982 commuters, 25.8%) for males and 5 to 9 minutes (1,428 commuters, 35.9%) for females.
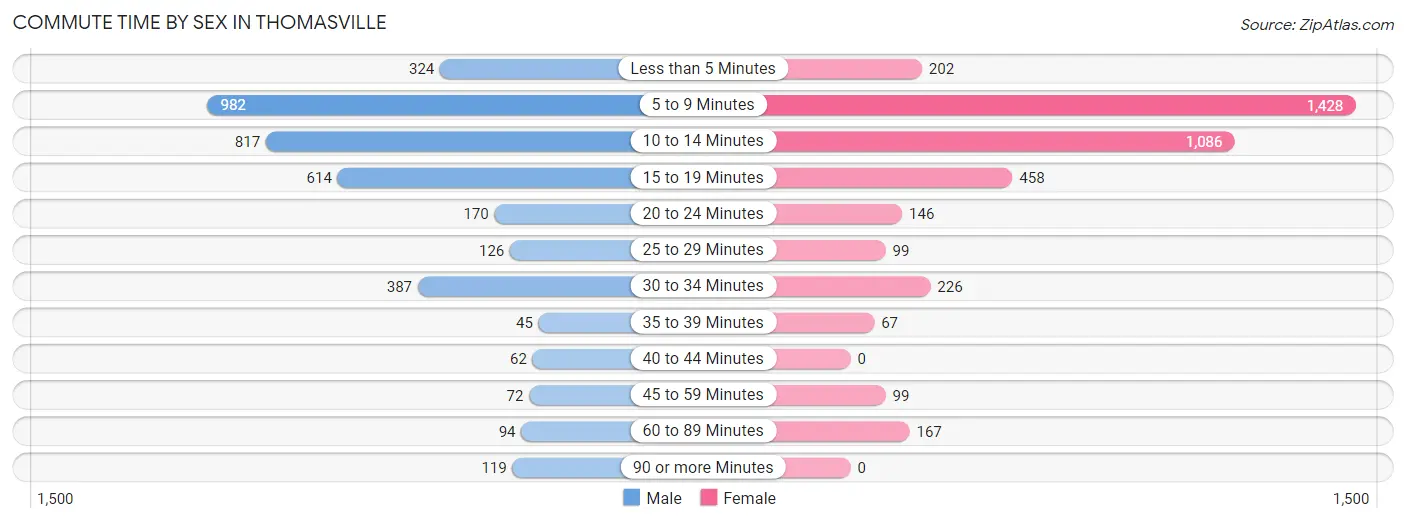
| Commute Time | Male | Female |
| Less than 5 Minutes | 324 (8.5%) | 202 (5.1%) |
| 5 to 9 Minutes | 982 (25.8%) | 1,428 (35.9%) |
| 10 to 14 Minutes | 817 (21.4%) | 1,086 (27.3%) |
| 15 to 19 Minutes | 614 (16.1%) | 458 (11.5%) |
| 20 to 24 Minutes | 170 (4.5%) | 146 (3.7%) |
| 25 to 29 Minutes | 126 (3.3%) | 99 (2.5%) |
| 30 to 34 Minutes | 387 (10.2%) | 226 (5.7%) |
| 35 to 39 Minutes | 45 (1.2%) | 67 (1.7%) |
| 40 to 44 Minutes | 62 (1.6%) | 0 (0.0%) |
| 45 to 59 Minutes | 72 (1.9%) | 99 (2.5%) |
| 60 to 89 Minutes | 94 (2.5%) | 167 (4.2%) |
| 90 or more Minutes | 119 (3.1%) | 0 (0.0%) |
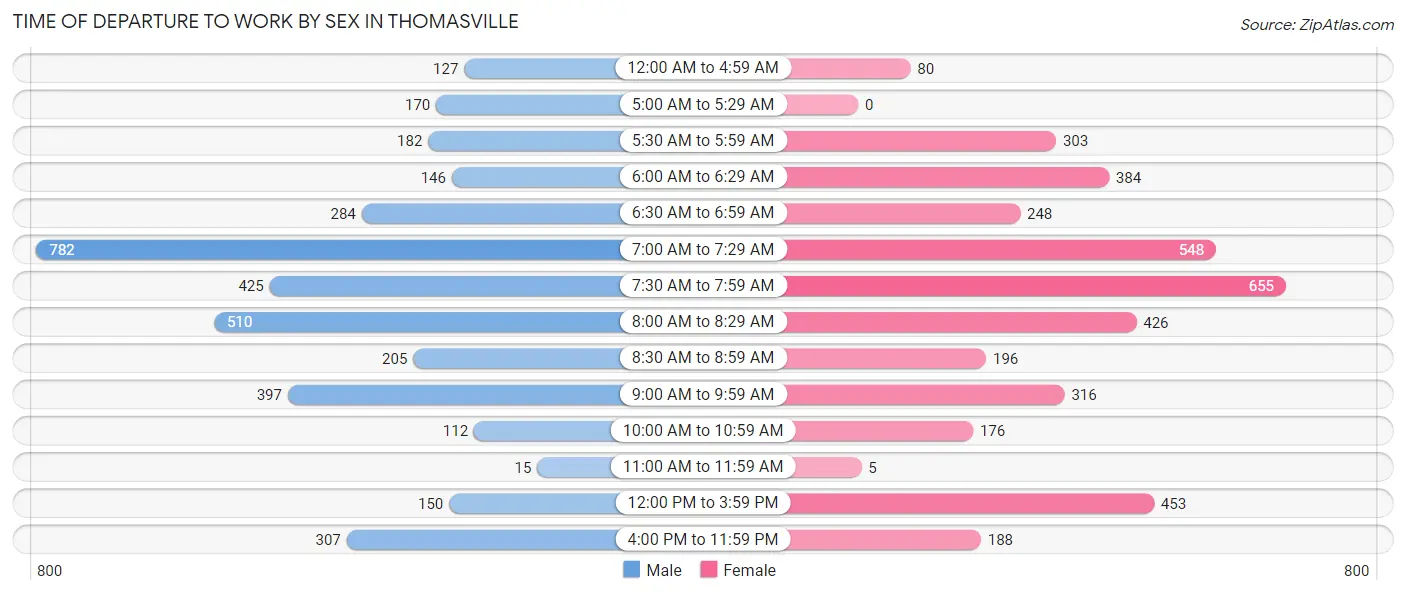
Time of Departure to Work by Sex in Thomasville
The most frequent times of departure to work in Thomasville are 7:00 AM to 7:29 AM (782, 20.5%) for males and 7:30 AM to 7:59 AM (655, 16.5%) for females.
| Time of Departure | Male | Female |
| 12:00 AM to 4:59 AM | 127 (3.3%) | 80 (2.0%) |
| 5:00 AM to 5:29 AM | 170 (4.5%) | 0 (0.0%) |
| 5:30 AM to 5:59 AM | 182 (4.8%) | 303 (7.6%) |
| 6:00 AM to 6:29 AM | 146 (3.8%) | 384 (9.7%) |
| 6:30 AM to 6:59 AM | 284 (7.4%) | 248 (6.2%) |
| 7:00 AM to 7:29 AM | 782 (20.5%) | 548 (13.8%) |
| 7:30 AM to 7:59 AM | 425 (11.2%) | 655 (16.5%) |
| 8:00 AM to 8:29 AM | 510 (13.4%) | 426 (10.7%) |
| 8:30 AM to 8:59 AM | 205 (5.4%) | 196 (4.9%) |
| 9:00 AM to 9:59 AM | 397 (10.4%) | 316 (7.9%) |
| 10:00 AM to 10:59 AM | 112 (2.9%) | 176 (4.4%) |
| 11:00 AM to 11:59 AM | 15 (0.4%) | 5 (0.1%) |
| 12:00 PM to 3:59 PM | 150 (3.9%) | 453 (11.4%) |
| 4:00 PM to 11:59 PM | 307 (8.1%) | 188 (4.7%) |
| Total | 3,812 (100.0%) | 3,978 (100.0%) |
Housing Occupancy in Thomasville
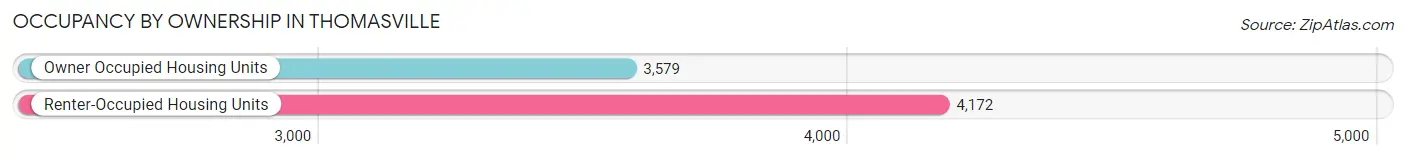
Occupancy by Ownership in Thomasville
Of the total 7,751 dwellings in Thomasville, owner-occupied units account for 3,579 (46.2%), while renter-occupied units make up 4,172 (53.8%).
| Occupancy | # Housing Units | % Housing Units |
| Owner Occupied Housing Units | 3,579 | 46.2% |
| Renter-Occupied Housing Units | 4,172 | 53.8% |
| Total Occupied Housing Units | 7,751 | 100.0% |
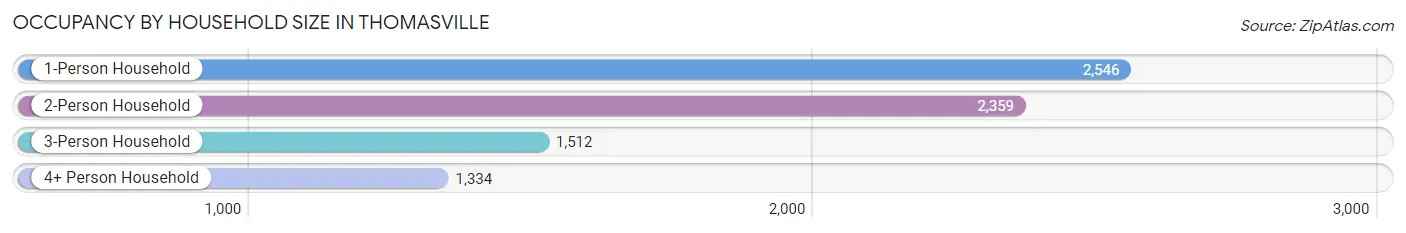
Occupancy by Household Size in Thomasville
| Household Size | # Housing Units | % Housing Units |
| 1-Person Household | 2,546 | 32.9% |
| 2-Person Household | 2,359 | 30.4% |
| 3-Person Household | 1,512 | 19.5% |
| 4+ Person Household | 1,334 | 17.2% |
| Total Housing Units | 7,751 | 100.0% |
Occupancy by Ownership by Household Size in Thomasville
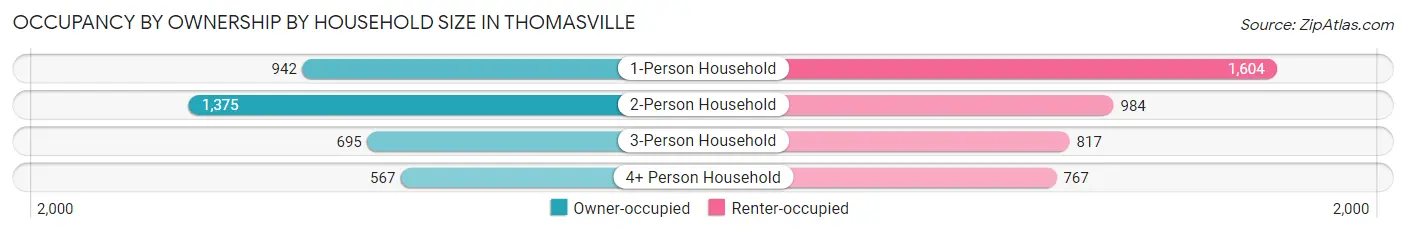
| Household Size | Owner-occupied | Renter-occupied |
| 1-Person Household | 942 (37.0%) | 1,604 (63.0%) |
| 2-Person Household | 1,375 (58.3%) | 984 (41.7%) |
| 3-Person Household | 695 (46.0%) | 817 (54.0%) |
| 4+ Person Household | 567 (42.5%) | 767 (57.5%) |
| Total Housing Units | 3,579 (46.2%) | 4,172 (53.8%) |
Occupancy by Educational Attainment in Thomasville
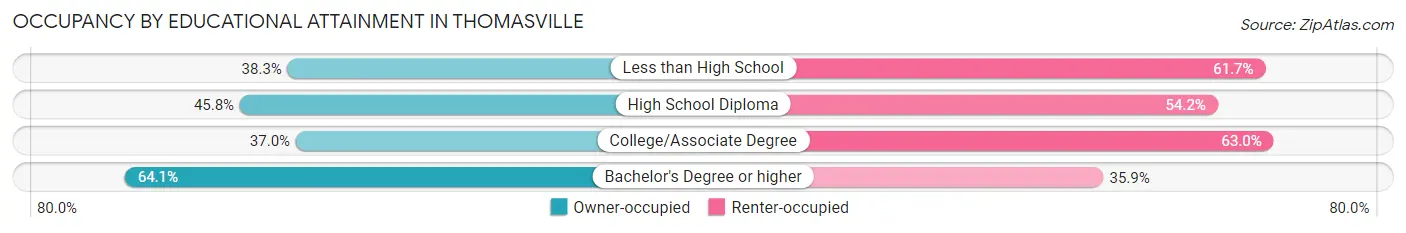
| Household Size | Owner-occupied | Renter-occupied |
| Less than High School | 382 (38.3%) | 616 (61.7%) |
| High School Diploma | 925 (45.8%) | 1,093 (54.2%) |
| College/Associate Degree | 1,040 (37.0%) | 1,773 (63.0%) |
| Bachelor's Degree or higher | 1,232 (64.1%) | 690 (35.9%) |
Occupancy by Age of Householder in Thomasville
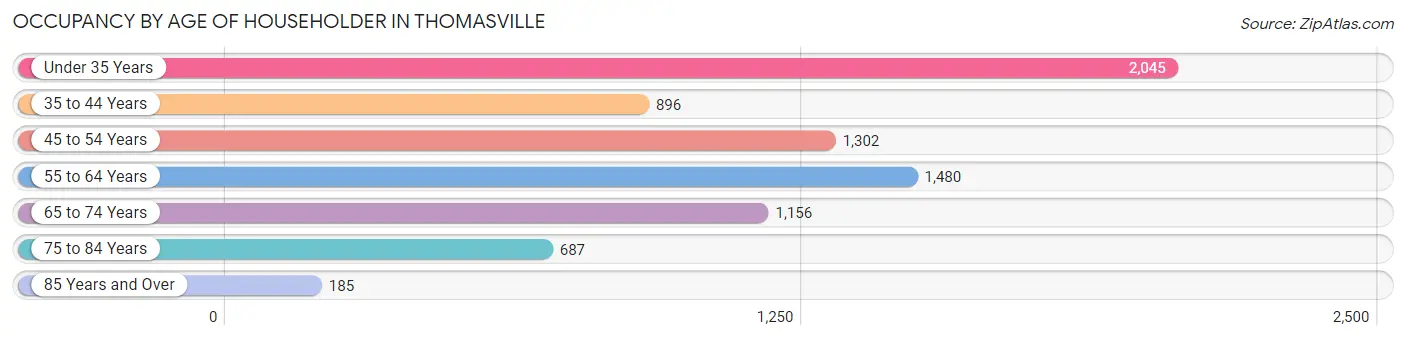
| Age Bracket | # Households | % Households |
| Under 35 Years | 2,045 | 26.4% |
| 35 to 44 Years | 896 | 11.6% |
| 45 to 54 Years | 1,302 | 16.8% |
| 55 to 64 Years | 1,480 | 19.1% |
| 65 to 74 Years | 1,156 | 14.9% |
| 75 to 84 Years | 687 | 8.9% |
| 85 Years and Over | 185 | 2.4% |
| Total | 7,751 | 100.0% |
Housing Finances in Thomasville
Median Income by Occupancy in Thomasville
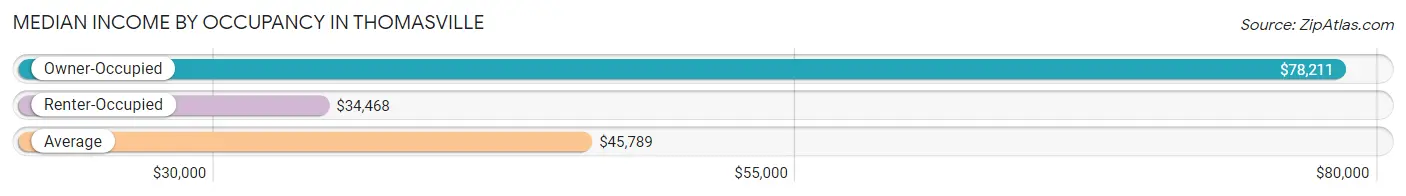
| Occupancy Type | # Households | Median Income |
| Owner-Occupied | 3,579 (46.2%) | $78,211 |
| Renter-Occupied | 4,172 (53.8%) | $34,468 |
| Average | 7,751 (100.0%) | $45,789 |
Occupancy by Householder Income Bracket in Thomasville
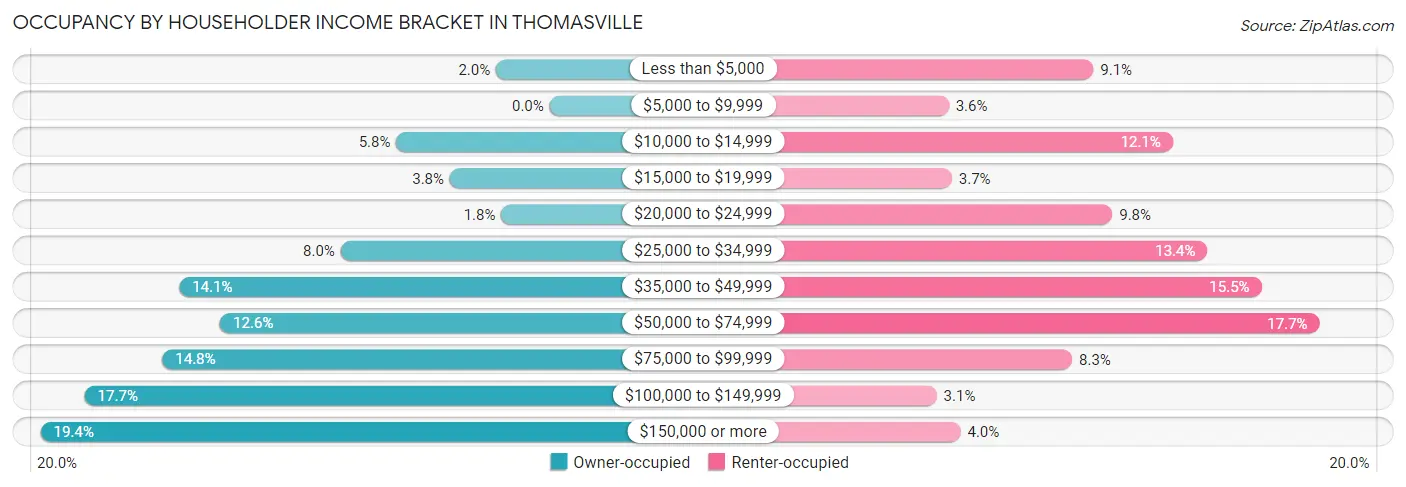
| Income Bracket | Owner-occupied | Renter-occupied |
| Less than $5,000 | 73 (2.0%) | 378 (9.1%) |
| $5,000 to $9,999 | 0 (0.0%) | 148 (3.5%) |
| $10,000 to $14,999 | 209 (5.8%) | 504 (12.1%) |
| $15,000 to $19,999 | 136 (3.8%) | 153 (3.7%) |
| $20,000 to $24,999 | 66 (1.8%) | 408 (9.8%) |
| $25,000 to $34,999 | 285 (8.0%) | 559 (13.4%) |
| $35,000 to $49,999 | 505 (14.1%) | 645 (15.5%) |
| $50,000 to $74,999 | 449 (12.6%) | 737 (17.7%) |
| $75,000 to $99,999 | 528 (14.7%) | 344 (8.3%) |
| $100,000 to $149,999 | 634 (17.7%) | 129 (3.1%) |
| $150,000 or more | 694 (19.4%) | 167 (4.0%) |
| Total | 3,579 (100.0%) | 4,172 (100.0%) |
Monthly Housing Cost Tiers in Thomasville
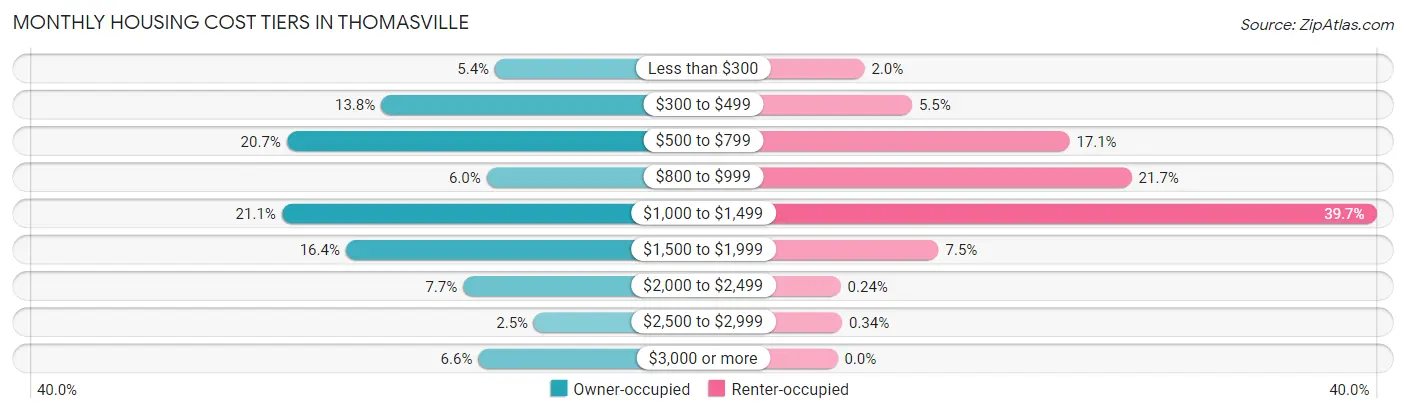
| Monthly Cost | Owner-occupied | Renter-occupied |
| Less than $300 | 192 (5.4%) | 83 (2.0%) |
| $300 to $499 | 492 (13.8%) | 229 (5.5%) |
| $500 to $799 | 741 (20.7%) | 713 (17.1%) |
| $800 to $999 | 214 (6.0%) | 904 (21.7%) |
| $1,000 to $1,499 | 754 (21.1%) | 1,656 (39.7%) |
| $1,500 to $1,999 | 585 (16.4%) | 311 (7.4%) |
| $2,000 to $2,499 | 276 (7.7%) | 10 (0.2%) |
| $2,500 to $2,999 | 89 (2.5%) | 14 (0.3%) |
| $3,000 or more | 236 (6.6%) | 0 (0.0%) |
| Total | 3,579 (100.0%) | 4,172 (100.0%) |
Physical Housing Characteristics in Thomasville
Housing Structures in Thomasville
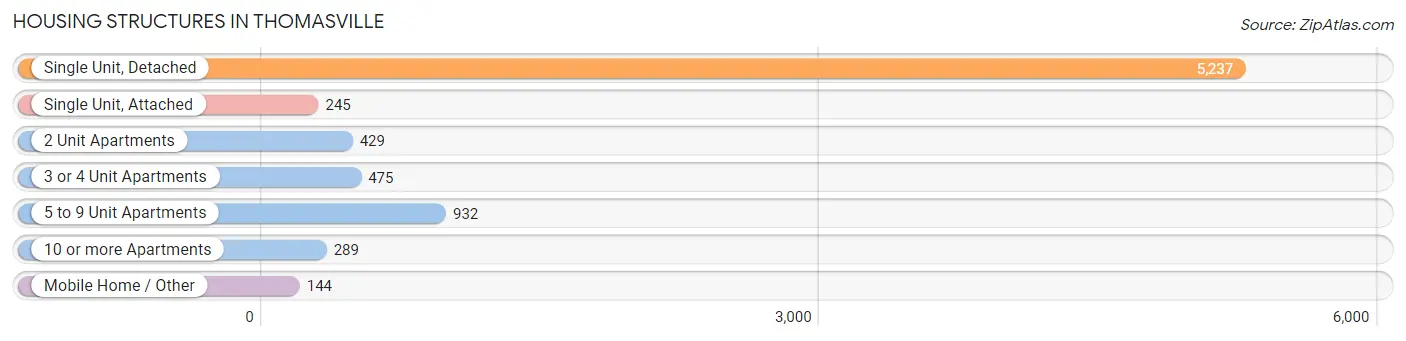
| Structure Type | # Housing Units | % Housing Units |
| Single Unit, Detached | 5,237 | 67.6% |
| Single Unit, Attached | 245 | 3.2% |
| 2 Unit Apartments | 429 | 5.5% |
| 3 or 4 Unit Apartments | 475 | 6.1% |
| 5 to 9 Unit Apartments | 932 | 12.0% |
| 10 or more Apartments | 289 | 3.7% |
| Mobile Home / Other | 144 | 1.9% |
| Total | 7,751 | 100.0% |
Housing Structures by Occupancy in Thomasville
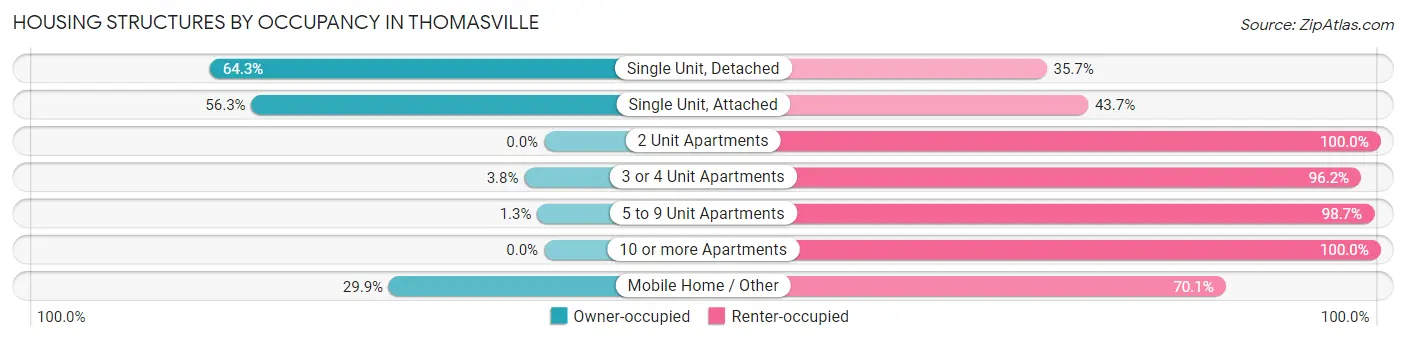
| Structure Type | Owner-occupied | Renter-occupied |
| Single Unit, Detached | 3,368 (64.3%) | 1,869 (35.7%) |
| Single Unit, Attached | 138 (56.3%) | 107 (43.7%) |
| 2 Unit Apartments | 0 (0.0%) | 429 (100.0%) |
| 3 or 4 Unit Apartments | 18 (3.8%) | 457 (96.2%) |
| 5 to 9 Unit Apartments | 12 (1.3%) | 920 (98.7%) |
| 10 or more Apartments | 0 (0.0%) | 289 (100.0%) |
| Mobile Home / Other | 43 (29.9%) | 101 (70.1%) |
| Total | 3,579 (46.2%) | 4,172 (53.8%) |
Housing Structures by Number of Rooms in Thomasville
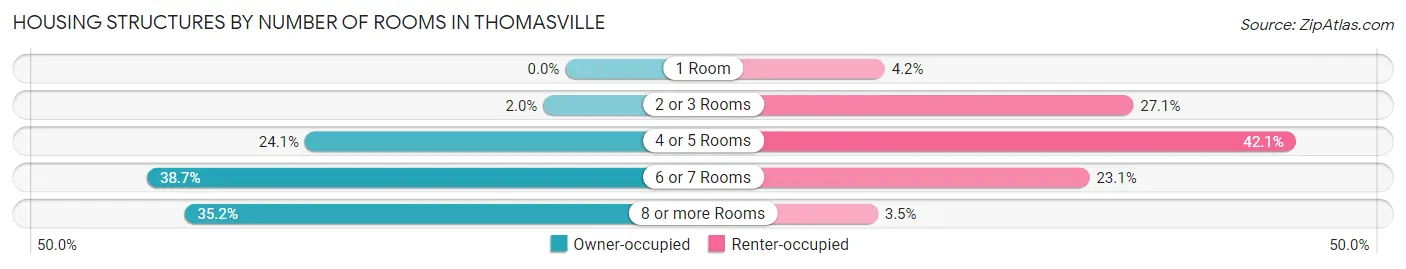
| Number of Rooms | Owner-occupied | Renter-occupied |
| 1 Room | 0 (0.0%) | 173 (4.2%) |
| 2 or 3 Rooms | 73 (2.0%) | 1,132 (27.1%) |
| 4 or 5 Rooms | 862 (24.1%) | 1,758 (42.1%) |
| 6 or 7 Rooms | 1,384 (38.7%) | 963 (23.1%) |
| 8 or more Rooms | 1,260 (35.2%) | 146 (3.5%) |
| Total | 3,579 (100.0%) | 4,172 (100.0%) |
Housing Structure by Heating Type in Thomasville
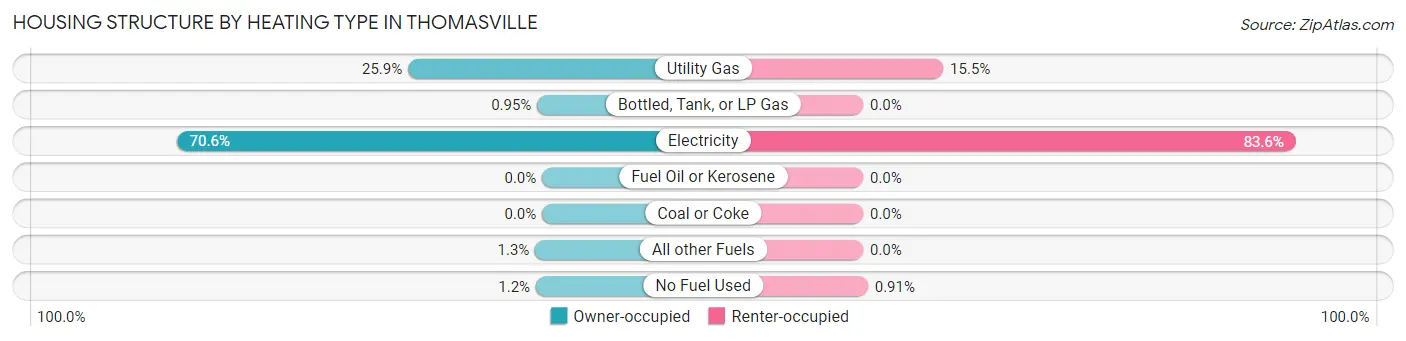
| Heating Type | Owner-occupied | Renter-occupied |
| Utility Gas | 927 (25.9%) | 646 (15.5%) |
| Bottled, Tank, or LP Gas | 34 (0.9%) | 0 (0.0%) |
| Electricity | 2,527 (70.6%) | 3,488 (83.6%) |
| Fuel Oil or Kerosene | 0 (0.0%) | 0 (0.0%) |
| Coal or Coke | 0 (0.0%) | 0 (0.0%) |
| All other Fuels | 48 (1.3%) | 0 (0.0%) |
| No Fuel Used | 43 (1.2%) | 38 (0.9%) |
| Total | 3,579 (100.0%) | 4,172 (100.0%) |
Household Vehicle Usage in Thomasville
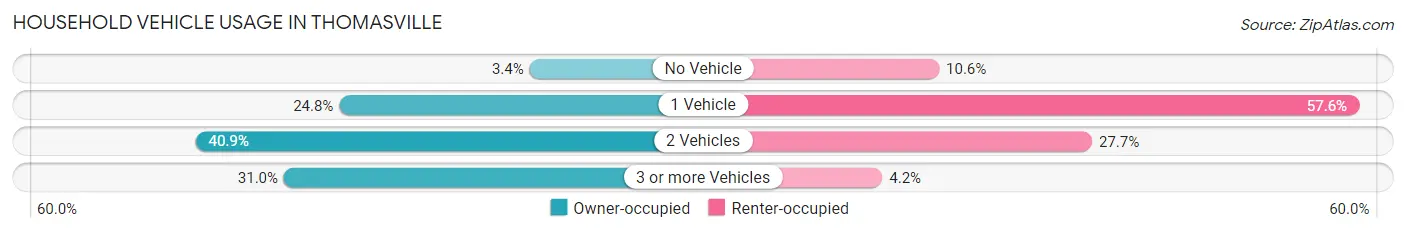
| Vehicles per Household | Owner-occupied | Renter-occupied |
| No Vehicle | 123 (3.4%) | 440 (10.5%) |
| 1 Vehicle | 886 (24.8%) | 2,402 (57.6%) |
| 2 Vehicles | 1,462 (40.8%) | 1,155 (27.7%) |
| 3 or more Vehicles | 1,108 (31.0%) | 175 (4.2%) |
| Total | 3,579 (100.0%) | 4,172 (100.0%) |
Real Estate & Mortgages in Thomasville
Real Estate and Mortgage Overview in Thomasville
| Characteristic | Without Mortgage | With Mortgage |
| Housing Units | 1,511 | 2,068 |
| Median Property Value | $123,800 | $201,200 |
| Median Household Income | $46,838 | $582 |
| Monthly Housing Costs | $525 | $236 |
| Real Estate Taxes | $1,393 | $45 |
Property Value by Mortgage Status in Thomasville
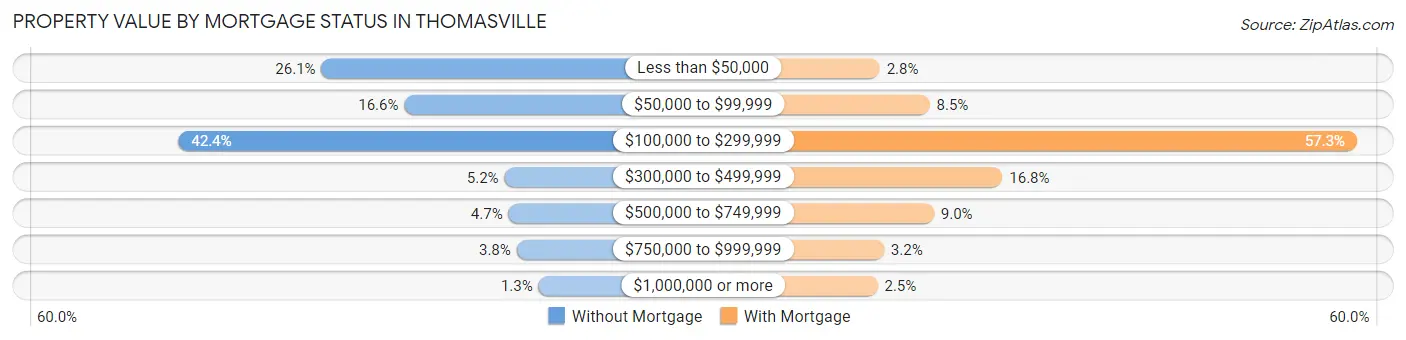
| Property Value | Without Mortgage | With Mortgage |
| Less than $50,000 | 394 (26.1%) | 57 (2.8%) |
| $50,000 to $99,999 | 251 (16.6%) | 175 (8.5%) |
| $100,000 to $299,999 | 641 (42.4%) | 1,185 (57.3%) |
| $300,000 to $499,999 | 78 (5.2%) | 347 (16.8%) |
| $500,000 to $749,999 | 71 (4.7%) | 185 (8.9%) |
| $750,000 to $999,999 | 57 (3.8%) | 67 (3.2%) |
| $1,000,000 or more | 19 (1.3%) | 52 (2.5%) |
| Total | 1,511 (100.0%) | 2,068 (100.0%) |
Household Income by Mortgage Status in Thomasville
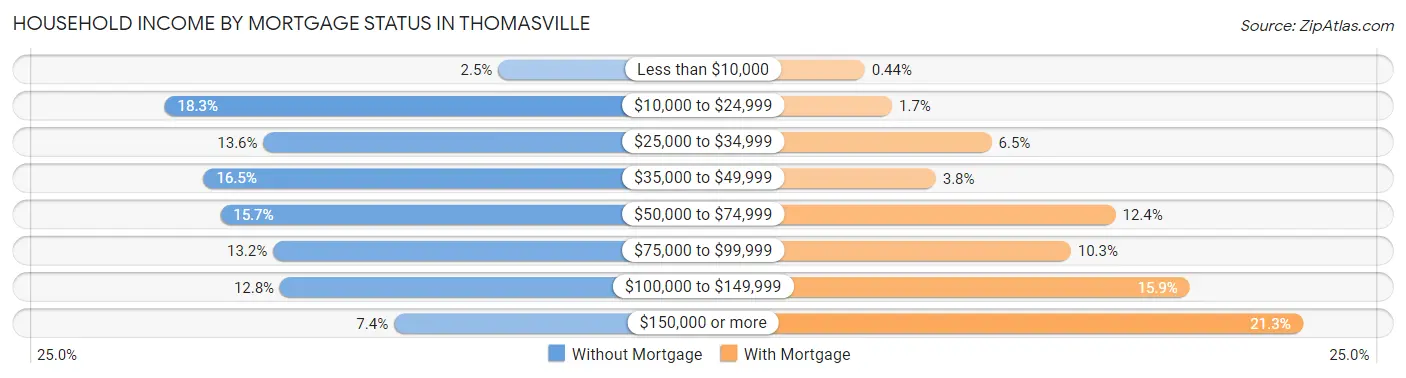
| Household Income | Without Mortgage | With Mortgage |
| Less than $10,000 | 37 (2.5%) | 9 (0.4%) |
| $10,000 to $24,999 | 277 (18.3%) | 36 (1.7%) |
| $25,000 to $34,999 | 206 (13.6%) | 134 (6.5%) |
| $35,000 to $49,999 | 249 (16.5%) | 79 (3.8%) |
| $50,000 to $74,999 | 237 (15.7%) | 256 (12.4%) |
| $75,000 to $99,999 | 199 (13.2%) | 212 (10.2%) |
| $100,000 to $149,999 | 194 (12.8%) | 329 (15.9%) |
| $150,000 or more | 112 (7.4%) | 440 (21.3%) |
| Total | 1,511 (100.0%) | 2,068 (100.0%) |
Property Value to Household Income Ratio in Thomasville
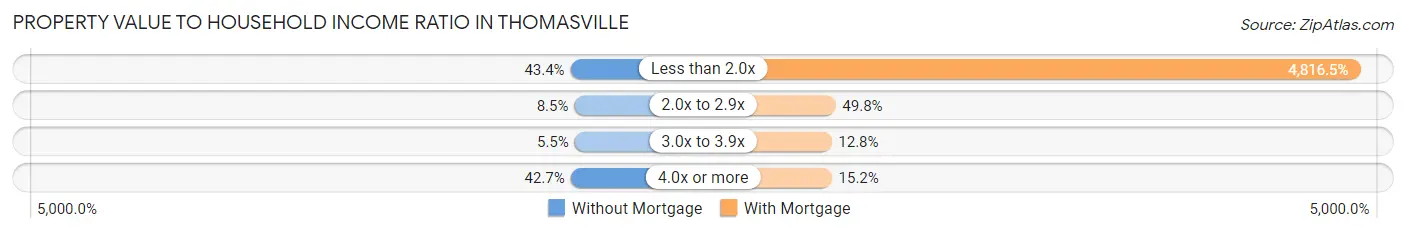
| Value-to-Income Ratio | Without Mortgage | With Mortgage |
| Less than 2.0x | 655 (43.3%) | 99,605 (4,816.5%) |
| 2.0x to 2.9x | 128 (8.5%) | 1,030 (49.8%) |
| 3.0x to 3.9x | 83 (5.5%) | 264 (12.8%) |
| 4.0x or more | 645 (42.7%) | 315 (15.2%) |
| Total | 1,511 (100.0%) | 2,068 (100.0%) |
Real Estate Taxes by Mortgage Status in Thomasville
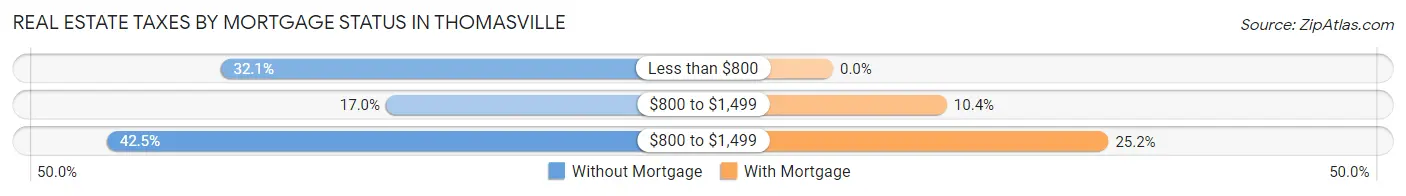
| Property Taxes | Without Mortgage | With Mortgage |
| Less than $800 | 485 (32.1%) | 0 (0.0%) |
| $800 to $1,499 | 257 (17.0%) | 215 (10.4%) |
| $800 to $1,499 | 642 (42.5%) | 520 (25.2%) |
| Total | 1,511 (100.0%) | 2,068 (100.0%) |
Health & Disability in Thomasville
Health Insurance Coverage by Age in Thomasville
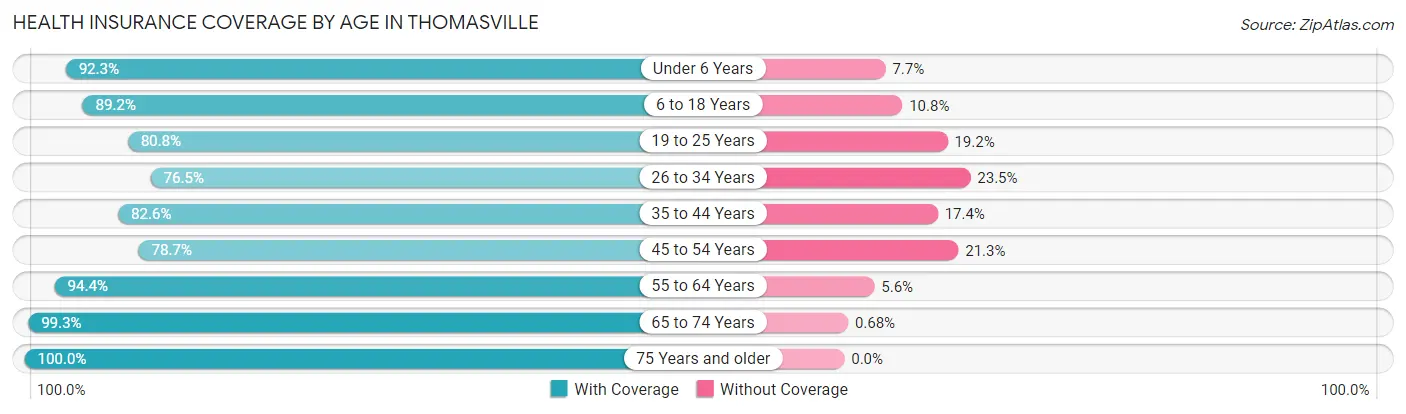
| Age Bracket | With Coverage | Without Coverage |
| Under 6 Years | 1,479 (92.3%) | 123 (7.7%) |
| 6 to 18 Years | 2,863 (89.2%) | 347 (10.8%) |
| 19 to 25 Years | 1,608 (80.8%) | 383 (19.2%) |
| 26 to 34 Years | 1,767 (76.5%) | 543 (23.5%) |
| 35 to 44 Years | 1,598 (82.6%) | 337 (17.4%) |
| 45 to 54 Years | 1,770 (78.7%) | 478 (21.3%) |
| 55 to 64 Years | 1,985 (94.4%) | 118 (5.6%) |
| 65 to 74 Years | 1,889 (99.3%) | 13 (0.7%) |
| 75 Years and older | 1,232 (100.0%) | 0 (0.0%) |
| Total | 16,191 (87.4%) | 2,342 (12.6%) |
Health Insurance Coverage by Citizenship Status in Thomasville
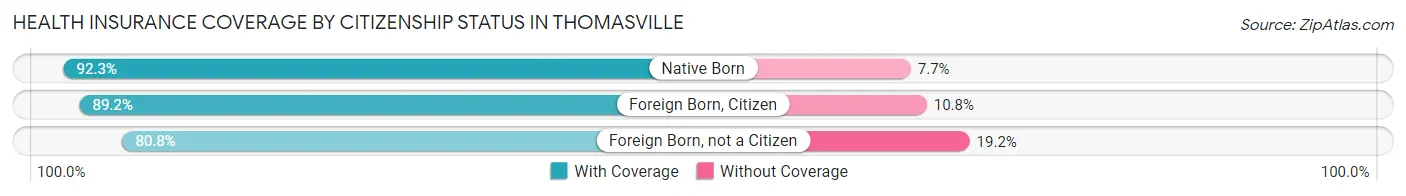
| Citizenship Status | With Coverage | Without Coverage |
| Native Born | 1,479 (92.3%) | 123 (7.7%) |
| Foreign Born, Citizen | 2,863 (89.2%) | 347 (10.8%) |
| Foreign Born, not a Citizen | 1,608 (80.8%) | 383 (19.2%) |
Health Insurance Coverage by Household Income in Thomasville
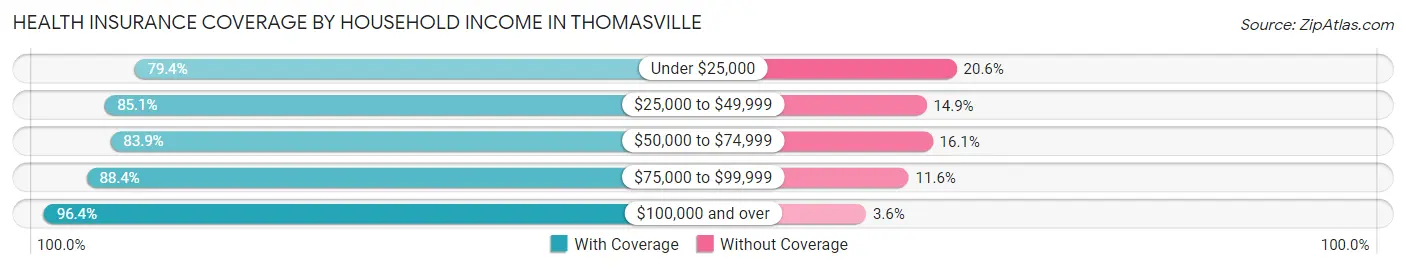
| Household Income | With Coverage | Without Coverage |
| Under $25,000 | 2,943 (79.4%) | 762 (20.6%) |
| $25,000 to $49,999 | 3,519 (85.1%) | 617 (14.9%) |
| $50,000 to $74,999 | 2,307 (83.9%) | 442 (16.1%) |
| $75,000 to $99,999 | 2,356 (88.4%) | 309 (11.6%) |
| $100,000 and over | 4,903 (96.4%) | 183 (3.6%) |
Public vs Private Health Insurance Coverage by Age in Thomasville
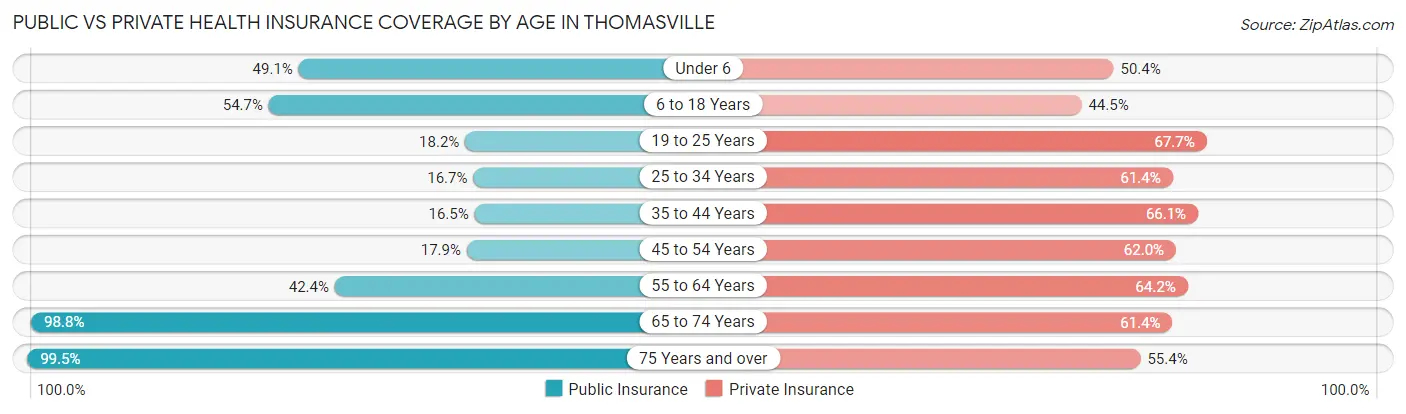
| Age Bracket | Public Insurance | Private Insurance |
| Under 6 | 787 (49.1%) | 808 (50.4%) |
| 6 to 18 Years | 1,755 (54.7%) | 1,428 (44.5%) |
| 19 to 25 Years | 363 (18.2%) | 1,348 (67.7%) |
| 25 to 34 Years | 386 (16.7%) | 1,418 (61.4%) |
| 35 to 44 Years | 319 (16.5%) | 1,279 (66.1%) |
| 45 to 54 Years | 403 (17.9%) | 1,394 (62.0%) |
| 55 to 64 Years | 892 (42.4%) | 1,350 (64.2%) |
| 65 to 74 Years | 1,879 (98.8%) | 1,167 (61.4%) |
| 75 Years and over | 1,226 (99.5%) | 683 (55.4%) |
| Total | 8,010 (43.2%) | 10,875 (58.7%) |
Disability Status by Sex by Age in Thomasville
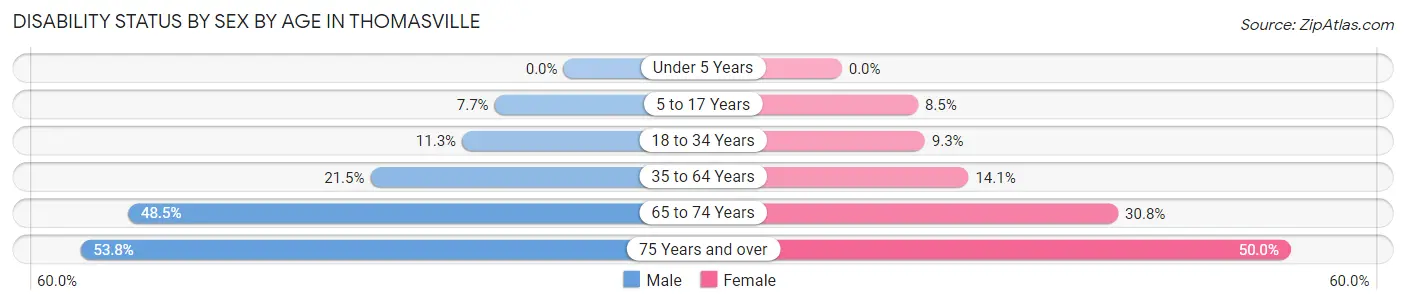
| Age Bracket | Male | Female |
| Under 5 Years | 0 (0.0%) | 0 (0.0%) |
| 5 to 17 Years | 135 (7.7%) | 135 (8.5%) |
| 18 to 34 Years | 226 (11.3%) | 224 (9.2%) |
| 35 to 64 Years | 600 (21.5%) | 493 (14.1%) |
| 65 to 74 Years | 415 (48.5%) | 322 (30.8%) |
| 75 Years and over | 256 (53.8%) | 378 (50.0%) |
Disability Class by Sex by Age in Thomasville
Disability Class: Hearing Difficulty
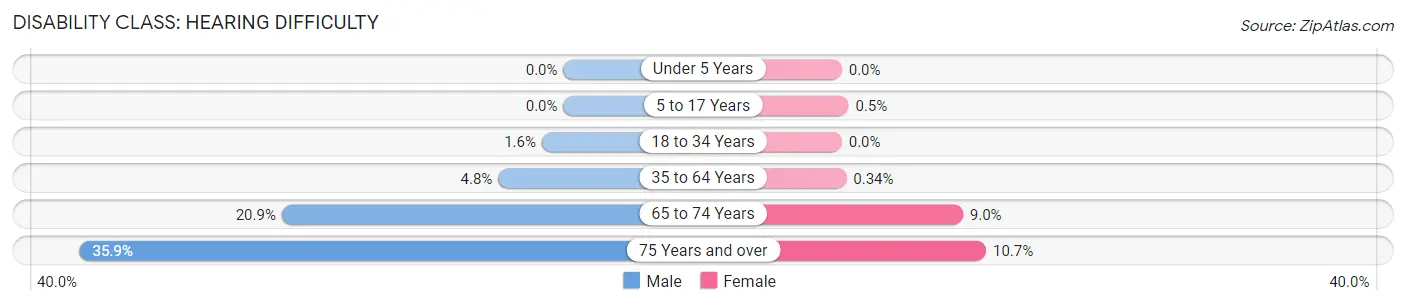
| Age Bracket | Male | Female |
| Under 5 Years | 0 (0.0%) | 0 (0.0%) |
| 5 to 17 Years | 0 (0.0%) | 8 (0.5%) |
| 18 to 34 Years | 32 (1.6%) | 0 (0.0%) |
| 35 to 64 Years | 135 (4.8%) | 12 (0.3%) |
| 65 to 74 Years | 179 (20.9%) | 94 (9.0%) |
| 75 Years and over | 171 (35.9%) | 81 (10.7%) |
Disability Class: Vision Difficulty
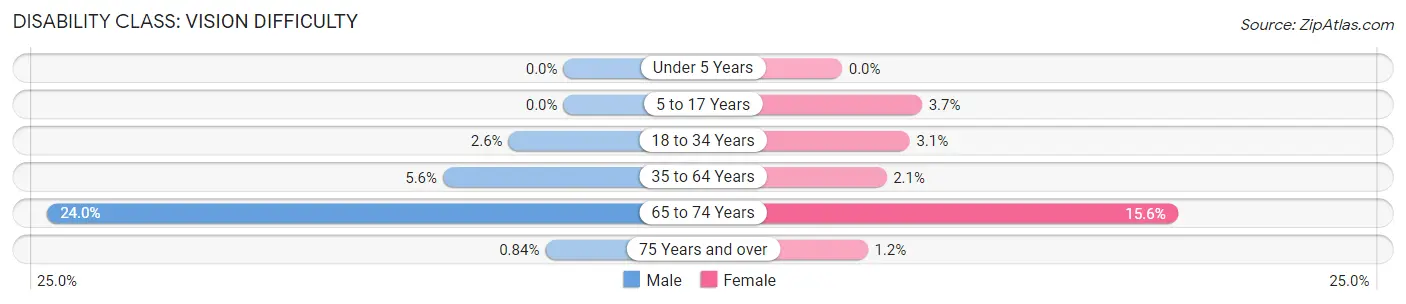
| Age Bracket | Male | Female |
| Under 5 Years | 0 (0.0%) | 0 (0.0%) |
| 5 to 17 Years | 0 (0.0%) | 59 (3.7%) |
| 18 to 34 Years | 51 (2.5%) | 76 (3.1%) |
| 35 to 64 Years | 156 (5.6%) | 72 (2.1%) |
| 65 to 74 Years | 205 (23.9%) | 163 (15.6%) |
| 75 Years and over | 4 (0.8%) | 9 (1.2%) |
Disability Class: Cognitive Difficulty
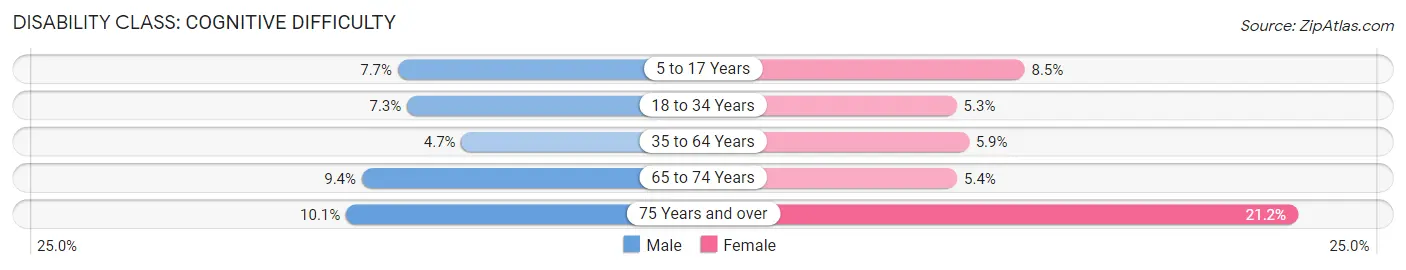
| Age Bracket | Male | Female |
| 5 to 17 Years | 135 (7.7%) | 135 (8.5%) |
| 18 to 34 Years | 145 (7.2%) | 129 (5.3%) |
| 35 to 64 Years | 132 (4.7%) | 206 (5.9%) |
| 65 to 74 Years | 80 (9.3%) | 56 (5.3%) |
| 75 Years and over | 48 (10.1%) | 160 (21.2%) |
Disability Class: Ambulatory Difficulty
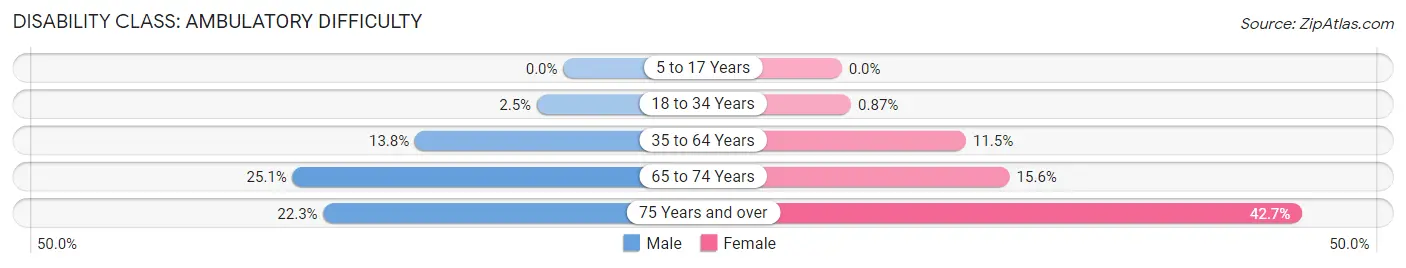
| Age Bracket | Male | Female |
| 5 to 17 Years | 0 (0.0%) | 0 (0.0%) |
| 18 to 34 Years | 49 (2.5%) | 21 (0.9%) |
| 35 to 64 Years | 384 (13.8%) | 403 (11.5%) |
| 65 to 74 Years | 215 (25.1%) | 163 (15.6%) |
| 75 Years and over | 106 (22.3%) | 323 (42.7%) |
Disability Class: Self-Care Difficulty
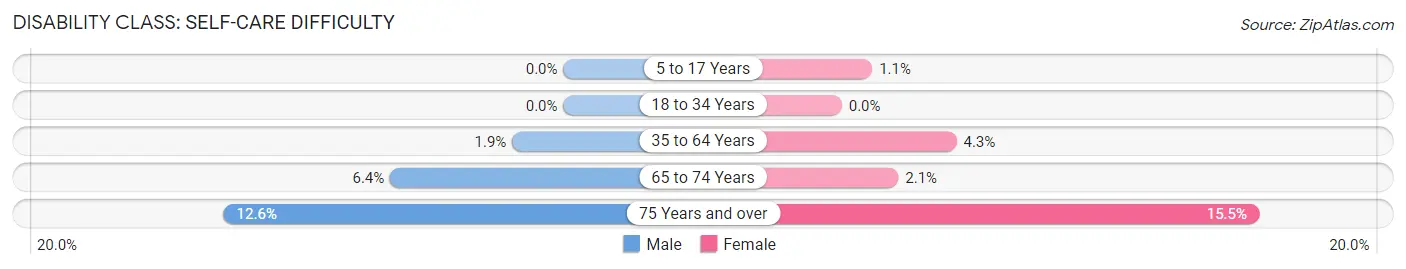
| Age Bracket | Male | Female |
| 5 to 17 Years | 0 (0.0%) | 18 (1.1%) |
| 18 to 34 Years | 0 (0.0%) | 0 (0.0%) |
| 35 to 64 Years | 53 (1.9%) | 149 (4.3%) |
| 65 to 74 Years | 55 (6.4%) | 22 (2.1%) |
| 75 Years and over | 60 (12.6%) | 117 (15.5%) |
Technology Access in Thomasville
Computing Device Access in Thomasville
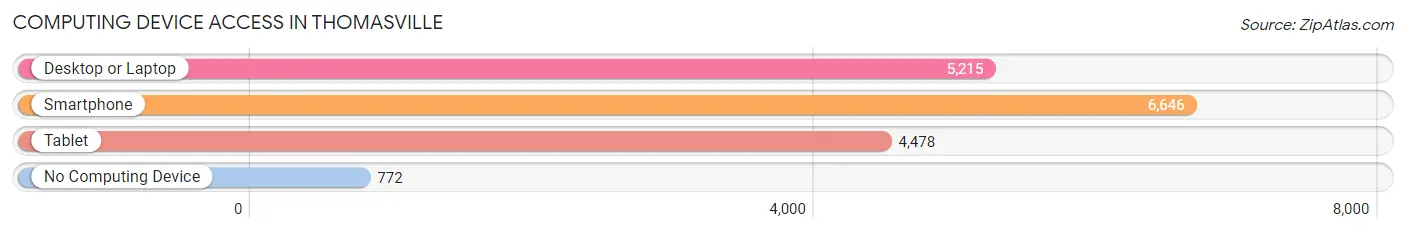
| Device Type | # Households | % Households |
| Desktop or Laptop | 5,215 | 67.3% |
| Smartphone | 6,646 | 85.7% |
| Tablet | 4,478 | 57.8% |
| No Computing Device | 772 | 10.0% |
| Total | 7,751 | 100.0% |
Internet Access in Thomasville
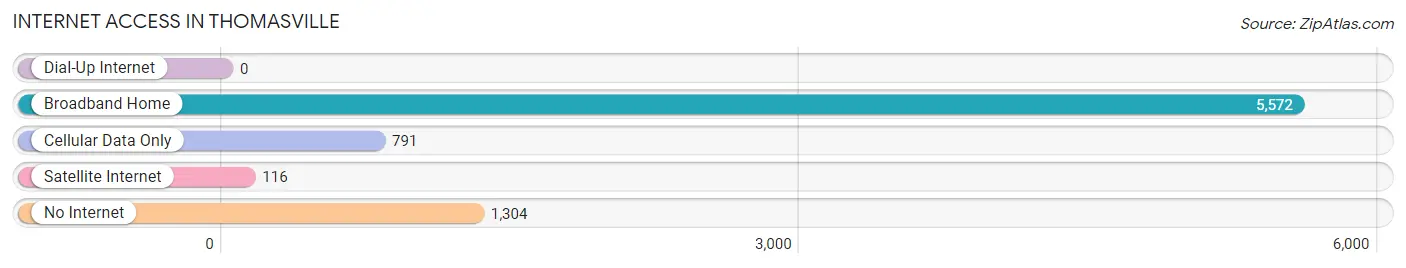
| Internet Type | # Households | % Households |
| Dial-Up Internet | 0 | 0.0% |
| Broadband Home | 5,572 | 71.9% |
| Cellular Data Only | 791 | 10.2% |
| Satellite Internet | 116 | 1.5% |
| No Internet | 1,304 | 16.8% |
| Total | 7,751 | 100.0% |
Thomasville Summary
Thomasville, Georgia is a city located in Thomas County, Georgia, United States. It is the county seat of Thomas County and is located in the southwestern part of the state. The city is located along the border of Florida and Georgia, and is approximately 60 miles north of Tallahassee, Florida. The population of Thomasville was 18,413 at the 2010 census, making it the largest city in Thomas County.
History
Thomasville was founded in 1825 by John and Mary Thomas, who were among the first settlers in the area. The city was named after John Thomas, who was a Revolutionary War veteran and a prominent local landowner. The city was incorporated in 1831 and was the county seat of Thomas County.
In the late 19th century, Thomasville became a popular winter resort for wealthy Northerners. The city was known for its many grand hotels, including the Thomasville Hotel, which was built in 1885 and was one of the largest hotels in the South. The city also became known for its many parks and gardens, which were designed by renowned landscape architect Frederick Law Olmsted.
In the early 20th century, Thomasville was a major center for the production of naval stores, such as turpentine and rosin. The city was also home to several large lumber mills and furniture factories.
Geography
Thomasville is located in southwestern Georgia, approximately 60 miles north of Tallahassee, Florida. The city is situated in the Coastal Plain region of the state, and is located along the border of Florida and Georgia. The city is located at the intersection of U.S. Route 84 and U.S. Route 319.
The city has a total area of 16.2 square miles, of which 16.1 square miles is land and 0.1 square miles is water. The city is located in the Apalachicola-Chattahoochee-Flint River Basin, and is located near the Ochlockonee River.
Economy
Thomasville’s economy is largely based on manufacturing and agriculture. The city is home to several large manufacturing plants, including a paper mill, a furniture factory, and a lumber mill. The city is also home to several agricultural businesses, including a poultry processing plant and a cotton gin.
The city is also home to several retail stores, restaurants, and other businesses. The city is also home to several educational institutions, including Thomas University and South Georgia Technical College.
Demographics
As of the 2010 census, the population of Thomasville was 18,413. The racial makeup of the city was 57.3% White, 37.2% African American, 0.4% Native American, 0.7% Asian, 0.1% Pacific Islander, 2.2% from other races, and 2.1% from two or more races. Hispanic or Latino of any race were 4.3% of the population.
The median income for a household in the city was $30,945, and the median income for a family was $37,945. The per capita income for the city was $17,845. About 19.3% of the population was below the poverty line.
Common Questions
What is Per Capita Income in Thomasville?
Per Capita income in Thomasville is $33,578.
What is the Median Family Income in Thomasville?
Median Family Income in Thomasville is $65,941.
What is the Median Household income in Thomasville?
Median Household Income in Thomasville is $45,789.
What is Income or Wage Gap in Thomasville?
Income or Wage Gap in Thomasville is 27.8%.
Women in Thomasville earn 72.2 cents for every dollar earned by a man.
What is Family Income Deficit in Thomasville?
Family Income Deficit in Thomasville is $11,333.
Families that are below poverty line in Thomasville earn $11,333 less on average than the poverty threshold level.
What is Inequality or Gini Index in Thomasville?
Inequality or Gini Index in Thomasville is 0.53.
What is the Total Population of Thomasville?
Total Population of Thomasville is 18,744.
What is the Total Male Population of Thomasville?
Total Male Population of Thomasville is 8,668.
What is the Total Female Population of Thomasville?
Total Female Population of Thomasville is 10,076.
What is the Ratio of Males per 100 Females in Thomasville?
There are 86.03 Males per 100 Females in Thomasville.
What is the Ratio of Females per 100 Males in Thomasville?
There are 116.24 Females per 100 Males in Thomasville.
What is the Median Population Age in Thomasville?
Median Population Age in Thomasville is 36.2 Years.
What is the Average Family Size in Thomasville
Average Family Size in Thomasville is 3.0 People.
What is the Average Household Size in Thomasville
Average Household Size in Thomasville is 2.4 People.
How Large is the Labor Force in Thomasville?
There are 9,103 People in the Labor Forcein in Thomasville.
What is the Percentage of People in the Labor Force in Thomasville?
62.3% of People are in the Labor Force in Thomasville.
What is the Unemployment Rate in Thomasville?
Unemployment Rate in Thomasville is 4.5%.