Taylorsville, GA Map & Demographics
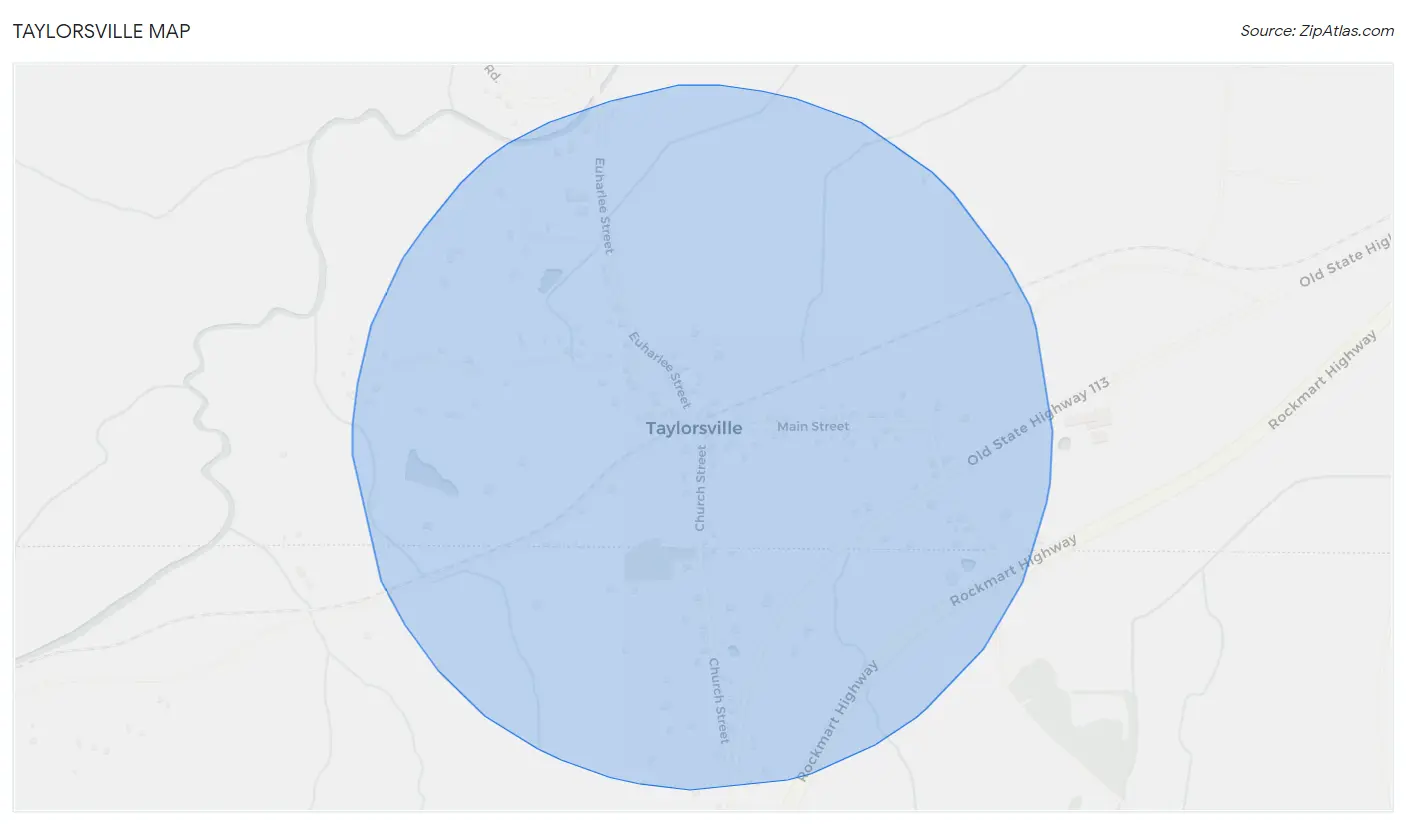
Taylorsville Map
Taylorsville Overview
$27,119
PER CAPITA INCOME
$61,406
AVG FAMILY INCOME
$41,250
AVG HOUSEHOLD INCOME
39.8%
WAGE / INCOME GAP [ % ]
60.2¢/ $1
WAGE / INCOME GAP [ $ ]
0.45
INEQUALITY / GINI INDEX
355
TOTAL POPULATION
154
MALE POPULATION
201
FEMALE POPULATION
76.62
MALES / 100 FEMALES
130.52
FEMALES / 100 MALES
56.7
MEDIAN AGE
3.0
AVG FAMILY SIZE
2.1
AVG HOUSEHOLD SIZE
119
LABOR FORCE [ PEOPLE ]
37.9%
PERCENT IN LABOR FORCE
0.8%
UNEMPLOYMENT RATE
Taylorsville Zip Codes
Income in Taylorsville
Income Overview in Taylorsville
Per Capita Income in Taylorsville is $27,119, while median incomes of families and households are $61,406 and $41,250 respectively.
| Characteristic | Number | Measure |
| Per Capita Income | 355 | $27,119 |
| Median Family Income | 90 | $61,406 |
| Mean Family Income | 90 | $83,563 |
| Median Household Income | 165 | $41,250 |
| Mean Household Income | 165 | $59,336 |
| Income Deficit | 90 | $0 |
| Wage / Income Gap (%) | 355 | 39.77% |
| Wage / Income Gap ($) | 355 | 60.23¢ per $1 |
| Gini / Inequality Index | 355 | 0.45 |
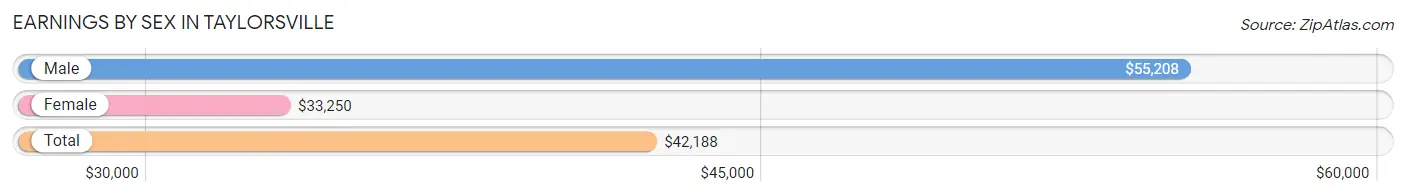
Earnings by Sex in Taylorsville
Average Earnings in Taylorsville are $42,188, $55,208 for men and $33,250 for women, a difference of 39.8%.
| Sex | Number | Average Earnings |
| Male | 65 (51.6%) | $55,208 |
| Female | 61 (48.4%) | $33,250 |
| Total | 126 (100.0%) | $42,188 |
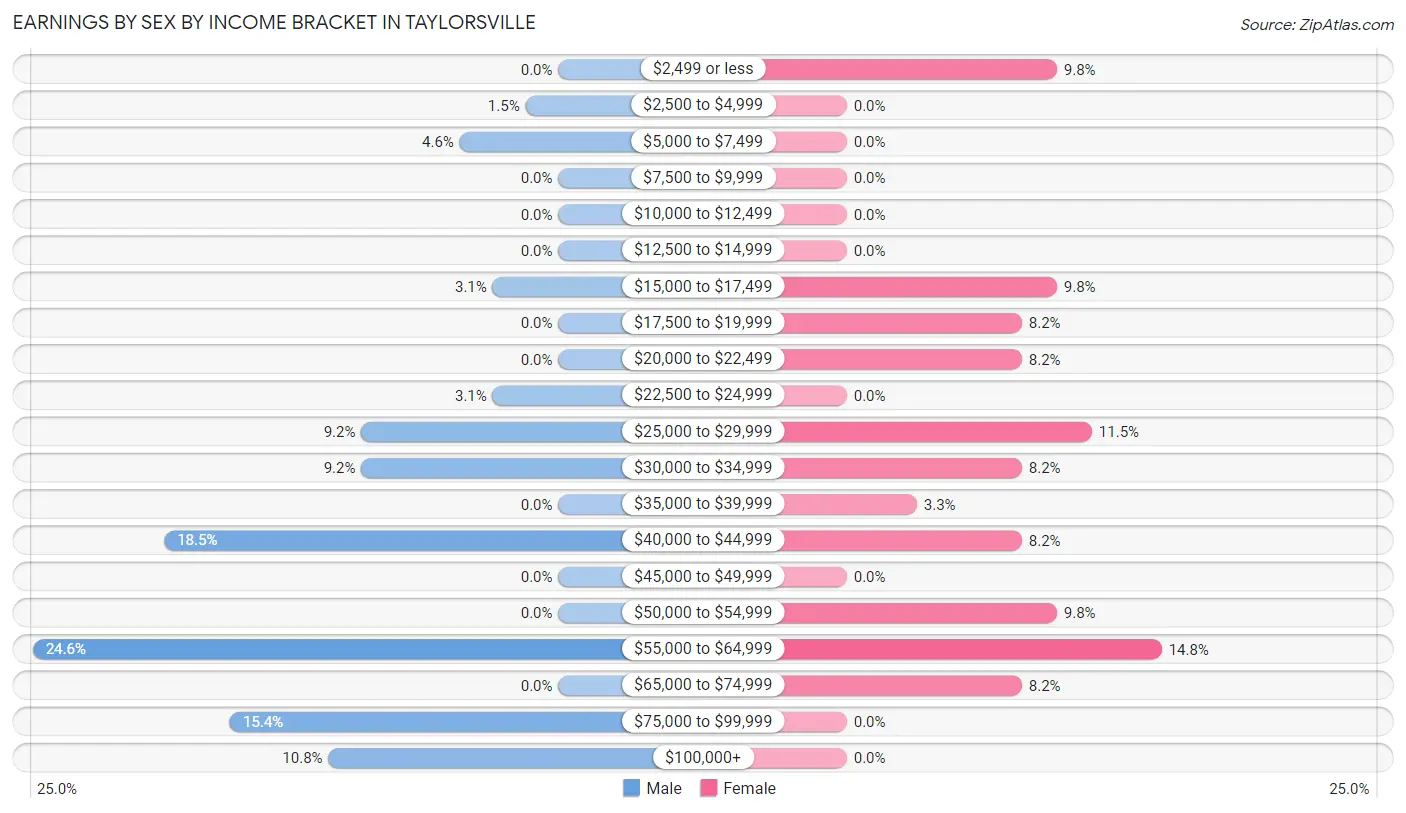
Earnings by Sex by Income Bracket in Taylorsville
The most common earnings brackets in Taylorsville are $55,000 to $64,999 for men (16 | 24.6%) and $55,000 to $64,999 for women (9 | 14.7%).
| Income | Male | Female |
| $2,499 or less | 0 (0.0%) | 6 (9.8%) |
| $2,500 to $4,999 | 1 (1.5%) | 0 (0.0%) |
| $5,000 to $7,499 | 3 (4.6%) | 0 (0.0%) |
| $7,500 to $9,999 | 0 (0.0%) | 0 (0.0%) |
| $10,000 to $12,499 | 0 (0.0%) | 0 (0.0%) |
| $12,500 to $14,999 | 0 (0.0%) | 0 (0.0%) |
| $15,000 to $17,499 | 2 (3.1%) | 6 (9.8%) |
| $17,500 to $19,999 | 0 (0.0%) | 5 (8.2%) |
| $20,000 to $22,499 | 0 (0.0%) | 5 (8.2%) |
| $22,500 to $24,999 | 2 (3.1%) | 0 (0.0%) |
| $25,000 to $29,999 | 6 (9.2%) | 7 (11.5%) |
| $30,000 to $34,999 | 6 (9.2%) | 5 (8.2%) |
| $35,000 to $39,999 | 0 (0.0%) | 2 (3.3%) |
| $40,000 to $44,999 | 12 (18.5%) | 5 (8.2%) |
| $45,000 to $49,999 | 0 (0.0%) | 0 (0.0%) |
| $50,000 to $54,999 | 0 (0.0%) | 6 (9.8%) |
| $55,000 to $64,999 | 16 (24.6%) | 9 (14.7%) |
| $65,000 to $74,999 | 0 (0.0%) | 5 (8.2%) |
| $75,000 to $99,999 | 10 (15.4%) | 0 (0.0%) |
| $100,000+ | 7 (10.8%) | 0 (0.0%) |
| Total | 65 (100.0%) | 61 (100.0%) |
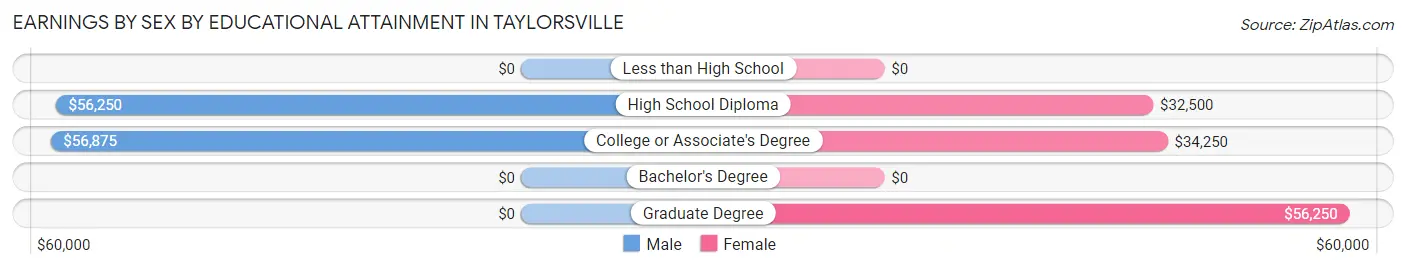
Earnings by Sex by Educational Attainment in Taylorsville
Average earnings in Taylorsville are $57,500 for men and $36,250 for women, a difference of 37.0%. Men with an educational attainment of college or associate's degree enjoy the highest average annual earnings of $56,875, while those with high school diploma education earn the least with $56,250. Women with an educational attainment of graduate degree earn the most with the average annual earnings of $56,250, while those with high school diploma education have the smallest earnings of $32,500.
| Educational Attainment | Male Income | Female Income |
| Less than High School | - | - |
| High School Diploma | $56,250 | $32,500 |
| College or Associate's Degree | $56,875 | $34,250 |
| Bachelor's Degree | - | - |
| Graduate Degree | - | - |
| Total | $57,500 | $36,250 |
Family Income in Taylorsville
Family Income Brackets in Taylorsville
According to the Taylorsville family income data, there are 21 families falling into the $50,000 to $74,999 income range, which is the most common income bracket and makes up 23.3% of all families.
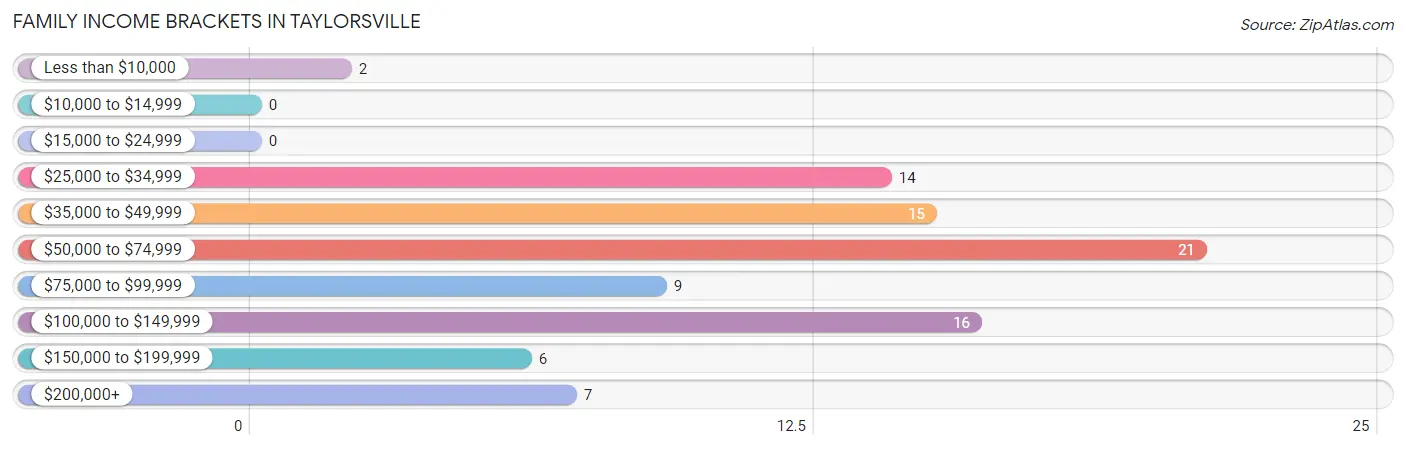
| Income Bracket | # Families | % Families |
| Less than $10,000 | 2 | 2.2% |
| $10,000 to $14,999 | 0 | 0.0% |
| $15,000 to $24,999 | 0 | 0.0% |
| $25,000 to $34,999 | 14 | 15.6% |
| $35,000 to $49,999 | 15 | 16.7% |
| $50,000 to $74,999 | 21 | 23.3% |
| $75,000 to $99,999 | 9 | 10.0% |
| $100,000 to $149,999 | 16 | 17.8% |
| $150,000 to $199,999 | 6 | 6.7% |
| $200,000+ | 7 | 7.8% |
Family Income by Famaliy Size in Taylorsville
3-person families (40 | 44.4%) account for the highest median family income in Taylorsville with $105,833 per family, while 3-person families (40 | 44.4%) have the highest median income of $35,278 per family member.
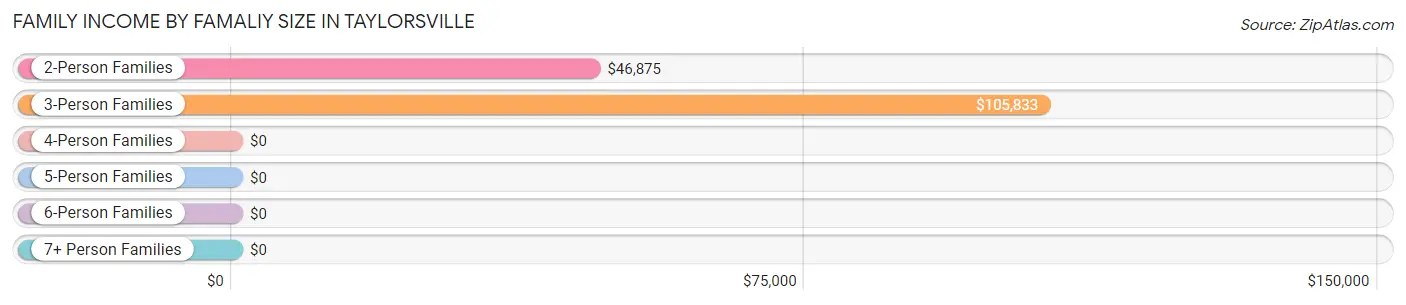
| Income Bracket | # Families | Median Income |
| 2-Person Families | 37 (41.1%) | $46,875 |
| 3-Person Families | 40 (44.4%) | $105,833 |
| 4-Person Families | 8 (8.9%) | $0 |
| 5-Person Families | 2 (2.2%) | $0 |
| 6-Person Families | 0 (0.0%) | $0 |
| 7+ Person Families | 3 (3.3%) | $0 |
| Total | 90 (100.0%) | $61,406 |
Family Income by Number of Earners in Taylorsville
The median family income in Taylorsville is $61,406, with families comprising 3+ earners (12) having the highest median family income of $131,250, while families with no earners (36) have the lowest median family income of $36,500, accounting for 13.3% and 40.0% of families, respectively.
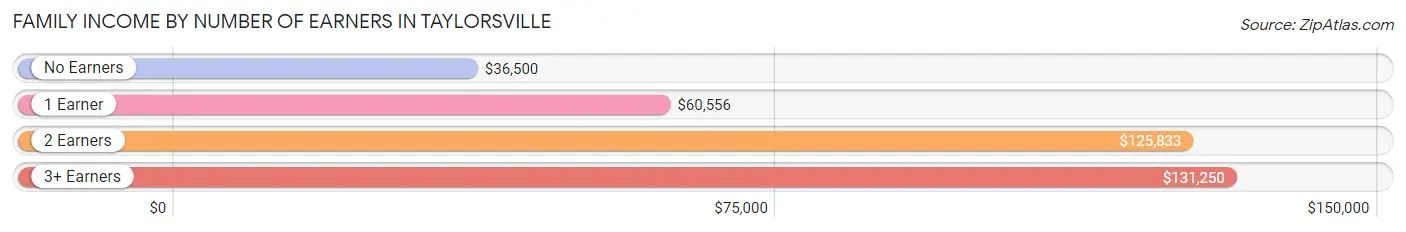
| Number of Earners | # Families | Median Income |
| No Earners | 36 (40.0%) | $36,500 |
| 1 Earner | 22 (24.4%) | $60,556 |
| 2 Earners | 20 (22.2%) | $125,833 |
| 3+ Earners | 12 (13.3%) | $131,250 |
| Total | 90 (100.0%) | $61,406 |
Household Income in Taylorsville
Household Income Brackets in Taylorsville
With 41 households falling in the category, the $10,000 to $14,999 income range is the most frequent in Taylorsville, accounting for 24.8% of all households. In contrast, only 2 households (1.2%) fall into the less than $10,000 income bracket, making it the least populous group.
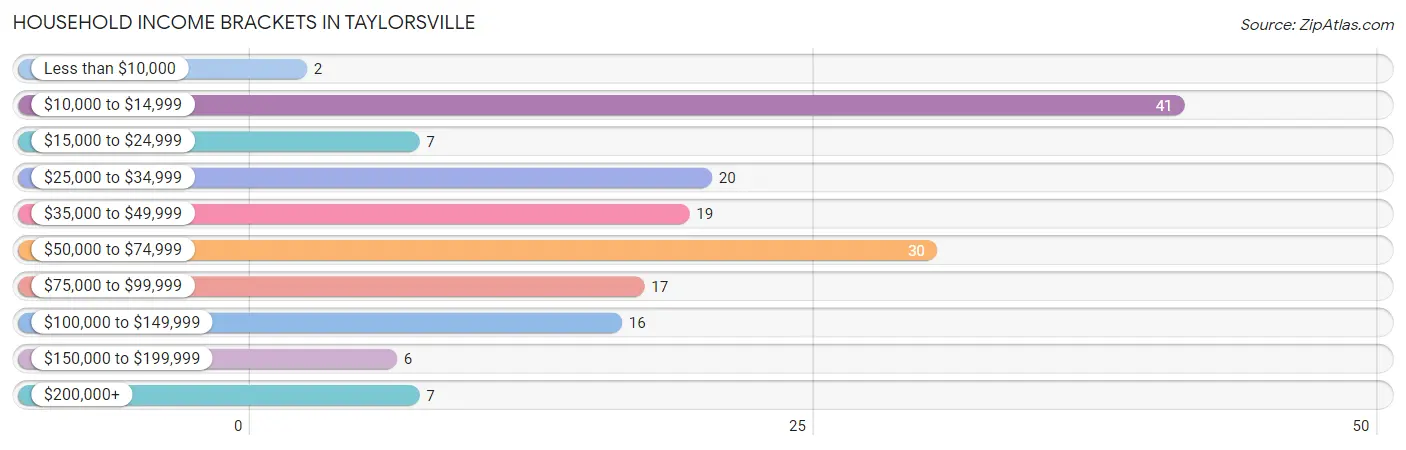
| Income Bracket | # Households | % Households |
| Less than $10,000 | 2 | 1.2% |
| $10,000 to $14,999 | 41 | 24.8% |
| $15,000 to $24,999 | 7 | 4.2% |
| $25,000 to $34,999 | 20 | 12.1% |
| $35,000 to $49,999 | 19 | 11.5% |
| $50,000 to $74,999 | 30 | 18.2% |
| $75,000 to $99,999 | 17 | 10.3% |
| $100,000 to $149,999 | 16 | 9.7% |
| $150,000 to $199,999 | 6 | 3.6% |
| $200,000+ | 7 | 4.2% |
Household Income by Householder Age in Taylorsville
The median household income in Taylorsville is $41,250, with the highest median household income of $105,833 found in the 45 to 64 years age bracket for the primary householder. A total of 34 households (20.6%) fall into this category. Meanwhile, the 15 to 24 years age bracket for the primary householder has the lowest median household income of $0, with 6 households (3.6%) in this group.
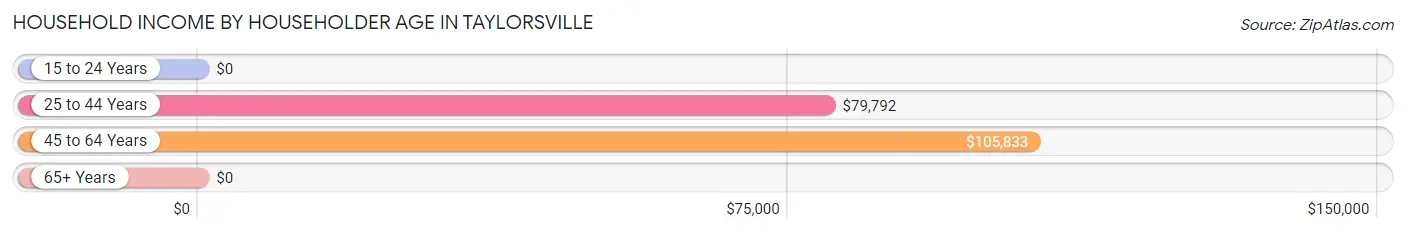
| Income Bracket | # Households | Median Income |
| 15 to 24 Years | 6 (3.6%) | $0 |
| 25 to 44 Years | 25 (15.1%) | $79,792 |
| 45 to 64 Years | 34 (20.6%) | $105,833 |
| 65+ Years | 100 (60.6%) | $0 |
| Total | 165 (100.0%) | $41,250 |
Poverty in Taylorsville
Income Below Poverty by Sex and Age in Taylorsville
With 5.8% poverty level for males and 17.4% for females among the residents of Taylorsville, 75 year old and over males and 75 year old and over females are the most vulnerable to poverty, with 6 males (46.2%) and 33 females (52.4%) in their respective age groups living below the poverty level.
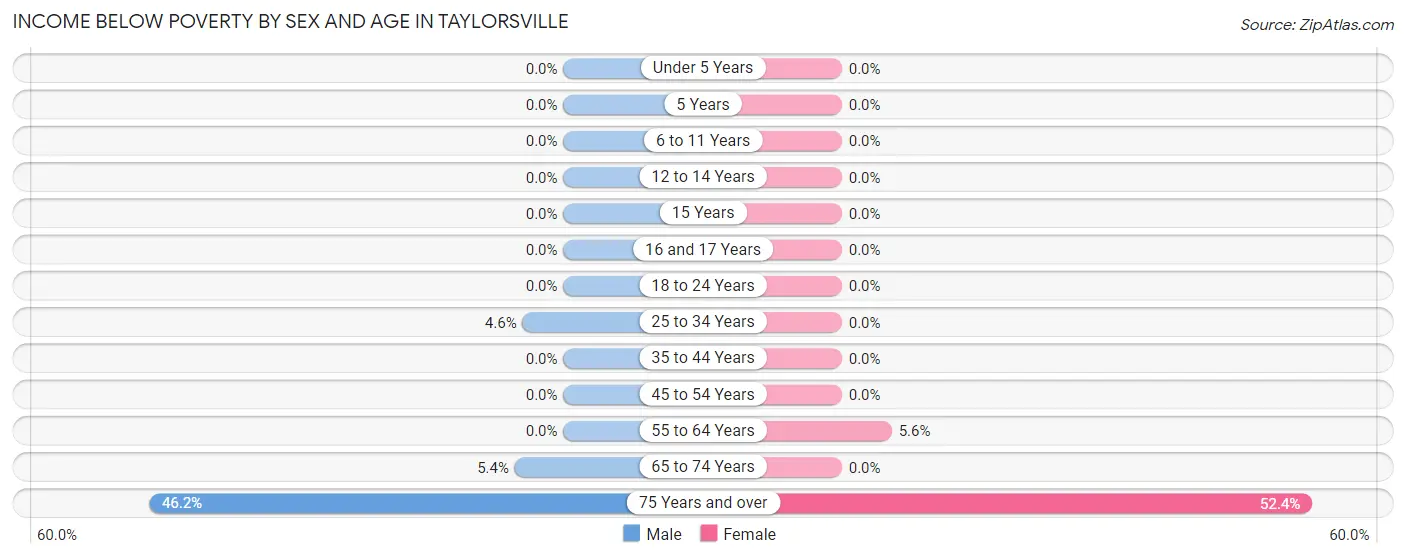
| Age Bracket | Male | Female |
| Under 5 Years | 0 (0.0%) | 0 (0.0%) |
| 5 Years | 0 (0.0%) | 0 (0.0%) |
| 6 to 11 Years | 0 (0.0%) | 0 (0.0%) |
| 12 to 14 Years | 0 (0.0%) | 0 (0.0%) |
| 15 Years | 0 (0.0%) | 0 (0.0%) |
| 16 and 17 Years | 0 (0.0%) | 0 (0.0%) |
| 18 to 24 Years | 0 (0.0%) | 0 (0.0%) |
| 25 to 34 Years | 1 (4.5%) | 0 (0.0%) |
| 35 to 44 Years | 0 (0.0%) | 0 (0.0%) |
| 45 to 54 Years | 0 (0.0%) | 0 (0.0%) |
| 55 to 64 Years | 0 (0.0%) | 2 (5.6%) |
| 65 to 74 Years | 2 (5.4%) | 0 (0.0%) |
| 75 Years and over | 6 (46.2%) | 33 (52.4%) |
| Total | 9 (5.8%) | 35 (17.4%) |
Income Above Poverty by Sex and Age in Taylorsville
According to the poverty statistics in Taylorsville, males aged under 5 years and females aged under 5 years are the age groups that are most secure financially, with 100.0% of males and 100.0% of females in these age groups living above the poverty line.
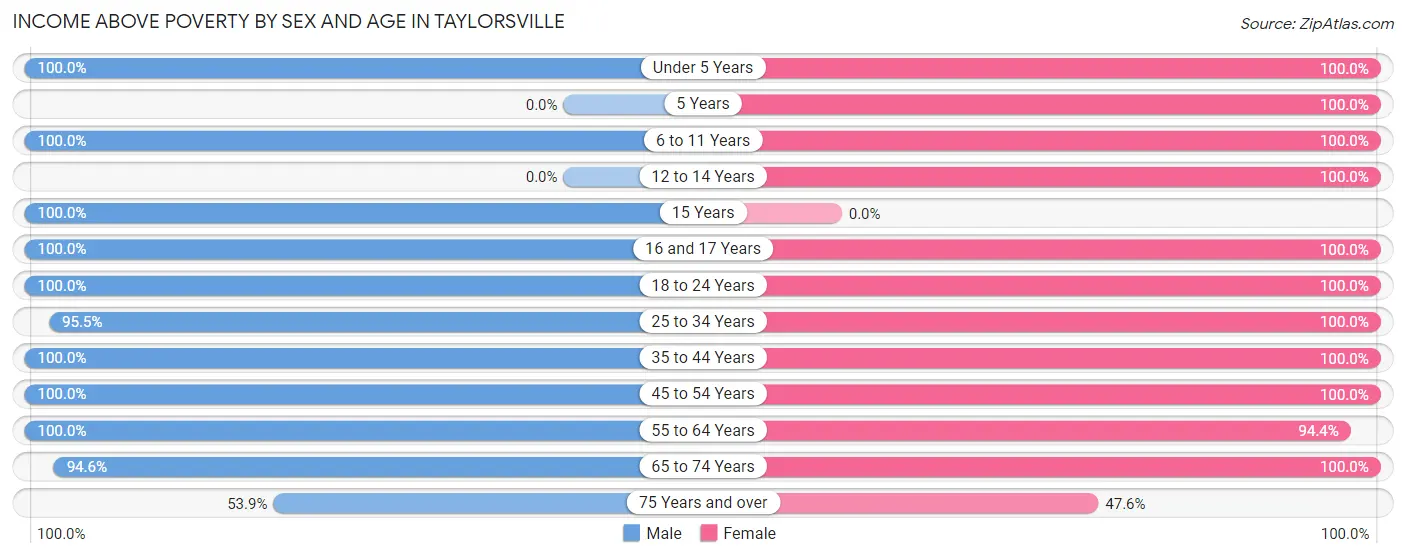
| Age Bracket | Male | Female |
| Under 5 Years | 3 (100.0%) | 4 (100.0%) |
| 5 Years | 0 (0.0%) | 2 (100.0%) |
| 6 to 11 Years | 17 (100.0%) | 5 (100.0%) |
| 12 to 14 Years | 0 (0.0%) | 4 (100.0%) |
| 15 Years | 6 (100.0%) | 0 (0.0%) |
| 16 and 17 Years | 3 (100.0%) | 3 (100.0%) |
| 18 to 24 Years | 11 (100.0%) | 6 (100.0%) |
| 25 to 34 Years | 21 (95.5%) | 21 (100.0%) |
| 35 to 44 Years | 4 (100.0%) | 10 (100.0%) |
| 45 to 54 Years | 20 (100.0%) | 27 (100.0%) |
| 55 to 64 Years | 18 (100.0%) | 34 (94.4%) |
| 65 to 74 Years | 35 (94.6%) | 20 (100.0%) |
| 75 Years and over | 7 (53.8%) | 30 (47.6%) |
| Total | 145 (94.2%) | 166 (82.6%) |
Income Below Poverty Among Married-Couple Families in Taylorsville
The poverty statistics for married-couple families in Taylorsville show that 2.7% or 2 of the total 75 families live below the poverty line. Families with no children have the highest poverty rate of 3.6%, comprising of 2 families. On the other hand, families with 1 or 2 children have the lowest poverty rate of 0.0%, which includes 0 families.
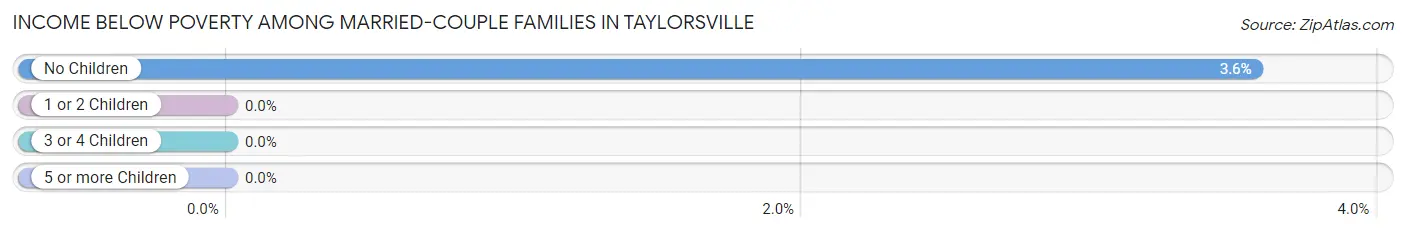
| Children | Above Poverty | Below Poverty |
| No Children | 54 (96.4%) | 2 (3.6%) |
| 1 or 2 Children | 14 (100.0%) | 0 (0.0%) |
| 3 or 4 Children | 5 (100.0%) | 0 (0.0%) |
| 5 or more Children | 0 (0.0%) | 0 (0.0%) |
| Total | 73 (97.3%) | 2 (2.7%) |
Income Below Poverty Among Single-Parent Households in Taylorsville
| Children | Single Father | Single Mother |
| No Children | 0 (0.0%) | 0 (0.0%) |
| 1 or 2 Children | 0 (0.0%) | 0 (0.0%) |
| 3 or 4 Children | 0 (0.0%) | 0 (0.0%) |
| 5 or more Children | 0 (0.0%) | 0 (0.0%) |
| Total | 0 (0.0%) | 0 (0.0%) |
Income Below Poverty Among Married-Couple vs Single-Parent Households in Taylorsville
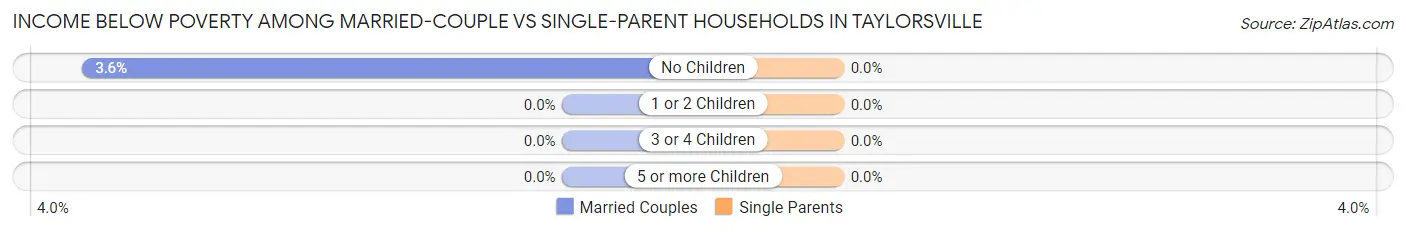
| Children | Married-Couple Families | Single-Parent Households |
| No Children | 2 (3.6%) | 0 (0.0%) |
| 1 or 2 Children | 0 (0.0%) | 0 (0.0%) |
| 3 or 4 Children | 0 (0.0%) | 0 (0.0%) |
| 5 or more Children | 0 (0.0%) | 0 (0.0%) |
| Total | 2 (2.7%) | 0 (0.0%) |
Race in Taylorsville
The most populous races in Taylorsville are White / Caucasian (326 | 91.8%), Two or more Races (19 | 5.3%), and Hispanic or Latino (18 | 5.1%).
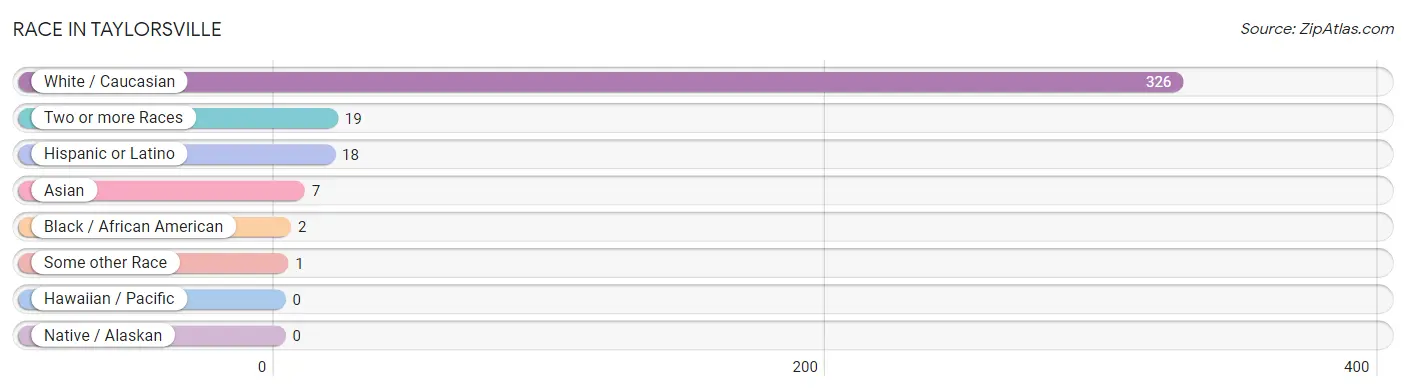
| Race | # Population | % Population |
| Asian | 7 | 2.0% |
| Black / African American | 2 | 0.6% |
| Hawaiian / Pacific | 0 | 0.0% |
| Hispanic or Latino | 18 | 5.1% |
| Native / Alaskan | 0 | 0.0% |
| White / Caucasian | 326 | 91.8% |
| Two or more Races | 19 | 5.3% |
| Some other Race | 1 | 0.3% |
| Total | 355 | 100.0% |
Ancestry in Taylorsville
The most populous ancestries reported in Taylorsville are American (101 | 28.4%), English (35 | 9.9%), European (35 | 9.9%), Irish (28 | 7.9%), and German (21 | 5.9%), together accounting for 62.0% of all Taylorsville residents.
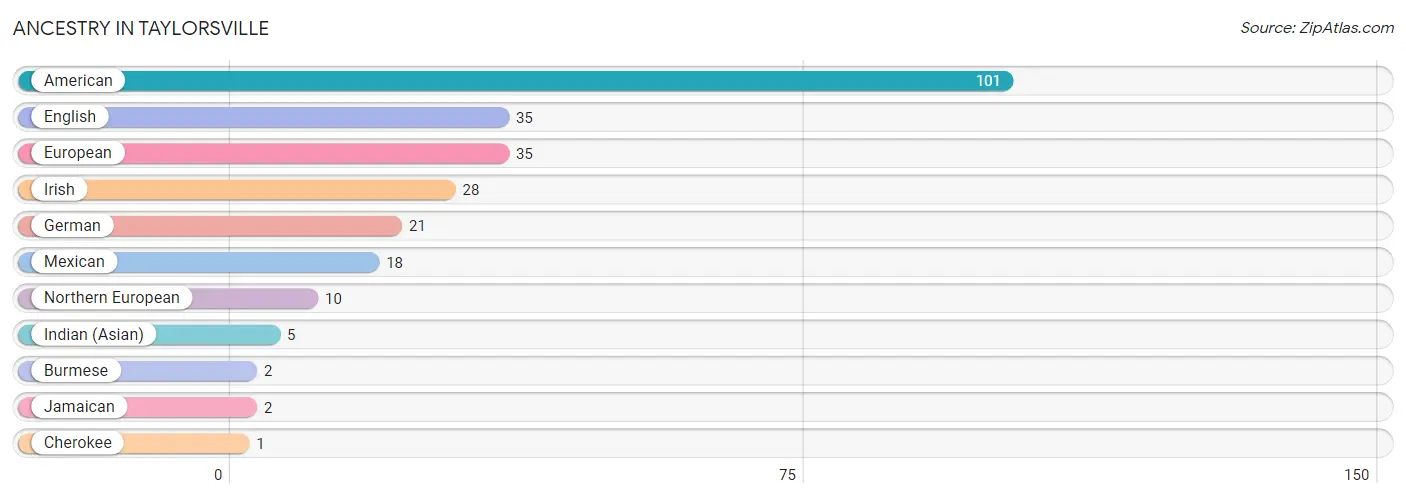
| Ancestry | # Population | % Population |
| American | 101 | 28.4% |
| Burmese | 2 | 0.6% |
| Cherokee | 1 | 0.3% |
| English | 35 | 9.9% |
| European | 35 | 9.9% |
| German | 21 | 5.9% |
| Indian (Asian) | 5 | 1.4% |
| Irish | 28 | 7.9% |
| Jamaican | 2 | 0.6% |
| Mexican | 18 | 5.1% |
| Northern European | 10 | 2.8% | View All 11 Rows |
Immigrants in Taylorsville
The most numerous immigrant groups reported in Taylorsville came from Latin America (12 | 3.4%), Central America (10 | 2.8%), Mexico (10 | 2.8%), Caribbean (2 | 0.6%), and Jamaica (2 | 0.6%), together accounting for 10.1% of all Taylorsville residents.
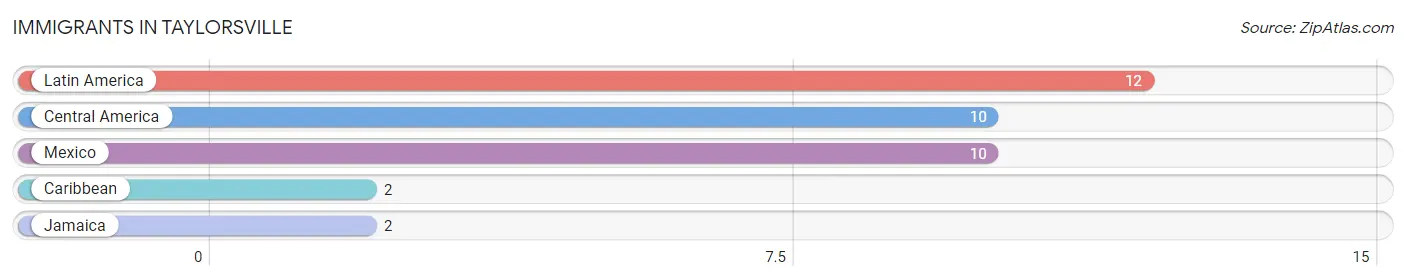
| Immigration Origin | # Population | % Population |
| Caribbean | 2 | 0.6% |
| Central America | 10 | 2.8% |
| Jamaica | 2 | 0.6% |
| Latin America | 12 | 3.4% |
| Mexico | 10 | 2.8% | View All 5 Rows |
Sex and Age in Taylorsville
Sex and Age in Taylorsville
The most populous age groups in Taylorsville are 65 to 69 Years (20 | 13.0%) for men and 85 Years and over (45 | 22.4%) for women.
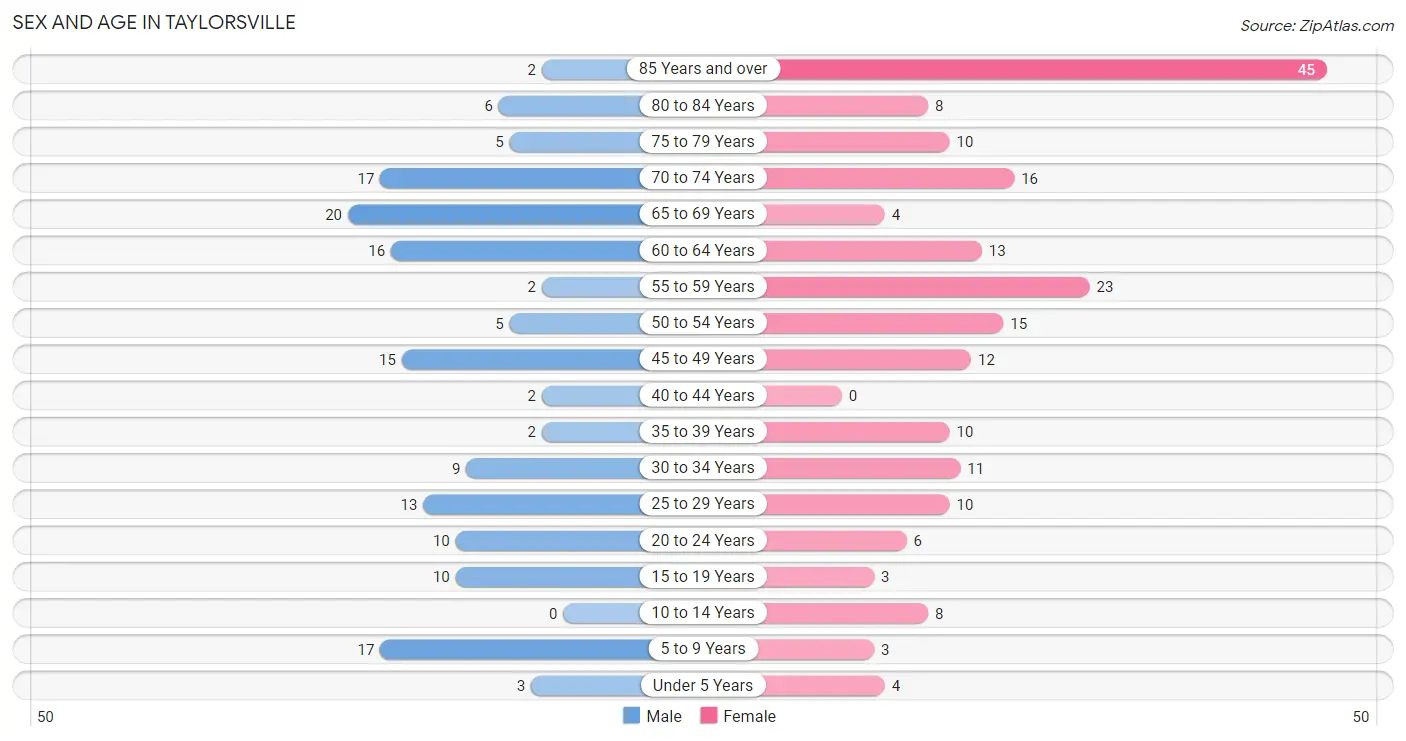
| Age Bracket | Male | Female |
| Under 5 Years | 3 (1.9%) | 4 (2.0%) |
| 5 to 9 Years | 17 (11.0%) | 3 (1.5%) |
| 10 to 14 Years | 0 (0.0%) | 8 (4.0%) |
| 15 to 19 Years | 10 (6.5%) | 3 (1.5%) |
| 20 to 24 Years | 10 (6.5%) | 6 (3.0%) |
| 25 to 29 Years | 13 (8.4%) | 10 (5.0%) |
| 30 to 34 Years | 9 (5.8%) | 11 (5.5%) |
| 35 to 39 Years | 2 (1.3%) | 10 (5.0%) |
| 40 to 44 Years | 2 (1.3%) | 0 (0.0%) |
| 45 to 49 Years | 15 (9.7%) | 12 (6.0%) |
| 50 to 54 Years | 5 (3.3%) | 15 (7.5%) |
| 55 to 59 Years | 2 (1.3%) | 23 (11.4%) |
| 60 to 64 Years | 16 (10.4%) | 13 (6.5%) |
| 65 to 69 Years | 20 (13.0%) | 4 (2.0%) |
| 70 to 74 Years | 17 (11.0%) | 16 (8.0%) |
| 75 to 79 Years | 5 (3.3%) | 10 (5.0%) |
| 80 to 84 Years | 6 (3.9%) | 8 (4.0%) |
| 85 Years and over | 2 (1.3%) | 45 (22.4%) |
| Total | 154 (100.0%) | 201 (100.0%) |
Families and Households in Taylorsville
Median Family Size in Taylorsville
The median family size in Taylorsville is 3.04 persons per family, with single male/father families (2 | 2.2%) accounting for the largest median family size of 4.5 persons per family. On the other hand, married-couple families (75 | 83.3%) represent the smallest median family size with 3.00 persons per family.
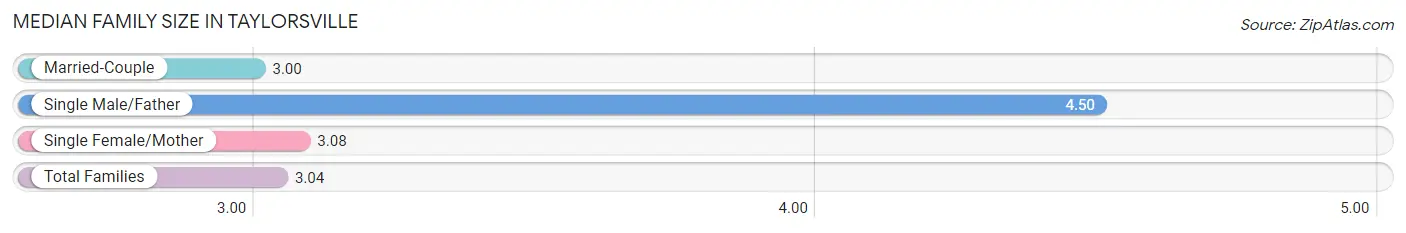
| Family Type | # Families | Family Size |
| Married-Couple | 75 (83.3%) | 3.00 |
| Single Male/Father | 2 (2.2%) | 4.50 |
| Single Female/Mother | 13 (14.4%) | 3.08 |
| Total Families | 90 (100.0%) | 3.04 |
Median Household Size in Taylorsville
The median household size in Taylorsville is 2.15 persons per household, with single male/father households (2 | 1.2%) accounting for the largest median household size of 4.5 persons per household. non-family households (75 | 45.5%) represent the smallest median household size with 1.08 persons per household.
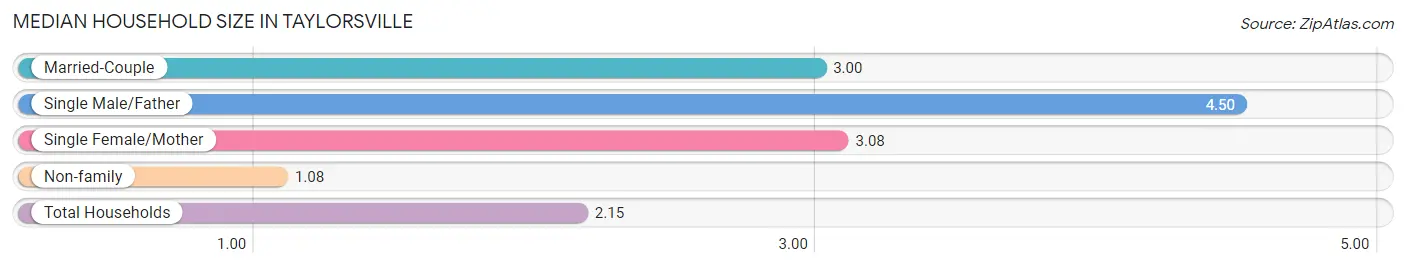
| Household Type | # Households | Household Size |
| Married-Couple | 75 (45.5%) | 3.00 |
| Single Male/Father | 2 (1.2%) | 4.50 |
| Single Female/Mother | 13 (7.9%) | 3.08 |
| Non-family | 75 (45.5%) | 1.08 |
| Total Households | 165 (100.0%) | 2.15 |
Household Size by Marriage Status in Taylorsville
Out of a total of 165 households in Taylorsville, 90 (54.5%) are family households, while 75 (45.5%) are nonfamily households. The most numerous type of family households are 3-person households, comprising 40, and the most common type of nonfamily households are 1-person households, comprising 68.
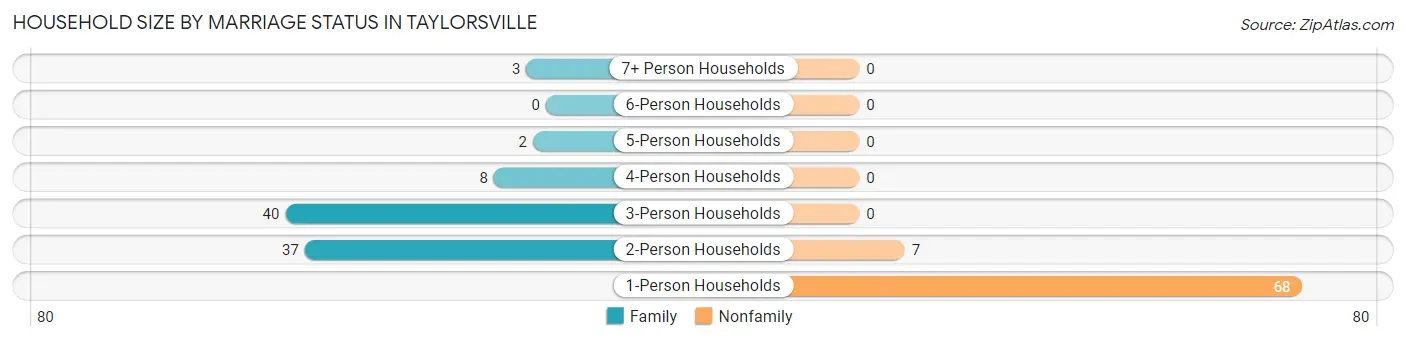
| Household Size | Family Households | Nonfamily Households |
| 1-Person Households | - | 68 (41.2%) |
| 2-Person Households | 37 (22.4%) | 7 (4.2%) |
| 3-Person Households | 40 (24.2%) | 0 (0.0%) |
| 4-Person Households | 8 (4.9%) | 0 (0.0%) |
| 5-Person Households | 2 (1.2%) | 0 (0.0%) |
| 6-Person Households | 0 (0.0%) | 0 (0.0%) |
| 7+ Person Households | 3 (1.8%) | 0 (0.0%) |
| Total | 90 (54.5%) | 75 (45.5%) |
Female Fertility in Taylorsville
Fertility by Age in Taylorsville
| Age Bracket | Women with Births | Births / 1,000 Women |
| 15 to 19 years | 0 (0.0%) | 0.0 |
| 20 to 34 years | 0 (0.0%) | 0.0 |
| 35 to 50 years | 0 (0.0%) | 0.0 |
| Total | 0 (0.0%) | 0.0 |
Fertility by Age by Marriage Status in Taylorsville
| Age Bracket | Married | Unmarried |
| 15 to 19 years | 0 (0.0%) | 0 (0.0%) |
| 20 to 34 years | 0 (0.0%) | 0 (0.0%) |
| 35 to 50 years | 0 (0.0%) | 0 (0.0%) |
| Total | 0 (0.0%) | 0 (0.0%) |
Fertility by Education in Taylorsville
| Educational Attainment | Women with Births | Births / 1,000 Women |
| Less than High School | 0 (0.0%) | 0.0 |
| High School Diploma | 0 (0.0%) | 0.0 |
| College or Associate's Degree | 0 (0.0%) | 0.0 |
| Bachelor's Degree | 0 (0.0%) | 0.0 |
| Graduate Degree | 0 (0.0%) | 0.0 |
| Total | 0 (0.0%) | 0.0 |
Fertility by Education by Marriage Status in Taylorsville
| Educational Attainment | Married | Unmarried |
| Less than High School | 0 (0.0%) | 0 (0.0%) |
| High School Diploma | 0 (0.0%) | 0 (0.0%) |
| College or Associate's Degree | 0 (0.0%) | 0 (0.0%) |
| Bachelor's Degree | 0 (0.0%) | 0 (0.0%) |
| Graduate Degree | 0 (0.0%) | 0 (0.0%) |
| Total | 0 (0.0%) | 0 (0.0%) |
Employment Characteristics in Taylorsville
Employment by Class of Employer in Taylorsville
Among the 115 employed individuals in Taylorsville, private company employees (61 | 53.0%), local government employees (21 | 18.3%), and not-for-profit organizations (16 | 13.9%) make up the most common classes of employment.
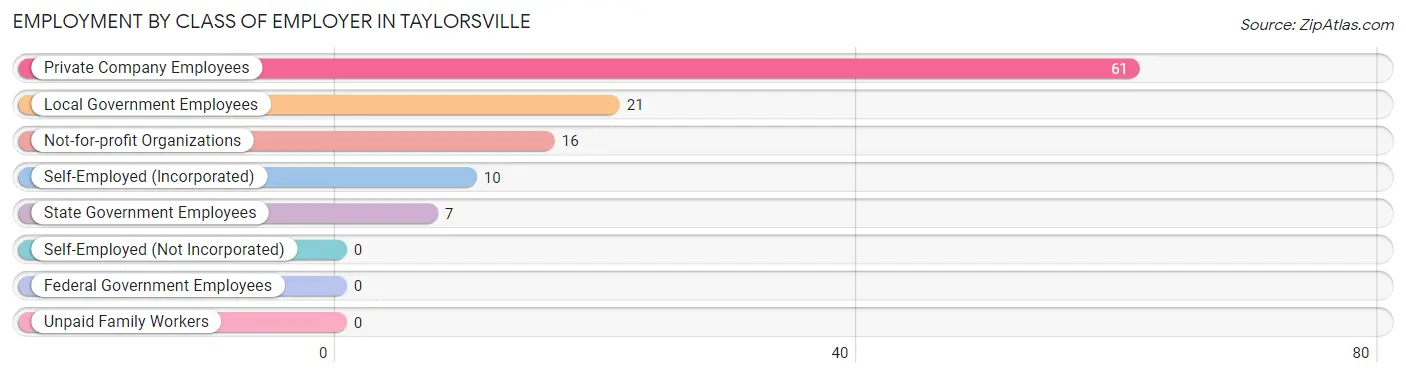
| Employer Class | # Employees | % Employees |
| Private Company Employees | 61 | 53.0% |
| Self-Employed (Incorporated) | 10 | 8.7% |
| Self-Employed (Not Incorporated) | 0 | 0.0% |
| Not-for-profit Organizations | 16 | 13.9% |
| Local Government Employees | 21 | 18.3% |
| State Government Employees | 7 | 6.1% |
| Federal Government Employees | 0 | 0.0% |
| Unpaid Family Workers | 0 | 0.0% |
| Total | 115 | 100.0% |
Employment Status by Age in Taylorsville
According to the labor force statistics for Taylorsville, out of the total population over 16 years of age (314), 37.9% or 119 individuals are in the labor force, with 0.8% or 1 of them unemployed. The age group with the highest labor force participation rate is 20 to 24 years, with 100.0% or 16 individuals in the labor force. Within the labor force, the 30 to 34 years age range has the highest percentage of unemployed individuals, with 11.1% or 1 of them being unemployed.
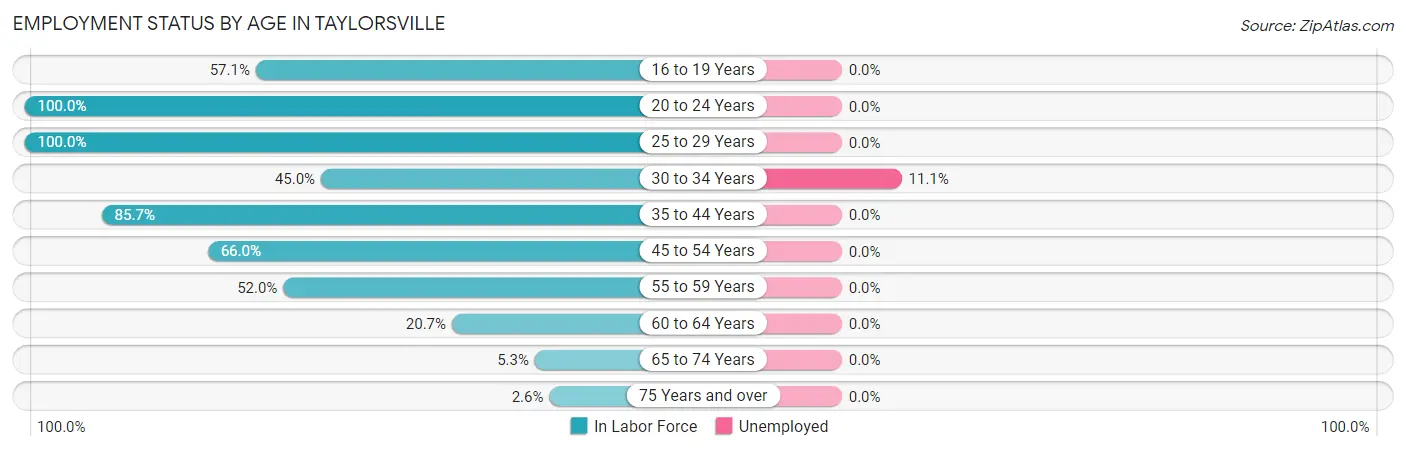
| Age Bracket | In Labor Force | Unemployed |
| 16 to 19 Years | 4 (57.1%) | 0 (0.0%) |
| 20 to 24 Years | 16 (100.0%) | 0 (0.0%) |
| 25 to 29 Years | 23 (100.0%) | 0 (0.0%) |
| 30 to 34 Years | 9 (45.0%) | 1 (11.1%) |
| 35 to 44 Years | 12 (85.7%) | 0 (0.0%) |
| 45 to 54 Years | 31 (66.0%) | 0 (0.0%) |
| 55 to 59 Years | 13 (52.0%) | 0 (0.0%) |
| 60 to 64 Years | 6 (20.7%) | 0 (0.0%) |
| 65 to 74 Years | 3 (5.3%) | 0 (0.0%) |
| 75 Years and over | 2 (2.6%) | 0 (0.0%) |
| Total | 119 (37.9%) | 1 (0.8%) |
Employment Status by Educational Attainment in Taylorsville
According to labor force statistics for Taylorsville, 59.5% of individuals (94) out of the total population between 25 and 64 years of age (158) are in the labor force, with 1.1% or 1 of them being unemployed. The group with the highest labor force participation rate are those with the educational attainment of college / associate degree, with 76.8% or 43 individuals in the labor force. Within the labor force, individuals with high school diploma education have the highest percentage of unemployment, with 3.7% or 1 of them being unemployed.
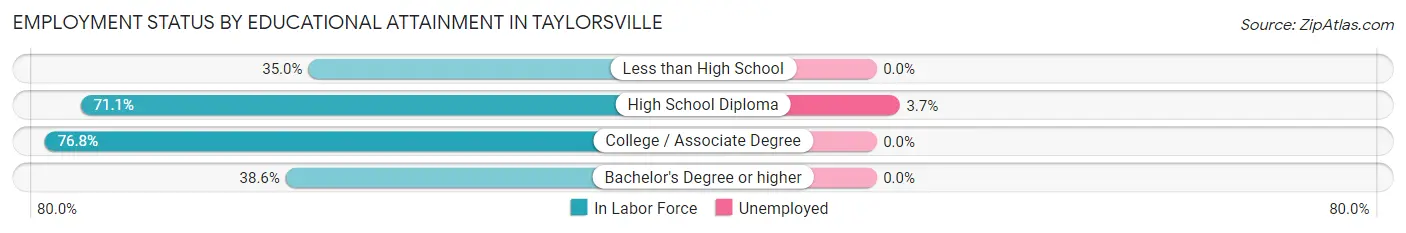
| Educational Attainment | In Labor Force | Unemployed |
| Less than High School | 7 (35.0%) | 0 (0.0%) |
| High School Diploma | 27 (71.1%) | 1 (3.7%) |
| College / Associate Degree | 43 (76.8%) | 0 (0.0%) |
| Bachelor's Degree or higher | 17 (38.6%) | 0 (0.0%) |
| Total | 94 (59.5%) | 2 (1.1%) |
Employment Occupations by Sex in Taylorsville
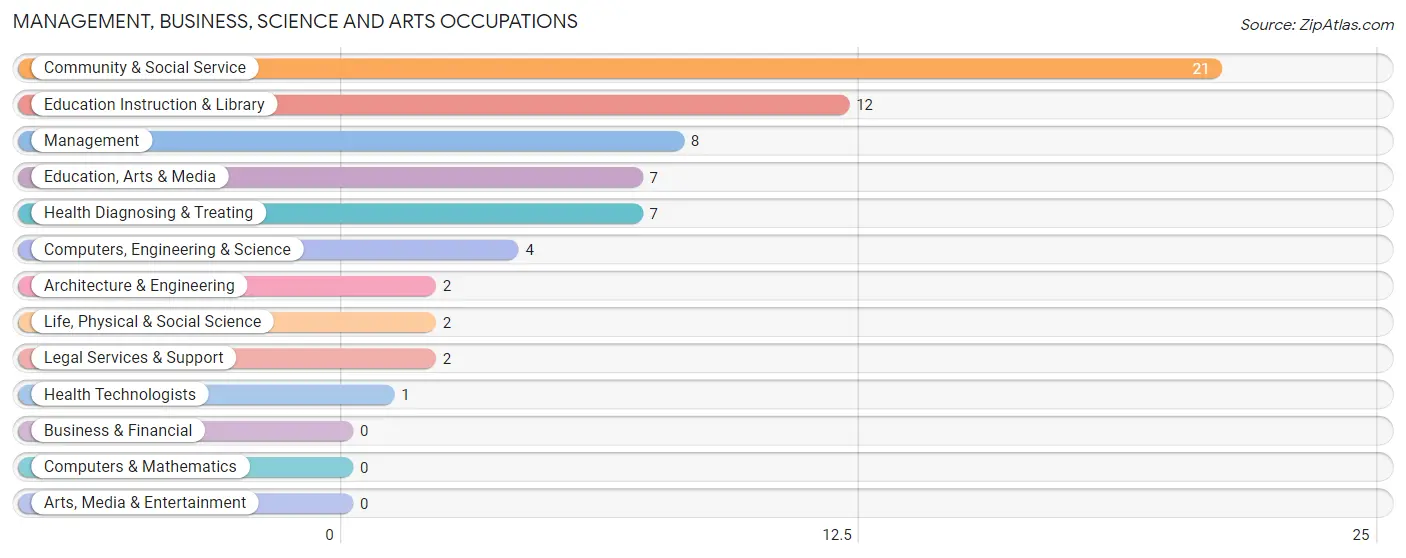
Management, Business, Science and Arts Occupations
The most common Management, Business, Science and Arts occupations in Taylorsville are Community & Social Service (21 | 17.8%), Education Instruction & Library (12 | 10.2%), Management (8 | 6.8%), Education, Arts & Media (7 | 5.9%), and Health Diagnosing & Treating (7 | 5.9%).
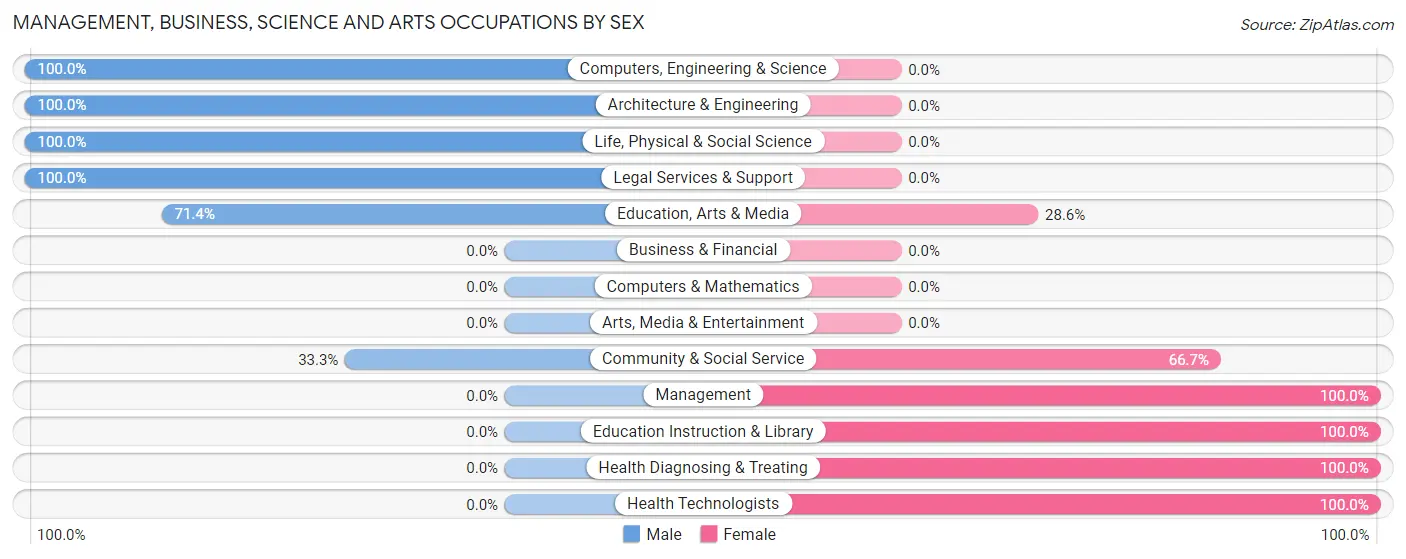
Management, Business, Science and Arts Occupations by Sex
Within the Management, Business, Science and Arts occupations in Taylorsville, the most male-oriented occupations are Computers, Engineering & Science (100.0%), Architecture & Engineering (100.0%), and Life, Physical & Social Science (100.0%), while the most female-oriented occupations are Management (100.0%), Education Instruction & Library (100.0%), and Health Diagnosing & Treating (100.0%).
| Occupation | Male | Female |
| Management | 0 (0.0%) | 8 (100.0%) |
| Business & Financial | 0 (0.0%) | 0 (0.0%) |
| Computers, Engineering & Science | 4 (100.0%) | 0 (0.0%) |
| Computers & Mathematics | 0 (0.0%) | 0 (0.0%) |
| Architecture & Engineering | 2 (100.0%) | 0 (0.0%) |
| Life, Physical & Social Science | 2 (100.0%) | 0 (0.0%) |
| Community & Social Service | 7 (33.3%) | 14 (66.7%) |
| Education, Arts & Media | 5 (71.4%) | 2 (28.6%) |
| Legal Services & Support | 2 (100.0%) | 0 (0.0%) |
| Education Instruction & Library | 0 (0.0%) | 12 (100.0%) |
| Arts, Media & Entertainment | 0 (0.0%) | 0 (0.0%) |
| Health Diagnosing & Treating | 0 (0.0%) | 7 (100.0%) |
| Health Technologists | 0 (0.0%) | 1 (100.0%) |
| Total (Category) | 11 (27.5%) | 29 (72.5%) |
| Total (Overall) | 62 (52.5%) | 56 (47.5%) |
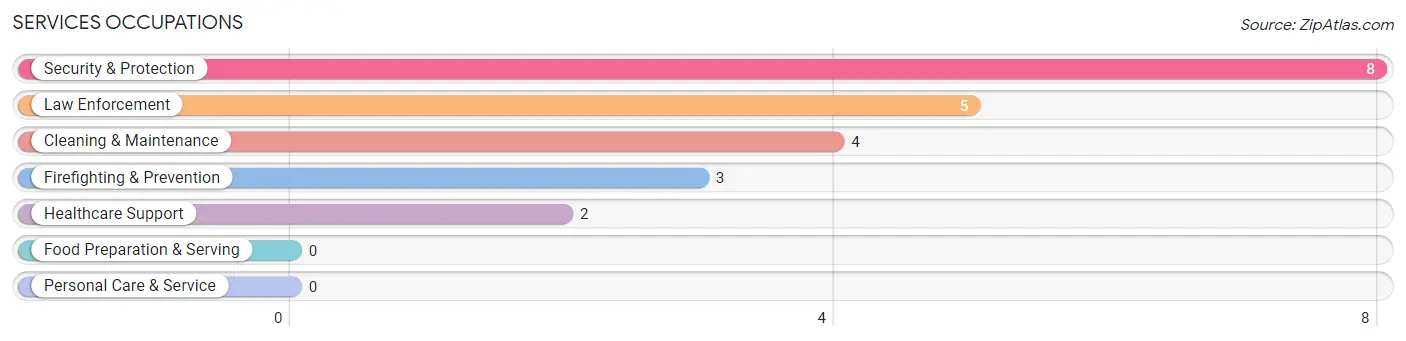
Services Occupations
The most common Services occupations in Taylorsville are Security & Protection (8 | 6.8%), Law Enforcement (5 | 4.2%), Cleaning & Maintenance (4 | 3.4%), Firefighting & Prevention (3 | 2.5%), and Healthcare Support (2 | 1.7%).
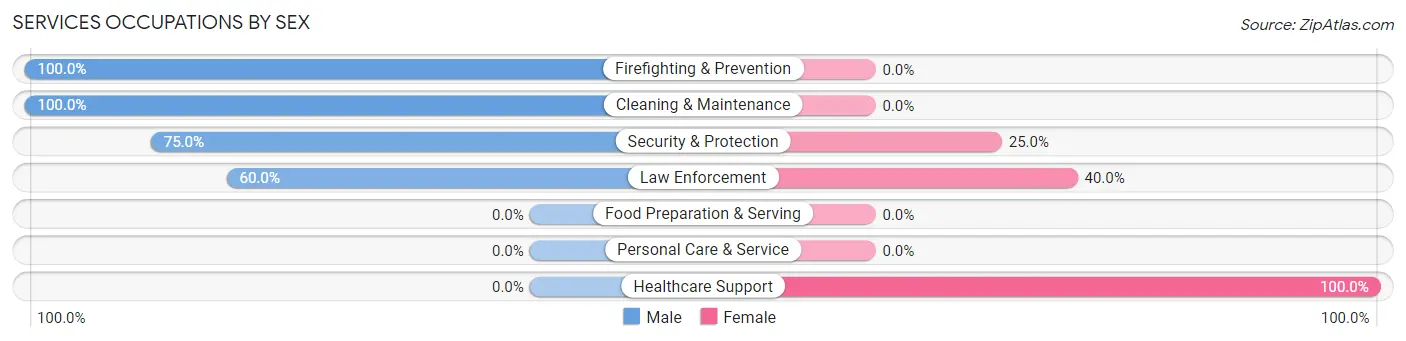
Services Occupations by Sex
Within the Services occupations in Taylorsville, the most male-oriented occupations are Firefighting & Prevention (100.0%), Cleaning & Maintenance (100.0%), and Security & Protection (75.0%), while the most female-oriented occupations are Healthcare Support (100.0%), Law Enforcement (40.0%), and Security & Protection (25.0%).
| Occupation | Male | Female |
| Healthcare Support | 0 (0.0%) | 2 (100.0%) |
| Security & Protection | 6 (75.0%) | 2 (25.0%) |
| Firefighting & Prevention | 3 (100.0%) | 0 (0.0%) |
| Law Enforcement | 3 (60.0%) | 2 (40.0%) |
| Food Preparation & Serving | 0 (0.0%) | 0 (0.0%) |
| Cleaning & Maintenance | 4 (100.0%) | 0 (0.0%) |
| Personal Care & Service | 0 (0.0%) | 0 (0.0%) |
| Total (Category) | 10 (71.4%) | 4 (28.6%) |
| Total (Overall) | 62 (52.5%) | 56 (47.5%) |
Sales and Office Occupations
The most common Sales and Office occupations in Taylorsville are Office & Administration (16 | 13.6%), and Sales & Related (7 | 5.9%).
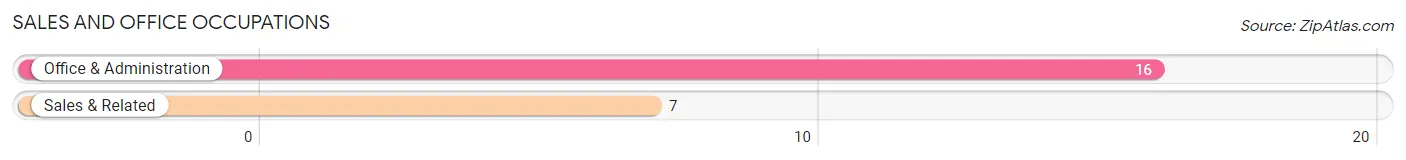
Sales and Office Occupations by Sex

| Occupation | Male | Female |
| Sales & Related | 7 (100.0%) | 0 (0.0%) |
| Office & Administration | 2 (12.5%) | 14 (87.5%) |
| Total (Category) | 9 (39.1%) | 14 (60.9%) |
| Total (Overall) | 62 (52.5%) | 56 (47.5%) |
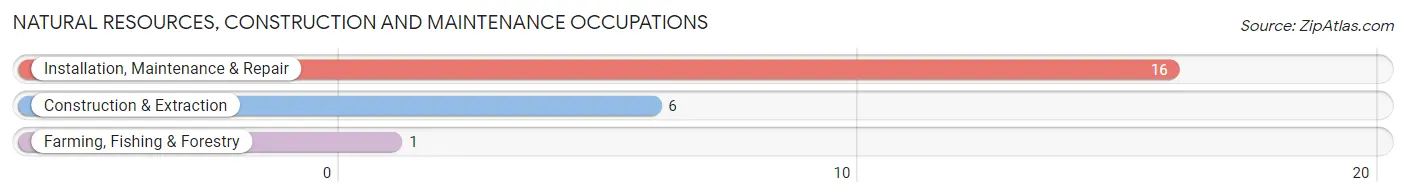
Natural Resources, Construction and Maintenance Occupations
The most common Natural Resources, Construction and Maintenance occupations in Taylorsville are Installation, Maintenance & Repair (16 | 13.6%), Construction & Extraction (6 | 5.1%), and Farming, Fishing & Forestry (1 | 0.9%).
Natural Resources, Construction and Maintenance Occupations by Sex
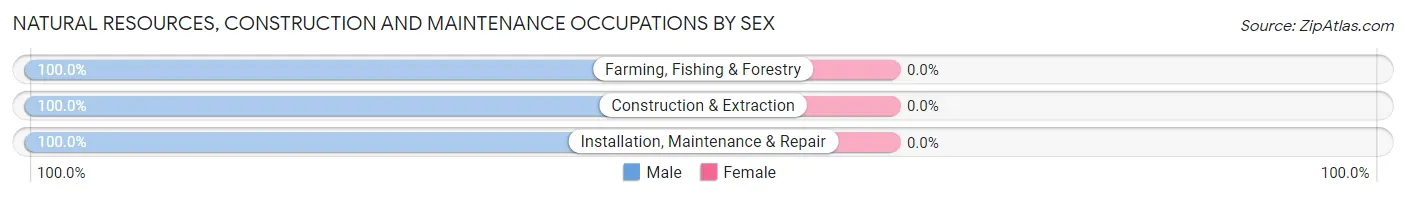
| Occupation | Male | Female |
| Farming, Fishing & Forestry | 1 (100.0%) | 0 (0.0%) |
| Construction & Extraction | 6 (100.0%) | 0 (0.0%) |
| Installation, Maintenance & Repair | 16 (100.0%) | 0 (0.0%) |
| Total (Category) | 23 (100.0%) | 0 (0.0%) |
| Total (Overall) | 62 (52.5%) | 56 (47.5%) |
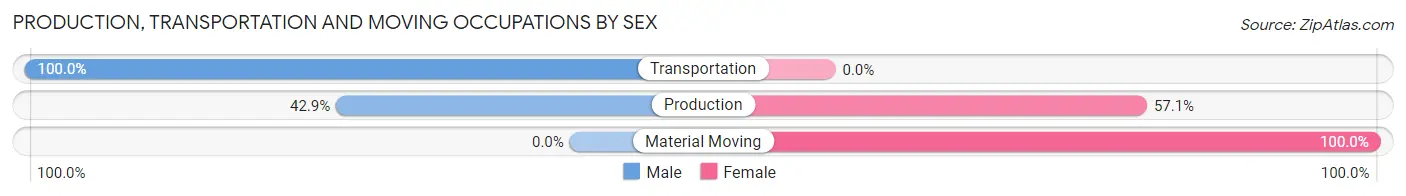
Production, Transportation and Moving Occupations
The most common Production, Transportation and Moving occupations in Taylorsville are Production (7 | 5.9%), Transportation (6 | 5.1%), and Material Moving (5 | 4.2%).
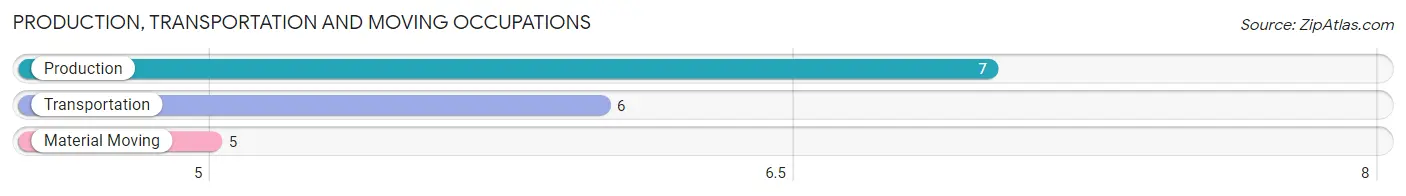
Production, Transportation and Moving Occupations by Sex
| Occupation | Male | Female |
| Production | 3 (42.9%) | 4 (57.1%) |
| Transportation | 6 (100.0%) | 0 (0.0%) |
| Material Moving | 0 (0.0%) | 5 (100.0%) |
| Total (Category) | 9 (50.0%) | 9 (50.0%) |
| Total (Overall) | 62 (52.5%) | 56 (47.5%) |
Employment Industries by Sex in Taylorsville
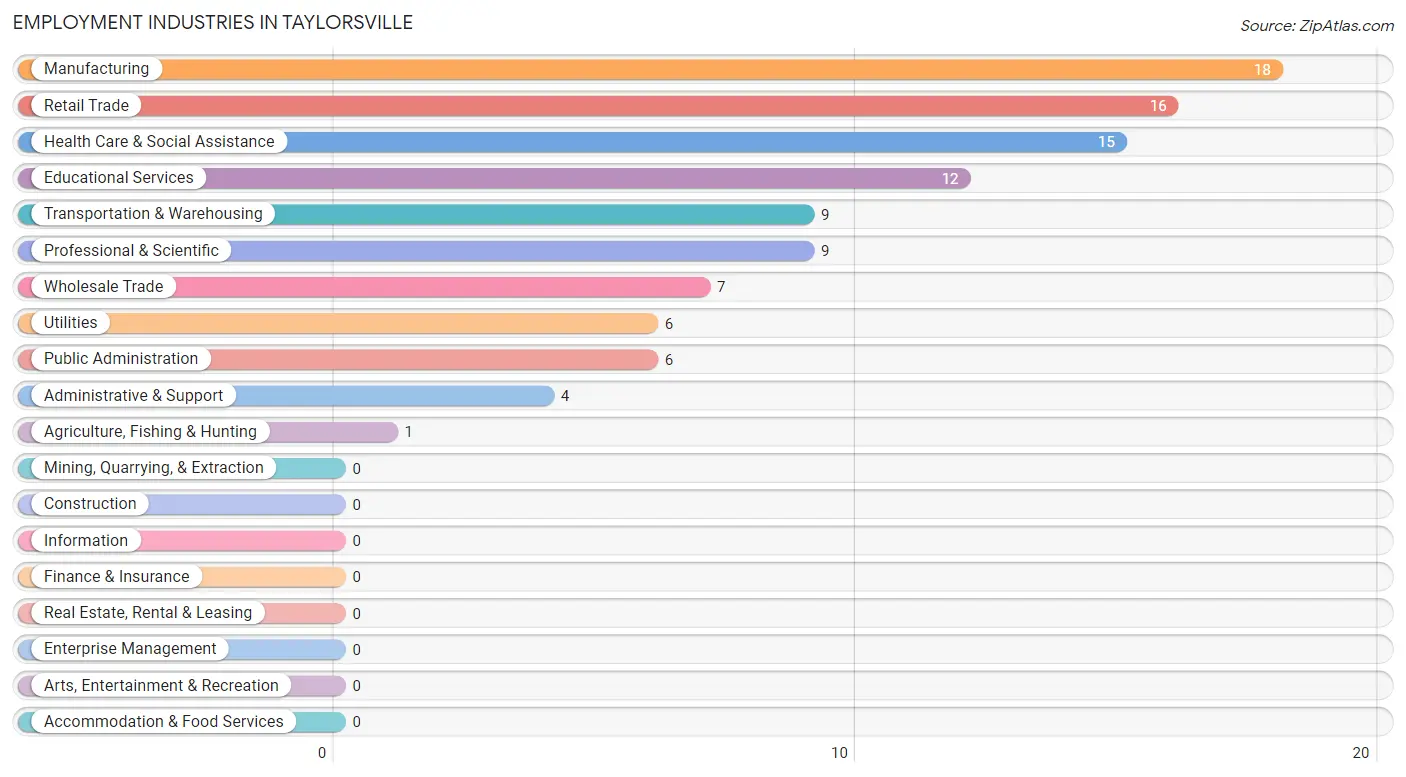
Employment Industries in Taylorsville
The major employment industries in Taylorsville include Manufacturing (18 | 15.2%), Retail Trade (16 | 13.6%), Health Care & Social Assistance (15 | 12.7%), Educational Services (12 | 10.2%), and Transportation & Warehousing (9 | 7.6%).
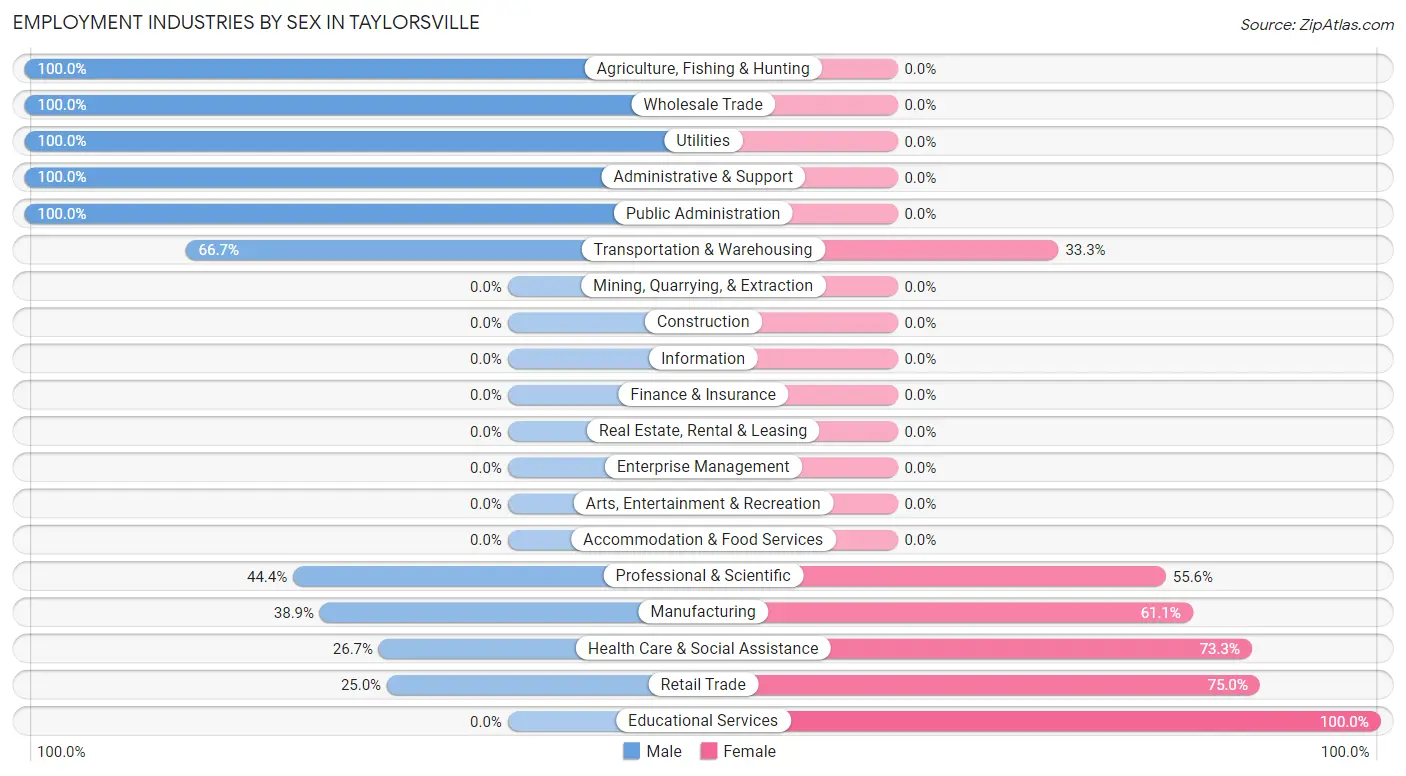
Employment Industries by Sex in Taylorsville
The Taylorsville industries that see more men than women are Agriculture, Fishing & Hunting (100.0%), Wholesale Trade (100.0%), and Utilities (100.0%), whereas the industries that tend to have a higher number of women are Educational Services (100.0%), Retail Trade (75.0%), and Health Care & Social Assistance (73.3%).
| Industry | Male | Female |
| Agriculture, Fishing & Hunting | 1 (100.0%) | 0 (0.0%) |
| Mining, Quarrying, & Extraction | 0 (0.0%) | 0 (0.0%) |
| Construction | 0 (0.0%) | 0 (0.0%) |
| Manufacturing | 7 (38.9%) | 11 (61.1%) |
| Wholesale Trade | 7 (100.0%) | 0 (0.0%) |
| Retail Trade | 4 (25.0%) | 12 (75.0%) |
| Transportation & Warehousing | 6 (66.7%) | 3 (33.3%) |
| Utilities | 6 (100.0%) | 0 (0.0%) |
| Information | 0 (0.0%) | 0 (0.0%) |
| Finance & Insurance | 0 (0.0%) | 0 (0.0%) |
| Real Estate, Rental & Leasing | 0 (0.0%) | 0 (0.0%) |
| Professional & Scientific | 4 (44.4%) | 5 (55.6%) |
| Enterprise Management | 0 (0.0%) | 0 (0.0%) |
| Administrative & Support | 4 (100.0%) | 0 (0.0%) |
| Educational Services | 0 (0.0%) | 12 (100.0%) |
| Health Care & Social Assistance | 4 (26.7%) | 11 (73.3%) |
| Arts, Entertainment & Recreation | 0 (0.0%) | 0 (0.0%) |
| Accommodation & Food Services | 0 (0.0%) | 0 (0.0%) |
| Public Administration | 6 (100.0%) | 0 (0.0%) |
| Total | 62 (52.5%) | 56 (47.5%) |
Education in Taylorsville
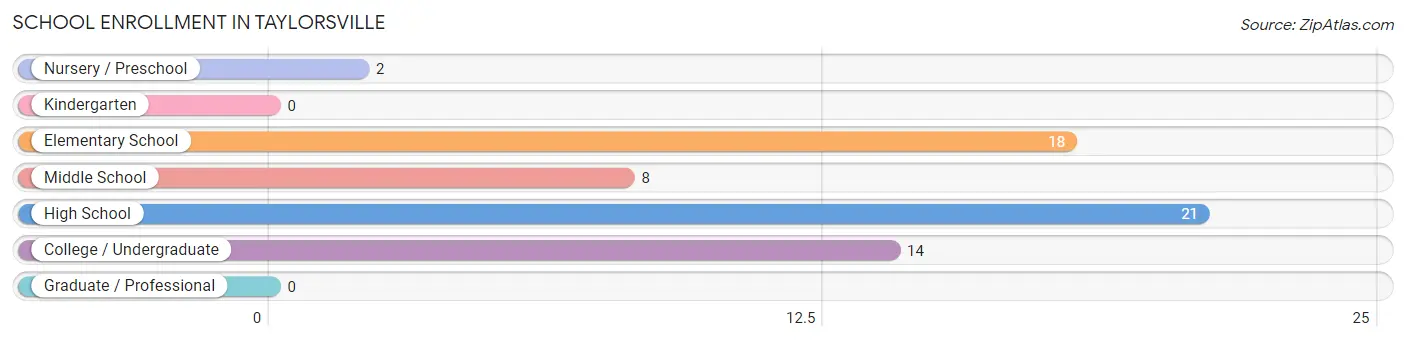
School Enrollment in Taylorsville
The most common levels of schooling among the 63 students in Taylorsville are high school (21 | 33.3%), elementary school (18 | 28.6%), and college / undergraduate (14 | 22.2%).
| School Level | # Students | % Students |
| Nursery / Preschool | 2 | 3.2% |
| Kindergarten | 0 | 0.0% |
| Elementary School | 18 | 28.6% |
| Middle School | 8 | 12.7% |
| High School | 21 | 33.3% |
| College / Undergraduate | 14 | 22.2% |
| Graduate / Professional | 0 | 0.0% |
| Total | 63 | 100.0% |
School Enrollment by Age by Funding Source in Taylorsville
Out of a total of 63 students who are enrolled in schools in Taylorsville, 18 (28.6%) attend a private institution, while the remaining 45 (71.4%) are enrolled in public schools. The age group of 10 to 14 year olds has the highest likelihood of being enrolled in private schools, with 4 (50.0% in the age bracket) enrolled. Conversely, the age group of 18 to 19 year olds has the lowest likelihood of being enrolled in a private school, with 1 (100.0% in the age bracket) attending a public institution.
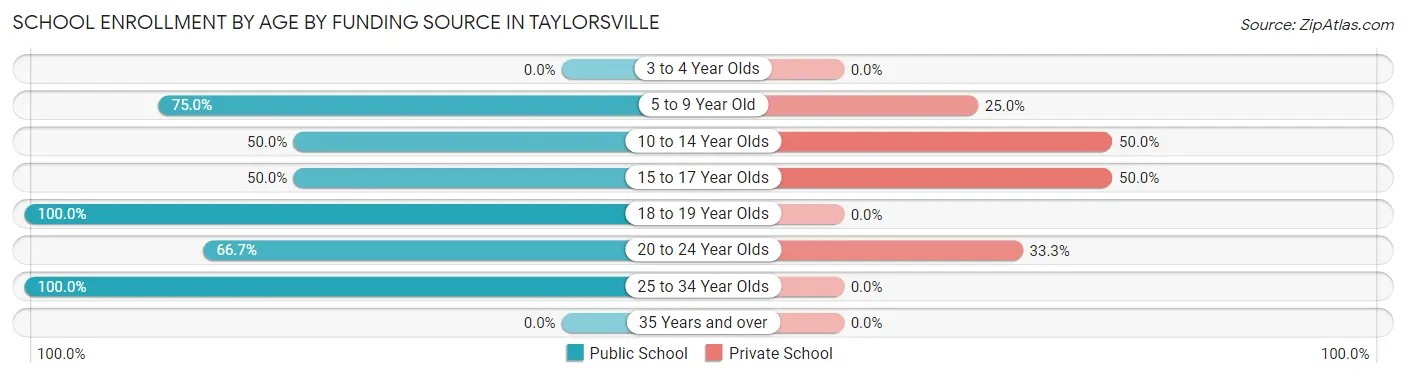
| Age Bracket | Public School | Private School |
| 3 to 4 Year Olds | 0 (0.0%) | 0 (0.0%) |
| 5 to 9 Year Old | 15 (75.0%) | 5 (25.0%) |
| 10 to 14 Year Olds | 4 (50.0%) | 4 (50.0%) |
| 15 to 17 Year Olds | 6 (50.0%) | 6 (50.0%) |
| 18 to 19 Year Olds | 1 (100.0%) | 0 (0.0%) |
| 20 to 24 Year Olds | 6 (66.7%) | 3 (33.3%) |
| 25 to 34 Year Olds | 13 (100.0%) | 0 (0.0%) |
| 35 Years and over | 0 (0.0%) | 0 (0.0%) |
| Total | 45 (71.4%) | 18 (28.6%) |
Educational Attainment by Field of Study in Taylorsville
Education (15 | 23.8%), visual & performing arts (10 | 15.9%), business (9 | 14.3%), psychology (8 | 12.7%), and liberal arts & history (8 | 12.7%) are the most common fields of study among 63 individuals in Taylorsville who have obtained a bachelor's degree or higher.
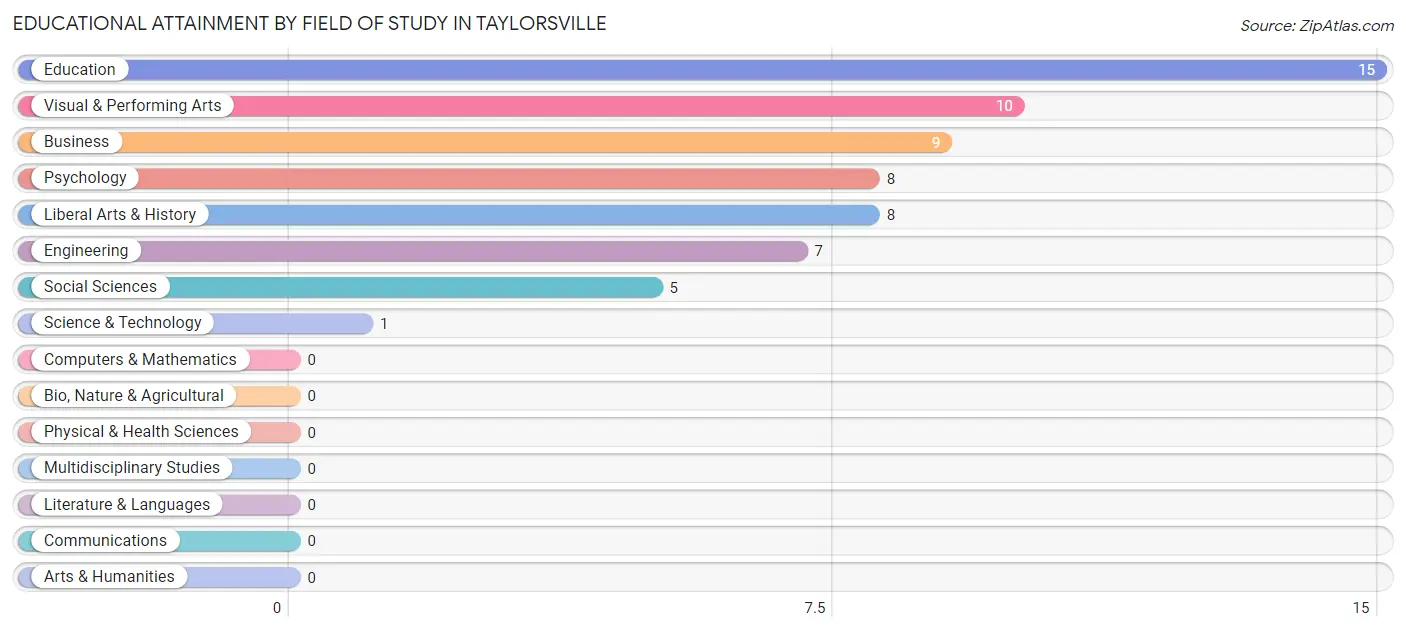
| Field of Study | # Graduates | % Graduates |
| Computers & Mathematics | 0 | 0.0% |
| Bio, Nature & Agricultural | 0 | 0.0% |
| Physical & Health Sciences | 0 | 0.0% |
| Psychology | 8 | 12.7% |
| Social Sciences | 5 | 7.9% |
| Engineering | 7 | 11.1% |
| Multidisciplinary Studies | 0 | 0.0% |
| Science & Technology | 1 | 1.6% |
| Business | 9 | 14.3% |
| Education | 15 | 23.8% |
| Literature & Languages | 0 | 0.0% |
| Liberal Arts & History | 8 | 12.7% |
| Visual & Performing Arts | 10 | 15.9% |
| Communications | 0 | 0.0% |
| Arts & Humanities | 0 | 0.0% |
| Total | 63 | 100.0% |
Transportation & Commute in Taylorsville
Vehicle Availability by Sex in Taylorsville
The most prevalent vehicle ownership categories in Taylorsville are males with 3 vehicles (23, accounting for 37.1%) and females with 3 vehicles (22, making up 43.4%).
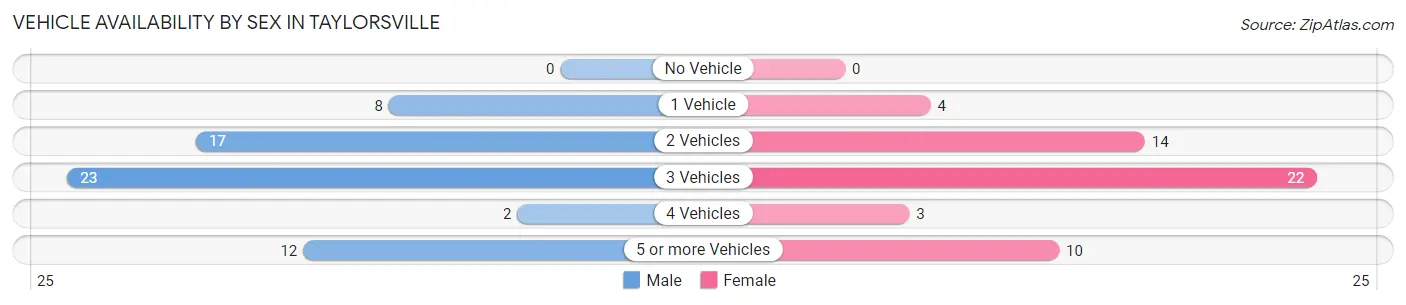
| Vehicles Available | Male | Female |
| No Vehicle | 0 (0.0%) | 0 (0.0%) |
| 1 Vehicle | 8 (12.9%) | 4 (7.5%) |
| 2 Vehicles | 17 (27.4%) | 14 (26.4%) |
| 3 Vehicles | 23 (37.1%) | 22 (41.5%) |
| 4 Vehicles | 2 (3.2%) | 3 (5.7%) |
| 5 or more Vehicles | 12 (19.4%) | 10 (18.9%) |
| Total | 62 (100.0%) | 53 (100.0%) |
Commute Time in Taylorsville
The most frequently occuring commute durations in Taylorsville are 30 to 34 minutes (23 commuters, 22.6%), 15 to 19 minutes (16 commuters, 15.7%), and 20 to 24 minutes (15 commuters, 14.7%).
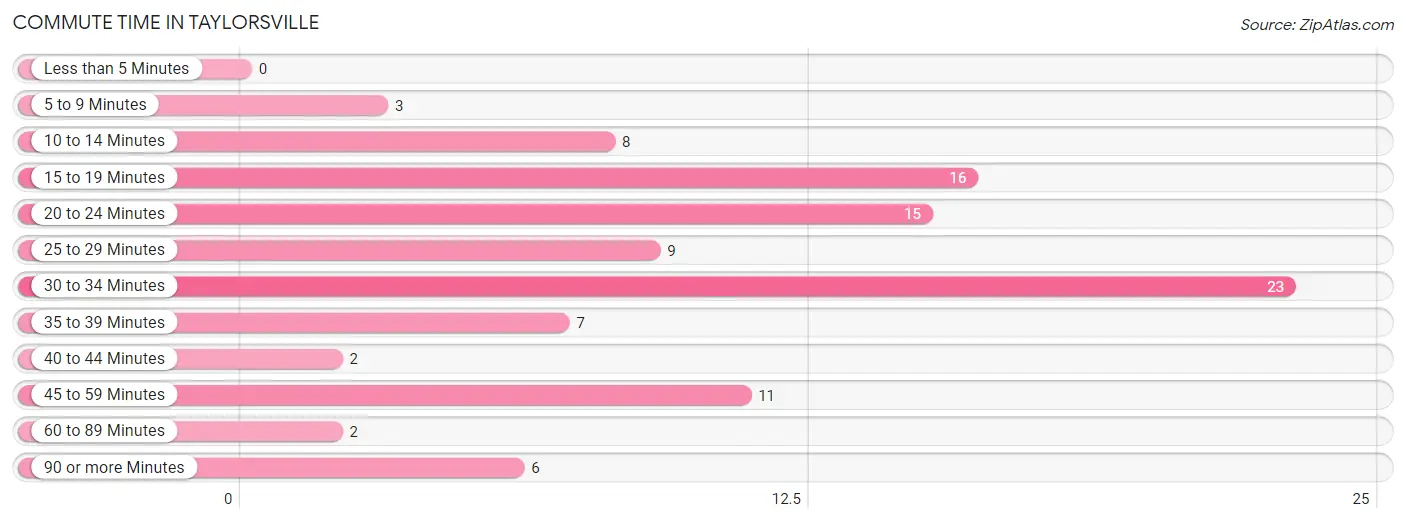
| Commute Time | # Commuters | % Commuters |
| Less than 5 Minutes | 0 | 0.0% |
| 5 to 9 Minutes | 3 | 2.9% |
| 10 to 14 Minutes | 8 | 7.8% |
| 15 to 19 Minutes | 16 | 15.7% |
| 20 to 24 Minutes | 15 | 14.7% |
| 25 to 29 Minutes | 9 | 8.8% |
| 30 to 34 Minutes | 23 | 22.6% |
| 35 to 39 Minutes | 7 | 6.9% |
| 40 to 44 Minutes | 2 | 2.0% |
| 45 to 59 Minutes | 11 | 10.8% |
| 60 to 89 Minutes | 2 | 2.0% |
| 90 or more Minutes | 6 | 5.9% |
Commute Time by Sex in Taylorsville
The most common commute times in Taylorsville are 30 to 34 minutes (12 commuters, 20.7%) for males and 30 to 34 minutes (11 commuters, 25.0%) for females.
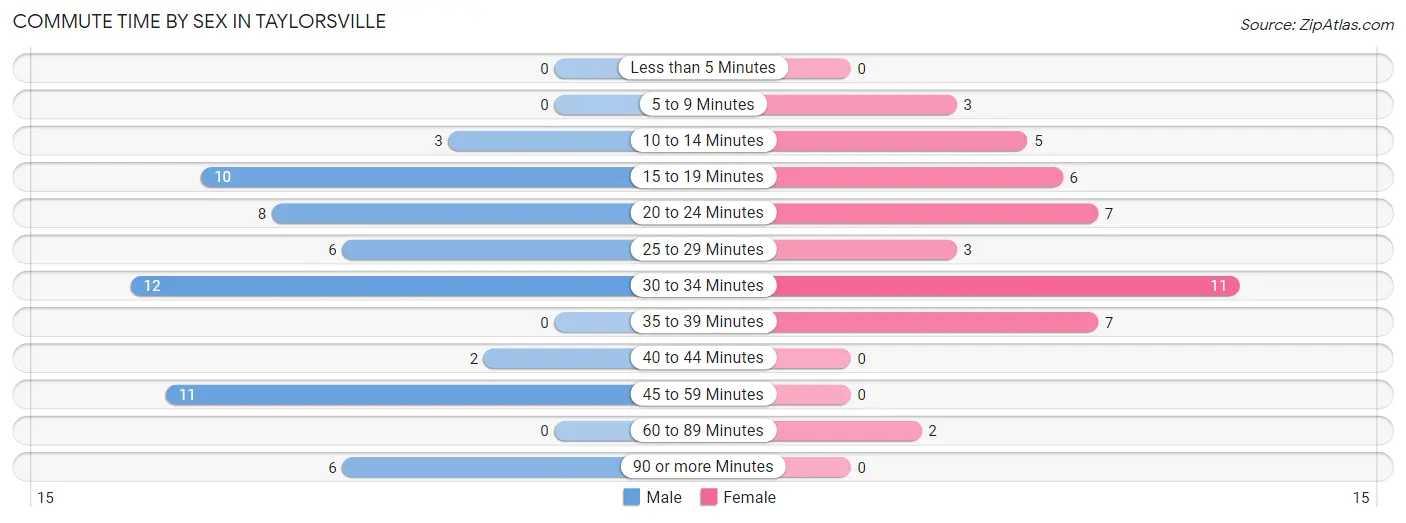
| Commute Time | Male | Female |
| Less than 5 Minutes | 0 (0.0%) | 0 (0.0%) |
| 5 to 9 Minutes | 0 (0.0%) | 3 (6.8%) |
| 10 to 14 Minutes | 3 (5.2%) | 5 (11.4%) |
| 15 to 19 Minutes | 10 (17.2%) | 6 (13.6%) |
| 20 to 24 Minutes | 8 (13.8%) | 7 (15.9%) |
| 25 to 29 Minutes | 6 (10.3%) | 3 (6.8%) |
| 30 to 34 Minutes | 12 (20.7%) | 11 (25.0%) |
| 35 to 39 Minutes | 0 (0.0%) | 7 (15.9%) |
| 40 to 44 Minutes | 2 (3.5%) | 0 (0.0%) |
| 45 to 59 Minutes | 11 (19.0%) | 0 (0.0%) |
| 60 to 89 Minutes | 0 (0.0%) | 2 (4.5%) |
| 90 or more Minutes | 6 (10.3%) | 0 (0.0%) |
Time of Departure to Work by Sex in Taylorsville
The most frequent times of departure to work in Taylorsville are 6:00 AM to 6:29 AM (9, 15.5%) for males and 7:00 AM to 7:29 AM (11, 25.0%) for females.
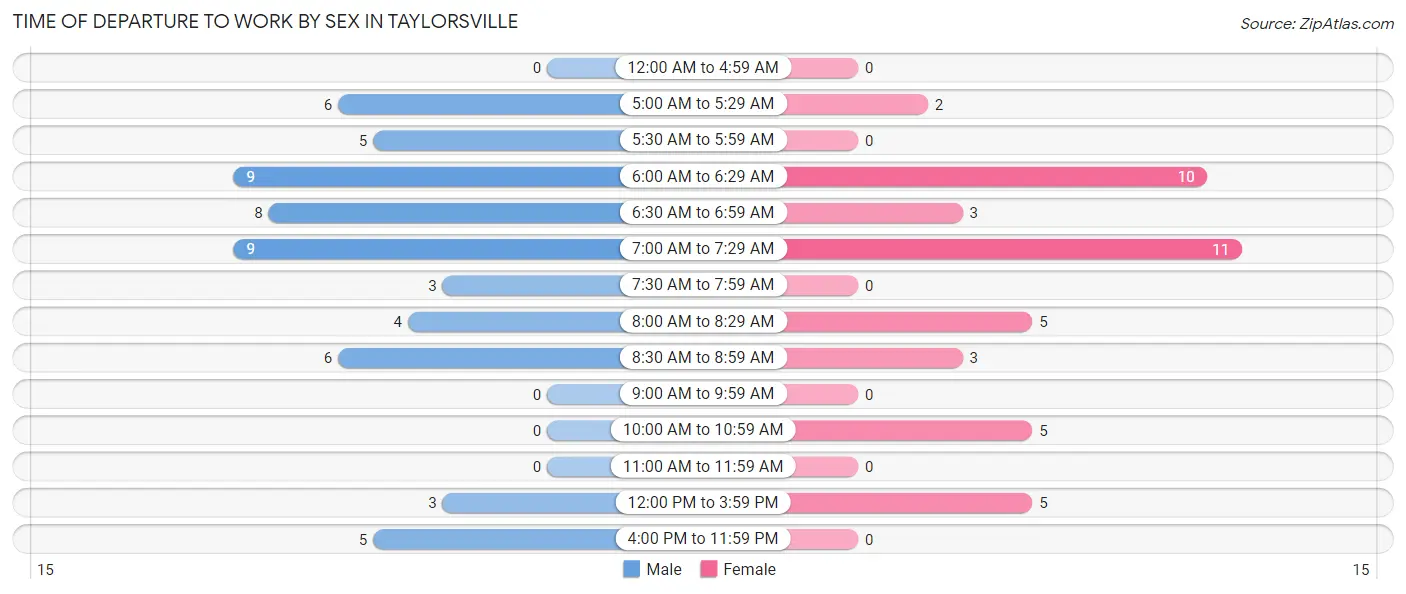
| Time of Departure | Male | Female |
| 12:00 AM to 4:59 AM | 0 (0.0%) | 0 (0.0%) |
| 5:00 AM to 5:29 AM | 6 (10.3%) | 2 (4.5%) |
| 5:30 AM to 5:59 AM | 5 (8.6%) | 0 (0.0%) |
| 6:00 AM to 6:29 AM | 9 (15.5%) | 10 (22.7%) |
| 6:30 AM to 6:59 AM | 8 (13.8%) | 3 (6.8%) |
| 7:00 AM to 7:29 AM | 9 (15.5%) | 11 (25.0%) |
| 7:30 AM to 7:59 AM | 3 (5.2%) | 0 (0.0%) |
| 8:00 AM to 8:29 AM | 4 (6.9%) | 5 (11.4%) |
| 8:30 AM to 8:59 AM | 6 (10.3%) | 3 (6.8%) |
| 9:00 AM to 9:59 AM | 0 (0.0%) | 0 (0.0%) |
| 10:00 AM to 10:59 AM | 0 (0.0%) | 5 (11.4%) |
| 11:00 AM to 11:59 AM | 0 (0.0%) | 0 (0.0%) |
| 12:00 PM to 3:59 PM | 3 (5.2%) | 5 (11.4%) |
| 4:00 PM to 11:59 PM | 5 (8.6%) | 0 (0.0%) |
| Total | 58 (100.0%) | 44 (100.0%) |
Housing Occupancy in Taylorsville
Occupancy by Ownership in Taylorsville
Of the total 165 dwellings in Taylorsville, owner-occupied units account for 115 (69.7%), while renter-occupied units make up 50 (30.3%).
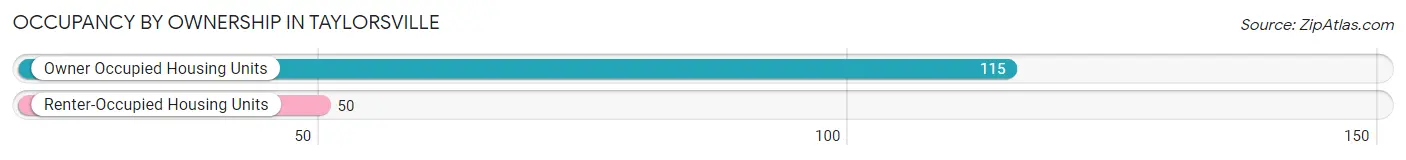
| Occupancy | # Housing Units | % Housing Units |
| Owner Occupied Housing Units | 115 | 69.7% |
| Renter-Occupied Housing Units | 50 | 30.3% |
| Total Occupied Housing Units | 165 | 100.0% |
Occupancy by Household Size in Taylorsville
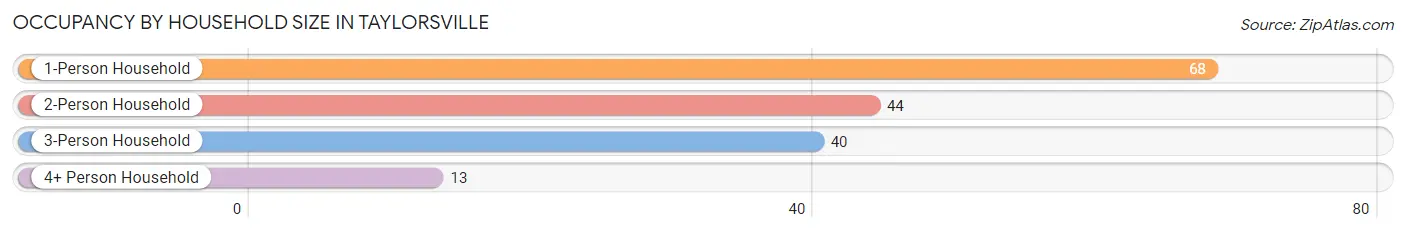
| Household Size | # Housing Units | % Housing Units |
| 1-Person Household | 68 | 41.2% |
| 2-Person Household | 44 | 26.7% |
| 3-Person Household | 40 | 24.2% |
| 4+ Person Household | 13 | 7.9% |
| Total Housing Units | 165 | 100.0% |
Occupancy by Ownership by Household Size in Taylorsville
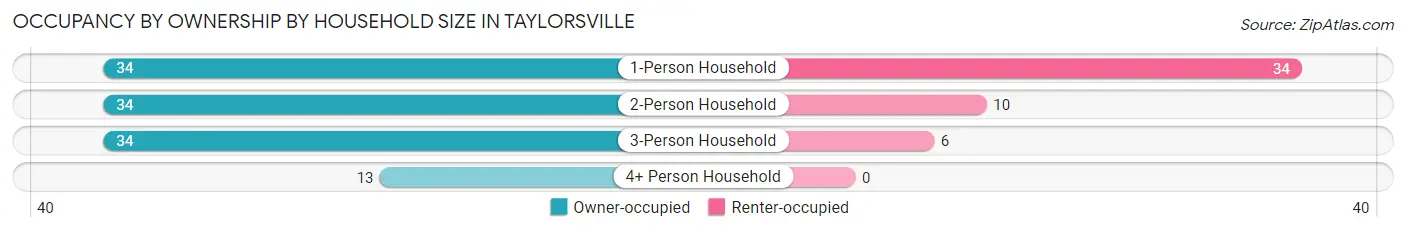
| Household Size | Owner-occupied | Renter-occupied |
| 1-Person Household | 34 (50.0%) | 34 (50.0%) |
| 2-Person Household | 34 (77.3%) | 10 (22.7%) |
| 3-Person Household | 34 (85.0%) | 6 (15.0%) |
| 4+ Person Household | 13 (100.0%) | 0 (0.0%) |
| Total Housing Units | 115 (69.7%) | 50 (30.3%) |
Occupancy by Educational Attainment in Taylorsville
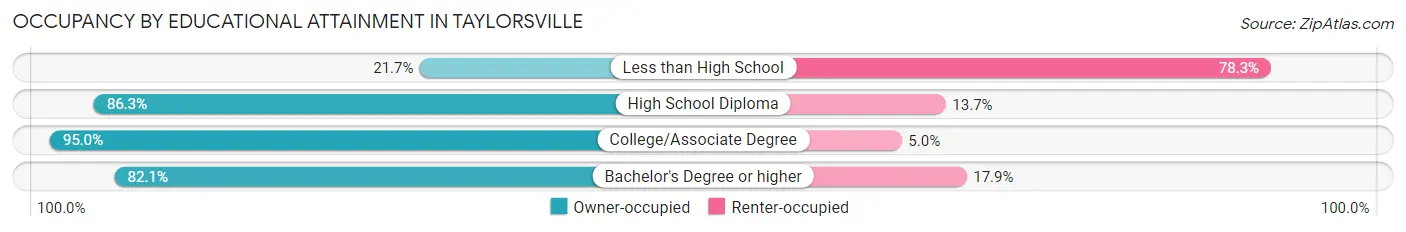
| Household Size | Owner-occupied | Renter-occupied |
| Less than High School | 10 (21.7%) | 36 (78.3%) |
| High School Diploma | 44 (86.3%) | 7 (13.7%) |
| College/Associate Degree | 38 (95.0%) | 2 (5.0%) |
| Bachelor's Degree or higher | 23 (82.1%) | 5 (17.9%) |
Occupancy by Age of Householder in Taylorsville
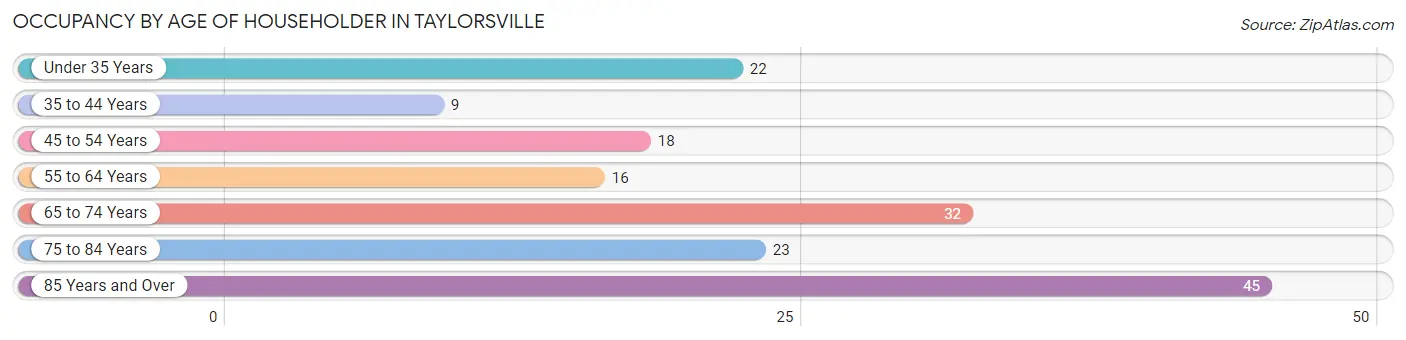
| Age Bracket | # Households | % Households |
| Under 35 Years | 22 | 13.3% |
| 35 to 44 Years | 9 | 5.4% |
| 45 to 54 Years | 18 | 10.9% |
| 55 to 64 Years | 16 | 9.7% |
| 65 to 74 Years | 32 | 19.4% |
| 75 to 84 Years | 23 | 13.9% |
| 85 Years and Over | 45 | 27.3% |
| Total | 165 | 100.0% |
Housing Finances in Taylorsville
Median Income by Occupancy in Taylorsville
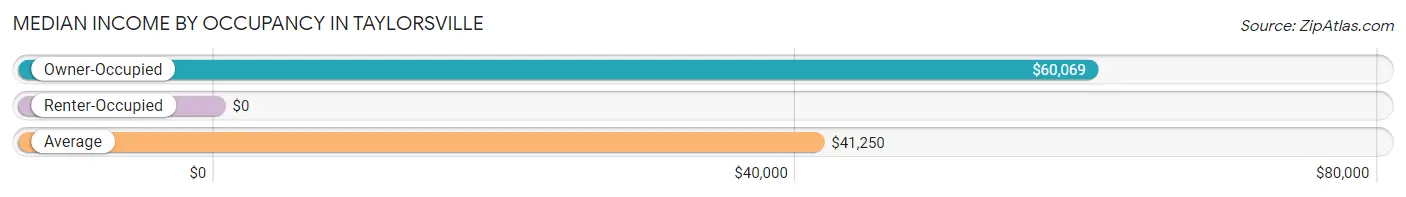
| Occupancy Type | # Households | Median Income |
| Owner-Occupied | 115 (69.7%) | $60,069 |
| Renter-Occupied | 50 (30.3%) | $0 |
| Average | 165 (100.0%) | $41,250 |
Occupancy by Householder Income Bracket in Taylorsville
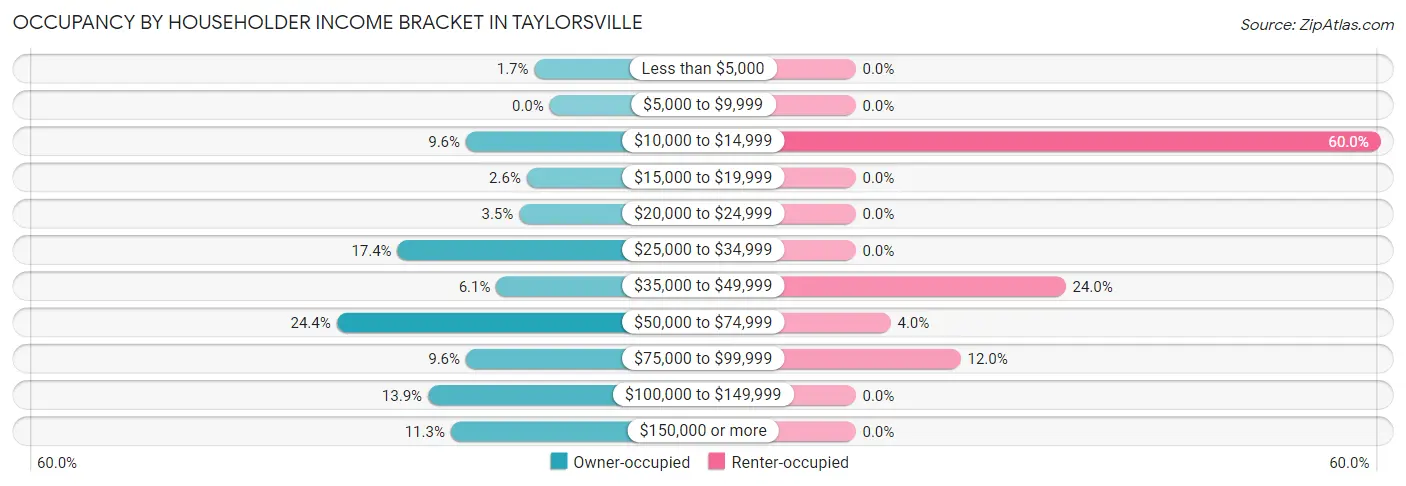
| Income Bracket | Owner-occupied | Renter-occupied |
| Less than $5,000 | 2 (1.7%) | 0 (0.0%) |
| $5,000 to $9,999 | 0 (0.0%) | 0 (0.0%) |
| $10,000 to $14,999 | 11 (9.6%) | 30 (60.0%) |
| $15,000 to $19,999 | 3 (2.6%) | 0 (0.0%) |
| $20,000 to $24,999 | 4 (3.5%) | 0 (0.0%) |
| $25,000 to $34,999 | 20 (17.4%) | 0 (0.0%) |
| $35,000 to $49,999 | 7 (6.1%) | 12 (24.0%) |
| $50,000 to $74,999 | 28 (24.3%) | 2 (4.0%) |
| $75,000 to $99,999 | 11 (9.6%) | 6 (12.0%) |
| $100,000 to $149,999 | 16 (13.9%) | 0 (0.0%) |
| $150,000 or more | 13 (11.3%) | 0 (0.0%) |
| Total | 115 (100.0%) | 50 (100.0%) |
Monthly Housing Cost Tiers in Taylorsville
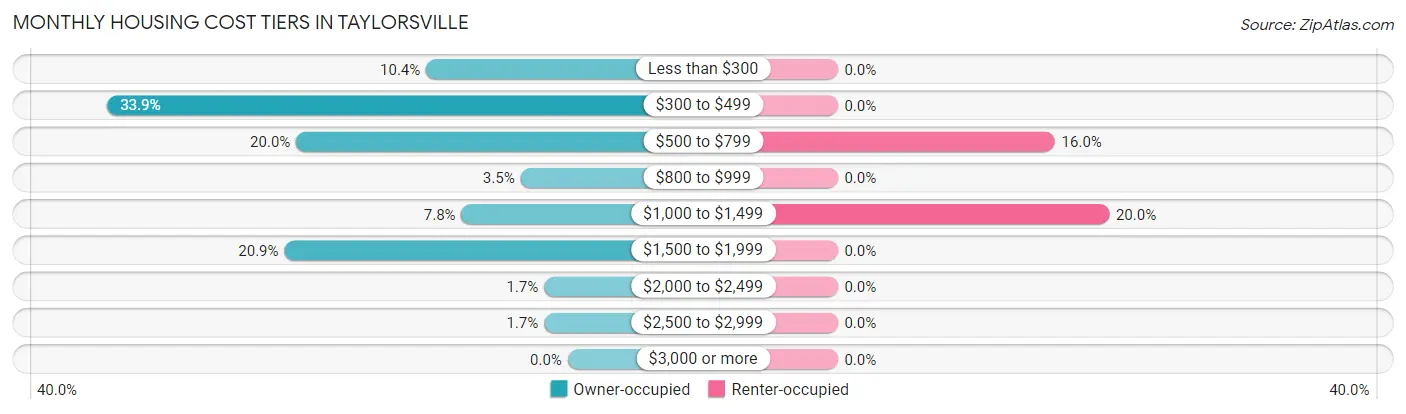
| Monthly Cost | Owner-occupied | Renter-occupied |
| Less than $300 | 12 (10.4%) | 0 (0.0%) |
| $300 to $499 | 39 (33.9%) | 0 (0.0%) |
| $500 to $799 | 23 (20.0%) | 8 (16.0%) |
| $800 to $999 | 4 (3.5%) | 0 (0.0%) |
| $1,000 to $1,499 | 9 (7.8%) | 10 (20.0%) |
| $1,500 to $1,999 | 24 (20.9%) | 0 (0.0%) |
| $2,000 to $2,499 | 2 (1.7%) | 0 (0.0%) |
| $2,500 to $2,999 | 2 (1.7%) | 0 (0.0%) |
| $3,000 or more | 0 (0.0%) | 0 (0.0%) |
| Total | 115 (100.0%) | 50 (100.0%) |
Physical Housing Characteristics in Taylorsville
Housing Structures in Taylorsville
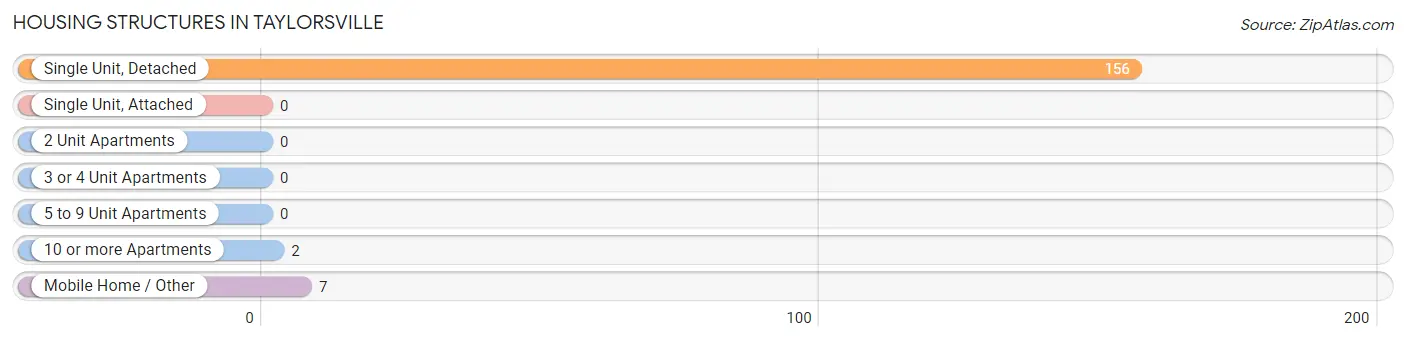
| Structure Type | # Housing Units | % Housing Units |
| Single Unit, Detached | 156 | 94.6% |
| Single Unit, Attached | 0 | 0.0% |
| 2 Unit Apartments | 0 | 0.0% |
| 3 or 4 Unit Apartments | 0 | 0.0% |
| 5 to 9 Unit Apartments | 0 | 0.0% |
| 10 or more Apartments | 2 | 1.2% |
| Mobile Home / Other | 7 | 4.2% |
| Total | 165 | 100.0% |
Housing Structures by Occupancy in Taylorsville
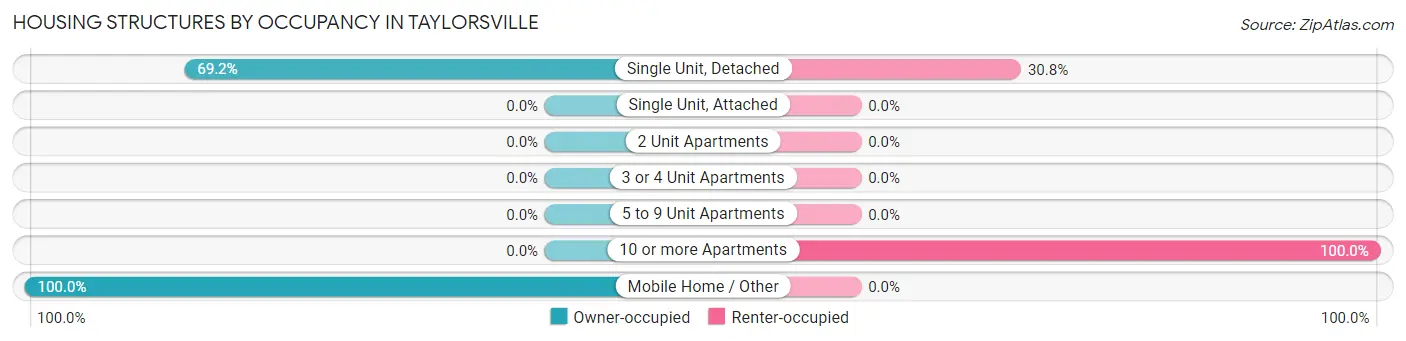
| Structure Type | Owner-occupied | Renter-occupied |
| Single Unit, Detached | 108 (69.2%) | 48 (30.8%) |
| Single Unit, Attached | 0 (0.0%) | 0 (0.0%) |
| 2 Unit Apartments | 0 (0.0%) | 0 (0.0%) |
| 3 or 4 Unit Apartments | 0 (0.0%) | 0 (0.0%) |
| 5 to 9 Unit Apartments | 0 (0.0%) | 0 (0.0%) |
| 10 or more Apartments | 0 (0.0%) | 2 (100.0%) |
| Mobile Home / Other | 7 (100.0%) | 0 (0.0%) |
| Total | 115 (69.7%) | 50 (30.3%) |
Housing Structures by Number of Rooms in Taylorsville
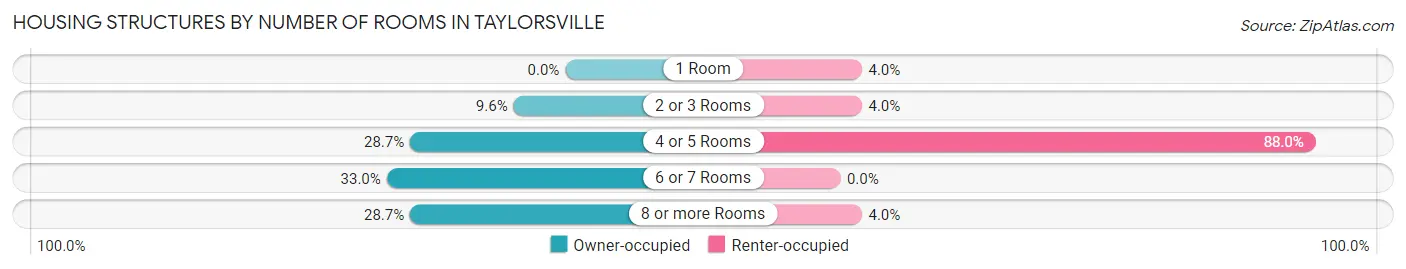
| Number of Rooms | Owner-occupied | Renter-occupied |
| 1 Room | 0 (0.0%) | 2 (4.0%) |
| 2 or 3 Rooms | 11 (9.6%) | 2 (4.0%) |
| 4 or 5 Rooms | 33 (28.7%) | 44 (88.0%) |
| 6 or 7 Rooms | 38 (33.0%) | 0 (0.0%) |
| 8 or more Rooms | 33 (28.7%) | 2 (4.0%) |
| Total | 115 (100.0%) | 50 (100.0%) |
Housing Structure by Heating Type in Taylorsville
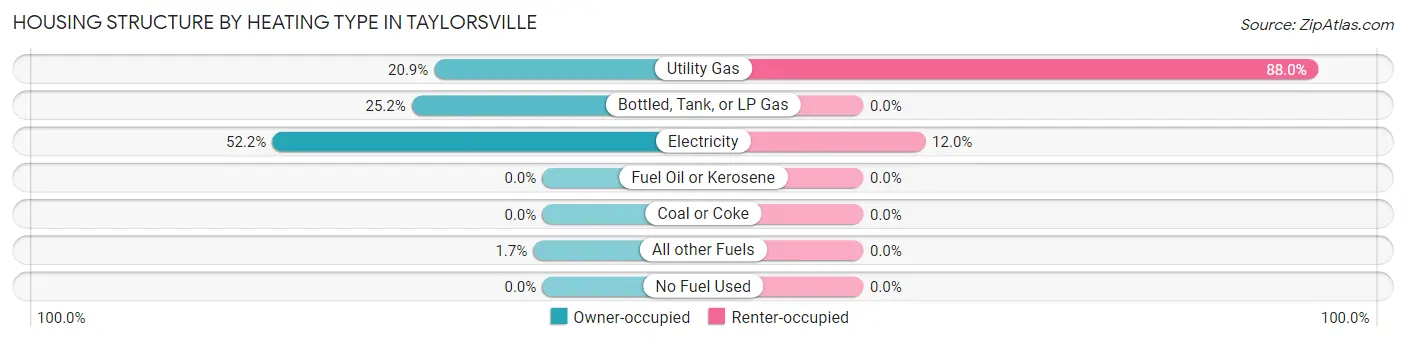
| Heating Type | Owner-occupied | Renter-occupied |
| Utility Gas | 24 (20.9%) | 44 (88.0%) |
| Bottled, Tank, or LP Gas | 29 (25.2%) | 0 (0.0%) |
| Electricity | 60 (52.2%) | 6 (12.0%) |
| Fuel Oil or Kerosene | 0 (0.0%) | 0 (0.0%) |
| Coal or Coke | 0 (0.0%) | 0 (0.0%) |
| All other Fuels | 2 (1.7%) | 0 (0.0%) |
| No Fuel Used | 0 (0.0%) | 0 (0.0%) |
| Total | 115 (100.0%) | 50 (100.0%) |
Household Vehicle Usage in Taylorsville
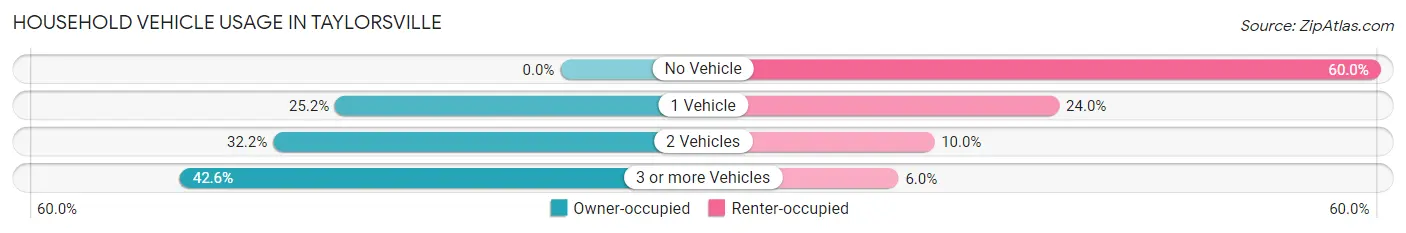
| Vehicles per Household | Owner-occupied | Renter-occupied |
| No Vehicle | 0 (0.0%) | 30 (60.0%) |
| 1 Vehicle | 29 (25.2%) | 12 (24.0%) |
| 2 Vehicles | 37 (32.2%) | 5 (10.0%) |
| 3 or more Vehicles | 49 (42.6%) | 3 (6.0%) |
| Total | 115 (100.0%) | 50 (100.0%) |
Real Estate & Mortgages in Taylorsville
Real Estate and Mortgage Overview in Taylorsville
| Characteristic | Without Mortgage | With Mortgage |
| Housing Units | 74 | 41 |
| Median Property Value | $170,800 | $244,600 |
| Median Household Income | $58,889 | $7 |
| Monthly Housing Costs | $452 | $0 |
| Real Estate Taxes | $800 | $0 |
Property Value by Mortgage Status in Taylorsville
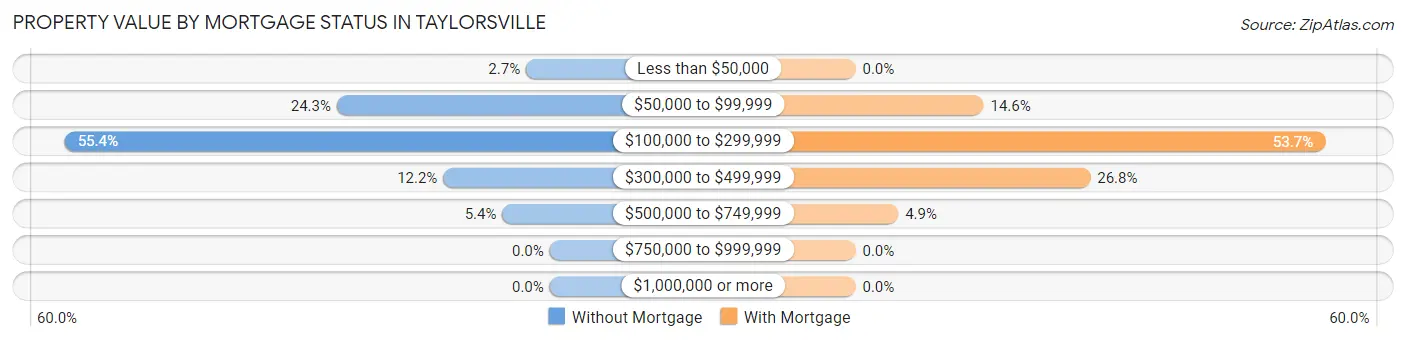
| Property Value | Without Mortgage | With Mortgage |
| Less than $50,000 | 2 (2.7%) | 0 (0.0%) |
| $50,000 to $99,999 | 18 (24.3%) | 6 (14.6%) |
| $100,000 to $299,999 | 41 (55.4%) | 22 (53.7%) |
| $300,000 to $499,999 | 9 (12.2%) | 11 (26.8%) |
| $500,000 to $749,999 | 4 (5.4%) | 2 (4.9%) |
| $750,000 to $999,999 | 0 (0.0%) | 0 (0.0%) |
| $1,000,000 or more | 0 (0.0%) | 0 (0.0%) |
| Total | 74 (100.0%) | 41 (100.0%) |
Household Income by Mortgage Status in Taylorsville
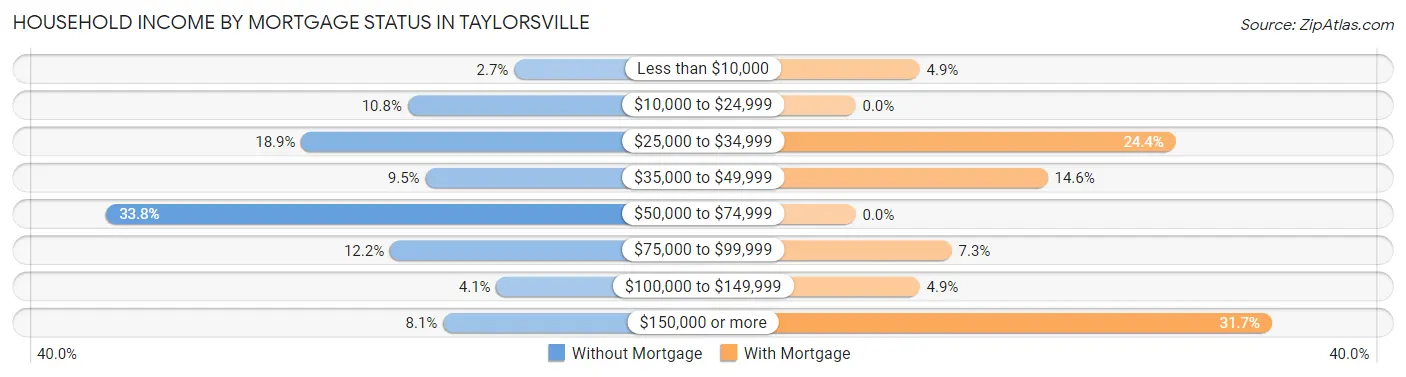
| Household Income | Without Mortgage | With Mortgage |
| Less than $10,000 | 2 (2.7%) | 2 (4.9%) |
| $10,000 to $24,999 | 8 (10.8%) | 0 (0.0%) |
| $25,000 to $34,999 | 14 (18.9%) | 10 (24.4%) |
| $35,000 to $49,999 | 7 (9.5%) | 6 (14.6%) |
| $50,000 to $74,999 | 25 (33.8%) | 0 (0.0%) |
| $75,000 to $99,999 | 9 (12.2%) | 3 (7.3%) |
| $100,000 to $149,999 | 3 (4.1%) | 2 (4.9%) |
| $150,000 or more | 6 (8.1%) | 13 (31.7%) |
| Total | 74 (100.0%) | 41 (100.0%) |
Property Value to Household Income Ratio in Taylorsville
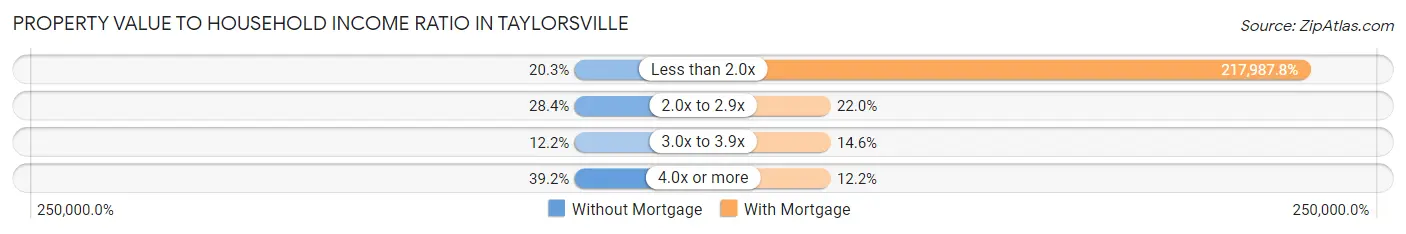
| Value-to-Income Ratio | Without Mortgage | With Mortgage |
| Less than 2.0x | 15 (20.3%) | 89,375 (217,987.8%) |
| 2.0x to 2.9x | 21 (28.4%) | 9 (22.0%) |
| 3.0x to 3.9x | 9 (12.2%) | 6 (14.6%) |
| 4.0x or more | 29 (39.2%) | 5 (12.2%) |
| Total | 74 (100.0%) | 41 (100.0%) |
Real Estate Taxes by Mortgage Status in Taylorsville
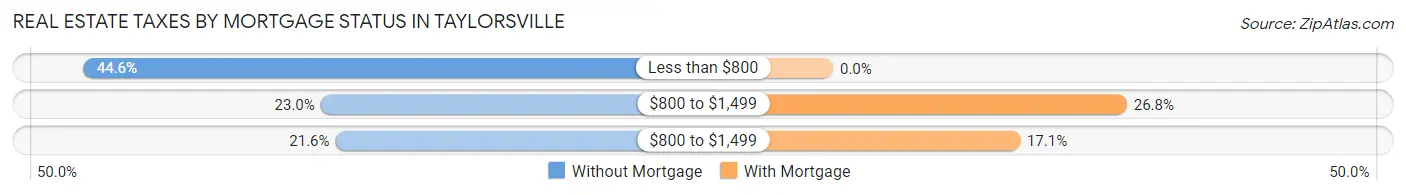
| Property Taxes | Without Mortgage | With Mortgage |
| Less than $800 | 33 (44.6%) | 0 (0.0%) |
| $800 to $1,499 | 17 (23.0%) | 11 (26.8%) |
| $800 to $1,499 | 16 (21.6%) | 7 (17.1%) |
| Total | 74 (100.0%) | 41 (100.0%) |
Health & Disability in Taylorsville
Health Insurance Coverage by Age in Taylorsville
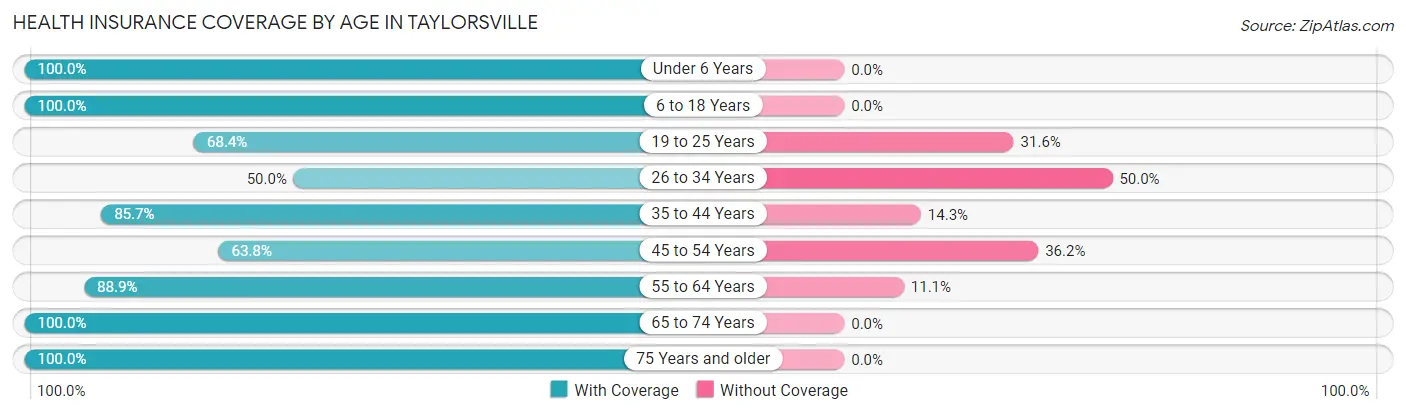
| Age Bracket | With Coverage | Without Coverage |
| Under 6 Years | 9 (100.0%) | 0 (0.0%) |
| 6 to 18 Years | 39 (100.0%) | 0 (0.0%) |
| 19 to 25 Years | 13 (68.4%) | 6 (31.6%) |
| 26 to 34 Years | 20 (50.0%) | 20 (50.0%) |
| 35 to 44 Years | 12 (85.7%) | 2 (14.3%) |
| 45 to 54 Years | 30 (63.8%) | 17 (36.2%) |
| 55 to 64 Years | 48 (88.9%) | 6 (11.1%) |
| 65 to 74 Years | 57 (100.0%) | 0 (0.0%) |
| 75 Years and older | 76 (100.0%) | 0 (0.0%) |
| Total | 304 (85.6%) | 51 (14.4%) |
Health Insurance Coverage by Citizenship Status in Taylorsville
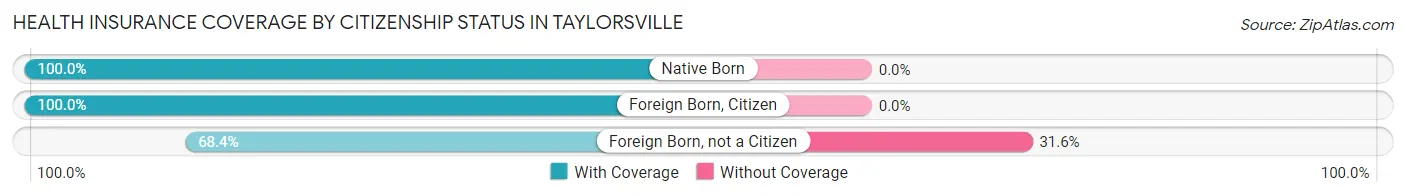
| Citizenship Status | With Coverage | Without Coverage |
| Native Born | 9 (100.0%) | 0 (0.0%) |
| Foreign Born, Citizen | 39 (100.0%) | 0 (0.0%) |
| Foreign Born, not a Citizen | 13 (68.4%) | 6 (31.6%) |
Health Insurance Coverage by Household Income in Taylorsville
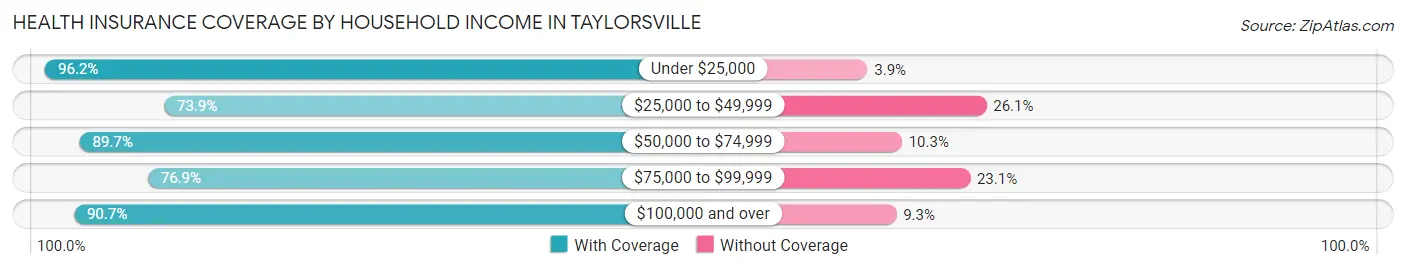
| Household Income | With Coverage | Without Coverage |
| Under $25,000 | 50 (96.2%) | 2 (3.8%) |
| $25,000 to $49,999 | 65 (73.9%) | 23 (26.1%) |
| $50,000 to $74,999 | 61 (89.7%) | 7 (10.3%) |
| $75,000 to $99,999 | 30 (76.9%) | 9 (23.1%) |
| $100,000 and over | 98 (90.7%) | 10 (9.3%) |
Public vs Private Health Insurance Coverage by Age in Taylorsville
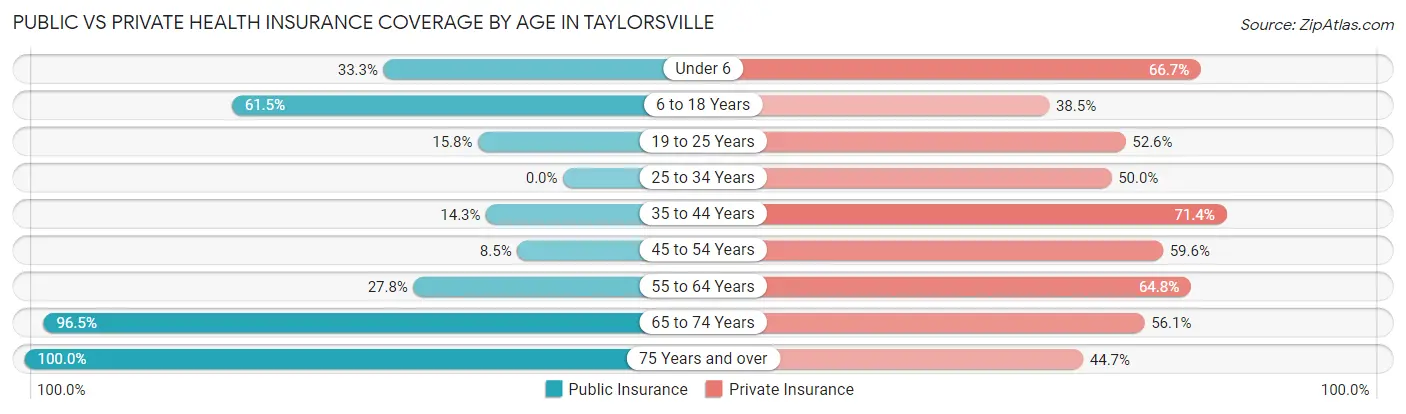
| Age Bracket | Public Insurance | Private Insurance |
| Under 6 | 3 (33.3%) | 6 (66.7%) |
| 6 to 18 Years | 24 (61.5%) | 15 (38.5%) |
| 19 to 25 Years | 3 (15.8%) | 10 (52.6%) |
| 25 to 34 Years | 0 (0.0%) | 20 (50.0%) |
| 35 to 44 Years | 2 (14.3%) | 10 (71.4%) |
| 45 to 54 Years | 4 (8.5%) | 28 (59.6%) |
| 55 to 64 Years | 15 (27.8%) | 35 (64.8%) |
| 65 to 74 Years | 55 (96.5%) | 32 (56.1%) |
| 75 Years and over | 76 (100.0%) | 34 (44.7%) |
| Total | 182 (51.3%) | 190 (53.5%) |
Disability Status by Sex by Age in Taylorsville
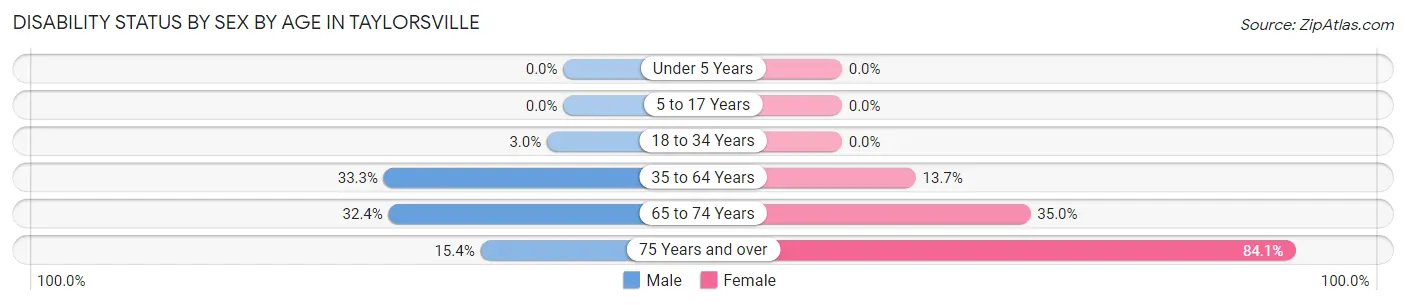
| Age Bracket | Male | Female |
| Under 5 Years | 0 (0.0%) | 0 (0.0%) |
| 5 to 17 Years | 0 (0.0%) | 0 (0.0%) |
| 18 to 34 Years | 1 (3.0%) | 0 (0.0%) |
| 35 to 64 Years | 14 (33.3%) | 10 (13.7%) |
| 65 to 74 Years | 12 (32.4%) | 7 (35.0%) |
| 75 Years and over | 2 (15.4%) | 53 (84.1%) |
Disability Class by Sex by Age in Taylorsville
Disability Class: Hearing Difficulty
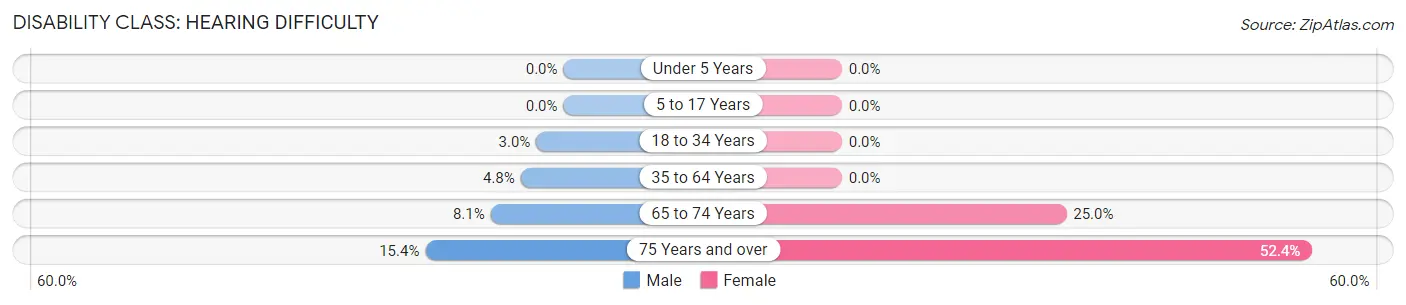
| Age Bracket | Male | Female |
| Under 5 Years | 0 (0.0%) | 0 (0.0%) |
| 5 to 17 Years | 0 (0.0%) | 0 (0.0%) |
| 18 to 34 Years | 1 (3.0%) | 0 (0.0%) |
| 35 to 64 Years | 2 (4.8%) | 0 (0.0%) |
| 65 to 74 Years | 3 (8.1%) | 5 (25.0%) |
| 75 Years and over | 2 (15.4%) | 33 (52.4%) |
Disability Class: Vision Difficulty
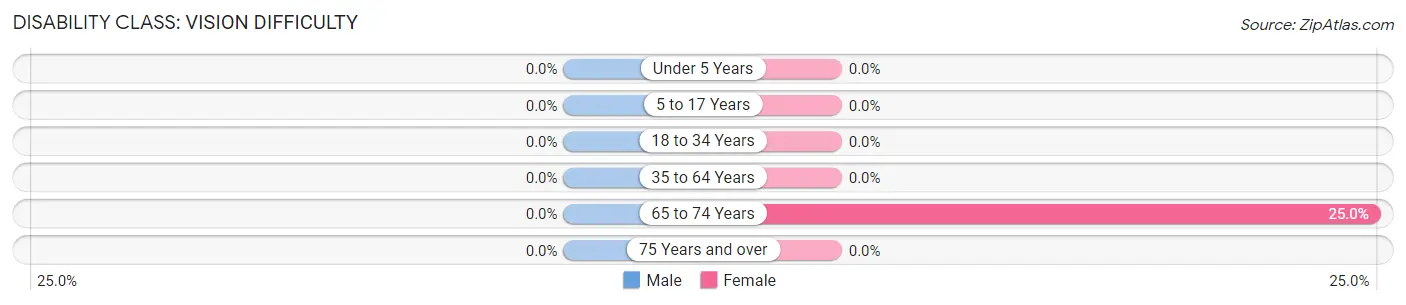
| Age Bracket | Male | Female |
| Under 5 Years | 0 (0.0%) | 0 (0.0%) |
| 5 to 17 Years | 0 (0.0%) | 0 (0.0%) |
| 18 to 34 Years | 0 (0.0%) | 0 (0.0%) |
| 35 to 64 Years | 0 (0.0%) | 0 (0.0%) |
| 65 to 74 Years | 0 (0.0%) | 5 (25.0%) |
| 75 Years and over | 0 (0.0%) | 0 (0.0%) |
Disability Class: Cognitive Difficulty
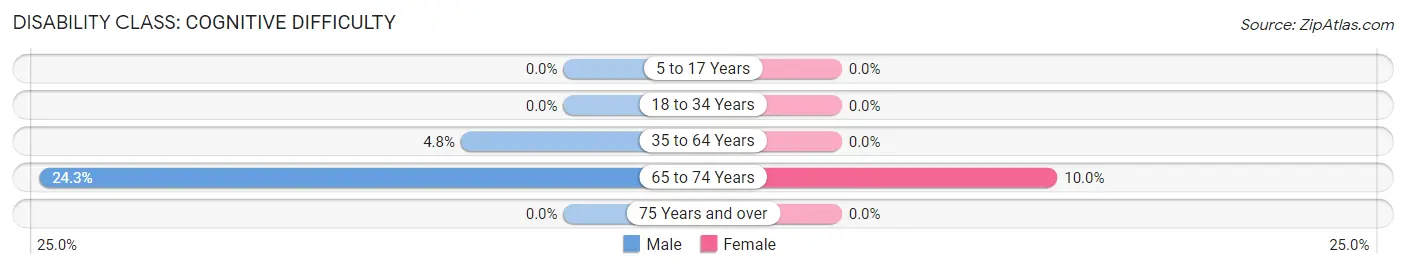
| Age Bracket | Male | Female |
| 5 to 17 Years | 0 (0.0%) | 0 (0.0%) |
| 18 to 34 Years | 0 (0.0%) | 0 (0.0%) |
| 35 to 64 Years | 2 (4.8%) | 0 (0.0%) |
| 65 to 74 Years | 9 (24.3%) | 2 (10.0%) |
| 75 Years and over | 0 (0.0%) | 0 (0.0%) |
Disability Class: Ambulatory Difficulty
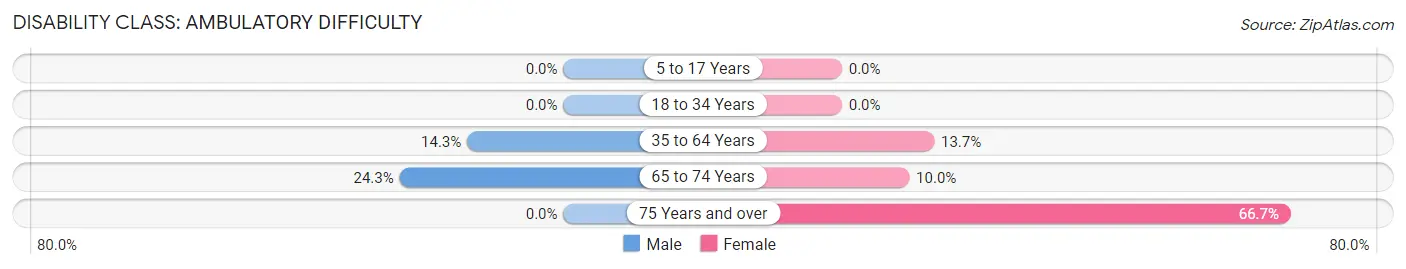
| Age Bracket | Male | Female |
| 5 to 17 Years | 0 (0.0%) | 0 (0.0%) |
| 18 to 34 Years | 0 (0.0%) | 0 (0.0%) |
| 35 to 64 Years | 6 (14.3%) | 10 (13.7%) |
| 65 to 74 Years | 9 (24.3%) | 2 (10.0%) |
| 75 Years and over | 0 (0.0%) | 42 (66.7%) |
Disability Class: Self-Care Difficulty
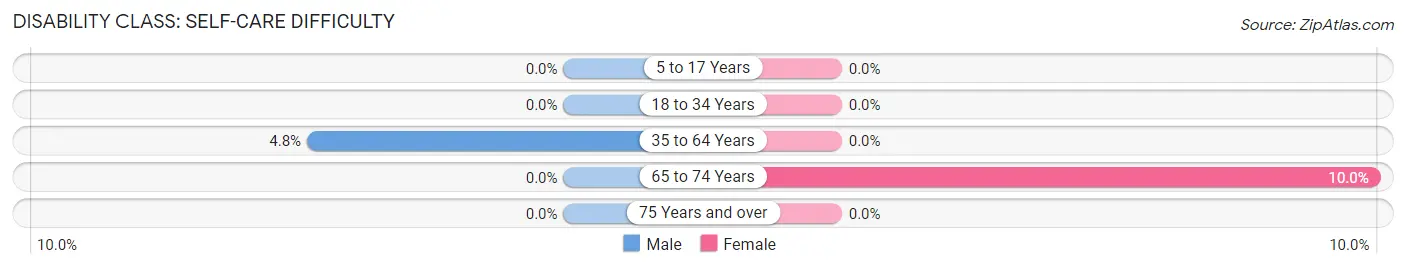
| Age Bracket | Male | Female |
| 5 to 17 Years | 0 (0.0%) | 0 (0.0%) |
| 18 to 34 Years | 0 (0.0%) | 0 (0.0%) |
| 35 to 64 Years | 2 (4.8%) | 0 (0.0%) |
| 65 to 74 Years | 0 (0.0%) | 2 (10.0%) |
| 75 Years and over | 0 (0.0%) | 0 (0.0%) |
Technology Access in Taylorsville
Computing Device Access in Taylorsville
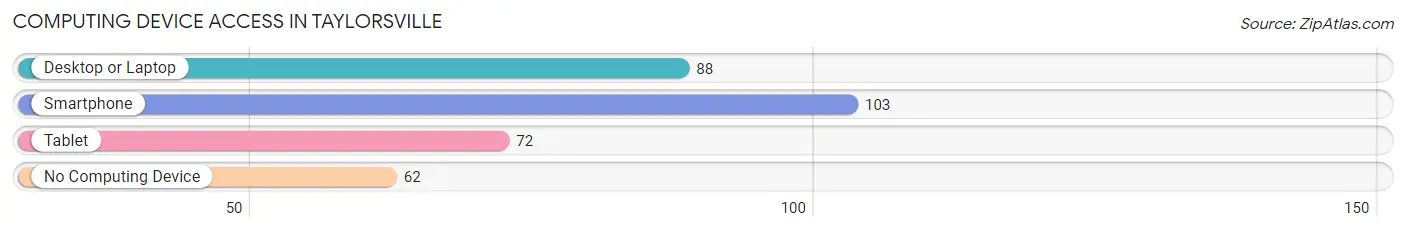
| Device Type | # Households | % Households |
| Desktop or Laptop | 88 | 53.3% |
| Smartphone | 103 | 62.4% |
| Tablet | 72 | 43.6% |
| No Computing Device | 62 | 37.6% |
| Total | 165 | 100.0% |
Internet Access in Taylorsville
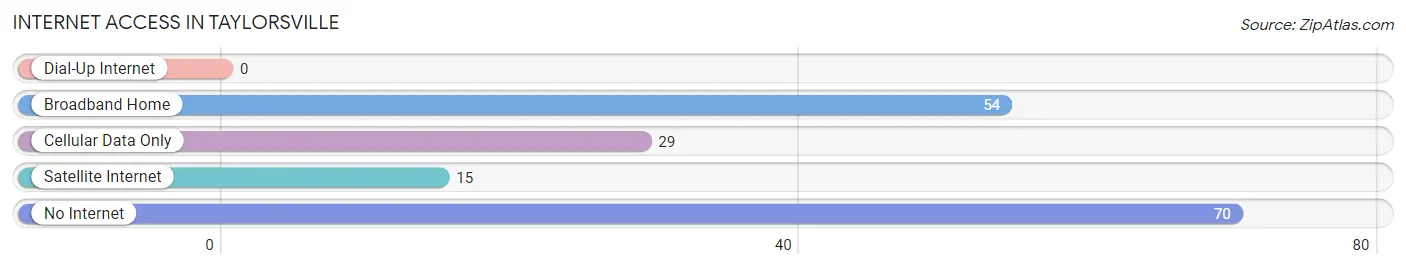
| Internet Type | # Households | % Households |
| Dial-Up Internet | 0 | 0.0% |
| Broadband Home | 54 | 32.7% |
| Cellular Data Only | 29 | 17.6% |
| Satellite Internet | 15 | 9.1% |
| No Internet | 70 | 42.4% |
| Total | 165 | 100.0% |
Taylorsville Summary
Taylorsville is a small town located in the state of Georgia, United States. It is situated in the foothills of the Appalachian Mountains, in the northwest corner of the state. The town is located in Bartow County, and is part of the Cartersville-Bartow Metropolitan Statistical Area. The population of Taylorsville was estimated to be 1,845 in 2019.
History
Taylorsville was founded in 1832 by William Taylor, a Revolutionary War veteran. The town was named after him, and was originally known as Taylor’s Crossroads. The town was incorporated in 1854, and the first post office was established in 1855.
Taylorsville was a small farming community until the late 19th century, when the railroad arrived. This brought new industry and economic growth to the area, and the town began to grow. The town was also home to several cotton mills, which provided employment for many of the town’s residents.
In the early 20th century, Taylorsville was a popular tourist destination, due to its proximity to the Appalachian Mountains. The town was also home to several resorts, which attracted visitors from all over the country.
Geography
Taylorsville is located in the foothills of the Appalachian Mountains, in the northwest corner of Georgia. The town is situated in Bartow County, and is part of the Cartersville-Bartow Metropolitan Statistical Area. The town is located at an elevation of 845 feet above sea level.
The town is located near several major highways, including Interstate 75, US Highway 41, and Georgia State Route 140. The nearest major cities are Atlanta (90 miles to the south), Chattanooga (90 miles to the north), and Birmingham (150 miles to the west).
Economy
Taylorsville’s economy is largely based on agriculture and tourism. The town is home to several farms, which produce a variety of crops, including corn, soybeans, and cotton. The town is also home to several tourist attractions, including the Taylorsville Lake State Park, which offers camping, fishing, and boating.
The town is also home to several small businesses, including restaurants, retail stores, and service providers. The town is also home to several manufacturing companies, which produce a variety of products, including furniture, textiles, and automotive parts.
Demographics
Taylorsville’s population was estimated to be 1,845 in 2019. The town has a diverse population, with people of various racial and ethnic backgrounds. The town’s population is predominantly white (83.3%), followed by African American (10.2%), Hispanic (3.2%), and Asian (2.2%).
The median household income in Taylorsville is $41,944, and the median home value is $128,400. The town has a poverty rate of 16.2%, and the unemployment rate is 4.2%. The town’s population is well-educated, with 92.2% of the population having at least a high school diploma, and 28.2% having a bachelor’s degree or higher.
Common Questions
What is Per Capita Income in Taylorsville?
Per Capita income in Taylorsville is $27,119.
What is the Median Family Income in Taylorsville?
Median Family Income in Taylorsville is $61,406.
What is the Median Household income in Taylorsville?
Median Household Income in Taylorsville is $41,250.
What is Income or Wage Gap in Taylorsville?
Income or Wage Gap in Taylorsville is 39.8%.
Women in Taylorsville earn 60.2 cents for every dollar earned by a man.
What is Inequality or Gini Index in Taylorsville?
Inequality or Gini Index in Taylorsville is 0.45.
What is the Total Population of Taylorsville?
Total Population of Taylorsville is 355.
What is the Total Male Population of Taylorsville?
Total Male Population of Taylorsville is 154.
What is the Total Female Population of Taylorsville?
Total Female Population of Taylorsville is 201.
What is the Ratio of Males per 100 Females in Taylorsville?
There are 76.62 Males per 100 Females in Taylorsville.
What is the Ratio of Females per 100 Males in Taylorsville?
There are 130.52 Females per 100 Males in Taylorsville.
What is the Median Population Age in Taylorsville?
Median Population Age in Taylorsville is 56.7 Years.
What is the Average Family Size in Taylorsville
Average Family Size in Taylorsville is 3.0 People.
What is the Average Household Size in Taylorsville
Average Household Size in Taylorsville is 2.1 People.
How Large is the Labor Force in Taylorsville?
There are 119 People in the Labor Forcein in Taylorsville.
What is the Percentage of People in the Labor Force in Taylorsville?
37.9% of People are in the Labor Force in Taylorsville.
What is the Unemployment Rate in Taylorsville?
Unemployment Rate in Taylorsville is 0.8%.