Sylvania, GA Map & Demographics
Sylvania Map
Sylvania Overview
$23,998
PER CAPITA INCOME
$68,679
AVG FAMILY INCOME
$36,682
AVG HOUSEHOLD INCOME
40.1%
WAGE / INCOME GAP [ % ]
59.9¢/ $1
WAGE / INCOME GAP [ $ ]
0.46
INEQUALITY / GINI INDEX
2,618
TOTAL POPULATION
1,193
MALE POPULATION
1,425
FEMALE POPULATION
83.72
MALES / 100 FEMALES
119.45
FEMALES / 100 MALES
43.7
MEDIAN AGE
3.8
AVG FAMILY SIZE
2.6
AVG HOUSEHOLD SIZE
1,062
LABOR FORCE [ PEOPLE ]
52.2%
PERCENT IN LABOR FORCE
1.1%
UNEMPLOYMENT RATE
Sylvania Zip Codes
Sylvania Area Codes
Income in Sylvania
Income Overview in Sylvania
Per Capita Income in Sylvania is $23,998, while median incomes of families and households are $68,679 and $36,682 respectively.
| Characteristic | Number | Measure |
| Per Capita Income | 2,618 | $23,998 |
| Median Family Income | 531 | $68,679 |
| Mean Family Income | 531 | $80,293 |
| Median Household Income | 957 | $36,682 |
| Mean Household Income | 957 | $57,481 |
| Income Deficit | 531 | $0 |
| Wage / Income Gap (%) | 2,618 | 40.07% |
| Wage / Income Gap ($) | 2,618 | 59.93¢ per $1 |
| Gini / Inequality Index | 2,618 | 0.46 |
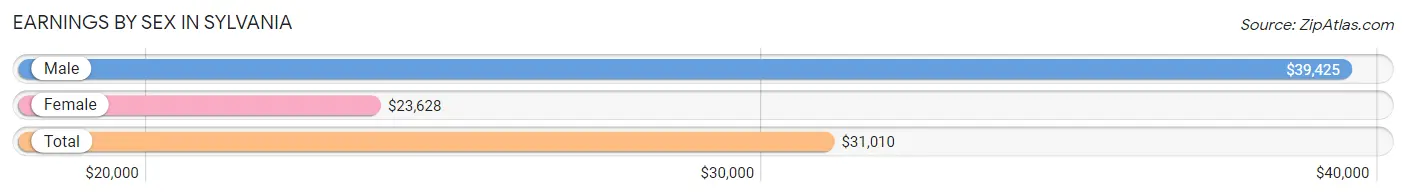
Earnings by Sex in Sylvania
Average Earnings in Sylvania are $31,010, $39,425 for men and $23,628 for women, a difference of 40.1%.
| Sex | Number | Average Earnings |
| Male | 466 (42.5%) | $39,425 |
| Female | 630 (57.5%) | $23,628 |
| Total | 1,096 (100.0%) | $31,010 |
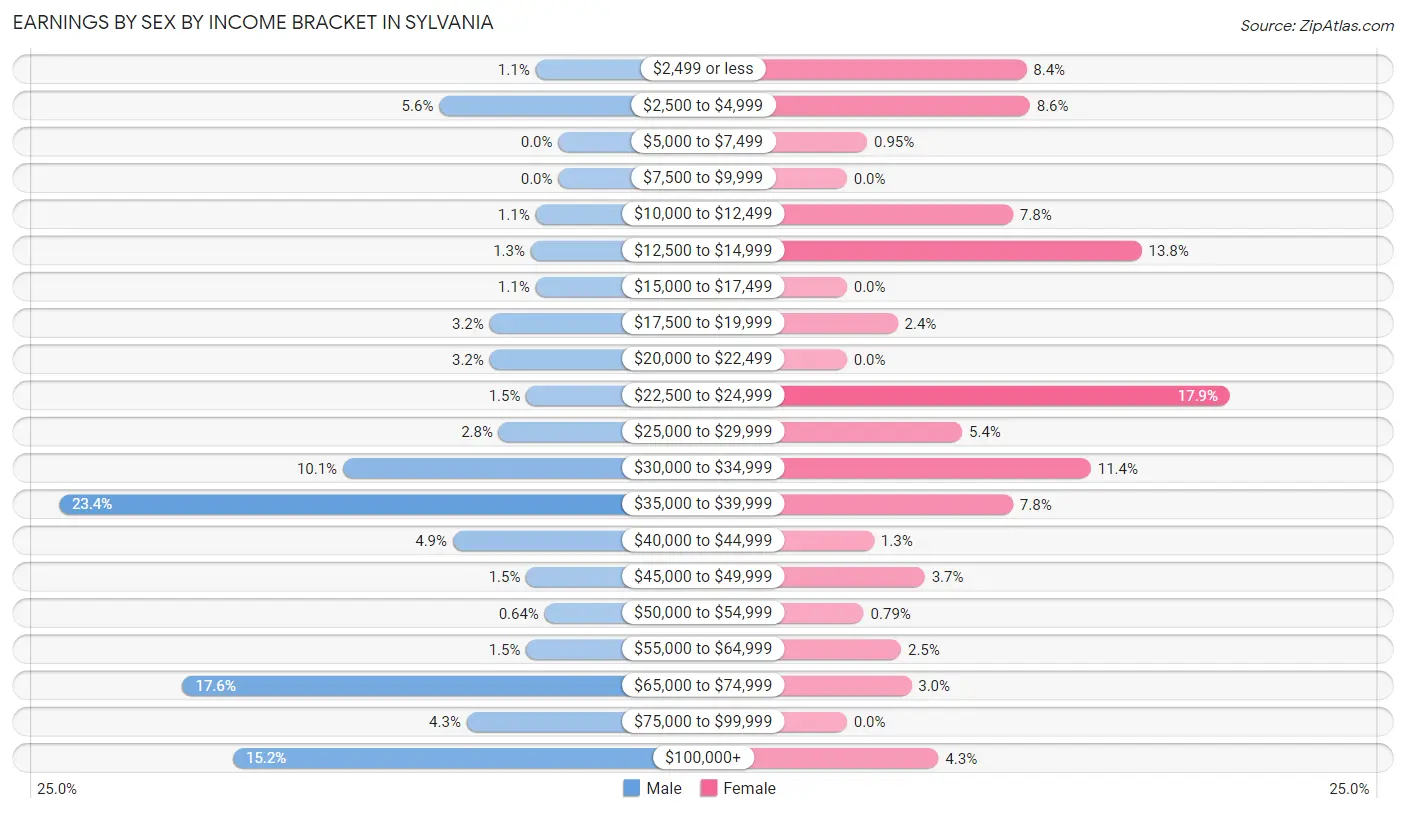
Earnings by Sex by Income Bracket in Sylvania
The most common earnings brackets in Sylvania are $35,000 to $39,999 for men (109 | 23.4%) and $22,500 to $24,999 for women (113 | 17.9%).
| Income | Male | Female |
| $2,499 or less | 5 (1.1%) | 53 (8.4%) |
| $2,500 to $4,999 | 26 (5.6%) | 54 (8.6%) |
| $5,000 to $7,499 | 0 (0.0%) | 6 (0.9%) |
| $7,500 to $9,999 | 0 (0.0%) | 0 (0.0%) |
| $10,000 to $12,499 | 5 (1.1%) | 49 (7.8%) |
| $12,500 to $14,999 | 6 (1.3%) | 87 (13.8%) |
| $15,000 to $17,499 | 5 (1.1%) | 0 (0.0%) |
| $17,500 to $19,999 | 15 (3.2%) | 15 (2.4%) |
| $20,000 to $22,499 | 15 (3.2%) | 0 (0.0%) |
| $22,500 to $24,999 | 7 (1.5%) | 113 (17.9%) |
| $25,000 to $29,999 | 13 (2.8%) | 34 (5.4%) |
| $30,000 to $34,999 | 47 (10.1%) | 72 (11.4%) |
| $35,000 to $39,999 | 109 (23.4%) | 49 (7.8%) |
| $40,000 to $44,999 | 23 (4.9%) | 8 (1.3%) |
| $45,000 to $49,999 | 7 (1.5%) | 23 (3.6%) |
| $50,000 to $54,999 | 3 (0.6%) | 5 (0.8%) |
| $55,000 to $64,999 | 7 (1.5%) | 16 (2.5%) |
| $65,000 to $74,999 | 82 (17.6%) | 19 (3.0%) |
| $75,000 to $99,999 | 20 (4.3%) | 0 (0.0%) |
| $100,000+ | 71 (15.2%) | 27 (4.3%) |
| Total | 466 (100.0%) | 630 (100.0%) |
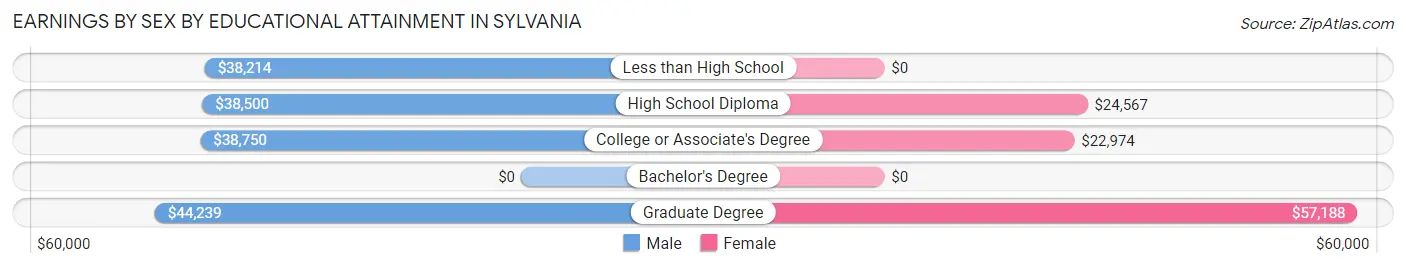
Earnings by Sex by Educational Attainment in Sylvania
Average earnings in Sylvania are $39,540 for men and $23,783 for women, a difference of 39.9%. Men with an educational attainment of graduate degree enjoy the highest average annual earnings of $44,239, while those with less than high school education earn the least with $38,214. Women with an educational attainment of graduate degree earn the most with the average annual earnings of $57,188, while those with college or associate's degree education have the smallest earnings of $22,974.
| Educational Attainment | Male Income | Female Income |
| Less than High School | $38,214 | $0 |
| High School Diploma | $38,500 | $24,567 |
| College or Associate's Degree | $38,750 | $22,974 |
| Bachelor's Degree | - | - |
| Graduate Degree | $44,239 | $57,188 |
| Total | $39,540 | $23,783 |
Family Income in Sylvania
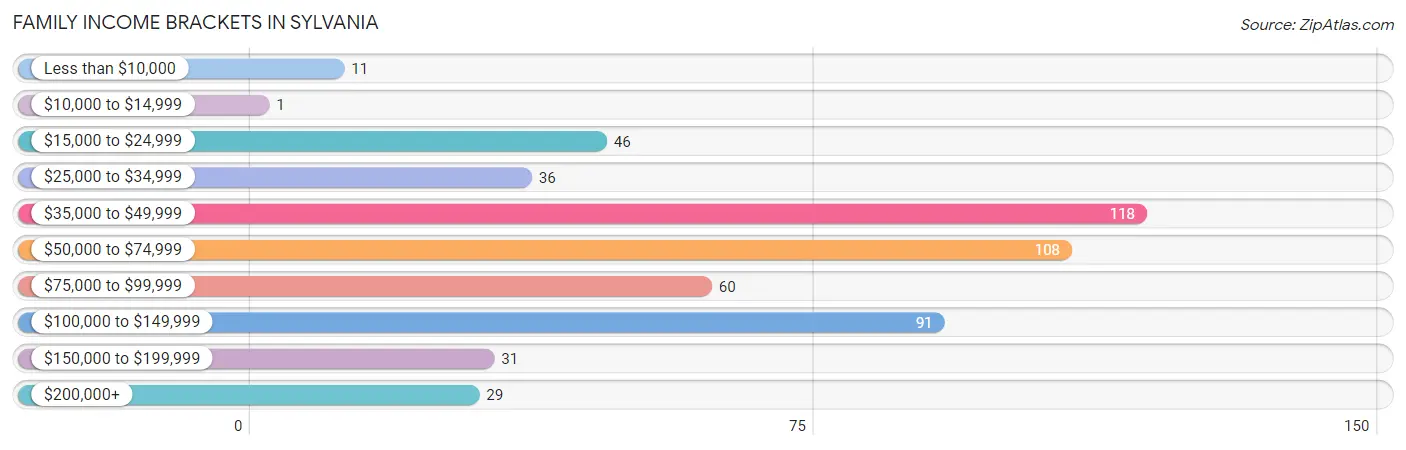
Family Income Brackets in Sylvania
According to the Sylvania family income data, there are 118 families falling into the $35,000 to $49,999 income range, which is the most common income bracket and makes up 22.2% of all families. Conversely, the $10,000 to $14,999 income bracket is the least frequent group with only 1 families (0.2%) belonging to this category.
| Income Bracket | # Families | % Families |
| Less than $10,000 | 11 | 2.1% |
| $10,000 to $14,999 | 1 | 0.2% |
| $15,000 to $24,999 | 46 | 8.7% |
| $25,000 to $34,999 | 36 | 6.8% |
| $35,000 to $49,999 | 118 | 22.2% |
| $50,000 to $74,999 | 108 | 20.3% |
| $75,000 to $99,999 | 60 | 11.3% |
| $100,000 to $149,999 | 91 | 17.1% |
| $150,000 to $199,999 | 31 | 5.8% |
| $200,000+ | 29 | 5.5% |
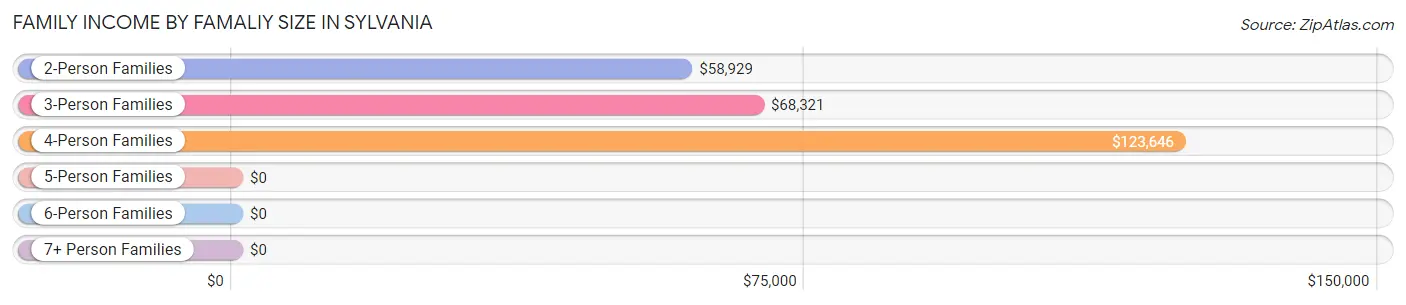
Family Income by Famaliy Size in Sylvania
4-person families (76 | 14.3%) account for the highest median family income in Sylvania with $123,646 per family, while 4-person families (76 | 14.3%) have the highest median income of $30,912 per family member.
| Income Bracket | # Families | Median Income |
| 2-Person Families | 256 (48.2%) | $58,929 |
| 3-Person Families | 141 (26.6%) | $68,321 |
| 4-Person Families | 76 (14.3%) | $123,646 |
| 5-Person Families | 32 (6.0%) | $0 |
| 6-Person Families | 26 (4.9%) | $0 |
| 7+ Person Families | 0 (0.0%) | $0 |
| Total | 531 (100.0%) | $68,679 |
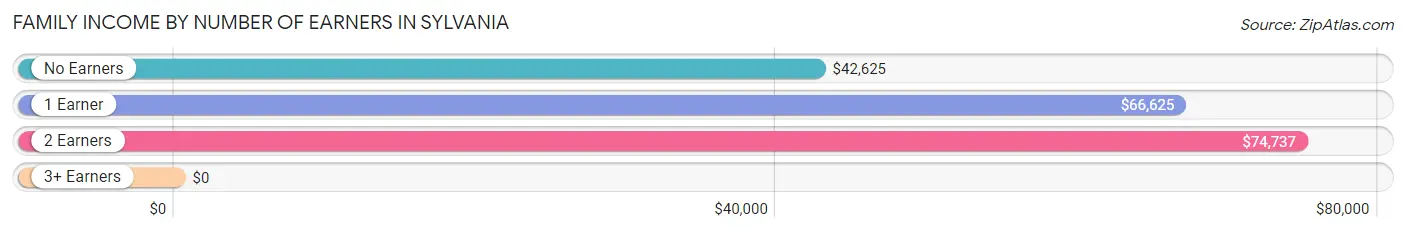
Family Income by Number of Earners in Sylvania
| Number of Earners | # Families | Median Income |
| No Earners | 136 (25.6%) | $42,625 |
| 1 Earner | 169 (31.8%) | $66,625 |
| 2 Earners | 200 (37.7%) | $74,737 |
| 3+ Earners | 26 (4.9%) | $0 |
| Total | 531 (100.0%) | $68,679 |
Household Income in Sylvania
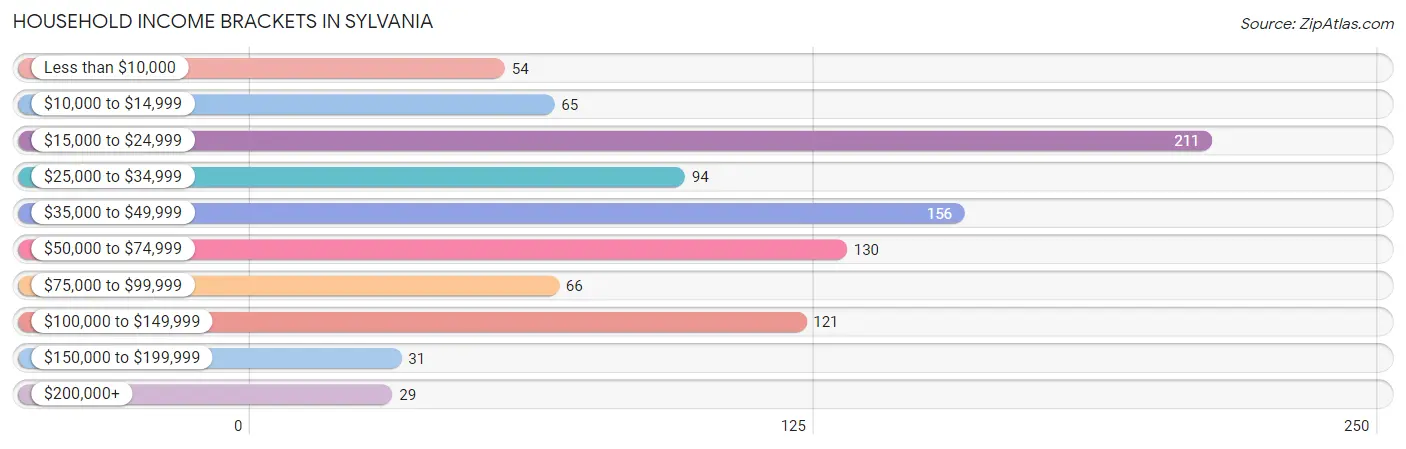
Household Income Brackets in Sylvania
With 211 households falling in the category, the $15,000 to $24,999 income range is the most frequent in Sylvania, accounting for 22.1% of all households. In contrast, only 29 households (3.0%) fall into the $200,000+ income bracket, making it the least populous group.
| Income Bracket | # Households | % Households |
| Less than $10,000 | 54 | 5.6% |
| $10,000 to $14,999 | 65 | 6.8% |
| $15,000 to $24,999 | 211 | 22.0% |
| $25,000 to $34,999 | 94 | 9.8% |
| $35,000 to $49,999 | 156 | 16.3% |
| $50,000 to $74,999 | 130 | 13.6% |
| $75,000 to $99,999 | 66 | 6.9% |
| $100,000 to $149,999 | 121 | 12.6% |
| $150,000 to $199,999 | 31 | 3.2% |
| $200,000+ | 29 | 3.0% |
Household Income by Householder Age in Sylvania
The median household income in Sylvania is $36,682, with the highest median household income of $37,450 found in the 45 to 64 years age bracket for the primary householder. A total of 324 households (33.9%) fall into this category. Meanwhile, the 15 to 24 years age bracket for the primary householder has the lowest median household income of $0, with 37 households (3.9%) in this group.
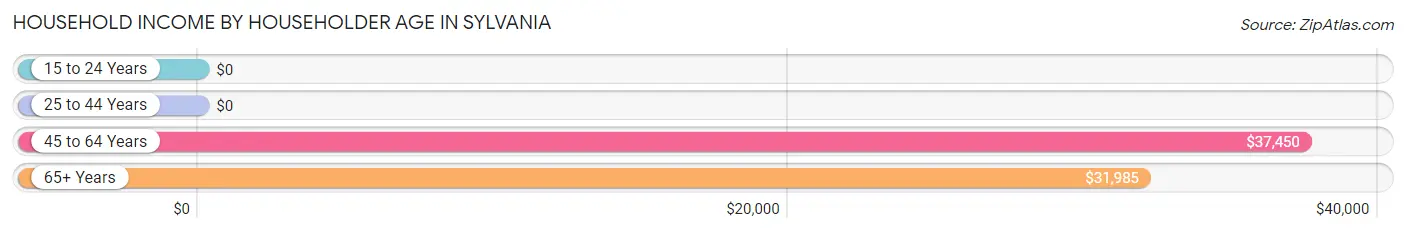
| Income Bracket | # Households | Median Income |
| 15 to 24 Years | 37 (3.9%) | $0 |
| 25 to 44 Years | 167 (17.4%) | $0 |
| 45 to 64 Years | 324 (33.9%) | $37,450 |
| 65+ Years | 429 (44.8%) | $31,985 |
| Total | 957 (100.0%) | $36,682 |
Poverty in Sylvania
Income Below Poverty by Sex and Age in Sylvania
With 15.0% poverty level for males and 20.4% for females among the residents of Sylvania, under 5 year old males and under 5 year old females are the most vulnerable to poverty, with 48 males (90.6%) and 55 females (53.9%) in their respective age groups living below the poverty level.
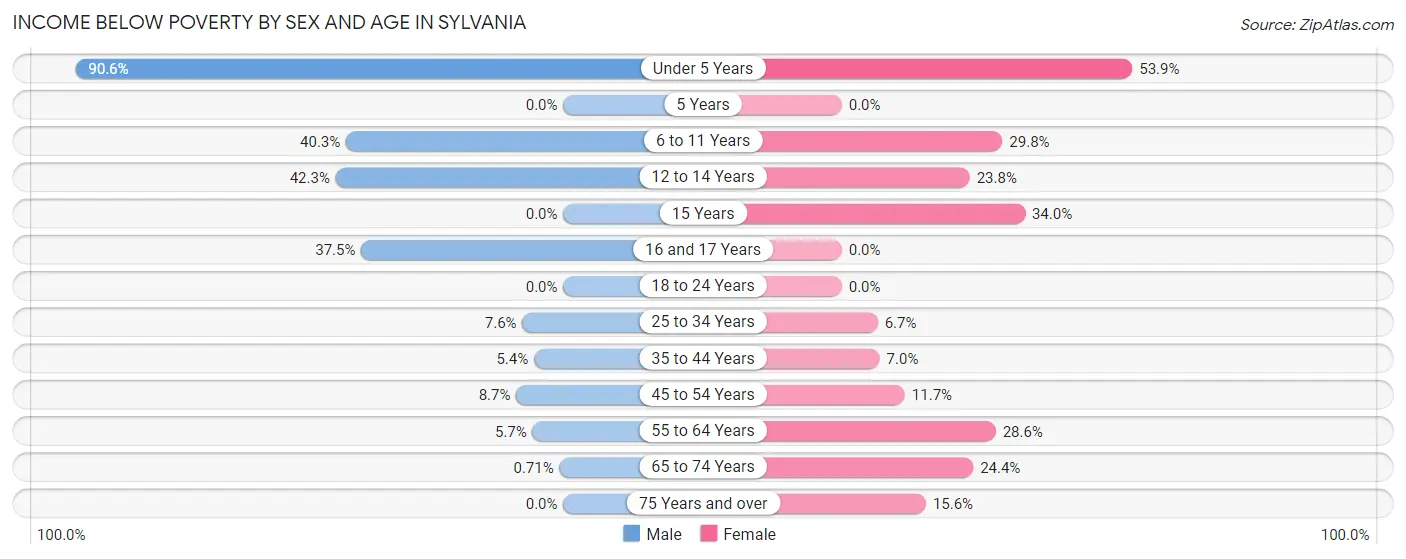
| Age Bracket | Male | Female |
| Under 5 Years | 48 (90.6%) | 55 (53.9%) |
| 5 Years | 0 (0.0%) | 0 (0.0%) |
| 6 to 11 Years | 50 (40.3%) | 31 (29.8%) |
| 12 to 14 Years | 30 (42.2%) | 19 (23.7%) |
| 15 Years | 0 (0.0%) | 17 (34.0%) |
| 16 and 17 Years | 6 (37.5%) | 0 (0.0%) |
| 18 to 24 Years | 0 (0.0%) | 0 (0.0%) |
| 25 to 34 Years | 12 (7.6%) | 9 (6.7%) |
| 35 to 44 Years | 8 (5.4%) | 9 (7.0%) |
| 45 to 54 Years | 9 (8.7%) | 24 (11.7%) |
| 55 to 64 Years | 9 (5.7%) | 42 (28.6%) |
| 65 to 74 Years | 1 (0.7%) | 50 (24.4%) |
| 75 Years and over | 0 (0.0%) | 25 (15.6%) |
| Total | 173 (15.0%) | 281 (20.4%) |
Income Above Poverty by Sex and Age in Sylvania
According to the poverty statistics in Sylvania, males aged 18 to 24 years and females aged 18 to 24 years are the age groups that are most secure financially, with 100.0% of males and 100.0% of females in these age groups living above the poverty line.
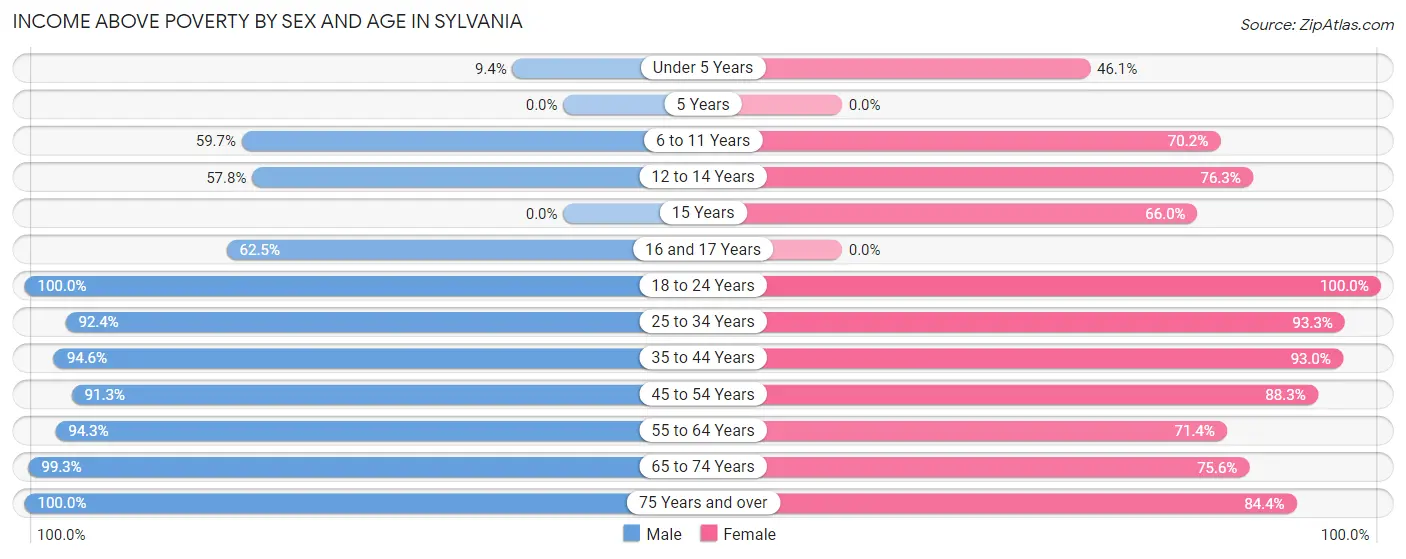
| Age Bracket | Male | Female |
| Under 5 Years | 5 (9.4%) | 47 (46.1%) |
| 5 Years | 0 (0.0%) | 0 (0.0%) |
| 6 to 11 Years | 74 (59.7%) | 73 (70.2%) |
| 12 to 14 Years | 41 (57.8%) | 61 (76.2%) |
| 15 Years | 0 (0.0%) | 33 (66.0%) |
| 16 and 17 Years | 10 (62.5%) | 0 (0.0%) |
| 18 to 24 Years | 92 (100.0%) | 63 (100.0%) |
| 25 to 34 Years | 146 (92.4%) | 126 (93.3%) |
| 35 to 44 Years | 139 (94.6%) | 119 (93.0%) |
| 45 to 54 Years | 94 (91.3%) | 181 (88.3%) |
| 55 to 64 Years | 149 (94.3%) | 105 (71.4%) |
| 65 to 74 Years | 139 (99.3%) | 155 (75.6%) |
| 75 Years and over | 93 (100.0%) | 135 (84.4%) |
| Total | 982 (85.0%) | 1,098 (79.6%) |
Income Below Poverty Among Married-Couple Families in Sylvania
The poverty statistics for married-couple families in Sylvania show that 2.9% or 10 of the total 339 families live below the poverty line. Families with 3 or 4 children have the highest poverty rate of 64.3%, comprising of 9 families. On the other hand, families with 1 or 2 children have the lowest poverty rate of 0.0%, which includes 0 families.
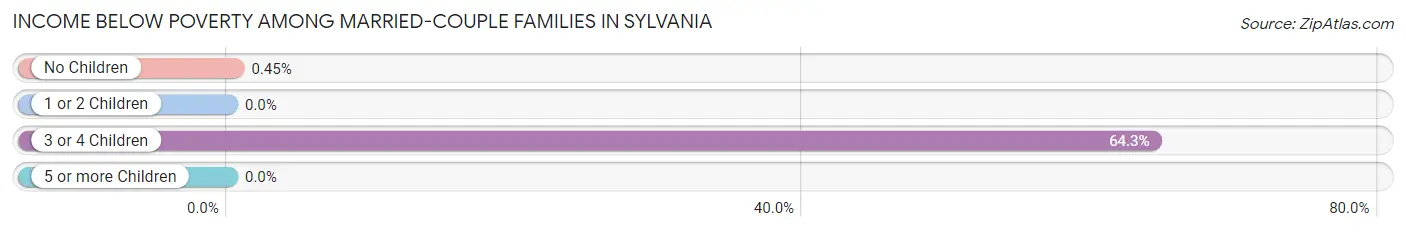
| Children | Above Poverty | Below Poverty |
| No Children | 222 (99.6%) | 1 (0.4%) |
| 1 or 2 Children | 102 (100.0%) | 0 (0.0%) |
| 3 or 4 Children | 5 (35.7%) | 9 (64.3%) |
| 5 or more Children | 0 (0.0%) | 0 (0.0%) |
| Total | 329 (97.1%) | 10 (2.9%) |
Income Below Poverty Among Single-Parent Households in Sylvania
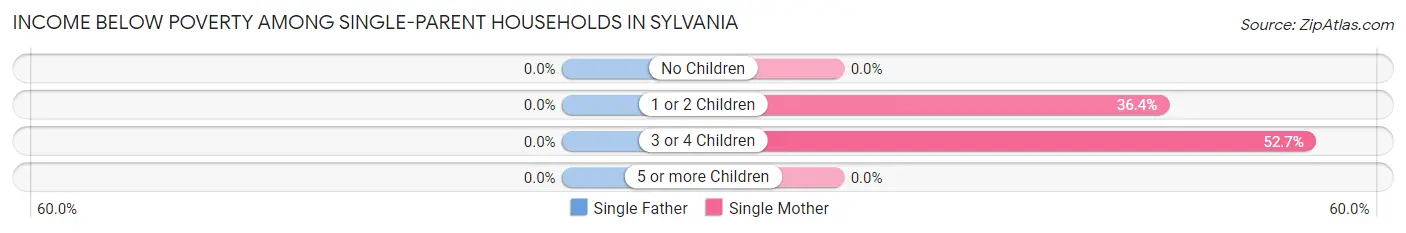
| Children | Single Father | Single Mother |
| No Children | 0 (0.0%) | 0 (0.0%) |
| 1 or 2 Children | 0 (0.0%) | 16 (36.4%) |
| 3 or 4 Children | 0 (0.0%) | 29 (52.7%) |
| 5 or more Children | 0 (0.0%) | 0 (0.0%) |
| Total | 0 (0.0%) | 45 (28.5%) |
Income Below Poverty Among Married-Couple vs Single-Parent Households in Sylvania
The poverty data for Sylvania shows that 10 of the married-couple family households (2.9%) and 45 of the single-parent households (23.4%) are living below the poverty level. Within the married-couple family households, those with 3 or 4 children have the highest poverty rate, with 9 households (64.3%) falling below the poverty line. Among the single-parent households, those with 3 or 4 children have the highest poverty rate, with 29 household (52.7%) living below poverty.
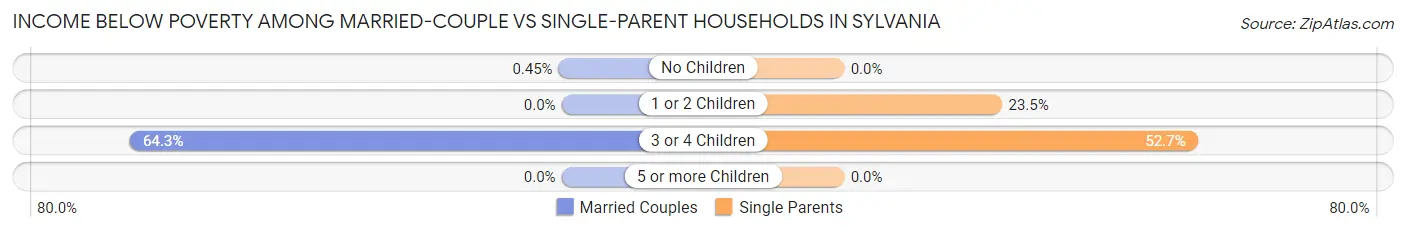
| Children | Married-Couple Families | Single-Parent Households |
| No Children | 1 (0.4%) | 0 (0.0%) |
| 1 or 2 Children | 0 (0.0%) | 16 (23.5%) |
| 3 or 4 Children | 9 (64.3%) | 29 (52.7%) |
| 5 or more Children | 0 (0.0%) | 0 (0.0%) |
| Total | 10 (2.9%) | 45 (23.4%) |
Race in Sylvania
The most populous races in Sylvania are Black / African American (1,493 | 57.0%), White / Caucasian (1,062 | 40.6%), and Two or more Races (61 | 2.3%).
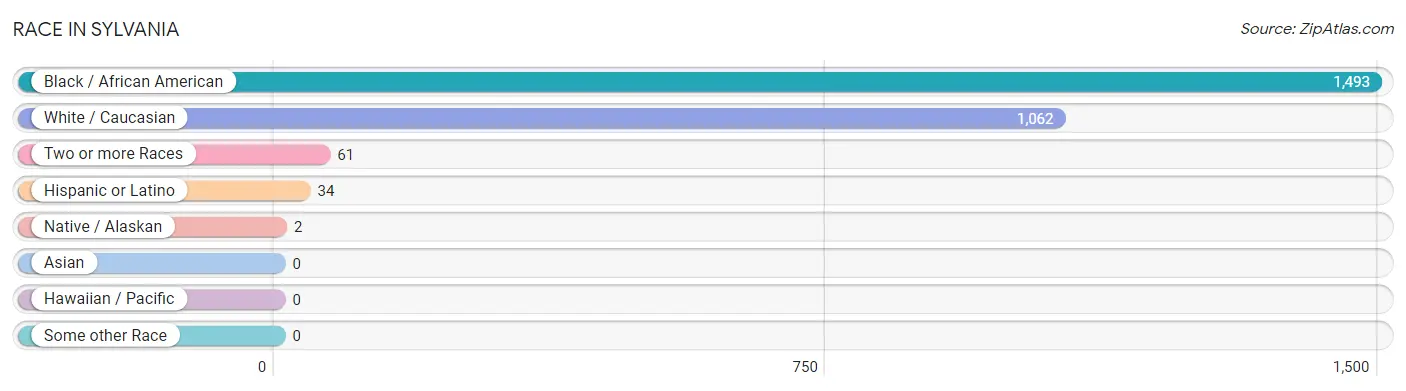
| Race | # Population | % Population |
| Asian | 0 | 0.0% |
| Black / African American | 1,493 | 57.0% |
| Hawaiian / Pacific | 0 | 0.0% |
| Hispanic or Latino | 34 | 1.3% |
| Native / Alaskan | 2 | 0.1% |
| White / Caucasian | 1,062 | 40.6% |
| Two or more Races | 61 | 2.3% |
| Some other Race | 0 | 0.0% |
| Total | 2,618 | 100.0% |
Ancestry in Sylvania
The most populous ancestries reported in Sylvania are English (247 | 9.4%), Irish (147 | 5.6%), German (141 | 5.4%), American (123 | 4.7%), and Polish (79 | 3.0%), together accounting for 28.1% of all Sylvania residents.
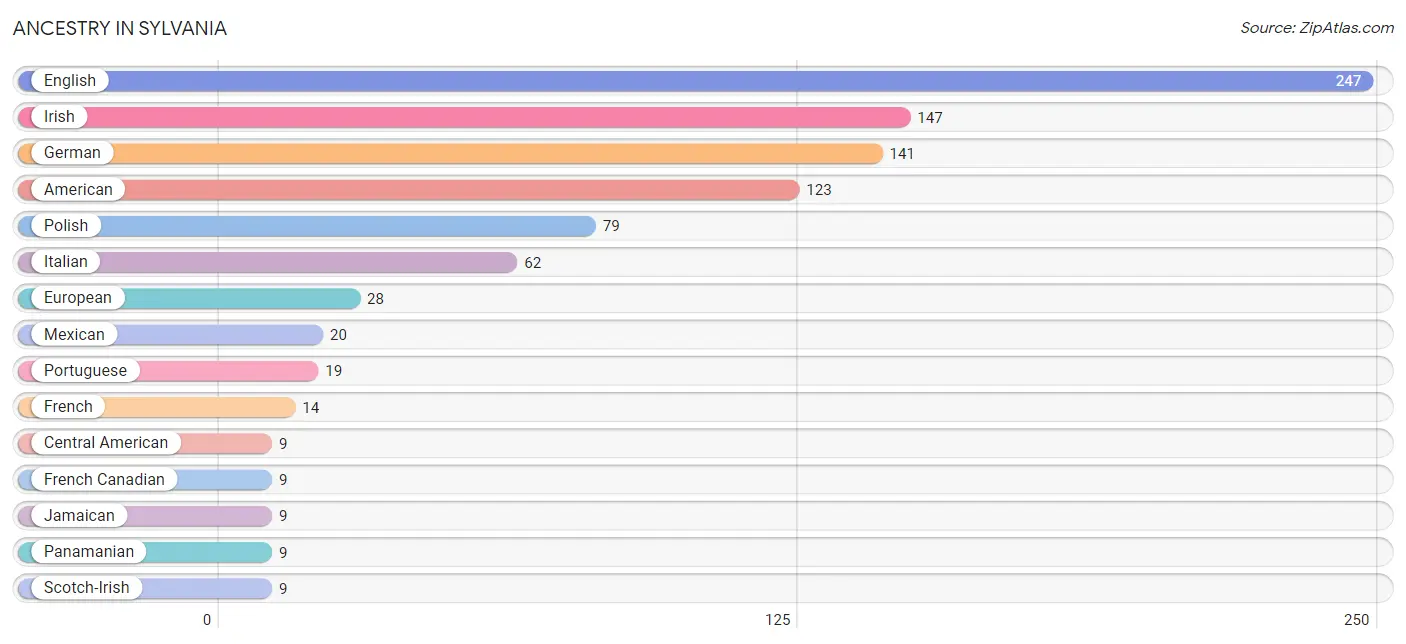
| Ancestry | # Population | % Population |
| American | 123 | 4.7% |
| British | 7 | 0.3% |
| Central American | 9 | 0.3% |
| English | 247 | 9.4% |
| European | 28 | 1.1% |
| French | 14 | 0.5% |
| French Canadian | 9 | 0.3% |
| German | 141 | 5.4% |
| Irish | 147 | 5.6% |
| Iroquois | 2 | 0.1% |
| Italian | 62 | 2.4% |
| Jamaican | 9 | 0.3% |
| Mexican | 20 | 0.8% |
| Norwegian | 1 | 0.0% |
| Panamanian | 9 | 0.3% |
| Polish | 79 | 3.0% |
| Portuguese | 19 | 0.7% |
| Puerto Rican | 1 | 0.0% |
| Scotch-Irish | 9 | 0.3% |
| Scottish | 8 | 0.3% |
| Spaniard | 1 | 0.0% |
| Spanish | 3 | 0.1% |
| Subsaharan African | 3 | 0.1% | View All 23 Rows |
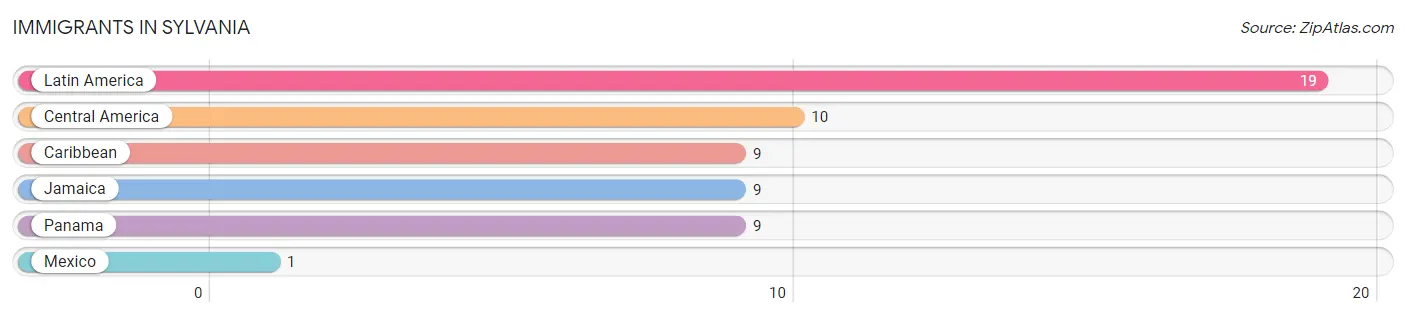
Immigrants in Sylvania
The most numerous immigrant groups reported in Sylvania came from Latin America (19 | 0.7%), Central America (10 | 0.4%), Caribbean (9 | 0.3%), Jamaica (9 | 0.3%), and Panama (9 | 0.3%), together accounting for 2.1% of all Sylvania residents.
| Immigration Origin | # Population | % Population |
| Caribbean | 9 | 0.3% |
| Central America | 10 | 0.4% |
| Jamaica | 9 | 0.3% |
| Latin America | 19 | 0.7% |
| Mexico | 1 | 0.0% |
| Panama | 9 | 0.3% | View All 6 Rows |
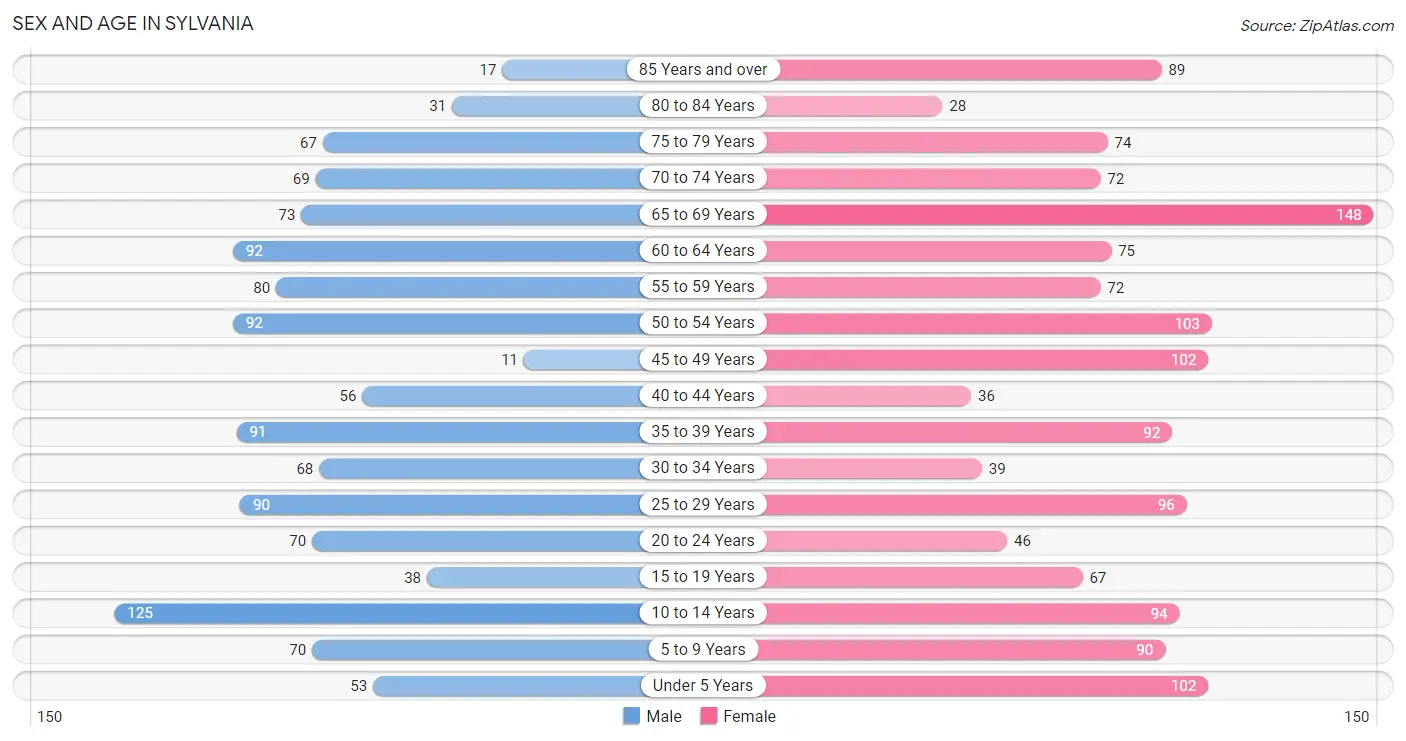
Sex and Age in Sylvania
Sex and Age in Sylvania
The most populous age groups in Sylvania are 10 to 14 Years (125 | 10.5%) for men and 65 to 69 Years (148 | 10.4%) for women.
| Age Bracket | Male | Female |
| Under 5 Years | 53 (4.4%) | 102 (7.2%) |
| 5 to 9 Years | 70 (5.9%) | 90 (6.3%) |
| 10 to 14 Years | 125 (10.5%) | 94 (6.6%) |
| 15 to 19 Years | 38 (3.2%) | 67 (4.7%) |
| 20 to 24 Years | 70 (5.9%) | 46 (3.2%) |
| 25 to 29 Years | 90 (7.5%) | 96 (6.7%) |
| 30 to 34 Years | 68 (5.7%) | 39 (2.7%) |
| 35 to 39 Years | 91 (7.6%) | 92 (6.5%) |
| 40 to 44 Years | 56 (4.7%) | 36 (2.5%) |
| 45 to 49 Years | 11 (0.9%) | 102 (7.2%) |
| 50 to 54 Years | 92 (7.7%) | 103 (7.2%) |
| 55 to 59 Years | 80 (6.7%) | 72 (5.1%) |
| 60 to 64 Years | 92 (7.7%) | 75 (5.3%) |
| 65 to 69 Years | 73 (6.1%) | 148 (10.4%) |
| 70 to 74 Years | 69 (5.8%) | 72 (5.1%) |
| 75 to 79 Years | 67 (5.6%) | 74 (5.2%) |
| 80 to 84 Years | 31 (2.6%) | 28 (2.0%) |
| 85 Years and over | 17 (1.4%) | 89 (6.2%) |
| Total | 1,193 (100.0%) | 1,425 (100.0%) |
Families and Households in Sylvania
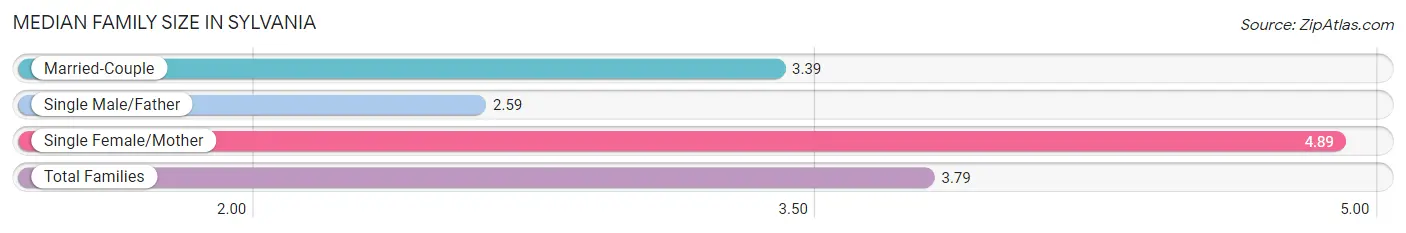
Median Family Size in Sylvania
The median family size in Sylvania is 3.79 persons per family, with single female/mother families (158 | 29.8%) accounting for the largest median family size of 4.89 persons per family. On the other hand, single male/father families (34 | 6.4%) represent the smallest median family size with 2.59 persons per family.
| Family Type | # Families | Family Size |
| Married-Couple | 339 (63.8%) | 3.39 |
| Single Male/Father | 34 (6.4%) | 2.59 |
| Single Female/Mother | 158 (29.8%) | 4.89 |
| Total Families | 531 (100.0%) | 3.79 |
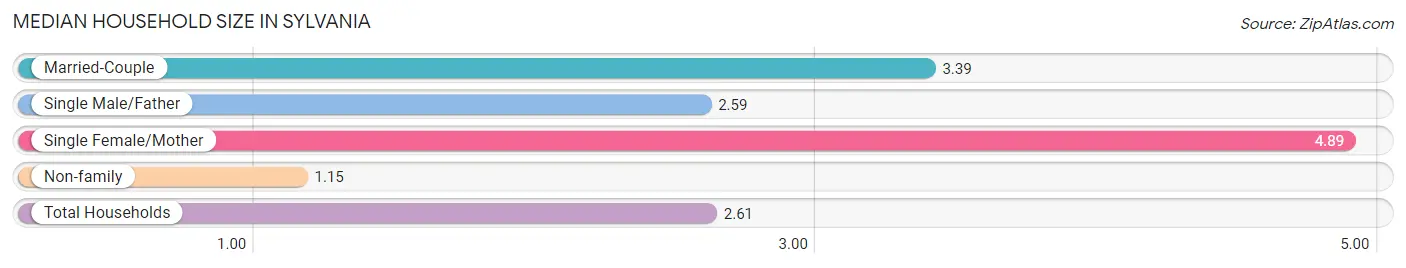
Median Household Size in Sylvania
The median household size in Sylvania is 2.61 persons per household, with single female/mother households (158 | 16.5%) accounting for the largest median household size of 4.89 persons per household. non-family households (426 | 44.5%) represent the smallest median household size with 1.15 persons per household.
| Household Type | # Households | Household Size |
| Married-Couple | 339 (35.4%) | 3.39 |
| Single Male/Father | 34 (3.5%) | 2.59 |
| Single Female/Mother | 158 (16.5%) | 4.89 |
| Non-family | 426 (44.5%) | 1.15 |
| Total Households | 957 (100.0%) | 2.61 |
Household Size by Marriage Status in Sylvania
Out of a total of 957 households in Sylvania, 531 (55.5%) are family households, while 426 (44.5%) are nonfamily households. The most numerous type of family households are 2-person households, comprising 256, and the most common type of nonfamily households are 1-person households, comprising 386.
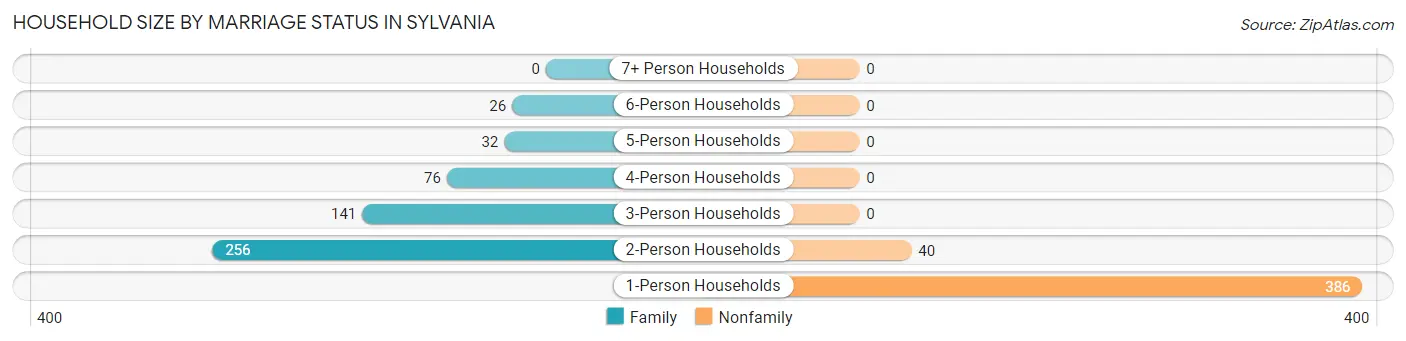
| Household Size | Family Households | Nonfamily Households |
| 1-Person Households | - | 386 (40.3%) |
| 2-Person Households | 256 (26.8%) | 40 (4.2%) |
| 3-Person Households | 141 (14.7%) | 0 (0.0%) |
| 4-Person Households | 76 (7.9%) | 0 (0.0%) |
| 5-Person Households | 32 (3.3%) | 0 (0.0%) |
| 6-Person Households | 26 (2.7%) | 0 (0.0%) |
| 7+ Person Households | 0 (0.0%) | 0 (0.0%) |
| Total | 531 (55.5%) | 426 (44.5%) |
Female Fertility in Sylvania
Fertility by Age in Sylvania
Average fertility rate in Sylvania is 48.0 births per 1,000 women. Women in the age bracket of 20 to 34 years have the highest fertility rate with 138.0 births per 1,000 women. Women in the age bracket of 20 to 34 years acount for 100.0% of all women with births.
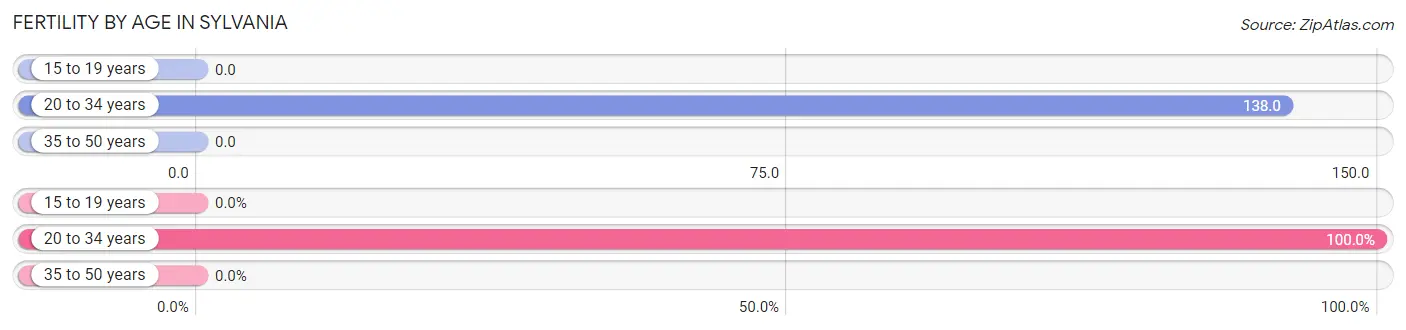
| Age Bracket | Women with Births | Births / 1,000 Women |
| 15 to 19 years | 0 (0.0%) | 0.0 |
| 20 to 34 years | 25 (100.0%) | 138.0 |
| 35 to 50 years | 0 (0.0%) | 0.0 |
| Total | 25 (100.0%) | 48.0 |
Fertility by Age by Marriage Status in Sylvania
36.0% of women with births (25) in Sylvania are married. The highest percentage of unmarried women with births falls into 20 to 34 years age bracket with 64.0% of them unmarried at the time of birth, while the lowest percentage of unmarried women with births belong to 20 to 34 years age bracket with 64.0% of them unmarried.
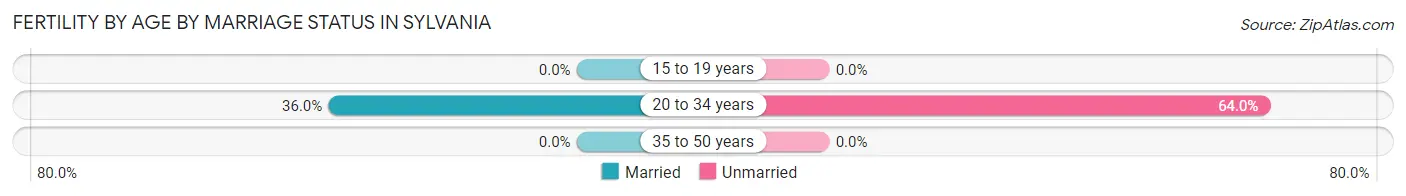
| Age Bracket | Married | Unmarried |
| 15 to 19 years | 0 (0.0%) | 0 (0.0%) |
| 20 to 34 years | 9 (36.0%) | 16 (64.0%) |
| 35 to 50 years | 0 (0.0%) | 0 (0.0%) |
| Total | 9 (36.0%) | 16 (64.0%) |
Fertility by Education in Sylvania
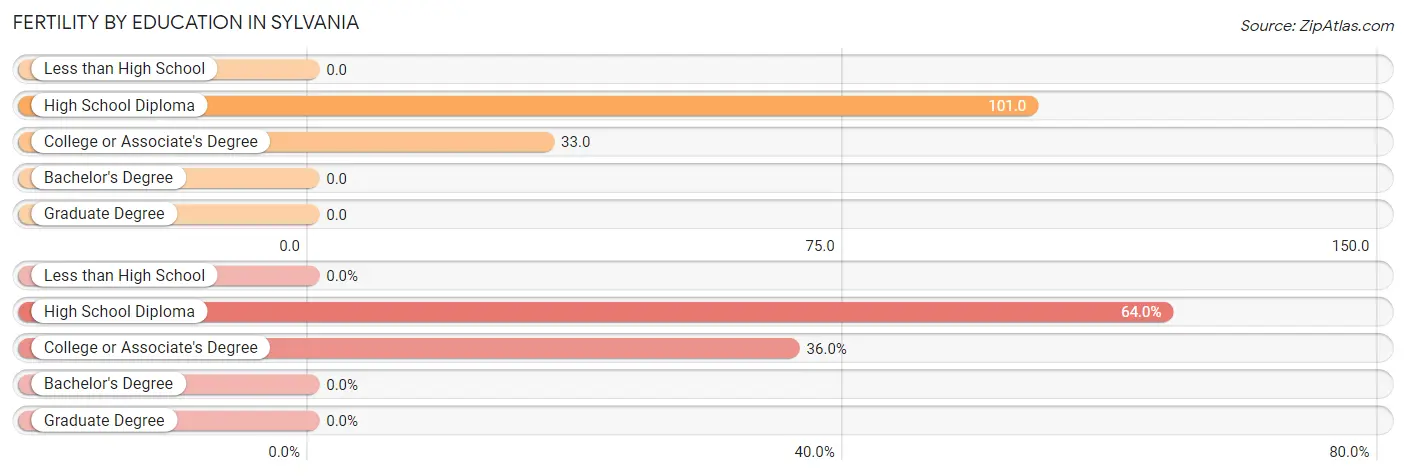
| Educational Attainment | Women with Births | Births / 1,000 Women |
| Less than High School | 0 (0.0%) | 0.0 |
| High School Diploma | 16 (64.0%) | 101.0 |
| College or Associate's Degree | 9 (36.0%) | 33.0 |
| Bachelor's Degree | 0 (0.0%) | 0.0 |
| Graduate Degree | 0 (0.0%) | 0.0 |
| Total | 25 (100.0%) | 48.0 |
Fertility by Education by Marriage Status in Sylvania
64.0% of women with births in Sylvania are unmarried. Women with the educational attainment of college or associate's degree are most likely to be married with 100.0% of them married at childbirth, while women with the educational attainment of high school diploma are least likely to be married with 100.0% of them unmarried at childbirth.
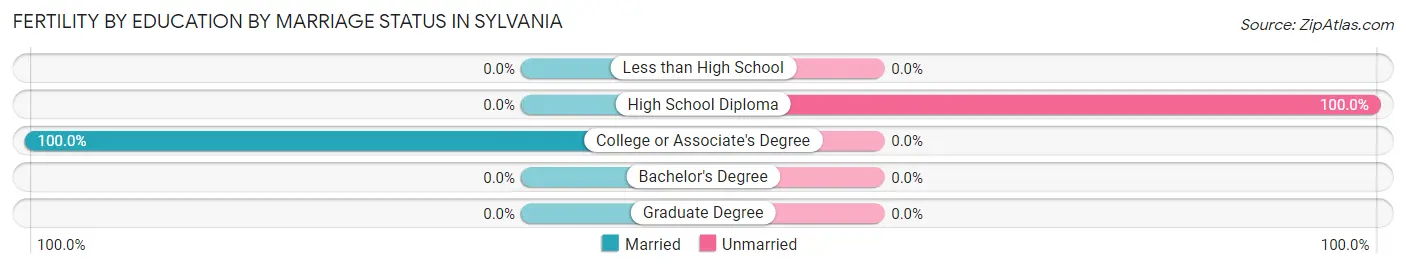
| Educational Attainment | Married | Unmarried |
| Less than High School | 0 (0.0%) | 0 (0.0%) |
| High School Diploma | 0 (0.0%) | 16 (100.0%) |
| College or Associate's Degree | 9 (100.0%) | 0 (0.0%) |
| Bachelor's Degree | 0 (0.0%) | 0 (0.0%) |
| Graduate Degree | 0 (0.0%) | 0 (0.0%) |
| Total | 9 (36.0%) | 16 (64.0%) |
Employment Characteristics in Sylvania
Employment by Class of Employer in Sylvania
Among the 988 employed individuals in Sylvania, private company employees (716 | 72.5%), state government employees (121 | 12.2%), and self-employed (incorporated) (40 | 4.1%) make up the most common classes of employment.
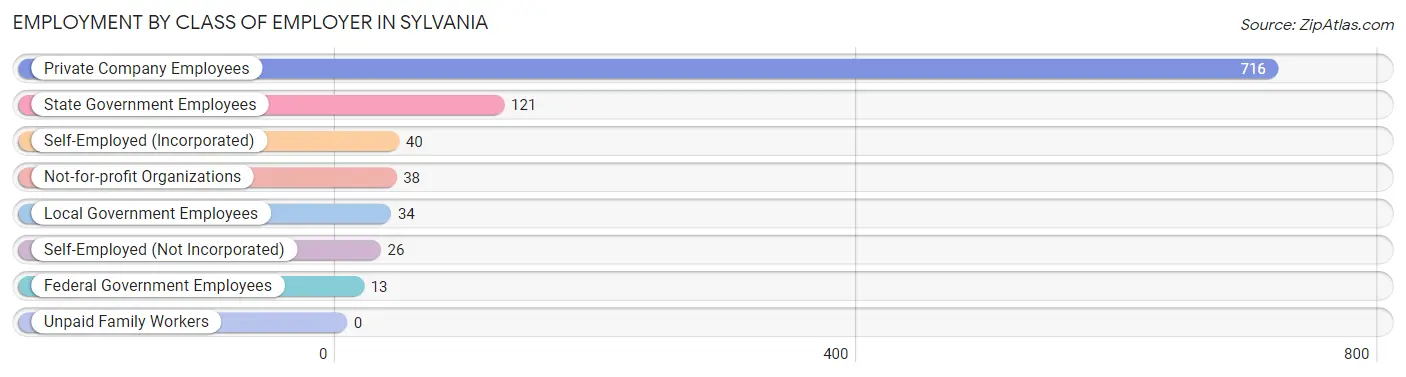
| Employer Class | # Employees | % Employees |
| Private Company Employees | 716 | 72.5% |
| Self-Employed (Incorporated) | 40 | 4.1% |
| Self-Employed (Not Incorporated) | 26 | 2.6% |
| Not-for-profit Organizations | 38 | 3.8% |
| Local Government Employees | 34 | 3.4% |
| State Government Employees | 121 | 12.2% |
| Federal Government Employees | 13 | 1.3% |
| Unpaid Family Workers | 0 | 0.0% |
| Total | 988 | 100.0% |
Employment Status by Age in Sylvania
According to the labor force statistics for Sylvania, out of the total population over 16 years of age (2,034), 52.2% or 1,062 individuals are in the labor force, with 1.1% or 12 of them unemployed. The age group with the highest labor force participation rate is 25 to 29 years, with 100.0% or 186 individuals in the labor force. Within the labor force, the 25 to 29 years age range has the highest percentage of unemployed individuals, with 6.5% or 12 of them being unemployed.
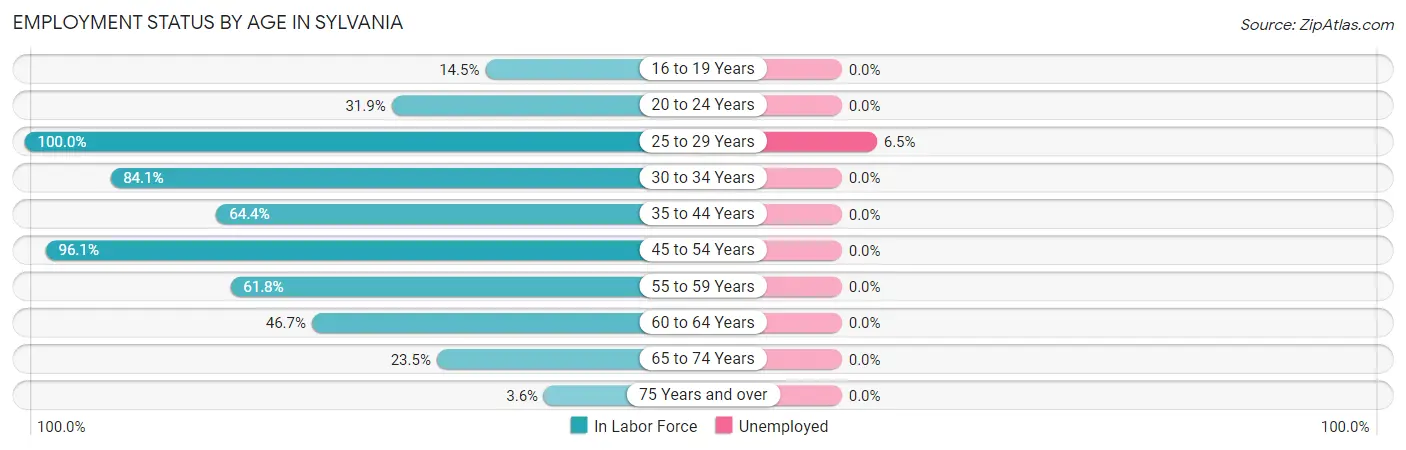
| Age Bracket | In Labor Force | Unemployed |
| 16 to 19 Years | 8 (14.5%) | 0 (0.0%) |
| 20 to 24 Years | 37 (31.9%) | 0 (0.0%) |
| 25 to 29 Years | 186 (100.0%) | 12 (6.5%) |
| 30 to 34 Years | 90 (84.1%) | 0 (0.0%) |
| 35 to 44 Years | 177 (64.4%) | 0 (0.0%) |
| 45 to 54 Years | 296 (96.1%) | 0 (0.0%) |
| 55 to 59 Years | 94 (61.8%) | 0 (0.0%) |
| 60 to 64 Years | 78 (46.7%) | 0 (0.0%) |
| 65 to 74 Years | 85 (23.5%) | 0 (0.0%) |
| 75 Years and over | 11 (3.6%) | 0 (0.0%) |
| Total | 1,062 (52.2%) | 12 (1.1%) |
Employment Status by Educational Attainment in Sylvania
According to labor force statistics for Sylvania, 77.1% of individuals (921) out of the total population between 25 and 64 years of age (1,195) are in the labor force, with 1.3% or 12 of them being unemployed. The group with the highest labor force participation rate are those with the educational attainment of college / associate degree, with 97.9% or 323 individuals in the labor force. Within the labor force, individuals with less than high school education have the highest percentage of unemployment, with 7.1% or 7 of them being unemployed.
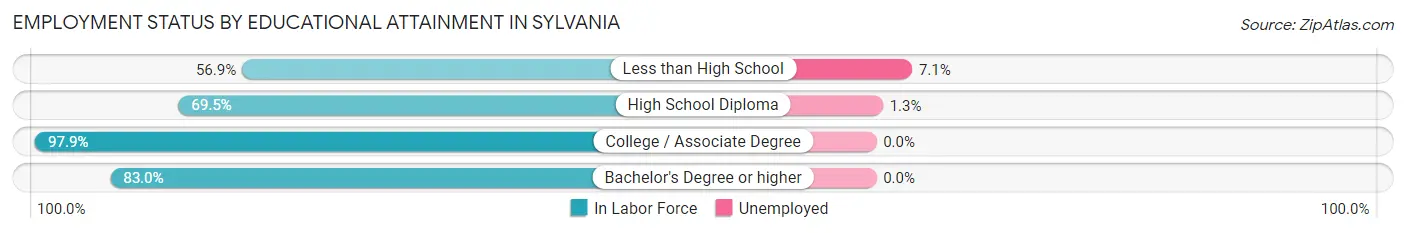
| Educational Attainment | In Labor Force | Unemployed |
| Less than High School | 99 (56.9%) | 12 (7.1%) |
| High School Diploma | 382 (69.5%) | 7 (1.3%) |
| College / Associate Degree | 323 (97.9%) | 0 (0.0%) |
| Bachelor's Degree or higher | 117 (83.0%) | 0 (0.0%) |
| Total | 921 (77.1%) | 16 (1.3%) |
Employment Occupations by Sex in Sylvania
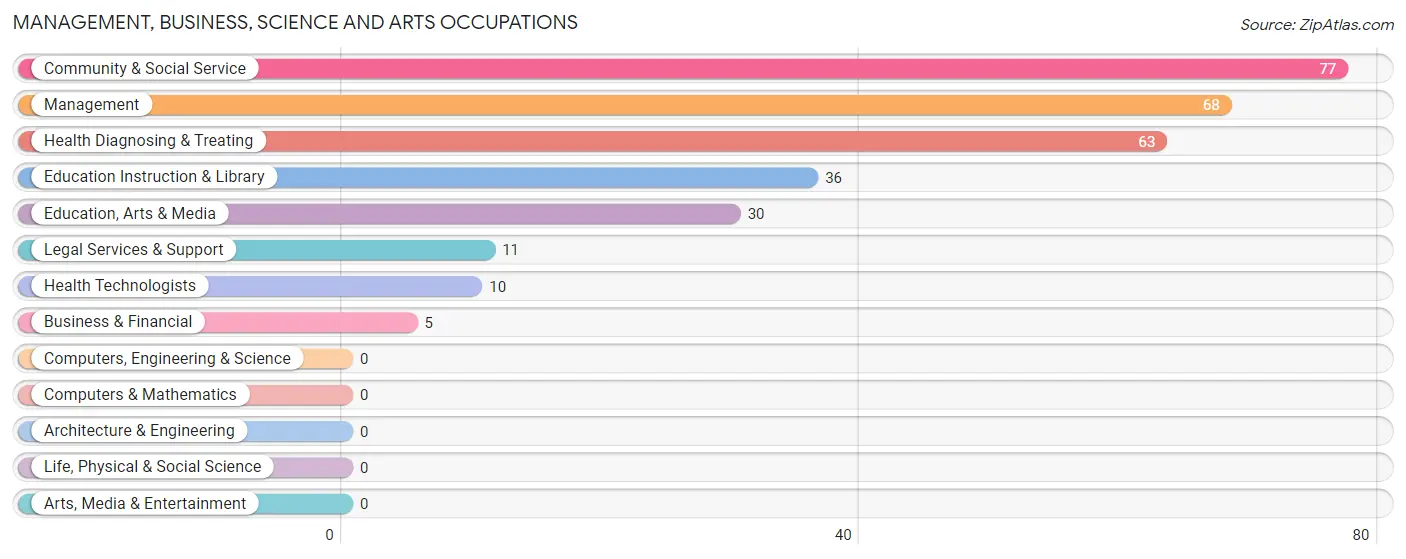
Management, Business, Science and Arts Occupations
The most common Management, Business, Science and Arts occupations in Sylvania are Community & Social Service (77 | 7.3%), Management (68 | 6.5%), Health Diagnosing & Treating (63 | 6.0%), Education Instruction & Library (36 | 3.4%), and Education, Arts & Media (30 | 2.9%).
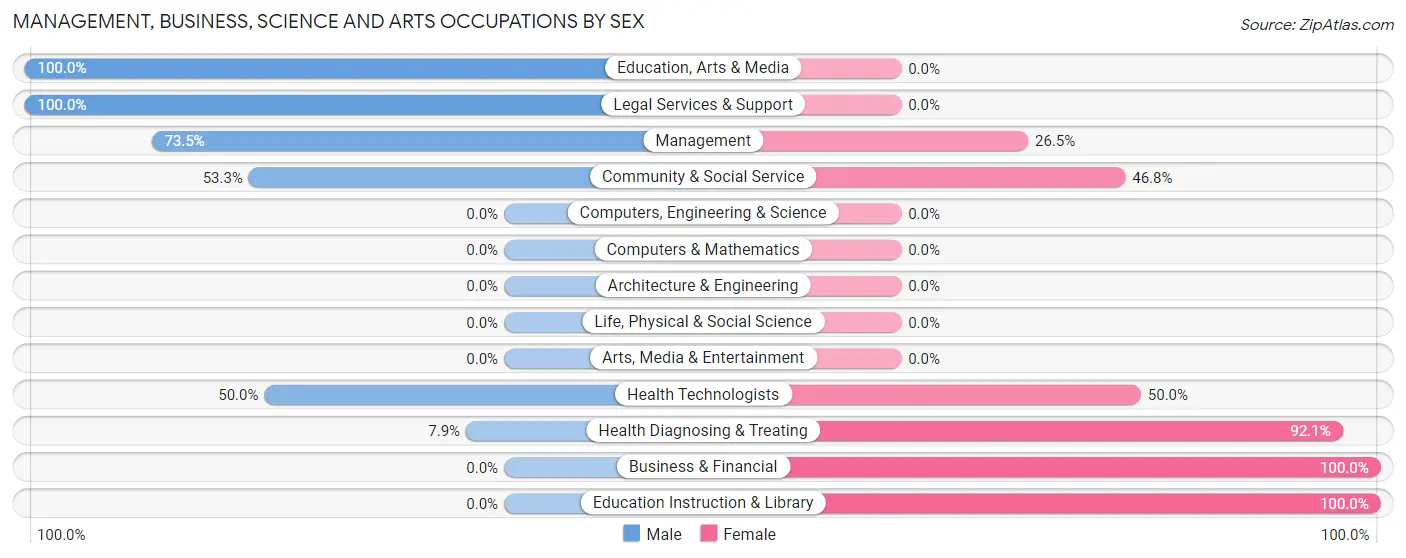
Management, Business, Science and Arts Occupations by Sex
Within the Management, Business, Science and Arts occupations in Sylvania, the most male-oriented occupations are Education, Arts & Media (100.0%), Legal Services & Support (100.0%), and Management (73.5%), while the most female-oriented occupations are Business & Financial (100.0%), Education Instruction & Library (100.0%), and Health Diagnosing & Treating (92.1%).
| Occupation | Male | Female |
| Management | 50 (73.5%) | 18 (26.5%) |
| Business & Financial | 0 (0.0%) | 5 (100.0%) |
| Computers, Engineering & Science | 0 (0.0%) | 0 (0.0%) |
| Computers & Mathematics | 0 (0.0%) | 0 (0.0%) |
| Architecture & Engineering | 0 (0.0%) | 0 (0.0%) |
| Life, Physical & Social Science | 0 (0.0%) | 0 (0.0%) |
| Community & Social Service | 41 (53.2%) | 36 (46.8%) |
| Education, Arts & Media | 30 (100.0%) | 0 (0.0%) |
| Legal Services & Support | 11 (100.0%) | 0 (0.0%) |
| Education Instruction & Library | 0 (0.0%) | 36 (100.0%) |
| Arts, Media & Entertainment | 0 (0.0%) | 0 (0.0%) |
| Health Diagnosing & Treating | 5 (7.9%) | 58 (92.1%) |
| Health Technologists | 5 (50.0%) | 5 (50.0%) |
| Total (Category) | 96 (45.1%) | 117 (54.9%) |
| Total (Overall) | 445 (42.4%) | 605 (57.6%) |
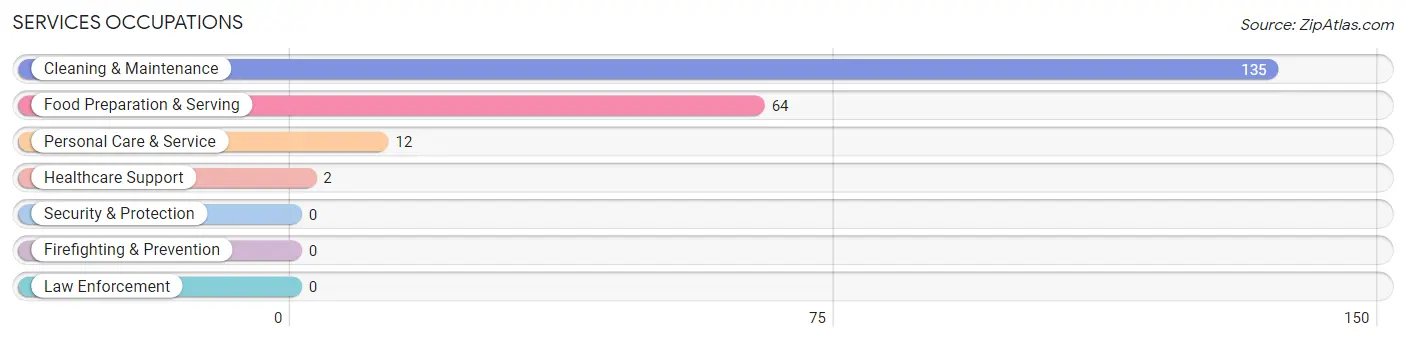
Services Occupations
The most common Services occupations in Sylvania are Cleaning & Maintenance (135 | 12.9%), Food Preparation & Serving (64 | 6.1%), Personal Care & Service (12 | 1.1%), and Healthcare Support (2 | 0.2%).
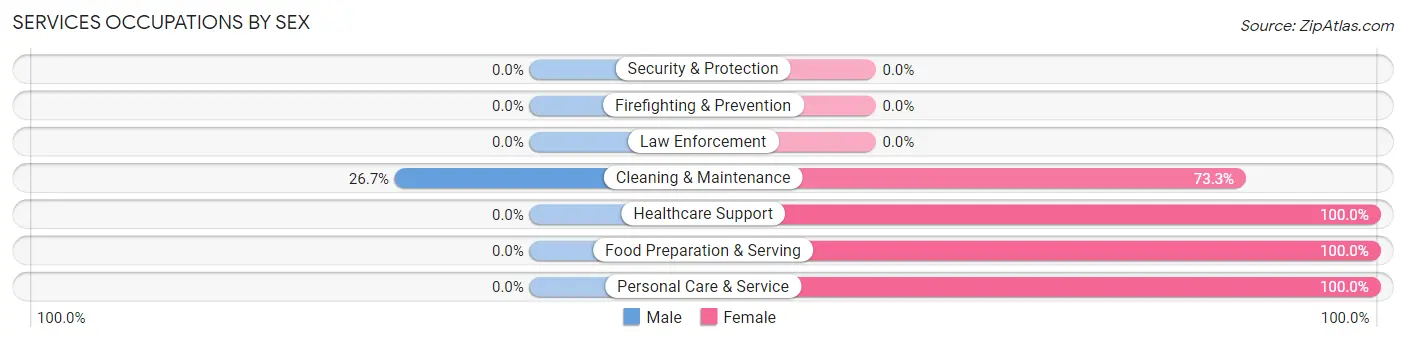
Services Occupations by Sex
| Occupation | Male | Female |
| Healthcare Support | 0 (0.0%) | 2 (100.0%) |
| Security & Protection | 0 (0.0%) | 0 (0.0%) |
| Firefighting & Prevention | 0 (0.0%) | 0 (0.0%) |
| Law Enforcement | 0 (0.0%) | 0 (0.0%) |
| Food Preparation & Serving | 0 (0.0%) | 64 (100.0%) |
| Cleaning & Maintenance | 36 (26.7%) | 99 (73.3%) |
| Personal Care & Service | 0 (0.0%) | 12 (100.0%) |
| Total (Category) | 36 (16.9%) | 177 (83.1%) |
| Total (Overall) | 445 (42.4%) | 605 (57.6%) |
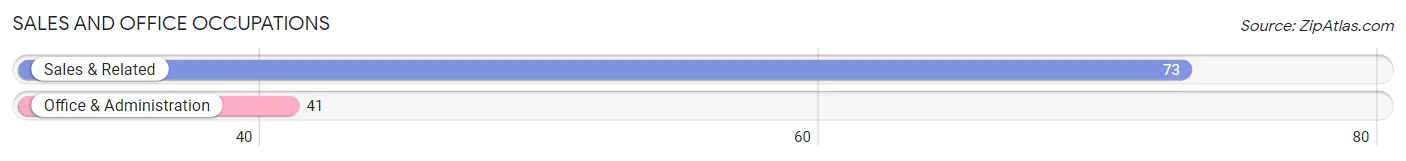
Sales and Office Occupations
The most common Sales and Office occupations in Sylvania are Sales & Related (73 | 7.0%), and Office & Administration (41 | 3.9%).
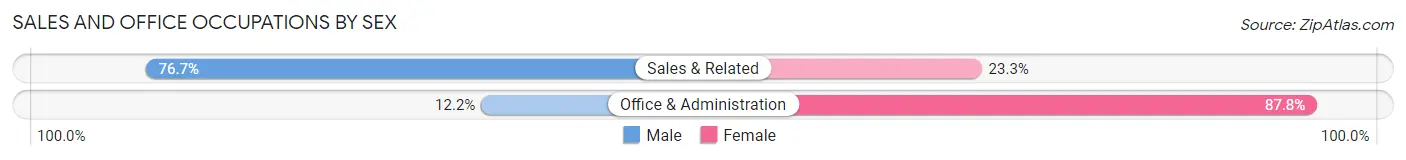
Sales and Office Occupations by Sex
| Occupation | Male | Female |
| Sales & Related | 56 (76.7%) | 17 (23.3%) |
| Office & Administration | 5 (12.2%) | 36 (87.8%) |
| Total (Category) | 61 (53.5%) | 53 (46.5%) |
| Total (Overall) | 445 (42.4%) | 605 (57.6%) |
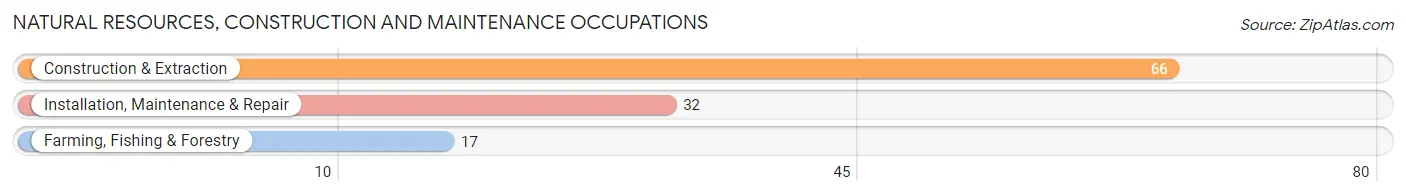
Natural Resources, Construction and Maintenance Occupations
The most common Natural Resources, Construction and Maintenance occupations in Sylvania are Construction & Extraction (66 | 6.3%), Installation, Maintenance & Repair (32 | 3.0%), and Farming, Fishing & Forestry (17 | 1.6%).
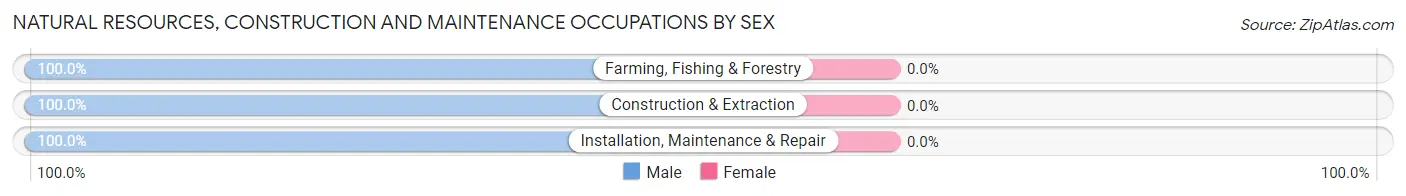
Natural Resources, Construction and Maintenance Occupations by Sex
| Occupation | Male | Female |
| Farming, Fishing & Forestry | 17 (100.0%) | 0 (0.0%) |
| Construction & Extraction | 66 (100.0%) | 0 (0.0%) |
| Installation, Maintenance & Repair | 32 (100.0%) | 0 (0.0%) |
| Total (Category) | 115 (100.0%) | 0 (0.0%) |
| Total (Overall) | 445 (42.4%) | 605 (57.6%) |
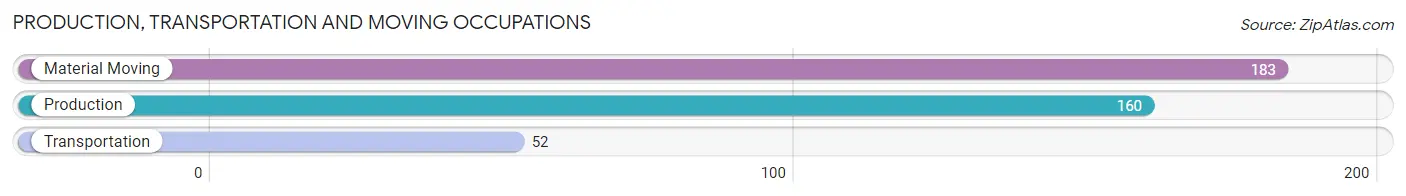
Production, Transportation and Moving Occupations
The most common Production, Transportation and Moving occupations in Sylvania are Material Moving (183 | 17.4%), Production (160 | 15.2%), and Transportation (52 | 5.0%).
Production, Transportation and Moving Occupations by Sex
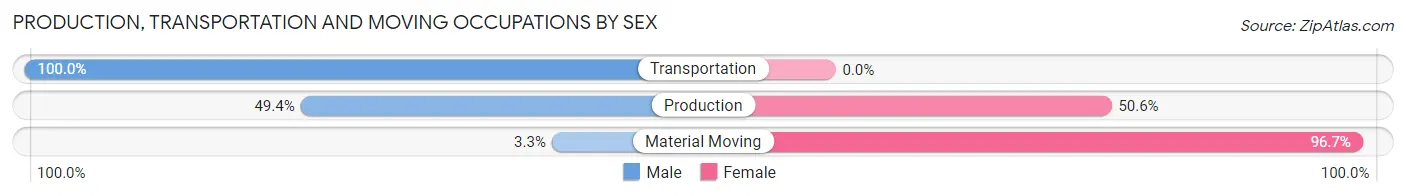
| Occupation | Male | Female |
| Production | 79 (49.4%) | 81 (50.6%) |
| Transportation | 52 (100.0%) | 0 (0.0%) |
| Material Moving | 6 (3.3%) | 177 (96.7%) |
| Total (Category) | 137 (34.7%) | 258 (65.3%) |
| Total (Overall) | 445 (42.4%) | 605 (57.6%) |
Employment Industries by Sex in Sylvania
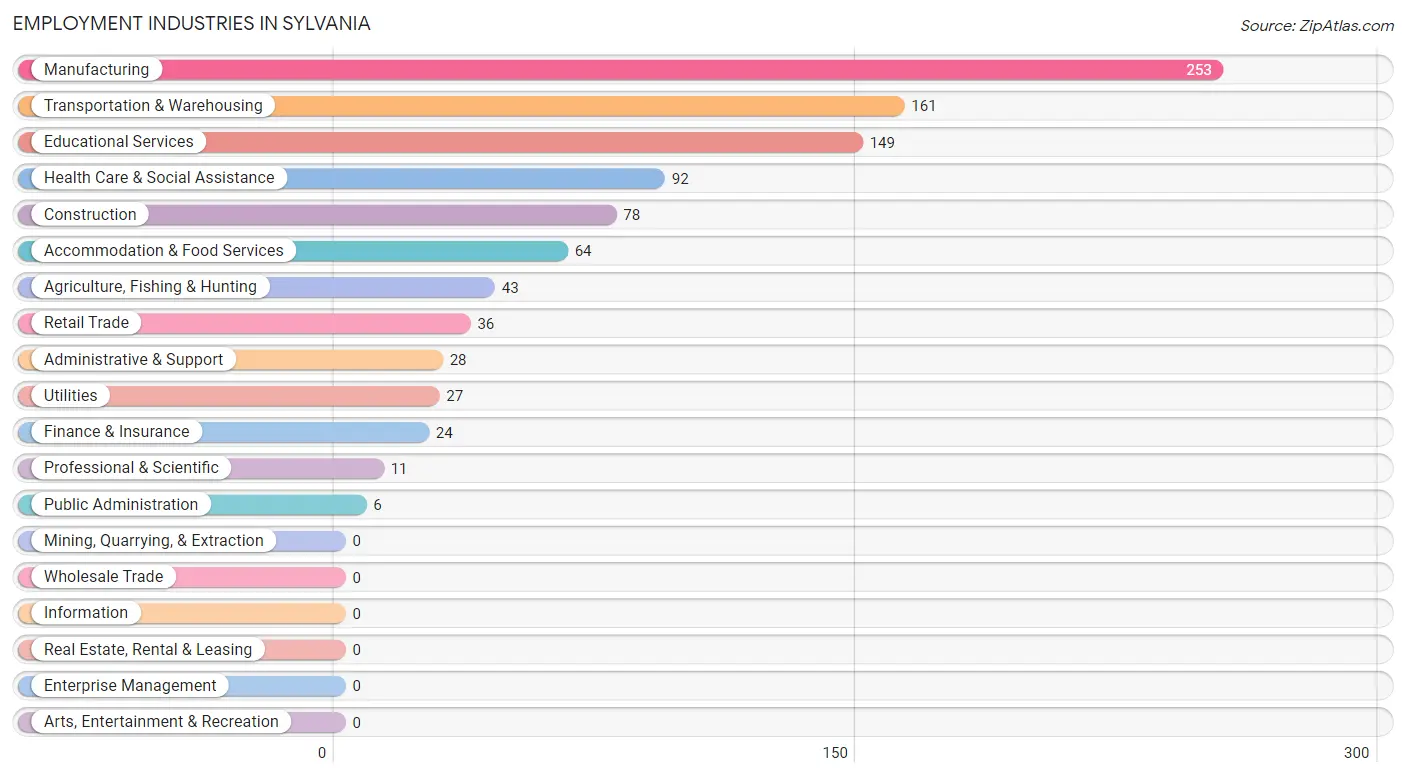
Employment Industries in Sylvania
The major employment industries in Sylvania include Manufacturing (253 | 24.1%), Transportation & Warehousing (161 | 15.3%), Educational Services (149 | 14.2%), Health Care & Social Assistance (92 | 8.8%), and Construction (78 | 7.4%).
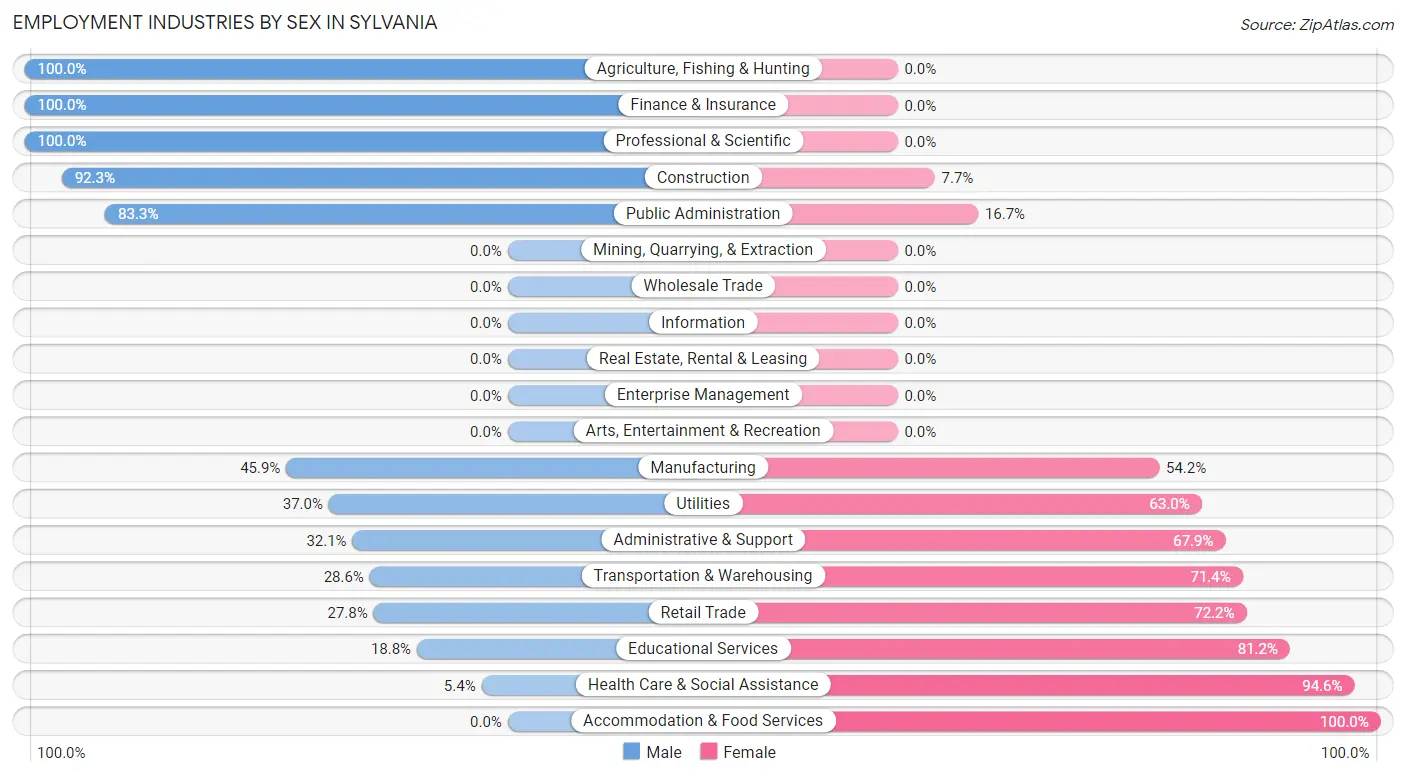
Employment Industries by Sex in Sylvania
The Sylvania industries that see more men than women are Agriculture, Fishing & Hunting (100.0%), Finance & Insurance (100.0%), and Professional & Scientific (100.0%), whereas the industries that tend to have a higher number of women are Accommodation & Food Services (100.0%), Health Care & Social Assistance (94.6%), and Educational Services (81.2%).
| Industry | Male | Female |
| Agriculture, Fishing & Hunting | 43 (100.0%) | 0 (0.0%) |
| Mining, Quarrying, & Extraction | 0 (0.0%) | 0 (0.0%) |
| Construction | 72 (92.3%) | 6 (7.7%) |
| Manufacturing | 116 (45.9%) | 137 (54.1%) |
| Wholesale Trade | 0 (0.0%) | 0 (0.0%) |
| Retail Trade | 10 (27.8%) | 26 (72.2%) |
| Transportation & Warehousing | 46 (28.6%) | 115 (71.4%) |
| Utilities | 10 (37.0%) | 17 (63.0%) |
| Information | 0 (0.0%) | 0 (0.0%) |
| Finance & Insurance | 24 (100.0%) | 0 (0.0%) |
| Real Estate, Rental & Leasing | 0 (0.0%) | 0 (0.0%) |
| Professional & Scientific | 11 (100.0%) | 0 (0.0%) |
| Enterprise Management | 0 (0.0%) | 0 (0.0%) |
| Administrative & Support | 9 (32.1%) | 19 (67.9%) |
| Educational Services | 28 (18.8%) | 121 (81.2%) |
| Health Care & Social Assistance | 5 (5.4%) | 87 (94.6%) |
| Arts, Entertainment & Recreation | 0 (0.0%) | 0 (0.0%) |
| Accommodation & Food Services | 0 (0.0%) | 64 (100.0%) |
| Public Administration | 5 (83.3%) | 1 (16.7%) |
| Total | 445 (42.4%) | 605 (57.6%) |
Education in Sylvania
School Enrollment in Sylvania
The most common levels of schooling among the 501 students in Sylvania are middle school (169 | 33.7%), elementary school (168 | 33.5%), and high school (97 | 19.4%).
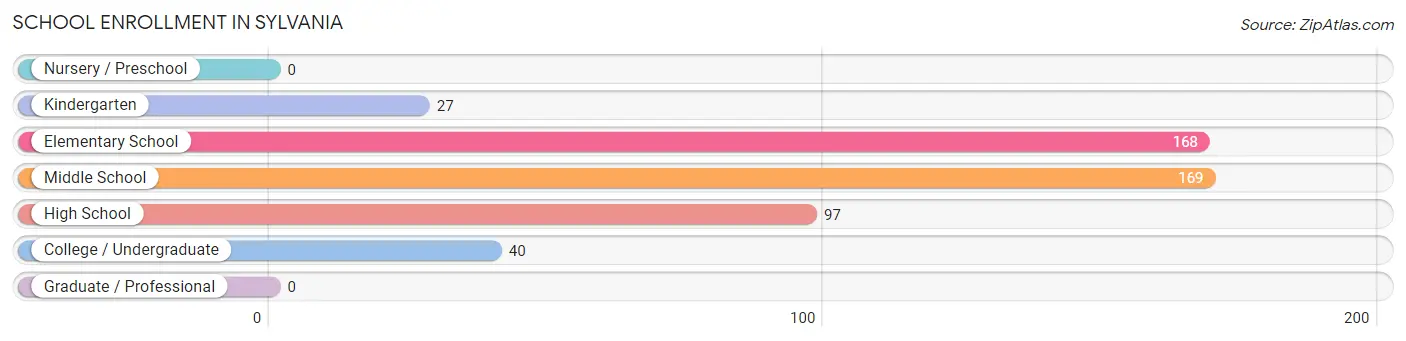
| School Level | # Students | % Students |
| Nursery / Preschool | 0 | 0.0% |
| Kindergarten | 27 | 5.4% |
| Elementary School | 168 | 33.5% |
| Middle School | 169 | 33.7% |
| High School | 97 | 19.4% |
| College / Undergraduate | 40 | 8.0% |
| Graduate / Professional | 0 | 0.0% |
| Total | 501 | 100.0% |
School Enrollment by Age by Funding Source in Sylvania
Out of a total of 501 students who are enrolled in schools in Sylvania, 14 (2.8%) attend a private institution, while the remaining 487 (97.2%) are enrolled in public schools. The age group of 5 to 9 year old has the highest likelihood of being enrolled in private schools, with 7 (4.4% in the age bracket) enrolled. Conversely, the age group of 15 to 17 year olds has the lowest likelihood of being enrolled in a private school, with 60 (100.0% in the age bracket) attending a public institution.
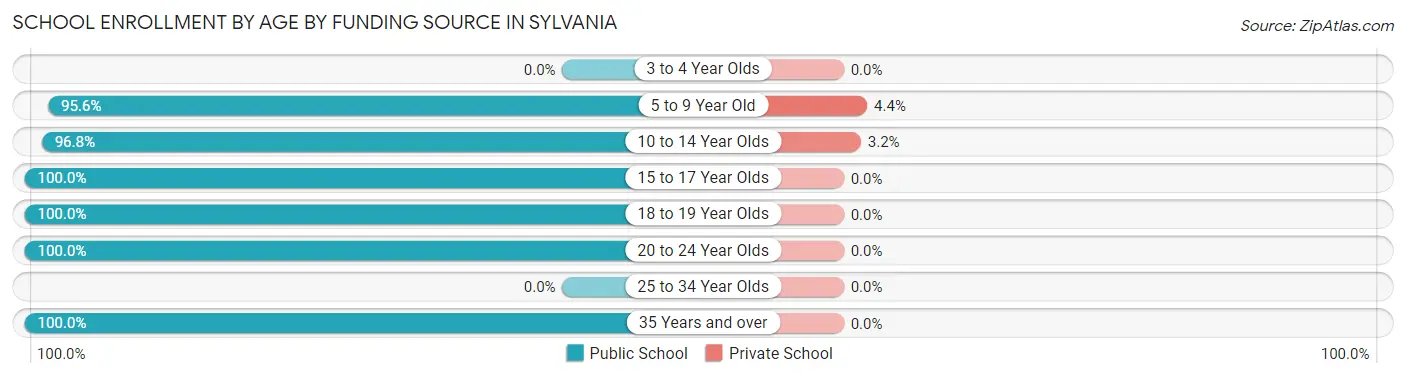
| Age Bracket | Public School | Private School |
| 3 to 4 Year Olds | 0 (0.0%) | 0 (0.0%) |
| 5 to 9 Year Old | 153 (95.6%) | 7 (4.4%) |
| 10 to 14 Year Olds | 212 (96.8%) | 7 (3.2%) |
| 15 to 17 Year Olds | 60 (100.0%) | 0 (0.0%) |
| 18 to 19 Year Olds | 31 (100.0%) | 0 (0.0%) |
| 20 to 24 Year Olds | 21 (100.0%) | 0 (0.0%) |
| 25 to 34 Year Olds | 0 (0.0%) | 0 (0.0%) |
| 35 Years and over | 10 (100.0%) | 0 (0.0%) |
| Total | 487 (97.2%) | 14 (2.8%) |
Educational Attainment by Field of Study in Sylvania
Science & technology (68 | 23.3%), business (54 | 18.5%), liberal arts & history (48 | 16.4%), education (47 | 16.1%), and literature & languages (17 | 5.8%) are the most common fields of study among 292 individuals in Sylvania who have obtained a bachelor's degree or higher.
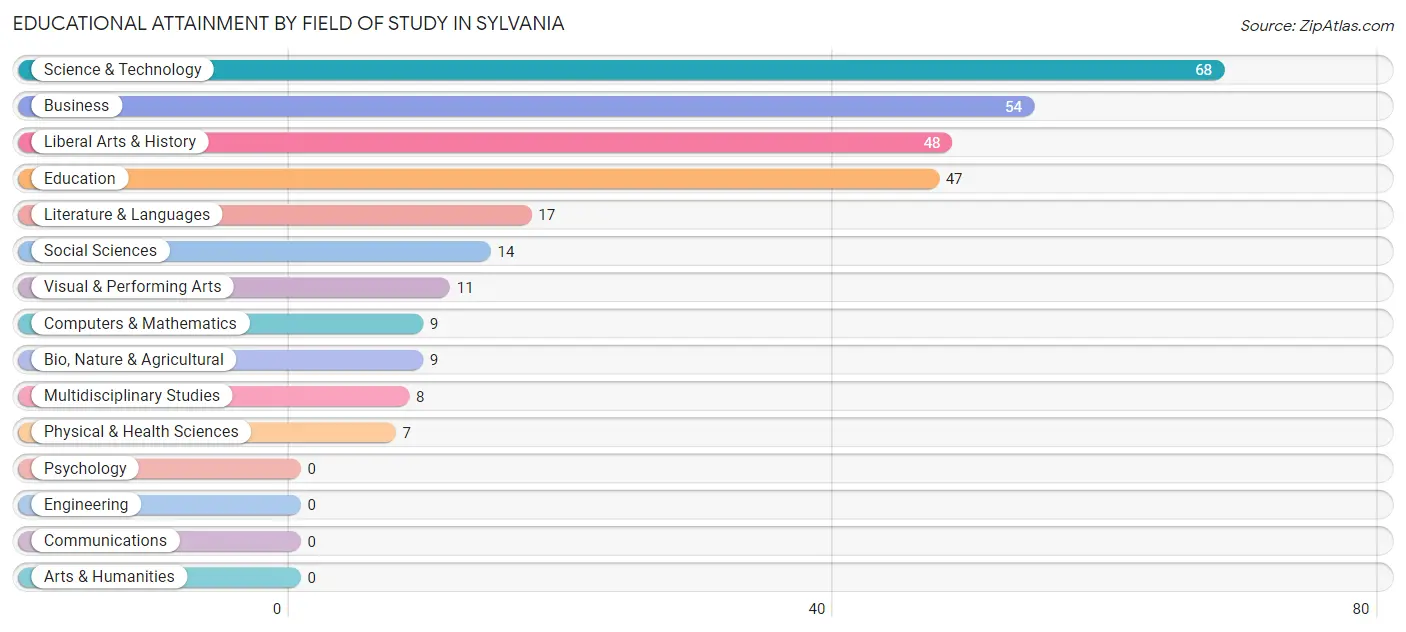
| Field of Study | # Graduates | % Graduates |
| Computers & Mathematics | 9 | 3.1% |
| Bio, Nature & Agricultural | 9 | 3.1% |
| Physical & Health Sciences | 7 | 2.4% |
| Psychology | 0 | 0.0% |
| Social Sciences | 14 | 4.8% |
| Engineering | 0 | 0.0% |
| Multidisciplinary Studies | 8 | 2.7% |
| Science & Technology | 68 | 23.3% |
| Business | 54 | 18.5% |
| Education | 47 | 16.1% |
| Literature & Languages | 17 | 5.8% |
| Liberal Arts & History | 48 | 16.4% |
| Visual & Performing Arts | 11 | 3.8% |
| Communications | 0 | 0.0% |
| Arts & Humanities | 0 | 0.0% |
| Total | 292 | 100.0% |
Transportation & Commute in Sylvania
Vehicle Availability by Sex in Sylvania
The most prevalent vehicle ownership categories in Sylvania are males with 2 vehicles (186, accounting for 44.1%) and females with 2 vehicles (296, making up 34.3%).
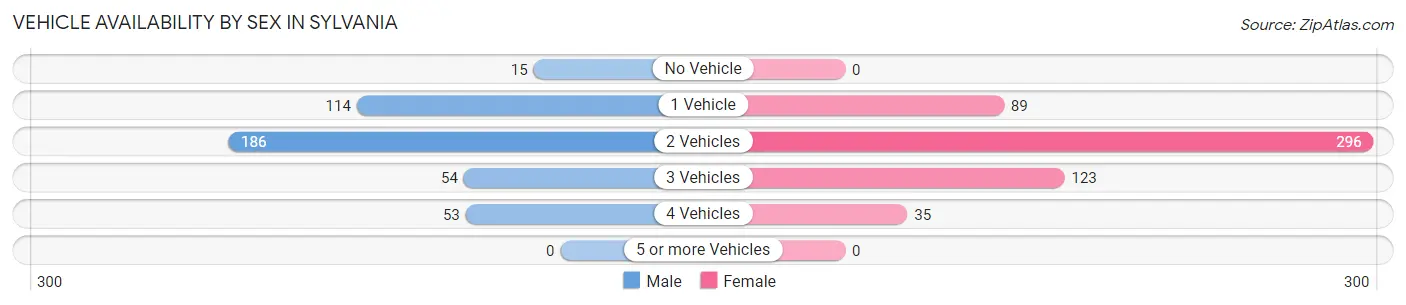
| Vehicles Available | Male | Female |
| No Vehicle | 15 (3.5%) | 0 (0.0%) |
| 1 Vehicle | 114 (27.0%) | 89 (16.4%) |
| 2 Vehicles | 186 (44.1%) | 296 (54.5%) |
| 3 Vehicles | 54 (12.8%) | 123 (22.7%) |
| 4 Vehicles | 53 (12.6%) | 35 (6.5%) |
| 5 or more Vehicles | 0 (0.0%) | 0 (0.0%) |
| Total | 422 (100.0%) | 543 (100.0%) |
Commute Time in Sylvania
The most frequently occuring commute durations in Sylvania are 5 to 9 minutes (191 commuters, 20.4%), 45 to 59 minutes (137 commuters, 14.6%), and 90 or more minutes (125 commuters, 13.3%).
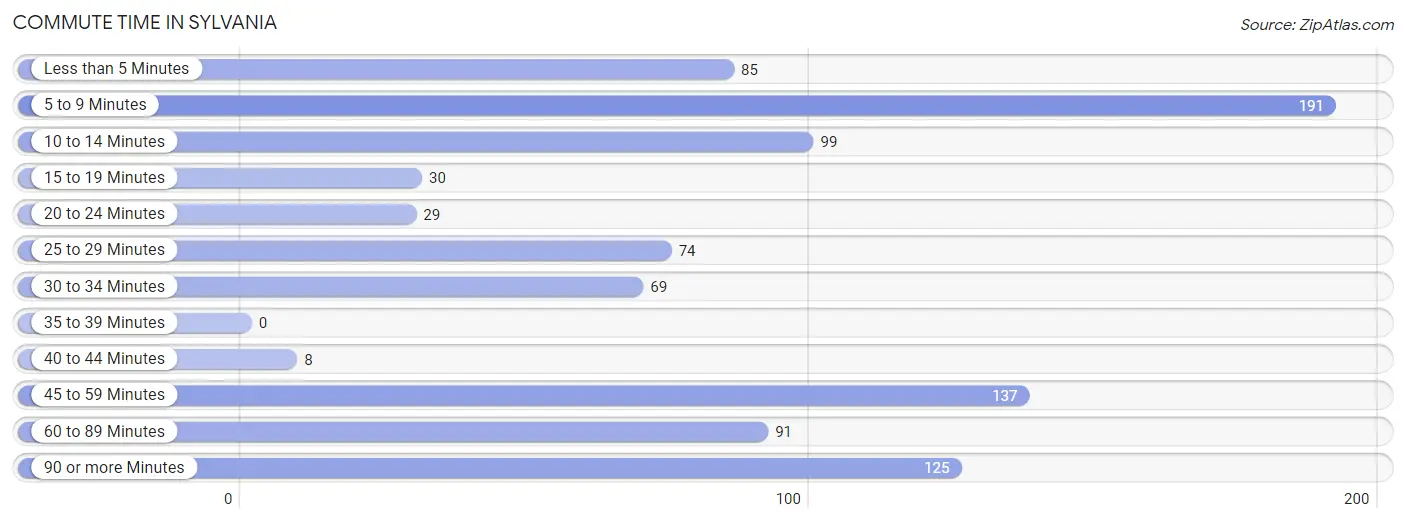
| Commute Time | # Commuters | % Commuters |
| Less than 5 Minutes | 85 | 9.1% |
| 5 to 9 Minutes | 191 | 20.4% |
| 10 to 14 Minutes | 99 | 10.5% |
| 15 to 19 Minutes | 30 | 3.2% |
| 20 to 24 Minutes | 29 | 3.1% |
| 25 to 29 Minutes | 74 | 7.9% |
| 30 to 34 Minutes | 69 | 7.4% |
| 35 to 39 Minutes | 0 | 0.0% |
| 40 to 44 Minutes | 8 | 0.9% |
| 45 to 59 Minutes | 137 | 14.6% |
| 60 to 89 Minutes | 91 | 9.7% |
| 90 or more Minutes | 125 | 13.3% |
Commute Time by Sex in Sylvania
The most common commute times in Sylvania are 90 or more minutes (95 commuters, 23.1%) for males and 5 to 9 minutes (105 commuters, 20.0%) for females.
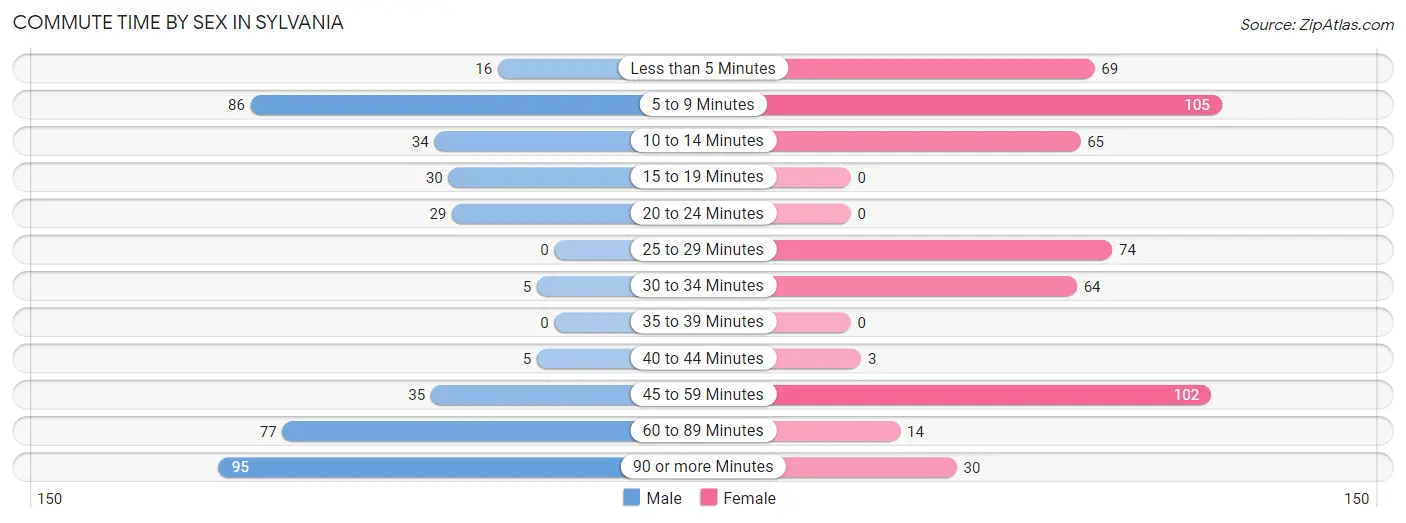
| Commute Time | Male | Female |
| Less than 5 Minutes | 16 (3.9%) | 69 (13.1%) |
| 5 to 9 Minutes | 86 (20.9%) | 105 (20.0%) |
| 10 to 14 Minutes | 34 (8.3%) | 65 (12.4%) |
| 15 to 19 Minutes | 30 (7.3%) | 0 (0.0%) |
| 20 to 24 Minutes | 29 (7.0%) | 0 (0.0%) |
| 25 to 29 Minutes | 0 (0.0%) | 74 (14.1%) |
| 30 to 34 Minutes | 5 (1.2%) | 64 (12.2%) |
| 35 to 39 Minutes | 0 (0.0%) | 0 (0.0%) |
| 40 to 44 Minutes | 5 (1.2%) | 3 (0.6%) |
| 45 to 59 Minutes | 35 (8.5%) | 102 (19.4%) |
| 60 to 89 Minutes | 77 (18.7%) | 14 (2.7%) |
| 90 or more Minutes | 95 (23.1%) | 30 (5.7%) |
Time of Departure to Work by Sex in Sylvania
The most frequent times of departure to work in Sylvania are 12:00 AM to 4:59 AM (127, 30.8%) for males and 12:00 AM to 4:59 AM (93, 17.7%) for females.
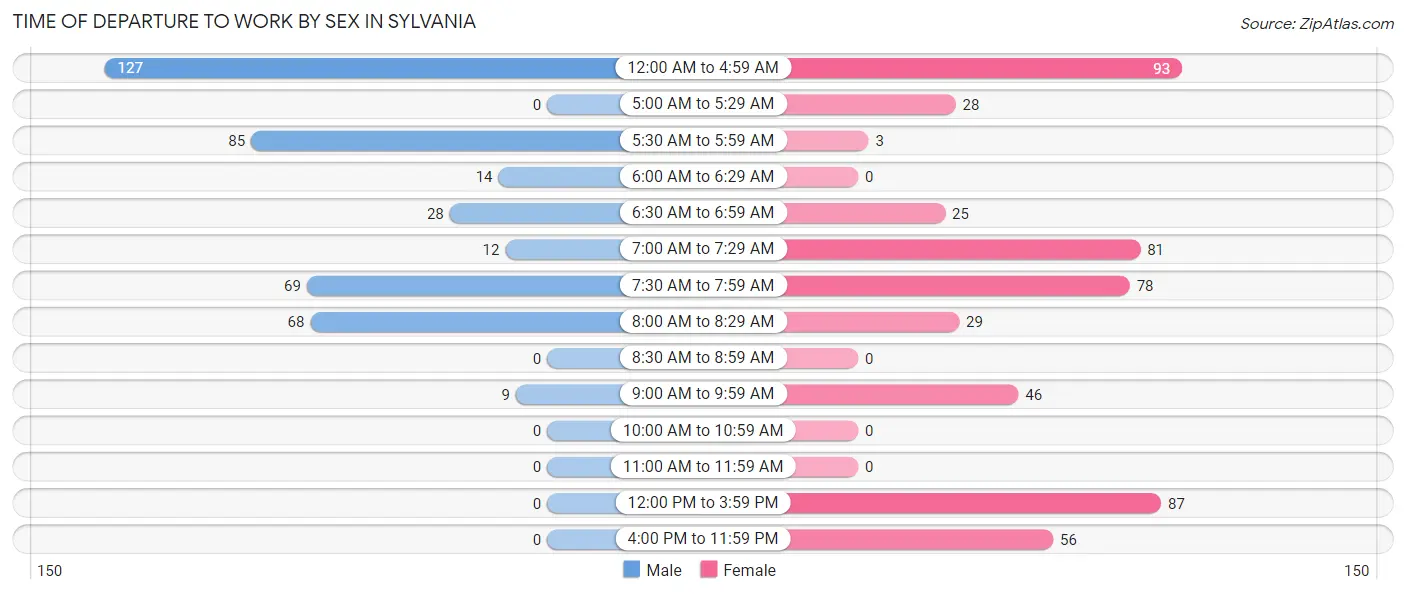
| Time of Departure | Male | Female |
| 12:00 AM to 4:59 AM | 127 (30.8%) | 93 (17.7%) |
| 5:00 AM to 5:29 AM | 0 (0.0%) | 28 (5.3%) |
| 5:30 AM to 5:59 AM | 85 (20.6%) | 3 (0.6%) |
| 6:00 AM to 6:29 AM | 14 (3.4%) | 0 (0.0%) |
| 6:30 AM to 6:59 AM | 28 (6.8%) | 25 (4.8%) |
| 7:00 AM to 7:29 AM | 12 (2.9%) | 81 (15.4%) |
| 7:30 AM to 7:59 AM | 69 (16.8%) | 78 (14.8%) |
| 8:00 AM to 8:29 AM | 68 (16.5%) | 29 (5.5%) |
| 8:30 AM to 8:59 AM | 0 (0.0%) | 0 (0.0%) |
| 9:00 AM to 9:59 AM | 9 (2.2%) | 46 (8.7%) |
| 10:00 AM to 10:59 AM | 0 (0.0%) | 0 (0.0%) |
| 11:00 AM to 11:59 AM | 0 (0.0%) | 0 (0.0%) |
| 12:00 PM to 3:59 PM | 0 (0.0%) | 87 (16.5%) |
| 4:00 PM to 11:59 PM | 0 (0.0%) | 56 (10.6%) |
| Total | 412 (100.0%) | 526 (100.0%) |
Housing Occupancy in Sylvania
Occupancy by Ownership in Sylvania
Of the total 957 dwellings in Sylvania, owner-occupied units account for 589 (61.6%), while renter-occupied units make up 368 (38.5%).
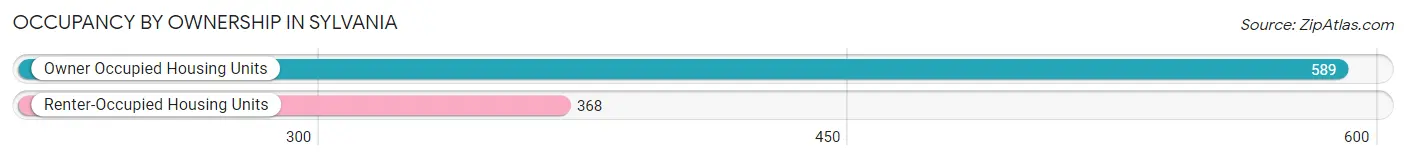
| Occupancy | # Housing Units | % Housing Units |
| Owner Occupied Housing Units | 589 | 61.6% |
| Renter-Occupied Housing Units | 368 | 38.5% |
| Total Occupied Housing Units | 957 | 100.0% |
Occupancy by Household Size in Sylvania
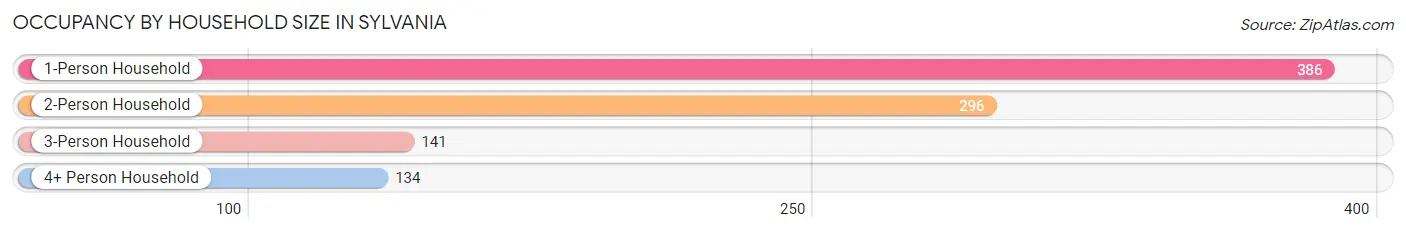
| Household Size | # Housing Units | % Housing Units |
| 1-Person Household | 386 | 40.3% |
| 2-Person Household | 296 | 30.9% |
| 3-Person Household | 141 | 14.7% |
| 4+ Person Household | 134 | 14.0% |
| Total Housing Units | 957 | 100.0% |
Occupancy by Ownership by Household Size in Sylvania
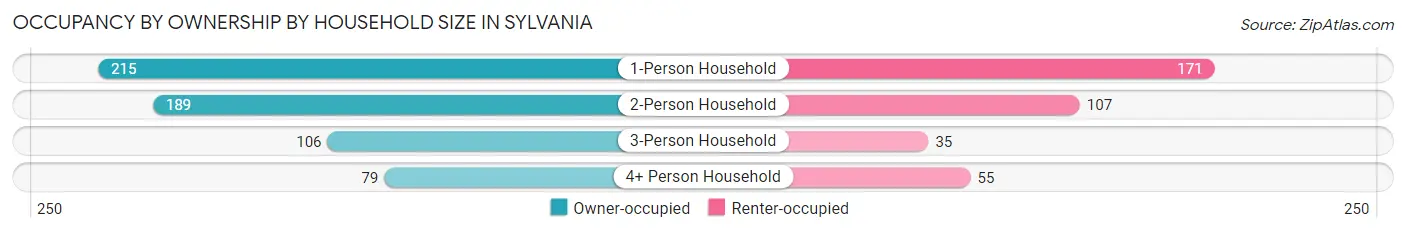
| Household Size | Owner-occupied | Renter-occupied |
| 1-Person Household | 215 (55.7%) | 171 (44.3%) |
| 2-Person Household | 189 (63.8%) | 107 (36.1%) |
| 3-Person Household | 106 (75.2%) | 35 (24.8%) |
| 4+ Person Household | 79 (59.0%) | 55 (41.0%) |
| Total Housing Units | 589 (61.6%) | 368 (38.5%) |
Occupancy by Educational Attainment in Sylvania
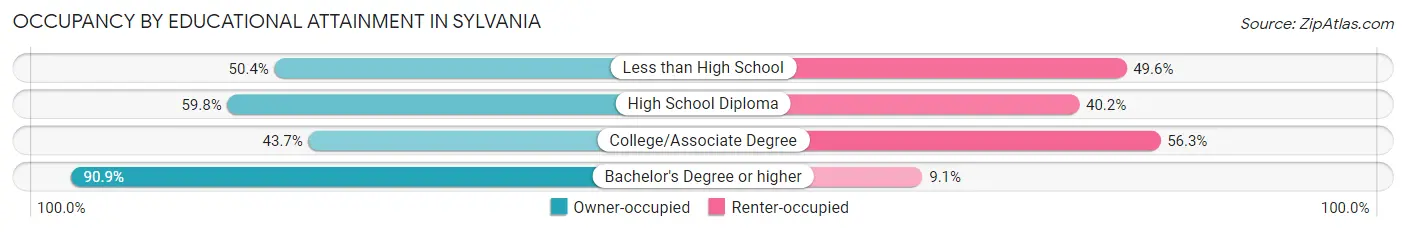
| Household Size | Owner-occupied | Renter-occupied |
| Less than High School | 60 (50.4%) | 59 (49.6%) |
| High School Diploma | 260 (59.8%) | 175 (40.2%) |
| College/Associate Degree | 90 (43.7%) | 116 (56.3%) |
| Bachelor's Degree or higher | 179 (90.9%) | 18 (9.1%) |
Occupancy by Age of Householder in Sylvania
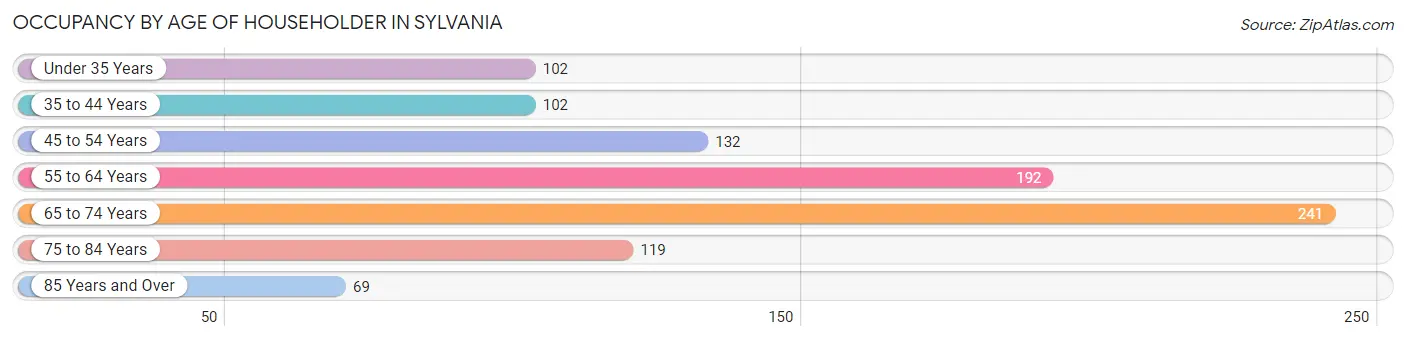
| Age Bracket | # Households | % Households |
| Under 35 Years | 102 | 10.7% |
| 35 to 44 Years | 102 | 10.7% |
| 45 to 54 Years | 132 | 13.8% |
| 55 to 64 Years | 192 | 20.1% |
| 65 to 74 Years | 241 | 25.2% |
| 75 to 84 Years | 119 | 12.4% |
| 85 Years and Over | 69 | 7.2% |
| Total | 957 | 100.0% |
Housing Finances in Sylvania
Median Income by Occupancy in Sylvania
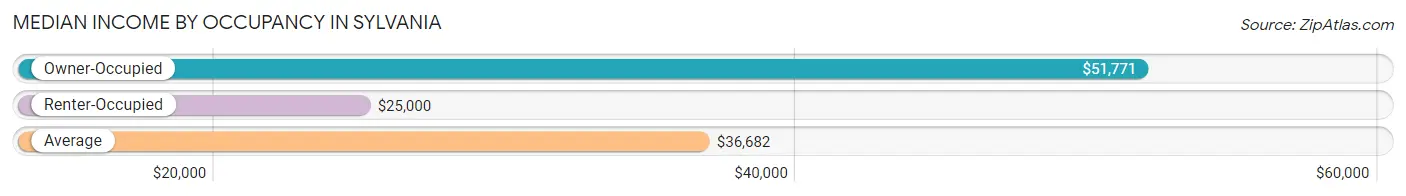
| Occupancy Type | # Households | Median Income |
| Owner-Occupied | 589 (61.6%) | $51,771 |
| Renter-Occupied | 368 (38.5%) | $25,000 |
| Average | 957 (100.0%) | $36,682 |
Occupancy by Householder Income Bracket in Sylvania
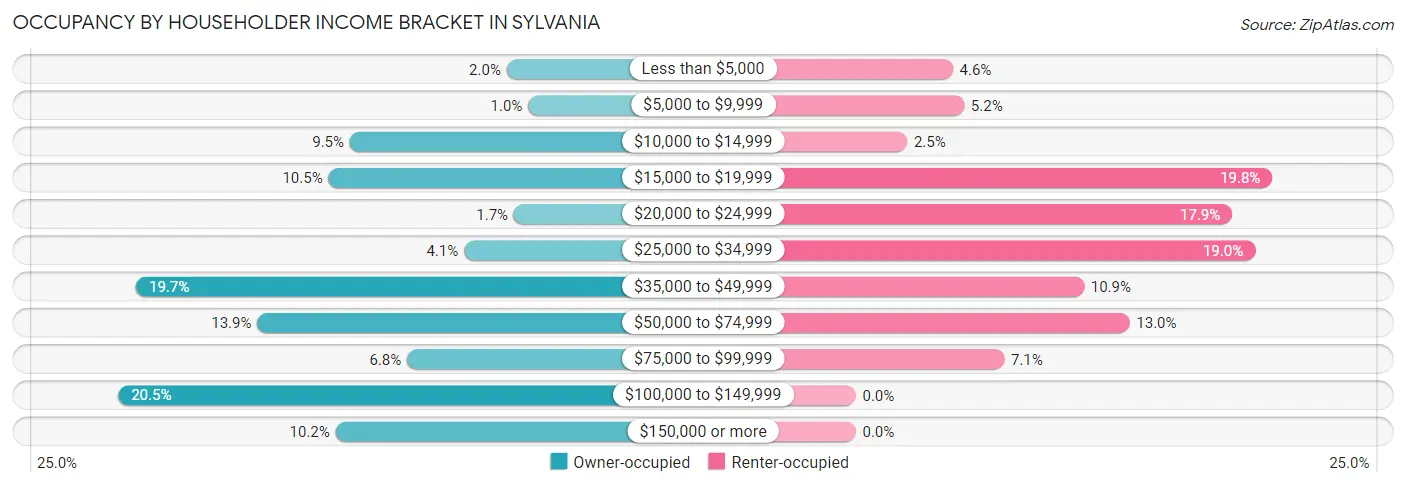
| Income Bracket | Owner-occupied | Renter-occupied |
| Less than $5,000 | 12 (2.0%) | 17 (4.6%) |
| $5,000 to $9,999 | 6 (1.0%) | 19 (5.2%) |
| $10,000 to $14,999 | 56 (9.5%) | 9 (2.5%) |
| $15,000 to $19,999 | 62 (10.5%) | 73 (19.8%) |
| $20,000 to $24,999 | 10 (1.7%) | 66 (17.9%) |
| $25,000 to $34,999 | 24 (4.1%) | 70 (19.0%) |
| $35,000 to $49,999 | 116 (19.7%) | 40 (10.9%) |
| $50,000 to $74,999 | 82 (13.9%) | 48 (13.0%) |
| $75,000 to $99,999 | 40 (6.8%) | 26 (7.1%) |
| $100,000 to $149,999 | 121 (20.5%) | 0 (0.0%) |
| $150,000 or more | 60 (10.2%) | 0 (0.0%) |
| Total | 589 (100.0%) | 368 (100.0%) |
Monthly Housing Cost Tiers in Sylvania
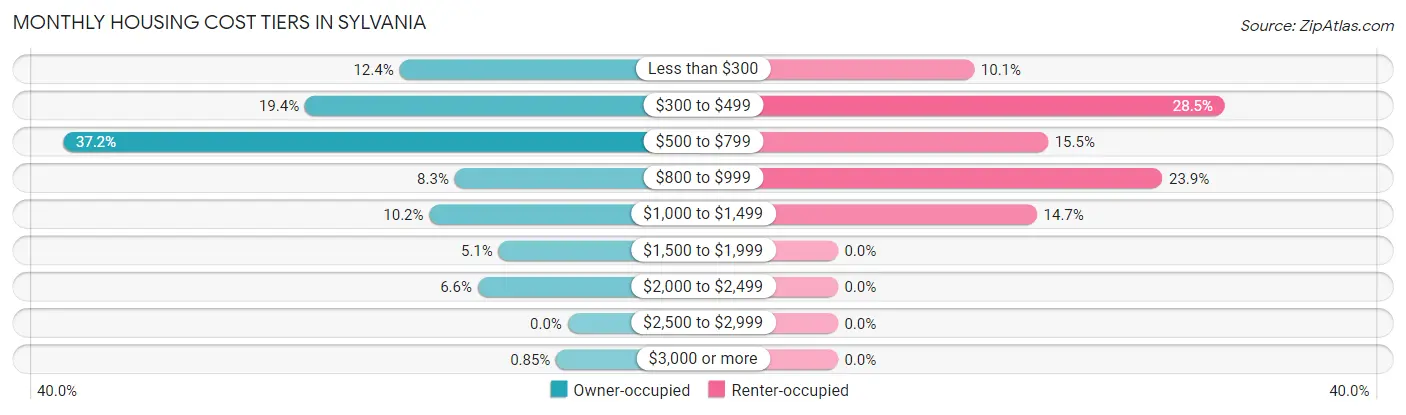
| Monthly Cost | Owner-occupied | Renter-occupied |
| Less than $300 | 73 (12.4%) | 37 (10.1%) |
| $300 to $499 | 114 (19.4%) | 105 (28.5%) |
| $500 to $799 | 219 (37.2%) | 57 (15.5%) |
| $800 to $999 | 49 (8.3%) | 88 (23.9%) |
| $1,000 to $1,499 | 60 (10.2%) | 54 (14.7%) |
| $1,500 to $1,999 | 30 (5.1%) | 0 (0.0%) |
| $2,000 to $2,499 | 39 (6.6%) | 0 (0.0%) |
| $2,500 to $2,999 | 0 (0.0%) | 0 (0.0%) |
| $3,000 or more | 5 (0.9%) | 0 (0.0%) |
| Total | 589 (100.0%) | 368 (100.0%) |
Physical Housing Characteristics in Sylvania
Housing Structures in Sylvania
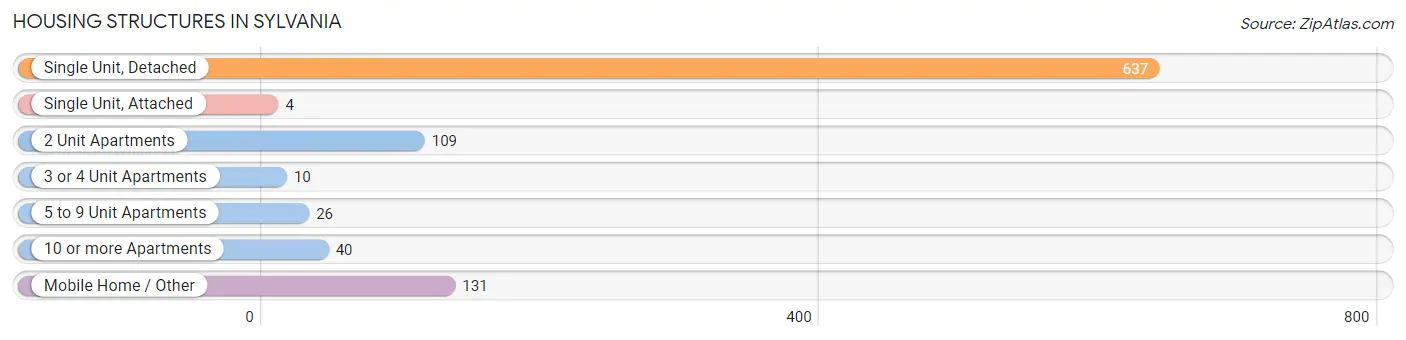
| Structure Type | # Housing Units | % Housing Units |
| Single Unit, Detached | 637 | 66.6% |
| Single Unit, Attached | 4 | 0.4% |
| 2 Unit Apartments | 109 | 11.4% |
| 3 or 4 Unit Apartments | 10 | 1.0% |
| 5 to 9 Unit Apartments | 26 | 2.7% |
| 10 or more Apartments | 40 | 4.2% |
| Mobile Home / Other | 131 | 13.7% |
| Total | 957 | 100.0% |
Housing Structures by Occupancy in Sylvania
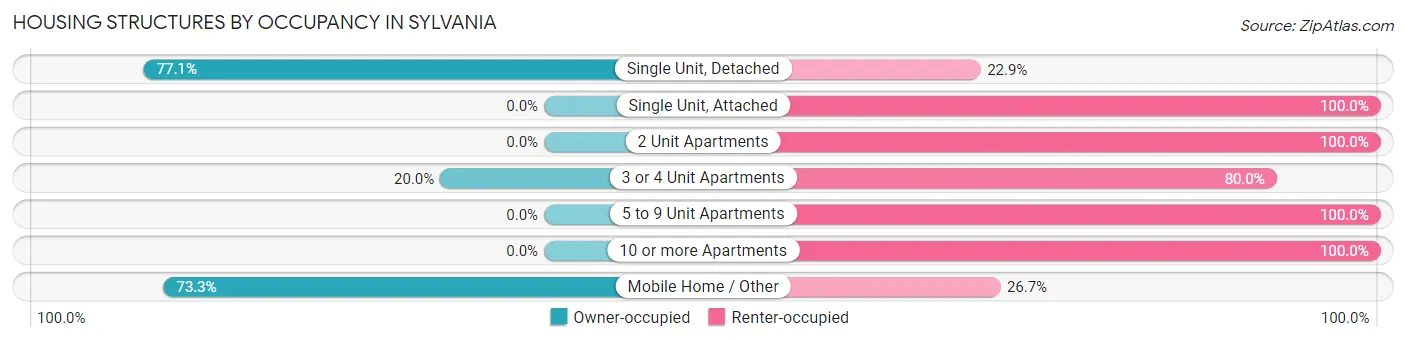
| Structure Type | Owner-occupied | Renter-occupied |
| Single Unit, Detached | 491 (77.1%) | 146 (22.9%) |
| Single Unit, Attached | 0 (0.0%) | 4 (100.0%) |
| 2 Unit Apartments | 0 (0.0%) | 109 (100.0%) |
| 3 or 4 Unit Apartments | 2 (20.0%) | 8 (80.0%) |
| 5 to 9 Unit Apartments | 0 (0.0%) | 26 (100.0%) |
| 10 or more Apartments | 0 (0.0%) | 40 (100.0%) |
| Mobile Home / Other | 96 (73.3%) | 35 (26.7%) |
| Total | 589 (61.6%) | 368 (38.5%) |
Housing Structures by Number of Rooms in Sylvania
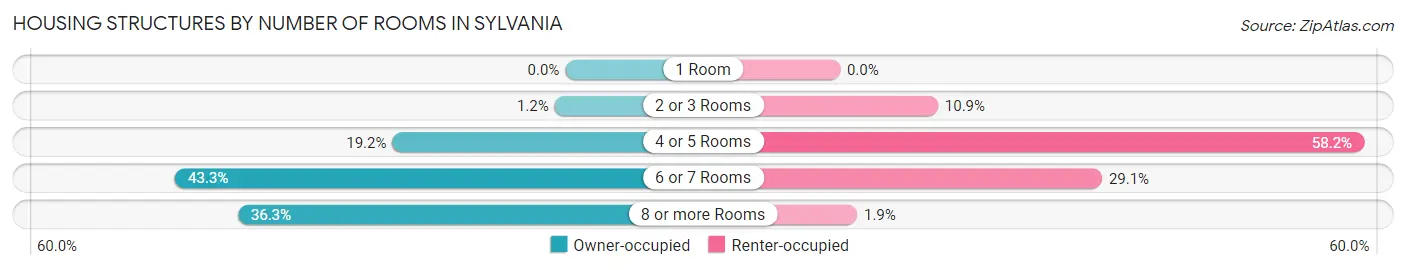
| Number of Rooms | Owner-occupied | Renter-occupied |
| 1 Room | 0 (0.0%) | 0 (0.0%) |
| 2 or 3 Rooms | 7 (1.2%) | 40 (10.9%) |
| 4 or 5 Rooms | 113 (19.2%) | 214 (58.2%) |
| 6 or 7 Rooms | 255 (43.3%) | 107 (29.1%) |
| 8 or more Rooms | 214 (36.3%) | 7 (1.9%) |
| Total | 589 (100.0%) | 368 (100.0%) |
Housing Structure by Heating Type in Sylvania
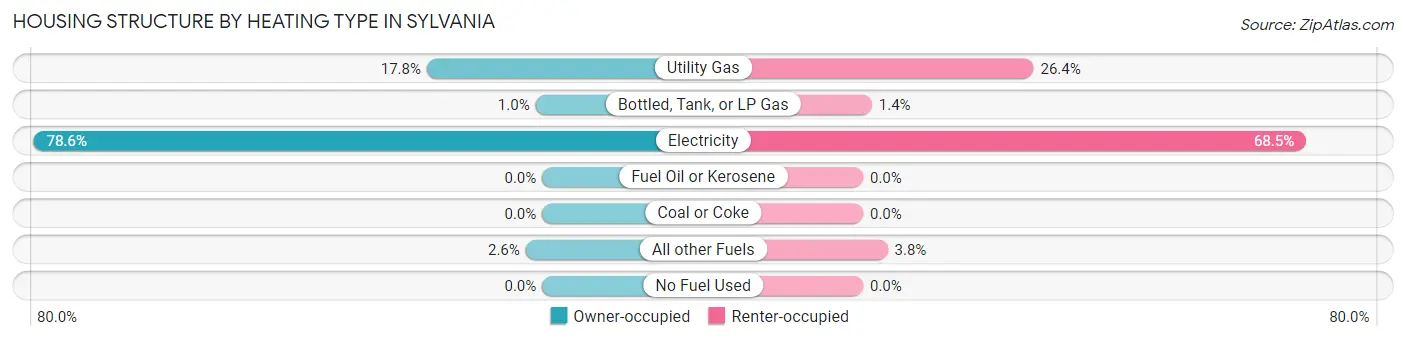
| Heating Type | Owner-occupied | Renter-occupied |
| Utility Gas | 105 (17.8%) | 97 (26.4%) |
| Bottled, Tank, or LP Gas | 6 (1.0%) | 5 (1.4%) |
| Electricity | 463 (78.6%) | 252 (68.5%) |
| Fuel Oil or Kerosene | 0 (0.0%) | 0 (0.0%) |
| Coal or Coke | 0 (0.0%) | 0 (0.0%) |
| All other Fuels | 15 (2.5%) | 14 (3.8%) |
| No Fuel Used | 0 (0.0%) | 0 (0.0%) |
| Total | 589 (100.0%) | 368 (100.0%) |
Household Vehicle Usage in Sylvania
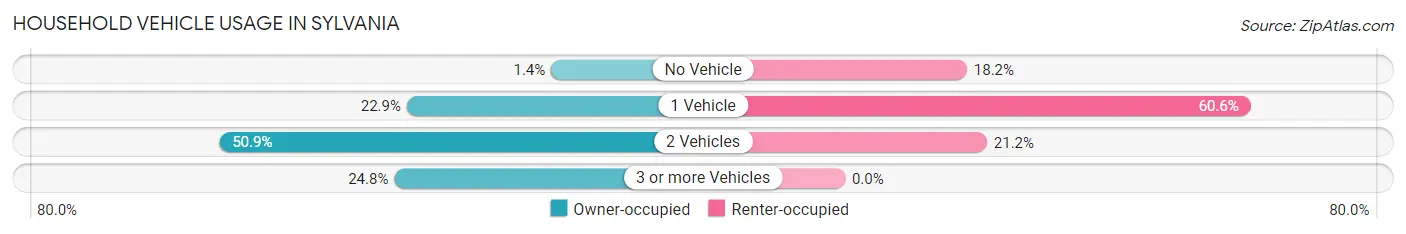
| Vehicles per Household | Owner-occupied | Renter-occupied |
| No Vehicle | 8 (1.4%) | 67 (18.2%) |
| 1 Vehicle | 135 (22.9%) | 223 (60.6%) |
| 2 Vehicles | 300 (50.9%) | 78 (21.2%) |
| 3 or more Vehicles | 146 (24.8%) | 0 (0.0%) |
| Total | 589 (100.0%) | 368 (100.0%) |
Real Estate & Mortgages in Sylvania
Real Estate and Mortgage Overview in Sylvania
| Characteristic | Without Mortgage | With Mortgage |
| Housing Units | 321 | 268 |
| Median Property Value | $107,300 | $93,600 |
| Median Household Income | $44,813 | $60 |
| Monthly Housing Costs | $462 | $5 |
| Real Estate Taxes | $1,250 | $19 |
Property Value by Mortgage Status in Sylvania
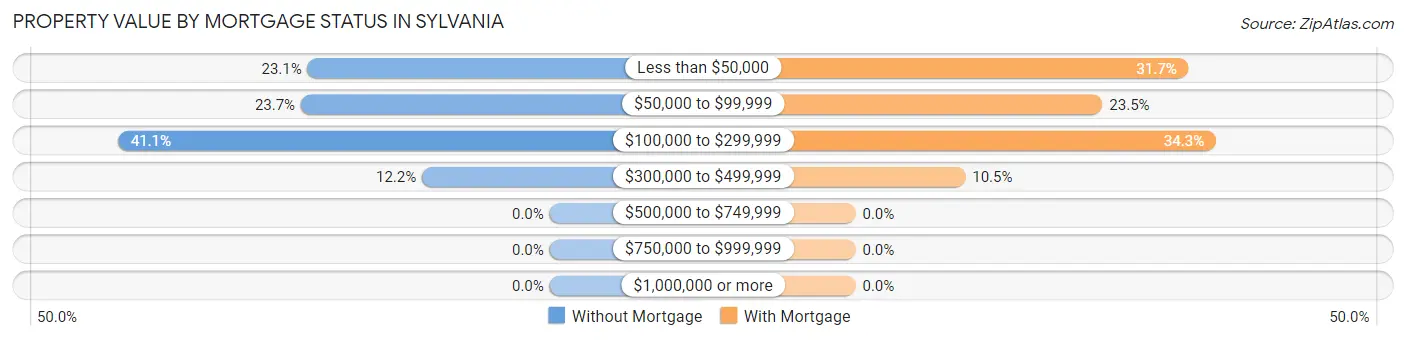
| Property Value | Without Mortgage | With Mortgage |
| Less than $50,000 | 74 (23.1%) | 85 (31.7%) |
| $50,000 to $99,999 | 76 (23.7%) | 63 (23.5%) |
| $100,000 to $299,999 | 132 (41.1%) | 92 (34.3%) |
| $300,000 to $499,999 | 39 (12.1%) | 28 (10.4%) |
| $500,000 to $749,999 | 0 (0.0%) | 0 (0.0%) |
| $750,000 to $999,999 | 0 (0.0%) | 0 (0.0%) |
| $1,000,000 or more | 0 (0.0%) | 0 (0.0%) |
| Total | 321 (100.0%) | 268 (100.0%) |
Household Income by Mortgage Status in Sylvania
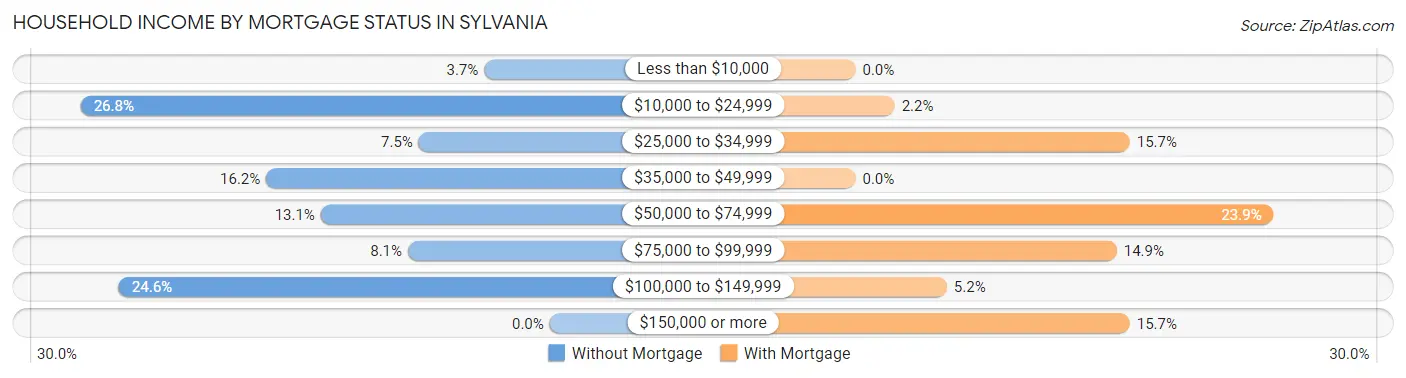
| Household Income | Without Mortgage | With Mortgage |
| Less than $10,000 | 12 (3.7%) | 0 (0.0%) |
| $10,000 to $24,999 | 86 (26.8%) | 6 (2.2%) |
| $25,000 to $34,999 | 24 (7.5%) | 42 (15.7%) |
| $35,000 to $49,999 | 52 (16.2%) | 0 (0.0%) |
| $50,000 to $74,999 | 42 (13.1%) | 64 (23.9%) |
| $75,000 to $99,999 | 26 (8.1%) | 40 (14.9%) |
| $100,000 to $149,999 | 79 (24.6%) | 14 (5.2%) |
| $150,000 or more | 0 (0.0%) | 42 (15.7%) |
| Total | 321 (100.0%) | 268 (100.0%) |
Property Value to Household Income Ratio in Sylvania
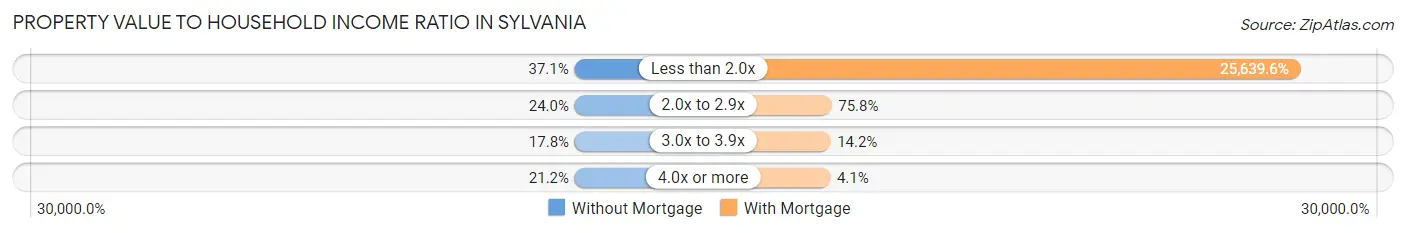
| Value-to-Income Ratio | Without Mortgage | With Mortgage |
| Less than 2.0x | 119 (37.1%) | 68,714 (25,639.6%) |
| 2.0x to 2.9x | 77 (24.0%) | 203 (75.7%) |
| 3.0x to 3.9x | 57 (17.8%) | 38 (14.2%) |
| 4.0x or more | 68 (21.2%) | 11 (4.1%) |
| Total | 321 (100.0%) | 268 (100.0%) |
Real Estate Taxes by Mortgage Status in Sylvania
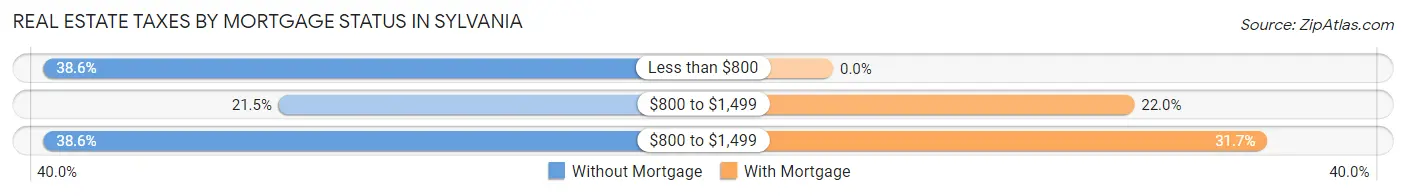
| Property Taxes | Without Mortgage | With Mortgage |
| Less than $800 | 124 (38.6%) | 0 (0.0%) |
| $800 to $1,499 | 69 (21.5%) | 59 (22.0%) |
| $800 to $1,499 | 124 (38.6%) | 85 (31.7%) |
| Total | 321 (100.0%) | 268 (100.0%) |
Health & Disability in Sylvania
Health Insurance Coverage by Age in Sylvania
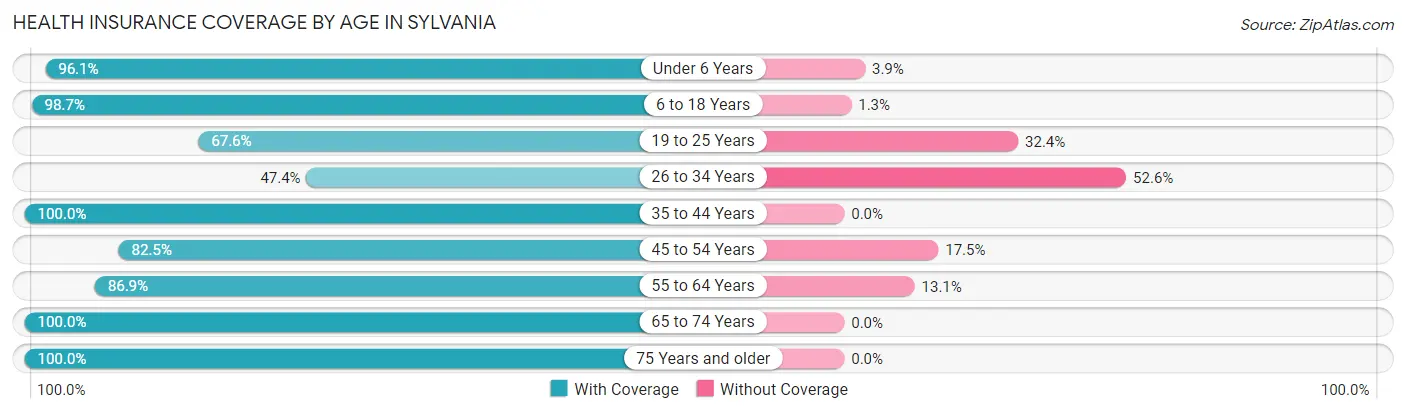
| Age Bracket | With Coverage | Without Coverage |
| Under 6 Years | 149 (96.1%) | 6 (3.9%) |
| 6 to 18 Years | 456 (98.7%) | 6 (1.3%) |
| 19 to 25 Years | 146 (67.6%) | 70 (32.4%) |
| 26 to 34 Years | 102 (47.4%) | 113 (52.6%) |
| 35 to 44 Years | 275 (100.0%) | 0 (0.0%) |
| 45 to 54 Years | 254 (82.5%) | 54 (17.5%) |
| 55 to 64 Years | 265 (86.9%) | 40 (13.1%) |
| 65 to 74 Years | 345 (100.0%) | 0 (0.0%) |
| 75 Years and older | 253 (100.0%) | 0 (0.0%) |
| Total | 2,245 (88.6%) | 289 (11.4%) |
Health Insurance Coverage by Citizenship Status in Sylvania
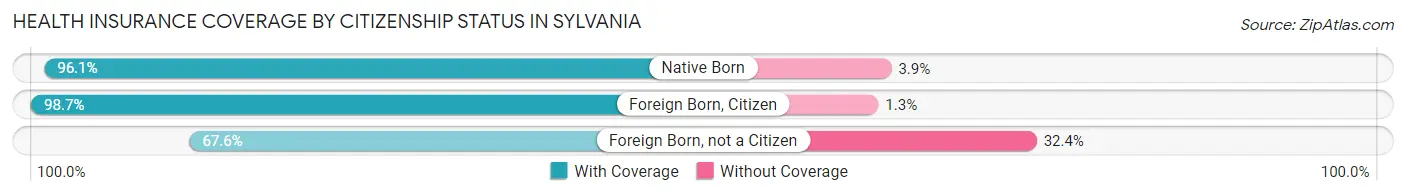
| Citizenship Status | With Coverage | Without Coverage |
| Native Born | 149 (96.1%) | 6 (3.9%) |
| Foreign Born, Citizen | 456 (98.7%) | 6 (1.3%) |
| Foreign Born, not a Citizen | 146 (67.6%) | 70 (32.4%) |
Health Insurance Coverage by Household Income in Sylvania
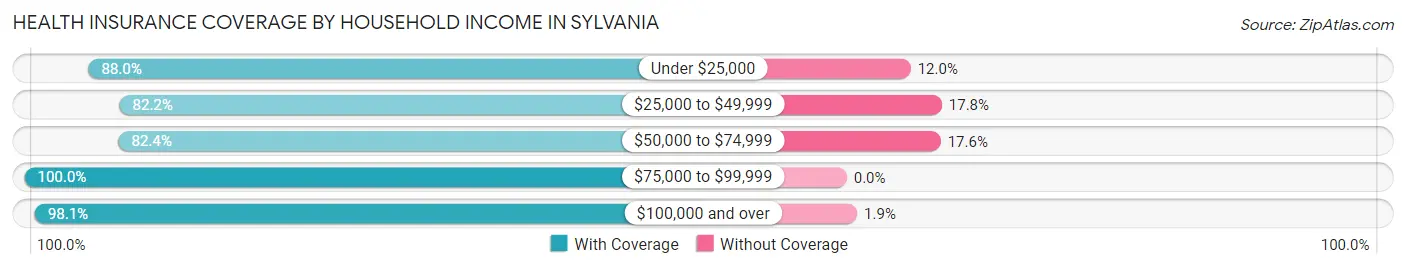
| Household Income | With Coverage | Without Coverage |
| Under $25,000 | 507 (88.0%) | 69 (12.0%) |
| $25,000 to $49,999 | 503 (82.2%) | 109 (17.8%) |
| $50,000 to $74,999 | 454 (82.4%) | 97 (17.6%) |
| $75,000 to $99,999 | 294 (100.0%) | 0 (0.0%) |
| $100,000 and over | 456 (98.1%) | 9 (1.9%) |
Public vs Private Health Insurance Coverage by Age in Sylvania
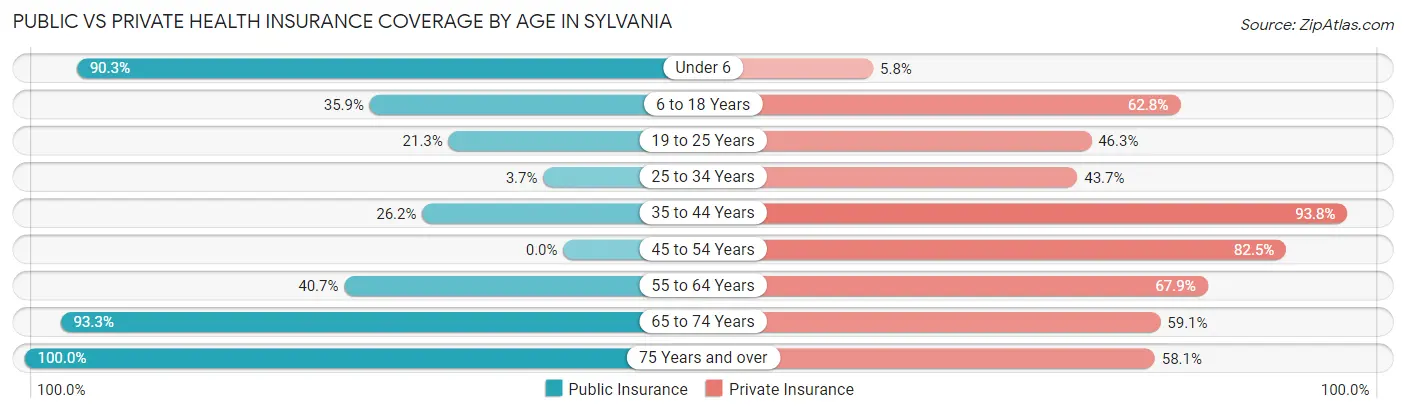
| Age Bracket | Public Insurance | Private Insurance |
| Under 6 | 140 (90.3%) | 9 (5.8%) |
| 6 to 18 Years | 166 (35.9%) | 290 (62.8%) |
| 19 to 25 Years | 46 (21.3%) | 100 (46.3%) |
| 25 to 34 Years | 8 (3.7%) | 94 (43.7%) |
| 35 to 44 Years | 72 (26.2%) | 258 (93.8%) |
| 45 to 54 Years | 0 (0.0%) | 254 (82.5%) |
| 55 to 64 Years | 124 (40.7%) | 207 (67.9%) |
| 65 to 74 Years | 322 (93.3%) | 204 (59.1%) |
| 75 Years and over | 253 (100.0%) | 147 (58.1%) |
| Total | 1,131 (44.6%) | 1,563 (61.7%) |
Disability Status by Sex by Age in Sylvania
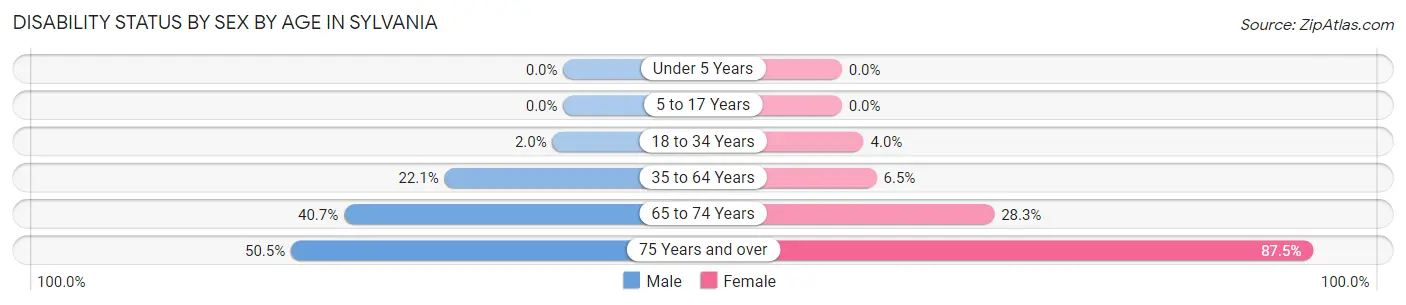
| Age Bracket | Male | Female |
| Under 5 Years | 0 (0.0%) | 0 (0.0%) |
| 5 to 17 Years | 0 (0.0%) | 0 (0.0%) |
| 18 to 34 Years | 5 (2.0%) | 8 (4.0%) |
| 35 to 64 Years | 90 (22.1%) | 31 (6.5%) |
| 65 to 74 Years | 57 (40.7%) | 58 (28.3%) |
| 75 Years and over | 47 (50.5%) | 140 (87.5%) |
Disability Class by Sex by Age in Sylvania
Disability Class: Hearing Difficulty
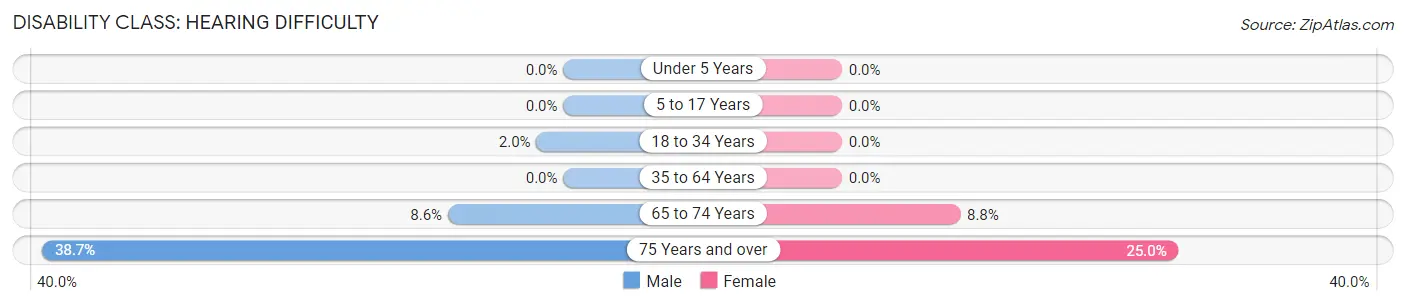
| Age Bracket | Male | Female |
| Under 5 Years | 0 (0.0%) | 0 (0.0%) |
| 5 to 17 Years | 0 (0.0%) | 0 (0.0%) |
| 18 to 34 Years | 5 (2.0%) | 0 (0.0%) |
| 35 to 64 Years | 0 (0.0%) | 0 (0.0%) |
| 65 to 74 Years | 12 (8.6%) | 18 (8.8%) |
| 75 Years and over | 36 (38.7%) | 40 (25.0%) |
Disability Class: Vision Difficulty
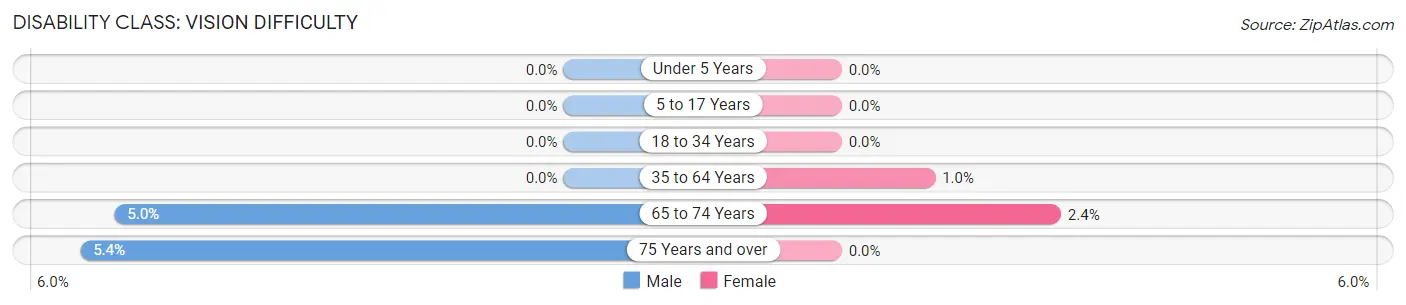
| Age Bracket | Male | Female |
| Under 5 Years | 0 (0.0%) | 0 (0.0%) |
| 5 to 17 Years | 0 (0.0%) | 0 (0.0%) |
| 18 to 34 Years | 0 (0.0%) | 0 (0.0%) |
| 35 to 64 Years | 0 (0.0%) | 5 (1.0%) |
| 65 to 74 Years | 7 (5.0%) | 5 (2.4%) |
| 75 Years and over | 5 (5.4%) | 0 (0.0%) |
Disability Class: Cognitive Difficulty
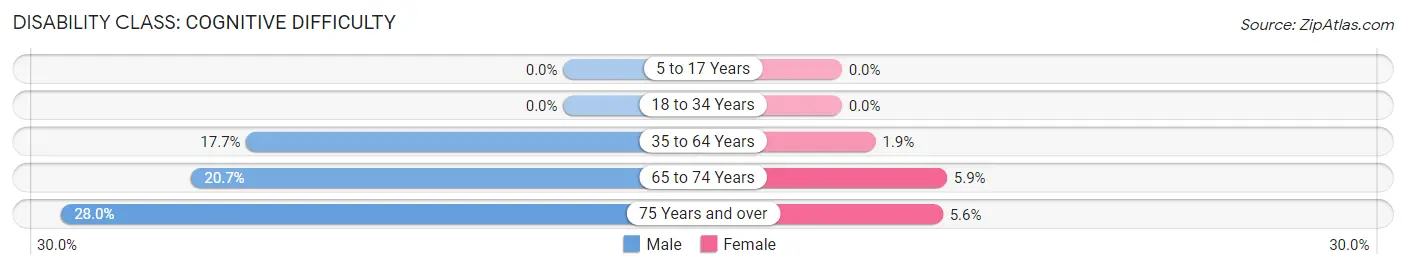
| Age Bracket | Male | Female |
| 5 to 17 Years | 0 (0.0%) | 0 (0.0%) |
| 18 to 34 Years | 0 (0.0%) | 0 (0.0%) |
| 35 to 64 Years | 72 (17.6%) | 9 (1.9%) |
| 65 to 74 Years | 29 (20.7%) | 12 (5.9%) |
| 75 Years and over | 26 (28.0%) | 9 (5.6%) |
Disability Class: Ambulatory Difficulty
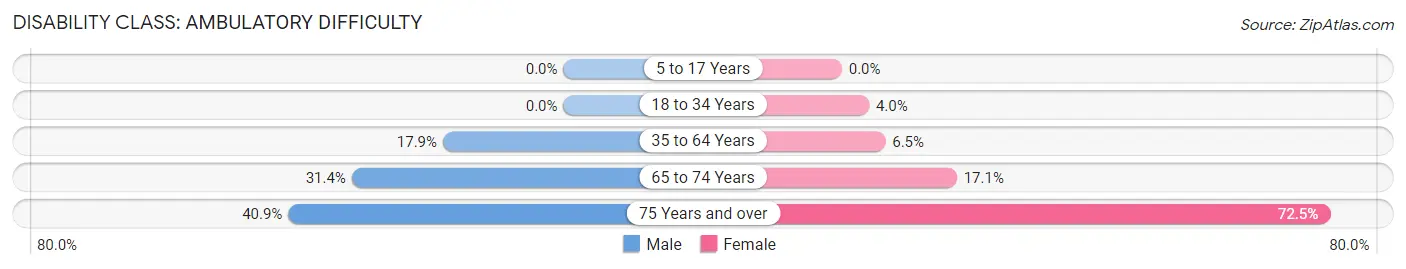
| Age Bracket | Male | Female |
| 5 to 17 Years | 0 (0.0%) | 0 (0.0%) |
| 18 to 34 Years | 0 (0.0%) | 8 (4.0%) |
| 35 to 64 Years | 73 (17.9%) | 31 (6.5%) |
| 65 to 74 Years | 44 (31.4%) | 35 (17.1%) |
| 75 Years and over | 38 (40.9%) | 116 (72.5%) |
Disability Class: Self-Care Difficulty
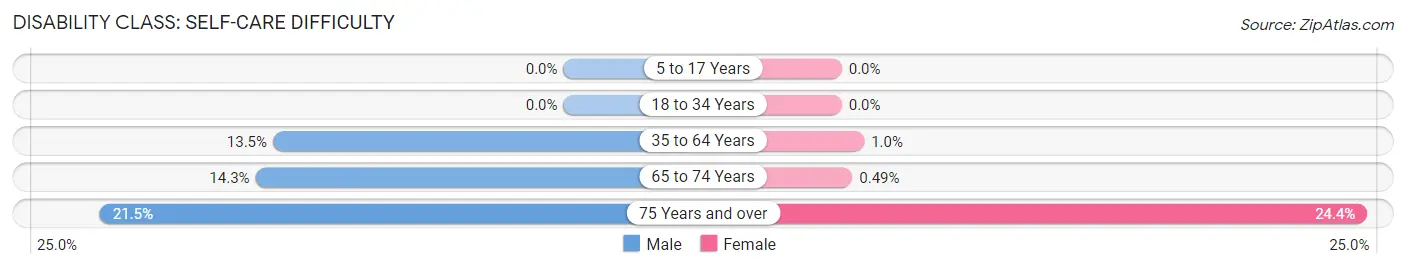
| Age Bracket | Male | Female |
| 5 to 17 Years | 0 (0.0%) | 0 (0.0%) |
| 18 to 34 Years | 0 (0.0%) | 0 (0.0%) |
| 35 to 64 Years | 55 (13.5%) | 5 (1.0%) |
| 65 to 74 Years | 20 (14.3%) | 1 (0.5%) |
| 75 Years and over | 20 (21.5%) | 39 (24.4%) |
Technology Access in Sylvania
Computing Device Access in Sylvania
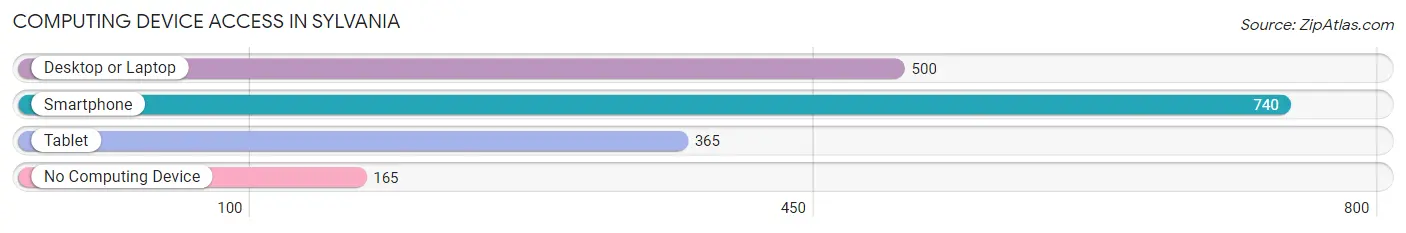
| Device Type | # Households | % Households |
| Desktop or Laptop | 500 | 52.2% |
| Smartphone | 740 | 77.3% |
| Tablet | 365 | 38.1% |
| No Computing Device | 165 | 17.2% |
| Total | 957 | 100.0% |
Internet Access in Sylvania
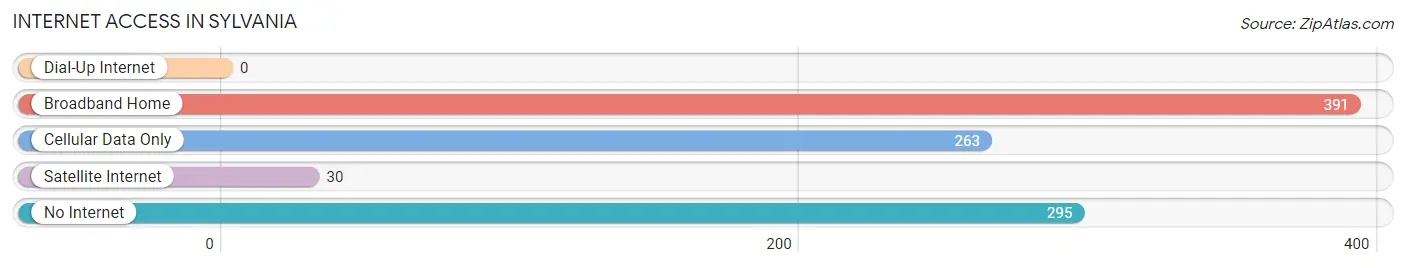
| Internet Type | # Households | % Households |
| Dial-Up Internet | 0 | 0.0% |
| Broadband Home | 391 | 40.9% |
| Cellular Data Only | 263 | 27.5% |
| Satellite Internet | 30 | 3.1% |
| No Internet | 295 | 30.8% |
| Total | 957 | 100.0% |
Sylvania Summary
Sylvania is a city located in Screven County, Georgia, United States. It is the county seat of Screven County. The population was 2,945 at the 2010 census.
History
Sylvania was founded in 1812 and named after the Latin word for “forest”. The city was originally known as “Newington”, but the name was changed to Sylvania in 1820. The city was incorporated in 1837.
Sylvania was a major center of the cotton industry in the 19th century. The city was home to several cotton mills, including the Sylvania Cotton Mill, which was established in 1845. The mill was destroyed by fire in 1891, but was rebuilt and continued to operate until the 1950s.
Geography
Sylvania is located at 32°25'25" North, 81°51'45" West (32.423, -81.862). The city is situated in the Ogeechee River Valley, about 25 miles (40 km) northwest of Savannah.
The city has a total area of 4 2 square miles 10 8 km2 all of it land
Economy
Sylvania’s economy is largely based on agriculture and manufacturing. The city is home to several large agricultural operations, including a poultry processing plant, a cotton gin, and a feed mill.
The city is also home to several manufacturing companies, including a furniture manufacturer, a plastics manufacturer, and a paper products manufacturer.
Demographics
As of the 2010 census, there were 2,945 people, 1,093 households, and 745 families residing in the city. The population density was 703.3 people per square mile (271.3/km2). There were 1,223 housing units at an average density of 293.3 per square mile (113.3/km2). The racial makeup of the city was 65.2% White, 30.2% African American, 0.3% Native American, 0.7% Asian, 0.1% Pacific Islander, 2.2% from other races, and 1.3% from two or more races. Hispanic or Latino of any race were 4.2% of the population.
There were 1,093 households, out of which 33.2% had children under the age of 18 living with them, 43.2% were married couples living together, 19.2% had a female householder with no husband present, and 32.2% were non-families. 28.2% of all households were made up of individuals, and 11.7% had someone living alone who was 65 years of age or older. The average household size was 2.60 and the average family size was 3.17.
In the city, the population was spread out, with 28.2% under the age of 18, 8.7% from 18 to 24, 27.2% from 25 to 44, 22.2% from 45 to 64, and 13.7% who were 65 years of age or older. The median age was 35 years. For every 100 females, there were 87.2 males. For every 100 females age 18 and over, there were 81.2 males.
The median income for a household in the city was $27,917, and the median income for a family was $33,750. Males had a median income of $27,500 versus $20,000 for females. The per capita income for the city was $14,845. About 17.2% of families and 20.2% of the population were below the poverty line, including 28.2% of those under age 18 and 16.2% of those age 65 or over.
Common Questions
What is Per Capita Income in Sylvania?
Per Capita income in Sylvania is $23,998.
What is the Median Family Income in Sylvania?
Median Family Income in Sylvania is $68,679.
What is the Median Household income in Sylvania?
Median Household Income in Sylvania is $36,682.
What is Income or Wage Gap in Sylvania?
Income or Wage Gap in Sylvania is 40.1%.
Women in Sylvania earn 59.9 cents for every dollar earned by a man.
What is Inequality or Gini Index in Sylvania?
Inequality or Gini Index in Sylvania is 0.46.
What is the Total Population of Sylvania?
Total Population of Sylvania is 2,618.
What is the Total Male Population of Sylvania?
Total Male Population of Sylvania is 1,193.
What is the Total Female Population of Sylvania?
Total Female Population of Sylvania is 1,425.
What is the Ratio of Males per 100 Females in Sylvania?
There are 83.72 Males per 100 Females in Sylvania.
What is the Ratio of Females per 100 Males in Sylvania?
There are 119.45 Females per 100 Males in Sylvania.
What is the Median Population Age in Sylvania?
Median Population Age in Sylvania is 43.7 Years.
What is the Average Family Size in Sylvania
Average Family Size in Sylvania is 3.8 People.
What is the Average Household Size in Sylvania
Average Household Size in Sylvania is 2.6 People.
How Large is the Labor Force in Sylvania?
There are 1,062 People in the Labor Forcein in Sylvania.
What is the Percentage of People in the Labor Force in Sylvania?
52.2% of People are in the Labor Force in Sylvania.
What is the Unemployment Rate in Sylvania?
Unemployment Rate in Sylvania is 1.1%.