Surrency, GA Map & Demographics
Surrency Map
Surrency Overview
$21,420
PER CAPITA INCOME
$55,208
AVG FAMILY INCOME
$32,250
AVG HOUSEHOLD INCOME
0.42
INEQUALITY / GINI INDEX
281
TOTAL POPULATION
139
MALE POPULATION
142
FEMALE POPULATION
97.89
MALES / 100 FEMALES
102.16
FEMALES / 100 MALES
35.3
MEDIAN AGE
3.8
AVG FAMILY SIZE
3.0
AVG HOUSEHOLD SIZE
122
LABOR FORCE [ PEOPLE ]
58.9%
PERCENT IN LABOR FORCE
8.2%
UNEMPLOYMENT RATE
Surrency Zip Codes
Surrency Area Codes
Income in Surrency
Income Overview in Surrency
Per Capita Income in Surrency is $21,420, while median incomes of families and households are $55,208 and $32,250 respectively.
| Characteristic | Number | Measure |
| Per Capita Income | 281 | $21,420 |
| Median Family Income | 65 | $55,208 |
| Mean Family Income | 65 | $64,772 |
| Median Household Income | 95 | $32,250 |
| Mean Household Income | 95 | $52,888 |
| Income Deficit | 65 | $0 |
| Wage / Income Gap (%) | 281 | 0.00% |
| Wage / Income Gap ($) | 281 | 100.00¢ per $1 |
| Gini / Inequality Index | 281 | 0.42 |
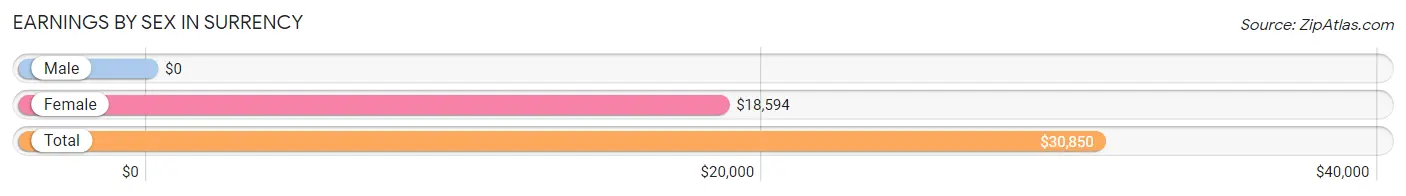
Earnings by Sex in Surrency
| Sex | Number | Average Earnings |
| Male | 57 (50.4%) | $0 |
| Female | 56 (49.6%) | $18,594 |
| Total | 113 (100.0%) | $30,850 |
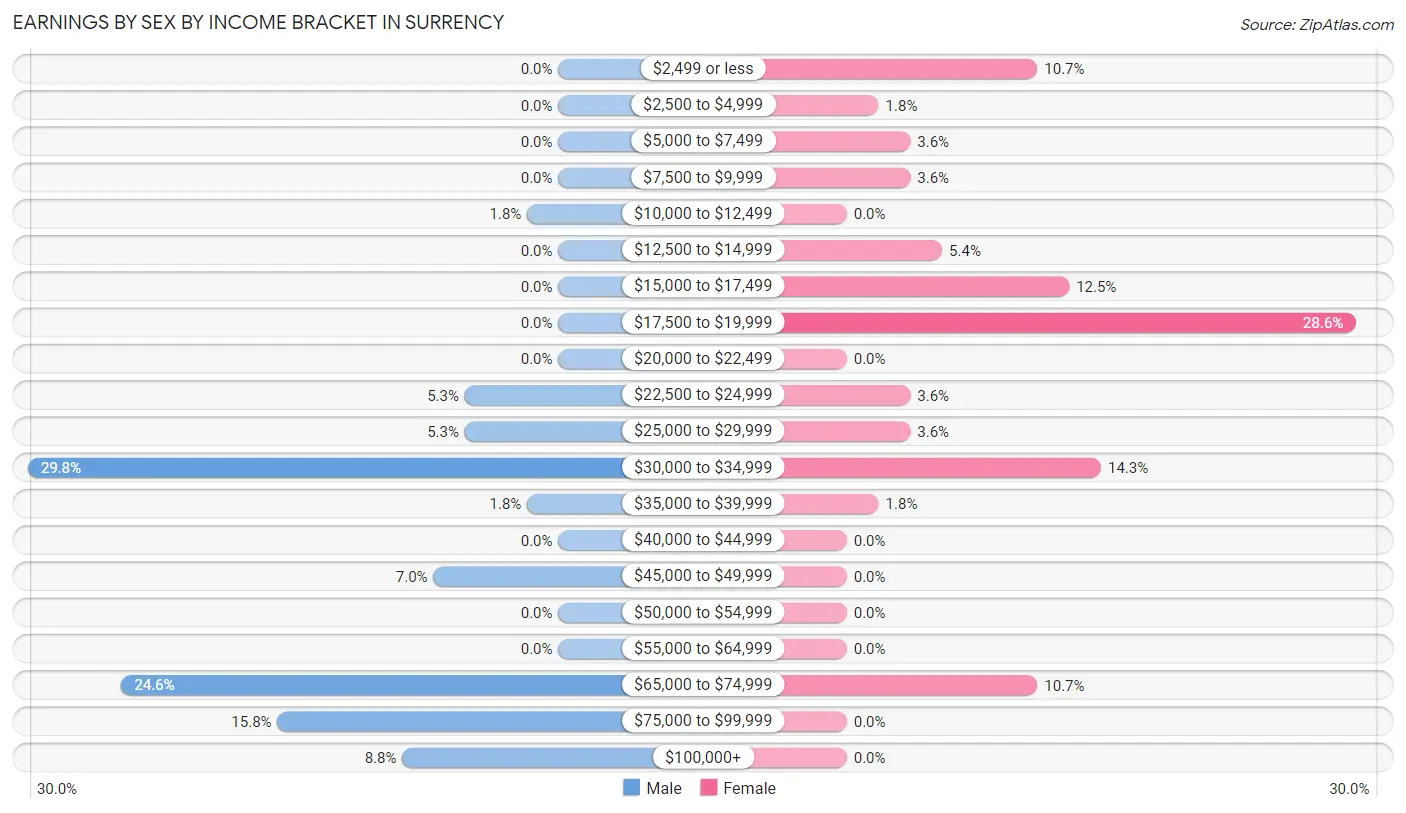
Earnings by Sex by Income Bracket in Surrency
The most common earnings brackets in Surrency are $30,000 to $34,999 for men (17 | 29.8%) and $17,500 to $19,999 for women (16 | 28.6%).
| Income | Male | Female |
| $2,499 or less | 0 (0.0%) | 6 (10.7%) |
| $2,500 to $4,999 | 0 (0.0%) | 1 (1.8%) |
| $5,000 to $7,499 | 0 (0.0%) | 2 (3.6%) |
| $7,500 to $9,999 | 0 (0.0%) | 2 (3.6%) |
| $10,000 to $12,499 | 1 (1.8%) | 0 (0.0%) |
| $12,500 to $14,999 | 0 (0.0%) | 3 (5.4%) |
| $15,000 to $17,499 | 0 (0.0%) | 7 (12.5%) |
| $17,500 to $19,999 | 0 (0.0%) | 16 (28.6%) |
| $20,000 to $22,499 | 0 (0.0%) | 0 (0.0%) |
| $22,500 to $24,999 | 3 (5.3%) | 2 (3.6%) |
| $25,000 to $29,999 | 3 (5.3%) | 2 (3.6%) |
| $30,000 to $34,999 | 17 (29.8%) | 8 (14.3%) |
| $35,000 to $39,999 | 1 (1.8%) | 1 (1.8%) |
| $40,000 to $44,999 | 0 (0.0%) | 0 (0.0%) |
| $45,000 to $49,999 | 4 (7.0%) | 0 (0.0%) |
| $50,000 to $54,999 | 0 (0.0%) | 0 (0.0%) |
| $55,000 to $64,999 | 0 (0.0%) | 0 (0.0%) |
| $65,000 to $74,999 | 14 (24.6%) | 6 (10.7%) |
| $75,000 to $99,999 | 9 (15.8%) | 0 (0.0%) |
| $100,000+ | 5 (8.8%) | 0 (0.0%) |
| Total | 57 (100.0%) | 56 (100.0%) |
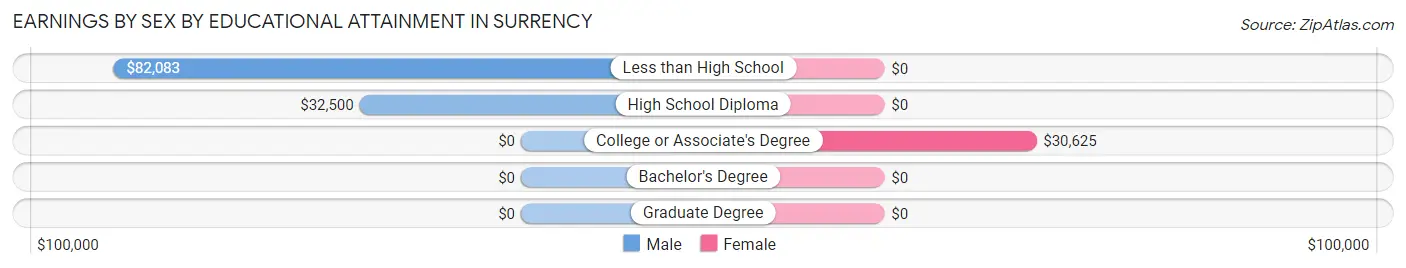
Earnings by Sex by Educational Attainment in Surrency
| Educational Attainment | Male Income | Female Income |
| Less than High School | $82,083 | $0 |
| High School Diploma | $32,500 | $0 |
| College or Associate's Degree | - | - |
| Bachelor's Degree | - | - |
| Graduate Degree | - | - |
| Total | - | - |
Family Income in Surrency
Family Income Brackets in Surrency
According to the Surrency family income data, there are 13 families falling into the $25,000 to $34,999 income range, which is the most common income bracket and makes up 20.0% of all families.
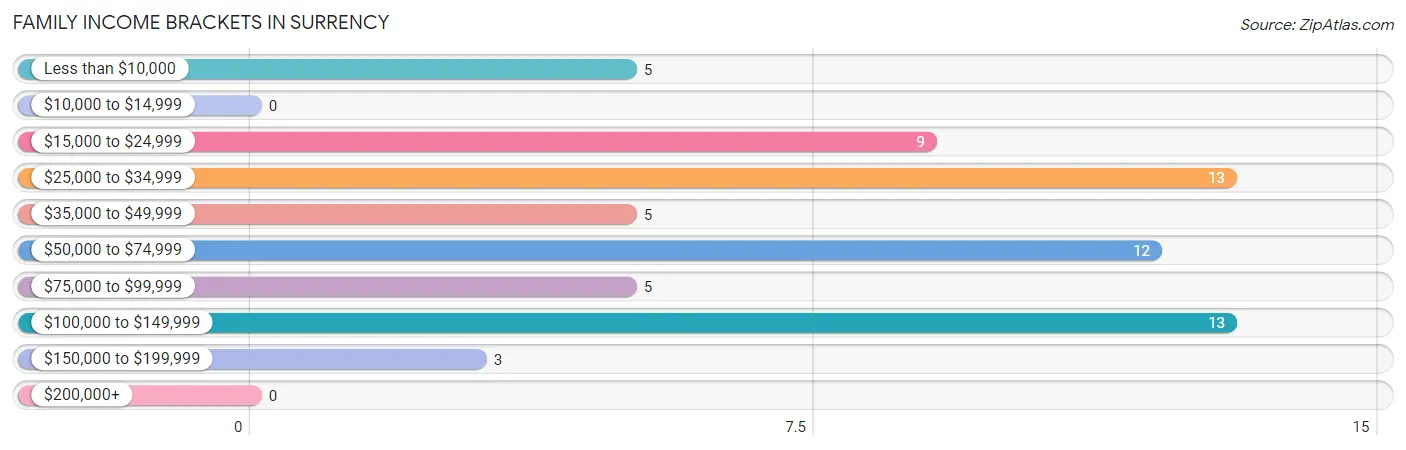
| Income Bracket | # Families | % Families |
| Less than $10,000 | 5 | 7.7% |
| $10,000 to $14,999 | 0 | 0.0% |
| $15,000 to $24,999 | 9 | 13.8% |
| $25,000 to $34,999 | 13 | 20.0% |
| $35,000 to $49,999 | 5 | 7.7% |
| $50,000 to $74,999 | 12 | 18.5% |
| $75,000 to $99,999 | 5 | 7.7% |
| $100,000 to $149,999 | 13 | 20.0% |
| $150,000 to $199,999 | 3 | 4.6% |
| $200,000+ | 0 | 0.0% |
Family Income by Famaliy Size in Surrency
3-person families (6 | 9.2%) account for the highest median family income in Surrency with $83,333 per family, while 3-person families (6 | 9.2%) have the highest median income of $27,778 per family member.
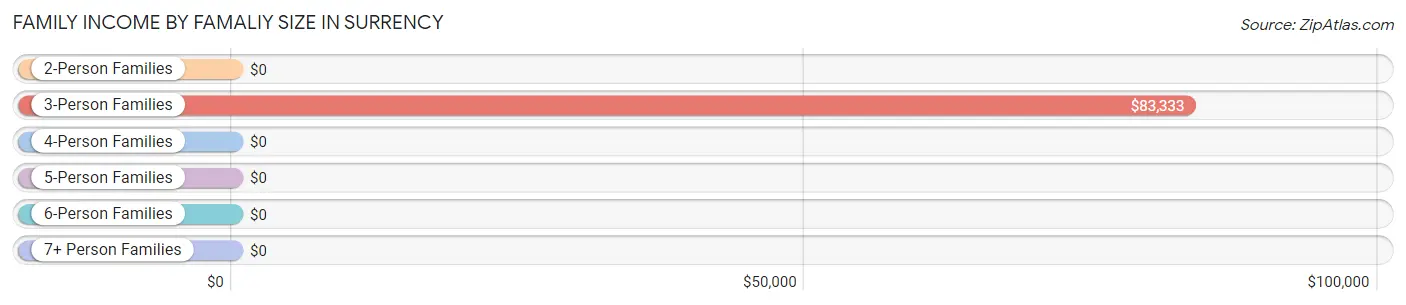
| Income Bracket | # Families | Median Income |
| 2-Person Families | 31 (47.7%) | $0 |
| 3-Person Families | 6 (9.2%) | $83,333 |
| 4-Person Families | 11 (16.9%) | $0 |
| 5-Person Families | 8 (12.3%) | $0 |
| 6-Person Families | 0 (0.0%) | $0 |
| 7+ Person Families | 9 (13.9%) | $0 |
| Total | 65 (100.0%) | $55,208 |
Family Income by Number of Earners in Surrency
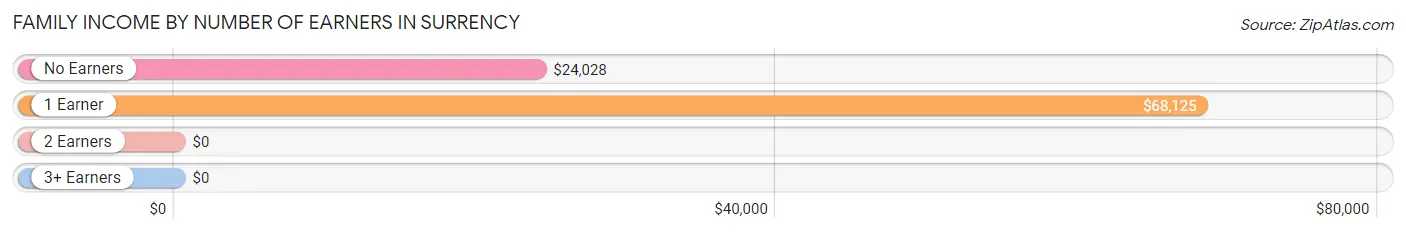
| Number of Earners | # Families | Median Income |
| No Earners | 21 (32.3%) | $24,028 |
| 1 Earner | 21 (32.3%) | $68,125 |
| 2 Earners | 14 (21.5%) | $0 |
| 3+ Earners | 9 (13.9%) | $0 |
| Total | 65 (100.0%) | $55,208 |
Household Income in Surrency
Household Income Brackets in Surrency
With 26 households falling in the category, the $15,000 to $24,999 income range is the most frequent in Surrency, accounting for 27.4% of all households.
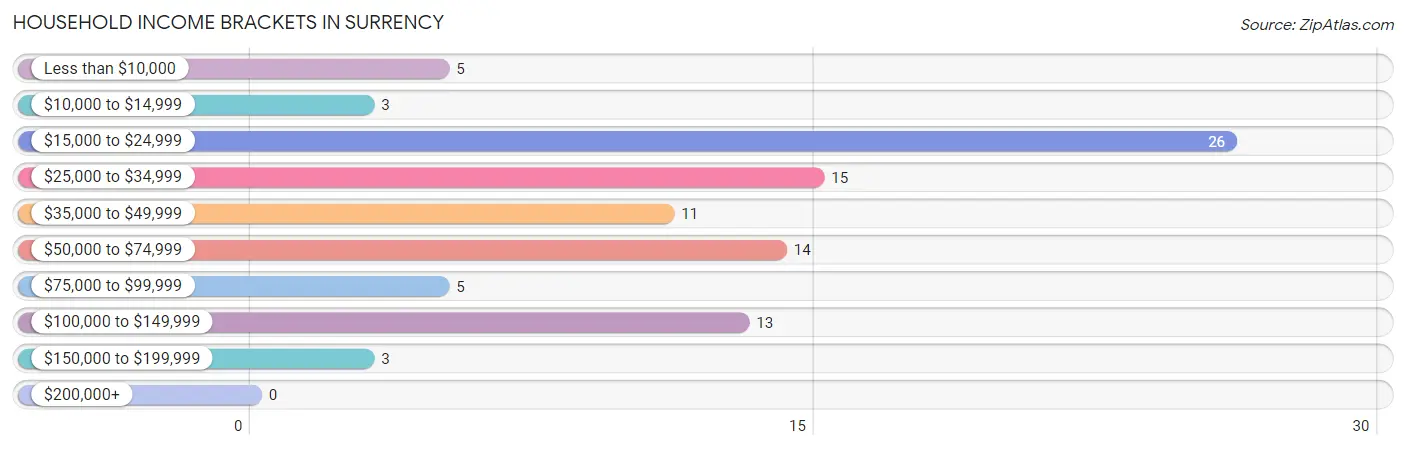
| Income Bracket | # Households | % Households |
| Less than $10,000 | 5 | 5.3% |
| $10,000 to $14,999 | 3 | 3.2% |
| $15,000 to $24,999 | 26 | 27.4% |
| $25,000 to $34,999 | 15 | 15.8% |
| $35,000 to $49,999 | 11 | 11.6% |
| $50,000 to $74,999 | 14 | 14.7% |
| $75,000 to $99,999 | 5 | 5.3% |
| $100,000 to $149,999 | 13 | 13.7% |
| $150,000 to $199,999 | 3 | 3.2% |
| $200,000+ | 0 | 0.0% |
Household Income by Householder Age in Surrency
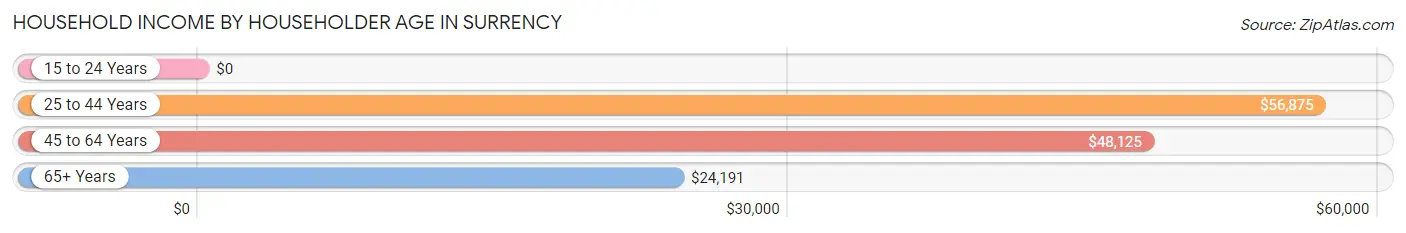
The median household income in Surrency is $32,250, with the highest median household income of $56,875 found in the 25 to 44 years age bracket for the primary householder. A total of 43 households (45.3%) fall into this category.
| Income Bracket | # Households | Median Income |
| 15 to 24 Years | 0 (0.0%) | $0 |
| 25 to 44 Years | 43 (45.3%) | $56,875 |
| 45 to 64 Years | 13 (13.7%) | $48,125 |
| 65+ Years | 39 (41.0%) | $24,191 |
| Total | 95 (100.0%) | $32,250 |
Poverty in Surrency
Income Below Poverty by Sex and Age in Surrency
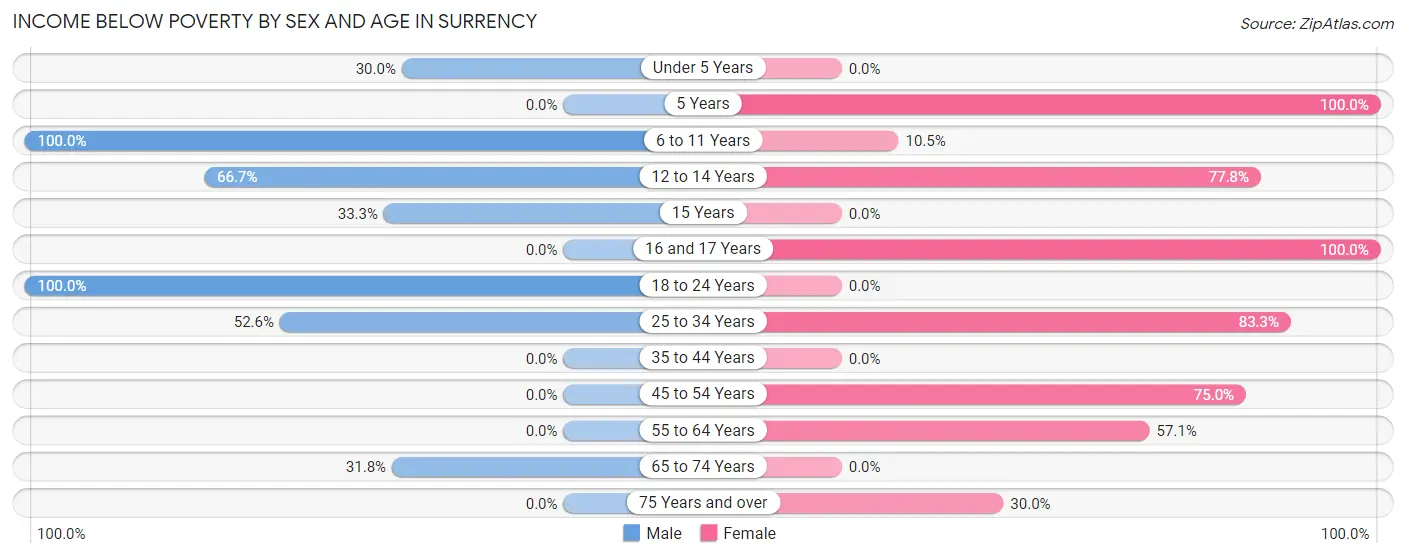
With 35.2% poverty level for males and 30.3% for females among the residents of Surrency, 6 to 11 year old males and 5 year old females are the most vulnerable to poverty, with 11 males (100.0%) and 6 females (100.0%) in their respective age groups living below the poverty level.
| Age Bracket | Male | Female |
| Under 5 Years | 3 (30.0%) | 0 (0.0%) |
| 5 Years | 0 (0.0%) | 6 (100.0%) |
| 6 to 11 Years | 11 (100.0%) | 2 (10.5%) |
| 12 to 14 Years | 4 (66.7%) | 7 (77.8%) |
| 15 Years | 4 (33.3%) | 0 (0.0%) |
| 16 and 17 Years | 0 (0.0%) | 2 (100.0%) |
| 18 to 24 Years | 10 (100.0%) | 0 (0.0%) |
| 25 to 34 Years | 10 (52.6%) | 10 (83.3%) |
| 35 to 44 Years | 0 (0.0%) | 0 (0.0%) |
| 45 to 54 Years | 0 (0.0%) | 3 (75.0%) |
| 55 to 64 Years | 0 (0.0%) | 4 (57.1%) |
| 65 to 74 Years | 7 (31.8%) | 0 (0.0%) |
| 75 Years and over | 0 (0.0%) | 9 (30.0%) |
| Total | 49 (35.2%) | 43 (30.3%) |
Income Above Poverty by Sex and Age in Surrency
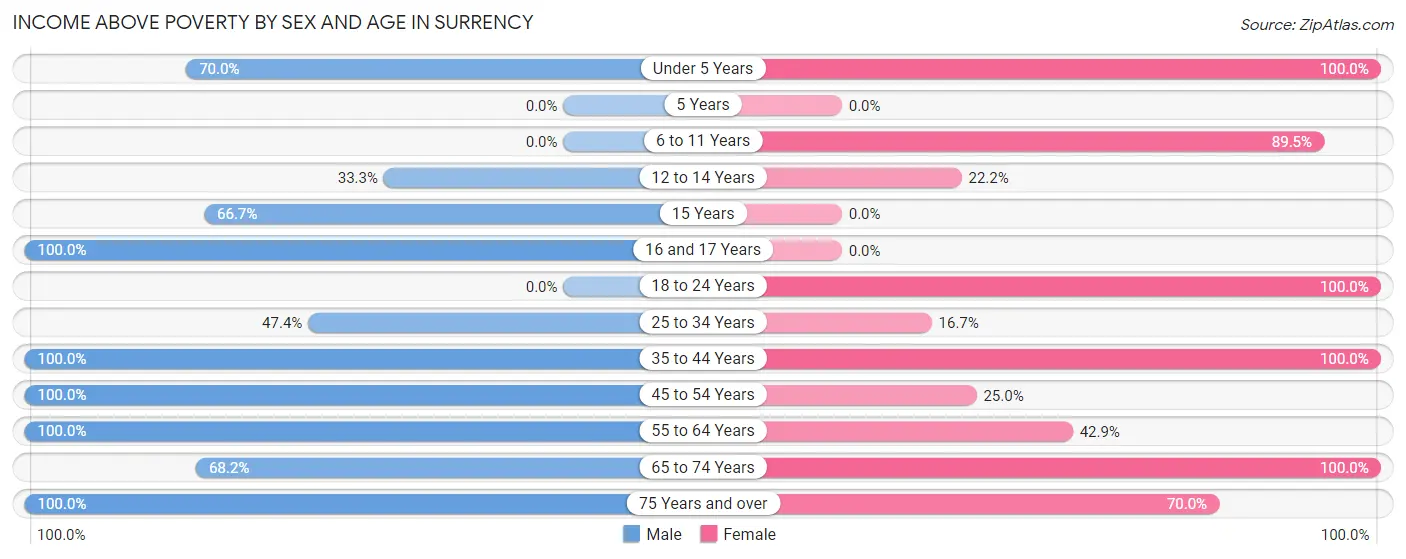
According to the poverty statistics in Surrency, males aged 16 and 17 years and females aged under 5 years are the age groups that are most secure financially, with 100.0% of males and 100.0% of females in these age groups living above the poverty line.
| Age Bracket | Male | Female |
| Under 5 Years | 7 (70.0%) | 1 (100.0%) |
| 5 Years | 0 (0.0%) | 0 (0.0%) |
| 6 to 11 Years | 0 (0.0%) | 17 (89.5%) |
| 12 to 14 Years | 2 (33.3%) | 2 (22.2%) |
| 15 Years | 8 (66.7%) | 0 (0.0%) |
| 16 and 17 Years | 6 (100.0%) | 0 (0.0%) |
| 18 to 24 Years | 0 (0.0%) | 15 (100.0%) |
| 25 to 34 Years | 9 (47.4%) | 2 (16.7%) |
| 35 to 44 Years | 15 (100.0%) | 30 (100.0%) |
| 45 to 54 Years | 16 (100.0%) | 1 (25.0%) |
| 55 to 64 Years | 8 (100.0%) | 3 (42.9%) |
| 65 to 74 Years | 15 (68.2%) | 7 (100.0%) |
| 75 Years and over | 4 (100.0%) | 21 (70.0%) |
| Total | 90 (64.7%) | 99 (69.7%) |
Income Below Poverty Among Married-Couple Families in Surrency
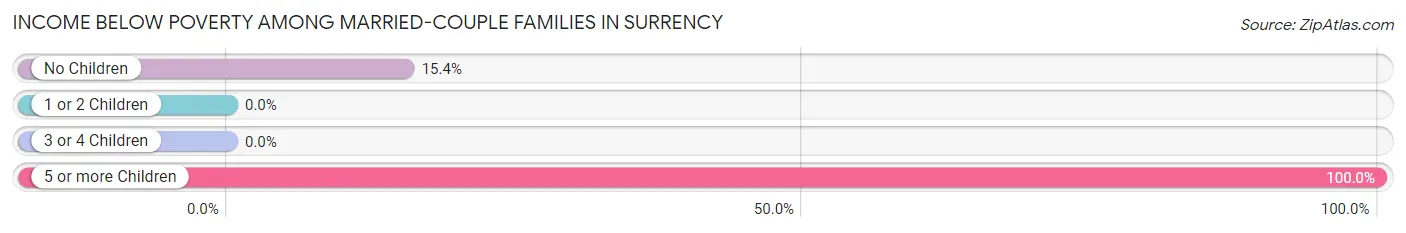
The poverty statistics for married-couple families in Surrency show that 20.0% or 8 of the total 40 families live below the poverty line. Families with 5 or more children have the highest poverty rate of 100.0%, comprising of 6 families. On the other hand, families with 1 or 2 children have the lowest poverty rate of 0.0%, which includes 0 families.
| Children | Above Poverty | Below Poverty |
| No Children | 11 (84.6%) | 2 (15.4%) |
| 1 or 2 Children | 21 (100.0%) | 0 (0.0%) |
| 3 or 4 Children | 0 (0.0%) | 0 (0.0%) |
| 5 or more Children | 0 (0.0%) | 6 (100.0%) |
| Total | 32 (80.0%) | 8 (20.0%) |
Income Below Poverty Among Single-Parent Households in Surrency
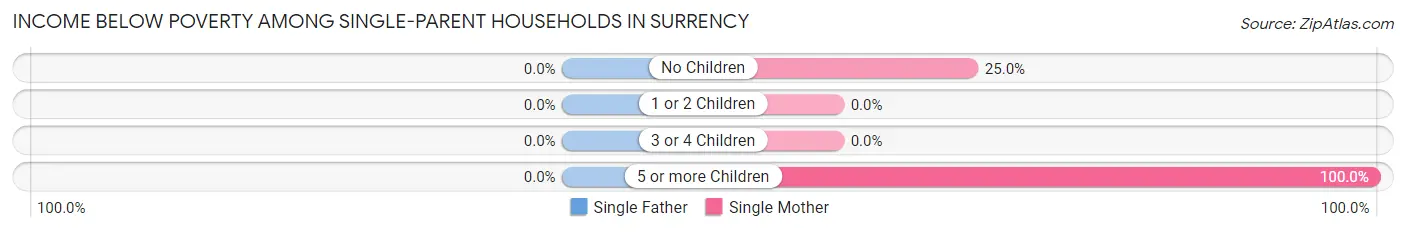
| Children | Single Father | Single Mother |
| No Children | 0 (0.0%) | 3 (25.0%) |
| 1 or 2 Children | 0 (0.0%) | 0 (0.0%) |
| 3 or 4 Children | 0 (0.0%) | 0 (0.0%) |
| 5 or more Children | 0 (0.0%) | 3 (100.0%) |
| Total | 0 (0.0%) | 6 (27.3%) |
Income Below Poverty Among Married-Couple vs Single-Parent Households in Surrency
The poverty data for Surrency shows that 8 of the married-couple family households (20.0%) and 6 of the single-parent households (24.0%) are living below the poverty level. Within the married-couple family households, those with 5 or more children have the highest poverty rate, with 6 households (100.0%) falling below the poverty line. Among the single-parent households, those with 5 or more children have the highest poverty rate, with 3 household (100.0%) living below poverty.
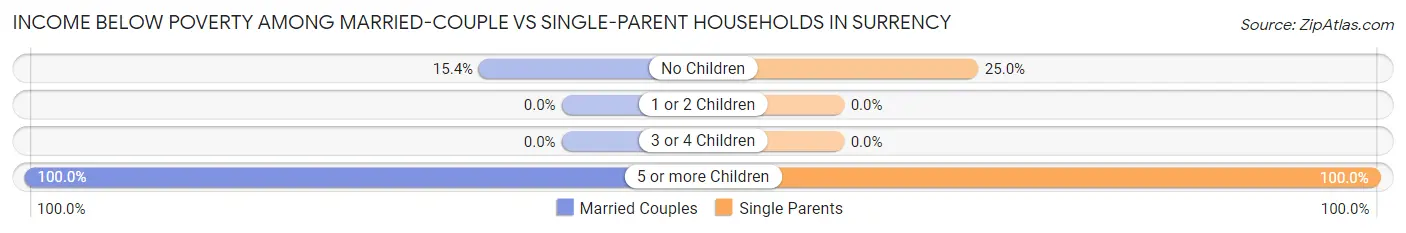
| Children | Married-Couple Families | Single-Parent Households |
| No Children | 2 (15.4%) | 3 (25.0%) |
| 1 or 2 Children | 0 (0.0%) | 0 (0.0%) |
| 3 or 4 Children | 0 (0.0%) | 0 (0.0%) |
| 5 or more Children | 6 (100.0%) | 3 (100.0%) |
| Total | 8 (20.0%) | 6 (24.0%) |
Race in Surrency
The most populous races in Surrency are White / Caucasian (169 | 60.1%), Black / African American (106 | 37.7%), and Hispanic or Latino (40 | 14.2%).
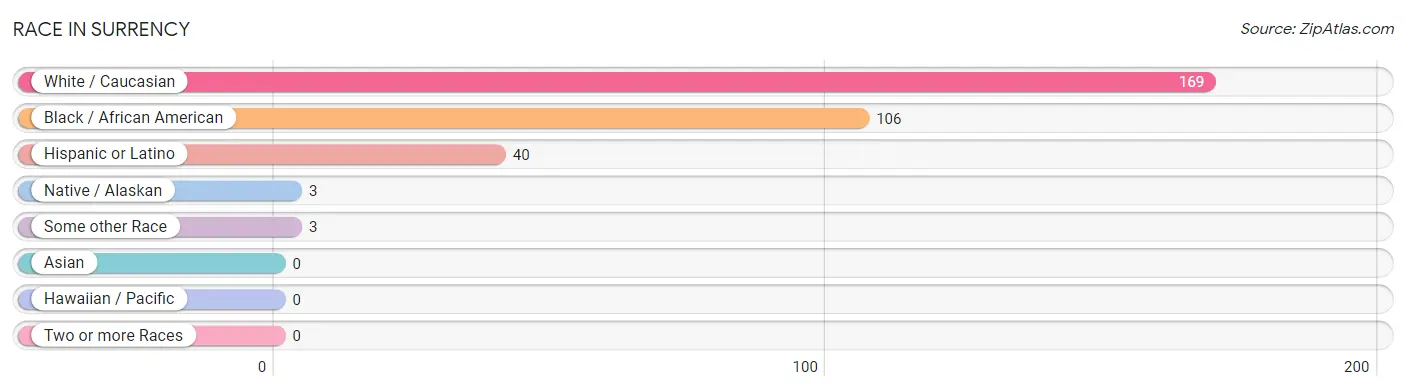
| Race | # Population | % Population |
| Asian | 0 | 0.0% |
| Black / African American | 106 | 37.7% |
| Hawaiian / Pacific | 0 | 0.0% |
| Hispanic or Latino | 40 | 14.2% |
| Native / Alaskan | 3 | 1.1% |
| White / Caucasian | 169 | 60.1% |
| Two or more Races | 0 | 0.0% |
| Some other Race | 3 | 1.1% |
| Total | 281 | 100.0% |
Ancestry in Surrency
The most populous ancestries reported in Surrency are Mexican (40 | 14.2%), American (31 | 11.0%), Mexican American Indian (3 | 1.1%), and Swedish (3 | 1.1%), together accounting for 27.4% of all Surrency residents.
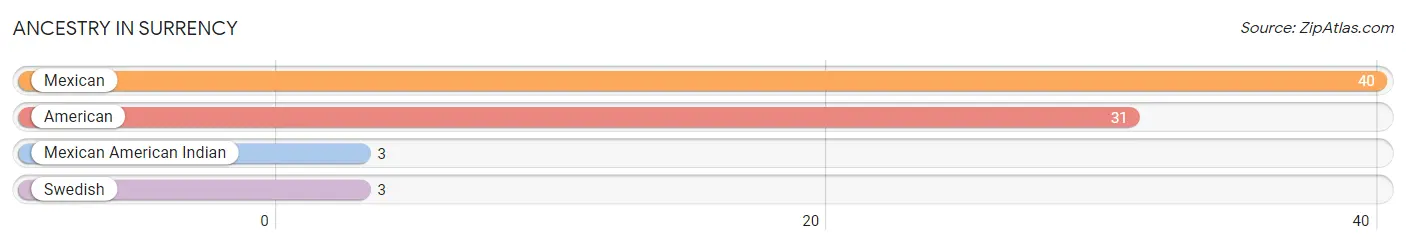
| Ancestry | # Population | % Population |
| American | 31 | 11.0% |
| Mexican | 40 | 14.2% |
| Mexican American Indian | 3 | 1.1% |
| Swedish | 3 | 1.1% | View All 4 Rows |
Immigrants in Surrency
The most numerous immigrant groups reported in Surrency came from Central America (3 | 1.1%), Latin America (3 | 1.1%), and Mexico (3 | 1.1%), together accounting for 3.2% of all Surrency residents.
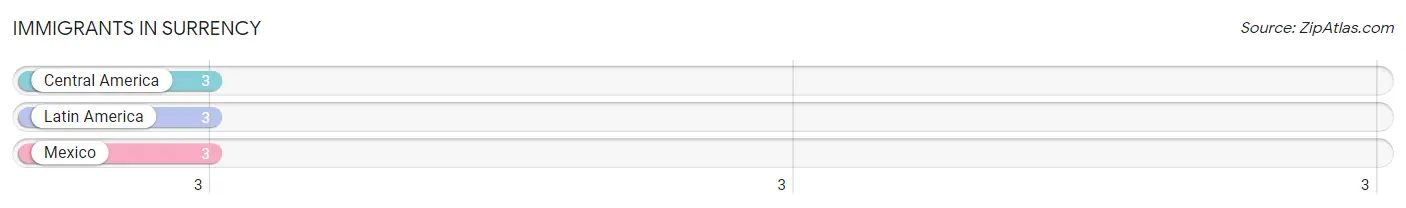
| Immigration Origin | # Population | % Population |
| Central America | 3 | 1.1% |
| Latin America | 3 | 1.1% |
| Mexico | 3 | 1.1% | View All 3 Rows |
Sex and Age in Surrency
Sex and Age in Surrency
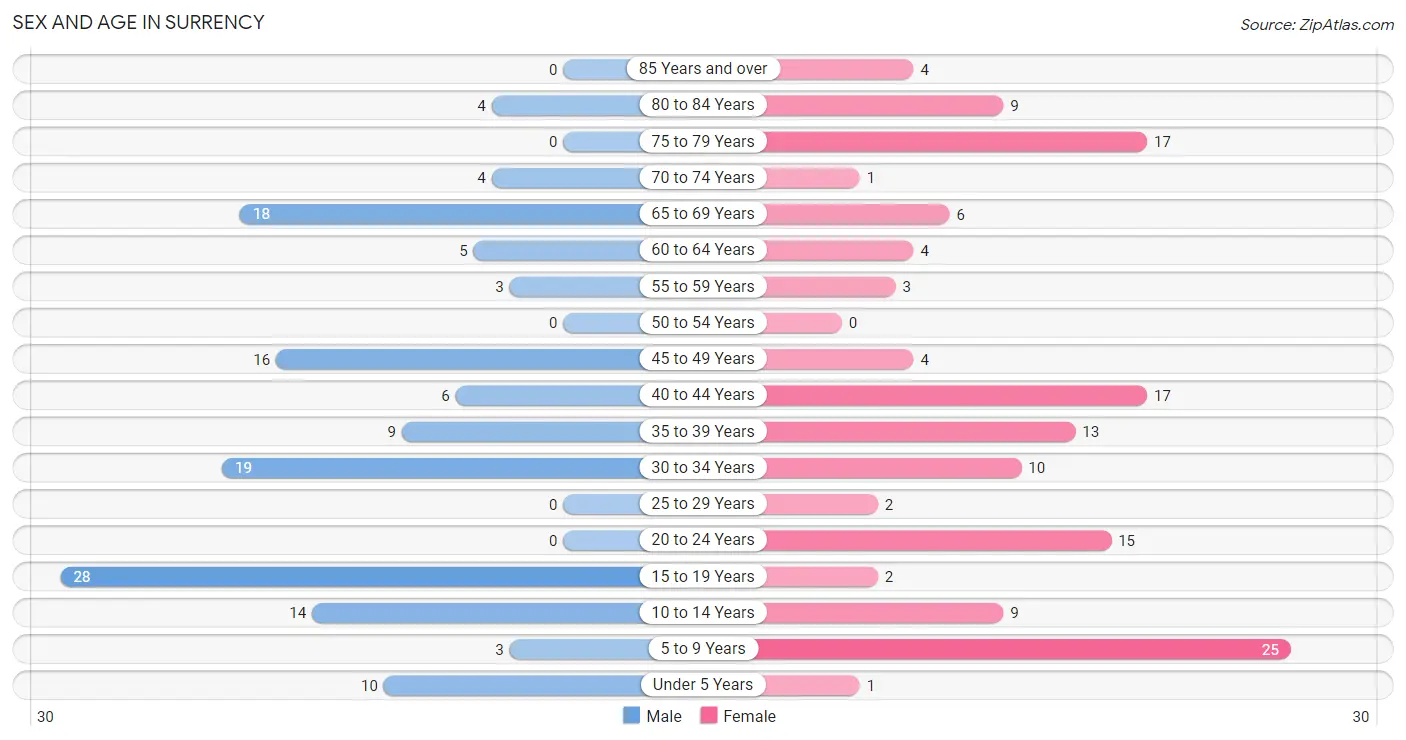
The most populous age groups in Surrency are 15 to 19 Years (28 | 20.1%) for men and 5 to 9 Years (25 | 17.6%) for women.
| Age Bracket | Male | Female |
| Under 5 Years | 10 (7.2%) | 1 (0.7%) |
| 5 to 9 Years | 3 (2.2%) | 25 (17.6%) |
| 10 to 14 Years | 14 (10.1%) | 9 (6.3%) |
| 15 to 19 Years | 28 (20.1%) | 2 (1.4%) |
| 20 to 24 Years | 0 (0.0%) | 15 (10.6%) |
| 25 to 29 Years | 0 (0.0%) | 2 (1.4%) |
| 30 to 34 Years | 19 (13.7%) | 10 (7.0%) |
| 35 to 39 Years | 9 (6.5%) | 13 (9.1%) |
| 40 to 44 Years | 6 (4.3%) | 17 (12.0%) |
| 45 to 49 Years | 16 (11.5%) | 4 (2.8%) |
| 50 to 54 Years | 0 (0.0%) | 0 (0.0%) |
| 55 to 59 Years | 3 (2.2%) | 3 (2.1%) |
| 60 to 64 Years | 5 (3.6%) | 4 (2.8%) |
| 65 to 69 Years | 18 (13.0%) | 6 (4.2%) |
| 70 to 74 Years | 4 (2.9%) | 1 (0.7%) |
| 75 to 79 Years | 0 (0.0%) | 17 (12.0%) |
| 80 to 84 Years | 4 (2.9%) | 9 (6.3%) |
| 85 Years and over | 0 (0.0%) | 4 (2.8%) |
| Total | 139 (100.0%) | 142 (100.0%) |
Families and Households in Surrency
Median Family Size in Surrency
The median family size in Surrency is 3.80 persons per family, with single female/mother families (22 | 33.9%) accounting for the largest median family size of 3.95 persons per family. On the other hand, single male/father families (3 | 4.6%) represent the smallest median family size with 2.33 persons per family.
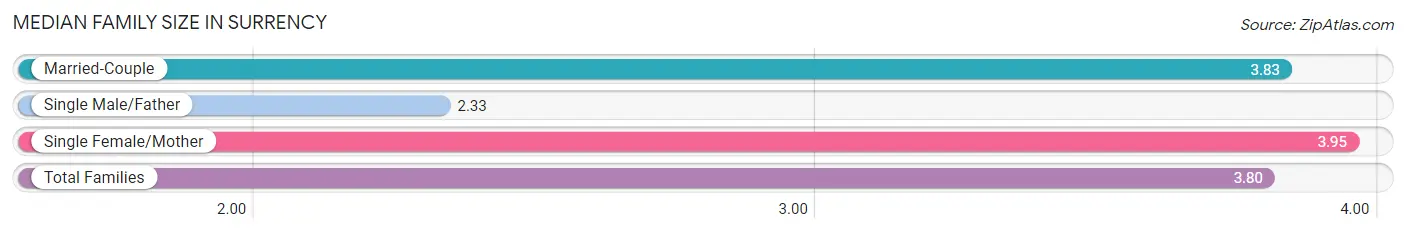
| Family Type | # Families | Family Size |
| Married-Couple | 40 (61.5%) | 3.83 |
| Single Male/Father | 3 (4.6%) | 2.33 |
| Single Female/Mother | 22 (33.9%) | 3.95 |
| Total Families | 65 (100.0%) | 3.80 |
Median Household Size in Surrency
The median household size in Surrency is 2.96 persons per household, with single female/mother households (22 | 23.2%) accounting for the largest median household size of 3.95 persons per household. non-family households (30 | 31.6%) represent the smallest median household size with 1.03 persons per household.
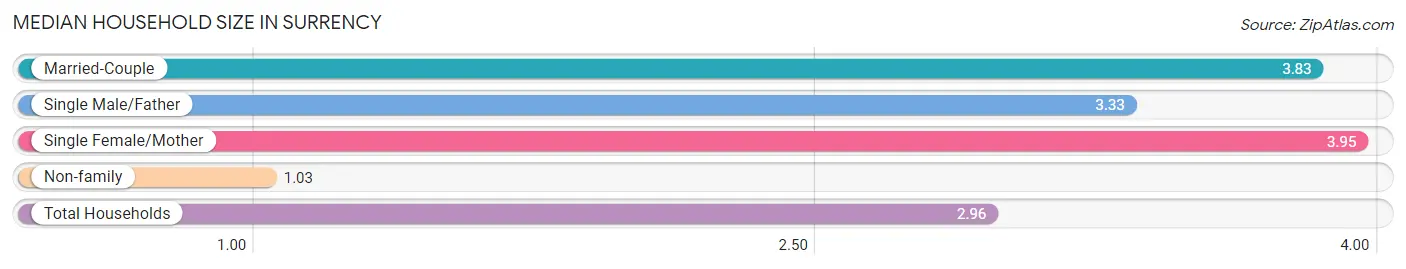
| Household Type | # Households | Household Size |
| Married-Couple | 40 (42.1%) | 3.83 |
| Single Male/Father | 3 (3.2%) | 3.33 |
| Single Female/Mother | 22 (23.2%) | 3.95 |
| Non-family | 30 (31.6%) | 1.03 |
| Total Households | 95 (100.0%) | 2.96 |
Household Size by Marriage Status in Surrency
Out of a total of 95 households in Surrency, 65 (68.4%) are family households, while 30 (31.6%) are nonfamily households. The most numerous type of family households are 2-person households, comprising 31, and the most common type of nonfamily households are 1-person households, comprising 29.
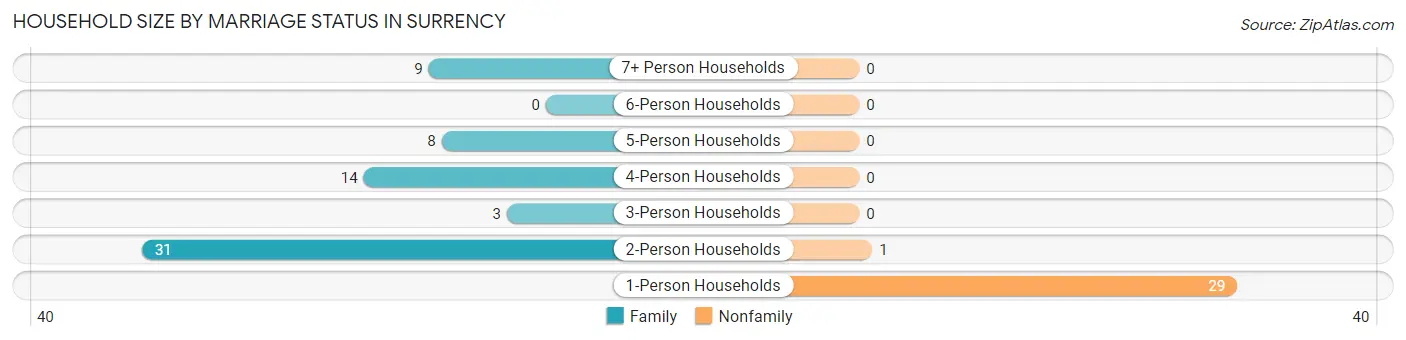
| Household Size | Family Households | Nonfamily Households |
| 1-Person Households | - | 29 (30.5%) |
| 2-Person Households | 31 (32.6%) | 1 (1.1%) |
| 3-Person Households | 3 (3.2%) | 0 (0.0%) |
| 4-Person Households | 14 (14.7%) | 0 (0.0%) |
| 5-Person Households | 8 (8.4%) | 0 (0.0%) |
| 6-Person Households | 0 (0.0%) | 0 (0.0%) |
| 7+ Person Households | 9 (9.5%) | 0 (0.0%) |
| Total | 65 (68.4%) | 30 (31.6%) |
Female Fertility in Surrency
Fertility by Age in Surrency
Average fertility rate in Surrency is 143.0 births per 1,000 women. Women in the age bracket of 35 to 50 years have the highest fertility rate with 206.0 births per 1,000 women. Women in the age bracket of 35 to 50 years acount for 77.8% of all women with births.
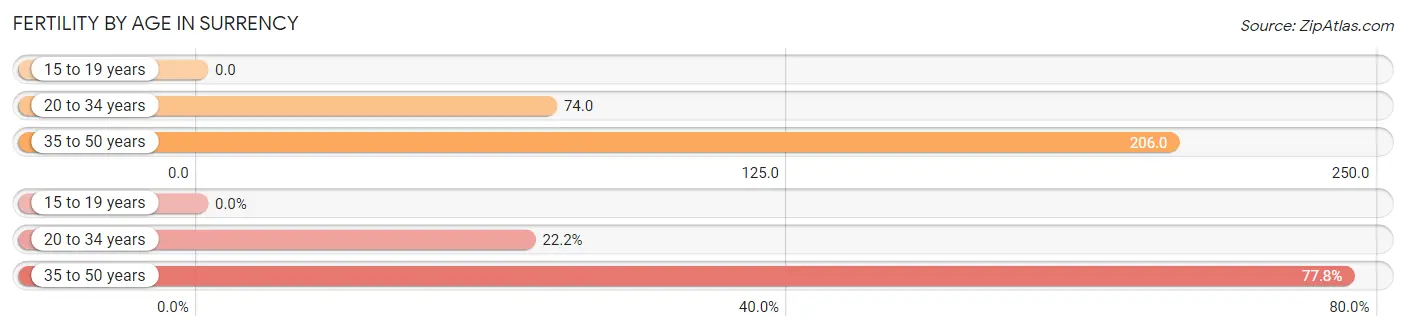
| Age Bracket | Women with Births | Births / 1,000 Women |
| 15 to 19 years | 0 (0.0%) | 0.0 |
| 20 to 34 years | 2 (22.2%) | 74.0 |
| 35 to 50 years | 7 (77.8%) | 206.0 |
| Total | 9 (100.0%) | 143.0 |
Fertility by Age by Marriage Status in Surrency
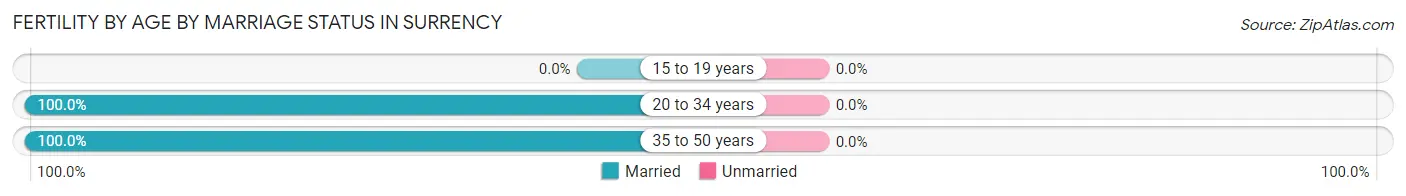
| Age Bracket | Married | Unmarried |
| 15 to 19 years | 0 (0.0%) | 0 (0.0%) |
| 20 to 34 years | 2 (100.0%) | 0 (0.0%) |
| 35 to 50 years | 7 (100.0%) | 0 (0.0%) |
| Total | 9 (100.0%) | 0 (0.0%) |
Fertility by Education in Surrency
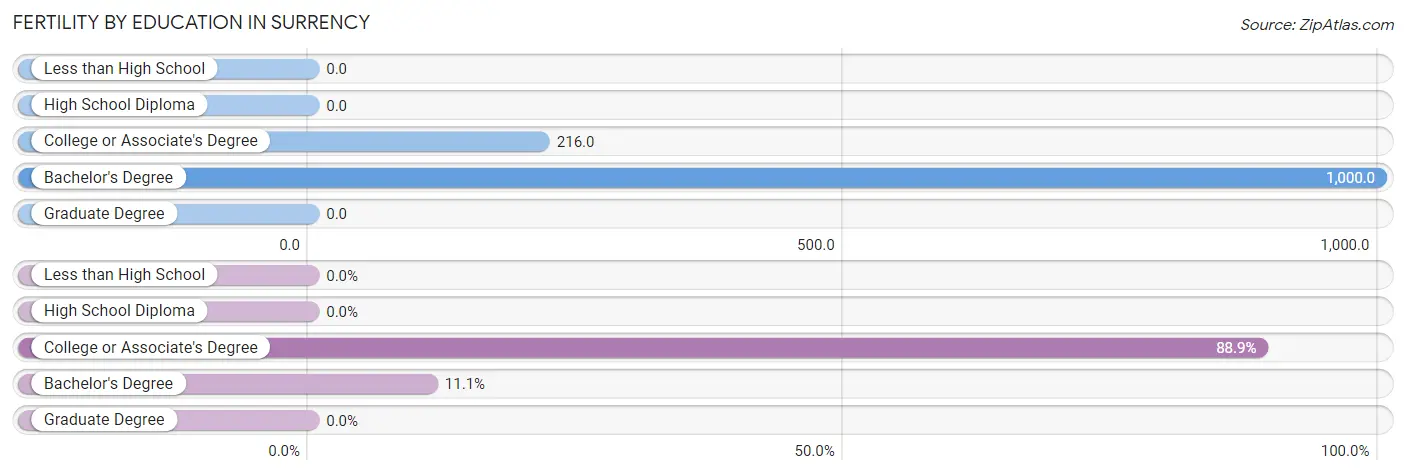
| Educational Attainment | Women with Births | Births / 1,000 Women |
| Less than High School | 0 (0.0%) | 0.0 |
| High School Diploma | 0 (0.0%) | 0.0 |
| College or Associate's Degree | 8 (88.9%) | 216.0 |
| Bachelor's Degree | 1 (11.1%) | 1,000.0 |
| Graduate Degree | 0 (0.0%) | 0.0 |
| Total | 9 (100.0%) | 143.0 |
Fertility by Education by Marriage Status in Surrency
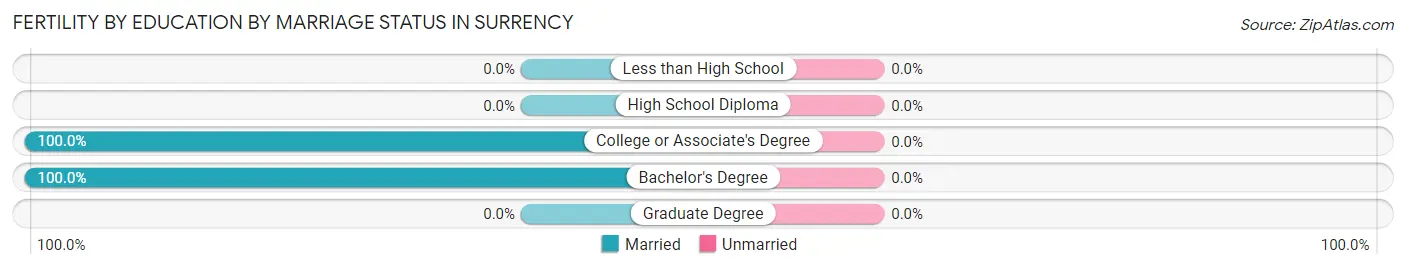
| Educational Attainment | Married | Unmarried |
| Less than High School | 0 (0.0%) | 0 (0.0%) |
| High School Diploma | 0 (0.0%) | 0 (0.0%) |
| College or Associate's Degree | 8 (100.0%) | 0 (0.0%) |
| Bachelor's Degree | 1 (100.0%) | 0 (0.0%) |
| Graduate Degree | 0 (0.0%) | 0 (0.0%) |
| Total | 9 (100.0%) | 0 (0.0%) |
Employment Characteristics in Surrency
Employment by Class of Employer in Surrency
Among the 110 employed individuals in Surrency, private company employees (76 | 69.1%), self-employed (not incorporated) (19 | 17.3%), and not-for-profit organizations (10 | 9.1%) make up the most common classes of employment.
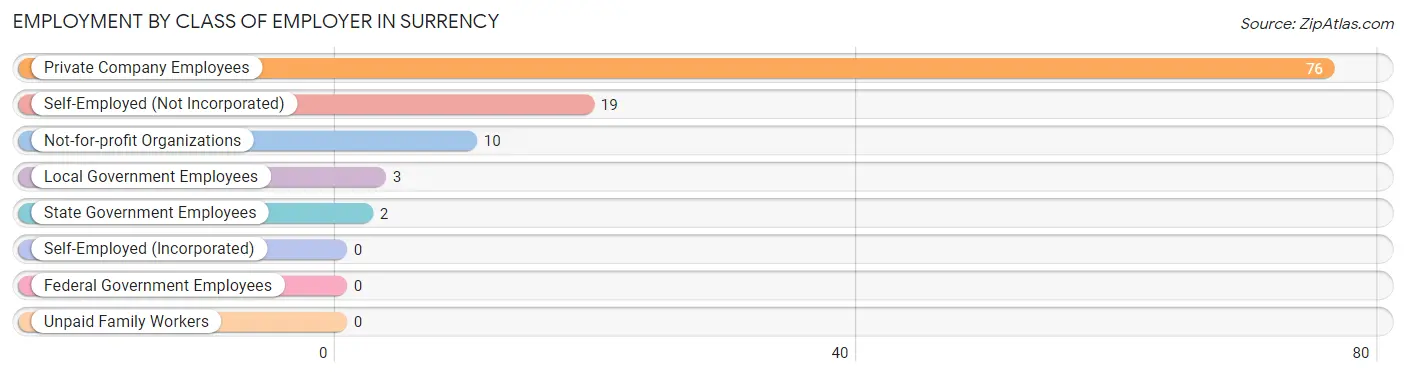
| Employer Class | # Employees | % Employees |
| Private Company Employees | 76 | 69.1% |
| Self-Employed (Incorporated) | 0 | 0.0% |
| Self-Employed (Not Incorporated) | 19 | 17.3% |
| Not-for-profit Organizations | 10 | 9.1% |
| Local Government Employees | 3 | 2.7% |
| State Government Employees | 2 | 1.8% |
| Federal Government Employees | 0 | 0.0% |
| Unpaid Family Workers | 0 | 0.0% |
| Total | 110 | 100.0% |
Employment Status by Age in Surrency
According to the labor force statistics for Surrency, out of the total population over 16 years of age (207), 58.9% or 122 individuals are in the labor force, with 8.2% or 10 of them unemployed. The age group with the highest labor force participation rate is 20 to 24 years, with 100.0% or 15 individuals in the labor force. Within the labor force, the 16 to 19 years age range has the highest percentage of unemployed individuals, with 100.0% or 10 of them being unemployed.
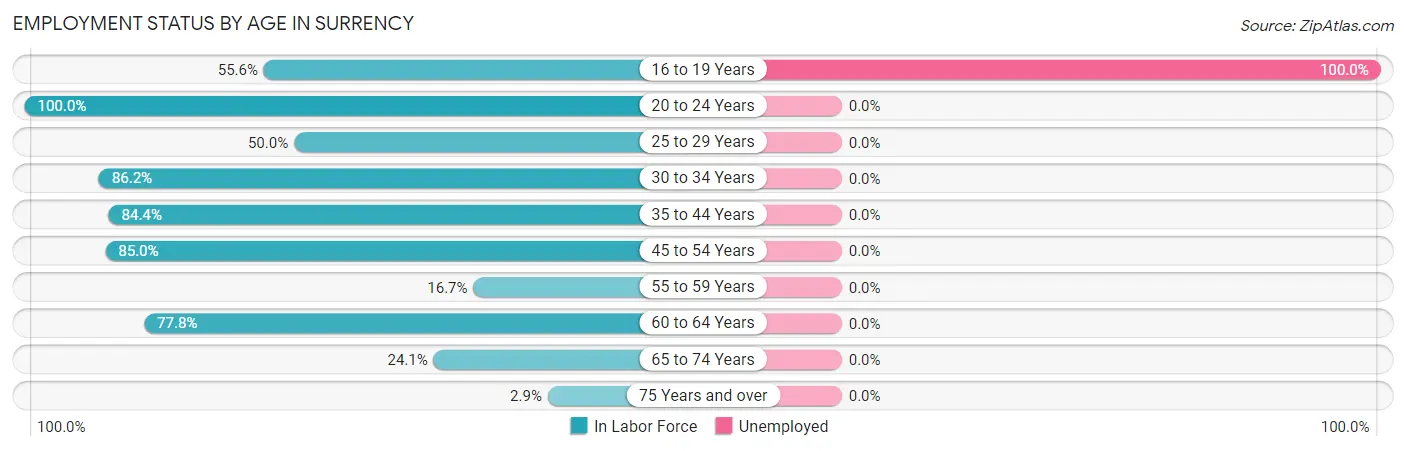
| Age Bracket | In Labor Force | Unemployed |
| 16 to 19 Years | 10 (55.6%) | 10 (100.0%) |
| 20 to 24 Years | 15 (100.0%) | 0 (0.0%) |
| 25 to 29 Years | 1 (50.0%) | 0 (0.0%) |
| 30 to 34 Years | 25 (86.2%) | 0 (0.0%) |
| 35 to 44 Years | 38 (84.4%) | 0 (0.0%) |
| 45 to 54 Years | 17 (85.0%) | 0 (0.0%) |
| 55 to 59 Years | 1 (16.7%) | 0 (0.0%) |
| 60 to 64 Years | 7 (77.8%) | 0 (0.0%) |
| 65 to 74 Years | 7 (24.1%) | 0 (0.0%) |
| 75 Years and over | 1 (2.9%) | 0 (0.0%) |
| Total | 122 (58.9%) | 10 (8.2%) |
Employment Status by Educational Attainment in Surrency
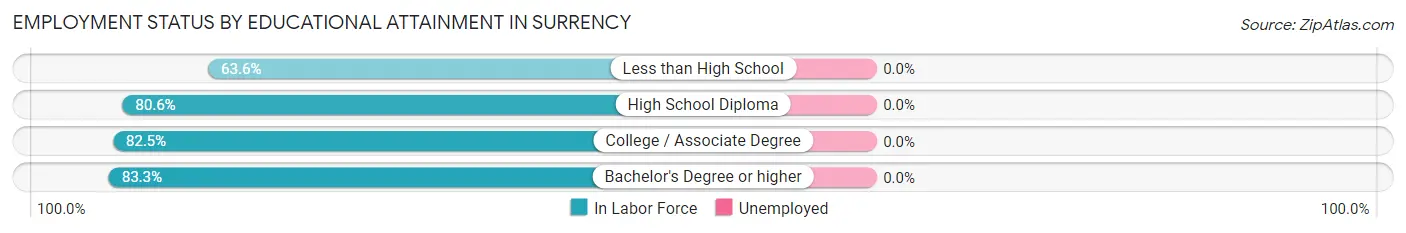
| Educational Attainment | In Labor Force | Unemployed |
| Less than High School | 7 (63.6%) | 0 (0.0%) |
| High School Diploma | 25 (80.6%) | 0 (0.0%) |
| College / Associate Degree | 52 (82.5%) | 0 (0.0%) |
| Bachelor's Degree or higher | 5 (83.3%) | 0 (0.0%) |
| Total | 89 (80.2%) | 0 (0.0%) |
Employment Occupations by Sex in Surrency
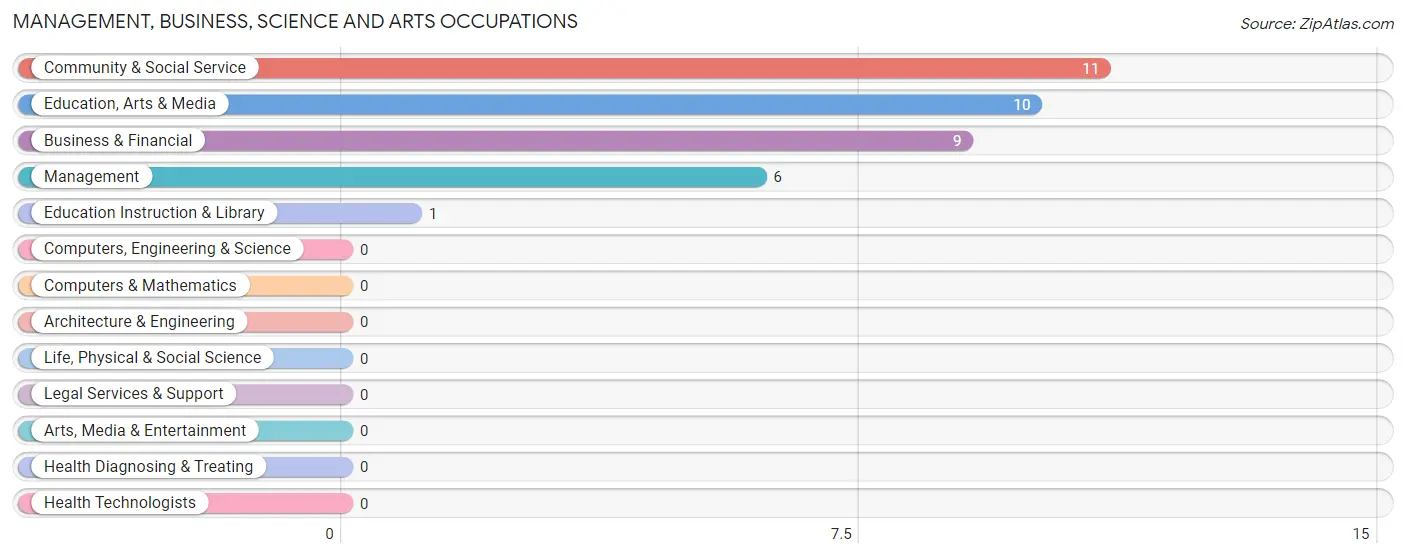
Management, Business, Science and Arts Occupations
The most common Management, Business, Science and Arts occupations in Surrency are Community & Social Service (11 | 9.8%), Education, Arts & Media (10 | 8.9%), Business & Financial (9 | 8.0%), Management (6 | 5.4%), and Education Instruction & Library (1 | 0.9%).
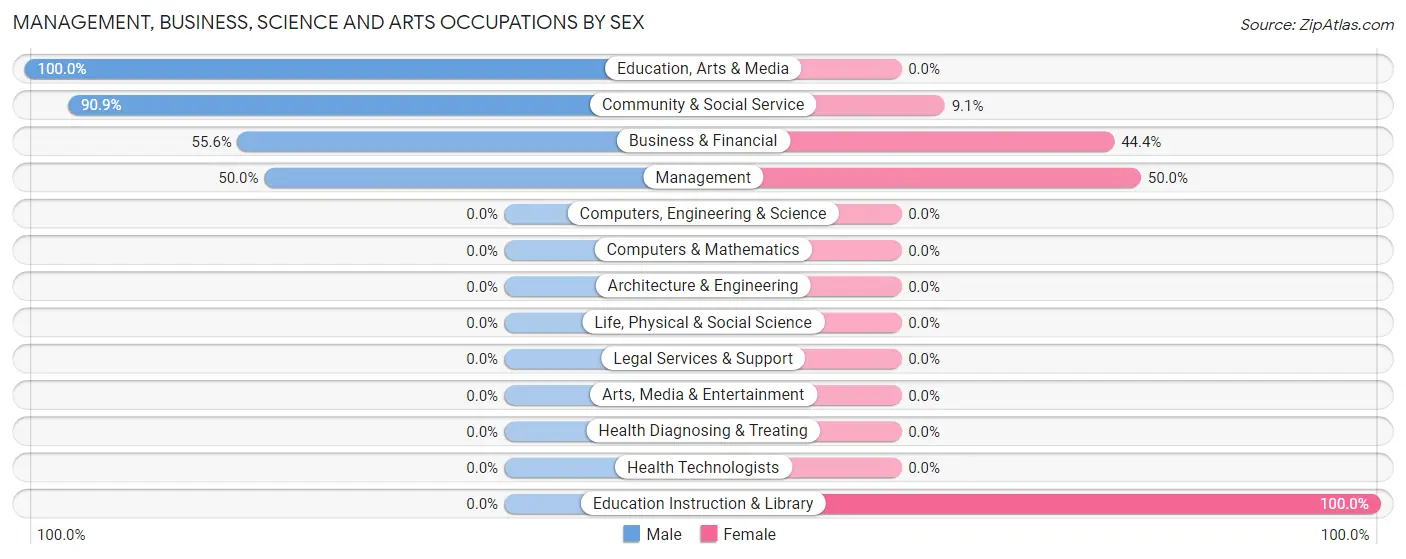
Management, Business, Science and Arts Occupations by Sex
Within the Management, Business, Science and Arts occupations in Surrency, the most male-oriented occupations are Education, Arts & Media (100.0%), Community & Social Service (90.9%), and Business & Financial (55.6%), while the most female-oriented occupations are Education Instruction & Library (100.0%), Management (50.0%), and Business & Financial (44.4%).
| Occupation | Male | Female |
| Management | 3 (50.0%) | 3 (50.0%) |
| Business & Financial | 5 (55.6%) | 4 (44.4%) |
| Computers, Engineering & Science | 0 (0.0%) | 0 (0.0%) |
| Computers & Mathematics | 0 (0.0%) | 0 (0.0%) |
| Architecture & Engineering | 0 (0.0%) | 0 (0.0%) |
| Life, Physical & Social Science | 0 (0.0%) | 0 (0.0%) |
| Community & Social Service | 10 (90.9%) | 1 (9.1%) |
| Education, Arts & Media | 10 (100.0%) | 0 (0.0%) |
| Legal Services & Support | 0 (0.0%) | 0 (0.0%) |
| Education Instruction & Library | 0 (0.0%) | 1 (100.0%) |
| Arts, Media & Entertainment | 0 (0.0%) | 0 (0.0%) |
| Health Diagnosing & Treating | 0 (0.0%) | 0 (0.0%) |
| Health Technologists | 0 (0.0%) | 0 (0.0%) |
| Total (Category) | 18 (69.2%) | 8 (30.8%) |
| Total (Overall) | 56 (50.0%) | 56 (50.0%) |
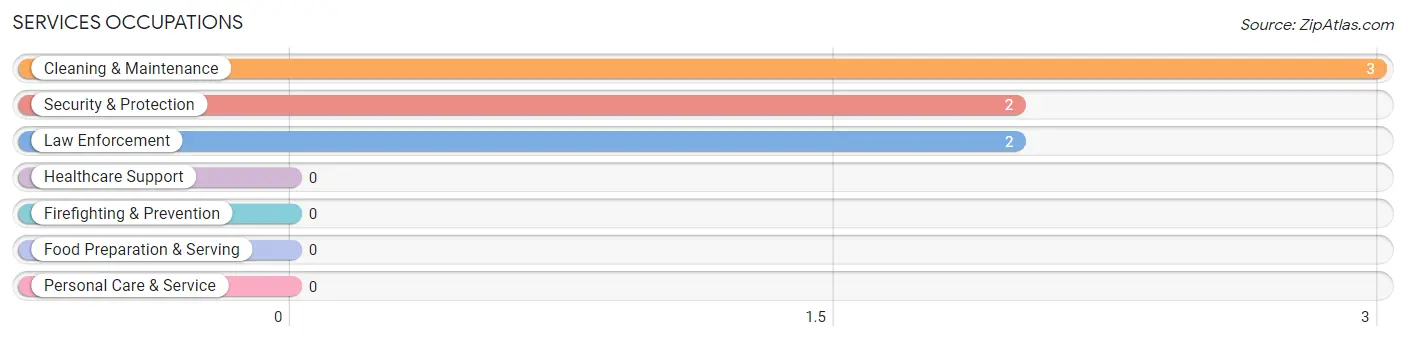
Services Occupations
The most common Services occupations in Surrency are Cleaning & Maintenance (3 | 2.7%), Security & Protection (2 | 1.8%), and Law Enforcement (2 | 1.8%).
Services Occupations by Sex
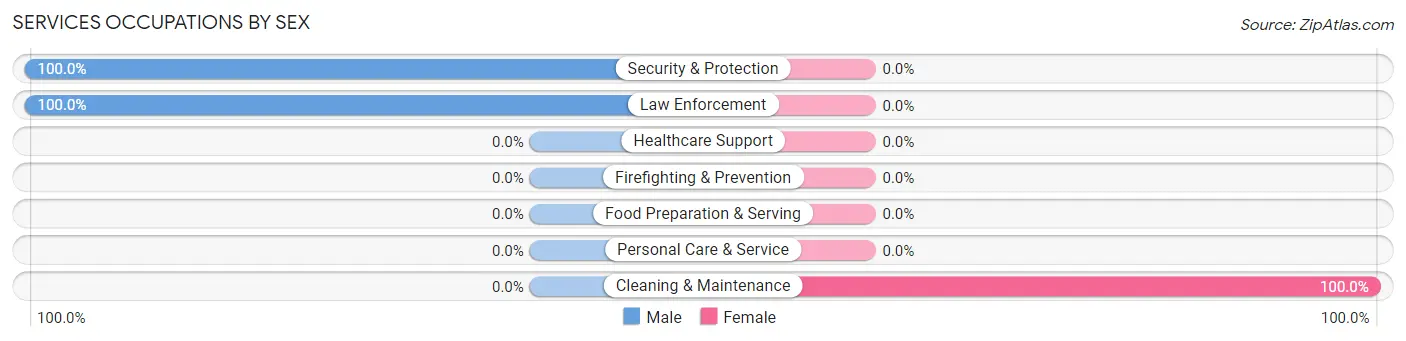
| Occupation | Male | Female |
| Healthcare Support | 0 (0.0%) | 0 (0.0%) |
| Security & Protection | 2 (100.0%) | 0 (0.0%) |
| Firefighting & Prevention | 0 (0.0%) | 0 (0.0%) |
| Law Enforcement | 2 (100.0%) | 0 (0.0%) |
| Food Preparation & Serving | 0 (0.0%) | 0 (0.0%) |
| Cleaning & Maintenance | 0 (0.0%) | 3 (100.0%) |
| Personal Care & Service | 0 (0.0%) | 0 (0.0%) |
| Total (Category) | 2 (40.0%) | 3 (60.0%) |
| Total (Overall) | 56 (50.0%) | 56 (50.0%) |
Sales and Office Occupations
The most common Sales and Office occupations in Surrency are Office & Administration (31 | 27.7%), and Sales & Related (8 | 7.1%).
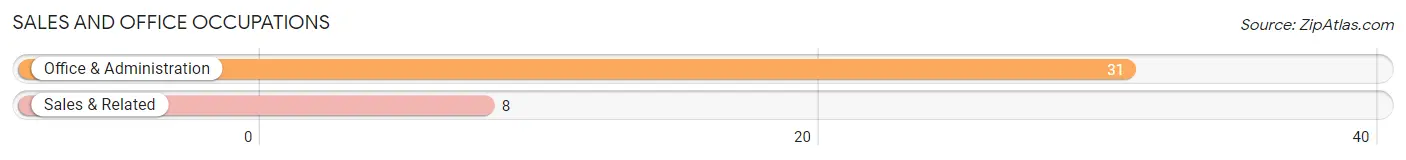
Sales and Office Occupations by Sex
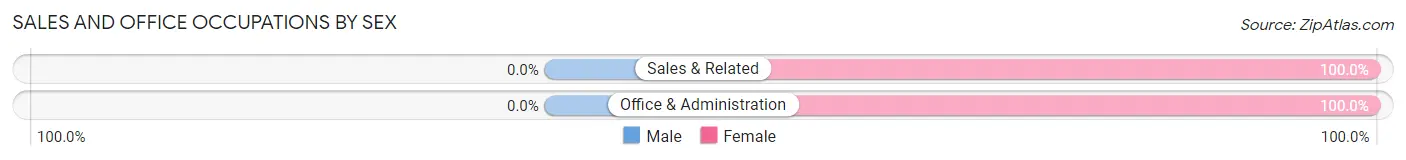
| Occupation | Male | Female |
| Sales & Related | 0 (0.0%) | 8 (100.0%) |
| Office & Administration | 0 (0.0%) | 31 (100.0%) |
| Total (Category) | 0 (0.0%) | 39 (100.0%) |
| Total (Overall) | 56 (50.0%) | 56 (50.0%) |
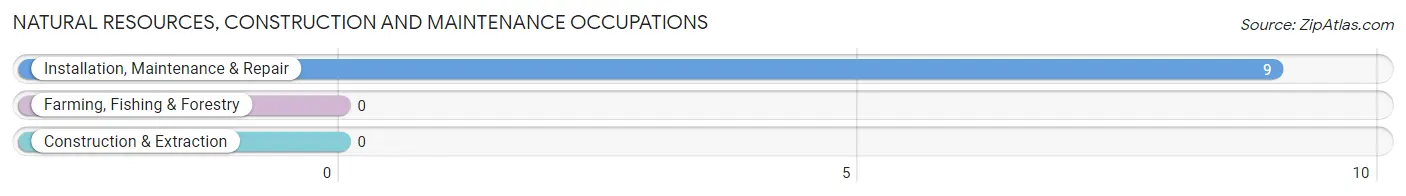
Natural Resources, Construction and Maintenance Occupations
The most common Natural Resources, Construction and Maintenance occupations in Surrency are , and Installation, Maintenance & Repair (9 | 8.0%).
Natural Resources, Construction and Maintenance Occupations by Sex
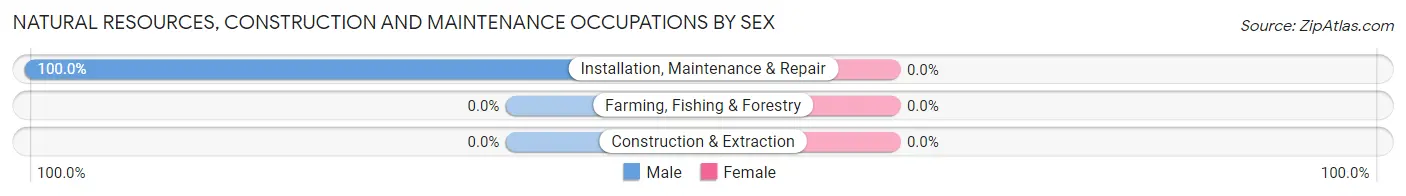
| Occupation | Male | Female |
| Farming, Fishing & Forestry | 0 (0.0%) | 0 (0.0%) |
| Construction & Extraction | 0 (0.0%) | 0 (0.0%) |
| Installation, Maintenance & Repair | 9 (100.0%) | 0 (0.0%) |
| Total (Category) | 9 (100.0%) | 0 (0.0%) |
| Total (Overall) | 56 (50.0%) | 56 (50.0%) |
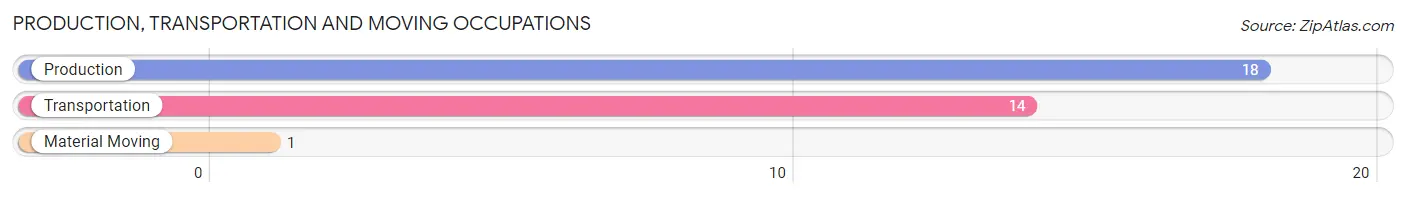
Production, Transportation and Moving Occupations
The most common Production, Transportation and Moving occupations in Surrency are Production (18 | 16.1%), Transportation (14 | 12.5%), and Material Moving (1 | 0.9%).
Production, Transportation and Moving Occupations by Sex
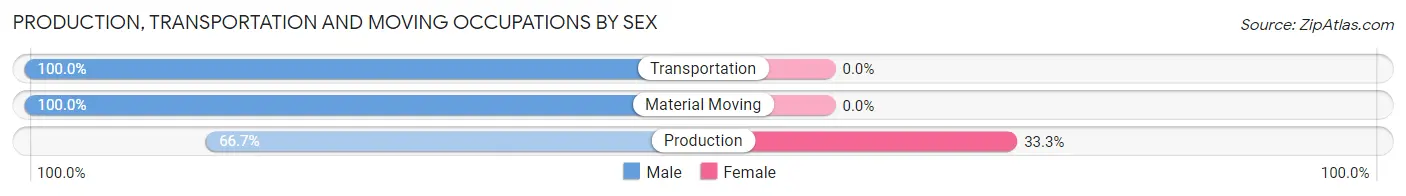
| Occupation | Male | Female |
| Production | 12 (66.7%) | 6 (33.3%) |
| Transportation | 14 (100.0%) | 0 (0.0%) |
| Material Moving | 1 (100.0%) | 0 (0.0%) |
| Total (Category) | 27 (81.8%) | 6 (18.2%) |
| Total (Overall) | 56 (50.0%) | 56 (50.0%) |
Employment Industries by Sex in Surrency
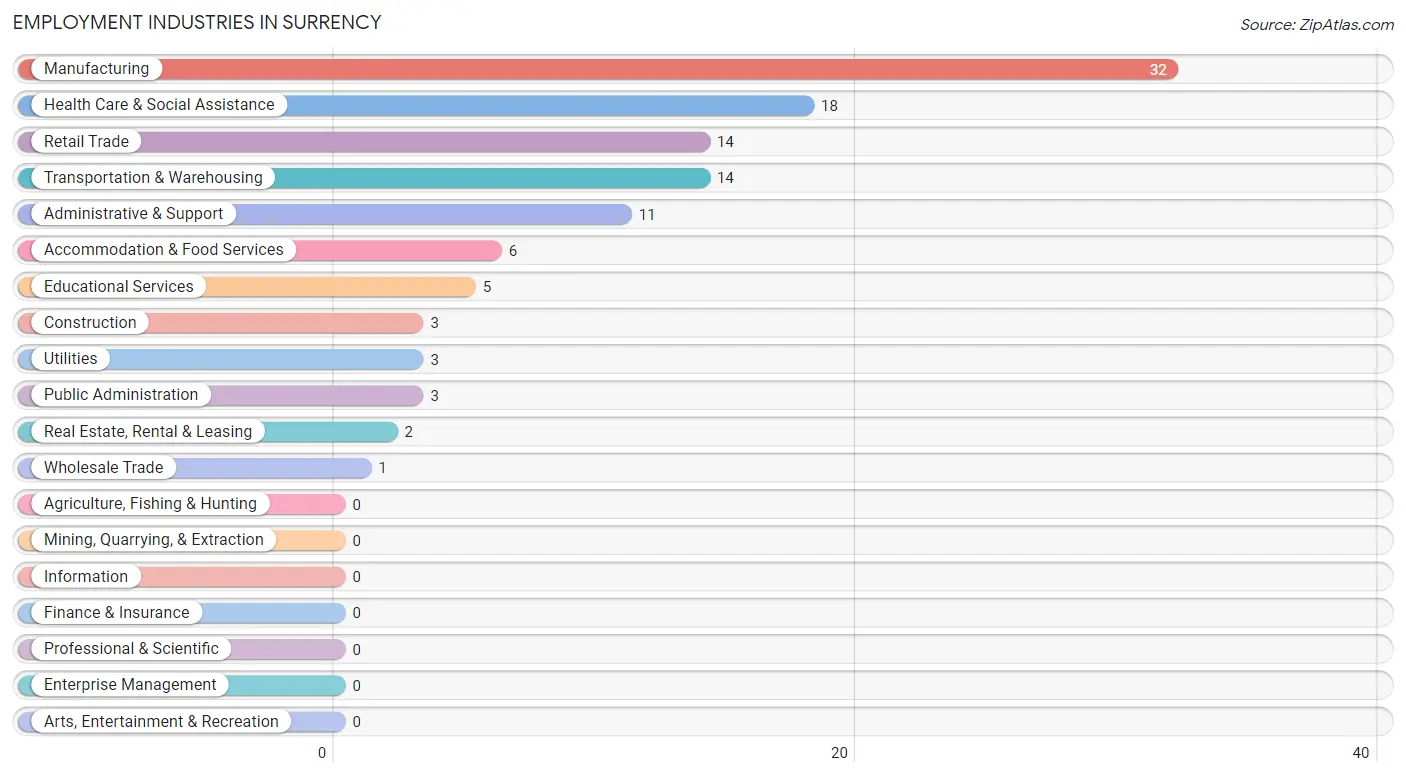
Employment Industries in Surrency
The major employment industries in Surrency include Manufacturing (32 | 28.6%), Health Care & Social Assistance (18 | 16.1%), Retail Trade (14 | 12.5%), Transportation & Warehousing (14 | 12.5%), and Administrative & Support (11 | 9.8%).
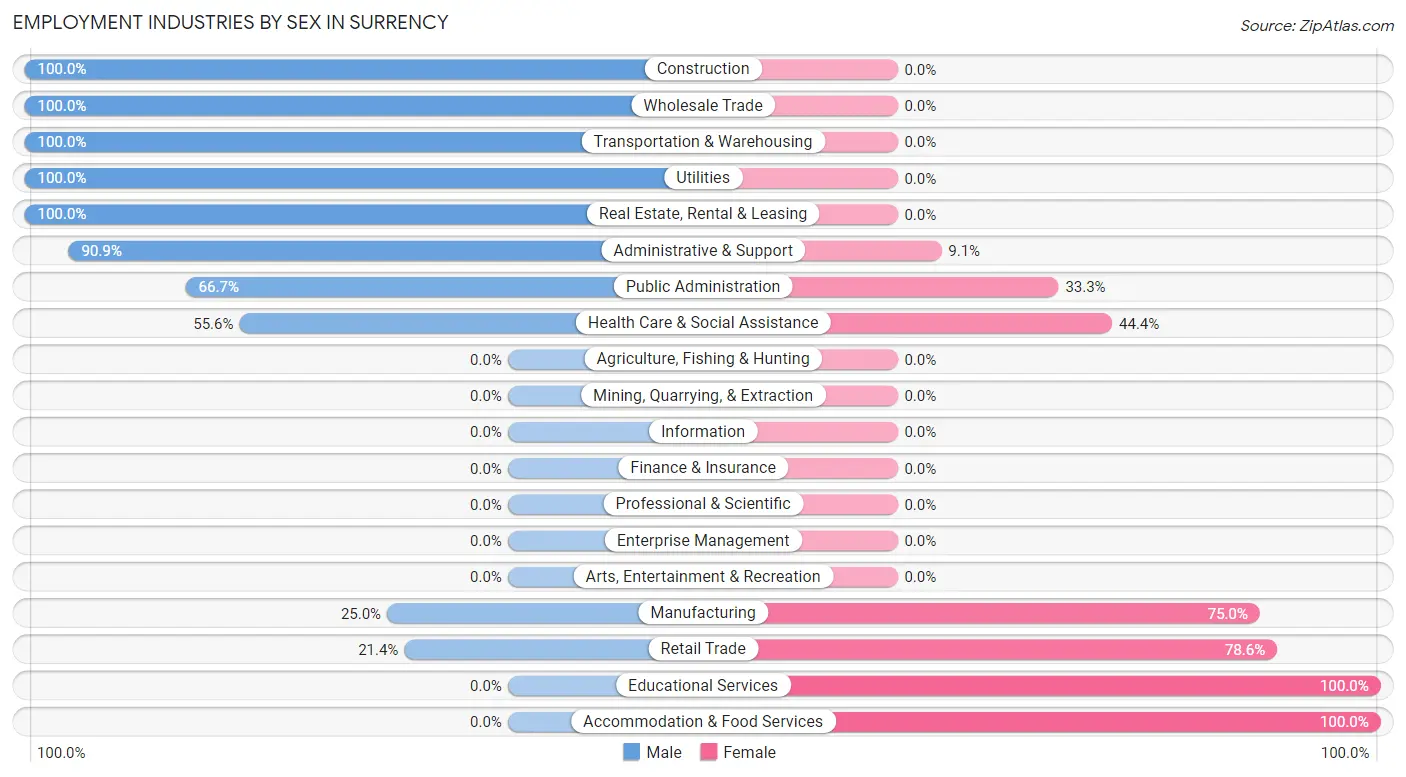
Employment Industries by Sex in Surrency
The Surrency industries that see more men than women are Construction (100.0%), Wholesale Trade (100.0%), and Transportation & Warehousing (100.0%), whereas the industries that tend to have a higher number of women are Educational Services (100.0%), Accommodation & Food Services (100.0%), and Retail Trade (78.6%).
| Industry | Male | Female |
| Agriculture, Fishing & Hunting | 0 (0.0%) | 0 (0.0%) |
| Mining, Quarrying, & Extraction | 0 (0.0%) | 0 (0.0%) |
| Construction | 3 (100.0%) | 0 (0.0%) |
| Manufacturing | 8 (25.0%) | 24 (75.0%) |
| Wholesale Trade | 1 (100.0%) | 0 (0.0%) |
| Retail Trade | 3 (21.4%) | 11 (78.6%) |
| Transportation & Warehousing | 14 (100.0%) | 0 (0.0%) |
| Utilities | 3 (100.0%) | 0 (0.0%) |
| Information | 0 (0.0%) | 0 (0.0%) |
| Finance & Insurance | 0 (0.0%) | 0 (0.0%) |
| Real Estate, Rental & Leasing | 2 (100.0%) | 0 (0.0%) |
| Professional & Scientific | 0 (0.0%) | 0 (0.0%) |
| Enterprise Management | 0 (0.0%) | 0 (0.0%) |
| Administrative & Support | 10 (90.9%) | 1 (9.1%) |
| Educational Services | 0 (0.0%) | 5 (100.0%) |
| Health Care & Social Assistance | 10 (55.6%) | 8 (44.4%) |
| Arts, Entertainment & Recreation | 0 (0.0%) | 0 (0.0%) |
| Accommodation & Food Services | 0 (0.0%) | 6 (100.0%) |
| Public Administration | 2 (66.7%) | 1 (33.3%) |
| Total | 56 (50.0%) | 56 (50.0%) |
Education in Surrency
School Enrollment in Surrency
The most common levels of schooling among the 105 students in Surrency are high school (30 | 28.6%), middle school (23 | 21.9%), and elementary school (22 | 20.9%).
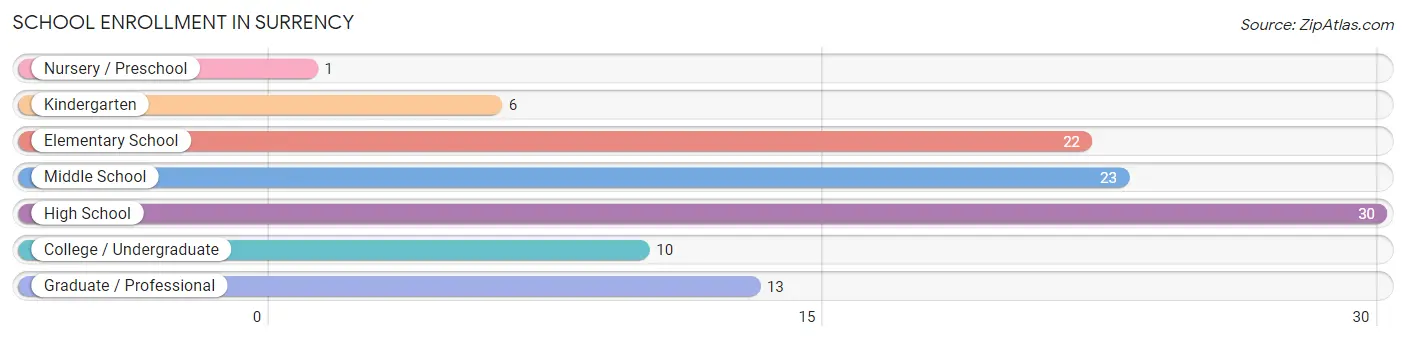
| School Level | # Students | % Students |
| Nursery / Preschool | 1 | 0.9% |
| Kindergarten | 6 | 5.7% |
| Elementary School | 22 | 20.9% |
| Middle School | 23 | 21.9% |
| High School | 30 | 28.6% |
| College / Undergraduate | 10 | 9.5% |
| Graduate / Professional | 13 | 12.4% |
| Total | 105 | 100.0% |
School Enrollment by Age by Funding Source in Surrency
Out of a total of 105 students who are enrolled in schools in Surrency, 4 (3.8%) attend a private institution, while the remaining 101 (96.2%) are enrolled in public schools. The age group of 3 to 4 year olds has the highest likelihood of being enrolled in private schools, with 1 (100.0% in the age bracket) enrolled. Conversely, the age group of 5 to 9 year old has the lowest likelihood of being enrolled in a private school, with 28 (100.0% in the age bracket) attending a public institution.
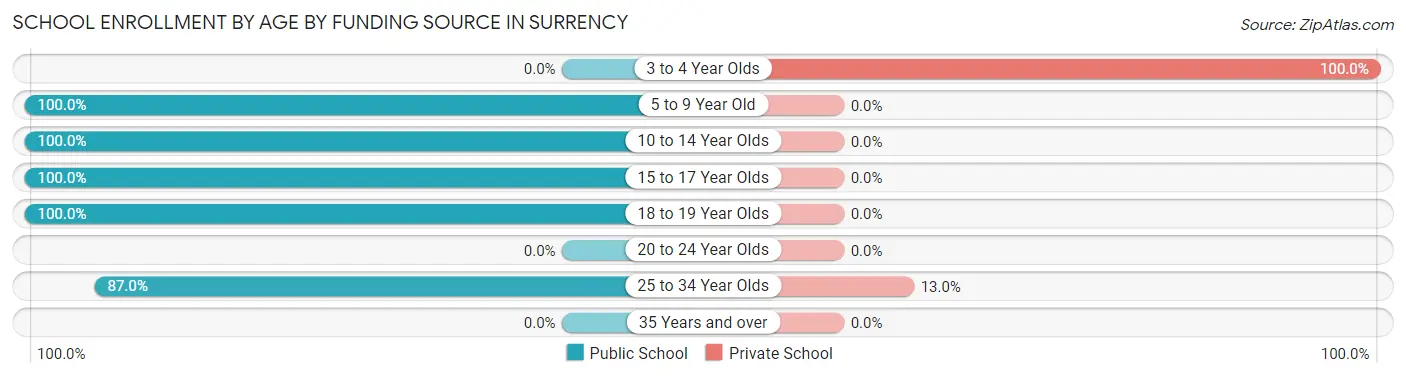
| Age Bracket | Public School | Private School |
| 3 to 4 Year Olds | 0 (0.0%) | 1 (100.0%) |
| 5 to 9 Year Old | 28 (100.0%) | 0 (0.0%) |
| 10 to 14 Year Olds | 23 (100.0%) | 0 (0.0%) |
| 15 to 17 Year Olds | 20 (100.0%) | 0 (0.0%) |
| 18 to 19 Year Olds | 10 (100.0%) | 0 (0.0%) |
| 20 to 24 Year Olds | 0 (0.0%) | 0 (0.0%) |
| 25 to 34 Year Olds | 20 (87.0%) | 3 (13.0%) |
| 35 Years and over | 0 (0.0%) | 0 (0.0%) |
| Total | 101 (96.2%) | 4 (3.8%) |
Educational Attainment by Field of Study in Surrency
Education (4 | 57.1%), and engineering (3 | 42.9%) are the most common fields of study among 7 individuals in Surrency who have obtained a bachelor's degree or higher.
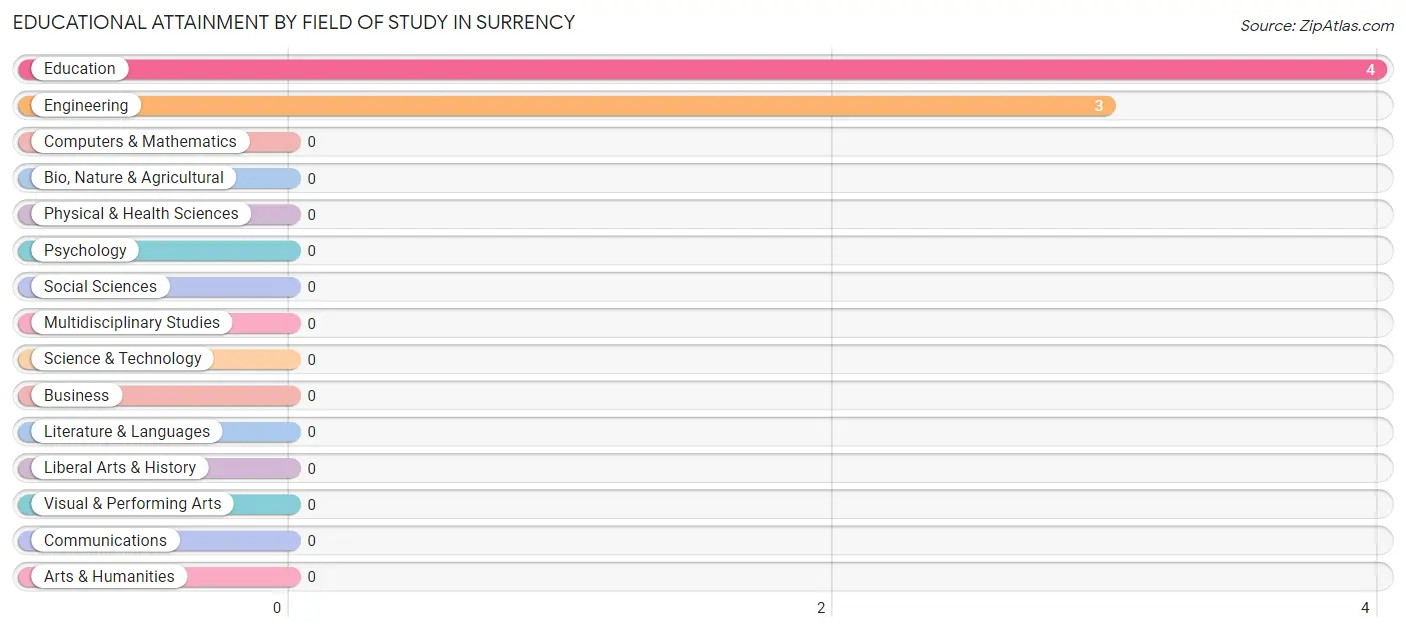
| Field of Study | # Graduates | % Graduates |
| Computers & Mathematics | 0 | 0.0% |
| Bio, Nature & Agricultural | 0 | 0.0% |
| Physical & Health Sciences | 0 | 0.0% |
| Psychology | 0 | 0.0% |
| Social Sciences | 0 | 0.0% |
| Engineering | 3 | 42.9% |
| Multidisciplinary Studies | 0 | 0.0% |
| Science & Technology | 0 | 0.0% |
| Business | 0 | 0.0% |
| Education | 4 | 57.1% |
| Literature & Languages | 0 | 0.0% |
| Liberal Arts & History | 0 | 0.0% |
| Visual & Performing Arts | 0 | 0.0% |
| Communications | 0 | 0.0% |
| Arts & Humanities | 0 | 0.0% |
| Total | 7 | 100.0% |
Transportation & Commute in Surrency
Vehicle Availability by Sex in Surrency
The most prevalent vehicle ownership categories in Surrency are males with 2 vehicles (39, accounting for 70.9%) and females with 2 vehicles (30, making up 70.9%).
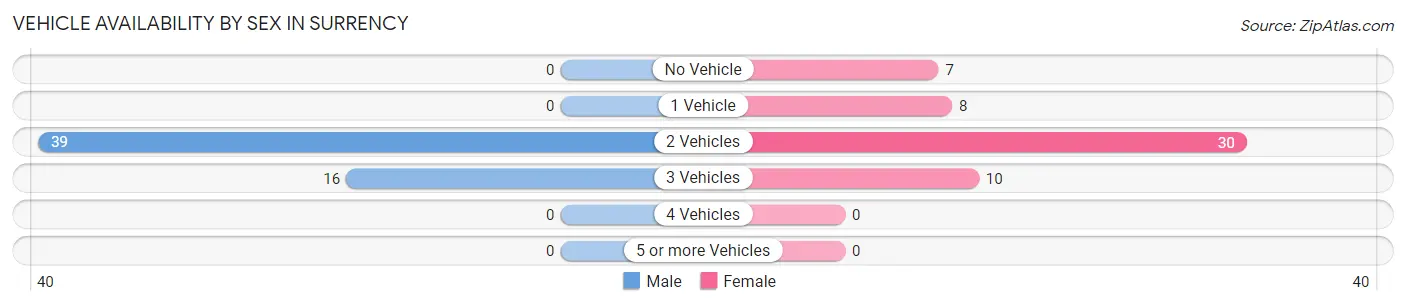
| Vehicles Available | Male | Female |
| No Vehicle | 0 (0.0%) | 7 (12.7%) |
| 1 Vehicle | 0 (0.0%) | 8 (14.5%) |
| 2 Vehicles | 39 (70.9%) | 30 (54.5%) |
| 3 Vehicles | 16 (29.1%) | 10 (18.2%) |
| 4 Vehicles | 0 (0.0%) | 0 (0.0%) |
| 5 or more Vehicles | 0 (0.0%) | 0 (0.0%) |
| Total | 55 (100.0%) | 55 (100.0%) |
Commute Time in Surrency
The most frequently occuring commute durations in Surrency are 20 to 24 minutes (41 commuters, 37.3%), 10 to 14 minutes (29 commuters, 26.4%), and 30 to 34 minutes (20 commuters, 18.2%).
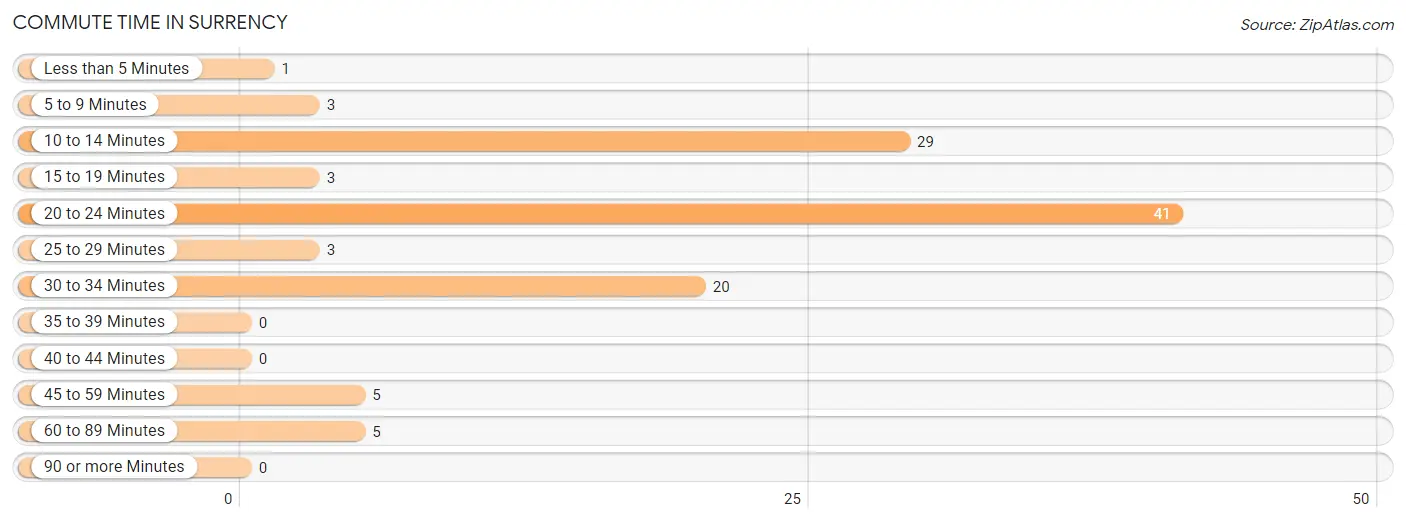
| Commute Time | # Commuters | % Commuters |
| Less than 5 Minutes | 1 | 0.9% |
| 5 to 9 Minutes | 3 | 2.7% |
| 10 to 14 Minutes | 29 | 26.4% |
| 15 to 19 Minutes | 3 | 2.7% |
| 20 to 24 Minutes | 41 | 37.3% |
| 25 to 29 Minutes | 3 | 2.7% |
| 30 to 34 Minutes | 20 | 18.2% |
| 35 to 39 Minutes | 0 | 0.0% |
| 40 to 44 Minutes | 0 | 0.0% |
| 45 to 59 Minutes | 5 | 4.5% |
| 60 to 89 Minutes | 5 | 4.5% |
| 90 or more Minutes | 0 | 0.0% |
Commute Time by Sex in Surrency
The most common commute times in Surrency are 20 to 24 minutes (16 commuters, 29.1%) for males and 20 to 24 minutes (25 commuters, 45.5%) for females.
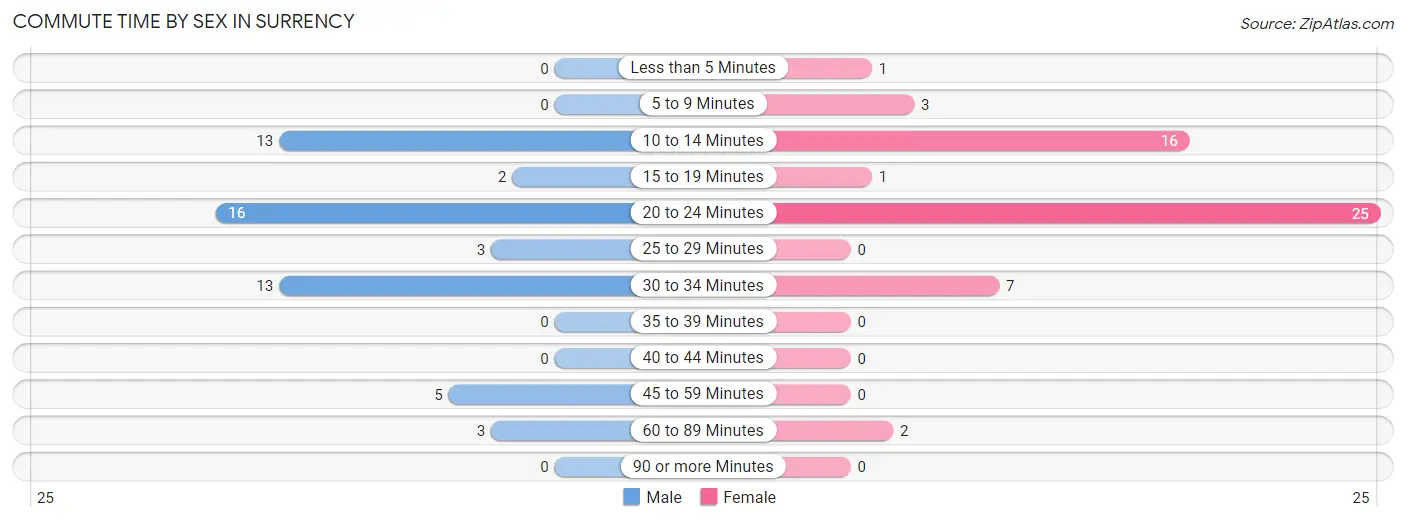
| Commute Time | Male | Female |
| Less than 5 Minutes | 0 (0.0%) | 1 (1.8%) |
| 5 to 9 Minutes | 0 (0.0%) | 3 (5.4%) |
| 10 to 14 Minutes | 13 (23.6%) | 16 (29.1%) |
| 15 to 19 Minutes | 2 (3.6%) | 1 (1.8%) |
| 20 to 24 Minutes | 16 (29.1%) | 25 (45.5%) |
| 25 to 29 Minutes | 3 (5.4%) | 0 (0.0%) |
| 30 to 34 Minutes | 13 (23.6%) | 7 (12.7%) |
| 35 to 39 Minutes | 0 (0.0%) | 0 (0.0%) |
| 40 to 44 Minutes | 0 (0.0%) | 0 (0.0%) |
| 45 to 59 Minutes | 5 (9.1%) | 0 (0.0%) |
| 60 to 89 Minutes | 3 (5.4%) | 2 (3.6%) |
| 90 or more Minutes | 0 (0.0%) | 0 (0.0%) |
Time of Departure to Work by Sex in Surrency
The most frequent times of departure to work in Surrency are 12:00 AM to 4:59 AM (14, 25.5%) for males and 8:00 AM to 8:29 AM (19, 34.5%) for females.
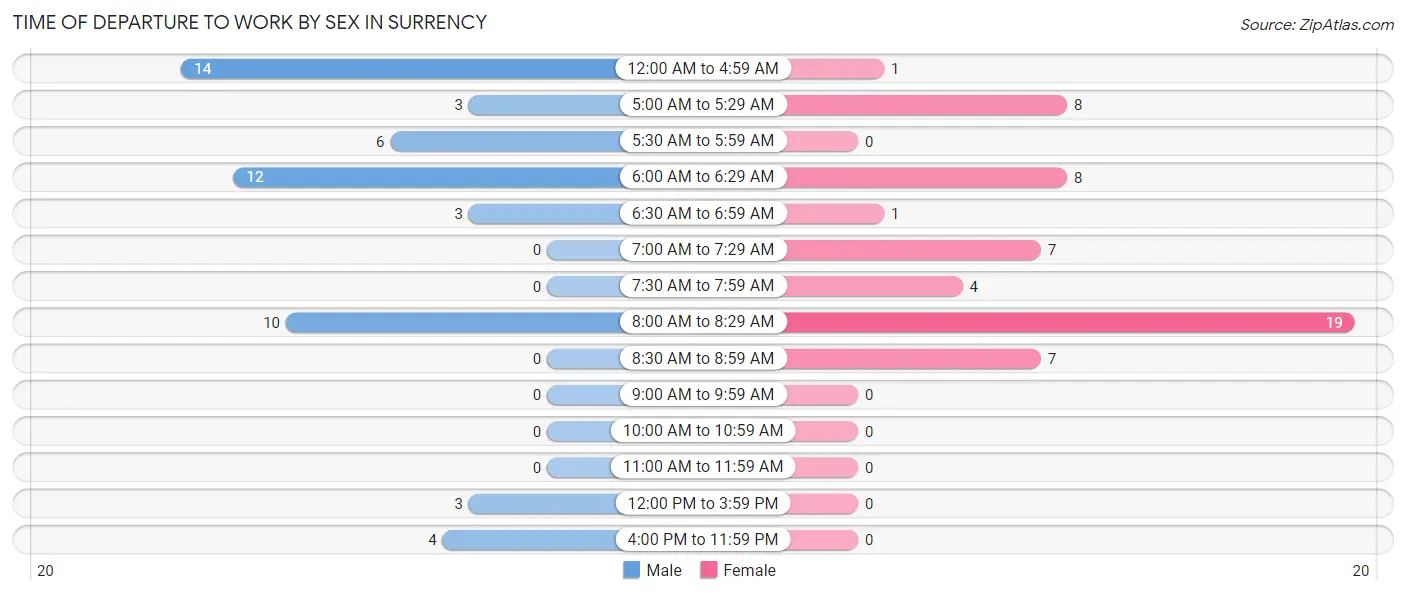
| Time of Departure | Male | Female |
| 12:00 AM to 4:59 AM | 14 (25.5%) | 1 (1.8%) |
| 5:00 AM to 5:29 AM | 3 (5.4%) | 8 (14.5%) |
| 5:30 AM to 5:59 AM | 6 (10.9%) | 0 (0.0%) |
| 6:00 AM to 6:29 AM | 12 (21.8%) | 8 (14.5%) |
| 6:30 AM to 6:59 AM | 3 (5.4%) | 1 (1.8%) |
| 7:00 AM to 7:29 AM | 0 (0.0%) | 7 (12.7%) |
| 7:30 AM to 7:59 AM | 0 (0.0%) | 4 (7.3%) |
| 8:00 AM to 8:29 AM | 10 (18.2%) | 19 (34.5%) |
| 8:30 AM to 8:59 AM | 0 (0.0%) | 7 (12.7%) |
| 9:00 AM to 9:59 AM | 0 (0.0%) | 0 (0.0%) |
| 10:00 AM to 10:59 AM | 0 (0.0%) | 0 (0.0%) |
| 11:00 AM to 11:59 AM | 0 (0.0%) | 0 (0.0%) |
| 12:00 PM to 3:59 PM | 3 (5.4%) | 0 (0.0%) |
| 4:00 PM to 11:59 PM | 4 (7.3%) | 0 (0.0%) |
| Total | 55 (100.0%) | 55 (100.0%) |
Housing Occupancy in Surrency
Occupancy by Ownership in Surrency
Of the total 95 dwellings in Surrency, owner-occupied units account for 70 (73.7%), while renter-occupied units make up 25 (26.3%).
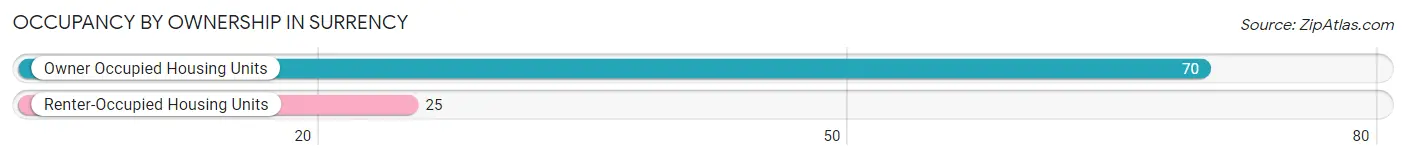
| Occupancy | # Housing Units | % Housing Units |
| Owner Occupied Housing Units | 70 | 73.7% |
| Renter-Occupied Housing Units | 25 | 26.3% |
| Total Occupied Housing Units | 95 | 100.0% |
Occupancy by Household Size in Surrency
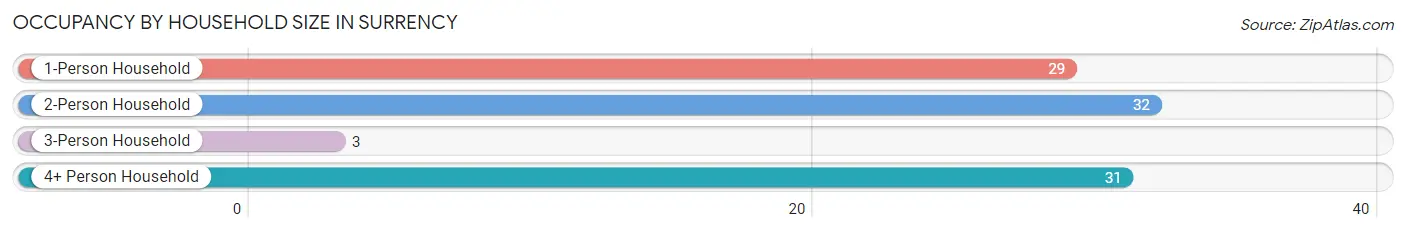
| Household Size | # Housing Units | % Housing Units |
| 1-Person Household | 29 | 30.5% |
| 2-Person Household | 32 | 33.7% |
| 3-Person Household | 3 | 3.2% |
| 4+ Person Household | 31 | 32.6% |
| Total Housing Units | 95 | 100.0% |
Occupancy by Ownership by Household Size in Surrency
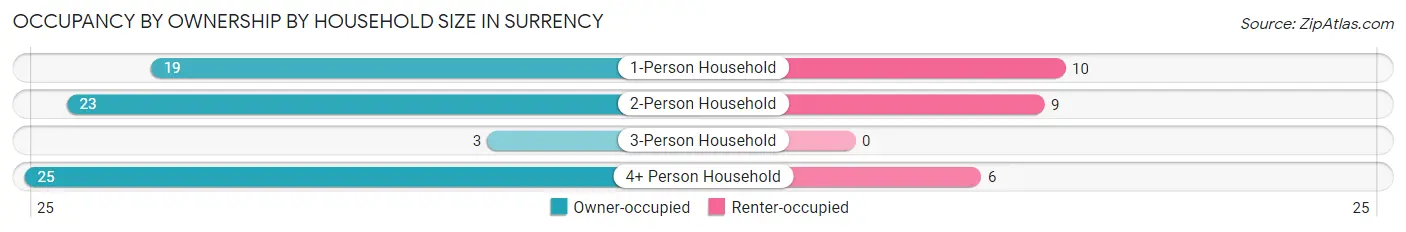
| Household Size | Owner-occupied | Renter-occupied |
| 1-Person Household | 19 (65.5%) | 10 (34.5%) |
| 2-Person Household | 23 (71.9%) | 9 (28.1%) |
| 3-Person Household | 3 (100.0%) | 0 (0.0%) |
| 4+ Person Household | 25 (80.6%) | 6 (19.4%) |
| Total Housing Units | 70 (73.7%) | 25 (26.3%) |
Occupancy by Educational Attainment in Surrency
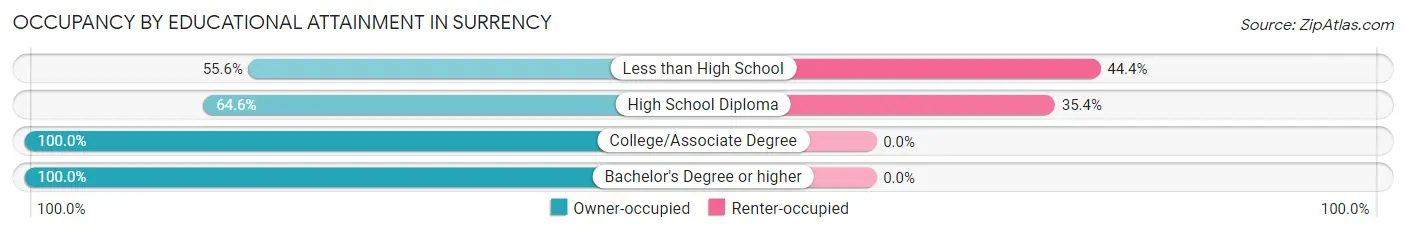
| Household Size | Owner-occupied | Renter-occupied |
| Less than High School | 10 (55.6%) | 8 (44.4%) |
| High School Diploma | 31 (64.6%) | 17 (35.4%) |
| College/Associate Degree | 25 (100.0%) | 0 (0.0%) |
| Bachelor's Degree or higher | 4 (100.0%) | 0 (0.0%) |
Occupancy by Age of Householder in Surrency
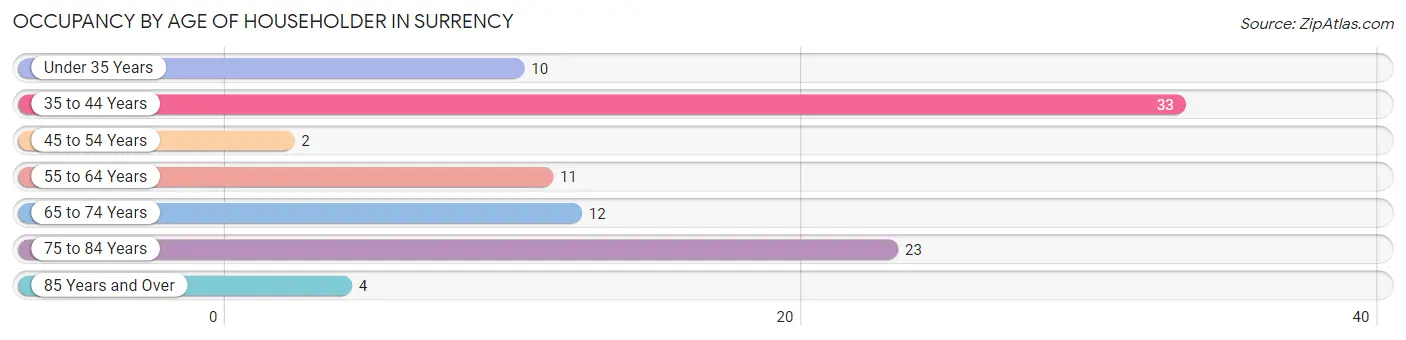
| Age Bracket | # Households | % Households |
| Under 35 Years | 10 | 10.5% |
| 35 to 44 Years | 33 | 34.7% |
| 45 to 54 Years | 2 | 2.1% |
| 55 to 64 Years | 11 | 11.6% |
| 65 to 74 Years | 12 | 12.6% |
| 75 to 84 Years | 23 | 24.2% |
| 85 Years and Over | 4 | 4.2% |
| Total | 95 | 100.0% |
Housing Finances in Surrency
Median Income by Occupancy in Surrency
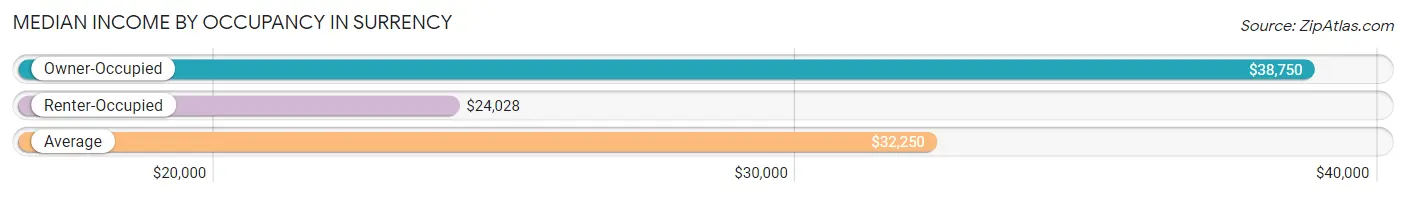
| Occupancy Type | # Households | Median Income |
| Owner-Occupied | 70 (73.7%) | $38,750 |
| Renter-Occupied | 25 (26.3%) | $24,028 |
| Average | 95 (100.0%) | $32,250 |
Occupancy by Householder Income Bracket in Surrency
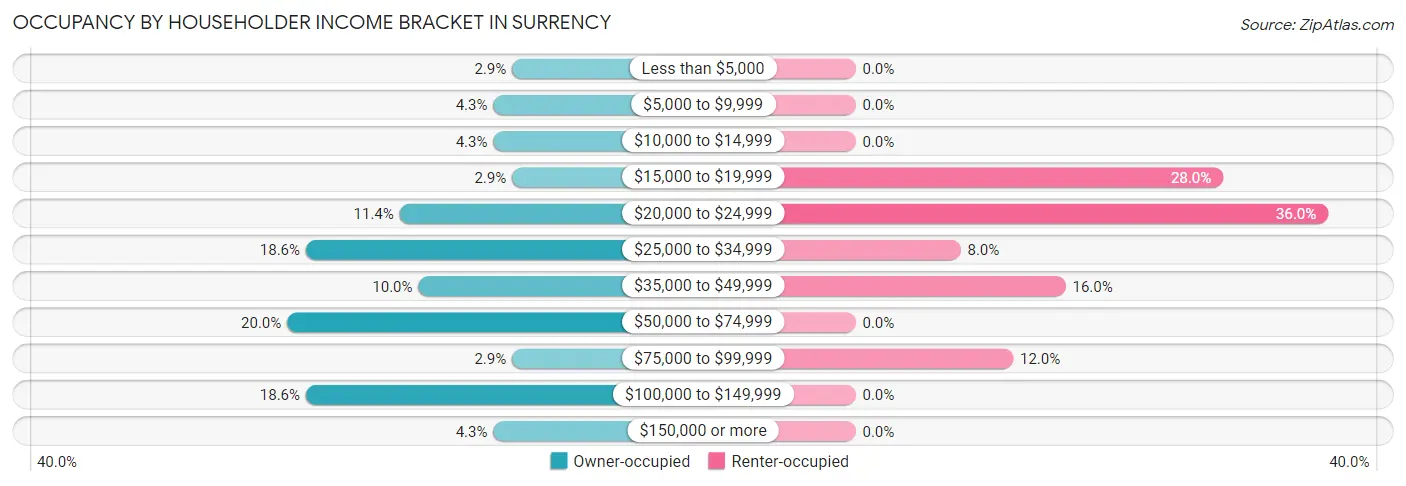
| Income Bracket | Owner-occupied | Renter-occupied |
| Less than $5,000 | 2 (2.9%) | 0 (0.0%) |
| $5,000 to $9,999 | 3 (4.3%) | 0 (0.0%) |
| $10,000 to $14,999 | 3 (4.3%) | 0 (0.0%) |
| $15,000 to $19,999 | 2 (2.9%) | 7 (28.0%) |
| $20,000 to $24,999 | 8 (11.4%) | 9 (36.0%) |
| $25,000 to $34,999 | 13 (18.6%) | 2 (8.0%) |
| $35,000 to $49,999 | 7 (10.0%) | 4 (16.0%) |
| $50,000 to $74,999 | 14 (20.0%) | 0 (0.0%) |
| $75,000 to $99,999 | 2 (2.9%) | 3 (12.0%) |
| $100,000 to $149,999 | 13 (18.6%) | 0 (0.0%) |
| $150,000 or more | 3 (4.3%) | 0 (0.0%) |
| Total | 70 (100.0%) | 25 (100.0%) |
Monthly Housing Cost Tiers in Surrency
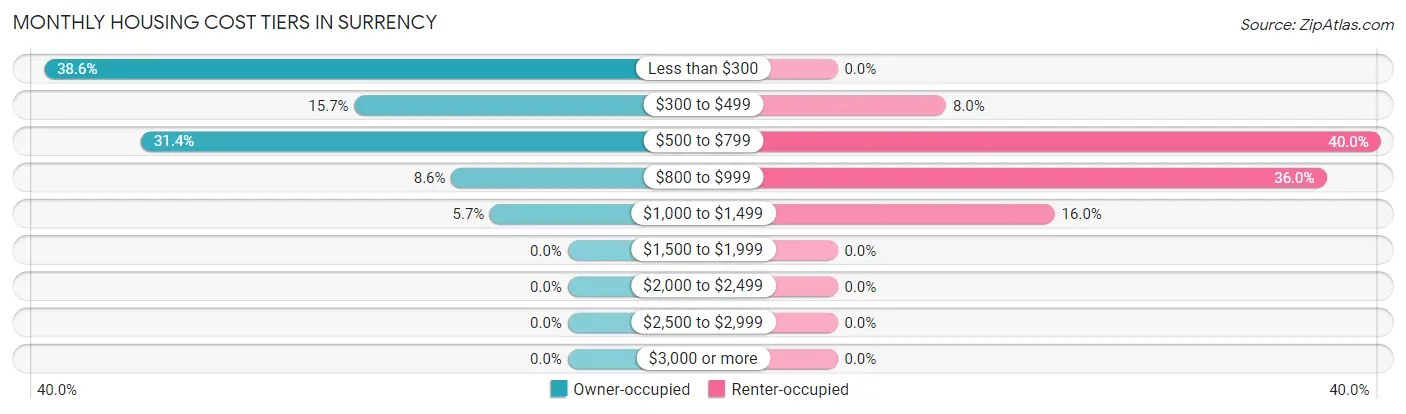
| Monthly Cost | Owner-occupied | Renter-occupied |
| Less than $300 | 27 (38.6%) | 0 (0.0%) |
| $300 to $499 | 11 (15.7%) | 2 (8.0%) |
| $500 to $799 | 22 (31.4%) | 10 (40.0%) |
| $800 to $999 | 6 (8.6%) | 9 (36.0%) |
| $1,000 to $1,499 | 4 (5.7%) | 4 (16.0%) |
| $1,500 to $1,999 | 0 (0.0%) | 0 (0.0%) |
| $2,000 to $2,499 | 0 (0.0%) | 0 (0.0%) |
| $2,500 to $2,999 | 0 (0.0%) | 0 (0.0%) |
| $3,000 or more | 0 (0.0%) | 0 (0.0%) |
| Total | 70 (100.0%) | 25 (100.0%) |
Physical Housing Characteristics in Surrency
Housing Structures in Surrency
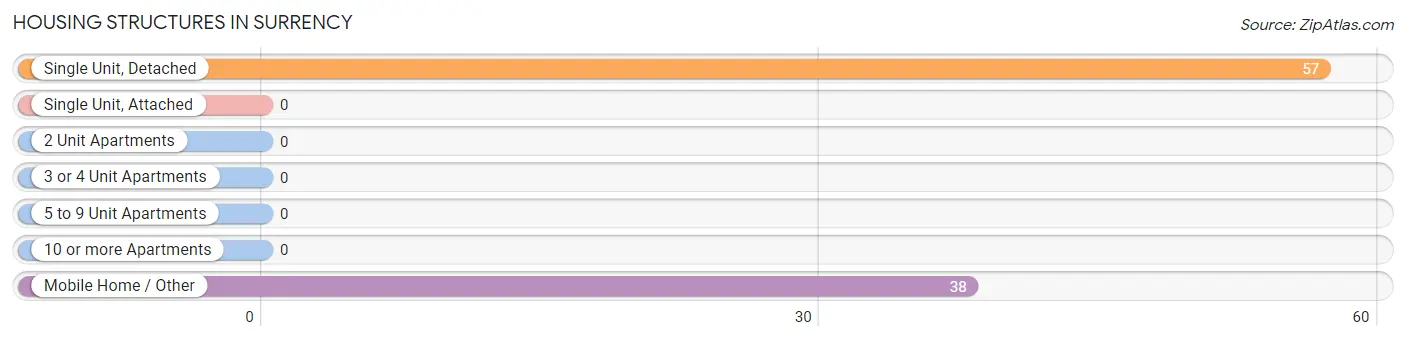
| Structure Type | # Housing Units | % Housing Units |
| Single Unit, Detached | 57 | 60.0% |
| Single Unit, Attached | 0 | 0.0% |
| 2 Unit Apartments | 0 | 0.0% |
| 3 or 4 Unit Apartments | 0 | 0.0% |
| 5 to 9 Unit Apartments | 0 | 0.0% |
| 10 or more Apartments | 0 | 0.0% |
| Mobile Home / Other | 38 | 40.0% |
| Total | 95 | 100.0% |
Housing Structures by Occupancy in Surrency
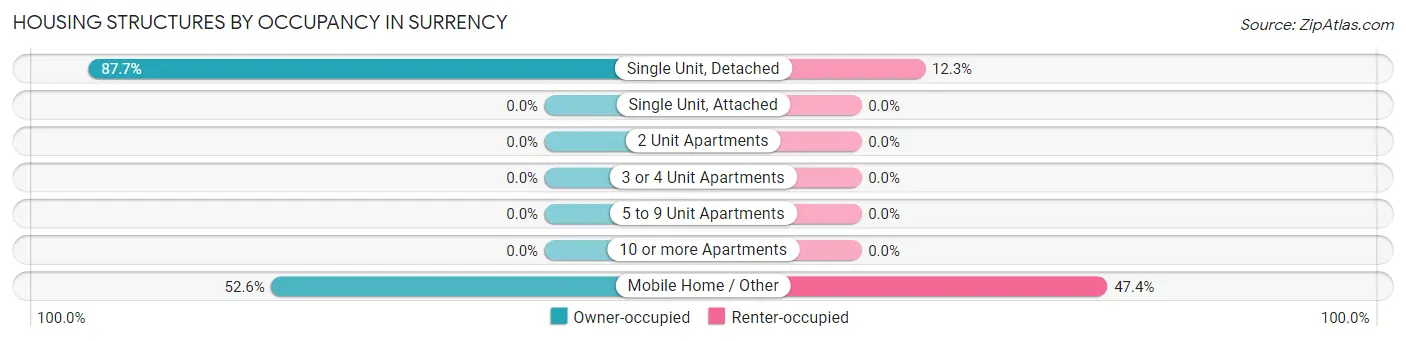
| Structure Type | Owner-occupied | Renter-occupied |
| Single Unit, Detached | 50 (87.7%) | 7 (12.3%) |
| Single Unit, Attached | 0 (0.0%) | 0 (0.0%) |
| 2 Unit Apartments | 0 (0.0%) | 0 (0.0%) |
| 3 or 4 Unit Apartments | 0 (0.0%) | 0 (0.0%) |
| 5 to 9 Unit Apartments | 0 (0.0%) | 0 (0.0%) |
| 10 or more Apartments | 0 (0.0%) | 0 (0.0%) |
| Mobile Home / Other | 20 (52.6%) | 18 (47.4%) |
| Total | 70 (73.7%) | 25 (26.3%) |
Housing Structures by Number of Rooms in Surrency
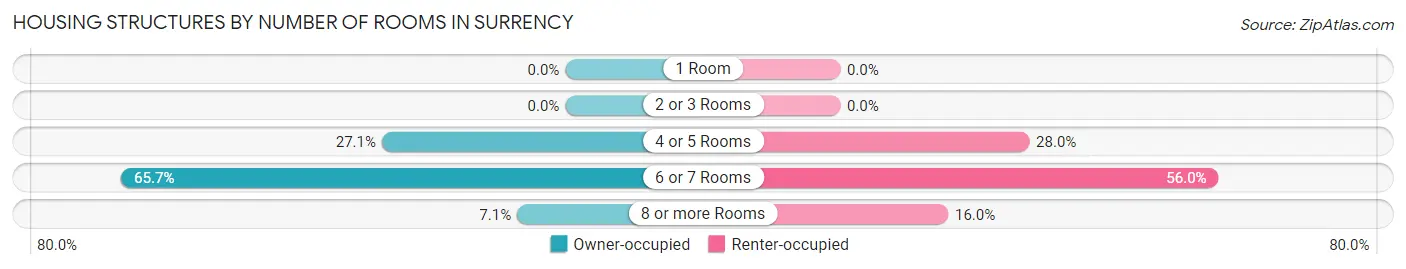
| Number of Rooms | Owner-occupied | Renter-occupied |
| 1 Room | 0 (0.0%) | 0 (0.0%) |
| 2 or 3 Rooms | 0 (0.0%) | 0 (0.0%) |
| 4 or 5 Rooms | 19 (27.1%) | 7 (28.0%) |
| 6 or 7 Rooms | 46 (65.7%) | 14 (56.0%) |
| 8 or more Rooms | 5 (7.1%) | 4 (16.0%) |
| Total | 70 (100.0%) | 25 (100.0%) |
Housing Structure by Heating Type in Surrency
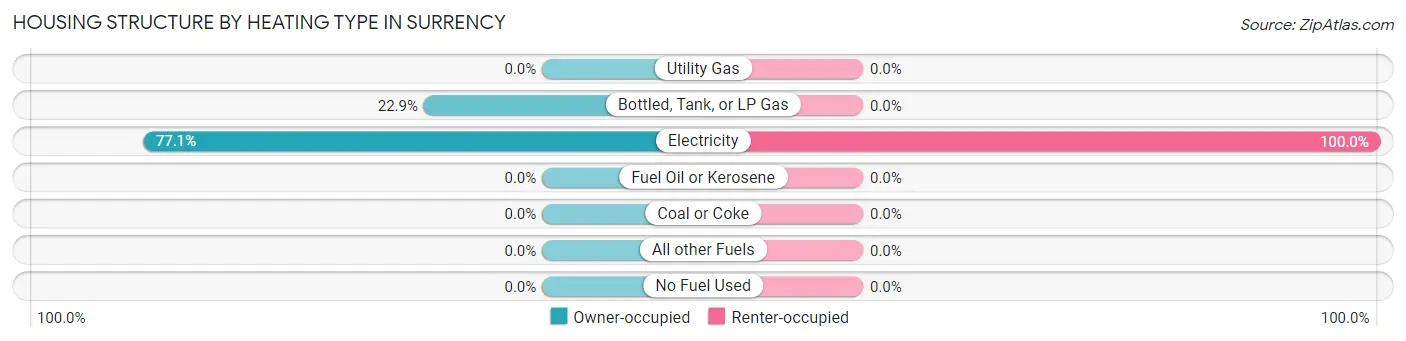
| Heating Type | Owner-occupied | Renter-occupied |
| Utility Gas | 0 (0.0%) | 0 (0.0%) |
| Bottled, Tank, or LP Gas | 16 (22.9%) | 0 (0.0%) |
| Electricity | 54 (77.1%) | 25 (100.0%) |
| Fuel Oil or Kerosene | 0 (0.0%) | 0 (0.0%) |
| Coal or Coke | 0 (0.0%) | 0 (0.0%) |
| All other Fuels | 0 (0.0%) | 0 (0.0%) |
| No Fuel Used | 0 (0.0%) | 0 (0.0%) |
| Total | 70 (100.0%) | 25 (100.0%) |
Household Vehicle Usage in Surrency
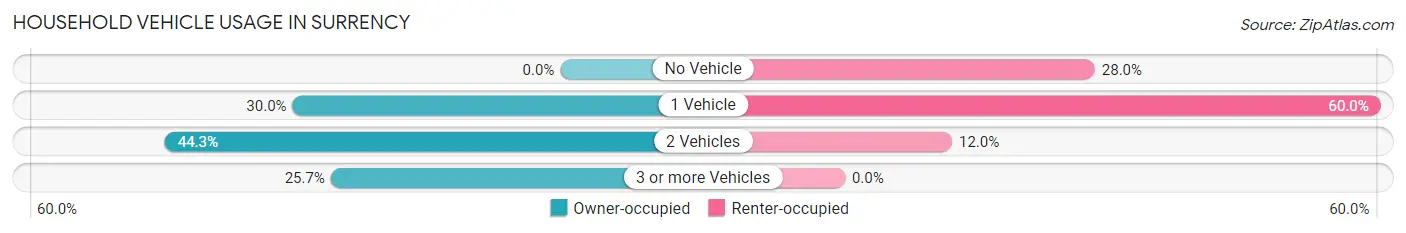
| Vehicles per Household | Owner-occupied | Renter-occupied |
| No Vehicle | 0 (0.0%) | 7 (28.0%) |
| 1 Vehicle | 21 (30.0%) | 15 (60.0%) |
| 2 Vehicles | 31 (44.3%) | 3 (12.0%) |
| 3 or more Vehicles | 18 (25.7%) | 0 (0.0%) |
| Total | 70 (100.0%) | 25 (100.0%) |
Real Estate & Mortgages in Surrency
Real Estate and Mortgage Overview in Surrency
| Characteristic | Without Mortgage | With Mortgage |
| Housing Units | 56 | 14 |
| Median Property Value | $78,600 | $55,000 |
| Median Household Income | $36,250 | $0 |
| Monthly Housing Costs | $350 | $0 |
| Real Estate Taxes | $567 | $0 |
Property Value by Mortgage Status in Surrency
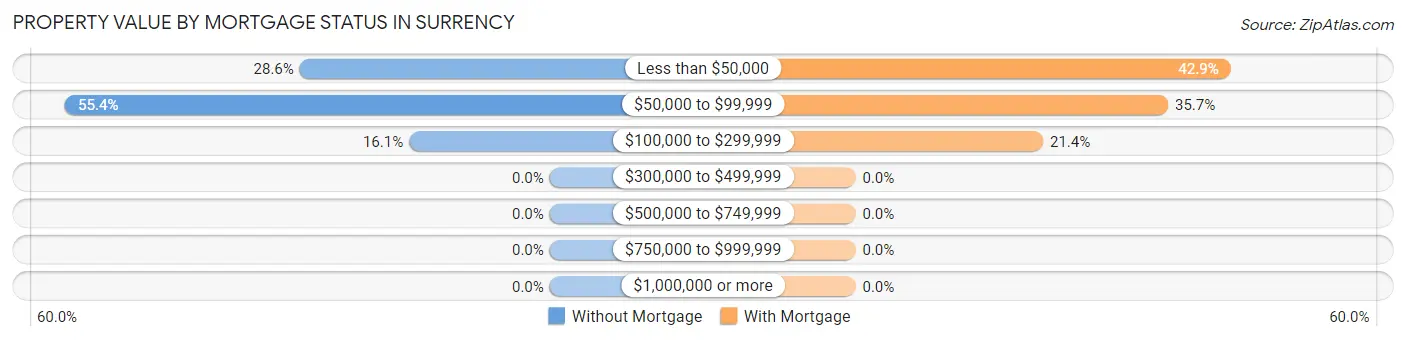
| Property Value | Without Mortgage | With Mortgage |
| Less than $50,000 | 16 (28.6%) | 6 (42.9%) |
| $50,000 to $99,999 | 31 (55.4%) | 5 (35.7%) |
| $100,000 to $299,999 | 9 (16.1%) | 3 (21.4%) |
| $300,000 to $499,999 | 0 (0.0%) | 0 (0.0%) |
| $500,000 to $749,999 | 0 (0.0%) | 0 (0.0%) |
| $750,000 to $999,999 | 0 (0.0%) | 0 (0.0%) |
| $1,000,000 or more | 0 (0.0%) | 0 (0.0%) |
| Total | 56 (100.0%) | 14 (100.0%) |
Household Income by Mortgage Status in Surrency
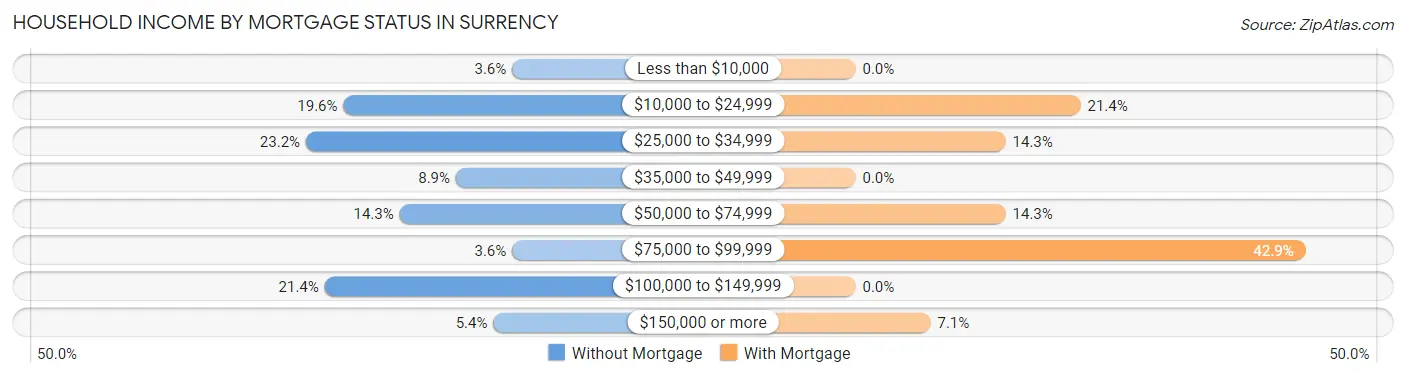
| Household Income | Without Mortgage | With Mortgage |
| Less than $10,000 | 2 (3.6%) | 0 (0.0%) |
| $10,000 to $24,999 | 11 (19.6%) | 3 (21.4%) |
| $25,000 to $34,999 | 13 (23.2%) | 2 (14.3%) |
| $35,000 to $49,999 | 5 (8.9%) | 0 (0.0%) |
| $50,000 to $74,999 | 8 (14.3%) | 2 (14.3%) |
| $75,000 to $99,999 | 2 (3.6%) | 6 (42.9%) |
| $100,000 to $149,999 | 12 (21.4%) | 0 (0.0%) |
| $150,000 or more | 3 (5.4%) | 1 (7.1%) |
| Total | 56 (100.0%) | 14 (100.0%) |
Property Value to Household Income Ratio in Surrency
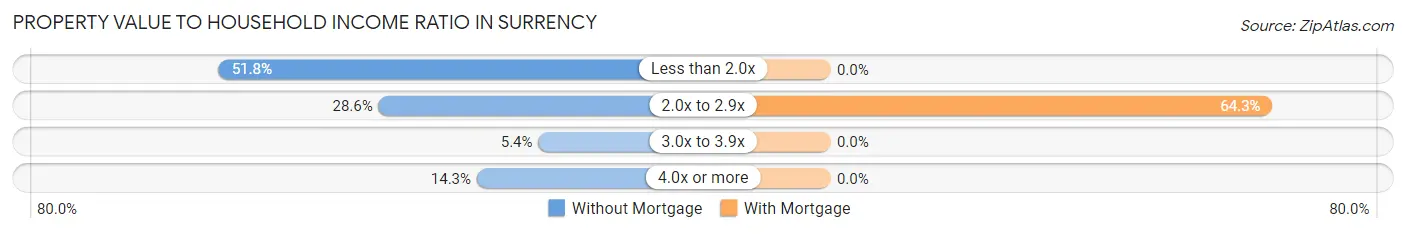
| Value-to-Income Ratio | Without Mortgage | With Mortgage |
| Less than 2.0x | 29 (51.8%) | 0 (0.0%) |
| 2.0x to 2.9x | 16 (28.6%) | 9 (64.3%) |
| 3.0x to 3.9x | 3 (5.4%) | 0 (0.0%) |
| 4.0x or more | 8 (14.3%) | 0 (0.0%) |
| Total | 56 (100.0%) | 14 (100.0%) |
Real Estate Taxes by Mortgage Status in Surrency
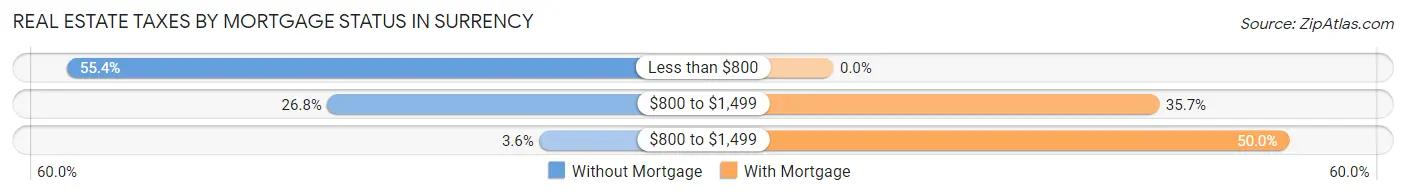
| Property Taxes | Without Mortgage | With Mortgage |
| Less than $800 | 31 (55.4%) | 0 (0.0%) |
| $800 to $1,499 | 15 (26.8%) | 5 (35.7%) |
| $800 to $1,499 | 2 (3.6%) | 7 (50.0%) |
| Total | 56 (100.0%) | 14 (100.0%) |
Health & Disability in Surrency
Health Insurance Coverage by Age in Surrency
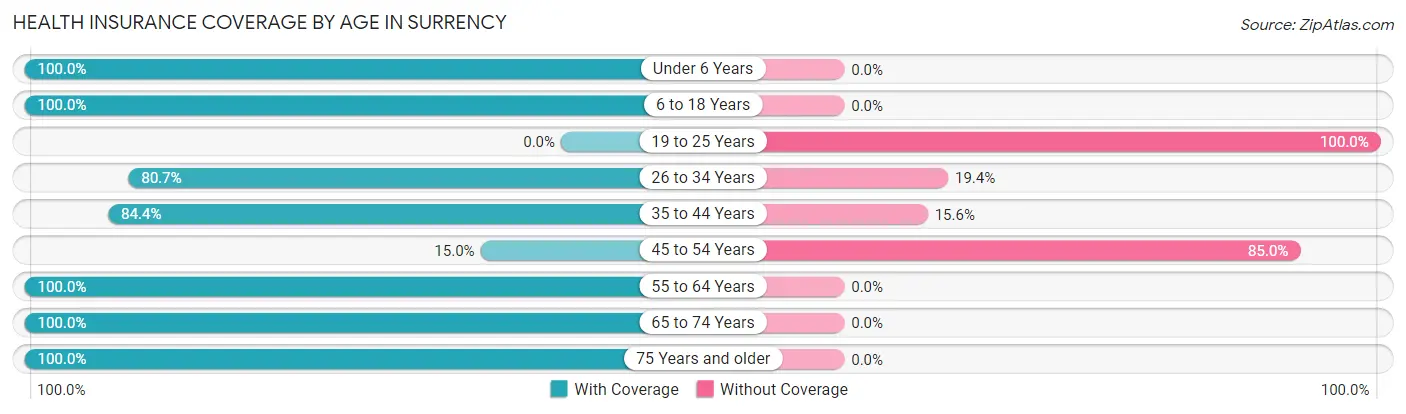
| Age Bracket | With Coverage | Without Coverage |
| Under 6 Years | 17 (100.0%) | 0 (0.0%) |
| 6 to 18 Years | 70 (100.0%) | 0 (0.0%) |
| 19 to 25 Years | 0 (0.0%) | 20 (100.0%) |
| 26 to 34 Years | 25 (80.6%) | 6 (19.4%) |
| 35 to 44 Years | 38 (84.4%) | 7 (15.6%) |
| 45 to 54 Years | 3 (15.0%) | 17 (85.0%) |
| 55 to 64 Years | 15 (100.0%) | 0 (0.0%) |
| 65 to 74 Years | 29 (100.0%) | 0 (0.0%) |
| 75 Years and older | 34 (100.0%) | 0 (0.0%) |
| Total | 231 (82.2%) | 50 (17.8%) |
Health Insurance Coverage by Citizenship Status in Surrency
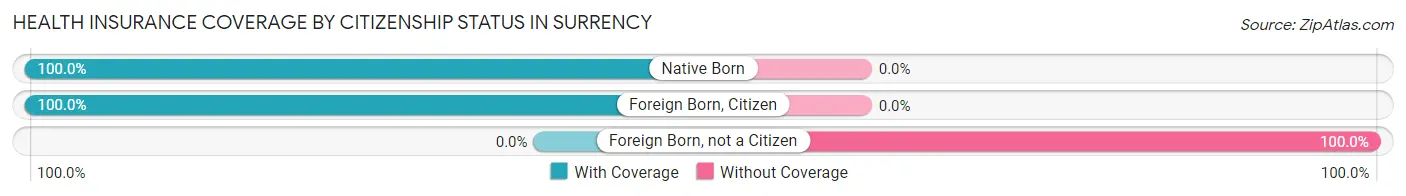
| Citizenship Status | With Coverage | Without Coverage |
| Native Born | 17 (100.0%) | 0 (0.0%) |
| Foreign Born, Citizen | 70 (100.0%) | 0 (0.0%) |
| Foreign Born, not a Citizen | 0 (0.0%) | 20 (100.0%) |
Health Insurance Coverage by Household Income in Surrency
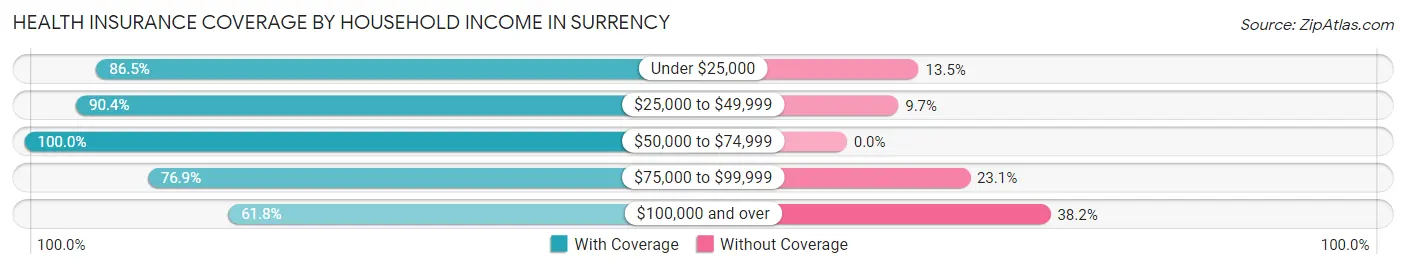
| Household Income | With Coverage | Without Coverage |
| Under $25,000 | 45 (86.5%) | 7 (13.5%) |
| $25,000 to $49,999 | 103 (90.3%) | 11 (9.7%) |
| $50,000 to $74,999 | 26 (100.0%) | 0 (0.0%) |
| $75,000 to $99,999 | 10 (76.9%) | 3 (23.1%) |
| $100,000 and over | 47 (61.8%) | 29 (38.2%) |
Public vs Private Health Insurance Coverage by Age in Surrency
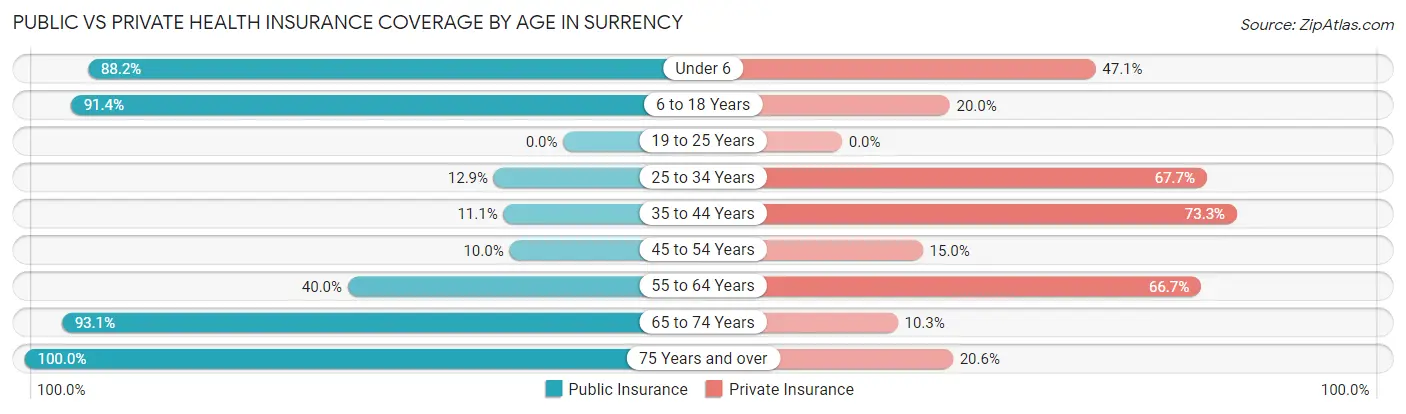
| Age Bracket | Public Insurance | Private Insurance |
| Under 6 | 15 (88.2%) | 8 (47.1%) |
| 6 to 18 Years | 64 (91.4%) | 14 (20.0%) |
| 19 to 25 Years | 0 (0.0%) | 0 (0.0%) |
| 25 to 34 Years | 4 (12.9%) | 21 (67.7%) |
| 35 to 44 Years | 5 (11.1%) | 33 (73.3%) |
| 45 to 54 Years | 2 (10.0%) | 3 (15.0%) |
| 55 to 64 Years | 6 (40.0%) | 10 (66.7%) |
| 65 to 74 Years | 27 (93.1%) | 3 (10.3%) |
| 75 Years and over | 34 (100.0%) | 7 (20.6%) |
| Total | 157 (55.9%) | 99 (35.2%) |
Disability Status by Sex by Age in Surrency
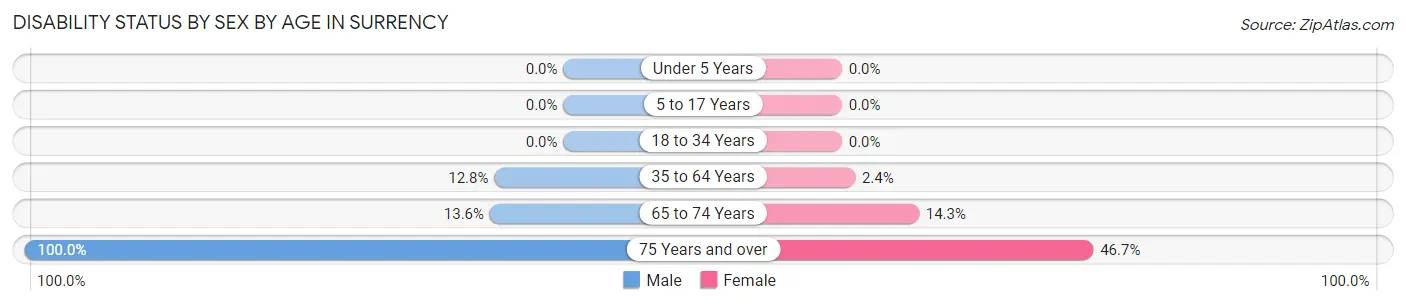
| Age Bracket | Male | Female |
| Under 5 Years | 0 (0.0%) | 0 (0.0%) |
| 5 to 17 Years | 0 (0.0%) | 0 (0.0%) |
| 18 to 34 Years | 0 (0.0%) | 0 (0.0%) |
| 35 to 64 Years | 5 (12.8%) | 1 (2.4%) |
| 65 to 74 Years | 3 (13.6%) | 1 (14.3%) |
| 75 Years and over | 4 (100.0%) | 14 (46.7%) |
Disability Class by Sex by Age in Surrency
Disability Class: Hearing Difficulty
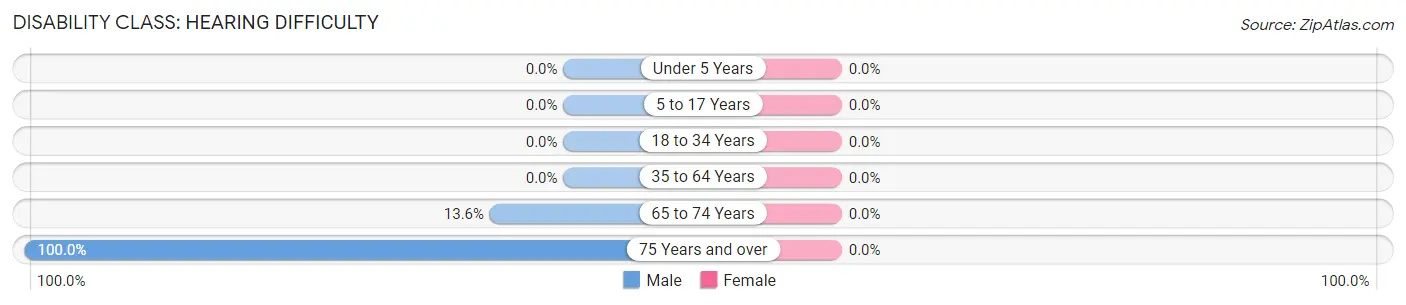
| Age Bracket | Male | Female |
| Under 5 Years | 0 (0.0%) | 0 (0.0%) |
| 5 to 17 Years | 0 (0.0%) | 0 (0.0%) |
| 18 to 34 Years | 0 (0.0%) | 0 (0.0%) |
| 35 to 64 Years | 0 (0.0%) | 0 (0.0%) |
| 65 to 74 Years | 3 (13.6%) | 0 (0.0%) |
| 75 Years and over | 4 (100.0%) | 0 (0.0%) |
Disability Class: Vision Difficulty
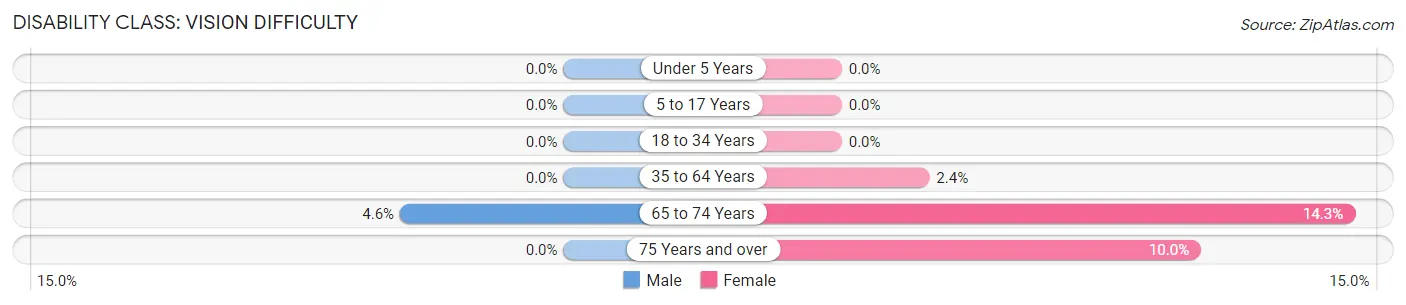
| Age Bracket | Male | Female |
| Under 5 Years | 0 (0.0%) | 0 (0.0%) |
| 5 to 17 Years | 0 (0.0%) | 0 (0.0%) |
| 18 to 34 Years | 0 (0.0%) | 0 (0.0%) |
| 35 to 64 Years | 0 (0.0%) | 1 (2.4%) |
| 65 to 74 Years | 1 (4.5%) | 1 (14.3%) |
| 75 Years and over | 0 (0.0%) | 3 (10.0%) |
Disability Class: Cognitive Difficulty
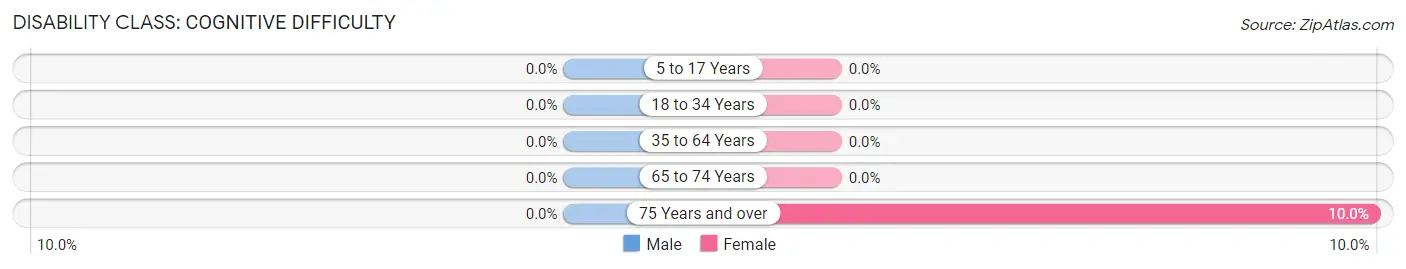
| Age Bracket | Male | Female |
| 5 to 17 Years | 0 (0.0%) | 0 (0.0%) |
| 18 to 34 Years | 0 (0.0%) | 0 (0.0%) |
| 35 to 64 Years | 0 (0.0%) | 0 (0.0%) |
| 65 to 74 Years | 0 (0.0%) | 0 (0.0%) |
| 75 Years and over | 0 (0.0%) | 3 (10.0%) |
Disability Class: Ambulatory Difficulty
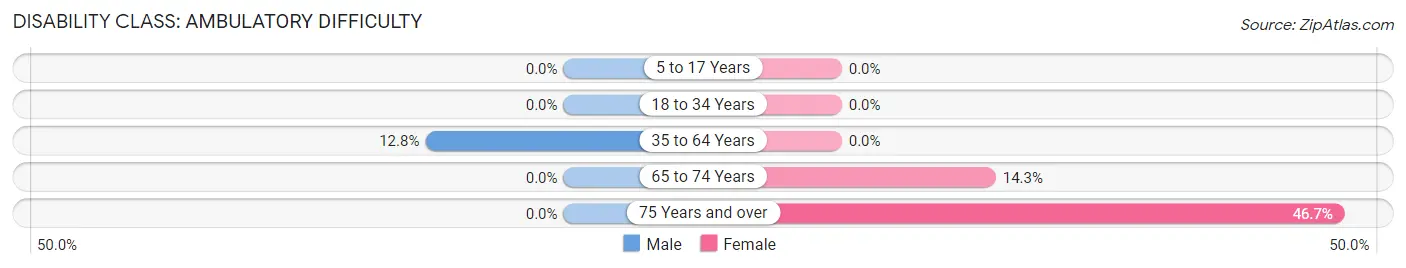
| Age Bracket | Male | Female |
| 5 to 17 Years | 0 (0.0%) | 0 (0.0%) |
| 18 to 34 Years | 0 (0.0%) | 0 (0.0%) |
| 35 to 64 Years | 5 (12.8%) | 0 (0.0%) |
| 65 to 74 Years | 0 (0.0%) | 1 (14.3%) |
| 75 Years and over | 0 (0.0%) | 14 (46.7%) |
Disability Class: Self-Care Difficulty
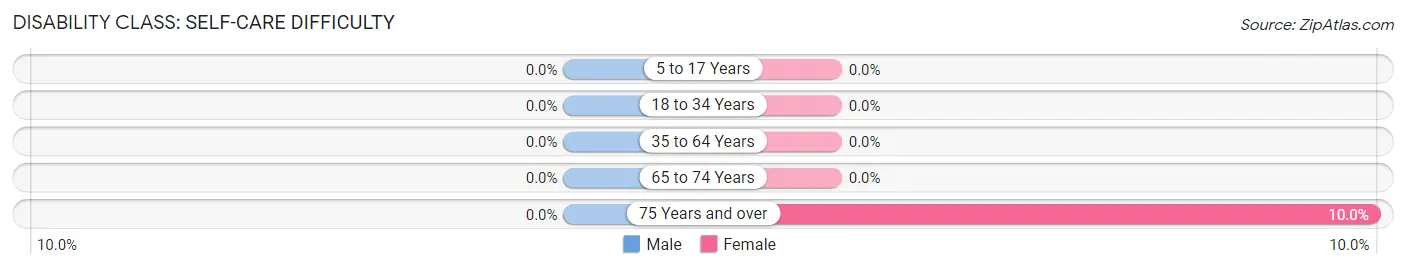
| Age Bracket | Male | Female |
| 5 to 17 Years | 0 (0.0%) | 0 (0.0%) |
| 18 to 34 Years | 0 (0.0%) | 0 (0.0%) |
| 35 to 64 Years | 0 (0.0%) | 0 (0.0%) |
| 65 to 74 Years | 0 (0.0%) | 0 (0.0%) |
| 75 Years and over | 0 (0.0%) | 3 (10.0%) |
Technology Access in Surrency
Computing Device Access in Surrency
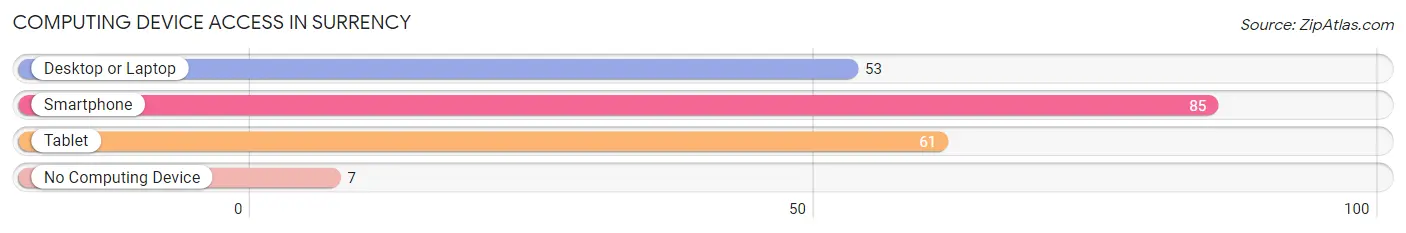
| Device Type | # Households | % Households |
| Desktop or Laptop | 53 | 55.8% |
| Smartphone | 85 | 89.5% |
| Tablet | 61 | 64.2% |
| No Computing Device | 7 | 7.4% |
| Total | 95 | 100.0% |
Internet Access in Surrency
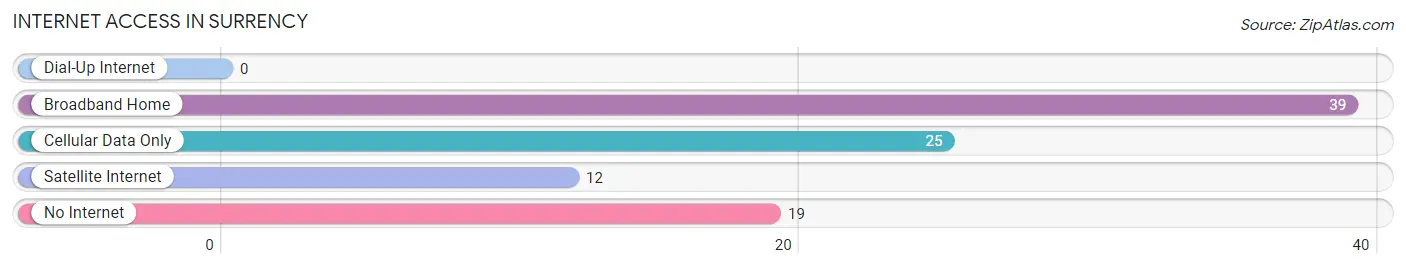
| Internet Type | # Households | % Households |
| Dial-Up Internet | 0 | 0.0% |
| Broadband Home | 39 | 41.0% |
| Cellular Data Only | 25 | 26.3% |
| Satellite Internet | 12 | 12.6% |
| No Internet | 19 | 20.0% |
| Total | 95 | 100.0% |
Surrency Summary
Surrency is a small unincorporated community located in Appling County, Georgia, United States. It is situated along the Altamaha River, approximately 10 miles south of Baxley and 25 miles north of Brunswick. The population of Surrency was estimated to be around 500 in 2020.
History
Surrency was founded in 1883 by William Surrency, a former Confederate soldier. He named the town after his family, who had been living in the area since the early 1800s. The town was originally a farming community, but it soon became a center for timber and turpentine production. In the early 1900s, the town was home to several sawmills, a gristmill, and a cotton gin.
In the 1920s, Surrency began to experience a period of growth and prosperity. The town was home to several stores, a bank, a post office, a hotel, and a movie theater. The town also had a school, which was attended by students from the surrounding area.
In the 1950s, Surrency began to decline as the timber and turpentine industries moved away. The town's population decreased and many of the businesses closed. In the 1970s, the town was revitalized when the Altamaha River was dammed to create the Altamaha River Wildlife Management Area. This brought new visitors to the area and helped to revive the local economy.
Geography
Surrency is located in Appling County, Georgia, approximately 10 miles south of Baxley and 25 miles north of Brunswick. The town is situated along the Altamaha River, which is part of the Altamaha River Wildlife Management Area. The area is mostly rural, with the majority of the land being used for farming and timber production.
Economy
Surrency's economy is largely based on agriculture and timber production. The town is home to several farms, which produce a variety of crops including corn, soybeans, and cotton. The timber industry is also an important part of the local economy, with several sawmills located in the area.
In addition to agriculture and timber production, Surrency is home to several small businesses. These include a grocery store, a hardware store, a gas station, and a few restaurants. The town also has a post office and a bank.
Demographics
As of the 2010 census, the population of Surrency was estimated to be around 500. The town is predominantly white, with a small African American population. The median household income is around $30,000, and the median home value is around $90,000. The town has a high rate of poverty, with nearly 30% of the population living below the poverty line.
Common Questions
What is Per Capita Income in Surrency?
Per Capita income in Surrency is $21,420.
What is the Median Family Income in Surrency?
Median Family Income in Surrency is $55,208.
What is the Median Household income in Surrency?
Median Household Income in Surrency is $32,250.
What is Inequality or Gini Index in Surrency?
Inequality or Gini Index in Surrency is 0.42.
What is the Total Population of Surrency?
Total Population of Surrency is 281.
What is the Total Male Population of Surrency?
Total Male Population of Surrency is 139.
What is the Total Female Population of Surrency?
Total Female Population of Surrency is 142.
What is the Ratio of Males per 100 Females in Surrency?
There are 97.89 Males per 100 Females in Surrency.
What is the Ratio of Females per 100 Males in Surrency?
There are 102.16 Females per 100 Males in Surrency.
What is the Median Population Age in Surrency?
Median Population Age in Surrency is 35.3 Years.
What is the Average Family Size in Surrency
Average Family Size in Surrency is 3.8 People.
What is the Average Household Size in Surrency
Average Household Size in Surrency is 3.0 People.
How Large is the Labor Force in Surrency?
There are 122 People in the Labor Forcein in Surrency.
What is the Percentage of People in the Labor Force in Surrency?
58.9% of People are in the Labor Force in Surrency.
What is the Unemployment Rate in Surrency?
Unemployment Rate in Surrency is 8.2%.