Screven, GA Map & Demographics
Screven Map
Screven Overview
$24,433
PER CAPITA INCOME
$58,958
AVG FAMILY INCOME
$44,643
AVG HOUSEHOLD INCOME
52.9%
WAGE / INCOME GAP [ % ]
47.1¢/ $1
WAGE / INCOME GAP [ $ ]
0.47
INEQUALITY / GINI INDEX
689
TOTAL POPULATION
368
MALE POPULATION
321
FEMALE POPULATION
114.64
MALES / 100 FEMALES
87.23
FEMALES / 100 MALES
34.5
MEDIAN AGE
3.2
AVG FAMILY SIZE
2.6
AVG HOUSEHOLD SIZE
297
LABOR FORCE [ PEOPLE ]
58.0%
PERCENT IN LABOR FORCE
3.4%
UNEMPLOYMENT RATE
Screven Zip Codes
Screven Area Codes
Income in Screven
Income Overview in Screven
Per Capita Income in Screven is $24,433, while median incomes of families and households are $58,958 and $44,643 respectively.
| Characteristic | Number | Measure |
| Per Capita Income | 689 | $24,433 |
| Median Family Income | 187 | $58,958 |
| Mean Family Income | 187 | $76,428 |
| Median Household Income | 262 | $44,643 |
| Mean Household Income | 262 | $65,073 |
| Income Deficit | 187 | $0 |
| Wage / Income Gap (%) | 689 | 52.86% |
| Wage / Income Gap ($) | 689 | 47.14¢ per $1 |
| Gini / Inequality Index | 689 | 0.47 |
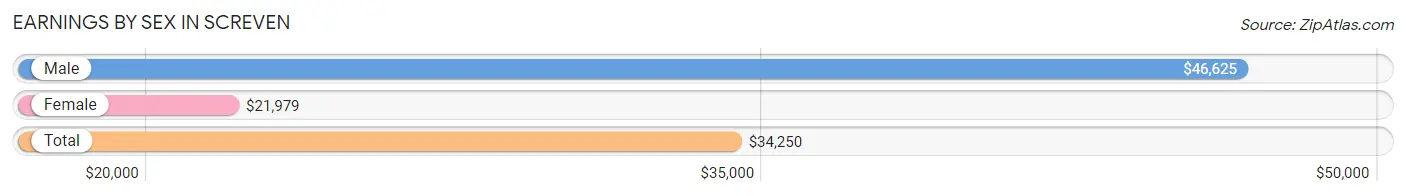
Earnings by Sex in Screven
Average Earnings in Screven are $34,250, $46,625 for men and $21,979 for women, a difference of 52.9%.
| Sex | Number | Average Earnings |
| Male | 165 (56.1%) | $46,625 |
| Female | 129 (43.9%) | $21,979 |
| Total | 294 (100.0%) | $34,250 |
Earnings by Sex by Income Bracket in Screven
The most common earnings brackets in Screven are $45,000 to $49,999 for men (28 | 17.0%) and $15,000 to $17,499 for women (25 | 19.4%).
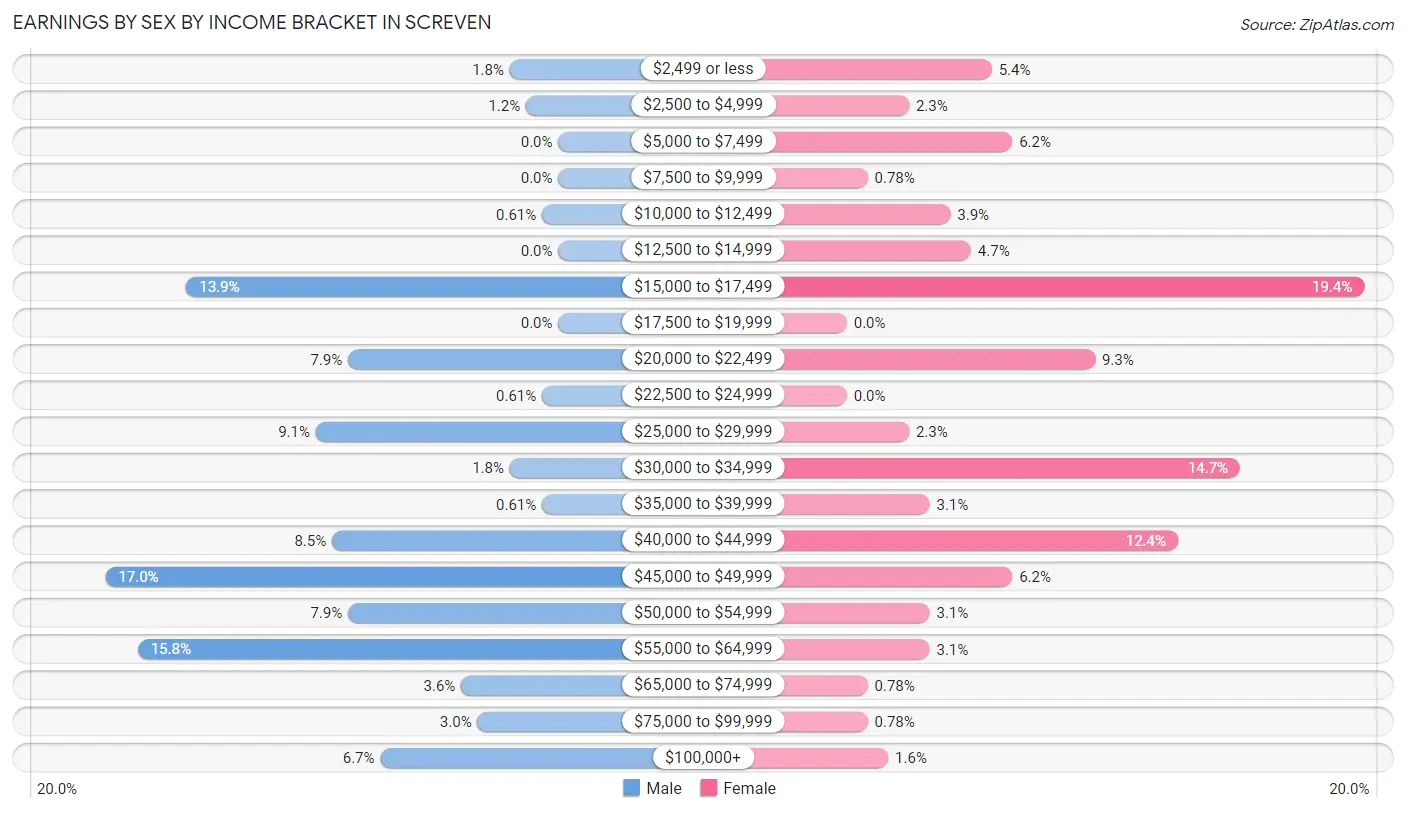
| Income | Male | Female |
| $2,499 or less | 3 (1.8%) | 7 (5.4%) |
| $2,500 to $4,999 | 2 (1.2%) | 3 (2.3%) |
| $5,000 to $7,499 | 0 (0.0%) | 8 (6.2%) |
| $7,500 to $9,999 | 0 (0.0%) | 1 (0.8%) |
| $10,000 to $12,499 | 1 (0.6%) | 5 (3.9%) |
| $12,500 to $14,999 | 0 (0.0%) | 6 (4.6%) |
| $15,000 to $17,499 | 23 (13.9%) | 25 (19.4%) |
| $17,500 to $19,999 | 0 (0.0%) | 0 (0.0%) |
| $20,000 to $22,499 | 13 (7.9%) | 12 (9.3%) |
| $22,500 to $24,999 | 1 (0.6%) | 0 (0.0%) |
| $25,000 to $29,999 | 15 (9.1%) | 3 (2.3%) |
| $30,000 to $34,999 | 3 (1.8%) | 19 (14.7%) |
| $35,000 to $39,999 | 1 (0.6%) | 4 (3.1%) |
| $40,000 to $44,999 | 14 (8.5%) | 16 (12.4%) |
| $45,000 to $49,999 | 28 (17.0%) | 8 (6.2%) |
| $50,000 to $54,999 | 13 (7.9%) | 4 (3.1%) |
| $55,000 to $64,999 | 26 (15.8%) | 4 (3.1%) |
| $65,000 to $74,999 | 6 (3.6%) | 1 (0.8%) |
| $75,000 to $99,999 | 5 (3.0%) | 1 (0.8%) |
| $100,000+ | 11 (6.7%) | 2 (1.5%) |
| Total | 165 (100.0%) | 129 (100.0%) |
Earnings by Sex by Educational Attainment in Screven
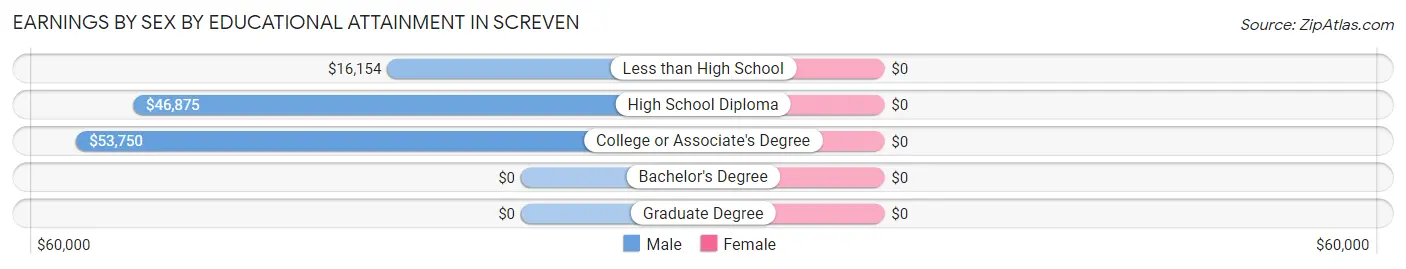
| Educational Attainment | Male Income | Female Income |
| Less than High School | $16,154 | $0 |
| High School Diploma | $46,875 | $0 |
| College or Associate's Degree | $53,750 | $0 |
| Bachelor's Degree | - | - |
| Graduate Degree | - | - |
| Total | $47,000 | $23,750 |
Family Income in Screven
Family Income Brackets in Screven
According to the Screven family income data, there are 42 families falling into the $50,000 to $74,999 income range, which is the most common income bracket and makes up 22.5% of all families. Conversely, the $10,000 to $14,999 income bracket is the least frequent group with only 2 families (1.1%) belonging to this category.
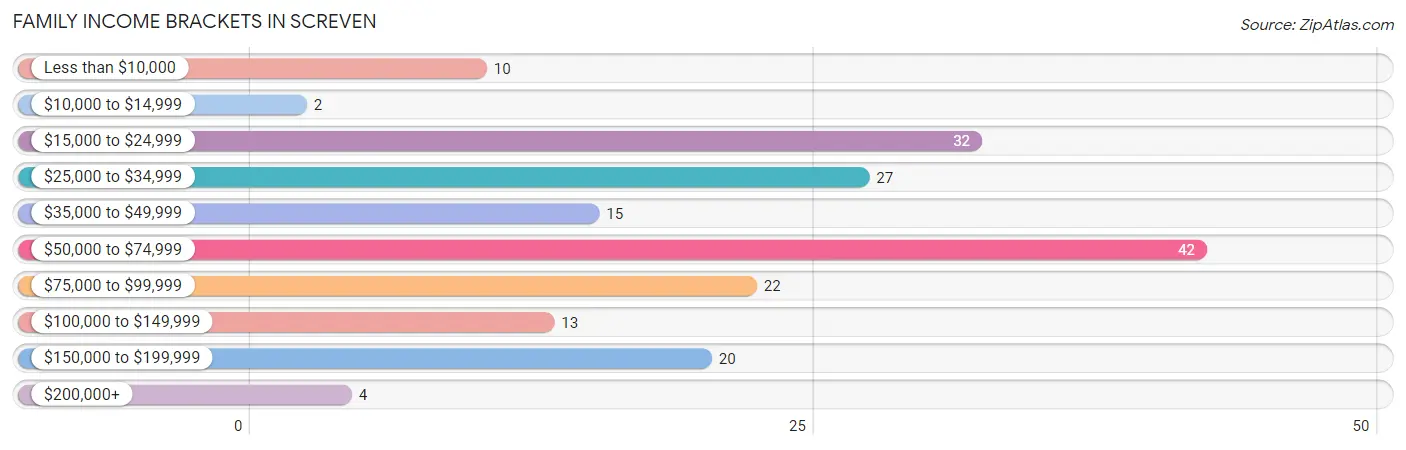
| Income Bracket | # Families | % Families |
| Less than $10,000 | 10 | 5.3% |
| $10,000 to $14,999 | 2 | 1.1% |
| $15,000 to $24,999 | 32 | 17.1% |
| $25,000 to $34,999 | 27 | 14.4% |
| $35,000 to $49,999 | 15 | 8.0% |
| $50,000 to $74,999 | 42 | 22.5% |
| $75,000 to $99,999 | 22 | 11.8% |
| $100,000 to $149,999 | 13 | 7.0% |
| $150,000 to $199,999 | 20 | 10.7% |
| $200,000+ | 4 | 2.1% |
Family Income by Famaliy Size in Screven
7+ person families (12 | 6.4%) account for the highest median family income in Screven with $73,750 per family, while 2-person families (82 | 43.9%) have the highest median income of $29,584 per family member.
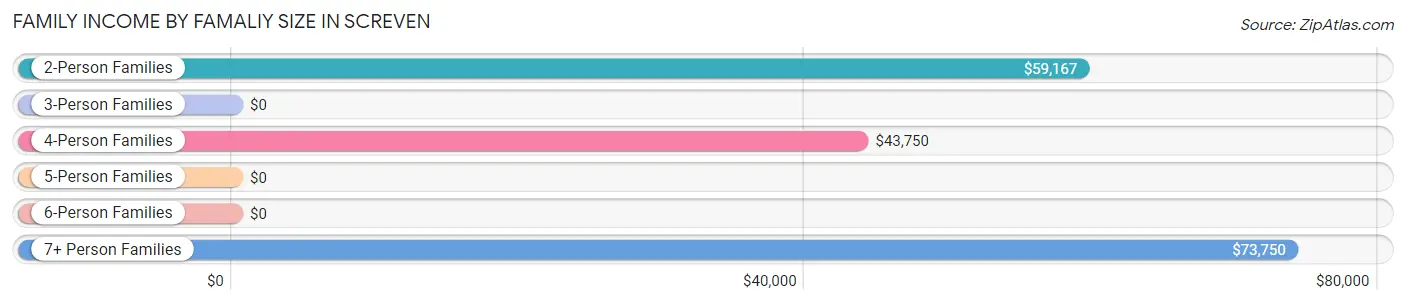
| Income Bracket | # Families | Median Income |
| 2-Person Families | 82 (43.9%) | $59,167 |
| 3-Person Families | 41 (21.9%) | $0 |
| 4-Person Families | 21 (11.2%) | $43,750 |
| 5-Person Families | 23 (12.3%) | $0 |
| 6-Person Families | 8 (4.3%) | $0 |
| 7+ Person Families | 12 (6.4%) | $73,750 |
| Total | 187 (100.0%) | $58,958 |
Family Income by Number of Earners in Screven
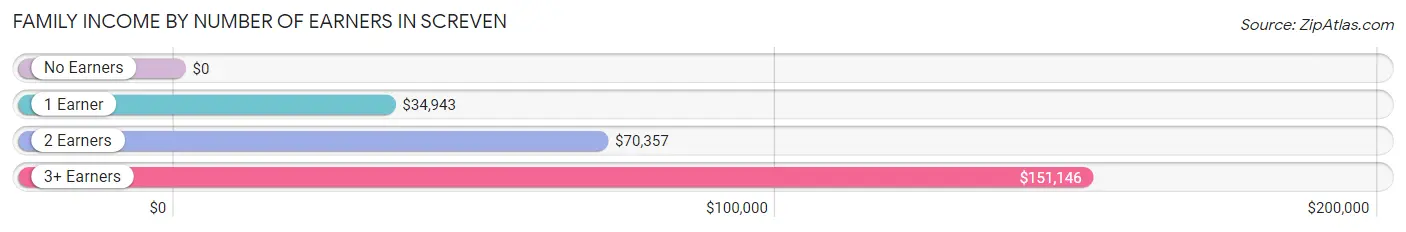
| Number of Earners | # Families | Median Income |
| No Earners | 37 (19.8%) | $0 |
| 1 Earner | 73 (39.0%) | $34,943 |
| 2 Earners | 60 (32.1%) | $70,357 |
| 3+ Earners | 17 (9.1%) | $151,146 |
| Total | 187 (100.0%) | $58,958 |
Household Income in Screven
Household Income Brackets in Screven
With 52 households falling in the category, the $50,000 to $74,999 income range is the most frequent in Screven, accounting for 19.9% of all households. In contrast, only 4 households (1.5%) fall into the $200,000+ income bracket, making it the least populous group.
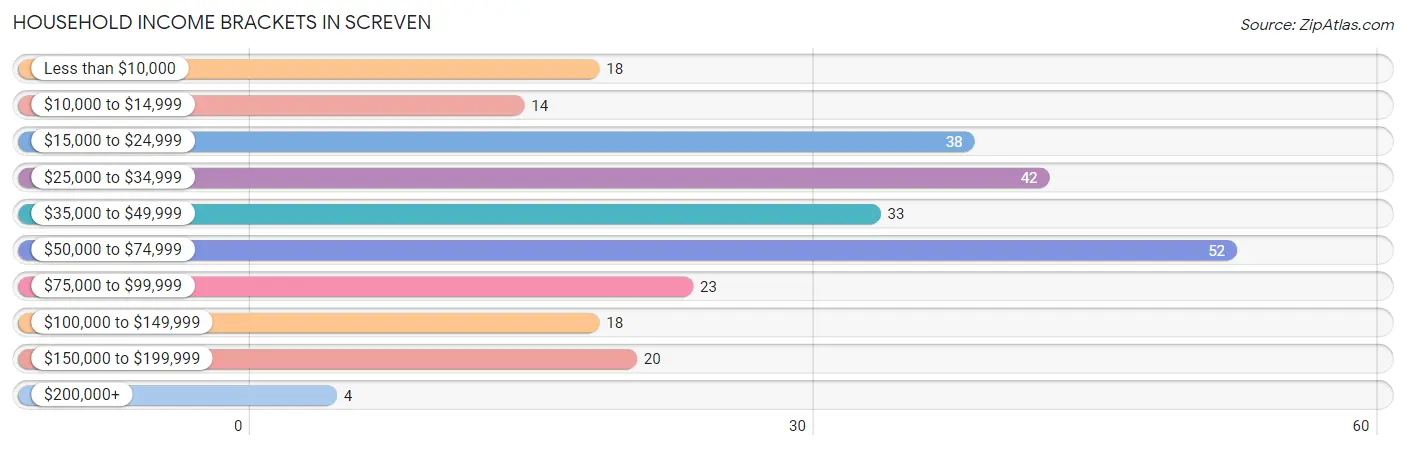
| Income Bracket | # Households | % Households |
| Less than $10,000 | 18 | 6.9% |
| $10,000 to $14,999 | 14 | 5.3% |
| $15,000 to $24,999 | 38 | 14.5% |
| $25,000 to $34,999 | 42 | 16.0% |
| $35,000 to $49,999 | 33 | 12.6% |
| $50,000 to $74,999 | 52 | 19.8% |
| $75,000 to $99,999 | 23 | 8.8% |
| $100,000 to $149,999 | 18 | 6.9% |
| $150,000 to $199,999 | 20 | 7.6% |
| $200,000+ | 4 | 1.5% |
Household Income by Householder Age in Screven
The median household income in Screven is $44,643, with the highest median household income of $73,000 found in the 45 to 64 years age bracket for the primary householder. A total of 108 households (41.2%) fall into this category. Meanwhile, the 15 to 24 years age bracket for the primary householder has the lowest median household income of $0, with 4 households (1.5%) in this group.
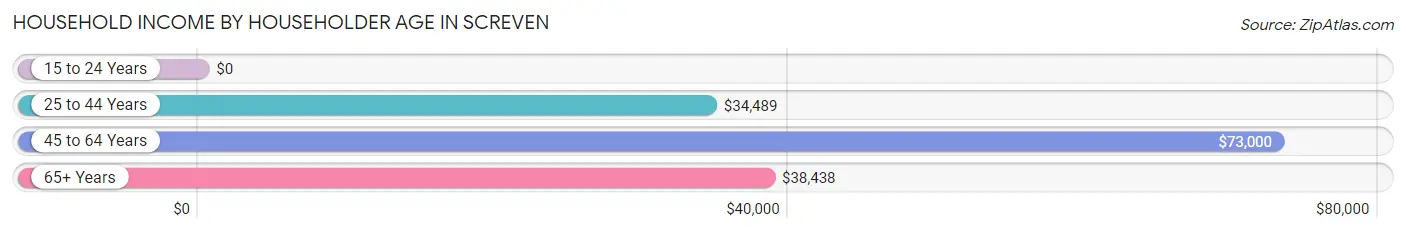
| Income Bracket | # Households | Median Income |
| 15 to 24 Years | 4 (1.5%) | $0 |
| 25 to 44 Years | 101 (38.6%) | $34,489 |
| 45 to 64 Years | 108 (41.2%) | $73,000 |
| 65+ Years | 49 (18.7%) | $38,438 |
| Total | 262 (100.0%) | $44,643 |
Poverty in Screven
Income Below Poverty by Sex and Age in Screven
With 23.9% poverty level for males and 32.1% for females among the residents of Screven, 15 year old males and 12 to 14 year old females are the most vulnerable to poverty, with 22 males (95.7%) and 21 females (80.8%) in their respective age groups living below the poverty level.
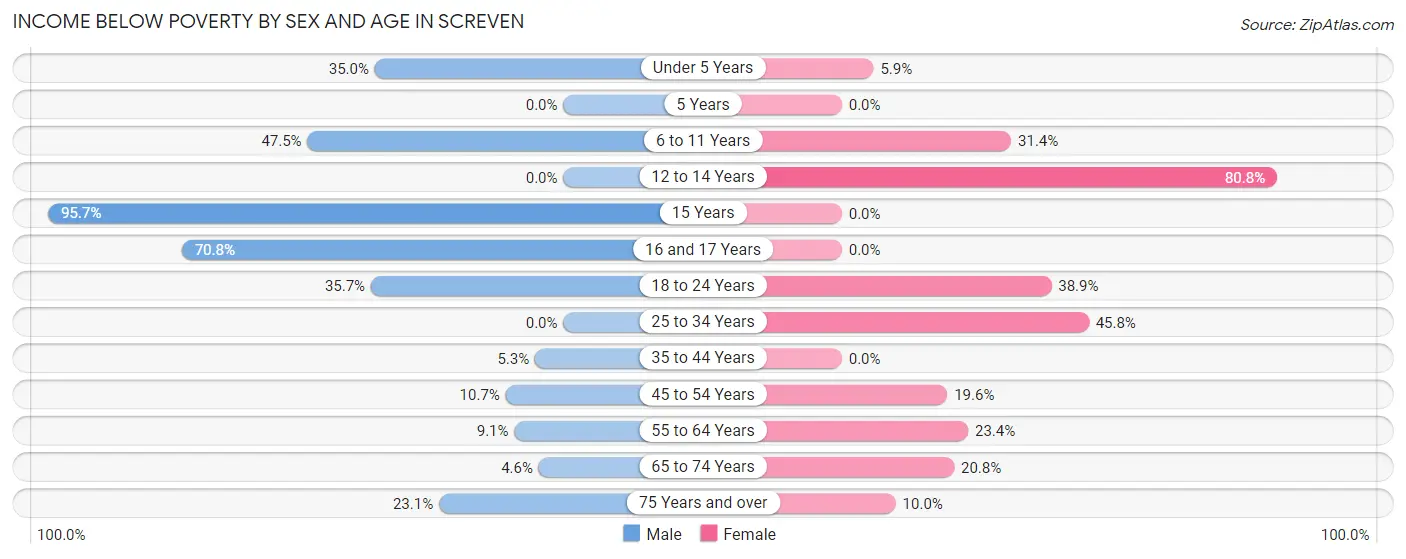
| Age Bracket | Male | Female |
| Under 5 Years | 7 (35.0%) | 1 (5.9%) |
| 5 Years | 0 (0.0%) | 0 (0.0%) |
| 6 to 11 Years | 19 (47.5%) | 11 (31.4%) |
| 12 to 14 Years | 0 (0.0%) | 21 (80.8%) |
| 15 Years | 22 (95.7%) | 0 (0.0%) |
| 16 and 17 Years | 17 (70.8%) | 0 (0.0%) |
| 18 to 24 Years | 5 (35.7%) | 7 (38.9%) |
| 25 to 34 Years | 0 (0.0%) | 33 (45.8%) |
| 35 to 44 Years | 2 (5.3%) | 0 (0.0%) |
| 45 to 54 Years | 6 (10.7%) | 9 (19.6%) |
| 55 to 64 Years | 3 (9.1%) | 15 (23.4%) |
| 65 to 74 Years | 1 (4.5%) | 5 (20.8%) |
| 75 Years and over | 6 (23.1%) | 1 (10.0%) |
| Total | 88 (23.9%) | 103 (32.1%) |
Income Above Poverty by Sex and Age in Screven
According to the poverty statistics in Screven, males aged 5 years and females aged 5 years are the age groups that are most secure financially, with 100.0% of males and 100.0% of females in these age groups living above the poverty line.
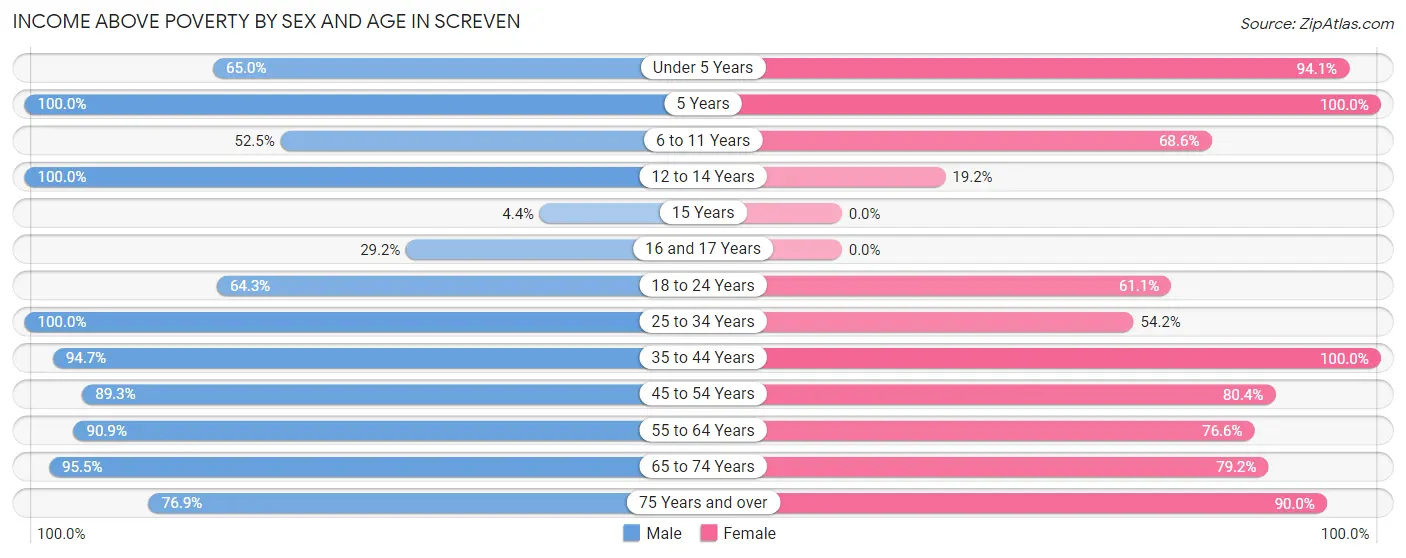
| Age Bracket | Male | Female |
| Under 5 Years | 13 (65.0%) | 16 (94.1%) |
| 5 Years | 3 (100.0%) | 2 (100.0%) |
| 6 to 11 Years | 21 (52.5%) | 24 (68.6%) |
| 12 to 14 Years | 11 (100.0%) | 5 (19.2%) |
| 15 Years | 1 (4.3%) | 0 (0.0%) |
| 16 and 17 Years | 7 (29.2%) | 0 (0.0%) |
| 18 to 24 Years | 9 (64.3%) | 11 (61.1%) |
| 25 to 34 Years | 58 (100.0%) | 39 (54.2%) |
| 35 to 44 Years | 36 (94.7%) | 7 (100.0%) |
| 45 to 54 Years | 50 (89.3%) | 37 (80.4%) |
| 55 to 64 Years | 30 (90.9%) | 49 (76.6%) |
| 65 to 74 Years | 21 (95.5%) | 19 (79.2%) |
| 75 Years and over | 20 (76.9%) | 9 (90.0%) |
| Total | 280 (76.1%) | 218 (67.9%) |
Income Below Poverty Among Married-Couple Families in Screven
The poverty statistics for married-couple families in Screven show that 4.1% or 5 of the total 123 families live below the poverty line. Families with no children have the highest poverty rate of 5.9%, comprising of 5 families. On the other hand, families with 1 or 2 children have the lowest poverty rate of 0.0%, which includes 0 families.
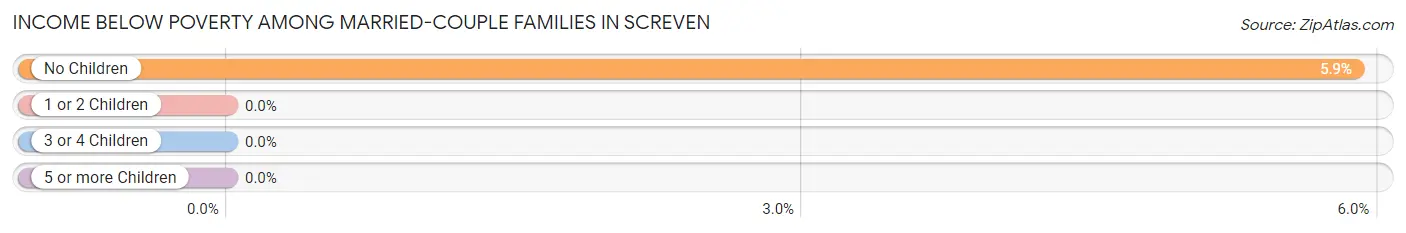
| Children | Above Poverty | Below Poverty |
| No Children | 80 (94.1%) | 5 (5.9%) |
| 1 or 2 Children | 19 (100.0%) | 0 (0.0%) |
| 3 or 4 Children | 17 (100.0%) | 0 (0.0%) |
| 5 or more Children | 2 (100.0%) | 0 (0.0%) |
| Total | 118 (95.9%) | 5 (4.1%) |
Income Below Poverty Among Single-Parent Households in Screven
According to the poverty data in Screven, 37.5% or 6 single-father households and 62.5% or 30 single-mother households are living below the poverty line. Among single-father households, those with no children have the highest poverty rate, with 6 households (100.0%) experiencing poverty. Likewise, among single-mother households, those with 3 or 4 children have the highest poverty rate, with 23 households (100.0%) falling below the poverty line.
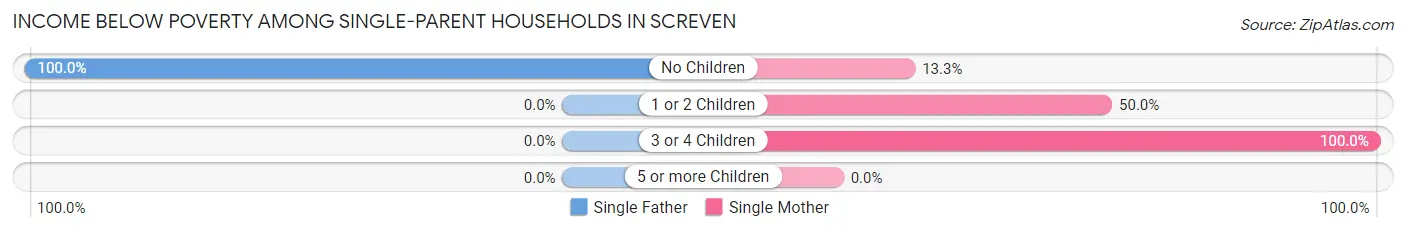
| Children | Single Father | Single Mother |
| No Children | 6 (100.0%) | 2 (13.3%) |
| 1 or 2 Children | 0 (0.0%) | 5 (50.0%) |
| 3 or 4 Children | 0 (0.0%) | 23 (100.0%) |
| 5 or more Children | 0 (0.0%) | 0 (0.0%) |
| Total | 6 (37.5%) | 30 (62.5%) |
Income Below Poverty Among Married-Couple vs Single-Parent Households in Screven
The poverty data for Screven shows that 5 of the married-couple family households (4.1%) and 36 of the single-parent households (56.2%) are living below the poverty level. Within the married-couple family households, those with no children have the highest poverty rate, with 5 households (5.9%) falling below the poverty line. Among the single-parent households, those with 3 or 4 children have the highest poverty rate, with 23 household (100.0%) living below poverty.
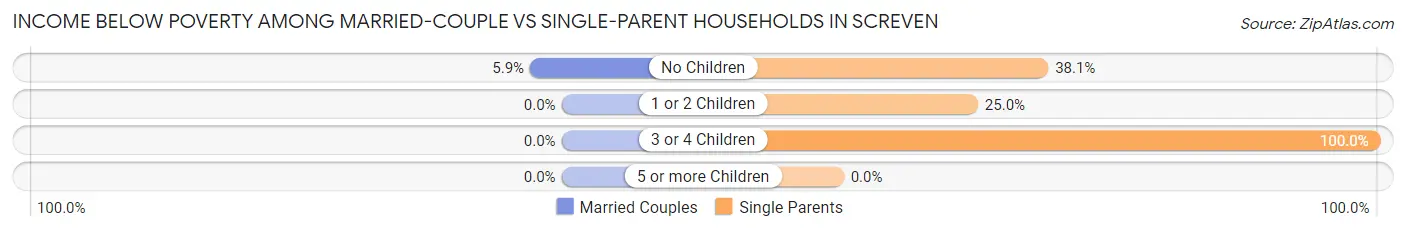
| Children | Married-Couple Families | Single-Parent Households |
| No Children | 5 (5.9%) | 8 (38.1%) |
| 1 or 2 Children | 0 (0.0%) | 5 (25.0%) |
| 3 or 4 Children | 0 (0.0%) | 23 (100.0%) |
| 5 or more Children | 0 (0.0%) | 0 (0.0%) |
| Total | 5 (4.1%) | 36 (56.2%) |
Race in Screven
The most populous races in Screven are White / Caucasian (509 | 73.9%), Black / African American (160 | 23.2%), and Hispanic or Latino (13 | 1.9%).
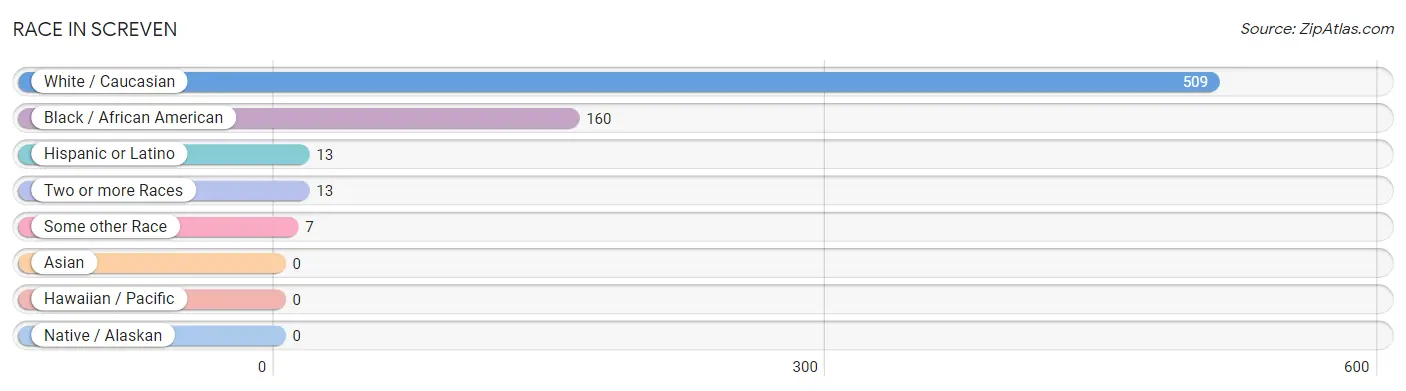
| Race | # Population | % Population |
| Asian | 0 | 0.0% |
| Black / African American | 160 | 23.2% |
| Hawaiian / Pacific | 0 | 0.0% |
| Hispanic or Latino | 13 | 1.9% |
| Native / Alaskan | 0 | 0.0% |
| White / Caucasian | 509 | 73.9% |
| Two or more Races | 13 | 1.9% |
| Some other Race | 7 | 1.0% |
| Total | 689 | 100.0% |
Ancestry in Screven
The most populous ancestries reported in Screven are American (33 | 4.8%), German (31 | 4.5%), European (18 | 2.6%), Irish (18 | 2.6%), and English (14 | 2.0%), together accounting for 16.5% of all Screven residents.
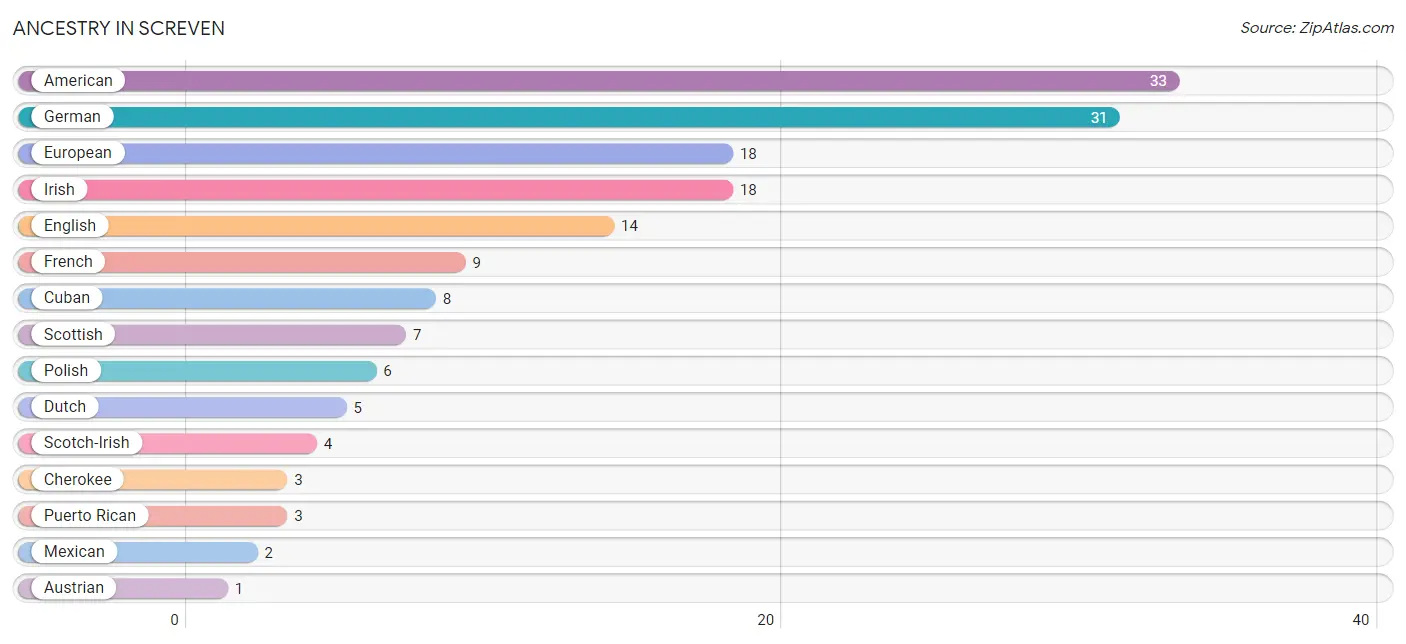
| Ancestry | # Population | % Population |
| American | 33 | 4.8% |
| Austrian | 1 | 0.2% |
| Cherokee | 3 | 0.4% |
| Cuban | 8 | 1.2% |
| Dutch | 5 | 0.7% |
| English | 14 | 2.0% |
| European | 18 | 2.6% |
| French | 9 | 1.3% |
| German | 31 | 4.5% |
| Irish | 18 | 2.6% |
| Mexican | 2 | 0.3% |
| Polish | 6 | 0.9% |
| Puerto Rican | 3 | 0.4% |
| Scotch-Irish | 4 | 0.6% |
| Scottish | 7 | 1.0% | View All 15 Rows |
Immigrants in Screven

| Immigration Origin | # Population | % Population | View All 0 Rows |
Sex and Age in Screven
Sex and Age in Screven
The most populous age groups in Screven are 15 to 19 Years (48 | 13.0%) for men and 30 to 34 Years (44 | 13.7%) for women.
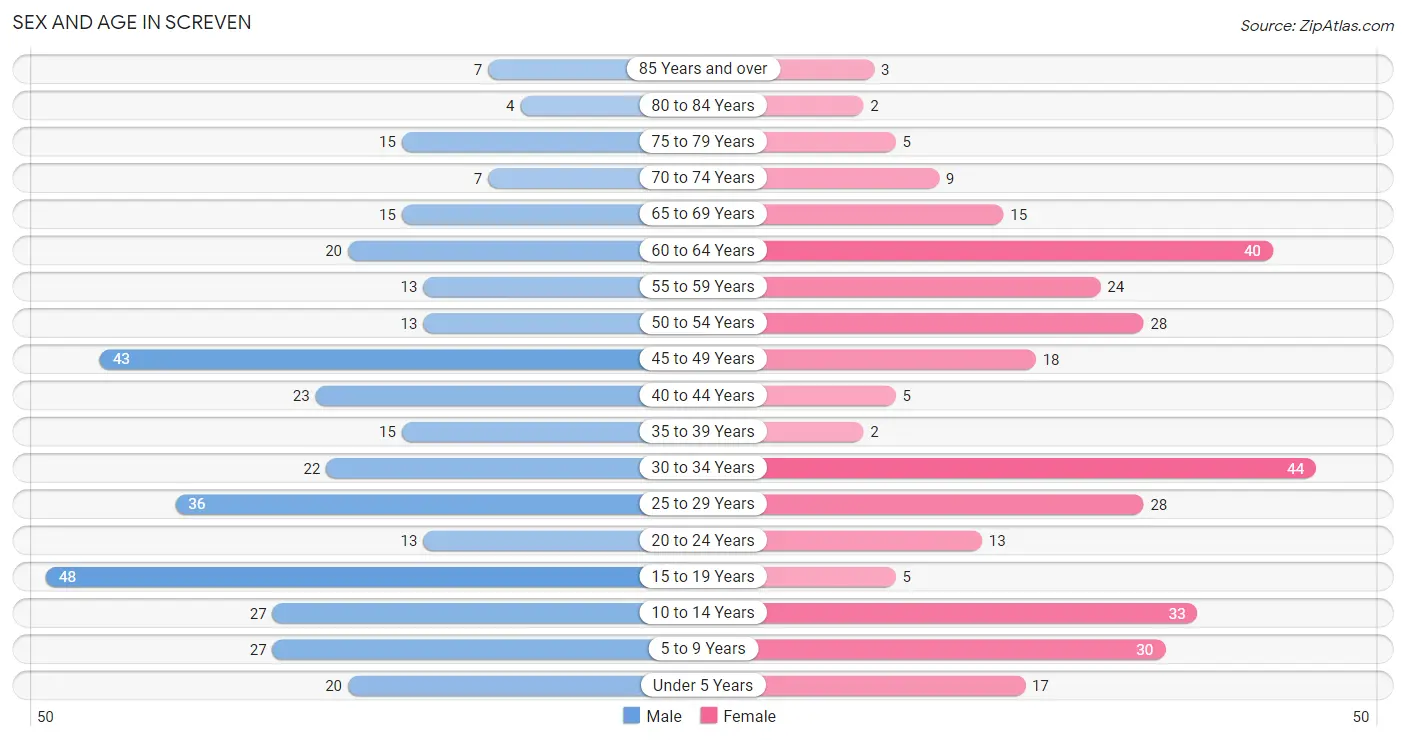
| Age Bracket | Male | Female |
| Under 5 Years | 20 (5.4%) | 17 (5.3%) |
| 5 to 9 Years | 27 (7.3%) | 30 (9.3%) |
| 10 to 14 Years | 27 (7.3%) | 33 (10.3%) |
| 15 to 19 Years | 48 (13.0%) | 5 (1.6%) |
| 20 to 24 Years | 13 (3.5%) | 13 (4.1%) |
| 25 to 29 Years | 36 (9.8%) | 28 (8.7%) |
| 30 to 34 Years | 22 (6.0%) | 44 (13.7%) |
| 35 to 39 Years | 15 (4.1%) | 2 (0.6%) |
| 40 to 44 Years | 23 (6.2%) | 5 (1.6%) |
| 45 to 49 Years | 43 (11.7%) | 18 (5.6%) |
| 50 to 54 Years | 13 (3.5%) | 28 (8.7%) |
| 55 to 59 Years | 13 (3.5%) | 24 (7.5%) |
| 60 to 64 Years | 20 (5.4%) | 40 (12.5%) |
| 65 to 69 Years | 15 (4.1%) | 15 (4.7%) |
| 70 to 74 Years | 7 (1.9%) | 9 (2.8%) |
| 75 to 79 Years | 15 (4.1%) | 5 (1.6%) |
| 80 to 84 Years | 4 (1.1%) | 2 (0.6%) |
| 85 Years and over | 7 (1.9%) | 3 (0.9%) |
| Total | 368 (100.0%) | 321 (100.0%) |
Families and Households in Screven
Median Family Size in Screven
The median family size in Screven is 3.21 persons per family, with single female/mother families (48 | 25.7%) accounting for the largest median family size of 3.98 persons per family. On the other hand, single male/father families (16 | 8.6%) represent the smallest median family size with 2.56 persons per family.
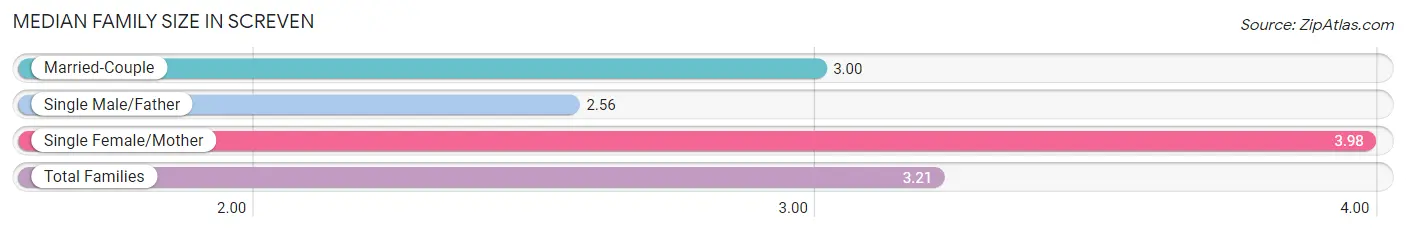
| Family Type | # Families | Family Size |
| Married-Couple | 123 (65.8%) | 3.00 |
| Single Male/Father | 16 (8.6%) | 2.56 |
| Single Female/Mother | 48 (25.7%) | 3.98 |
| Total Families | 187 (100.0%) | 3.21 |
Median Household Size in Screven
The median household size in Screven is 2.63 persons per household, with single female/mother households (48 | 18.3%) accounting for the largest median household size of 4.04 persons per household. non-family households (75 | 28.6%) represent the smallest median household size with 1.07 persons per household.
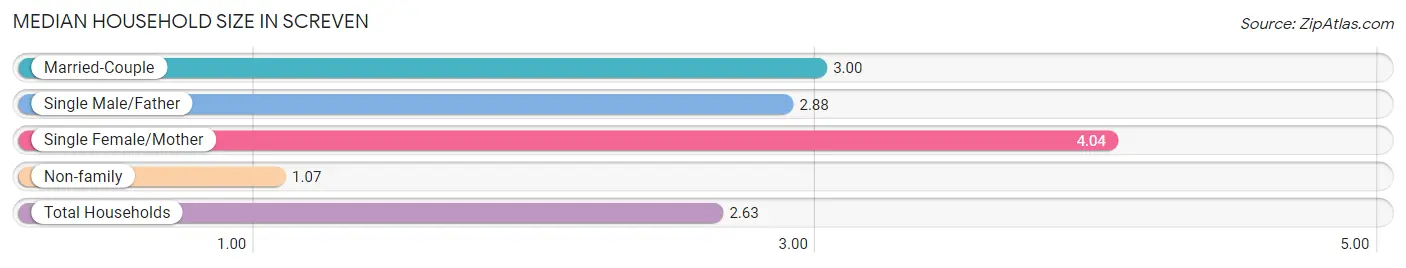
| Household Type | # Households | Household Size |
| Married-Couple | 123 (46.9%) | 3.00 |
| Single Male/Father | 16 (6.1%) | 2.88 |
| Single Female/Mother | 48 (18.3%) | 4.04 |
| Non-family | 75 (28.6%) | 1.07 |
| Total Households | 262 (100.0%) | 2.63 |
Household Size by Marriage Status in Screven
Out of a total of 262 households in Screven, 187 (71.4%) are family households, while 75 (28.6%) are nonfamily households. The most numerous type of family households are 2-person households, comprising 76, and the most common type of nonfamily households are 1-person households, comprising 74.
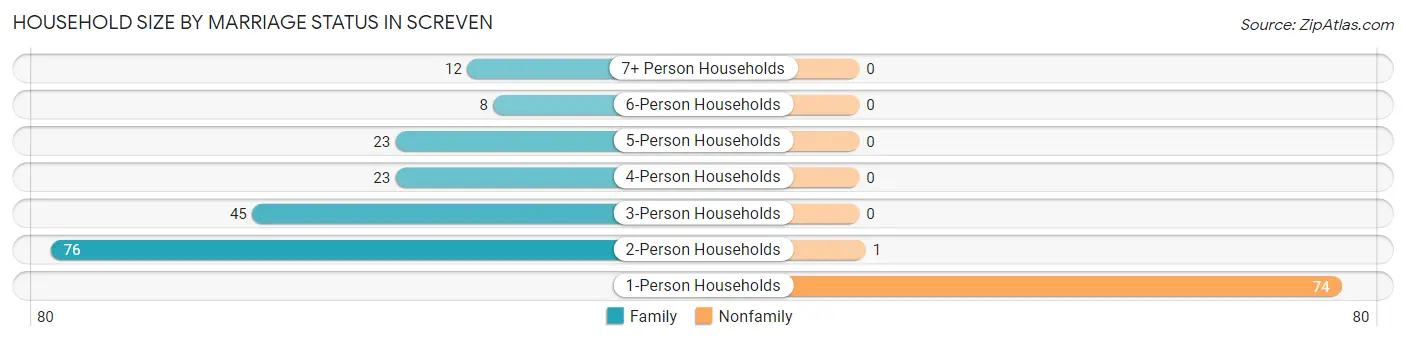
| Household Size | Family Households | Nonfamily Households |
| 1-Person Households | - | 74 (28.2%) |
| 2-Person Households | 76 (29.0%) | 1 (0.4%) |
| 3-Person Households | 45 (17.2%) | 0 (0.0%) |
| 4-Person Households | 23 (8.8%) | 0 (0.0%) |
| 5-Person Households | 23 (8.8%) | 0 (0.0%) |
| 6-Person Households | 8 (3.0%) | 0 (0.0%) |
| 7+ Person Households | 12 (4.6%) | 0 (0.0%) |
| Total | 187 (71.4%) | 75 (28.6%) |
Female Fertility in Screven
Fertility by Age in Screven
Average fertility rate in Screven is 26.0 births per 1,000 women. Women in the age bracket of 20 to 34 years have the highest fertility rate with 35.0 births per 1,000 women. Women in the age bracket of 20 to 34 years acount for 100.0% of all women with births.
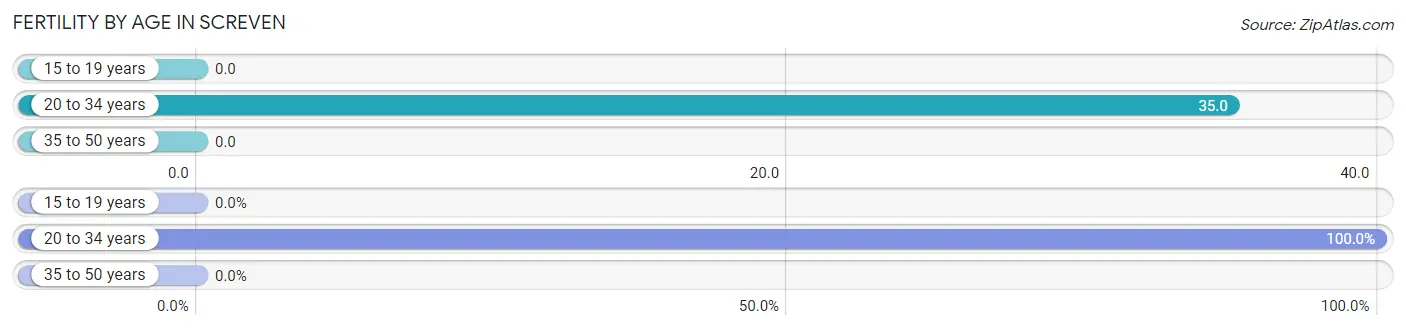
| Age Bracket | Women with Births | Births / 1,000 Women |
| 15 to 19 years | 0 (0.0%) | 0.0 |
| 20 to 34 years | 3 (100.0%) | 35.0 |
| 35 to 50 years | 0 (0.0%) | 0.0 |
| Total | 3 (100.0%) | 26.0 |
Fertility by Age by Marriage Status in Screven
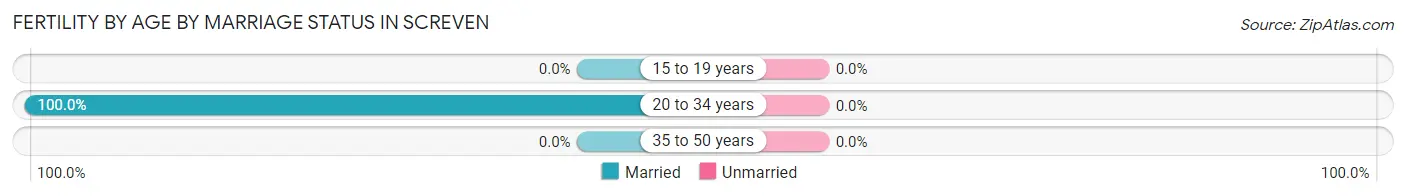
| Age Bracket | Married | Unmarried |
| 15 to 19 years | 0 (0.0%) | 0 (0.0%) |
| 20 to 34 years | 3 (100.0%) | 0 (0.0%) |
| 35 to 50 years | 0 (0.0%) | 0 (0.0%) |
| Total | 3 (100.0%) | 0 (0.0%) |
Fertility by Education in Screven
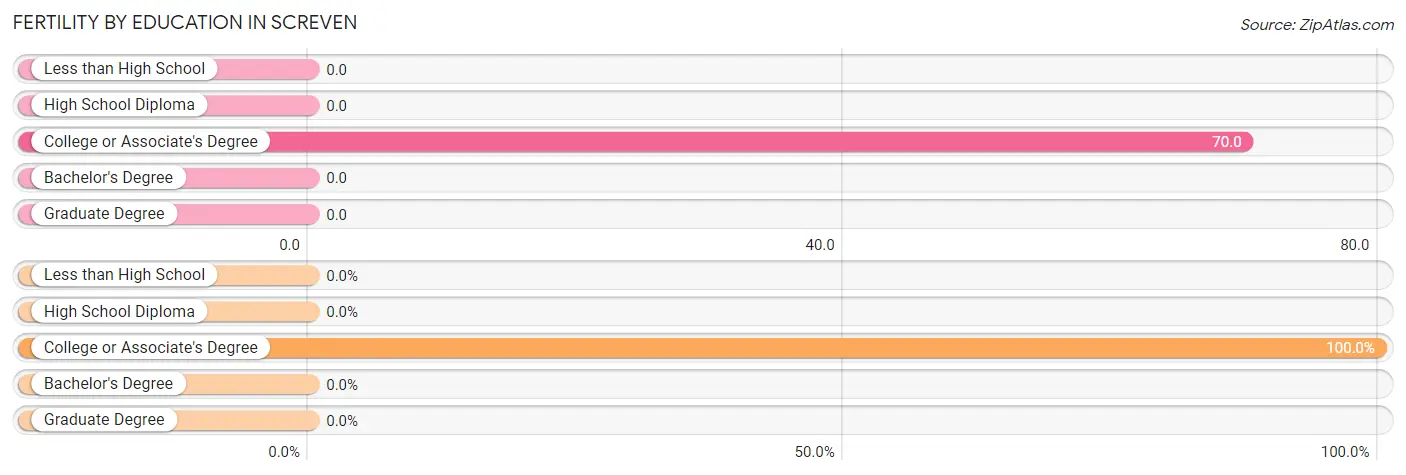
| Educational Attainment | Women with Births | Births / 1,000 Women |
| Less than High School | 0 (0.0%) | 0.0 |
| High School Diploma | 0 (0.0%) | 0.0 |
| College or Associate's Degree | 3 (100.0%) | 70.0 |
| Bachelor's Degree | 0 (0.0%) | 0.0 |
| Graduate Degree | 0 (0.0%) | 0.0 |
| Total | 3 (100.0%) | 26.0 |
Fertility by Education by Marriage Status in Screven
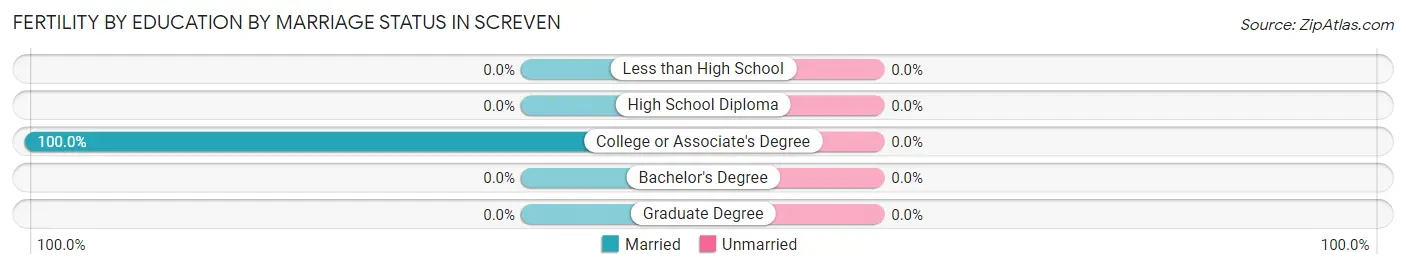
| Educational Attainment | Married | Unmarried |
| Less than High School | 0 (0.0%) | 0 (0.0%) |
| High School Diploma | 0 (0.0%) | 0 (0.0%) |
| College or Associate's Degree | 3 (100.0%) | 0 (0.0%) |
| Bachelor's Degree | 0 (0.0%) | 0 (0.0%) |
| Graduate Degree | 0 (0.0%) | 0 (0.0%) |
| Total | 3 (100.0%) | 0 (0.0%) |
Employment Characteristics in Screven
Employment by Class of Employer in Screven
Among the 274 employed individuals in Screven, private company employees (191 | 69.7%), state government employees (39 | 14.2%), and local government employees (20 | 7.3%) make up the most common classes of employment.
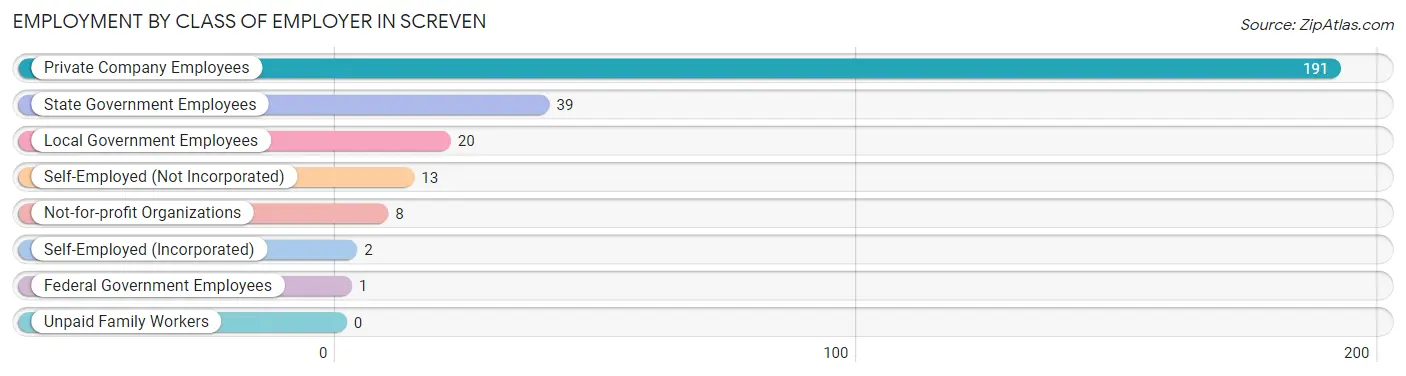
| Employer Class | # Employees | % Employees |
| Private Company Employees | 191 | 69.7% |
| Self-Employed (Incorporated) | 2 | 0.7% |
| Self-Employed (Not Incorporated) | 13 | 4.7% |
| Not-for-profit Organizations | 8 | 2.9% |
| Local Government Employees | 20 | 7.3% |
| State Government Employees | 39 | 14.2% |
| Federal Government Employees | 1 | 0.4% |
| Unpaid Family Workers | 0 | 0.0% |
| Total | 274 | 100.0% |
Employment Status by Age in Screven
According to the labor force statistics for Screven, out of the total population over 16 years of age (512), 58.0% or 297 individuals are in the labor force, with 3.4% or 10 of them unemployed. The age group with the highest labor force participation rate is 35 to 44 years, with 88.9% or 40 individuals in the labor force. Within the labor force, the 16 to 19 years age range has the highest percentage of unemployed individuals, with 25.0% or 1 of them being unemployed.
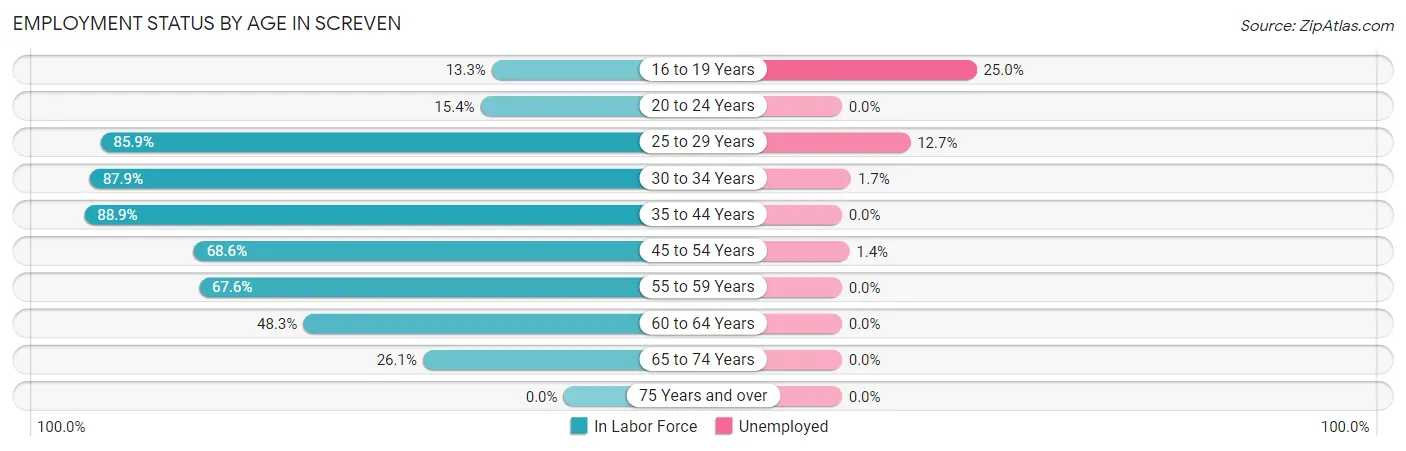
| Age Bracket | In Labor Force | Unemployed |
| 16 to 19 Years | 4 (13.3%) | 1 (25.0%) |
| 20 to 24 Years | 4 (15.4%) | 0 (0.0%) |
| 25 to 29 Years | 55 (85.9%) | 7 (12.7%) |
| 30 to 34 Years | 58 (87.9%) | 1 (1.7%) |
| 35 to 44 Years | 40 (88.9%) | 0 (0.0%) |
| 45 to 54 Years | 70 (68.6%) | 1 (1.4%) |
| 55 to 59 Years | 25 (67.6%) | 0 (0.0%) |
| 60 to 64 Years | 29 (48.3%) | 0 (0.0%) |
| 65 to 74 Years | 12 (26.1%) | 0 (0.0%) |
| 75 Years and over | 0 (0.0%) | 0 (0.0%) |
| Total | 297 (58.0%) | 10 (3.4%) |
Employment Status by Educational Attainment in Screven
According to labor force statistics for Screven, 74.1% of individuals (277) out of the total population between 25 and 64 years of age (374) are in the labor force, with 3.2% or 9 of them being unemployed. The group with the highest labor force participation rate are those with the educational attainment of college / associate degree, with 78.1% or 114 individuals in the labor force. Within the labor force, individuals with less than high school education have the highest percentage of unemployment, with 19.2% or 5 of them being unemployed.
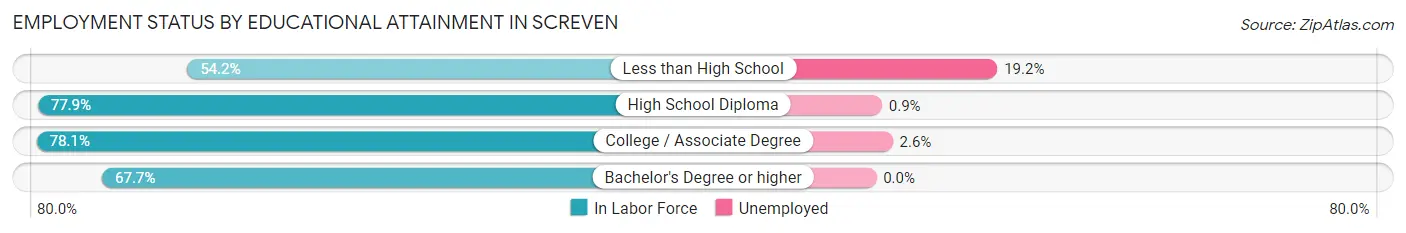
| Educational Attainment | In Labor Force | Unemployed |
| Less than High School | 26 (54.2%) | 9 (19.2%) |
| High School Diploma | 116 (77.9%) | 1 (0.9%) |
| College / Associate Degree | 114 (78.1%) | 4 (2.6%) |
| Bachelor's Degree or higher | 21 (67.7%) | 0 (0.0%) |
| Total | 277 (74.1%) | 12 (3.2%) |
Employment Occupations by Sex in Screven
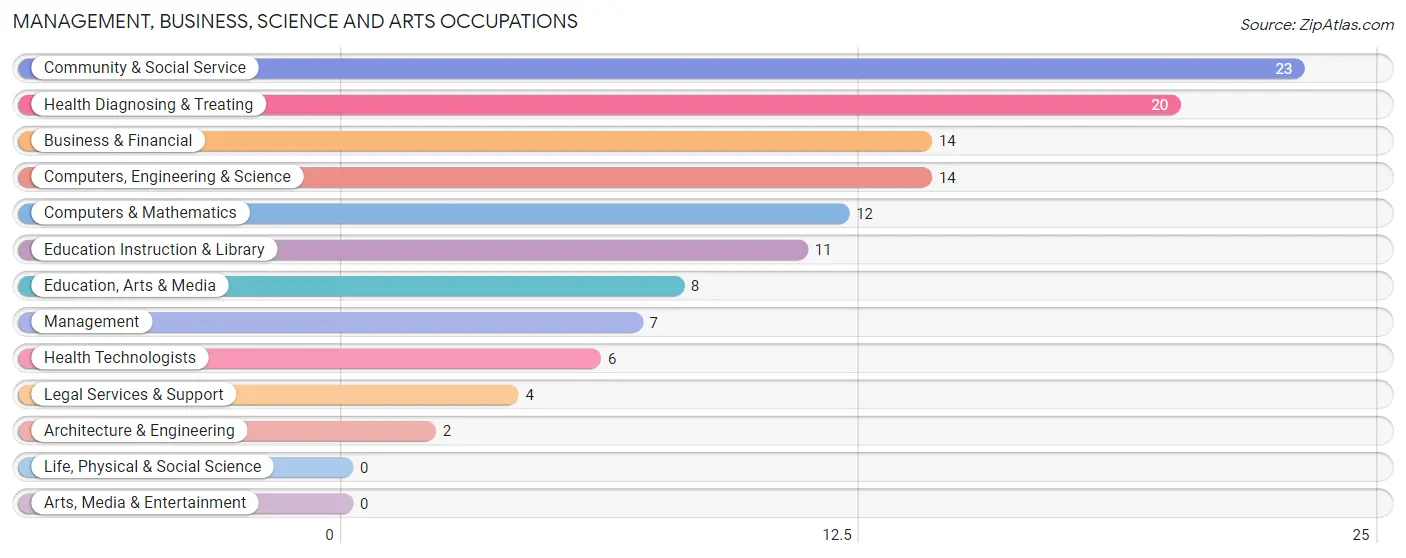
Management, Business, Science and Arts Occupations
The most common Management, Business, Science and Arts occupations in Screven are Community & Social Service (23 | 8.0%), Health Diagnosing & Treating (20 | 7.0%), Business & Financial (14 | 4.9%), Computers, Engineering & Science (14 | 4.9%), and Computers & Mathematics (12 | 4.2%).
Management, Business, Science and Arts Occupations by Sex
Within the Management, Business, Science and Arts occupations in Screven, the most male-oriented occupations are Architecture & Engineering (100.0%), Legal Services & Support (100.0%), and Business & Financial (78.6%), while the most female-oriented occupations are Management (100.0%), Computers & Mathematics (100.0%), and Health Diagnosing & Treating (95.0%).
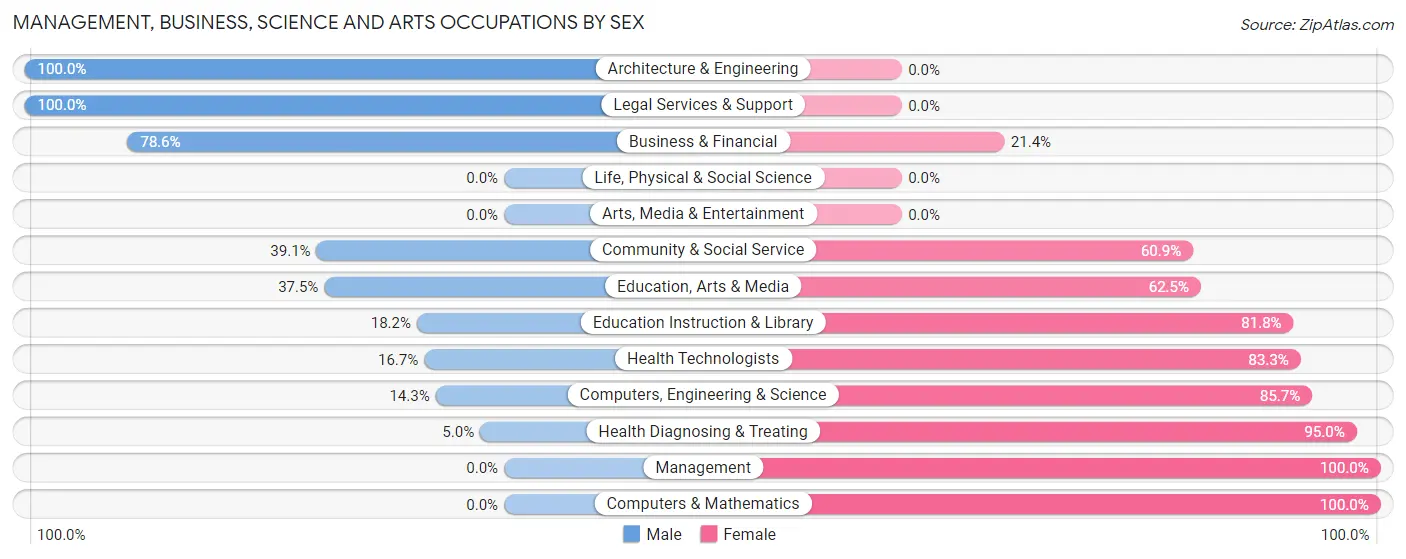
| Occupation | Male | Female |
| Management | 0 (0.0%) | 7 (100.0%) |
| Business & Financial | 11 (78.6%) | 3 (21.4%) |
| Computers, Engineering & Science | 2 (14.3%) | 12 (85.7%) |
| Computers & Mathematics | 0 (0.0%) | 12 (100.0%) |
| Architecture & Engineering | 2 (100.0%) | 0 (0.0%) |
| Life, Physical & Social Science | 0 (0.0%) | 0 (0.0%) |
| Community & Social Service | 9 (39.1%) | 14 (60.9%) |
| Education, Arts & Media | 3 (37.5%) | 5 (62.5%) |
| Legal Services & Support | 4 (100.0%) | 0 (0.0%) |
| Education Instruction & Library | 2 (18.2%) | 9 (81.8%) |
| Arts, Media & Entertainment | 0 (0.0%) | 0 (0.0%) |
| Health Diagnosing & Treating | 1 (5.0%) | 19 (95.0%) |
| Health Technologists | 1 (16.7%) | 5 (83.3%) |
| Total (Category) | 23 (29.5%) | 55 (70.5%) |
| Total (Overall) | 161 (56.1%) | 126 (43.9%) |
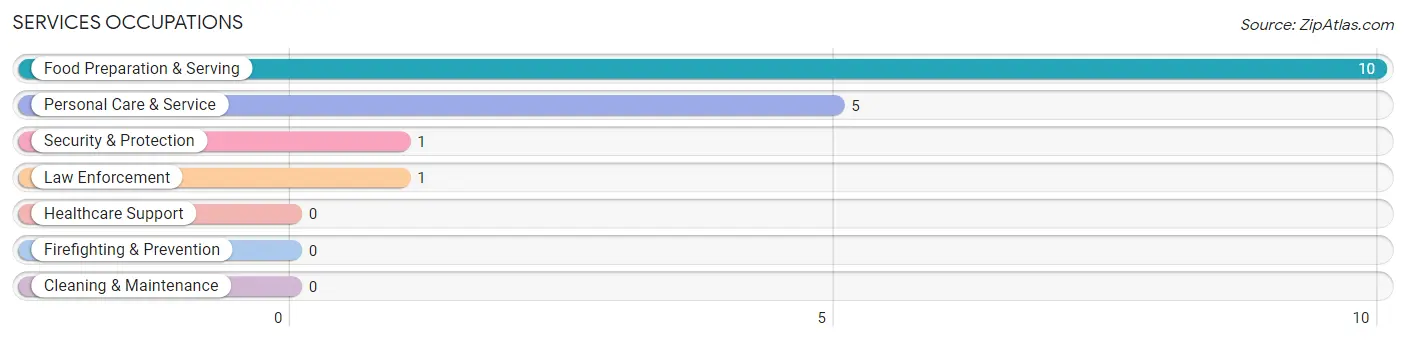
Services Occupations
The most common Services occupations in Screven are Food Preparation & Serving (10 | 3.5%), Personal Care & Service (5 | 1.7%), Security & Protection (1 | 0.4%), and Law Enforcement (1 | 0.4%).
Services Occupations by Sex
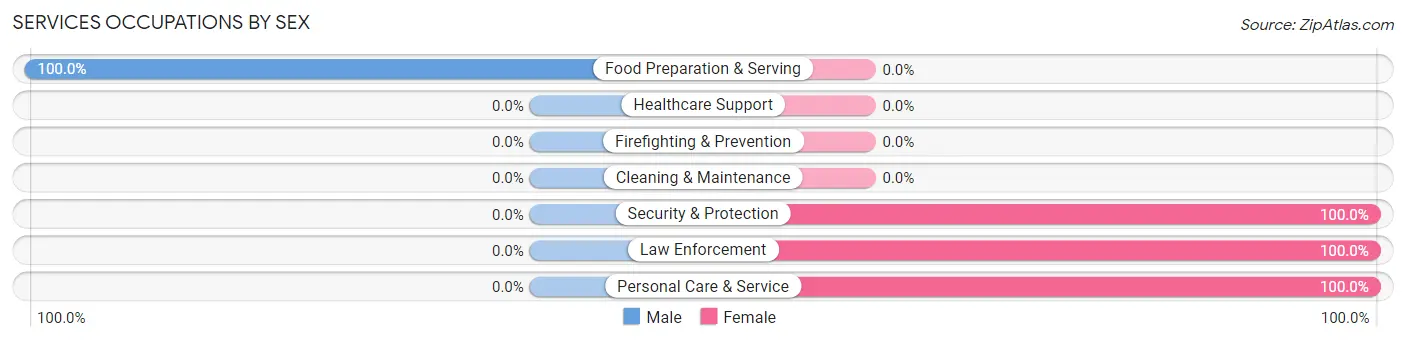
| Occupation | Male | Female |
| Healthcare Support | 0 (0.0%) | 0 (0.0%) |
| Security & Protection | 0 (0.0%) | 1 (100.0%) |
| Firefighting & Prevention | 0 (0.0%) | 0 (0.0%) |
| Law Enforcement | 0 (0.0%) | 1 (100.0%) |
| Food Preparation & Serving | 10 (100.0%) | 0 (0.0%) |
| Cleaning & Maintenance | 0 (0.0%) | 0 (0.0%) |
| Personal Care & Service | 0 (0.0%) | 5 (100.0%) |
| Total (Category) | 10 (62.5%) | 6 (37.5%) |
| Total (Overall) | 161 (56.1%) | 126 (43.9%) |
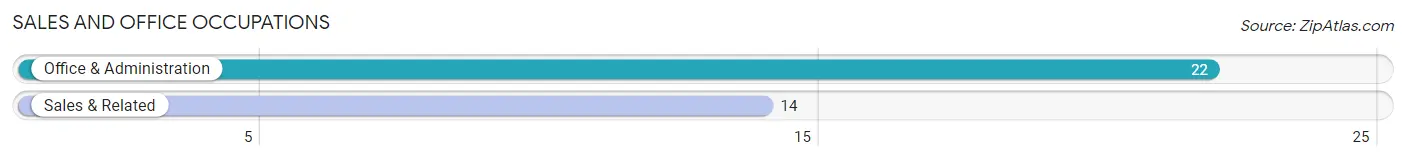
Sales and Office Occupations
The most common Sales and Office occupations in Screven are Office & Administration (22 | 7.7%), and Sales & Related (14 | 4.9%).
Sales and Office Occupations by Sex
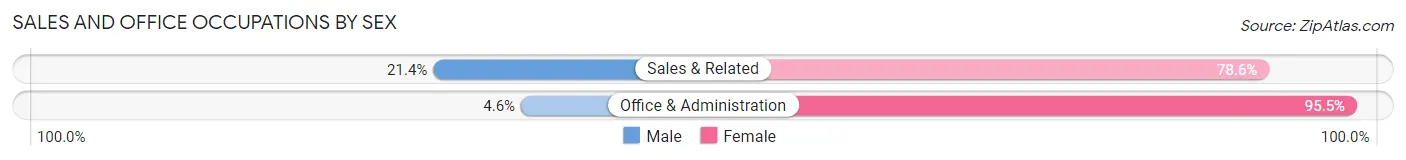
| Occupation | Male | Female |
| Sales & Related | 3 (21.4%) | 11 (78.6%) |
| Office & Administration | 1 (4.5%) | 21 (95.5%) |
| Total (Category) | 4 (11.1%) | 32 (88.9%) |
| Total (Overall) | 161 (56.1%) | 126 (43.9%) |
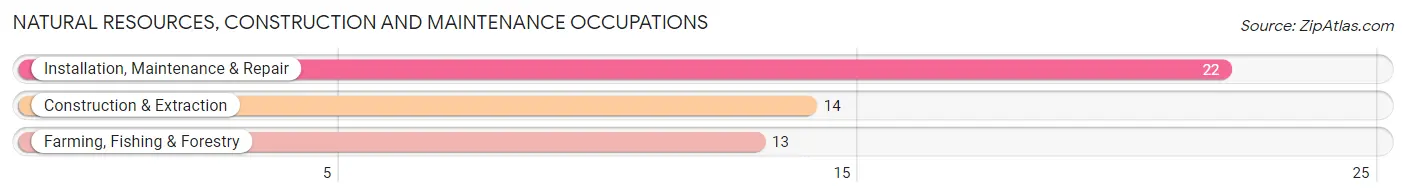
Natural Resources, Construction and Maintenance Occupations
The most common Natural Resources, Construction and Maintenance occupations in Screven are Installation, Maintenance & Repair (22 | 7.7%), Construction & Extraction (14 | 4.9%), and Farming, Fishing & Forestry (13 | 4.5%).
Natural Resources, Construction and Maintenance Occupations by Sex
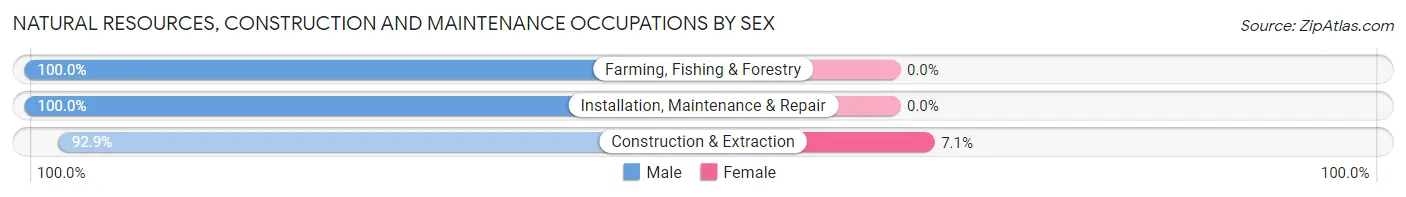
| Occupation | Male | Female |
| Farming, Fishing & Forestry | 13 (100.0%) | 0 (0.0%) |
| Construction & Extraction | 13 (92.9%) | 1 (7.1%) |
| Installation, Maintenance & Repair | 22 (100.0%) | 0 (0.0%) |
| Total (Category) | 48 (98.0%) | 1 (2.0%) |
| Total (Overall) | 161 (56.1%) | 126 (43.9%) |
Production, Transportation and Moving Occupations
The most common Production, Transportation and Moving occupations in Screven are Production (56 | 19.5%), Transportation (30 | 10.4%), and Material Moving (22 | 7.7%).
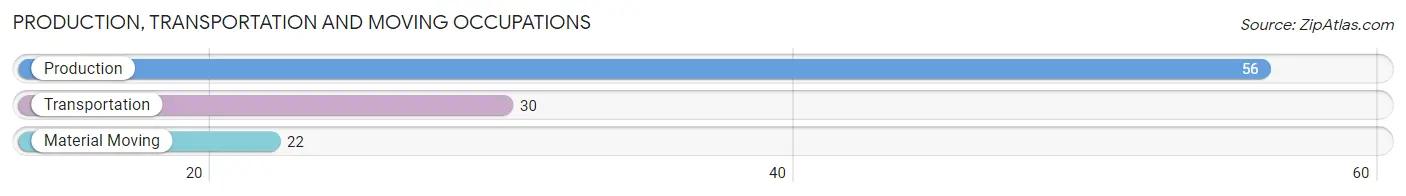
Production, Transportation and Moving Occupations by Sex
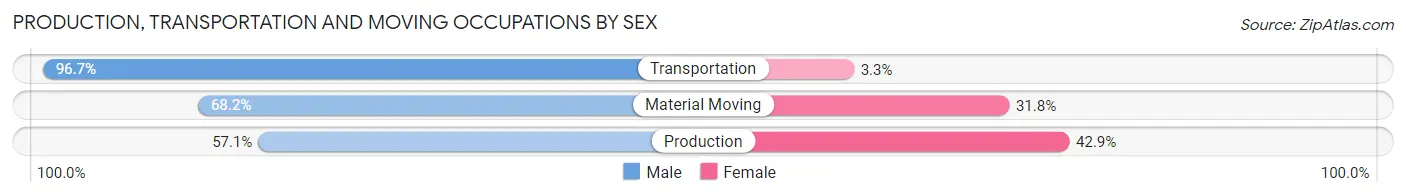
| Occupation | Male | Female |
| Production | 32 (57.1%) | 24 (42.9%) |
| Transportation | 29 (96.7%) | 1 (3.3%) |
| Material Moving | 15 (68.2%) | 7 (31.8%) |
| Total (Category) | 76 (70.4%) | 32 (29.6%) |
| Total (Overall) | 161 (56.1%) | 126 (43.9%) |
Employment Industries by Sex in Screven
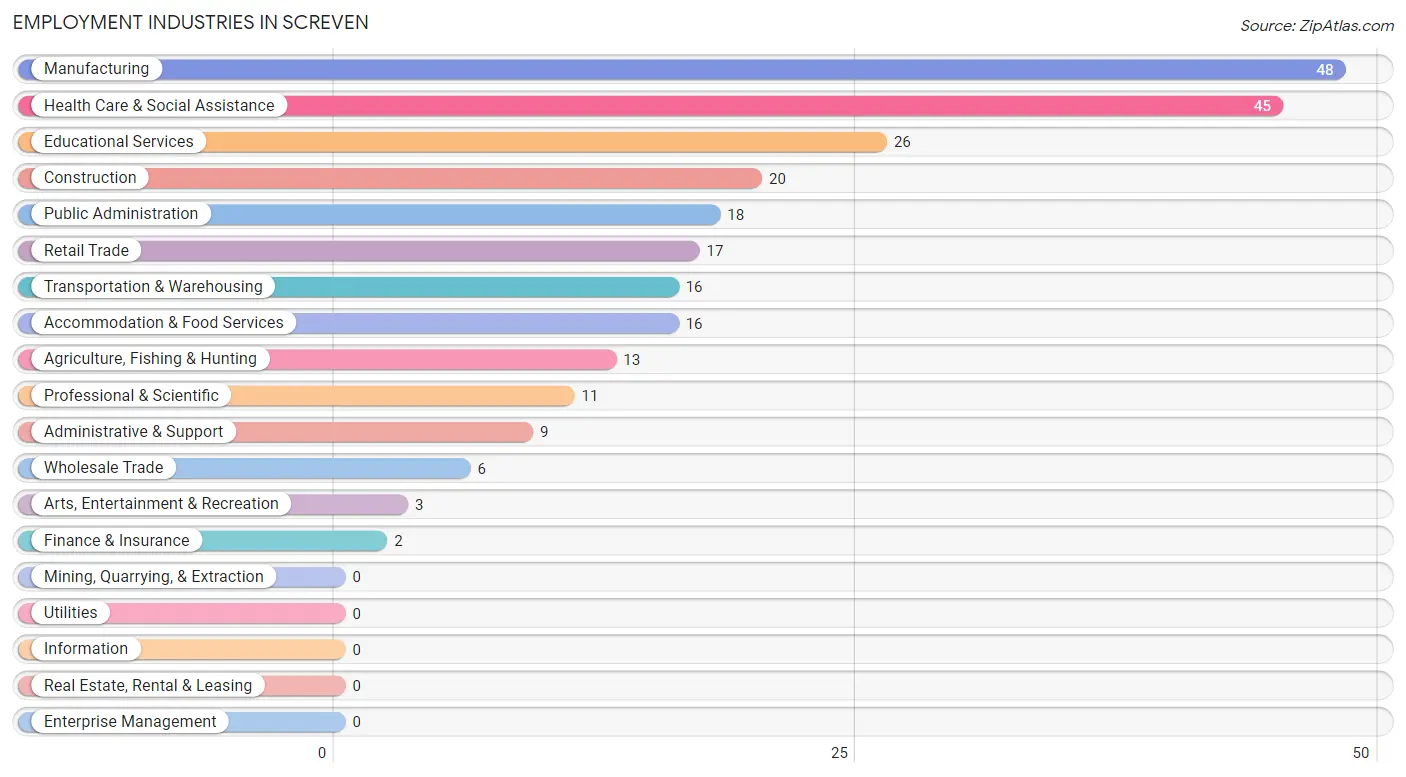
Employment Industries in Screven
The major employment industries in Screven include Manufacturing (48 | 16.7%), Health Care & Social Assistance (45 | 15.7%), Educational Services (26 | 9.1%), Construction (20 | 7.0%), and Public Administration (18 | 6.3%).
Employment Industries by Sex in Screven
The Screven industries that see more men than women are Agriculture, Fishing & Hunting (100.0%), Construction (100.0%), and Wholesale Trade (100.0%), whereas the industries that tend to have a higher number of women are Finance & Insurance (100.0%), Health Care & Social Assistance (88.9%), and Professional & Scientific (63.6%).
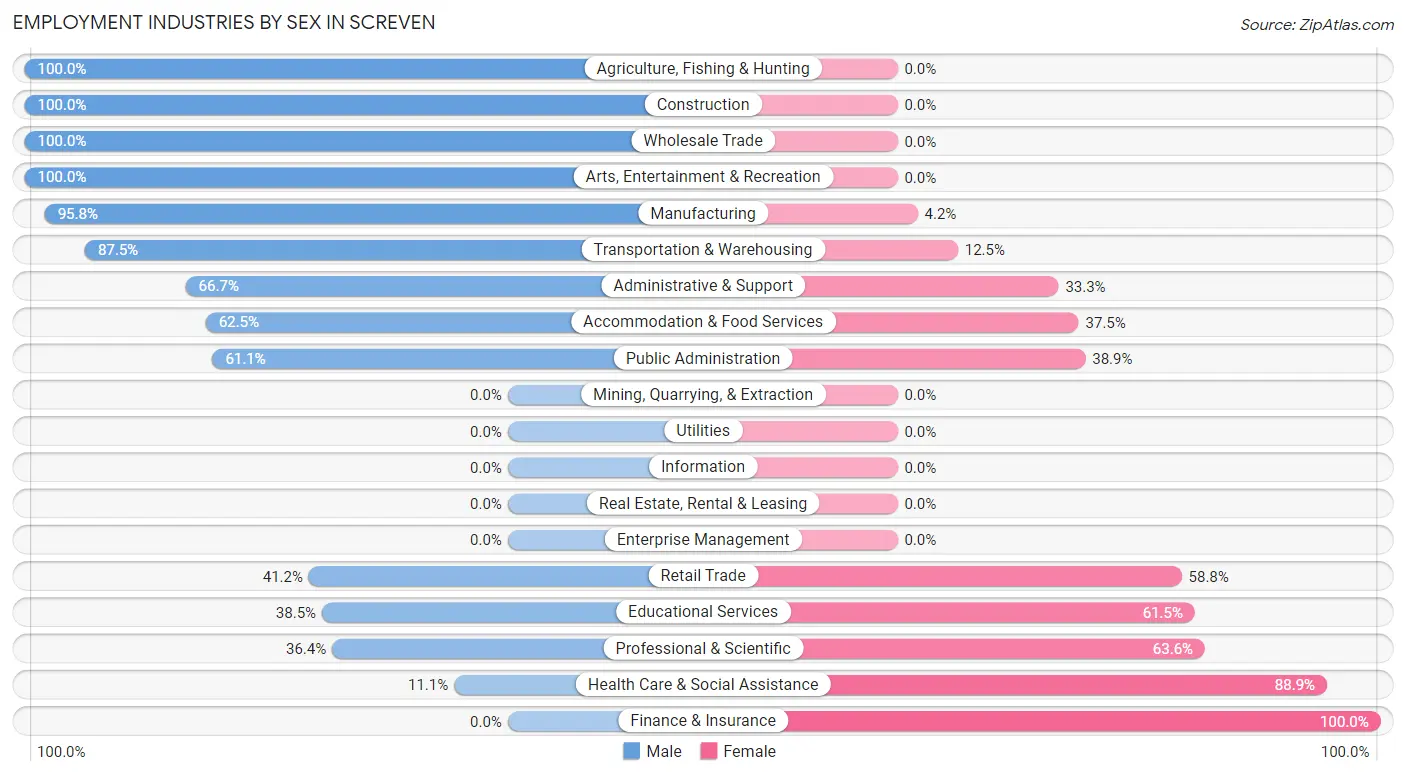
| Industry | Male | Female |
| Agriculture, Fishing & Hunting | 13 (100.0%) | 0 (0.0%) |
| Mining, Quarrying, & Extraction | 0 (0.0%) | 0 (0.0%) |
| Construction | 20 (100.0%) | 0 (0.0%) |
| Manufacturing | 46 (95.8%) | 2 (4.2%) |
| Wholesale Trade | 6 (100.0%) | 0 (0.0%) |
| Retail Trade | 7 (41.2%) | 10 (58.8%) |
| Transportation & Warehousing | 14 (87.5%) | 2 (12.5%) |
| Utilities | 0 (0.0%) | 0 (0.0%) |
| Information | 0 (0.0%) | 0 (0.0%) |
| Finance & Insurance | 0 (0.0%) | 2 (100.0%) |
| Real Estate, Rental & Leasing | 0 (0.0%) | 0 (0.0%) |
| Professional & Scientific | 4 (36.4%) | 7 (63.6%) |
| Enterprise Management | 0 (0.0%) | 0 (0.0%) |
| Administrative & Support | 6 (66.7%) | 3 (33.3%) |
| Educational Services | 10 (38.5%) | 16 (61.5%) |
| Health Care & Social Assistance | 5 (11.1%) | 40 (88.9%) |
| Arts, Entertainment & Recreation | 3 (100.0%) | 0 (0.0%) |
| Accommodation & Food Services | 10 (62.5%) | 6 (37.5%) |
| Public Administration | 11 (61.1%) | 7 (38.9%) |
| Total | 161 (56.1%) | 126 (43.9%) |
Education in Screven
School Enrollment in Screven
The most common levels of schooling among the 186 students in Screven are middle school (54 | 29.0%), high school (54 | 29.0%), and elementary school (51 | 27.4%).
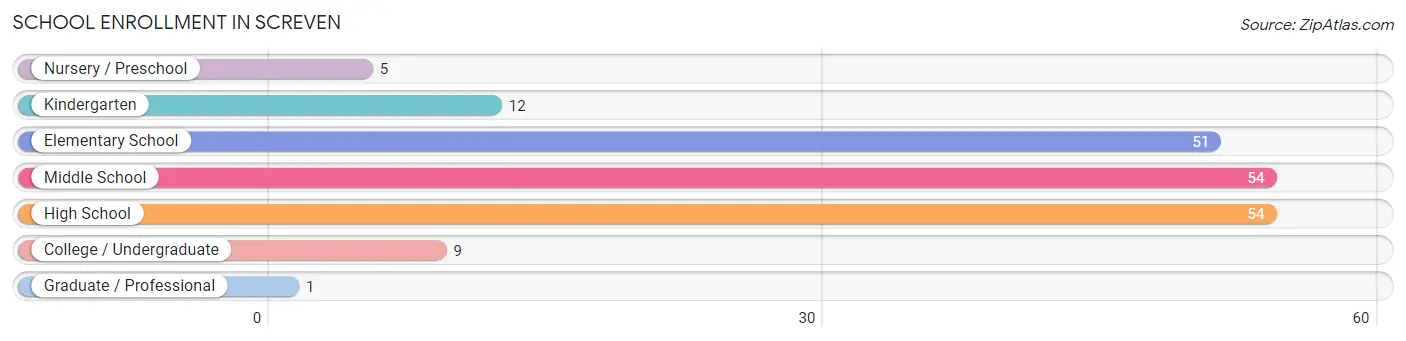
| School Level | # Students | % Students |
| Nursery / Preschool | 5 | 2.7% |
| Kindergarten | 12 | 6.5% |
| Elementary School | 51 | 27.4% |
| Middle School | 54 | 29.0% |
| High School | 54 | 29.0% |
| College / Undergraduate | 9 | 4.8% |
| Graduate / Professional | 1 | 0.5% |
| Total | 186 | 100.0% |
School Enrollment by Age by Funding Source in Screven
Out of a total of 186 students who are enrolled in schools in Screven, 15 (8.1%) attend a private institution, while the remaining 171 (91.9%) are enrolled in public schools. The age group of 3 to 4 year olds has the highest likelihood of being enrolled in private schools, with 5 (100.0% in the age bracket) enrolled. Conversely, the age group of 15 to 17 year olds has the lowest likelihood of being enrolled in a private school, with 47 (100.0% in the age bracket) attending a public institution.
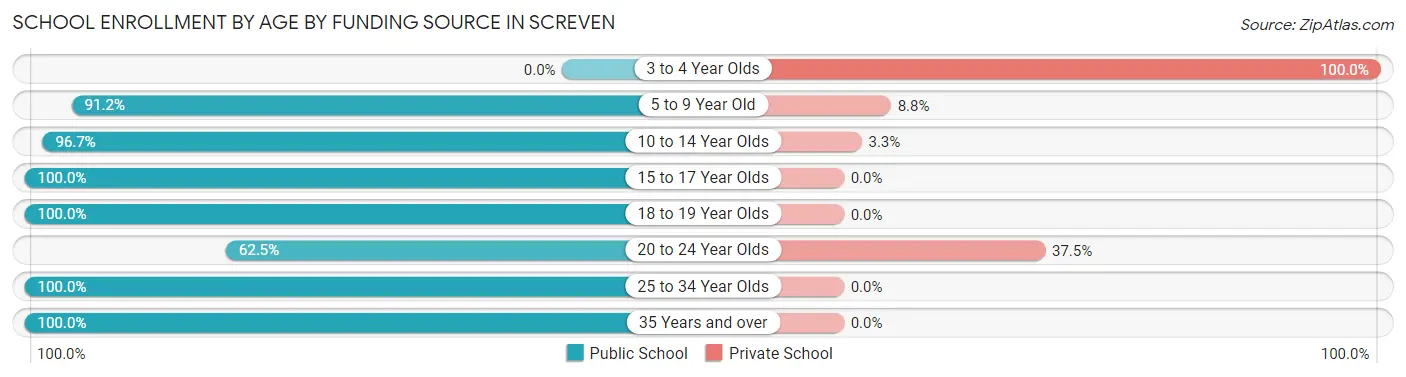
| Age Bracket | Public School | Private School |
| 3 to 4 Year Olds | 0 (0.0%) | 5 (100.0%) |
| 5 to 9 Year Old | 52 (91.2%) | 5 (8.8%) |
| 10 to 14 Year Olds | 58 (96.7%) | 2 (3.3%) |
| 15 to 17 Year Olds | 47 (100.0%) | 0 (0.0%) |
| 18 to 19 Year Olds | 5 (100.0%) | 0 (0.0%) |
| 20 to 24 Year Olds | 5 (62.5%) | 3 (37.5%) |
| 25 to 34 Year Olds | 1 (100.0%) | 0 (0.0%) |
| 35 Years and over | 3 (100.0%) | 0 (0.0%) |
| Total | 171 (91.9%) | 15 (8.1%) |
Educational Attainment by Field of Study in Screven
Communications (10 | 20.4%), literature & languages (9 | 18.4%), liberal arts & history (5 | 10.2%), psychology (4 | 8.2%), and social sciences (4 | 8.2%) are the most common fields of study among 49 individuals in Screven who have obtained a bachelor's degree or higher.
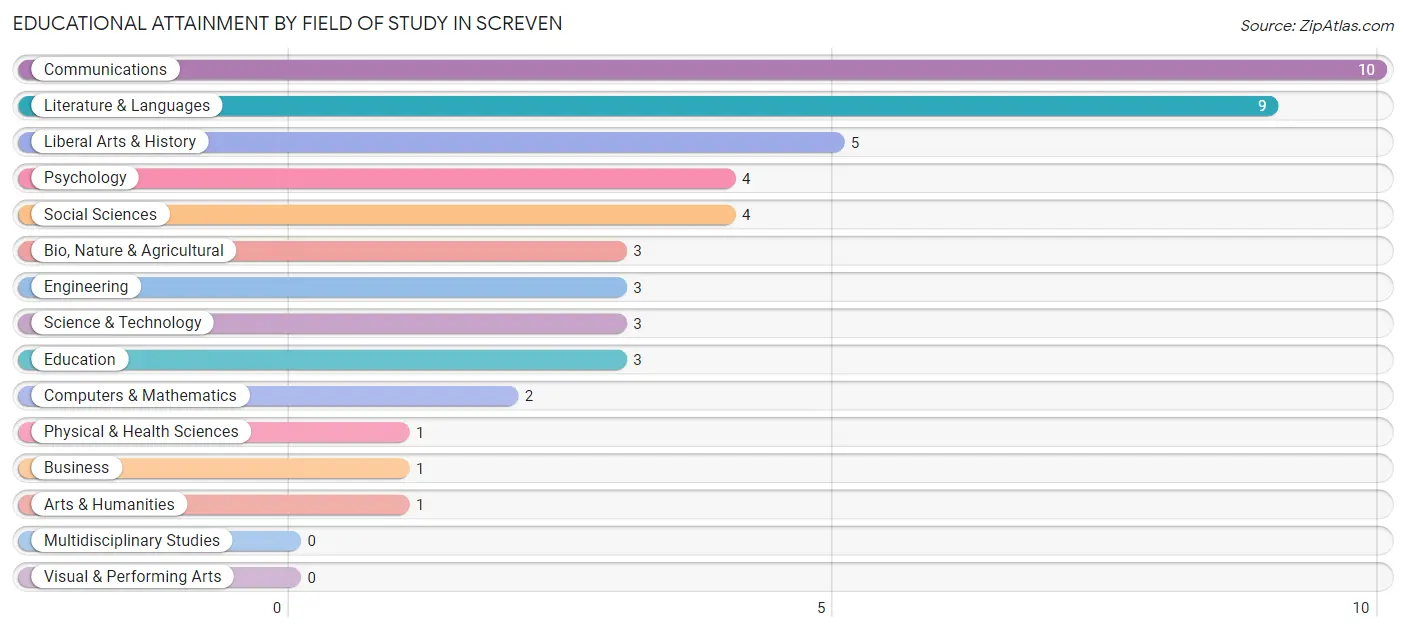
| Field of Study | # Graduates | % Graduates |
| Computers & Mathematics | 2 | 4.1% |
| Bio, Nature & Agricultural | 3 | 6.1% |
| Physical & Health Sciences | 1 | 2.0% |
| Psychology | 4 | 8.2% |
| Social Sciences | 4 | 8.2% |
| Engineering | 3 | 6.1% |
| Multidisciplinary Studies | 0 | 0.0% |
| Science & Technology | 3 | 6.1% |
| Business | 1 | 2.0% |
| Education | 3 | 6.1% |
| Literature & Languages | 9 | 18.4% |
| Liberal Arts & History | 5 | 10.2% |
| Visual & Performing Arts | 0 | 0.0% |
| Communications | 10 | 20.4% |
| Arts & Humanities | 1 | 2.0% |
| Total | 49 | 100.0% |
Transportation & Commute in Screven
Vehicle Availability by Sex in Screven
The most prevalent vehicle ownership categories in Screven are males with 2 vehicles (67, accounting for 41.9%) and females with 2 vehicles (44, making up 58.8%).
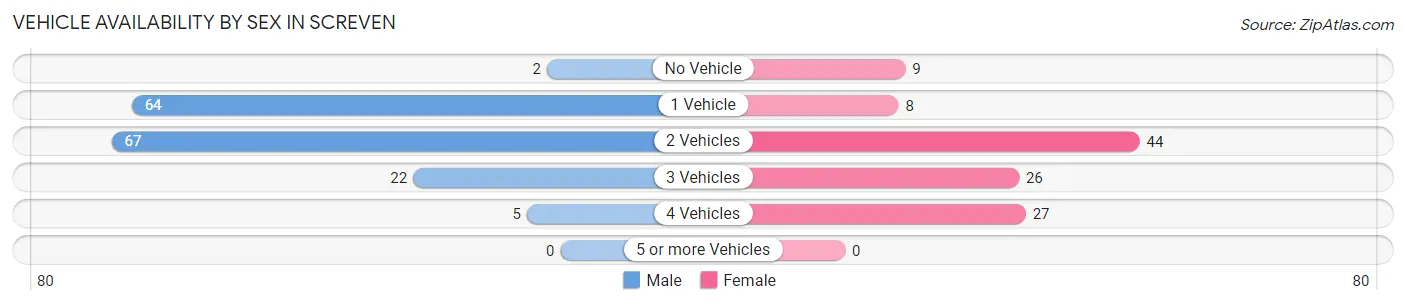
| Vehicles Available | Male | Female |
| No Vehicle | 2 (1.3%) | 9 (7.9%) |
| 1 Vehicle | 64 (40.0%) | 8 (7.0%) |
| 2 Vehicles | 67 (41.9%) | 44 (38.6%) |
| 3 Vehicles | 22 (13.8%) | 26 (22.8%) |
| 4 Vehicles | 5 (3.1%) | 27 (23.7%) |
| 5 or more Vehicles | 0 (0.0%) | 0 (0.0%) |
| Total | 160 (100.0%) | 114 (100.0%) |
Commute Time in Screven
The most frequently occuring commute durations in Screven are 20 to 24 minutes (55 commuters, 20.3%), 15 to 19 minutes (54 commuters, 19.9%), and 30 to 34 minutes (44 commuters, 16.2%).
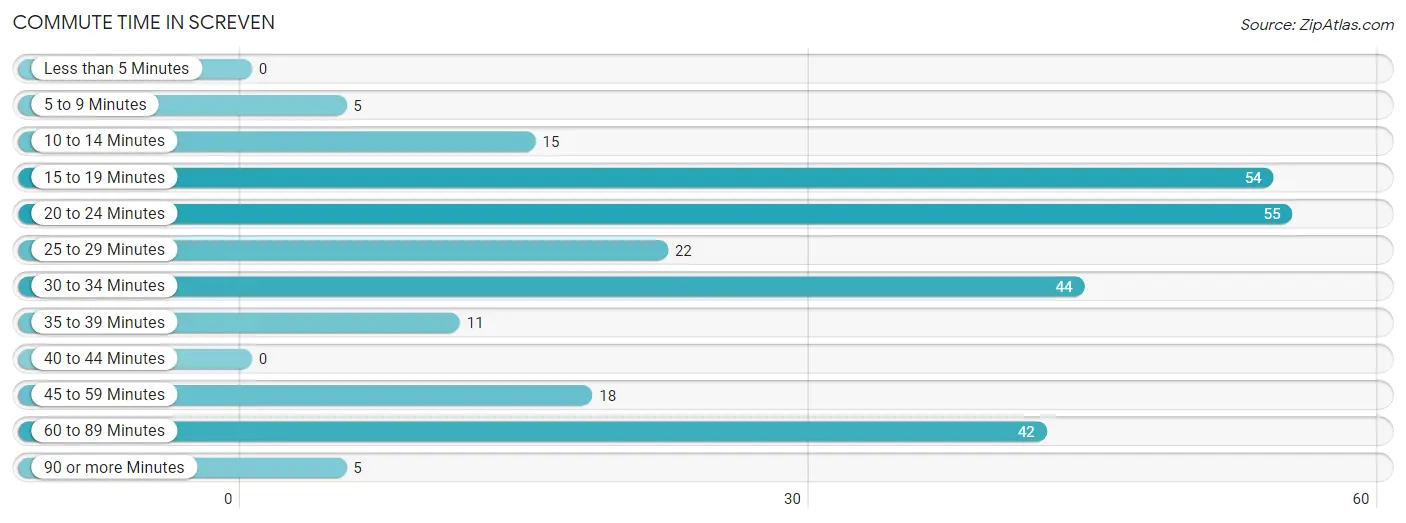
| Commute Time | # Commuters | % Commuters |
| Less than 5 Minutes | 0 | 0.0% |
| 5 to 9 Minutes | 5 | 1.8% |
| 10 to 14 Minutes | 15 | 5.5% |
| 15 to 19 Minutes | 54 | 19.9% |
| 20 to 24 Minutes | 55 | 20.3% |
| 25 to 29 Minutes | 22 | 8.1% |
| 30 to 34 Minutes | 44 | 16.2% |
| 35 to 39 Minutes | 11 | 4.1% |
| 40 to 44 Minutes | 0 | 0.0% |
| 45 to 59 Minutes | 18 | 6.6% |
| 60 to 89 Minutes | 42 | 15.5% |
| 90 or more Minutes | 5 | 1.8% |
Commute Time by Sex in Screven
The most common commute times in Screven are 15 to 19 minutes (38 commuters, 23.7%) for males and 60 to 89 minutes (30 commuters, 27.0%) for females.
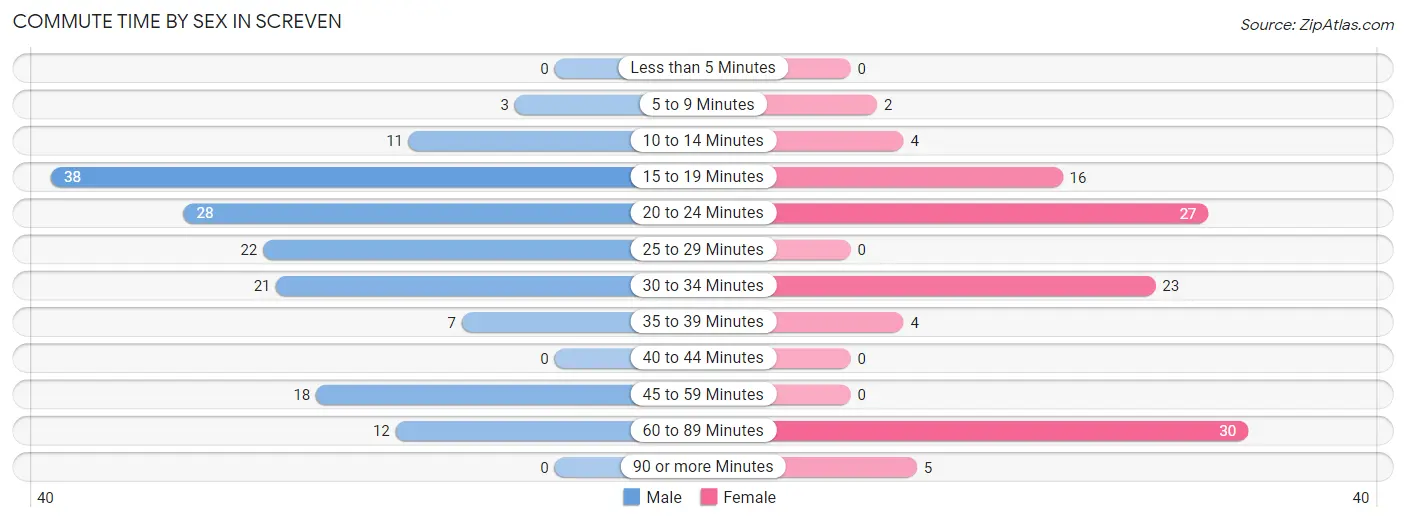
| Commute Time | Male | Female |
| Less than 5 Minutes | 0 (0.0%) | 0 (0.0%) |
| 5 to 9 Minutes | 3 (1.9%) | 2 (1.8%) |
| 10 to 14 Minutes | 11 (6.9%) | 4 (3.6%) |
| 15 to 19 Minutes | 38 (23.7%) | 16 (14.4%) |
| 20 to 24 Minutes | 28 (17.5%) | 27 (24.3%) |
| 25 to 29 Minutes | 22 (13.8%) | 0 (0.0%) |
| 30 to 34 Minutes | 21 (13.1%) | 23 (20.7%) |
| 35 to 39 Minutes | 7 (4.4%) | 4 (3.6%) |
| 40 to 44 Minutes | 0 (0.0%) | 0 (0.0%) |
| 45 to 59 Minutes | 18 (11.3%) | 0 (0.0%) |
| 60 to 89 Minutes | 12 (7.5%) | 30 (27.0%) |
| 90 or more Minutes | 0 (0.0%) | 5 (4.5%) |
Time of Departure to Work by Sex in Screven
The most frequent times of departure to work in Screven are 7:00 AM to 7:29 AM (34, 21.2%) for males and 5:00 AM to 5:29 AM (26, 23.4%) for females.
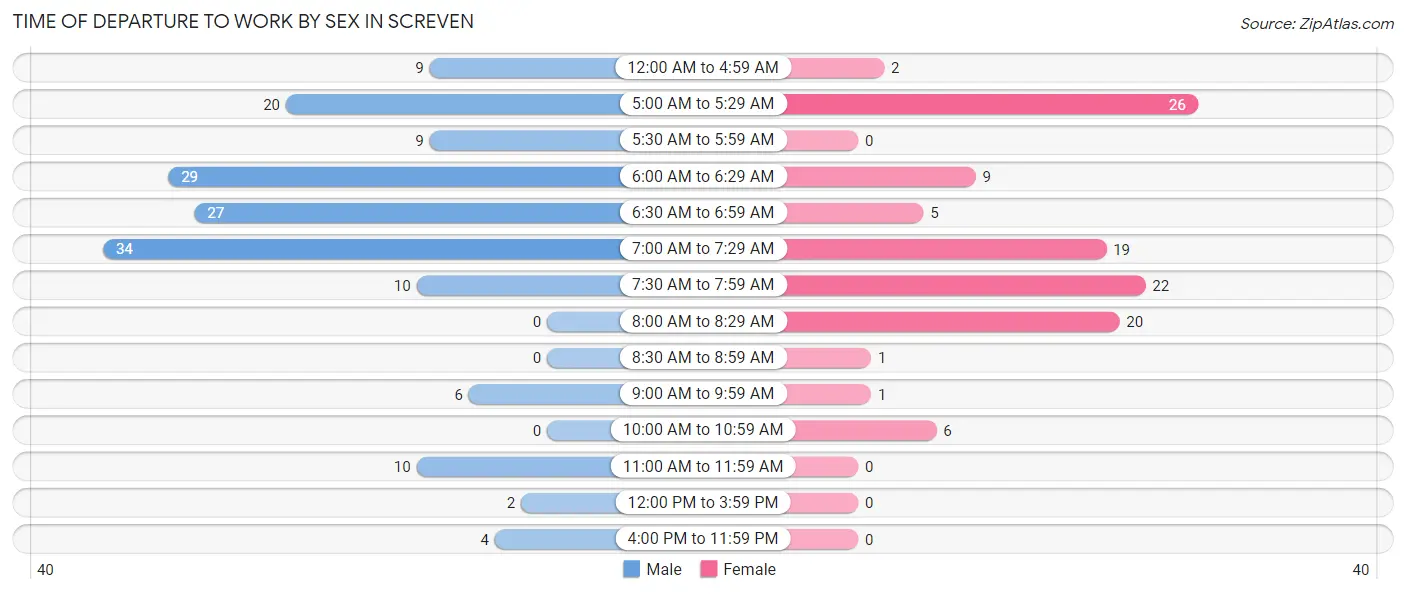
| Time of Departure | Male | Female |
| 12:00 AM to 4:59 AM | 9 (5.6%) | 2 (1.8%) |
| 5:00 AM to 5:29 AM | 20 (12.5%) | 26 (23.4%) |
| 5:30 AM to 5:59 AM | 9 (5.6%) | 0 (0.0%) |
| 6:00 AM to 6:29 AM | 29 (18.1%) | 9 (8.1%) |
| 6:30 AM to 6:59 AM | 27 (16.9%) | 5 (4.5%) |
| 7:00 AM to 7:29 AM | 34 (21.2%) | 19 (17.1%) |
| 7:30 AM to 7:59 AM | 10 (6.2%) | 22 (19.8%) |
| 8:00 AM to 8:29 AM | 0 (0.0%) | 20 (18.0%) |
| 8:30 AM to 8:59 AM | 0 (0.0%) | 1 (0.9%) |
| 9:00 AM to 9:59 AM | 6 (3.7%) | 1 (0.9%) |
| 10:00 AM to 10:59 AM | 0 (0.0%) | 6 (5.4%) |
| 11:00 AM to 11:59 AM | 10 (6.2%) | 0 (0.0%) |
| 12:00 PM to 3:59 PM | 2 (1.3%) | 0 (0.0%) |
| 4:00 PM to 11:59 PM | 4 (2.5%) | 0 (0.0%) |
| Total | 160 (100.0%) | 111 (100.0%) |
Housing Occupancy in Screven
Occupancy by Ownership in Screven
Of the total 262 dwellings in Screven, owner-occupied units account for 136 (51.9%), while renter-occupied units make up 126 (48.1%).
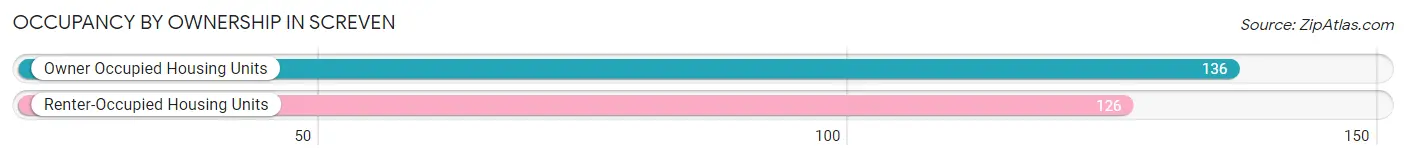
| Occupancy | # Housing Units | % Housing Units |
| Owner Occupied Housing Units | 136 | 51.9% |
| Renter-Occupied Housing Units | 126 | 48.1% |
| Total Occupied Housing Units | 262 | 100.0% |
Occupancy by Household Size in Screven
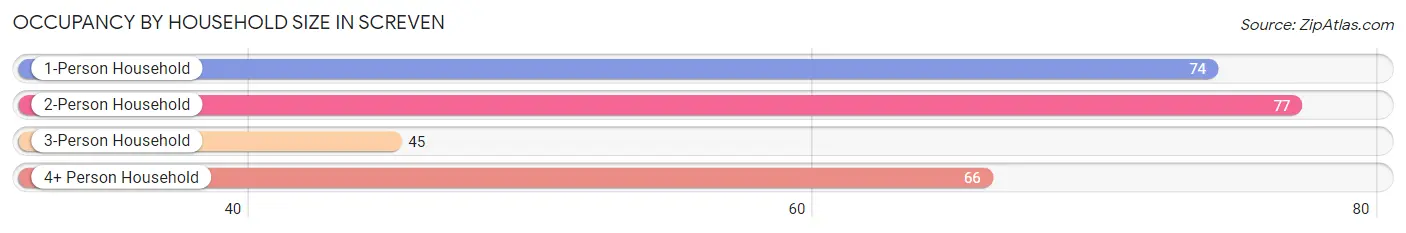
| Household Size | # Housing Units | % Housing Units |
| 1-Person Household | 74 | 28.2% |
| 2-Person Household | 77 | 29.4% |
| 3-Person Household | 45 | 17.2% |
| 4+ Person Household | 66 | 25.2% |
| Total Housing Units | 262 | 100.0% |
Occupancy by Ownership by Household Size in Screven
| Household Size | Owner-occupied | Renter-occupied |
| 1-Person Household | 45 (60.8%) | 29 (39.2%) |
| 2-Person Household | 46 (59.7%) | 31 (40.3%) |
| 3-Person Household | 25 (55.6%) | 20 (44.4%) |
| 4+ Person Household | 20 (30.3%) | 46 (69.7%) |
| Total Housing Units | 136 (51.9%) | 126 (48.1%) |
Occupancy by Educational Attainment in Screven
| Household Size | Owner-occupied | Renter-occupied |
| Less than High School | 9 (31.0%) | 20 (69.0%) |
| High School Diploma | 47 (47.0%) | 53 (53.0%) |
| College/Associate Degree | 61 (54.0%) | 52 (46.0%) |
| Bachelor's Degree or higher | 19 (95.0%) | 1 (5.0%) |
Occupancy by Age of Householder in Screven
| Age Bracket | # Households | % Households |
| Under 35 Years | 72 | 27.5% |
| 35 to 44 Years | 33 | 12.6% |
| 45 to 54 Years | 47 | 17.9% |
| 55 to 64 Years | 61 | 23.3% |
| 65 to 74 Years | 30 | 11.5% |
| 75 to 84 Years | 11 | 4.2% |
| 85 Years and Over | 8 | 3.0% |
| Total | 262 | 100.0% |
Housing Finances in Screven
Median Income by Occupancy in Screven
| Occupancy Type | # Households | Median Income |
| Owner-Occupied | 136 (51.9%) | $62,000 |
| Renter-Occupied | 126 (48.1%) | $32,841 |
| Average | 262 (100.0%) | $44,643 |
Occupancy by Householder Income Bracket in Screven
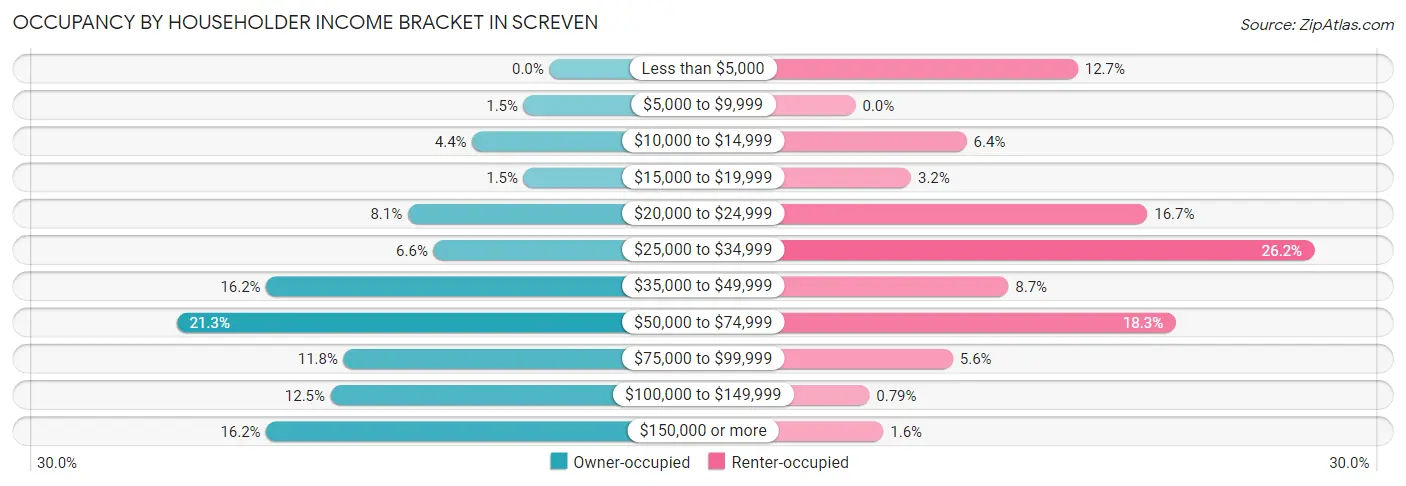
| Income Bracket | Owner-occupied | Renter-occupied |
| Less than $5,000 | 0 (0.0%) | 16 (12.7%) |
| $5,000 to $9,999 | 2 (1.5%) | 0 (0.0%) |
| $10,000 to $14,999 | 6 (4.4%) | 8 (6.4%) |
| $15,000 to $19,999 | 2 (1.5%) | 4 (3.2%) |
| $20,000 to $24,999 | 11 (8.1%) | 21 (16.7%) |
| $25,000 to $34,999 | 9 (6.6%) | 33 (26.2%) |
| $35,000 to $49,999 | 22 (16.2%) | 11 (8.7%) |
| $50,000 to $74,999 | 29 (21.3%) | 23 (18.2%) |
| $75,000 to $99,999 | 16 (11.8%) | 7 (5.6%) |
| $100,000 to $149,999 | 17 (12.5%) | 1 (0.8%) |
| $150,000 or more | 22 (16.2%) | 2 (1.6%) |
| Total | 136 (100.0%) | 126 (100.0%) |
Monthly Housing Cost Tiers in Screven
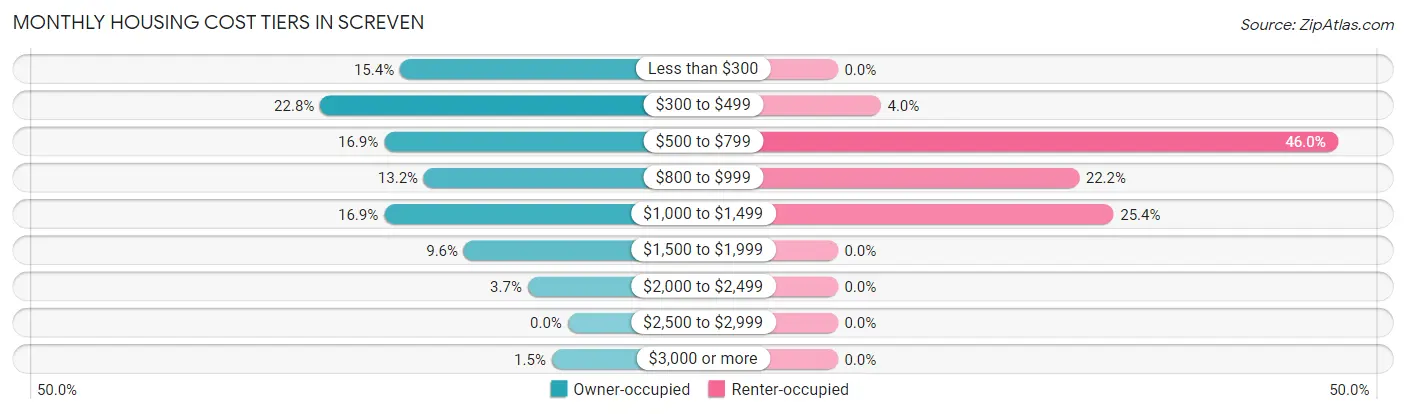
| Monthly Cost | Owner-occupied | Renter-occupied |
| Less than $300 | 21 (15.4%) | 0 (0.0%) |
| $300 to $499 | 31 (22.8%) | 5 (4.0%) |
| $500 to $799 | 23 (16.9%) | 58 (46.0%) |
| $800 to $999 | 18 (13.2%) | 28 (22.2%) |
| $1,000 to $1,499 | 23 (16.9%) | 32 (25.4%) |
| $1,500 to $1,999 | 13 (9.6%) | 0 (0.0%) |
| $2,000 to $2,499 | 5 (3.7%) | 0 (0.0%) |
| $2,500 to $2,999 | 0 (0.0%) | 0 (0.0%) |
| $3,000 or more | 2 (1.5%) | 0 (0.0%) |
| Total | 136 (100.0%) | 126 (100.0%) |
Physical Housing Characteristics in Screven
Housing Structures in Screven
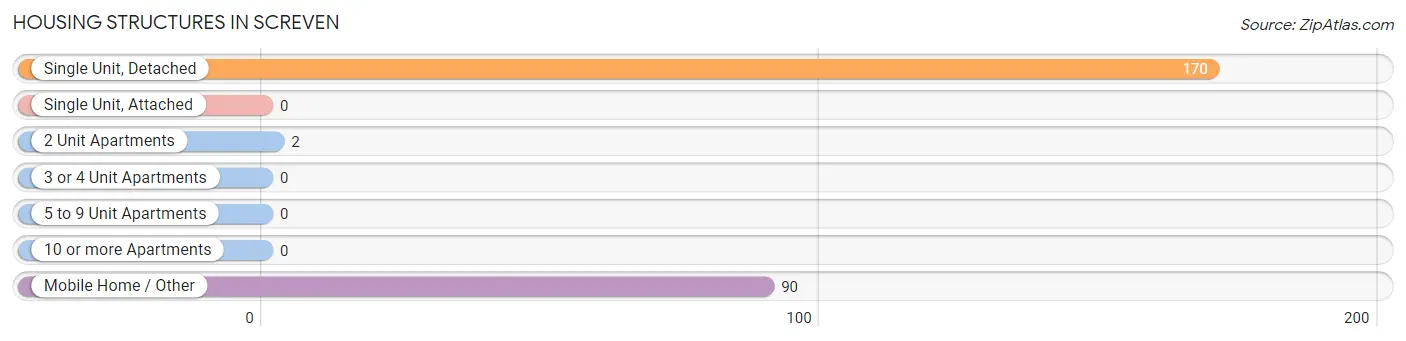
| Structure Type | # Housing Units | % Housing Units |
| Single Unit, Detached | 170 | 64.9% |
| Single Unit, Attached | 0 | 0.0% |
| 2 Unit Apartments | 2 | 0.8% |
| 3 or 4 Unit Apartments | 0 | 0.0% |
| 5 to 9 Unit Apartments | 0 | 0.0% |
| 10 or more Apartments | 0 | 0.0% |
| Mobile Home / Other | 90 | 34.4% |
| Total | 262 | 100.0% |
Housing Structures by Occupancy in Screven
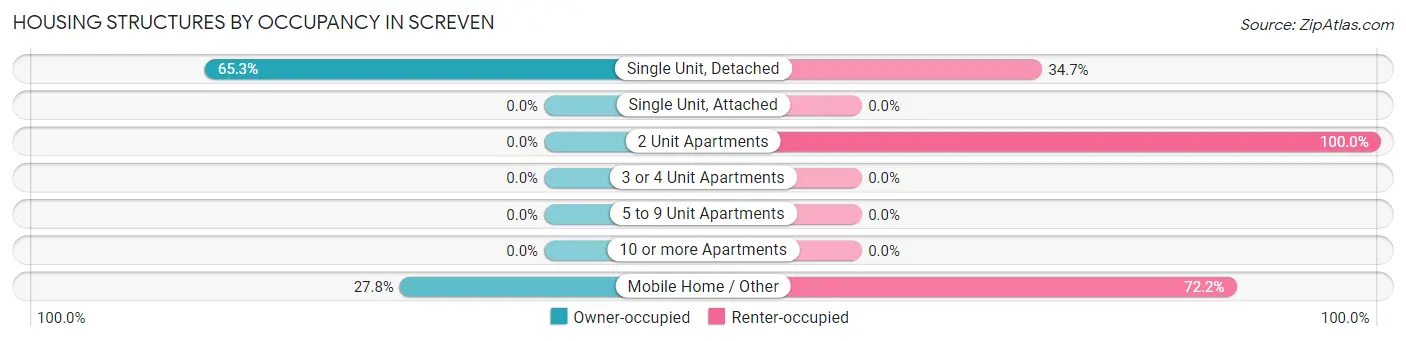
| Structure Type | Owner-occupied | Renter-occupied |
| Single Unit, Detached | 111 (65.3%) | 59 (34.7%) |
| Single Unit, Attached | 0 (0.0%) | 0 (0.0%) |
| 2 Unit Apartments | 0 (0.0%) | 2 (100.0%) |
| 3 or 4 Unit Apartments | 0 (0.0%) | 0 (0.0%) |
| 5 to 9 Unit Apartments | 0 (0.0%) | 0 (0.0%) |
| 10 or more Apartments | 0 (0.0%) | 0 (0.0%) |
| Mobile Home / Other | 25 (27.8%) | 65 (72.2%) |
| Total | 136 (51.9%) | 126 (48.1%) |
Housing Structures by Number of Rooms in Screven
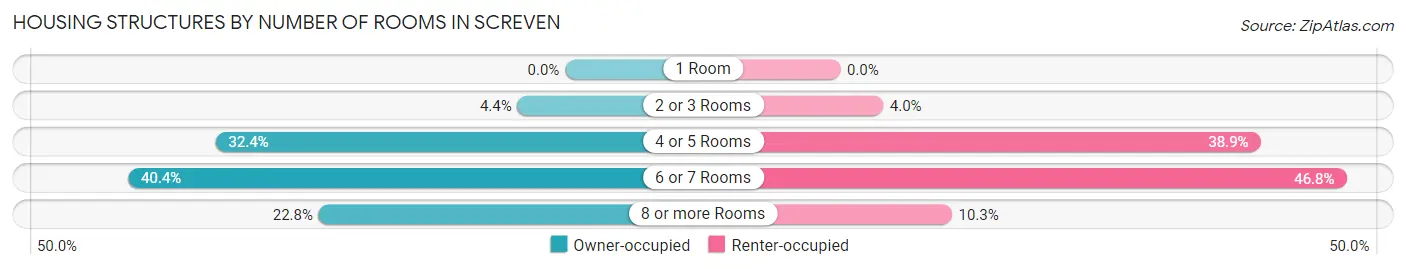
| Number of Rooms | Owner-occupied | Renter-occupied |
| 1 Room | 0 (0.0%) | 0 (0.0%) |
| 2 or 3 Rooms | 6 (4.4%) | 5 (4.0%) |
| 4 or 5 Rooms | 44 (32.4%) | 49 (38.9%) |
| 6 or 7 Rooms | 55 (40.4%) | 59 (46.8%) |
| 8 or more Rooms | 31 (22.8%) | 13 (10.3%) |
| Total | 136 (100.0%) | 126 (100.0%) |
Housing Structure by Heating Type in Screven
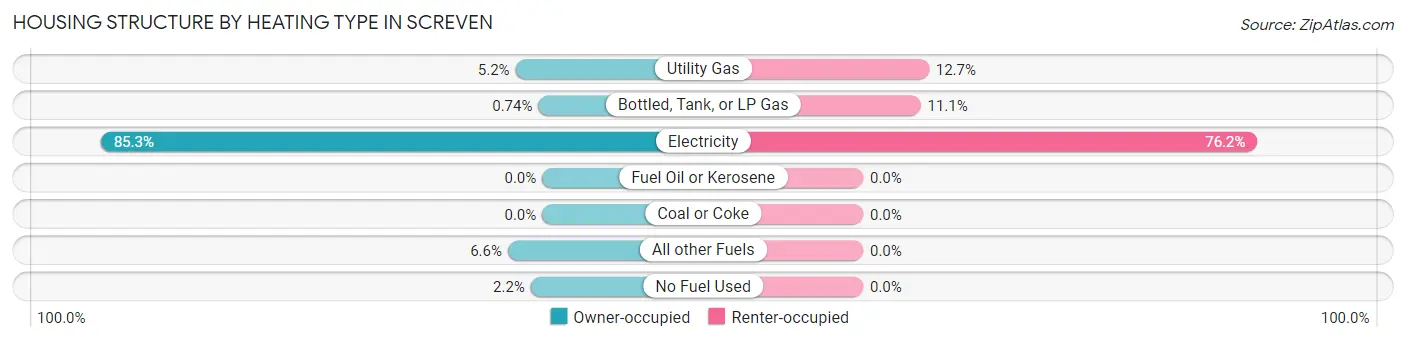
| Heating Type | Owner-occupied | Renter-occupied |
| Utility Gas | 7 (5.1%) | 16 (12.7%) |
| Bottled, Tank, or LP Gas | 1 (0.7%) | 14 (11.1%) |
| Electricity | 116 (85.3%) | 96 (76.2%) |
| Fuel Oil or Kerosene | 0 (0.0%) | 0 (0.0%) |
| Coal or Coke | 0 (0.0%) | 0 (0.0%) |
| All other Fuels | 9 (6.6%) | 0 (0.0%) |
| No Fuel Used | 3 (2.2%) | 0 (0.0%) |
| Total | 136 (100.0%) | 126 (100.0%) |
Household Vehicle Usage in Screven
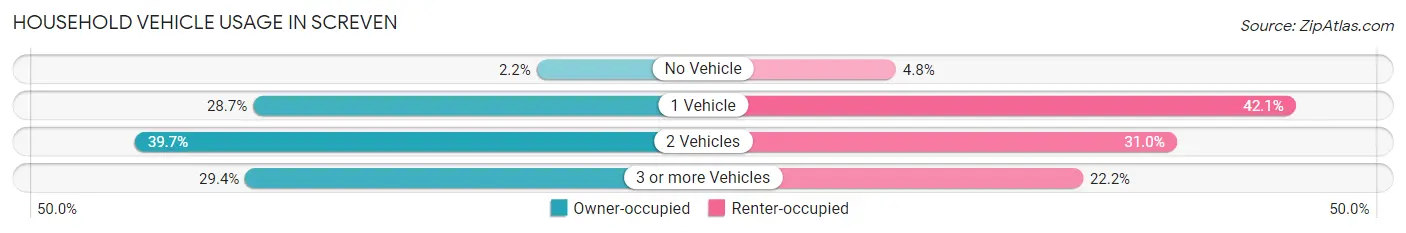
| Vehicles per Household | Owner-occupied | Renter-occupied |
| No Vehicle | 3 (2.2%) | 6 (4.8%) |
| 1 Vehicle | 39 (28.7%) | 53 (42.1%) |
| 2 Vehicles | 54 (39.7%) | 39 (30.9%) |
| 3 or more Vehicles | 40 (29.4%) | 28 (22.2%) |
| Total | 136 (100.0%) | 126 (100.0%) |
Real Estate & Mortgages in Screven
Real Estate and Mortgage Overview in Screven
| Characteristic | Without Mortgage | With Mortgage |
| Housing Units | 75 | 61 |
| Median Property Value | $71,900 | $112,000 |
| Median Household Income | $53,281 | $16 |
| Monthly Housing Costs | $360 | $2 |
| Real Estate Taxes | $717 | $0 |
Property Value by Mortgage Status in Screven
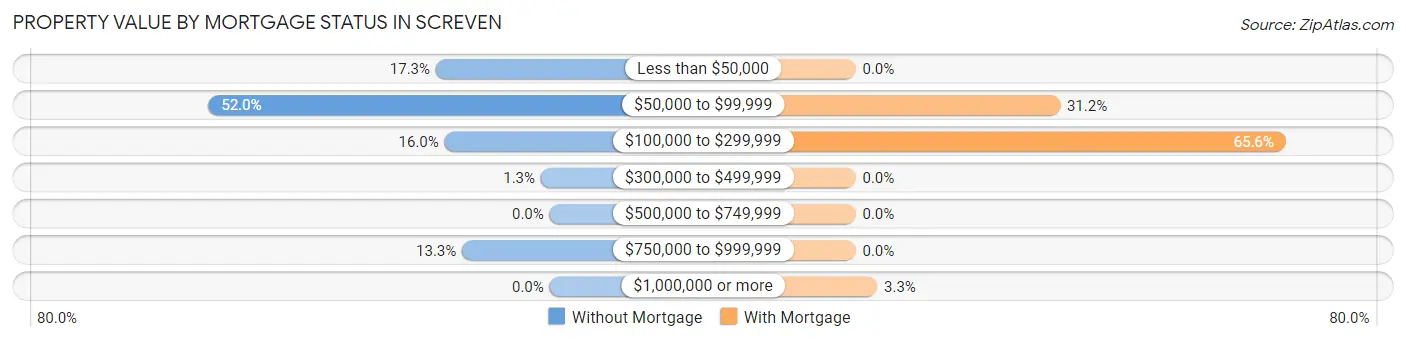
| Property Value | Without Mortgage | With Mortgage |
| Less than $50,000 | 13 (17.3%) | 0 (0.0%) |
| $50,000 to $99,999 | 39 (52.0%) | 19 (31.1%) |
| $100,000 to $299,999 | 12 (16.0%) | 40 (65.6%) |
| $300,000 to $499,999 | 1 (1.3%) | 0 (0.0%) |
| $500,000 to $749,999 | 0 (0.0%) | 0 (0.0%) |
| $750,000 to $999,999 | 10 (13.3%) | 0 (0.0%) |
| $1,000,000 or more | 0 (0.0%) | 2 (3.3%) |
| Total | 75 (100.0%) | 61 (100.0%) |
Household Income by Mortgage Status in Screven
| Household Income | Without Mortgage | With Mortgage |
| Less than $10,000 | 2 (2.7%) | 0 (0.0%) |
| $10,000 to $24,999 | 15 (20.0%) | 0 (0.0%) |
| $25,000 to $34,999 | 0 (0.0%) | 4 (6.6%) |
| $35,000 to $49,999 | 18 (24.0%) | 9 (14.7%) |
| $50,000 to $74,999 | 20 (26.7%) | 4 (6.6%) |
| $75,000 to $99,999 | 3 (4.0%) | 9 (14.7%) |
| $100,000 to $149,999 | 11 (14.7%) | 13 (21.3%) |
| $150,000 or more | 6 (8.0%) | 6 (9.8%) |
| Total | 75 (100.0%) | 61 (100.0%) |
Property Value to Household Income Ratio in Screven
| Value-to-Income Ratio | Without Mortgage | With Mortgage |
| Less than 2.0x | 46 (61.3%) | 92,875 (152,254.1%) |
| 2.0x to 2.9x | 11 (14.7%) | 40 (65.6%) |
| 3.0x to 3.9x | 0 (0.0%) | 5 (8.2%) |
| 4.0x or more | 18 (24.0%) | 7 (11.5%) |
| Total | 75 (100.0%) | 61 (100.0%) |
Real Estate Taxes by Mortgage Status in Screven
| Property Taxes | Without Mortgage | With Mortgage |
| Less than $800 | 40 (53.3%) | 0 (0.0%) |
| $800 to $1,499 | 8 (10.7%) | 13 (21.3%) |
| $800 to $1,499 | 22 (29.3%) | 11 (18.0%) |
| Total | 75 (100.0%) | 61 (100.0%) |
Health & Disability in Screven
Health Insurance Coverage by Age in Screven
| Age Bracket | With Coverage | Without Coverage |
| Under 6 Years | 42 (100.0%) | 0 (0.0%) |
| 6 to 18 Years | 160 (100.0%) | 0 (0.0%) |
| 19 to 25 Years | 19 (54.3%) | 16 (45.7%) |
| 26 to 34 Years | 75 (59.5%) | 51 (40.5%) |
| 35 to 44 Years | 25 (55.6%) | 20 (44.4%) |
| 45 to 54 Years | 74 (72.6%) | 28 (27.5%) |
| 55 to 64 Years | 77 (79.4%) | 20 (20.6%) |
| 65 to 74 Years | 45 (97.8%) | 1 (2.2%) |
| 75 Years and older | 36 (100.0%) | 0 (0.0%) |
| Total | 553 (80.3%) | 136 (19.7%) |
Health Insurance Coverage by Citizenship Status in Screven
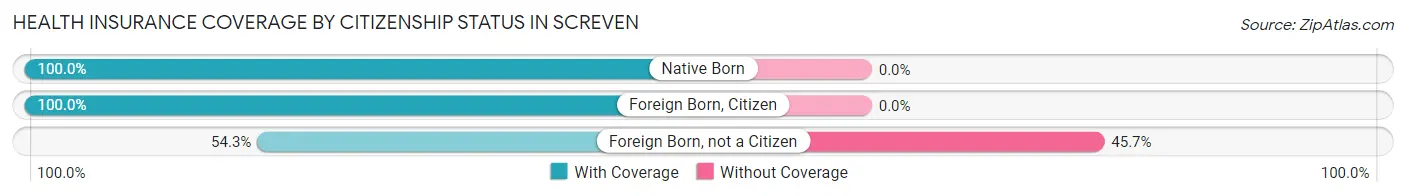
| Citizenship Status | With Coverage | Without Coverage |
| Native Born | 42 (100.0%) | 0 (0.0%) |
| Foreign Born, Citizen | 160 (100.0%) | 0 (0.0%) |
| Foreign Born, not a Citizen | 19 (54.3%) | 16 (45.7%) |
Health Insurance Coverage by Household Income in Screven
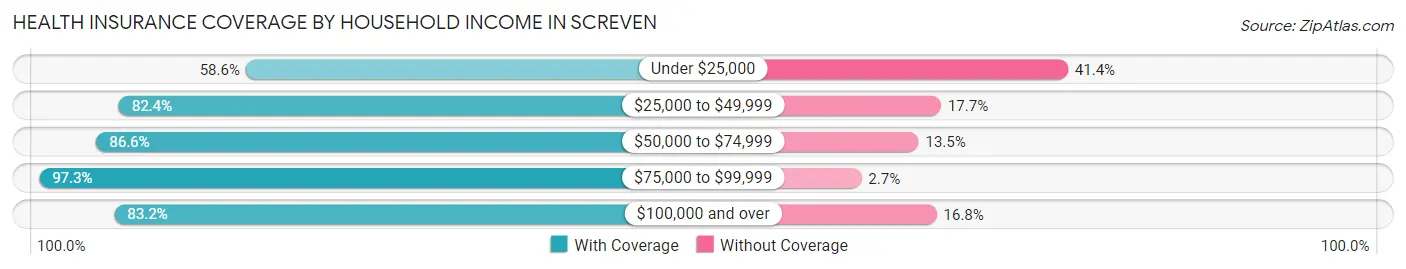
| Household Income | With Coverage | Without Coverage |
| Under $25,000 | 82 (58.6%) | 58 (41.4%) |
| $25,000 to $49,999 | 168 (82.4%) | 36 (17.6%) |
| $50,000 to $74,999 | 148 (86.6%) | 23 (13.5%) |
| $75,000 to $99,999 | 71 (97.3%) | 2 (2.7%) |
| $100,000 and over | 84 (83.2%) | 17 (16.8%) |
Public vs Private Health Insurance Coverage by Age in Screven
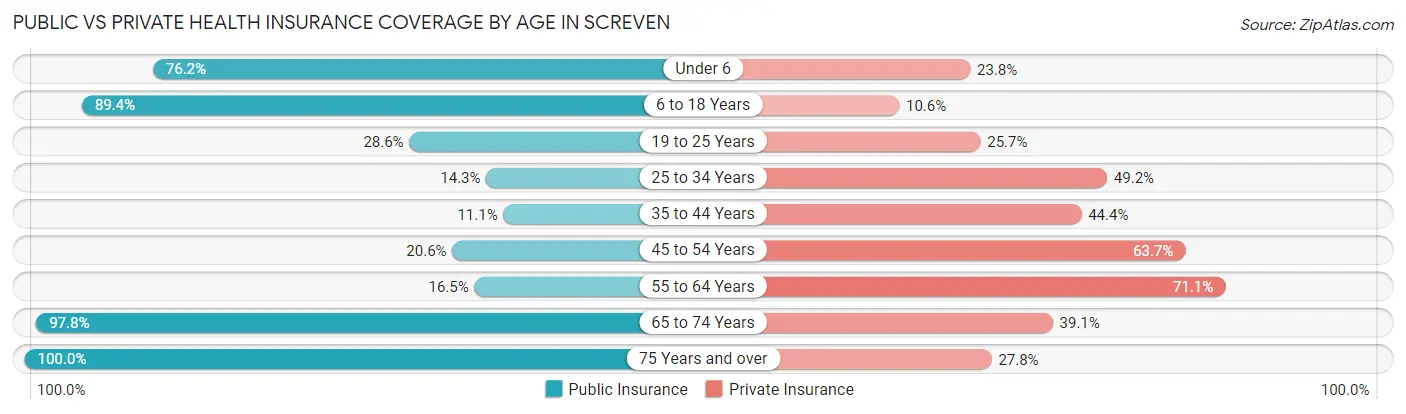
| Age Bracket | Public Insurance | Private Insurance |
| Under 6 | 32 (76.2%) | 10 (23.8%) |
| 6 to 18 Years | 143 (89.4%) | 17 (10.6%) |
| 19 to 25 Years | 10 (28.6%) | 9 (25.7%) |
| 25 to 34 Years | 18 (14.3%) | 62 (49.2%) |
| 35 to 44 Years | 5 (11.1%) | 20 (44.4%) |
| 45 to 54 Years | 21 (20.6%) | 65 (63.7%) |
| 55 to 64 Years | 16 (16.5%) | 69 (71.1%) |
| 65 to 74 Years | 45 (97.8%) | 18 (39.1%) |
| 75 Years and over | 36 (100.0%) | 10 (27.8%) |
| Total | 326 (47.3%) | 280 (40.6%) |
Disability Status by Sex by Age in Screven
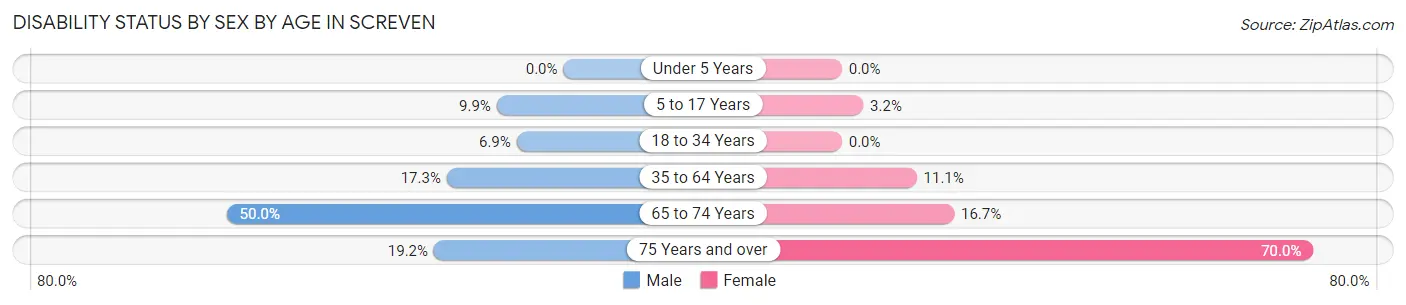
| Age Bracket | Male | Female |
| Under 5 Years | 0 (0.0%) | 0 (0.0%) |
| 5 to 17 Years | 10 (9.9%) | 2 (3.2%) |
| 18 to 34 Years | 5 (6.9%) | 0 (0.0%) |
| 35 to 64 Years | 22 (17.3%) | 13 (11.1%) |
| 65 to 74 Years | 11 (50.0%) | 4 (16.7%) |
| 75 Years and over | 5 (19.2%) | 7 (70.0%) |
Disability Class by Sex by Age in Screven
Disability Class: Hearing Difficulty
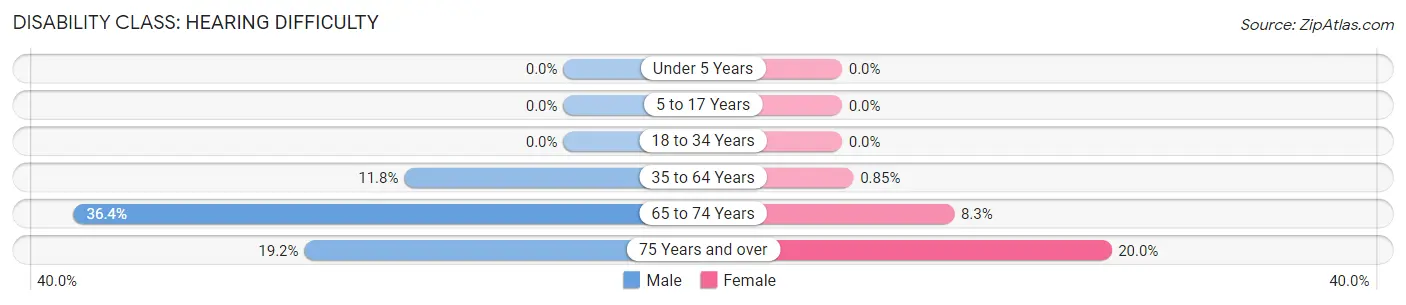
| Age Bracket | Male | Female |
| Under 5 Years | 0 (0.0%) | 0 (0.0%) |
| 5 to 17 Years | 0 (0.0%) | 0 (0.0%) |
| 18 to 34 Years | 0 (0.0%) | 0 (0.0%) |
| 35 to 64 Years | 15 (11.8%) | 1 (0.9%) |
| 65 to 74 Years | 8 (36.4%) | 2 (8.3%) |
| 75 Years and over | 5 (19.2%) | 2 (20.0%) |
Disability Class: Vision Difficulty
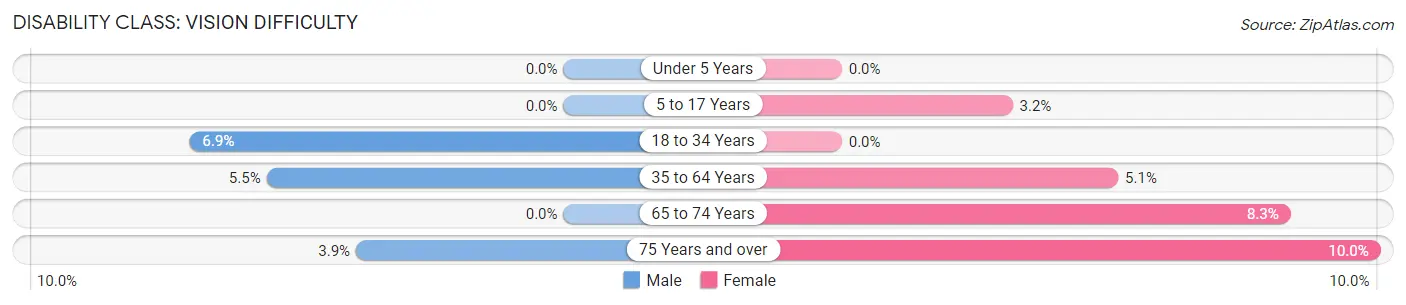
| Age Bracket | Male | Female |
| Under 5 Years | 0 (0.0%) | 0 (0.0%) |
| 5 to 17 Years | 0 (0.0%) | 2 (3.2%) |
| 18 to 34 Years | 5 (6.9%) | 0 (0.0%) |
| 35 to 64 Years | 7 (5.5%) | 6 (5.1%) |
| 65 to 74 Years | 0 (0.0%) | 2 (8.3%) |
| 75 Years and over | 1 (3.8%) | 1 (10.0%) |
Disability Class: Cognitive Difficulty
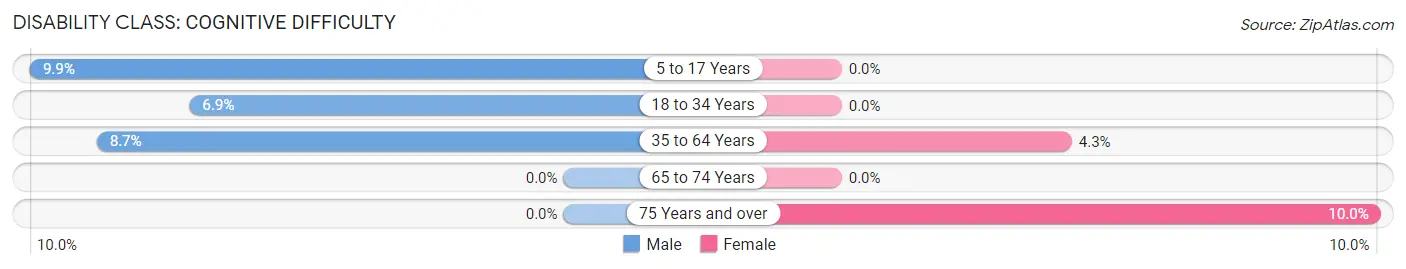
| Age Bracket | Male | Female |
| 5 to 17 Years | 10 (9.9%) | 0 (0.0%) |
| 18 to 34 Years | 5 (6.9%) | 0 (0.0%) |
| 35 to 64 Years | 11 (8.7%) | 5 (4.3%) |
| 65 to 74 Years | 0 (0.0%) | 0 (0.0%) |
| 75 Years and over | 0 (0.0%) | 1 (10.0%) |
Disability Class: Ambulatory Difficulty
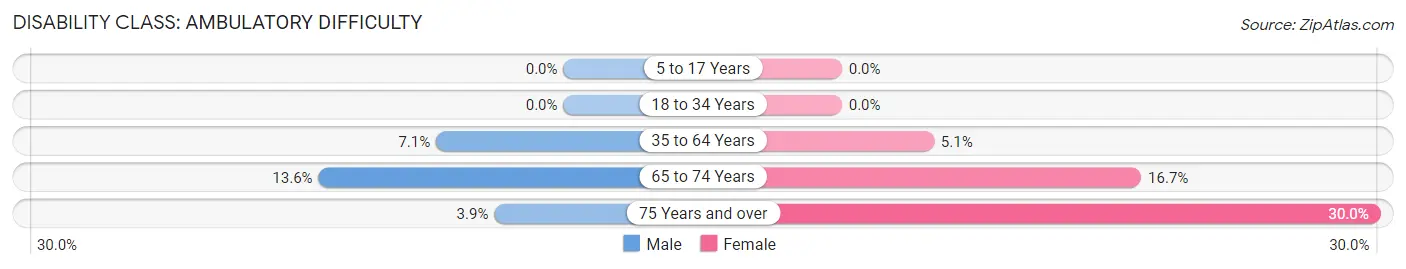
| Age Bracket | Male | Female |
| 5 to 17 Years | 0 (0.0%) | 0 (0.0%) |
| 18 to 34 Years | 0 (0.0%) | 0 (0.0%) |
| 35 to 64 Years | 9 (7.1%) | 6 (5.1%) |
| 65 to 74 Years | 3 (13.6%) | 4 (16.7%) |
| 75 Years and over | 1 (3.8%) | 3 (30.0%) |
Disability Class: Self-Care Difficulty
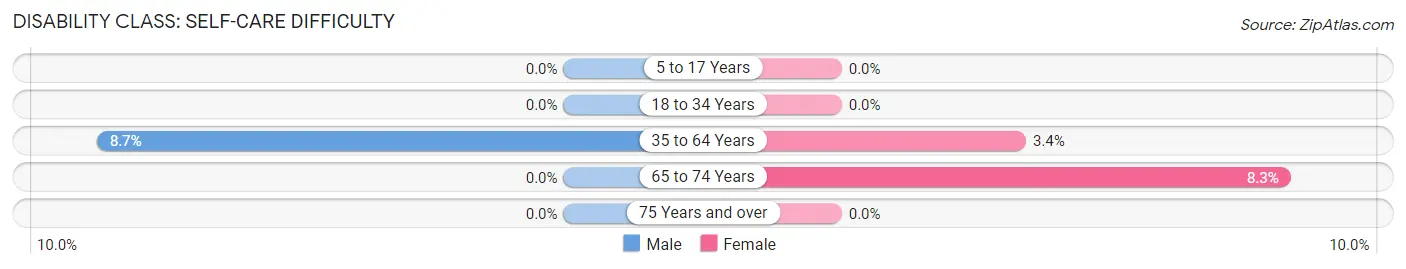
| Age Bracket | Male | Female |
| 5 to 17 Years | 0 (0.0%) | 0 (0.0%) |
| 18 to 34 Years | 0 (0.0%) | 0 (0.0%) |
| 35 to 64 Years | 11 (8.7%) | 4 (3.4%) |
| 65 to 74 Years | 0 (0.0%) | 2 (8.3%) |
| 75 Years and over | 0 (0.0%) | 0 (0.0%) |
Technology Access in Screven
Computing Device Access in Screven
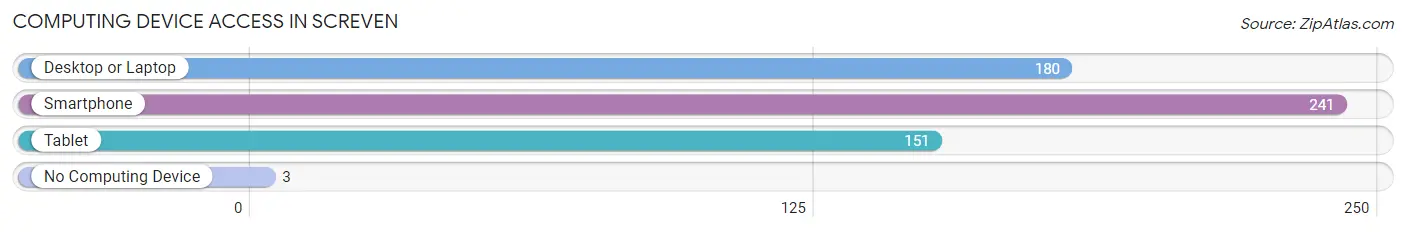
| Device Type | # Households | % Households |
| Desktop or Laptop | 180 | 68.7% |
| Smartphone | 241 | 92.0% |
| Tablet | 151 | 57.6% |
| No Computing Device | 3 | 1.1% |
| Total | 262 | 100.0% |
Internet Access in Screven
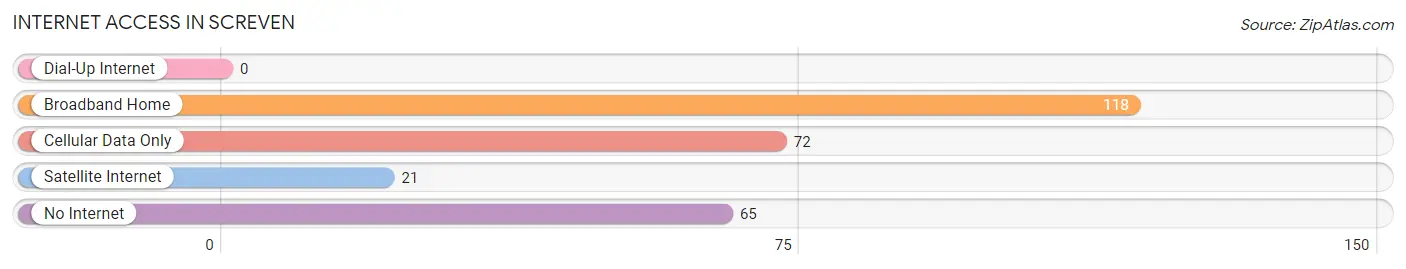
| Internet Type | # Households | % Households |
| Dial-Up Internet | 0 | 0.0% |
| Broadband Home | 118 | 45.0% |
| Cellular Data Only | 72 | 27.5% |
| Satellite Internet | 21 | 8.0% |
| No Internet | 65 | 24.8% |
| Total | 262 | 100.0% |
Screven Summary
Screven is a small city located in the state of Georgia, United States. It is situated in the southeastern part of the state, in the county of Jenkins. The city has a population of 1,845 people, according to the 2010 census.
History
Screven was founded in 1875 by a group of settlers from South Carolina. The city was named after General James Screven, a Revolutionary War hero who fought in the Battle of Kettle Creek. The city was incorporated in 1887 and has since grown to become a small but vibrant community.
Geography
Screven is located in the southeastern part of Georgia, in the county of Jenkins. It is situated at an elevation of approximately 200 feet above sea level. The city is located near the Ogeechee River, which provides a natural border between Georgia and South Carolina. The city is also located near the Savannah River, which provides a natural border between Georgia and South Carolina.
The climate in Screven is humid subtropical, with hot summers and mild winters. The average annual temperature is around 70 degrees Fahrenheit. The average annual precipitation is around 50 inches.
Economy
Screven’s economy is largely based on agriculture and manufacturing. The city is home to several large agricultural operations, including a poultry processing plant, a cotton gin, and a peanut processing plant. The city also has several manufacturing plants, including a paper mill and a furniture factory.
The city also has a thriving tourism industry, with several attractions, including the Ogeechee River, the Savannah River, and the nearby city of Savannah.
Demographics
As of the 2010 census, the population of Screven was 1,845 people. The racial makeup of the city was 79.3% White, 17.2% African American, 0.3% Native American, 0.7% Asian, 0.1% Pacific Islander, and 2.4% from other races. The median household income was $30,938, and the median family income was $37,813.
Screven is a small but vibrant city with a rich history and a diverse economy. The city is home to a variety of businesses and attractions, and its population is diverse and welcoming. Screven is a great place to live, work, and visit.
Common Questions
What is Per Capita Income in Screven?
Per Capita income in Screven is $24,433.
What is the Median Family Income in Screven?
Median Family Income in Screven is $58,958.
What is the Median Household income in Screven?
Median Household Income in Screven is $44,643.
What is Income or Wage Gap in Screven?
Income or Wage Gap in Screven is 52.9%.
Women in Screven earn 47.1 cents for every dollar earned by a man.
What is Inequality or Gini Index in Screven?
Inequality or Gini Index in Screven is 0.47.
What is the Total Population of Screven?
Total Population of Screven is 689.
What is the Total Male Population of Screven?
Total Male Population of Screven is 368.
What is the Total Female Population of Screven?
Total Female Population of Screven is 321.
What is the Ratio of Males per 100 Females in Screven?
There are 114.64 Males per 100 Females in Screven.
What is the Ratio of Females per 100 Males in Screven?
There are 87.23 Females per 100 Males in Screven.
What is the Median Population Age in Screven?
Median Population Age in Screven is 34.5 Years.
What is the Average Family Size in Screven
Average Family Size in Screven is 3.2 People.
What is the Average Household Size in Screven
Average Household Size in Screven is 2.6 People.
How Large is the Labor Force in Screven?
There are 297 People in the Labor Forcein in Screven.
What is the Percentage of People in the Labor Force in Screven?
58.0% of People are in the Labor Force in Screven.
What is the Unemployment Rate in Screven?
Unemployment Rate in Screven is 3.4%.