Poulan, GA Map & Demographics
Poulan Map
Poulan Overview
$25,186
PER CAPITA INCOME
$71,111
AVG FAMILY INCOME
$63,182
AVG HOUSEHOLD INCOME
44.8%
WAGE / INCOME GAP [ % ]
55.2¢/ $1
WAGE / INCOME GAP [ $ ]
0.40
INEQUALITY / GINI INDEX
768
TOTAL POPULATION
376
MALE POPULATION
392
FEMALE POPULATION
95.92
MALES / 100 FEMALES
104.26
FEMALES / 100 MALES
38.1
MEDIAN AGE
3.0
AVG FAMILY SIZE
2.6
AVG HOUSEHOLD SIZE
372
LABOR FORCE [ PEOPLE ]
56.2%
PERCENT IN LABOR FORCE
2.7%
UNEMPLOYMENT RATE
Poulan Zip Codes
Poulan Area Codes
Income in Poulan
Income Overview in Poulan
Per Capita Income in Poulan is $25,186, while median incomes of families and households are $71,111 and $63,182 respectively.
| Characteristic | Number | Measure |
| Per Capita Income | 768 | $25,186 |
| Median Family Income | 222 | $71,111 |
| Mean Family Income | 222 | $73,759 |
| Median Household Income | 294 | $63,182 |
| Mean Household Income | 294 | $62,637 |
| Income Deficit | 222 | $0 |
| Wage / Income Gap (%) | 768 | 44.82% |
| Wage / Income Gap ($) | 768 | 55.18¢ per $1 |
| Gini / Inequality Index | 768 | 0.40 |
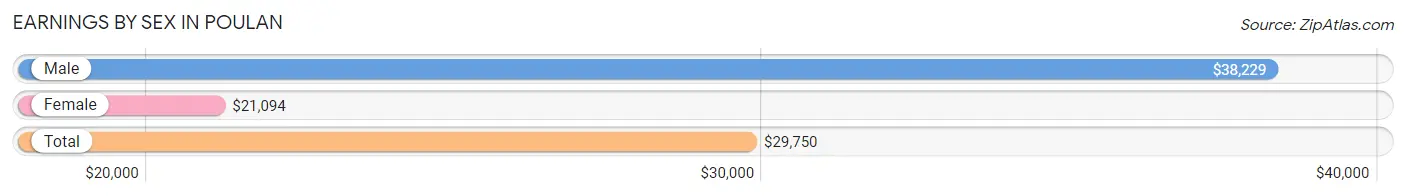
Earnings by Sex in Poulan
Average Earnings in Poulan are $29,750, $38,229 for men and $21,094 for women, a difference of 44.8%.
| Sex | Number | Average Earnings |
| Male | 245 (58.3%) | $38,229 |
| Female | 175 (41.7%) | $21,094 |
| Total | 420 (100.0%) | $29,750 |
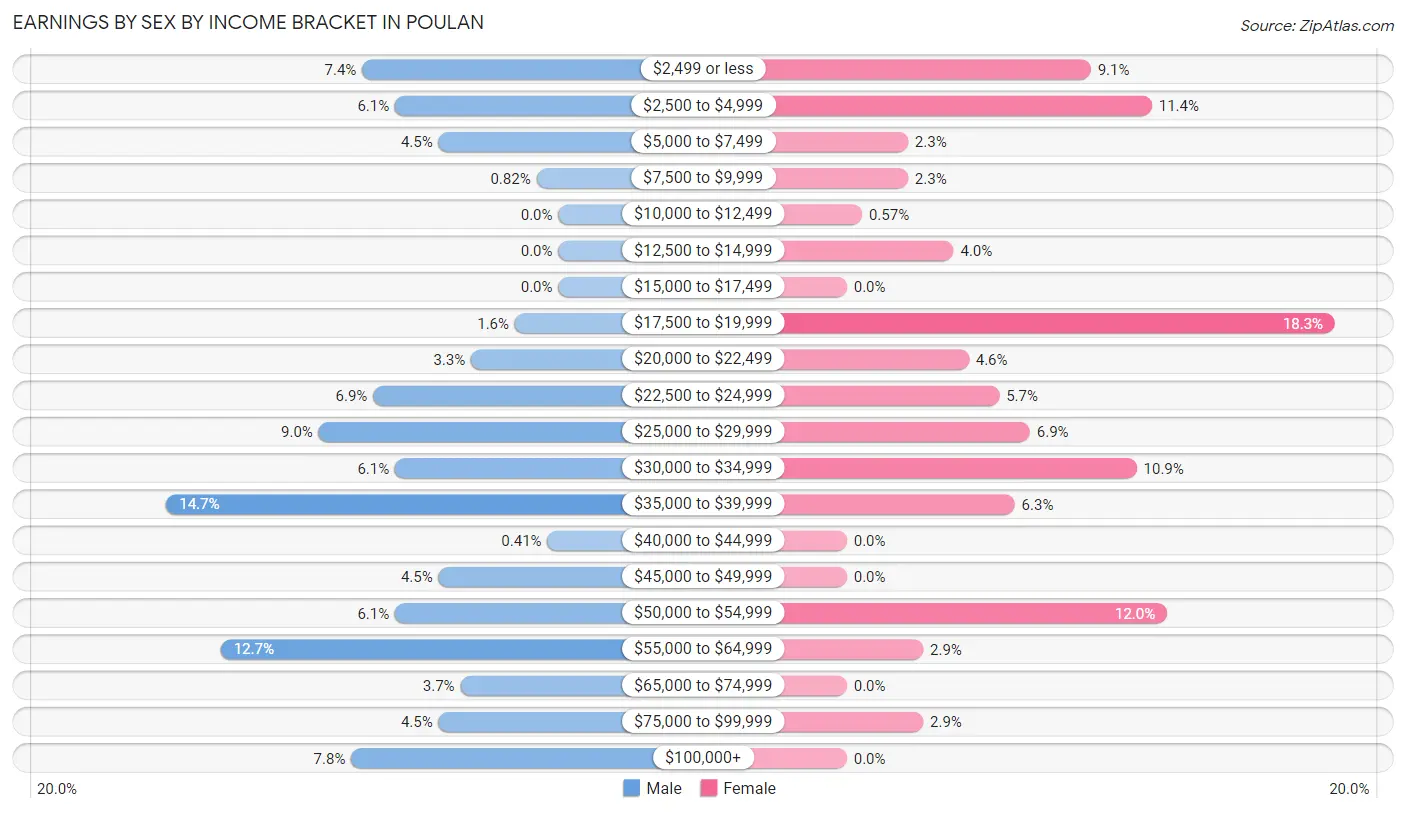
Earnings by Sex by Income Bracket in Poulan
The most common earnings brackets in Poulan are $35,000 to $39,999 for men (36 | 14.7%) and $17,500 to $19,999 for women (32 | 18.3%).
| Income | Male | Female |
| $2,499 or less | 18 (7.3%) | 16 (9.1%) |
| $2,500 to $4,999 | 15 (6.1%) | 20 (11.4%) |
| $5,000 to $7,499 | 11 (4.5%) | 4 (2.3%) |
| $7,500 to $9,999 | 2 (0.8%) | 4 (2.3%) |
| $10,000 to $12,499 | 0 (0.0%) | 1 (0.6%) |
| $12,500 to $14,999 | 0 (0.0%) | 7 (4.0%) |
| $15,000 to $17,499 | 0 (0.0%) | 0 (0.0%) |
| $17,500 to $19,999 | 4 (1.6%) | 32 (18.3%) |
| $20,000 to $22,499 | 8 (3.3%) | 8 (4.6%) |
| $22,500 to $24,999 | 17 (6.9%) | 10 (5.7%) |
| $25,000 to $29,999 | 22 (9.0%) | 12 (6.9%) |
| $30,000 to $34,999 | 15 (6.1%) | 19 (10.9%) |
| $35,000 to $39,999 | 36 (14.7%) | 11 (6.3%) |
| $40,000 to $44,999 | 1 (0.4%) | 0 (0.0%) |
| $45,000 to $49,999 | 11 (4.5%) | 0 (0.0%) |
| $50,000 to $54,999 | 15 (6.1%) | 21 (12.0%) |
| $55,000 to $64,999 | 31 (12.7%) | 5 (2.9%) |
| $65,000 to $74,999 | 9 (3.7%) | 0 (0.0%) |
| $75,000 to $99,999 | 11 (4.5%) | 5 (2.9%) |
| $100,000+ | 19 (7.8%) | 0 (0.0%) |
| Total | 245 (100.0%) | 175 (100.0%) |
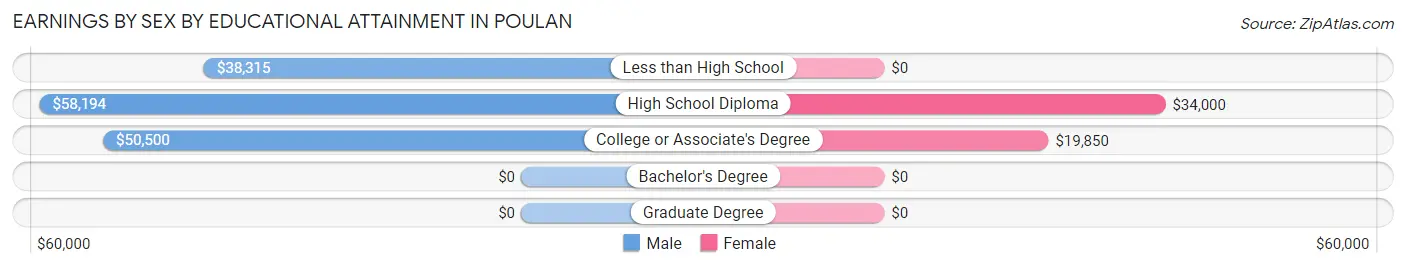
Earnings by Sex by Educational Attainment in Poulan
Average earnings in Poulan are $39,471 for men and $23,750 for women, a difference of 39.8%. Men with an educational attainment of high school diploma enjoy the highest average annual earnings of $58,194, while those with less than high school education earn the least with $38,315. Women with an educational attainment of high school diploma earn the most with the average annual earnings of $34,000, while those with college or associate's degree education have the smallest earnings of $19,850.
| Educational Attainment | Male Income | Female Income |
| Less than High School | $38,315 | $0 |
| High School Diploma | $58,194 | $34,000 |
| College or Associate's Degree | $50,500 | $19,850 |
| Bachelor's Degree | - | - |
| Graduate Degree | - | - |
| Total | $39,471 | $23,750 |
Family Income in Poulan
Family Income Brackets in Poulan
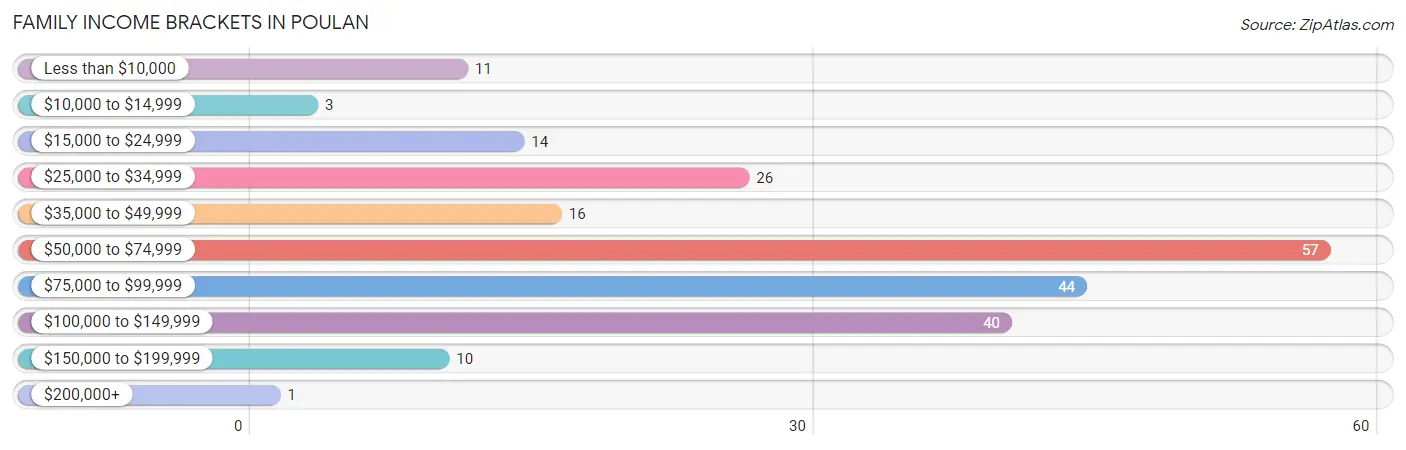
According to the Poulan family income data, there are 57 families falling into the $50,000 to $74,999 income range, which is the most common income bracket and makes up 25.7% of all families. Conversely, the $200,000+ income bracket is the least frequent group with only 1 families (0.4%) belonging to this category.
| Income Bracket | # Families | % Families |
| Less than $10,000 | 11 | 5.0% |
| $10,000 to $14,999 | 3 | 1.4% |
| $15,000 to $24,999 | 14 | 6.3% |
| $25,000 to $34,999 | 26 | 11.7% |
| $35,000 to $49,999 | 16 | 7.2% |
| $50,000 to $74,999 | 57 | 25.7% |
| $75,000 to $99,999 | 44 | 19.8% |
| $100,000 to $149,999 | 40 | 18.0% |
| $150,000 to $199,999 | 10 | 4.5% |
| $200,000+ | 1 | 0.5% |
Family Income by Famaliy Size in Poulan
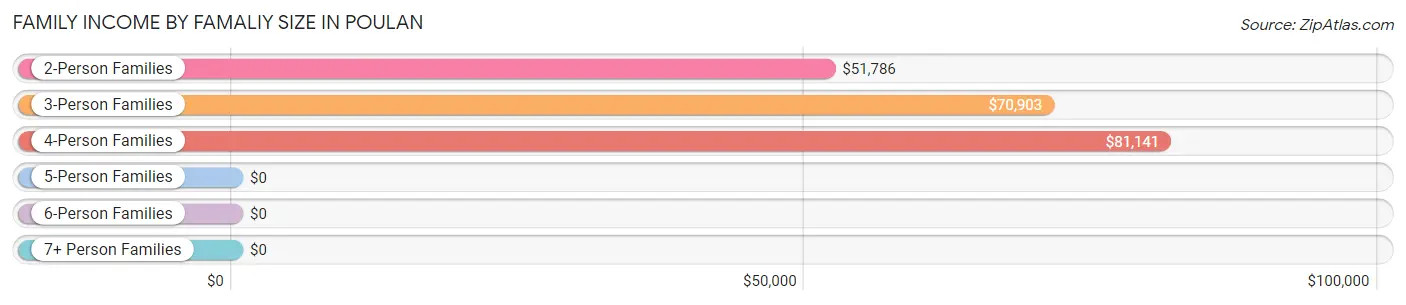
4-person families (65 | 29.3%) account for the highest median family income in Poulan with $81,141 per family, while 2-person families (90 | 40.5%) have the highest median income of $25,893 per family member.
| Income Bracket | # Families | Median Income |
| 2-Person Families | 90 (40.5%) | $51,786 |
| 3-Person Families | 55 (24.8%) | $70,903 |
| 4-Person Families | 65 (29.3%) | $81,141 |
| 5-Person Families | 8 (3.6%) | $0 |
| 6-Person Families | 4 (1.8%) | $0 |
| 7+ Person Families | 0 (0.0%) | $0 |
| Total | 222 (100.0%) | $71,111 |
Family Income by Number of Earners in Poulan
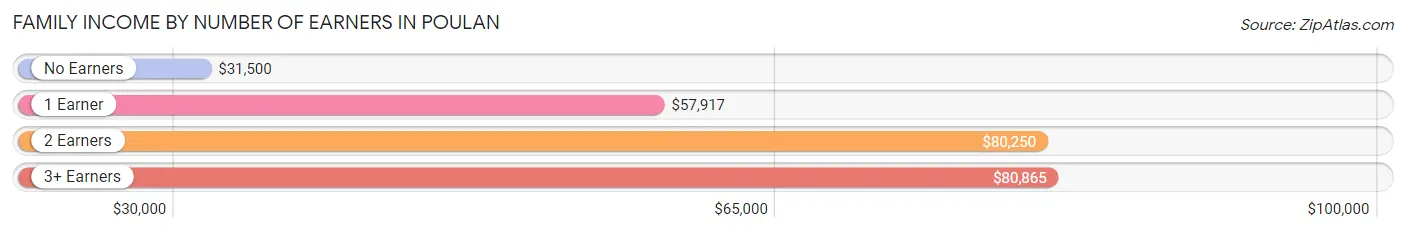
The median family income in Poulan is $71,111, with families comprising 3+ earners (47) having the highest median family income of $80,865, while families with no earners (42) have the lowest median family income of $31,500, accounting for 21.2% and 18.9% of families, respectively.
| Number of Earners | # Families | Median Income |
| No Earners | 42 (18.9%) | $31,500 |
| 1 Earner | 39 (17.6%) | $57,917 |
| 2 Earners | 94 (42.3%) | $80,250 |
| 3+ Earners | 47 (21.2%) | $80,865 |
| Total | 222 (100.0%) | $71,111 |
Household Income in Poulan
Household Income Brackets in Poulan
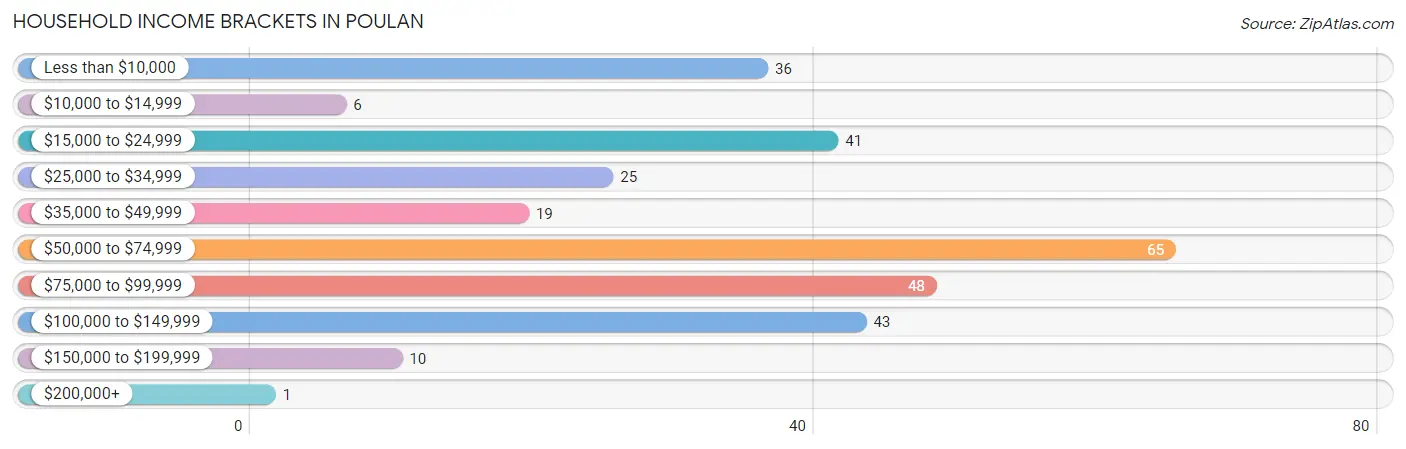
With 65 households falling in the category, the $50,000 to $74,999 income range is the most frequent in Poulan, accounting for 22.1% of all households. In contrast, only 1 households (0.3%) fall into the $200,000+ income bracket, making it the least populous group.
| Income Bracket | # Households | % Households |
| Less than $10,000 | 36 | 12.2% |
| $10,000 to $14,999 | 6 | 2.0% |
| $15,000 to $24,999 | 41 | 13.9% |
| $25,000 to $34,999 | 25 | 8.5% |
| $35,000 to $49,999 | 19 | 6.5% |
| $50,000 to $74,999 | 65 | 22.1% |
| $75,000 to $99,999 | 48 | 16.3% |
| $100,000 to $149,999 | 43 | 14.6% |
| $150,000 to $199,999 | 10 | 3.4% |
| $200,000+ | 1 | 0.3% |
Household Income by Householder Age in Poulan
The median household income in Poulan is $63,182, with the highest median household income of $101,875 found in the 45 to 64 years age bracket for the primary householder. A total of 64 households (21.8%) fall into this category. Meanwhile, the 15 to 24 years age bracket for the primary householder has the lowest median household income of $0, with 6 households (2.0%) in this group.
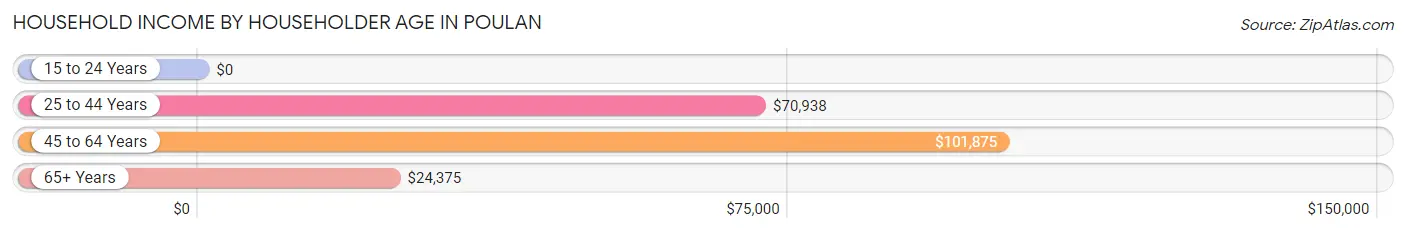
| Income Bracket | # Households | Median Income |
| 15 to 24 Years | 6 (2.0%) | $0 |
| 25 to 44 Years | 110 (37.4%) | $70,938 |
| 45 to 64 Years | 64 (21.8%) | $101,875 |
| 65+ Years | 114 (38.8%) | $24,375 |
| Total | 294 (100.0%) | $63,182 |
Poverty in Poulan
Income Below Poverty by Sex and Age in Poulan
With 22.3% poverty level for males and 13.0% for females among the residents of Poulan, 5 year old males and 65 to 74 year old females are the most vulnerable to poverty, with 1 males (100.0%) and 19 females (30.6%) in their respective age groups living below the poverty level.
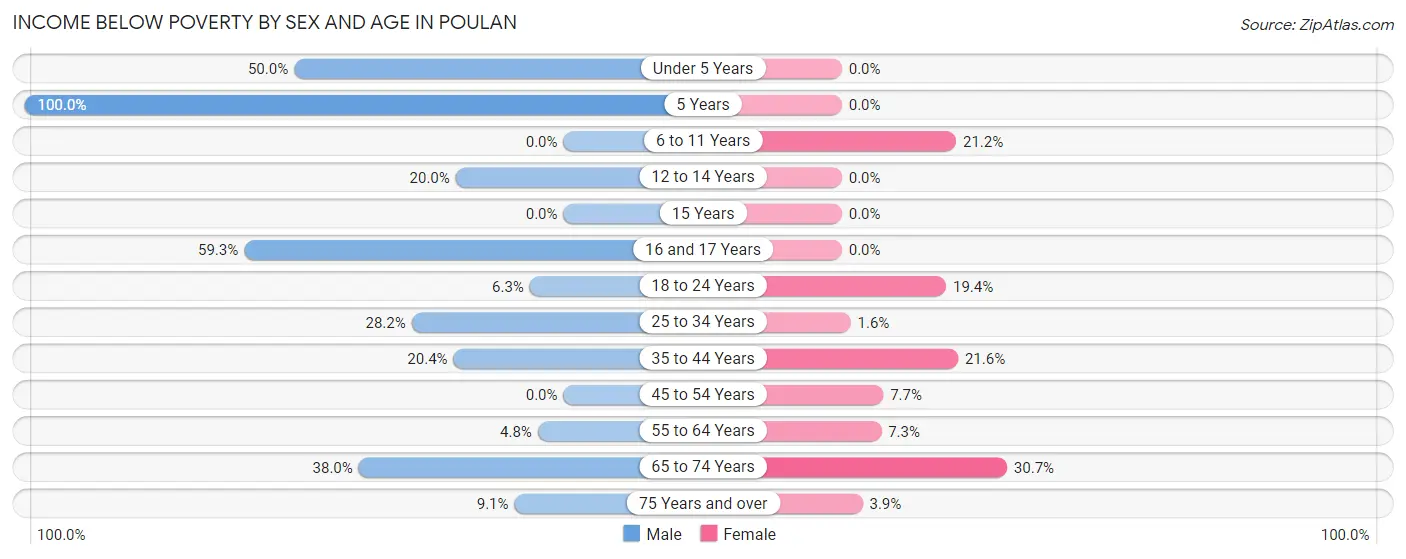
| Age Bracket | Male | Female |
| Under 5 Years | 10 (50.0%) | 0 (0.0%) |
| 5 Years | 1 (100.0%) | 0 (0.0%) |
| 6 to 11 Years | 0 (0.0%) | 7 (21.2%) |
| 12 to 14 Years | 1 (20.0%) | 0 (0.0%) |
| 15 Years | 0 (0.0%) | 0 (0.0%) |
| 16 and 17 Years | 16 (59.3%) | 0 (0.0%) |
| 18 to 24 Years | 3 (6.2%) | 6 (19.4%) |
| 25 to 34 Years | 20 (28.2%) | 1 (1.6%) |
| 35 to 44 Years | 10 (20.4%) | 11 (21.6%) |
| 45 to 54 Years | 0 (0.0%) | 2 (7.7%) |
| 55 to 64 Years | 2 (4.8%) | 3 (7.3%) |
| 65 to 74 Years | 19 (38.0%) | 19 (30.6%) |
| 75 Years and over | 2 (9.1%) | 2 (3.8%) |
| Total | 84 (22.3%) | 51 (13.0%) |
Income Above Poverty by Sex and Age in Poulan
According to the poverty statistics in Poulan, males aged 6 to 11 years and females aged under 5 years are the age groups that are most secure financially, with 100.0% of males and 100.0% of females in these age groups living above the poverty line.
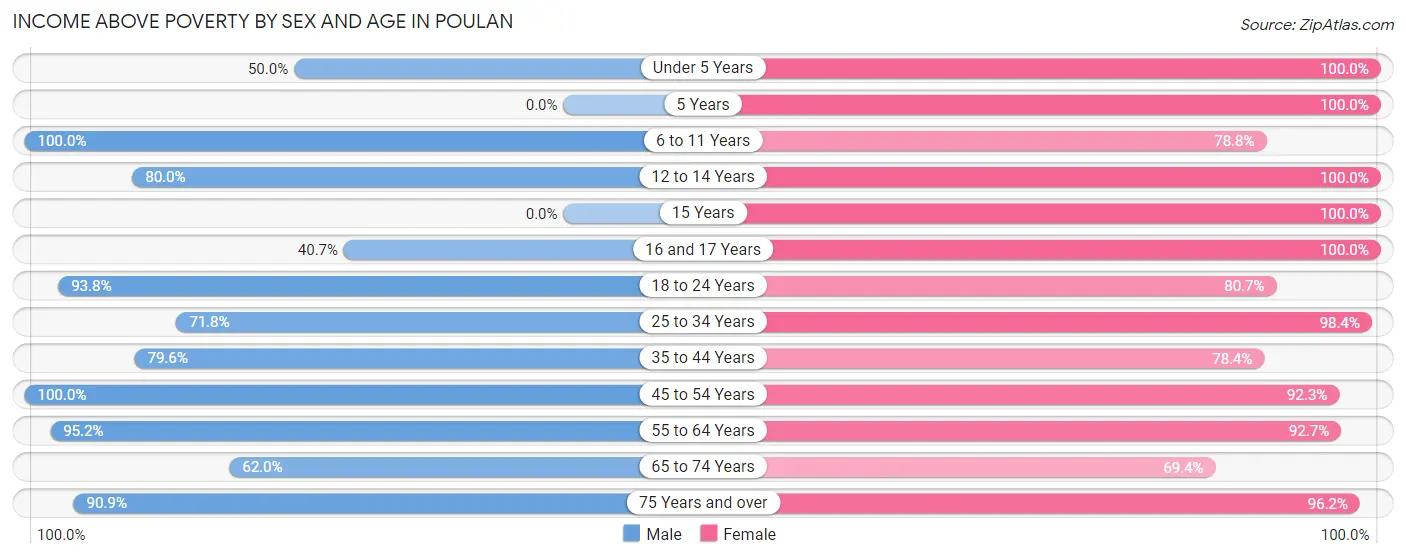
| Age Bracket | Male | Female |
| Under 5 Years | 10 (50.0%) | 13 (100.0%) |
| 5 Years | 0 (0.0%) | 6 (100.0%) |
| 6 to 11 Years | 20 (100.0%) | 26 (78.8%) |
| 12 to 14 Years | 4 (80.0%) | 4 (100.0%) |
| 15 Years | 0 (0.0%) | 4 (100.0%) |
| 16 and 17 Years | 11 (40.7%) | 8 (100.0%) |
| 18 to 24 Years | 45 (93.8%) | 25 (80.6%) |
| 25 to 34 Years | 51 (71.8%) | 60 (98.4%) |
| 35 to 44 Years | 39 (79.6%) | 40 (78.4%) |
| 45 to 54 Years | 21 (100.0%) | 24 (92.3%) |
| 55 to 64 Years | 40 (95.2%) | 38 (92.7%) |
| 65 to 74 Years | 31 (62.0%) | 43 (69.4%) |
| 75 Years and over | 20 (90.9%) | 50 (96.2%) |
| Total | 292 (77.7%) | 341 (87.0%) |
Income Below Poverty Among Married-Couple Families in Poulan
The poverty statistics for married-couple families in Poulan show that 16.5% or 29 of the total 176 families live below the poverty line. Families with 1 or 2 children have the highest poverty rate of 25.9%, comprising of 22 families. On the other hand, families with 3 or 4 children have the lowest poverty rate of 0.0%, which includes 0 families.
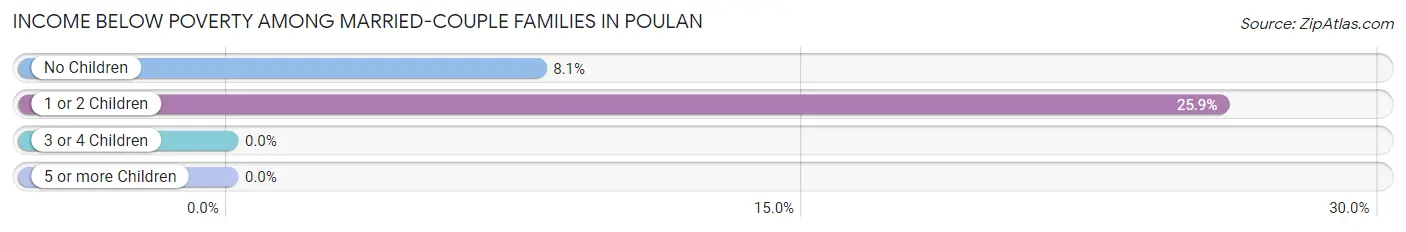
| Children | Above Poverty | Below Poverty |
| No Children | 80 (91.9%) | 7 (8.1%) |
| 1 or 2 Children | 63 (74.1%) | 22 (25.9%) |
| 3 or 4 Children | 4 (100.0%) | 0 (0.0%) |
| 5 or more Children | 0 (0.0%) | 0 (0.0%) |
| Total | 147 (83.5%) | 29 (16.5%) |
Income Below Poverty Among Single-Parent Households in Poulan
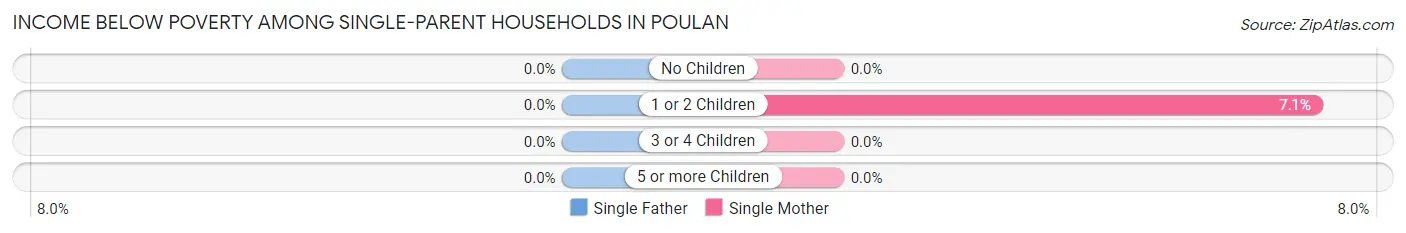
| Children | Single Father | Single Mother |
| No Children | 0 (0.0%) | 0 (0.0%) |
| 1 or 2 Children | 0 (0.0%) | 1 (7.1%) |
| 3 or 4 Children | 0 (0.0%) | 0 (0.0%) |
| 5 or more Children | 0 (0.0%) | 0 (0.0%) |
| Total | 0 (0.0%) | 1 (4.3%) |
Income Below Poverty Among Married-Couple vs Single-Parent Households in Poulan
The poverty data for Poulan shows that 29 of the married-couple family households (16.5%) and 1 of the single-parent households (2.2%) are living below the poverty level. Within the married-couple family households, those with 1 or 2 children have the highest poverty rate, with 22 households (25.9%) falling below the poverty line. Among the single-parent households, those with 1 or 2 children have the highest poverty rate, with 1 household (6.2%) living below poverty.
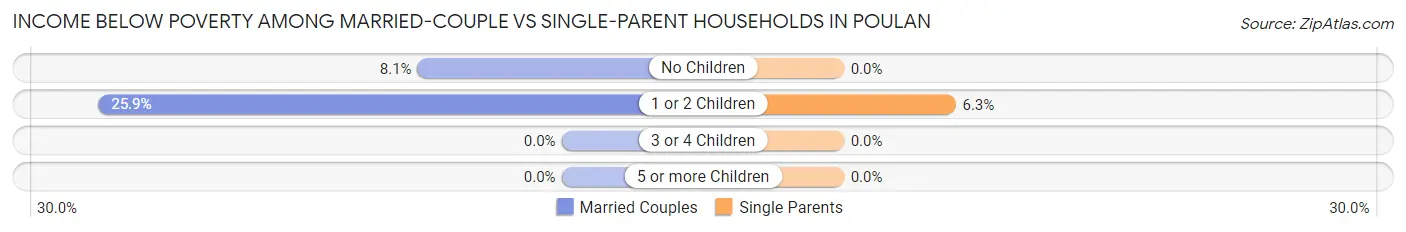
| Children | Married-Couple Families | Single-Parent Households |
| No Children | 7 (8.1%) | 0 (0.0%) |
| 1 or 2 Children | 22 (25.9%) | 1 (6.2%) |
| 3 or 4 Children | 0 (0.0%) | 0 (0.0%) |
| 5 or more Children | 0 (0.0%) | 0 (0.0%) |
| Total | 29 (16.5%) | 1 (2.2%) |
Race in Poulan
The most populous races in Poulan are White / Caucasian (669 | 87.1%), Black / African American (83 | 10.8%), and Two or more Races (14 | 1.8%).
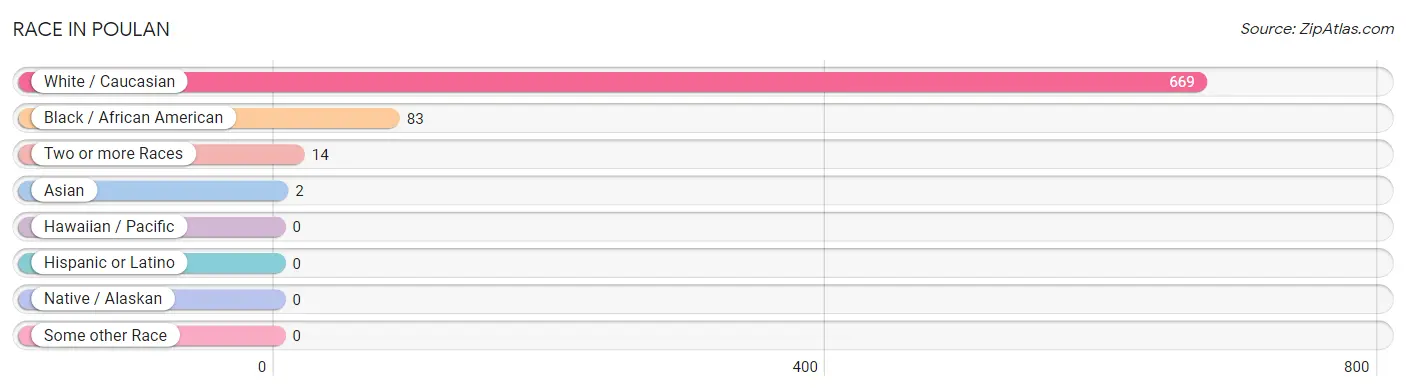
| Race | # Population | % Population |
| Asian | 2 | 0.3% |
| Black / African American | 83 | 10.8% |
| Hawaiian / Pacific | 0 | 0.0% |
| Hispanic or Latino | 0 | 0.0% |
| Native / Alaskan | 0 | 0.0% |
| White / Caucasian | 669 | 87.1% |
| Two or more Races | 14 | 1.8% |
| Some other Race | 0 | 0.0% |
| Total | 768 | 100.0% |
Ancestry in Poulan
The most populous ancestries reported in Poulan are American (162 | 21.1%), Irish (73 | 9.5%), English (68 | 8.8%), German (22 | 2.9%), and Scotch-Irish (19 | 2.5%), together accounting for 44.8% of all Poulan residents.
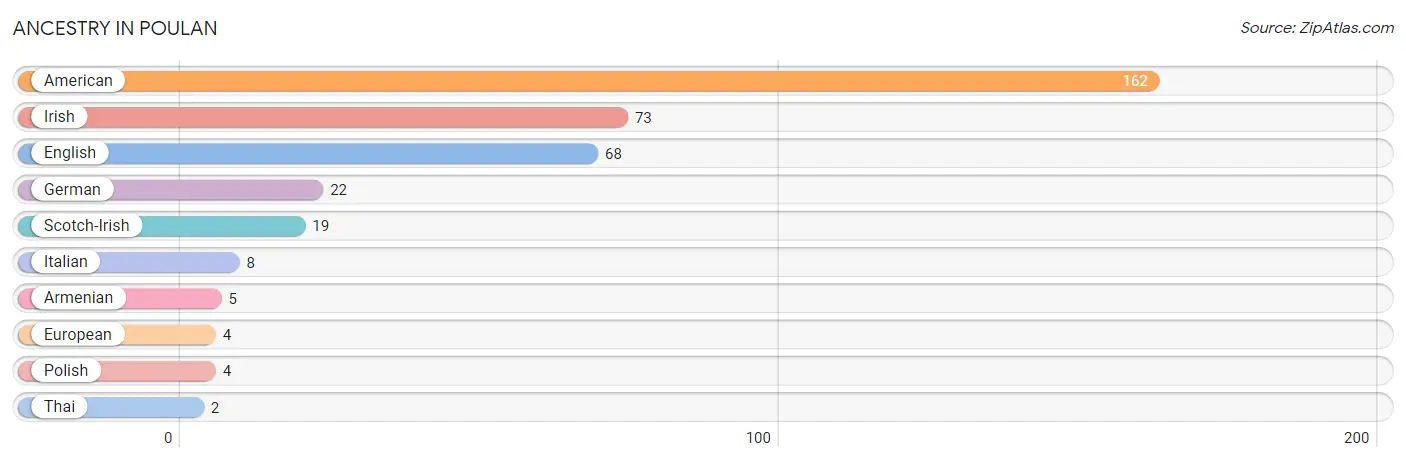
| Ancestry | # Population | % Population |
| American | 162 | 21.1% |
| Armenian | 5 | 0.6% |
| English | 68 | 8.8% |
| European | 4 | 0.5% |
| German | 22 | 2.9% |
| Irish | 73 | 9.5% |
| Italian | 8 | 1.0% |
| Polish | 4 | 0.5% |
| Scotch-Irish | 19 | 2.5% |
| Thai | 2 | 0.3% | View All 10 Rows |
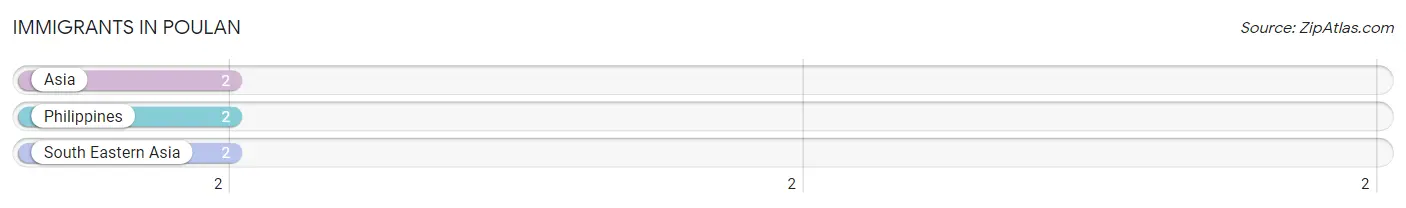
Immigrants in Poulan
The most numerous immigrant groups reported in Poulan came from Asia (2 | 0.3%), Philippines (2 | 0.3%), and South Eastern Asia (2 | 0.3%), together accounting for 0.8% of all Poulan residents.
| Immigration Origin | # Population | % Population |
| Asia | 2 | 0.3% |
| Philippines | 2 | 0.3% |
| South Eastern Asia | 2 | 0.3% | View All 3 Rows |
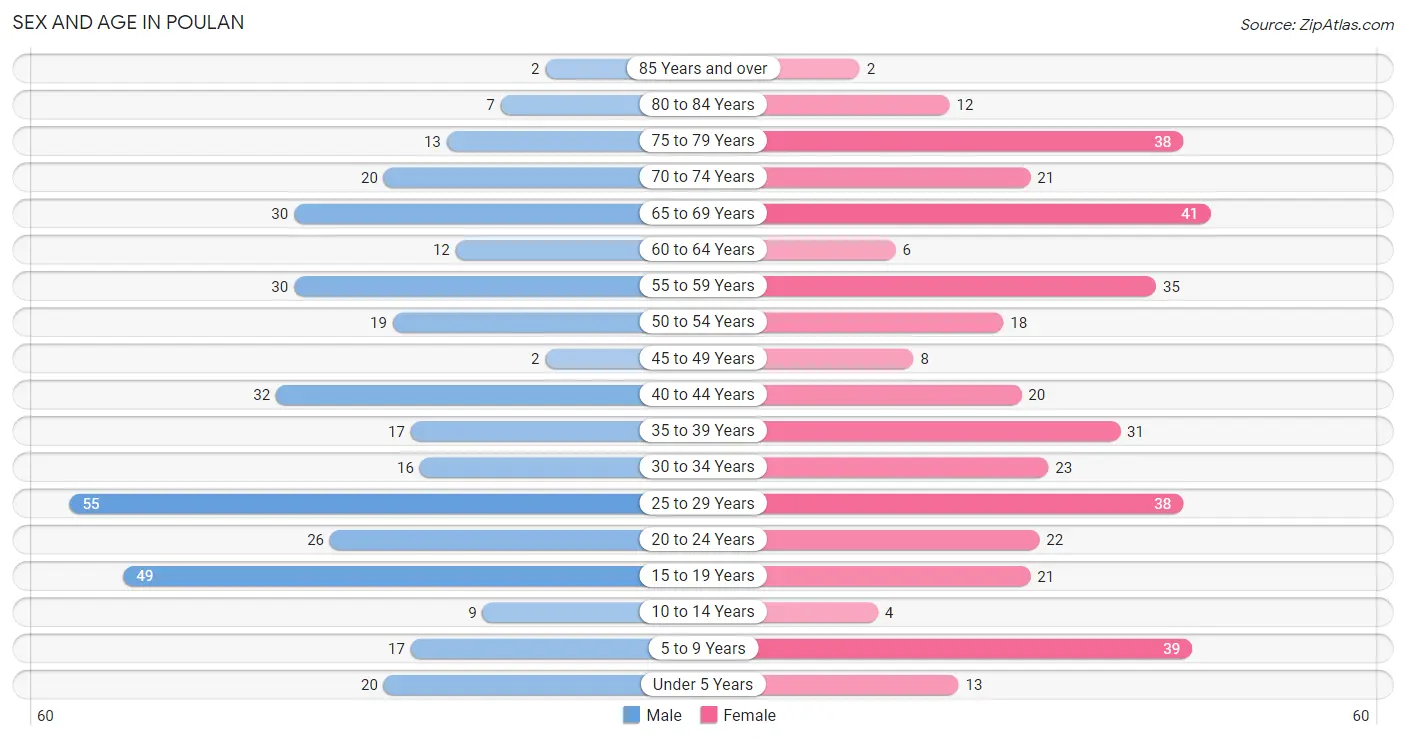
Sex and Age in Poulan
Sex and Age in Poulan
The most populous age groups in Poulan are 25 to 29 Years (55 | 14.6%) for men and 65 to 69 Years (41 | 10.5%) for women.
| Age Bracket | Male | Female |
| Under 5 Years | 20 (5.3%) | 13 (3.3%) |
| 5 to 9 Years | 17 (4.5%) | 39 (10.0%) |
| 10 to 14 Years | 9 (2.4%) | 4 (1.0%) |
| 15 to 19 Years | 49 (13.0%) | 21 (5.4%) |
| 20 to 24 Years | 26 (6.9%) | 22 (5.6%) |
| 25 to 29 Years | 55 (14.6%) | 38 (9.7%) |
| 30 to 34 Years | 16 (4.3%) | 23 (5.9%) |
| 35 to 39 Years | 17 (4.5%) | 31 (7.9%) |
| 40 to 44 Years | 32 (8.5%) | 20 (5.1%) |
| 45 to 49 Years | 2 (0.5%) | 8 (2.0%) |
| 50 to 54 Years | 19 (5.1%) | 18 (4.6%) |
| 55 to 59 Years | 30 (8.0%) | 35 (8.9%) |
| 60 to 64 Years | 12 (3.2%) | 6 (1.5%) |
| 65 to 69 Years | 30 (8.0%) | 41 (10.5%) |
| 70 to 74 Years | 20 (5.3%) | 21 (5.4%) |
| 75 to 79 Years | 13 (3.5%) | 38 (9.7%) |
| 80 to 84 Years | 7 (1.9%) | 12 (3.1%) |
| 85 Years and over | 2 (0.5%) | 2 (0.5%) |
| Total | 376 (100.0%) | 392 (100.0%) |
Families and Households in Poulan
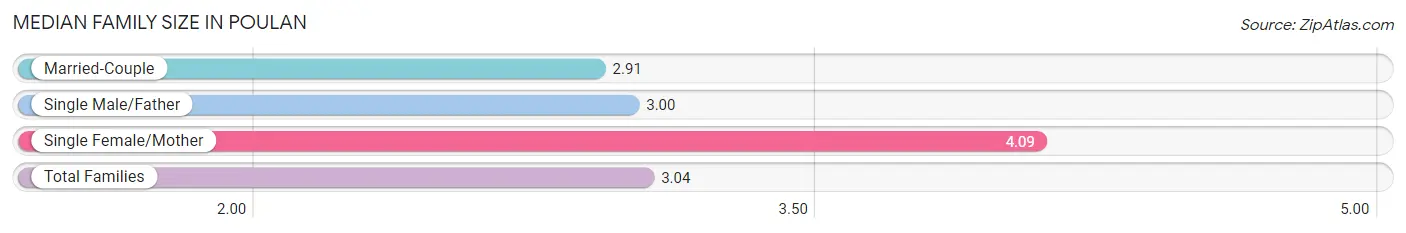
Median Family Size in Poulan
The median family size in Poulan is 3.04 persons per family, with single female/mother families (23 | 10.4%) accounting for the largest median family size of 4.09 persons per family. On the other hand, married-couple families (176 | 79.3%) represent the smallest median family size with 2.91 persons per family.
| Family Type | # Families | Family Size |
| Married-Couple | 176 (79.3%) | 2.91 |
| Single Male/Father | 23 (10.4%) | 3.00 |
| Single Female/Mother | 23 (10.4%) | 4.09 |
| Total Families | 222 (100.0%) | 3.04 |
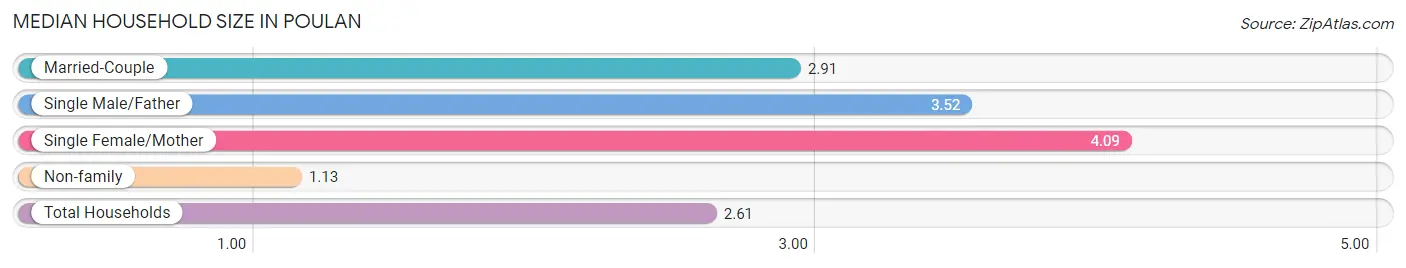
Median Household Size in Poulan
The median household size in Poulan is 2.61 persons per household, with single female/mother households (23 | 7.8%) accounting for the largest median household size of 4.09 persons per household. non-family households (72 | 24.5%) represent the smallest median household size with 1.13 persons per household.
| Household Type | # Households | Household Size |
| Married-Couple | 176 (59.9%) | 2.91 |
| Single Male/Father | 23 (7.8%) | 3.52 |
| Single Female/Mother | 23 (7.8%) | 4.09 |
| Non-family | 72 (24.5%) | 1.13 |
| Total Households | 294 (100.0%) | 2.61 |
Household Size by Marriage Status in Poulan
Out of a total of 294 households in Poulan, 222 (75.5%) are family households, while 72 (24.5%) are nonfamily households. The most numerous type of family households are 2-person households, comprising 84, and the most common type of nonfamily households are 1-person households, comprising 65.
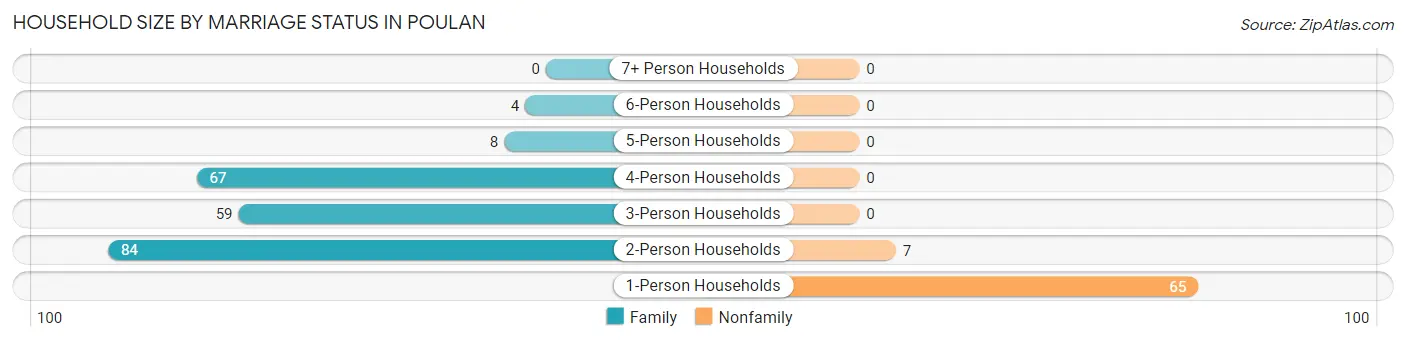
| Household Size | Family Households | Nonfamily Households |
| 1-Person Households | - | 65 (22.1%) |
| 2-Person Households | 84 (28.6%) | 7 (2.4%) |
| 3-Person Households | 59 (20.1%) | 0 (0.0%) |
| 4-Person Households | 67 (22.8%) | 0 (0.0%) |
| 5-Person Households | 8 (2.7%) | 0 (0.0%) |
| 6-Person Households | 4 (1.4%) | 0 (0.0%) |
| 7+ Person Households | 0 (0.0%) | 0 (0.0%) |
| Total | 222 (75.5%) | 72 (24.5%) |
Female Fertility in Poulan
Fertility by Age in Poulan
Average fertility rate in Poulan is 18.0 births per 1,000 women. Women in the age bracket of 20 to 34 years have the highest fertility rate with 36.0 births per 1,000 women. Women in the age bracket of 20 to 34 years acount for 100.0% of all women with births.
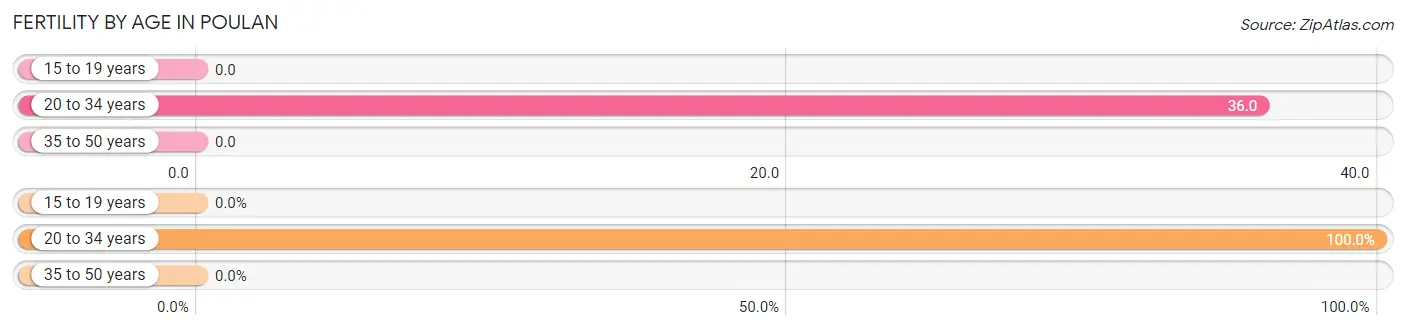
| Age Bracket | Women with Births | Births / 1,000 Women |
| 15 to 19 years | 0 (0.0%) | 0.0 |
| 20 to 34 years | 3 (100.0%) | 36.0 |
| 35 to 50 years | 0 (0.0%) | 0.0 |
| Total | 3 (100.0%) | 18.0 |
Fertility by Age by Marriage Status in Poulan
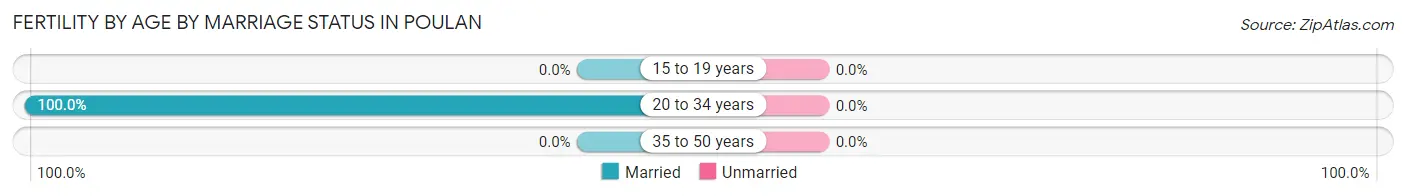
| Age Bracket | Married | Unmarried |
| 15 to 19 years | 0 (0.0%) | 0 (0.0%) |
| 20 to 34 years | 3 (100.0%) | 0 (0.0%) |
| 35 to 50 years | 0 (0.0%) | 0 (0.0%) |
| Total | 3 (100.0%) | 0 (0.0%) |
Fertility by Education in Poulan
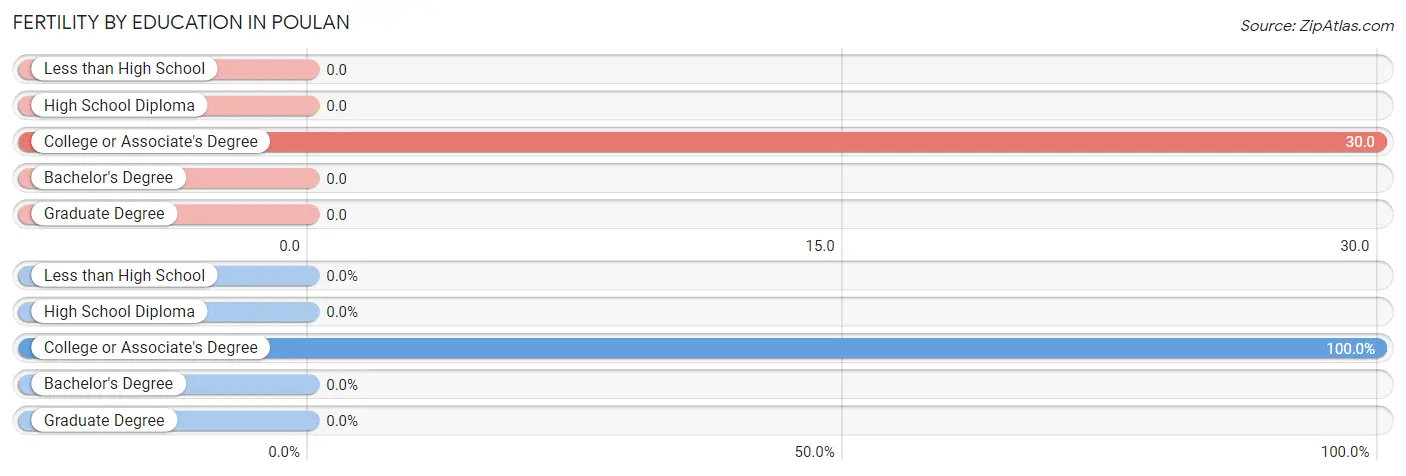
| Educational Attainment | Women with Births | Births / 1,000 Women |
| Less than High School | 0 (0.0%) | 0.0 |
| High School Diploma | 0 (0.0%) | 0.0 |
| College or Associate's Degree | 3 (100.0%) | 30.0 |
| Bachelor's Degree | 0 (0.0%) | 0.0 |
| Graduate Degree | 0 (0.0%) | 0.0 |
| Total | 3 (100.0%) | 18.0 |
Fertility by Education by Marriage Status in Poulan
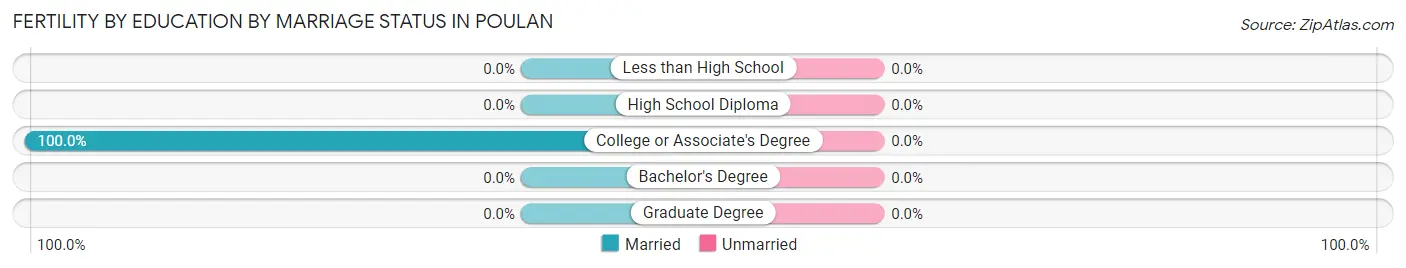
| Educational Attainment | Married | Unmarried |
| Less than High School | 0 (0.0%) | 0 (0.0%) |
| High School Diploma | 0 (0.0%) | 0 (0.0%) |
| College or Associate's Degree | 3 (100.0%) | 0 (0.0%) |
| Bachelor's Degree | 0 (0.0%) | 0 (0.0%) |
| Graduate Degree | 0 (0.0%) | 0 (0.0%) |
| Total | 3 (100.0%) | 0 (0.0%) |
Employment Characteristics in Poulan
Employment by Class of Employer in Poulan
Among the 362 employed individuals in Poulan, private company employees (242 | 66.8%), local government employees (36 | 9.9%), and state government employees (26 | 7.2%) make up the most common classes of employment.
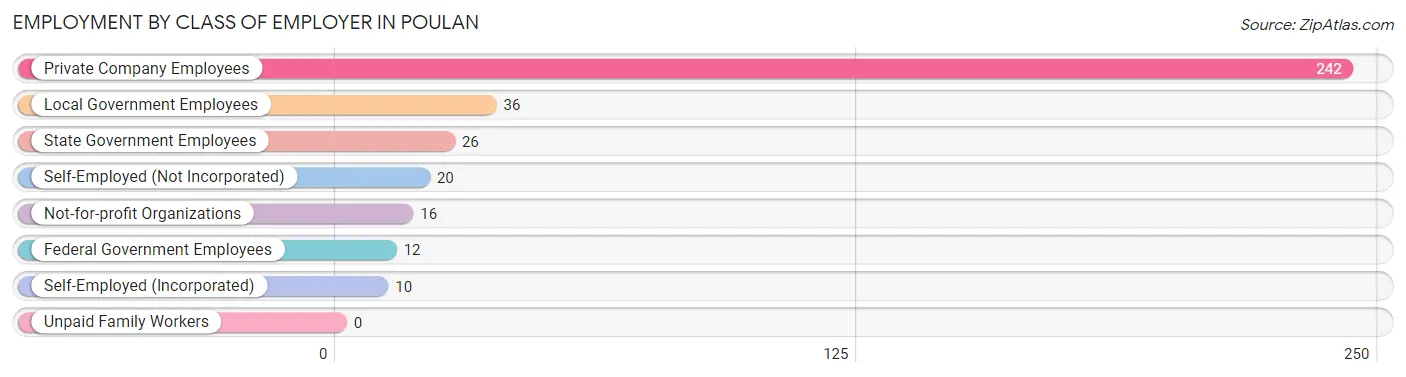
| Employer Class | # Employees | % Employees |
| Private Company Employees | 242 | 66.8% |
| Self-Employed (Incorporated) | 10 | 2.8% |
| Self-Employed (Not Incorporated) | 20 | 5.5% |
| Not-for-profit Organizations | 16 | 4.4% |
| Local Government Employees | 36 | 9.9% |
| State Government Employees | 26 | 7.2% |
| Federal Government Employees | 12 | 3.3% |
| Unpaid Family Workers | 0 | 0.0% |
| Total | 362 | 100.0% |
Employment Status by Age in Poulan
According to the labor force statistics for Poulan, out of the total population over 16 years of age (662), 56.2% or 372 individuals are in the labor force, with 2.7% or 10 of them unemployed. The age group with the highest labor force participation rate is 30 to 34 years, with 92.3% or 36 individuals in the labor force. Within the labor force, the 45 to 54 years age range has the highest percentage of unemployed individuals, with 14.3% or 6 of them being unemployed.
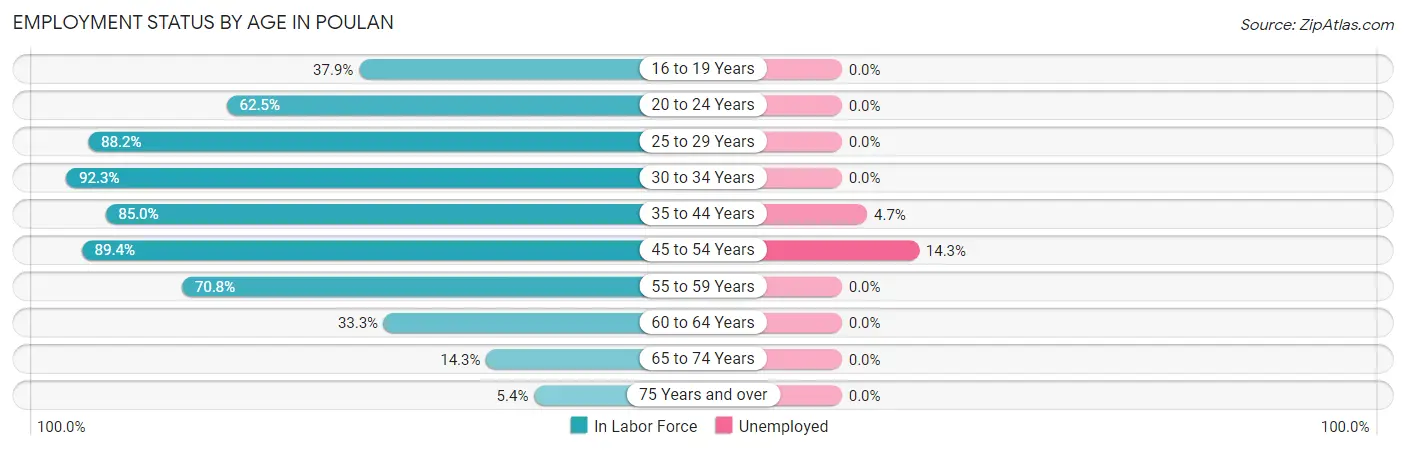
| Age Bracket | In Labor Force | Unemployed |
| 16 to 19 Years | 25 (37.9%) | 0 (0.0%) |
| 20 to 24 Years | 30 (62.5%) | 0 (0.0%) |
| 25 to 29 Years | 82 (88.2%) | 0 (0.0%) |
| 30 to 34 Years | 36 (92.3%) | 0 (0.0%) |
| 35 to 44 Years | 85 (85.0%) | 4 (4.7%) |
| 45 to 54 Years | 42 (89.4%) | 6 (14.3%) |
| 55 to 59 Years | 46 (70.8%) | 0 (0.0%) |
| 60 to 64 Years | 6 (33.3%) | 0 (0.0%) |
| 65 to 74 Years | 16 (14.3%) | 0 (0.0%) |
| 75 Years and over | 4 (5.4%) | 0 (0.0%) |
| Total | 372 (56.2%) | 10 (2.7%) |
Employment Status by Educational Attainment in Poulan
According to labor force statistics for Poulan, 82.0% of individuals (297) out of the total population between 25 and 64 years of age (362) are in the labor force, with 3.4% or 10 of them being unemployed. The group with the highest labor force participation rate are those with the educational attainment of high school diploma, with 89.9% or 107 individuals in the labor force. Within the labor force, individuals with high school diploma education have the highest percentage of unemployment, with 9.3% or 10 of them being unemployed.
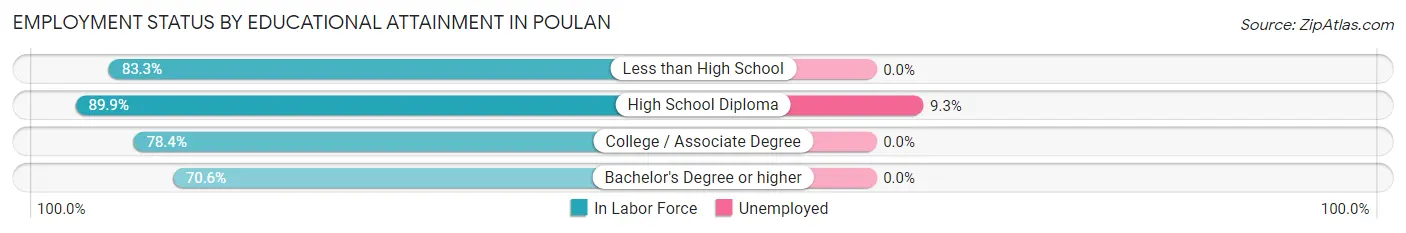
| Educational Attainment | In Labor Force | Unemployed |
| Less than High School | 35 (83.3%) | 0 (0.0%) |
| High School Diploma | 107 (89.9%) | 11 (9.3%) |
| College / Associate Degree | 131 (78.4%) | 0 (0.0%) |
| Bachelor's Degree or higher | 24 (70.6%) | 0 (0.0%) |
| Total | 297 (82.0%) | 12 (3.4%) |
Employment Occupations by Sex in Poulan
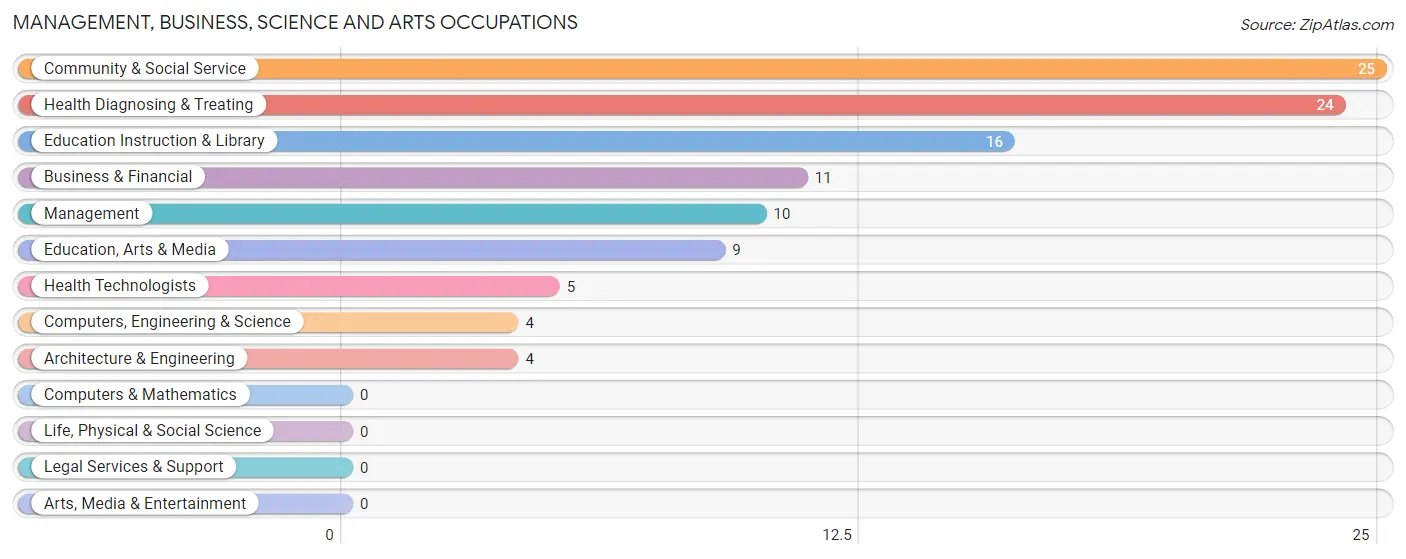
Management, Business, Science and Arts Occupations
The most common Management, Business, Science and Arts occupations in Poulan are Community & Social Service (25 | 6.9%), Health Diagnosing & Treating (24 | 6.6%), Education Instruction & Library (16 | 4.4%), Business & Financial (11 | 3.0%), and Management (10 | 2.8%).
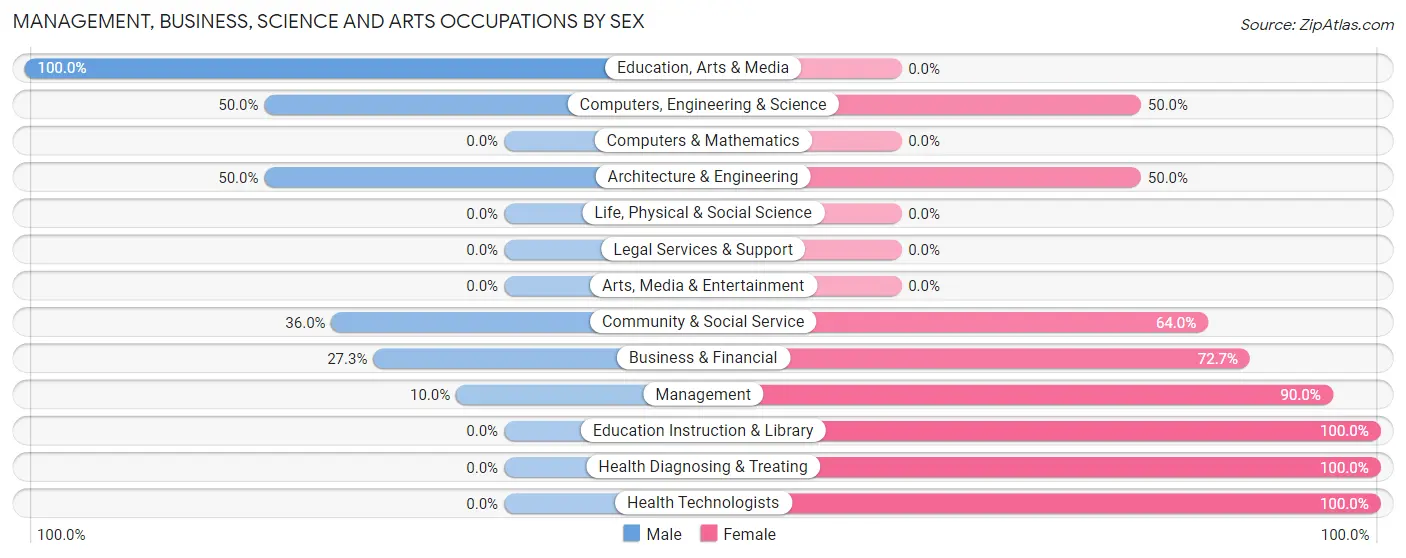
Management, Business, Science and Arts Occupations by Sex
Within the Management, Business, Science and Arts occupations in Poulan, the most male-oriented occupations are Education, Arts & Media (100.0%), Computers, Engineering & Science (50.0%), and Architecture & Engineering (50.0%), while the most female-oriented occupations are Education Instruction & Library (100.0%), Health Diagnosing & Treating (100.0%), and Health Technologists (100.0%).
| Occupation | Male | Female |
| Management | 1 (10.0%) | 9 (90.0%) |
| Business & Financial | 3 (27.3%) | 8 (72.7%) |
| Computers, Engineering & Science | 2 (50.0%) | 2 (50.0%) |
| Computers & Mathematics | 0 (0.0%) | 0 (0.0%) |
| Architecture & Engineering | 2 (50.0%) | 2 (50.0%) |
| Life, Physical & Social Science | 0 (0.0%) | 0 (0.0%) |
| Community & Social Service | 9 (36.0%) | 16 (64.0%) |
| Education, Arts & Media | 9 (100.0%) | 0 (0.0%) |
| Legal Services & Support | 0 (0.0%) | 0 (0.0%) |
| Education Instruction & Library | 0 (0.0%) | 16 (100.0%) |
| Arts, Media & Entertainment | 0 (0.0%) | 0 (0.0%) |
| Health Diagnosing & Treating | 0 (0.0%) | 24 (100.0%) |
| Health Technologists | 0 (0.0%) | 5 (100.0%) |
| Total (Category) | 15 (20.3%) | 59 (79.7%) |
| Total (Overall) | 218 (60.2%) | 144 (39.8%) |
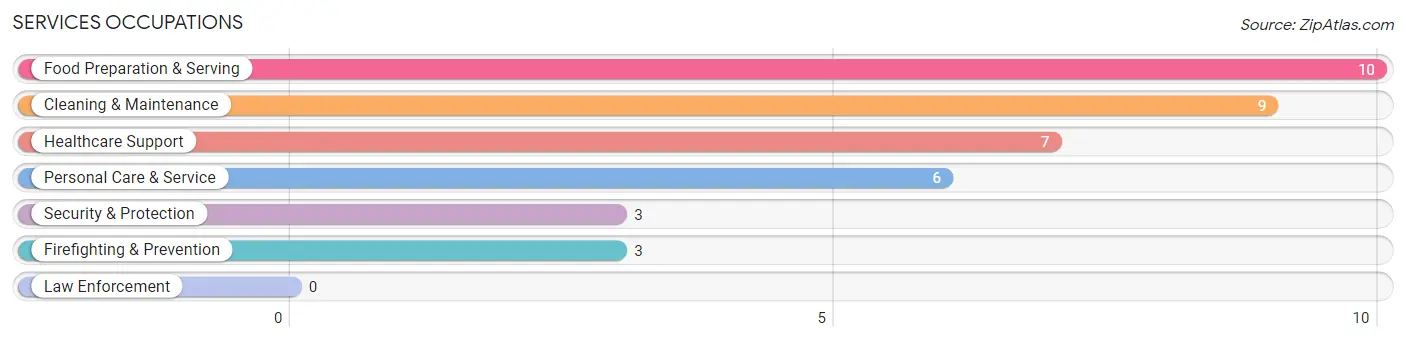
Services Occupations
The most common Services occupations in Poulan are Food Preparation & Serving (10 | 2.8%), Cleaning & Maintenance (9 | 2.5%), Healthcare Support (7 | 1.9%), Personal Care & Service (6 | 1.7%), and Security & Protection (3 | 0.8%).
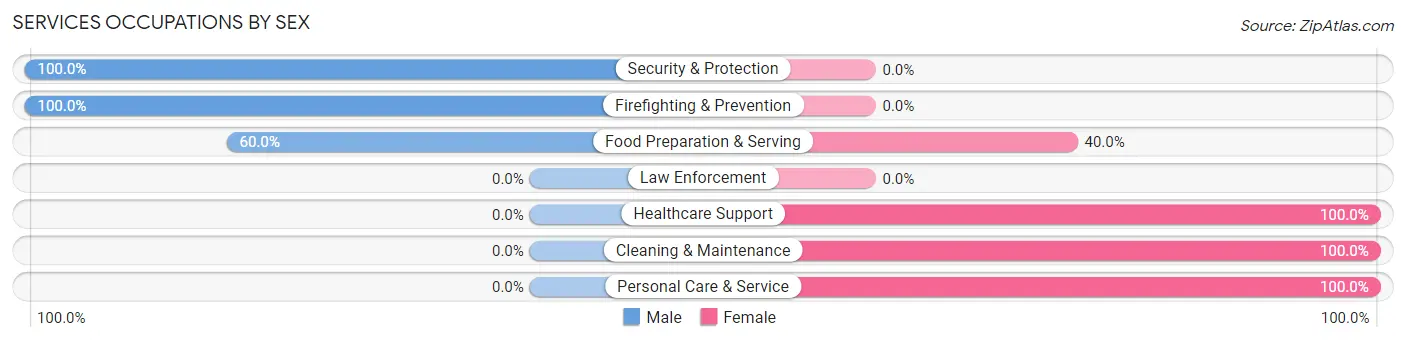
Services Occupations by Sex
Within the Services occupations in Poulan, the most male-oriented occupations are Security & Protection (100.0%), Firefighting & Prevention (100.0%), and Food Preparation & Serving (60.0%), while the most female-oriented occupations are Healthcare Support (100.0%), Cleaning & Maintenance (100.0%), and Personal Care & Service (100.0%).
| Occupation | Male | Female |
| Healthcare Support | 0 (0.0%) | 7 (100.0%) |
| Security & Protection | 3 (100.0%) | 0 (0.0%) |
| Firefighting & Prevention | 3 (100.0%) | 0 (0.0%) |
| Law Enforcement | 0 (0.0%) | 0 (0.0%) |
| Food Preparation & Serving | 6 (60.0%) | 4 (40.0%) |
| Cleaning & Maintenance | 0 (0.0%) | 9 (100.0%) |
| Personal Care & Service | 0 (0.0%) | 6 (100.0%) |
| Total (Category) | 9 (25.7%) | 26 (74.3%) |
| Total (Overall) | 218 (60.2%) | 144 (39.8%) |
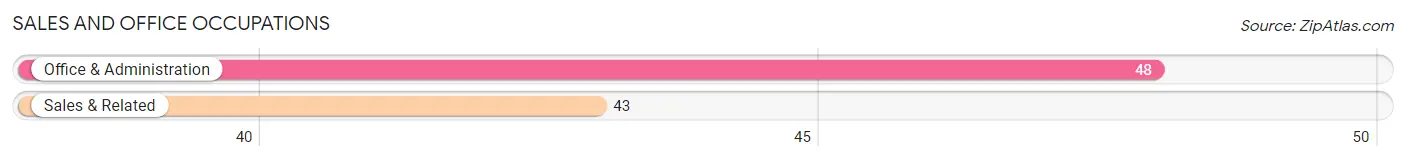
Sales and Office Occupations
The most common Sales and Office occupations in Poulan are Office & Administration (48 | 13.3%), and Sales & Related (43 | 11.9%).
Sales and Office Occupations by Sex
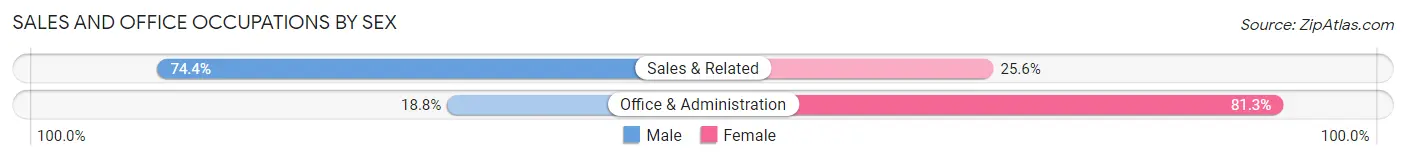
| Occupation | Male | Female |
| Sales & Related | 32 (74.4%) | 11 (25.6%) |
| Office & Administration | 9 (18.8%) | 39 (81.2%) |
| Total (Category) | 41 (45.1%) | 50 (54.9%) |
| Total (Overall) | 218 (60.2%) | 144 (39.8%) |
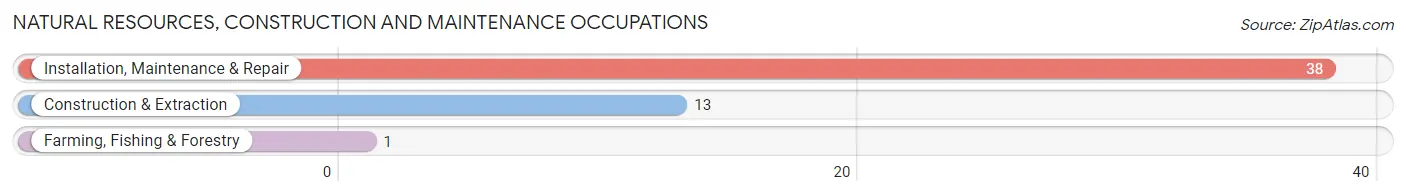
Natural Resources, Construction and Maintenance Occupations
The most common Natural Resources, Construction and Maintenance occupations in Poulan are Installation, Maintenance & Repair (38 | 10.5%), Construction & Extraction (13 | 3.6%), and Farming, Fishing & Forestry (1 | 0.3%).
Natural Resources, Construction and Maintenance Occupations by Sex
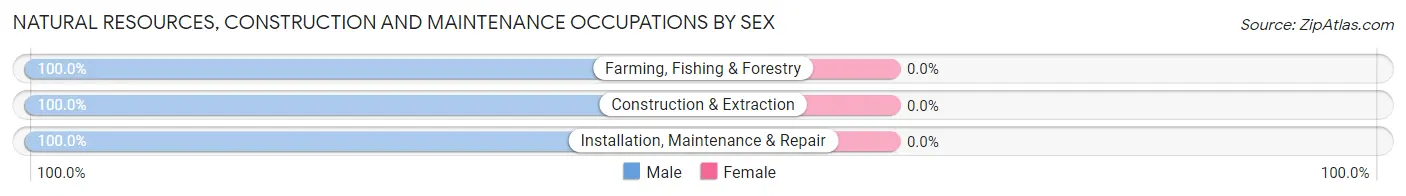
| Occupation | Male | Female |
| Farming, Fishing & Forestry | 1 (100.0%) | 0 (0.0%) |
| Construction & Extraction | 13 (100.0%) | 0 (0.0%) |
| Installation, Maintenance & Repair | 38 (100.0%) | 0 (0.0%) |
| Total (Category) | 52 (100.0%) | 0 (0.0%) |
| Total (Overall) | 218 (60.2%) | 144 (39.8%) |
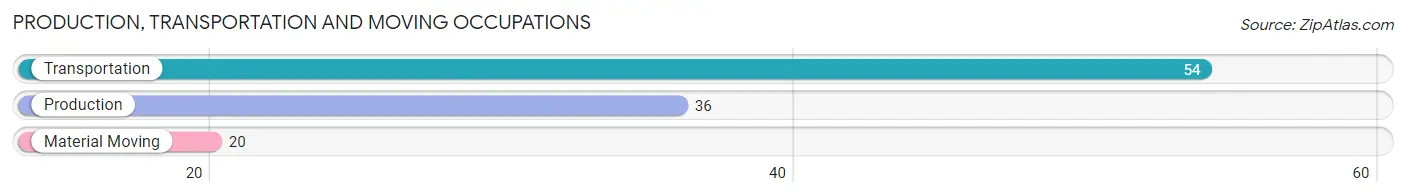
Production, Transportation and Moving Occupations
The most common Production, Transportation and Moving occupations in Poulan are Transportation (54 | 14.9%), Production (36 | 9.9%), and Material Moving (20 | 5.5%).
Production, Transportation and Moving Occupations by Sex
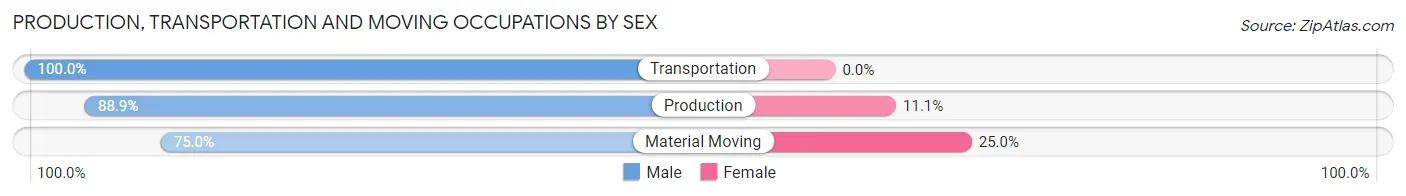
| Occupation | Male | Female |
| Production | 32 (88.9%) | 4 (11.1%) |
| Transportation | 54 (100.0%) | 0 (0.0%) |
| Material Moving | 15 (75.0%) | 5 (25.0%) |
| Total (Category) | 101 (91.8%) | 9 (8.2%) |
| Total (Overall) | 218 (60.2%) | 144 (39.8%) |
Employment Industries by Sex in Poulan
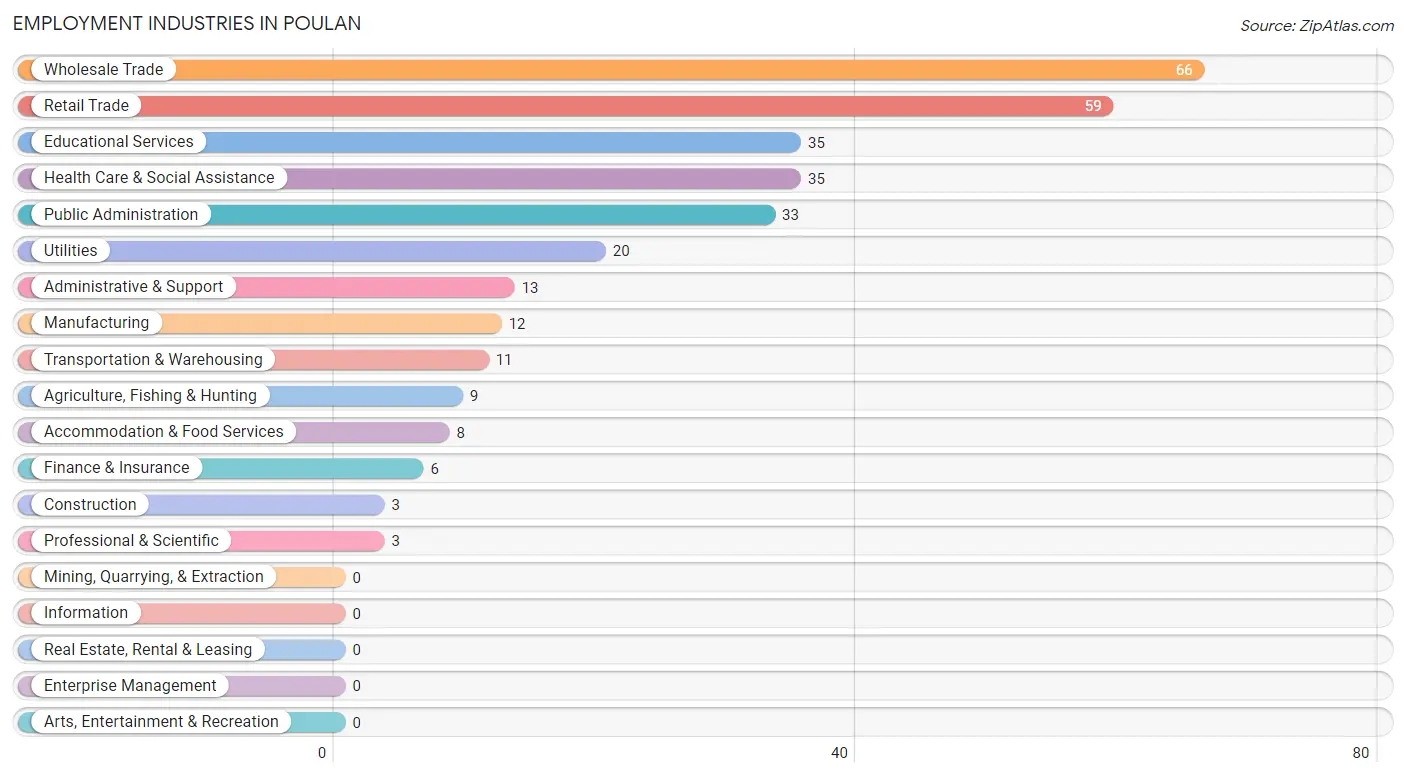
Employment Industries in Poulan
The major employment industries in Poulan include Wholesale Trade (66 | 18.2%), Retail Trade (59 | 16.3%), Educational Services (35 | 9.7%), Health Care & Social Assistance (35 | 9.7%), and Public Administration (33 | 9.1%).
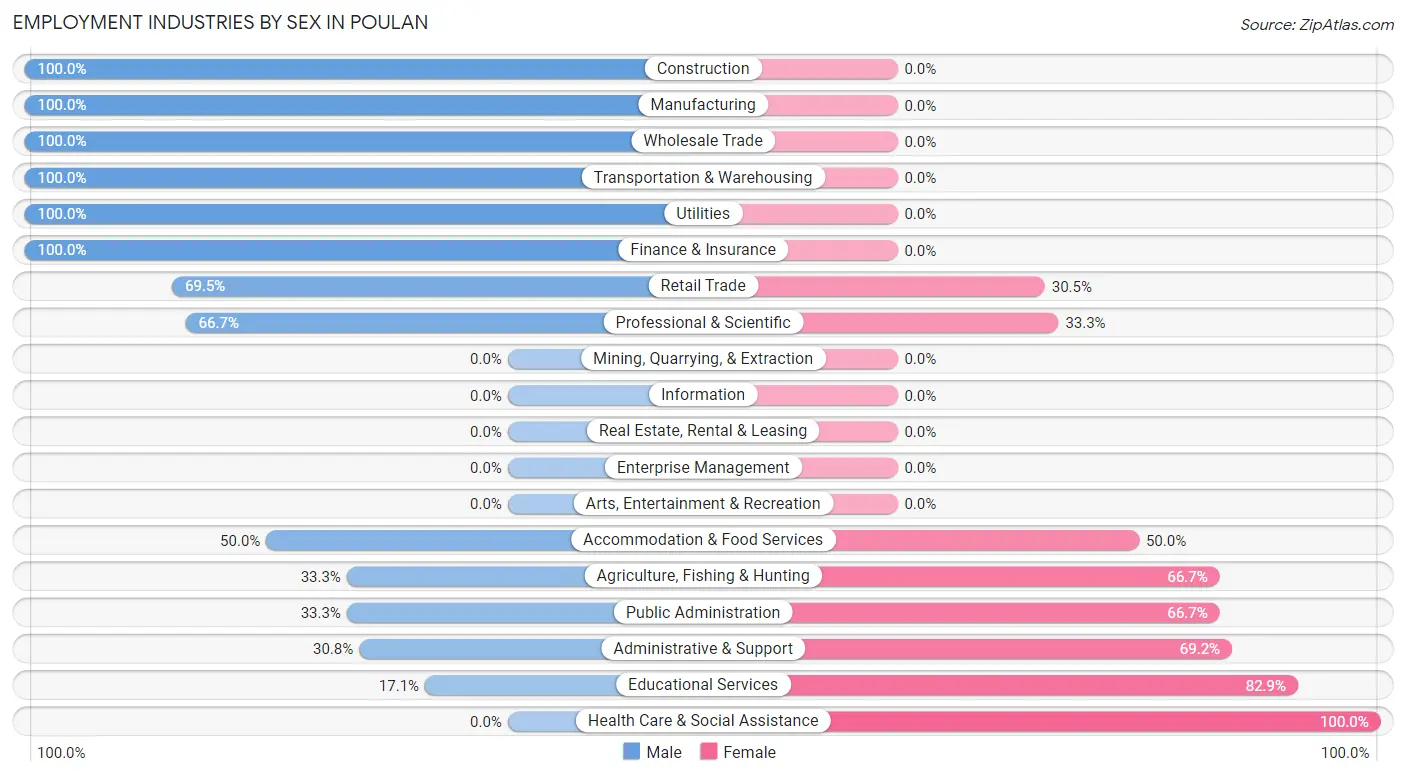
Employment Industries by Sex in Poulan
The Poulan industries that see more men than women are Construction (100.0%), Manufacturing (100.0%), and Wholesale Trade (100.0%), whereas the industries that tend to have a higher number of women are Health Care & Social Assistance (100.0%), Educational Services (82.9%), and Administrative & Support (69.2%).
| Industry | Male | Female |
| Agriculture, Fishing & Hunting | 3 (33.3%) | 6 (66.7%) |
| Mining, Quarrying, & Extraction | 0 (0.0%) | 0 (0.0%) |
| Construction | 3 (100.0%) | 0 (0.0%) |
| Manufacturing | 12 (100.0%) | 0 (0.0%) |
| Wholesale Trade | 66 (100.0%) | 0 (0.0%) |
| Retail Trade | 41 (69.5%) | 18 (30.5%) |
| Transportation & Warehousing | 11 (100.0%) | 0 (0.0%) |
| Utilities | 20 (100.0%) | 0 (0.0%) |
| Information | 0 (0.0%) | 0 (0.0%) |
| Finance & Insurance | 6 (100.0%) | 0 (0.0%) |
| Real Estate, Rental & Leasing | 0 (0.0%) | 0 (0.0%) |
| Professional & Scientific | 2 (66.7%) | 1 (33.3%) |
| Enterprise Management | 0 (0.0%) | 0 (0.0%) |
| Administrative & Support | 4 (30.8%) | 9 (69.2%) |
| Educational Services | 6 (17.1%) | 29 (82.9%) |
| Health Care & Social Assistance | 0 (0.0%) | 35 (100.0%) |
| Arts, Entertainment & Recreation | 0 (0.0%) | 0 (0.0%) |
| Accommodation & Food Services | 4 (50.0%) | 4 (50.0%) |
| Public Administration | 11 (33.3%) | 22 (66.7%) |
| Total | 218 (60.2%) | 144 (39.8%) |
Education in Poulan
School Enrollment in Poulan
The most common levels of schooling among the 156 students in Poulan are college / undergraduate (41 | 26.3%), high school (39 | 25.0%), and kindergarten (31 | 19.9%).
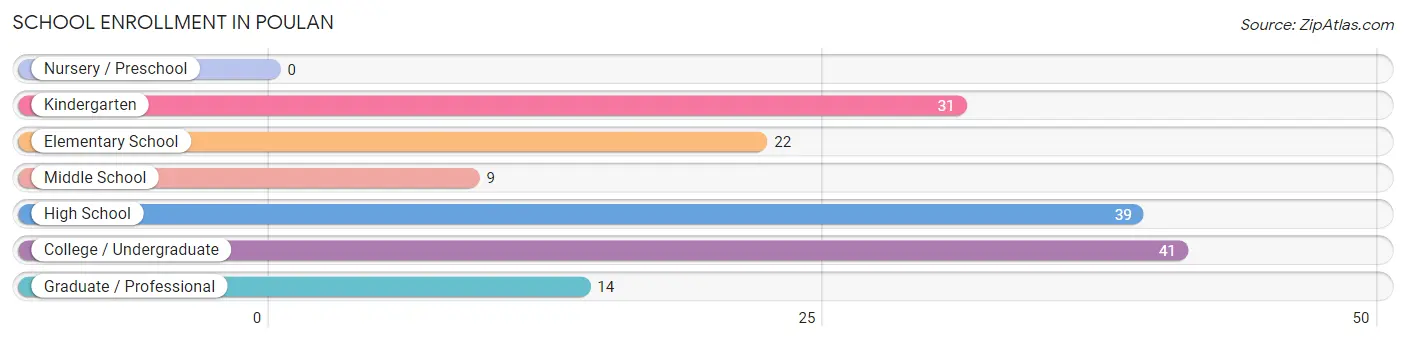
| School Level | # Students | % Students |
| Nursery / Preschool | 0 | 0.0% |
| Kindergarten | 31 | 19.9% |
| Elementary School | 22 | 14.1% |
| Middle School | 9 | 5.8% |
| High School | 39 | 25.0% |
| College / Undergraduate | 41 | 26.3% |
| Graduate / Professional | 14 | 9.0% |
| Total | 156 | 100.0% |
School Enrollment by Age by Funding Source in Poulan
Out of a total of 156 students who are enrolled in schools in Poulan, 8 (5.1%) attend a private institution, while the remaining 148 (94.9%) are enrolled in public schools. The age group of 10 to 14 year olds has the highest likelihood of being enrolled in private schools, with 4 (30.8% in the age bracket) enrolled. Conversely, the age group of 5 to 9 year old has the lowest likelihood of being enrolled in a private school, with 49 (100.0% in the age bracket) attending a public institution.
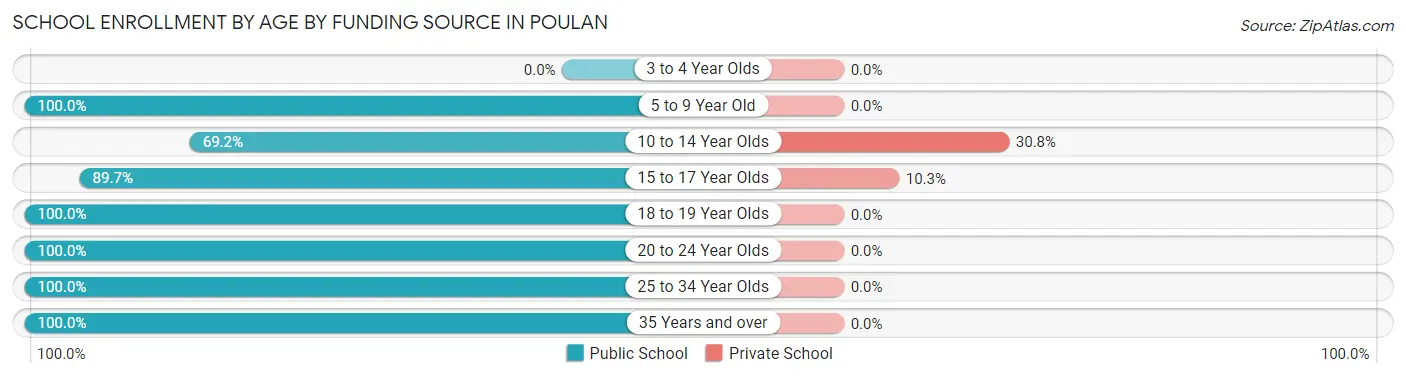
| Age Bracket | Public School | Private School |
| 3 to 4 Year Olds | 0 (0.0%) | 0 (0.0%) |
| 5 to 9 Year Old | 49 (100.0%) | 0 (0.0%) |
| 10 to 14 Year Olds | 9 (69.2%) | 4 (30.8%) |
| 15 to 17 Year Olds | 35 (89.7%) | 4 (10.3%) |
| 18 to 19 Year Olds | 9 (100.0%) | 0 (0.0%) |
| 20 to 24 Year Olds | 13 (100.0%) | 0 (0.0%) |
| 25 to 34 Year Olds | 28 (100.0%) | 0 (0.0%) |
| 35 Years and over | 5 (100.0%) | 0 (0.0%) |
| Total | 148 (94.9%) | 8 (5.1%) |
Educational Attainment by Field of Study in Poulan
Education (14 | 35.0%), bio, nature & agricultural (12 | 30.0%), liberal arts & history (9 | 22.5%), business (4 | 10.0%), and computers & mathematics (1 | 2.5%) are the most common fields of study among 40 individuals in Poulan who have obtained a bachelor's degree or higher.
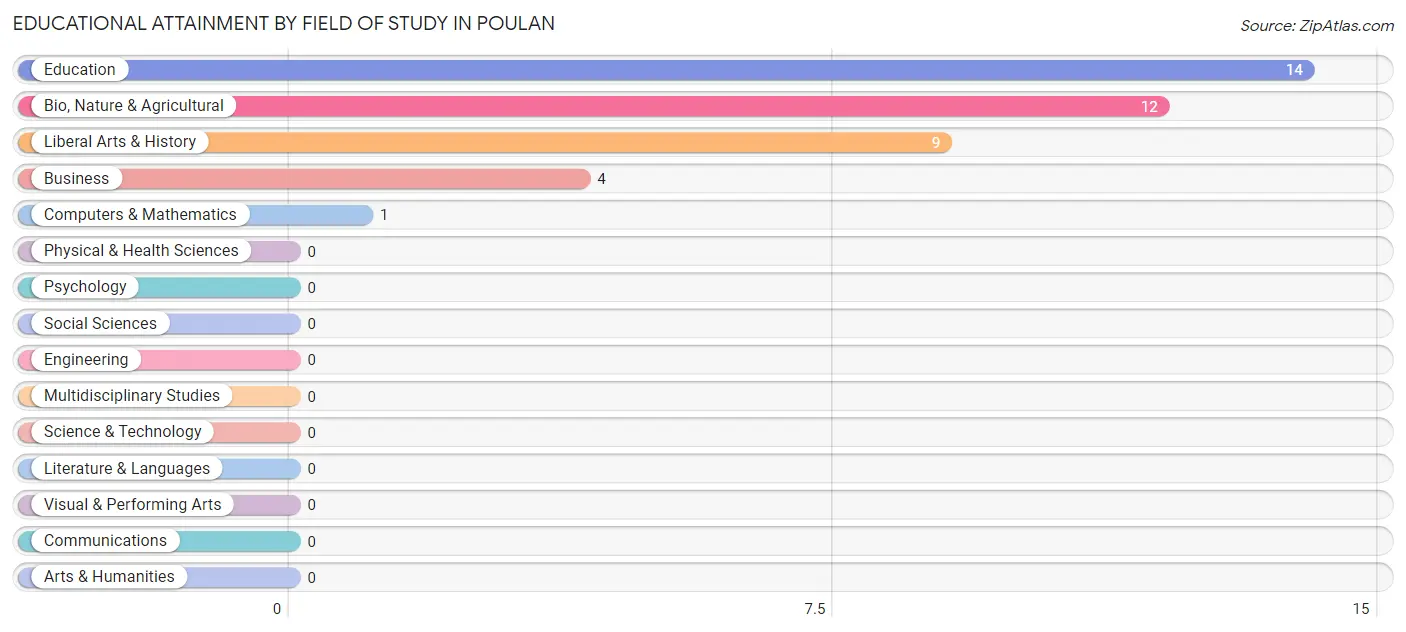
| Field of Study | # Graduates | % Graduates |
| Computers & Mathematics | 1 | 2.5% |
| Bio, Nature & Agricultural | 12 | 30.0% |
| Physical & Health Sciences | 0 | 0.0% |
| Psychology | 0 | 0.0% |
| Social Sciences | 0 | 0.0% |
| Engineering | 0 | 0.0% |
| Multidisciplinary Studies | 0 | 0.0% |
| Science & Technology | 0 | 0.0% |
| Business | 4 | 10.0% |
| Education | 14 | 35.0% |
| Literature & Languages | 0 | 0.0% |
| Liberal Arts & History | 9 | 22.5% |
| Visual & Performing Arts | 0 | 0.0% |
| Communications | 0 | 0.0% |
| Arts & Humanities | 0 | 0.0% |
| Total | 40 | 100.0% |
Transportation & Commute in Poulan
Vehicle Availability by Sex in Poulan
The most prevalent vehicle ownership categories in Poulan are males with 3 vehicles (88, accounting for 40.4%) and females with 3 vehicles (58, making up 61.1%).
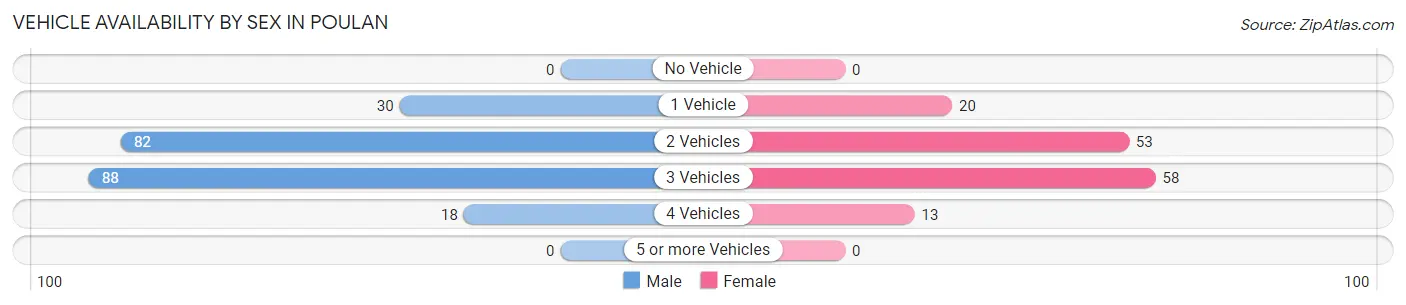
| Vehicles Available | Male | Female |
| No Vehicle | 0 (0.0%) | 0 (0.0%) |
| 1 Vehicle | 30 (13.8%) | 20 (13.9%) |
| 2 Vehicles | 82 (37.6%) | 53 (36.8%) |
| 3 Vehicles | 88 (40.4%) | 58 (40.3%) |
| 4 Vehicles | 18 (8.3%) | 13 (9.0%) |
| 5 or more Vehicles | 0 (0.0%) | 0 (0.0%) |
| Total | 218 (100.0%) | 144 (100.0%) |
Commute Time in Poulan
The most frequently occuring commute durations in Poulan are 10 to 14 minutes (69 commuters, 20.0%), 5 to 9 minutes (59 commuters, 17.1%), and 25 to 29 minutes (45 commuters, 13.0%).
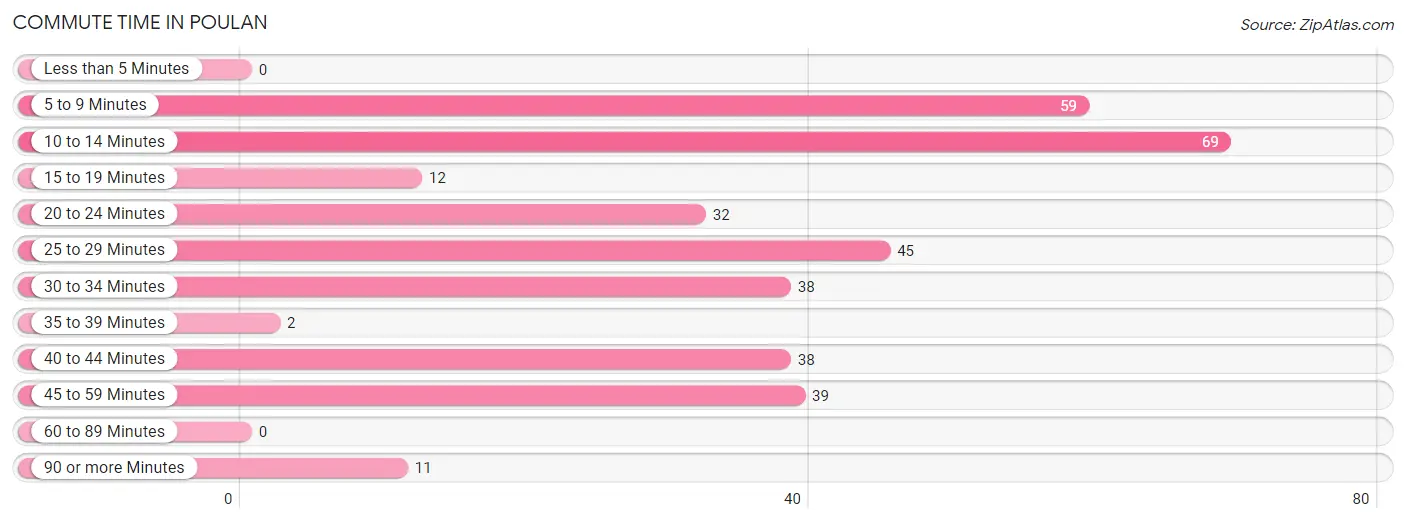
| Commute Time | # Commuters | % Commuters |
| Less than 5 Minutes | 0 | 0.0% |
| 5 to 9 Minutes | 59 | 17.1% |
| 10 to 14 Minutes | 69 | 20.0% |
| 15 to 19 Minutes | 12 | 3.5% |
| 20 to 24 Minutes | 32 | 9.3% |
| 25 to 29 Minutes | 45 | 13.0% |
| 30 to 34 Minutes | 38 | 11.0% |
| 35 to 39 Minutes | 2 | 0.6% |
| 40 to 44 Minutes | 38 | 11.0% |
| 45 to 59 Minutes | 39 | 11.3% |
| 60 to 89 Minutes | 0 | 0.0% |
| 90 or more Minutes | 11 | 3.2% |
Commute Time by Sex in Poulan
The most common commute times in Poulan are 10 to 14 minutes (43 commuters, 20.1%) for males and 5 to 9 minutes (41 commuters, 31.3%) for females.
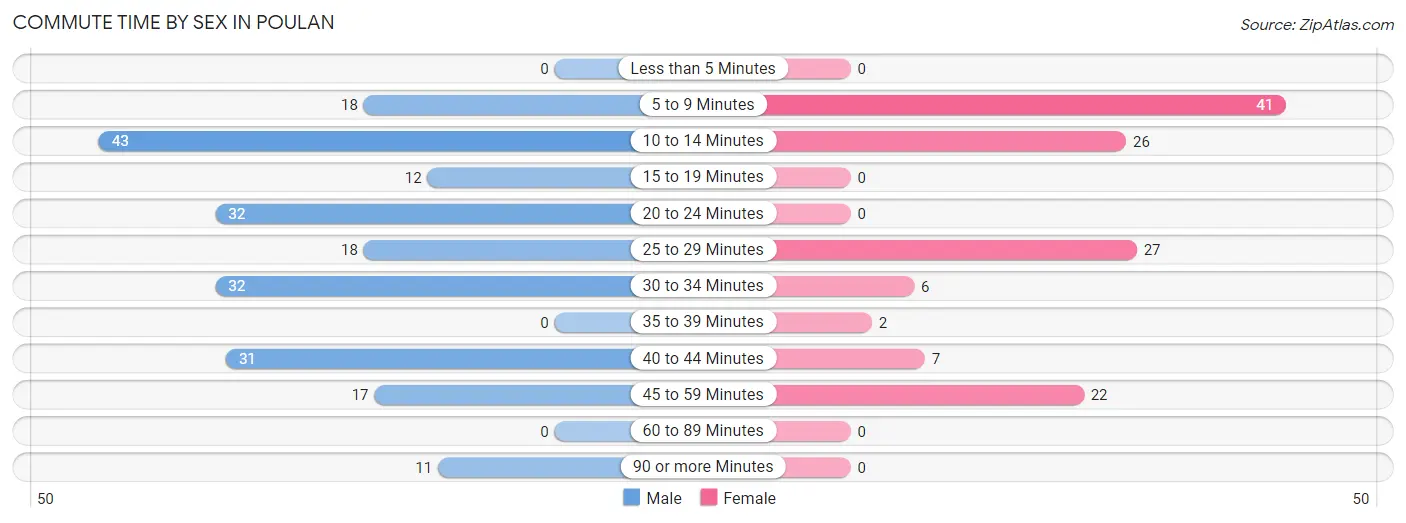
| Commute Time | Male | Female |
| Less than 5 Minutes | 0 (0.0%) | 0 (0.0%) |
| 5 to 9 Minutes | 18 (8.4%) | 41 (31.3%) |
| 10 to 14 Minutes | 43 (20.1%) | 26 (19.9%) |
| 15 to 19 Minutes | 12 (5.6%) | 0 (0.0%) |
| 20 to 24 Minutes | 32 (14.9%) | 0 (0.0%) |
| 25 to 29 Minutes | 18 (8.4%) | 27 (20.6%) |
| 30 to 34 Minutes | 32 (14.9%) | 6 (4.6%) |
| 35 to 39 Minutes | 0 (0.0%) | 2 (1.5%) |
| 40 to 44 Minutes | 31 (14.5%) | 7 (5.3%) |
| 45 to 59 Minutes | 17 (7.9%) | 22 (16.8%) |
| 60 to 89 Minutes | 0 (0.0%) | 0 (0.0%) |
| 90 or more Minutes | 11 (5.1%) | 0 (0.0%) |
Time of Departure to Work by Sex in Poulan
The most frequent times of departure to work in Poulan are 6:00 AM to 6:29 AM (58, 27.1%) for males and 7:00 AM to 7:29 AM (48, 36.6%) for females.
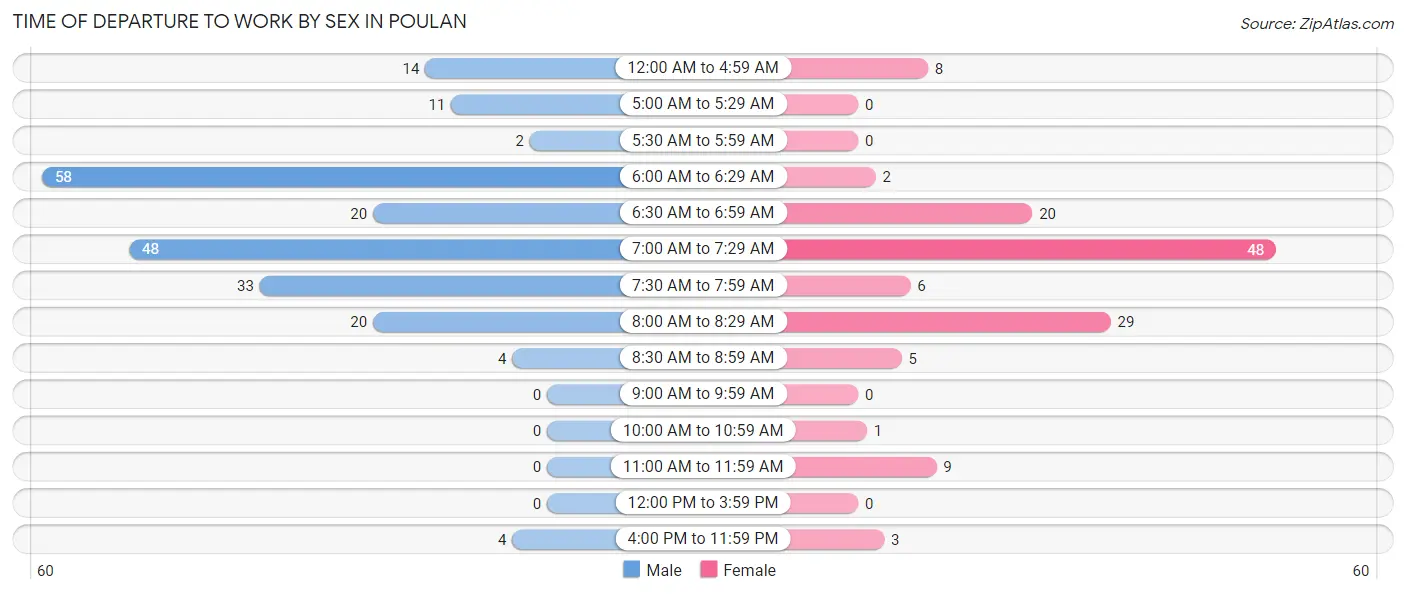
| Time of Departure | Male | Female |
| 12:00 AM to 4:59 AM | 14 (6.5%) | 8 (6.1%) |
| 5:00 AM to 5:29 AM | 11 (5.1%) | 0 (0.0%) |
| 5:30 AM to 5:59 AM | 2 (0.9%) | 0 (0.0%) |
| 6:00 AM to 6:29 AM | 58 (27.1%) | 2 (1.5%) |
| 6:30 AM to 6:59 AM | 20 (9.3%) | 20 (15.3%) |
| 7:00 AM to 7:29 AM | 48 (22.4%) | 48 (36.6%) |
| 7:30 AM to 7:59 AM | 33 (15.4%) | 6 (4.6%) |
| 8:00 AM to 8:29 AM | 20 (9.3%) | 29 (22.1%) |
| 8:30 AM to 8:59 AM | 4 (1.9%) | 5 (3.8%) |
| 9:00 AM to 9:59 AM | 0 (0.0%) | 0 (0.0%) |
| 10:00 AM to 10:59 AM | 0 (0.0%) | 1 (0.8%) |
| 11:00 AM to 11:59 AM | 0 (0.0%) | 9 (6.9%) |
| 12:00 PM to 3:59 PM | 0 (0.0%) | 0 (0.0%) |
| 4:00 PM to 11:59 PM | 4 (1.9%) | 3 (2.3%) |
| Total | 214 (100.0%) | 131 (100.0%) |
Housing Occupancy in Poulan
Occupancy by Ownership in Poulan
Of the total 294 dwellings in Poulan, owner-occupied units account for 221 (75.2%), while renter-occupied units make up 73 (24.8%).
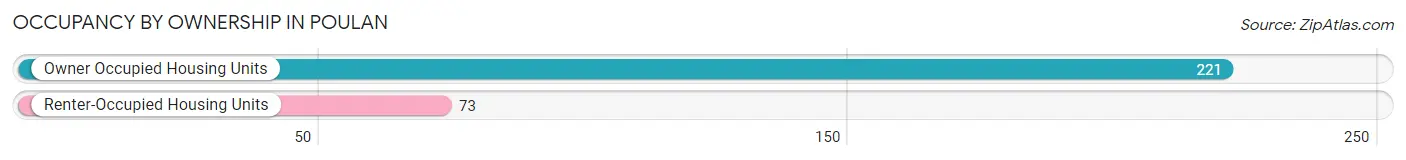
| Occupancy | # Housing Units | % Housing Units |
| Owner Occupied Housing Units | 221 | 75.2% |
| Renter-Occupied Housing Units | 73 | 24.8% |
| Total Occupied Housing Units | 294 | 100.0% |
Occupancy by Household Size in Poulan
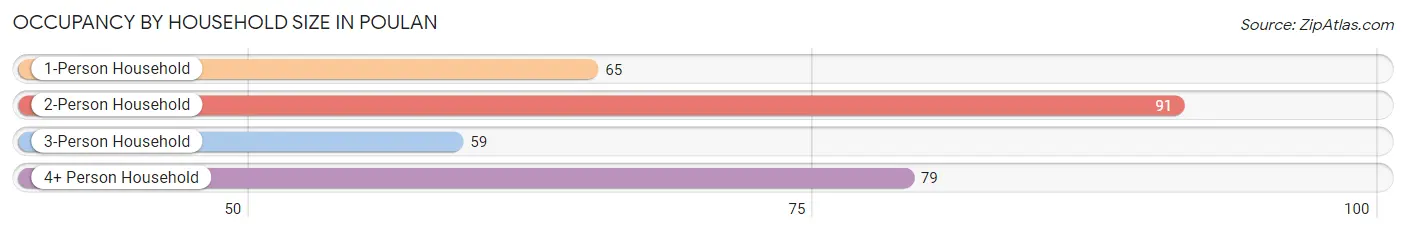
| Household Size | # Housing Units | % Housing Units |
| 1-Person Household | 65 | 22.1% |
| 2-Person Household | 91 | 30.9% |
| 3-Person Household | 59 | 20.1% |
| 4+ Person Household | 79 | 26.9% |
| Total Housing Units | 294 | 100.0% |
Occupancy by Ownership by Household Size in Poulan
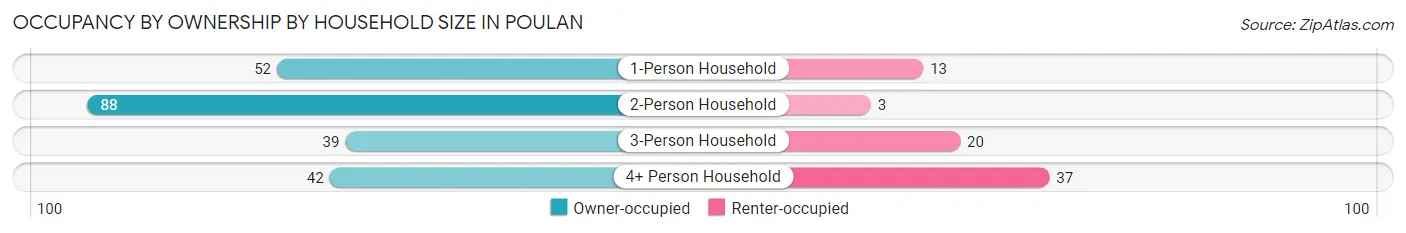
| Household Size | Owner-occupied | Renter-occupied |
| 1-Person Household | 52 (80.0%) | 13 (20.0%) |
| 2-Person Household | 88 (96.7%) | 3 (3.3%) |
| 3-Person Household | 39 (66.1%) | 20 (33.9%) |
| 4+ Person Household | 42 (53.2%) | 37 (46.8%) |
| Total Housing Units | 221 (75.2%) | 73 (24.8%) |
Occupancy by Educational Attainment in Poulan
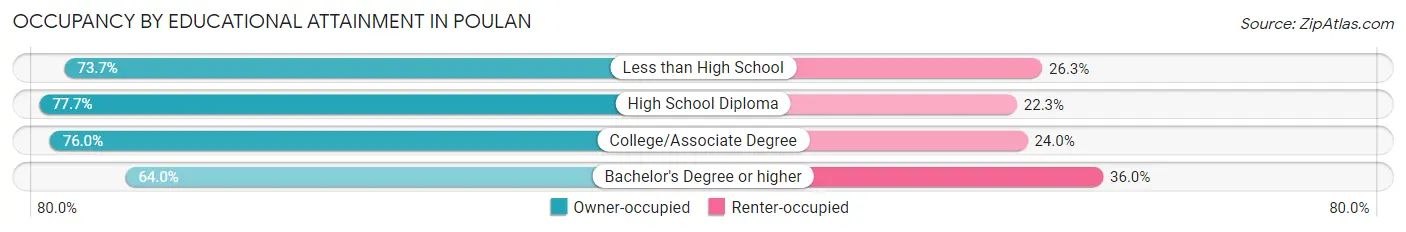
| Household Size | Owner-occupied | Renter-occupied |
| Less than High School | 42 (73.7%) | 15 (26.3%) |
| High School Diploma | 87 (77.7%) | 25 (22.3%) |
| College/Associate Degree | 76 (76.0%) | 24 (24.0%) |
| Bachelor's Degree or higher | 16 (64.0%) | 9 (36.0%) |
Occupancy by Age of Householder in Poulan
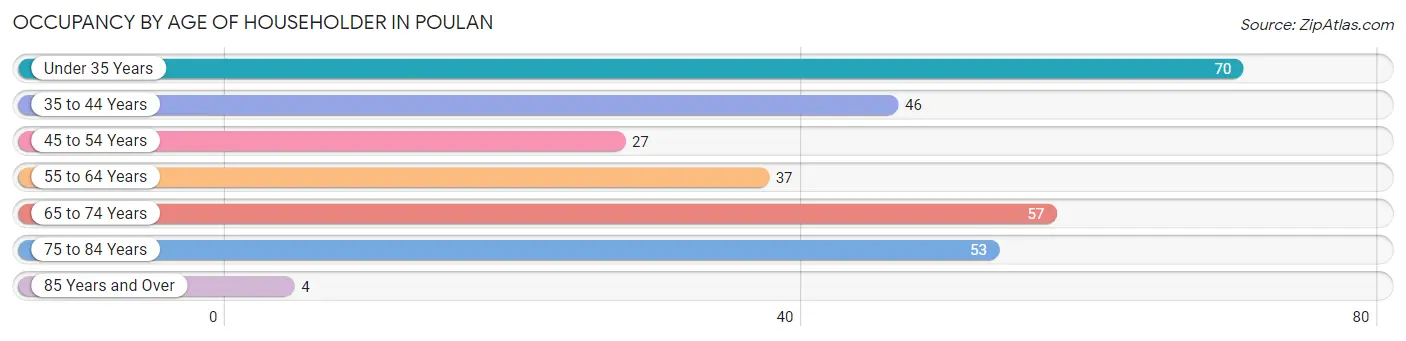
| Age Bracket | # Households | % Households |
| Under 35 Years | 70 | 23.8% |
| 35 to 44 Years | 46 | 15.7% |
| 45 to 54 Years | 27 | 9.2% |
| 55 to 64 Years | 37 | 12.6% |
| 65 to 74 Years | 57 | 19.4% |
| 75 to 84 Years | 53 | 18.0% |
| 85 Years and Over | 4 | 1.4% |
| Total | 294 | 100.0% |
Housing Finances in Poulan
Median Income by Occupancy in Poulan
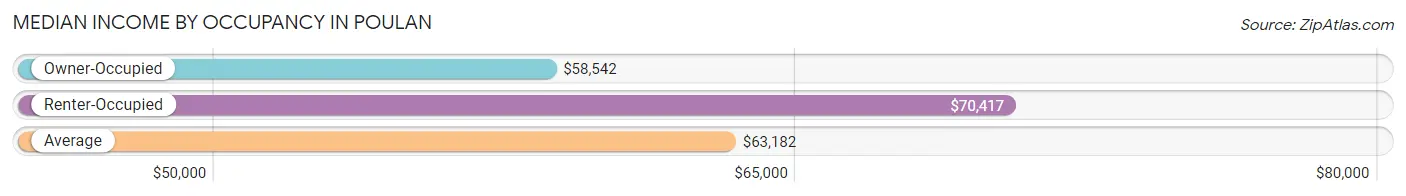
| Occupancy Type | # Households | Median Income |
| Owner-Occupied | 221 (75.2%) | $58,542 |
| Renter-Occupied | 73 (24.8%) | $70,417 |
| Average | 294 (100.0%) | $63,182 |
Occupancy by Householder Income Bracket in Poulan
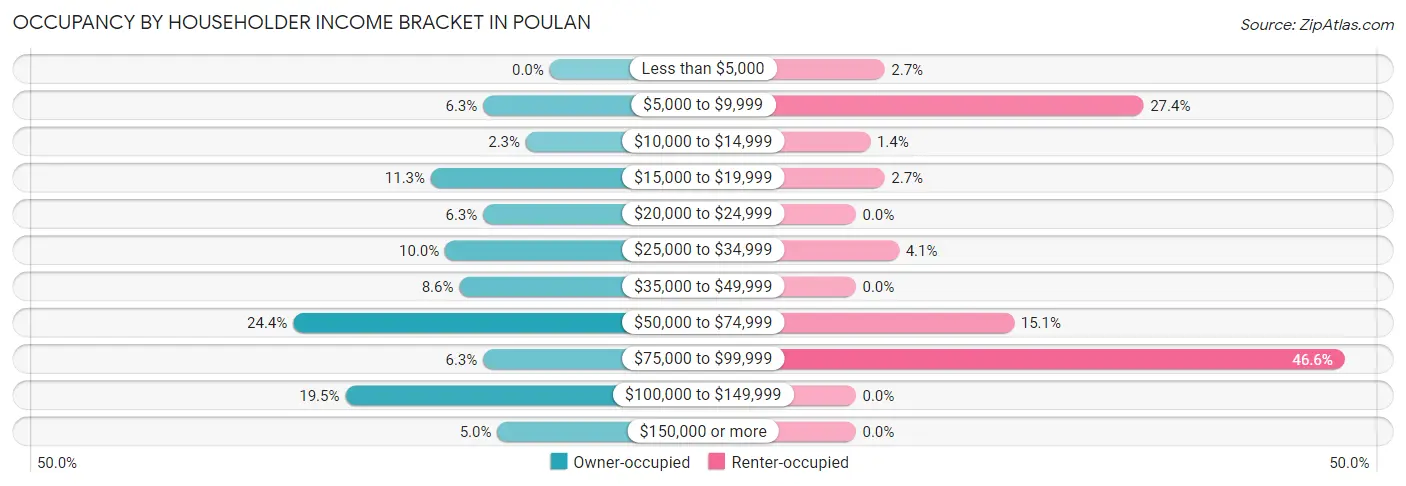
| Income Bracket | Owner-occupied | Renter-occupied |
| Less than $5,000 | 0 (0.0%) | 2 (2.7%) |
| $5,000 to $9,999 | 14 (6.3%) | 20 (27.4%) |
| $10,000 to $14,999 | 5 (2.3%) | 1 (1.4%) |
| $15,000 to $19,999 | 25 (11.3%) | 2 (2.7%) |
| $20,000 to $24,999 | 14 (6.3%) | 0 (0.0%) |
| $25,000 to $34,999 | 22 (10.0%) | 3 (4.1%) |
| $35,000 to $49,999 | 19 (8.6%) | 0 (0.0%) |
| $50,000 to $74,999 | 54 (24.4%) | 11 (15.1%) |
| $75,000 to $99,999 | 14 (6.3%) | 34 (46.6%) |
| $100,000 to $149,999 | 43 (19.5%) | 0 (0.0%) |
| $150,000 or more | 11 (5.0%) | 0 (0.0%) |
| Total | 221 (100.0%) | 73 (100.0%) |
Monthly Housing Cost Tiers in Poulan
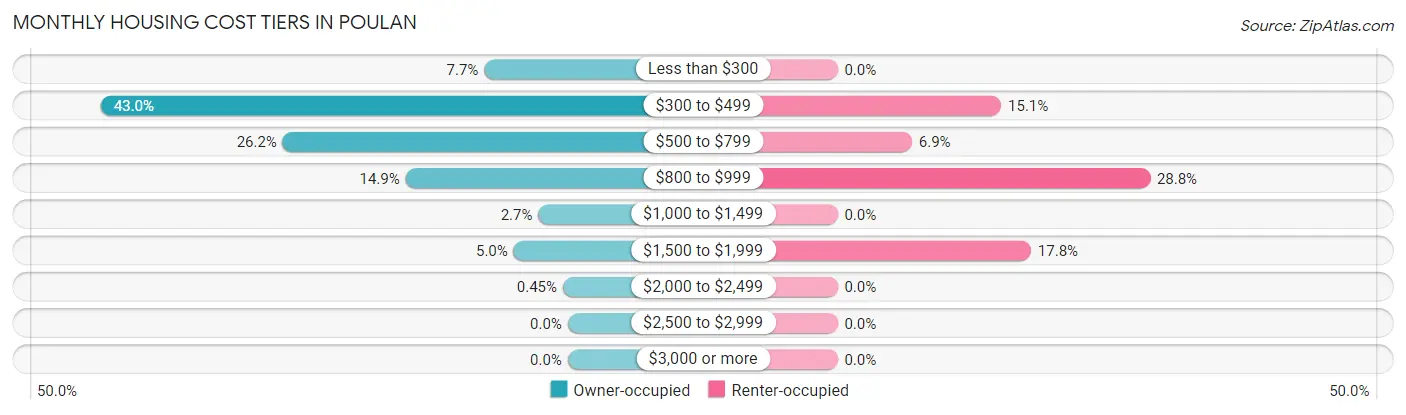
| Monthly Cost | Owner-occupied | Renter-occupied |
| Less than $300 | 17 (7.7%) | 0 (0.0%) |
| $300 to $499 | 95 (43.0%) | 11 (15.1%) |
| $500 to $799 | 58 (26.2%) | 5 (6.9%) |
| $800 to $999 | 33 (14.9%) | 21 (28.8%) |
| $1,000 to $1,499 | 6 (2.7%) | 0 (0.0%) |
| $1,500 to $1,999 | 11 (5.0%) | 13 (17.8%) |
| $2,000 to $2,499 | 1 (0.4%) | 0 (0.0%) |
| $2,500 to $2,999 | 0 (0.0%) | 0 (0.0%) |
| $3,000 or more | 0 (0.0%) | 0 (0.0%) |
| Total | 221 (100.0%) | 73 (100.0%) |
Physical Housing Characteristics in Poulan
Housing Structures in Poulan
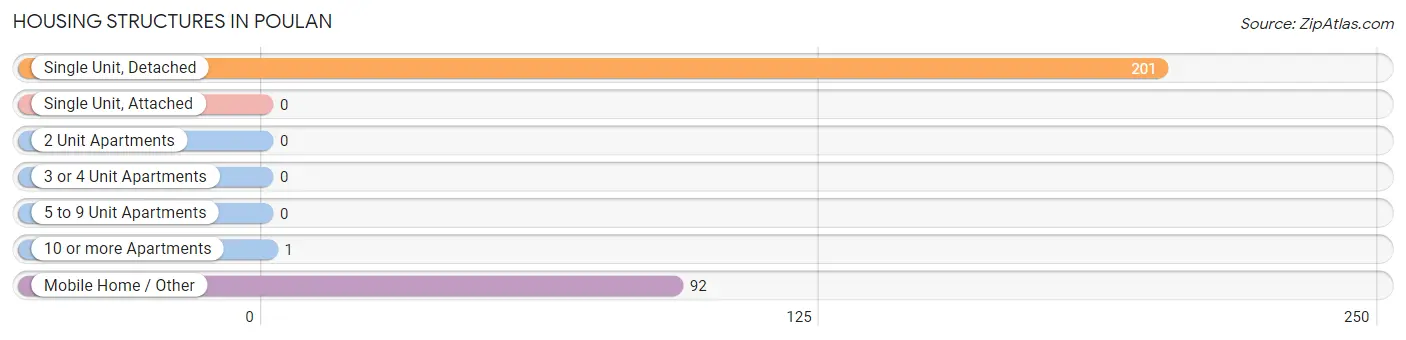
| Structure Type | # Housing Units | % Housing Units |
| Single Unit, Detached | 201 | 68.4% |
| Single Unit, Attached | 0 | 0.0% |
| 2 Unit Apartments | 0 | 0.0% |
| 3 or 4 Unit Apartments | 0 | 0.0% |
| 5 to 9 Unit Apartments | 0 | 0.0% |
| 10 or more Apartments | 1 | 0.3% |
| Mobile Home / Other | 92 | 31.3% |
| Total | 294 | 100.0% |
Housing Structures by Occupancy in Poulan
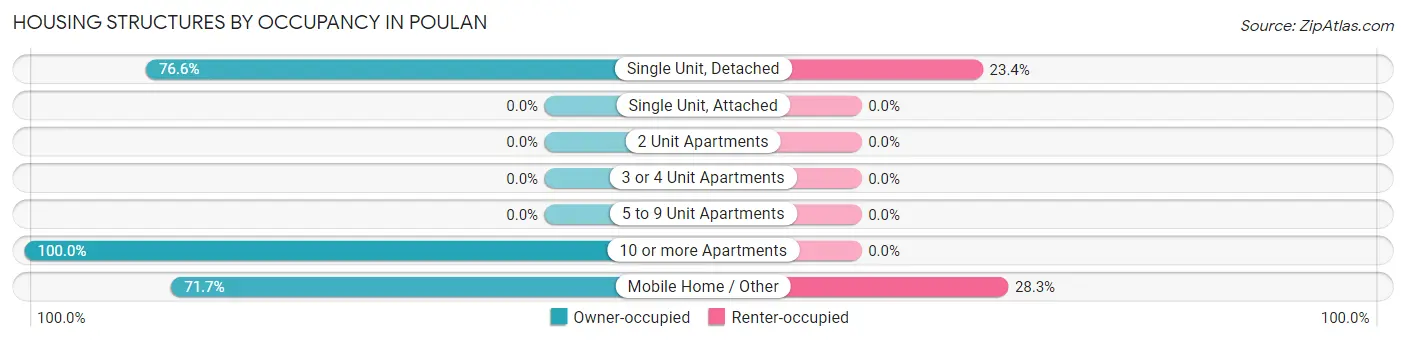
| Structure Type | Owner-occupied | Renter-occupied |
| Single Unit, Detached | 154 (76.6%) | 47 (23.4%) |
| Single Unit, Attached | 0 (0.0%) | 0 (0.0%) |
| 2 Unit Apartments | 0 (0.0%) | 0 (0.0%) |
| 3 or 4 Unit Apartments | 0 (0.0%) | 0 (0.0%) |
| 5 to 9 Unit Apartments | 0 (0.0%) | 0 (0.0%) |
| 10 or more Apartments | 1 (100.0%) | 0 (0.0%) |
| Mobile Home / Other | 66 (71.7%) | 26 (28.3%) |
| Total | 221 (75.2%) | 73 (24.8%) |
Housing Structures by Number of Rooms in Poulan
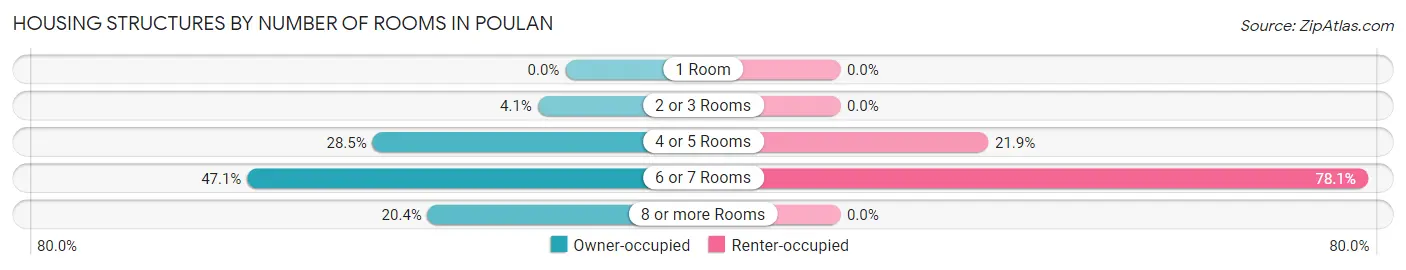
| Number of Rooms | Owner-occupied | Renter-occupied |
| 1 Room | 0 (0.0%) | 0 (0.0%) |
| 2 or 3 Rooms | 9 (4.1%) | 0 (0.0%) |
| 4 or 5 Rooms | 63 (28.5%) | 16 (21.9%) |
| 6 or 7 Rooms | 104 (47.1%) | 57 (78.1%) |
| 8 or more Rooms | 45 (20.4%) | 0 (0.0%) |
| Total | 221 (100.0%) | 73 (100.0%) |
Housing Structure by Heating Type in Poulan
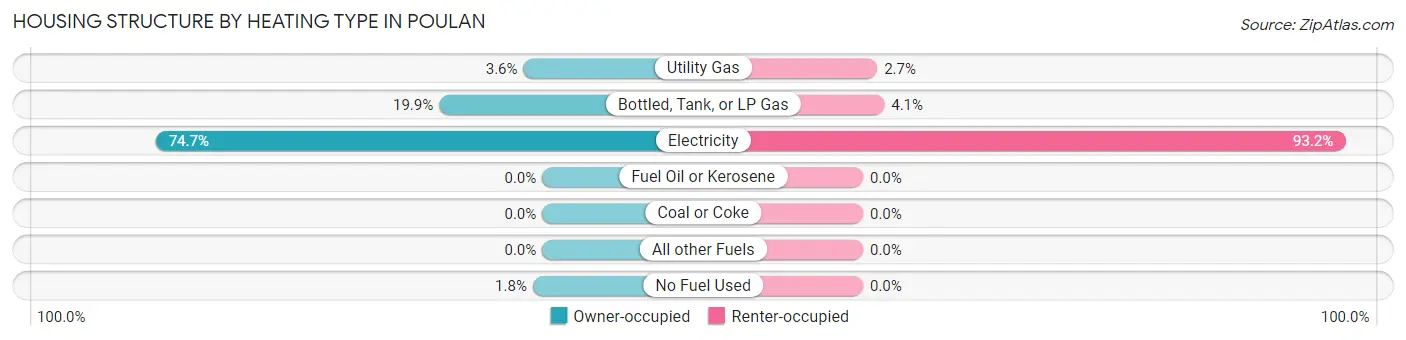
| Heating Type | Owner-occupied | Renter-occupied |
| Utility Gas | 8 (3.6%) | 2 (2.7%) |
| Bottled, Tank, or LP Gas | 44 (19.9%) | 3 (4.1%) |
| Electricity | 165 (74.7%) | 68 (93.1%) |
| Fuel Oil or Kerosene | 0 (0.0%) | 0 (0.0%) |
| Coal or Coke | 0 (0.0%) | 0 (0.0%) |
| All other Fuels | 0 (0.0%) | 0 (0.0%) |
| No Fuel Used | 4 (1.8%) | 0 (0.0%) |
| Total | 221 (100.0%) | 73 (100.0%) |
Household Vehicle Usage in Poulan
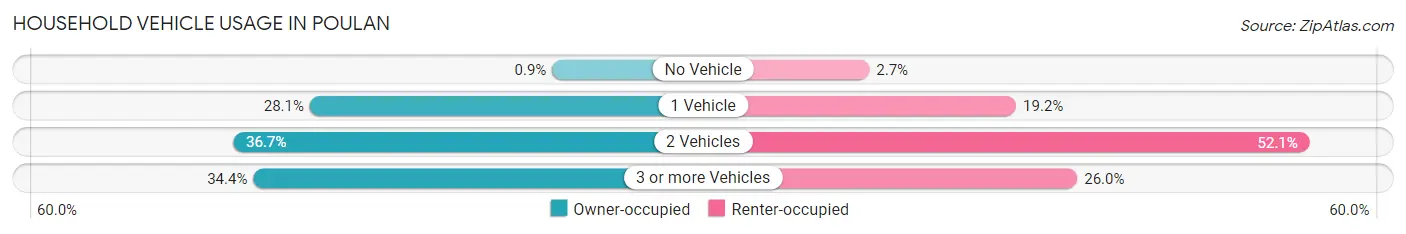
| Vehicles per Household | Owner-occupied | Renter-occupied |
| No Vehicle | 2 (0.9%) | 2 (2.7%) |
| 1 Vehicle | 62 (28.1%) | 14 (19.2%) |
| 2 Vehicles | 81 (36.6%) | 38 (52.0%) |
| 3 or more Vehicles | 76 (34.4%) | 19 (26.0%) |
| Total | 221 (100.0%) | 73 (100.0%) |
Real Estate & Mortgages in Poulan
Real Estate and Mortgage Overview in Poulan
| Characteristic | Without Mortgage | With Mortgage |
| Housing Units | 171 | 50 |
| Median Property Value | $64,400 | $111,500 |
| Median Household Income | $44,125 | $3 |
| Monthly Housing Costs | $463 | $0 |
| Real Estate Taxes | $573 | $2 |
Property Value by Mortgage Status in Poulan
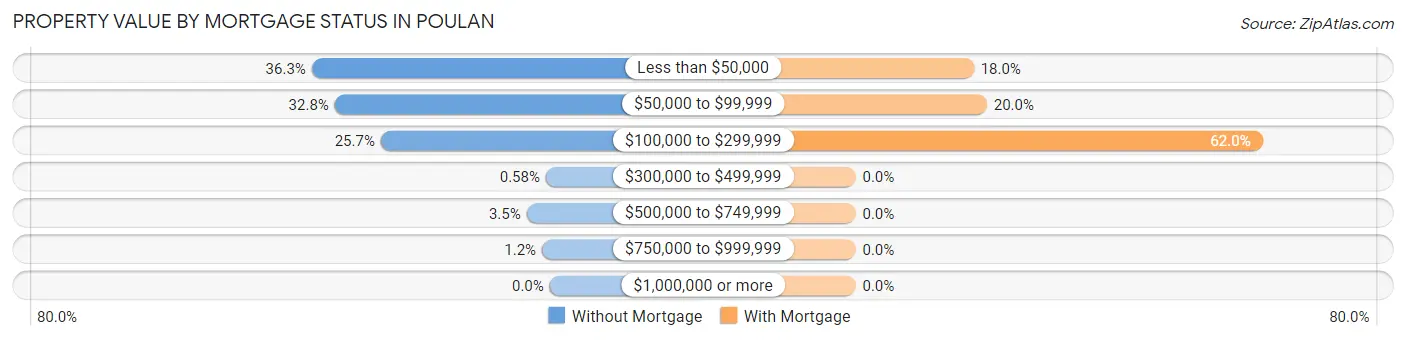
| Property Value | Without Mortgage | With Mortgage |
| Less than $50,000 | 62 (36.3%) | 9 (18.0%) |
| $50,000 to $99,999 | 56 (32.8%) | 10 (20.0%) |
| $100,000 to $299,999 | 44 (25.7%) | 31 (62.0%) |
| $300,000 to $499,999 | 1 (0.6%) | 0 (0.0%) |
| $500,000 to $749,999 | 6 (3.5%) | 0 (0.0%) |
| $750,000 to $999,999 | 2 (1.2%) | 0 (0.0%) |
| $1,000,000 or more | 0 (0.0%) | 0 (0.0%) |
| Total | 171 (100.0%) | 50 (100.0%) |
Household Income by Mortgage Status in Poulan
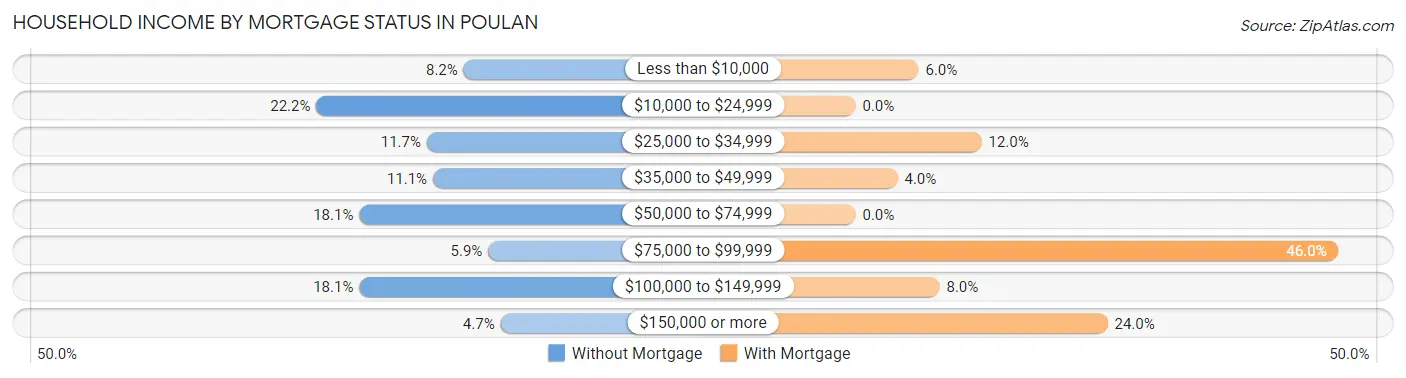
| Household Income | Without Mortgage | With Mortgage |
| Less than $10,000 | 14 (8.2%) | 3 (6.0%) |
| $10,000 to $24,999 | 38 (22.2%) | 0 (0.0%) |
| $25,000 to $34,999 | 20 (11.7%) | 6 (12.0%) |
| $35,000 to $49,999 | 19 (11.1%) | 2 (4.0%) |
| $50,000 to $74,999 | 31 (18.1%) | 0 (0.0%) |
| $75,000 to $99,999 | 10 (5.9%) | 23 (46.0%) |
| $100,000 to $149,999 | 31 (18.1%) | 4 (8.0%) |
| $150,000 or more | 8 (4.7%) | 12 (24.0%) |
| Total | 171 (100.0%) | 50 (100.0%) |
Property Value to Household Income Ratio in Poulan
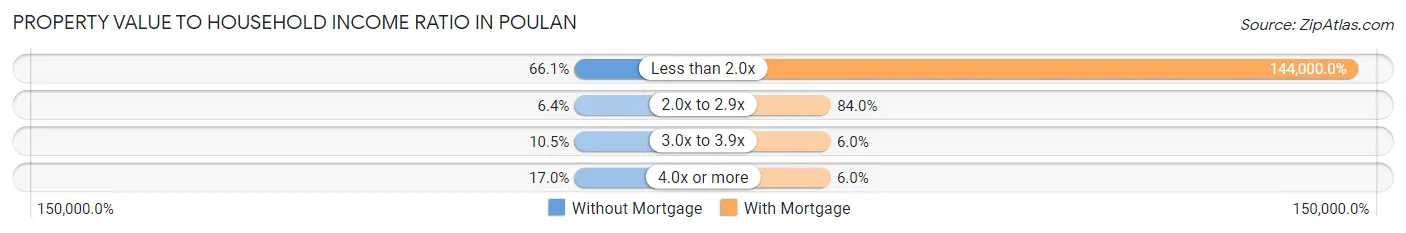
| Value-to-Income Ratio | Without Mortgage | With Mortgage |
| Less than 2.0x | 113 (66.1%) | 72,000 (144,000.0%) |
| 2.0x to 2.9x | 11 (6.4%) | 42 (84.0%) |
| 3.0x to 3.9x | 18 (10.5%) | 3 (6.0%) |
| 4.0x or more | 29 (17.0%) | 3 (6.0%) |
| Total | 171 (100.0%) | 50 (100.0%) |
Real Estate Taxes by Mortgage Status in Poulan
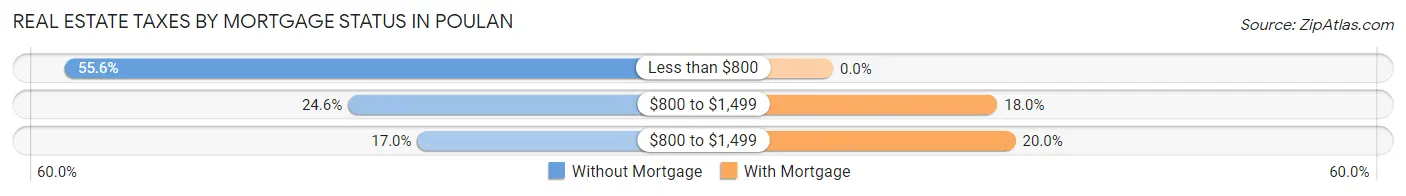
| Property Taxes | Without Mortgage | With Mortgage |
| Less than $800 | 95 (55.6%) | 0 (0.0%) |
| $800 to $1,499 | 42 (24.6%) | 9 (18.0%) |
| $800 to $1,499 | 29 (17.0%) | 10 (20.0%) |
| Total | 171 (100.0%) | 50 (100.0%) |
Health & Disability in Poulan
Health Insurance Coverage by Age in Poulan
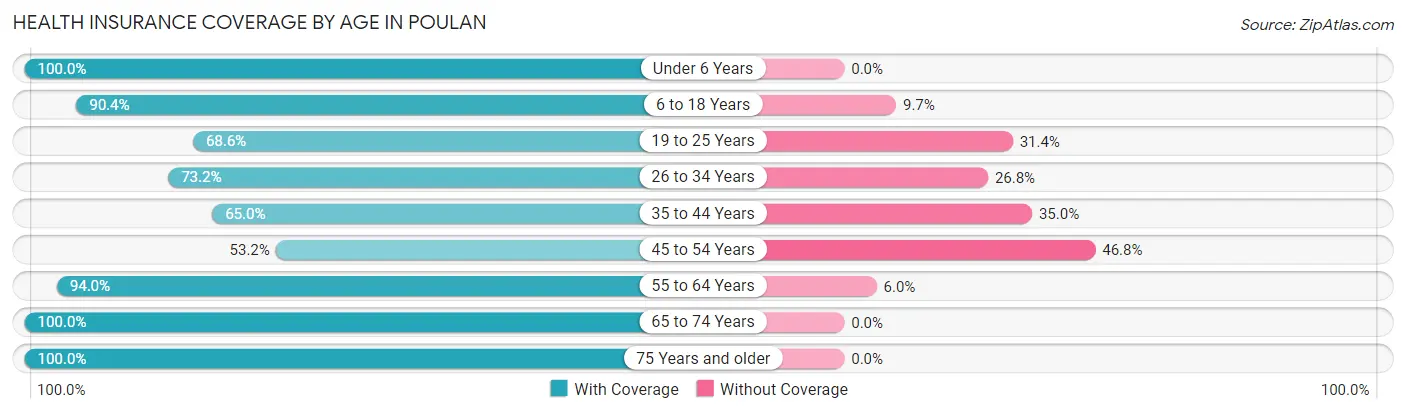
| Age Bracket | With Coverage | Without Coverage |
| Under 6 Years | 40 (100.0%) | 0 (0.0%) |
| 6 to 18 Years | 103 (90.3%) | 11 (9.7%) |
| 19 to 25 Years | 59 (68.6%) | 27 (31.4%) |
| 26 to 34 Years | 82 (73.2%) | 30 (26.8%) |
| 35 to 44 Years | 65 (65.0%) | 35 (35.0%) |
| 45 to 54 Years | 25 (53.2%) | 22 (46.8%) |
| 55 to 64 Years | 78 (94.0%) | 5 (6.0%) |
| 65 to 74 Years | 112 (100.0%) | 0 (0.0%) |
| 75 Years and older | 74 (100.0%) | 0 (0.0%) |
| Total | 638 (83.1%) | 130 (16.9%) |
Health Insurance Coverage by Citizenship Status in Poulan
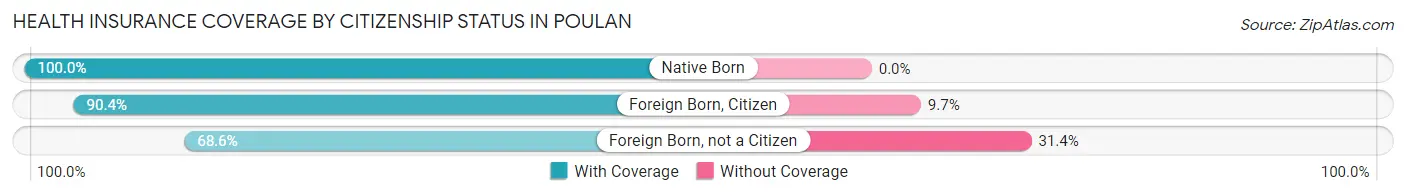
| Citizenship Status | With Coverage | Without Coverage |
| Native Born | 40 (100.0%) | 0 (0.0%) |
| Foreign Born, Citizen | 103 (90.3%) | 11 (9.7%) |
| Foreign Born, not a Citizen | 59 (68.6%) | 27 (31.4%) |
Health Insurance Coverage by Household Income in Poulan
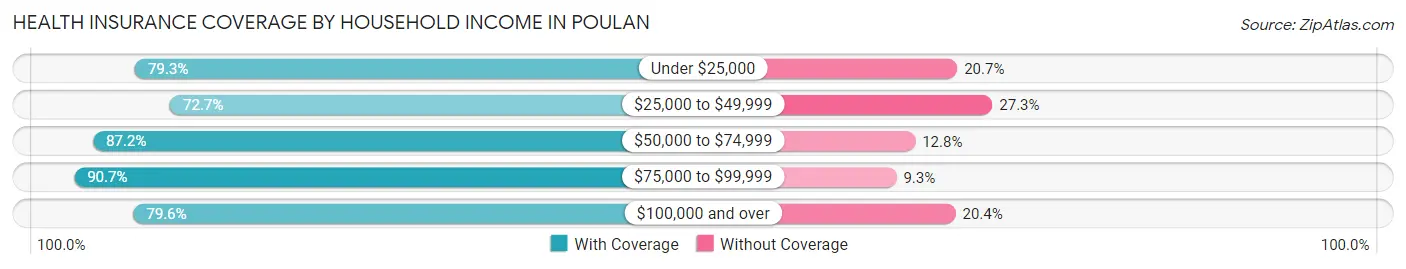
| Household Income | With Coverage | Without Coverage |
| Under $25,000 | 115 (79.3%) | 30 (20.7%) |
| $25,000 to $49,999 | 72 (72.7%) | 27 (27.3%) |
| $50,000 to $74,999 | 170 (87.2%) | 25 (12.8%) |
| $75,000 to $99,999 | 156 (90.7%) | 16 (9.3%) |
| $100,000 and over | 125 (79.6%) | 32 (20.4%) |
Public vs Private Health Insurance Coverage by Age in Poulan
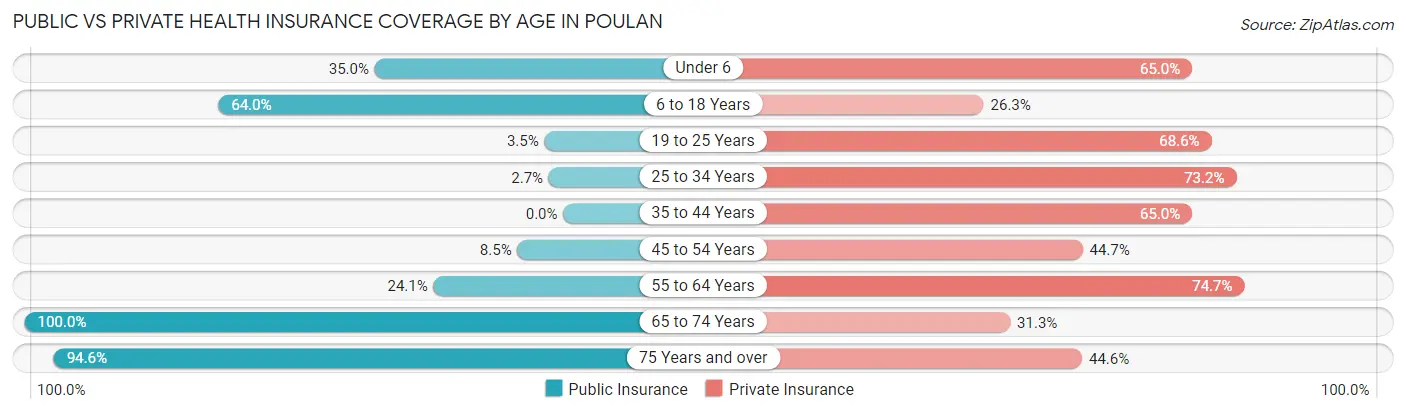
| Age Bracket | Public Insurance | Private Insurance |
| Under 6 | 14 (35.0%) | 26 (65.0%) |
| 6 to 18 Years | 73 (64.0%) | 30 (26.3%) |
| 19 to 25 Years | 3 (3.5%) | 59 (68.6%) |
| 25 to 34 Years | 3 (2.7%) | 82 (73.2%) |
| 35 to 44 Years | 0 (0.0%) | 65 (65.0%) |
| 45 to 54 Years | 4 (8.5%) | 21 (44.7%) |
| 55 to 64 Years | 20 (24.1%) | 62 (74.7%) |
| 65 to 74 Years | 112 (100.0%) | 35 (31.2%) |
| 75 Years and over | 70 (94.6%) | 33 (44.6%) |
| Total | 299 (38.9%) | 413 (53.8%) |
Disability Status by Sex by Age in Poulan
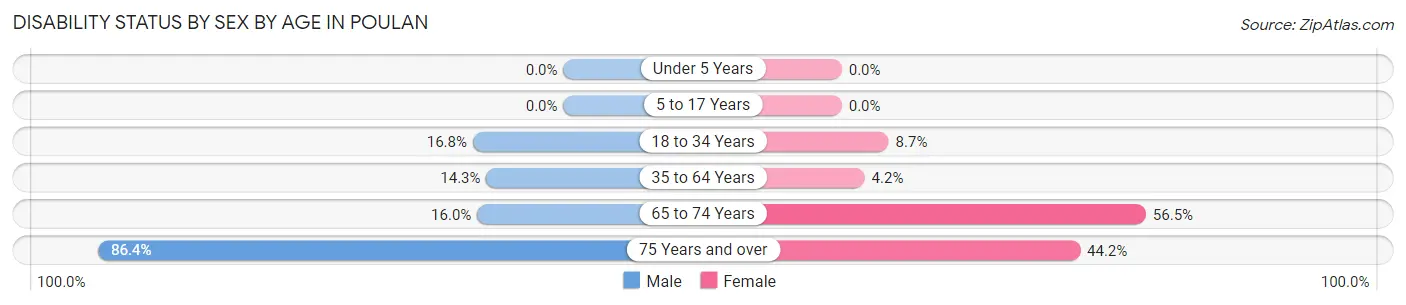
| Age Bracket | Male | Female |
| Under 5 Years | 0 (0.0%) | 0 (0.0%) |
| 5 to 17 Years | 0 (0.0%) | 0 (0.0%) |
| 18 to 34 Years | 20 (16.8%) | 8 (8.7%) |
| 35 to 64 Years | 16 (14.3%) | 5 (4.2%) |
| 65 to 74 Years | 8 (16.0%) | 35 (56.5%) |
| 75 Years and over | 19 (86.4%) | 23 (44.2%) |
Disability Class by Sex by Age in Poulan
Disability Class: Hearing Difficulty
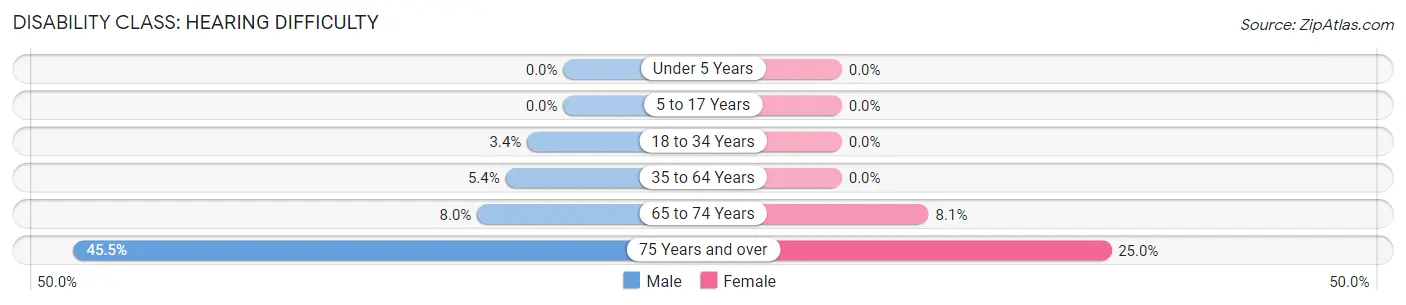
| Age Bracket | Male | Female |
| Under 5 Years | 0 (0.0%) | 0 (0.0%) |
| 5 to 17 Years | 0 (0.0%) | 0 (0.0%) |
| 18 to 34 Years | 4 (3.4%) | 0 (0.0%) |
| 35 to 64 Years | 6 (5.4%) | 0 (0.0%) |
| 65 to 74 Years | 4 (8.0%) | 5 (8.1%) |
| 75 Years and over | 10 (45.5%) | 13 (25.0%) |
Disability Class: Vision Difficulty
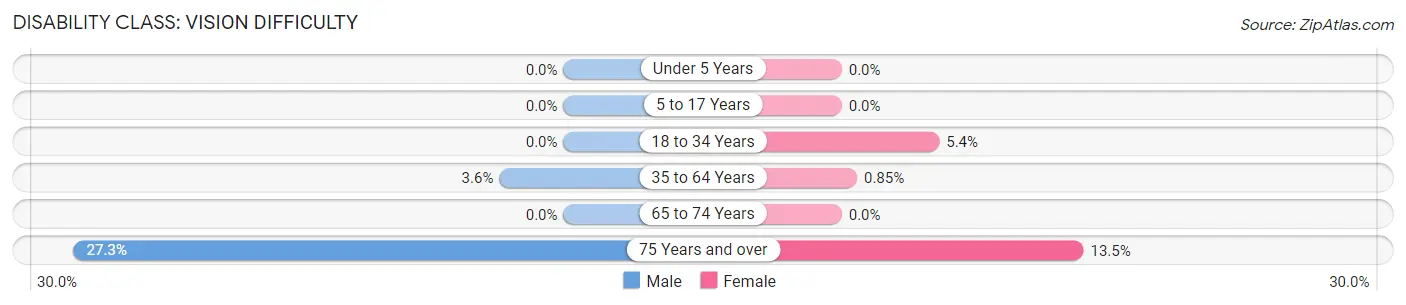
| Age Bracket | Male | Female |
| Under 5 Years | 0 (0.0%) | 0 (0.0%) |
| 5 to 17 Years | 0 (0.0%) | 0 (0.0%) |
| 18 to 34 Years | 0 (0.0%) | 5 (5.4%) |
| 35 to 64 Years | 4 (3.6%) | 1 (0.9%) |
| 65 to 74 Years | 0 (0.0%) | 0 (0.0%) |
| 75 Years and over | 6 (27.3%) | 7 (13.5%) |
Disability Class: Cognitive Difficulty
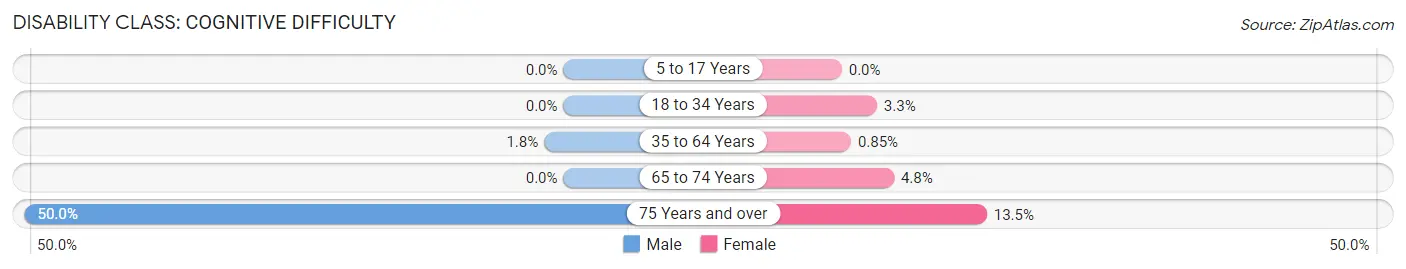
| Age Bracket | Male | Female |
| 5 to 17 Years | 0 (0.0%) | 0 (0.0%) |
| 18 to 34 Years | 0 (0.0%) | 3 (3.3%) |
| 35 to 64 Years | 2 (1.8%) | 1 (0.9%) |
| 65 to 74 Years | 0 (0.0%) | 3 (4.8%) |
| 75 Years and over | 11 (50.0%) | 7 (13.5%) |
Disability Class: Ambulatory Difficulty
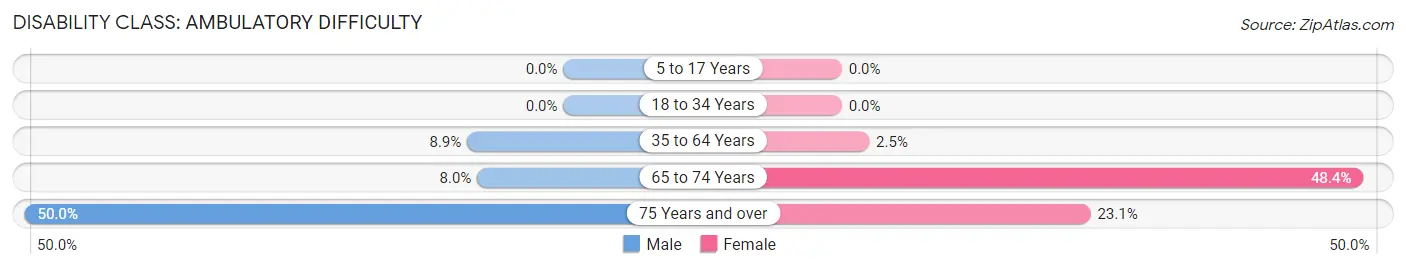
| Age Bracket | Male | Female |
| 5 to 17 Years | 0 (0.0%) | 0 (0.0%) |
| 18 to 34 Years | 0 (0.0%) | 0 (0.0%) |
| 35 to 64 Years | 10 (8.9%) | 3 (2.5%) |
| 65 to 74 Years | 4 (8.0%) | 30 (48.4%) |
| 75 Years and over | 11 (50.0%) | 12 (23.1%) |
Disability Class: Self-Care Difficulty
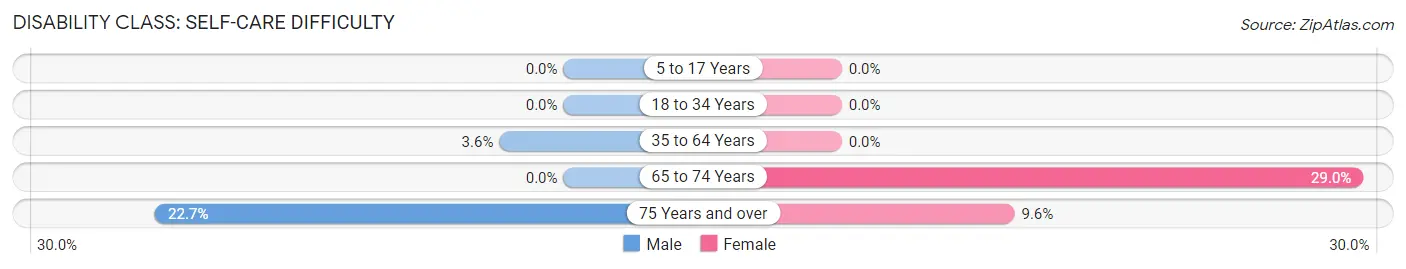
| Age Bracket | Male | Female |
| 5 to 17 Years | 0 (0.0%) | 0 (0.0%) |
| 18 to 34 Years | 0 (0.0%) | 0 (0.0%) |
| 35 to 64 Years | 4 (3.6%) | 0 (0.0%) |
| 65 to 74 Years | 0 (0.0%) | 18 (29.0%) |
| 75 Years and over | 5 (22.7%) | 5 (9.6%) |
Technology Access in Poulan
Computing Device Access in Poulan
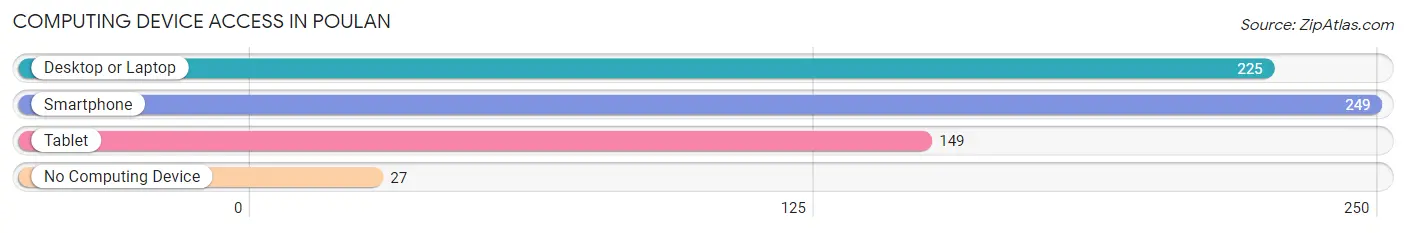
| Device Type | # Households | % Households |
| Desktop or Laptop | 225 | 76.5% |
| Smartphone | 249 | 84.7% |
| Tablet | 149 | 50.7% |
| No Computing Device | 27 | 9.2% |
| Total | 294 | 100.0% |
Internet Access in Poulan
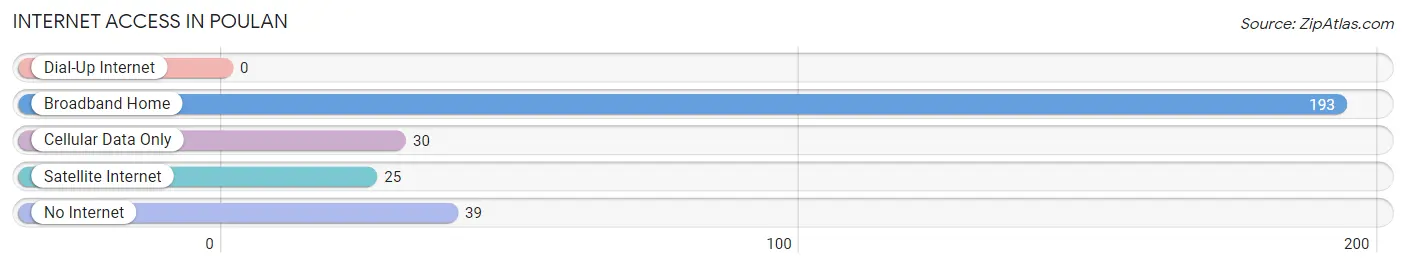
| Internet Type | # Households | % Households |
| Dial-Up Internet | 0 | 0.0% |
| Broadband Home | 193 | 65.6% |
| Cellular Data Only | 30 | 10.2% |
| Satellite Internet | 25 | 8.5% |
| No Internet | 39 | 13.3% |
| Total | 294 | 100.0% |
Poulan Summary
Poulan, Georgia is a small town located in Worth County, Georgia. It is situated about 10 miles south of Sylvester, Georgia and about 20 miles north of Albany, Georgia. The population of Poulan was estimated to be 1,072 in 2019.
History
Poulan was founded in 1891 by the Poulan family, who were originally from France. The town was named after the family’s ancestor, Pierre Poulan. The town was originally a farming community, and the Poulan family owned a large amount of land in the area. The town was incorporated in 1895.
In the early 1900s, the town began to grow and develop. The first school was built in 1906, and the first post office was established in 1907. The town also had a cotton gin, a sawmill, and a grist mill.
In the 1920s, the town began to decline due to the Great Depression. Many of the businesses in the town closed, and the population decreased. However, the town began to recover in the 1940s, and the population began to grow again.
Geography
Poulan is located in Worth County, Georgia. It is situated about 10 miles south of Sylvester, Georgia and about 20 miles north of Albany, Georgia. The town is located in the southeastern part of the state, and is surrounded by rural farmland. The town is located on the banks of the Flint River, and is about 30 miles from the Gulf of Mexico.
The climate in Poulan is humid subtropical, with hot summers and mild winters. The average temperature in the summer is around 90 degrees Fahrenheit, and the average temperature in the winter is around 50 degrees Fahrenheit.
Economy
The economy of Poulan is largely based on agriculture. The town is home to several farms, and the surrounding area is known for its production of cotton, peanuts, and corn. The town also has several small businesses, including a grocery store, a hardware store, and a few restaurants.
The town is also home to a few manufacturing companies, including a furniture factory and a paper mill. The town is also home to a few small businesses, such as a barber shop and a beauty salon.
Demographics
The population of Poulan was estimated to be 1,072 in 2019. The town is predominantly white, with about 90% of the population being white. The remaining 10% of the population is made up of African Americans, Hispanics, and other races.
The median household income in Poulan is $31,250, and the median home value is $87,500. The town has a poverty rate of about 20%, and the unemployment rate is about 6%.
Conclusion
Poulan, Georgia is a small town located in Worth County, Georgia. It was founded in 1891 by the Poulan family, and was originally a farming community. The town has a population of 1,072, and the economy is largely based on agriculture. The town is predominantly white, with a median household income of $31,250 and a median home value of $87,500.
Common Questions
What is Per Capita Income in Poulan?
Per Capita income in Poulan is $25,186.
What is the Median Family Income in Poulan?
Median Family Income in Poulan is $71,111.
What is the Median Household income in Poulan?
Median Household Income in Poulan is $63,182.
What is Income or Wage Gap in Poulan?
Income or Wage Gap in Poulan is 44.8%.
Women in Poulan earn 55.2 cents for every dollar earned by a man.
What is Inequality or Gini Index in Poulan?
Inequality or Gini Index in Poulan is 0.40.
What is the Total Population of Poulan?
Total Population of Poulan is 768.
What is the Total Male Population of Poulan?
Total Male Population of Poulan is 376.
What is the Total Female Population of Poulan?
Total Female Population of Poulan is 392.
What is the Ratio of Males per 100 Females in Poulan?
There are 95.92 Males per 100 Females in Poulan.
What is the Ratio of Females per 100 Males in Poulan?
There are 104.26 Females per 100 Males in Poulan.
What is the Median Population Age in Poulan?
Median Population Age in Poulan is 38.1 Years.
What is the Average Family Size in Poulan
Average Family Size in Poulan is 3.0 People.
What is the Average Household Size in Poulan
Average Household Size in Poulan is 2.6 People.
How Large is the Labor Force in Poulan?
There are 372 People in the Labor Forcein in Poulan.
What is the Percentage of People in the Labor Force in Poulan?
56.2% of People are in the Labor Force in Poulan.
What is the Unemployment Rate in Poulan?
Unemployment Rate in Poulan is 2.7%.