Plains, GA Map & Demographics
Plains Map
Plains Overview
$16,094
PER CAPITA INCOME
$36,338
AVG FAMILY INCOME
$36,138
AVG HOUSEHOLD INCOME
39.0%
WAGE / INCOME GAP [ % ]
61.0¢/ $1
WAGE / INCOME GAP [ $ ]
0.40
INEQUALITY / GINI INDEX
781
TOTAL POPULATION
310
MALE POPULATION
471
FEMALE POPULATION
65.82
MALES / 100 FEMALES
151.94
FEMALES / 100 MALES
42.1
MEDIAN AGE
3.4
AVG FAMILY SIZE
2.9
AVG HOUSEHOLD SIZE
190
LABOR FORCE [ PEOPLE ]
41.2%
PERCENT IN LABOR FORCE
Plains Zip Codes
Plains Area Codes
Income in Plains
Income Overview in Plains
Per Capita Income in Plains is $16,094, while median incomes of families and households are $36,338 and $36,138 respectively.
| Characteristic | Number | Measure |
| Per Capita Income | 781 | $16,094 |
| Median Family Income | 183 | $36,338 |
| Mean Family Income | 183 | $46,925 |
| Median Household Income | 235 | $36,138 |
| Mean Household Income | 235 | $45,053 |
| Income Deficit | 183 | $0 |
| Wage / Income Gap (%) | 781 | 39.03% |
| Wage / Income Gap ($) | 781 | 60.97¢ per $1 |
| Gini / Inequality Index | 781 | 0.40 |
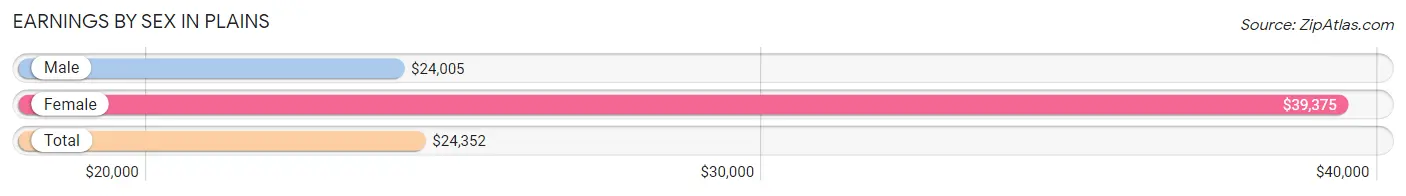
Earnings by Sex in Plains
Average Earnings in Plains are $24,352, $24,005 for men and $39,375 for women, a difference of 39.0%.
| Sex | Number | Average Earnings |
| Male | 142 (72.5%) | $24,005 |
| Female | 54 (27.6%) | $39,375 |
| Total | 196 (100.0%) | $24,352 |
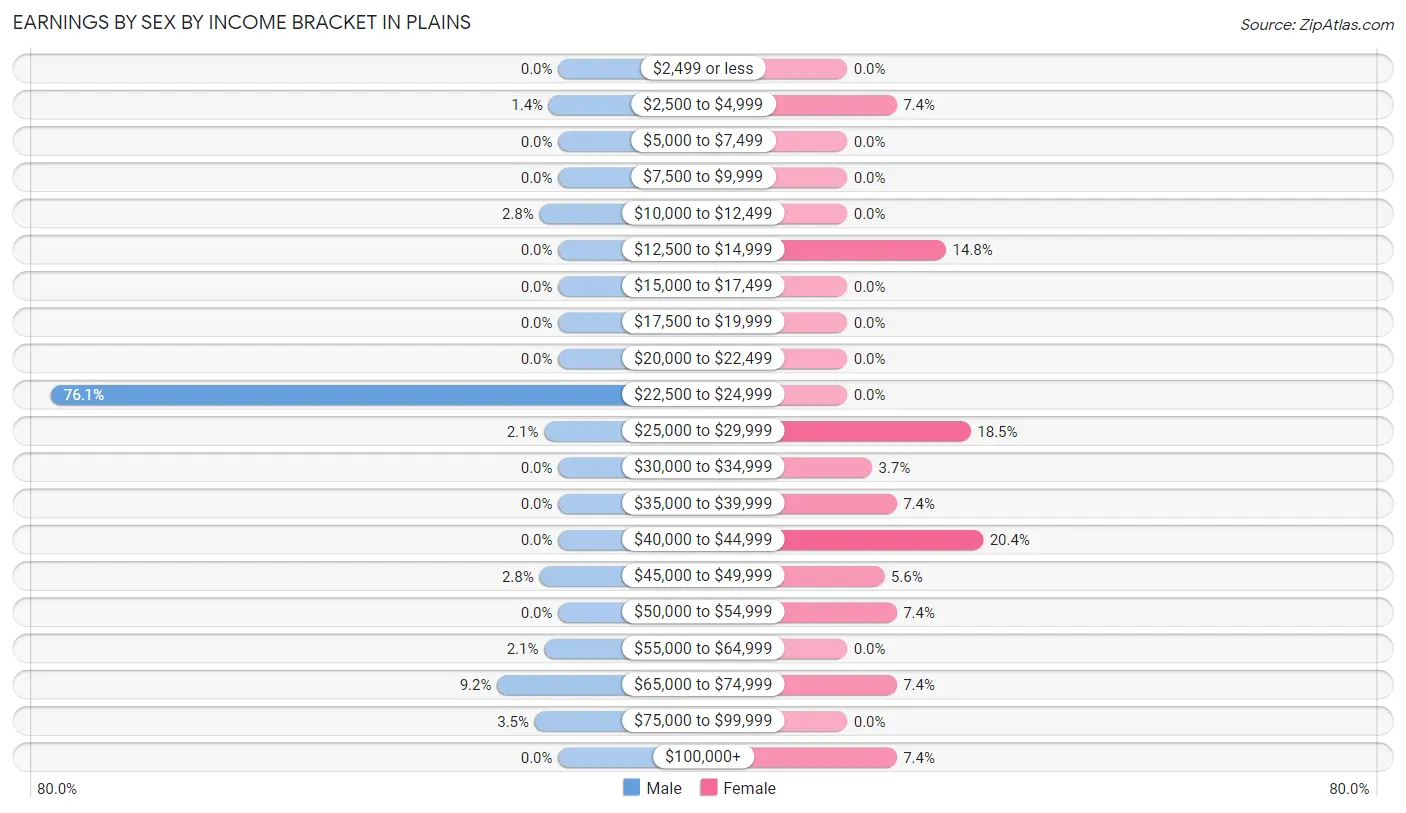
Earnings by Sex by Income Bracket in Plains
The most common earnings brackets in Plains are $22,500 to $24,999 for men (108 | 76.1%) and $40,000 to $44,999 for women (11 | 20.4%).
| Income | Male | Female |
| $2,499 or less | 0 (0.0%) | 0 (0.0%) |
| $2,500 to $4,999 | 2 (1.4%) | 4 (7.4%) |
| $5,000 to $7,499 | 0 (0.0%) | 0 (0.0%) |
| $7,500 to $9,999 | 0 (0.0%) | 0 (0.0%) |
| $10,000 to $12,499 | 4 (2.8%) | 0 (0.0%) |
| $12,500 to $14,999 | 0 (0.0%) | 8 (14.8%) |
| $15,000 to $17,499 | 0 (0.0%) | 0 (0.0%) |
| $17,500 to $19,999 | 0 (0.0%) | 0 (0.0%) |
| $20,000 to $22,499 | 0 (0.0%) | 0 (0.0%) |
| $22,500 to $24,999 | 108 (76.1%) | 0 (0.0%) |
| $25,000 to $29,999 | 3 (2.1%) | 10 (18.5%) |
| $30,000 to $34,999 | 0 (0.0%) | 2 (3.7%) |
| $35,000 to $39,999 | 0 (0.0%) | 4 (7.4%) |
| $40,000 to $44,999 | 0 (0.0%) | 11 (20.4%) |
| $45,000 to $49,999 | 4 (2.8%) | 3 (5.6%) |
| $50,000 to $54,999 | 0 (0.0%) | 4 (7.4%) |
| $55,000 to $64,999 | 3 (2.1%) | 0 (0.0%) |
| $65,000 to $74,999 | 13 (9.1%) | 4 (7.4%) |
| $75,000 to $99,999 | 5 (3.5%) | 0 (0.0%) |
| $100,000+ | 0 (0.0%) | 4 (7.4%) |
| Total | 142 (100.0%) | 54 (100.0%) |
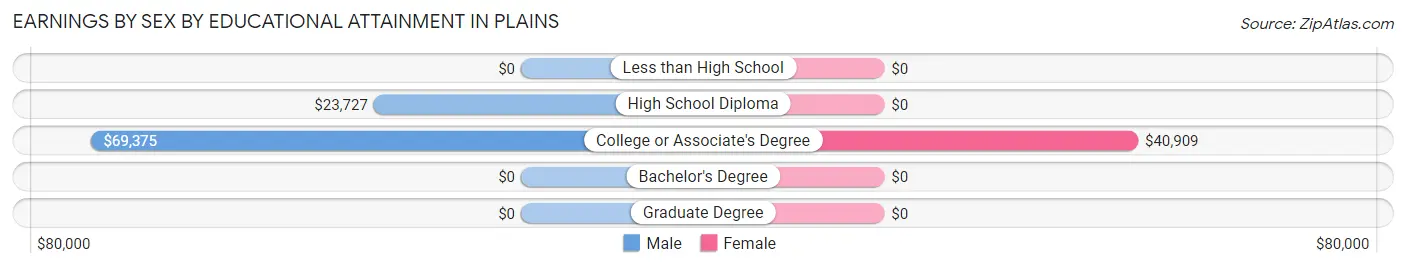
Earnings by Sex by Educational Attainment in Plains
Average earnings in Plains are $24,051 for men and $40,227 for women, a difference of 40.2%. Men with an educational attainment of college or associate's degree enjoy the highest average annual earnings of $69,375, while those with high school diploma education earn the least with $23,727. Women with an educational attainment of college or associate's degree earn the most with the average annual earnings of $40,909, while those with college or associate's degree education have the smallest earnings of $40,909.
| Educational Attainment | Male Income | Female Income |
| Less than High School | - | - |
| High School Diploma | $23,727 | $0 |
| College or Associate's Degree | $69,375 | $40,909 |
| Bachelor's Degree | - | - |
| Graduate Degree | - | - |
| Total | $24,051 | $40,227 |
Family Income in Plains
Family Income Brackets in Plains
According to the Plains family income data, there are 107 families falling into the $35,000 to $49,999 income range, which is the most common income bracket and makes up 58.5% of all families. Conversely, the $75,000 to $99,999 income bracket is the least frequent group with only 2 families (1.1%) belonging to this category.
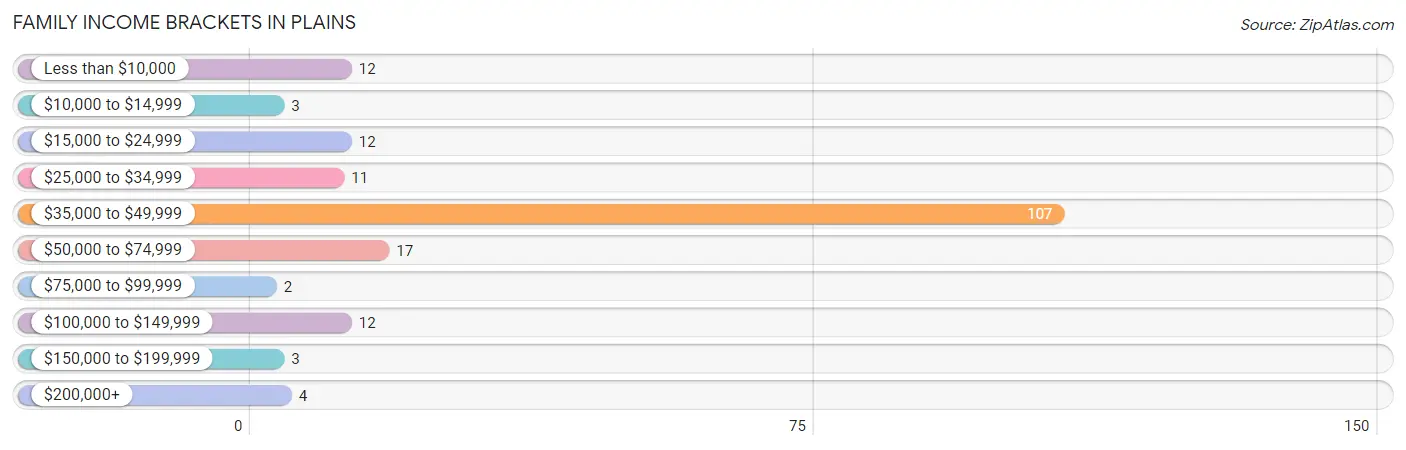
| Income Bracket | # Families | % Families |
| Less than $10,000 | 12 | 6.6% |
| $10,000 to $14,999 | 3 | 1.6% |
| $15,000 to $24,999 | 12 | 6.6% |
| $25,000 to $34,999 | 11 | 6.0% |
| $35,000 to $49,999 | 107 | 58.5% |
| $50,000 to $74,999 | 17 | 9.3% |
| $75,000 to $99,999 | 2 | 1.1% |
| $100,000 to $149,999 | 12 | 6.6% |
| $150,000 to $199,999 | 3 | 1.6% |
| $200,000+ | 4 | 2.2% |
Family Income by Famaliy Size in Plains
3-person families (103 | 56.3%) account for the highest median family income in Plains with $36,213 per family, while 2-person families (58 | 31.7%) have the highest median income of $15,312 per family member.
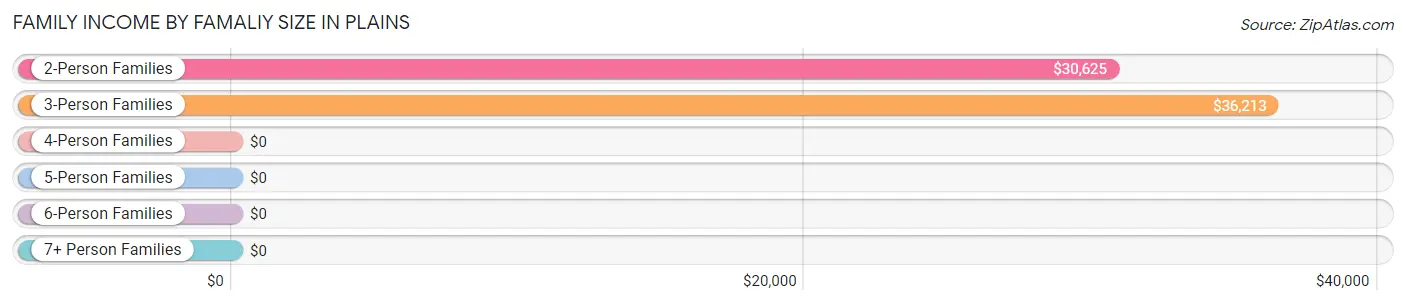
| Income Bracket | # Families | Median Income |
| 2-Person Families | 58 (31.7%) | $30,625 |
| 3-Person Families | 103 (56.3%) | $36,213 |
| 4-Person Families | 20 (10.9%) | $0 |
| 5-Person Families | 2 (1.1%) | $0 |
| 6-Person Families | 0 (0.0%) | $0 |
| 7+ Person Families | 0 (0.0%) | $0 |
| Total | 183 (100.0%) | $36,338 |
Family Income by Number of Earners in Plains
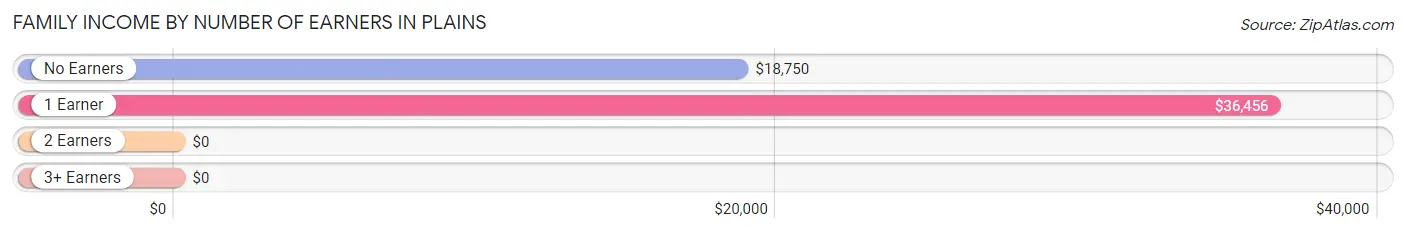
| Number of Earners | # Families | Median Income |
| No Earners | 42 (23.0%) | $18,750 |
| 1 Earner | 113 (61.8%) | $36,456 |
| 2 Earners | 26 (14.2%) | $0 |
| 3+ Earners | 2 (1.1%) | $0 |
| Total | 183 (100.0%) | $36,338 |
Household Income in Plains
Household Income Brackets in Plains
With 107 households falling in the category, the $35,000 to $49,999 income range is the most frequent in Plains, accounting for 45.5% of all households. In contrast, only 3 households (1.3%) fall into the $150,000 to $199,999 income bracket, making it the least populous group.
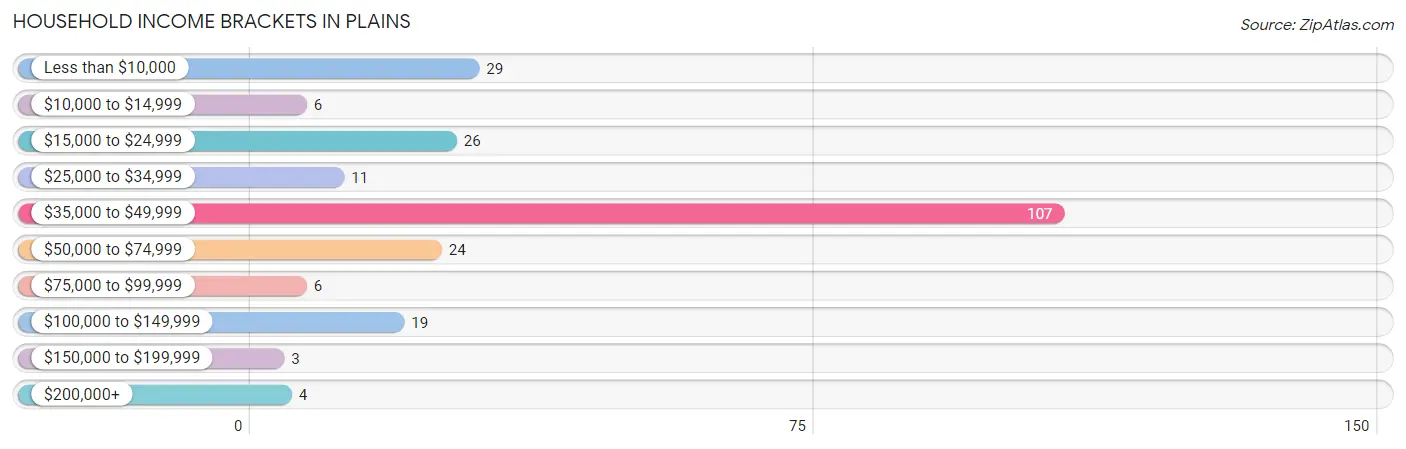
| Income Bracket | # Households | % Households |
| Less than $10,000 | 29 | 12.3% |
| $10,000 to $14,999 | 6 | 2.6% |
| $15,000 to $24,999 | 26 | 11.1% |
| $25,000 to $34,999 | 11 | 4.7% |
| $35,000 to $49,999 | 107 | 45.5% |
| $50,000 to $74,999 | 24 | 10.2% |
| $75,000 to $99,999 | 6 | 2.6% |
| $100,000 to $149,999 | 19 | 8.1% |
| $150,000 to $199,999 | 3 | 1.3% |
| $200,000+ | 4 | 1.7% |
Household Income by Householder Age in Plains
The median household income in Plains is $36,138, with the highest median household income of $36,430 found in the 25 to 44 years age bracket for the primary householder. A total of 127 households (54.0%) fall into this category.
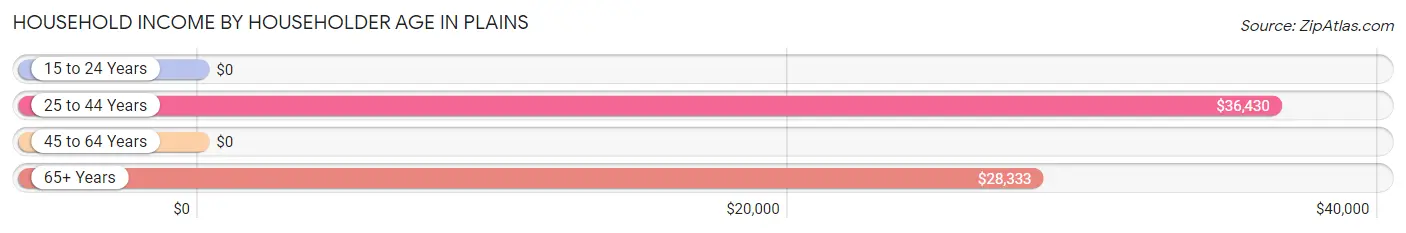
| Income Bracket | # Households | Median Income |
| 15 to 24 Years | 0 (0.0%) | $0 |
| 25 to 44 Years | 127 (54.0%) | $36,430 |
| 45 to 64 Years | 34 (14.5%) | $0 |
| 65+ Years | 74 (31.5%) | $28,333 |
| Total | 235 (100.0%) | $36,138 |
Poverty in Plains
Income Below Poverty by Sex and Age in Plains
With 11.9% poverty level for males and 8.3% for females among the residents of Plains, 45 to 54 year old males and 35 to 44 year old females are the most vulnerable to poverty, with 10 males (43.5%) and 17 females (36.2%) in their respective age groups living below the poverty level.
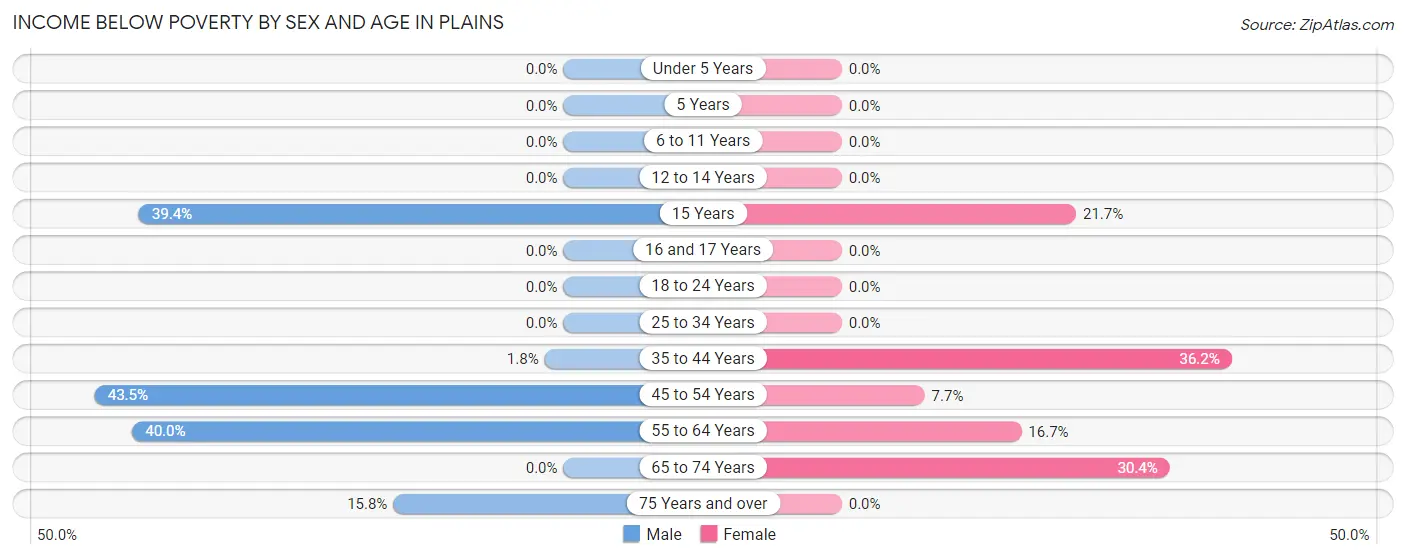
| Age Bracket | Male | Female |
| Under 5 Years | 0 (0.0%) | 0 (0.0%) |
| 5 Years | 0 (0.0%) | 0 (0.0%) |
| 6 to 11 Years | 0 (0.0%) | 0 (0.0%) |
| 12 to 14 Years | 0 (0.0%) | 0 (0.0%) |
| 15 Years | 13 (39.4%) | 5 (21.7%) |
| 16 and 17 Years | 0 (0.0%) | 0 (0.0%) |
| 18 to 24 Years | 0 (0.0%) | 0 (0.0%) |
| 25 to 34 Years | 0 (0.0%) | 0 (0.0%) |
| 35 to 44 Years | 2 (1.8%) | 17 (36.2%) |
| 45 to 54 Years | 10 (43.5%) | 3 (7.7%) |
| 55 to 64 Years | 2 (40.0%) | 4 (16.7%) |
| 65 to 74 Years | 0 (0.0%) | 7 (30.4%) |
| 75 Years and over | 3 (15.8%) | 0 (0.0%) |
| Total | 30 (11.9%) | 36 (8.3%) |
Income Above Poverty by Sex and Age in Plains
According to the poverty statistics in Plains, males aged 12 to 14 years and females aged under 5 years are the age groups that are most secure financially, with 100.0% of males and 100.0% of females in these age groups living above the poverty line.
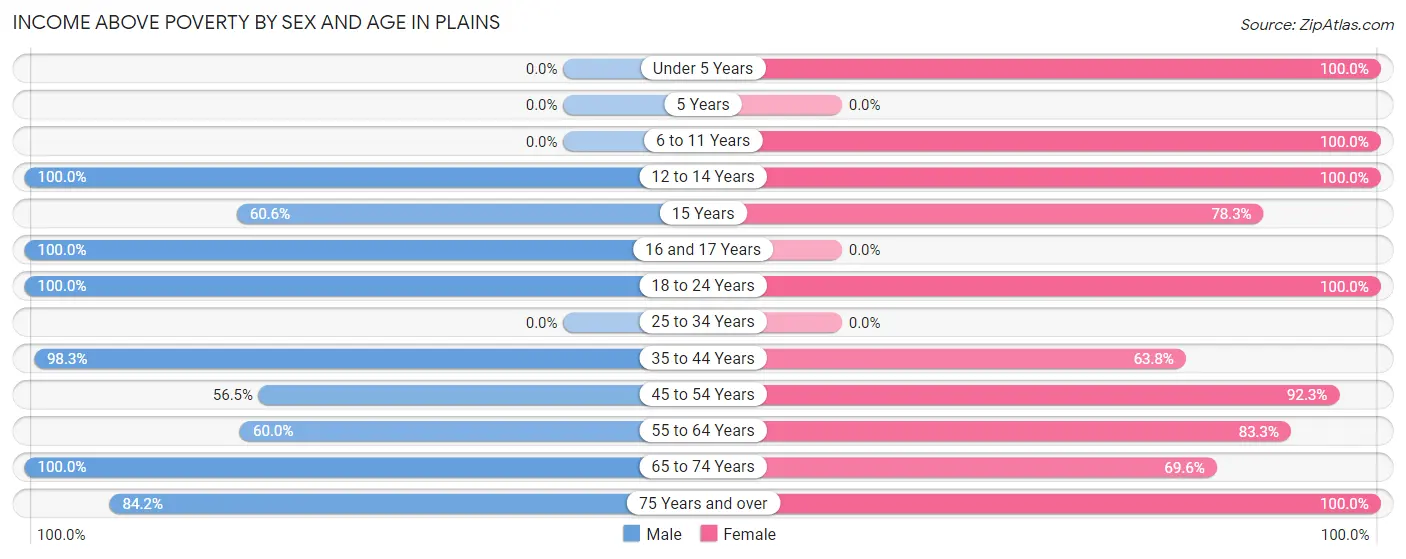
| Age Bracket | Male | Female |
| Under 5 Years | 0 (0.0%) | 6 (100.0%) |
| 5 Years | 0 (0.0%) | 0 (0.0%) |
| 6 to 11 Years | 0 (0.0%) | 231 (100.0%) |
| 12 to 14 Years | 9 (100.0%) | 18 (100.0%) |
| 15 Years | 20 (60.6%) | 18 (78.3%) |
| 16 and 17 Years | 8 (100.0%) | 0 (0.0%) |
| 18 to 24 Years | 14 (100.0%) | 4 (100.0%) |
| 25 to 34 Years | 0 (0.0%) | 0 (0.0%) |
| 35 to 44 Years | 112 (98.3%) | 30 (63.8%) |
| 45 to 54 Years | 13 (56.5%) | 36 (92.3%) |
| 55 to 64 Years | 3 (60.0%) | 20 (83.3%) |
| 65 to 74 Years | 26 (100.0%) | 16 (69.6%) |
| 75 Years and over | 16 (84.2%) | 20 (100.0%) |
| Total | 221 (88.0%) | 399 (91.7%) |
Income Below Poverty Among Married-Couple Families in Plains
The poverty statistics for married-couple families in Plains show that 1.3% or 2 of the total 156 families live below the poverty line. Families with no children have the highest poverty rate of 5.4%, comprising of 2 families. On the other hand, families with 1 or 2 children have the lowest poverty rate of 0.0%, which includes 0 families.
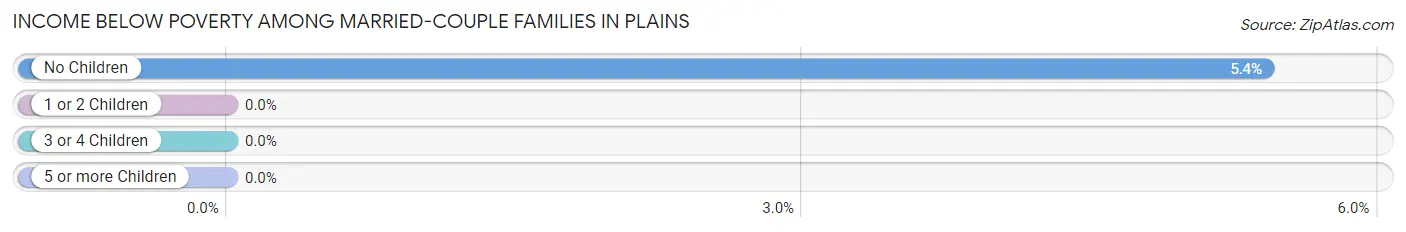
| Children | Above Poverty | Below Poverty |
| No Children | 35 (94.6%) | 2 (5.4%) |
| 1 or 2 Children | 119 (100.0%) | 0 (0.0%) |
| 3 or 4 Children | 0 (0.0%) | 0 (0.0%) |
| 5 or more Children | 0 (0.0%) | 0 (0.0%) |
| Total | 154 (98.7%) | 2 (1.3%) |
Income Below Poverty Among Single-Parent Households in Plains
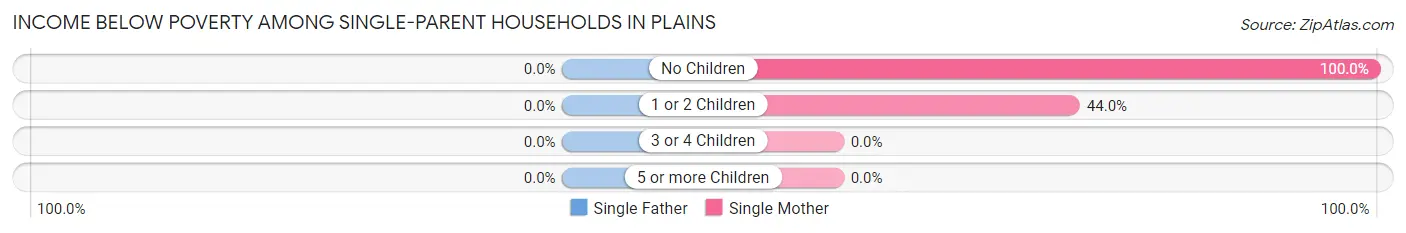
| Children | Single Father | Single Mother |
| No Children | 0 (0.0%) | 2 (100.0%) |
| 1 or 2 Children | 0 (0.0%) | 11 (44.0%) |
| 3 or 4 Children | 0 (0.0%) | 0 (0.0%) |
| 5 or more Children | 0 (0.0%) | 0 (0.0%) |
| Total | 0 (0.0%) | 13 (48.1%) |
Income Below Poverty Among Married-Couple vs Single-Parent Households in Plains
The poverty data for Plains shows that 2 of the married-couple family households (1.3%) and 13 of the single-parent households (48.1%) are living below the poverty level. Within the married-couple family households, those with no children have the highest poverty rate, with 2 households (5.4%) falling below the poverty line. Among the single-parent households, those with no children have the highest poverty rate, with 2 household (100.0%) living below poverty.
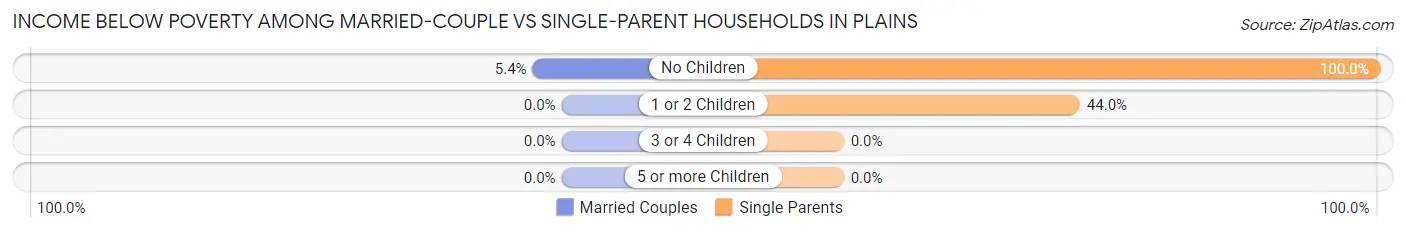
| Children | Married-Couple Families | Single-Parent Households |
| No Children | 2 (5.4%) | 2 (100.0%) |
| 1 or 2 Children | 0 (0.0%) | 11 (44.0%) |
| 3 or 4 Children | 0 (0.0%) | 0 (0.0%) |
| 5 or more Children | 0 (0.0%) | 0 (0.0%) |
| Total | 2 (1.3%) | 13 (48.1%) |
Race in Plains
The most populous races in Plains are Black / African American (440 | 56.3%), White / Caucasian (322 | 41.2%), and Hispanic or Latino (42 | 5.4%).
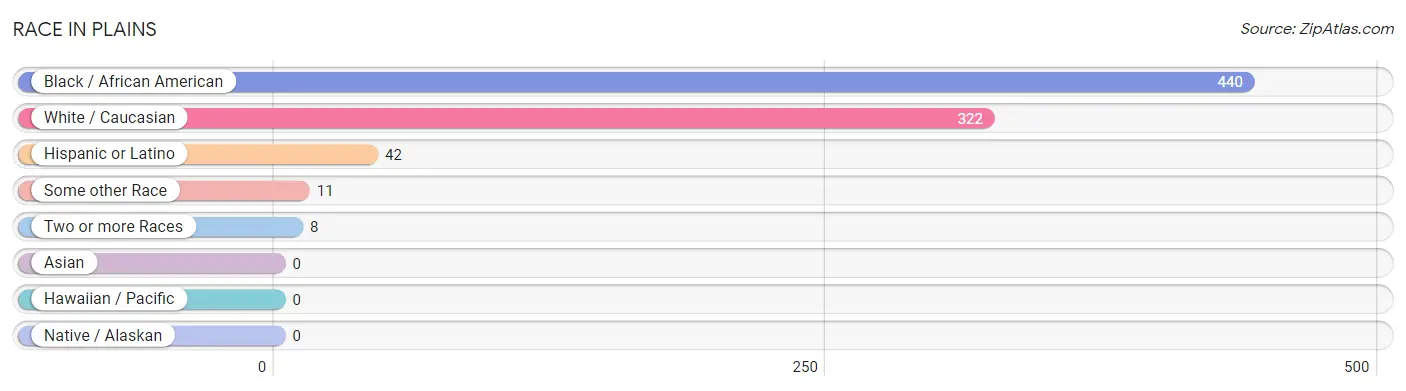
| Race | # Population | % Population |
| Asian | 0 | 0.0% |
| Black / African American | 440 | 56.3% |
| Hawaiian / Pacific | 0 | 0.0% |
| Hispanic or Latino | 42 | 5.4% |
| Native / Alaskan | 0 | 0.0% |
| White / Caucasian | 322 | 41.2% |
| Two or more Races | 8 | 1.0% |
| Some other Race | 11 | 1.4% |
| Total | 781 | 100.0% |
Ancestry in Plains
The most populous ancestries reported in Plains are Mexican (42 | 5.4%), Irish (34 | 4.3%), English (29 | 3.7%), American (23 | 2.9%), and European (11 | 1.4%), together accounting for 17.8% of all Plains residents.
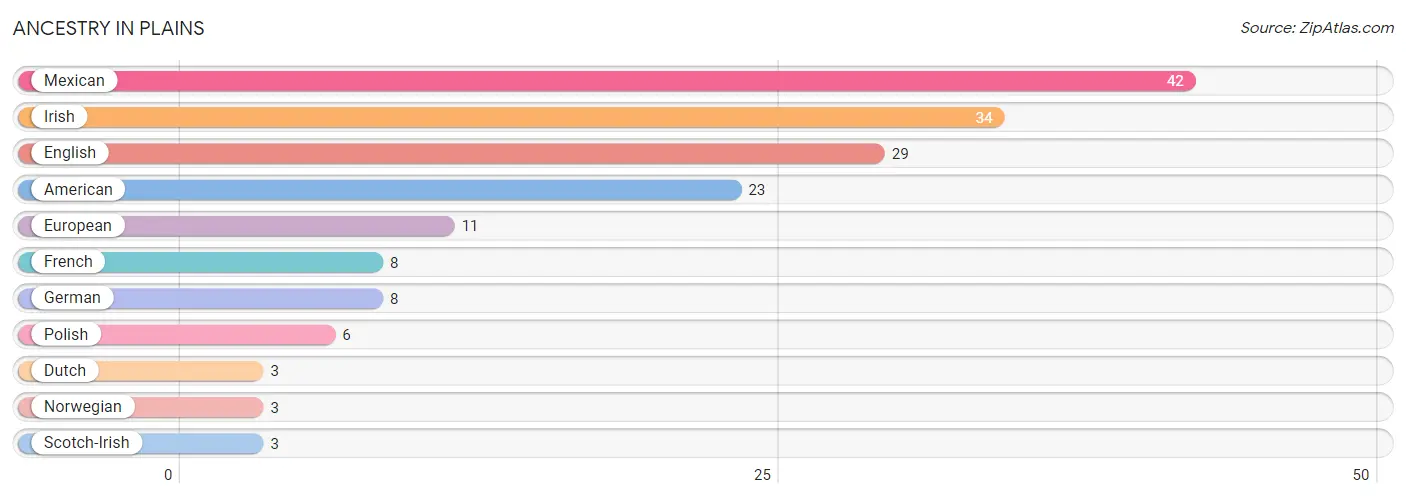
| Ancestry | # Population | % Population |
| American | 23 | 2.9% |
| Dutch | 3 | 0.4% |
| English | 29 | 3.7% |
| European | 11 | 1.4% |
| French | 8 | 1.0% |
| German | 8 | 1.0% |
| Irish | 34 | 4.3% |
| Mexican | 42 | 5.4% |
| Norwegian | 3 | 0.4% |
| Polish | 6 | 0.8% |
| Scotch-Irish | 3 | 0.4% | View All 11 Rows |
Immigrants in Plains
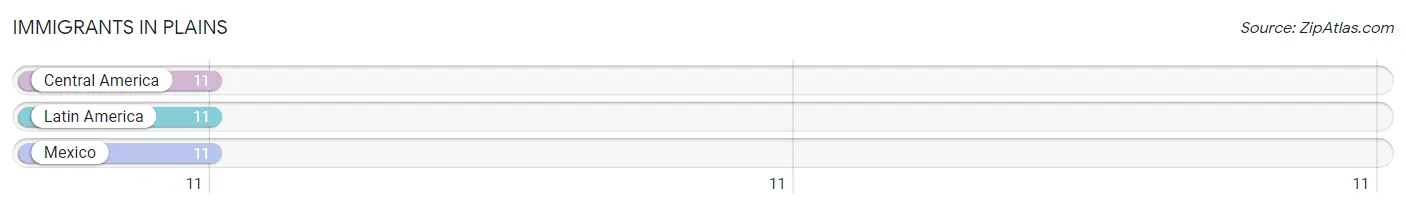
The most numerous immigrant groups reported in Plains came from Central America (11 | 1.4%), Latin America (11 | 1.4%), and Mexico (11 | 1.4%), together accounting for 4.2% of all Plains residents.
| Immigration Origin | # Population | % Population |
| Central America | 11 | 1.4% |
| Latin America | 11 | 1.4% |
| Mexico | 11 | 1.4% | View All 3 Rows |
Sex and Age in Plains
Sex and Age in Plains
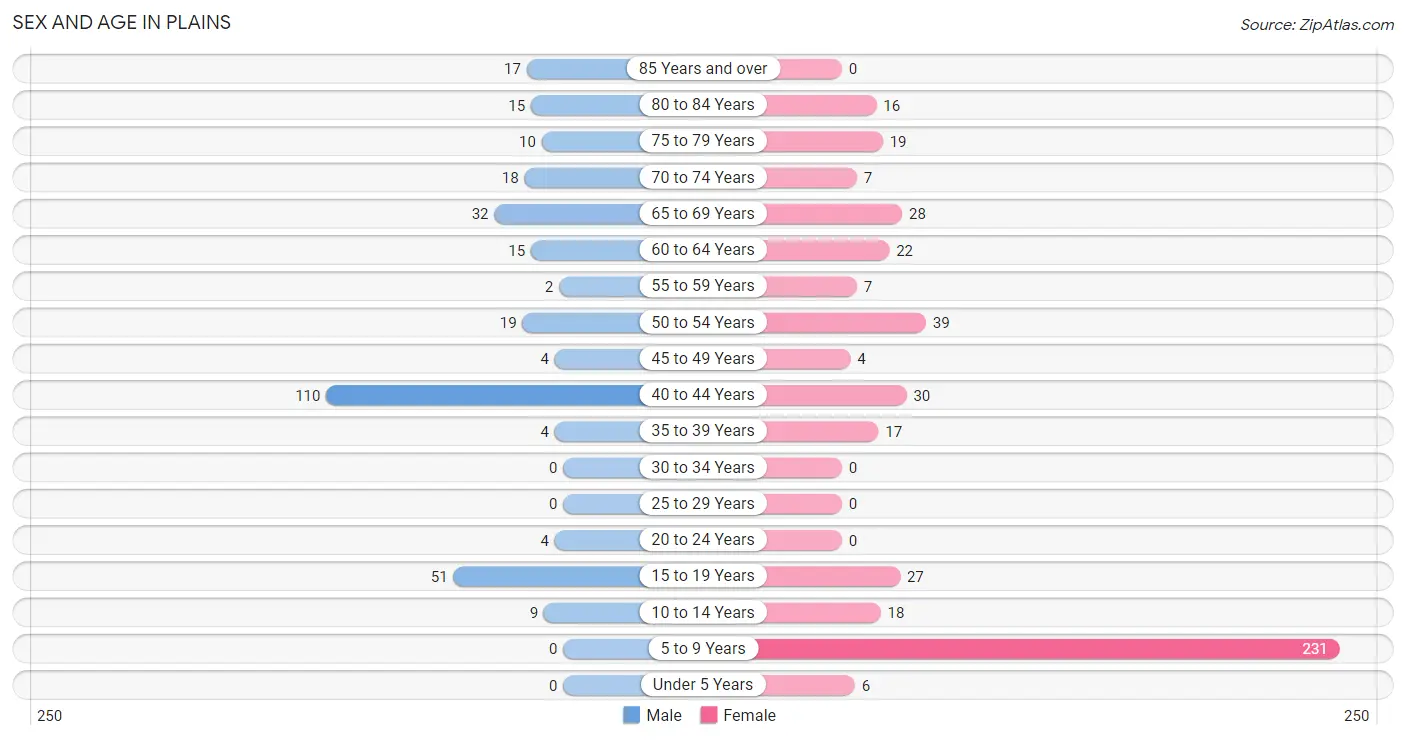
The most populous age groups in Plains are 40 to 44 Years (110 | 35.5%) for men and 5 to 9 Years (231 | 49.0%) for women.
| Age Bracket | Male | Female |
| Under 5 Years | 0 (0.0%) | 6 (1.3%) |
| 5 to 9 Years | 0 (0.0%) | 231 (49.0%) |
| 10 to 14 Years | 9 (2.9%) | 18 (3.8%) |
| 15 to 19 Years | 51 (16.5%) | 27 (5.7%) |
| 20 to 24 Years | 4 (1.3%) | 0 (0.0%) |
| 25 to 29 Years | 0 (0.0%) | 0 (0.0%) |
| 30 to 34 Years | 0 (0.0%) | 0 (0.0%) |
| 35 to 39 Years | 4 (1.3%) | 17 (3.6%) |
| 40 to 44 Years | 110 (35.5%) | 30 (6.4%) |
| 45 to 49 Years | 4 (1.3%) | 4 (0.9%) |
| 50 to 54 Years | 19 (6.1%) | 39 (8.3%) |
| 55 to 59 Years | 2 (0.6%) | 7 (1.5%) |
| 60 to 64 Years | 15 (4.8%) | 22 (4.7%) |
| 65 to 69 Years | 32 (10.3%) | 28 (5.9%) |
| 70 to 74 Years | 18 (5.8%) | 7 (1.5%) |
| 75 to 79 Years | 10 (3.2%) | 19 (4.0%) |
| 80 to 84 Years | 15 (4.8%) | 16 (3.4%) |
| 85 Years and over | 17 (5.5%) | 0 (0.0%) |
| Total | 310 (100.0%) | 471 (100.0%) |
Families and Households in Plains
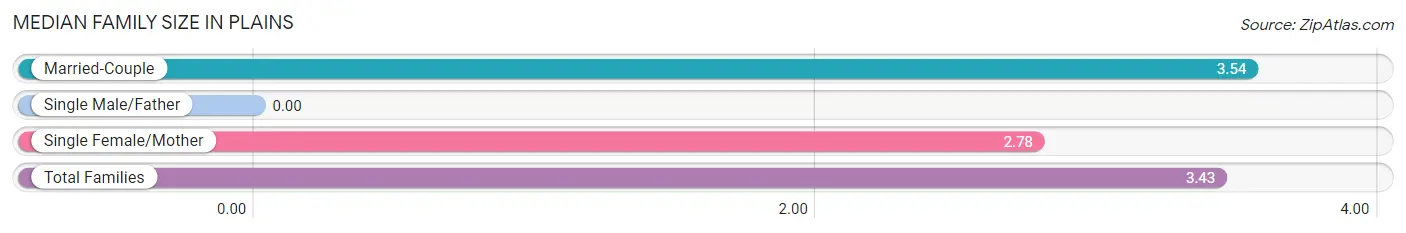
Median Family Size in Plains
| Family Type | # Families | Family Size |
| Married-Couple | 156 (85.3%) | 3.54 |
| Single Male/Father | 0 (0.0%) | - |
| Single Female/Mother | 27 (14.7%) | 2.78 |
| Total Families | 183 (100.0%) | 3.43 |
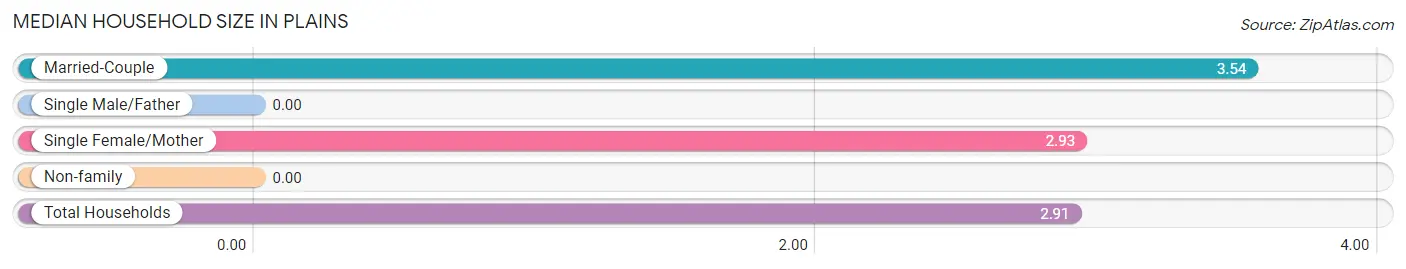
Median Household Size in Plains
| Household Type | # Households | Household Size |
| Married-Couple | 156 (66.4%) | 3.54 |
| Single Male/Father | 0 (0.0%) | - |
| Single Female/Mother | 27 (11.5%) | 2.93 |
| Non-family | 52 (22.1%) | - |
| Total Households | 235 (100.0%) | 2.91 |
Household Size by Marriage Status in Plains
Out of a total of 235 households in Plains, 183 (77.9%) are family households, while 52 (22.1%) are nonfamily households. The most numerous type of family households are 3-person households, comprising 107, and the most common type of nonfamily households are 1-person households, comprising 52.
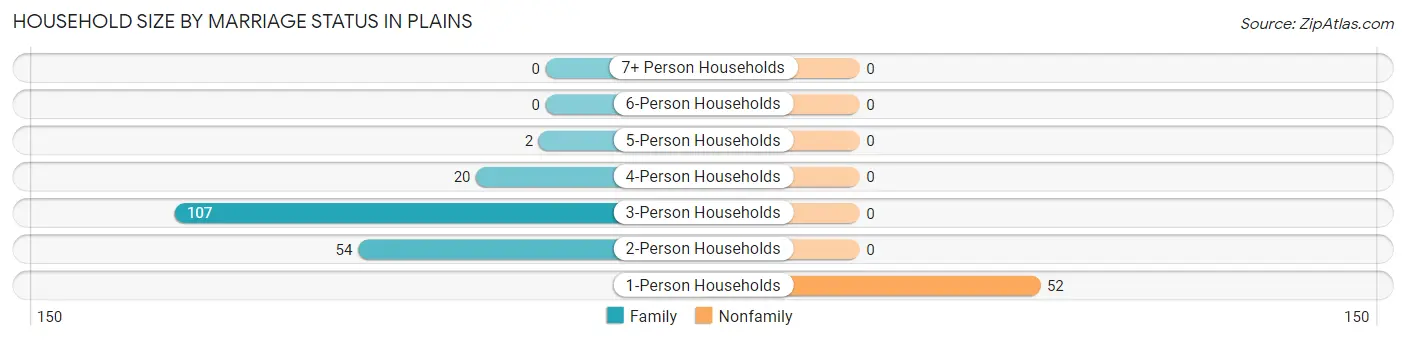
| Household Size | Family Households | Nonfamily Households |
| 1-Person Households | - | 52 (22.1%) |
| 2-Person Households | 54 (23.0%) | 0 (0.0%) |
| 3-Person Households | 107 (45.5%) | 0 (0.0%) |
| 4-Person Households | 20 (8.5%) | 0 (0.0%) |
| 5-Person Households | 2 (0.9%) | 0 (0.0%) |
| 6-Person Households | 0 (0.0%) | 0 (0.0%) |
| 7+ Person Households | 0 (0.0%) | 0 (0.0%) |
| Total | 183 (77.9%) | 52 (22.1%) |
Female Fertility in Plains
Fertility by Age in Plains
| Age Bracket | Women with Births | Births / 1,000 Women |
| 15 to 19 years | 0 (0.0%) | 0.0 |
| 20 to 34 years | 0 (0.0%) | 0.0 |
| 35 to 50 years | 0 (0.0%) | 0.0 |
| Total | 0 (0.0%) | 0.0 |
Fertility by Age by Marriage Status in Plains
| Age Bracket | Married | Unmarried |
| 15 to 19 years | 0 (0.0%) | 0 (0.0%) |
| 20 to 34 years | 0 (0.0%) | 0 (0.0%) |
| 35 to 50 years | 0 (0.0%) | 0 (0.0%) |
| Total | 0 (0.0%) | 0 (0.0%) |
Fertility by Education in Plains
| Educational Attainment | Women with Births | Births / 1,000 Women |
| Less than High School | 0 (0.0%) | 0.0 |
| High School Diploma | 0 (0.0%) | 0.0 |
| College or Associate's Degree | 0 (0.0%) | 0.0 |
| Bachelor's Degree | 0 (0.0%) | 0.0 |
| Graduate Degree | 0 (0.0%) | 0.0 |
| Total | 0 (0.0%) | 0.0 |
Fertility by Education by Marriage Status in Plains
| Educational Attainment | Married | Unmarried |
| Less than High School | 0 (0.0%) | 0 (0.0%) |
| High School Diploma | 0 (0.0%) | 0 (0.0%) |
| College or Associate's Degree | 0 (0.0%) | 0 (0.0%) |
| Bachelor's Degree | 0 (0.0%) | 0 (0.0%) |
| Graduate Degree | 0 (0.0%) | 0 (0.0%) |
| Total | 0 (0.0%) | 0 (0.0%) |
Employment Characteristics in Plains
Employment by Class of Employer in Plains
Among the 182 employed individuals in Plains, private company employees (129 | 70.9%), self-employed (not incorporated) (18 | 9.9%), and state government employees (12 | 6.6%) make up the most common classes of employment.
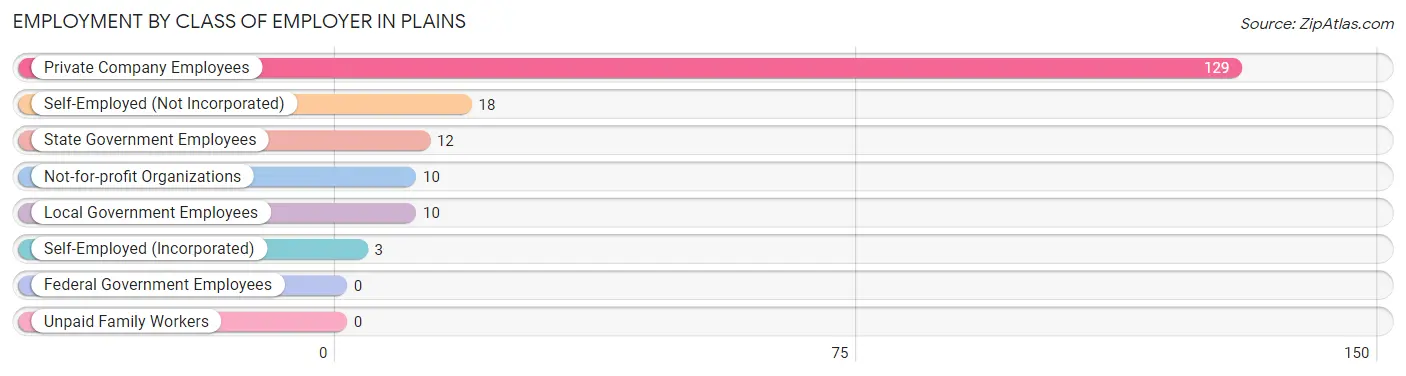
| Employer Class | # Employees | % Employees |
| Private Company Employees | 129 | 70.9% |
| Self-Employed (Incorporated) | 3 | 1.7% |
| Self-Employed (Not Incorporated) | 18 | 9.9% |
| Not-for-profit Organizations | 10 | 5.5% |
| Local Government Employees | 10 | 5.5% |
| State Government Employees | 12 | 6.6% |
| Federal Government Employees | 0 | 0.0% |
| Unpaid Family Workers | 0 | 0.0% |
| Total | 182 | 100.0% |
Employment Status by Age in Plains
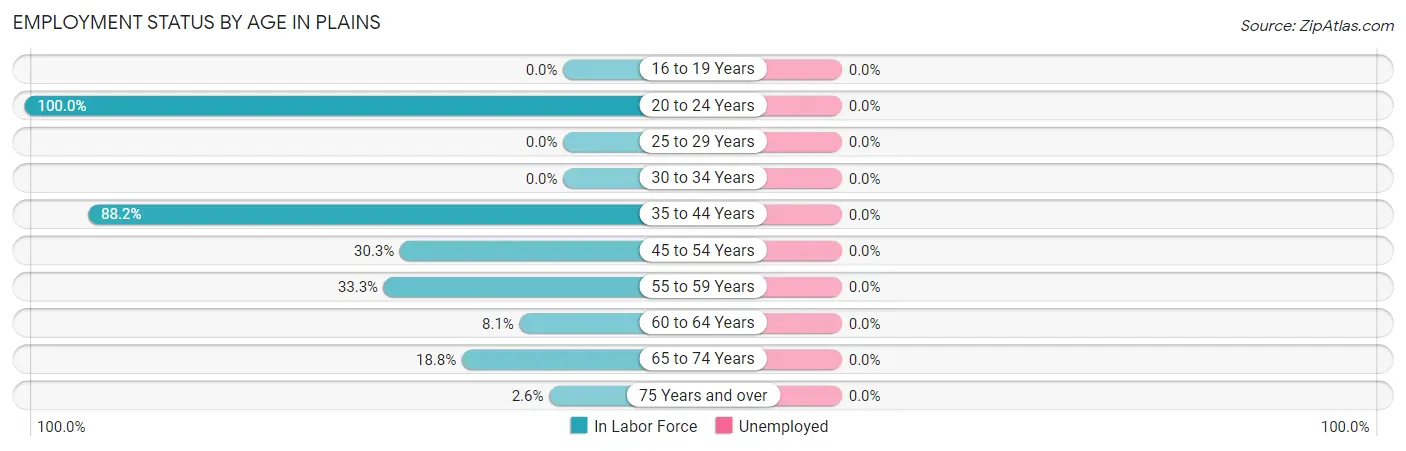
| Age Bracket | In Labor Force | Unemployed |
| 16 to 19 Years | 0 (0.0%) | 0 (0.0%) |
| 20 to 24 Years | 4 (100.0%) | 0 (0.0%) |
| 25 to 29 Years | 0 (0.0%) | 0 (0.0%) |
| 30 to 34 Years | 0 (0.0%) | 0 (0.0%) |
| 35 to 44 Years | 142 (88.2%) | 0 (0.0%) |
| 45 to 54 Years | 20 (30.3%) | 0 (0.0%) |
| 55 to 59 Years | 3 (33.3%) | 0 (0.0%) |
| 60 to 64 Years | 3 (8.1%) | 0 (0.0%) |
| 65 to 74 Years | 16 (18.8%) | 0 (0.0%) |
| 75 Years and over | 2 (2.6%) | 0 (0.0%) |
| Total | 190 (41.2%) | 0 (0.0%) |
Employment Status by Educational Attainment in Plains
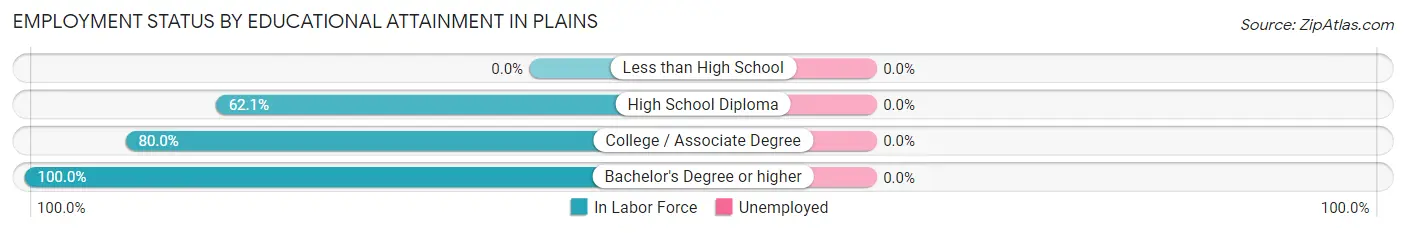
| Educational Attainment | In Labor Force | Unemployed |
| Less than High School | 0 (0.0%) | 0 (0.0%) |
| High School Diploma | 108 (62.1%) | 0 (0.0%) |
| College / Associate Degree | 28 (80.0%) | 0 (0.0%) |
| Bachelor's Degree or higher | 32 (100.0%) | 0 (0.0%) |
| Total | 168 (61.5%) | 0 (0.0%) |
Employment Occupations by Sex in Plains
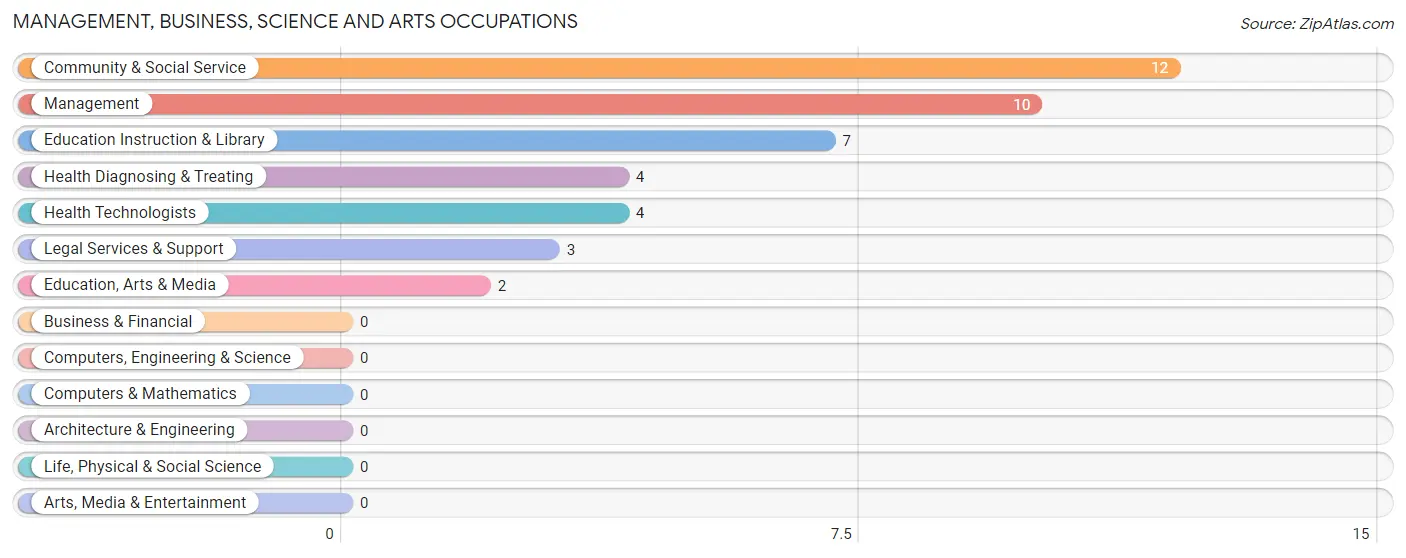
Management, Business, Science and Arts Occupations
The most common Management, Business, Science and Arts occupations in Plains are Community & Social Service (12 | 6.3%), Management (10 | 5.3%), Education Instruction & Library (7 | 3.7%), Health Diagnosing & Treating (4 | 2.1%), and Health Technologists (4 | 2.1%).
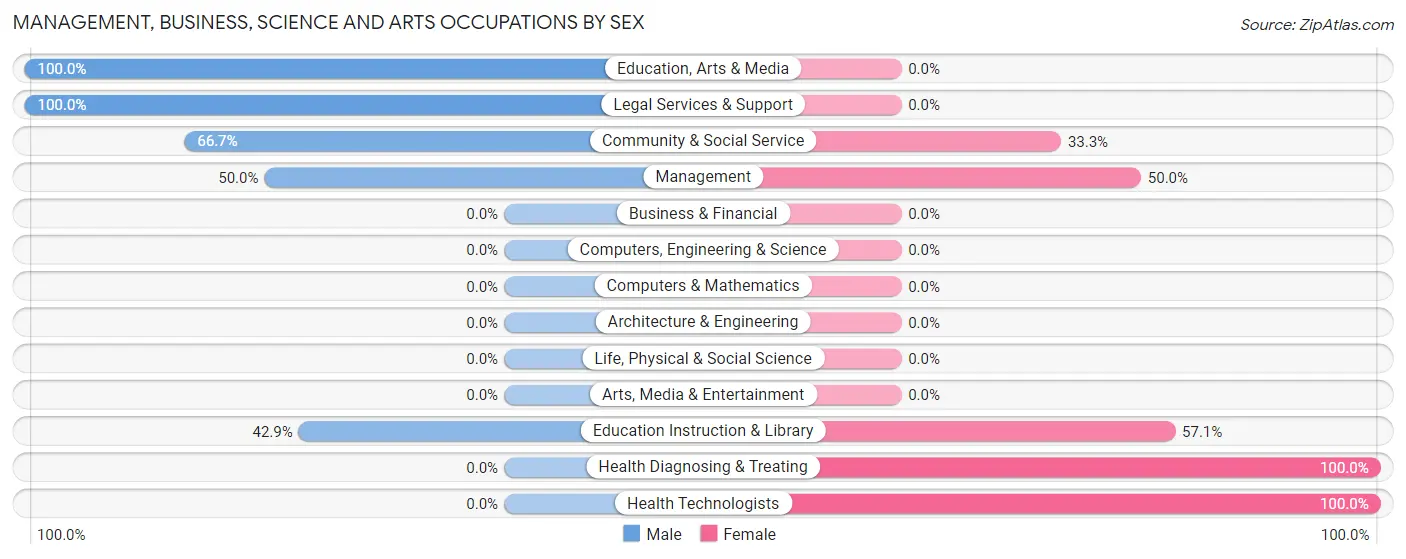
Management, Business, Science and Arts Occupations by Sex
Within the Management, Business, Science and Arts occupations in Plains, the most male-oriented occupations are Education, Arts & Media (100.0%), Legal Services & Support (100.0%), and Community & Social Service (66.7%), while the most female-oriented occupations are Health Diagnosing & Treating (100.0%), Health Technologists (100.0%), and Education Instruction & Library (57.1%).
| Occupation | Male | Female |
| Management | 5 (50.0%) | 5 (50.0%) |
| Business & Financial | 0 (0.0%) | 0 (0.0%) |
| Computers, Engineering & Science | 0 (0.0%) | 0 (0.0%) |
| Computers & Mathematics | 0 (0.0%) | 0 (0.0%) |
| Architecture & Engineering | 0 (0.0%) | 0 (0.0%) |
| Life, Physical & Social Science | 0 (0.0%) | 0 (0.0%) |
| Community & Social Service | 8 (66.7%) | 4 (33.3%) |
| Education, Arts & Media | 2 (100.0%) | 0 (0.0%) |
| Legal Services & Support | 3 (100.0%) | 0 (0.0%) |
| Education Instruction & Library | 3 (42.9%) | 4 (57.1%) |
| Arts, Media & Entertainment | 0 (0.0%) | 0 (0.0%) |
| Health Diagnosing & Treating | 0 (0.0%) | 4 (100.0%) |
| Health Technologists | 0 (0.0%) | 4 (100.0%) |
| Total (Category) | 13 (50.0%) | 13 (50.0%) |
| Total (Overall) | 140 (73.7%) | 50 (26.3%) |
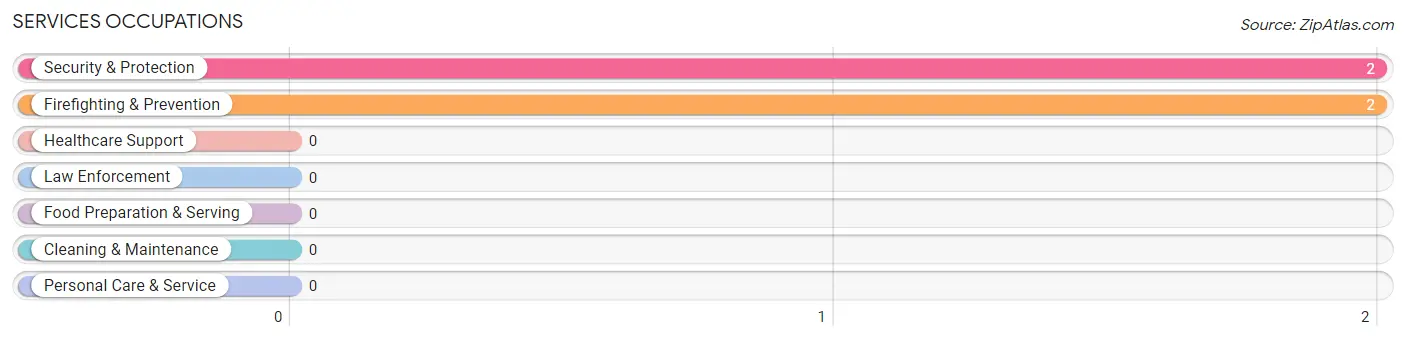
Services Occupations
The most common Services occupations in Plains are Security & Protection (2 | 1.1%), and Firefighting & Prevention (2 | 1.1%).
Services Occupations by Sex
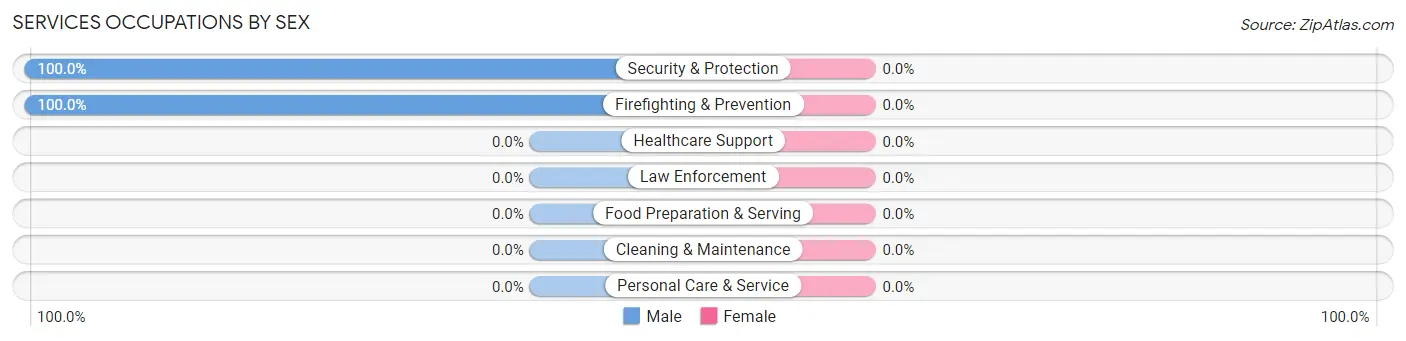
| Occupation | Male | Female |
| Healthcare Support | 0 (0.0%) | 0 (0.0%) |
| Security & Protection | 2 (100.0%) | 0 (0.0%) |
| Firefighting & Prevention | 2 (100.0%) | 0 (0.0%) |
| Law Enforcement | 0 (0.0%) | 0 (0.0%) |
| Food Preparation & Serving | 0 (0.0%) | 0 (0.0%) |
| Cleaning & Maintenance | 0 (0.0%) | 0 (0.0%) |
| Personal Care & Service | 0 (0.0%) | 0 (0.0%) |
| Total (Category) | 2 (100.0%) | 0 (0.0%) |
| Total (Overall) | 140 (73.7%) | 50 (26.3%) |
Sales and Office Occupations
The most common Sales and Office occupations in Plains are Office & Administration (28 | 14.7%), and Sales & Related (3 | 1.6%).
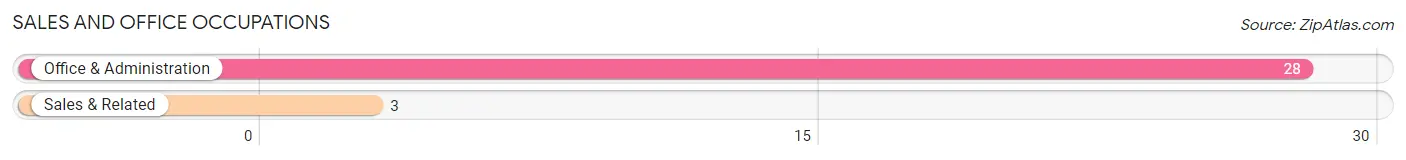
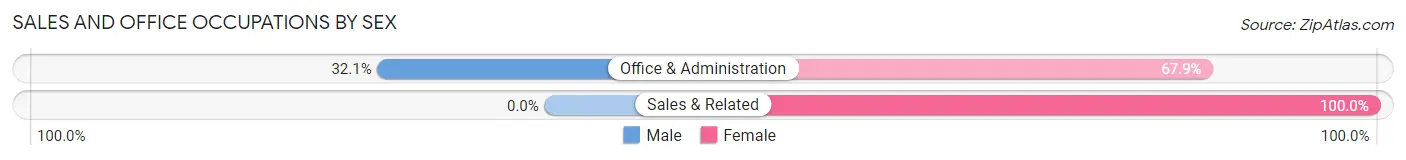
Sales and Office Occupations by Sex
| Occupation | Male | Female |
| Sales & Related | 0 (0.0%) | 3 (100.0%) |
| Office & Administration | 9 (32.1%) | 19 (67.9%) |
| Total (Category) | 9 (29.0%) | 22 (71.0%) |
| Total (Overall) | 140 (73.7%) | 50 (26.3%) |
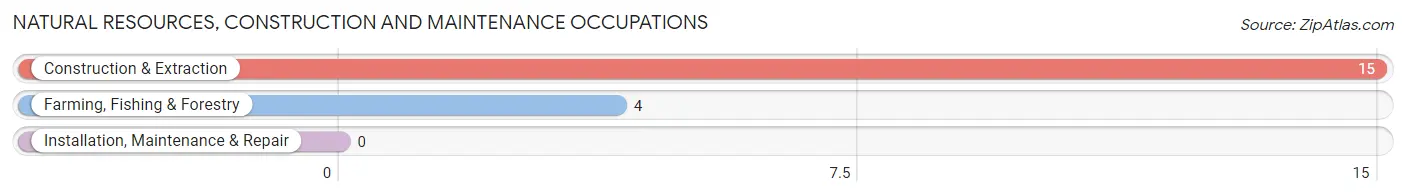
Natural Resources, Construction and Maintenance Occupations
The most common Natural Resources, Construction and Maintenance occupations in Plains are Construction & Extraction (15 | 7.9%), and Farming, Fishing & Forestry (4 | 2.1%).
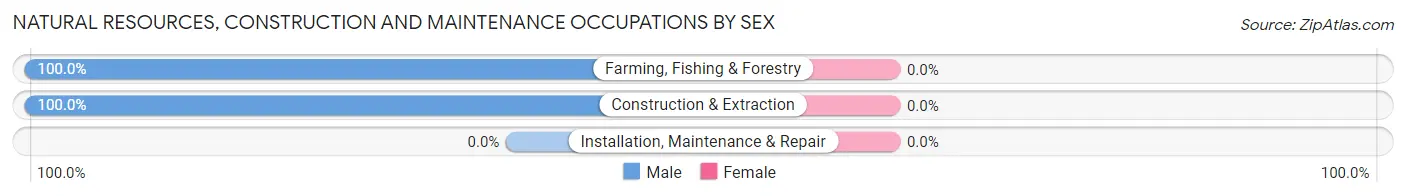
Natural Resources, Construction and Maintenance Occupations by Sex
| Occupation | Male | Female |
| Farming, Fishing & Forestry | 4 (100.0%) | 0 (0.0%) |
| Construction & Extraction | 15 (100.0%) | 0 (0.0%) |
| Installation, Maintenance & Repair | 0 (0.0%) | 0 (0.0%) |
| Total (Category) | 19 (100.0%) | 0 (0.0%) |
| Total (Overall) | 140 (73.7%) | 50 (26.3%) |
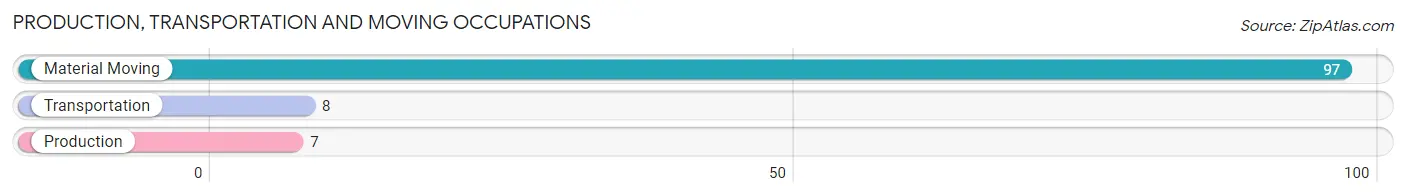
Production, Transportation and Moving Occupations
The most common Production, Transportation and Moving occupations in Plains are Material Moving (97 | 51.0%), Transportation (8 | 4.2%), and Production (7 | 3.7%).
Production, Transportation and Moving Occupations by Sex
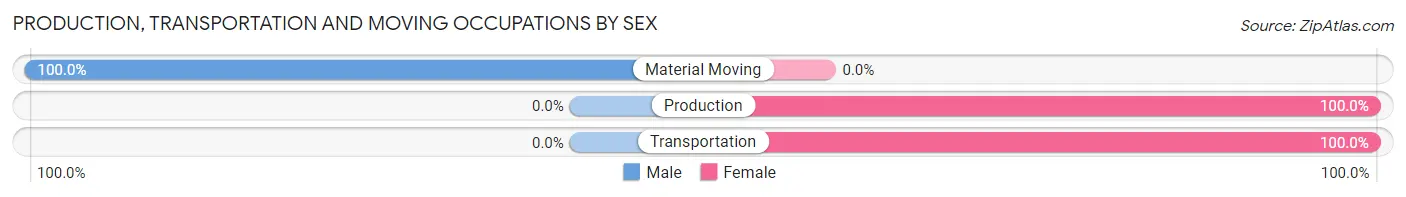
| Occupation | Male | Female |
| Production | 0 (0.0%) | 7 (100.0%) |
| Transportation | 0 (0.0%) | 8 (100.0%) |
| Material Moving | 97 (100.0%) | 0 (0.0%) |
| Total (Category) | 97 (86.6%) | 15 (13.4%) |
| Total (Overall) | 140 (73.7%) | 50 (26.3%) |
Employment Industries by Sex in Plains
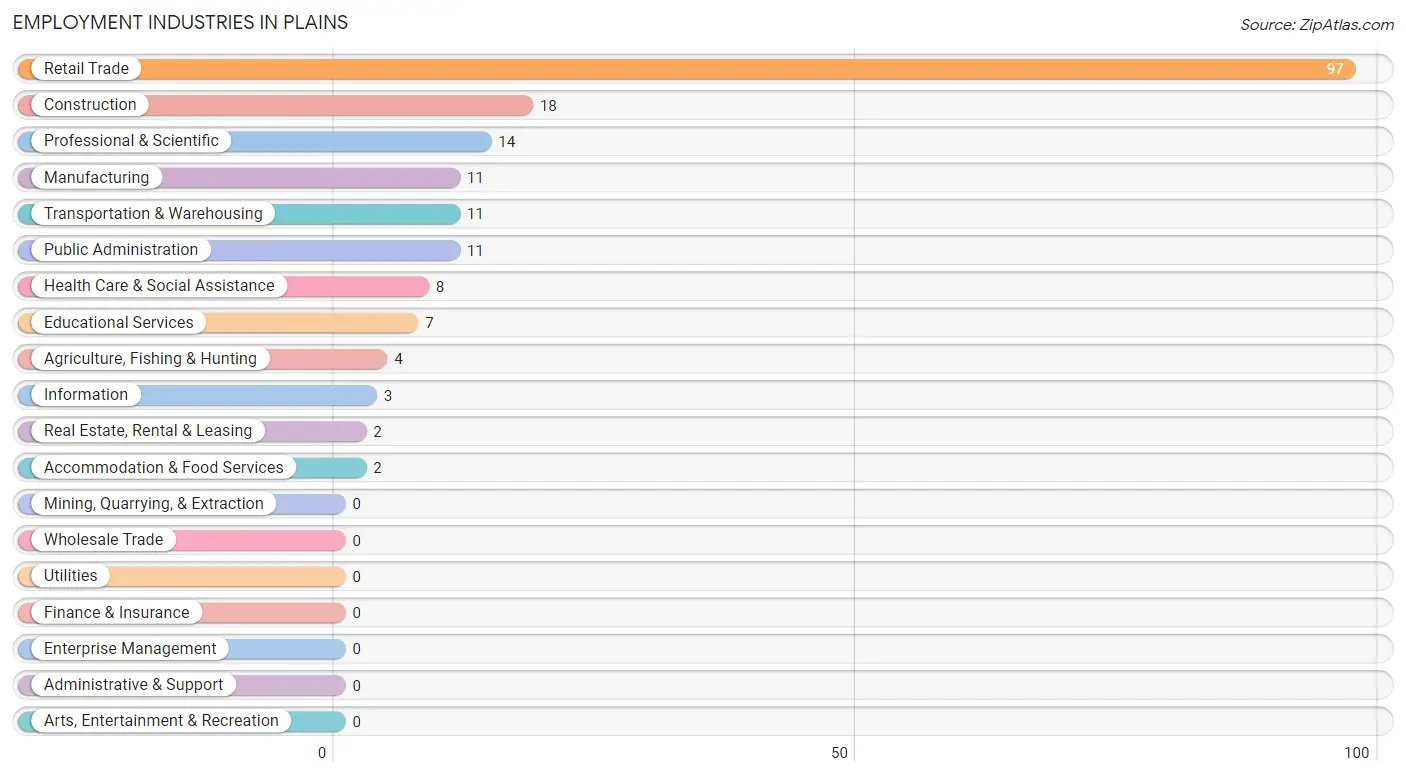
Employment Industries in Plains
The major employment industries in Plains include Retail Trade (97 | 51.0%), Construction (18 | 9.5%), Professional & Scientific (14 | 7.4%), Manufacturing (11 | 5.8%), and Transportation & Warehousing (11 | 5.8%).
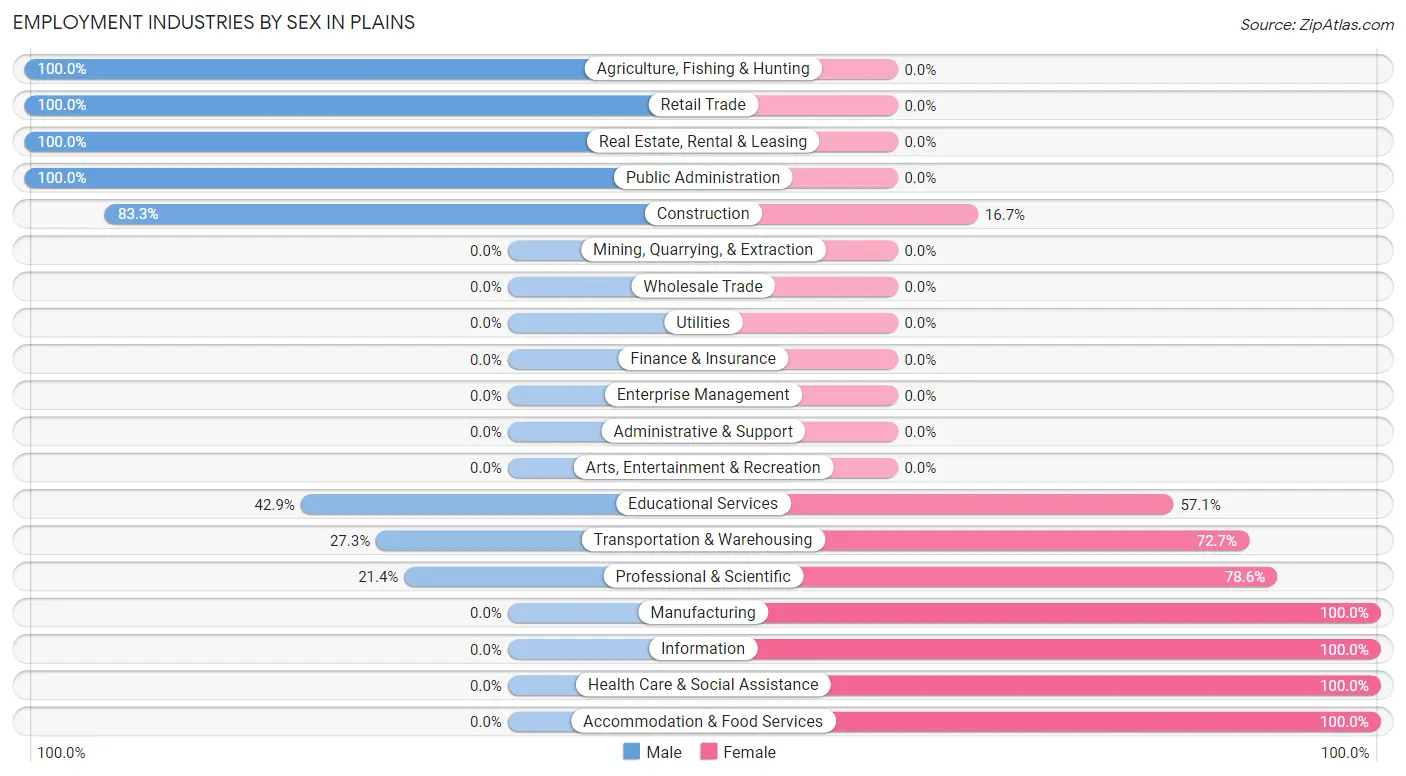
Employment Industries by Sex in Plains
The Plains industries that see more men than women are Agriculture, Fishing & Hunting (100.0%), Retail Trade (100.0%), and Real Estate, Rental & Leasing (100.0%), whereas the industries that tend to have a higher number of women are Manufacturing (100.0%), Information (100.0%), and Health Care & Social Assistance (100.0%).
| Industry | Male | Female |
| Agriculture, Fishing & Hunting | 4 (100.0%) | 0 (0.0%) |
| Mining, Quarrying, & Extraction | 0 (0.0%) | 0 (0.0%) |
| Construction | 15 (83.3%) | 3 (16.7%) |
| Manufacturing | 0 (0.0%) | 11 (100.0%) |
| Wholesale Trade | 0 (0.0%) | 0 (0.0%) |
| Retail Trade | 97 (100.0%) | 0 (0.0%) |
| Transportation & Warehousing | 3 (27.3%) | 8 (72.7%) |
| Utilities | 0 (0.0%) | 0 (0.0%) |
| Information | 0 (0.0%) | 3 (100.0%) |
| Finance & Insurance | 0 (0.0%) | 0 (0.0%) |
| Real Estate, Rental & Leasing | 2 (100.0%) | 0 (0.0%) |
| Professional & Scientific | 3 (21.4%) | 11 (78.6%) |
| Enterprise Management | 0 (0.0%) | 0 (0.0%) |
| Administrative & Support | 0 (0.0%) | 0 (0.0%) |
| Educational Services | 3 (42.9%) | 4 (57.1%) |
| Health Care & Social Assistance | 0 (0.0%) | 8 (100.0%) |
| Arts, Entertainment & Recreation | 0 (0.0%) | 0 (0.0%) |
| Accommodation & Food Services | 0 (0.0%) | 2 (100.0%) |
| Public Administration | 11 (100.0%) | 0 (0.0%) |
| Total | 140 (73.7%) | 50 (26.3%) |
Education in Plains
School Enrollment in Plains
The most common levels of schooling among the 344 students in Plains are elementary school (231 | 67.1%), high school (75 | 21.8%), and middle school (22 | 6.4%).
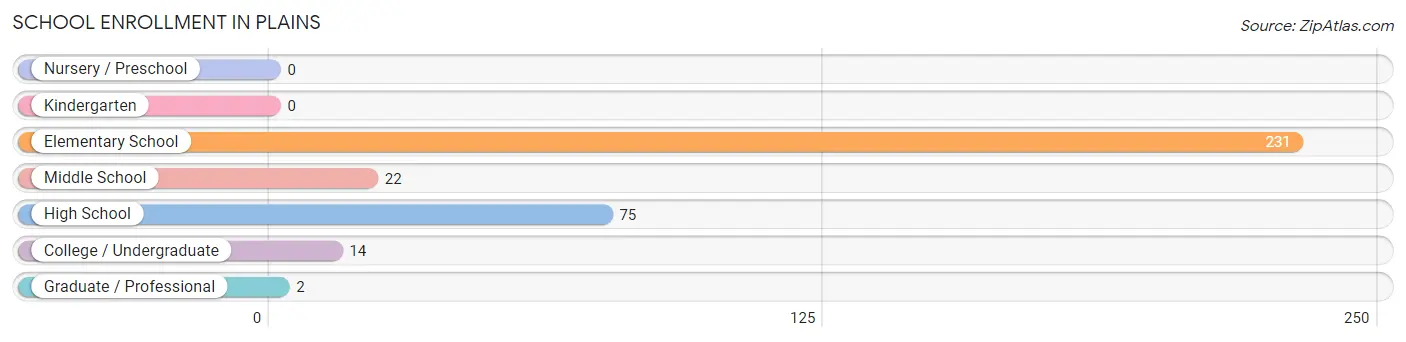
| School Level | # Students | % Students |
| Nursery / Preschool | 0 | 0.0% |
| Kindergarten | 0 | 0.0% |
| Elementary School | 231 | 67.1% |
| Middle School | 22 | 6.4% |
| High School | 75 | 21.8% |
| College / Undergraduate | 14 | 4.1% |
| Graduate / Professional | 2 | 0.6% |
| Total | 344 | 100.0% |
School Enrollment by Age by Funding Source in Plains
Out of a total of 344 students who are enrolled in schools in Plains, 10 (2.9%) attend a private institution, while the remaining 334 (97.1%) are enrolled in public schools. The age group of 35 years and over has the highest likelihood of being enrolled in private schools, with 2 (25.0% in the age bracket) enrolled. Conversely, the age group of 5 to 9 year old has the lowest likelihood of being enrolled in a private school, with 231 (100.0% in the age bracket) attending a public institution.
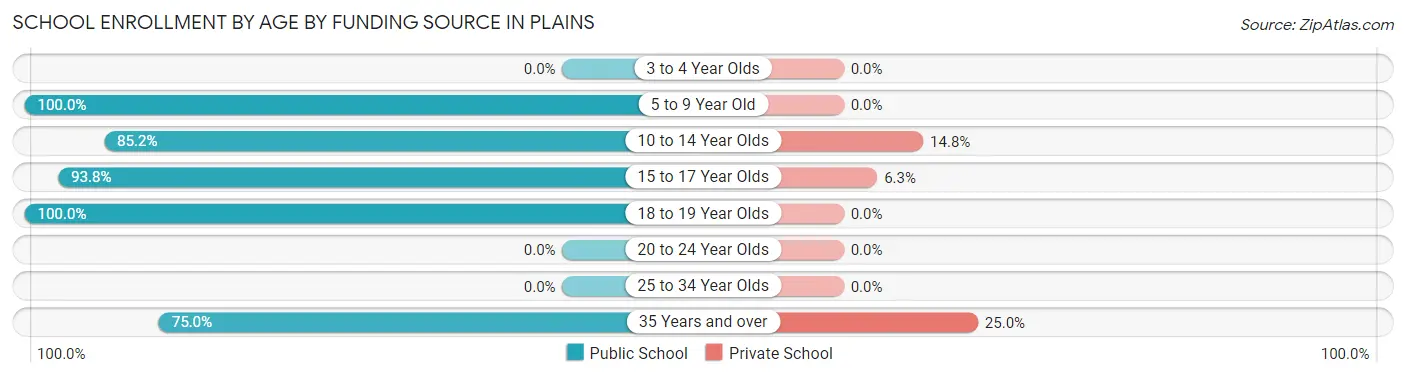
| Age Bracket | Public School | Private School |
| 3 to 4 Year Olds | 0 (0.0%) | 0 (0.0%) |
| 5 to 9 Year Old | 231 (100.0%) | 0 (0.0%) |
| 10 to 14 Year Olds | 23 (85.2%) | 4 (14.8%) |
| 15 to 17 Year Olds | 60 (93.8%) | 4 (6.2%) |
| 18 to 19 Year Olds | 14 (100.0%) | 0 (0.0%) |
| 20 to 24 Year Olds | 0 (0.0%) | 0 (0.0%) |
| 25 to 34 Year Olds | 0 (0.0%) | 0 (0.0%) |
| 35 Years and over | 6 (75.0%) | 2 (25.0%) |
| Total | 334 (97.1%) | 10 (2.9%) |
Educational Attainment by Field of Study in Plains
Education (14 | 20.0%), visual & performing arts (10 | 14.3%), social sciences (9 | 12.9%), science & technology (9 | 12.9%), and liberal arts & history (9 | 12.9%) are the most common fields of study among 70 individuals in Plains who have obtained a bachelor's degree or higher.
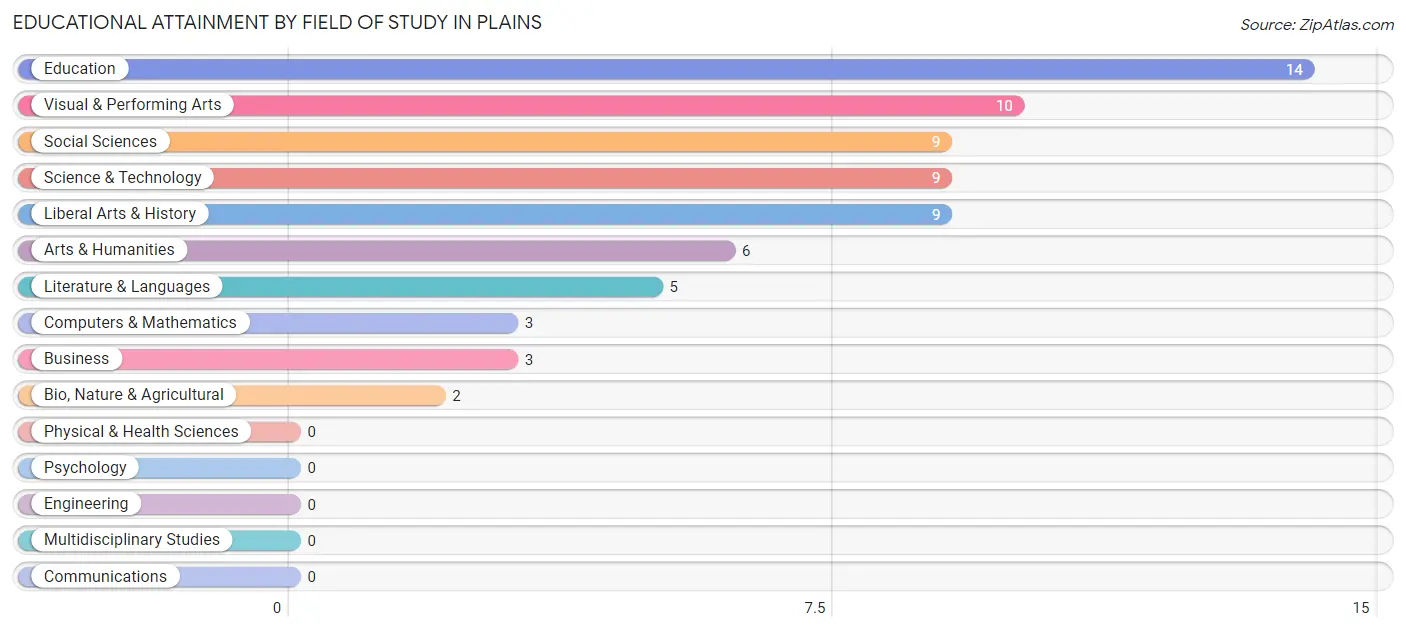
| Field of Study | # Graduates | % Graduates |
| Computers & Mathematics | 3 | 4.3% |
| Bio, Nature & Agricultural | 2 | 2.9% |
| Physical & Health Sciences | 0 | 0.0% |
| Psychology | 0 | 0.0% |
| Social Sciences | 9 | 12.9% |
| Engineering | 0 | 0.0% |
| Multidisciplinary Studies | 0 | 0.0% |
| Science & Technology | 9 | 12.9% |
| Business | 3 | 4.3% |
| Education | 14 | 20.0% |
| Literature & Languages | 5 | 7.1% |
| Liberal Arts & History | 9 | 12.9% |
| Visual & Performing Arts | 10 | 14.3% |
| Communications | 0 | 0.0% |
| Arts & Humanities | 6 | 8.6% |
| Total | 70 | 100.0% |
Transportation & Commute in Plains
Vehicle Availability by Sex in Plains
The most prevalent vehicle ownership categories in Plains are males with 1 vehicle (105, accounting for 75.0%) and females with 1 vehicle (5, making up 250.0%).
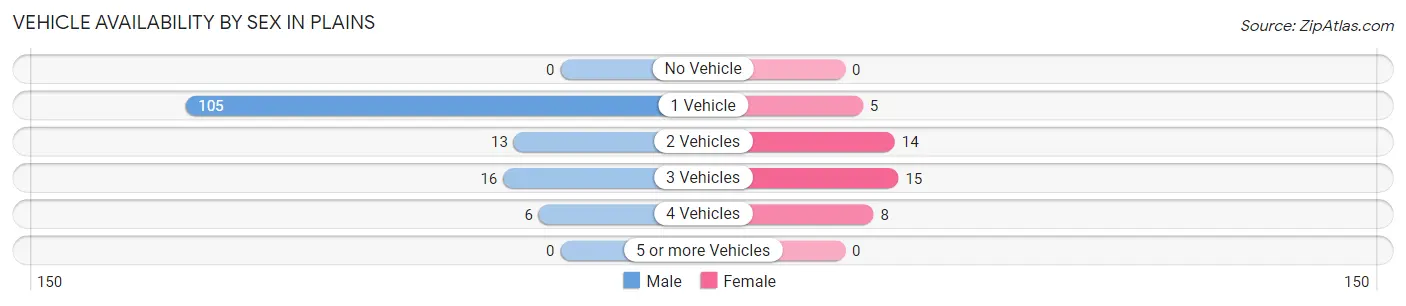
| Vehicles Available | Male | Female |
| No Vehicle | 0 (0.0%) | 0 (0.0%) |
| 1 Vehicle | 105 (75.0%) | 5 (11.9%) |
| 2 Vehicles | 13 (9.3%) | 14 (33.3%) |
| 3 Vehicles | 16 (11.4%) | 15 (35.7%) |
| 4 Vehicles | 6 (4.3%) | 8 (19.1%) |
| 5 or more Vehicles | 0 (0.0%) | 0 (0.0%) |
| Total | 140 (100.0%) | 42 (100.0%) |
Commute Time in Plains
The most frequently occuring commute durations in Plains are 25 to 29 minutes (107 commuters, 60.1%), less than 5 minutes (22 commuters, 12.4%), and 20 to 24 minutes (16 commuters, 9.0%).
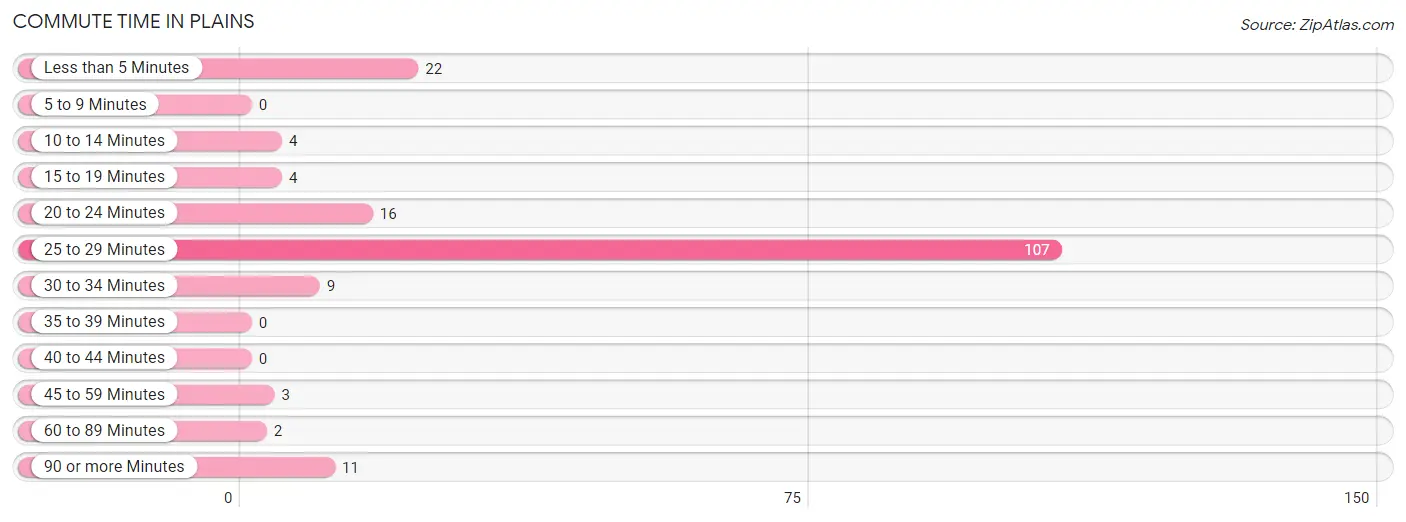
| Commute Time | # Commuters | % Commuters |
| Less than 5 Minutes | 22 | 12.4% |
| 5 to 9 Minutes | 0 | 0.0% |
| 10 to 14 Minutes | 4 | 2.2% |
| 15 to 19 Minutes | 4 | 2.2% |
| 20 to 24 Minutes | 16 | 9.0% |
| 25 to 29 Minutes | 107 | 60.1% |
| 30 to 34 Minutes | 9 | 5.1% |
| 35 to 39 Minutes | 0 | 0.0% |
| 40 to 44 Minutes | 0 | 0.0% |
| 45 to 59 Minutes | 3 | 1.7% |
| 60 to 89 Minutes | 2 | 1.1% |
| 90 or more Minutes | 11 | 6.2% |
Commute Time by Sex in Plains
The most common commute times in Plains are 25 to 29 minutes (97 commuters, 69.3%) for males and less than 5 minutes (13 commuters, 34.2%) for females.
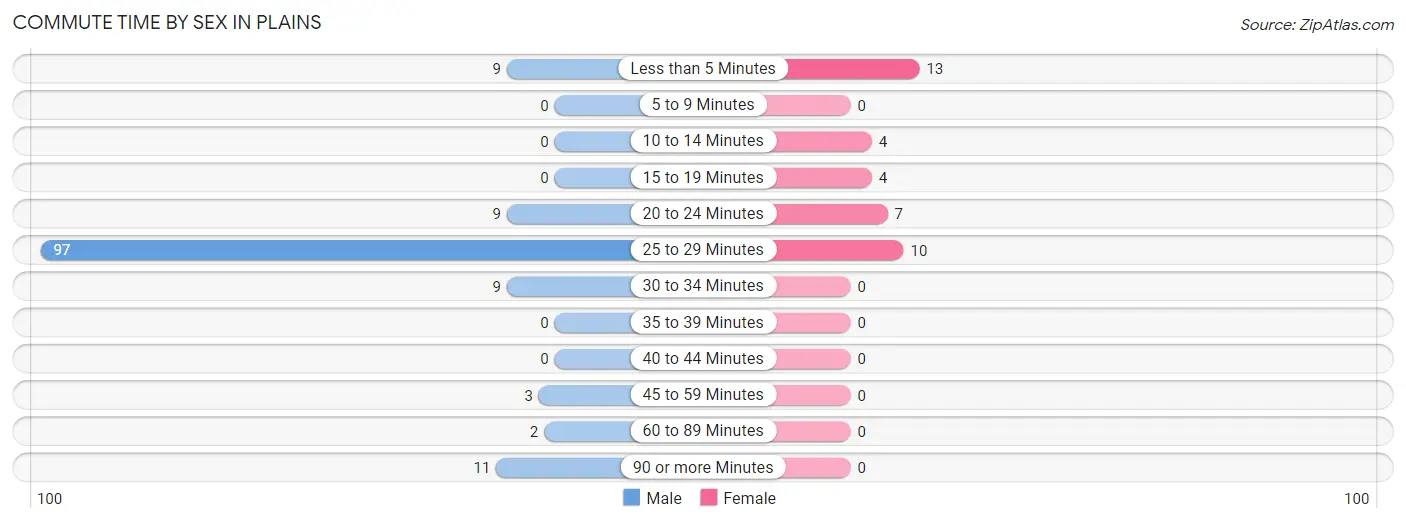
| Commute Time | Male | Female |
| Less than 5 Minutes | 9 (6.4%) | 13 (34.2%) |
| 5 to 9 Minutes | 0 (0.0%) | 0 (0.0%) |
| 10 to 14 Minutes | 0 (0.0%) | 4 (10.5%) |
| 15 to 19 Minutes | 0 (0.0%) | 4 (10.5%) |
| 20 to 24 Minutes | 9 (6.4%) | 7 (18.4%) |
| 25 to 29 Minutes | 97 (69.3%) | 10 (26.3%) |
| 30 to 34 Minutes | 9 (6.4%) | 0 (0.0%) |
| 35 to 39 Minutes | 0 (0.0%) | 0 (0.0%) |
| 40 to 44 Minutes | 0 (0.0%) | 0 (0.0%) |
| 45 to 59 Minutes | 3 (2.1%) | 0 (0.0%) |
| 60 to 89 Minutes | 2 (1.4%) | 0 (0.0%) |
| 90 or more Minutes | 11 (7.9%) | 0 (0.0%) |
Time of Departure to Work by Sex in Plains
The most frequent times of departure to work in Plains are 5:00 AM to 5:29 AM (108, 77.1%) for males and 9:00 AM to 9:59 AM (16, 42.1%) for females.
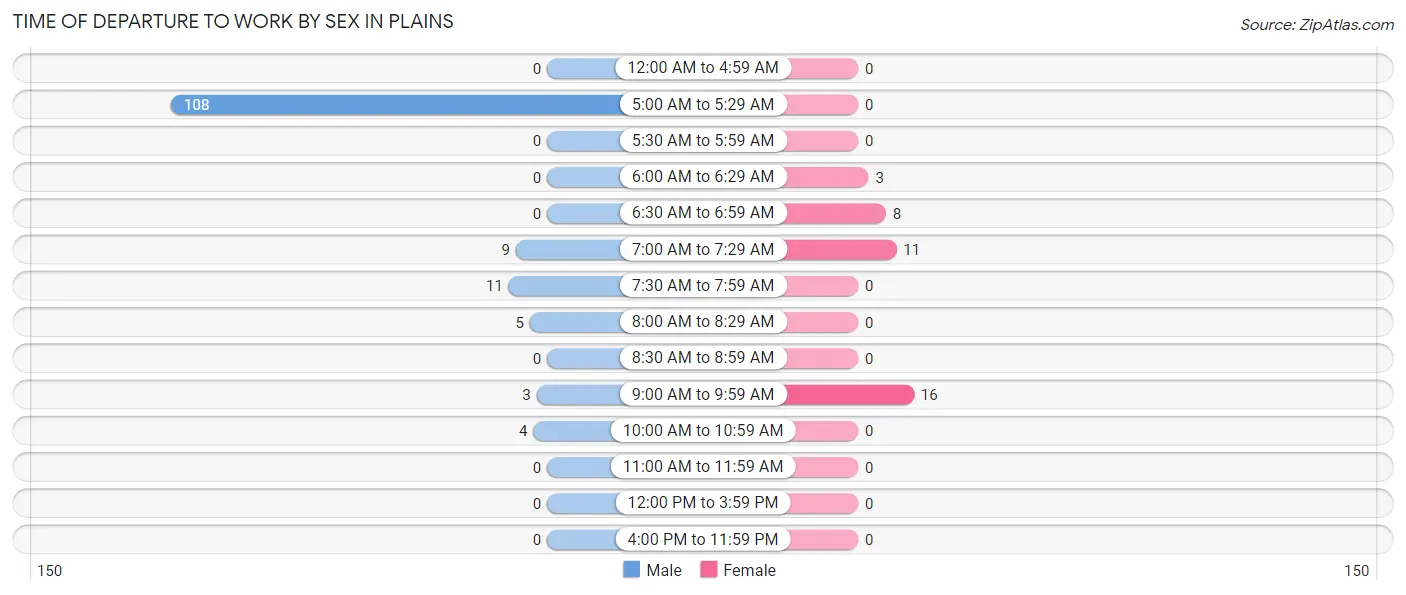
| Time of Departure | Male | Female |
| 12:00 AM to 4:59 AM | 0 (0.0%) | 0 (0.0%) |
| 5:00 AM to 5:29 AM | 108 (77.1%) | 0 (0.0%) |
| 5:30 AM to 5:59 AM | 0 (0.0%) | 0 (0.0%) |
| 6:00 AM to 6:29 AM | 0 (0.0%) | 3 (7.9%) |
| 6:30 AM to 6:59 AM | 0 (0.0%) | 8 (21.0%) |
| 7:00 AM to 7:29 AM | 9 (6.4%) | 11 (28.9%) |
| 7:30 AM to 7:59 AM | 11 (7.9%) | 0 (0.0%) |
| 8:00 AM to 8:29 AM | 5 (3.6%) | 0 (0.0%) |
| 8:30 AM to 8:59 AM | 0 (0.0%) | 0 (0.0%) |
| 9:00 AM to 9:59 AM | 3 (2.1%) | 16 (42.1%) |
| 10:00 AM to 10:59 AM | 4 (2.9%) | 0 (0.0%) |
| 11:00 AM to 11:59 AM | 0 (0.0%) | 0 (0.0%) |
| 12:00 PM to 3:59 PM | 0 (0.0%) | 0 (0.0%) |
| 4:00 PM to 11:59 PM | 0 (0.0%) | 0 (0.0%) |
| Total | 140 (100.0%) | 38 (100.0%) |
Housing Occupancy in Plains
Occupancy by Ownership in Plains
Of the total 235 dwellings in Plains, owner-occupied units account for 202 (86.0%), while renter-occupied units make up 33 (14.0%).
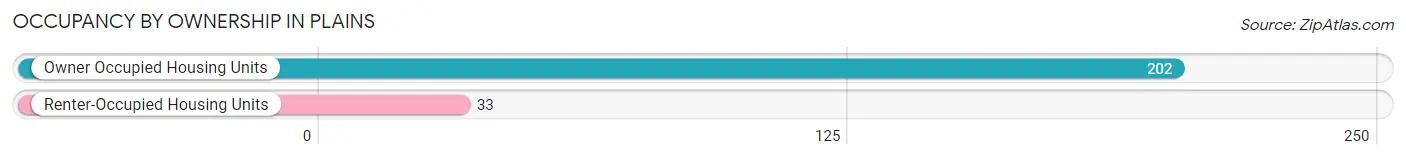
| Occupancy | # Housing Units | % Housing Units |
| Owner Occupied Housing Units | 202 | 86.0% |
| Renter-Occupied Housing Units | 33 | 14.0% |
| Total Occupied Housing Units | 235 | 100.0% |
Occupancy by Household Size in Plains
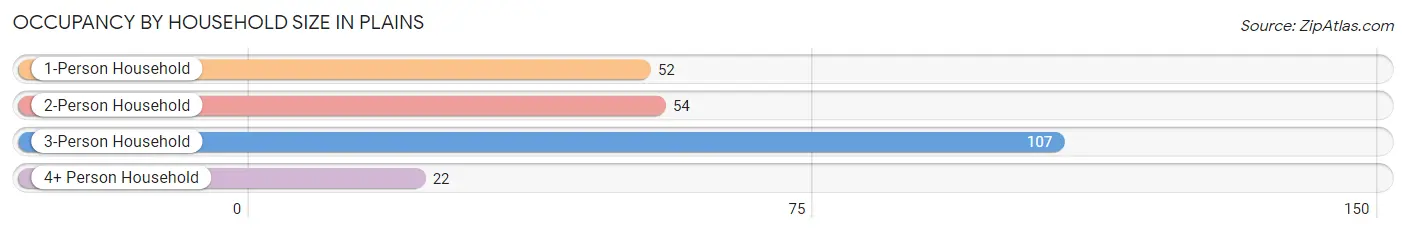
| Household Size | # Housing Units | % Housing Units |
| 1-Person Household | 52 | 22.1% |
| 2-Person Household | 54 | 23.0% |
| 3-Person Household | 107 | 45.5% |
| 4+ Person Household | 22 | 9.4% |
| Total Housing Units | 235 | 100.0% |
Occupancy by Ownership by Household Size in Plains
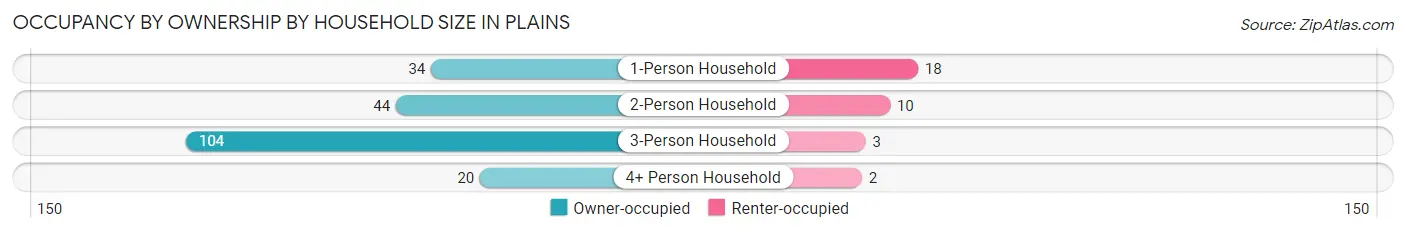
| Household Size | Owner-occupied | Renter-occupied |
| 1-Person Household | 34 (65.4%) | 18 (34.6%) |
| 2-Person Household | 44 (81.5%) | 10 (18.5%) |
| 3-Person Household | 104 (97.2%) | 3 (2.8%) |
| 4+ Person Household | 20 (90.9%) | 2 (9.1%) |
| Total Housing Units | 202 (86.0%) | 33 (14.0%) |
Occupancy by Educational Attainment in Plains
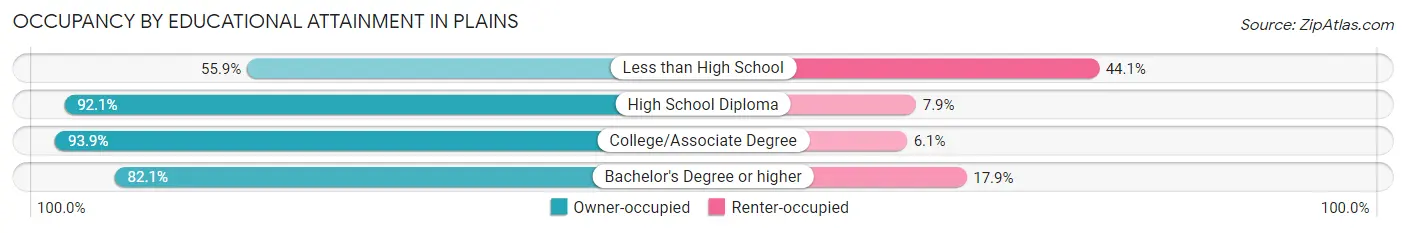
| Household Size | Owner-occupied | Renter-occupied |
| Less than High School | 19 (55.9%) | 15 (44.1%) |
| High School Diploma | 129 (92.1%) | 11 (7.9%) |
| College/Associate Degree | 31 (93.9%) | 2 (6.1%) |
| Bachelor's Degree or higher | 23 (82.1%) | 5 (17.9%) |
Occupancy by Age of Householder in Plains
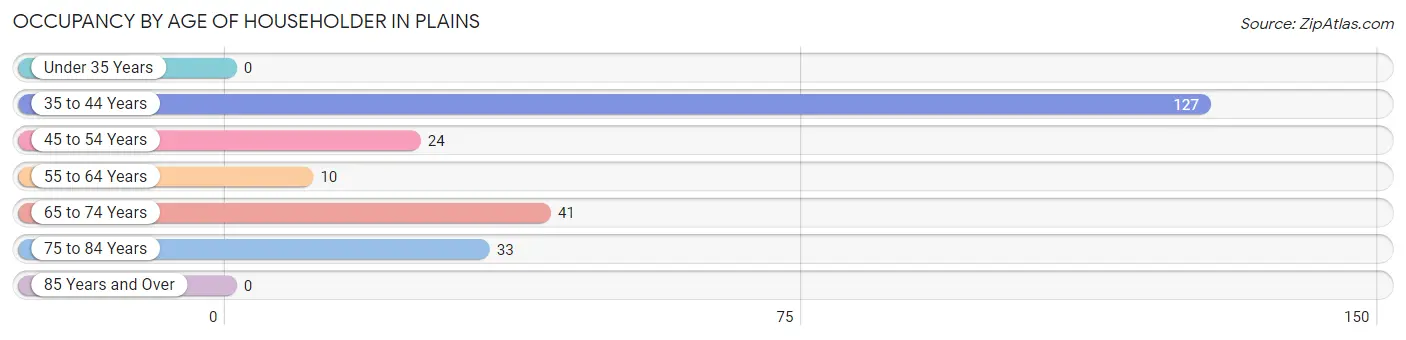
| Age Bracket | # Households | % Households |
| Under 35 Years | 0 | 0.0% |
| 35 to 44 Years | 127 | 54.0% |
| 45 to 54 Years | 24 | 10.2% |
| 55 to 64 Years | 10 | 4.3% |
| 65 to 74 Years | 41 | 17.4% |
| 75 to 84 Years | 33 | 14.0% |
| 85 Years and Over | 0 | 0.0% |
| Total | 235 | 100.0% |
Housing Finances in Plains
Median Income by Occupancy in Plains
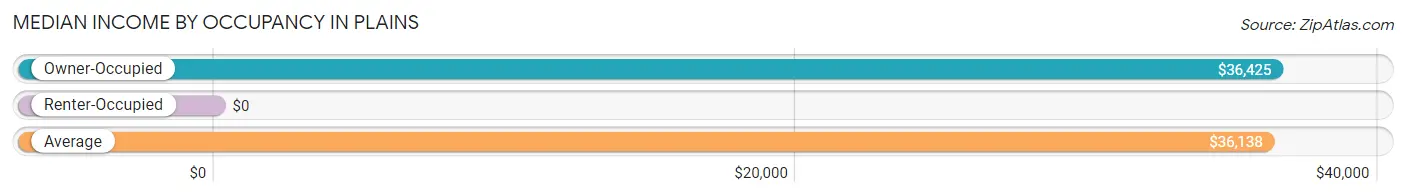
| Occupancy Type | # Households | Median Income |
| Owner-Occupied | 202 (86.0%) | $36,425 |
| Renter-Occupied | 33 (14.0%) | $0 |
| Average | 235 (100.0%) | $36,138 |
Occupancy by Householder Income Bracket in Plains
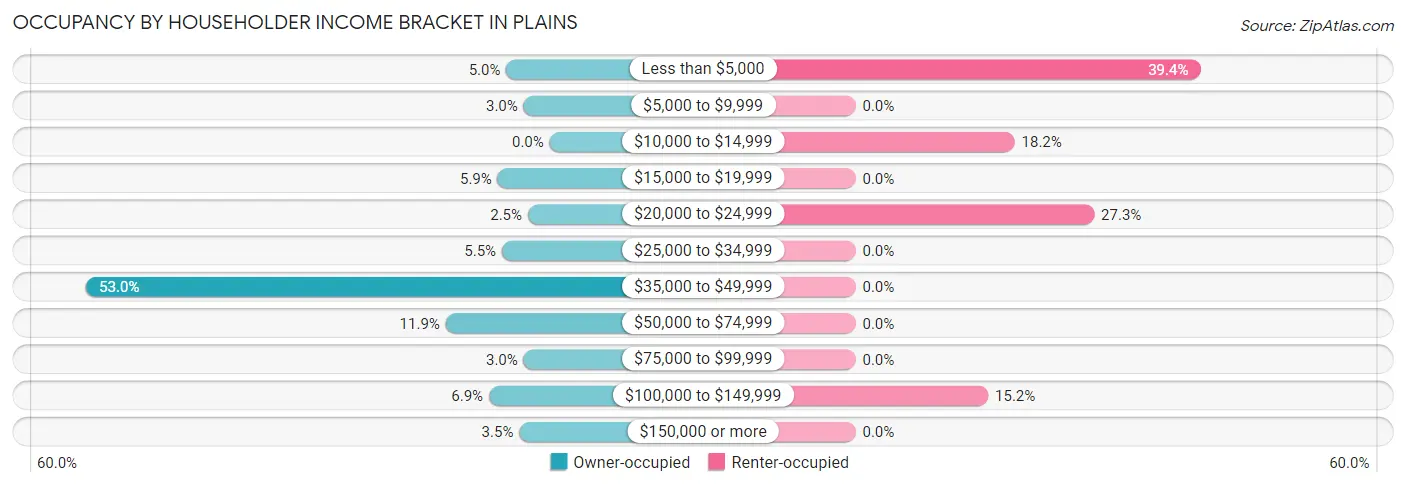
| Income Bracket | Owner-occupied | Renter-occupied |
| Less than $5,000 | 10 (5.0%) | 13 (39.4%) |
| $5,000 to $9,999 | 6 (3.0%) | 0 (0.0%) |
| $10,000 to $14,999 | 0 (0.0%) | 6 (18.2%) |
| $15,000 to $19,999 | 12 (5.9%) | 0 (0.0%) |
| $20,000 to $24,999 | 5 (2.5%) | 9 (27.3%) |
| $25,000 to $34,999 | 11 (5.4%) | 0 (0.0%) |
| $35,000 to $49,999 | 107 (53.0%) | 0 (0.0%) |
| $50,000 to $74,999 | 24 (11.9%) | 0 (0.0%) |
| $75,000 to $99,999 | 6 (3.0%) | 0 (0.0%) |
| $100,000 to $149,999 | 14 (6.9%) | 5 (15.1%) |
| $150,000 or more | 7 (3.5%) | 0 (0.0%) |
| Total | 202 (100.0%) | 33 (100.0%) |
Monthly Housing Cost Tiers in Plains
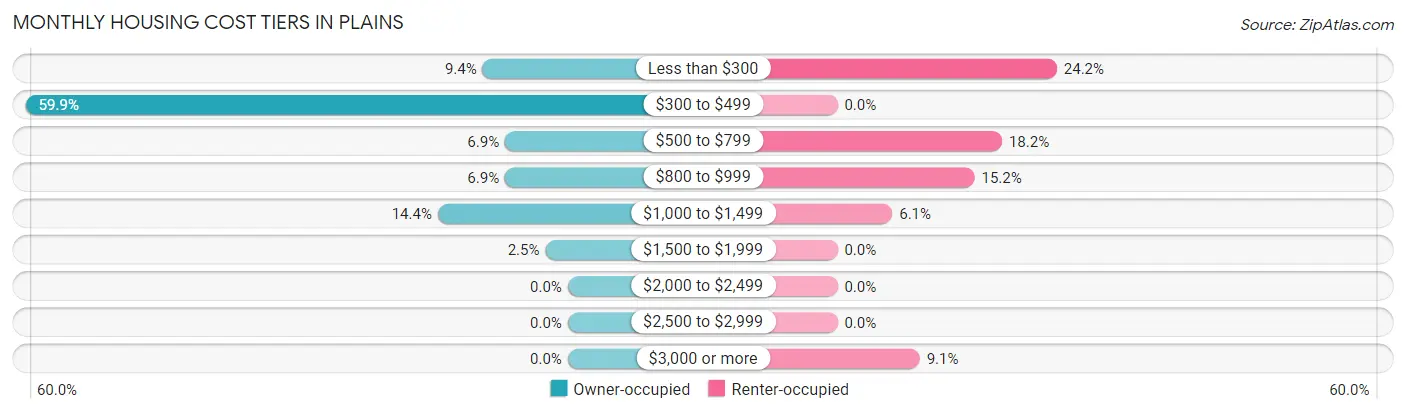
| Monthly Cost | Owner-occupied | Renter-occupied |
| Less than $300 | 19 (9.4%) | 8 (24.2%) |
| $300 to $499 | 121 (59.9%) | 0 (0.0%) |
| $500 to $799 | 14 (6.9%) | 6 (18.2%) |
| $800 to $999 | 14 (6.9%) | 5 (15.1%) |
| $1,000 to $1,499 | 29 (14.4%) | 2 (6.1%) |
| $1,500 to $1,999 | 5 (2.5%) | 0 (0.0%) |
| $2,000 to $2,499 | 0 (0.0%) | 0 (0.0%) |
| $2,500 to $2,999 | 0 (0.0%) | 0 (0.0%) |
| $3,000 or more | 0 (0.0%) | 3 (9.1%) |
| Total | 202 (100.0%) | 33 (100.0%) |
Physical Housing Characteristics in Plains
Housing Structures in Plains
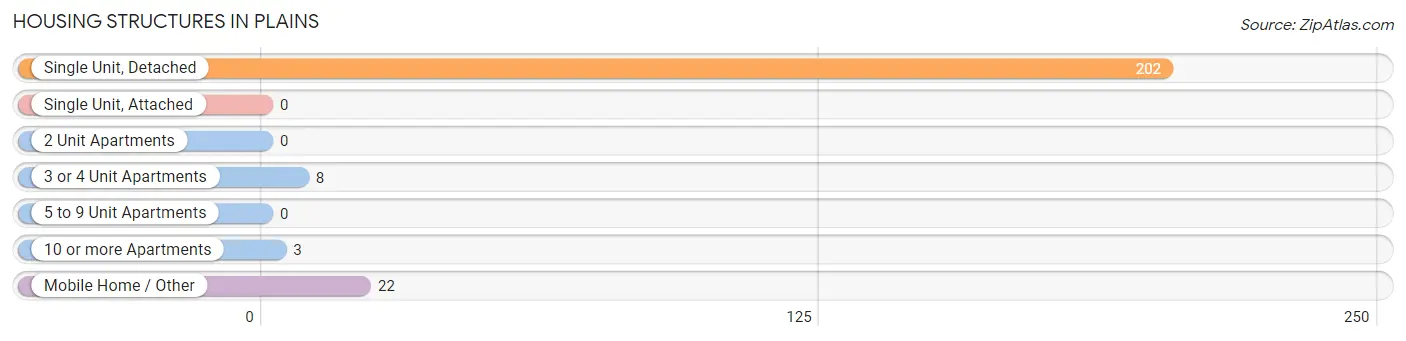
| Structure Type | # Housing Units | % Housing Units |
| Single Unit, Detached | 202 | 86.0% |
| Single Unit, Attached | 0 | 0.0% |
| 2 Unit Apartments | 0 | 0.0% |
| 3 or 4 Unit Apartments | 8 | 3.4% |
| 5 to 9 Unit Apartments | 0 | 0.0% |
| 10 or more Apartments | 3 | 1.3% |
| Mobile Home / Other | 22 | 9.4% |
| Total | 235 | 100.0% |
Housing Structures by Occupancy in Plains
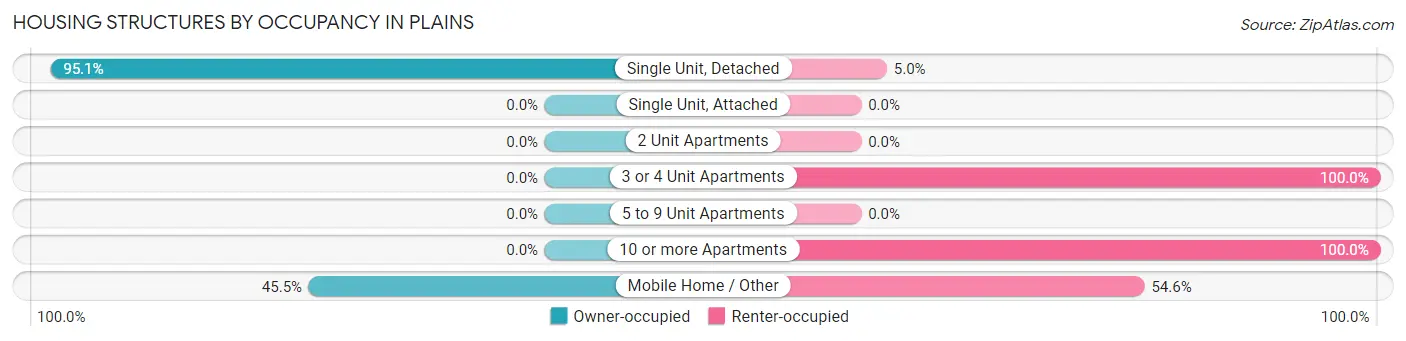
| Structure Type | Owner-occupied | Renter-occupied |
| Single Unit, Detached | 192 (95.1%) | 10 (5.0%) |
| Single Unit, Attached | 0 (0.0%) | 0 (0.0%) |
| 2 Unit Apartments | 0 (0.0%) | 0 (0.0%) |
| 3 or 4 Unit Apartments | 0 (0.0%) | 8 (100.0%) |
| 5 to 9 Unit Apartments | 0 (0.0%) | 0 (0.0%) |
| 10 or more Apartments | 0 (0.0%) | 3 (100.0%) |
| Mobile Home / Other | 10 (45.5%) | 12 (54.5%) |
| Total | 202 (86.0%) | 33 (14.0%) |
Housing Structures by Number of Rooms in Plains
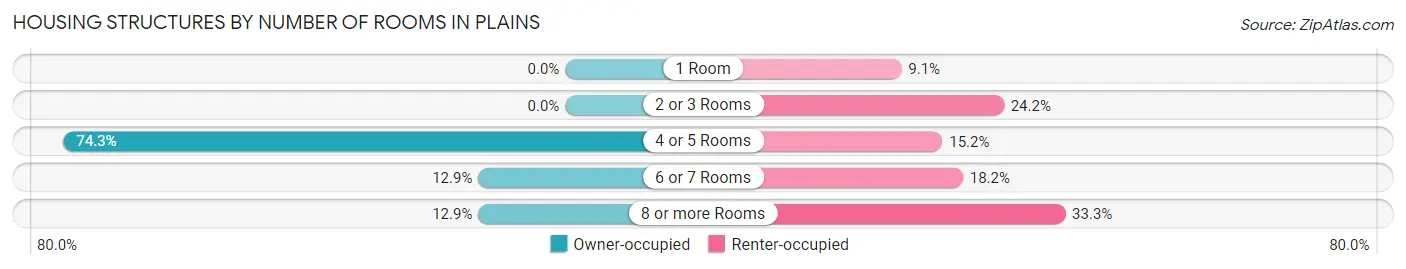
| Number of Rooms | Owner-occupied | Renter-occupied |
| 1 Room | 0 (0.0%) | 3 (9.1%) |
| 2 or 3 Rooms | 0 (0.0%) | 8 (24.2%) |
| 4 or 5 Rooms | 150 (74.3%) | 5 (15.1%) |
| 6 or 7 Rooms | 26 (12.9%) | 6 (18.2%) |
| 8 or more Rooms | 26 (12.9%) | 11 (33.3%) |
| Total | 202 (100.0%) | 33 (100.0%) |
Housing Structure by Heating Type in Plains
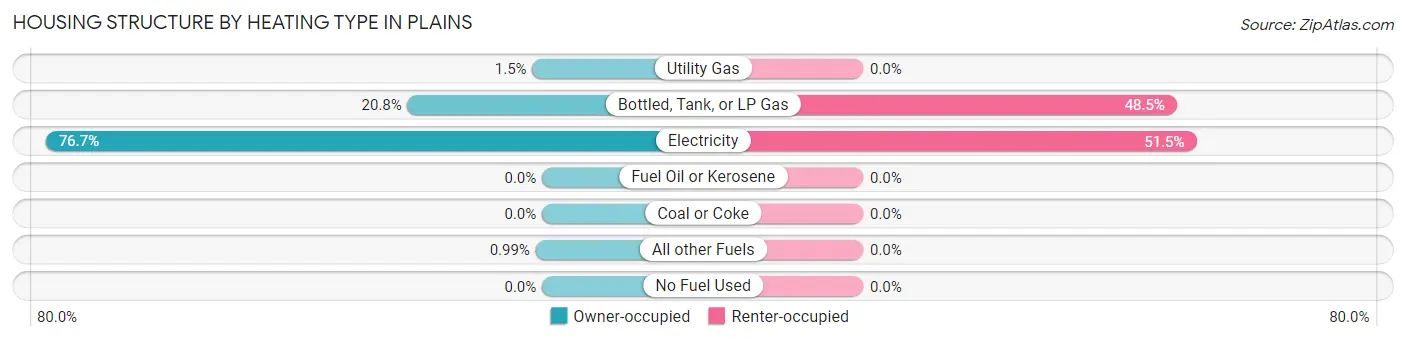
| Heating Type | Owner-occupied | Renter-occupied |
| Utility Gas | 3 (1.5%) | 0 (0.0%) |
| Bottled, Tank, or LP Gas | 42 (20.8%) | 16 (48.5%) |
| Electricity | 155 (76.7%) | 17 (51.5%) |
| Fuel Oil or Kerosene | 0 (0.0%) | 0 (0.0%) |
| Coal or Coke | 0 (0.0%) | 0 (0.0%) |
| All other Fuels | 2 (1.0%) | 0 (0.0%) |
| No Fuel Used | 0 (0.0%) | 0 (0.0%) |
| Total | 202 (100.0%) | 33 (100.0%) |
Household Vehicle Usage in Plains
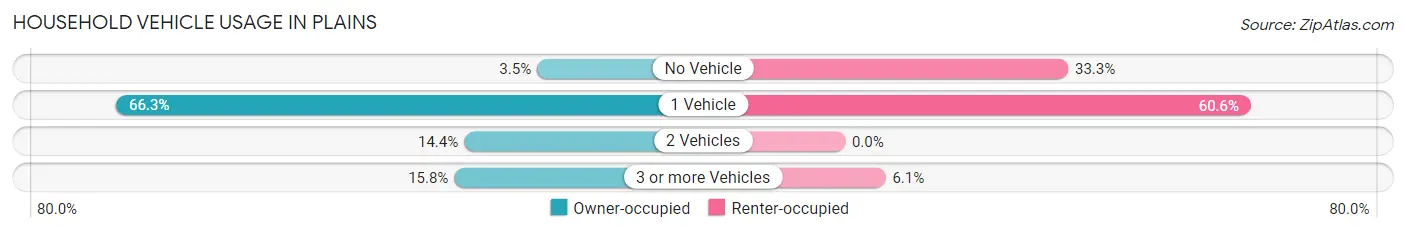
| Vehicles per Household | Owner-occupied | Renter-occupied |
| No Vehicle | 7 (3.5%) | 11 (33.3%) |
| 1 Vehicle | 134 (66.3%) | 20 (60.6%) |
| 2 Vehicles | 29 (14.4%) | 0 (0.0%) |
| 3 or more Vehicles | 32 (15.8%) | 2 (6.1%) |
| Total | 202 (100.0%) | 33 (100.0%) |
Real Estate & Mortgages in Plains
Real Estate and Mortgage Overview in Plains
| Characteristic | Without Mortgage | With Mortgage |
| Housing Units | 159 | 43 |
| Median Property Value | $259,000 | $128,800 |
| Median Household Income | $36,188 | $2 |
| Monthly Housing Costs | $329 | $0 |
| Real Estate Taxes | $1,695 | $11 |
Property Value by Mortgage Status in Plains
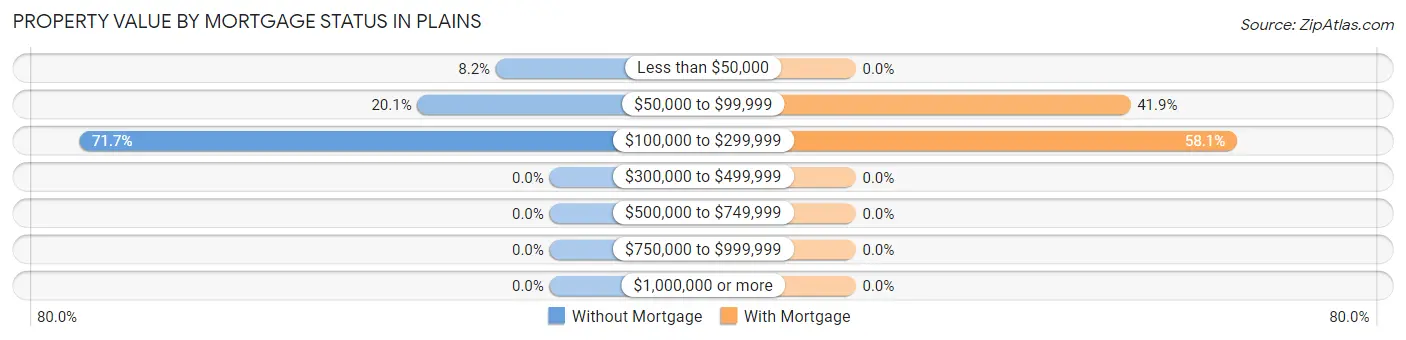
| Property Value | Without Mortgage | With Mortgage |
| Less than $50,000 | 13 (8.2%) | 0 (0.0%) |
| $50,000 to $99,999 | 32 (20.1%) | 18 (41.9%) |
| $100,000 to $299,999 | 114 (71.7%) | 25 (58.1%) |
| $300,000 to $499,999 | 0 (0.0%) | 0 (0.0%) |
| $500,000 to $749,999 | 0 (0.0%) | 0 (0.0%) |
| $750,000 to $999,999 | 0 (0.0%) | 0 (0.0%) |
| $1,000,000 or more | 0 (0.0%) | 0 (0.0%) |
| Total | 159 (100.0%) | 43 (100.0%) |
Household Income by Mortgage Status in Plains
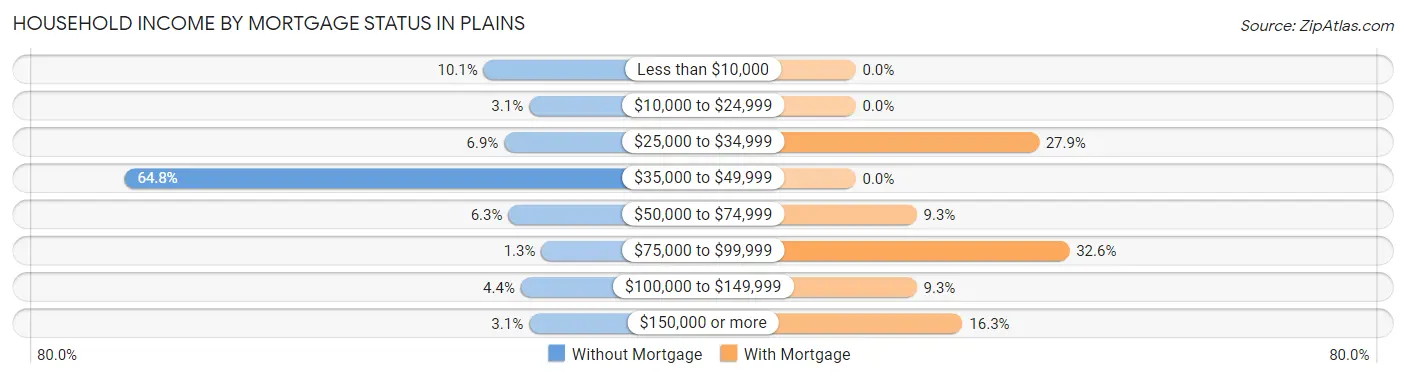
| Household Income | Without Mortgage | With Mortgage |
| Less than $10,000 | 16 (10.1%) | 0 (0.0%) |
| $10,000 to $24,999 | 5 (3.1%) | 0 (0.0%) |
| $25,000 to $34,999 | 11 (6.9%) | 12 (27.9%) |
| $35,000 to $49,999 | 103 (64.8%) | 0 (0.0%) |
| $50,000 to $74,999 | 10 (6.3%) | 4 (9.3%) |
| $75,000 to $99,999 | 2 (1.3%) | 14 (32.6%) |
| $100,000 to $149,999 | 7 (4.4%) | 4 (9.3%) |
| $150,000 or more | 5 (3.1%) | 7 (16.3%) |
| Total | 159 (100.0%) | 43 (100.0%) |
Property Value to Household Income Ratio in Plains
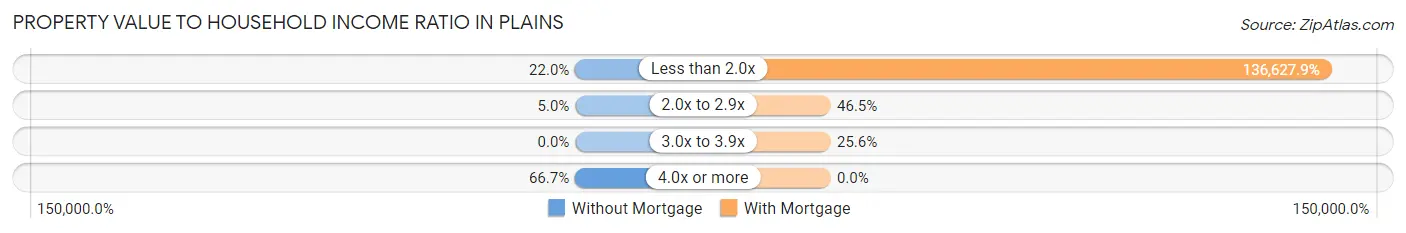
| Value-to-Income Ratio | Without Mortgage | With Mortgage |
| Less than 2.0x | 35 (22.0%) | 58,750 (136,627.9%) |
| 2.0x to 2.9x | 8 (5.0%) | 20 (46.5%) |
| 3.0x to 3.9x | 0 (0.0%) | 11 (25.6%) |
| 4.0x or more | 106 (66.7%) | 0 (0.0%) |
| Total | 159 (100.0%) | 43 (100.0%) |
Real Estate Taxes by Mortgage Status in Plains
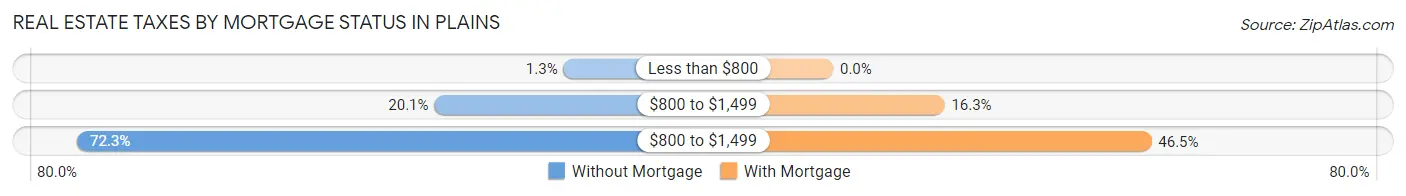
| Property Taxes | Without Mortgage | With Mortgage |
| Less than $800 | 2 (1.3%) | 0 (0.0%) |
| $800 to $1,499 | 32 (20.1%) | 7 (16.3%) |
| $800 to $1,499 | 115 (72.3%) | 20 (46.5%) |
| Total | 159 (100.0%) | 43 (100.0%) |
Health & Disability in Plains
Health Insurance Coverage by Age in Plains
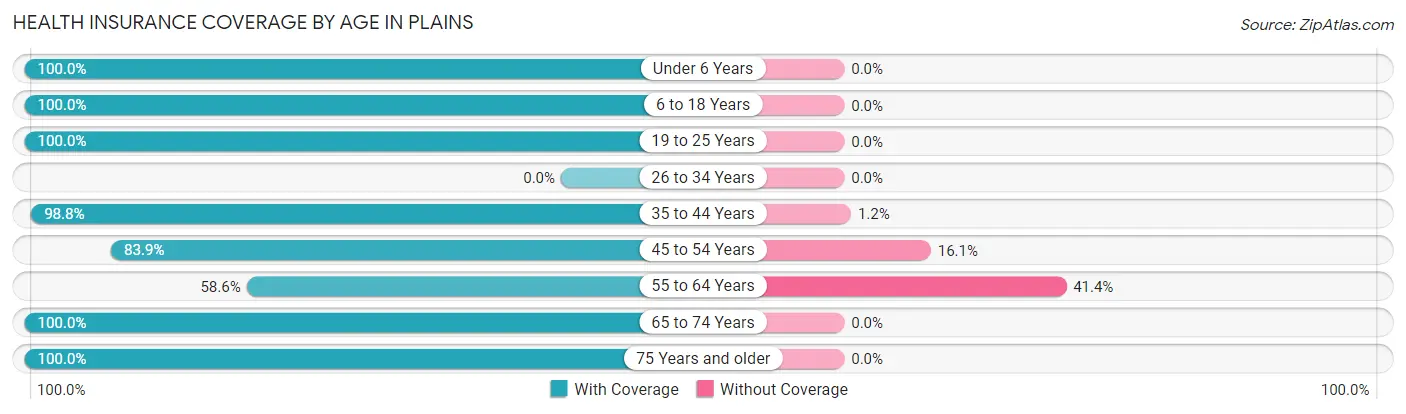
| Age Bracket | With Coverage | Without Coverage |
| Under 6 Years | 6 (100.0%) | 0 (0.0%) |
| 6 to 18 Years | 326 (100.0%) | 0 (0.0%) |
| 19 to 25 Years | 14 (100.0%) | 0 (0.0%) |
| 26 to 34 Years | 0 (0.0%) | 0 (0.0%) |
| 35 to 44 Years | 159 (98.8%) | 2 (1.2%) |
| 45 to 54 Years | 52 (83.9%) | 10 (16.1%) |
| 55 to 64 Years | 17 (58.6%) | 12 (41.4%) |
| 65 to 74 Years | 49 (100.0%) | 0 (0.0%) |
| 75 Years and older | 39 (100.0%) | 0 (0.0%) |
| Total | 662 (96.5%) | 24 (3.5%) |
Health Insurance Coverage by Citizenship Status in Plains
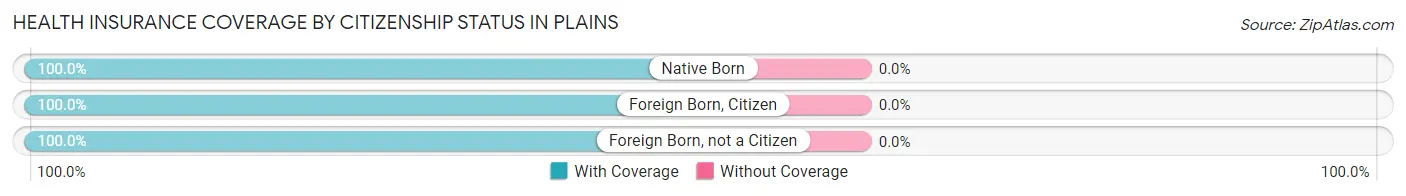
| Citizenship Status | With Coverage | Without Coverage |
| Native Born | 6 (100.0%) | 0 (0.0%) |
| Foreign Born, Citizen | 326 (100.0%) | 0 (0.0%) |
| Foreign Born, not a Citizen | 14 (100.0%) | 0 (0.0%) |
Health Insurance Coverage by Household Income in Plains
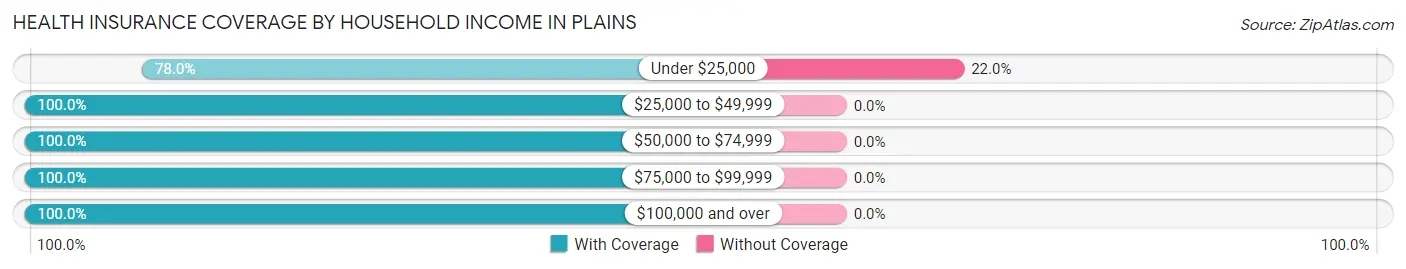
| Household Income | With Coverage | Without Coverage |
| Under $25,000 | 78 (78.0%) | 22 (22.0%) |
| $25,000 to $49,999 | 405 (100.0%) | 0 (0.0%) |
| $50,000 to $74,999 | 56 (100.0%) | 0 (0.0%) |
| $75,000 to $99,999 | 16 (100.0%) | 0 (0.0%) |
| $100,000 and over | 107 (100.0%) | 0 (0.0%) |
Public vs Private Health Insurance Coverage by Age in Plains
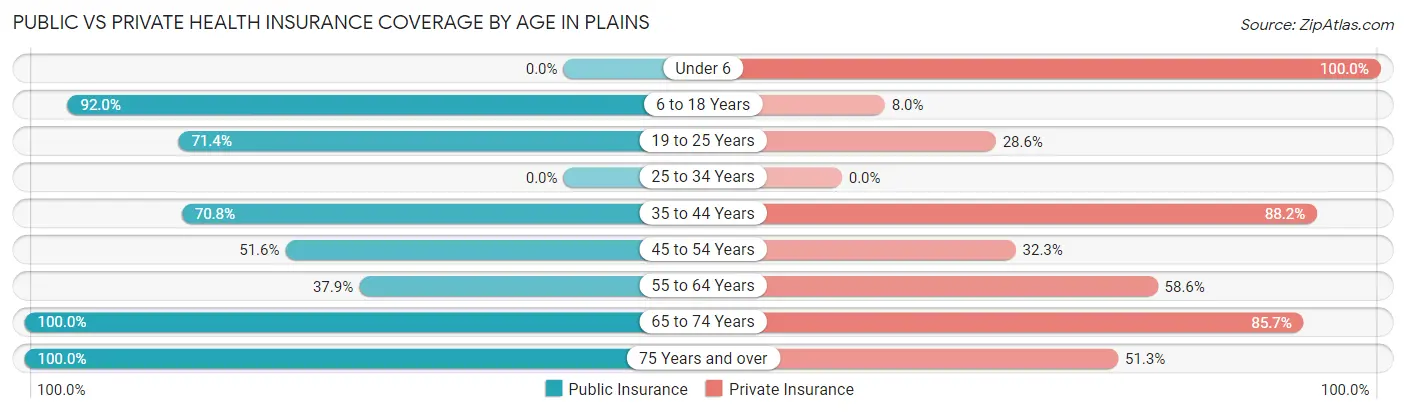
| Age Bracket | Public Insurance | Private Insurance |
| Under 6 | 0 (0.0%) | 6 (100.0%) |
| 6 to 18 Years | 300 (92.0%) | 26 (8.0%) |
| 19 to 25 Years | 10 (71.4%) | 4 (28.6%) |
| 25 to 34 Years | 0 (0.0%) | 0 (0.0%) |
| 35 to 44 Years | 114 (70.8%) | 142 (88.2%) |
| 45 to 54 Years | 32 (51.6%) | 20 (32.3%) |
| 55 to 64 Years | 11 (37.9%) | 17 (58.6%) |
| 65 to 74 Years | 49 (100.0%) | 42 (85.7%) |
| 75 Years and over | 39 (100.0%) | 20 (51.3%) |
| Total | 555 (80.9%) | 277 (40.4%) |
Disability Status by Sex by Age in Plains
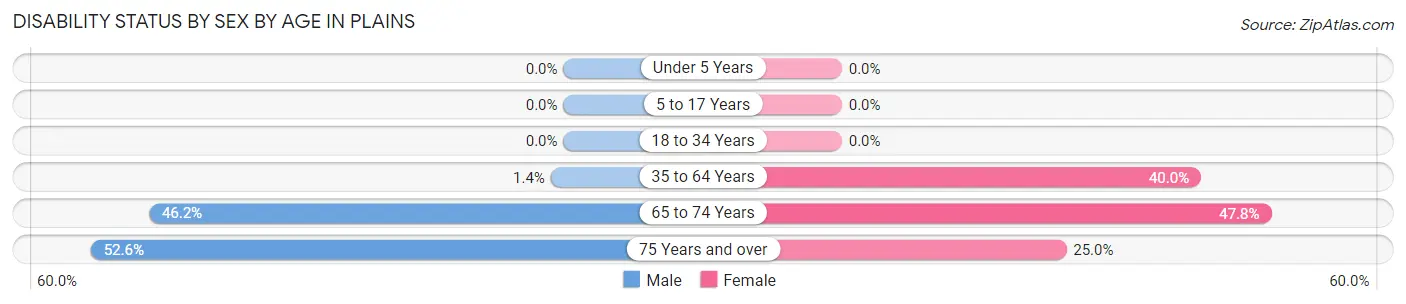
| Age Bracket | Male | Female |
| Under 5 Years | 0 (0.0%) | 0 (0.0%) |
| 5 to 17 Years | 0 (0.0%) | 0 (0.0%) |
| 18 to 34 Years | 0 (0.0%) | 0 (0.0%) |
| 35 to 64 Years | 2 (1.4%) | 44 (40.0%) |
| 65 to 74 Years | 12 (46.2%) | 11 (47.8%) |
| 75 Years and over | 10 (52.6%) | 5 (25.0%) |
Disability Class by Sex by Age in Plains
Disability Class: Hearing Difficulty
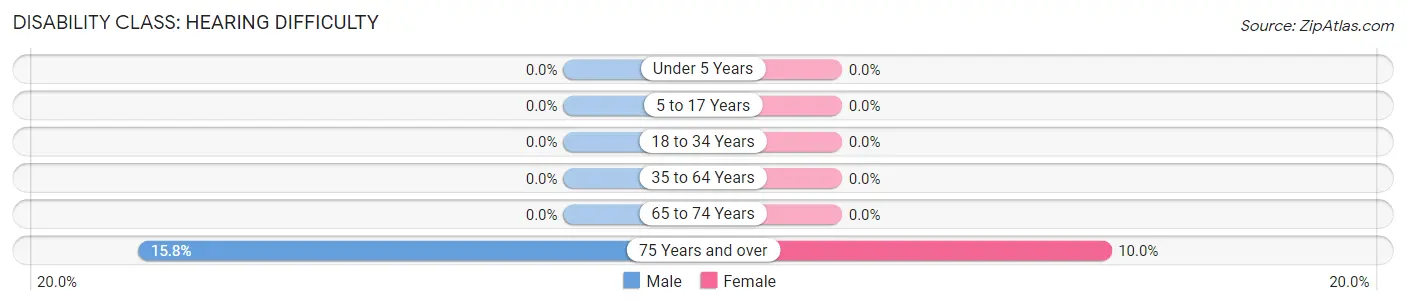
| Age Bracket | Male | Female |
| Under 5 Years | 0 (0.0%) | 0 (0.0%) |
| 5 to 17 Years | 0 (0.0%) | 0 (0.0%) |
| 18 to 34 Years | 0 (0.0%) | 0 (0.0%) |
| 35 to 64 Years | 0 (0.0%) | 0 (0.0%) |
| 65 to 74 Years | 0 (0.0%) | 0 (0.0%) |
| 75 Years and over | 3 (15.8%) | 2 (10.0%) |
Disability Class: Vision Difficulty
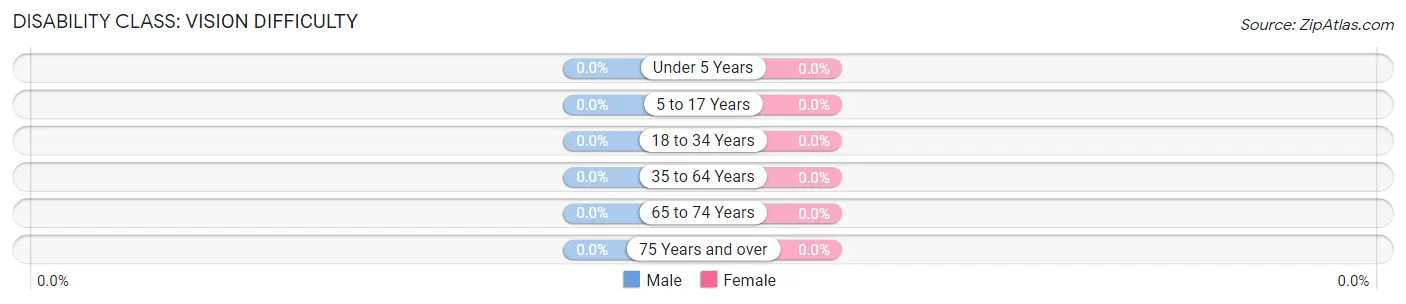
| Age Bracket | Male | Female |
| Under 5 Years | 0 (0.0%) | 0 (0.0%) |
| 5 to 17 Years | 0 (0.0%) | 0 (0.0%) |
| 18 to 34 Years | 0 (0.0%) | 0 (0.0%) |
| 35 to 64 Years | 0 (0.0%) | 0 (0.0%) |
| 65 to 74 Years | 0 (0.0%) | 0 (0.0%) |
| 75 Years and over | 0 (0.0%) | 0 (0.0%) |
Disability Class: Cognitive Difficulty
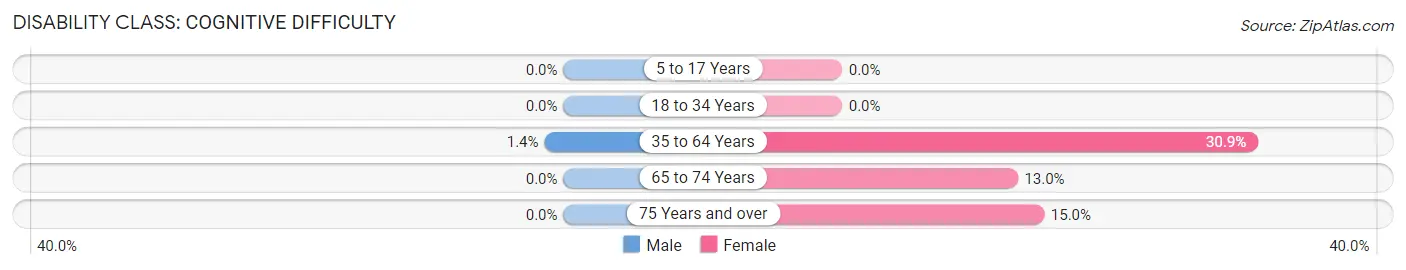
| Age Bracket | Male | Female |
| 5 to 17 Years | 0 (0.0%) | 0 (0.0%) |
| 18 to 34 Years | 0 (0.0%) | 0 (0.0%) |
| 35 to 64 Years | 2 (1.4%) | 34 (30.9%) |
| 65 to 74 Years | 0 (0.0%) | 3 (13.0%) |
| 75 Years and over | 0 (0.0%) | 3 (15.0%) |
Disability Class: Ambulatory Difficulty

| Age Bracket | Male | Female |
| 5 to 17 Years | 0 (0.0%) | 0 (0.0%) |
| 18 to 34 Years | 0 (0.0%) | 0 (0.0%) |
| 35 to 64 Years | 0 (0.0%) | 42 (38.2%) |
| 65 to 74 Years | 12 (46.2%) | 11 (47.8%) |
| 75 Years and over | 7 (36.8%) | 3 (15.0%) |
Disability Class: Self-Care Difficulty
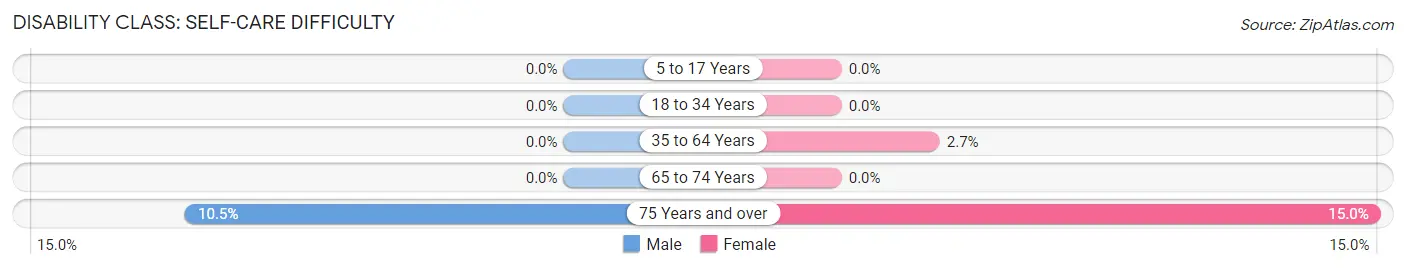
| Age Bracket | Male | Female |
| 5 to 17 Years | 0 (0.0%) | 0 (0.0%) |
| 18 to 34 Years | 0 (0.0%) | 0 (0.0%) |
| 35 to 64 Years | 0 (0.0%) | 3 (2.7%) |
| 65 to 74 Years | 0 (0.0%) | 0 (0.0%) |
| 75 Years and over | 2 (10.5%) | 3 (15.0%) |
Technology Access in Plains
Computing Device Access in Plains
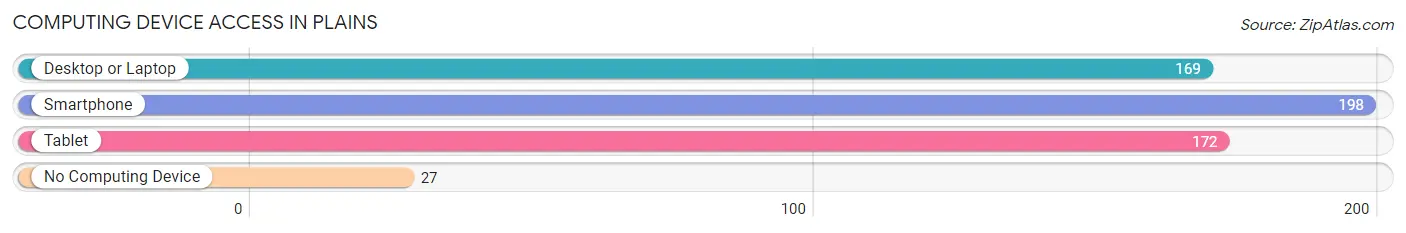
| Device Type | # Households | % Households |
| Desktop or Laptop | 169 | 71.9% |
| Smartphone | 198 | 84.3% |
| Tablet | 172 | 73.2% |
| No Computing Device | 27 | 11.5% |
| Total | 235 | 100.0% |
Internet Access in Plains
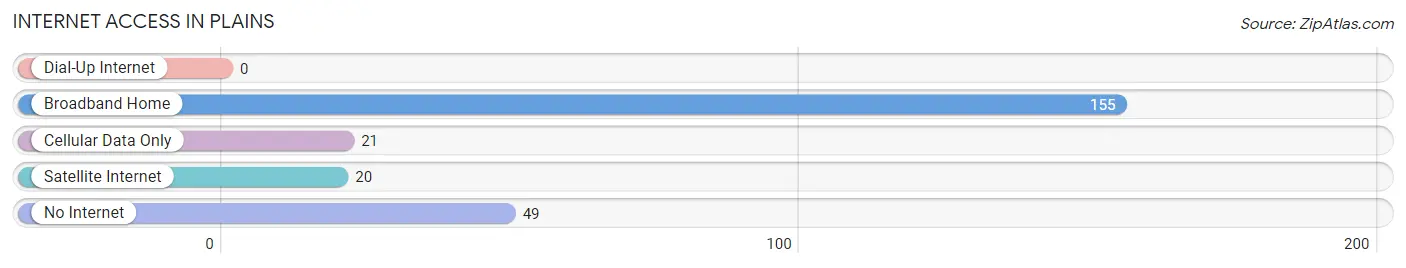
| Internet Type | # Households | % Households |
| Dial-Up Internet | 0 | 0.0% |
| Broadband Home | 155 | 66.0% |
| Cellular Data Only | 21 | 8.9% |
| Satellite Internet | 20 | 8.5% |
| No Internet | 49 | 20.8% |
| Total | 235 | 100.0% |
Plains Summary
Plains, Georgia is a small town located in Sumter County, Georgia. It is the birthplace of former President Jimmy Carter and the home of the Carter Presidential Library and Museum. The town has a population of 776 people, according to the 2010 census.
Geography
Plains is located in the southwestern corner of Sumter County, Georgia, at the intersection of U.S. Route 280 and Georgia State Route 45. The town is situated on the banks of the Kinchafoonee Creek, which flows through the town and is a tributary of the Flint River. Plains is located approximately 20 miles south of Americus, the county seat, and approximately 50 miles south of Macon.
The town is located in the Coastal Plain region of Georgia, which is characterized by flat terrain and sandy soils. The climate is humid subtropical, with hot, humid summers and mild winters. The average annual temperature is around 70 degrees Fahrenheit, and the average annual precipitation is around 50 inches.
History
Plains was founded in 1832 as a trading post and was originally known as "Lick Skillet". The town was renamed Plains in 1883, after the nearby Plains of Dura, which is mentioned in the Bible.
The town was an important stop on the Central of Georgia Railway, which ran through the town from 1883 to 1971. The railway was a major factor in the town's growth and development, and it was the site of the first train robbery in the state of Georgia.
The town was also the birthplace of former President Jimmy Carter, who was born in 1924. Carter served as the 39th President of the United States from 1977 to 1981.
Economy
The economy of Plains is largely based on agriculture and tourism. The town is home to several farms, including the Carter family farm, which is now a museum. The town is also home to several small businesses, including a grocery store, a hardware store, and a restaurant.
Tourism is an important part of the local economy, as the town is home to the Carter Presidential Library and Museum, which attracts visitors from all over the world. The town also hosts several festivals throughout the year, including the Plains Peanut Festival, which celebrates the town's agricultural heritage.
Demographics
According to the 2010 census, the population of Plains was 776, with a racial makeup of 79.3% White, 18.2% African American, 0.4% Native American, 0.4% Asian, 0.1% Pacific Islander, 0.4% from other races, and 1.2% from two or more races. The median household income was $25,938, and the median family income was $31,250. The per capita income was $14,945.
Conclusion
Plains, Georgia is a small town located in Sumter County, Georgia. It is the birthplace of former President Jimmy Carter and the home of the Carter Presidential Library and Museum. The town has a population of 776 people, according to the 2010 census. The economy of Plains is largely based on agriculture and tourism, and the town is home to several small businesses and farms. The town also hosts several festivals throughout the year, including the Plains Peanut Festival. The racial makeup of the town is 79.3% White, 18.2% African American, 0.4% Native American, 0.4% Asian, 0.1% Pacific Islander, 0.4% from other races, and 1.2% from two or more races. The median household income was $25,938, and the median family income was $31,250.
Common Questions
What is Per Capita Income in Plains?
Per Capita income in Plains is $16,094.
What is the Median Family Income in Plains?
Median Family Income in Plains is $36,338.
What is the Median Household income in Plains?
Median Household Income in Plains is $36,138.
What is Income or Wage Gap in Plains?
Income or Wage Gap in Plains is 39.0%.
Women in Plains earn 61.0 cents for every dollar earned by a man.
What is Inequality or Gini Index in Plains?
Inequality or Gini Index in Plains is 0.40.
What is the Total Population of Plains?
Total Population of Plains is 781.
What is the Total Male Population of Plains?
Total Male Population of Plains is 310.
What is the Total Female Population of Plains?
Total Female Population of Plains is 471.
What is the Ratio of Males per 100 Females in Plains?
There are 65.82 Males per 100 Females in Plains.
What is the Ratio of Females per 100 Males in Plains?
There are 151.94 Females per 100 Males in Plains.
What is the Median Population Age in Plains?
Median Population Age in Plains is 42.1 Years.
What is the Average Family Size in Plains
Average Family Size in Plains is 3.4 People.
What is the Average Household Size in Plains
Average Household Size in Plains is 2.9 People.
How Large is the Labor Force in Plains?
There are 190 People in the Labor Forcein in Plains.
What is the Percentage of People in the Labor Force in Plains?
41.2% of People are in the Labor Force in Plains.