Pine Lake, GA Map & Demographics
Pine Lake Map
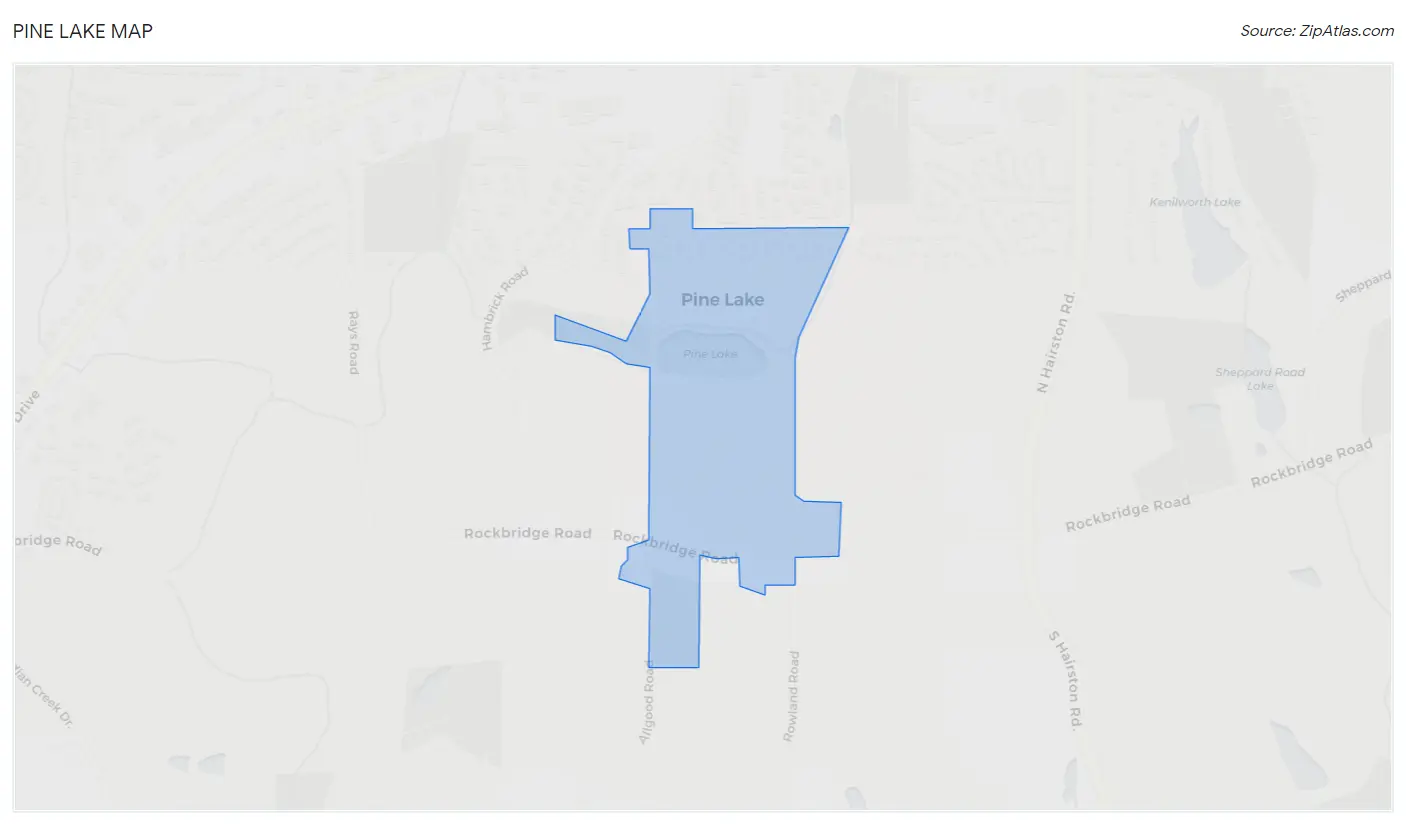
Pine Lake Overview
$39,280
PER CAPITA INCOME
$91,023
AVG FAMILY INCOME
$68,359
AVG HOUSEHOLD INCOME
11.8%
WAGE / INCOME GAP [ % ]
88.2¢/ $1
WAGE / INCOME GAP [ $ ]
0.34
INEQUALITY / GINI INDEX
888
TOTAL POPULATION
347
MALE POPULATION
541
FEMALE POPULATION
64.14
MALES / 100 FEMALES
155.91
FEMALES / 100 MALES
42.4
MEDIAN AGE
2.7
AVG FAMILY SIZE
2.1
AVG HOUSEHOLD SIZE
512
LABOR FORCE [ PEOPLE ]
69.4%
PERCENT IN LABOR FORCE
4.5%
UNEMPLOYMENT RATE
Pine Lake Zip Codes
Pine Lake Area Codes
Income in Pine Lake
Income Overview in Pine Lake
Per Capita Income in Pine Lake is $39,280, while median incomes of families and households are $91,023 and $68,359 respectively.
| Characteristic | Number | Measure |
| Per Capita Income | 888 | $39,280 |
| Median Family Income | 249 | $91,023 |
| Mean Family Income | 249 | $91,010 |
| Median Household Income | 429 | $68,359 |
| Mean Household Income | 429 | $81,401 |
| Income Deficit | 249 | $0 |
| Wage / Income Gap (%) | 888 | 11.75% |
| Wage / Income Gap ($) | 888 | 88.25¢ per $1 |
| Gini / Inequality Index | 888 | 0.34 |
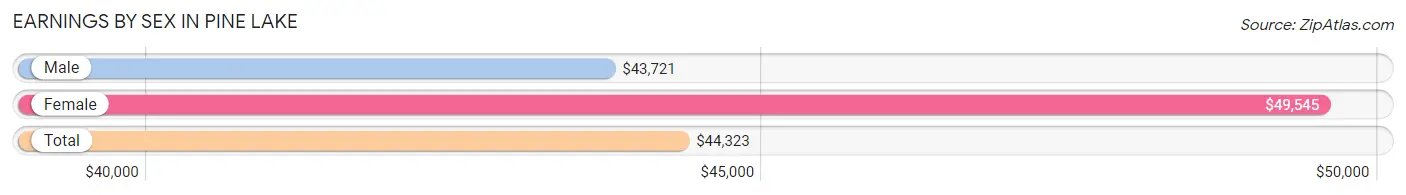
Earnings by Sex in Pine Lake
Average Earnings in Pine Lake are $44,323, $43,721 for men and $49,545 for women, a difference of 11.7%.
| Sex | Number | Average Earnings |
| Male | 210 (40.4%) | $43,721 |
| Female | 310 (59.6%) | $49,545 |
| Total | 520 (100.0%) | $44,323 |
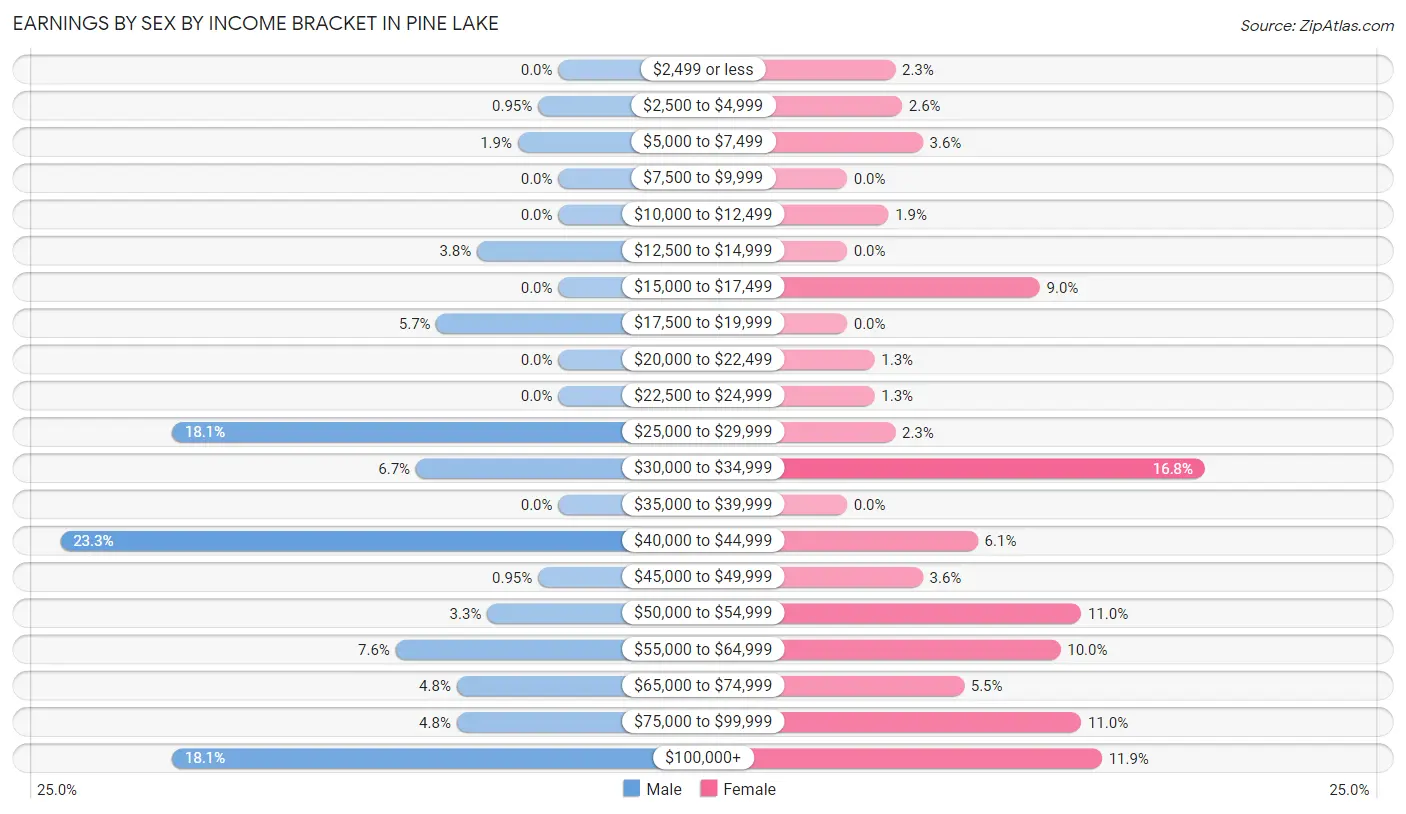
Earnings by Sex by Income Bracket in Pine Lake
The most common earnings brackets in Pine Lake are $40,000 to $44,999 for men (49 | 23.3%) and $30,000 to $34,999 for women (52 | 16.8%).
| Income | Male | Female |
| $2,499 or less | 0 (0.0%) | 7 (2.3%) |
| $2,500 to $4,999 | 2 (0.9%) | 8 (2.6%) |
| $5,000 to $7,499 | 4 (1.9%) | 11 (3.5%) |
| $7,500 to $9,999 | 0 (0.0%) | 0 (0.0%) |
| $10,000 to $12,499 | 0 (0.0%) | 6 (1.9%) |
| $12,500 to $14,999 | 8 (3.8%) | 0 (0.0%) |
| $15,000 to $17,499 | 0 (0.0%) | 28 (9.0%) |
| $17,500 to $19,999 | 12 (5.7%) | 0 (0.0%) |
| $20,000 to $22,499 | 0 (0.0%) | 4 (1.3%) |
| $22,500 to $24,999 | 0 (0.0%) | 4 (1.3%) |
| $25,000 to $29,999 | 38 (18.1%) | 7 (2.3%) |
| $30,000 to $34,999 | 14 (6.7%) | 52 (16.8%) |
| $35,000 to $39,999 | 0 (0.0%) | 0 (0.0%) |
| $40,000 to $44,999 | 49 (23.3%) | 19 (6.1%) |
| $45,000 to $49,999 | 2 (0.9%) | 11 (3.5%) |
| $50,000 to $54,999 | 7 (3.3%) | 34 (11.0%) |
| $55,000 to $64,999 | 16 (7.6%) | 31 (10.0%) |
| $65,000 to $74,999 | 10 (4.8%) | 17 (5.5%) |
| $75,000 to $99,999 | 10 (4.8%) | 34 (11.0%) |
| $100,000+ | 38 (18.1%) | 37 (11.9%) |
| Total | 210 (100.0%) | 310 (100.0%) |
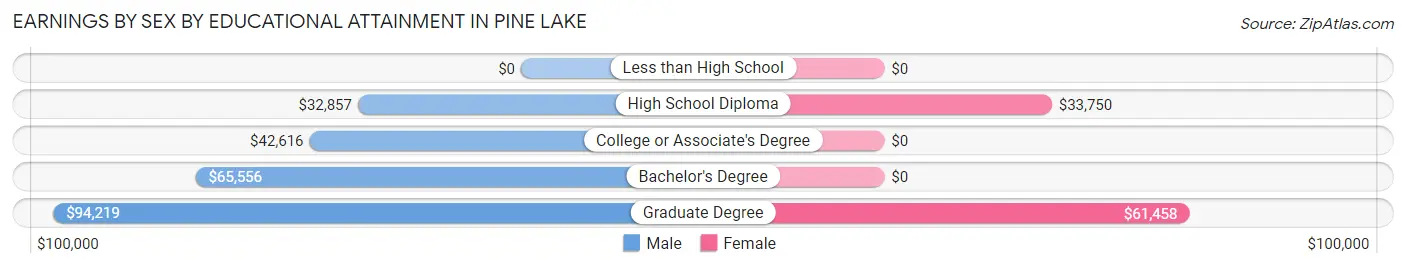
Earnings by Sex by Educational Attainment in Pine Lake
Average earnings in Pine Lake are $43,866 for men and $49,545 for women, a difference of 11.5%. Men with an educational attainment of graduate degree enjoy the highest average annual earnings of $94,219, while those with high school diploma education earn the least with $32,857. Women with an educational attainment of graduate degree earn the most with the average annual earnings of $61,458, while those with high school diploma education have the smallest earnings of $33,750.
| Educational Attainment | Male Income | Female Income |
| Less than High School | - | - |
| High School Diploma | $32,857 | $33,750 |
| College or Associate's Degree | $42,616 | $0 |
| Bachelor's Degree | $65,556 | $0 |
| Graduate Degree | $94,219 | $61,458 |
| Total | $43,866 | $49,545 |
Family Income in Pine Lake
Family Income Brackets in Pine Lake
According to the Pine Lake family income data, there are 73 families falling into the $100,000 to $149,999 income range, which is the most common income bracket and makes up 29.3% of all families.
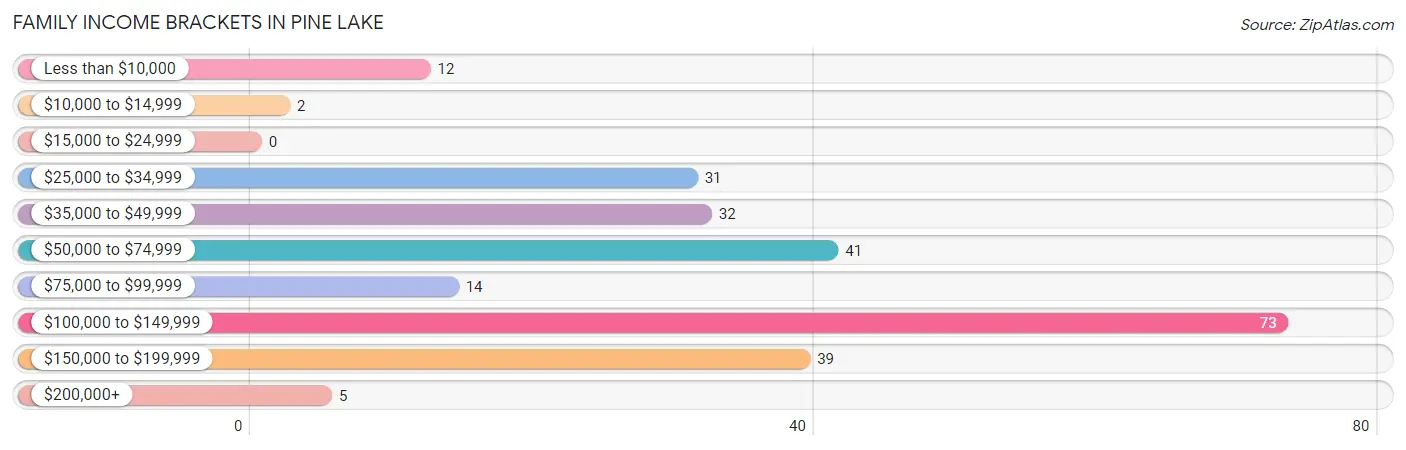
| Income Bracket | # Families | % Families |
| Less than $10,000 | 12 | 4.8% |
| $10,000 to $14,999 | 2 | 0.8% |
| $15,000 to $24,999 | 0 | 0.0% |
| $25,000 to $34,999 | 31 | 12.4% |
| $35,000 to $49,999 | 32 | 12.9% |
| $50,000 to $74,999 | 41 | 16.5% |
| $75,000 to $99,999 | 14 | 5.6% |
| $100,000 to $149,999 | 73 | 29.3% |
| $150,000 to $199,999 | 39 | 15.7% |
| $200,000+ | 5 | 2.0% |
Family Income by Famaliy Size in Pine Lake
4-person families (14 | 5.6%) account for the highest median family income in Pine Lake with $160,313 per family, while 2-person families (170 | 68.3%) have the highest median income of $45,341 per family member.
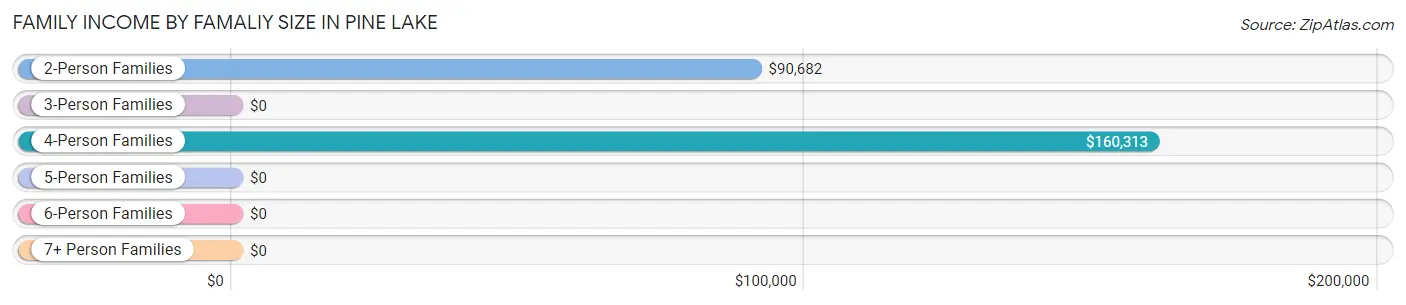
| Income Bracket | # Families | Median Income |
| 2-Person Families | 170 (68.3%) | $90,682 |
| 3-Person Families | 52 (20.9%) | $0 |
| 4-Person Families | 14 (5.6%) | $160,313 |
| 5-Person Families | 8 (3.2%) | $0 |
| 6-Person Families | 5 (2.0%) | $0 |
| 7+ Person Families | 0 (0.0%) | $0 |
| Total | 249 (100.0%) | $91,023 |
Family Income by Number of Earners in Pine Lake
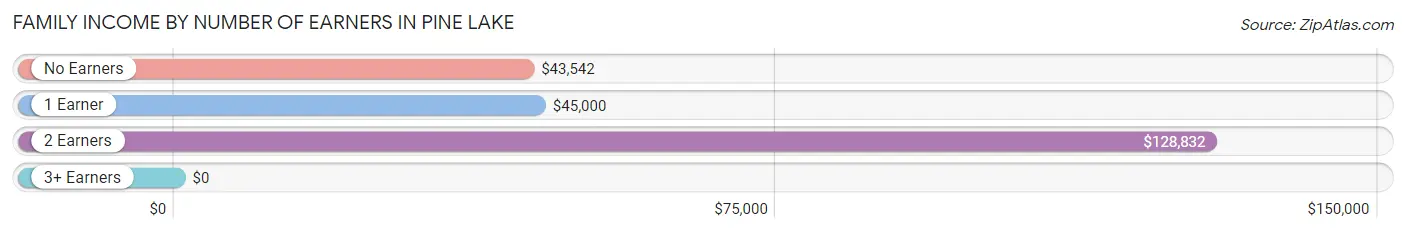
| Number of Earners | # Families | Median Income |
| No Earners | 21 (8.4%) | $43,542 |
| 1 Earner | 108 (43.4%) | $45,000 |
| 2 Earners | 115 (46.2%) | $128,832 |
| 3+ Earners | 5 (2.0%) | $0 |
| Total | 249 (100.0%) | $91,023 |
Household Income in Pine Lake
Household Income Brackets in Pine Lake
With 98 households falling in the category, the $100,000 to $149,999 income range is the most frequent in Pine Lake, accounting for 22.8% of all households. In contrast, only 5 households (1.2%) fall into the $200,000+ income bracket, making it the least populous group.
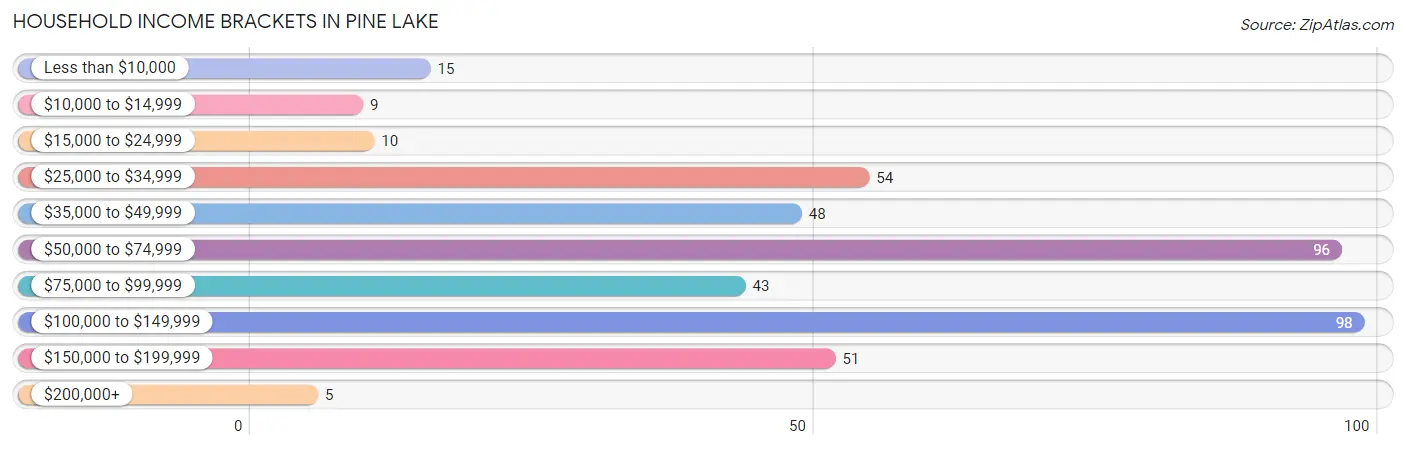
| Income Bracket | # Households | % Households |
| Less than $10,000 | 15 | 3.5% |
| $10,000 to $14,999 | 9 | 2.1% |
| $15,000 to $24,999 | 10 | 2.3% |
| $25,000 to $34,999 | 54 | 12.6% |
| $35,000 to $49,999 | 48 | 11.2% |
| $50,000 to $74,999 | 96 | 22.4% |
| $75,000 to $99,999 | 43 | 10.0% |
| $100,000 to $149,999 | 98 | 22.8% |
| $150,000 to $199,999 | 51 | 11.9% |
| $200,000+ | 5 | 1.2% |
Household Income by Householder Age in Pine Lake
The median household income in Pine Lake is $68,359, with the highest median household income of $97,500 found in the 25 to 44 years age bracket for the primary householder. A total of 142 households (33.1%) fall into this category. Meanwhile, the 15 to 24 years age bracket for the primary householder has the lowest median household income of $0, with 5 households (1.2%) in this group.
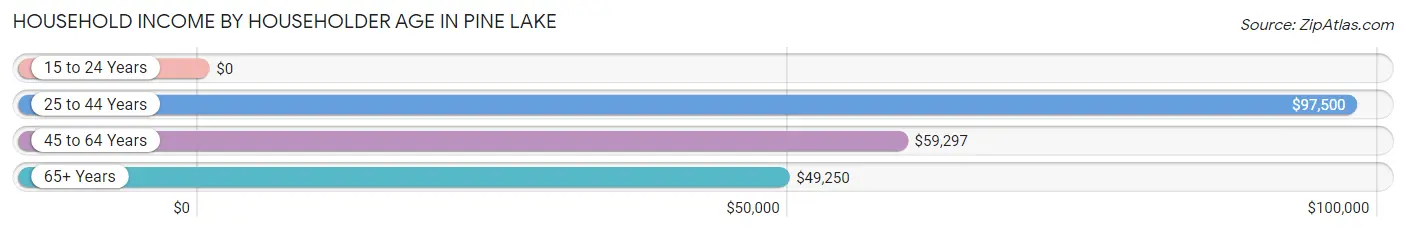
| Income Bracket | # Households | Median Income |
| 15 to 24 Years | 5 (1.2%) | $0 |
| 25 to 44 Years | 142 (33.1%) | $97,500 |
| 45 to 64 Years | 199 (46.4%) | $59,297 |
| 65+ Years | 83 (19.4%) | $49,250 |
| Total | 429 (100.0%) | $68,359 |
Poverty in Pine Lake
Income Below Poverty by Sex and Age in Pine Lake
With 2.3% poverty level for males and 10.9% for females among the residents of Pine Lake, 5 year old males and 75 year old and over females are the most vulnerable to poverty, with 3 males (42.9%) and 9 females (69.2%) in their respective age groups living below the poverty level.
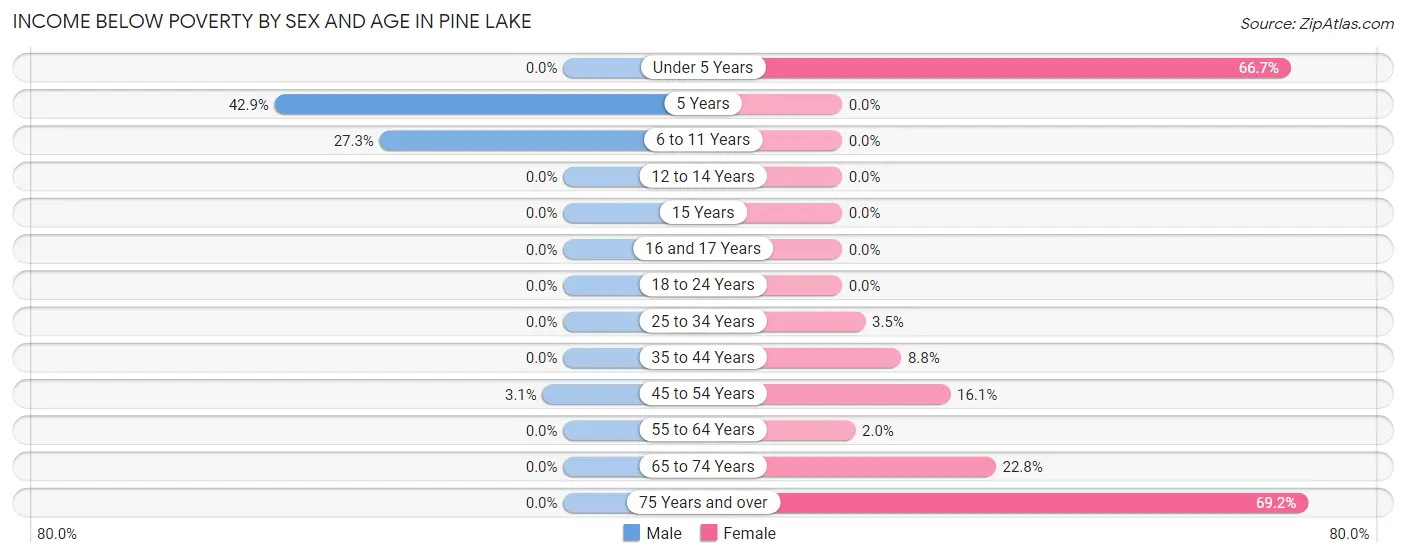
| Age Bracket | Male | Female |
| Under 5 Years | 0 (0.0%) | 6 (66.7%) |
| 5 Years | 3 (42.9%) | 0 (0.0%) |
| 6 to 11 Years | 3 (27.3%) | 0 (0.0%) |
| 12 to 14 Years | 0 (0.0%) | 0 (0.0%) |
| 15 Years | 0 (0.0%) | 0 (0.0%) |
| 16 and 17 Years | 0 (0.0%) | 0 (0.0%) |
| 18 to 24 Years | 0 (0.0%) | 0 (0.0%) |
| 25 to 34 Years | 0 (0.0%) | 3 (3.5%) |
| 35 to 44 Years | 0 (0.0%) | 8 (8.8%) |
| 45 to 54 Years | 2 (3.1%) | 9 (16.1%) |
| 55 to 64 Years | 0 (0.0%) | 2 (2.0%) |
| 65 to 74 Years | 0 (0.0%) | 21 (22.8%) |
| 75 Years and over | 0 (0.0%) | 9 (69.2%) |
| Total | 8 (2.3%) | 58 (10.9%) |
Income Above Poverty by Sex and Age in Pine Lake
According to the poverty statistics in Pine Lake, males aged under 5 years and females aged 6 to 11 years are the age groups that are most secure financially, with 100.0% of males and 100.0% of females in these age groups living above the poverty line.
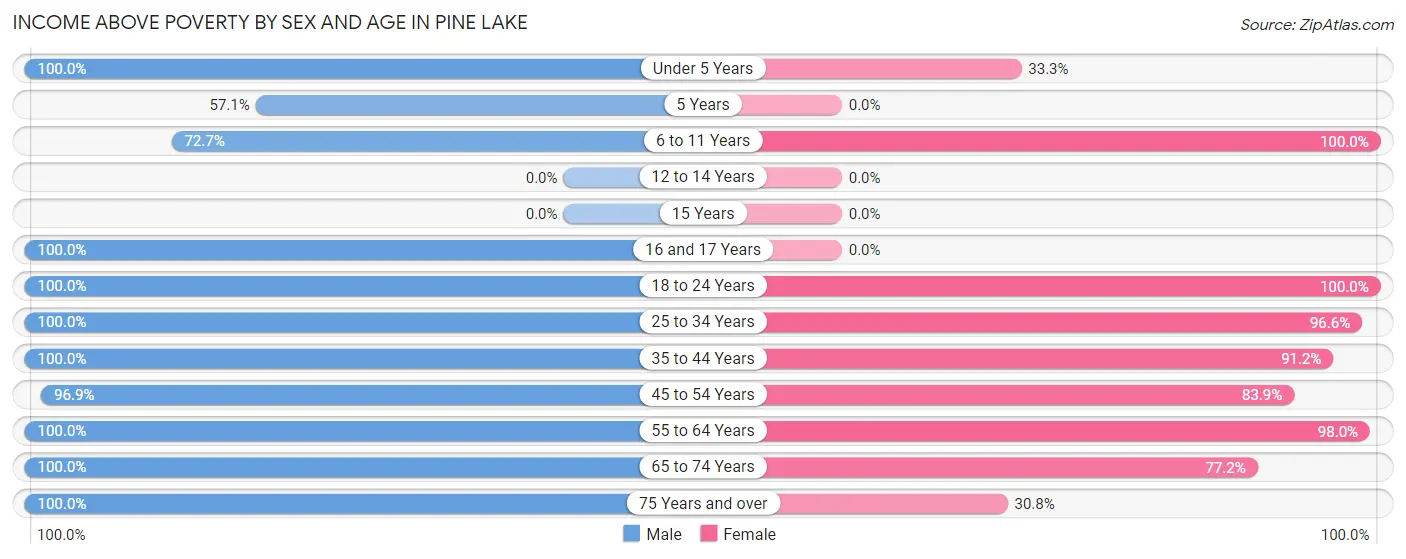
| Age Bracket | Male | Female |
| Under 5 Years | 36 (100.0%) | 3 (33.3%) |
| 5 Years | 4 (57.1%) | 0 (0.0%) |
| 6 to 11 Years | 8 (72.7%) | 78 (100.0%) |
| 12 to 14 Years | 0 (0.0%) | 0 (0.0%) |
| 15 Years | 0 (0.0%) | 0 (0.0%) |
| 16 and 17 Years | 23 (100.0%) | 0 (0.0%) |
| 18 to 24 Years | 44 (100.0%) | 5 (100.0%) |
| 25 to 34 Years | 59 (100.0%) | 84 (96.6%) |
| 35 to 44 Years | 15 (100.0%) | 83 (91.2%) |
| 45 to 54 Years | 63 (96.9%) | 47 (83.9%) |
| 55 to 64 Years | 52 (100.0%) | 99 (98.0%) |
| 65 to 74 Years | 29 (100.0%) | 71 (77.2%) |
| 75 Years and over | 6 (100.0%) | 4 (30.8%) |
| Total | 339 (97.7%) | 474 (89.1%) |
Income Below Poverty Among Married-Couple Families in Pine Lake
The poverty statistics for married-couple families in Pine Lake show that 1.2% or 2 of the total 167 families live below the poverty line. Families with 1 or 2 children have the highest poverty rate of 4.6%, comprising of 2 families. On the other hand, families with no children have the lowest poverty rate of 0.0%, which includes 0 families.
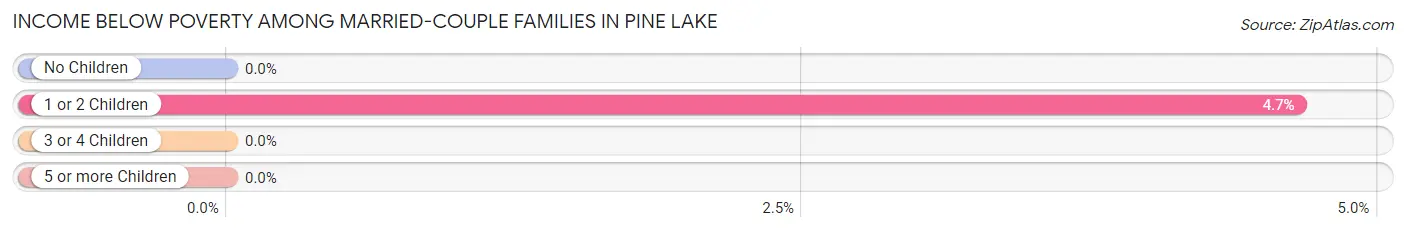
| Children | Above Poverty | Below Poverty |
| No Children | 124 (100.0%) | 0 (0.0%) |
| 1 or 2 Children | 41 (95.4%) | 2 (4.6%) |
| 3 or 4 Children | 0 (0.0%) | 0 (0.0%) |
| 5 or more Children | 0 (0.0%) | 0 (0.0%) |
| Total | 165 (98.8%) | 2 (1.2%) |
Income Below Poverty Among Single-Parent Households in Pine Lake
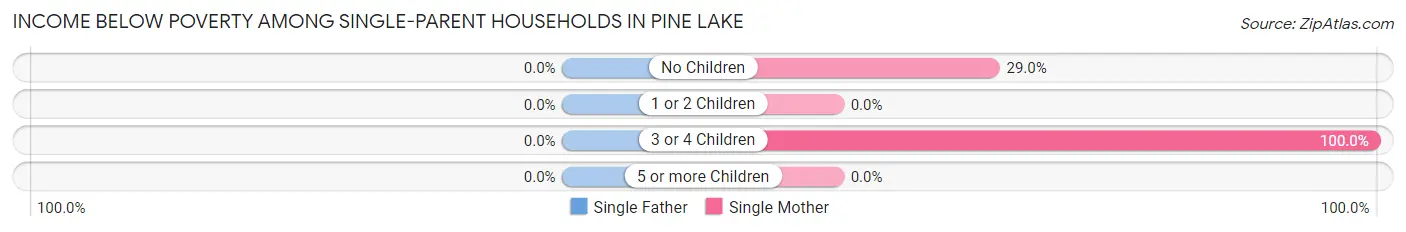
| Children | Single Father | Single Mother |
| No Children | 0 (0.0%) | 9 (29.0%) |
| 1 or 2 Children | 0 (0.0%) | 0 (0.0%) |
| 3 or 4 Children | 0 (0.0%) | 3 (100.0%) |
| 5 or more Children | 0 (0.0%) | 0 (0.0%) |
| Total | 0 (0.0%) | 12 (19.4%) |
Income Below Poverty Among Married-Couple vs Single-Parent Households in Pine Lake
The poverty data for Pine Lake shows that 2 of the married-couple family households (1.2%) and 12 of the single-parent households (14.6%) are living below the poverty level. Within the married-couple family households, those with 1 or 2 children have the highest poverty rate, with 2 households (4.6%) falling below the poverty line. Among the single-parent households, those with 3 or 4 children have the highest poverty rate, with 3 household (100.0%) living below poverty.
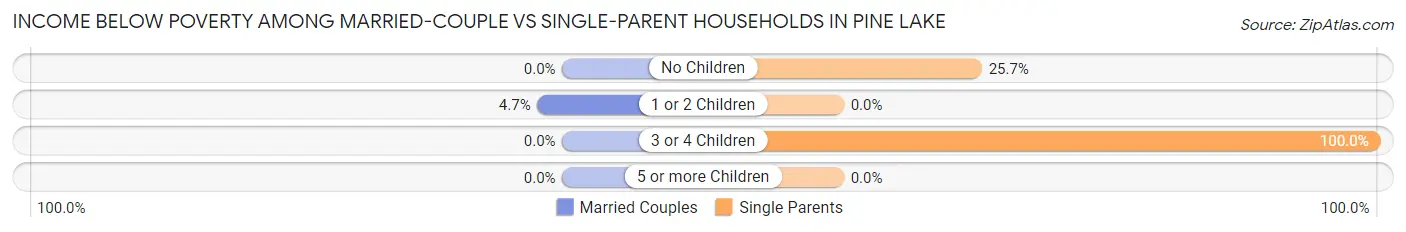
| Children | Married-Couple Families | Single-Parent Households |
| No Children | 0 (0.0%) | 9 (25.7%) |
| 1 or 2 Children | 2 (4.6%) | 0 (0.0%) |
| 3 or 4 Children | 0 (0.0%) | 3 (100.0%) |
| 5 or more Children | 0 (0.0%) | 0 (0.0%) |
| Total | 2 (1.2%) | 12 (14.6%) |
Race in Pine Lake
The most populous races in Pine Lake are White / Caucasian (650 | 73.2%), Black / African American (166 | 18.7%), and Two or more Races (67 | 7.5%).
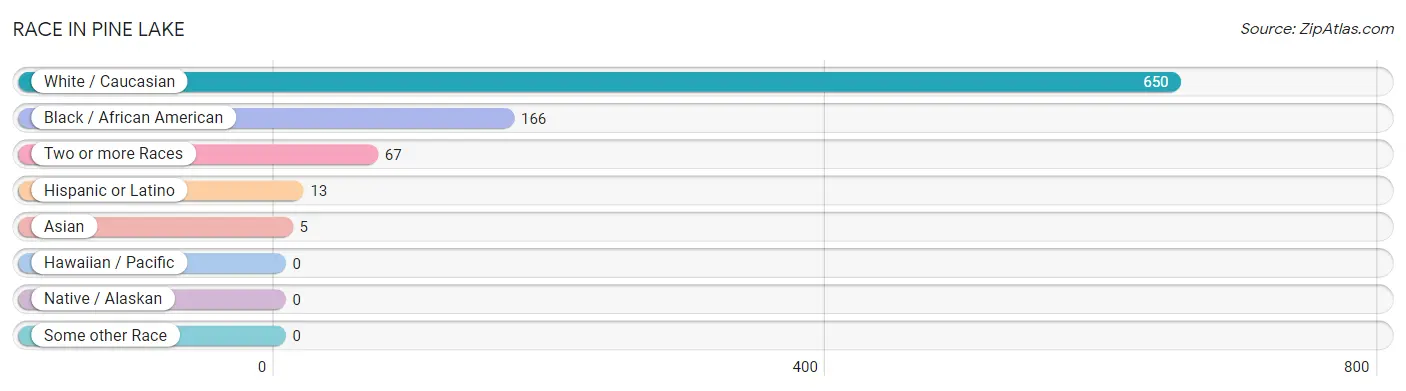
| Race | # Population | % Population |
| Asian | 5 | 0.6% |
| Black / African American | 166 | 18.7% |
| Hawaiian / Pacific | 0 | 0.0% |
| Hispanic or Latino | 13 | 1.5% |
| Native / Alaskan | 0 | 0.0% |
| White / Caucasian | 650 | 73.2% |
| Two or more Races | 67 | 7.5% |
| Some other Race | 0 | 0.0% |
| Total | 888 | 100.0% |
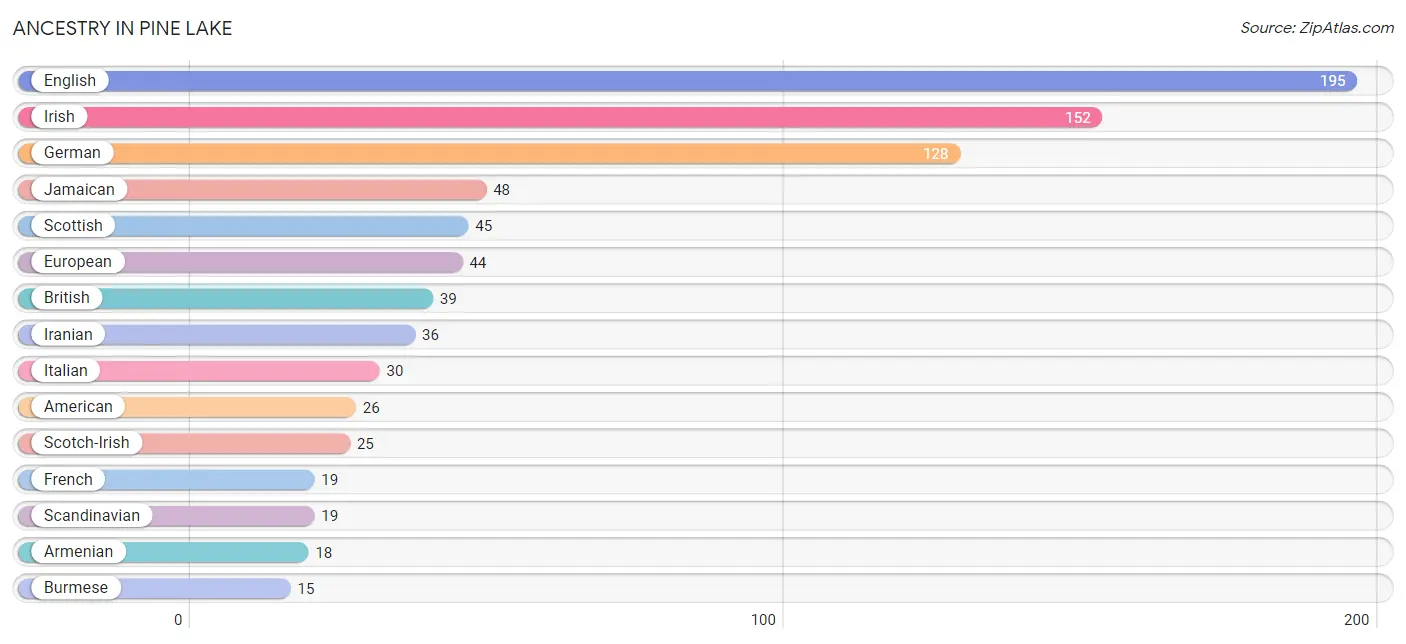
Ancestry in Pine Lake
The most populous ancestries reported in Pine Lake are English (195 | 22.0%), Irish (152 | 17.1%), German (128 | 14.4%), Jamaican (48 | 5.4%), and Scottish (45 | 5.1%), together accounting for 64.0% of all Pine Lake residents.
| Ancestry | # Population | % Population |
| African | 8 | 0.9% |
| American | 26 | 2.9% |
| Armenian | 18 | 2.0% |
| British | 39 | 4.4% |
| Burmese | 15 | 1.7% |
| Central American | 5 | 0.6% |
| Colombian | 1 | 0.1% |
| Croatian | 9 | 1.0% |
| Danish | 12 | 1.3% |
| Dutch | 9 | 1.0% |
| Eastern European | 8 | 0.9% |
| English | 195 | 22.0% |
| European | 44 | 5.0% |
| French | 19 | 2.1% |
| German | 128 | 14.4% |
| Greek | 5 | 0.6% |
| Indian (Asian) | 3 | 0.3% |
| Iranian | 36 | 4.1% |
| Irish | 152 | 17.1% |
| Italian | 30 | 3.4% |
| Jamaican | 48 | 5.4% |
| Japanese | 5 | 0.6% |
| Korean | 3 | 0.3% |
| Mexican | 4 | 0.4% |
| Nicaraguan | 5 | 0.6% |
| Norwegian | 10 | 1.1% |
| Polish | 5 | 0.6% |
| Puerto Rican | 3 | 0.3% |
| Romanian | 2 | 0.2% |
| Russian | 8 | 0.9% |
| Scandinavian | 19 | 2.1% |
| Scotch-Irish | 25 | 2.8% |
| Scottish | 45 | 5.1% |
| South American | 1 | 0.1% |
| Sri Lankan | 5 | 0.6% |
| Subsaharan African | 8 | 0.9% |
| Swiss | 12 | 1.3% |
| Thai | 3 | 0.3% |
| Welsh | 1 | 0.1% | View All 39 Rows |
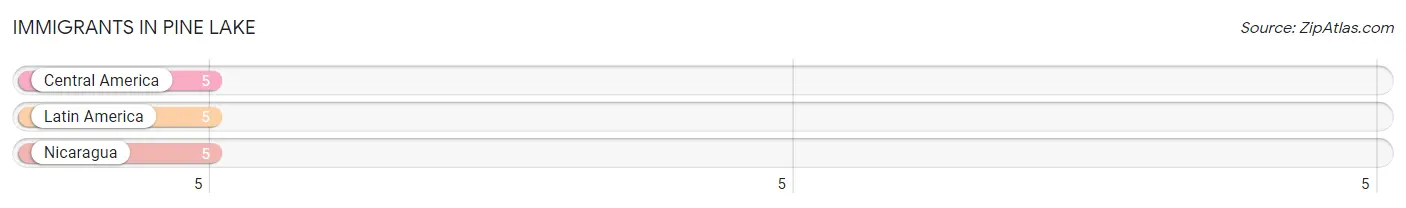
Immigrants in Pine Lake
The most numerous immigrant groups reported in Pine Lake came from Central America (5 | 0.6%), Latin America (5 | 0.6%), and Nicaragua (5 | 0.6%), together accounting for 1.7% of all Pine Lake residents.
| Immigration Origin | # Population | % Population |
| Central America | 5 | 0.6% |
| Latin America | 5 | 0.6% |
| Nicaragua | 5 | 0.6% | View All 3 Rows |
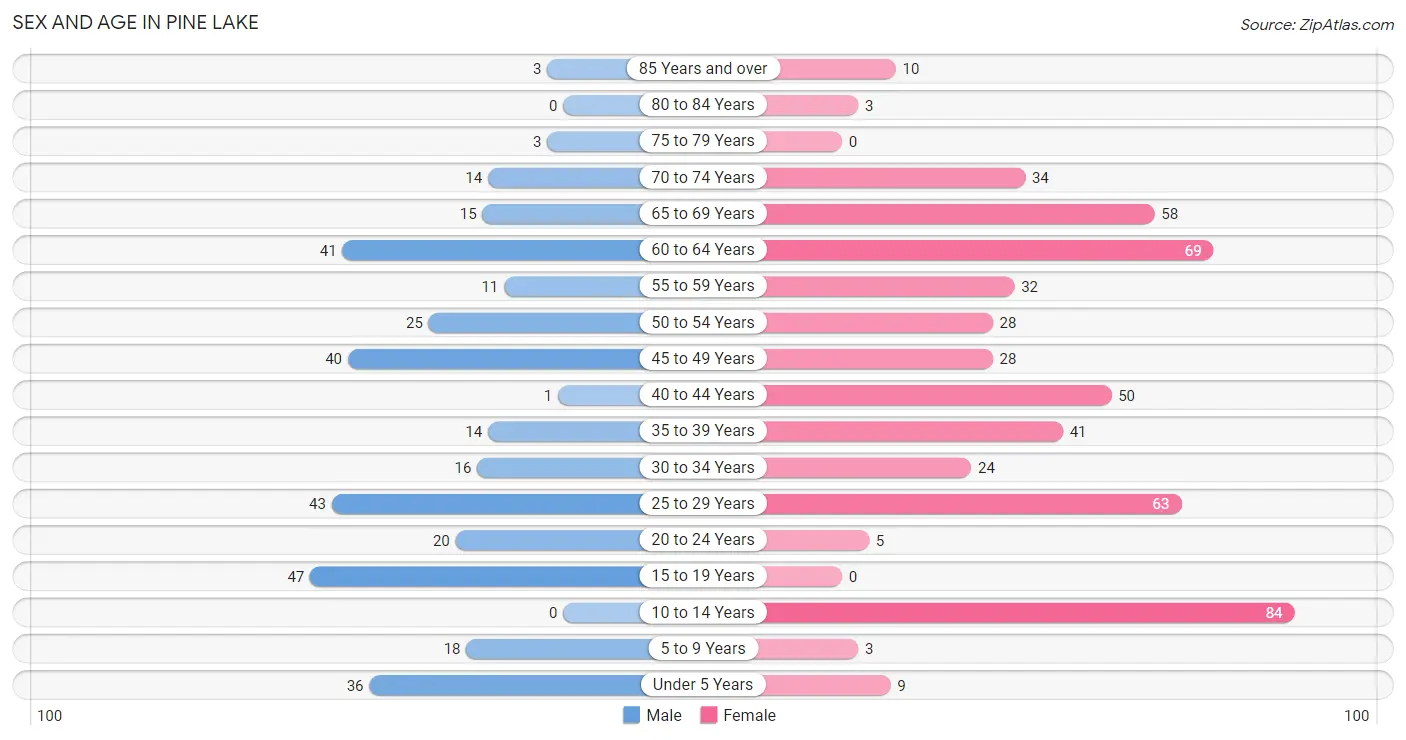
Sex and Age in Pine Lake
Sex and Age in Pine Lake
The most populous age groups in Pine Lake are 15 to 19 Years (47 | 13.5%) for men and 10 to 14 Years (84 | 15.5%) for women.
| Age Bracket | Male | Female |
| Under 5 Years | 36 (10.4%) | 9 (1.7%) |
| 5 to 9 Years | 18 (5.2%) | 3 (0.5%) |
| 10 to 14 Years | 0 (0.0%) | 84 (15.5%) |
| 15 to 19 Years | 47 (13.5%) | 0 (0.0%) |
| 20 to 24 Years | 20 (5.8%) | 5 (0.9%) |
| 25 to 29 Years | 43 (12.4%) | 63 (11.7%) |
| 30 to 34 Years | 16 (4.6%) | 24 (4.4%) |
| 35 to 39 Years | 14 (4.0%) | 41 (7.6%) |
| 40 to 44 Years | 1 (0.3%) | 50 (9.2%) |
| 45 to 49 Years | 40 (11.5%) | 28 (5.2%) |
| 50 to 54 Years | 25 (7.2%) | 28 (5.2%) |
| 55 to 59 Years | 11 (3.2%) | 32 (5.9%) |
| 60 to 64 Years | 41 (11.8%) | 69 (12.8%) |
| 65 to 69 Years | 15 (4.3%) | 58 (10.7%) |
| 70 to 74 Years | 14 (4.0%) | 34 (6.3%) |
| 75 to 79 Years | 3 (0.9%) | 0 (0.0%) |
| 80 to 84 Years | 0 (0.0%) | 3 (0.5%) |
| 85 Years and over | 3 (0.9%) | 10 (1.8%) |
| Total | 347 (100.0%) | 541 (100.0%) |
Families and Households in Pine Lake
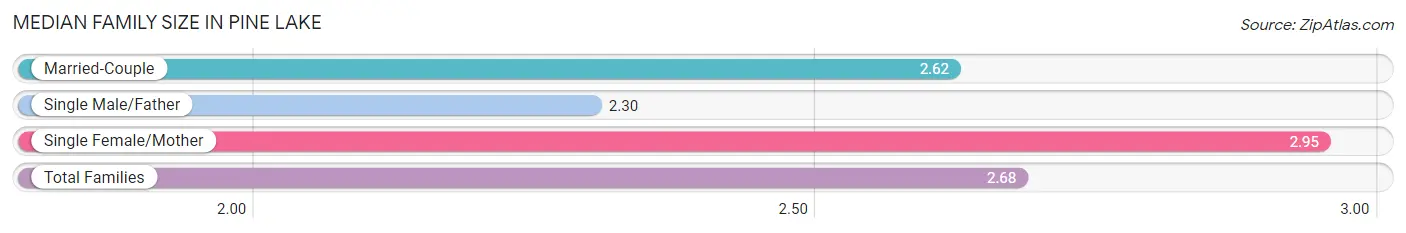
Median Family Size in Pine Lake
The median family size in Pine Lake is 2.68 persons per family, with single female/mother families (62 | 24.9%) accounting for the largest median family size of 2.95 persons per family. On the other hand, single male/father families (20 | 8.0%) represent the smallest median family size with 2.30 persons per family.
| Family Type | # Families | Family Size |
| Married-Couple | 167 (67.1%) | 2.62 |
| Single Male/Father | 20 (8.0%) | 2.30 |
| Single Female/Mother | 62 (24.9%) | 2.95 |
| Total Families | 249 (100.0%) | 2.68 |
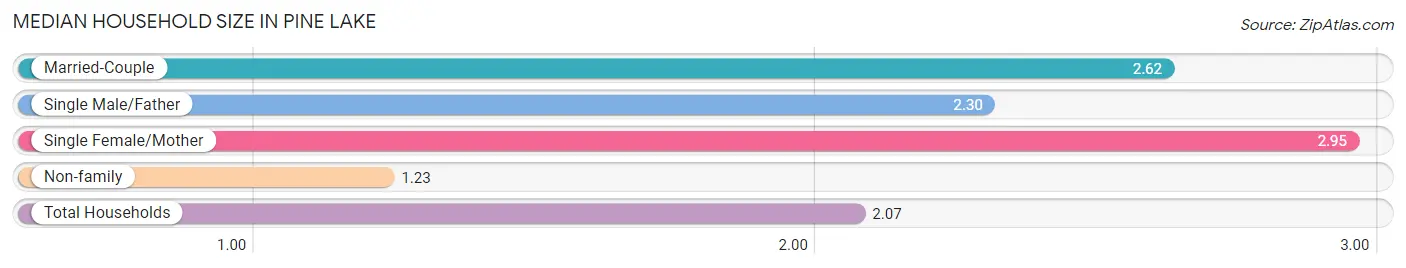
Median Household Size in Pine Lake
The median household size in Pine Lake is 2.07 persons per household, with single female/mother households (62 | 14.4%) accounting for the largest median household size of 2.95 persons per household. non-family households (180 | 42.0%) represent the smallest median household size with 1.23 persons per household.
| Household Type | # Households | Household Size |
| Married-Couple | 167 (38.9%) | 2.62 |
| Single Male/Father | 20 (4.7%) | 2.30 |
| Single Female/Mother | 62 (14.4%) | 2.95 |
| Non-family | 180 (42.0%) | 1.23 |
| Total Households | 429 (100.0%) | 2.07 |
Household Size by Marriage Status in Pine Lake
Out of a total of 429 households in Pine Lake, 249 (58.0%) are family households, while 180 (42.0%) are nonfamily households. The most numerous type of family households are 2-person households, comprising 170, and the most common type of nonfamily households are 1-person households, comprising 150.
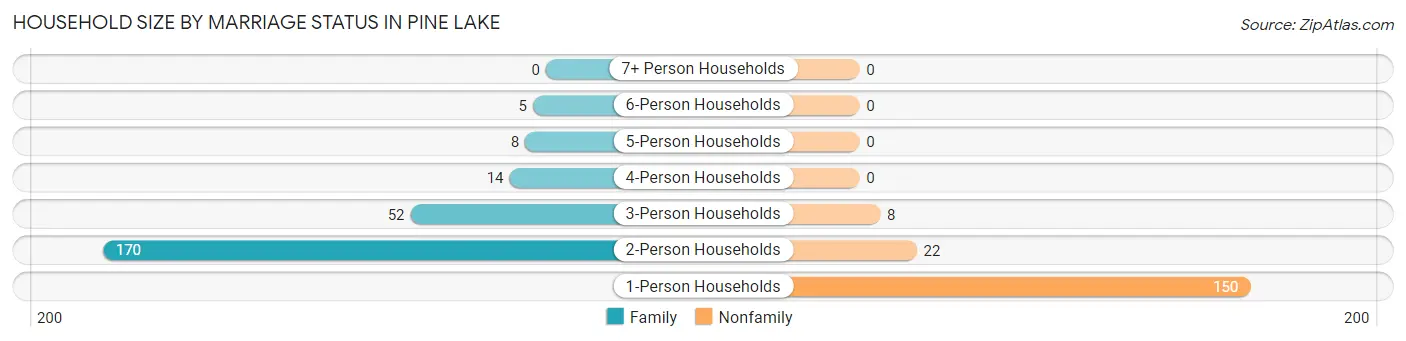
| Household Size | Family Households | Nonfamily Households |
| 1-Person Households | - | 150 (35.0%) |
| 2-Person Households | 170 (39.6%) | 22 (5.1%) |
| 3-Person Households | 52 (12.1%) | 8 (1.9%) |
| 4-Person Households | 14 (3.3%) | 0 (0.0%) |
| 5-Person Households | 8 (1.9%) | 0 (0.0%) |
| 6-Person Households | 5 (1.2%) | 0 (0.0%) |
| 7+ Person Households | 0 (0.0%) | 0 (0.0%) |
| Total | 249 (58.0%) | 180 (42.0%) |
Female Fertility in Pine Lake
Fertility by Age in Pine Lake
| Age Bracket | Women with Births | Births / 1,000 Women |
| 15 to 19 years | 0 (0.0%) | 0.0 |
| 20 to 34 years | 0 (0.0%) | 0.0 |
| 35 to 50 years | 0 (0.0%) | 0.0 |
| Total | 0 (0.0%) | 0.0 |
Fertility by Age by Marriage Status in Pine Lake
| Age Bracket | Married | Unmarried |
| 15 to 19 years | 0 (0.0%) | 0 (0.0%) |
| 20 to 34 years | 0 (0.0%) | 0 (0.0%) |
| 35 to 50 years | 0 (0.0%) | 0 (0.0%) |
| Total | 0 (0.0%) | 0 (0.0%) |
Fertility by Education in Pine Lake
| Educational Attainment | Women with Births | Births / 1,000 Women |
| Less than High School | 0 (0.0%) | 0.0 |
| High School Diploma | 0 (0.0%) | 0.0 |
| College or Associate's Degree | 0 (0.0%) | 0.0 |
| Bachelor's Degree | 0 (0.0%) | 0.0 |
| Graduate Degree | 0 (0.0%) | 0.0 |
| Total | 0 (0.0%) | 0.0 |
Fertility by Education by Marriage Status in Pine Lake
| Educational Attainment | Married | Unmarried |
| Less than High School | 0 (0.0%) | 0 (0.0%) |
| High School Diploma | 0 (0.0%) | 0 (0.0%) |
| College or Associate's Degree | 0 (0.0%) | 0 (0.0%) |
| Bachelor's Degree | 0 (0.0%) | 0 (0.0%) |
| Graduate Degree | 0 (0.0%) | 0 (0.0%) |
| Total | 0 (0.0%) | 0 (0.0%) |
Employment Characteristics in Pine Lake
Employment by Class of Employer in Pine Lake
Among the 483 employed individuals in Pine Lake, private company employees (228 | 47.2%), not-for-profit organizations (109 | 22.6%), and self-employed (incorporated) (60 | 12.4%) make up the most common classes of employment.
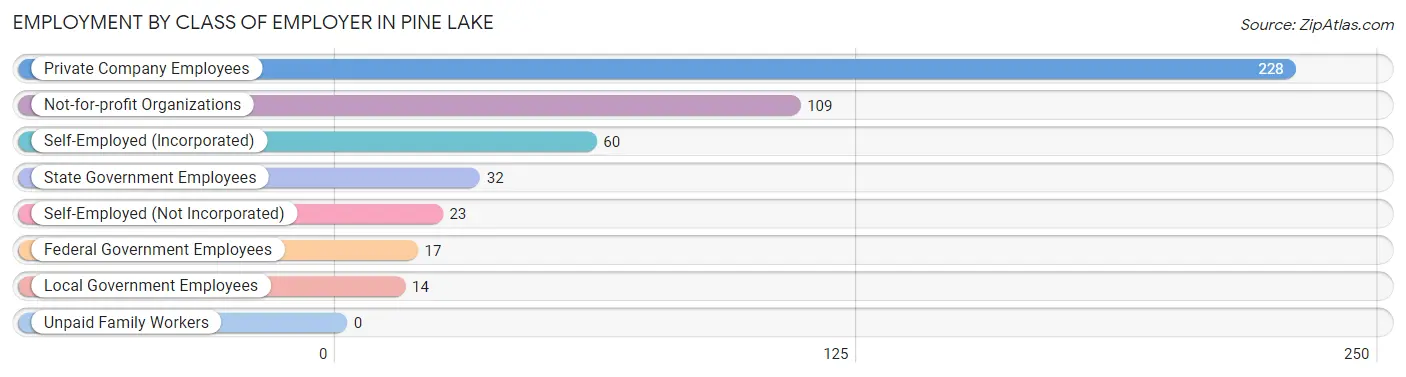
| Employer Class | # Employees | % Employees |
| Private Company Employees | 228 | 47.2% |
| Self-Employed (Incorporated) | 60 | 12.4% |
| Self-Employed (Not Incorporated) | 23 | 4.8% |
| Not-for-profit Organizations | 109 | 22.6% |
| Local Government Employees | 14 | 2.9% |
| State Government Employees | 32 | 6.6% |
| Federal Government Employees | 17 | 3.5% |
| Unpaid Family Workers | 0 | 0.0% |
| Total | 483 | 100.0% |
Employment Status by Age in Pine Lake
According to the labor force statistics for Pine Lake, out of the total population over 16 years of age (738), 69.4% or 512 individuals are in the labor force, with 4.5% or 23 of them unemployed. The age group with the highest labor force participation rate is 30 to 34 years, with 100.0% or 40 individuals in the labor force. Within the labor force, the 75 years and over age range has the highest percentage of unemployed individuals, with 100.0% or 9 of them being unemployed.
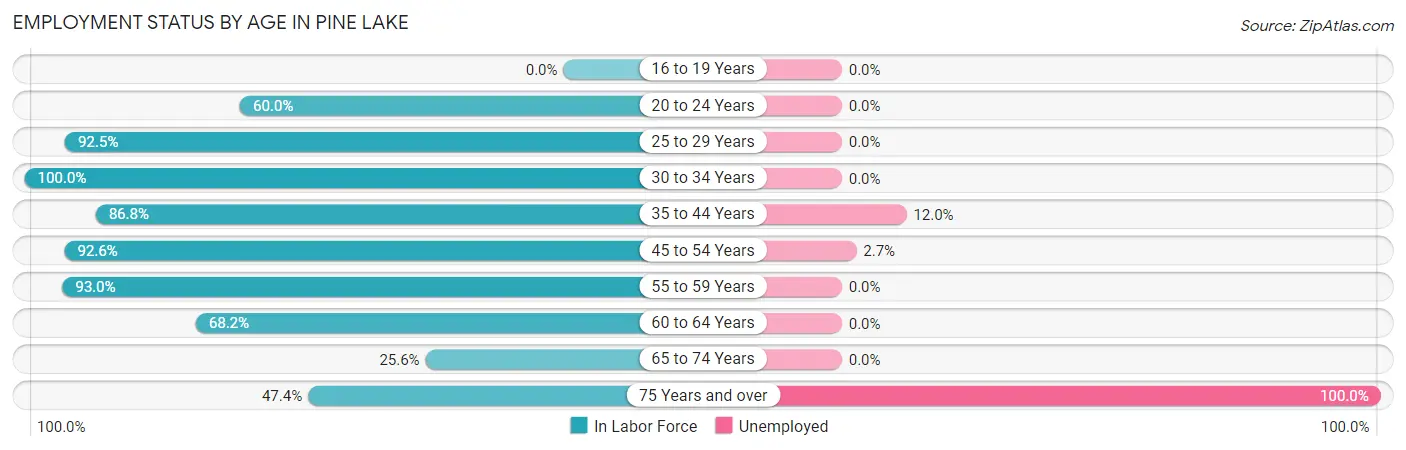
| Age Bracket | In Labor Force | Unemployed |
| 16 to 19 Years | 0 (0.0%) | 0 (0.0%) |
| 20 to 24 Years | 15 (60.0%) | 0 (0.0%) |
| 25 to 29 Years | 98 (92.5%) | 0 (0.0%) |
| 30 to 34 Years | 40 (100.0%) | 0 (0.0%) |
| 35 to 44 Years | 92 (86.8%) | 11 (12.0%) |
| 45 to 54 Years | 112 (92.6%) | 3 (2.7%) |
| 55 to 59 Years | 40 (93.0%) | 0 (0.0%) |
| 60 to 64 Years | 75 (68.2%) | 0 (0.0%) |
| 65 to 74 Years | 31 (25.6%) | 0 (0.0%) |
| 75 Years and over | 9 (47.4%) | 9 (100.0%) |
| Total | 512 (69.4%) | 23 (4.5%) |
Employment Status by Educational Attainment in Pine Lake
According to labor force statistics for Pine Lake, 86.9% of individuals (457) out of the total population between 25 and 64 years of age (526) are in the labor force, with 3.1% or 14 of them being unemployed. The group with the highest labor force participation rate are those with the educational attainment of high school diploma, with 100.0% or 31 individuals in the labor force. Within the labor force, individuals with college / associate degree education have the highest percentage of unemployment, with 7.7% or 11 of them being unemployed.
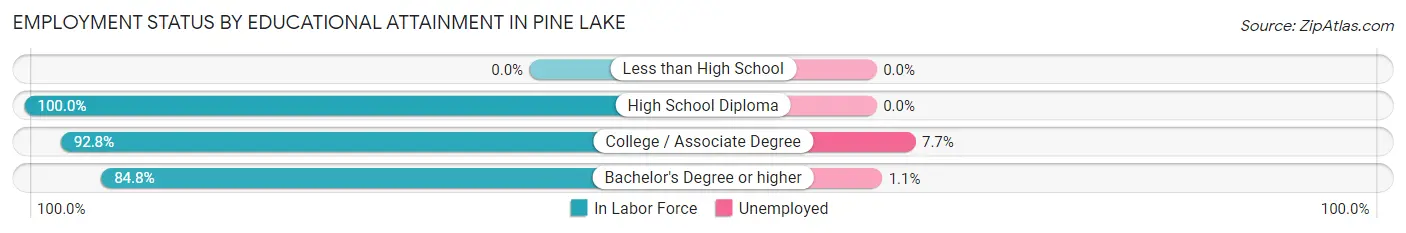
| Educational Attainment | In Labor Force | Unemployed |
| Less than High School | 0 (0.0%) | 0 (0.0%) |
| High School Diploma | 31 (100.0%) | 0 (0.0%) |
| College / Associate Degree | 142 (92.8%) | 12 (7.7%) |
| Bachelor's Degree or higher | 284 (84.8%) | 4 (1.1%) |
| Total | 457 (86.9%) | 16 (3.1%) |
Employment Occupations by Sex in Pine Lake
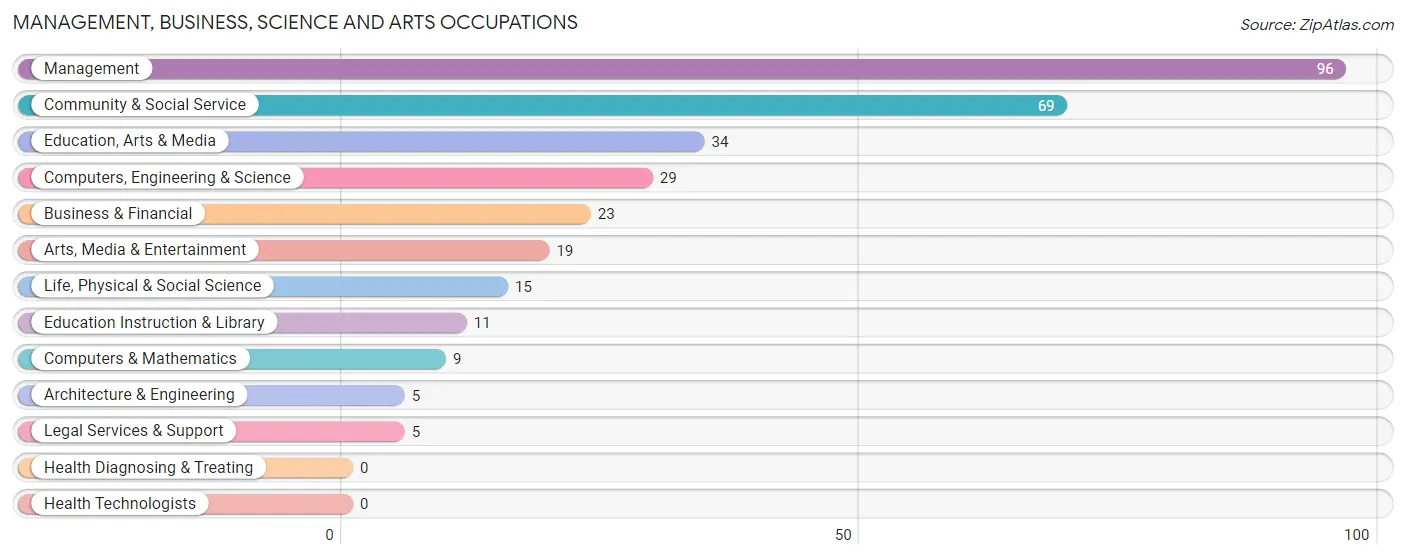
Management, Business, Science and Arts Occupations
The most common Management, Business, Science and Arts occupations in Pine Lake are Management (96 | 19.6%), Community & Social Service (69 | 14.1%), Education, Arts & Media (34 | 7.0%), Computers, Engineering & Science (29 | 5.9%), and Business & Financial (23 | 4.7%).
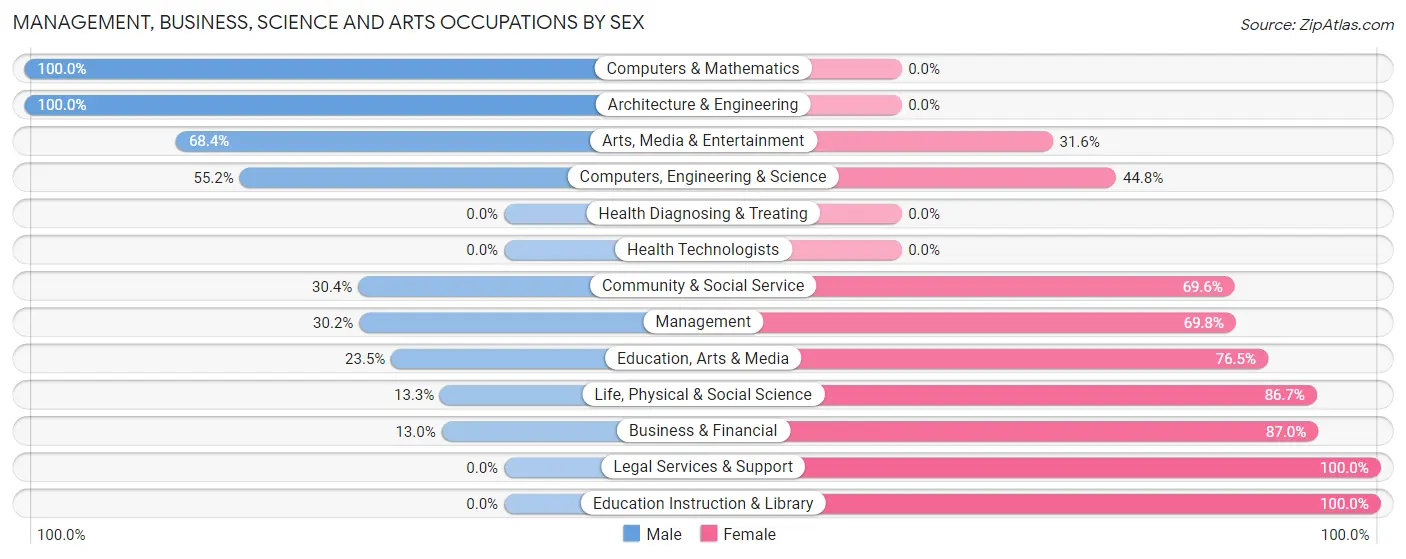
Management, Business, Science and Arts Occupations by Sex
Within the Management, Business, Science and Arts occupations in Pine Lake, the most male-oriented occupations are Computers & Mathematics (100.0%), Architecture & Engineering (100.0%), and Arts, Media & Entertainment (68.4%), while the most female-oriented occupations are Legal Services & Support (100.0%), Education Instruction & Library (100.0%), and Business & Financial (87.0%).
| Occupation | Male | Female |
| Management | 29 (30.2%) | 67 (69.8%) |
| Business & Financial | 3 (13.0%) | 20 (87.0%) |
| Computers, Engineering & Science | 16 (55.2%) | 13 (44.8%) |
| Computers & Mathematics | 9 (100.0%) | 0 (0.0%) |
| Architecture & Engineering | 5 (100.0%) | 0 (0.0%) |
| Life, Physical & Social Science | 2 (13.3%) | 13 (86.7%) |
| Community & Social Service | 21 (30.4%) | 48 (69.6%) |
| Education, Arts & Media | 8 (23.5%) | 26 (76.5%) |
| Legal Services & Support | 0 (0.0%) | 5 (100.0%) |
| Education Instruction & Library | 0 (0.0%) | 11 (100.0%) |
| Arts, Media & Entertainment | 13 (68.4%) | 6 (31.6%) |
| Health Diagnosing & Treating | 0 (0.0%) | 0 (0.0%) |
| Health Technologists | 0 (0.0%) | 0 (0.0%) |
| Total (Category) | 69 (31.8%) | 148 (68.2%) |
| Total (Overall) | 198 (40.5%) | 291 (59.5%) |
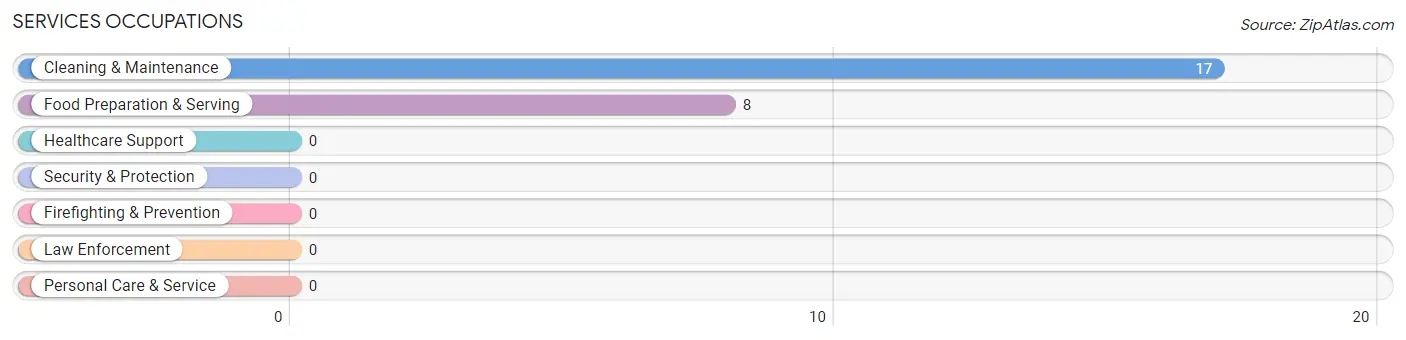
Services Occupations
The most common Services occupations in Pine Lake are Cleaning & Maintenance (17 | 3.5%), and Food Preparation & Serving (8 | 1.6%).
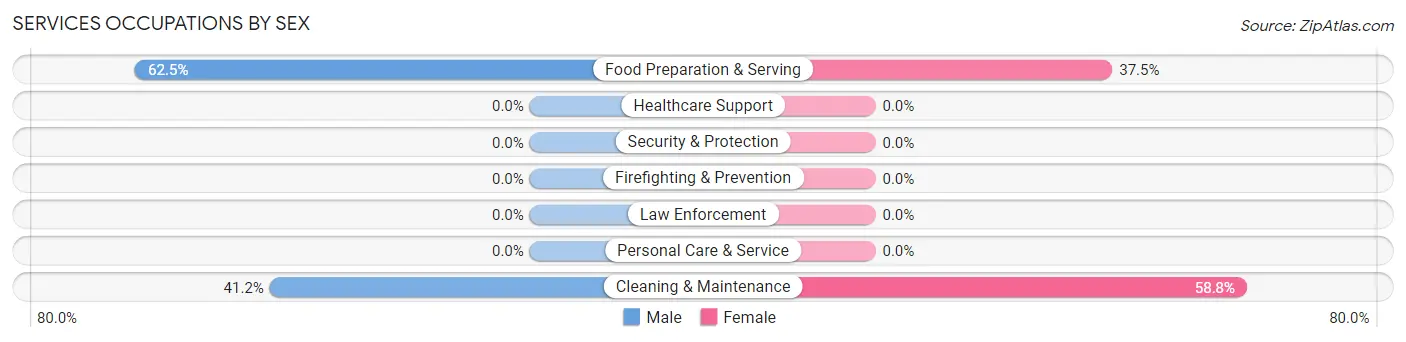
Services Occupations by Sex
Within the Services occupations in Pine Lake, the most male-oriented occupations are Food Preparation & Serving (62.5%), and Cleaning & Maintenance (41.2%), while the most female-oriented occupations are Cleaning & Maintenance (58.8%), and Food Preparation & Serving (37.5%).
| Occupation | Male | Female |
| Healthcare Support | 0 (0.0%) | 0 (0.0%) |
| Security & Protection | 0 (0.0%) | 0 (0.0%) |
| Firefighting & Prevention | 0 (0.0%) | 0 (0.0%) |
| Law Enforcement | 0 (0.0%) | 0 (0.0%) |
| Food Preparation & Serving | 5 (62.5%) | 3 (37.5%) |
| Cleaning & Maintenance | 7 (41.2%) | 10 (58.8%) |
| Personal Care & Service | 0 (0.0%) | 0 (0.0%) |
| Total (Category) | 12 (48.0%) | 13 (52.0%) |
| Total (Overall) | 198 (40.5%) | 291 (59.5%) |
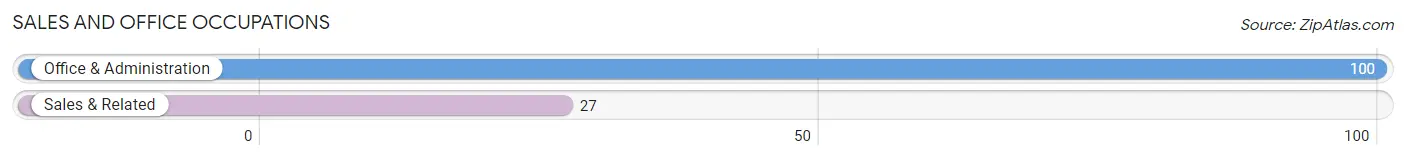
Sales and Office Occupations
The most common Sales and Office occupations in Pine Lake are Office & Administration (100 | 20.4%), and Sales & Related (27 | 5.5%).
Sales and Office Occupations by Sex
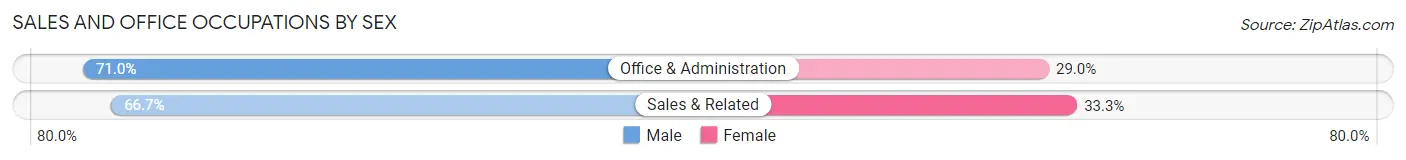
| Occupation | Male | Female |
| Sales & Related | 18 (66.7%) | 9 (33.3%) |
| Office & Administration | 71 (71.0%) | 29 (29.0%) |
| Total (Category) | 89 (70.1%) | 38 (29.9%) |
| Total (Overall) | 198 (40.5%) | 291 (59.5%) |
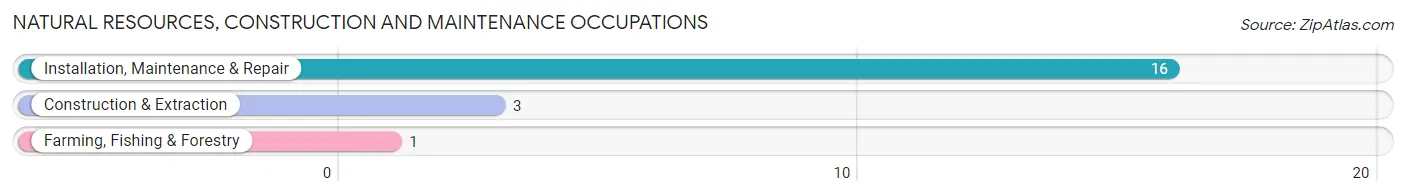
Natural Resources, Construction and Maintenance Occupations
The most common Natural Resources, Construction and Maintenance occupations in Pine Lake are Installation, Maintenance & Repair (16 | 3.3%), Construction & Extraction (3 | 0.6%), and Farming, Fishing & Forestry (1 | 0.2%).
Natural Resources, Construction and Maintenance Occupations by Sex
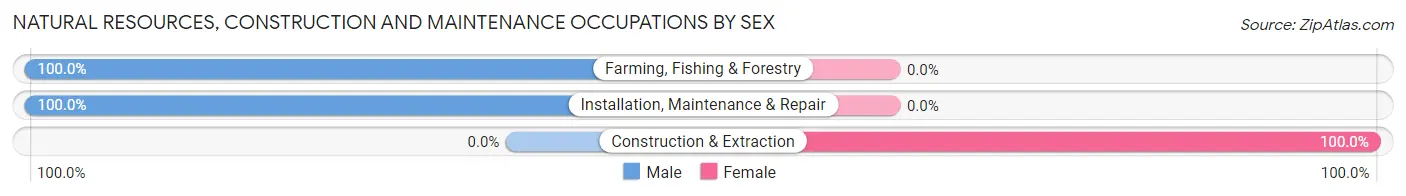
| Occupation | Male | Female |
| Farming, Fishing & Forestry | 1 (100.0%) | 0 (0.0%) |
| Construction & Extraction | 0 (0.0%) | 3 (100.0%) |
| Installation, Maintenance & Repair | 16 (100.0%) | 0 (0.0%) |
| Total (Category) | 17 (85.0%) | 3 (15.0%) |
| Total (Overall) | 198 (40.5%) | 291 (59.5%) |
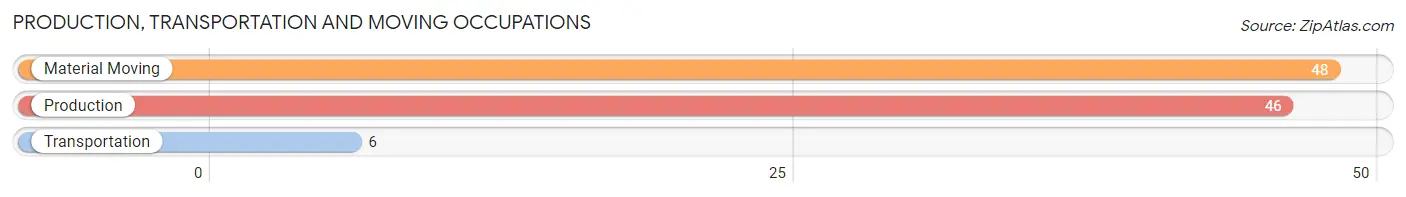
Production, Transportation and Moving Occupations
The most common Production, Transportation and Moving occupations in Pine Lake are Material Moving (48 | 9.8%), Production (46 | 9.4%), and Transportation (6 | 1.2%).
Production, Transportation and Moving Occupations by Sex
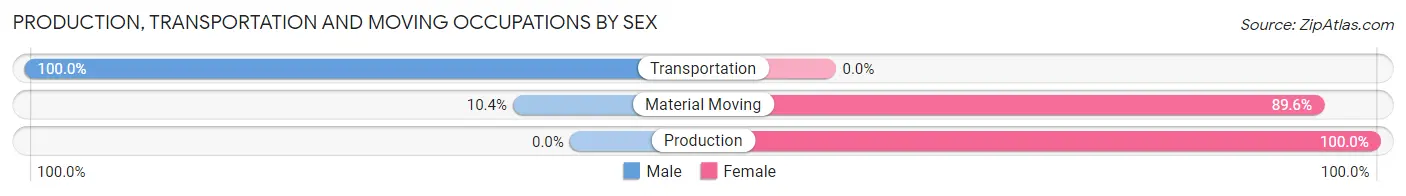
| Occupation | Male | Female |
| Production | 0 (0.0%) | 46 (100.0%) |
| Transportation | 6 (100.0%) | 0 (0.0%) |
| Material Moving | 5 (10.4%) | 43 (89.6%) |
| Total (Category) | 11 (11.0%) | 89 (89.0%) |
| Total (Overall) | 198 (40.5%) | 291 (59.5%) |
Employment Industries by Sex in Pine Lake
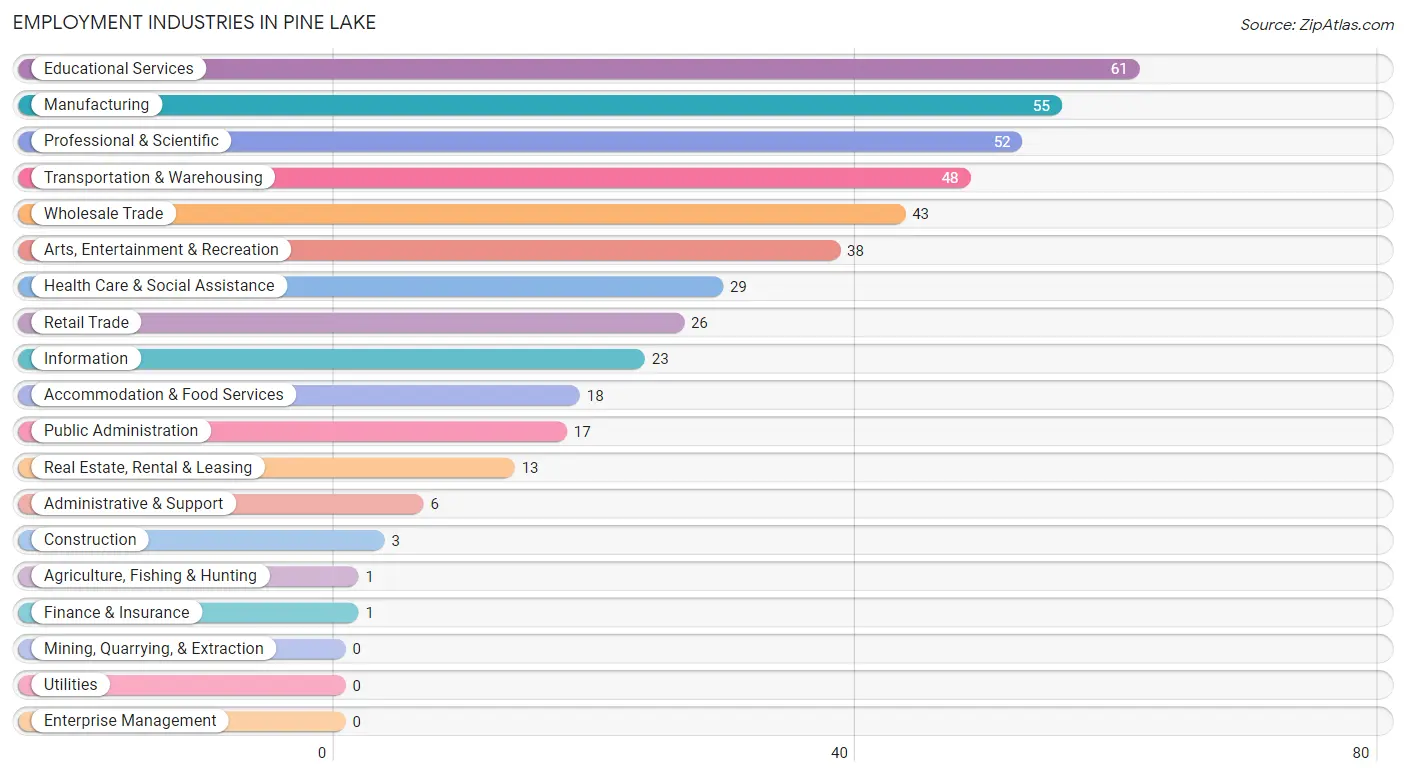
Employment Industries in Pine Lake
The major employment industries in Pine Lake include Educational Services (61 | 12.5%), Manufacturing (55 | 11.3%), Professional & Scientific (52 | 10.6%), Transportation & Warehousing (48 | 9.8%), and Wholesale Trade (43 | 8.8%).
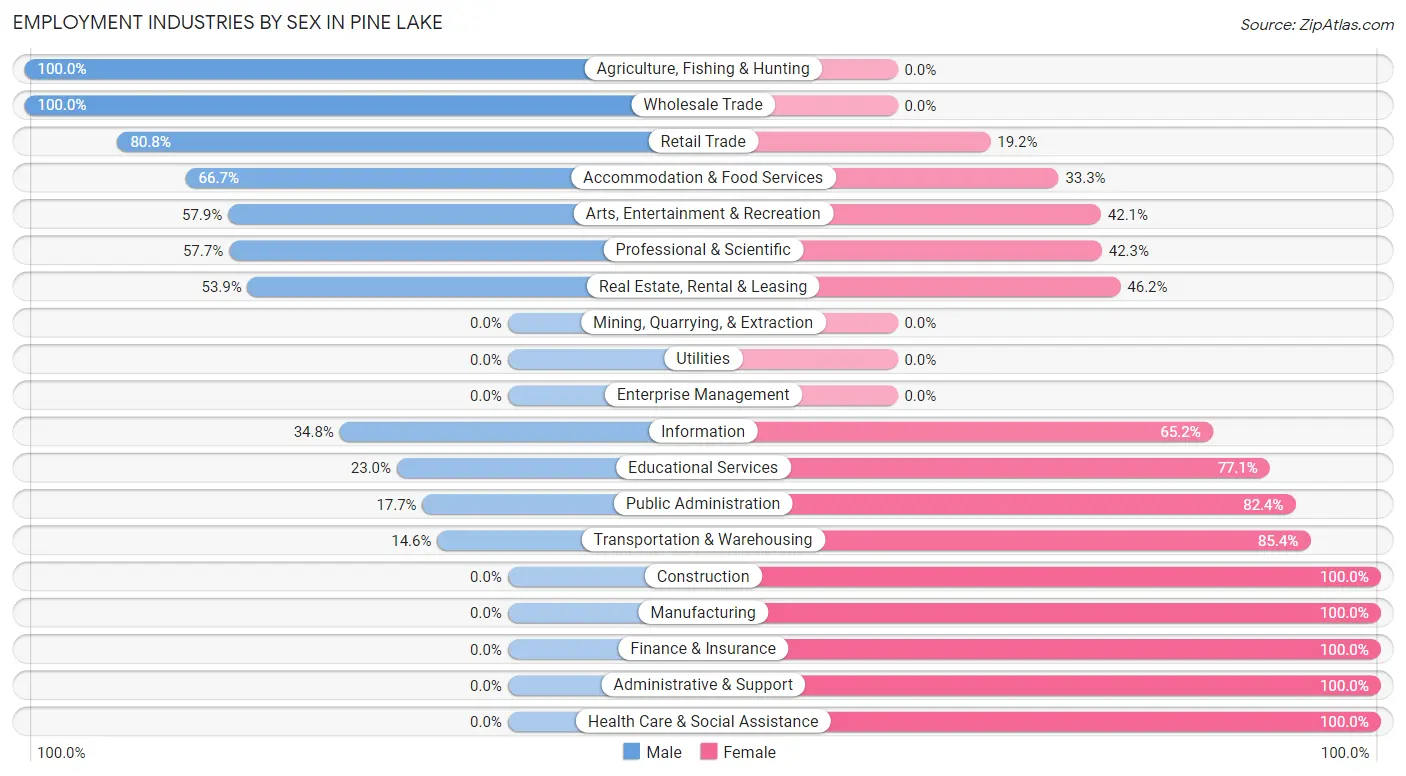
Employment Industries by Sex in Pine Lake
The Pine Lake industries that see more men than women are Agriculture, Fishing & Hunting (100.0%), Wholesale Trade (100.0%), and Retail Trade (80.8%), whereas the industries that tend to have a higher number of women are Construction (100.0%), Manufacturing (100.0%), and Finance & Insurance (100.0%).
| Industry | Male | Female |
| Agriculture, Fishing & Hunting | 1 (100.0%) | 0 (0.0%) |
| Mining, Quarrying, & Extraction | 0 (0.0%) | 0 (0.0%) |
| Construction | 0 (0.0%) | 3 (100.0%) |
| Manufacturing | 0 (0.0%) | 55 (100.0%) |
| Wholesale Trade | 43 (100.0%) | 0 (0.0%) |
| Retail Trade | 21 (80.8%) | 5 (19.2%) |
| Transportation & Warehousing | 7 (14.6%) | 41 (85.4%) |
| Utilities | 0 (0.0%) | 0 (0.0%) |
| Information | 8 (34.8%) | 15 (65.2%) |
| Finance & Insurance | 0 (0.0%) | 1 (100.0%) |
| Real Estate, Rental & Leasing | 7 (53.8%) | 6 (46.2%) |
| Professional & Scientific | 30 (57.7%) | 22 (42.3%) |
| Enterprise Management | 0 (0.0%) | 0 (0.0%) |
| Administrative & Support | 0 (0.0%) | 6 (100.0%) |
| Educational Services | 14 (23.0%) | 47 (77.0%) |
| Health Care & Social Assistance | 0 (0.0%) | 29 (100.0%) |
| Arts, Entertainment & Recreation | 22 (57.9%) | 16 (42.1%) |
| Accommodation & Food Services | 12 (66.7%) | 6 (33.3%) |
| Public Administration | 3 (17.6%) | 14 (82.4%) |
| Total | 198 (40.5%) | 291 (59.5%) |
Education in Pine Lake
School Enrollment in Pine Lake
The most common levels of schooling among the 260 students in Pine Lake are college / undergraduate (84 | 32.3%), middle school (79 | 30.4%), and elementary school (42 | 16.2%).
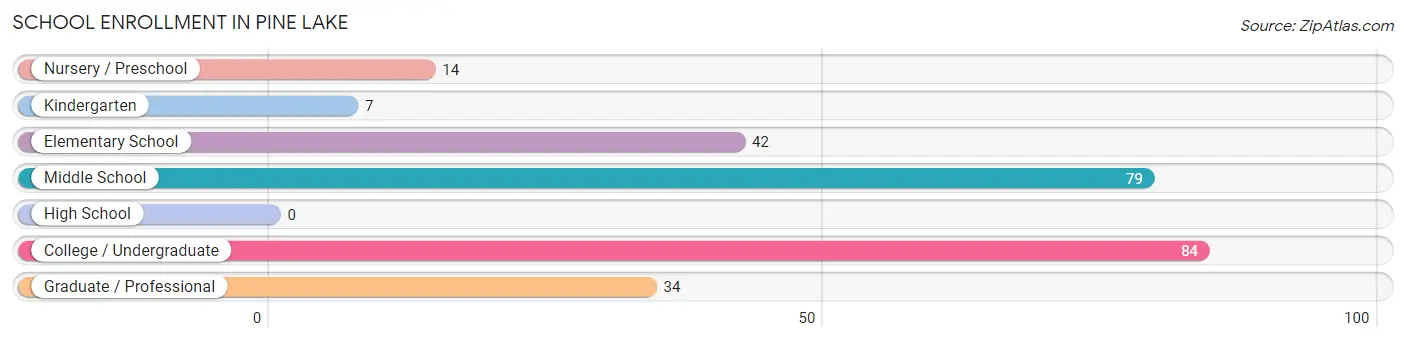
| School Level | # Students | % Students |
| Nursery / Preschool | 14 | 5.4% |
| Kindergarten | 7 | 2.7% |
| Elementary School | 42 | 16.2% |
| Middle School | 79 | 30.4% |
| High School | 0 | 0.0% |
| College / Undergraduate | 84 | 32.3% |
| Graduate / Professional | 34 | 13.1% |
| Total | 260 | 100.0% |
School Enrollment by Age by Funding Source in Pine Lake
Out of a total of 260 students who are enrolled in schools in Pine Lake, 88 (33.8%) attend a private institution, while the remaining 172 (66.2%) are enrolled in public schools. The age group of 3 to 4 year olds has the highest likelihood of being enrolled in private schools, with 14 (100.0% in the age bracket) enrolled. Conversely, the age group of 18 to 19 year olds has the lowest likelihood of being enrolled in a private school, with 24 (100.0% in the age bracket) attending a public institution.
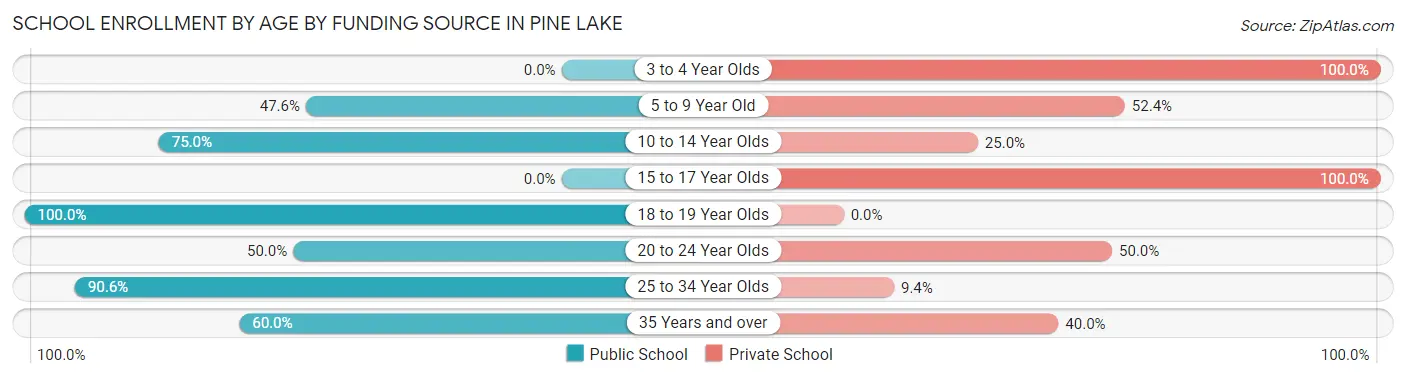
| Age Bracket | Public School | Private School |
| 3 to 4 Year Olds | 0 (0.0%) | 14 (100.0%) |
| 5 to 9 Year Old | 10 (47.6%) | 11 (52.4%) |
| 10 to 14 Year Olds | 63 (75.0%) | 21 (25.0%) |
| 15 to 17 Year Olds | 0 (0.0%) | 23 (100.0%) |
| 18 to 19 Year Olds | 24 (100.0%) | 0 (0.0%) |
| 20 to 24 Year Olds | 5 (50.0%) | 5 (50.0%) |
| 25 to 34 Year Olds | 58 (90.6%) | 6 (9.4%) |
| 35 Years and over | 12 (60.0%) | 8 (40.0%) |
| Total | 172 (66.2%) | 88 (33.8%) |
Educational Attainment by Field of Study in Pine Lake
Visual & performing arts (77 | 17.0%), social sciences (53 | 11.7%), business (48 | 10.6%), arts & humanities (42 | 9.3%), and liberal arts & history (38 | 8.4%) are the most common fields of study among 452 individuals in Pine Lake who have obtained a bachelor's degree or higher.
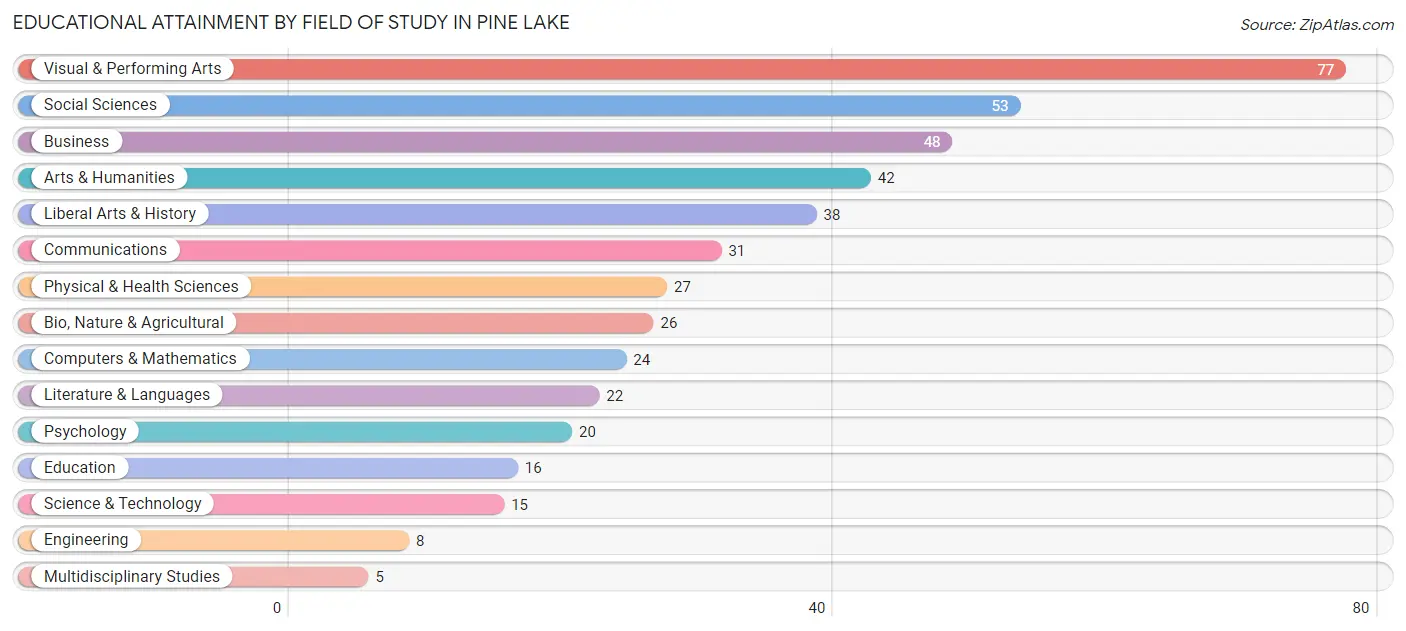
| Field of Study | # Graduates | % Graduates |
| Computers & Mathematics | 24 | 5.3% |
| Bio, Nature & Agricultural | 26 | 5.8% |
| Physical & Health Sciences | 27 | 6.0% |
| Psychology | 20 | 4.4% |
| Social Sciences | 53 | 11.7% |
| Engineering | 8 | 1.8% |
| Multidisciplinary Studies | 5 | 1.1% |
| Science & Technology | 15 | 3.3% |
| Business | 48 | 10.6% |
| Education | 16 | 3.5% |
| Literature & Languages | 22 | 4.9% |
| Liberal Arts & History | 38 | 8.4% |
| Visual & Performing Arts | 77 | 17.0% |
| Communications | 31 | 6.9% |
| Arts & Humanities | 42 | 9.3% |
| Total | 452 | 100.0% |
Transportation & Commute in Pine Lake
Vehicle Availability by Sex in Pine Lake
The most prevalent vehicle ownership categories in Pine Lake are males with 1 vehicle (111, accounting for 56.1%) and females with 1 vehicle (214, making up 39.0%).
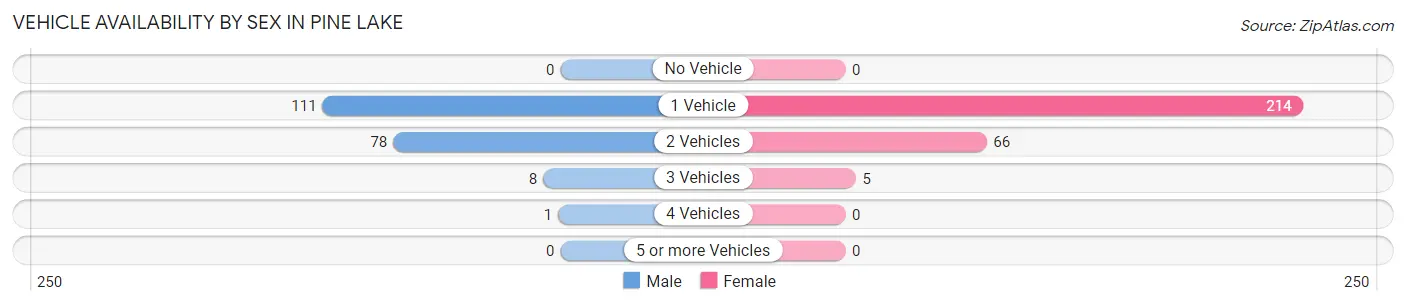
| Vehicles Available | Male | Female |
| No Vehicle | 0 (0.0%) | 0 (0.0%) |
| 1 Vehicle | 111 (56.1%) | 214 (75.1%) |
| 2 Vehicles | 78 (39.4%) | 66 (23.2%) |
| 3 Vehicles | 8 (4.0%) | 5 (1.8%) |
| 4 Vehicles | 1 (0.5%) | 0 (0.0%) |
| 5 or more Vehicles | 0 (0.0%) | 0 (0.0%) |
| Total | 198 (100.0%) | 285 (100.0%) |
Commute Time in Pine Lake
The most frequently occuring commute durations in Pine Lake are 20 to 24 minutes (70 commuters, 19.9%), 25 to 29 minutes (62 commuters, 17.7%), and 30 to 34 minutes (61 commuters, 17.4%).
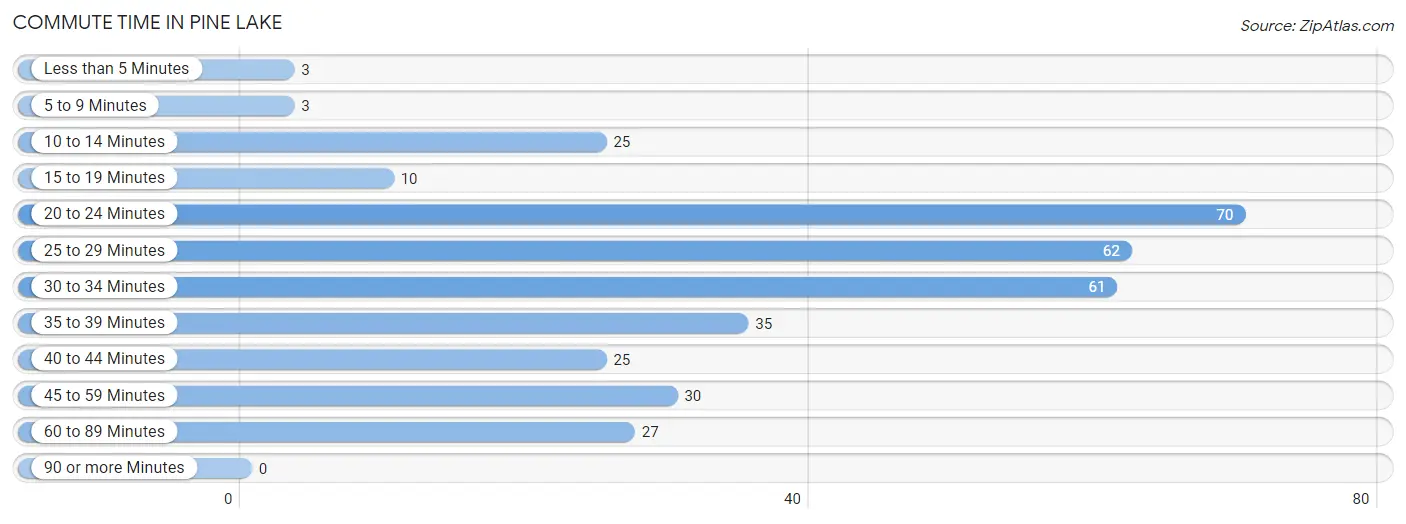
| Commute Time | # Commuters | % Commuters |
| Less than 5 Minutes | 3 | 0.9% |
| 5 to 9 Minutes | 3 | 0.9% |
| 10 to 14 Minutes | 25 | 7.1% |
| 15 to 19 Minutes | 10 | 2.9% |
| 20 to 24 Minutes | 70 | 19.9% |
| 25 to 29 Minutes | 62 | 17.7% |
| 30 to 34 Minutes | 61 | 17.4% |
| 35 to 39 Minutes | 35 | 10.0% |
| 40 to 44 Minutes | 25 | 7.1% |
| 45 to 59 Minutes | 30 | 8.6% |
| 60 to 89 Minutes | 27 | 7.7% |
| 90 or more Minutes | 0 | 0.0% |
Commute Time by Sex in Pine Lake
The most common commute times in Pine Lake are 20 to 24 minutes (44 commuters, 23.9%) for males and 25 to 29 minutes (45 commuters, 27.0%) for females.
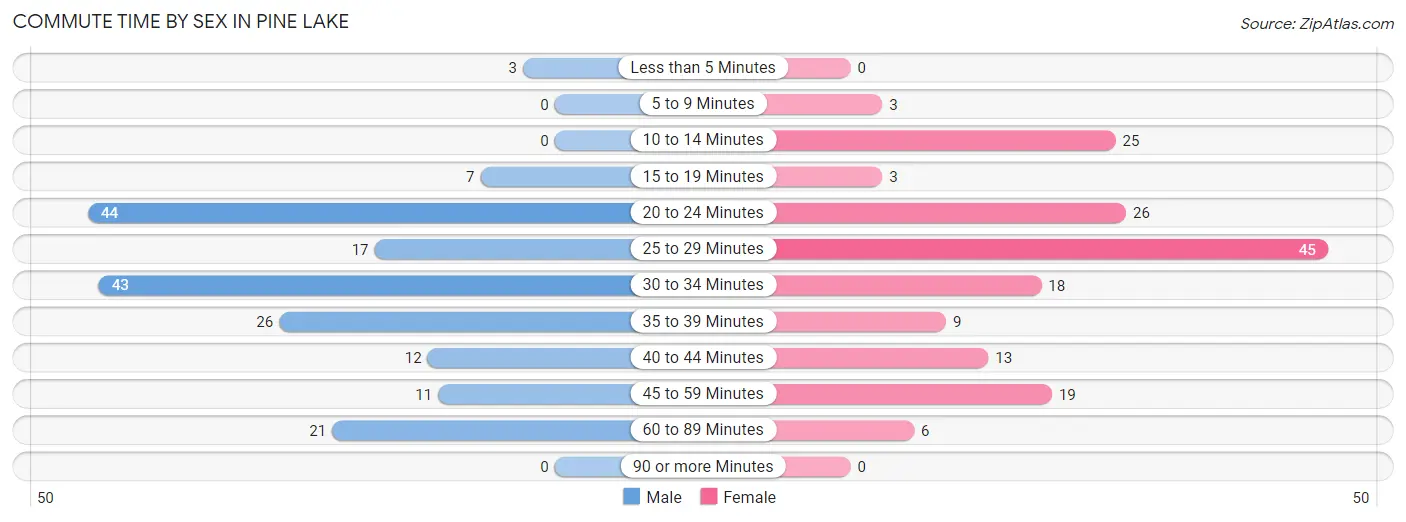
| Commute Time | Male | Female |
| Less than 5 Minutes | 3 (1.6%) | 0 (0.0%) |
| 5 to 9 Minutes | 0 (0.0%) | 3 (1.8%) |
| 10 to 14 Minutes | 0 (0.0%) | 25 (15.0%) |
| 15 to 19 Minutes | 7 (3.8%) | 3 (1.8%) |
| 20 to 24 Minutes | 44 (23.9%) | 26 (15.6%) |
| 25 to 29 Minutes | 17 (9.2%) | 45 (27.0%) |
| 30 to 34 Minutes | 43 (23.4%) | 18 (10.8%) |
| 35 to 39 Minutes | 26 (14.1%) | 9 (5.4%) |
| 40 to 44 Minutes | 12 (6.5%) | 13 (7.8%) |
| 45 to 59 Minutes | 11 (6.0%) | 19 (11.4%) |
| 60 to 89 Minutes | 21 (11.4%) | 6 (3.6%) |
| 90 or more Minutes | 0 (0.0%) | 0 (0.0%) |
Time of Departure to Work by Sex in Pine Lake
The most frequent times of departure to work in Pine Lake are 11:00 AM to 11:59 AM (43, 23.4%) for males and 10:00 AM to 10:59 AM (37, 22.2%) for females.
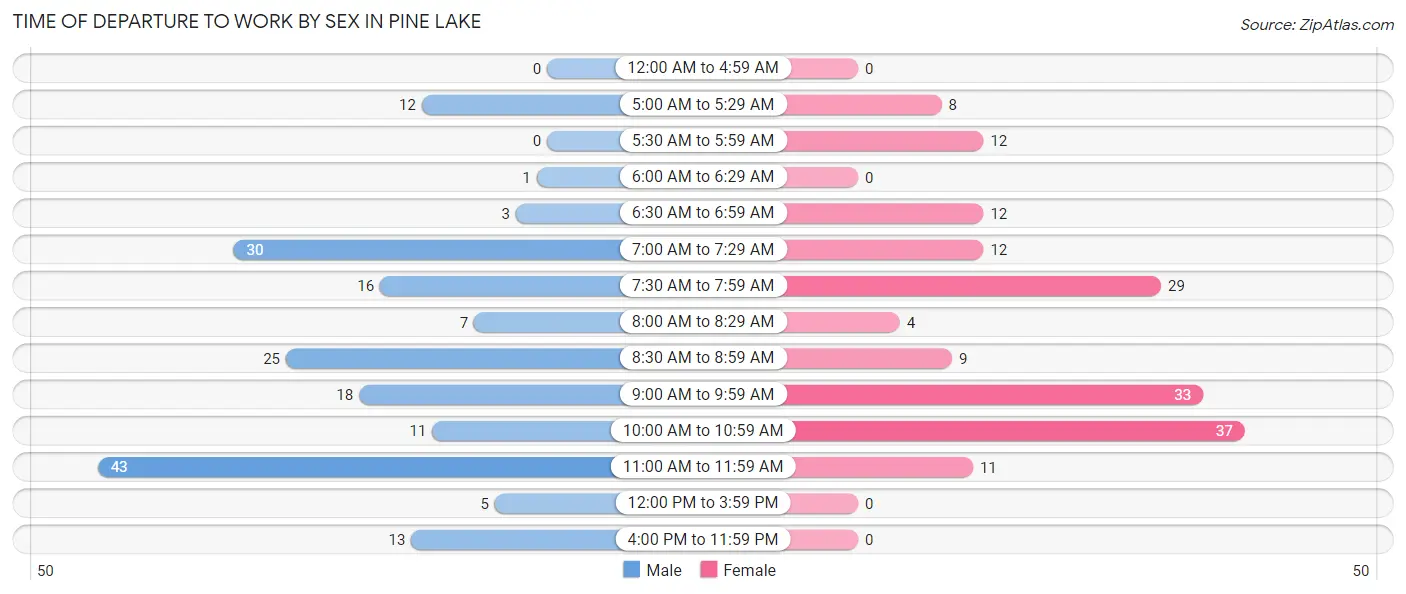
| Time of Departure | Male | Female |
| 12:00 AM to 4:59 AM | 0 (0.0%) | 0 (0.0%) |
| 5:00 AM to 5:29 AM | 12 (6.5%) | 8 (4.8%) |
| 5:30 AM to 5:59 AM | 0 (0.0%) | 12 (7.2%) |
| 6:00 AM to 6:29 AM | 1 (0.5%) | 0 (0.0%) |
| 6:30 AM to 6:59 AM | 3 (1.6%) | 12 (7.2%) |
| 7:00 AM to 7:29 AM | 30 (16.3%) | 12 (7.2%) |
| 7:30 AM to 7:59 AM | 16 (8.7%) | 29 (17.4%) |
| 8:00 AM to 8:29 AM | 7 (3.8%) | 4 (2.4%) |
| 8:30 AM to 8:59 AM | 25 (13.6%) | 9 (5.4%) |
| 9:00 AM to 9:59 AM | 18 (9.8%) | 33 (19.8%) |
| 10:00 AM to 10:59 AM | 11 (6.0%) | 37 (22.2%) |
| 11:00 AM to 11:59 AM | 43 (23.4%) | 11 (6.6%) |
| 12:00 PM to 3:59 PM | 5 (2.7%) | 0 (0.0%) |
| 4:00 PM to 11:59 PM | 13 (7.1%) | 0 (0.0%) |
| Total | 184 (100.0%) | 167 (100.0%) |
Housing Occupancy in Pine Lake
Occupancy by Ownership in Pine Lake
Of the total 429 dwellings in Pine Lake, owner-occupied units account for 251 (58.5%), while renter-occupied units make up 178 (41.5%).
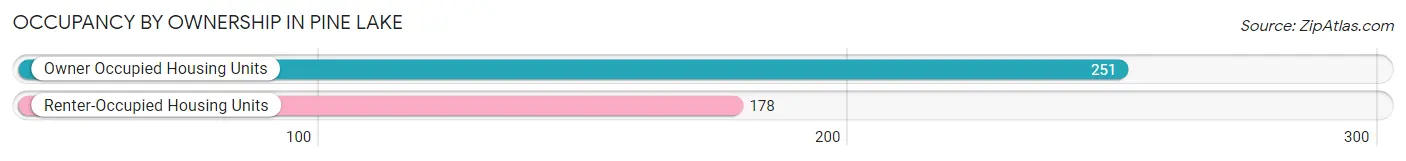
| Occupancy | # Housing Units | % Housing Units |
| Owner Occupied Housing Units | 251 | 58.5% |
| Renter-Occupied Housing Units | 178 | 41.5% |
| Total Occupied Housing Units | 429 | 100.0% |
Occupancy by Household Size in Pine Lake
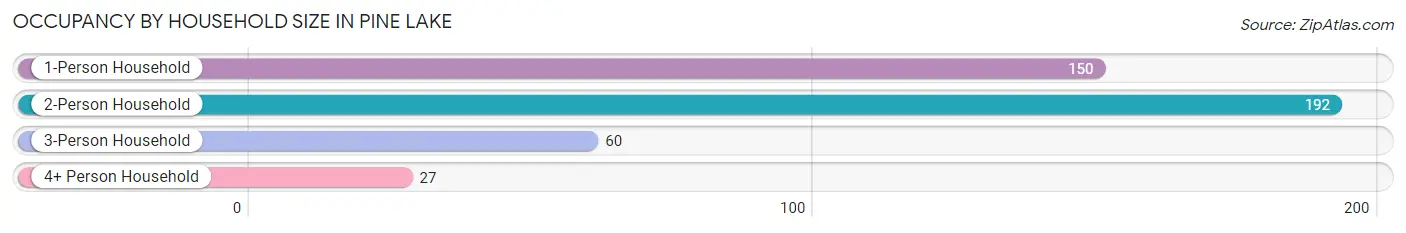
| Household Size | # Housing Units | % Housing Units |
| 1-Person Household | 150 | 35.0% |
| 2-Person Household | 192 | 44.8% |
| 3-Person Household | 60 | 14.0% |
| 4+ Person Household | 27 | 6.3% |
| Total Housing Units | 429 | 100.0% |
Occupancy by Ownership by Household Size in Pine Lake
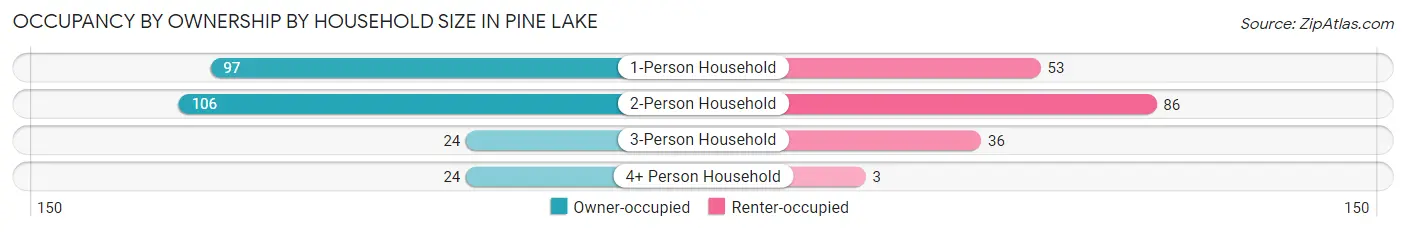
| Household Size | Owner-occupied | Renter-occupied |
| 1-Person Household | 97 (64.7%) | 53 (35.3%) |
| 2-Person Household | 106 (55.2%) | 86 (44.8%) |
| 3-Person Household | 24 (40.0%) | 36 (60.0%) |
| 4+ Person Household | 24 (88.9%) | 3 (11.1%) |
| Total Housing Units | 251 (58.5%) | 178 (41.5%) |
Occupancy by Educational Attainment in Pine Lake
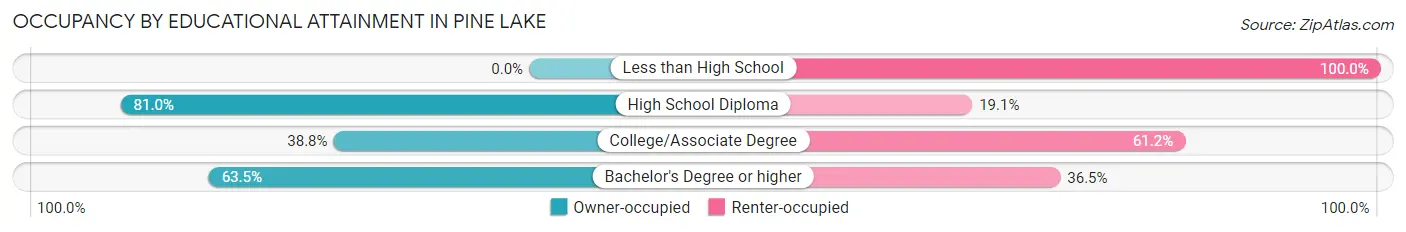
| Household Size | Owner-occupied | Renter-occupied |
| Less than High School | 0 (0.0%) | 7 (100.0%) |
| High School Diploma | 34 (80.9%) | 8 (19.1%) |
| College/Associate Degree | 38 (38.8%) | 60 (61.2%) |
| Bachelor's Degree or higher | 179 (63.5%) | 103 (36.5%) |
Occupancy by Age of Householder in Pine Lake
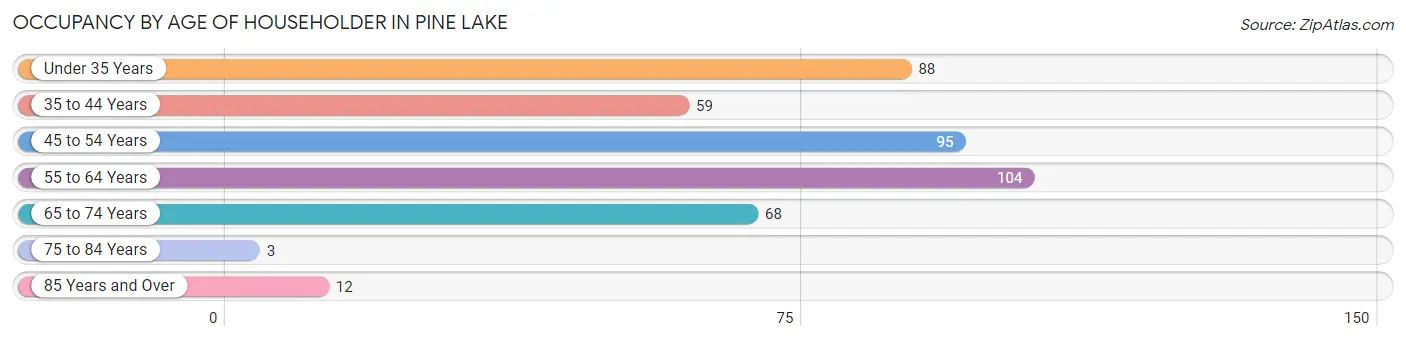
| Age Bracket | # Households | % Households |
| Under 35 Years | 88 | 20.5% |
| 35 to 44 Years | 59 | 13.8% |
| 45 to 54 Years | 95 | 22.1% |
| 55 to 64 Years | 104 | 24.2% |
| 65 to 74 Years | 68 | 15.9% |
| 75 to 84 Years | 3 | 0.7% |
| 85 Years and Over | 12 | 2.8% |
| Total | 429 | 100.0% |
Housing Finances in Pine Lake
Median Income by Occupancy in Pine Lake
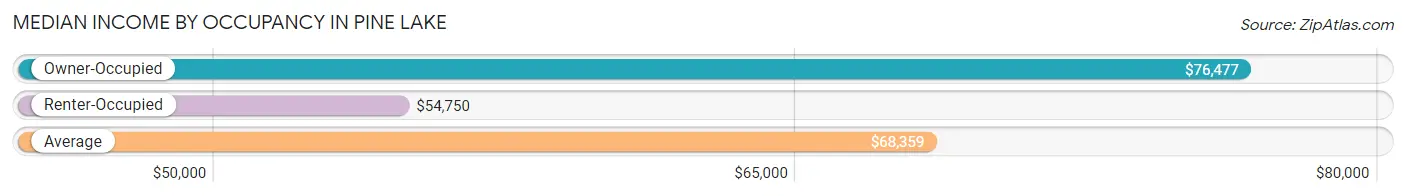
| Occupancy Type | # Households | Median Income |
| Owner-Occupied | 251 (58.5%) | $76,477 |
| Renter-Occupied | 178 (41.5%) | $54,750 |
| Average | 429 (100.0%) | $68,359 |
Occupancy by Householder Income Bracket in Pine Lake
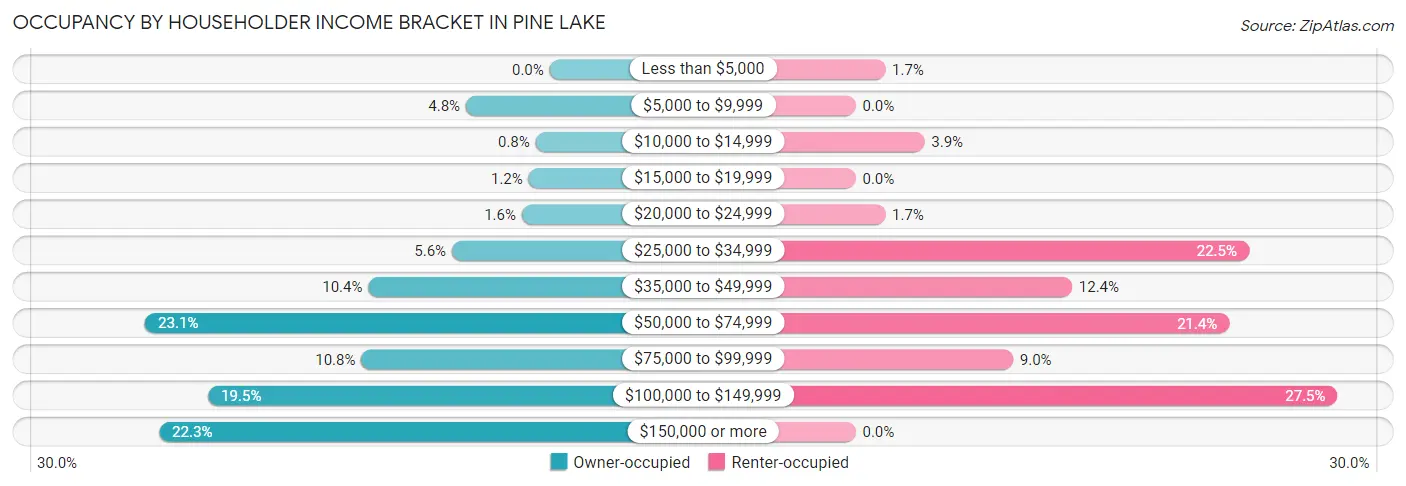
| Income Bracket | Owner-occupied | Renter-occupied |
| Less than $5,000 | 0 (0.0%) | 3 (1.7%) |
| $5,000 to $9,999 | 12 (4.8%) | 0 (0.0%) |
| $10,000 to $14,999 | 2 (0.8%) | 7 (3.9%) |
| $15,000 to $19,999 | 3 (1.2%) | 0 (0.0%) |
| $20,000 to $24,999 | 4 (1.6%) | 3 (1.7%) |
| $25,000 to $34,999 | 14 (5.6%) | 40 (22.5%) |
| $35,000 to $49,999 | 26 (10.4%) | 22 (12.4%) |
| $50,000 to $74,999 | 58 (23.1%) | 38 (21.3%) |
| $75,000 to $99,999 | 27 (10.8%) | 16 (9.0%) |
| $100,000 to $149,999 | 49 (19.5%) | 49 (27.5%) |
| $150,000 or more | 56 (22.3%) | 0 (0.0%) |
| Total | 251 (100.0%) | 178 (100.0%) |
Monthly Housing Cost Tiers in Pine Lake
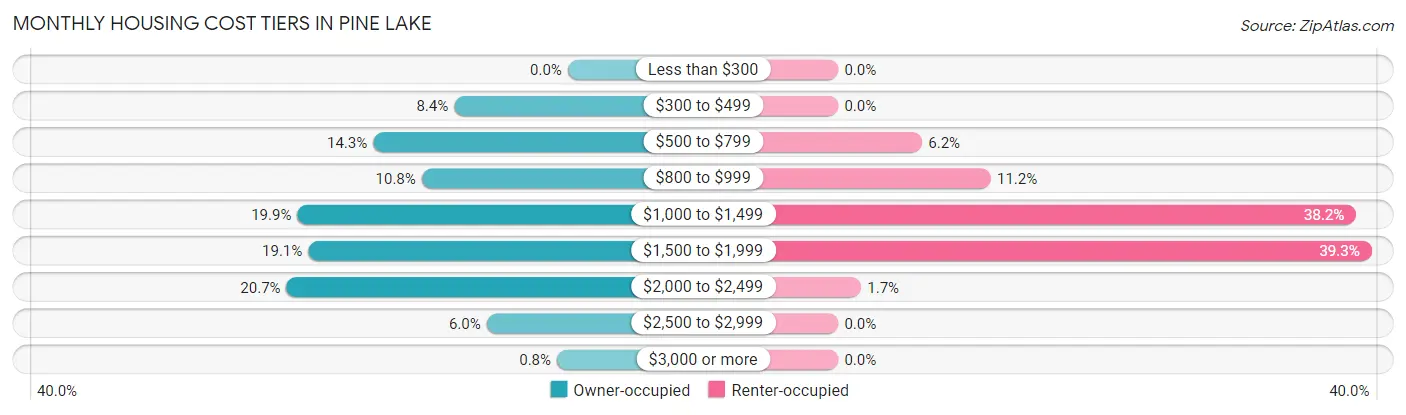
| Monthly Cost | Owner-occupied | Renter-occupied |
| Less than $300 | 0 (0.0%) | 0 (0.0%) |
| $300 to $499 | 21 (8.4%) | 0 (0.0%) |
| $500 to $799 | 36 (14.3%) | 11 (6.2%) |
| $800 to $999 | 27 (10.8%) | 20 (11.2%) |
| $1,000 to $1,499 | 50 (19.9%) | 68 (38.2%) |
| $1,500 to $1,999 | 48 (19.1%) | 70 (39.3%) |
| $2,000 to $2,499 | 52 (20.7%) | 3 (1.7%) |
| $2,500 to $2,999 | 15 (6.0%) | 0 (0.0%) |
| $3,000 or more | 2 (0.8%) | 0 (0.0%) |
| Total | 251 (100.0%) | 178 (100.0%) |
Physical Housing Characteristics in Pine Lake
Housing Structures in Pine Lake
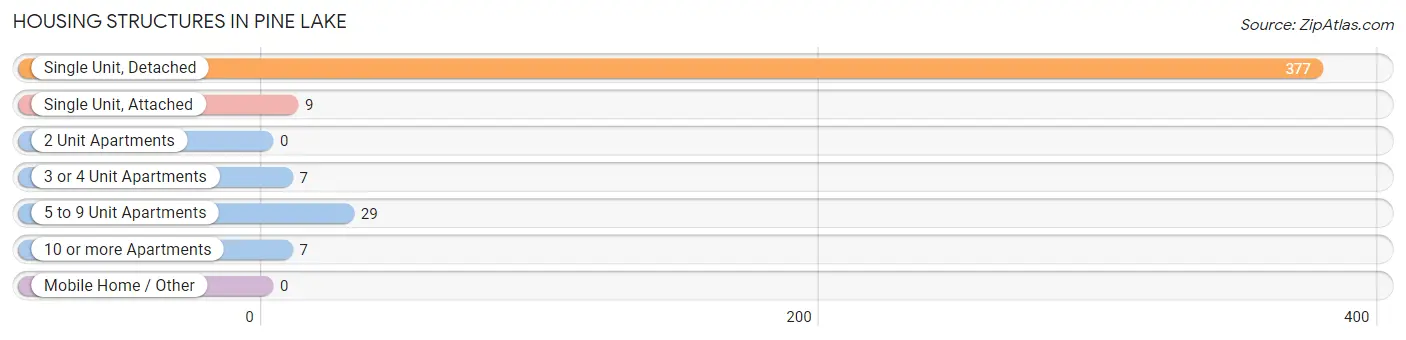
| Structure Type | # Housing Units | % Housing Units |
| Single Unit, Detached | 377 | 87.9% |
| Single Unit, Attached | 9 | 2.1% |
| 2 Unit Apartments | 0 | 0.0% |
| 3 or 4 Unit Apartments | 7 | 1.6% |
| 5 to 9 Unit Apartments | 29 | 6.8% |
| 10 or more Apartments | 7 | 1.6% |
| Mobile Home / Other | 0 | 0.0% |
| Total | 429 | 100.0% |
Housing Structures by Occupancy in Pine Lake
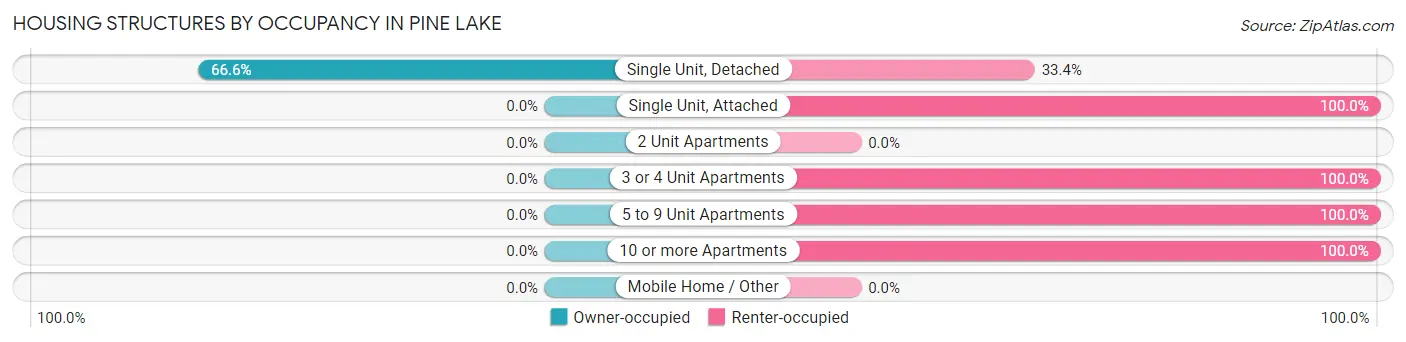
| Structure Type | Owner-occupied | Renter-occupied |
| Single Unit, Detached | 251 (66.6%) | 126 (33.4%) |
| Single Unit, Attached | 0 (0.0%) | 9 (100.0%) |
| 2 Unit Apartments | 0 (0.0%) | 0 (0.0%) |
| 3 or 4 Unit Apartments | 0 (0.0%) | 7 (100.0%) |
| 5 to 9 Unit Apartments | 0 (0.0%) | 29 (100.0%) |
| 10 or more Apartments | 0 (0.0%) | 7 (100.0%) |
| Mobile Home / Other | 0 (0.0%) | 0 (0.0%) |
| Total | 251 (58.5%) | 178 (41.5%) |
Housing Structures by Number of Rooms in Pine Lake
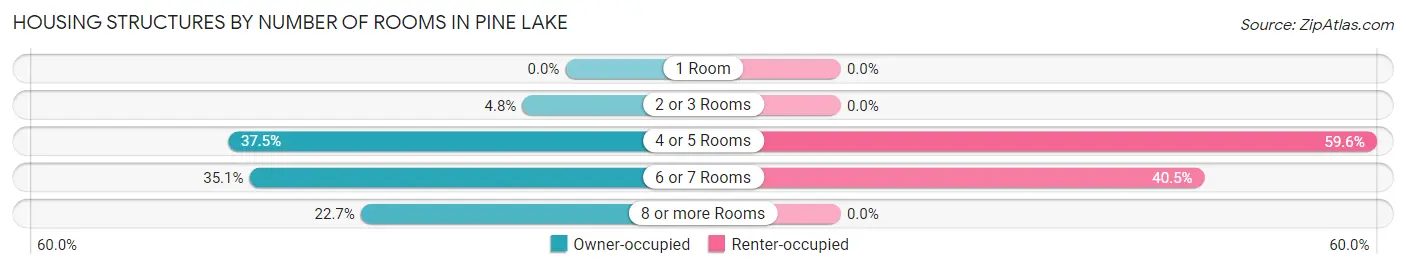
| Number of Rooms | Owner-occupied | Renter-occupied |
| 1 Room | 0 (0.0%) | 0 (0.0%) |
| 2 or 3 Rooms | 12 (4.8%) | 0 (0.0%) |
| 4 or 5 Rooms | 94 (37.4%) | 106 (59.6%) |
| 6 or 7 Rooms | 88 (35.1%) | 72 (40.5%) |
| 8 or more Rooms | 57 (22.7%) | 0 (0.0%) |
| Total | 251 (100.0%) | 178 (100.0%) |
Housing Structure by Heating Type in Pine Lake
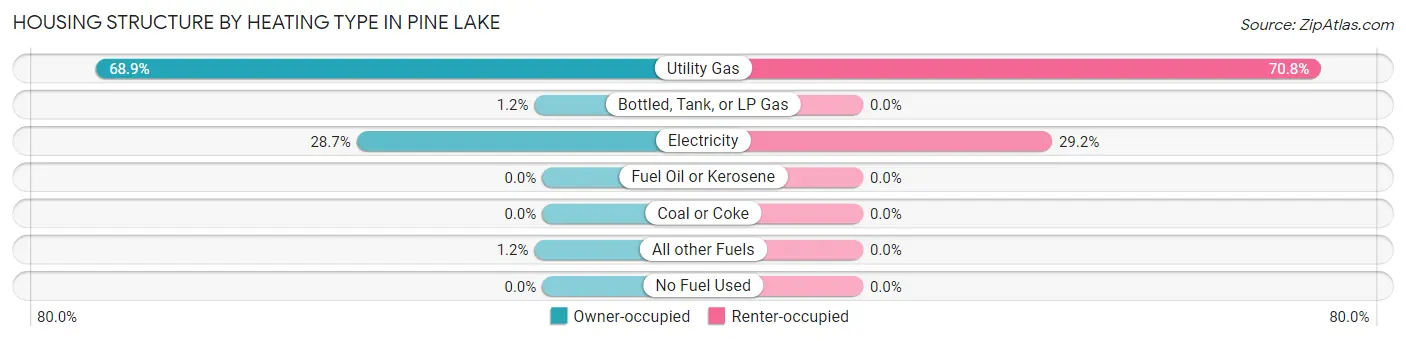
| Heating Type | Owner-occupied | Renter-occupied |
| Utility Gas | 173 (68.9%) | 126 (70.8%) |
| Bottled, Tank, or LP Gas | 3 (1.2%) | 0 (0.0%) |
| Electricity | 72 (28.7%) | 52 (29.2%) |
| Fuel Oil or Kerosene | 0 (0.0%) | 0 (0.0%) |
| Coal or Coke | 0 (0.0%) | 0 (0.0%) |
| All other Fuels | 3 (1.2%) | 0 (0.0%) |
| No Fuel Used | 0 (0.0%) | 0 (0.0%) |
| Total | 251 (100.0%) | 178 (100.0%) |
Household Vehicle Usage in Pine Lake
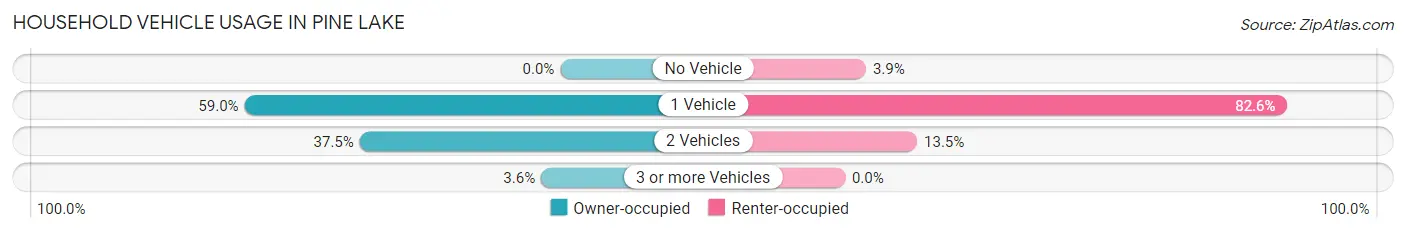
| Vehicles per Household | Owner-occupied | Renter-occupied |
| No Vehicle | 0 (0.0%) | 7 (3.9%) |
| 1 Vehicle | 148 (59.0%) | 147 (82.6%) |
| 2 Vehicles | 94 (37.4%) | 24 (13.5%) |
| 3 or more Vehicles | 9 (3.6%) | 0 (0.0%) |
| Total | 251 (100.0%) | 178 (100.0%) |
Real Estate & Mortgages in Pine Lake
Real Estate and Mortgage Overview in Pine Lake
| Characteristic | Without Mortgage | With Mortgage |
| Housing Units | 59 | 192 |
| Median Property Value | $238,200 | $267,200 |
| Median Household Income | $50,417 | $51 |
| Monthly Housing Costs | $545 | $2 |
| Real Estate Taxes | $2,618 | $0 |
Property Value by Mortgage Status in Pine Lake
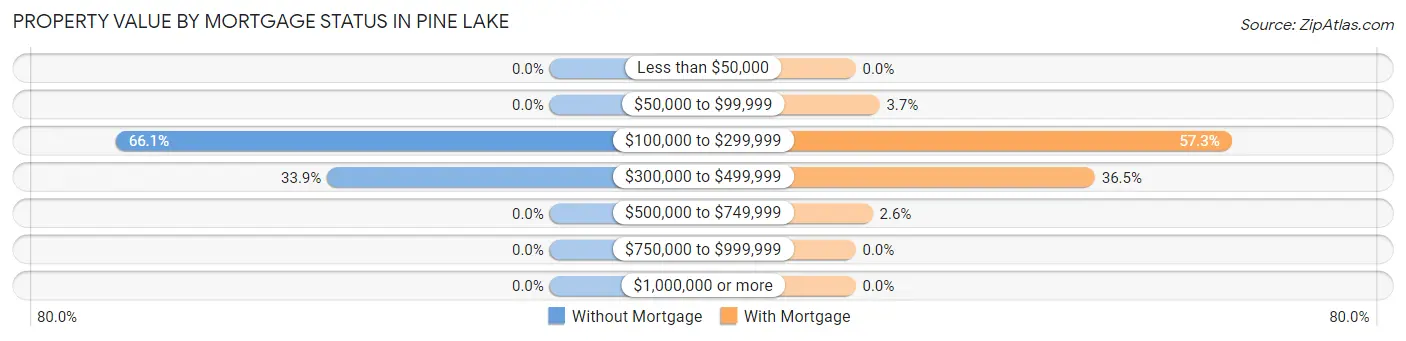
| Property Value | Without Mortgage | With Mortgage |
| Less than $50,000 | 0 (0.0%) | 0 (0.0%) |
| $50,000 to $99,999 | 0 (0.0%) | 7 (3.6%) |
| $100,000 to $299,999 | 39 (66.1%) | 110 (57.3%) |
| $300,000 to $499,999 | 20 (33.9%) | 70 (36.5%) |
| $500,000 to $749,999 | 0 (0.0%) | 5 (2.6%) |
| $750,000 to $999,999 | 0 (0.0%) | 0 (0.0%) |
| $1,000,000 or more | 0 (0.0%) | 0 (0.0%) |
| Total | 59 (100.0%) | 192 (100.0%) |
Household Income by Mortgage Status in Pine Lake
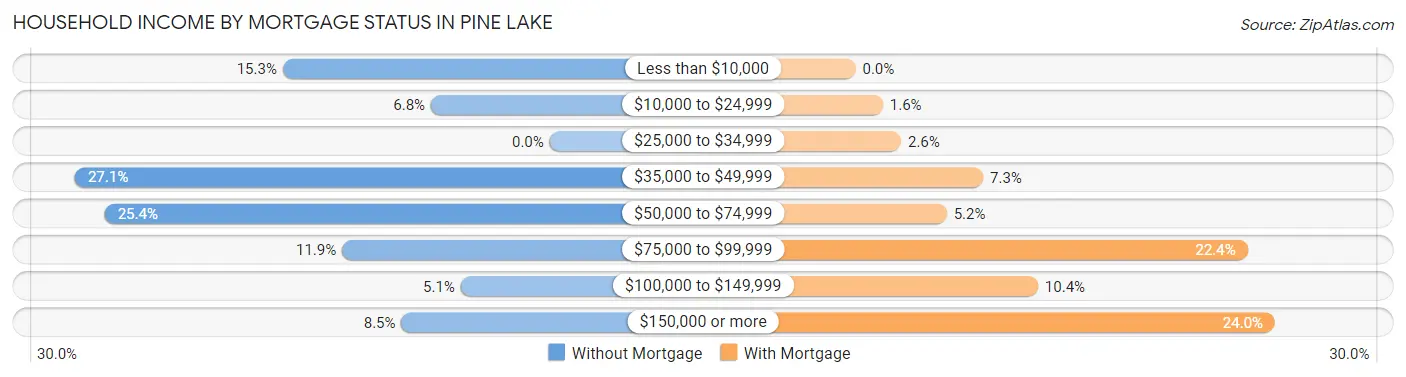
| Household Income | Without Mortgage | With Mortgage |
| Less than $10,000 | 9 (15.2%) | 0 (0.0%) |
| $10,000 to $24,999 | 4 (6.8%) | 3 (1.6%) |
| $25,000 to $34,999 | 0 (0.0%) | 5 (2.6%) |
| $35,000 to $49,999 | 16 (27.1%) | 14 (7.3%) |
| $50,000 to $74,999 | 15 (25.4%) | 10 (5.2%) |
| $75,000 to $99,999 | 7 (11.9%) | 43 (22.4%) |
| $100,000 to $149,999 | 3 (5.1%) | 20 (10.4%) |
| $150,000 or more | 5 (8.5%) | 46 (24.0%) |
| Total | 59 (100.0%) | 192 (100.0%) |
Property Value to Household Income Ratio in Pine Lake
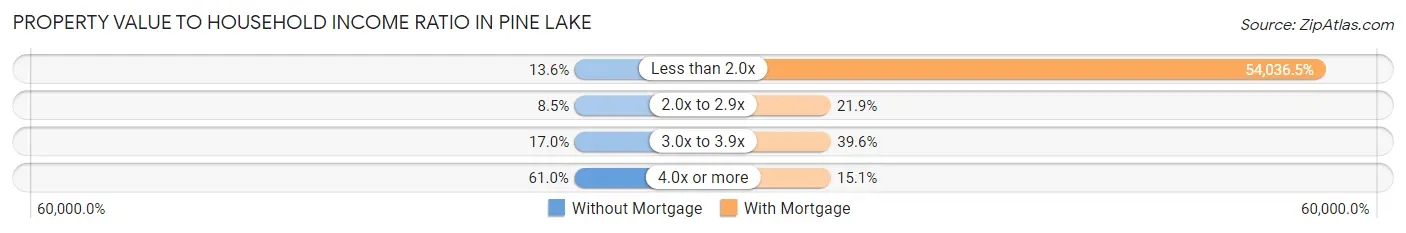
| Value-to-Income Ratio | Without Mortgage | With Mortgage |
| Less than 2.0x | 8 (13.6%) | 103,750 (54,036.5%) |
| 2.0x to 2.9x | 5 (8.5%) | 42 (21.9%) |
| 3.0x to 3.9x | 10 (17.0%) | 76 (39.6%) |
| 4.0x or more | 36 (61.0%) | 29 (15.1%) |
| Total | 59 (100.0%) | 192 (100.0%) |
Real Estate Taxes by Mortgage Status in Pine Lake
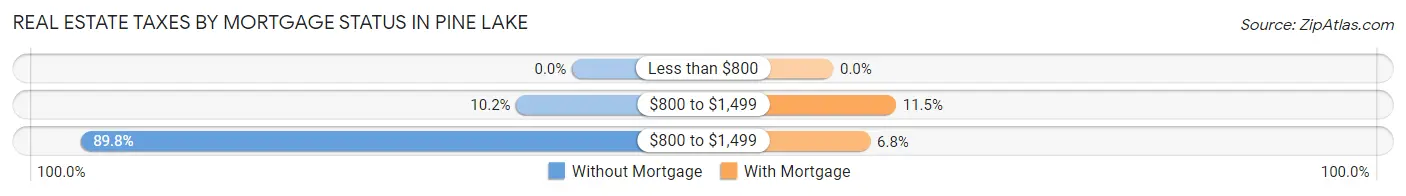
| Property Taxes | Without Mortgage | With Mortgage |
| Less than $800 | 0 (0.0%) | 0 (0.0%) |
| $800 to $1,499 | 6 (10.2%) | 22 (11.5%) |
| $800 to $1,499 | 53 (89.8%) | 13 (6.8%) |
| Total | 59 (100.0%) | 192 (100.0%) |
Health & Disability in Pine Lake
Health Insurance Coverage by Age in Pine Lake
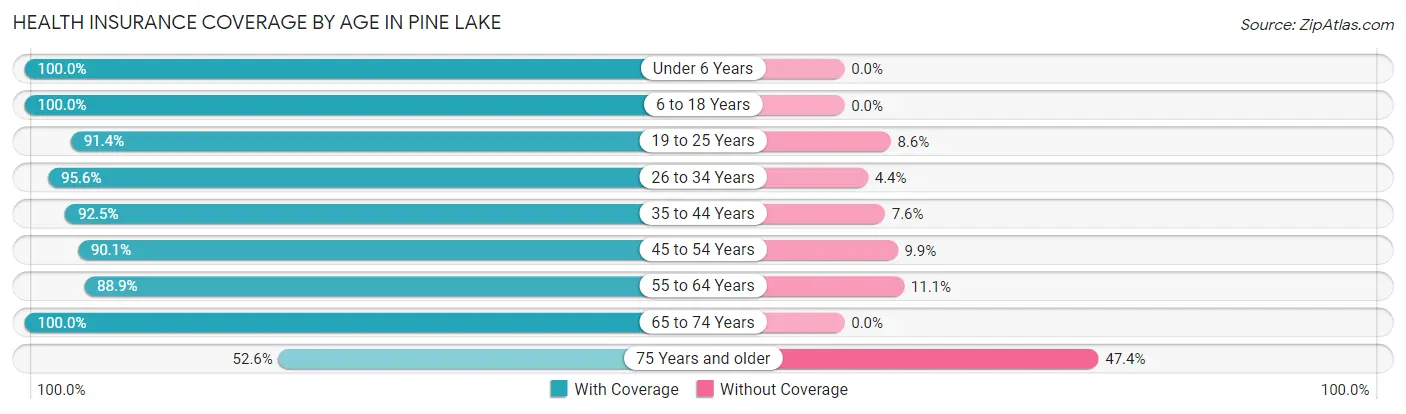
| Age Bracket | With Coverage | Without Coverage |
| Under 6 Years | 52 (100.0%) | 0 (0.0%) |
| 6 to 18 Years | 121 (100.0%) | 0 (0.0%) |
| 19 to 25 Years | 53 (91.4%) | 5 (8.6%) |
| 26 to 34 Years | 131 (95.6%) | 6 (4.4%) |
| 35 to 44 Years | 98 (92.4%) | 8 (7.5%) |
| 45 to 54 Years | 109 (90.1%) | 12 (9.9%) |
| 55 to 64 Years | 136 (88.9%) | 17 (11.1%) |
| 65 to 74 Years | 121 (100.0%) | 0 (0.0%) |
| 75 Years and older | 10 (52.6%) | 9 (47.4%) |
| Total | 831 (93.6%) | 57 (6.4%) |
Health Insurance Coverage by Citizenship Status in Pine Lake
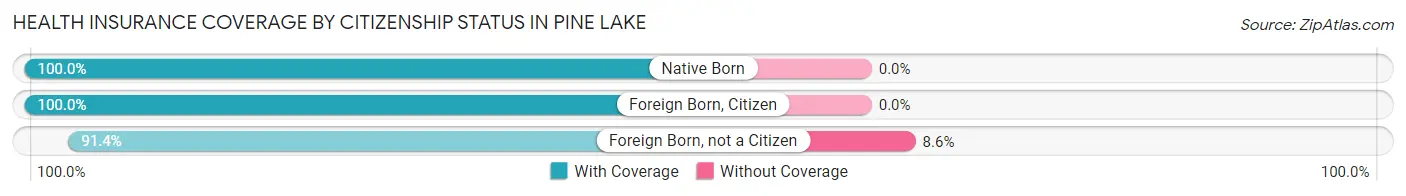
| Citizenship Status | With Coverage | Without Coverage |
| Native Born | 52 (100.0%) | 0 (0.0%) |
| Foreign Born, Citizen | 121 (100.0%) | 0 (0.0%) |
| Foreign Born, not a Citizen | 53 (91.4%) | 5 (8.6%) |
Health Insurance Coverage by Household Income in Pine Lake
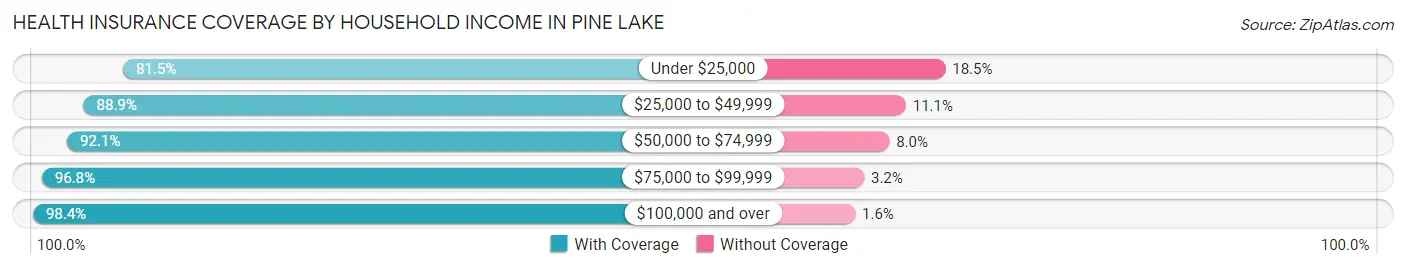
| Household Income | With Coverage | Without Coverage |
| Under $25,000 | 53 (81.5%) | 12 (18.5%) |
| $25,000 to $49,999 | 201 (88.9%) | 25 (11.1%) |
| $50,000 to $74,999 | 139 (92.0%) | 12 (8.0%) |
| $75,000 to $99,999 | 60 (96.8%) | 2 (3.2%) |
| $100,000 and over | 378 (98.4%) | 6 (1.6%) |
Public vs Private Health Insurance Coverage by Age in Pine Lake
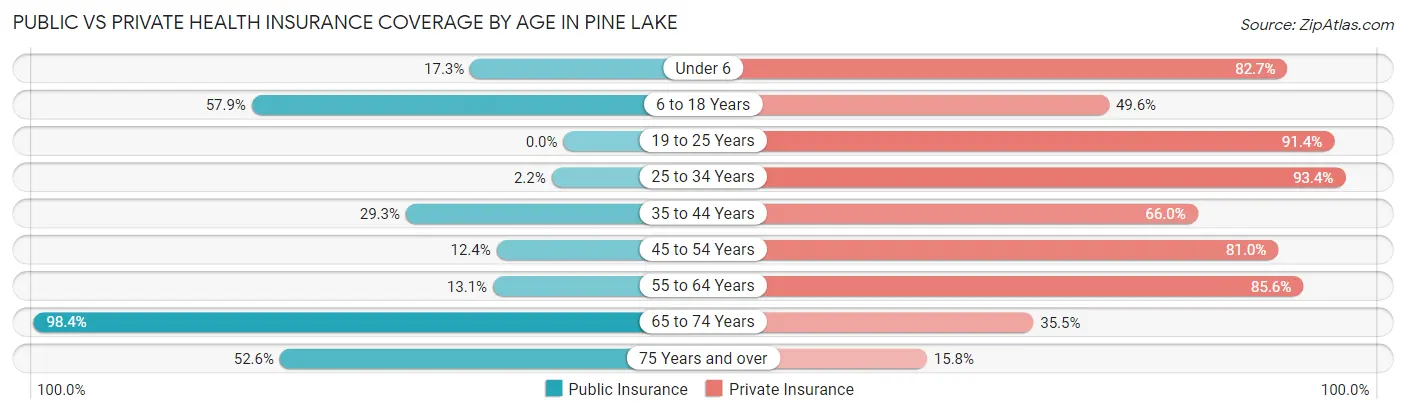
| Age Bracket | Public Insurance | Private Insurance |
| Under 6 | 9 (17.3%) | 43 (82.7%) |
| 6 to 18 Years | 70 (57.9%) | 60 (49.6%) |
| 19 to 25 Years | 0 (0.0%) | 53 (91.4%) |
| 25 to 34 Years | 3 (2.2%) | 128 (93.4%) |
| 35 to 44 Years | 31 (29.2%) | 70 (66.0%) |
| 45 to 54 Years | 15 (12.4%) | 98 (81.0%) |
| 55 to 64 Years | 20 (13.1%) | 131 (85.6%) |
| 65 to 74 Years | 119 (98.4%) | 43 (35.5%) |
| 75 Years and over | 10 (52.6%) | 3 (15.8%) |
| Total | 277 (31.2%) | 629 (70.8%) |
Disability Status by Sex by Age in Pine Lake
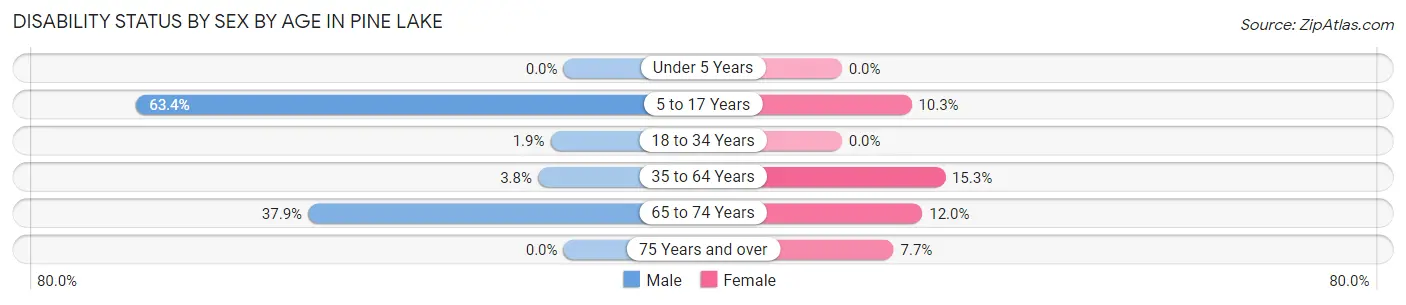
| Age Bracket | Male | Female |
| Under 5 Years | 0 (0.0%) | 0 (0.0%) |
| 5 to 17 Years | 26 (63.4%) | 9 (10.3%) |
| 18 to 34 Years | 2 (1.9%) | 0 (0.0%) |
| 35 to 64 Years | 5 (3.8%) | 38 (15.3%) |
| 65 to 74 Years | 11 (37.9%) | 11 (12.0%) |
| 75 Years and over | 0 (0.0%) | 1 (7.7%) |
Disability Class by Sex by Age in Pine Lake
Disability Class: Hearing Difficulty
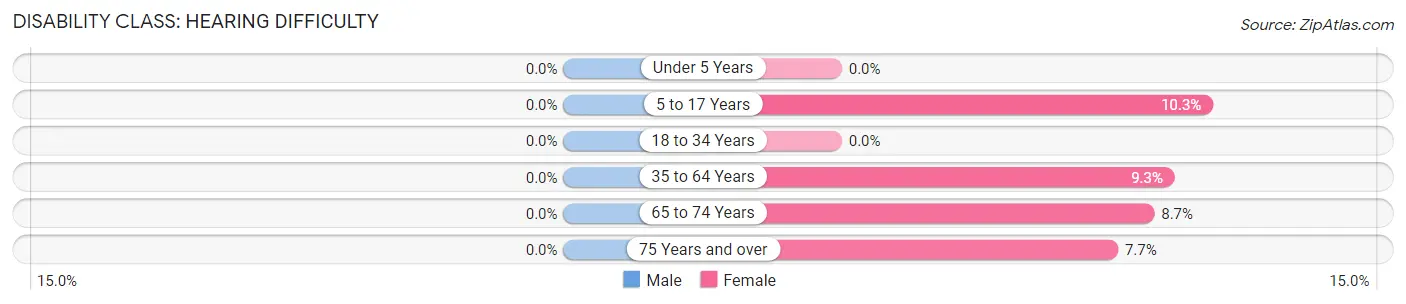
| Age Bracket | Male | Female |
| Under 5 Years | 0 (0.0%) | 0 (0.0%) |
| 5 to 17 Years | 0 (0.0%) | 9 (10.3%) |
| 18 to 34 Years | 0 (0.0%) | 0 (0.0%) |
| 35 to 64 Years | 0 (0.0%) | 23 (9.3%) |
| 65 to 74 Years | 0 (0.0%) | 8 (8.7%) |
| 75 Years and over | 0 (0.0%) | 1 (7.7%) |
Disability Class: Vision Difficulty
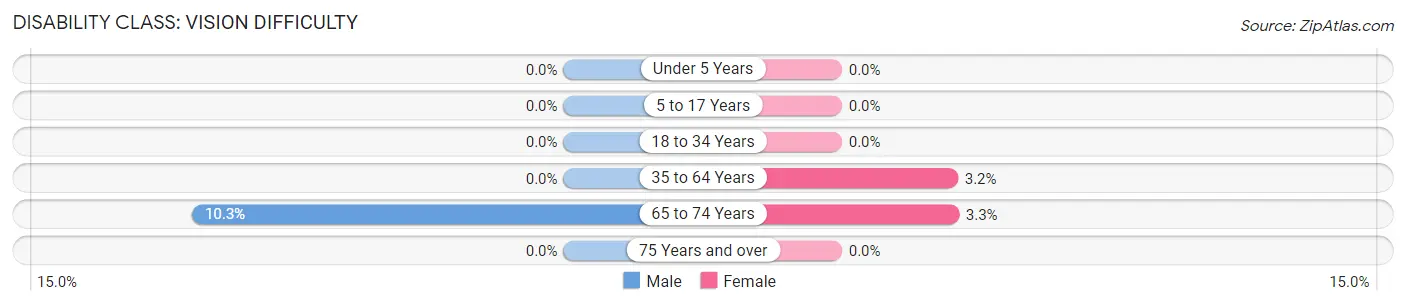
| Age Bracket | Male | Female |
| Under 5 Years | 0 (0.0%) | 0 (0.0%) |
| 5 to 17 Years | 0 (0.0%) | 0 (0.0%) |
| 18 to 34 Years | 0 (0.0%) | 0 (0.0%) |
| 35 to 64 Years | 0 (0.0%) | 8 (3.2%) |
| 65 to 74 Years | 3 (10.3%) | 3 (3.3%) |
| 75 Years and over | 0 (0.0%) | 0 (0.0%) |
Disability Class: Cognitive Difficulty
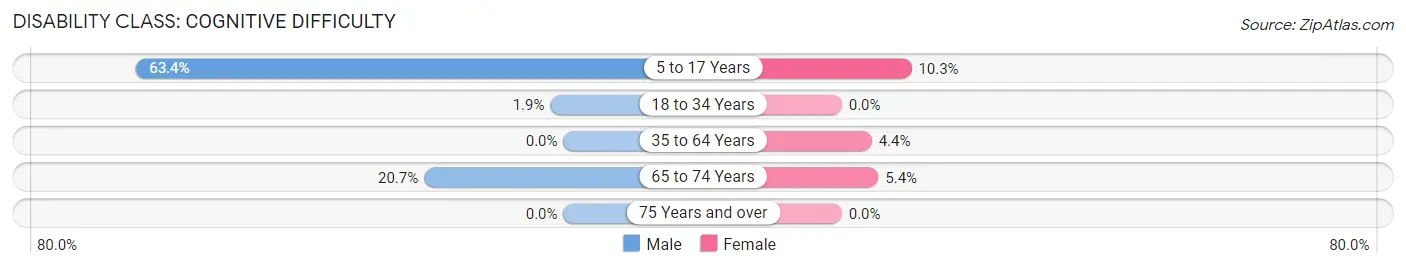
| Age Bracket | Male | Female |
| 5 to 17 Years | 26 (63.4%) | 9 (10.3%) |
| 18 to 34 Years | 2 (1.9%) | 0 (0.0%) |
| 35 to 64 Years | 0 (0.0%) | 11 (4.4%) |
| 65 to 74 Years | 6 (20.7%) | 5 (5.4%) |
| 75 Years and over | 0 (0.0%) | 0 (0.0%) |
Disability Class: Ambulatory Difficulty
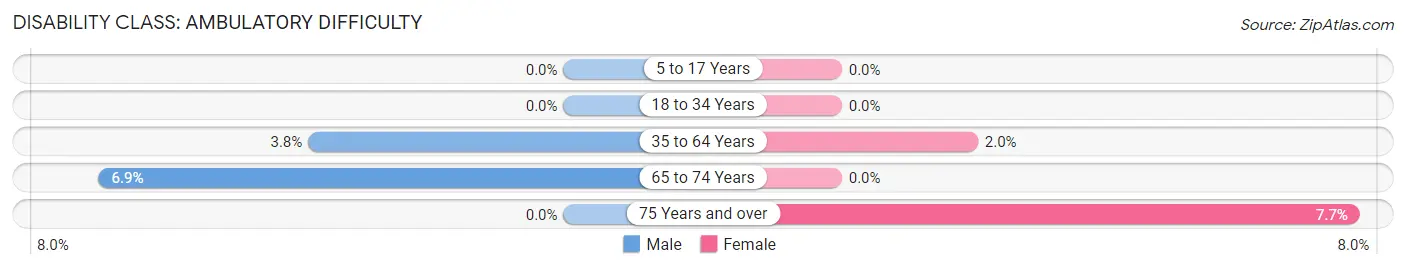
| Age Bracket | Male | Female |
| 5 to 17 Years | 0 (0.0%) | 0 (0.0%) |
| 18 to 34 Years | 0 (0.0%) | 0 (0.0%) |
| 35 to 64 Years | 5 (3.8%) | 5 (2.0%) |
| 65 to 74 Years | 2 (6.9%) | 0 (0.0%) |
| 75 Years and over | 0 (0.0%) | 1 (7.7%) |
Disability Class: Self-Care Difficulty
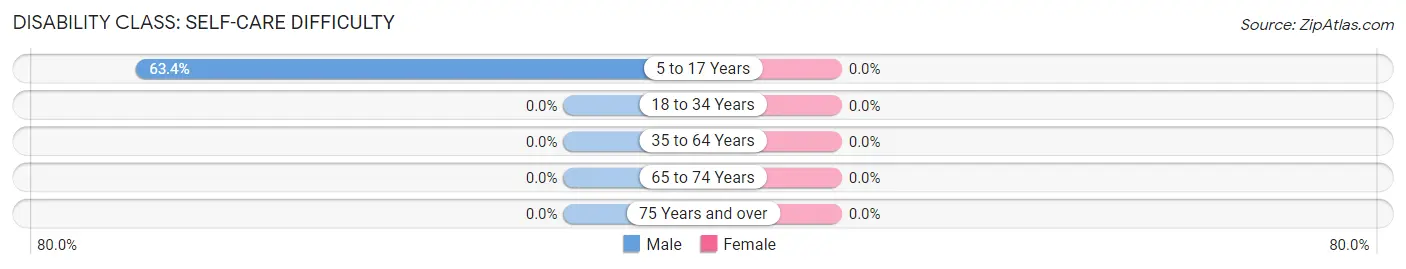
| Age Bracket | Male | Female |
| 5 to 17 Years | 26 (63.4%) | 0 (0.0%) |
| 18 to 34 Years | 0 (0.0%) | 0 (0.0%) |
| 35 to 64 Years | 0 (0.0%) | 0 (0.0%) |
| 65 to 74 Years | 0 (0.0%) | 0 (0.0%) |
| 75 Years and over | 0 (0.0%) | 0 (0.0%) |
Technology Access in Pine Lake
Computing Device Access in Pine Lake
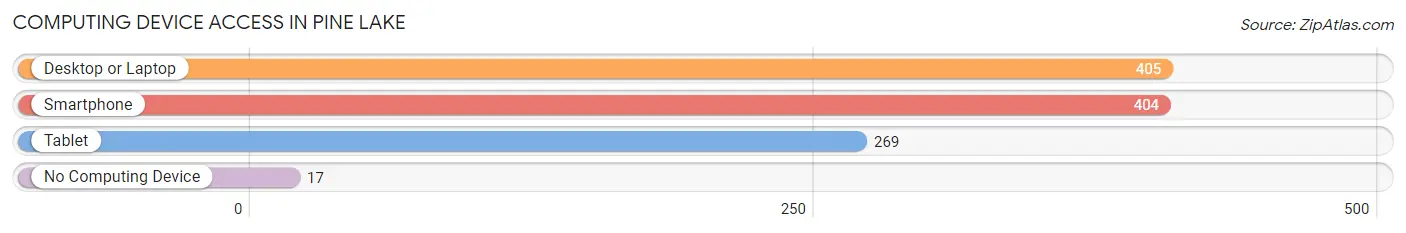
| Device Type | # Households | % Households |
| Desktop or Laptop | 405 | 94.4% |
| Smartphone | 404 | 94.2% |
| Tablet | 269 | 62.7% |
| No Computing Device | 17 | 4.0% |
| Total | 429 | 100.0% |
Internet Access in Pine Lake
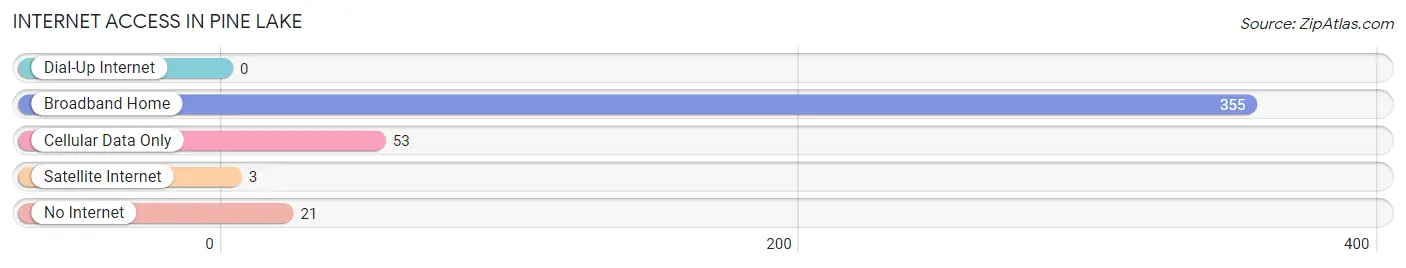
| Internet Type | # Households | % Households |
| Dial-Up Internet | 0 | 0.0% |
| Broadband Home | 355 | 82.8% |
| Cellular Data Only | 53 | 12.3% |
| Satellite Internet | 3 | 0.7% |
| No Internet | 21 | 4.9% |
| Total | 429 | 100.0% |
Pine Lake Summary
Pine Lake is a small city located in DeKalb County, Georgia, United States. It is situated in the foothills of the Appalachian Mountains, approximately 20 miles northeast of Atlanta. The city has a population of approximately 1,500 people and covers an area of 1.2 square miles.
History
Pine Lake was founded in the late 1800s by a group of settlers from the nearby town of Stone Mountain. The settlers were looking for a place to build a new community and chose the area around Pine Lake due to its natural beauty and abundance of resources. The town was officially incorporated in 1921 and has remained a small, rural community ever since.
The city was named after the nearby lake, which was originally known as “Piney Lake”. The lake was renamed in the early 1900s to honor the first settler of the area, William Pine.
Geography
Pine Lake is located in the foothills of the Appalachian Mountains, approximately 20 miles northeast of Atlanta. The city is situated on the western edge of DeKalb County, near the border with Gwinnett County. The city is bordered by Stone Mountain to the north, Decatur to the east, and Snellville to the south.
The city is situated at an elevation of 890 feet above sea level and is surrounded by rolling hills and forests. The city is located in the Piedmont region of Georgia, which is characterized by its hilly terrain and temperate climate.
Economy
Pine Lake is a small, rural community with a limited economy. The city’s main industries are agriculture and tourism. The city is home to several small farms, which produce a variety of crops, including corn, soybeans, and hay. The city also has several small businesses, including restaurants, retail stores, and a few small manufacturing companies.
The city is also a popular tourist destination due to its proximity to Atlanta and its natural beauty. The city is home to several parks and recreational areas, including Pine Lake Park, which offers swimming, fishing, and boating. The city also hosts several annual festivals and events, including the Pine Lake Festival and the Pine Lake Music Festival.
Demographics
As of the 2010 census, the population of Pine Lake was 1,500. The racial makeup of the city was 79.2% White, 15.3% African American, 0.7% Asian, 0.2% Native American, and 4.6% from other races. The median household income was $45,000, and the median age was 37.
Pine Lake is a small, rural community with a diverse population. The city is home to a variety of religious denominations, including Baptist, Methodist, and Catholic. The city is also home to a variety of cultural and recreational activities, including festivals, concerts, and outdoor activities.
Common Questions
What is Per Capita Income in Pine Lake?
Per Capita income in Pine Lake is $39,280.
What is the Median Family Income in Pine Lake?
Median Family Income in Pine Lake is $91,023.
What is the Median Household income in Pine Lake?
Median Household Income in Pine Lake is $68,359.
What is Income or Wage Gap in Pine Lake?
Income or Wage Gap in Pine Lake is 11.8%.
Women in Pine Lake earn 88.2 cents for every dollar earned by a man.
What is Inequality or Gini Index in Pine Lake?
Inequality or Gini Index in Pine Lake is 0.34.
What is the Total Population of Pine Lake?
Total Population of Pine Lake is 888.
What is the Total Male Population of Pine Lake?
Total Male Population of Pine Lake is 347.
What is the Total Female Population of Pine Lake?
Total Female Population of Pine Lake is 541.
What is the Ratio of Males per 100 Females in Pine Lake?
There are 64.14 Males per 100 Females in Pine Lake.
What is the Ratio of Females per 100 Males in Pine Lake?
There are 155.91 Females per 100 Males in Pine Lake.
What is the Median Population Age in Pine Lake?
Median Population Age in Pine Lake is 42.4 Years.
What is the Average Family Size in Pine Lake
Average Family Size in Pine Lake is 2.7 People.
What is the Average Household Size in Pine Lake
Average Household Size in Pine Lake is 2.1 People.
How Large is the Labor Force in Pine Lake?
There are 512 People in the Labor Forcein in Pine Lake.
What is the Percentage of People in the Labor Force in Pine Lake?
69.4% of People are in the Labor Force in Pine Lake.
What is the Unemployment Rate in Pine Lake?
Unemployment Rate in Pine Lake is 4.5%.