Norwood, GA Map & Demographics
Norwood Map
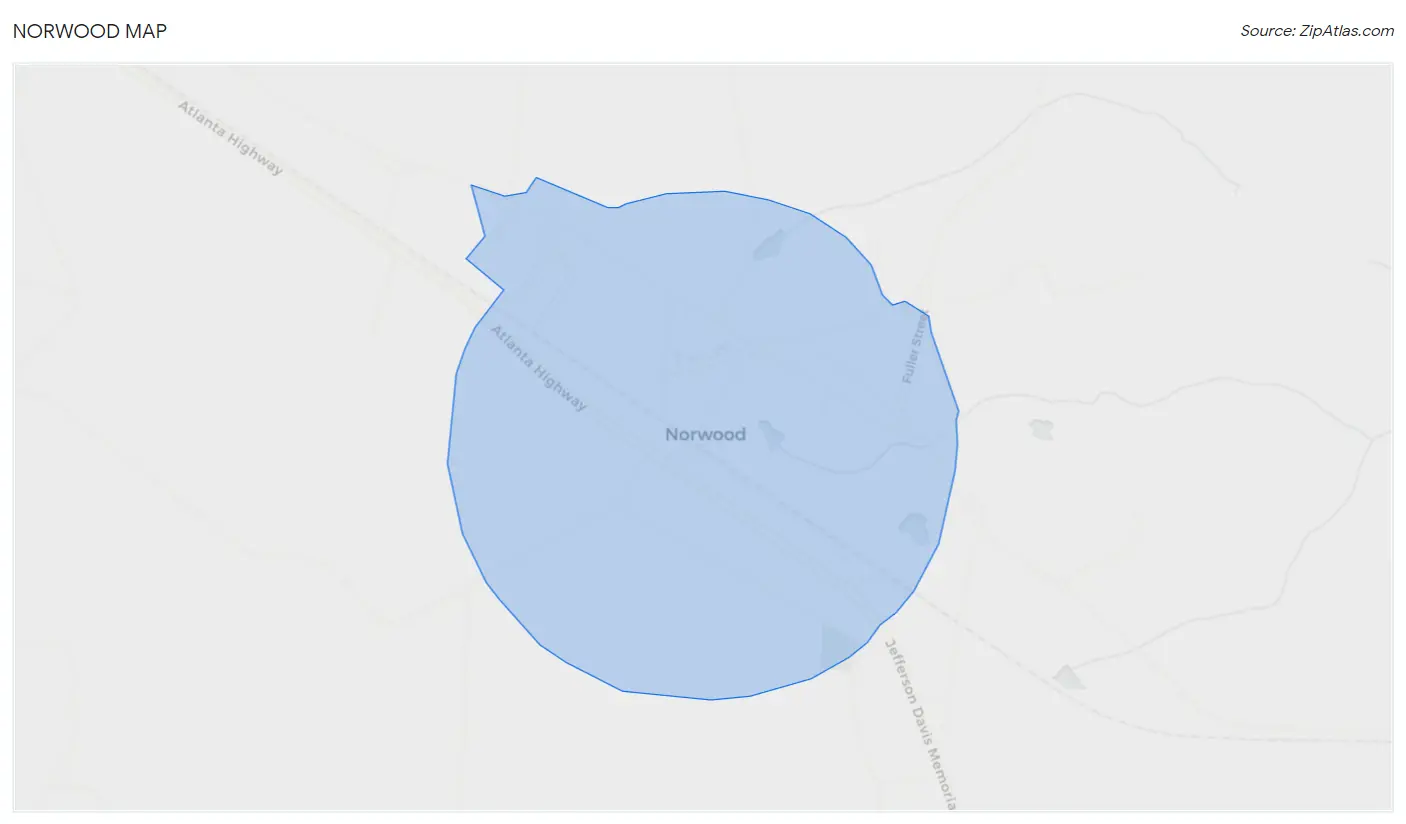
Norwood Overview
$22,918
PER CAPITA INCOME
$24,375
AVG HOUSEHOLD INCOME
0.63
INEQUALITY / GINI INDEX
277
TOTAL POPULATION
139
MALE POPULATION
138
FEMALE POPULATION
100.72
MALES / 100 FEMALES
99.28
FEMALES / 100 MALES
53.9
MEDIAN AGE
2.6
AVG FAMILY SIZE
2.2
AVG HOUSEHOLD SIZE
77
LABOR FORCE [ PEOPLE ]
31.2%
PERCENT IN LABOR FORCE
2.6%
UNEMPLOYMENT RATE
Norwood Zip Codes
Norwood Area Codes
Income in Norwood
Income Overview in Norwood
| Characteristic | Number | Measure |
| Per Capita Income | 277 | $22,918 |
| Median Family Income | 72 | $0 |
| Mean Family Income | 72 | $42,557 |
| Median Household Income | 125 | $24,375 |
| Mean Household Income | 125 | $50,703 |
| Income Deficit | 72 | $0 |
| Wage / Income Gap (%) | 277 | 0.00% |
| Wage / Income Gap ($) | 277 | 100.00¢ per $1 |
| Gini / Inequality Index | 277 | 0.63 |
Earnings by Sex in Norwood
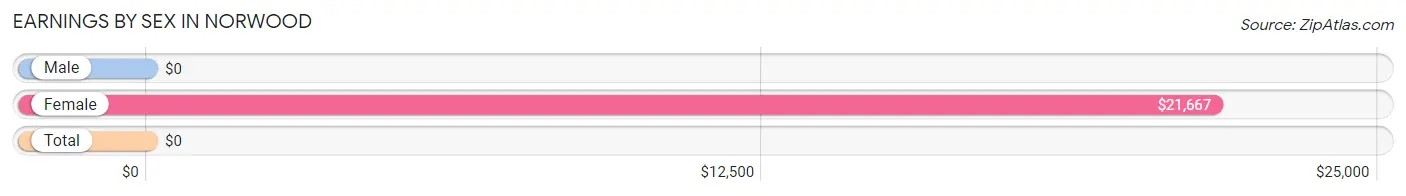
| Sex | Number | Average Earnings |
| Male | 45 (58.4%) | $0 |
| Female | 32 (41.6%) | $21,667 |
| Total | 77 (100.0%) | $0 |
Earnings by Sex by Income Bracket in Norwood
The most common earnings brackets in Norwood are $10,000 to $12,499 for men (20 | 44.4%) and $7,500 to $9,999 for women (6 | 18.8%).
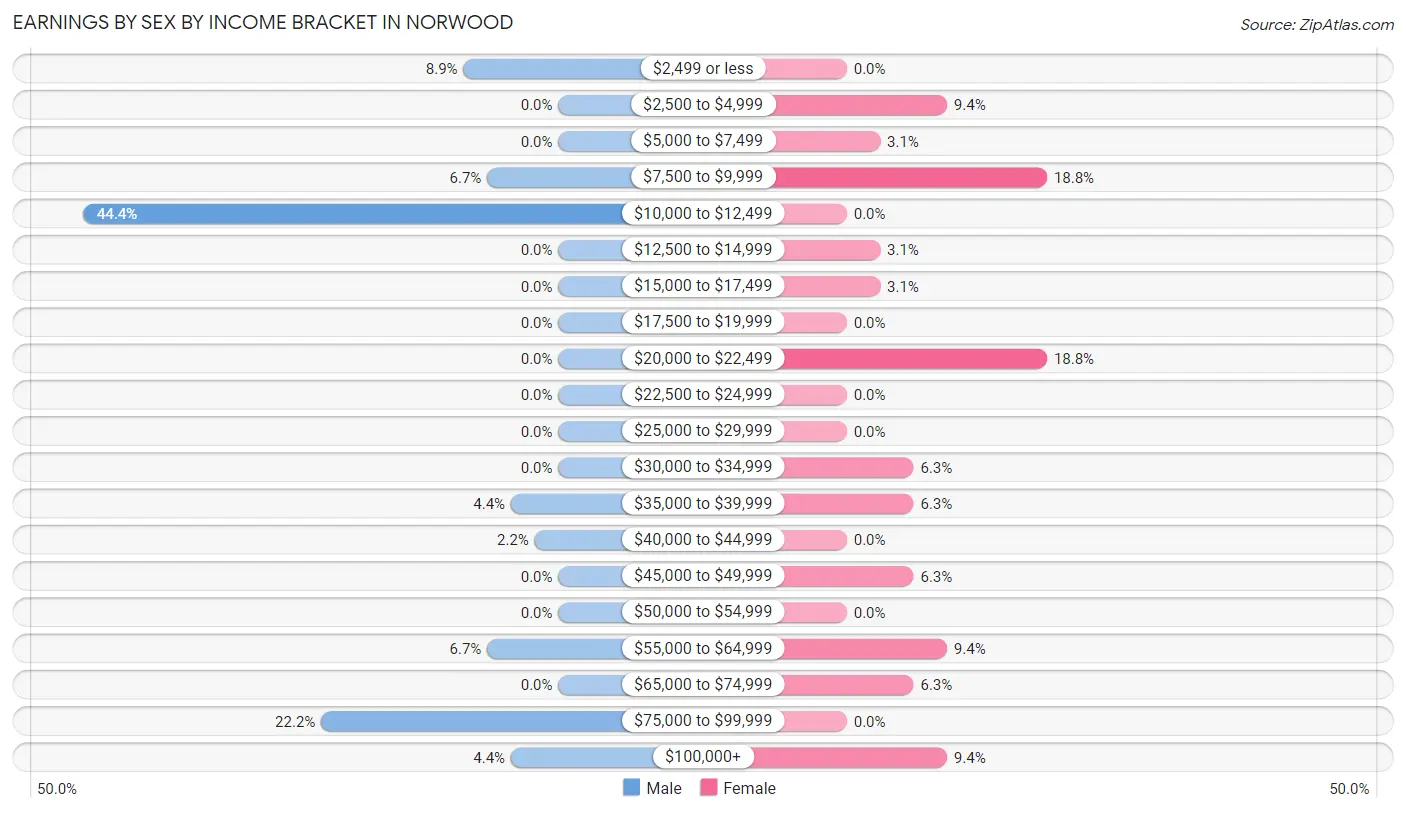
| Income | Male | Female |
| $2,499 or less | 4 (8.9%) | 0 (0.0%) |
| $2,500 to $4,999 | 0 (0.0%) | 3 (9.4%) |
| $5,000 to $7,499 | 0 (0.0%) | 1 (3.1%) |
| $7,500 to $9,999 | 3 (6.7%) | 6 (18.8%) |
| $10,000 to $12,499 | 20 (44.4%) | 0 (0.0%) |
| $12,500 to $14,999 | 0 (0.0%) | 1 (3.1%) |
| $15,000 to $17,499 | 0 (0.0%) | 1 (3.1%) |
| $17,500 to $19,999 | 0 (0.0%) | 0 (0.0%) |
| $20,000 to $22,499 | 0 (0.0%) | 6 (18.8%) |
| $22,500 to $24,999 | 0 (0.0%) | 0 (0.0%) |
| $25,000 to $29,999 | 0 (0.0%) | 0 (0.0%) |
| $30,000 to $34,999 | 0 (0.0%) | 2 (6.2%) |
| $35,000 to $39,999 | 2 (4.4%) | 2 (6.2%) |
| $40,000 to $44,999 | 1 (2.2%) | 0 (0.0%) |
| $45,000 to $49,999 | 0 (0.0%) | 2 (6.2%) |
| $50,000 to $54,999 | 0 (0.0%) | 0 (0.0%) |
| $55,000 to $64,999 | 3 (6.7%) | 3 (9.4%) |
| $65,000 to $74,999 | 0 (0.0%) | 2 (6.2%) |
| $75,000 to $99,999 | 10 (22.2%) | 0 (0.0%) |
| $100,000+ | 2 (4.4%) | 3 (9.4%) |
| Total | 45 (100.0%) | 32 (100.0%) |
Earnings by Sex by Educational Attainment in Norwood
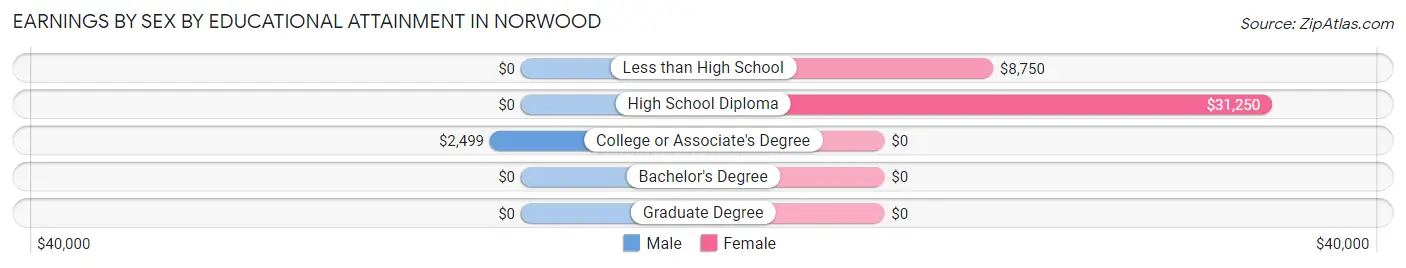
| Educational Attainment | Male Income | Female Income |
| Less than High School | - | - |
| High School Diploma | - | - |
| College or Associate's Degree | $2,499 | $0 |
| Bachelor's Degree | - | - |
| Graduate Degree | - | - |
| Total | - | - |
Family Income in Norwood
Family Income Brackets in Norwood
According to the Norwood family income data, there are 18 families falling into the less than $10,000 income range, which is the most common income bracket and makes up 25.0% of all families.
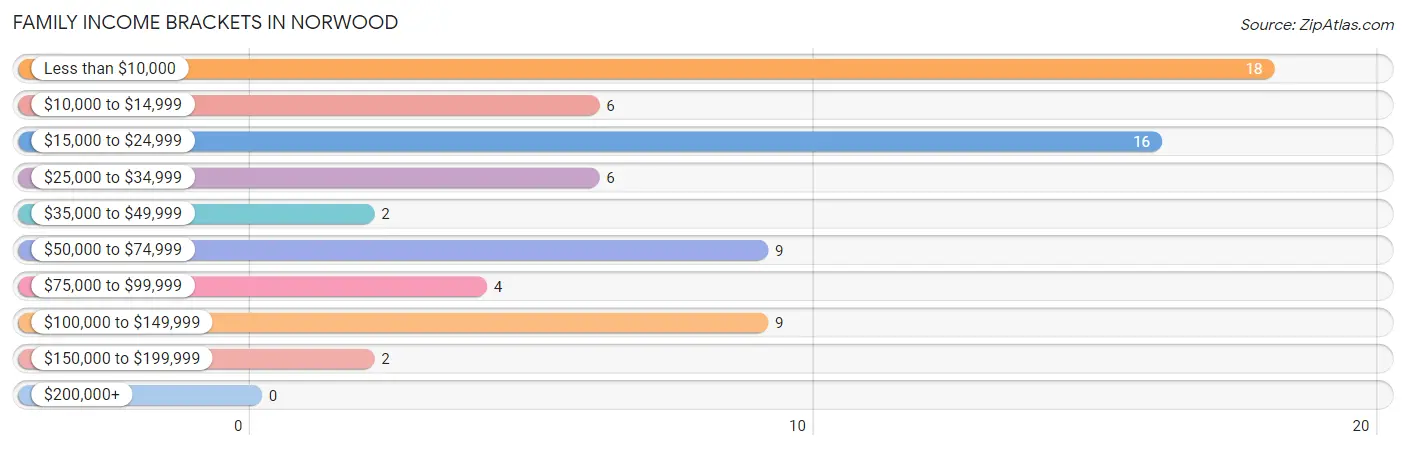
| Income Bracket | # Families | % Families |
| Less than $10,000 | 18 | 25.0% |
| $10,000 to $14,999 | 6 | 8.3% |
| $15,000 to $24,999 | 16 | 22.2% |
| $25,000 to $34,999 | 6 | 8.3% |
| $35,000 to $49,999 | 2 | 2.8% |
| $50,000 to $74,999 | 9 | 12.5% |
| $75,000 to $99,999 | 4 | 5.6% |
| $100,000 to $149,999 | 9 | 12.5% |
| $150,000 to $199,999 | 2 | 2.8% |
| $200,000+ | 0 | 0.0% |
Family Income by Famaliy Size in Norwood
| Income Bracket | # Families | Median Income |
| 2-Person Families | 41 (56.9%) | $0 |
| 3-Person Families | 28 (38.9%) | $0 |
| 4-Person Families | 0 (0.0%) | $0 |
| 5-Person Families | 1 (1.4%) | $0 |
| 6-Person Families | 0 (0.0%) | $0 |
| 7+ Person Families | 2 (2.8%) | $0 |
| Total | 72 (100.0%) | $0 |
Family Income by Number of Earners in Norwood
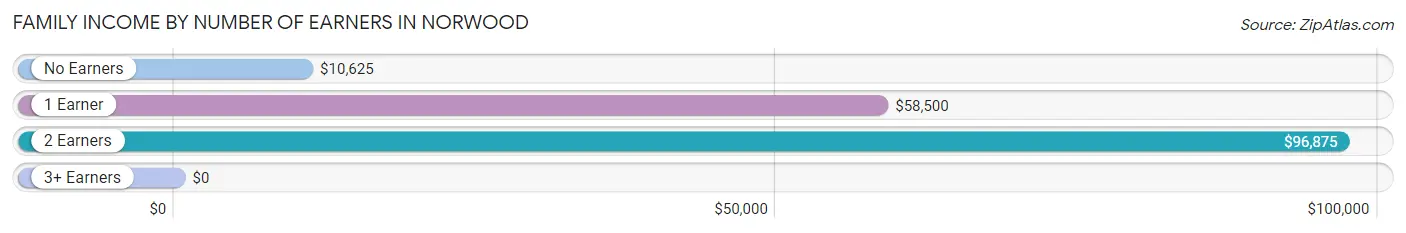
| Number of Earners | # Families | Median Income |
| No Earners | 39 (54.2%) | $10,625 |
| 1 Earner | 20 (27.8%) | $58,500 |
| 2 Earners | 13 (18.1%) | $96,875 |
| 3+ Earners | 0 (0.0%) | $0 |
| Total | 72 (100.0%) | $0 |
Household Income in Norwood
Household Income Brackets in Norwood
With 26 households falling in the category, the less than $10,000 income range is the most frequent in Norwood, accounting for 20.8% of all households. In contrast, only 2 households (1.6%) fall into the $150,000 to $199,999 income bracket, making it the least populous group.
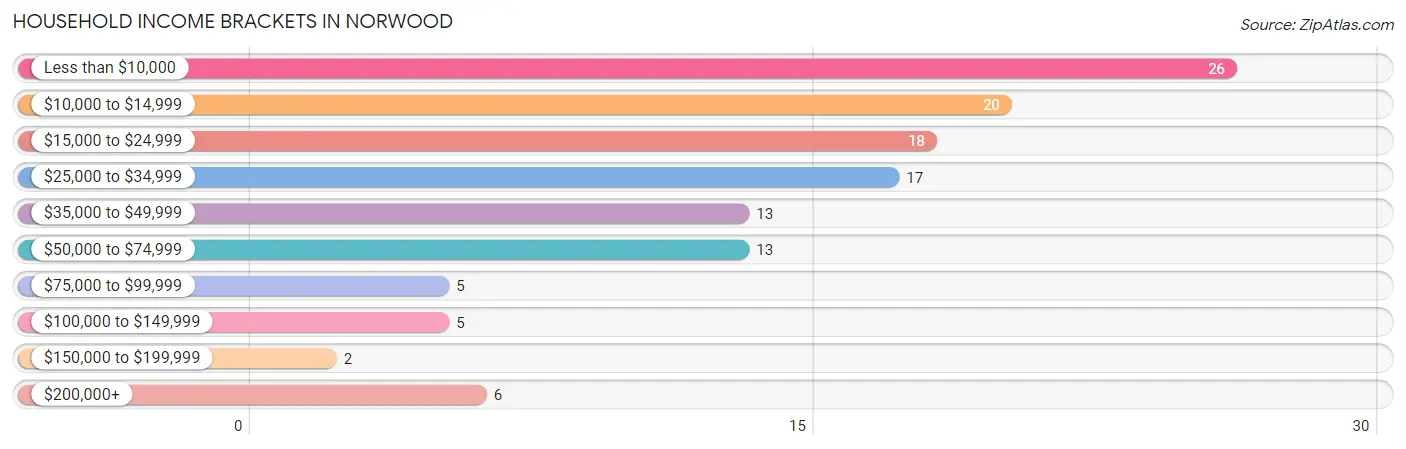
| Income Bracket | # Households | % Households |
| Less than $10,000 | 26 | 20.8% |
| $10,000 to $14,999 | 20 | 16.0% |
| $15,000 to $24,999 | 18 | 14.4% |
| $25,000 to $34,999 | 17 | 13.6% |
| $35,000 to $49,999 | 13 | 10.4% |
| $50,000 to $74,999 | 13 | 10.4% |
| $75,000 to $99,999 | 5 | 4.0% |
| $100,000 to $149,999 | 5 | 4.0% |
| $150,000 to $199,999 | 2 | 1.6% |
| $200,000+ | 6 | 4.8% |
Household Income by Householder Age in Norwood
The median household income in Norwood is $24,375, with the highest median household income of $101,875 found in the 25 to 44 years age bracket for the primary householder. A total of 5 households (4.0%) fall into this category. Meanwhile, the 15 to 24 years age bracket for the primary householder has the lowest median household income of $0, with 1 households (0.8%) in this group.
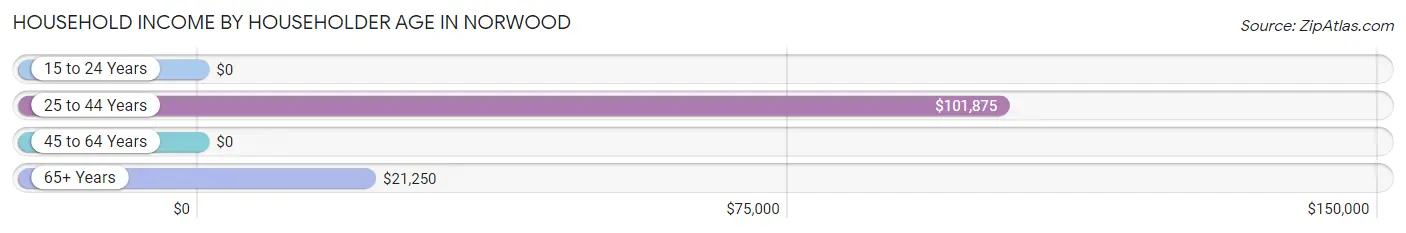
| Income Bracket | # Households | Median Income |
| 15 to 24 Years | 1 (0.8%) | $0 |
| 25 to 44 Years | 5 (4.0%) | $101,875 |
| 45 to 64 Years | 59 (47.2%) | $0 |
| 65+ Years | 60 (48.0%) | $21,250 |
| Total | 125 (100.0%) | $24,375 |
Poverty in Norwood
Income Below Poverty by Sex and Age in Norwood
With 57.8% poverty level for males and 33.3% for females among the residents of Norwood, 45 to 54 year old males and 45 to 54 year old females are the most vulnerable to poverty, with 31 males (77.5%) and 14 females (77.8%) in their respective age groups living below the poverty level.
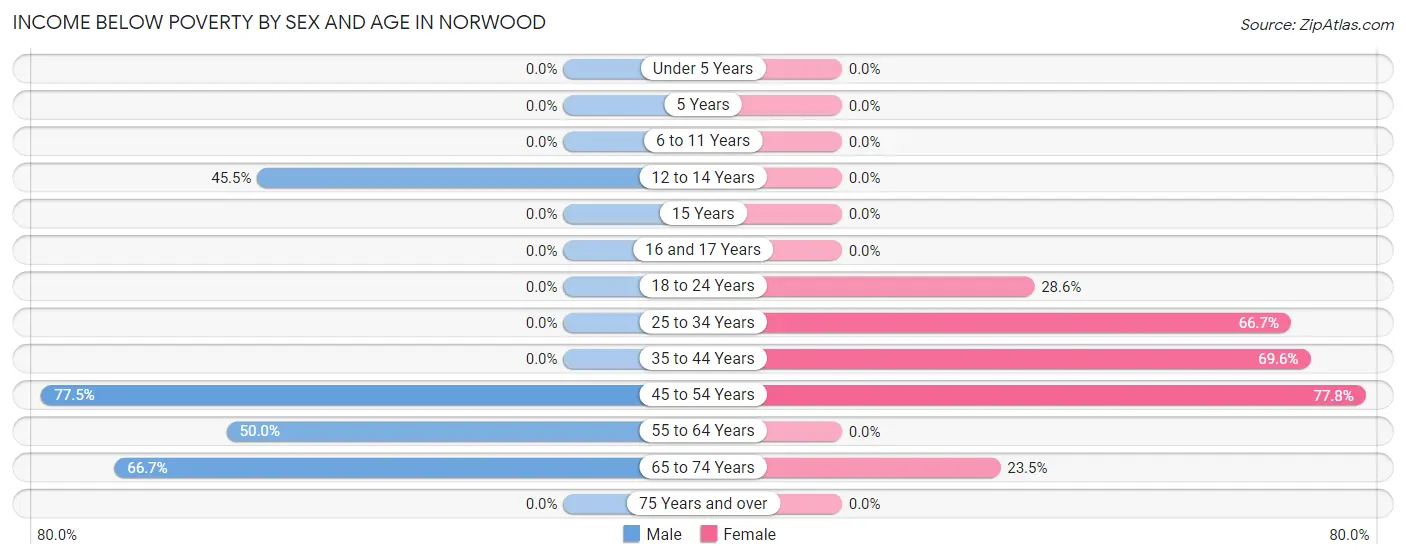
| Age Bracket | Male | Female |
| Under 5 Years | 0 (0.0%) | 0 (0.0%) |
| 5 Years | 0 (0.0%) | 0 (0.0%) |
| 6 to 11 Years | 0 (0.0%) | 0 (0.0%) |
| 12 to 14 Years | 5 (45.5%) | 0 (0.0%) |
| 15 Years | 0 (0.0%) | 0 (0.0%) |
| 16 and 17 Years | 0 (0.0%) | 0 (0.0%) |
| 18 to 24 Years | 0 (0.0%) | 2 (28.6%) |
| 25 to 34 Years | 0 (0.0%) | 10 (66.7%) |
| 35 to 44 Years | 0 (0.0%) | 16 (69.6%) |
| 45 to 54 Years | 31 (77.5%) | 14 (77.8%) |
| 55 to 64 Years | 12 (50.0%) | 0 (0.0%) |
| 65 to 74 Years | 30 (66.7%) | 4 (23.5%) |
| 75 Years and over | 0 (0.0%) | 0 (0.0%) |
| Total | 78 (57.8%) | 46 (33.3%) |
Income Above Poverty by Sex and Age in Norwood
According to the poverty statistics in Norwood, males aged under 5 years and females aged under 5 years are the age groups that are most secure financially, with 100.0% of males and 100.0% of females in these age groups living above the poverty line.
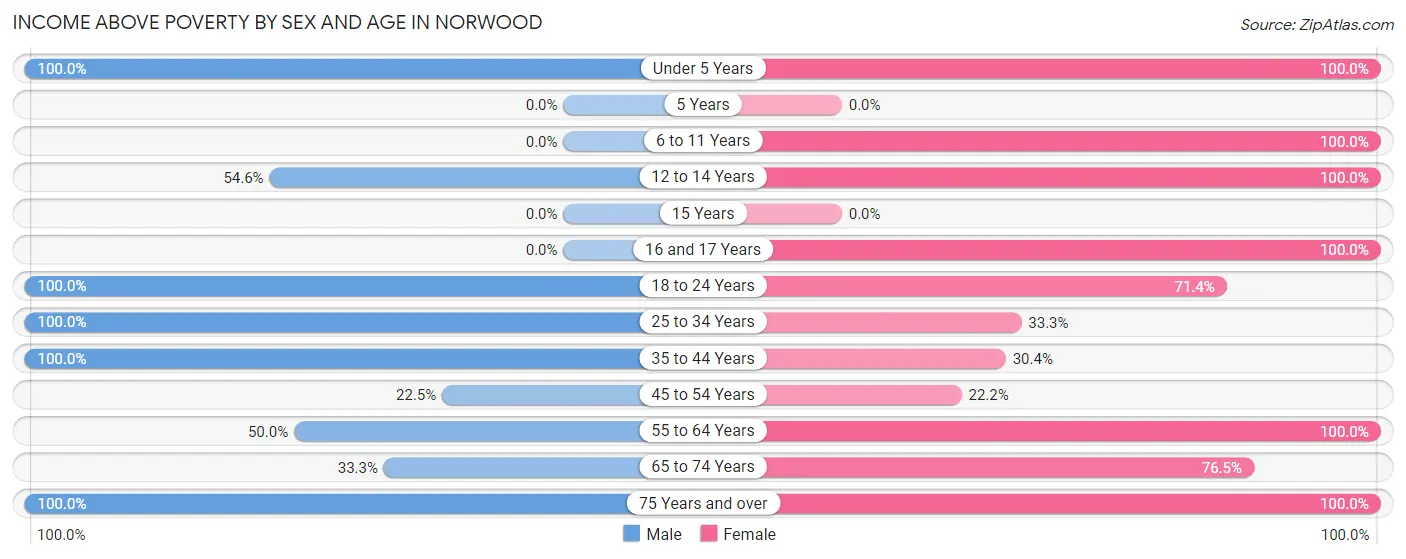
| Age Bracket | Male | Female |
| Under 5 Years | 2 (100.0%) | 2 (100.0%) |
| 5 Years | 0 (0.0%) | 0 (0.0%) |
| 6 to 11 Years | 0 (0.0%) | 9 (100.0%) |
| 12 to 14 Years | 6 (54.5%) | 2 (100.0%) |
| 15 Years | 0 (0.0%) | 0 (0.0%) |
| 16 and 17 Years | 0 (0.0%) | 5 (100.0%) |
| 18 to 24 Years | 1 (100.0%) | 5 (71.4%) |
| 25 to 34 Years | 5 (100.0%) | 5 (33.3%) |
| 35 to 44 Years | 5 (100.0%) | 7 (30.4%) |
| 45 to 54 Years | 9 (22.5%) | 4 (22.2%) |
| 55 to 64 Years | 12 (50.0%) | 25 (100.0%) |
| 65 to 74 Years | 15 (33.3%) | 13 (76.5%) |
| 75 Years and over | 2 (100.0%) | 15 (100.0%) |
| Total | 57 (42.2%) | 92 (66.7%) |
Income Below Poverty Among Married-Couple Families in Norwood
The poverty statistics for married-couple families in Norwood show that 21.6% or 8 of the total 37 families live below the poverty line. Families with no children have the highest poverty rate of 23.5%, comprising of 8 families. On the other hand, families with 3 or 4 children have the lowest poverty rate of 0.0%, which includes 0 families.
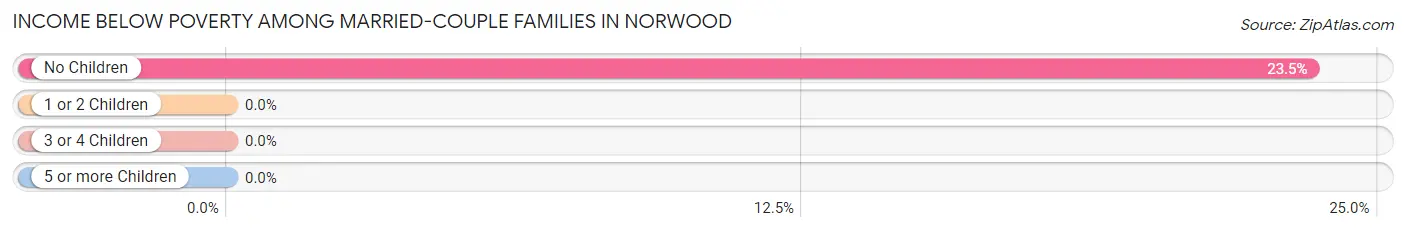
| Children | Above Poverty | Below Poverty |
| No Children | 26 (76.5%) | 8 (23.5%) |
| 1 or 2 Children | 0 (0.0%) | 0 (0.0%) |
| 3 or 4 Children | 3 (100.0%) | 0 (0.0%) |
| 5 or more Children | 0 (0.0%) | 0 (0.0%) |
| Total | 29 (78.4%) | 8 (21.6%) |
Income Below Poverty Among Single-Parent Households in Norwood
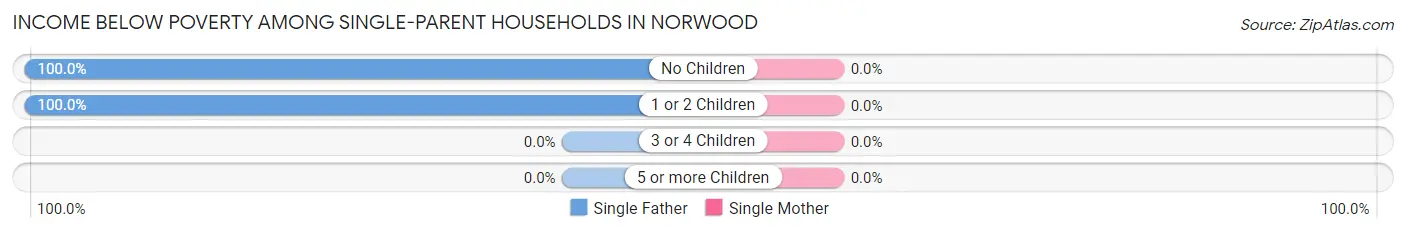
| Children | Single Father | Single Mother |
| No Children | 18 (100.0%) | 0 (0.0%) |
| 1 or 2 Children | 6 (100.0%) | 0 (0.0%) |
| 3 or 4 Children | 0 (0.0%) | 0 (0.0%) |
| 5 or more Children | 0 (0.0%) | 0 (0.0%) |
| Total | 24 (100.0%) | 0 (0.0%) |
Income Below Poverty Among Married-Couple vs Single-Parent Households in Norwood
The poverty data for Norwood shows that 8 of the married-couple family households (21.6%) and 24 of the single-parent households (68.6%) are living below the poverty level. Within the married-couple family households, those with no children have the highest poverty rate, with 8 households (23.5%) falling below the poverty line. Among the single-parent households, those with no children have the highest poverty rate, with 18 household (78.3%) living below poverty.
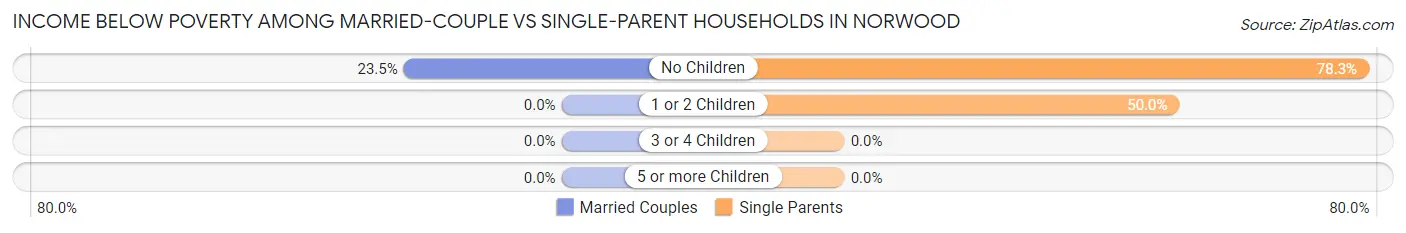
| Children | Married-Couple Families | Single-Parent Households |
| No Children | 8 (23.5%) | 18 (78.3%) |
| 1 or 2 Children | 0 (0.0%) | 6 (50.0%) |
| 3 or 4 Children | 0 (0.0%) | 0 (0.0%) |
| 5 or more Children | 0 (0.0%) | 0 (0.0%) |
| Total | 8 (21.6%) | 24 (68.6%) |
Race in Norwood
The most populous races in Norwood are Black / African American (166 | 59.9%), and White / Caucasian (111 | 40.1%).
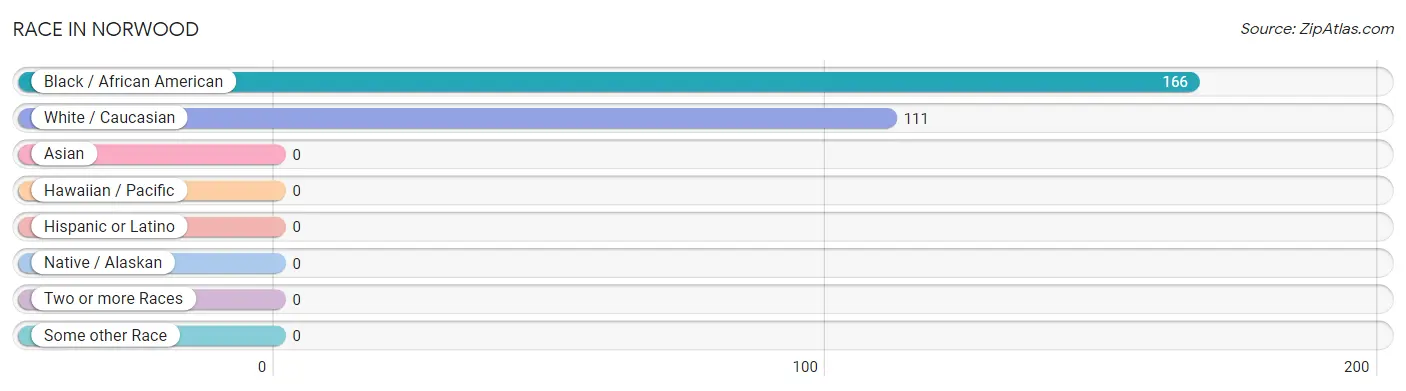
| Race | # Population | % Population |
| Asian | 0 | 0.0% |
| Black / African American | 166 | 59.9% |
| Hawaiian / Pacific | 0 | 0.0% |
| Hispanic or Latino | 0 | 0.0% |
| Native / Alaskan | 0 | 0.0% |
| White / Caucasian | 111 | 40.1% |
| Two or more Races | 0 | 0.0% |
| Some other Race | 0 | 0.0% |
| Total | 277 | 100.0% |
Ancestry in Norwood
The most populous ancestries reported in Norwood are American (32 | 11.6%), English (16 | 5.8%), African (5 | 1.8%), Subsaharan African (5 | 1.8%), and Irish (2 | 0.7%), together accounting for 21.7% of all Norwood residents.
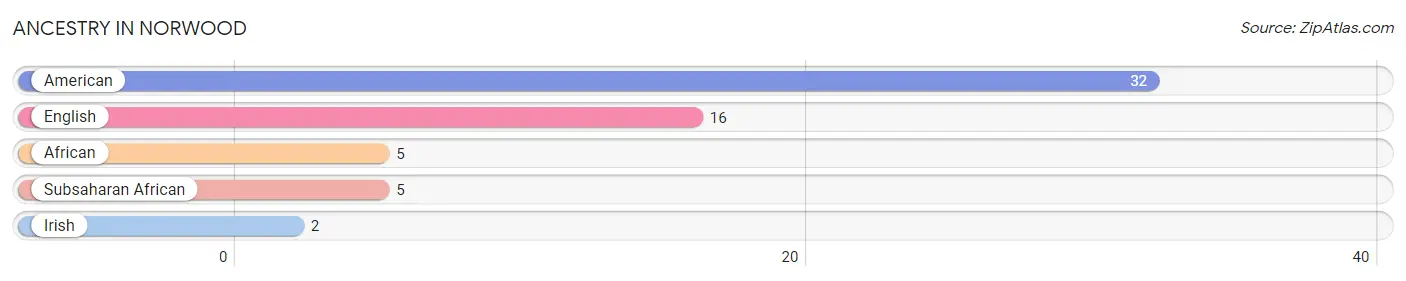
| Ancestry | # Population | % Population |
| African | 5 | 1.8% |
| American | 32 | 11.6% |
| English | 16 | 5.8% |
| Irish | 2 | 0.7% |
| Subsaharan African | 5 | 1.8% | View All 5 Rows |
Immigrants in Norwood

| Immigration Origin | # Population | % Population | View All 0 Rows |
Sex and Age in Norwood
Sex and Age in Norwood
The most populous age groups in Norwood are 65 to 69 Years (35 | 25.2%) for men and 55 to 59 Years (21 | 15.2%) for women.
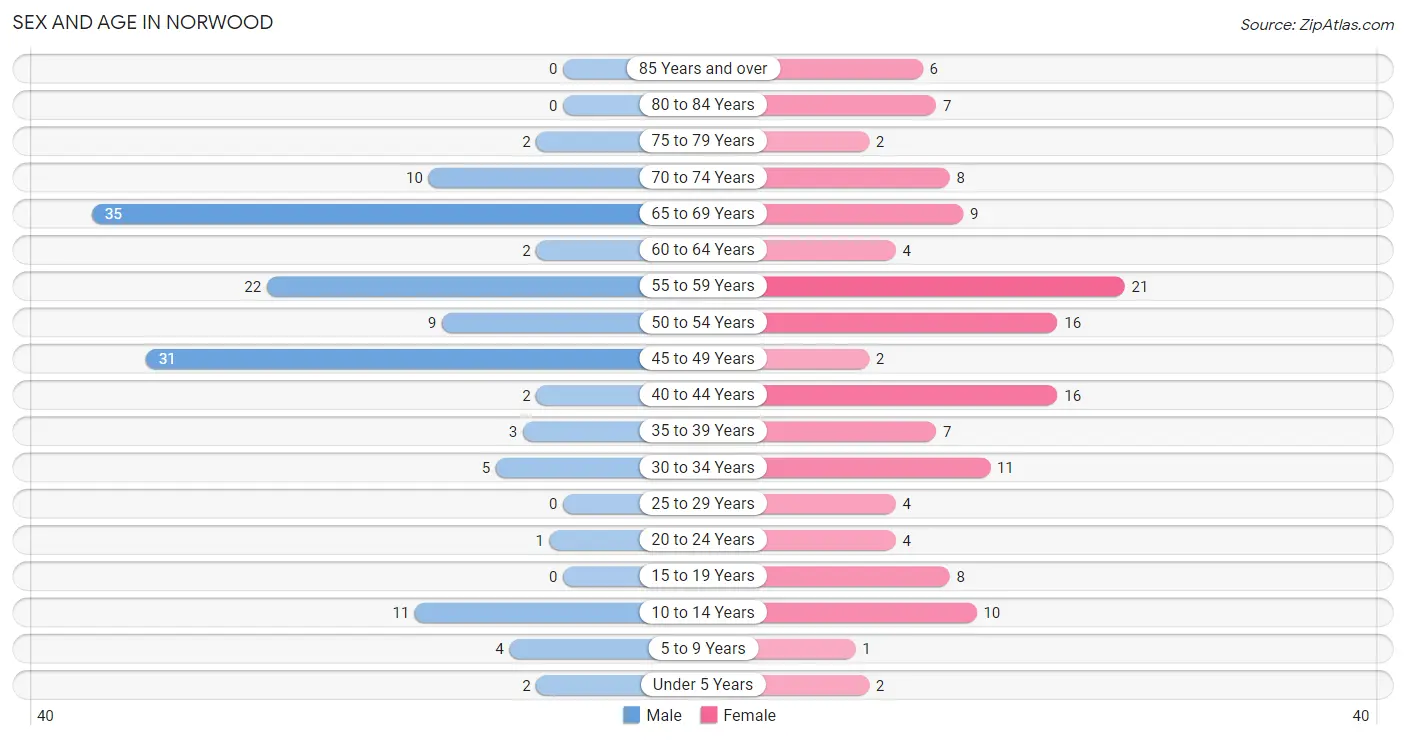
| Age Bracket | Male | Female |
| Under 5 Years | 2 (1.4%) | 2 (1.5%) |
| 5 to 9 Years | 4 (2.9%) | 1 (0.7%) |
| 10 to 14 Years | 11 (7.9%) | 10 (7.2%) |
| 15 to 19 Years | 0 (0.0%) | 8 (5.8%) |
| 20 to 24 Years | 1 (0.7%) | 4 (2.9%) |
| 25 to 29 Years | 0 (0.0%) | 4 (2.9%) |
| 30 to 34 Years | 5 (3.6%) | 11 (8.0%) |
| 35 to 39 Years | 3 (2.2%) | 7 (5.1%) |
| 40 to 44 Years | 2 (1.4%) | 16 (11.6%) |
| 45 to 49 Years | 31 (22.3%) | 2 (1.5%) |
| 50 to 54 Years | 9 (6.5%) | 16 (11.6%) |
| 55 to 59 Years | 22 (15.8%) | 21 (15.2%) |
| 60 to 64 Years | 2 (1.4%) | 4 (2.9%) |
| 65 to 69 Years | 35 (25.2%) | 9 (6.5%) |
| 70 to 74 Years | 10 (7.2%) | 8 (5.8%) |
| 75 to 79 Years | 2 (1.4%) | 2 (1.5%) |
| 80 to 84 Years | 0 (0.0%) | 7 (5.1%) |
| 85 Years and over | 0 (0.0%) | 6 (4.3%) |
| Total | 139 (100.0%) | 138 (100.0%) |
Families and Households in Norwood
Median Family Size in Norwood
The median family size in Norwood is 2.58 persons per family, with single female/mother families (11 | 15.3%) accounting for the largest median family size of 2.82 persons per family. On the other hand, single male/father families (24 | 33.3%) represent the smallest median family size with 2.33 persons per family.
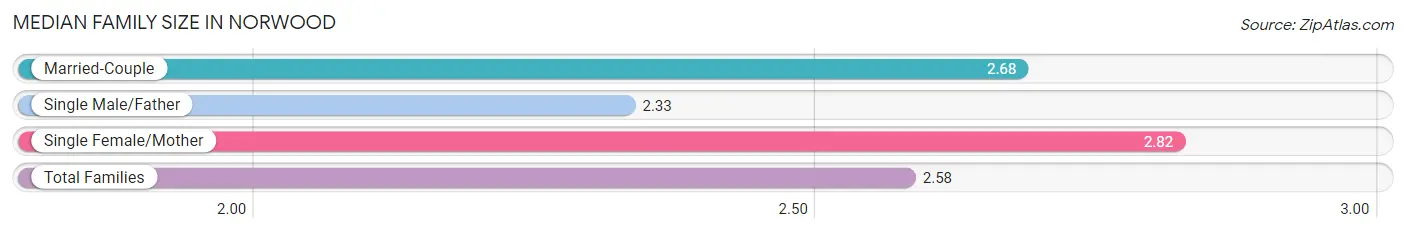
| Family Type | # Families | Family Size |
| Married-Couple | 37 (51.4%) | 2.68 |
| Single Male/Father | 24 (33.3%) | 2.33 |
| Single Female/Mother | 11 (15.3%) | 2.82 |
| Total Families | 72 (100.0%) | 2.58 |
Median Household Size in Norwood
The median household size in Norwood is 2.22 persons per household, with single male/father households (24 | 19.2%) accounting for the largest median household size of 3.25 persons per household. non-family households (53 | 42.4%) represent the smallest median household size with 1.21 persons per household.
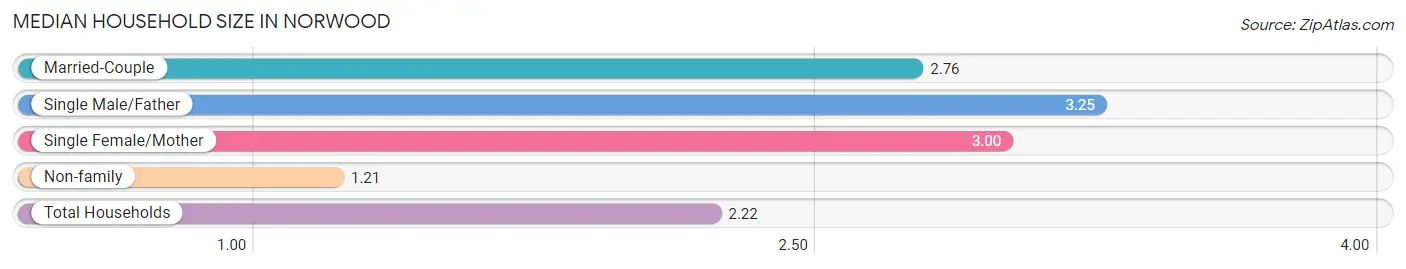
| Household Type | # Households | Household Size |
| Married-Couple | 37 (29.6%) | 2.76 |
| Single Male/Father | 24 (19.2%) | 3.25 |
| Single Female/Mother | 11 (8.8%) | 3.00 |
| Non-family | 53 (42.4%) | 1.21 |
| Total Households | 125 (100.0%) | 2.22 |
Household Size by Marriage Status in Norwood
Out of a total of 125 households in Norwood, 72 (57.6%) are family households, while 53 (42.4%) are nonfamily households. The most numerous type of family households are 3-person households, comprising 36, and the most common type of nonfamily households are 1-person households, comprising 48.
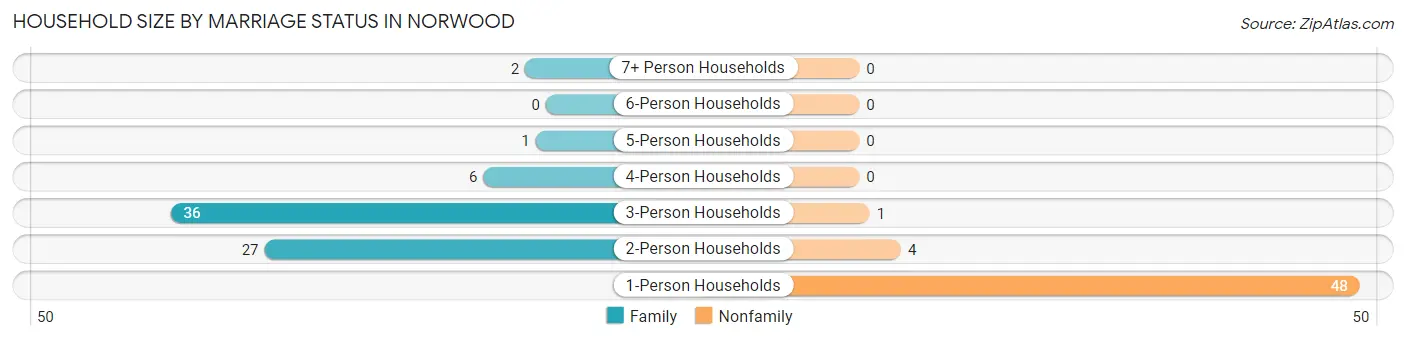
| Household Size | Family Households | Nonfamily Households |
| 1-Person Households | - | 48 (38.4%) |
| 2-Person Households | 27 (21.6%) | 4 (3.2%) |
| 3-Person Households | 36 (28.8%) | 1 (0.8%) |
| 4-Person Households | 6 (4.8%) | 0 (0.0%) |
| 5-Person Households | 1 (0.8%) | 0 (0.0%) |
| 6-Person Households | 0 (0.0%) | 0 (0.0%) |
| 7+ Person Households | 2 (1.6%) | 0 (0.0%) |
| Total | 72 (57.6%) | 53 (42.4%) |
Female Fertility in Norwood
Fertility by Age in Norwood
| Age Bracket | Women with Births | Births / 1,000 Women |
| 15 to 19 years | 0 (0.0%) | 0.0 |
| 20 to 34 years | 0 (0.0%) | 0.0 |
| 35 to 50 years | 0 (0.0%) | 0.0 |
| Total | 0 (0.0%) | 0.0 |
Fertility by Age by Marriage Status in Norwood
| Age Bracket | Married | Unmarried |
| 15 to 19 years | 0 (0.0%) | 0 (0.0%) |
| 20 to 34 years | 0 (0.0%) | 0 (0.0%) |
| 35 to 50 years | 0 (0.0%) | 0 (0.0%) |
| Total | 0 (0.0%) | 0 (0.0%) |
Fertility by Education in Norwood
| Educational Attainment | Women with Births | Births / 1,000 Women |
| Less than High School | 0 (0.0%) | 0.0 |
| High School Diploma | 0 (0.0%) | 0.0 |
| College or Associate's Degree | 0 (0.0%) | 0.0 |
| Bachelor's Degree | 0 (0.0%) | 0.0 |
| Graduate Degree | 0 (0.0%) | 0.0 |
| Total | 0 (0.0%) | 0.0 |
Fertility by Education by Marriage Status in Norwood
| Educational Attainment | Married | Unmarried |
| Less than High School | 0 (0.0%) | 0 (0.0%) |
| High School Diploma | 0 (0.0%) | 0 (0.0%) |
| College or Associate's Degree | 0 (0.0%) | 0 (0.0%) |
| Bachelor's Degree | 0 (0.0%) | 0 (0.0%) |
| Graduate Degree | 0 (0.0%) | 0 (0.0%) |
| Total | 0 (0.0%) | 0 (0.0%) |
Employment Characteristics in Norwood
Employment by Class of Employer in Norwood
Among the 73 employed individuals in Norwood, private company employees (42 | 57.5%), self-employed (not incorporated) (20 | 27.4%), and local government employees (6 | 8.2%) make up the most common classes of employment.
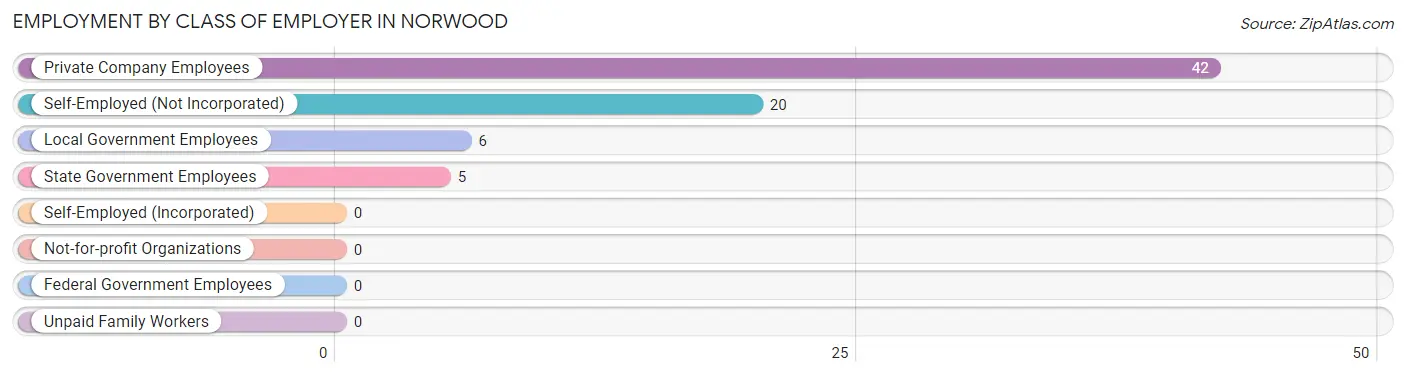
| Employer Class | # Employees | % Employees |
| Private Company Employees | 42 | 57.5% |
| Self-Employed (Incorporated) | 0 | 0.0% |
| Self-Employed (Not Incorporated) | 20 | 27.4% |
| Not-for-profit Organizations | 0 | 0.0% |
| Local Government Employees | 6 | 8.2% |
| State Government Employees | 5 | 6.9% |
| Federal Government Employees | 0 | 0.0% |
| Unpaid Family Workers | 0 | 0.0% |
| Total | 73 | 100.0% |
Employment Status by Age in Norwood
According to the labor force statistics for Norwood, out of the total population over 16 years of age (247), 31.2% or 77 individuals are in the labor force, with 2.6% or 2 of them unemployed. The age group with the highest labor force participation rate is 25 to 29 years, with 100.0% or 4 individuals in the labor force. Within the labor force, the 20 to 24 years age range has the highest percentage of unemployed individuals, with 66.7% or 2 of them being unemployed.
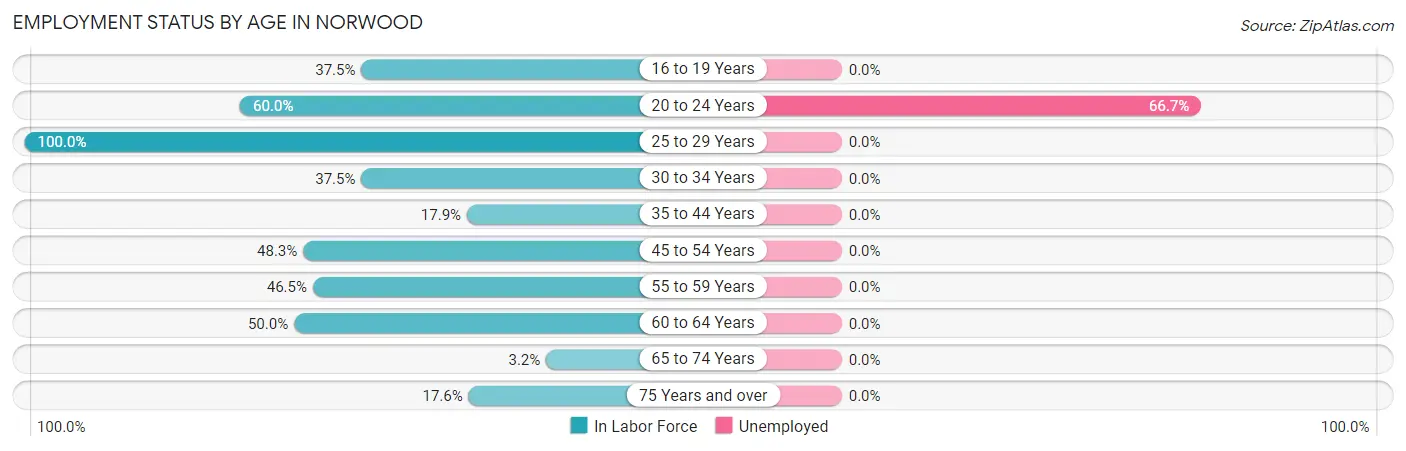
| Age Bracket | In Labor Force | Unemployed |
| 16 to 19 Years | 3 (37.5%) | 0 (0.0%) |
| 20 to 24 Years | 3 (60.0%) | 2 (66.7%) |
| 25 to 29 Years | 4 (100.0%) | 0 (0.0%) |
| 30 to 34 Years | 6 (37.5%) | 0 (0.0%) |
| 35 to 44 Years | 5 (17.9%) | 0 (0.0%) |
| 45 to 54 Years | 28 (48.3%) | 0 (0.0%) |
| 55 to 59 Years | 20 (46.5%) | 0 (0.0%) |
| 60 to 64 Years | 3 (50.0%) | 0 (0.0%) |
| 65 to 74 Years | 2 (3.2%) | 0 (0.0%) |
| 75 Years and over | 3 (17.6%) | 0 (0.0%) |
| Total | 77 (31.2%) | 2 (2.6%) |
Employment Status by Educational Attainment in Norwood
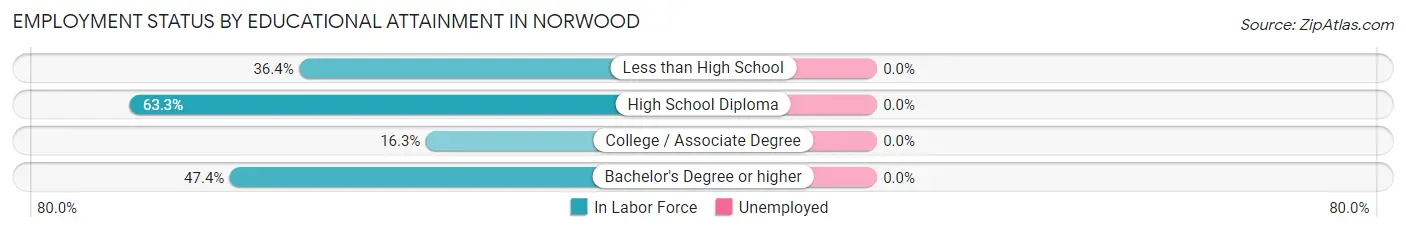
| Educational Attainment | In Labor Force | Unemployed |
| Less than High School | 12 (36.4%) | 0 (0.0%) |
| High School Diploma | 38 (63.3%) | 0 (0.0%) |
| College / Associate Degree | 7 (16.3%) | 0 (0.0%) |
| Bachelor's Degree or higher | 9 (47.4%) | 0 (0.0%) |
| Total | 66 (42.6%) | 0 (0.0%) |
Employment Occupations by Sex in Norwood
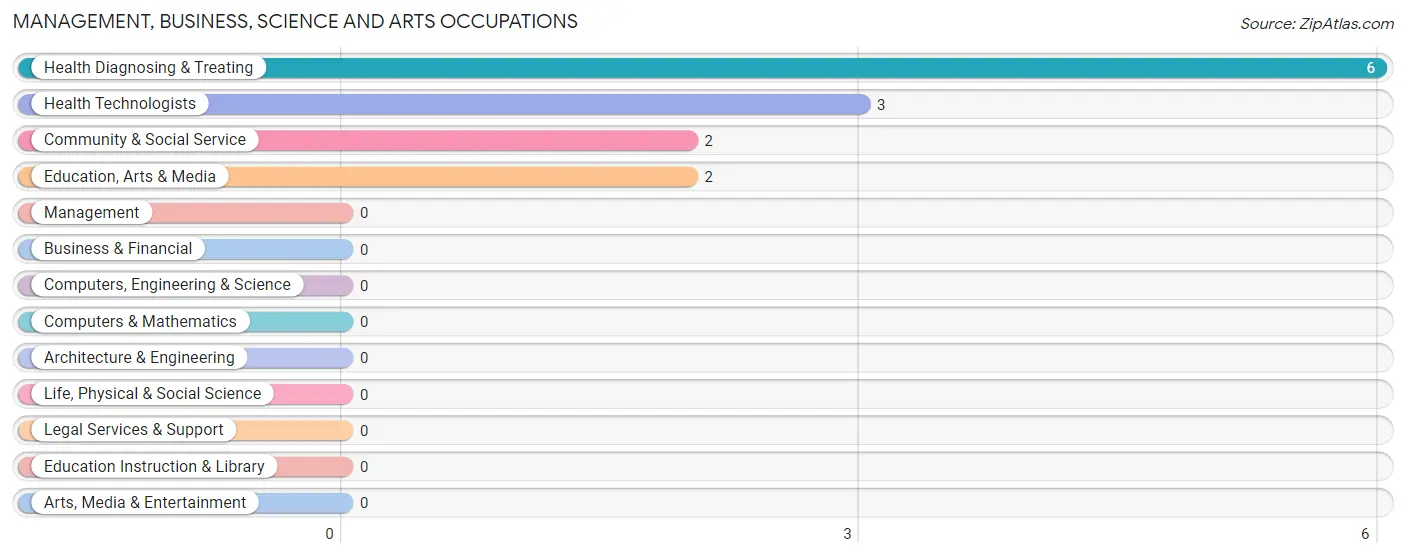
Management, Business, Science and Arts Occupations
The most common Management, Business, Science and Arts occupations in Norwood are Health Diagnosing & Treating (6 | 8.0%), Health Technologists (3 | 4.0%), Community & Social Service (2 | 2.7%), and Education, Arts & Media (2 | 2.7%).
Management, Business, Science and Arts Occupations by Sex
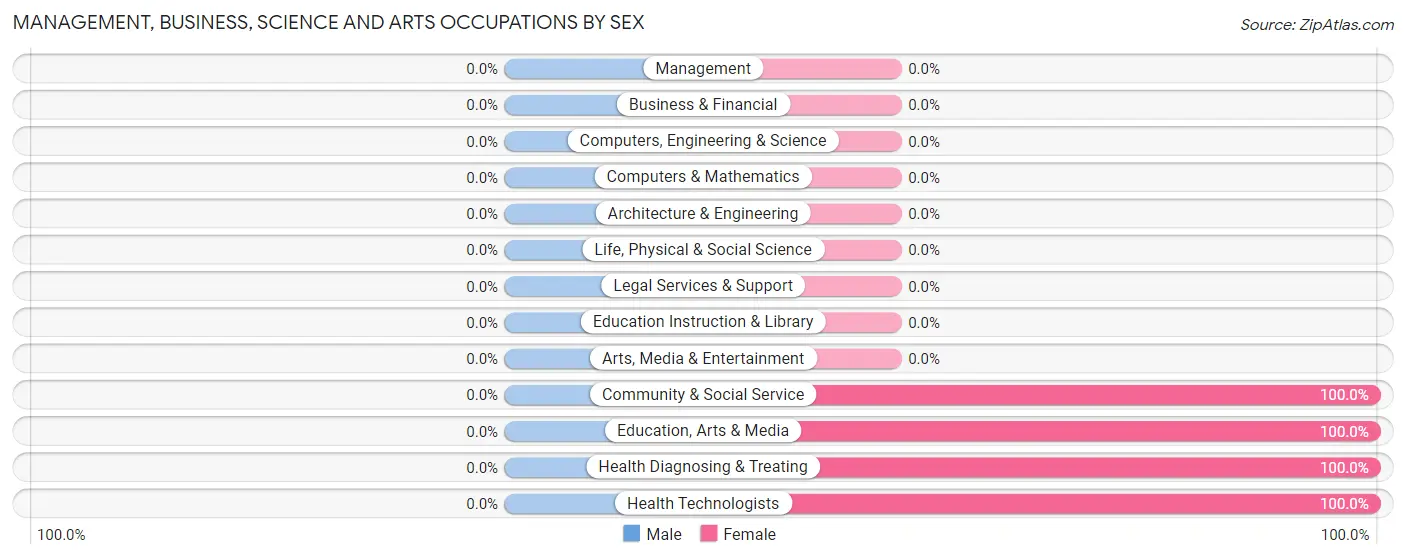
| Occupation | Male | Female |
| Management | 0 (0.0%) | 0 (0.0%) |
| Business & Financial | 0 (0.0%) | 0 (0.0%) |
| Computers, Engineering & Science | 0 (0.0%) | 0 (0.0%) |
| Computers & Mathematics | 0 (0.0%) | 0 (0.0%) |
| Architecture & Engineering | 0 (0.0%) | 0 (0.0%) |
| Life, Physical & Social Science | 0 (0.0%) | 0 (0.0%) |
| Community & Social Service | 0 (0.0%) | 2 (100.0%) |
| Education, Arts & Media | 0 (0.0%) | 2 (100.0%) |
| Legal Services & Support | 0 (0.0%) | 0 (0.0%) |
| Education Instruction & Library | 0 (0.0%) | 0 (0.0%) |
| Arts, Media & Entertainment | 0 (0.0%) | 0 (0.0%) |
| Health Diagnosing & Treating | 0 (0.0%) | 6 (100.0%) |
| Health Technologists | 0 (0.0%) | 3 (100.0%) |
| Total (Category) | 0 (0.0%) | 8 (100.0%) |
| Total (Overall) | 45 (60.0%) | 30 (40.0%) |
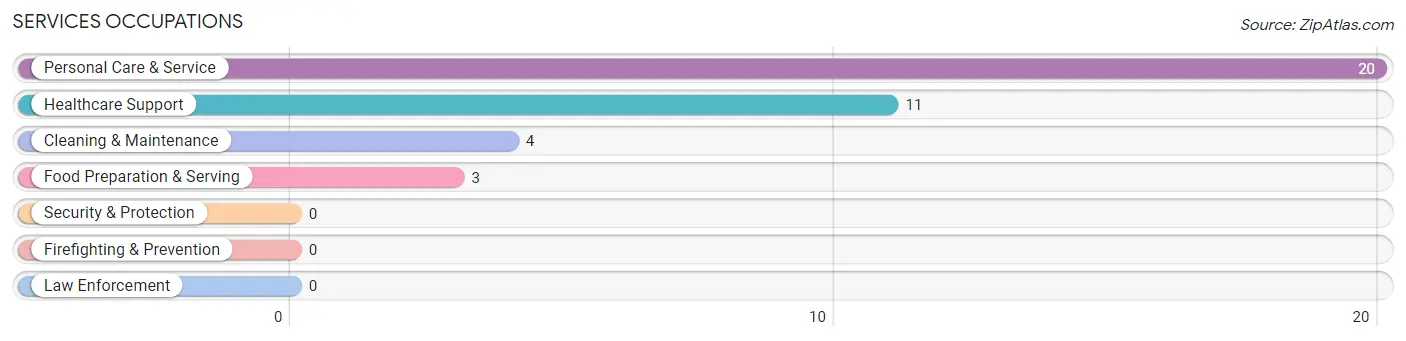
Services Occupations
The most common Services occupations in Norwood are Personal Care & Service (20 | 26.7%), Healthcare Support (11 | 14.7%), Cleaning & Maintenance (4 | 5.3%), and Food Preparation & Serving (3 | 4.0%).
Services Occupations by Sex
Within the Services occupations in Norwood, the most male-oriented occupations are Personal Care & Service (100.0%), and Cleaning & Maintenance (75.0%), while the most female-oriented occupations are Healthcare Support (100.0%), Food Preparation & Serving (100.0%), and Cleaning & Maintenance (25.0%).
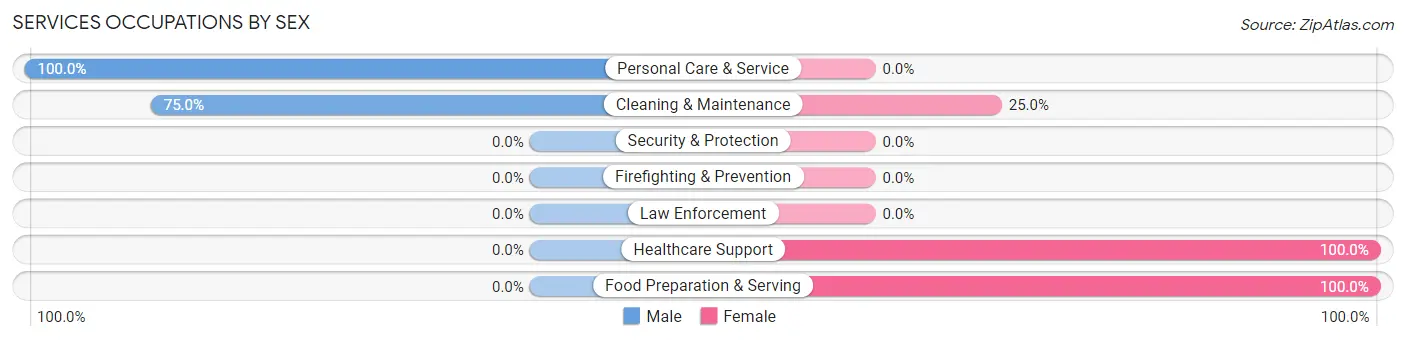
| Occupation | Male | Female |
| Healthcare Support | 0 (0.0%) | 11 (100.0%) |
| Security & Protection | 0 (0.0%) | 0 (0.0%) |
| Firefighting & Prevention | 0 (0.0%) | 0 (0.0%) |
| Law Enforcement | 0 (0.0%) | 0 (0.0%) |
| Food Preparation & Serving | 0 (0.0%) | 3 (100.0%) |
| Cleaning & Maintenance | 3 (75.0%) | 1 (25.0%) |
| Personal Care & Service | 20 (100.0%) | 0 (0.0%) |
| Total (Category) | 23 (60.5%) | 15 (39.5%) |
| Total (Overall) | 45 (60.0%) | 30 (40.0%) |
Sales and Office Occupations
The most common Sales and Office occupations in Norwood are Office & Administration (5 | 6.7%), and Sales & Related (1 | 1.3%).
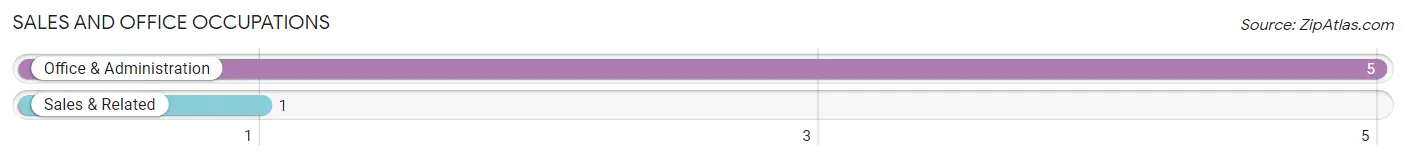
Sales and Office Occupations by Sex
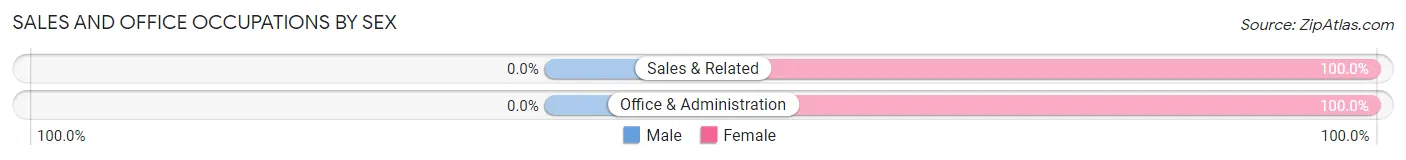
| Occupation | Male | Female |
| Sales & Related | 0 (0.0%) | 1 (100.0%) |
| Office & Administration | 0 (0.0%) | 5 (100.0%) |
| Total (Category) | 0 (0.0%) | 6 (100.0%) |
| Total (Overall) | 45 (60.0%) | 30 (40.0%) |
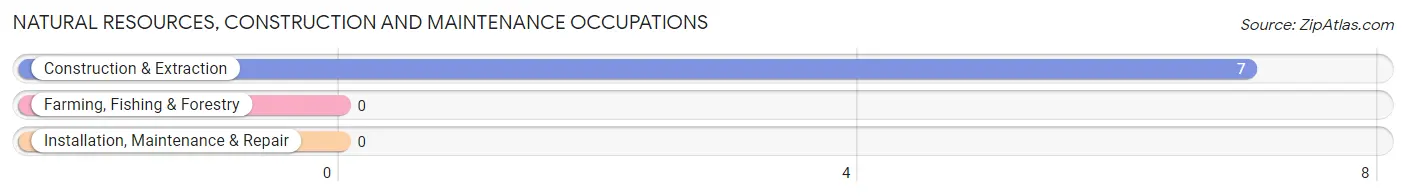
Natural Resources, Construction and Maintenance Occupations
The most common Natural Resources, Construction and Maintenance occupations in Norwood are , and Construction & Extraction (7 | 9.3%).
Natural Resources, Construction and Maintenance Occupations by Sex
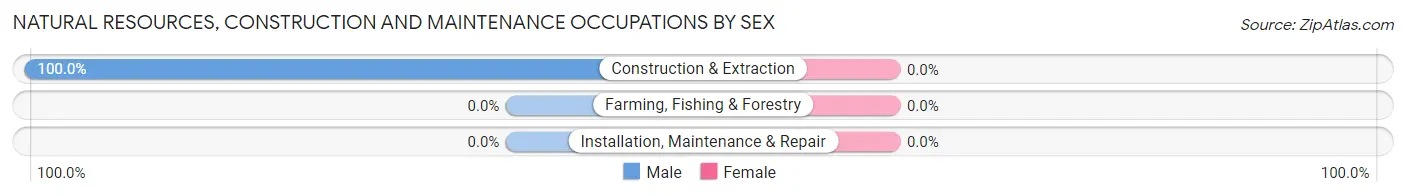
| Occupation | Male | Female |
| Farming, Fishing & Forestry | 0 (0.0%) | 0 (0.0%) |
| Construction & Extraction | 7 (100.0%) | 0 (0.0%) |
| Installation, Maintenance & Repair | 0 (0.0%) | 0 (0.0%) |
| Total (Category) | 7 (100.0%) | 0 (0.0%) |
| Total (Overall) | 45 (60.0%) | 30 (40.0%) |
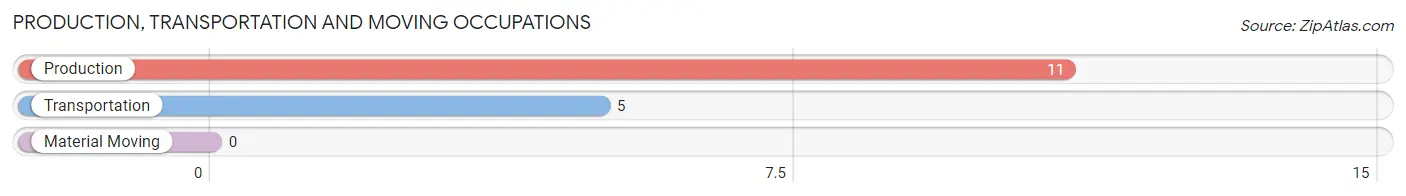
Production, Transportation and Moving Occupations
The most common Production, Transportation and Moving occupations in Norwood are Production (11 | 14.7%), and Transportation (5 | 6.7%).
Production, Transportation and Moving Occupations by Sex
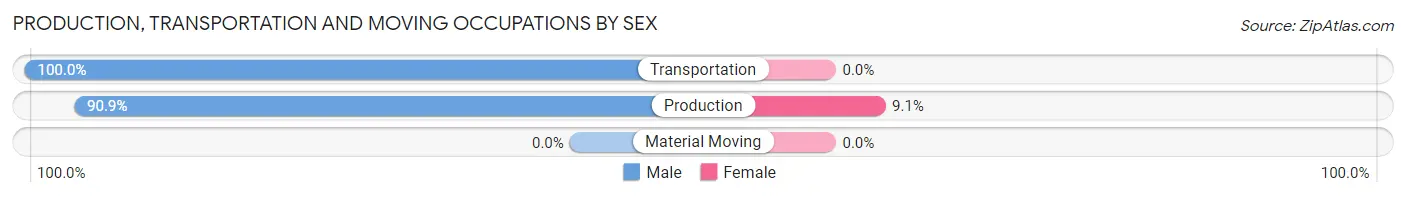
| Occupation | Male | Female |
| Production | 10 (90.9%) | 1 (9.1%) |
| Transportation | 5 (100.0%) | 0 (0.0%) |
| Material Moving | 0 (0.0%) | 0 (0.0%) |
| Total (Category) | 15 (93.8%) | 1 (6.2%) |
| Total (Overall) | 45 (60.0%) | 30 (40.0%) |
Employment Industries by Sex in Norwood
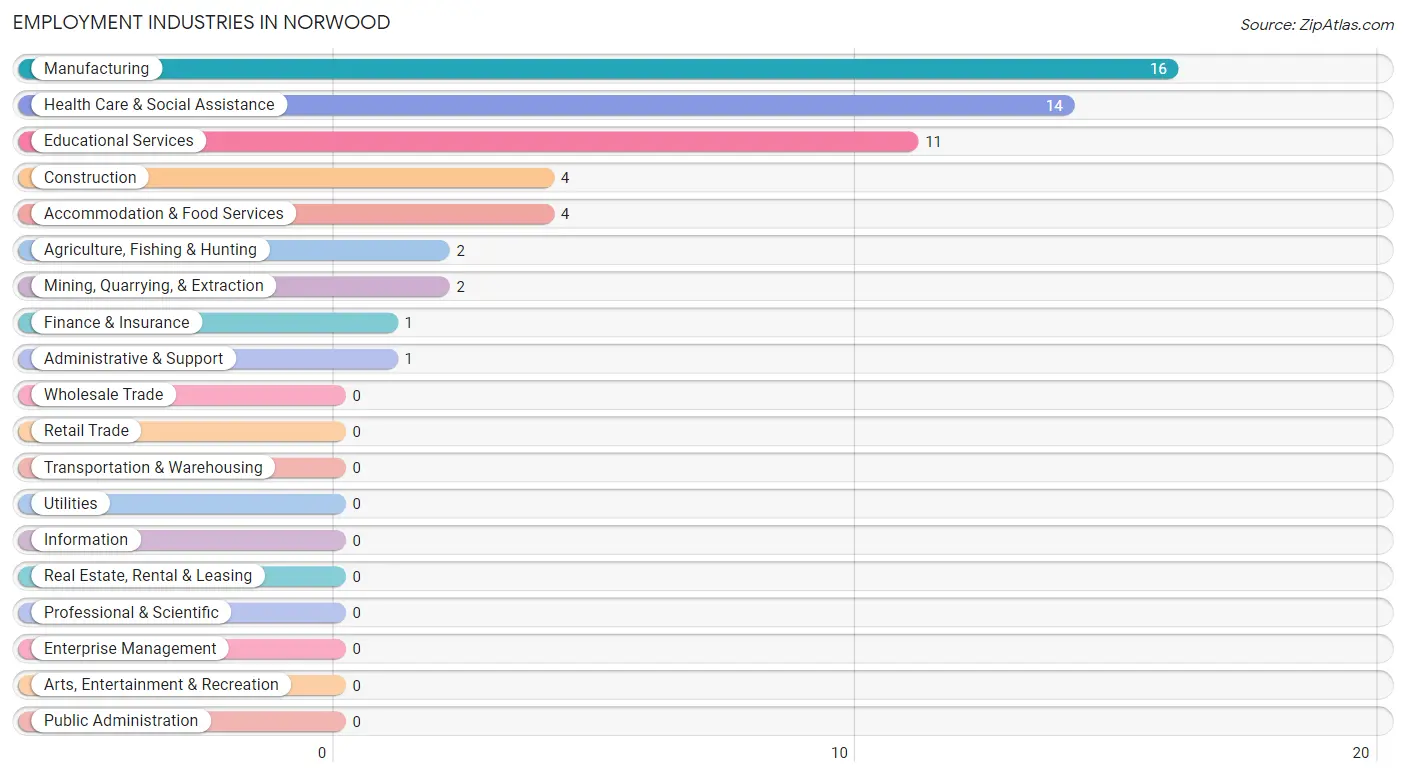
Employment Industries in Norwood
The major employment industries in Norwood include Manufacturing (16 | 21.3%), Health Care & Social Assistance (14 | 18.7%), Educational Services (11 | 14.7%), Construction (4 | 5.3%), and Accommodation & Food Services (4 | 5.3%).
Employment Industries by Sex in Norwood
The Norwood industries that see more men than women are Agriculture, Fishing & Hunting (100.0%), Mining, Quarrying, & Extraction (100.0%), and Construction (100.0%), whereas the industries that tend to have a higher number of women are Finance & Insurance (100.0%), Health Care & Social Assistance (100.0%), and Accommodation & Food Services (100.0%).
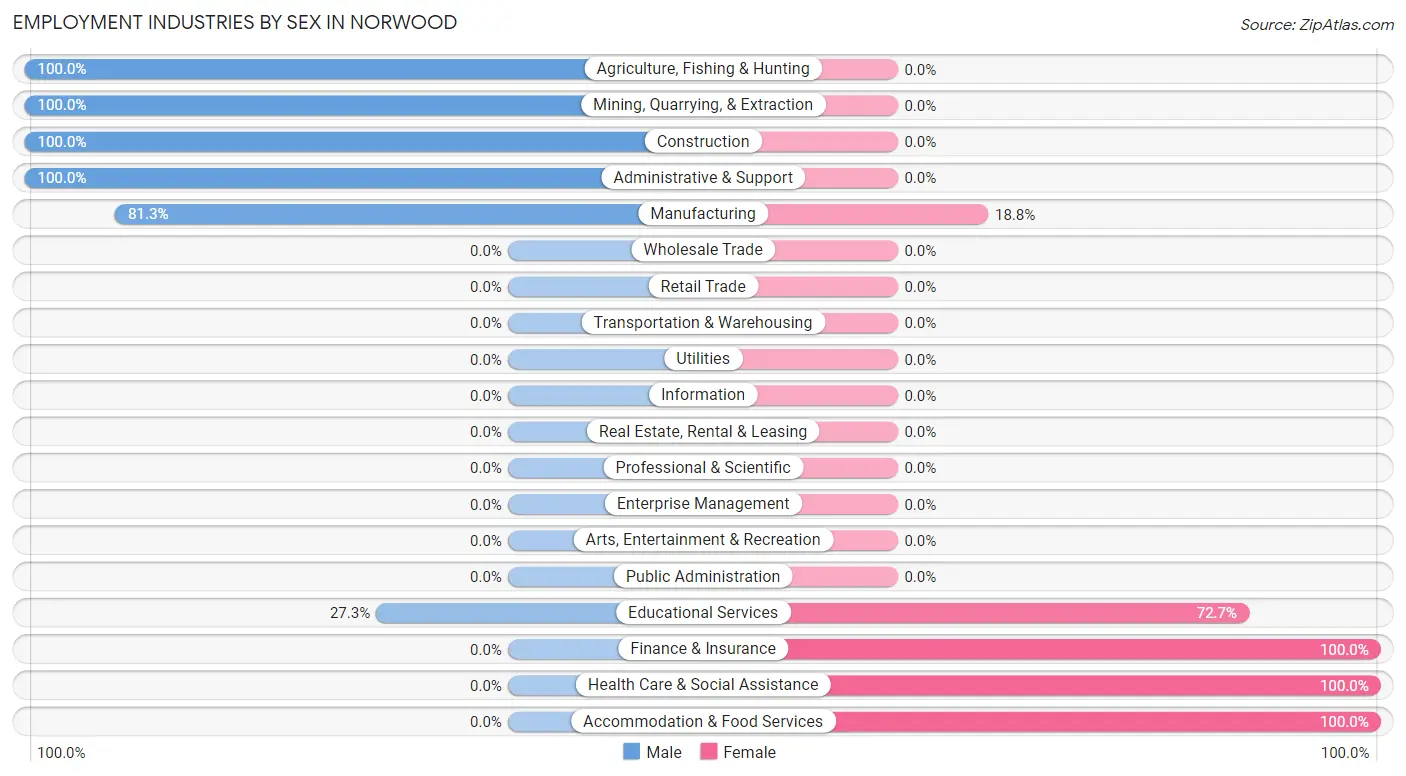
| Industry | Male | Female |
| Agriculture, Fishing & Hunting | 2 (100.0%) | 0 (0.0%) |
| Mining, Quarrying, & Extraction | 2 (100.0%) | 0 (0.0%) |
| Construction | 4 (100.0%) | 0 (0.0%) |
| Manufacturing | 13 (81.2%) | 3 (18.8%) |
| Wholesale Trade | 0 (0.0%) | 0 (0.0%) |
| Retail Trade | 0 (0.0%) | 0 (0.0%) |
| Transportation & Warehousing | 0 (0.0%) | 0 (0.0%) |
| Utilities | 0 (0.0%) | 0 (0.0%) |
| Information | 0 (0.0%) | 0 (0.0%) |
| Finance & Insurance | 0 (0.0%) | 1 (100.0%) |
| Real Estate, Rental & Leasing | 0 (0.0%) | 0 (0.0%) |
| Professional & Scientific | 0 (0.0%) | 0 (0.0%) |
| Enterprise Management | 0 (0.0%) | 0 (0.0%) |
| Administrative & Support | 1 (100.0%) | 0 (0.0%) |
| Educational Services | 3 (27.3%) | 8 (72.7%) |
| Health Care & Social Assistance | 0 (0.0%) | 14 (100.0%) |
| Arts, Entertainment & Recreation | 0 (0.0%) | 0 (0.0%) |
| Accommodation & Food Services | 0 (0.0%) | 4 (100.0%) |
| Public Administration | 0 (0.0%) | 0 (0.0%) |
| Total | 45 (60.0%) | 30 (40.0%) |
Education in Norwood
School Enrollment in Norwood
The most common levels of schooling among the 35 students in Norwood are middle school (21 | 60.0%), high school (9 | 25.7%), and elementary school (5 | 14.3%).
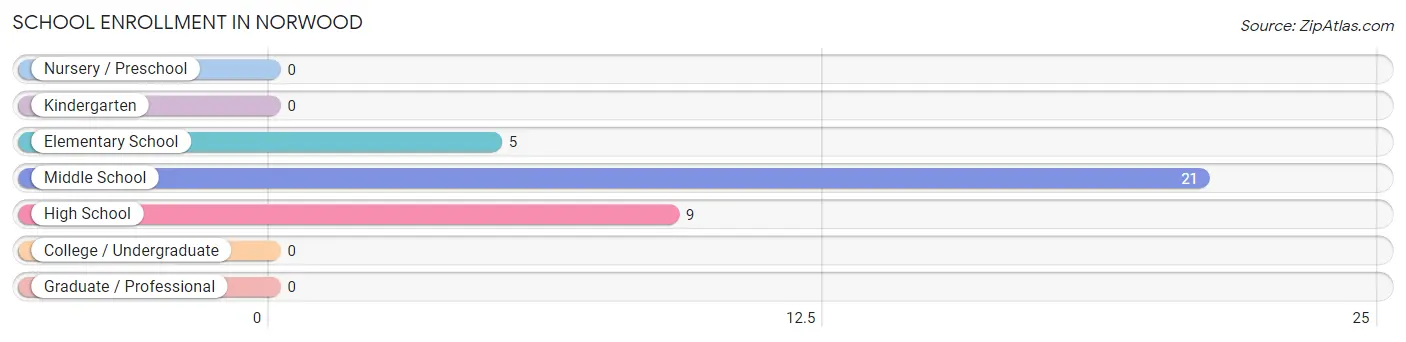
| School Level | # Students | % Students |
| Nursery / Preschool | 0 | 0.0% |
| Kindergarten | 0 | 0.0% |
| Elementary School | 5 | 14.3% |
| Middle School | 21 | 60.0% |
| High School | 9 | 25.7% |
| College / Undergraduate | 0 | 0.0% |
| Graduate / Professional | 0 | 0.0% |
| Total | 35 | 100.0% |
School Enrollment by Age by Funding Source in Norwood
Out of a total of 35 students who are enrolled in schools in Norwood, 19 (54.3%) attend a private institution, while the remaining 16 (45.7%) are enrolled in public schools. The age group of 18 to 19 year olds has the highest likelihood of being enrolled in private schools, with 3 (100.0% in the age bracket) enrolled. Conversely, the age group of 15 to 17 year olds has the lowest likelihood of being enrolled in a private school, with 5 (100.0% in the age bracket) attending a public institution.
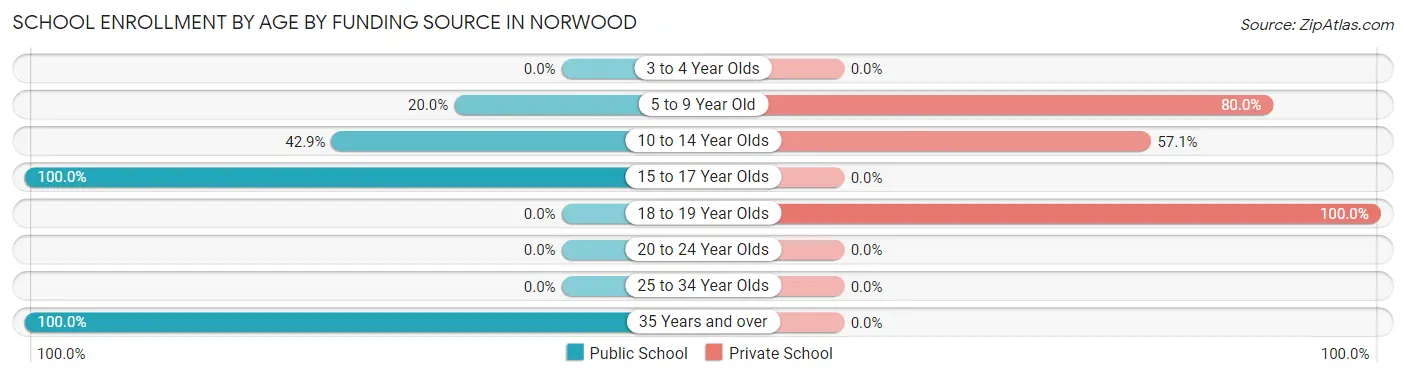
| Age Bracket | Public School | Private School |
| 3 to 4 Year Olds | 0 (0.0%) | 0 (0.0%) |
| 5 to 9 Year Old | 1 (20.0%) | 4 (80.0%) |
| 10 to 14 Year Olds | 9 (42.9%) | 12 (57.1%) |
| 15 to 17 Year Olds | 5 (100.0%) | 0 (0.0%) |
| 18 to 19 Year Olds | 0 (0.0%) | 3 (100.0%) |
| 20 to 24 Year Olds | 0 (0.0%) | 0 (0.0%) |
| 25 to 34 Year Olds | 0 (0.0%) | 0 (0.0%) |
| 35 Years and over | 1 (100.0%) | 0 (0.0%) |
| Total | 16 (45.7%) | 19 (54.3%) |
Educational Attainment by Field of Study in Norwood
Business (13 | 52.0%), education (6 | 24.0%), and arts & humanities (6 | 24.0%) are the most common fields of study among 25 individuals in Norwood who have obtained a bachelor's degree or higher.
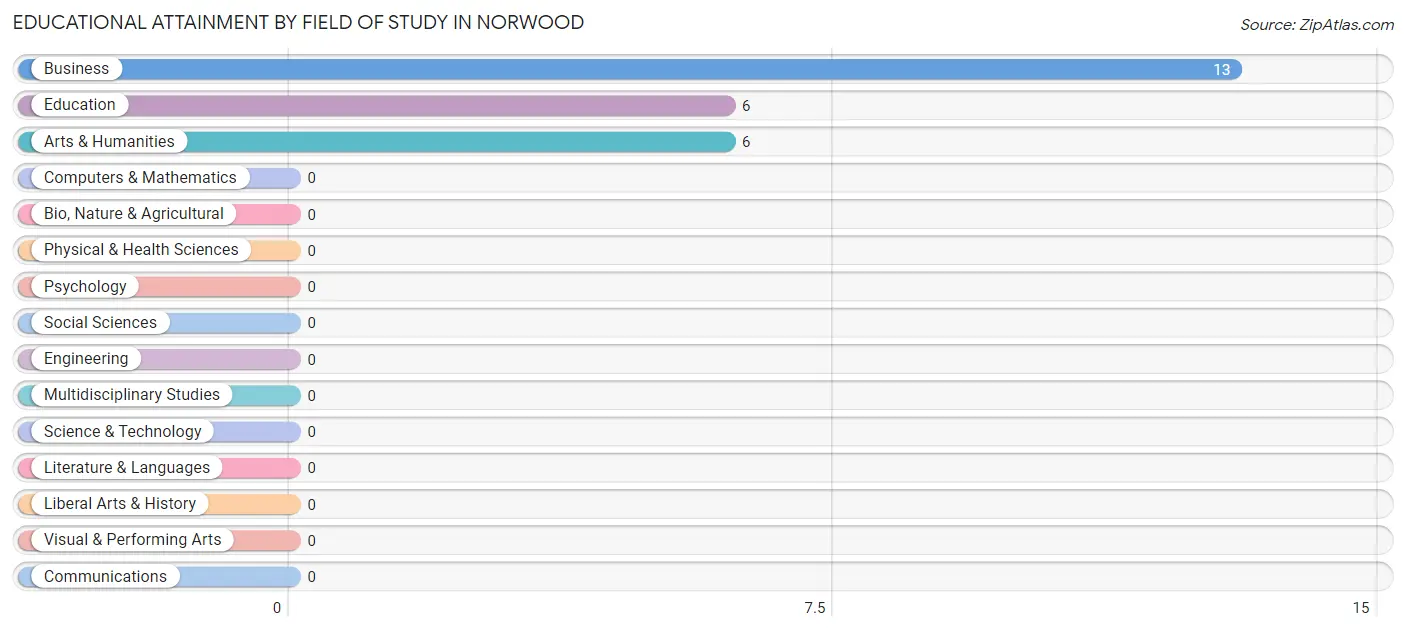
| Field of Study | # Graduates | % Graduates |
| Computers & Mathematics | 0 | 0.0% |
| Bio, Nature & Agricultural | 0 | 0.0% |
| Physical & Health Sciences | 0 | 0.0% |
| Psychology | 0 | 0.0% |
| Social Sciences | 0 | 0.0% |
| Engineering | 0 | 0.0% |
| Multidisciplinary Studies | 0 | 0.0% |
| Science & Technology | 0 | 0.0% |
| Business | 13 | 52.0% |
| Education | 6 | 24.0% |
| Literature & Languages | 0 | 0.0% |
| Liberal Arts & History | 0 | 0.0% |
| Visual & Performing Arts | 0 | 0.0% |
| Communications | 0 | 0.0% |
| Arts & Humanities | 6 | 24.0% |
| Total | 25 | 100.0% |
Transportation & Commute in Norwood
Vehicle Availability by Sex in Norwood
The most prevalent vehicle ownership categories in Norwood are males with 2 vehicles (23, accounting for 52.3%) and females with 2 vehicles (4, making up 79.3%).
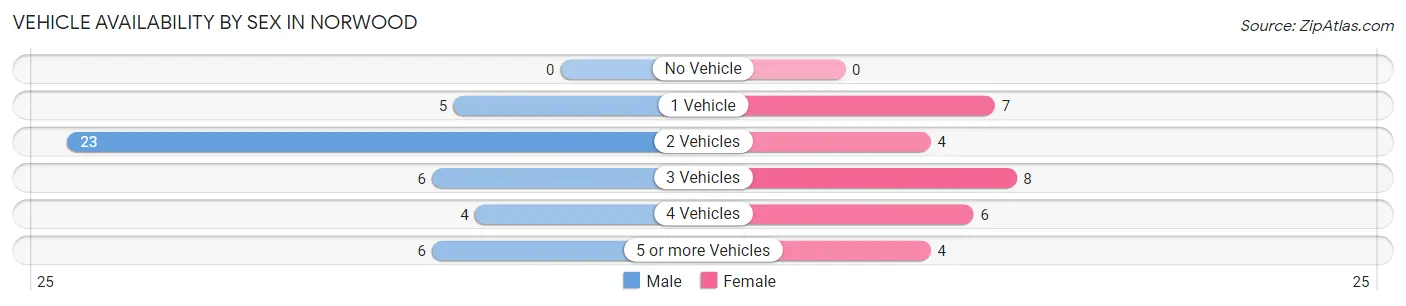
| Vehicles Available | Male | Female |
| No Vehicle | 0 (0.0%) | 0 (0.0%) |
| 1 Vehicle | 5 (11.4%) | 7 (24.1%) |
| 2 Vehicles | 23 (52.3%) | 4 (13.8%) |
| 3 Vehicles | 6 (13.6%) | 8 (27.6%) |
| 4 Vehicles | 4 (9.1%) | 6 (20.7%) |
| 5 or more Vehicles | 6 (13.6%) | 4 (13.8%) |
| Total | 44 (100.0%) | 29 (100.0%) |
Commute Time in Norwood
The most frequently occuring commute durations in Norwood are 15 to 19 minutes (15 commuters, 28.3%), 30 to 34 minutes (12 commuters, 22.6%), and 5 to 9 minutes (8 commuters, 15.1%).
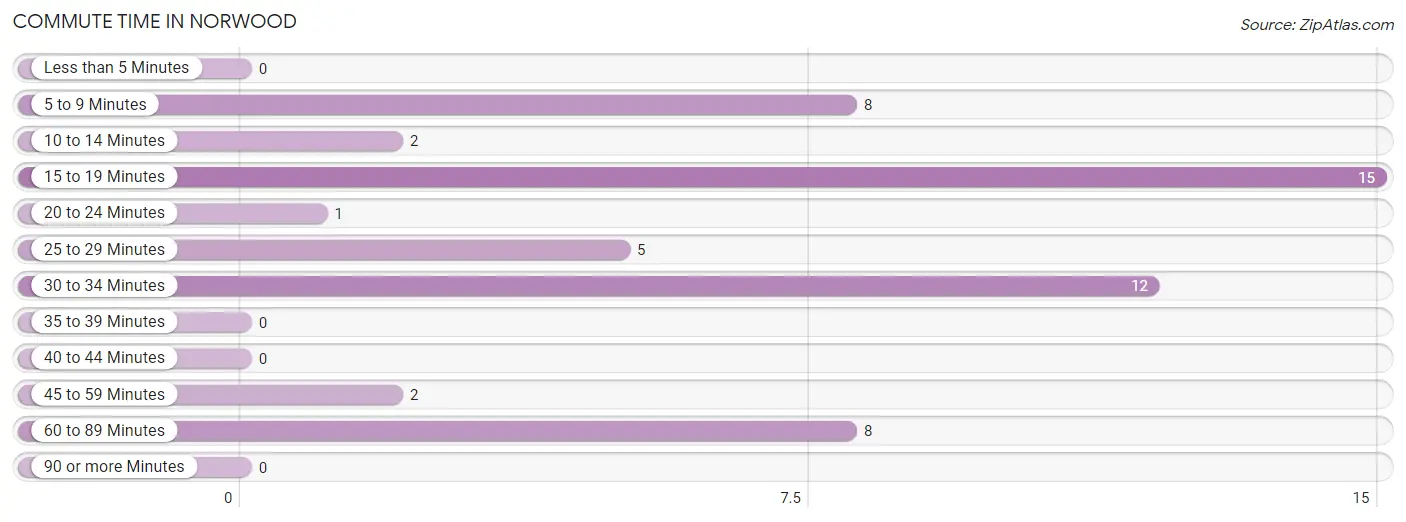
| Commute Time | # Commuters | % Commuters |
| Less than 5 Minutes | 0 | 0.0% |
| 5 to 9 Minutes | 8 | 15.1% |
| 10 to 14 Minutes | 2 | 3.8% |
| 15 to 19 Minutes | 15 | 28.3% |
| 20 to 24 Minutes | 1 | 1.9% |
| 25 to 29 Minutes | 5 | 9.4% |
| 30 to 34 Minutes | 12 | 22.6% |
| 35 to 39 Minutes | 0 | 0.0% |
| 40 to 44 Minutes | 0 | 0.0% |
| 45 to 59 Minutes | 2 | 3.8% |
| 60 to 89 Minutes | 8 | 15.1% |
| 90 or more Minutes | 0 | 0.0% |
Commute Time by Sex in Norwood
The most common commute times in Norwood are 60 to 89 minutes (8 commuters, 33.3%) for males and 15 to 19 minutes (9 commuters, 31.0%) for females.
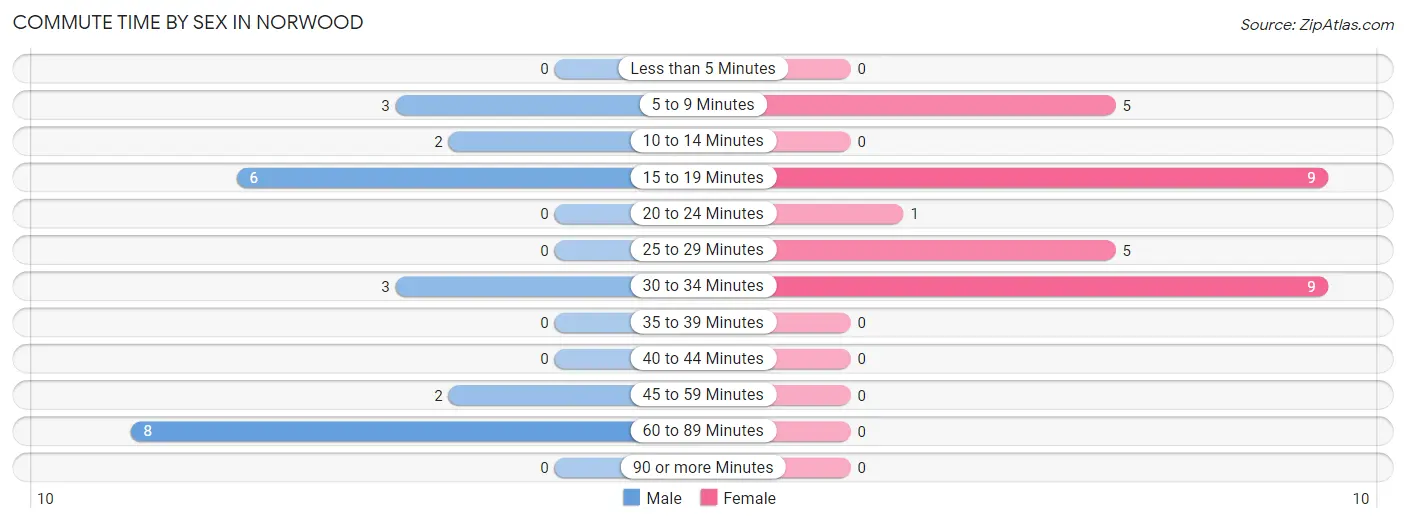
| Commute Time | Male | Female |
| Less than 5 Minutes | 0 (0.0%) | 0 (0.0%) |
| 5 to 9 Minutes | 3 (12.5%) | 5 (17.2%) |
| 10 to 14 Minutes | 2 (8.3%) | 0 (0.0%) |
| 15 to 19 Minutes | 6 (25.0%) | 9 (31.0%) |
| 20 to 24 Minutes | 0 (0.0%) | 1 (3.5%) |
| 25 to 29 Minutes | 0 (0.0%) | 5 (17.2%) |
| 30 to 34 Minutes | 3 (12.5%) | 9 (31.0%) |
| 35 to 39 Minutes | 0 (0.0%) | 0 (0.0%) |
| 40 to 44 Minutes | 0 (0.0%) | 0 (0.0%) |
| 45 to 59 Minutes | 2 (8.3%) | 0 (0.0%) |
| 60 to 89 Minutes | 8 (33.3%) | 0 (0.0%) |
| 90 or more Minutes | 0 (0.0%) | 0 (0.0%) |
Time of Departure to Work by Sex in Norwood
The most frequent times of departure to work in Norwood are 5:30 AM to 5:59 AM (7, 29.2%) for males and 7:30 AM to 7:59 AM (7, 24.1%) for females.
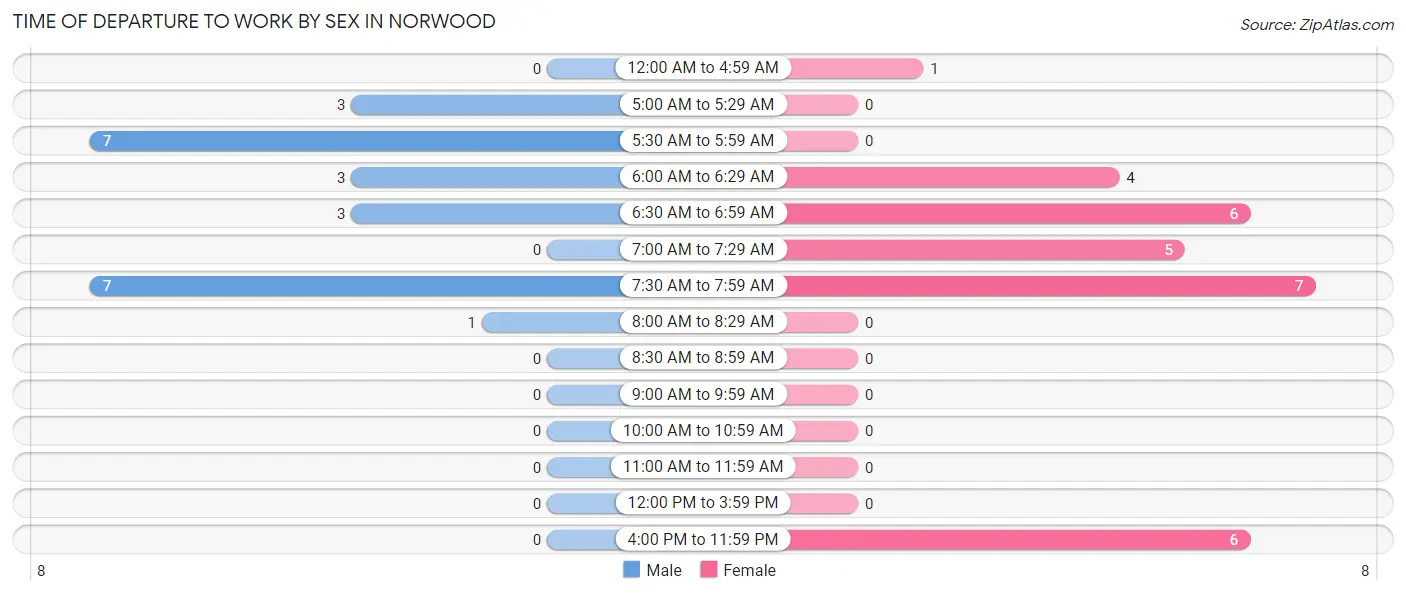
| Time of Departure | Male | Female |
| 12:00 AM to 4:59 AM | 0 (0.0%) | 1 (3.5%) |
| 5:00 AM to 5:29 AM | 3 (12.5%) | 0 (0.0%) |
| 5:30 AM to 5:59 AM | 7 (29.2%) | 0 (0.0%) |
| 6:00 AM to 6:29 AM | 3 (12.5%) | 4 (13.8%) |
| 6:30 AM to 6:59 AM | 3 (12.5%) | 6 (20.7%) |
| 7:00 AM to 7:29 AM | 0 (0.0%) | 5 (17.2%) |
| 7:30 AM to 7:59 AM | 7 (29.2%) | 7 (24.1%) |
| 8:00 AM to 8:29 AM | 1 (4.2%) | 0 (0.0%) |
| 8:30 AM to 8:59 AM | 0 (0.0%) | 0 (0.0%) |
| 9:00 AM to 9:59 AM | 0 (0.0%) | 0 (0.0%) |
| 10:00 AM to 10:59 AM | 0 (0.0%) | 0 (0.0%) |
| 11:00 AM to 11:59 AM | 0 (0.0%) | 0 (0.0%) |
| 12:00 PM to 3:59 PM | 0 (0.0%) | 0 (0.0%) |
| 4:00 PM to 11:59 PM | 0 (0.0%) | 6 (20.7%) |
| Total | 24 (100.0%) | 29 (100.0%) |
Housing Occupancy in Norwood
Occupancy by Ownership in Norwood
Of the total 125 dwellings in Norwood, owner-occupied units account for 83 (66.4%), while renter-occupied units make up 42 (33.6%).
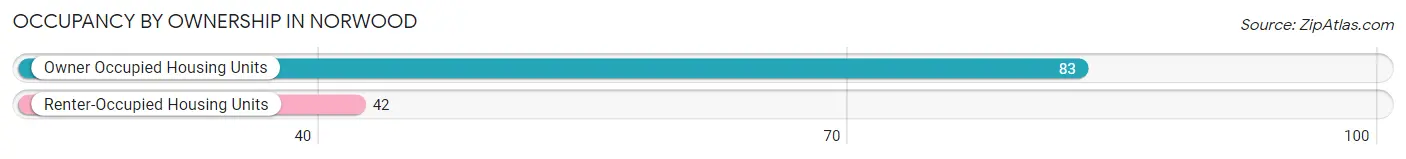
| Occupancy | # Housing Units | % Housing Units |
| Owner Occupied Housing Units | 83 | 66.4% |
| Renter-Occupied Housing Units | 42 | 33.6% |
| Total Occupied Housing Units | 125 | 100.0% |
Occupancy by Household Size in Norwood
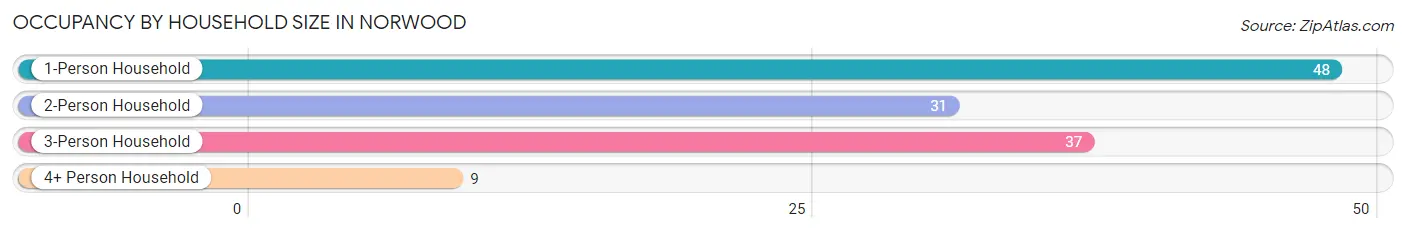
| Household Size | # Housing Units | % Housing Units |
| 1-Person Household | 48 | 38.4% |
| 2-Person Household | 31 | 24.8% |
| 3-Person Household | 37 | 29.6% |
| 4+ Person Household | 9 | 7.2% |
| Total Housing Units | 125 | 100.0% |
Occupancy by Ownership by Household Size in Norwood
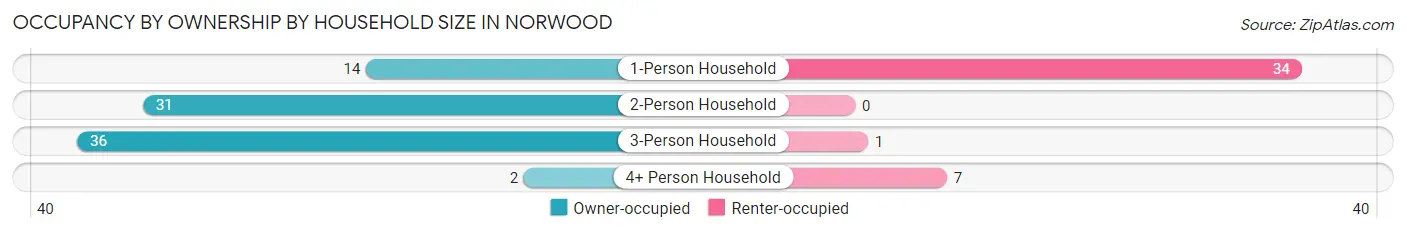
| Household Size | Owner-occupied | Renter-occupied |
| 1-Person Household | 14 (29.2%) | 34 (70.8%) |
| 2-Person Household | 31 (100.0%) | 0 (0.0%) |
| 3-Person Household | 36 (97.3%) | 1 (2.7%) |
| 4+ Person Household | 2 (22.2%) | 7 (77.8%) |
| Total Housing Units | 83 (66.4%) | 42 (33.6%) |
Occupancy by Educational Attainment in Norwood
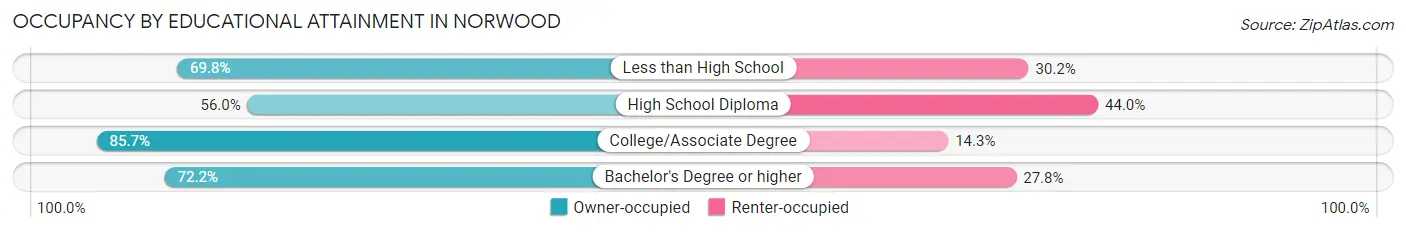
| Household Size | Owner-occupied | Renter-occupied |
| Less than High School | 30 (69.8%) | 13 (30.2%) |
| High School Diploma | 28 (56.0%) | 22 (44.0%) |
| College/Associate Degree | 12 (85.7%) | 2 (14.3%) |
| Bachelor's Degree or higher | 13 (72.2%) | 5 (27.8%) |
Occupancy by Age of Householder in Norwood
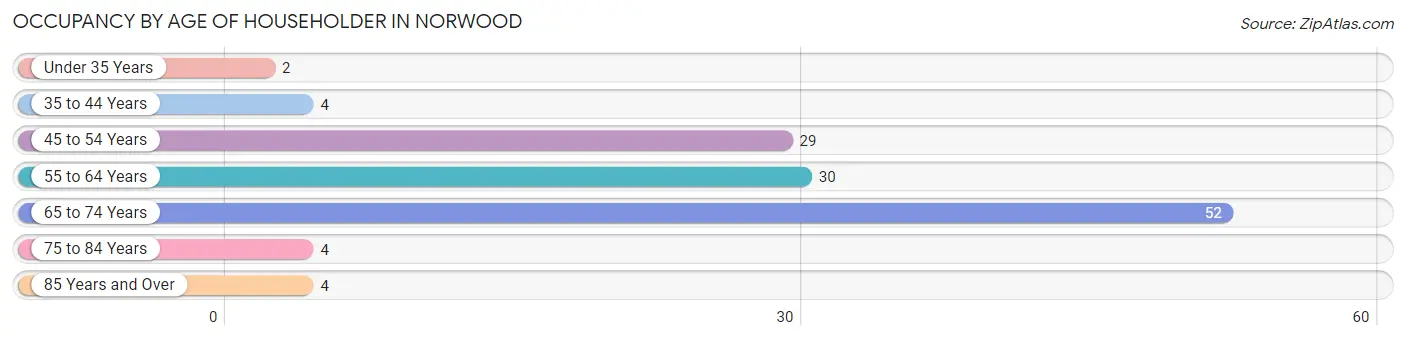
| Age Bracket | # Households | % Households |
| Under 35 Years | 2 | 1.6% |
| 35 to 44 Years | 4 | 3.2% |
| 45 to 54 Years | 29 | 23.2% |
| 55 to 64 Years | 30 | 24.0% |
| 65 to 74 Years | 52 | 41.6% |
| 75 to 84 Years | 4 | 3.2% |
| 85 Years and Over | 4 | 3.2% |
| Total | 125 | 100.0% |
Housing Finances in Norwood
Median Income by Occupancy in Norwood
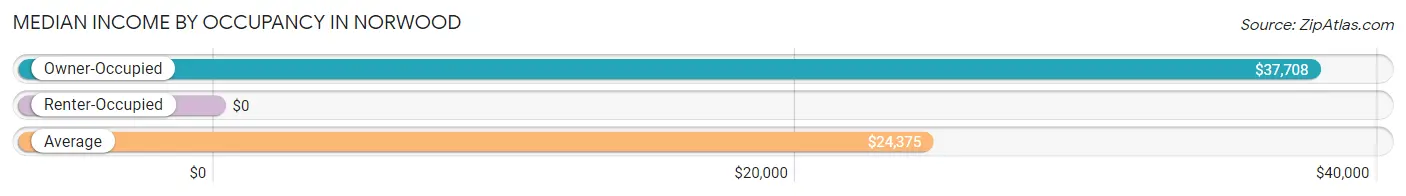
| Occupancy Type | # Households | Median Income |
| Owner-Occupied | 83 (66.4%) | $37,708 |
| Renter-Occupied | 42 (33.6%) | $0 |
| Average | 125 (100.0%) | $24,375 |
Occupancy by Householder Income Bracket in Norwood
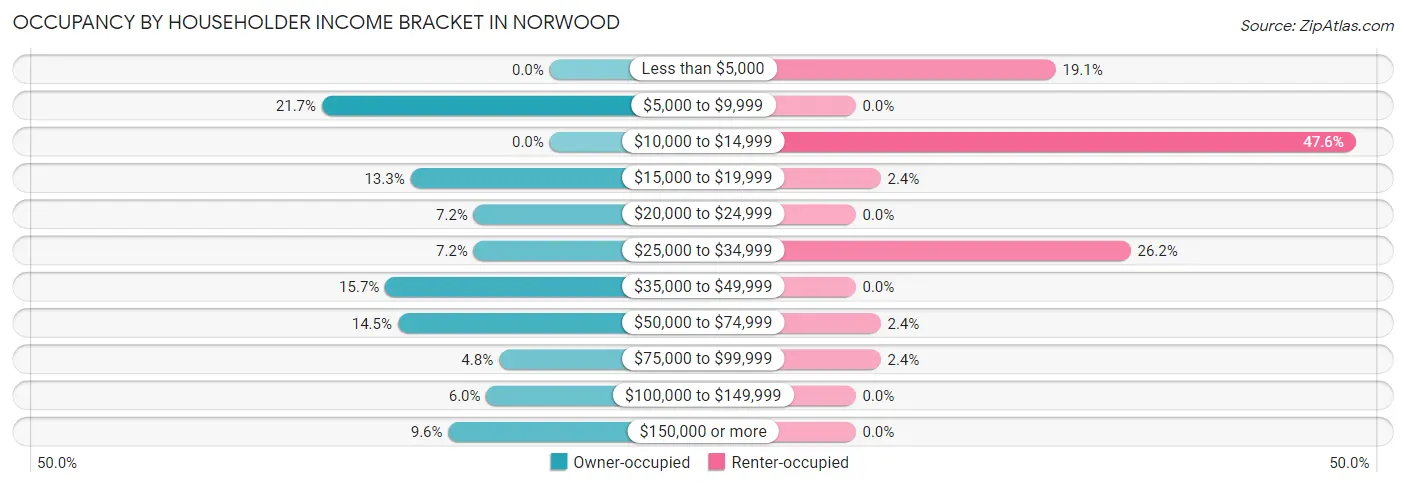
| Income Bracket | Owner-occupied | Renter-occupied |
| Less than $5,000 | 0 (0.0%) | 8 (19.1%) |
| $5,000 to $9,999 | 18 (21.7%) | 0 (0.0%) |
| $10,000 to $14,999 | 0 (0.0%) | 20 (47.6%) |
| $15,000 to $19,999 | 11 (13.3%) | 1 (2.4%) |
| $20,000 to $24,999 | 6 (7.2%) | 0 (0.0%) |
| $25,000 to $34,999 | 6 (7.2%) | 11 (26.2%) |
| $35,000 to $49,999 | 13 (15.7%) | 0 (0.0%) |
| $50,000 to $74,999 | 12 (14.5%) | 1 (2.4%) |
| $75,000 to $99,999 | 4 (4.8%) | 1 (2.4%) |
| $100,000 to $149,999 | 5 (6.0%) | 0 (0.0%) |
| $150,000 or more | 8 (9.6%) | 0 (0.0%) |
| Total | 83 (100.0%) | 42 (100.0%) |
Monthly Housing Cost Tiers in Norwood
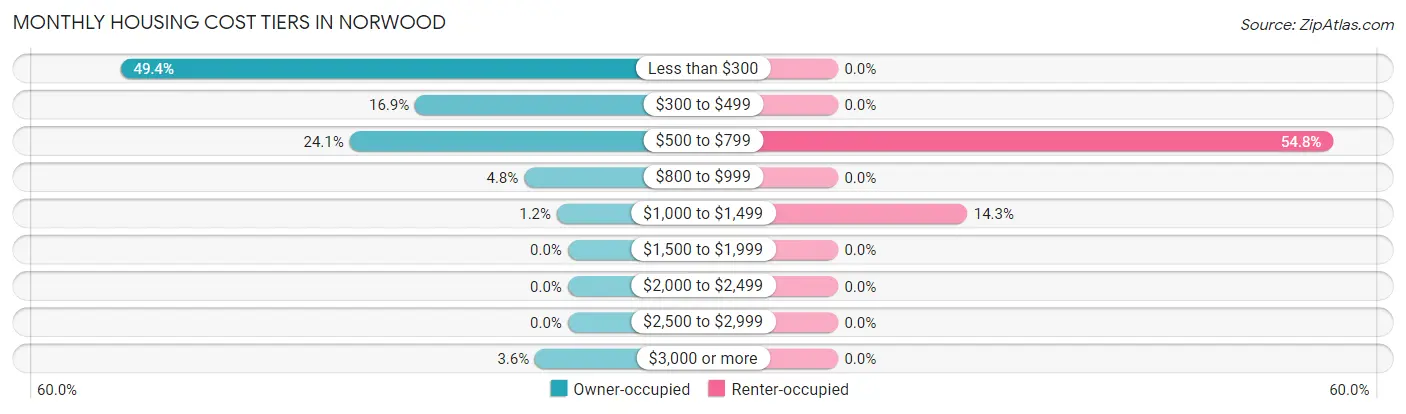
| Monthly Cost | Owner-occupied | Renter-occupied |
| Less than $300 | 41 (49.4%) | 0 (0.0%) |
| $300 to $499 | 14 (16.9%) | 0 (0.0%) |
| $500 to $799 | 20 (24.1%) | 23 (54.8%) |
| $800 to $999 | 4 (4.8%) | 0 (0.0%) |
| $1,000 to $1,499 | 1 (1.2%) | 6 (14.3%) |
| $1,500 to $1,999 | 0 (0.0%) | 0 (0.0%) |
| $2,000 to $2,499 | 0 (0.0%) | 0 (0.0%) |
| $2,500 to $2,999 | 0 (0.0%) | 0 (0.0%) |
| $3,000 or more | 3 (3.6%) | 0 (0.0%) |
| Total | 83 (100.0%) | 42 (100.0%) |
Physical Housing Characteristics in Norwood
Housing Structures in Norwood
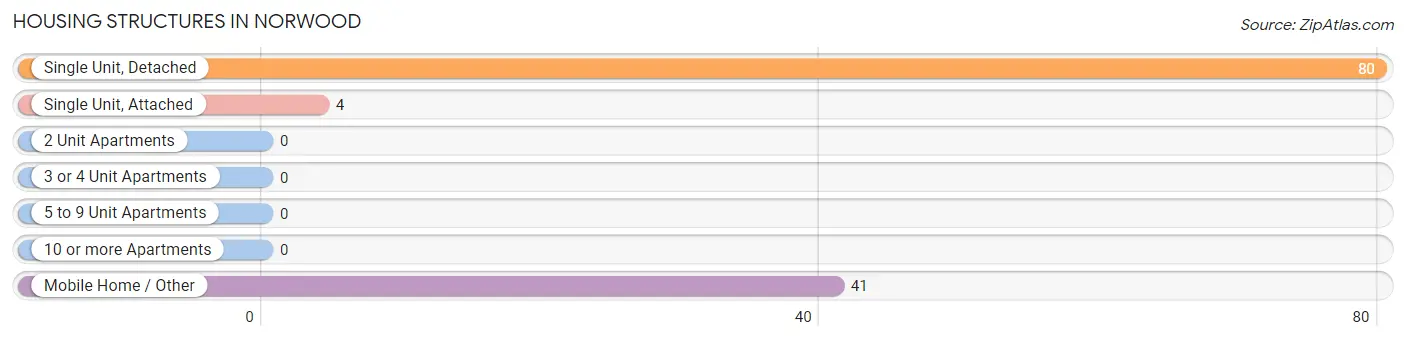
| Structure Type | # Housing Units | % Housing Units |
| Single Unit, Detached | 80 | 64.0% |
| Single Unit, Attached | 4 | 3.2% |
| 2 Unit Apartments | 0 | 0.0% |
| 3 or 4 Unit Apartments | 0 | 0.0% |
| 5 to 9 Unit Apartments | 0 | 0.0% |
| 10 or more Apartments | 0 | 0.0% |
| Mobile Home / Other | 41 | 32.8% |
| Total | 125 | 100.0% |
Housing Structures by Occupancy in Norwood
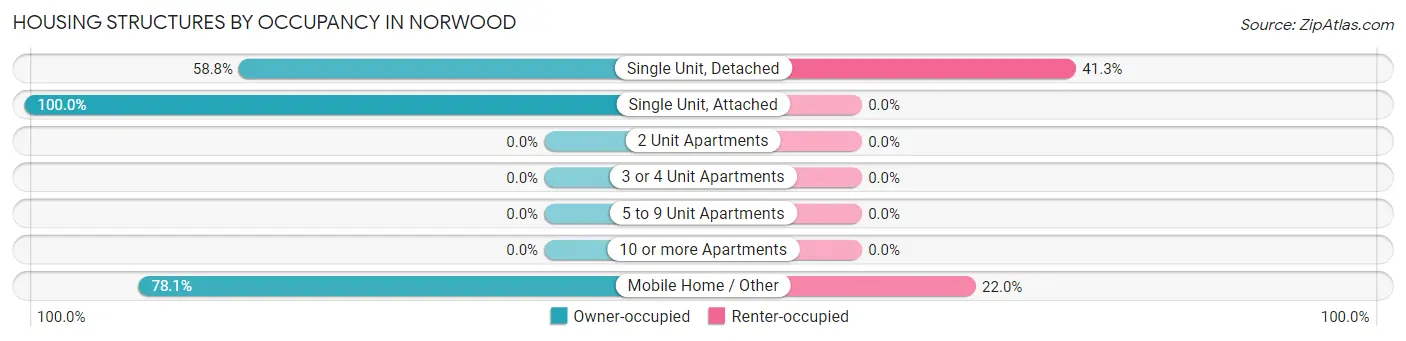
| Structure Type | Owner-occupied | Renter-occupied |
| Single Unit, Detached | 47 (58.8%) | 33 (41.2%) |
| Single Unit, Attached | 4 (100.0%) | 0 (0.0%) |
| 2 Unit Apartments | 0 (0.0%) | 0 (0.0%) |
| 3 or 4 Unit Apartments | 0 (0.0%) | 0 (0.0%) |
| 5 to 9 Unit Apartments | 0 (0.0%) | 0 (0.0%) |
| 10 or more Apartments | 0 (0.0%) | 0 (0.0%) |
| Mobile Home / Other | 32 (78.0%) | 9 (22.0%) |
| Total | 83 (66.4%) | 42 (33.6%) |
Housing Structures by Number of Rooms in Norwood
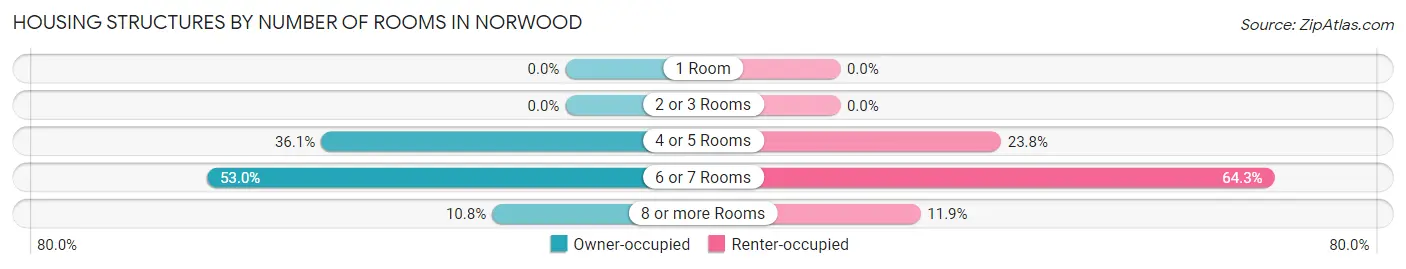
| Number of Rooms | Owner-occupied | Renter-occupied |
| 1 Room | 0 (0.0%) | 0 (0.0%) |
| 2 or 3 Rooms | 0 (0.0%) | 0 (0.0%) |
| 4 or 5 Rooms | 30 (36.1%) | 10 (23.8%) |
| 6 or 7 Rooms | 44 (53.0%) | 27 (64.3%) |
| 8 or more Rooms | 9 (10.8%) | 5 (11.9%) |
| Total | 83 (100.0%) | 42 (100.0%) |
Housing Structure by Heating Type in Norwood
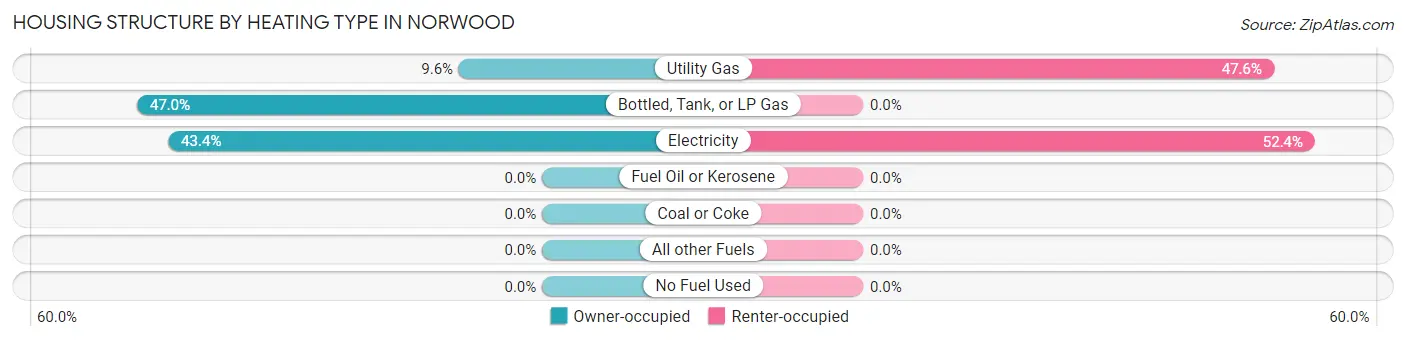
| Heating Type | Owner-occupied | Renter-occupied |
| Utility Gas | 8 (9.6%) | 20 (47.6%) |
| Bottled, Tank, or LP Gas | 39 (47.0%) | 0 (0.0%) |
| Electricity | 36 (43.4%) | 22 (52.4%) |
| Fuel Oil or Kerosene | 0 (0.0%) | 0 (0.0%) |
| Coal or Coke | 0 (0.0%) | 0 (0.0%) |
| All other Fuels | 0 (0.0%) | 0 (0.0%) |
| No Fuel Used | 0 (0.0%) | 0 (0.0%) |
| Total | 83 (100.0%) | 42 (100.0%) |
Household Vehicle Usage in Norwood
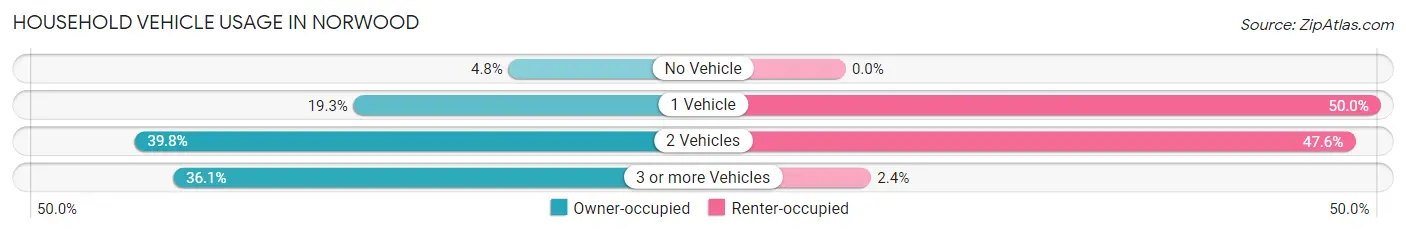
| Vehicles per Household | Owner-occupied | Renter-occupied |
| No Vehicle | 4 (4.8%) | 0 (0.0%) |
| 1 Vehicle | 16 (19.3%) | 21 (50.0%) |
| 2 Vehicles | 33 (39.8%) | 20 (47.6%) |
| 3 or more Vehicles | 30 (36.1%) | 1 (2.4%) |
| Total | 83 (100.0%) | 42 (100.0%) |
Real Estate & Mortgages in Norwood
Real Estate and Mortgage Overview in Norwood
| Characteristic | Without Mortgage | With Mortgage |
| Housing Units | 77 | 6 |
| Median Property Value | $54,100 | $116,700 |
| Median Household Income | $37,708 | $0 |
| Monthly Housing Costs | $289 | $3 |
| Real Estate Taxes | $481 | $0 |
Property Value by Mortgage Status in Norwood
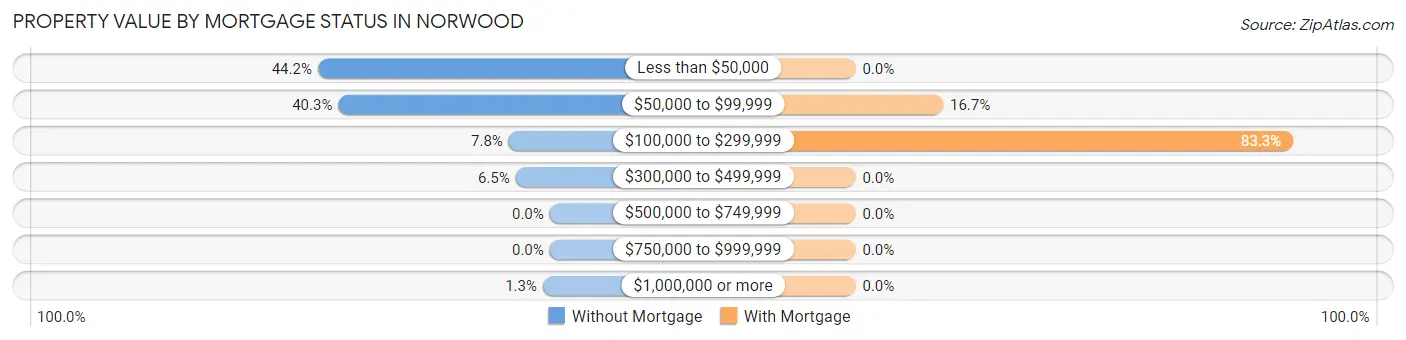
| Property Value | Without Mortgage | With Mortgage |
| Less than $50,000 | 34 (44.2%) | 0 (0.0%) |
| $50,000 to $99,999 | 31 (40.3%) | 1 (16.7%) |
| $100,000 to $299,999 | 6 (7.8%) | 5 (83.3%) |
| $300,000 to $499,999 | 5 (6.5%) | 0 (0.0%) |
| $500,000 to $749,999 | 0 (0.0%) | 0 (0.0%) |
| $750,000 to $999,999 | 0 (0.0%) | 0 (0.0%) |
| $1,000,000 or more | 1 (1.3%) | 0 (0.0%) |
| Total | 77 (100.0%) | 6 (100.0%) |
Household Income by Mortgage Status in Norwood
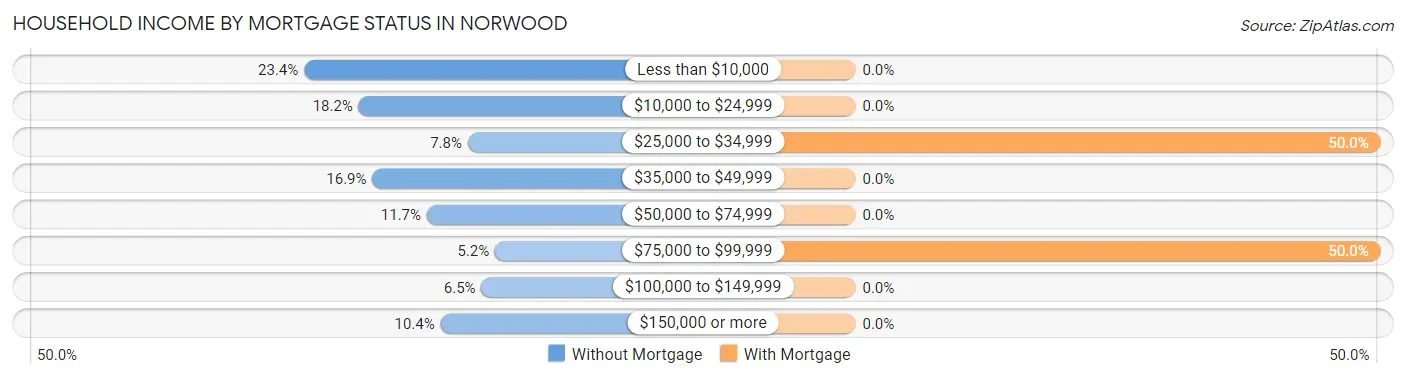
| Household Income | Without Mortgage | With Mortgage |
| Less than $10,000 | 18 (23.4%) | 0 (0.0%) |
| $10,000 to $24,999 | 14 (18.2%) | 0 (0.0%) |
| $25,000 to $34,999 | 6 (7.8%) | 3 (50.0%) |
| $35,000 to $49,999 | 13 (16.9%) | 0 (0.0%) |
| $50,000 to $74,999 | 9 (11.7%) | 0 (0.0%) |
| $75,000 to $99,999 | 4 (5.2%) | 3 (50.0%) |
| $100,000 to $149,999 | 5 (6.5%) | 0 (0.0%) |
| $150,000 or more | 8 (10.4%) | 0 (0.0%) |
| Total | 77 (100.0%) | 6 (100.0%) |
Property Value to Household Income Ratio in Norwood
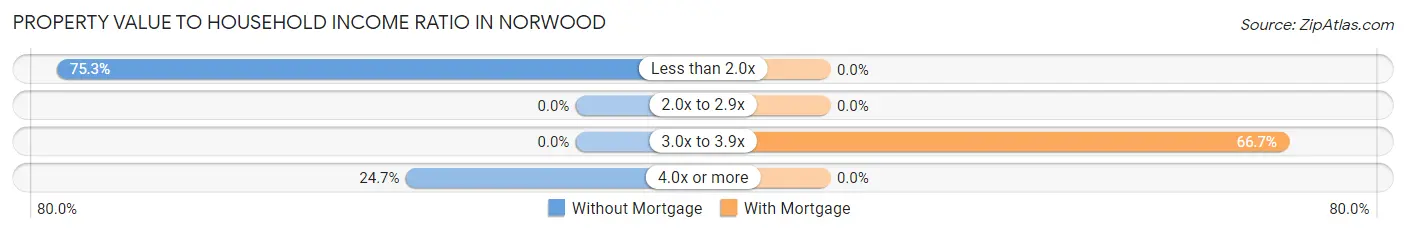
| Value-to-Income Ratio | Without Mortgage | With Mortgage |
| Less than 2.0x | 58 (75.3%) | 0 (0.0%) |
| 2.0x to 2.9x | 0 (0.0%) | 0 (0.0%) |
| 3.0x to 3.9x | 0 (0.0%) | 4 (66.7%) |
| 4.0x or more | 19 (24.7%) | 0 (0.0%) |
| Total | 77 (100.0%) | 6 (100.0%) |
Real Estate Taxes by Mortgage Status in Norwood
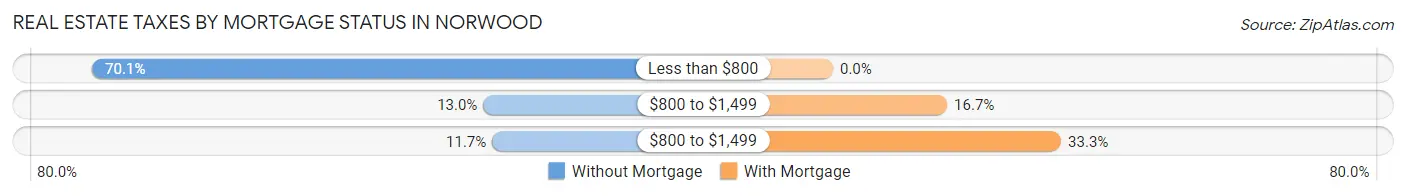
| Property Taxes | Without Mortgage | With Mortgage |
| Less than $800 | 54 (70.1%) | 0 (0.0%) |
| $800 to $1,499 | 10 (13.0%) | 1 (16.7%) |
| $800 to $1,499 | 9 (11.7%) | 2 (33.3%) |
| Total | 77 (100.0%) | 6 (100.0%) |
Health & Disability in Norwood
Health Insurance Coverage by Age in Norwood
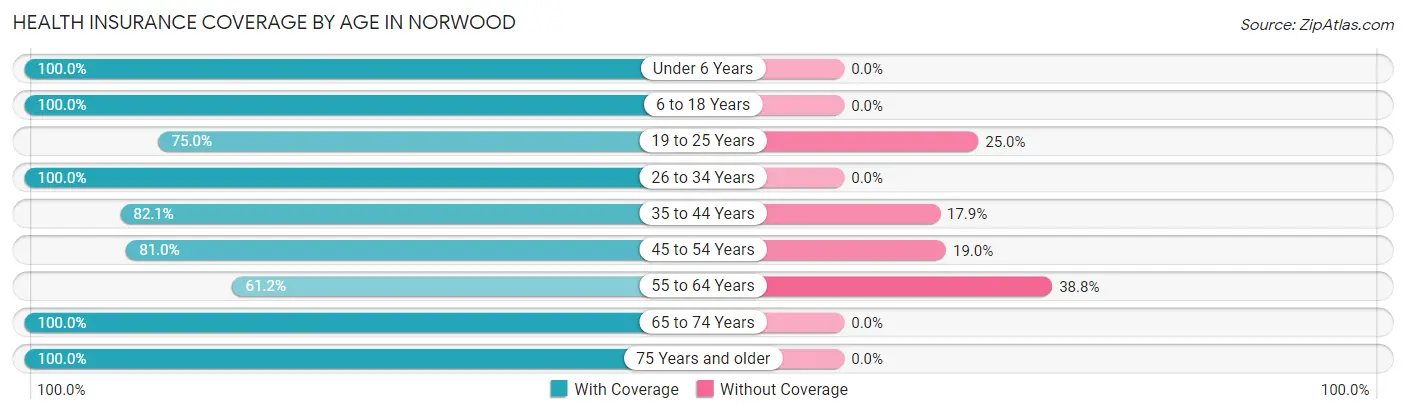
| Age Bracket | With Coverage | Without Coverage |
| Under 6 Years | 4 (100.0%) | 0 (0.0%) |
| 6 to 18 Years | 34 (100.0%) | 0 (0.0%) |
| 19 to 25 Years | 6 (75.0%) | 2 (25.0%) |
| 26 to 34 Years | 17 (100.0%) | 0 (0.0%) |
| 35 to 44 Years | 23 (82.1%) | 5 (17.9%) |
| 45 to 54 Years | 47 (81.0%) | 11 (19.0%) |
| 55 to 64 Years | 30 (61.2%) | 19 (38.8%) |
| 65 to 74 Years | 62 (100.0%) | 0 (0.0%) |
| 75 Years and older | 17 (100.0%) | 0 (0.0%) |
| Total | 240 (86.6%) | 37 (13.4%) |
Health Insurance Coverage by Citizenship Status in Norwood
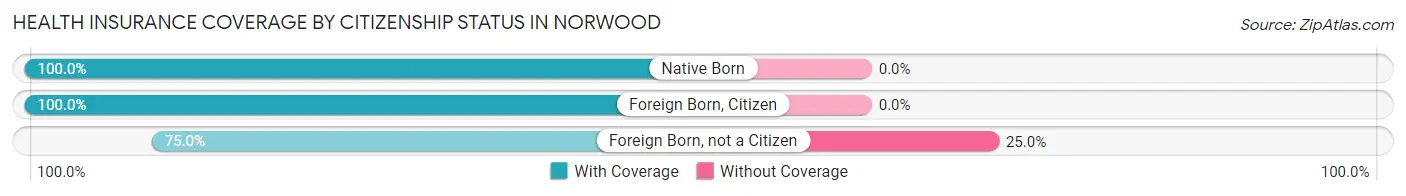
| Citizenship Status | With Coverage | Without Coverage |
| Native Born | 4 (100.0%) | 0 (0.0%) |
| Foreign Born, Citizen | 34 (100.0%) | 0 (0.0%) |
| Foreign Born, not a Citizen | 6 (75.0%) | 2 (25.0%) |
Health Insurance Coverage by Household Income in Norwood
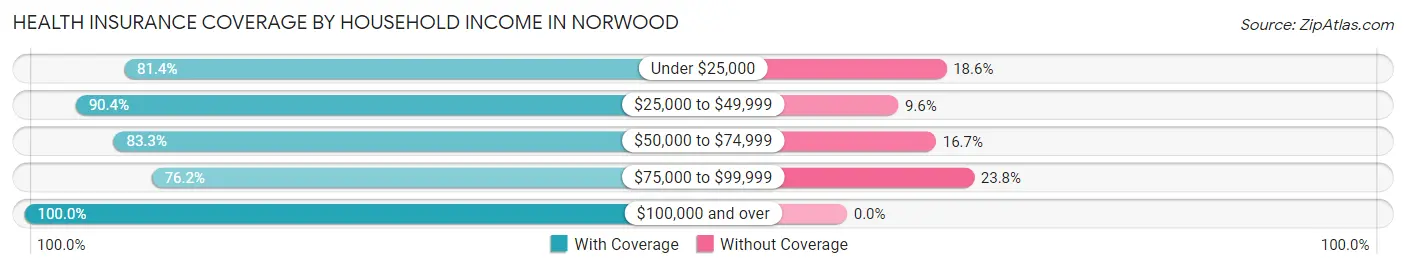
| Household Income | With Coverage | Without Coverage |
| Under $25,000 | 83 (81.4%) | 19 (18.6%) |
| $25,000 to $49,999 | 66 (90.4%) | 7 (9.6%) |
| $50,000 to $74,999 | 30 (83.3%) | 6 (16.7%) |
| $75,000 to $99,999 | 16 (76.2%) | 5 (23.8%) |
| $100,000 and over | 45 (100.0%) | 0 (0.0%) |
Public vs Private Health Insurance Coverage by Age in Norwood
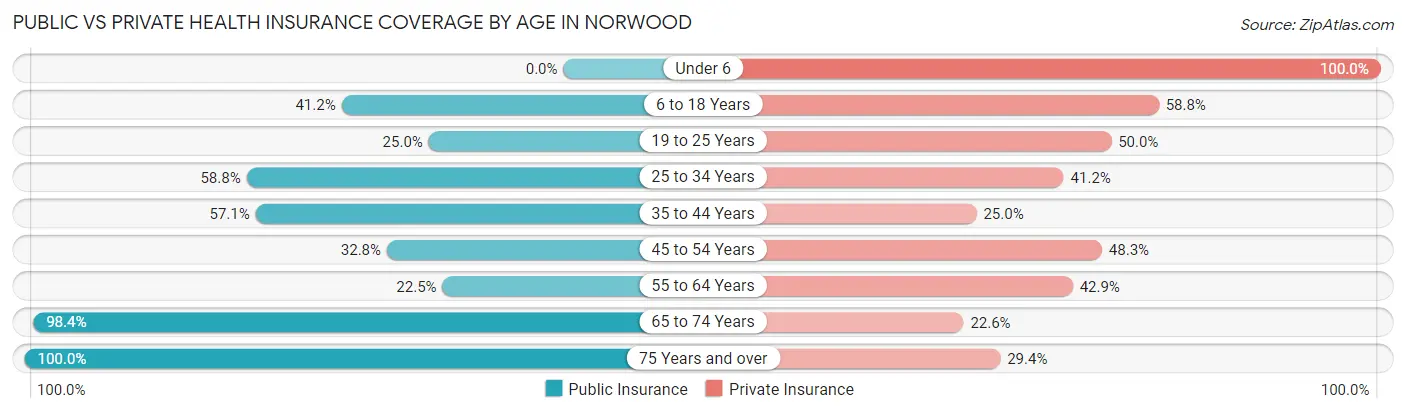
| Age Bracket | Public Insurance | Private Insurance |
| Under 6 | 0 (0.0%) | 4 (100.0%) |
| 6 to 18 Years | 14 (41.2%) | 20 (58.8%) |
| 19 to 25 Years | 2 (25.0%) | 4 (50.0%) |
| 25 to 34 Years | 10 (58.8%) | 7 (41.2%) |
| 35 to 44 Years | 16 (57.1%) | 7 (25.0%) |
| 45 to 54 Years | 19 (32.8%) | 28 (48.3%) |
| 55 to 64 Years | 11 (22.5%) | 21 (42.9%) |
| 65 to 74 Years | 61 (98.4%) | 14 (22.6%) |
| 75 Years and over | 17 (100.0%) | 5 (29.4%) |
| Total | 150 (54.1%) | 110 (39.7%) |
Disability Status by Sex by Age in Norwood
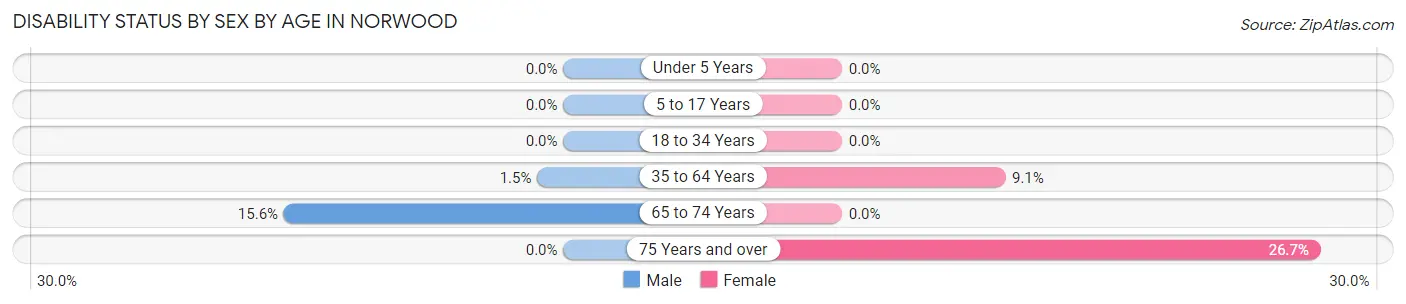
| Age Bracket | Male | Female |
| Under 5 Years | 0 (0.0%) | 0 (0.0%) |
| 5 to 17 Years | 0 (0.0%) | 0 (0.0%) |
| 18 to 34 Years | 0 (0.0%) | 0 (0.0%) |
| 35 to 64 Years | 1 (1.5%) | 6 (9.1%) |
| 65 to 74 Years | 7 (15.6%) | 0 (0.0%) |
| 75 Years and over | 0 (0.0%) | 4 (26.7%) |
Disability Class by Sex by Age in Norwood
Disability Class: Hearing Difficulty
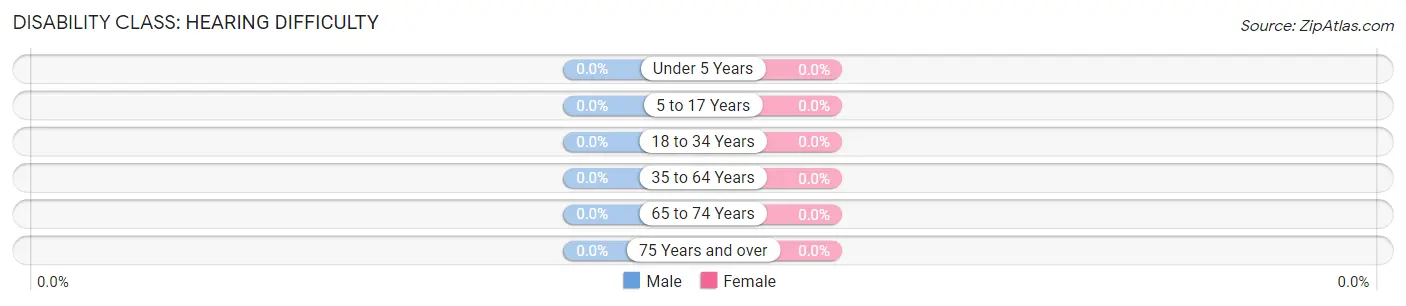
| Age Bracket | Male | Female |
| Under 5 Years | 0 (0.0%) | 0 (0.0%) |
| 5 to 17 Years | 0 (0.0%) | 0 (0.0%) |
| 18 to 34 Years | 0 (0.0%) | 0 (0.0%) |
| 35 to 64 Years | 0 (0.0%) | 0 (0.0%) |
| 65 to 74 Years | 0 (0.0%) | 0 (0.0%) |
| 75 Years and over | 0 (0.0%) | 0 (0.0%) |
Disability Class: Vision Difficulty
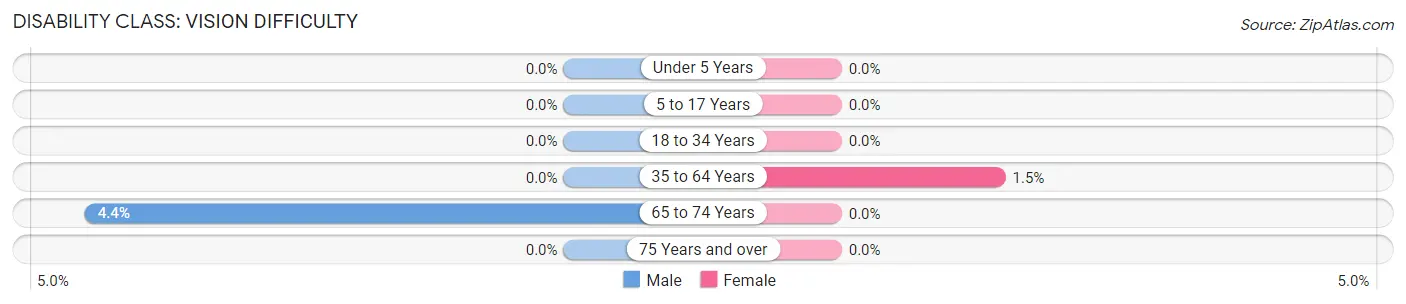
| Age Bracket | Male | Female |
| Under 5 Years | 0 (0.0%) | 0 (0.0%) |
| 5 to 17 Years | 0 (0.0%) | 0 (0.0%) |
| 18 to 34 Years | 0 (0.0%) | 0 (0.0%) |
| 35 to 64 Years | 0 (0.0%) | 1 (1.5%) |
| 65 to 74 Years | 2 (4.4%) | 0 (0.0%) |
| 75 Years and over | 0 (0.0%) | 0 (0.0%) |
Disability Class: Cognitive Difficulty
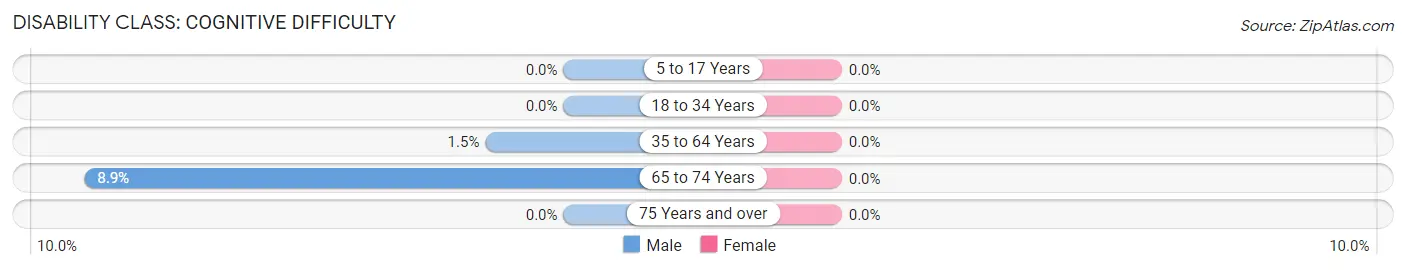
| Age Bracket | Male | Female |
| 5 to 17 Years | 0 (0.0%) | 0 (0.0%) |
| 18 to 34 Years | 0 (0.0%) | 0 (0.0%) |
| 35 to 64 Years | 1 (1.5%) | 0 (0.0%) |
| 65 to 74 Years | 4 (8.9%) | 0 (0.0%) |
| 75 Years and over | 0 (0.0%) | 0 (0.0%) |
Disability Class: Ambulatory Difficulty
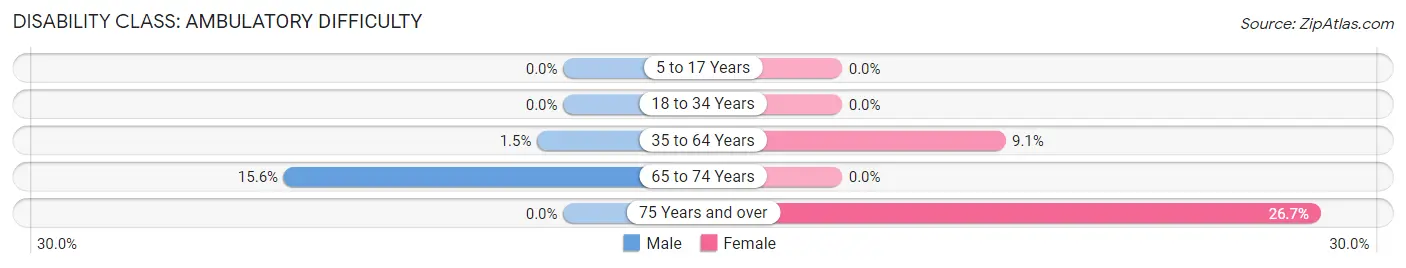
| Age Bracket | Male | Female |
| 5 to 17 Years | 0 (0.0%) | 0 (0.0%) |
| 18 to 34 Years | 0 (0.0%) | 0 (0.0%) |
| 35 to 64 Years | 1 (1.5%) | 6 (9.1%) |
| 65 to 74 Years | 7 (15.6%) | 0 (0.0%) |
| 75 Years and over | 0 (0.0%) | 4 (26.7%) |
Disability Class: Self-Care Difficulty
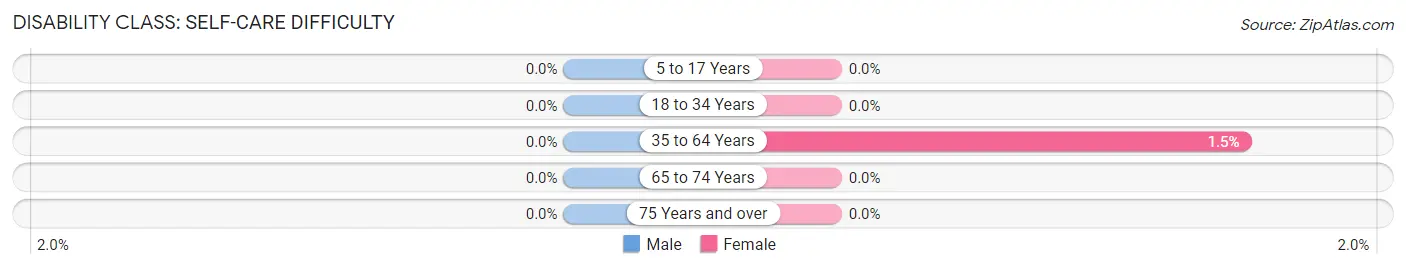
| Age Bracket | Male | Female |
| 5 to 17 Years | 0 (0.0%) | 0 (0.0%) |
| 18 to 34 Years | 0 (0.0%) | 0 (0.0%) |
| 35 to 64 Years | 0 (0.0%) | 1 (1.5%) |
| 65 to 74 Years | 0 (0.0%) | 0 (0.0%) |
| 75 Years and over | 0 (0.0%) | 0 (0.0%) |
Technology Access in Norwood
Computing Device Access in Norwood
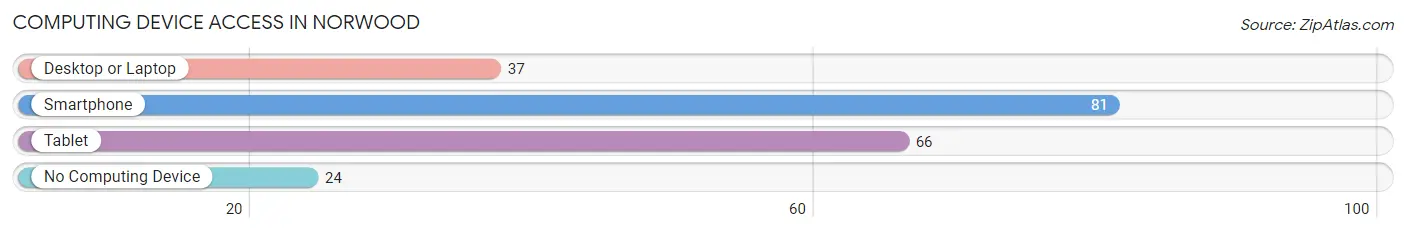
| Device Type | # Households | % Households |
| Desktop or Laptop | 37 | 29.6% |
| Smartphone | 81 | 64.8% |
| Tablet | 66 | 52.8% |
| No Computing Device | 24 | 19.2% |
| Total | 125 | 100.0% |
Internet Access in Norwood
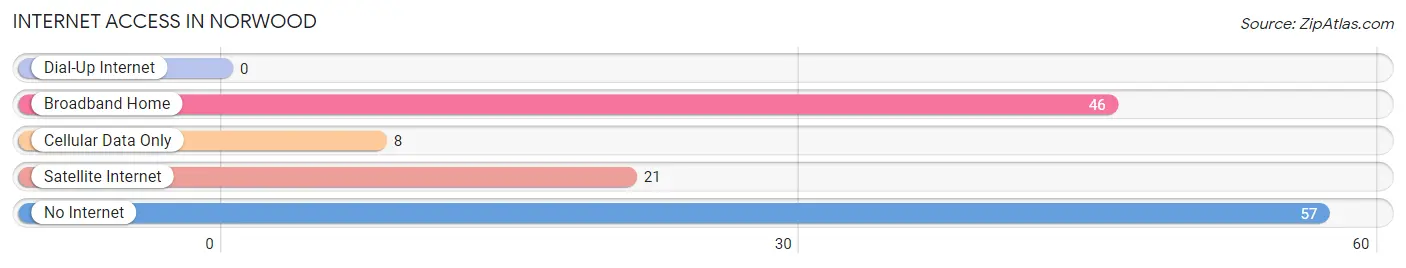
| Internet Type | # Households | % Households |
| Dial-Up Internet | 0 | 0.0% |
| Broadband Home | 46 | 36.8% |
| Cellular Data Only | 8 | 6.4% |
| Satellite Internet | 21 | 16.8% |
| No Internet | 57 | 45.6% |
| Total | 125 | 100.0% |
Norwood Summary
Norwood, Georgia is a small town located in Warren County, Georgia. It is situated in the southeastern part of the state, about 30 miles south of Macon. The town was founded in 1872 and was named after a local family. The population of Norwood was estimated to be 1,072 in 2019.
Geography
Norwood is located in the Piedmont region of Georgia, which is characterized by rolling hills and flat plains. The town is situated on the banks of the Ocmulgee River, which is a major tributary of the Altamaha River. The town is surrounded by the cities of Macon, Warner Robins, and Milledgeville. The climate in Norwood is humid subtropical, with hot summers and mild winters.
Economy
The economy of Norwood is largely based on agriculture and manufacturing. The town is home to several large farms, which produce a variety of crops, including cotton, corn, soybeans, and peanuts. The town is also home to several manufacturing companies, which produce a variety of products, including furniture, textiles, and automotive parts.
Demographics
As of the 2010 census, the population of Norwood was 1,072. The racial makeup of the town was 79.2% White, 17.2% African American, 0.7% Native American, 0.3% Asian, 0.1% Pacific Islander, and 2.5% from other races. The median household income in Norwood was $31,250, and the median family income was $37,500.
History
Norwood was founded in 1872 by a group of settlers from the nearby town of Milledgeville. The town was named after a local family, the Norwoods. The town grew quickly, and by the early 1900s, it had become a thriving agricultural center. The town was also home to several manufacturing companies, which produced a variety of products, including furniture, textiles, and automotive parts.
In the late 20th century, Norwood began to experience a decline in population as many of its residents moved to larger cities in search of better job opportunities. However, the town has seen a resurgence in recent years, as many people have moved back to the area in search of a more rural lifestyle.
Today, Norwood is a small but vibrant town. It is home to several businesses, including restaurants, shops, and a local theater. The town also hosts several annual events, including a Fourth of July parade and a Christmas parade. Norwood is a great place to live, work, and raise a family.
Common Questions
What is Per Capita Income in Norwood?
Per Capita income in Norwood is $22,918.
What is the Median Household income in Norwood?
Median Household Income in Norwood is $24,375.
What is Inequality or Gini Index in Norwood?
Inequality or Gini Index in Norwood is 0.63.
What is the Total Population of Norwood?
Total Population of Norwood is 277.
What is the Total Male Population of Norwood?
Total Male Population of Norwood is 139.
What is the Total Female Population of Norwood?
Total Female Population of Norwood is 138.
What is the Ratio of Males per 100 Females in Norwood?
There are 100.72 Males per 100 Females in Norwood.
What is the Ratio of Females per 100 Males in Norwood?
There are 99.28 Females per 100 Males in Norwood.
What is the Median Population Age in Norwood?
Median Population Age in Norwood is 53.9 Years.
What is the Average Family Size in Norwood
Average Family Size in Norwood is 2.6 People.
What is the Average Household Size in Norwood
Average Household Size in Norwood is 2.2 People.
How Large is the Labor Force in Norwood?
There are 77 People in the Labor Forcein in Norwood.
What is the Percentage of People in the Labor Force in Norwood?
31.2% of People are in the Labor Force in Norwood.
What is the Unemployment Rate in Norwood?
Unemployment Rate in Norwood is 2.6%.