Newborn, GA Map & Demographics
Newborn Map
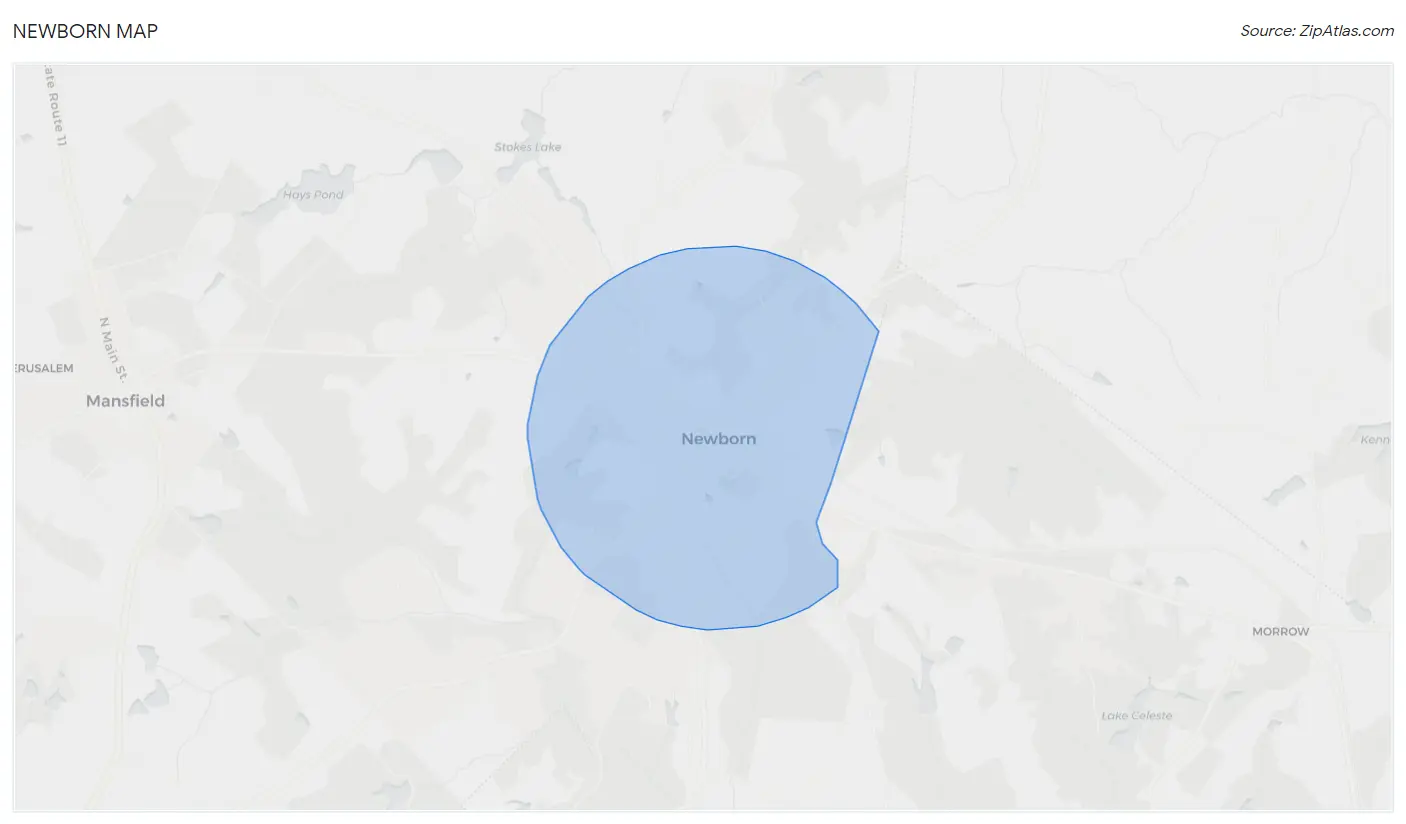
Newborn Overview
$36,107
PER CAPITA INCOME
$80,156
AVG FAMILY INCOME
$64,028
AVG HOUSEHOLD INCOME
48.2%
WAGE / INCOME GAP [ % ]
51.8¢/ $1
WAGE / INCOME GAP [ $ ]
0.41
INEQUALITY / GINI INDEX
643
TOTAL POPULATION
362
MALE POPULATION
281
FEMALE POPULATION
128.83
MALES / 100 FEMALES
77.62
FEMALES / 100 MALES
48.6
MEDIAN AGE
3.0
AVG FAMILY SIZE
2.6
AVG HOUSEHOLD SIZE
369
LABOR FORCE [ PEOPLE ]
63.7%
PERCENT IN LABOR FORCE
10.3%
UNEMPLOYMENT RATE
Newborn Zip Codes
Income in Newborn
Income Overview in Newborn
Per Capita Income in Newborn is $36,107, while median incomes of families and households are $80,156 and $64,028 respectively.
| Characteristic | Number | Measure |
| Per Capita Income | 643 | $36,107 |
| Median Family Income | 187 | $80,156 |
| Mean Family Income | 187 | $111,884 |
| Median Household Income | 245 | $64,028 |
| Mean Household Income | 245 | $95,199 |
| Income Deficit | 187 | $0 |
| Wage / Income Gap (%) | 643 | 48.15% |
| Wage / Income Gap ($) | 643 | 51.85¢ per $1 |
| Gini / Inequality Index | 643 | 0.41 |
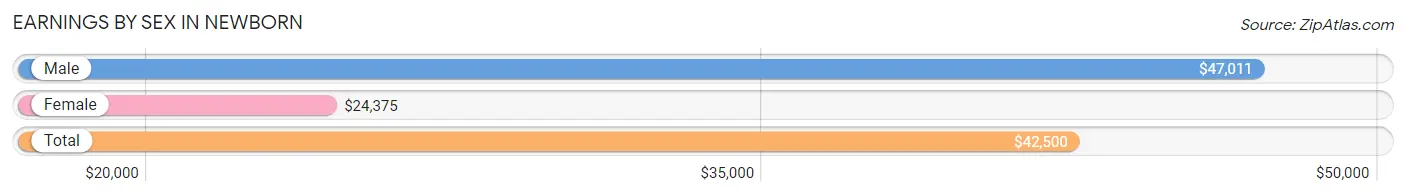
Earnings by Sex in Newborn
Average Earnings in Newborn are $42,500, $47,011 for men and $24,375 for women, a difference of 48.1%.
| Sex | Number | Average Earnings |
| Male | 249 (67.7%) | $47,011 |
| Female | 119 (32.3%) | $24,375 |
| Total | 368 (100.0%) | $42,500 |
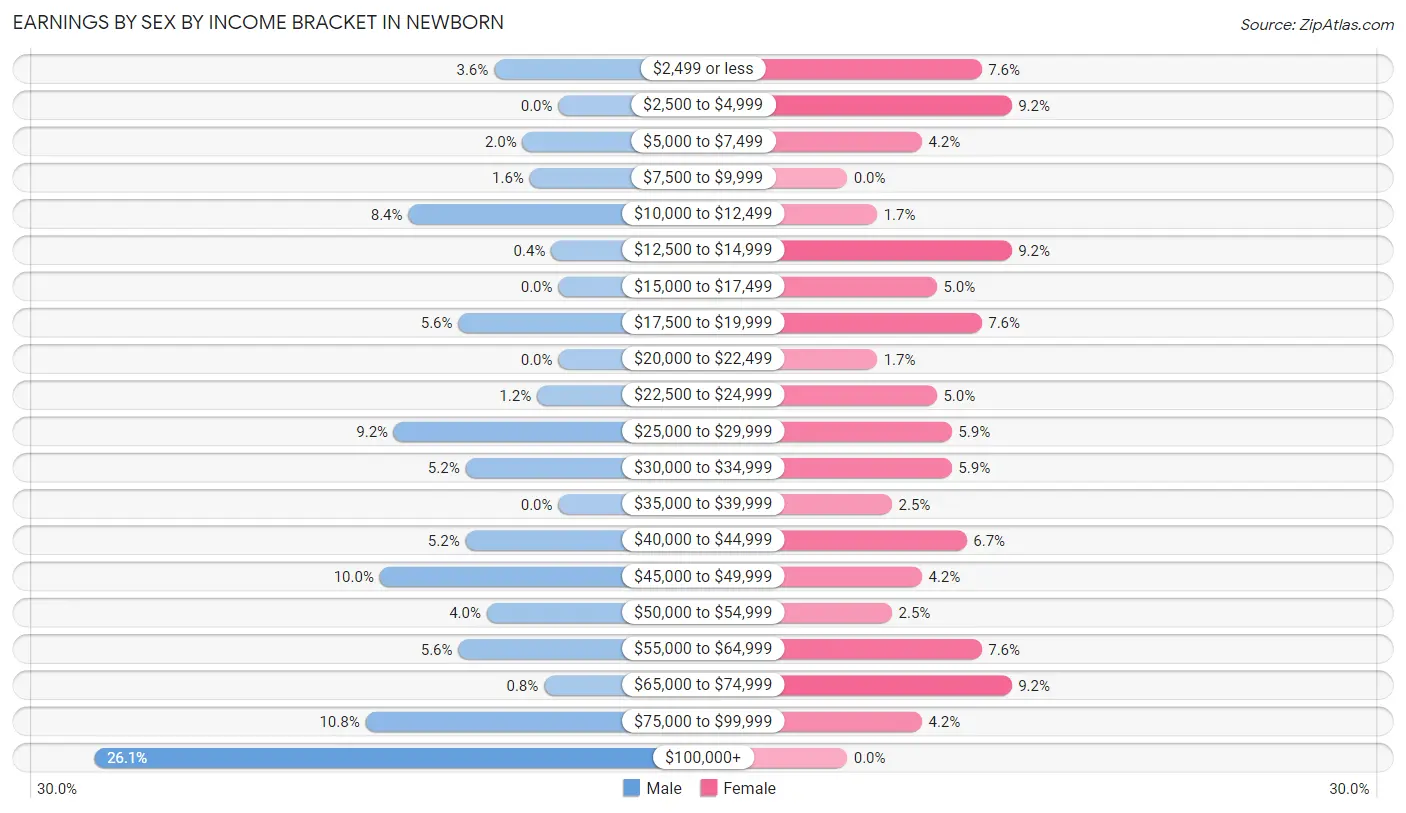
Earnings by Sex by Income Bracket in Newborn
The most common earnings brackets in Newborn are $100,000+ for men (65 | 26.1%) and $2,500 to $4,999 for women (11 | 9.2%).
| Income | Male | Female |
| $2,499 or less | 9 (3.6%) | 9 (7.6%) |
| $2,500 to $4,999 | 0 (0.0%) | 11 (9.2%) |
| $5,000 to $7,499 | 5 (2.0%) | 5 (4.2%) |
| $7,500 to $9,999 | 4 (1.6%) | 0 (0.0%) |
| $10,000 to $12,499 | 21 (8.4%) | 2 (1.7%) |
| $12,500 to $14,999 | 1 (0.4%) | 11 (9.2%) |
| $15,000 to $17,499 | 0 (0.0%) | 6 (5.0%) |
| $17,500 to $19,999 | 14 (5.6%) | 9 (7.6%) |
| $20,000 to $22,499 | 0 (0.0%) | 2 (1.7%) |
| $22,500 to $24,999 | 3 (1.2%) | 6 (5.0%) |
| $25,000 to $29,999 | 23 (9.2%) | 7 (5.9%) |
| $30,000 to $34,999 | 13 (5.2%) | 7 (5.9%) |
| $35,000 to $39,999 | 0 (0.0%) | 3 (2.5%) |
| $40,000 to $44,999 | 13 (5.2%) | 8 (6.7%) |
| $45,000 to $49,999 | 25 (10.0%) | 5 (4.2%) |
| $50,000 to $54,999 | 10 (4.0%) | 3 (2.5%) |
| $55,000 to $64,999 | 14 (5.6%) | 9 (7.6%) |
| $65,000 to $74,999 | 2 (0.8%) | 11 (9.2%) |
| $75,000 to $99,999 | 27 (10.8%) | 5 (4.2%) |
| $100,000+ | 65 (26.1%) | 0 (0.0%) |
| Total | 249 (100.0%) | 119 (100.0%) |
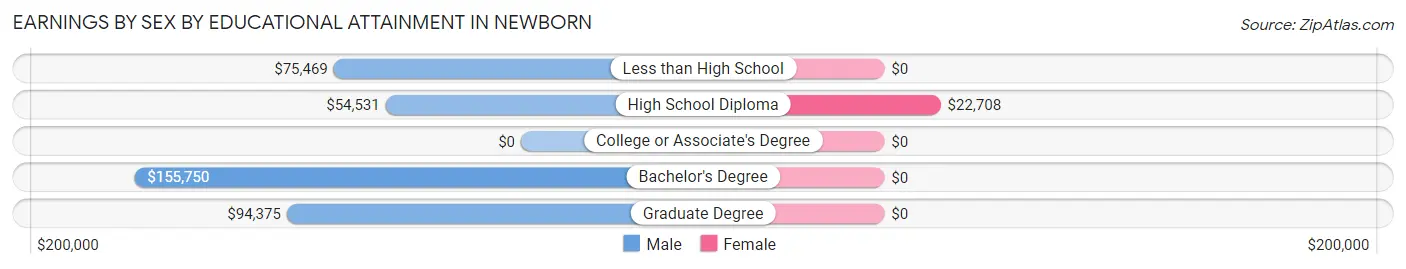
Earnings by Sex by Educational Attainment in Newborn
Average earnings in Newborn are $59,219 for men and $29,375 for women, a difference of 50.4%. Men with an educational attainment of bachelor's degree enjoy the highest average annual earnings of $155,750, while those with high school diploma education earn the least with $54,531. Women with an educational attainment of high school diploma earn the most with the average annual earnings of $22,708, while those with high school diploma education have the smallest earnings of $22,708.
| Educational Attainment | Male Income | Female Income |
| Less than High School | $75,469 | $0 |
| High School Diploma | $54,531 | $22,708 |
| College or Associate's Degree | - | - |
| Bachelor's Degree | $155,750 | $0 |
| Graduate Degree | $94,375 | $0 |
| Total | $59,219 | $29,375 |
Family Income in Newborn
Family Income Brackets in Newborn
According to the Newborn family income data, there are 48 families falling into the $150,000 to $199,999 income range, which is the most common income bracket and makes up 25.7% of all families.
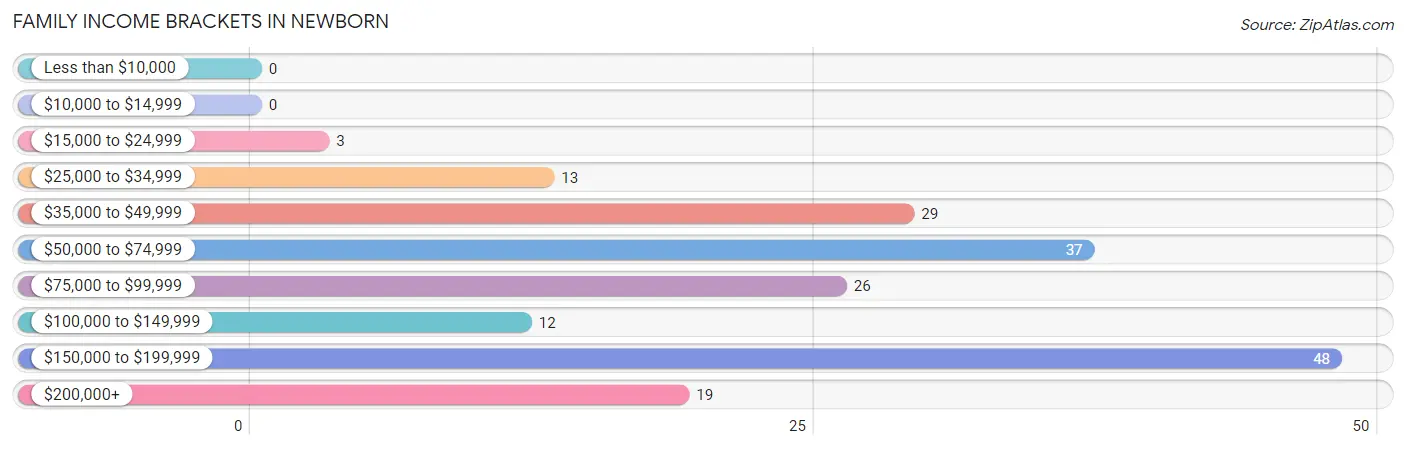
| Income Bracket | # Families | % Families |
| Less than $10,000 | 0 | 0.0% |
| $10,000 to $14,999 | 0 | 0.0% |
| $15,000 to $24,999 | 3 | 1.6% |
| $25,000 to $34,999 | 13 | 7.0% |
| $35,000 to $49,999 | 29 | 15.5% |
| $50,000 to $74,999 | 37 | 19.8% |
| $75,000 to $99,999 | 26 | 13.9% |
| $100,000 to $149,999 | 12 | 6.4% |
| $150,000 to $199,999 | 48 | 25.7% |
| $200,000+ | 19 | 10.2% |
Family Income by Famaliy Size in Newborn
6-person families (11 | 5.9%) account for the highest median family income in Newborn with $191,250 per family, while 6-person families (11 | 5.9%) have the highest median income of $31,875 per family member.
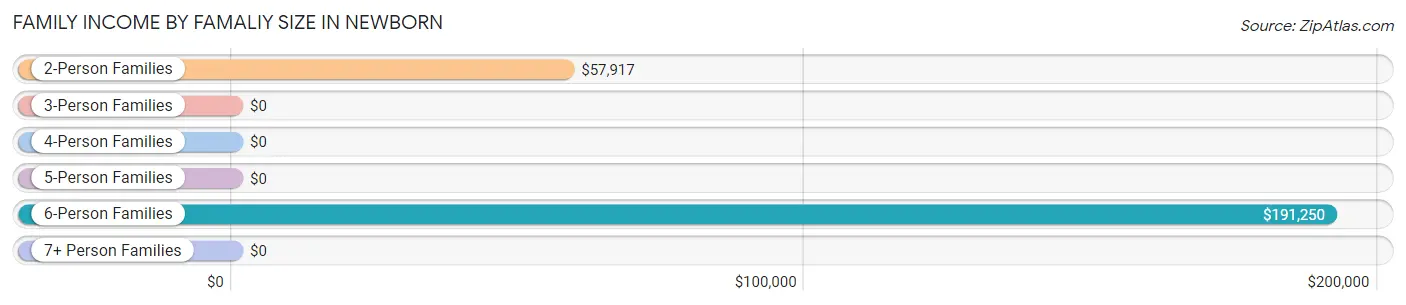
| Income Bracket | # Families | Median Income |
| 2-Person Families | 102 (54.5%) | $57,917 |
| 3-Person Families | 17 (9.1%) | $0 |
| 4-Person Families | 48 (25.7%) | $0 |
| 5-Person Families | 6 (3.2%) | $0 |
| 6-Person Families | 11 (5.9%) | $191,250 |
| 7+ Person Families | 3 (1.6%) | $0 |
| Total | 187 (100.0%) | $80,156 |
Family Income by Number of Earners in Newborn
The median family income in Newborn is $80,156, with families comprising 3+ earners (27) having the highest median family income of $197,981, while families with no earners (28) have the lowest median family income of $40,455, accounting for 14.4% and 15.0% of families, respectively.
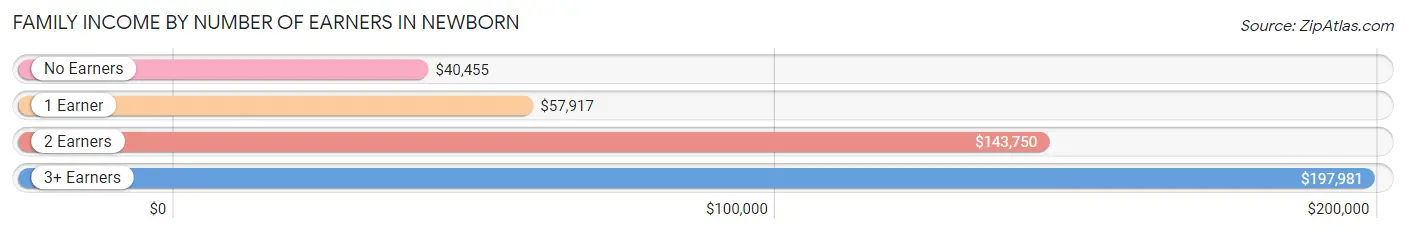
| Number of Earners | # Families | Median Income |
| No Earners | 28 (15.0%) | $40,455 |
| 1 Earner | 51 (27.3%) | $57,917 |
| 2 Earners | 81 (43.3%) | $143,750 |
| 3+ Earners | 27 (14.4%) | $197,981 |
| Total | 187 (100.0%) | $80,156 |
Household Income in Newborn
Household Income Brackets in Newborn
With 50 households falling in the category, the $50,000 to $74,999 income range is the most frequent in Newborn, accounting for 20.4% of all households.
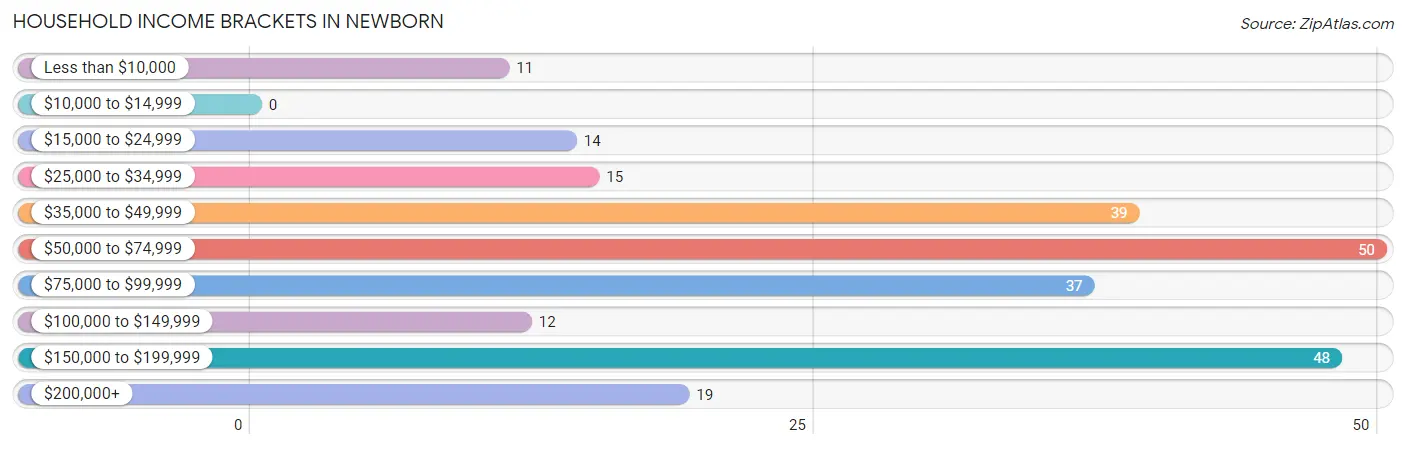
| Income Bracket | # Households | % Households |
| Less than $10,000 | 11 | 4.5% |
| $10,000 to $14,999 | 0 | 0.0% |
| $15,000 to $24,999 | 14 | 5.7% |
| $25,000 to $34,999 | 15 | 6.1% |
| $35,000 to $49,999 | 39 | 15.9% |
| $50,000 to $74,999 | 50 | 20.4% |
| $75,000 to $99,999 | 37 | 15.1% |
| $100,000 to $149,999 | 12 | 4.9% |
| $150,000 to $199,999 | 48 | 19.6% |
| $200,000+ | 19 | 7.8% |
Household Income by Householder Age in Newborn
The median household income in Newborn is $64,028, with the highest median household income of $76,875 found in the 45 to 64 years age bracket for the primary householder. A total of 125 households (51.0%) fall into this category. Meanwhile, the 15 to 24 years age bracket for the primary householder has the lowest median household income of $0, with 7 households (2.9%) in this group.
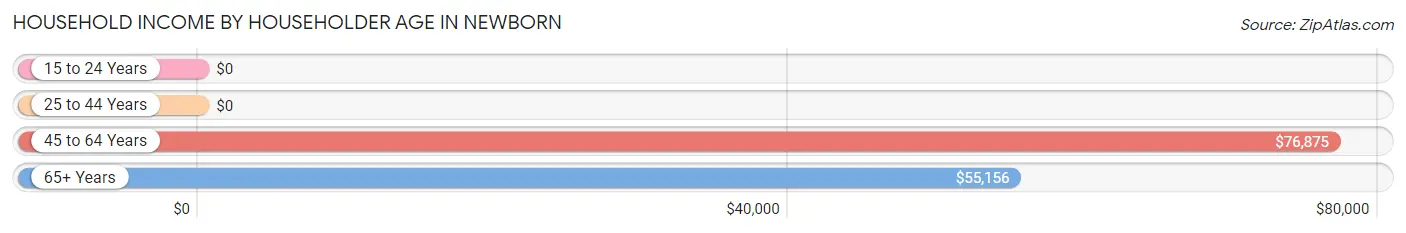
| Income Bracket | # Households | Median Income |
| 15 to 24 Years | 7 (2.9%) | $0 |
| 25 to 44 Years | 50 (20.4%) | $0 |
| 45 to 64 Years | 125 (51.0%) | $76,875 |
| 65+ Years | 63 (25.7%) | $55,156 |
| Total | 245 (100.0%) | $64,028 |
Poverty in Newborn
Income Below Poverty by Sex and Age in Newborn
With 4.5% poverty level for males and 0.7% for females among the residents of Newborn, 18 to 24 year old males and 35 to 44 year old females are the most vulnerable to poverty, with 7 males (10.9%) and 2 females (20.0%) in their respective age groups living below the poverty level.
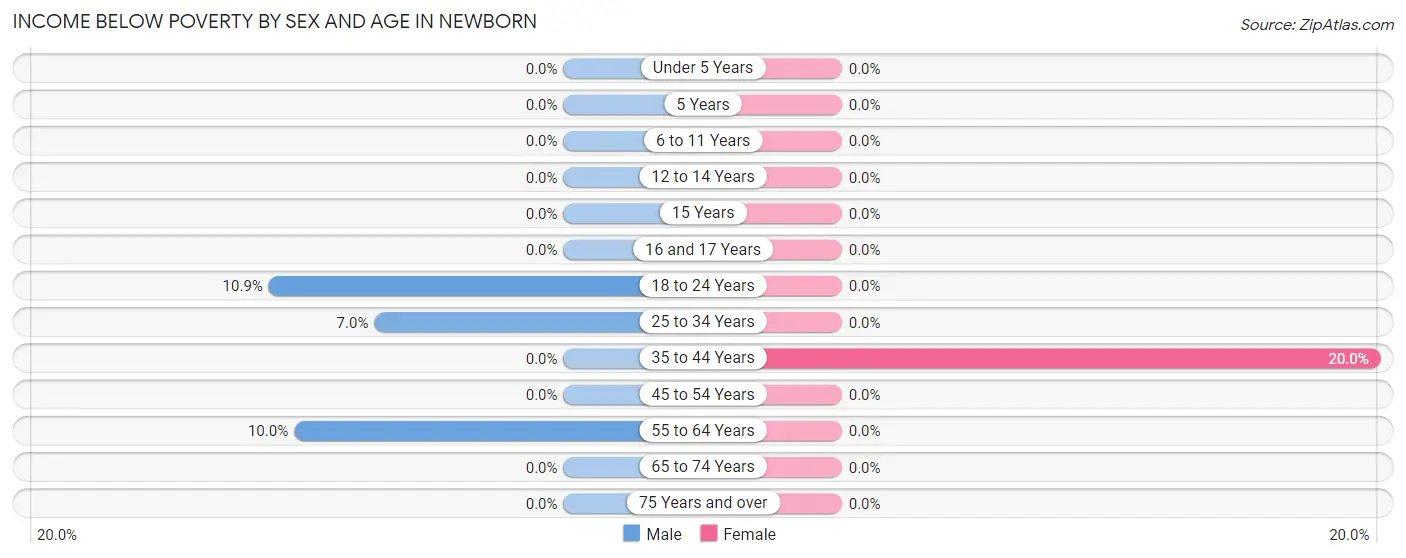
| Age Bracket | Male | Female |
| Under 5 Years | 0 (0.0%) | 0 (0.0%) |
| 5 Years | 0 (0.0%) | 0 (0.0%) |
| 6 to 11 Years | 0 (0.0%) | 0 (0.0%) |
| 12 to 14 Years | 0 (0.0%) | 0 (0.0%) |
| 15 Years | 0 (0.0%) | 0 (0.0%) |
| 16 and 17 Years | 0 (0.0%) | 0 (0.0%) |
| 18 to 24 Years | 7 (10.9%) | 0 (0.0%) |
| 25 to 34 Years | 4 (7.0%) | 0 (0.0%) |
| 35 to 44 Years | 0 (0.0%) | 2 (20.0%) |
| 45 to 54 Years | 0 (0.0%) | 0 (0.0%) |
| 55 to 64 Years | 5 (10.0%) | 0 (0.0%) |
| 65 to 74 Years | 0 (0.0%) | 0 (0.0%) |
| 75 Years and over | 0 (0.0%) | 0 (0.0%) |
| Total | 16 (4.5%) | 2 (0.7%) |
Income Above Poverty by Sex and Age in Newborn
According to the poverty statistics in Newborn, males aged 5 years and females aged under 5 years are the age groups that are most secure financially, with 100.0% of males and 100.0% of females in these age groups living above the poverty line.
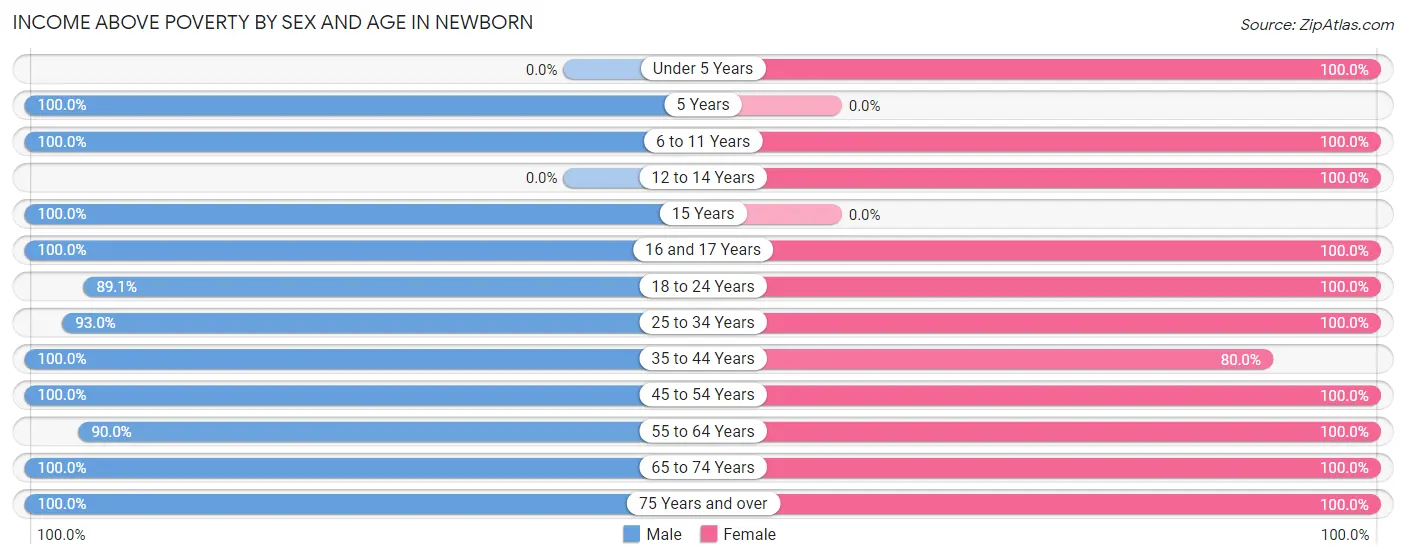
| Age Bracket | Male | Female |
| Under 5 Years | 0 (0.0%) | 9 (100.0%) |
| 5 Years | 8 (100.0%) | 0 (0.0%) |
| 6 to 11 Years | 13 (100.0%) | 11 (100.0%) |
| 12 to 14 Years | 0 (0.0%) | 5 (100.0%) |
| 15 Years | 2 (100.0%) | 0 (0.0%) |
| 16 and 17 Years | 3 (100.0%) | 13 (100.0%) |
| 18 to 24 Years | 57 (89.1%) | 13 (100.0%) |
| 25 to 34 Years | 53 (93.0%) | 21 (100.0%) |
| 35 to 44 Years | 59 (100.0%) | 8 (80.0%) |
| 45 to 54 Years | 63 (100.0%) | 43 (100.0%) |
| 55 to 64 Years | 45 (90.0%) | 65 (100.0%) |
| 65 to 74 Years | 18 (100.0%) | 49 (100.0%) |
| 75 Years and over | 19 (100.0%) | 32 (100.0%) |
| Total | 340 (95.5%) | 269 (99.3%) |
Income Below Poverty Among Married-Couple Families in Newborn
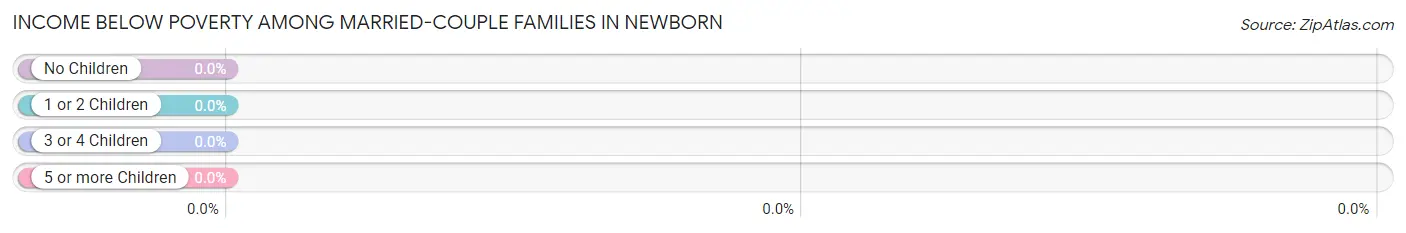
| Children | Above Poverty | Below Poverty |
| No Children | 77 (100.0%) | 0 (0.0%) |
| 1 or 2 Children | 44 (100.0%) | 0 (0.0%) |
| 3 or 4 Children | 3 (100.0%) | 0 (0.0%) |
| 5 or more Children | 0 (0.0%) | 0 (0.0%) |
| Total | 124 (100.0%) | 0 (0.0%) |
Income Below Poverty Among Single-Parent Households in Newborn
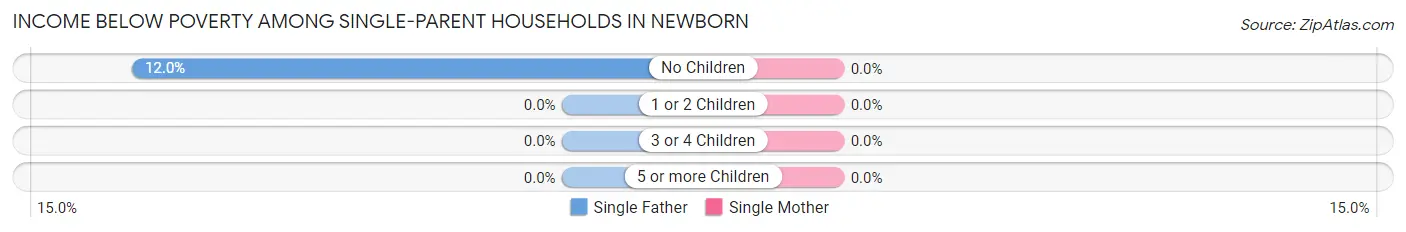
| Children | Single Father | Single Mother |
| No Children | 3 (12.0%) | 0 (0.0%) |
| 1 or 2 Children | 0 (0.0%) | 0 (0.0%) |
| 3 or 4 Children | 0 (0.0%) | 0 (0.0%) |
| 5 or more Children | 0 (0.0%) | 0 (0.0%) |
| Total | 3 (12.0%) | 0 (0.0%) |
Income Below Poverty Among Married-Couple vs Single-Parent Households in Newborn
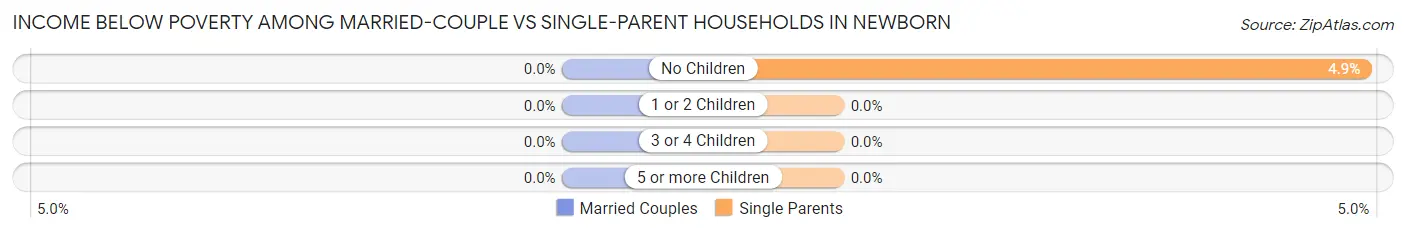
| Children | Married-Couple Families | Single-Parent Households |
| No Children | 0 (0.0%) | 3 (4.9%) |
| 1 or 2 Children | 0 (0.0%) | 0 (0.0%) |
| 3 or 4 Children | 0 (0.0%) | 0 (0.0%) |
| 5 or more Children | 0 (0.0%) | 0 (0.0%) |
| Total | 0 (0.0%) | 3 (4.8%) |
Race in Newborn
The most populous races in Newborn are White / Caucasian (469 | 72.9%), Black / African American (151 | 23.5%), and Hispanic or Latino (23 | 3.6%).
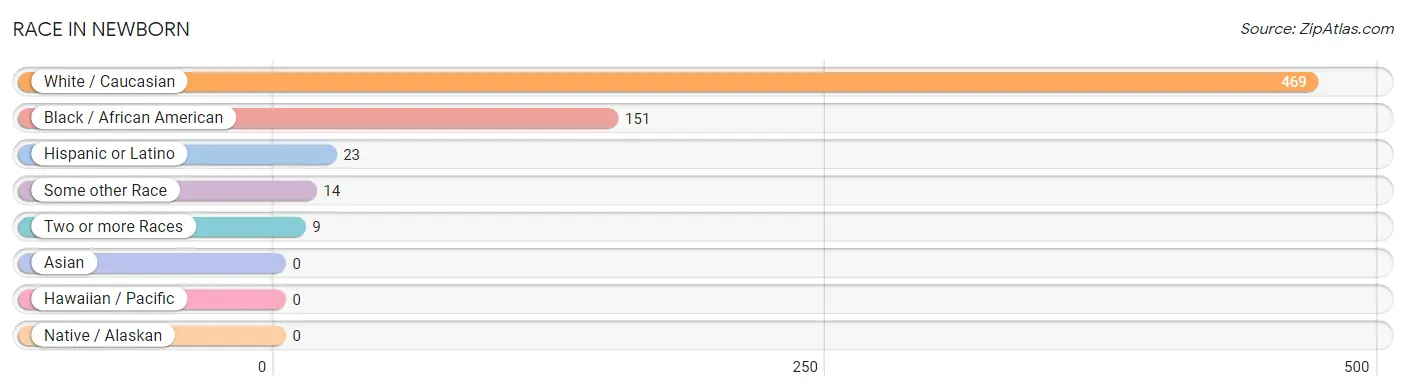
| Race | # Population | % Population |
| Asian | 0 | 0.0% |
| Black / African American | 151 | 23.5% |
| Hawaiian / Pacific | 0 | 0.0% |
| Hispanic or Latino | 23 | 3.6% |
| Native / Alaskan | 0 | 0.0% |
| White / Caucasian | 469 | 72.9% |
| Two or more Races | 9 | 1.4% |
| Some other Race | 14 | 2.2% |
| Total | 643 | 100.0% |
Ancestry in Newborn
The most populous ancestries reported in Newborn are American (94 | 14.6%), English (68 | 10.6%), Irish (35 | 5.4%), Italian (20 | 3.1%), and Dutch (12 | 1.9%), together accounting for 35.6% of all Newborn residents.
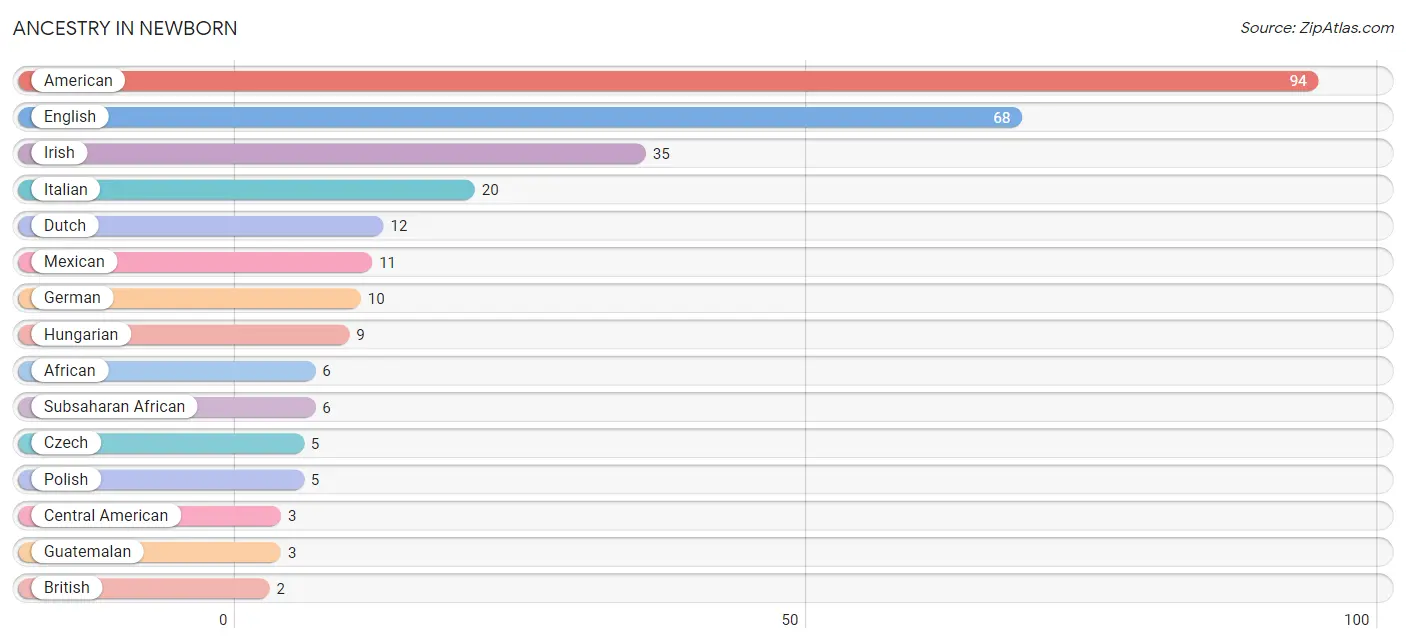
| Ancestry | # Population | % Population |
| African | 6 | 0.9% |
| American | 94 | 14.6% |
| British | 2 | 0.3% |
| Central American | 3 | 0.5% |
| Czech | 5 | 0.8% |
| Dutch | 12 | 1.9% |
| English | 68 | 10.6% |
| German | 10 | 1.6% |
| Guatemalan | 3 | 0.5% |
| Hungarian | 9 | 1.4% |
| Irish | 35 | 5.4% |
| Italian | 20 | 3.1% |
| Mexican | 11 | 1.7% |
| Polish | 5 | 0.8% |
| Scottish | 2 | 0.3% |
| Subsaharan African | 6 | 0.9% |
| Trinidadian and Tobagonian | 1 | 0.2% | View All 17 Rows |
Immigrants in Newborn
The most numerous immigrant groups reported in Newborn came from Europe (2 | 0.3%), Northern Europe (2 | 0.3%), Caribbean (1 | 0.2%), Latin America (1 | 0.2%), and Trinidad and Tobago (1 | 0.2%), together accounting for 1.1% of all Newborn residents.
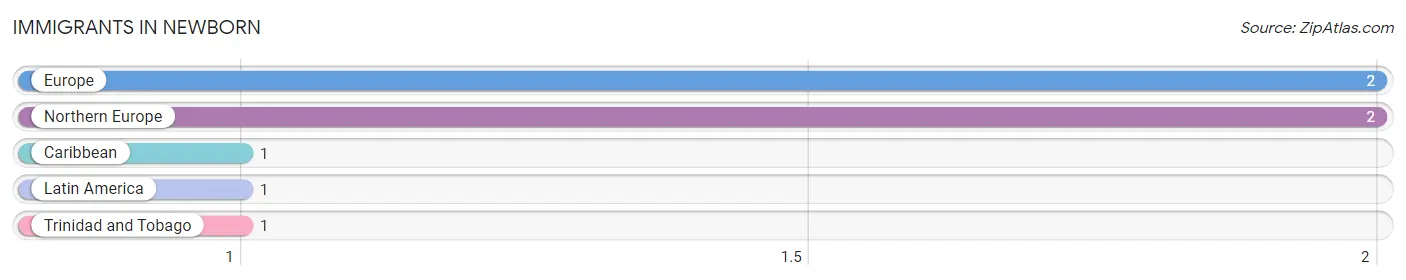
| Immigration Origin | # Population | % Population |
| Caribbean | 1 | 0.2% |
| Europe | 2 | 0.3% |
| Latin America | 1 | 0.2% |
| Northern Europe | 2 | 0.3% |
| Trinidad and Tobago | 1 | 0.2% | View All 5 Rows |
Sex and Age in Newborn
Sex and Age in Newborn
The most populous age groups in Newborn are 20 to 24 Years (59 | 16.3%) for men and 55 to 59 Years (34 | 12.1%) for women.
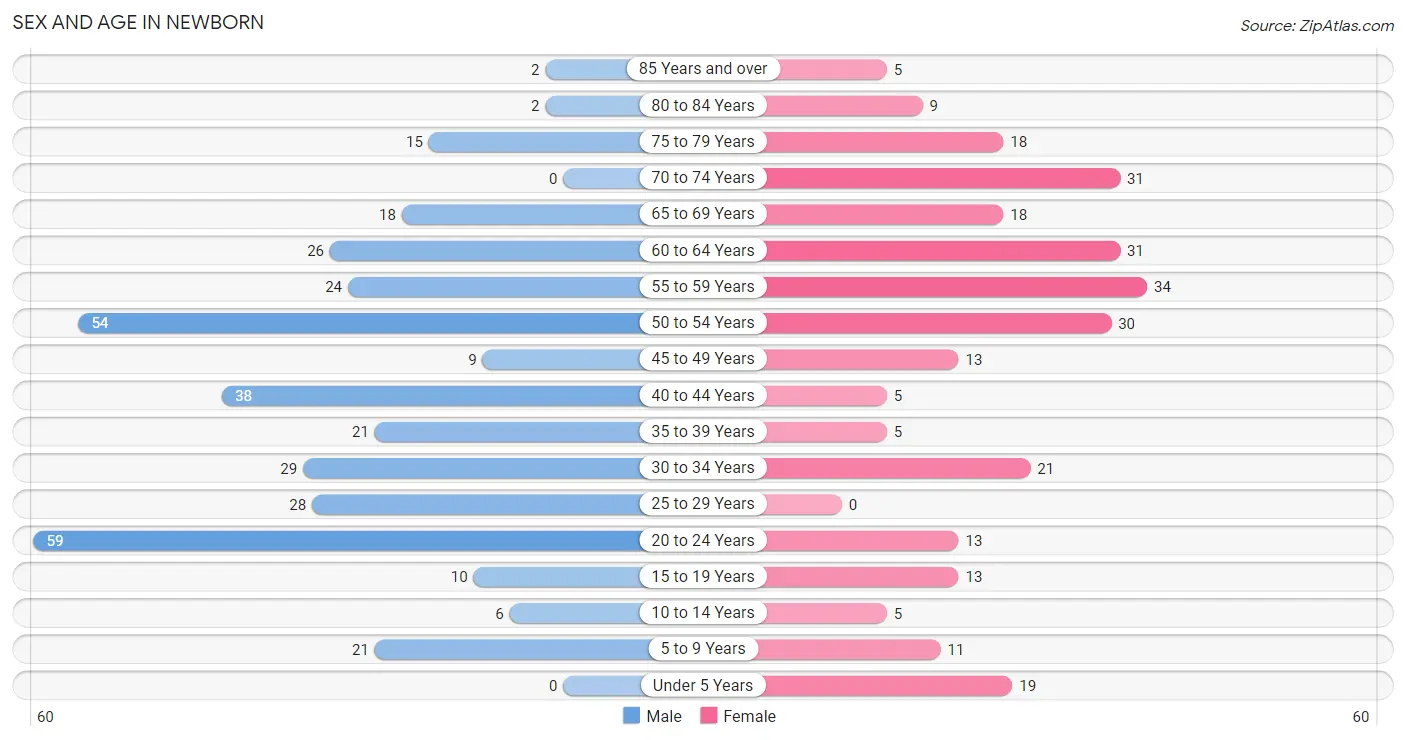
| Age Bracket | Male | Female |
| Under 5 Years | 0 (0.0%) | 19 (6.8%) |
| 5 to 9 Years | 21 (5.8%) | 11 (3.9%) |
| 10 to 14 Years | 6 (1.7%) | 5 (1.8%) |
| 15 to 19 Years | 10 (2.8%) | 13 (4.6%) |
| 20 to 24 Years | 59 (16.3%) | 13 (4.6%) |
| 25 to 29 Years | 28 (7.7%) | 0 (0.0%) |
| 30 to 34 Years | 29 (8.0%) | 21 (7.5%) |
| 35 to 39 Years | 21 (5.8%) | 5 (1.8%) |
| 40 to 44 Years | 38 (10.5%) | 5 (1.8%) |
| 45 to 49 Years | 9 (2.5%) | 13 (4.6%) |
| 50 to 54 Years | 54 (14.9%) | 30 (10.7%) |
| 55 to 59 Years | 24 (6.6%) | 34 (12.1%) |
| 60 to 64 Years | 26 (7.2%) | 31 (11.0%) |
| 65 to 69 Years | 18 (5.0%) | 18 (6.4%) |
| 70 to 74 Years | 0 (0.0%) | 31 (11.0%) |
| 75 to 79 Years | 15 (4.1%) | 18 (6.4%) |
| 80 to 84 Years | 2 (0.5%) | 9 (3.2%) |
| 85 Years and over | 2 (0.5%) | 5 (1.8%) |
| Total | 362 (100.0%) | 281 (100.0%) |
Families and Households in Newborn
Median Family Size in Newborn
The median family size in Newborn is 2.97 persons per family, with married-couple families (124 | 66.3%) accounting for the largest median family size of 3.23 persons per family. On the other hand, single male/father families (25 | 13.4%) represent the smallest median family size with 1.96 persons per family.
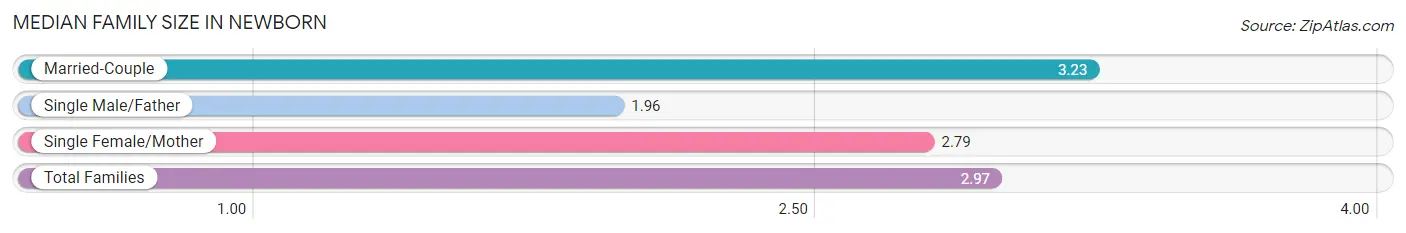
| Family Type | # Families | Family Size |
| Married-Couple | 124 (66.3%) | 3.23 |
| Single Male/Father | 25 (13.4%) | 1.96 |
| Single Female/Mother | 38 (20.3%) | 2.79 |
| Total Families | 187 (100.0%) | 2.97 |
Median Household Size in Newborn
The median household size in Newborn is 2.60 persons per household, with single female/mother households (38 | 15.5%) accounting for the largest median household size of 3.37 persons per household. non-family households (58 | 23.7%) represent the smallest median household size with 1.03 persons per household.
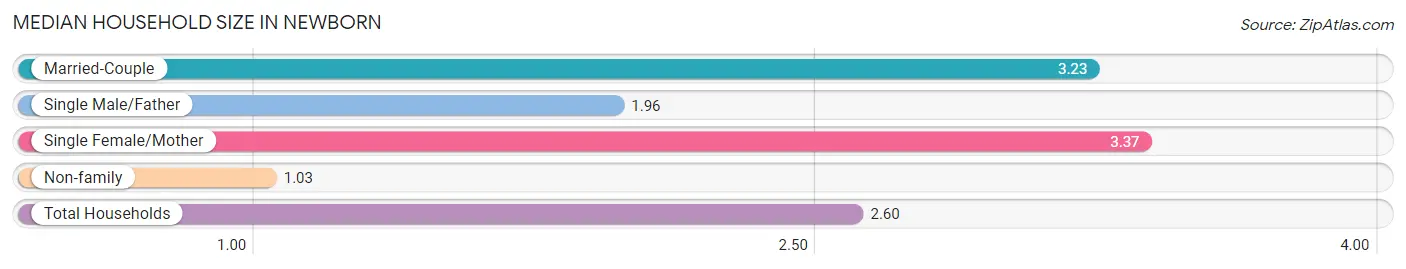
| Household Type | # Households | Household Size |
| Married-Couple | 124 (50.6%) | 3.23 |
| Single Male/Father | 25 (10.2%) | 1.96 |
| Single Female/Mother | 38 (15.5%) | 3.37 |
| Non-family | 58 (23.7%) | 1.03 |
| Total Households | 245 (100.0%) | 2.60 |
Household Size by Marriage Status in Newborn
Out of a total of 245 households in Newborn, 187 (76.3%) are family households, while 58 (23.7%) are nonfamily households. The most numerous type of family households are 2-person households, comprising 96, and the most common type of nonfamily households are 1-person households, comprising 56.
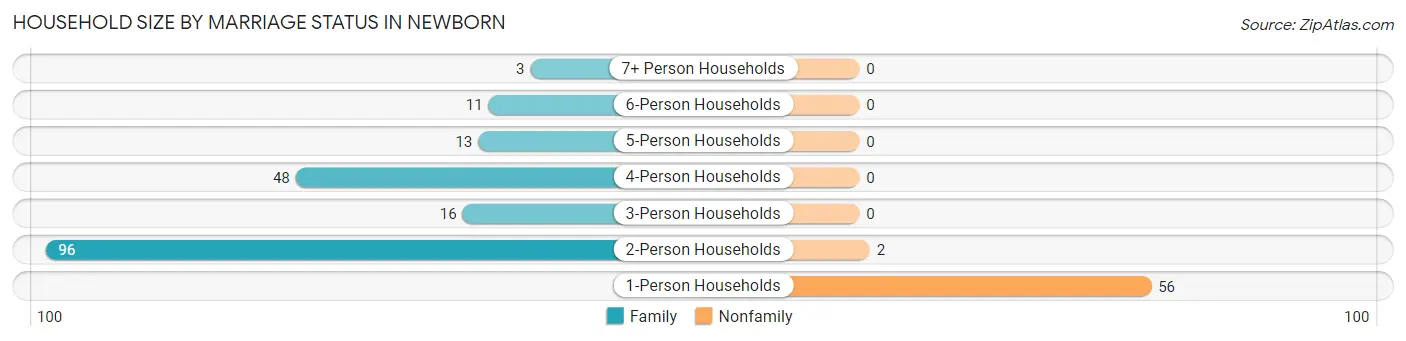
| Household Size | Family Households | Nonfamily Households |
| 1-Person Households | - | 56 (22.9%) |
| 2-Person Households | 96 (39.2%) | 2 (0.8%) |
| 3-Person Households | 16 (6.5%) | 0 (0.0%) |
| 4-Person Households | 48 (19.6%) | 0 (0.0%) |
| 5-Person Households | 13 (5.3%) | 0 (0.0%) |
| 6-Person Households | 11 (4.5%) | 0 (0.0%) |
| 7+ Person Households | 3 (1.2%) | 0 (0.0%) |
| Total | 187 (76.3%) | 58 (23.7%) |
Female Fertility in Newborn
Fertility by Age in Newborn
Average fertility rate in Newborn is 57.0 births per 1,000 women. Women in the age bracket of 20 to 34 years have the highest fertility rate with 118.0 births per 1,000 women. Women in the age bracket of 20 to 34 years acount for 100.0% of all women with births.
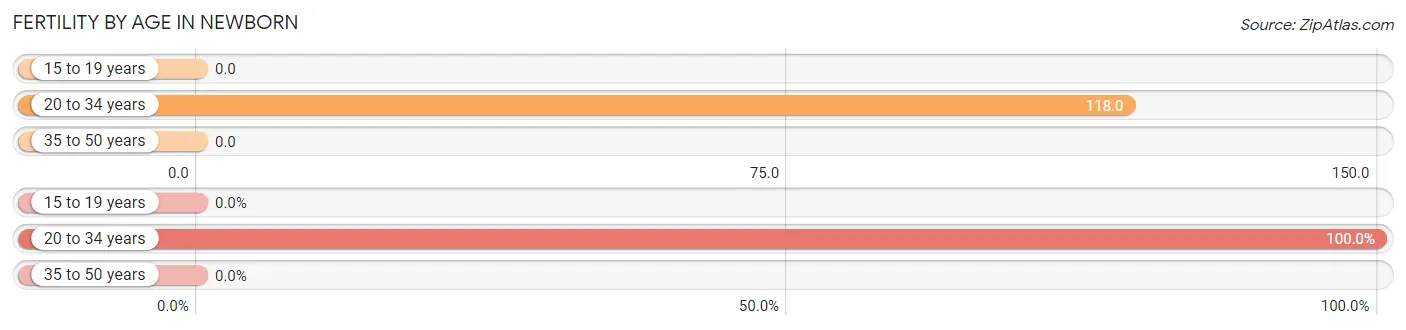
| Age Bracket | Women with Births | Births / 1,000 Women |
| 15 to 19 years | 0 (0.0%) | 0.0 |
| 20 to 34 years | 4 (100.0%) | 118.0 |
| 35 to 50 years | 0 (0.0%) | 0.0 |
| Total | 4 (100.0%) | 57.0 |
Fertility by Age by Marriage Status in Newborn
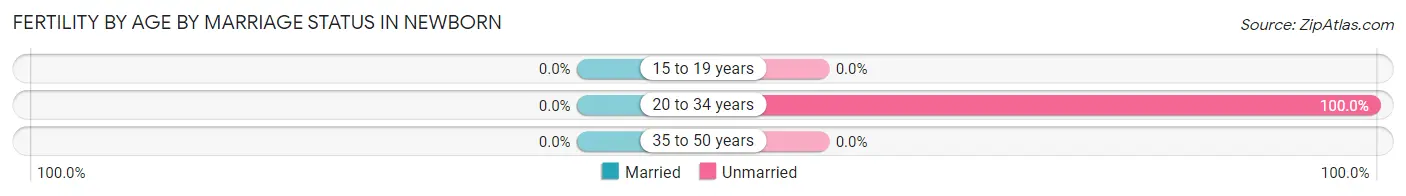
| Age Bracket | Married | Unmarried |
| 15 to 19 years | 0 (0.0%) | 0 (0.0%) |
| 20 to 34 years | 0 (0.0%) | 4 (100.0%) |
| 35 to 50 years | 0 (0.0%) | 0 (0.0%) |
| Total | 0 (0.0%) | 4 (100.0%) |
Fertility by Education in Newborn
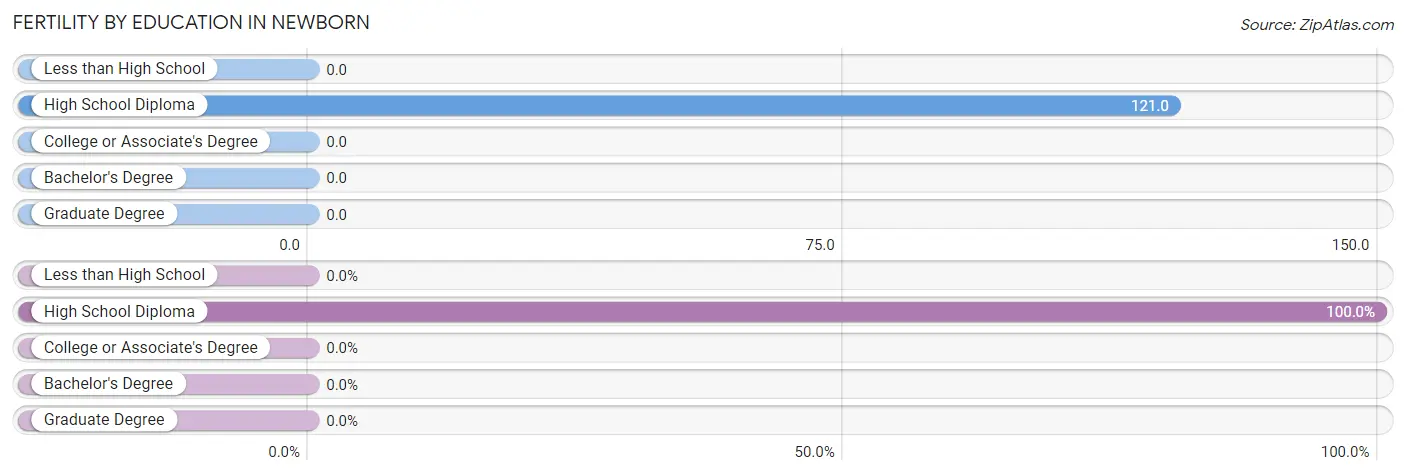
| Educational Attainment | Women with Births | Births / 1,000 Women |
| Less than High School | 0 (0.0%) | 0.0 |
| High School Diploma | 4 (100.0%) | 121.0 |
| College or Associate's Degree | 0 (0.0%) | 0.0 |
| Bachelor's Degree | 0 (0.0%) | 0.0 |
| Graduate Degree | 0 (0.0%) | 0.0 |
| Total | 4 (100.0%) | 57.0 |
Fertility by Education by Marriage Status in Newborn
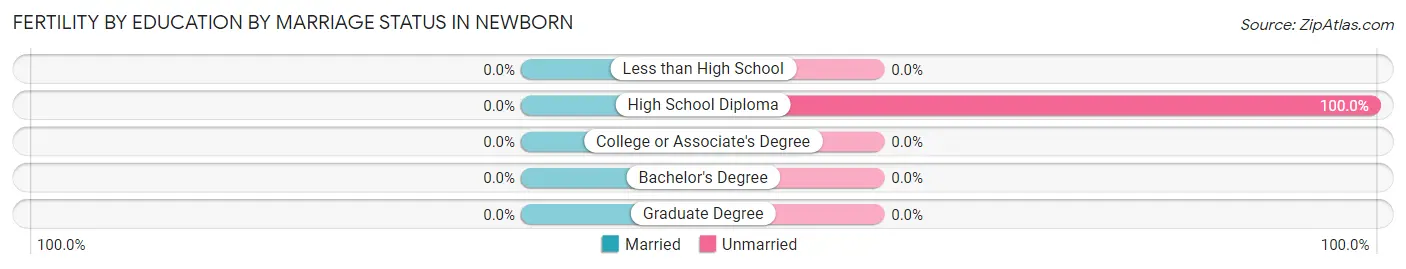
| Educational Attainment | Married | Unmarried |
| Less than High School | 0 (0.0%) | 0 (0.0%) |
| High School Diploma | 0 (0.0%) | 4 (100.0%) |
| College or Associate's Degree | 0 (0.0%) | 0 (0.0%) |
| Bachelor's Degree | 0 (0.0%) | 0 (0.0%) |
| Graduate Degree | 0 (0.0%) | 0 (0.0%) |
| Total | 0 (0.0%) | 4 (100.0%) |
Employment Characteristics in Newborn
Employment by Class of Employer in Newborn
Among the 323 employed individuals in Newborn, private company employees (228 | 70.6%), self-employed (incorporated) (24 | 7.4%), and self-employed (not incorporated) (22 | 6.8%) make up the most common classes of employment.
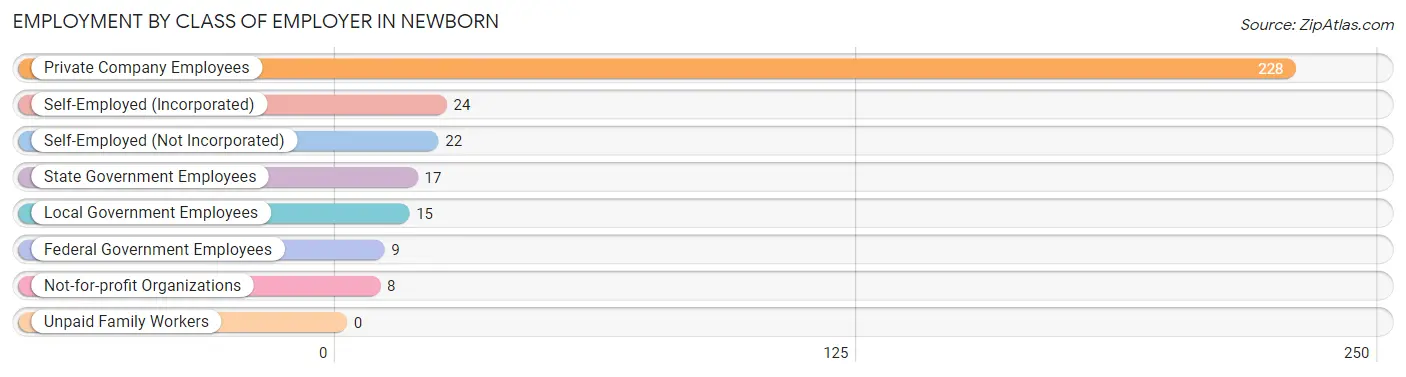
| Employer Class | # Employees | % Employees |
| Private Company Employees | 228 | 70.6% |
| Self-Employed (Incorporated) | 24 | 7.4% |
| Self-Employed (Not Incorporated) | 22 | 6.8% |
| Not-for-profit Organizations | 8 | 2.5% |
| Local Government Employees | 15 | 4.6% |
| State Government Employees | 17 | 5.3% |
| Federal Government Employees | 9 | 2.8% |
| Unpaid Family Workers | 0 | 0.0% |
| Total | 323 | 100.0% |
Employment Status by Age in Newborn
According to the labor force statistics for Newborn, out of the total population over 16 years of age (579), 63.7% or 369 individuals are in the labor force, with 10.3% or 38 of them unemployed. The age group with the highest labor force participation rate is 25 to 29 years, with 100.0% or 28 individuals in the labor force. Within the labor force, the 16 to 19 years age range has the highest percentage of unemployed individuals, with 100.0% or 6 of them being unemployed.
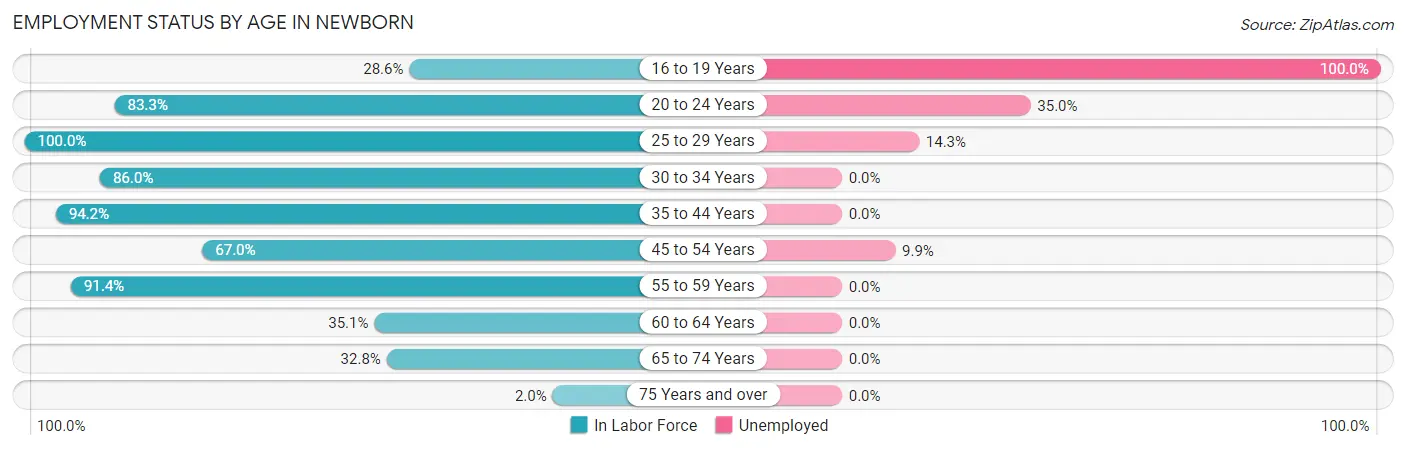
| Age Bracket | In Labor Force | Unemployed |
| 16 to 19 Years | 6 (28.6%) | 6 (100.0%) |
| 20 to 24 Years | 60 (83.3%) | 21 (35.0%) |
| 25 to 29 Years | 28 (100.0%) | 4 (14.3%) |
| 30 to 34 Years | 43 (86.0%) | 0 (0.0%) |
| 35 to 44 Years | 65 (94.2%) | 0 (0.0%) |
| 45 to 54 Years | 71 (67.0%) | 7 (9.9%) |
| 55 to 59 Years | 53 (91.4%) | 0 (0.0%) |
| 60 to 64 Years | 20 (35.1%) | 0 (0.0%) |
| 65 to 74 Years | 22 (32.8%) | 0 (0.0%) |
| 75 Years and over | 1 (2.0%) | 0 (0.0%) |
| Total | 369 (63.7%) | 38 (10.3%) |
Employment Status by Educational Attainment in Newborn
According to labor force statistics for Newborn, 76.1% of individuals (280) out of the total population between 25 and 64 years of age (368) are in the labor force, with 3.9% or 11 of them being unemployed. The group with the highest labor force participation rate are those with the educational attainment of bachelor's degree or higher, with 89.5% or 51 individuals in the labor force. Within the labor force, individuals with high school diploma education have the highest percentage of unemployment, with 7.4% or 11 of them being unemployed.
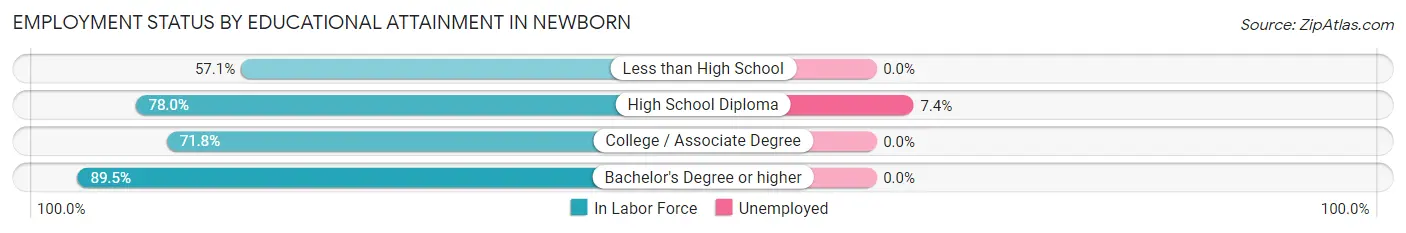
| Educational Attainment | In Labor Force | Unemployed |
| Less than High School | 24 (57.1%) | 0 (0.0%) |
| High School Diploma | 149 (78.0%) | 14 (7.4%) |
| College / Associate Degree | 56 (71.8%) | 0 (0.0%) |
| Bachelor's Degree or higher | 51 (89.5%) | 0 (0.0%) |
| Total | 280 (76.1%) | 14 (3.9%) |
Employment Occupations by Sex in Newborn
Management, Business, Science and Arts Occupations
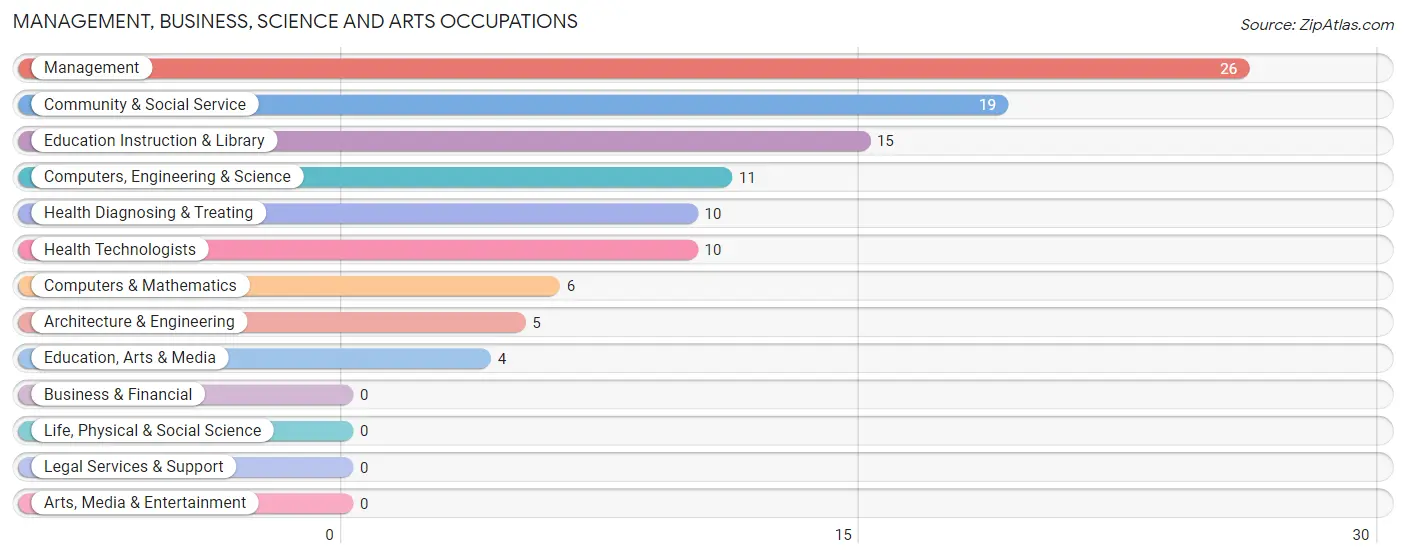
The most common Management, Business, Science and Arts occupations in Newborn are Management (26 | 7.9%), Community & Social Service (19 | 5.7%), Education Instruction & Library (15 | 4.5%), Computers, Engineering & Science (11 | 3.3%), and Health Diagnosing & Treating (10 | 3.0%).
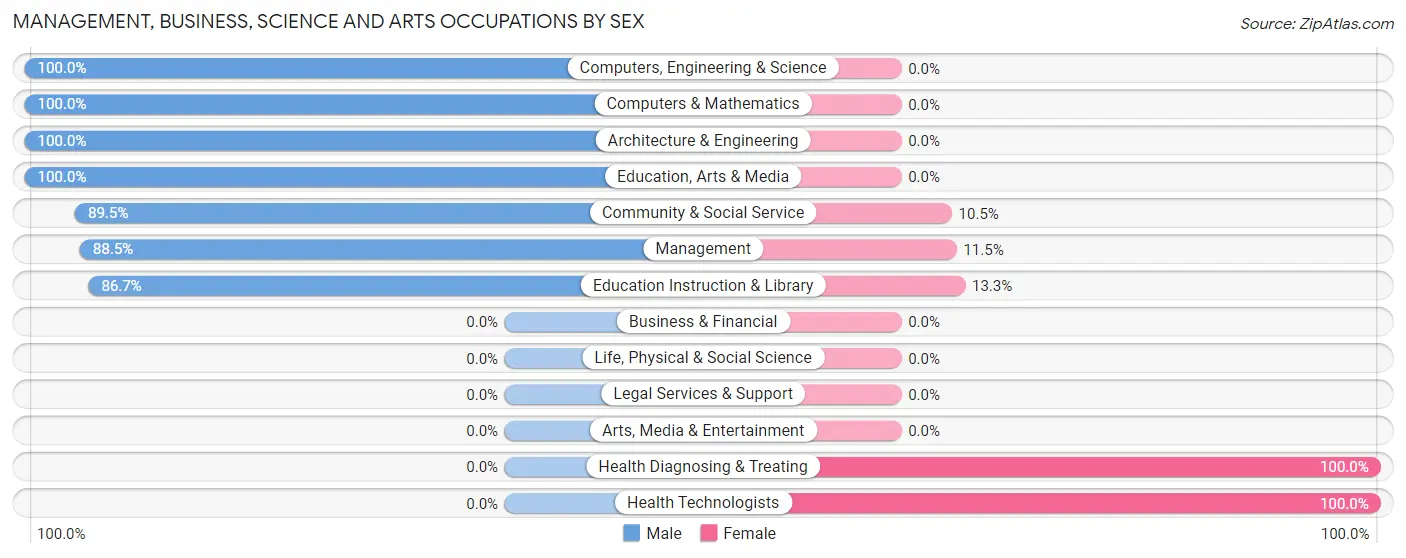
Management, Business, Science and Arts Occupations by Sex
Within the Management, Business, Science and Arts occupations in Newborn, the most male-oriented occupations are Computers, Engineering & Science (100.0%), Computers & Mathematics (100.0%), and Architecture & Engineering (100.0%), while the most female-oriented occupations are Health Diagnosing & Treating (100.0%), Health Technologists (100.0%), and Education Instruction & Library (13.3%).
| Occupation | Male | Female |
| Management | 23 (88.5%) | 3 (11.5%) |
| Business & Financial | 0 (0.0%) | 0 (0.0%) |
| Computers, Engineering & Science | 11 (100.0%) | 0 (0.0%) |
| Computers & Mathematics | 6 (100.0%) | 0 (0.0%) |
| Architecture & Engineering | 5 (100.0%) | 0 (0.0%) |
| Life, Physical & Social Science | 0 (0.0%) | 0 (0.0%) |
| Community & Social Service | 17 (89.5%) | 2 (10.5%) |
| Education, Arts & Media | 4 (100.0%) | 0 (0.0%) |
| Legal Services & Support | 0 (0.0%) | 0 (0.0%) |
| Education Instruction & Library | 13 (86.7%) | 2 (13.3%) |
| Arts, Media & Entertainment | 0 (0.0%) | 0 (0.0%) |
| Health Diagnosing & Treating | 0 (0.0%) | 10 (100.0%) |
| Health Technologists | 0 (0.0%) | 10 (100.0%) |
| Total (Category) | 51 (77.3%) | 15 (22.7%) |
| Total (Overall) | 217 (65.6%) | 114 (34.4%) |
Services Occupations
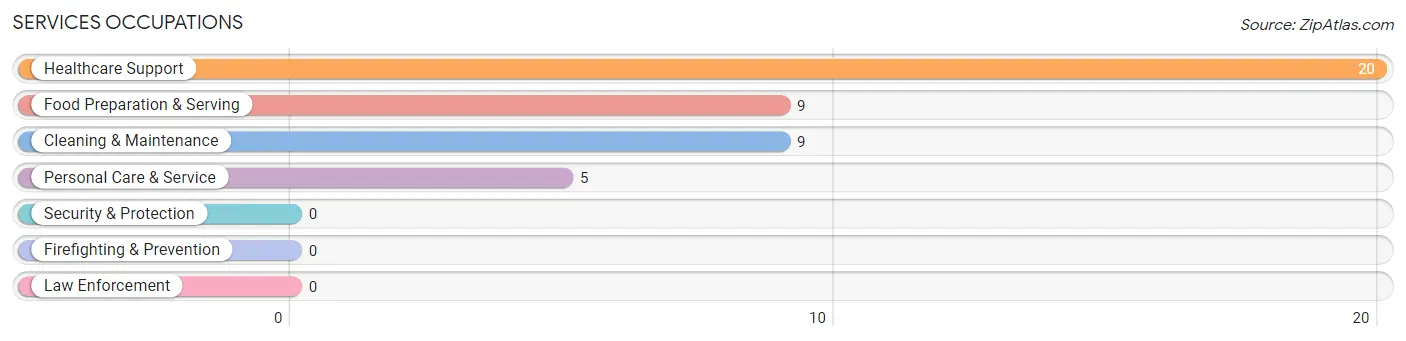
The most common Services occupations in Newborn are Healthcare Support (20 | 6.0%), Food Preparation & Serving (9 | 2.7%), Cleaning & Maintenance (9 | 2.7%), and Personal Care & Service (5 | 1.5%).
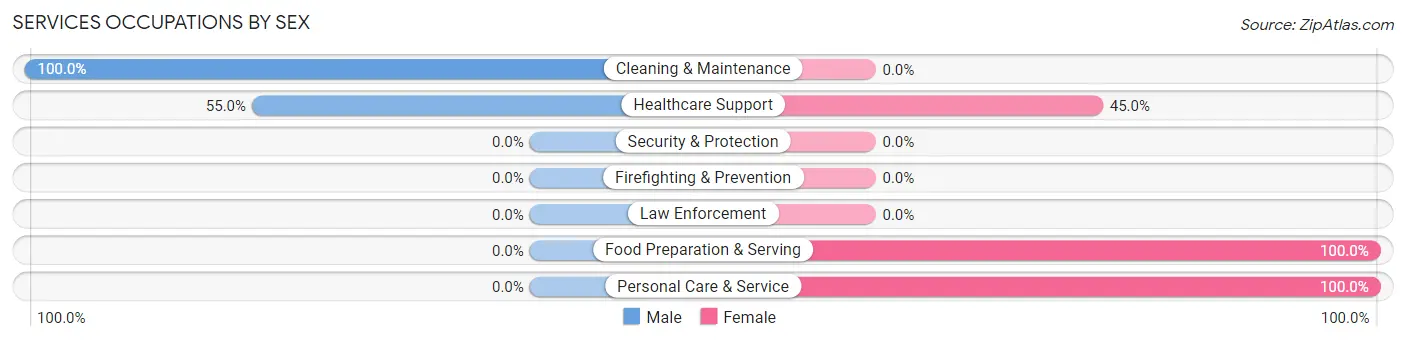
Services Occupations by Sex
Within the Services occupations in Newborn, the most male-oriented occupations are Cleaning & Maintenance (100.0%), and Healthcare Support (55.0%), while the most female-oriented occupations are Food Preparation & Serving (100.0%), Personal Care & Service (100.0%), and Healthcare Support (45.0%).
| Occupation | Male | Female |
| Healthcare Support | 11 (55.0%) | 9 (45.0%) |
| Security & Protection | 0 (0.0%) | 0 (0.0%) |
| Firefighting & Prevention | 0 (0.0%) | 0 (0.0%) |
| Law Enforcement | 0 (0.0%) | 0 (0.0%) |
| Food Preparation & Serving | 0 (0.0%) | 9 (100.0%) |
| Cleaning & Maintenance | 9 (100.0%) | 0 (0.0%) |
| Personal Care & Service | 0 (0.0%) | 5 (100.0%) |
| Total (Category) | 20 (46.5%) | 23 (53.5%) |
| Total (Overall) | 217 (65.6%) | 114 (34.4%) |
Sales and Office Occupations
The most common Sales and Office occupations in Newborn are Sales & Related (47 | 14.2%), and Office & Administration (34 | 10.3%).

Sales and Office Occupations by Sex

| Occupation | Male | Female |
| Sales & Related | 26 (55.3%) | 21 (44.7%) |
| Office & Administration | 5 (14.7%) | 29 (85.3%) |
| Total (Category) | 31 (38.3%) | 50 (61.7%) |
| Total (Overall) | 217 (65.6%) | 114 (34.4%) |
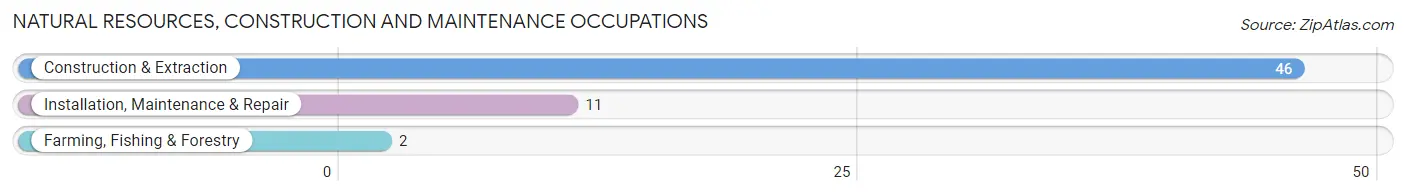
Natural Resources, Construction and Maintenance Occupations
The most common Natural Resources, Construction and Maintenance occupations in Newborn are Construction & Extraction (46 | 13.9%), Installation, Maintenance & Repair (11 | 3.3%), and Farming, Fishing & Forestry (2 | 0.6%).
Natural Resources, Construction and Maintenance Occupations by Sex
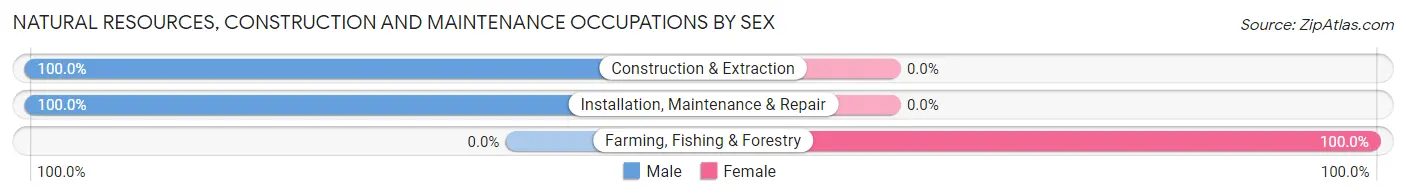
| Occupation | Male | Female |
| Farming, Fishing & Forestry | 0 (0.0%) | 2 (100.0%) |
| Construction & Extraction | 46 (100.0%) | 0 (0.0%) |
| Installation, Maintenance & Repair | 11 (100.0%) | 0 (0.0%) |
| Total (Category) | 57 (96.6%) | 2 (3.4%) |
| Total (Overall) | 217 (65.6%) | 114 (34.4%) |
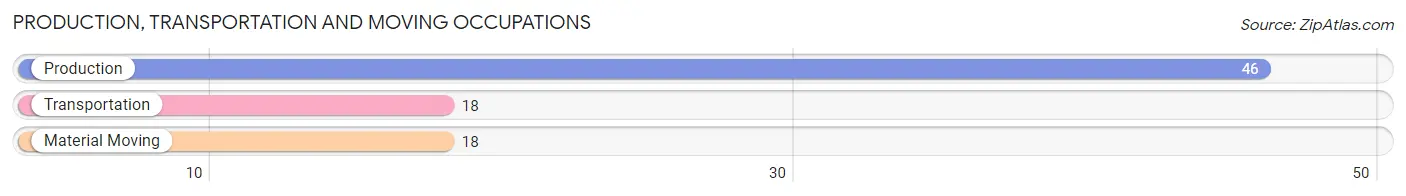
Production, Transportation and Moving Occupations
The most common Production, Transportation and Moving occupations in Newborn are Production (46 | 13.9%), Transportation (18 | 5.4%), and Material Moving (18 | 5.4%).
Production, Transportation and Moving Occupations by Sex
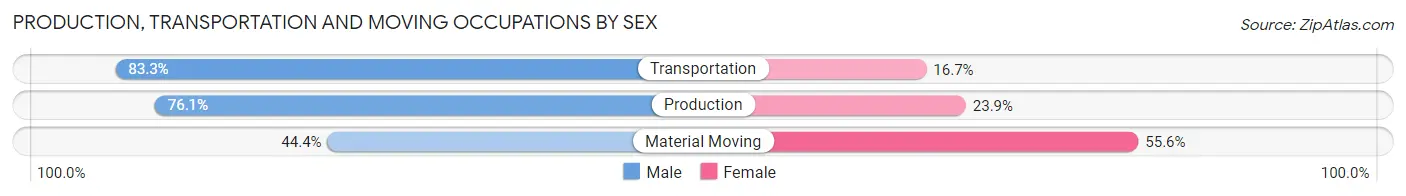
| Occupation | Male | Female |
| Production | 35 (76.1%) | 11 (23.9%) |
| Transportation | 15 (83.3%) | 3 (16.7%) |
| Material Moving | 8 (44.4%) | 10 (55.6%) |
| Total (Category) | 58 (70.7%) | 24 (29.3%) |
| Total (Overall) | 217 (65.6%) | 114 (34.4%) |
Employment Industries by Sex in Newborn
Employment Industries in Newborn
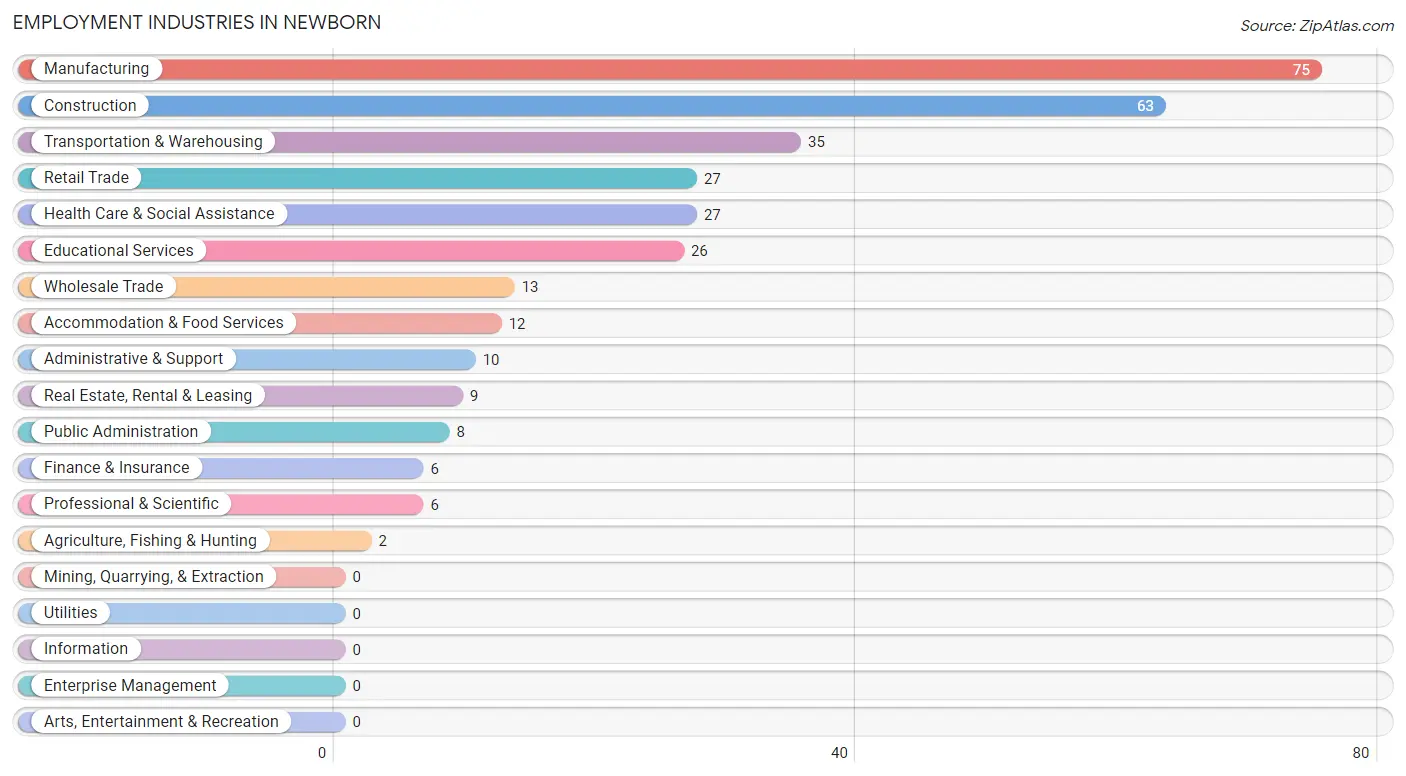
The major employment industries in Newborn include Manufacturing (75 | 22.7%), Construction (63 | 19.0%), Transportation & Warehousing (35 | 10.6%), Retail Trade (27 | 8.2%), and Health Care & Social Assistance (27 | 8.2%).
Employment Industries by Sex in Newborn
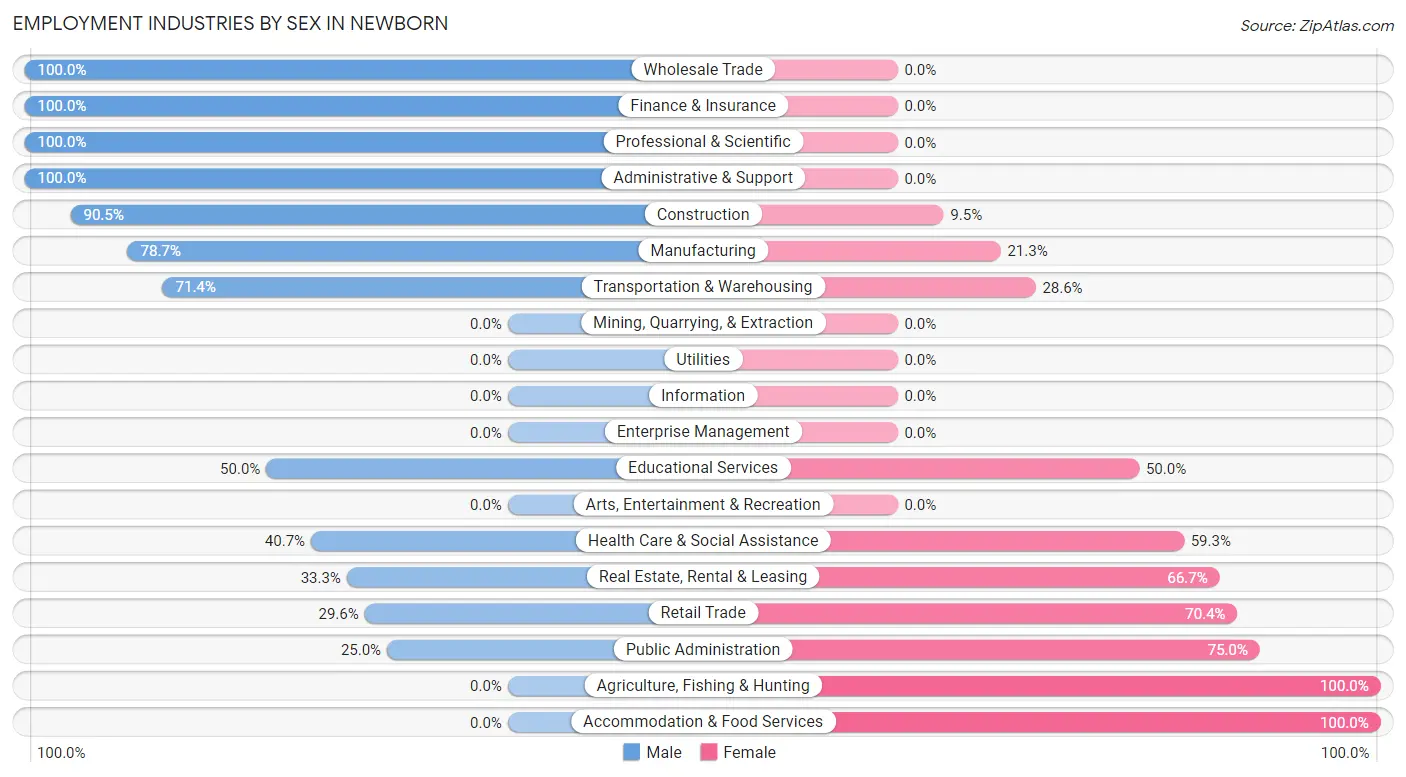
The Newborn industries that see more men than women are Wholesale Trade (100.0%), Finance & Insurance (100.0%), and Professional & Scientific (100.0%), whereas the industries that tend to have a higher number of women are Agriculture, Fishing & Hunting (100.0%), Accommodation & Food Services (100.0%), and Public Administration (75.0%).
| Industry | Male | Female |
| Agriculture, Fishing & Hunting | 0 (0.0%) | 2 (100.0%) |
| Mining, Quarrying, & Extraction | 0 (0.0%) | 0 (0.0%) |
| Construction | 57 (90.5%) | 6 (9.5%) |
| Manufacturing | 59 (78.7%) | 16 (21.3%) |
| Wholesale Trade | 13 (100.0%) | 0 (0.0%) |
| Retail Trade | 8 (29.6%) | 19 (70.4%) |
| Transportation & Warehousing | 25 (71.4%) | 10 (28.6%) |
| Utilities | 0 (0.0%) | 0 (0.0%) |
| Information | 0 (0.0%) | 0 (0.0%) |
| Finance & Insurance | 6 (100.0%) | 0 (0.0%) |
| Real Estate, Rental & Leasing | 3 (33.3%) | 6 (66.7%) |
| Professional & Scientific | 6 (100.0%) | 0 (0.0%) |
| Enterprise Management | 0 (0.0%) | 0 (0.0%) |
| Administrative & Support | 10 (100.0%) | 0 (0.0%) |
| Educational Services | 13 (50.0%) | 13 (50.0%) |
| Health Care & Social Assistance | 11 (40.7%) | 16 (59.3%) |
| Arts, Entertainment & Recreation | 0 (0.0%) | 0 (0.0%) |
| Accommodation & Food Services | 0 (0.0%) | 12 (100.0%) |
| Public Administration | 2 (25.0%) | 6 (75.0%) |
| Total | 217 (65.6%) | 114 (34.4%) |
Education in Newborn
School Enrollment in Newborn
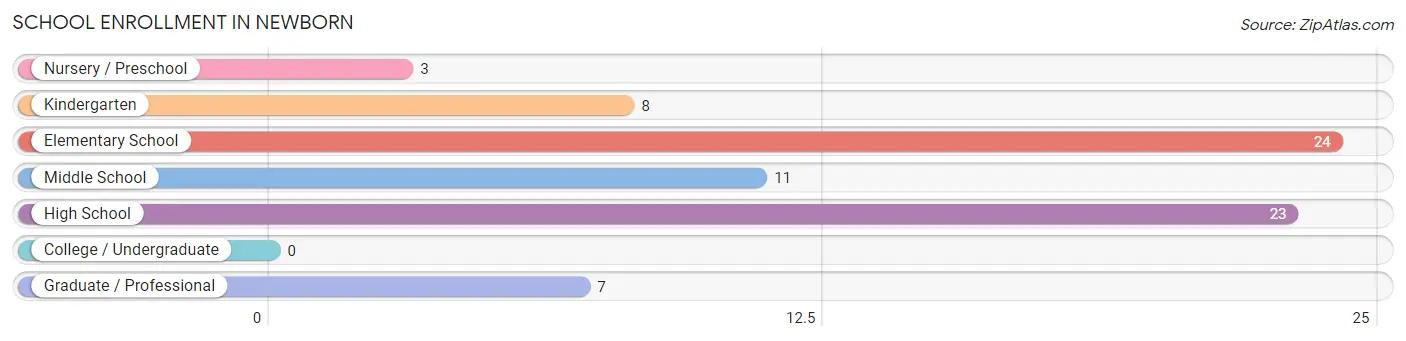
The most common levels of schooling among the 76 students in Newborn are elementary school (24 | 31.6%), high school (23 | 30.3%), and middle school (11 | 14.5%).
| School Level | # Students | % Students |
| Nursery / Preschool | 3 | 4.0% |
| Kindergarten | 8 | 10.5% |
| Elementary School | 24 | 31.6% |
| Middle School | 11 | 14.5% |
| High School | 23 | 30.3% |
| College / Undergraduate | 0 | 0.0% |
| Graduate / Professional | 7 | 9.2% |
| Total | 76 | 100.0% |
School Enrollment by Age by Funding Source in Newborn
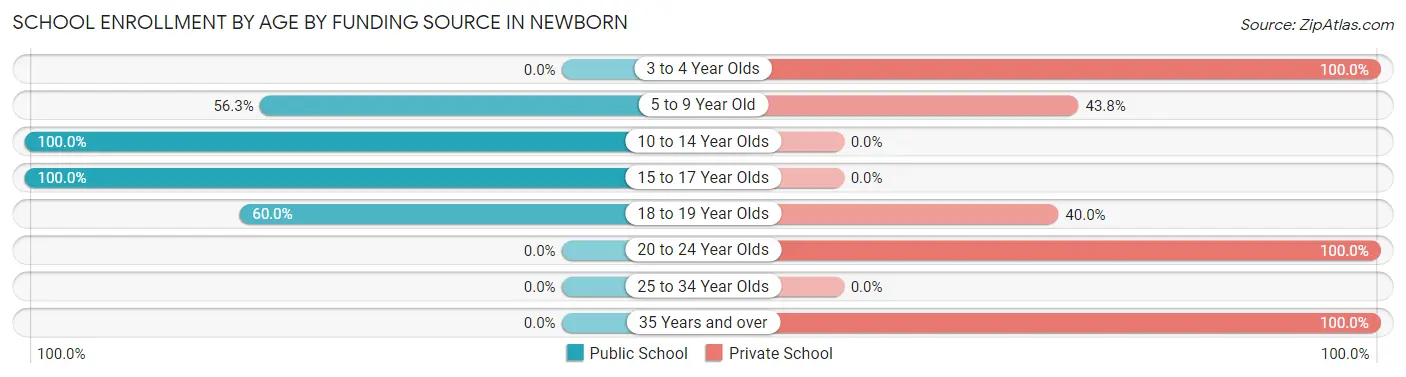
Out of a total of 76 students who are enrolled in schools in Newborn, 26 (34.2%) attend a private institution, while the remaining 50 (65.8%) are enrolled in public schools. The age group of 3 to 4 year olds has the highest likelihood of being enrolled in private schools, with 3 (100.0% in the age bracket) enrolled. Conversely, the age group of 10 to 14 year olds has the lowest likelihood of being enrolled in a private school, with 11 (100.0% in the age bracket) attending a public institution.
| Age Bracket | Public School | Private School |
| 3 to 4 Year Olds | 0 (0.0%) | 3 (100.0%) |
| 5 to 9 Year Old | 18 (56.2%) | 14 (43.8%) |
| 10 to 14 Year Olds | 11 (100.0%) | 0 (0.0%) |
| 15 to 17 Year Olds | 18 (100.0%) | 0 (0.0%) |
| 18 to 19 Year Olds | 3 (60.0%) | 2 (40.0%) |
| 20 to 24 Year Olds | 0 (0.0%) | 3 (100.0%) |
| 25 to 34 Year Olds | 0 (0.0%) | 0 (0.0%) |
| 35 Years and over | 0 (0.0%) | 4 (100.0%) |
| Total | 50 (65.8%) | 26 (34.2%) |
Educational Attainment by Field of Study in Newborn
Business (20 | 23.0%), education (15 | 17.2%), physical & health sciences (13 | 14.9%), science & technology (11 | 12.6%), and social sciences (10 | 11.5%) are the most common fields of study among 87 individuals in Newborn who have obtained a bachelor's degree or higher.
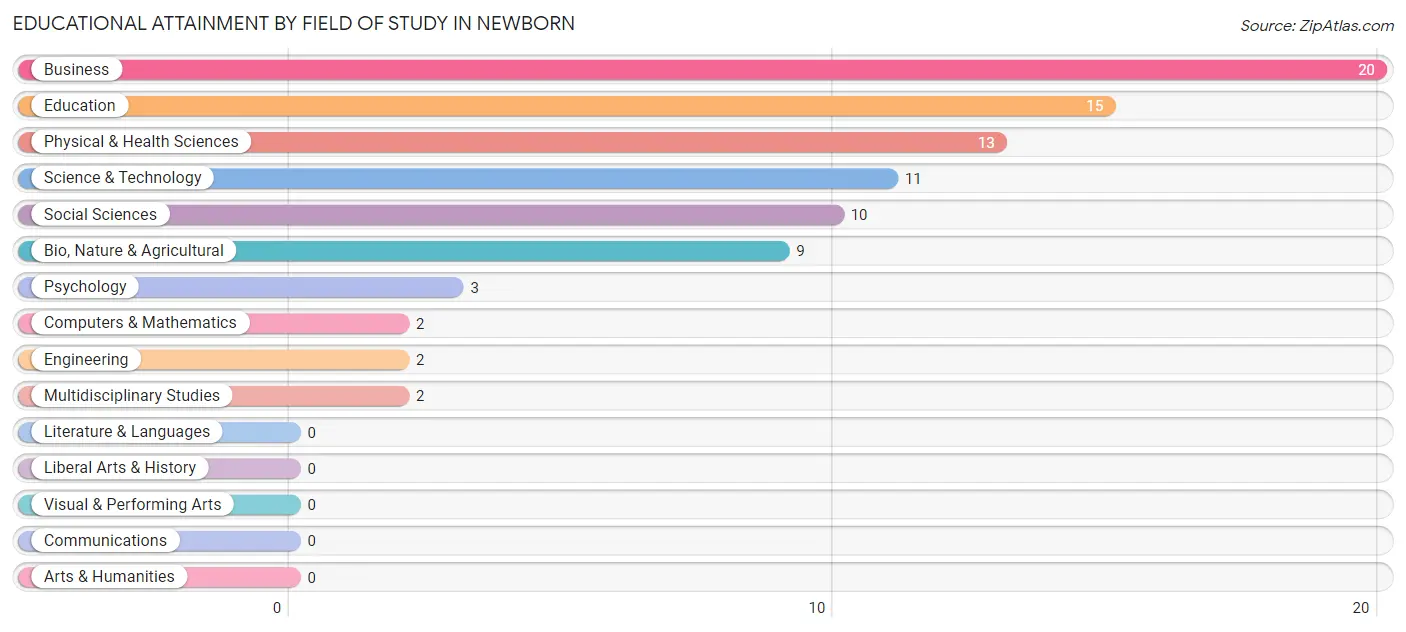
| Field of Study | # Graduates | % Graduates |
| Computers & Mathematics | 2 | 2.3% |
| Bio, Nature & Agricultural | 9 | 10.3% |
| Physical & Health Sciences | 13 | 14.9% |
| Psychology | 3 | 3.5% |
| Social Sciences | 10 | 11.5% |
| Engineering | 2 | 2.3% |
| Multidisciplinary Studies | 2 | 2.3% |
| Science & Technology | 11 | 12.6% |
| Business | 20 | 23.0% |
| Education | 15 | 17.2% |
| Literature & Languages | 0 | 0.0% |
| Liberal Arts & History | 0 | 0.0% |
| Visual & Performing Arts | 0 | 0.0% |
| Communications | 0 | 0.0% |
| Arts & Humanities | 0 | 0.0% |
| Total | 87 | 100.0% |
Transportation & Commute in Newborn
Vehicle Availability by Sex in Newborn
The most prevalent vehicle ownership categories in Newborn are males with 4 vehicles (63, accounting for 30.7%) and females with 4 vehicles (31, making up 55.3%).
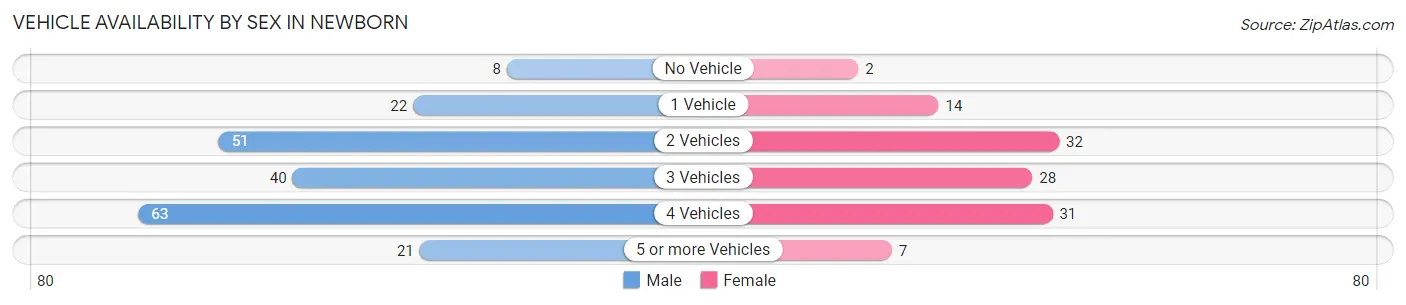
| Vehicles Available | Male | Female |
| No Vehicle | 8 (3.9%) | 2 (1.8%) |
| 1 Vehicle | 22 (10.7%) | 14 (12.3%) |
| 2 Vehicles | 51 (24.9%) | 32 (28.1%) |
| 3 Vehicles | 40 (19.5%) | 28 (24.6%) |
| 4 Vehicles | 63 (30.7%) | 31 (27.2%) |
| 5 or more Vehicles | 21 (10.2%) | 7 (6.1%) |
| Total | 205 (100.0%) | 114 (100.0%) |
Commute Time in Newborn
The most frequently occuring commute durations in Newborn are 30 to 34 minutes (57 commuters, 18.6%), 15 to 19 minutes (47 commuters, 15.3%), and 60 to 89 minutes (46 commuters, 15.0%).
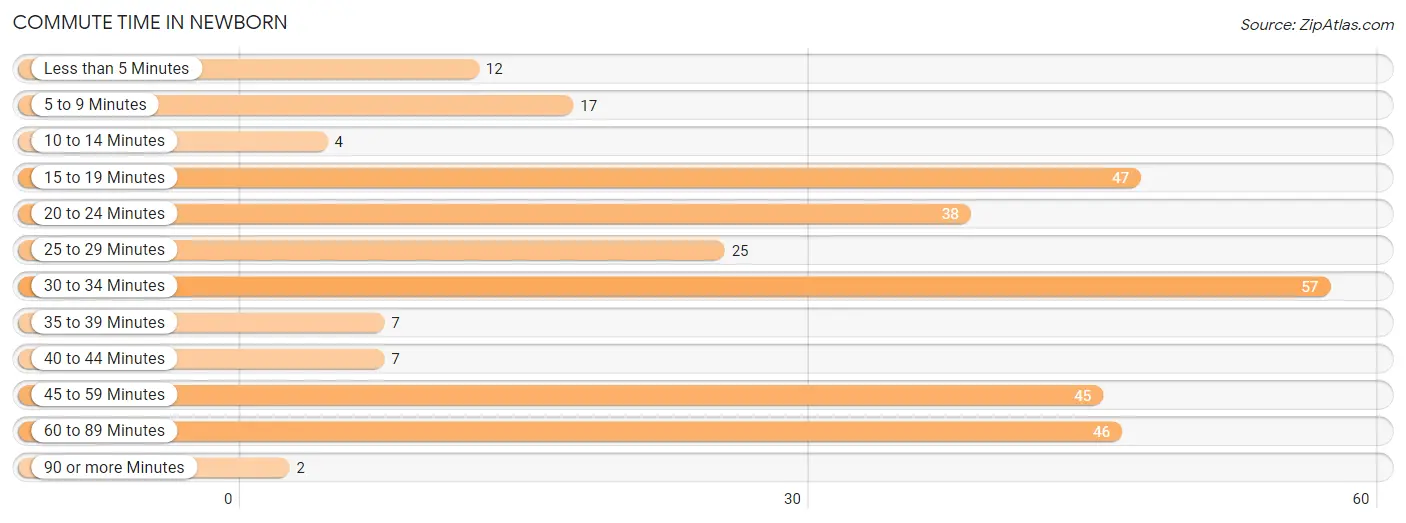
| Commute Time | # Commuters | % Commuters |
| Less than 5 Minutes | 12 | 3.9% |
| 5 to 9 Minutes | 17 | 5.5% |
| 10 to 14 Minutes | 4 | 1.3% |
| 15 to 19 Minutes | 47 | 15.3% |
| 20 to 24 Minutes | 38 | 12.4% |
| 25 to 29 Minutes | 25 | 8.1% |
| 30 to 34 Minutes | 57 | 18.6% |
| 35 to 39 Minutes | 7 | 2.3% |
| 40 to 44 Minutes | 7 | 2.3% |
| 45 to 59 Minutes | 45 | 14.7% |
| 60 to 89 Minutes | 46 | 15.0% |
| 90 or more Minutes | 2 | 0.6% |
Commute Time by Sex in Newborn
The most common commute times in Newborn are 30 to 34 minutes (47 commuters, 23.6%) for males and 20 to 24 minutes (20 commuters, 18.5%) for females.
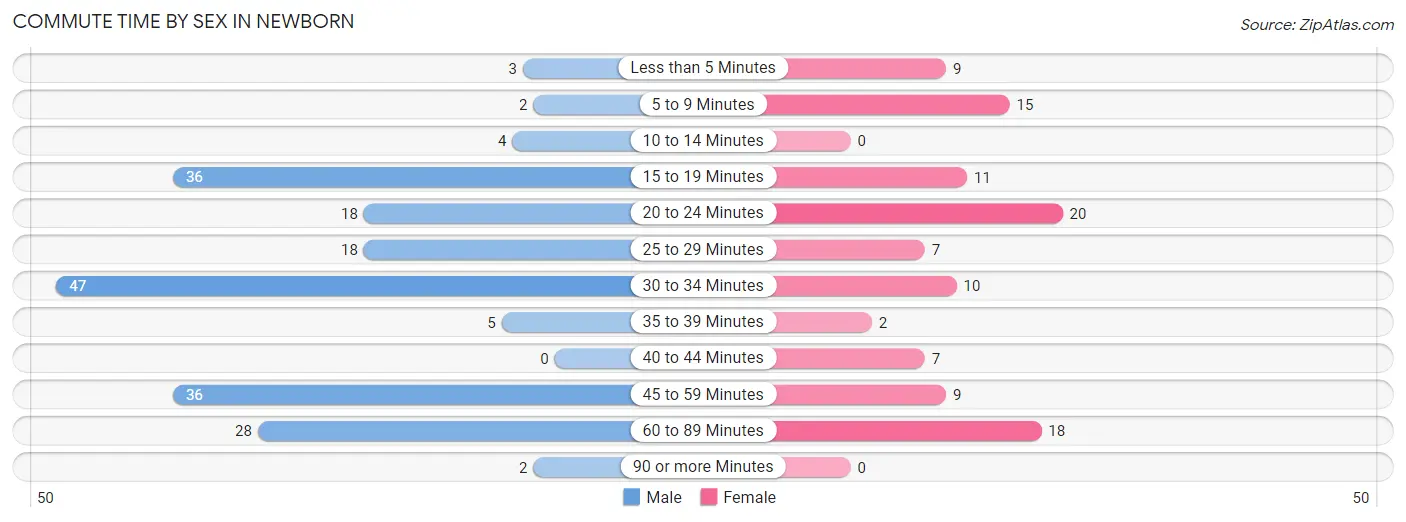
| Commute Time | Male | Female |
| Less than 5 Minutes | 3 (1.5%) | 9 (8.3%) |
| 5 to 9 Minutes | 2 (1.0%) | 15 (13.9%) |
| 10 to 14 Minutes | 4 (2.0%) | 0 (0.0%) |
| 15 to 19 Minutes | 36 (18.1%) | 11 (10.2%) |
| 20 to 24 Minutes | 18 (9.0%) | 20 (18.5%) |
| 25 to 29 Minutes | 18 (9.0%) | 7 (6.5%) |
| 30 to 34 Minutes | 47 (23.6%) | 10 (9.3%) |
| 35 to 39 Minutes | 5 (2.5%) | 2 (1.8%) |
| 40 to 44 Minutes | 0 (0.0%) | 7 (6.5%) |
| 45 to 59 Minutes | 36 (18.1%) | 9 (8.3%) |
| 60 to 89 Minutes | 28 (14.1%) | 18 (16.7%) |
| 90 or more Minutes | 2 (1.0%) | 0 (0.0%) |
Time of Departure to Work by Sex in Newborn
The most frequent times of departure to work in Newborn are 5:00 AM to 5:29 AM (31, 15.6%) for males and 7:00 AM to 7:29 AM (28, 25.9%) for females.
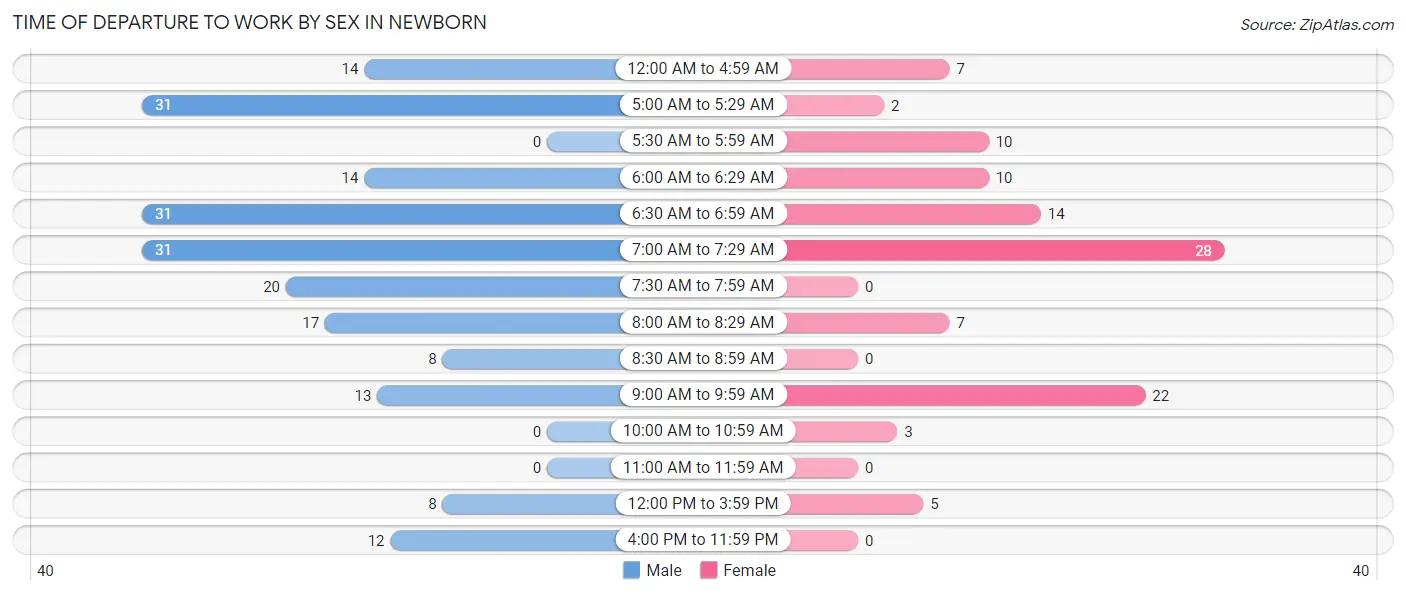
| Time of Departure | Male | Female |
| 12:00 AM to 4:59 AM | 14 (7.0%) | 7 (6.5%) |
| 5:00 AM to 5:29 AM | 31 (15.6%) | 2 (1.8%) |
| 5:30 AM to 5:59 AM | 0 (0.0%) | 10 (9.3%) |
| 6:00 AM to 6:29 AM | 14 (7.0%) | 10 (9.3%) |
| 6:30 AM to 6:59 AM | 31 (15.6%) | 14 (13.0%) |
| 7:00 AM to 7:29 AM | 31 (15.6%) | 28 (25.9%) |
| 7:30 AM to 7:59 AM | 20 (10.1%) | 0 (0.0%) |
| 8:00 AM to 8:29 AM | 17 (8.5%) | 7 (6.5%) |
| 8:30 AM to 8:59 AM | 8 (4.0%) | 0 (0.0%) |
| 9:00 AM to 9:59 AM | 13 (6.5%) | 22 (20.4%) |
| 10:00 AM to 10:59 AM | 0 (0.0%) | 3 (2.8%) |
| 11:00 AM to 11:59 AM | 0 (0.0%) | 0 (0.0%) |
| 12:00 PM to 3:59 PM | 8 (4.0%) | 5 (4.6%) |
| 4:00 PM to 11:59 PM | 12 (6.0%) | 0 (0.0%) |
| Total | 199 (100.0%) | 108 (100.0%) |
Housing Occupancy in Newborn
Occupancy by Ownership in Newborn
Of the total 245 dwellings in Newborn, owner-occupied units account for 192 (78.4%), while renter-occupied units make up 53 (21.6%).
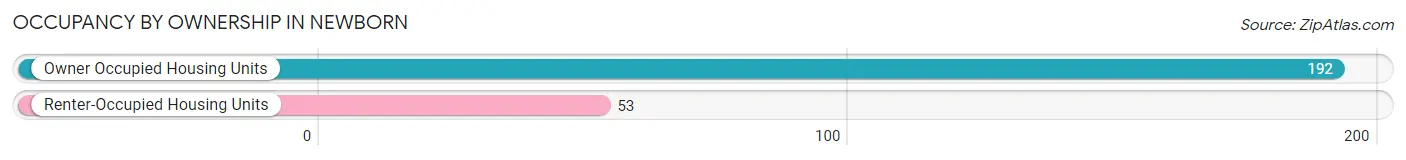
| Occupancy | # Housing Units | % Housing Units |
| Owner Occupied Housing Units | 192 | 78.4% |
| Renter-Occupied Housing Units | 53 | 21.6% |
| Total Occupied Housing Units | 245 | 100.0% |
Occupancy by Household Size in Newborn
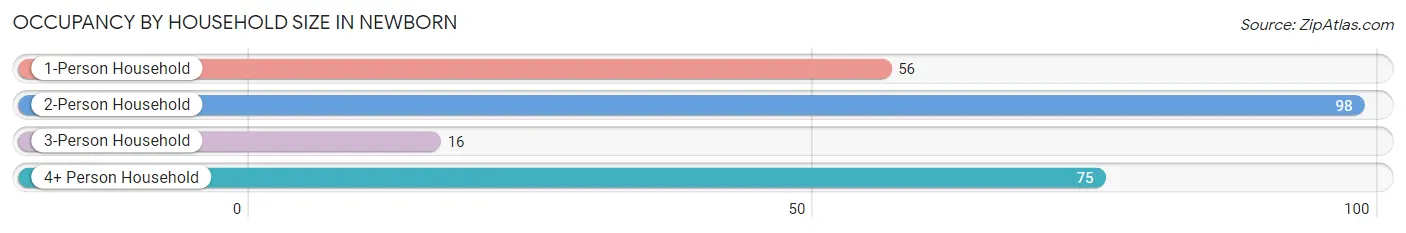
| Household Size | # Housing Units | % Housing Units |
| 1-Person Household | 56 | 22.9% |
| 2-Person Household | 98 | 40.0% |
| 3-Person Household | 16 | 6.5% |
| 4+ Person Household | 75 | 30.6% |
| Total Housing Units | 245 | 100.0% |
Occupancy by Ownership by Household Size in Newborn
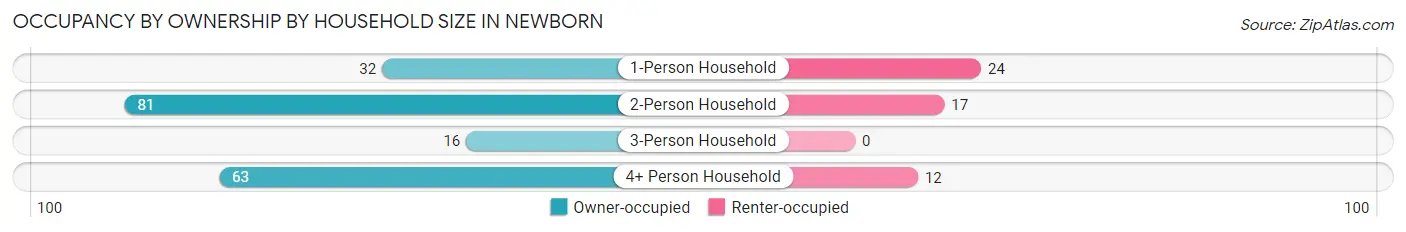
| Household Size | Owner-occupied | Renter-occupied |
| 1-Person Household | 32 (57.1%) | 24 (42.9%) |
| 2-Person Household | 81 (82.7%) | 17 (17.3%) |
| 3-Person Household | 16 (100.0%) | 0 (0.0%) |
| 4+ Person Household | 63 (84.0%) | 12 (16.0%) |
| Total Housing Units | 192 (78.4%) | 53 (21.6%) |
Occupancy by Educational Attainment in Newborn
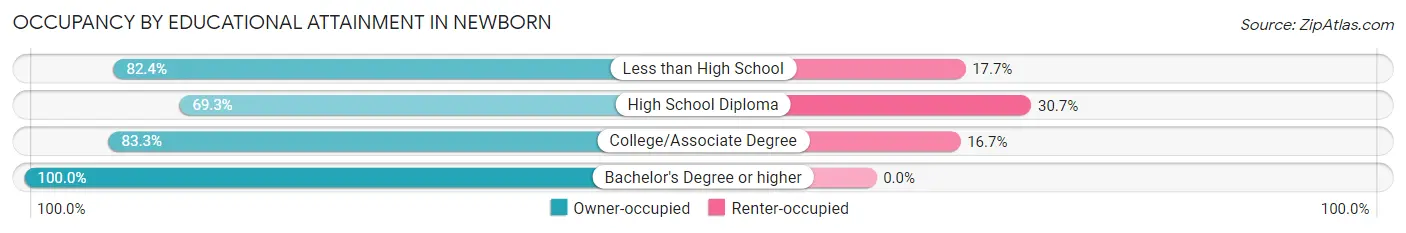
| Household Size | Owner-occupied | Renter-occupied |
| Less than High School | 28 (82.4%) | 6 (17.6%) |
| High School Diploma | 88 (69.3%) | 39 (30.7%) |
| College/Associate Degree | 40 (83.3%) | 8 (16.7%) |
| Bachelor's Degree or higher | 36 (100.0%) | 0 (0.0%) |
Occupancy by Age of Householder in Newborn
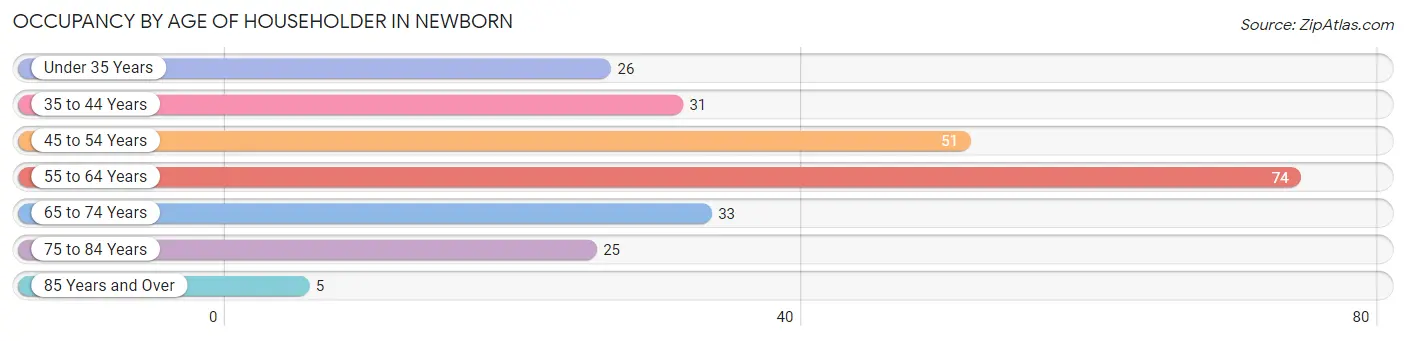
| Age Bracket | # Households | % Households |
| Under 35 Years | 26 | 10.6% |
| 35 to 44 Years | 31 | 12.7% |
| 45 to 54 Years | 51 | 20.8% |
| 55 to 64 Years | 74 | 30.2% |
| 65 to 74 Years | 33 | 13.5% |
| 75 to 84 Years | 25 | 10.2% |
| 85 Years and Over | 5 | 2.0% |
| Total | 245 | 100.0% |
Housing Finances in Newborn
Median Income by Occupancy in Newborn
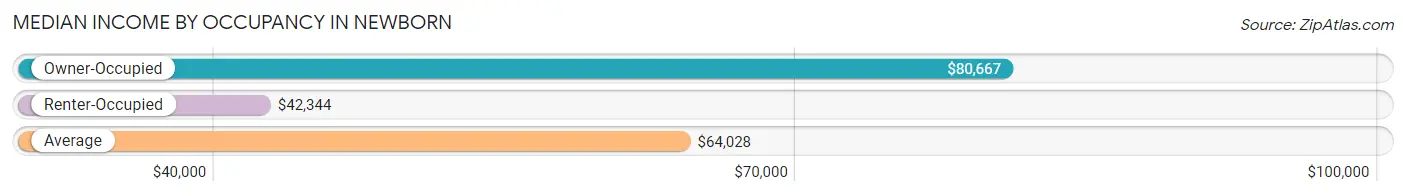
| Occupancy Type | # Households | Median Income |
| Owner-Occupied | 192 (78.4%) | $80,667 |
| Renter-Occupied | 53 (21.6%) | $42,344 |
| Average | 245 (100.0%) | $64,028 |
Occupancy by Householder Income Bracket in Newborn
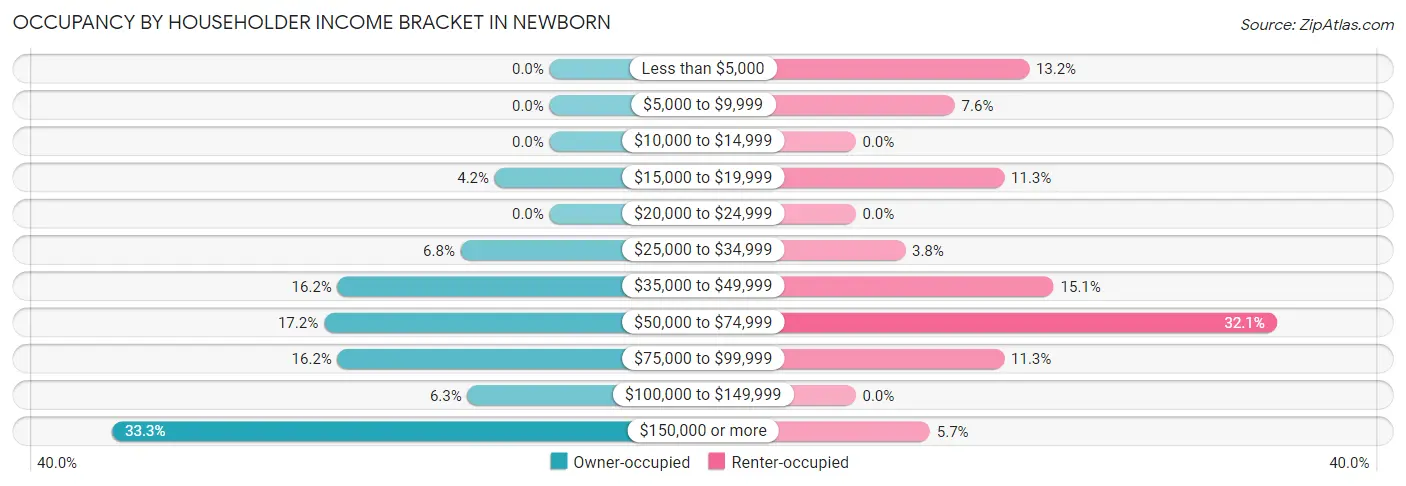
| Income Bracket | Owner-occupied | Renter-occupied |
| Less than $5,000 | 0 (0.0%) | 7 (13.2%) |
| $5,000 to $9,999 | 0 (0.0%) | 4 (7.5%) |
| $10,000 to $14,999 | 0 (0.0%) | 0 (0.0%) |
| $15,000 to $19,999 | 8 (4.2%) | 6 (11.3%) |
| $20,000 to $24,999 | 0 (0.0%) | 0 (0.0%) |
| $25,000 to $34,999 | 13 (6.8%) | 2 (3.8%) |
| $35,000 to $49,999 | 31 (16.2%) | 8 (15.1%) |
| $50,000 to $74,999 | 33 (17.2%) | 17 (32.1%) |
| $75,000 to $99,999 | 31 (16.2%) | 6 (11.3%) |
| $100,000 to $149,999 | 12 (6.2%) | 0 (0.0%) |
| $150,000 or more | 64 (33.3%) | 3 (5.7%) |
| Total | 192 (100.0%) | 53 (100.0%) |
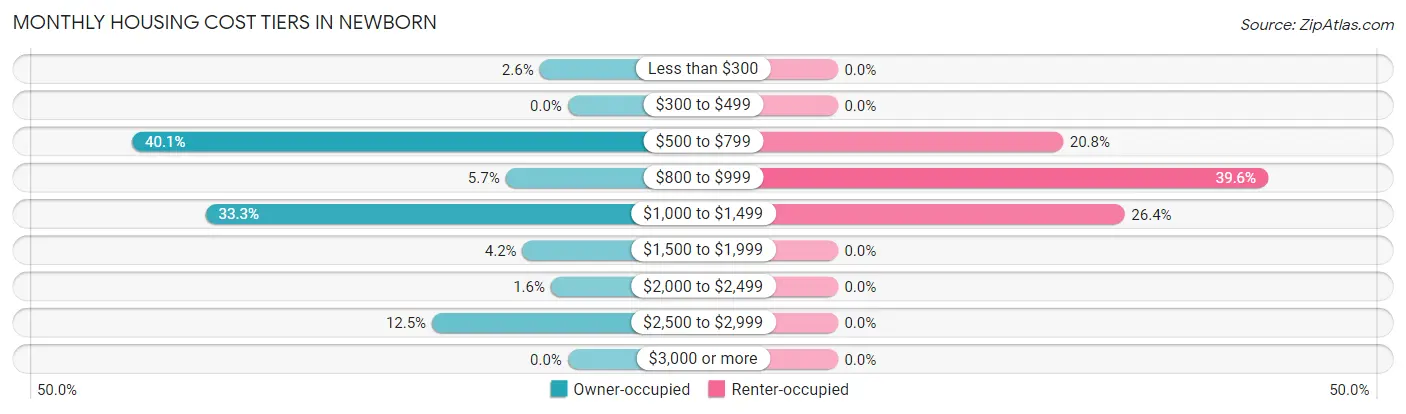
Monthly Housing Cost Tiers in Newborn
| Monthly Cost | Owner-occupied | Renter-occupied |
| Less than $300 | 5 (2.6%) | 0 (0.0%) |
| $300 to $499 | 0 (0.0%) | 0 (0.0%) |
| $500 to $799 | 77 (40.1%) | 11 (20.7%) |
| $800 to $999 | 11 (5.7%) | 21 (39.6%) |
| $1,000 to $1,499 | 64 (33.3%) | 14 (26.4%) |
| $1,500 to $1,999 | 8 (4.2%) | 0 (0.0%) |
| $2,000 to $2,499 | 3 (1.6%) | 0 (0.0%) |
| $2,500 to $2,999 | 24 (12.5%) | 0 (0.0%) |
| $3,000 or more | 0 (0.0%) | 0 (0.0%) |
| Total | 192 (100.0%) | 53 (100.0%) |
Physical Housing Characteristics in Newborn
Housing Structures in Newborn
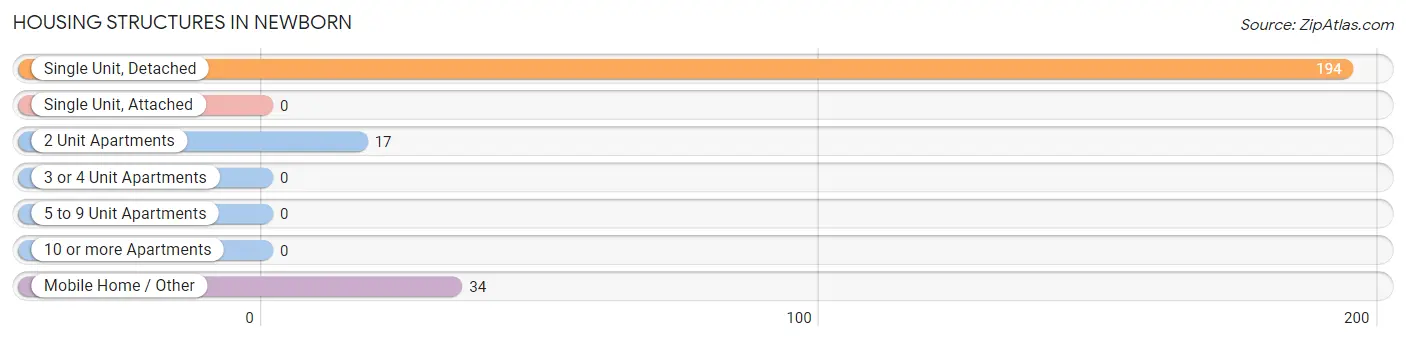
| Structure Type | # Housing Units | % Housing Units |
| Single Unit, Detached | 194 | 79.2% |
| Single Unit, Attached | 0 | 0.0% |
| 2 Unit Apartments | 17 | 6.9% |
| 3 or 4 Unit Apartments | 0 | 0.0% |
| 5 to 9 Unit Apartments | 0 | 0.0% |
| 10 or more Apartments | 0 | 0.0% |
| Mobile Home / Other | 34 | 13.9% |
| Total | 245 | 100.0% |
Housing Structures by Occupancy in Newborn
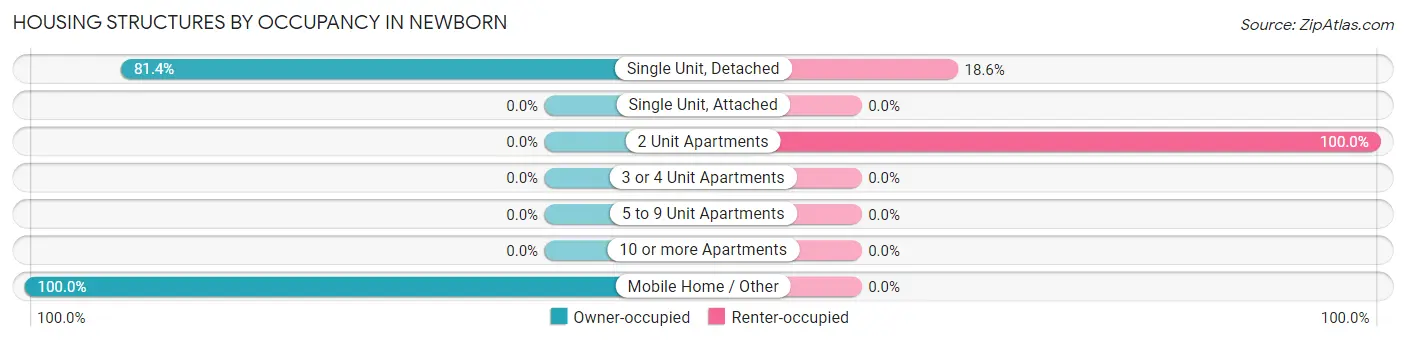
| Structure Type | Owner-occupied | Renter-occupied |
| Single Unit, Detached | 158 (81.4%) | 36 (18.6%) |
| Single Unit, Attached | 0 (0.0%) | 0 (0.0%) |
| 2 Unit Apartments | 0 (0.0%) | 17 (100.0%) |
| 3 or 4 Unit Apartments | 0 (0.0%) | 0 (0.0%) |
| 5 to 9 Unit Apartments | 0 (0.0%) | 0 (0.0%) |
| 10 or more Apartments | 0 (0.0%) | 0 (0.0%) |
| Mobile Home / Other | 34 (100.0%) | 0 (0.0%) |
| Total | 192 (78.4%) | 53 (21.6%) |
Housing Structures by Number of Rooms in Newborn
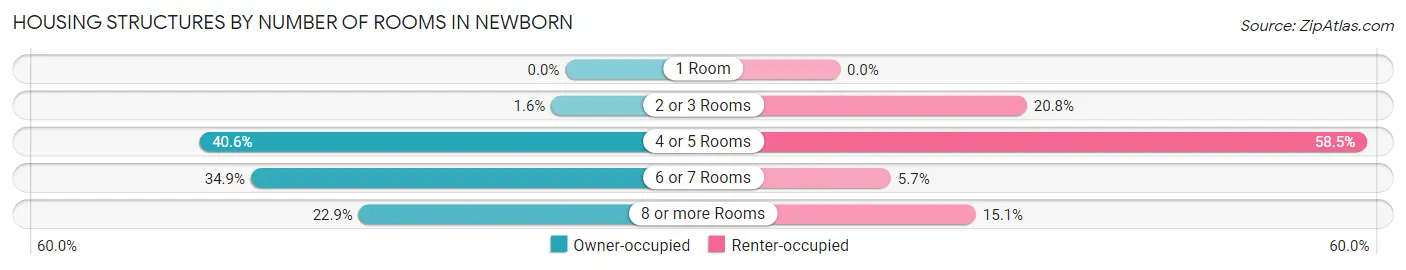
| Number of Rooms | Owner-occupied | Renter-occupied |
| 1 Room | 0 (0.0%) | 0 (0.0%) |
| 2 or 3 Rooms | 3 (1.6%) | 11 (20.7%) |
| 4 or 5 Rooms | 78 (40.6%) | 31 (58.5%) |
| 6 or 7 Rooms | 67 (34.9%) | 3 (5.7%) |
| 8 or more Rooms | 44 (22.9%) | 8 (15.1%) |
| Total | 192 (100.0%) | 53 (100.0%) |
Housing Structure by Heating Type in Newborn
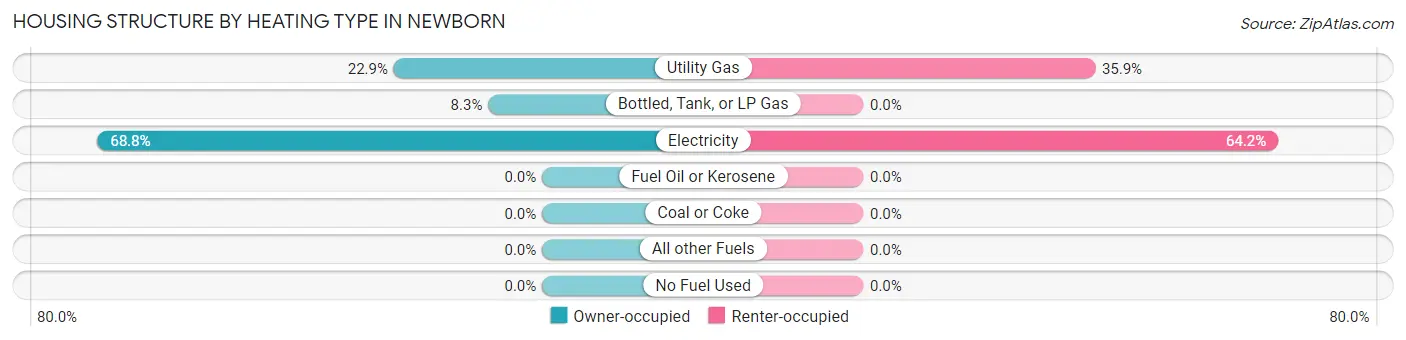
| Heating Type | Owner-occupied | Renter-occupied |
| Utility Gas | 44 (22.9%) | 19 (35.8%) |
| Bottled, Tank, or LP Gas | 16 (8.3%) | 0 (0.0%) |
| Electricity | 132 (68.8%) | 34 (64.1%) |
| Fuel Oil or Kerosene | 0 (0.0%) | 0 (0.0%) |
| Coal or Coke | 0 (0.0%) | 0 (0.0%) |
| All other Fuels | 0 (0.0%) | 0 (0.0%) |
| No Fuel Used | 0 (0.0%) | 0 (0.0%) |
| Total | 192 (100.0%) | 53 (100.0%) |
Household Vehicle Usage in Newborn
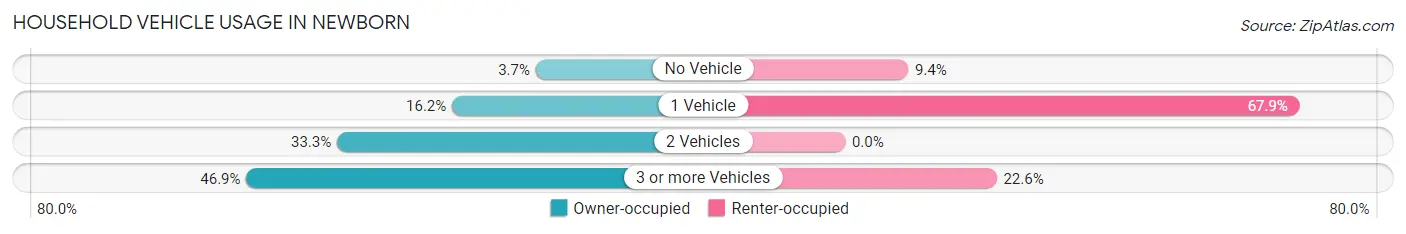
| Vehicles per Household | Owner-occupied | Renter-occupied |
| No Vehicle | 7 (3.6%) | 5 (9.4%) |
| 1 Vehicle | 31 (16.2%) | 36 (67.9%) |
| 2 Vehicles | 64 (33.3%) | 0 (0.0%) |
| 3 or more Vehicles | 90 (46.9%) | 12 (22.6%) |
| Total | 192 (100.0%) | 53 (100.0%) |
Real Estate & Mortgages in Newborn
Real Estate and Mortgage Overview in Newborn
| Characteristic | Without Mortgage | With Mortgage |
| Housing Units | 58 | 134 |
| Median Property Value | $125,000 | $165,500 |
| Median Household Income | $81,875 | $49 |
| Monthly Housing Costs | $625 | $0 |
| Real Estate Taxes | - | - |
Property Value by Mortgage Status in Newborn
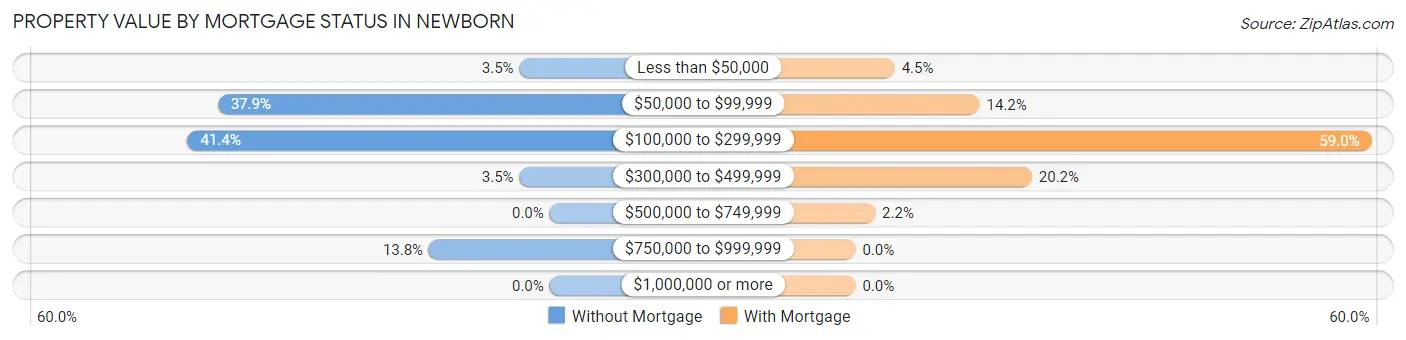
| Property Value | Without Mortgage | With Mortgage |
| Less than $50,000 | 2 (3.5%) | 6 (4.5%) |
| $50,000 to $99,999 | 22 (37.9%) | 19 (14.2%) |
| $100,000 to $299,999 | 24 (41.4%) | 79 (59.0%) |
| $300,000 to $499,999 | 2 (3.5%) | 27 (20.2%) |
| $500,000 to $749,999 | 0 (0.0%) | 3 (2.2%) |
| $750,000 to $999,999 | 8 (13.8%) | 0 (0.0%) |
| $1,000,000 or more | 0 (0.0%) | 0 (0.0%) |
| Total | 58 (100.0%) | 134 (100.0%) |
Household Income by Mortgage Status in Newborn
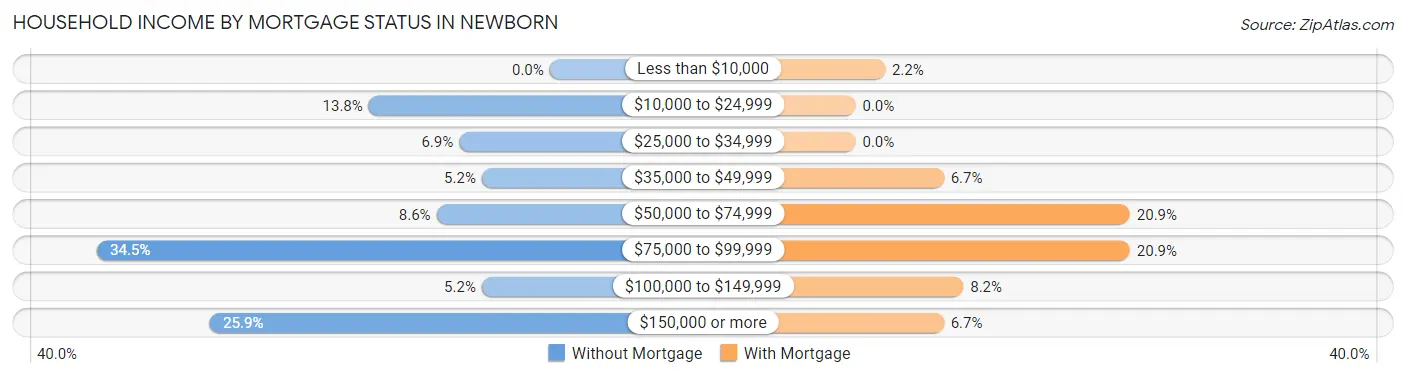
| Household Income | Without Mortgage | With Mortgage |
| Less than $10,000 | 0 (0.0%) | 3 (2.2%) |
| $10,000 to $24,999 | 8 (13.8%) | 0 (0.0%) |
| $25,000 to $34,999 | 4 (6.9%) | 0 (0.0%) |
| $35,000 to $49,999 | 3 (5.2%) | 9 (6.7%) |
| $50,000 to $74,999 | 5 (8.6%) | 28 (20.9%) |
| $75,000 to $99,999 | 20 (34.5%) | 28 (20.9%) |
| $100,000 to $149,999 | 3 (5.2%) | 11 (8.2%) |
| $150,000 or more | 15 (25.9%) | 9 (6.7%) |
| Total | 58 (100.0%) | 134 (100.0%) |
Property Value to Household Income Ratio in Newborn
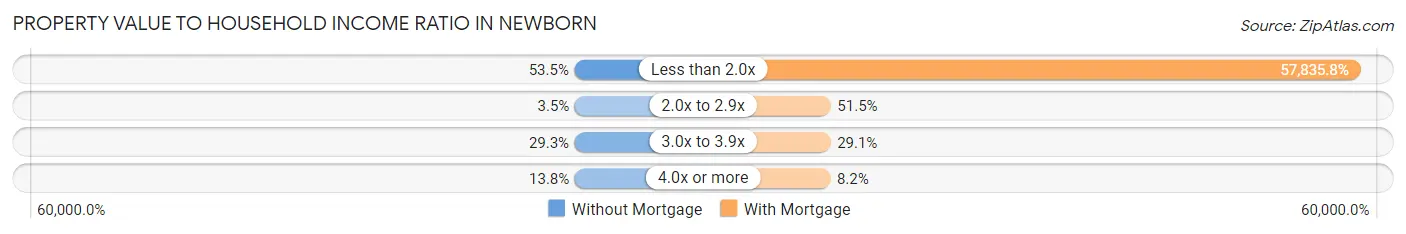
| Value-to-Income Ratio | Without Mortgage | With Mortgage |
| Less than 2.0x | 31 (53.4%) | 77,500 (57,835.8%) |
| 2.0x to 2.9x | 2 (3.5%) | 69 (51.5%) |
| 3.0x to 3.9x | 17 (29.3%) | 39 (29.1%) |
| 4.0x or more | 8 (13.8%) | 11 (8.2%) |
| Total | 58 (100.0%) | 134 (100.0%) |
Real Estate Taxes by Mortgage Status in Newborn
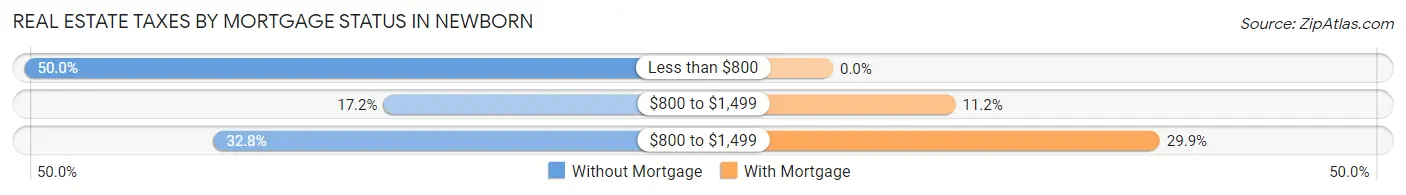
| Property Taxes | Without Mortgage | With Mortgage |
| Less than $800 | 29 (50.0%) | 0 (0.0%) |
| $800 to $1,499 | 10 (17.2%) | 15 (11.2%) |
| $800 to $1,499 | 19 (32.8%) | 40 (29.8%) |
| Total | 58 (100.0%) | 134 (100.0%) |
Health & Disability in Newborn
Health Insurance Coverage by Age in Newborn
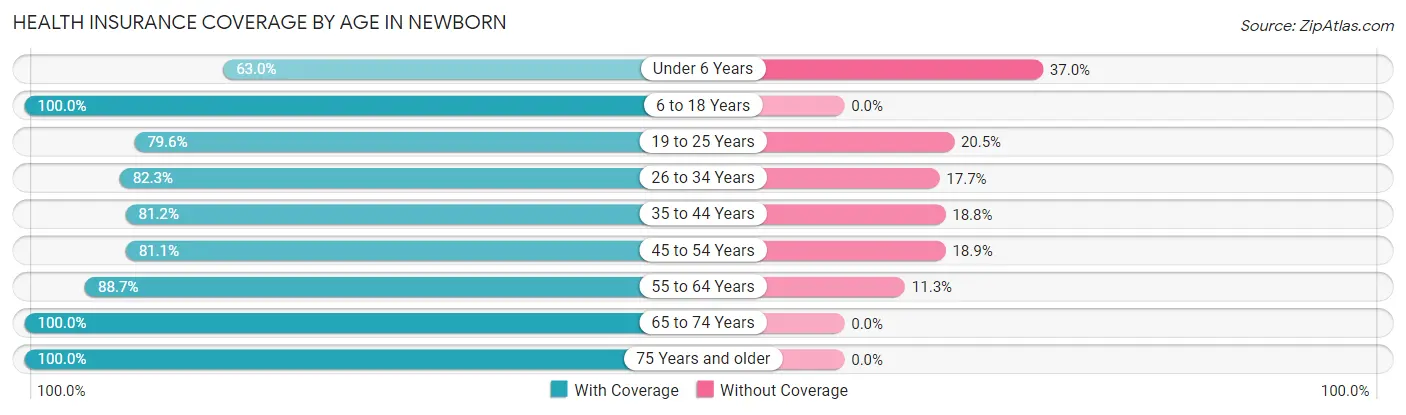
| Age Bracket | With Coverage | Without Coverage |
| Under 6 Years | 17 (63.0%) | 10 (37.0%) |
| 6 to 18 Years | 58 (100.0%) | 0 (0.0%) |
| 19 to 25 Years | 70 (79.5%) | 18 (20.4%) |
| 26 to 34 Years | 51 (82.3%) | 11 (17.7%) |
| 35 to 44 Years | 56 (81.2%) | 13 (18.8%) |
| 45 to 54 Years | 86 (81.1%) | 20 (18.9%) |
| 55 to 64 Years | 102 (88.7%) | 13 (11.3%) |
| 65 to 74 Years | 67 (100.0%) | 0 (0.0%) |
| 75 Years and older | 51 (100.0%) | 0 (0.0%) |
| Total | 558 (86.8%) | 85 (13.2%) |
Health Insurance Coverage by Citizenship Status in Newborn
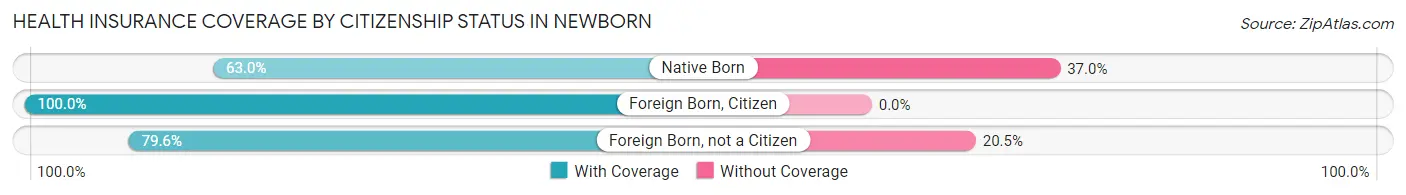
| Citizenship Status | With Coverage | Without Coverage |
| Native Born | 17 (63.0%) | 10 (37.0%) |
| Foreign Born, Citizen | 58 (100.0%) | 0 (0.0%) |
| Foreign Born, not a Citizen | 70 (79.5%) | 18 (20.4%) |
Health Insurance Coverage by Household Income in Newborn
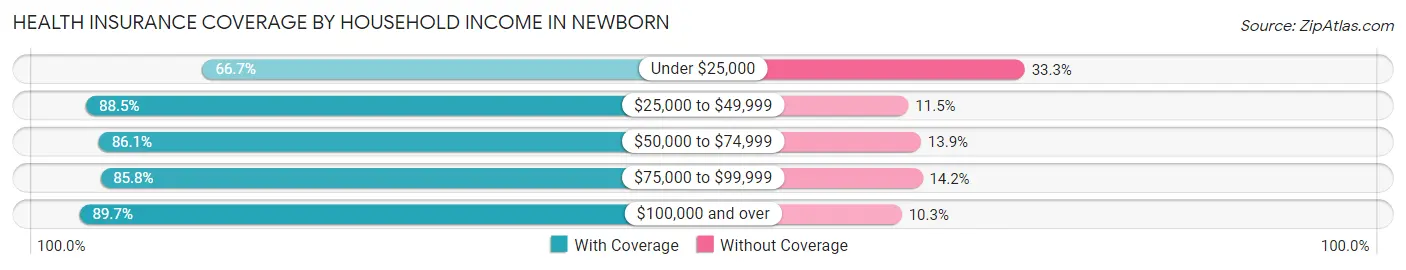
| Household Income | With Coverage | Without Coverage |
| Under $25,000 | 18 (66.7%) | 9 (33.3%) |
| $25,000 to $49,999 | 92 (88.5%) | 12 (11.5%) |
| $50,000 to $74,999 | 93 (86.1%) | 15 (13.9%) |
| $75,000 to $99,999 | 109 (85.8%) | 18 (14.2%) |
| $100,000 and over | 244 (89.7%) | 28 (10.3%) |
Public vs Private Health Insurance Coverage by Age in Newborn
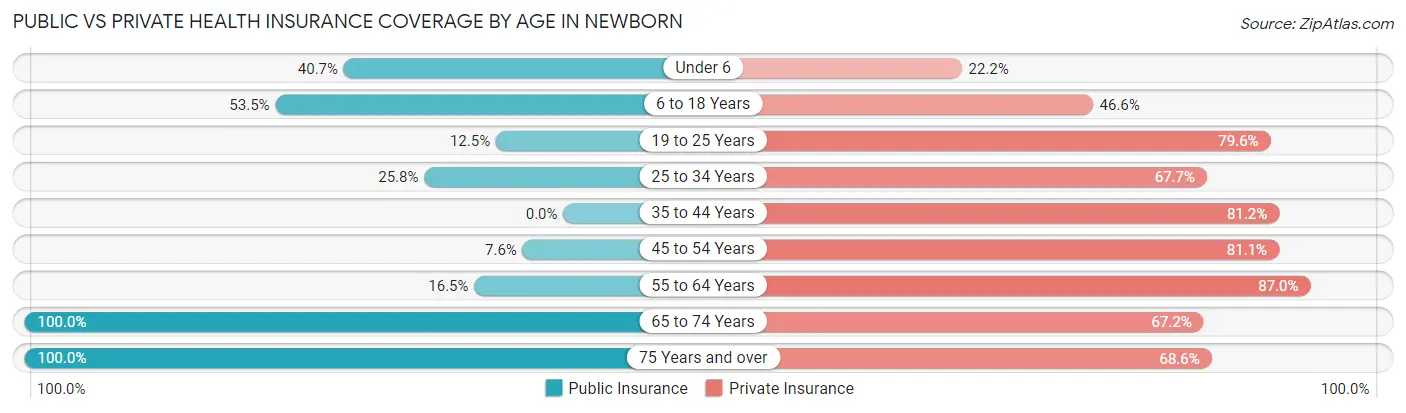
| Age Bracket | Public Insurance | Private Insurance |
| Under 6 | 11 (40.7%) | 6 (22.2%) |
| 6 to 18 Years | 31 (53.4%) | 27 (46.6%) |
| 19 to 25 Years | 11 (12.5%) | 70 (79.5%) |
| 25 to 34 Years | 16 (25.8%) | 42 (67.7%) |
| 35 to 44 Years | 0 (0.0%) | 56 (81.2%) |
| 45 to 54 Years | 8 (7.5%) | 86 (81.1%) |
| 55 to 64 Years | 19 (16.5%) | 100 (87.0%) |
| 65 to 74 Years | 67 (100.0%) | 45 (67.2%) |
| 75 Years and over | 51 (100.0%) | 35 (68.6%) |
| Total | 214 (33.3%) | 467 (72.6%) |
Disability Status by Sex by Age in Newborn
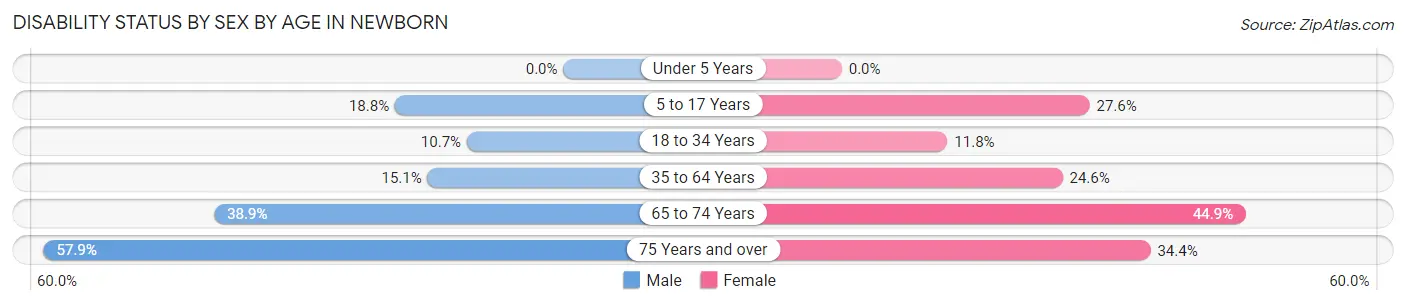
| Age Bracket | Male | Female |
| Under 5 Years | 0 (0.0%) | 0 (0.0%) |
| 5 to 17 Years | 6 (18.8%) | 8 (27.6%) |
| 18 to 34 Years | 13 (10.7%) | 4 (11.8%) |
| 35 to 64 Years | 26 (15.1%) | 29 (24.6%) |
| 65 to 74 Years | 7 (38.9%) | 22 (44.9%) |
| 75 Years and over | 11 (57.9%) | 11 (34.4%) |
Disability Class by Sex by Age in Newborn
Disability Class: Hearing Difficulty
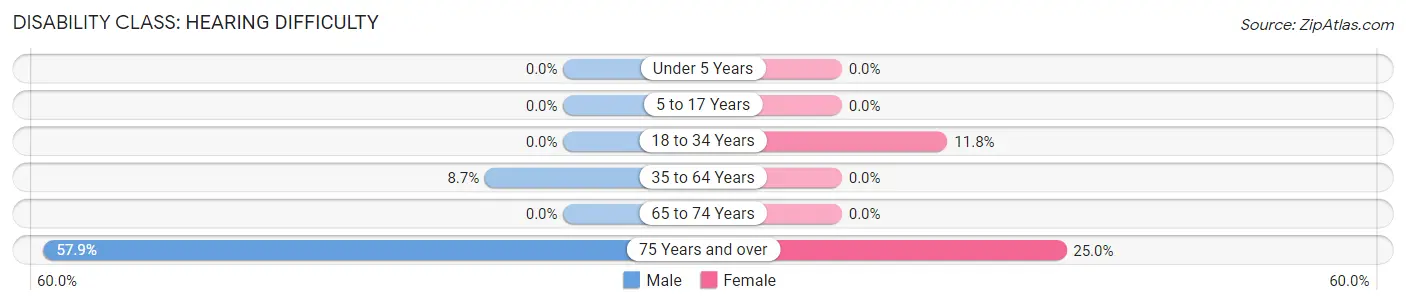
| Age Bracket | Male | Female |
| Under 5 Years | 0 (0.0%) | 0 (0.0%) |
| 5 to 17 Years | 0 (0.0%) | 0 (0.0%) |
| 18 to 34 Years | 0 (0.0%) | 4 (11.8%) |
| 35 to 64 Years | 15 (8.7%) | 0 (0.0%) |
| 65 to 74 Years | 0 (0.0%) | 0 (0.0%) |
| 75 Years and over | 11 (57.9%) | 8 (25.0%) |
Disability Class: Vision Difficulty
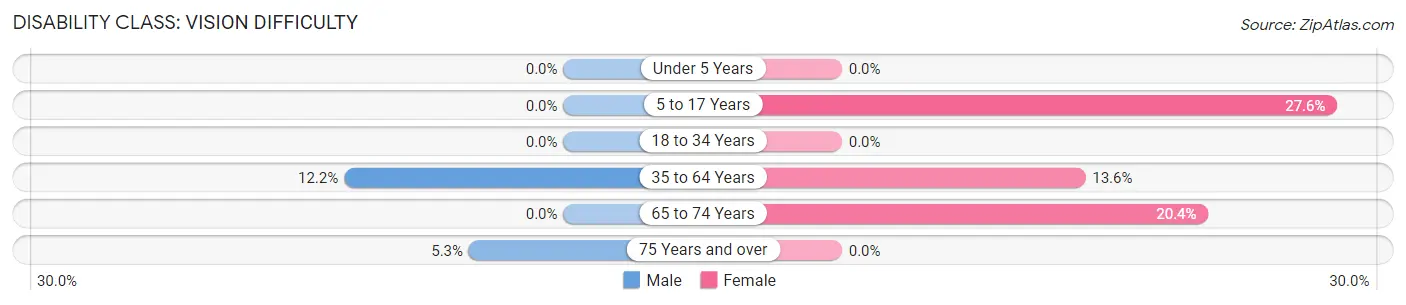
| Age Bracket | Male | Female |
| Under 5 Years | 0 (0.0%) | 0 (0.0%) |
| 5 to 17 Years | 0 (0.0%) | 8 (27.6%) |
| 18 to 34 Years | 0 (0.0%) | 0 (0.0%) |
| 35 to 64 Years | 21 (12.2%) | 16 (13.6%) |
| 65 to 74 Years | 0 (0.0%) | 10 (20.4%) |
| 75 Years and over | 1 (5.3%) | 0 (0.0%) |
Disability Class: Cognitive Difficulty
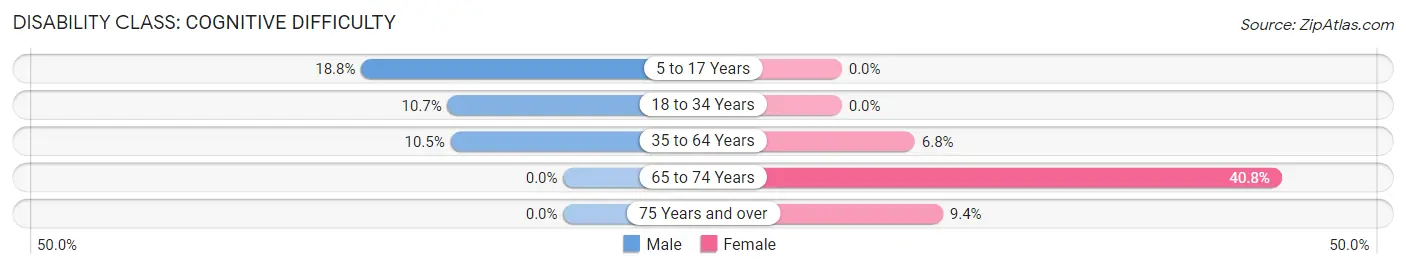
| Age Bracket | Male | Female |
| 5 to 17 Years | 6 (18.8%) | 0 (0.0%) |
| 18 to 34 Years | 13 (10.7%) | 0 (0.0%) |
| 35 to 64 Years | 18 (10.5%) | 8 (6.8%) |
| 65 to 74 Years | 0 (0.0%) | 20 (40.8%) |
| 75 Years and over | 0 (0.0%) | 3 (9.4%) |
Disability Class: Ambulatory Difficulty
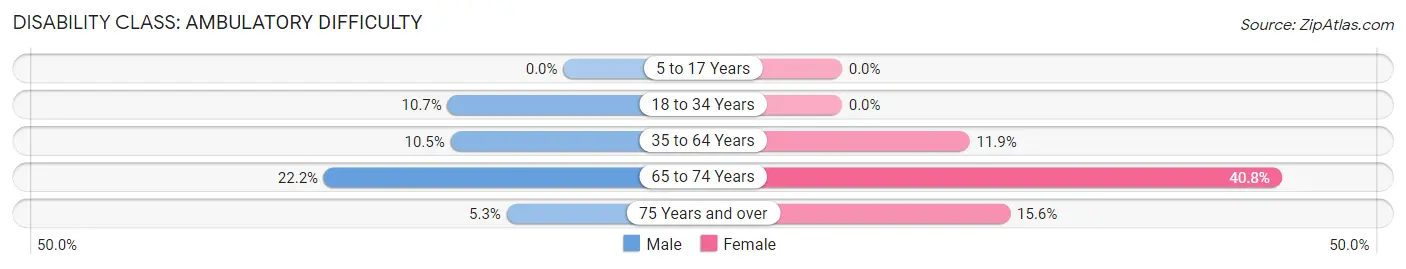
| Age Bracket | Male | Female |
| 5 to 17 Years | 0 (0.0%) | 0 (0.0%) |
| 18 to 34 Years | 13 (10.7%) | 0 (0.0%) |
| 35 to 64 Years | 18 (10.5%) | 14 (11.9%) |
| 65 to 74 Years | 4 (22.2%) | 20 (40.8%) |
| 75 Years and over | 1 (5.3%) | 5 (15.6%) |
Disability Class: Self-Care Difficulty
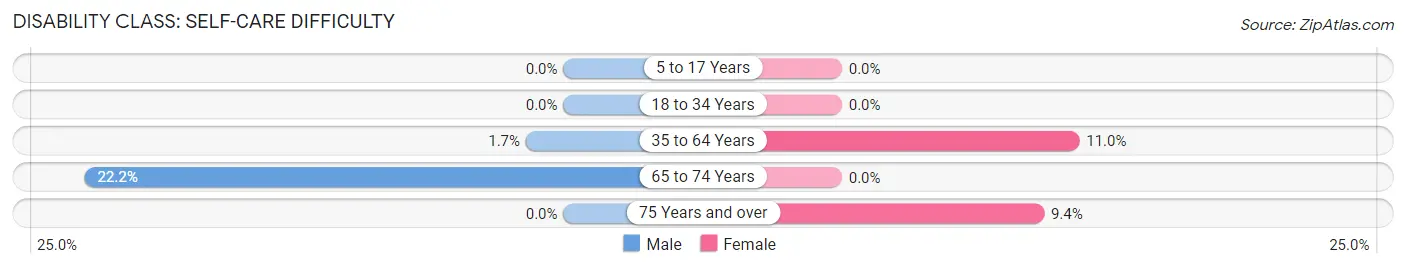
| Age Bracket | Male | Female |
| 5 to 17 Years | 0 (0.0%) | 0 (0.0%) |
| 18 to 34 Years | 0 (0.0%) | 0 (0.0%) |
| 35 to 64 Years | 3 (1.7%) | 13 (11.0%) |
| 65 to 74 Years | 4 (22.2%) | 0 (0.0%) |
| 75 Years and over | 0 (0.0%) | 3 (9.4%) |
Technology Access in Newborn
Computing Device Access in Newborn
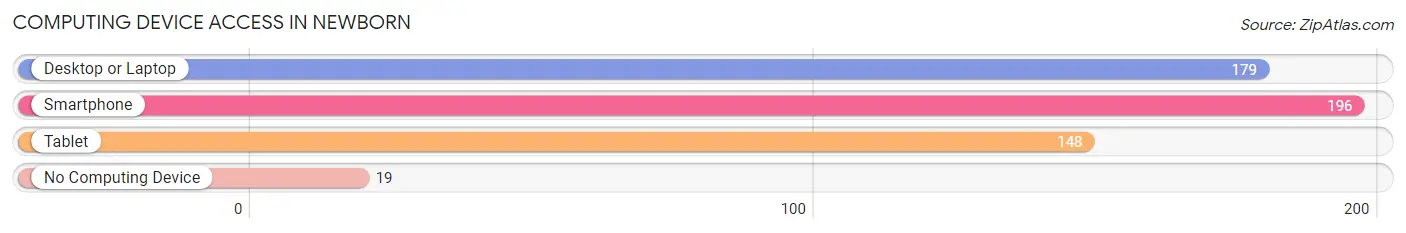
| Device Type | # Households | % Households |
| Desktop or Laptop | 179 | 73.1% |
| Smartphone | 196 | 80.0% |
| Tablet | 148 | 60.4% |
| No Computing Device | 19 | 7.8% |
| Total | 245 | 100.0% |
Internet Access in Newborn
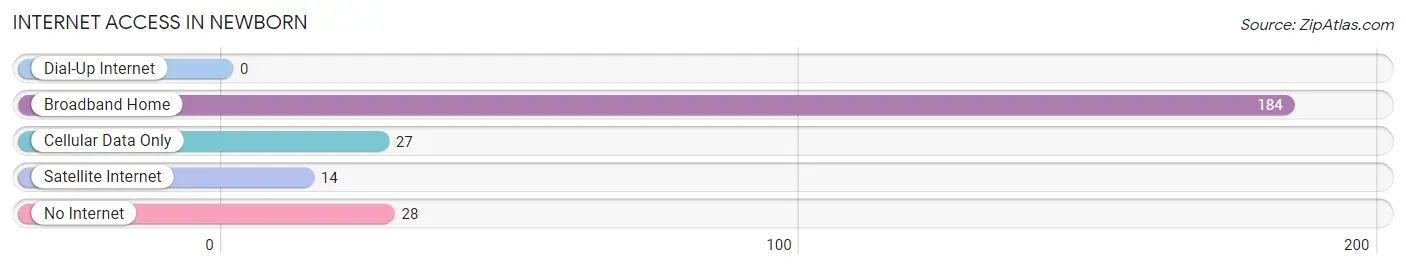
| Internet Type | # Households | % Households |
| Dial-Up Internet | 0 | 0.0% |
| Broadband Home | 184 | 75.1% |
| Cellular Data Only | 27 | 11.0% |
| Satellite Internet | 14 | 5.7% |
| No Internet | 28 | 11.4% |
| Total | 245 | 100.0% |
Newborn Summary
Newborn is a small town located in the state of Georgia, United States. It is situated in the county of Newton, and is part of the Atlanta metropolitan area. The town has a population of approximately 1,000 people, and is located about 40 miles east of Atlanta.
History
Newborn was founded in 1820 by a group of settlers from North Carolina. The town was named after the newborn baby of one of the settlers, and was originally known as Newborn Crossroads. The town was incorporated in 1883, and the first mayor was elected in 1884.
In the late 19th century, Newborn was a thriving agricultural community, with cotton, corn, and tobacco being the main crops. The town also had a number of sawmills and gristmills, as well as a number of stores and businesses.
In the early 20th century, the town began to decline as the railroad bypassed it and the population began to move away. The town was nearly abandoned by the 1950s, but in the late 1960s, the town began to experience a revival.
Geography
Newborn is located in the Piedmont region of Georgia, and is situated in the foothills of the Appalachian Mountains. The town is located on the banks of the Alcovy River, and is surrounded by rolling hills and forests. The town is located about 40 miles east of Atlanta, and is about an hour’s drive from the city.
The climate in Newborn is humid subtropical, with hot, humid summers and mild winters. The average annual temperature is around 70 degrees Fahrenheit, and the average annual precipitation is around 50 inches.
Economy
The economy of Newborn is largely based on agriculture and tourism. The town is home to a number of farms, and the main crops grown are cotton, corn, and tobacco. The town also has a number of small businesses, including restaurants, stores, and other services.
Tourism is also an important part of the economy, as the town is located close to several popular attractions, including Stone Mountain Park, the Georgia Aquarium, and the Atlanta Zoo.
Demographics
As of the 2010 census, the population of Newborn was 1,000 people. The racial makeup of the town was 94.2% White, 3.2% African American, 0.7% Native American, 0.3% Asian, and 1.6% from other races. The median household income was $37,500, and the median family income was $45,000. The per capita income was $18,000.
Newborn is a small, rural town with a rich history and a vibrant economy. The town is home to a diverse population, and is a popular destination for tourists. The town is a great place to live, work, and raise a family.
Common Questions
What is Per Capita Income in Newborn?
Per Capita income in Newborn is $36,107.
What is the Median Family Income in Newborn?
Median Family Income in Newborn is $80,156.
What is the Median Household income in Newborn?
Median Household Income in Newborn is $64,028.
What is Income or Wage Gap in Newborn?
Income or Wage Gap in Newborn is 48.2%.
Women in Newborn earn 51.8 cents for every dollar earned by a man.
What is Inequality or Gini Index in Newborn?
Inequality or Gini Index in Newborn is 0.41.
What is the Total Population of Newborn?
Total Population of Newborn is 643.
What is the Total Male Population of Newborn?
Total Male Population of Newborn is 362.
What is the Total Female Population of Newborn?
Total Female Population of Newborn is 281.
What is the Ratio of Males per 100 Females in Newborn?
There are 128.83 Males per 100 Females in Newborn.
What is the Ratio of Females per 100 Males in Newborn?
There are 77.62 Females per 100 Males in Newborn.
What is the Median Population Age in Newborn?
Median Population Age in Newborn is 48.6 Years.
What is the Average Family Size in Newborn
Average Family Size in Newborn is 3.0 People.
What is the Average Household Size in Newborn
Average Household Size in Newborn is 2.6 People.
How Large is the Labor Force in Newborn?
There are 369 People in the Labor Forcein in Newborn.
What is the Percentage of People in the Labor Force in Newborn?
63.7% of People are in the Labor Force in Newborn.
What is the Unemployment Rate in Newborn?
Unemployment Rate in Newborn is 10.3%.