Mountain City, GA Map & Demographics
Mountain City Map
Mountain City Overview
$23,619
PER CAPITA INCOME
$59,444
AVG FAMILY INCOME
$43,269
AVG HOUSEHOLD INCOME
13.5%
WAGE / INCOME GAP [ % ]
86.5¢/ $1
WAGE / INCOME GAP [ $ ]
0.42
INEQUALITY / GINI INDEX
991
TOTAL POPULATION
422
MALE POPULATION
569
FEMALE POPULATION
74.17
MALES / 100 FEMALES
134.83
FEMALES / 100 MALES
45.3
MEDIAN AGE
3.3
AVG FAMILY SIZE
2.5
AVG HOUSEHOLD SIZE
403
LABOR FORCE [ PEOPLE ]
47.9%
PERCENT IN LABOR FORCE
Mountain City Zip Codes
Mountain City Area Codes
Income in Mountain City
Income Overview in Mountain City
Per Capita Income in Mountain City is $23,619, while median incomes of families and households are $59,444 and $43,269 respectively.
| Characteristic | Number | Measure |
| Per Capita Income | 991 | $23,619 |
| Median Family Income | 232 | $59,444 |
| Mean Family Income | 232 | $70,257 |
| Median Household Income | 402 | $43,269 |
| Mean Household Income | 402 | $54,117 |
| Income Deficit | 232 | $0 |
| Wage / Income Gap (%) | 991 | 13.54% |
| Wage / Income Gap ($) | 991 | 86.46¢ per $1 |
| Gini / Inequality Index | 991 | 0.42 |
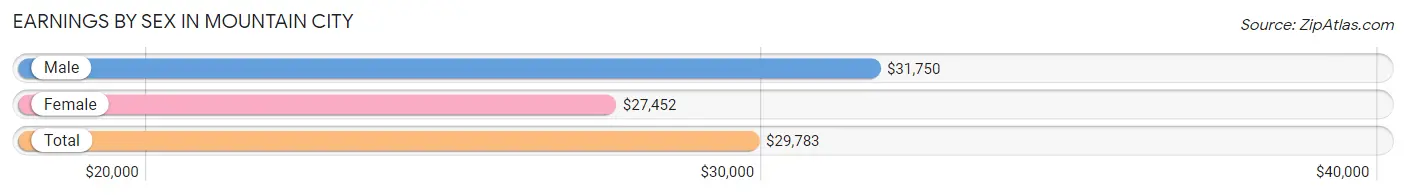
Earnings by Sex in Mountain City
Average Earnings in Mountain City are $29,783, $31,750 for men and $27,452 for women, a difference of 13.5%.
| Sex | Number | Average Earnings |
| Male | 177 (42.5%) | $31,750 |
| Female | 239 (57.5%) | $27,452 |
| Total | 416 (100.0%) | $29,783 |
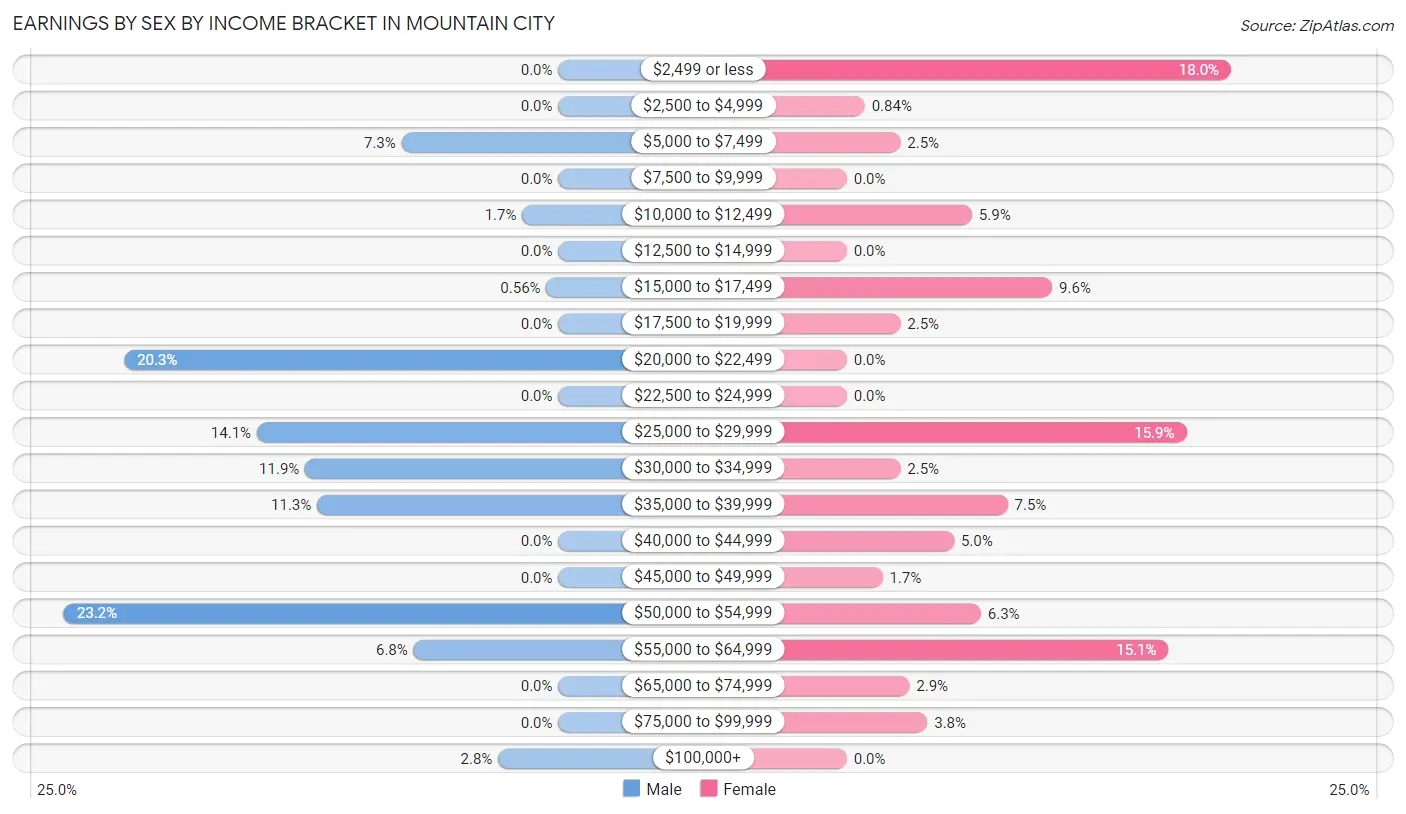
Earnings by Sex by Income Bracket in Mountain City
The most common earnings brackets in Mountain City are $50,000 to $54,999 for men (41 | 23.2%) and $2,499 or less for women (43 | 18.0%).
| Income | Male | Female |
| $2,499 or less | 0 (0.0%) | 43 (18.0%) |
| $2,500 to $4,999 | 0 (0.0%) | 2 (0.8%) |
| $5,000 to $7,499 | 13 (7.3%) | 6 (2.5%) |
| $7,500 to $9,999 | 0 (0.0%) | 0 (0.0%) |
| $10,000 to $12,499 | 3 (1.7%) | 14 (5.9%) |
| $12,500 to $14,999 | 0 (0.0%) | 0 (0.0%) |
| $15,000 to $17,499 | 1 (0.6%) | 23 (9.6%) |
| $17,500 to $19,999 | 0 (0.0%) | 6 (2.5%) |
| $20,000 to $22,499 | 36 (20.3%) | 0 (0.0%) |
| $22,500 to $24,999 | 0 (0.0%) | 0 (0.0%) |
| $25,000 to $29,999 | 25 (14.1%) | 38 (15.9%) |
| $30,000 to $34,999 | 21 (11.9%) | 6 (2.5%) |
| $35,000 to $39,999 | 20 (11.3%) | 18 (7.5%) |
| $40,000 to $44,999 | 0 (0.0%) | 12 (5.0%) |
| $45,000 to $49,999 | 0 (0.0%) | 4 (1.7%) |
| $50,000 to $54,999 | 41 (23.2%) | 15 (6.3%) |
| $55,000 to $64,999 | 12 (6.8%) | 36 (15.1%) |
| $65,000 to $74,999 | 0 (0.0%) | 7 (2.9%) |
| $75,000 to $99,999 | 0 (0.0%) | 9 (3.8%) |
| $100,000+ | 5 (2.8%) | 0 (0.0%) |
| Total | 177 (100.0%) | 239 (100.0%) |
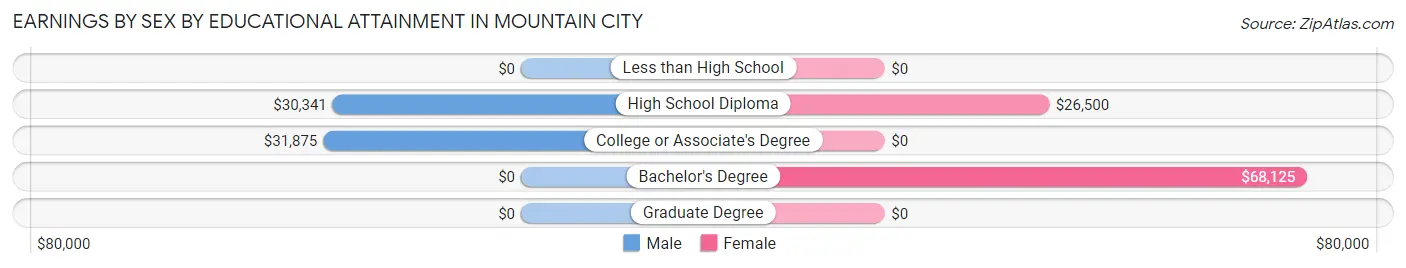
Earnings by Sex by Educational Attainment in Mountain City
Average earnings in Mountain City are $32,000 for men and $30,833 for women, a difference of 3.6%. Men with an educational attainment of college or associate's degree enjoy the highest average annual earnings of $31,875, while those with high school diploma education earn the least with $30,341. Women with an educational attainment of bachelor's degree earn the most with the average annual earnings of $68,125, while those with high school diploma education have the smallest earnings of $26,500.
| Educational Attainment | Male Income | Female Income |
| Less than High School | - | - |
| High School Diploma | $30,341 | $26,500 |
| College or Associate's Degree | $31,875 | $0 |
| Bachelor's Degree | - | - |
| Graduate Degree | - | - |
| Total | $32,000 | $30,833 |
Family Income in Mountain City
Family Income Brackets in Mountain City
According to the Mountain City family income data, there are 50 families falling into the $50,000 to $74,999 income range, which is the most common income bracket and makes up 21.5% of all families.
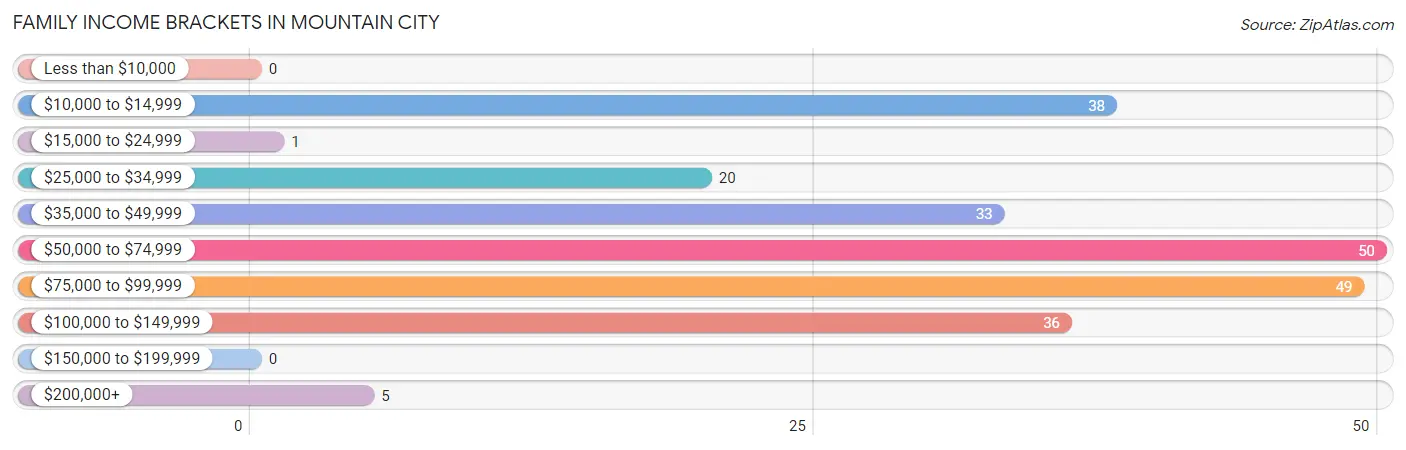
| Income Bracket | # Families | % Families |
| Less than $10,000 | 0 | 0.0% |
| $10,000 to $14,999 | 38 | 16.4% |
| $15,000 to $24,999 | 1 | 0.4% |
| $25,000 to $34,999 | 20 | 8.6% |
| $35,000 to $49,999 | 33 | 14.2% |
| $50,000 to $74,999 | 50 | 21.6% |
| $75,000 to $99,999 | 49 | 21.1% |
| $100,000 to $149,999 | 36 | 15.5% |
| $150,000 to $199,999 | 0 | 0.0% |
| $200,000+ | 5 | 2.2% |
Family Income by Famaliy Size in Mountain City
2-person families (103 | 44.4%) account for the highest median family income in Mountain City with $57,639 per family, while 2-person families (103 | 44.4%) have the highest median income of $28,820 per family member.
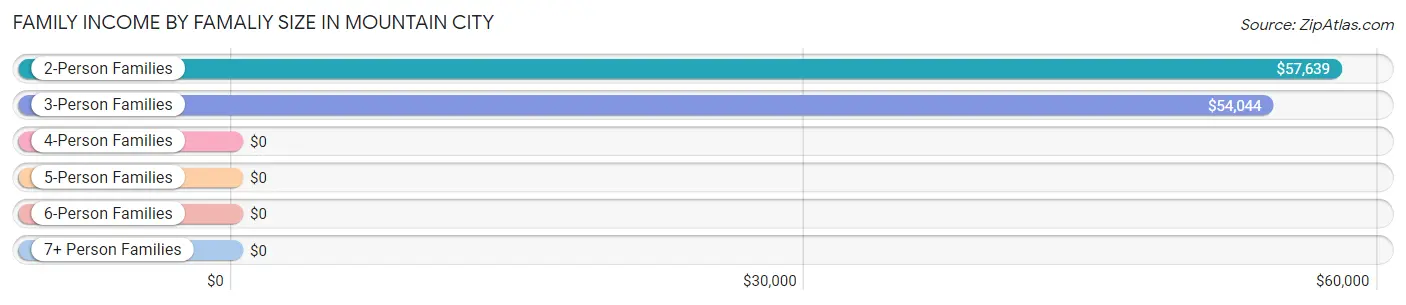
| Income Bracket | # Families | Median Income |
| 2-Person Families | 103 (44.4%) | $57,639 |
| 3-Person Families | 95 (40.9%) | $54,044 |
| 4-Person Families | 8 (3.5%) | $0 |
| 5-Person Families | 0 (0.0%) | $0 |
| 6-Person Families | 21 (9.0%) | $0 |
| 7+ Person Families | 5 (2.2%) | $0 |
| Total | 232 (100.0%) | $59,444 |
Family Income by Number of Earners in Mountain City
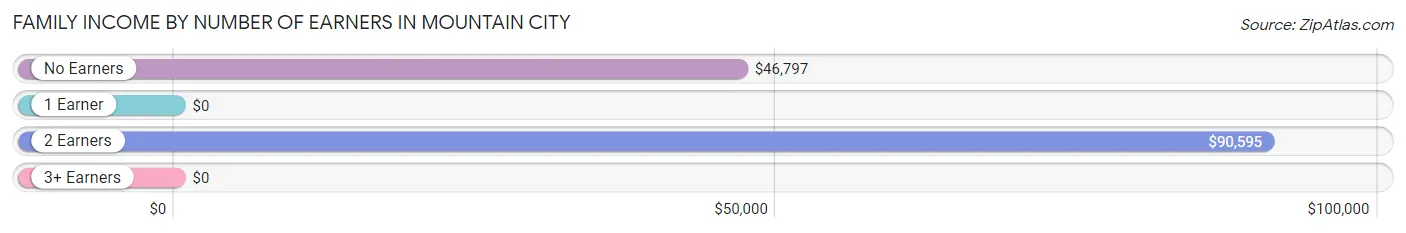
| Number of Earners | # Families | Median Income |
| No Earners | 63 (27.2%) | $46,797 |
| 1 Earner | 78 (33.6%) | $0 |
| 2 Earners | 86 (37.1%) | $90,595 |
| 3+ Earners | 5 (2.2%) | $0 |
| Total | 232 (100.0%) | $59,444 |
Household Income in Mountain City
Household Income Brackets in Mountain City
With 75 households falling in the category, the $35,000 to $49,999 income range is the most frequent in Mountain City, accounting for 18.7% of all households.
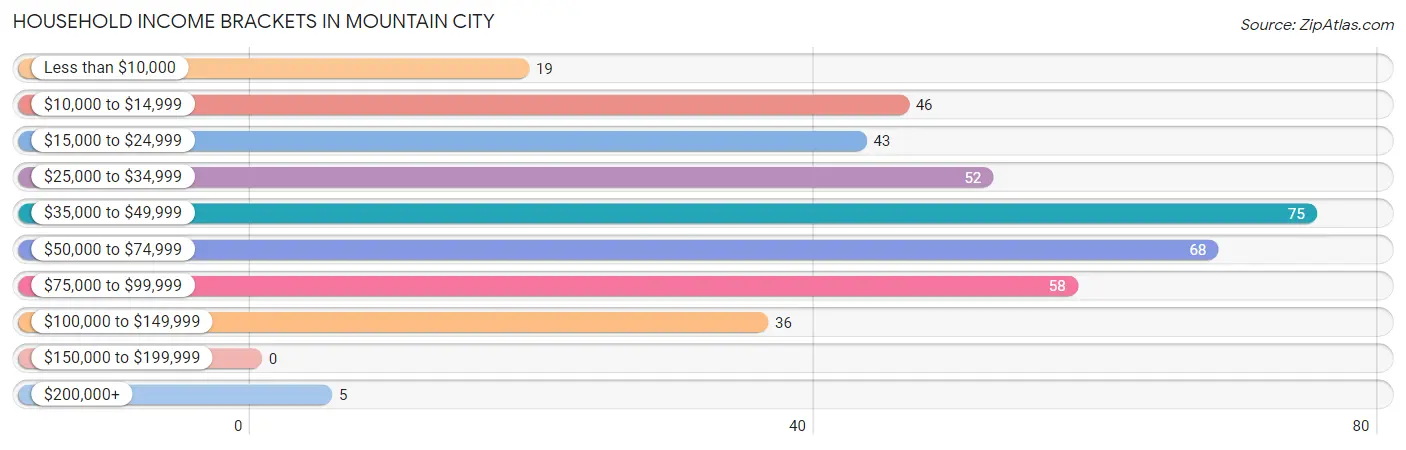
| Income Bracket | # Households | % Households |
| Less than $10,000 | 19 | 4.7% |
| $10,000 to $14,999 | 46 | 11.4% |
| $15,000 to $24,999 | 43 | 10.7% |
| $25,000 to $34,999 | 52 | 12.9% |
| $35,000 to $49,999 | 75 | 18.7% |
| $50,000 to $74,999 | 68 | 16.9% |
| $75,000 to $99,999 | 58 | 14.4% |
| $100,000 to $149,999 | 36 | 9.0% |
| $150,000 to $199,999 | 0 | 0.0% |
| $200,000+ | 5 | 1.2% |
Household Income by Householder Age in Mountain City
The median household income in Mountain City is $43,269, with the highest median household income of $90,119 found in the 45 to 64 years age bracket for the primary householder. A total of 112 households (27.9%) fall into this category. Meanwhile, the 15 to 24 years age bracket for the primary householder has the lowest median household income of $0, with 12 households (3.0%) in this group.
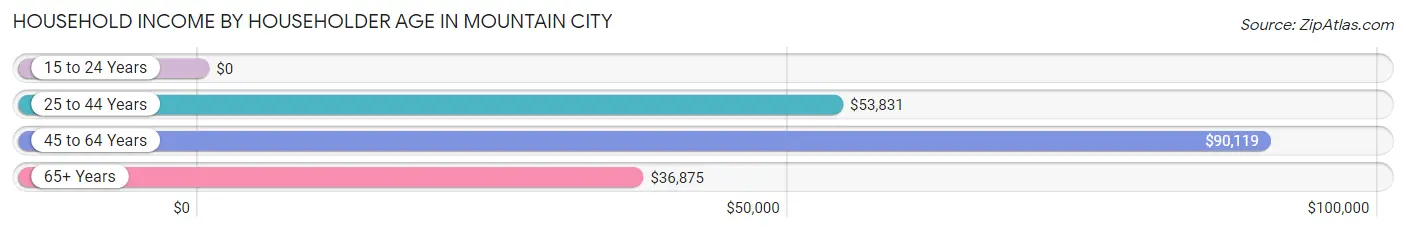
| Income Bracket | # Households | Median Income |
| 15 to 24 Years | 12 (3.0%) | $0 |
| 25 to 44 Years | 89 (22.1%) | $53,831 |
| 45 to 64 Years | 112 (27.9%) | $90,119 |
| 65+ Years | 189 (47.0%) | $36,875 |
| Total | 402 (100.0%) | $43,269 |
Poverty in Mountain City
Income Below Poverty by Sex and Age in Mountain City
With 12.4% poverty level for males and 18.6% for females among the residents of Mountain City, 16 and 17 year old males and 45 to 54 year old females are the most vulnerable to poverty, with 3 males (100.0%) and 58 females (53.2%) in their respective age groups living below the poverty level.
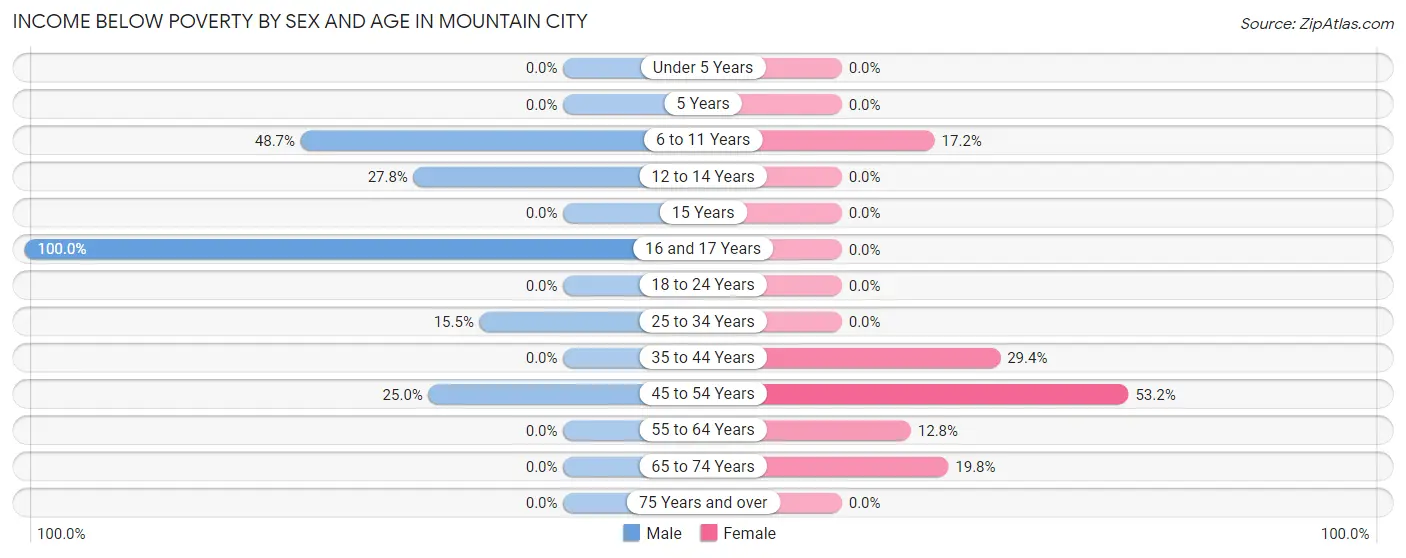
| Age Bracket | Male | Female |
| Under 5 Years | 0 (0.0%) | 0 (0.0%) |
| 5 Years | 0 (0.0%) | 0 (0.0%) |
| 6 to 11 Years | 19 (48.7%) | 5 (17.2%) |
| 12 to 14 Years | 10 (27.8%) | 0 (0.0%) |
| 15 Years | 0 (0.0%) | 0 (0.0%) |
| 16 and 17 Years | 3 (100.0%) | 0 (0.0%) |
| 18 to 24 Years | 0 (0.0%) | 0 (0.0%) |
| 25 to 34 Years | 9 (15.5%) | 0 (0.0%) |
| 35 to 44 Years | 0 (0.0%) | 20 (29.4%) |
| 45 to 54 Years | 11 (25.0%) | 58 (53.2%) |
| 55 to 64 Years | 0 (0.0%) | 5 (12.8%) |
| 65 to 74 Years | 0 (0.0%) | 18 (19.8%) |
| 75 Years and over | 0 (0.0%) | 0 (0.0%) |
| Total | 52 (12.4%) | 106 (18.6%) |
Income Above Poverty by Sex and Age in Mountain City
According to the poverty statistics in Mountain City, males aged 18 to 24 years and females aged under 5 years are the age groups that are most secure financially, with 100.0% of males and 100.0% of females in these age groups living above the poverty line.
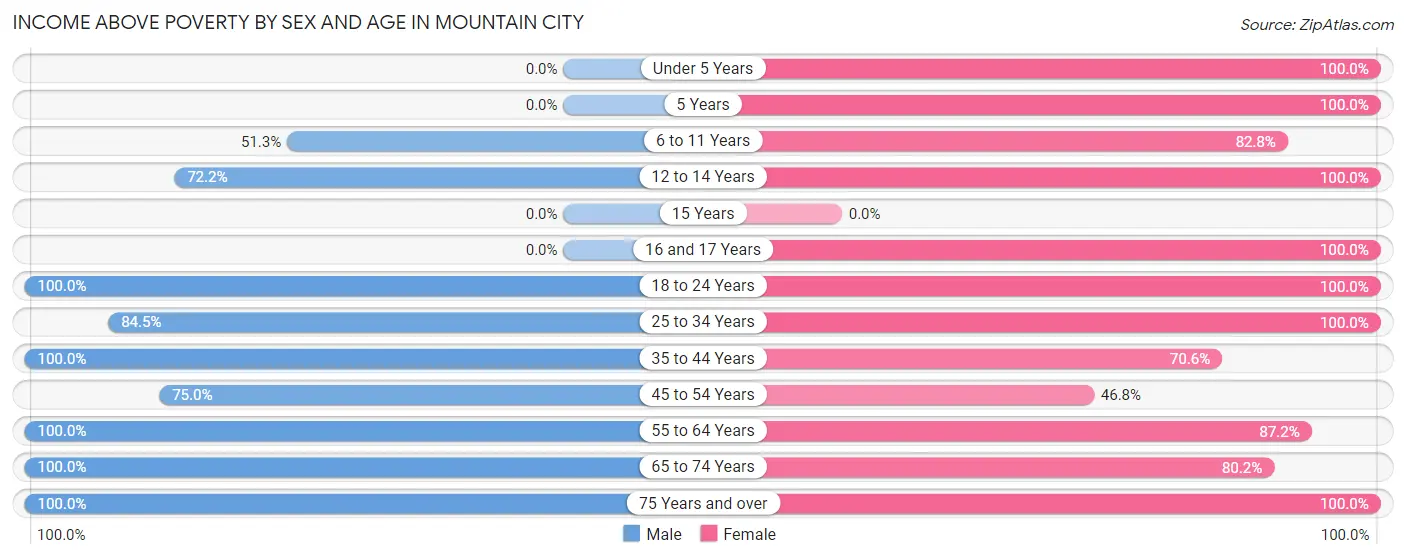
| Age Bracket | Male | Female |
| Under 5 Years | 0 (0.0%) | 34 (100.0%) |
| 5 Years | 0 (0.0%) | 6 (100.0%) |
| 6 to 11 Years | 20 (51.3%) | 24 (82.8%) |
| 12 to 14 Years | 26 (72.2%) | 5 (100.0%) |
| 15 Years | 0 (0.0%) | 0 (0.0%) |
| 16 and 17 Years | 0 (0.0%) | 7 (100.0%) |
| 18 to 24 Years | 38 (100.0%) | 29 (100.0%) |
| 25 to 34 Years | 49 (84.5%) | 85 (100.0%) |
| 35 to 44 Years | 46 (100.0%) | 48 (70.6%) |
| 45 to 54 Years | 33 (75.0%) | 51 (46.8%) |
| 55 to 64 Years | 48 (100.0%) | 34 (87.2%) |
| 65 to 74 Years | 54 (100.0%) | 73 (80.2%) |
| 75 Years and over | 54 (100.0%) | 67 (100.0%) |
| Total | 368 (87.6%) | 463 (81.4%) |
Income Below Poverty Among Married-Couple Families in Mountain City
The poverty statistics for married-couple families in Mountain City show that 2.6% or 4 of the total 151 families live below the poverty line. Families with 1 or 2 children have the highest poverty rate of 8.0%, comprising of 4 families. On the other hand, families with no children have the lowest poverty rate of 0.0%, which includes 0 families.
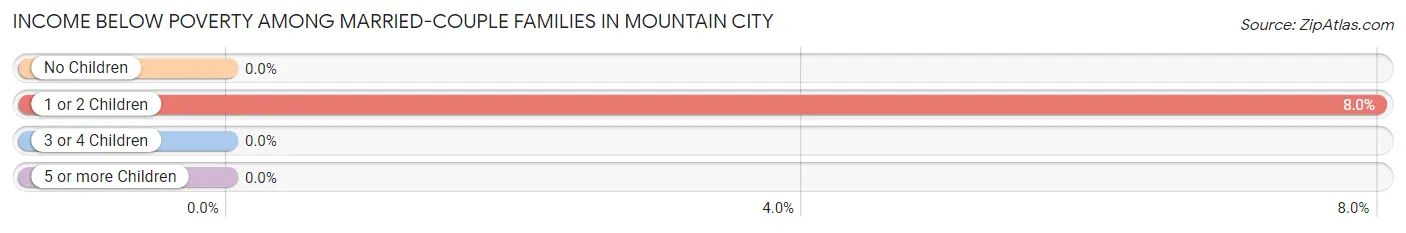
| Children | Above Poverty | Below Poverty |
| No Children | 96 (100.0%) | 0 (0.0%) |
| 1 or 2 Children | 46 (92.0%) | 4 (8.0%) |
| 3 or 4 Children | 5 (100.0%) | 0 (0.0%) |
| 5 or more Children | 0 (0.0%) | 0 (0.0%) |
| Total | 147 (97.4%) | 4 (2.6%) |
Income Below Poverty Among Single-Parent Households in Mountain City
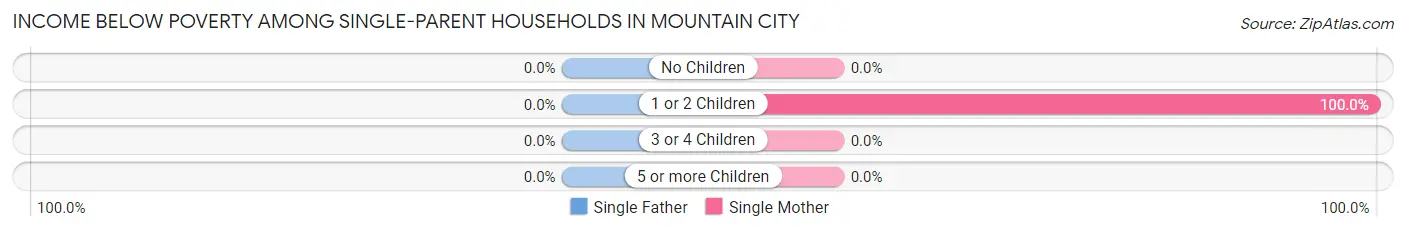
| Children | Single Father | Single Mother |
| No Children | 0 (0.0%) | 0 (0.0%) |
| 1 or 2 Children | 0 (0.0%) | 34 (100.0%) |
| 3 or 4 Children | 0 (0.0%) | 0 (0.0%) |
| 5 or more Children | 0 (0.0%) | 0 (0.0%) |
| Total | 0 (0.0%) | 34 (60.7%) |
Income Below Poverty Among Married-Couple vs Single-Parent Households in Mountain City
The poverty data for Mountain City shows that 4 of the married-couple family households (2.6%) and 34 of the single-parent households (42.0%) are living below the poverty level. Within the married-couple family households, those with 1 or 2 children have the highest poverty rate, with 4 households (8.0%) falling below the poverty line. Among the single-parent households, those with 1 or 2 children have the highest poverty rate, with 34 household (65.4%) living below poverty.
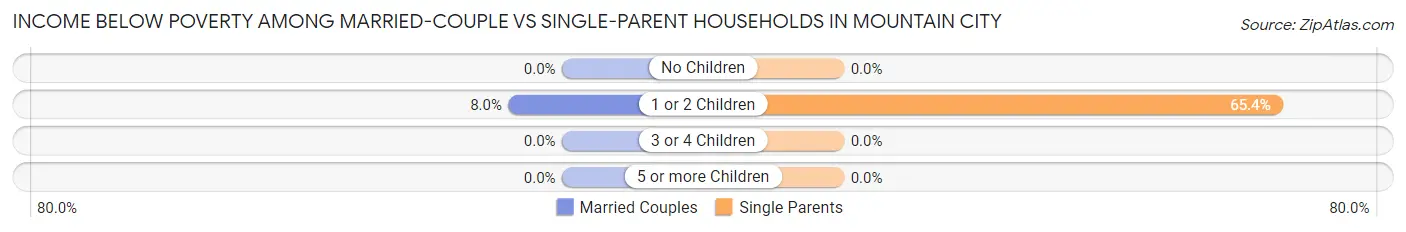
| Children | Married-Couple Families | Single-Parent Households |
| No Children | 0 (0.0%) | 0 (0.0%) |
| 1 or 2 Children | 4 (8.0%) | 34 (65.4%) |
| 3 or 4 Children | 0 (0.0%) | 0 (0.0%) |
| 5 or more Children | 0 (0.0%) | 0 (0.0%) |
| Total | 4 (2.6%) | 34 (42.0%) |
Race in Mountain City
The most populous races in Mountain City are White / Caucasian (790 | 79.7%), Two or more Races (175 | 17.7%), and Hispanic or Latino (162 | 16.4%).
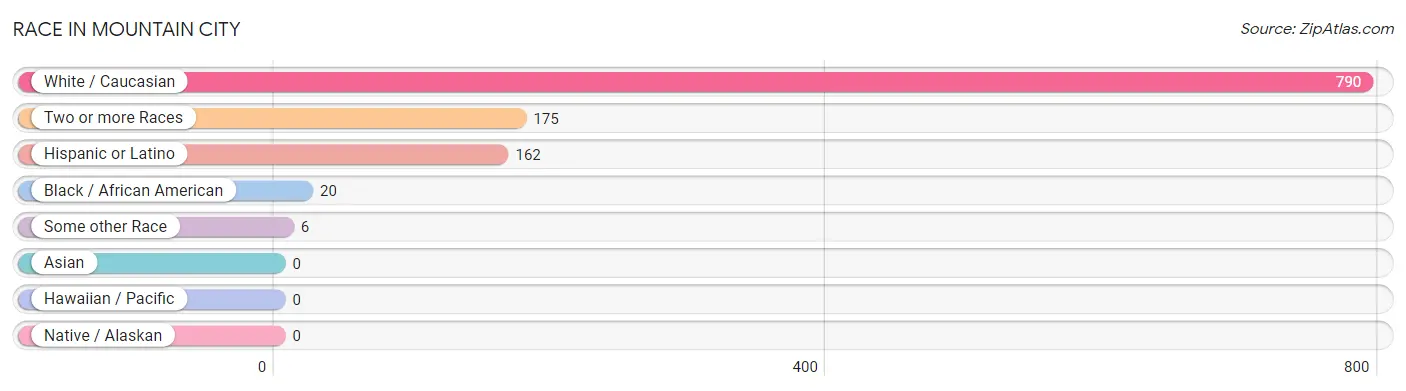
| Race | # Population | % Population |
| Asian | 0 | 0.0% |
| Black / African American | 20 | 2.0% |
| Hawaiian / Pacific | 0 | 0.0% |
| Hispanic or Latino | 162 | 16.4% |
| Native / Alaskan | 0 | 0.0% |
| White / Caucasian | 790 | 79.7% |
| Two or more Races | 175 | 17.7% |
| Some other Race | 6 | 0.6% |
| Total | 991 | 100.0% |
Ancestry in Mountain City
The most populous ancestries reported in Mountain City are American (223 | 22.5%), Irish (140 | 14.1%), Mexican (105 | 10.6%), English (93 | 9.4%), and Central American (57 | 5.8%), together accounting for 62.4% of all Mountain City residents.
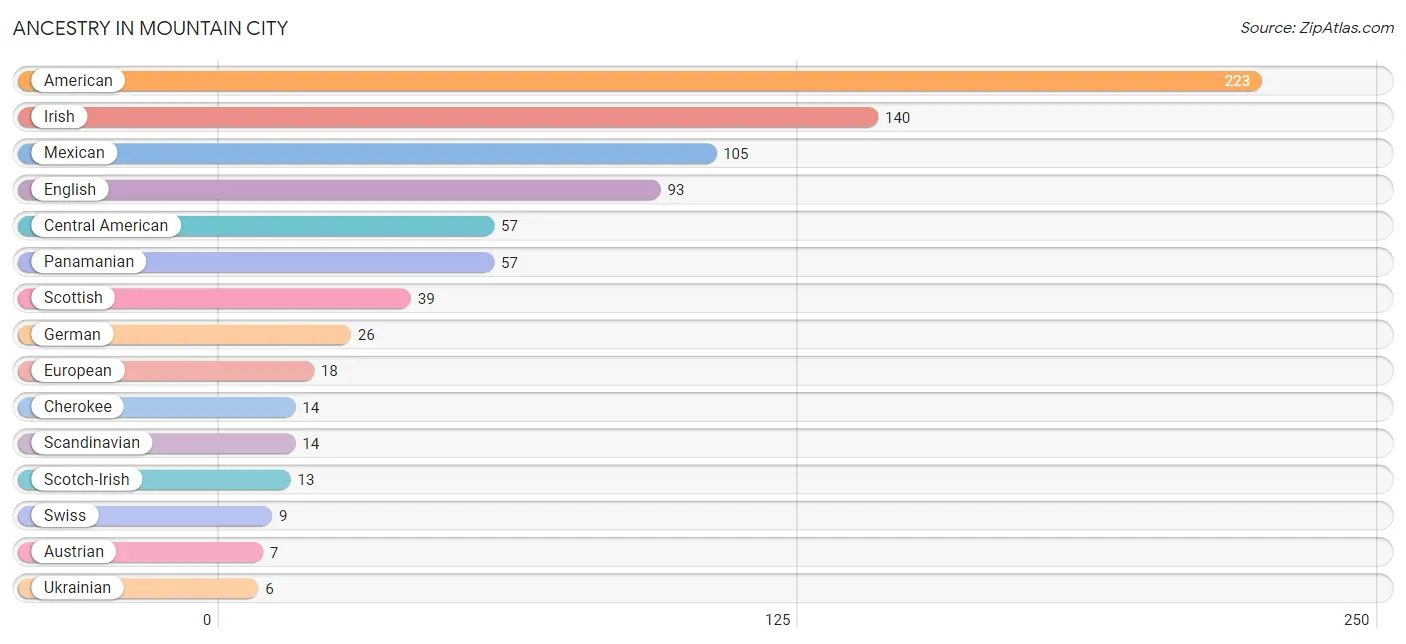
| Ancestry | # Population | % Population |
| American | 223 | 22.5% |
| Austrian | 7 | 0.7% |
| Central American | 57 | 5.8% |
| Cherokee | 14 | 1.4% |
| English | 93 | 9.4% |
| European | 18 | 1.8% |
| German | 26 | 2.6% |
| Hungarian | 2 | 0.2% |
| Irish | 140 | 14.1% |
| Italian | 2 | 0.2% |
| Mexican | 105 | 10.6% |
| Panamanian | 57 | 5.8% |
| Scandinavian | 14 | 1.4% |
| Scotch-Irish | 13 | 1.3% |
| Scottish | 39 | 3.9% |
| Swiss | 9 | 0.9% |
| Ukrainian | 6 | 0.6% | View All 17 Rows |
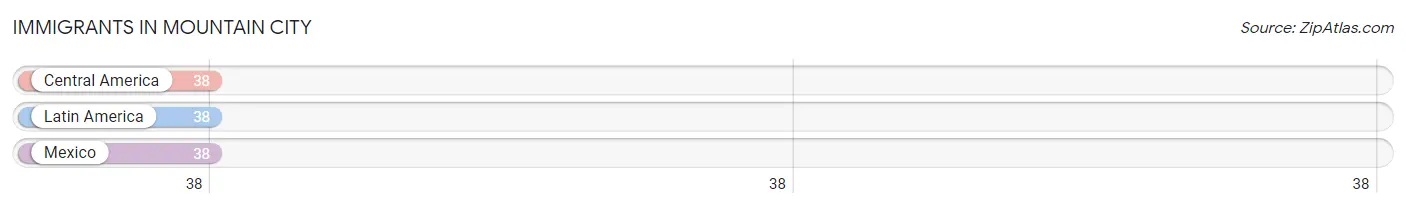
Immigrants in Mountain City
The most numerous immigrant groups reported in Mountain City came from Central America (38 | 3.8%), Latin America (38 | 3.8%), and Mexico (38 | 3.8%), together accounting for 11.5% of all Mountain City residents.
| Immigration Origin | # Population | % Population |
| Central America | 38 | 3.8% |
| Latin America | 38 | 3.8% |
| Mexico | 38 | 3.8% | View All 3 Rows |
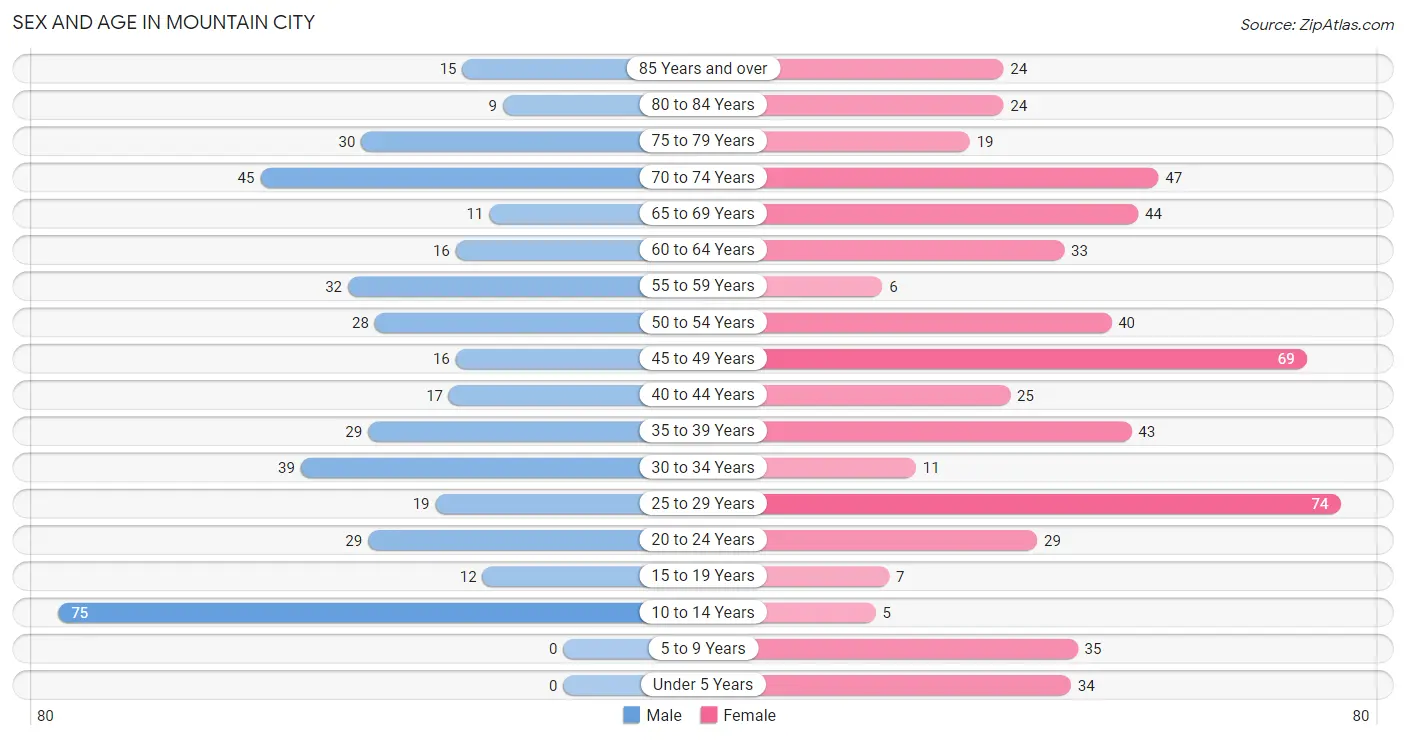
Sex and Age in Mountain City
Sex and Age in Mountain City
The most populous age groups in Mountain City are 10 to 14 Years (75 | 17.8%) for men and 25 to 29 Years (74 | 13.0%) for women.
| Age Bracket | Male | Female |
| Under 5 Years | 0 (0.0%) | 34 (6.0%) |
| 5 to 9 Years | 0 (0.0%) | 35 (6.1%) |
| 10 to 14 Years | 75 (17.8%) | 5 (0.9%) |
| 15 to 19 Years | 12 (2.8%) | 7 (1.2%) |
| 20 to 24 Years | 29 (6.9%) | 29 (5.1%) |
| 25 to 29 Years | 19 (4.5%) | 74 (13.0%) |
| 30 to 34 Years | 39 (9.2%) | 11 (1.9%) |
| 35 to 39 Years | 29 (6.9%) | 43 (7.6%) |
| 40 to 44 Years | 17 (4.0%) | 25 (4.4%) |
| 45 to 49 Years | 16 (3.8%) | 69 (12.1%) |
| 50 to 54 Years | 28 (6.6%) | 40 (7.0%) |
| 55 to 59 Years | 32 (7.6%) | 6 (1.1%) |
| 60 to 64 Years | 16 (3.8%) | 33 (5.8%) |
| 65 to 69 Years | 11 (2.6%) | 44 (7.7%) |
| 70 to 74 Years | 45 (10.7%) | 47 (8.3%) |
| 75 to 79 Years | 30 (7.1%) | 19 (3.3%) |
| 80 to 84 Years | 9 (2.1%) | 24 (4.2%) |
| 85 Years and over | 15 (3.5%) | 24 (4.2%) |
| Total | 422 (100.0%) | 569 (100.0%) |
Families and Households in Mountain City
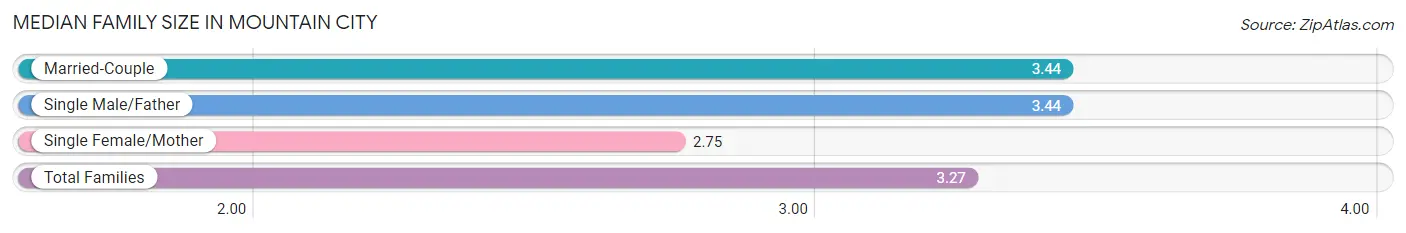
Median Family Size in Mountain City
The median family size in Mountain City is 3.27 persons per family, with married-couple families (151 | 65.1%) accounting for the largest median family size of 3.44 persons per family. On the other hand, single female/mother families (56 | 24.1%) represent the smallest median family size with 2.75 persons per family.
| Family Type | # Families | Family Size |
| Married-Couple | 151 (65.1%) | 3.44 |
| Single Male/Father | 25 (10.8%) | 3.44 |
| Single Female/Mother | 56 (24.1%) | 2.75 |
| Total Families | 232 (100.0%) | 3.27 |
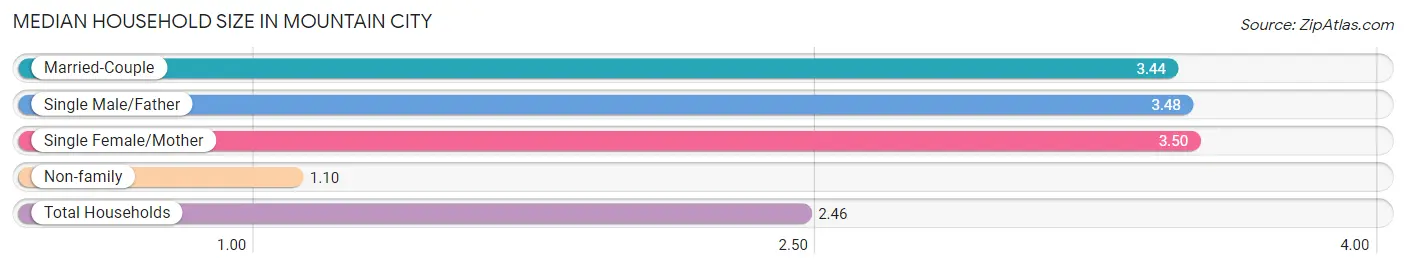
Median Household Size in Mountain City
The median household size in Mountain City is 2.46 persons per household, with single female/mother households (56 | 13.9%) accounting for the largest median household size of 3.5 persons per household. non-family households (170 | 42.3%) represent the smallest median household size with 1.10 persons per household.
| Household Type | # Households | Household Size |
| Married-Couple | 151 (37.6%) | 3.44 |
| Single Male/Father | 25 (6.2%) | 3.48 |
| Single Female/Mother | 56 (13.9%) | 3.50 |
| Non-family | 170 (42.3%) | 1.10 |
| Total Households | 402 (100.0%) | 2.46 |
Household Size by Marriage Status in Mountain City
Out of a total of 402 households in Mountain City, 232 (57.7%) are family households, while 170 (42.3%) are nonfamily households. The most numerous type of family households are 3-person households, comprising 104, and the most common type of nonfamily households are 1-person households, comprising 159.
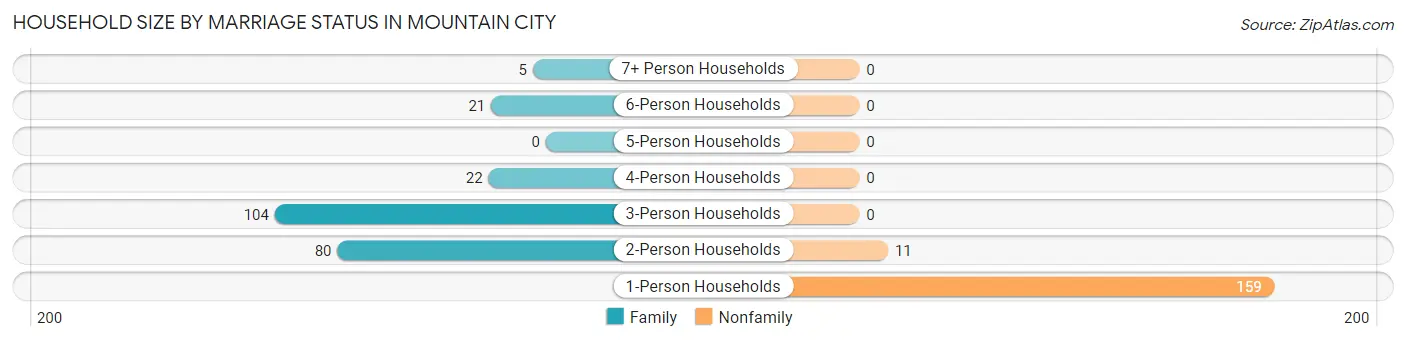
| Household Size | Family Households | Nonfamily Households |
| 1-Person Households | - | 159 (39.6%) |
| 2-Person Households | 80 (19.9%) | 11 (2.7%) |
| 3-Person Households | 104 (25.9%) | 0 (0.0%) |
| 4-Person Households | 22 (5.5%) | 0 (0.0%) |
| 5-Person Households | 0 (0.0%) | 0 (0.0%) |
| 6-Person Households | 21 (5.2%) | 0 (0.0%) |
| 7+ Person Households | 5 (1.2%) | 0 (0.0%) |
| Total | 232 (57.7%) | 170 (42.3%) |
Female Fertility in Mountain City
Fertility by Age in Mountain City
| Age Bracket | Women with Births | Births / 1,000 Women |
| 15 to 19 years | 0 (0.0%) | 0.0 |
| 20 to 34 years | 0 (0.0%) | 0.0 |
| 35 to 50 years | 0 (0.0%) | 0.0 |
| Total | 0 (0.0%) | 0.0 |
Fertility by Age by Marriage Status in Mountain City
| Age Bracket | Married | Unmarried |
| 15 to 19 years | 0 (0.0%) | 0 (0.0%) |
| 20 to 34 years | 0 (0.0%) | 0 (0.0%) |
| 35 to 50 years | 0 (0.0%) | 0 (0.0%) |
| Total | 0 (0.0%) | 0 (0.0%) |
Fertility by Education in Mountain City
| Educational Attainment | Women with Births | Births / 1,000 Women |
| Less than High School | 0 (0.0%) | 0.0 |
| High School Diploma | 0 (0.0%) | 0.0 |
| College or Associate's Degree | 0 (0.0%) | 0.0 |
| Bachelor's Degree | 0 (0.0%) | 0.0 |
| Graduate Degree | 0 (0.0%) | 0.0 |
| Total | 0 (0.0%) | 0.0 |
Fertility by Education by Marriage Status in Mountain City
| Educational Attainment | Married | Unmarried |
| Less than High School | 0 (0.0%) | 0 (0.0%) |
| High School Diploma | 0 (0.0%) | 0 (0.0%) |
| College or Associate's Degree | 0 (0.0%) | 0 (0.0%) |
| Bachelor's Degree | 0 (0.0%) | 0 (0.0%) |
| Graduate Degree | 0 (0.0%) | 0 (0.0%) |
| Total | 0 (0.0%) | 0 (0.0%) |
Employment Characteristics in Mountain City
Employment by Class of Employer in Mountain City
Among the 403 employed individuals in Mountain City, private company employees (220 | 54.6%), local government employees (84 | 20.8%), and self-employed (not incorporated) (66 | 16.4%) make up the most common classes of employment.
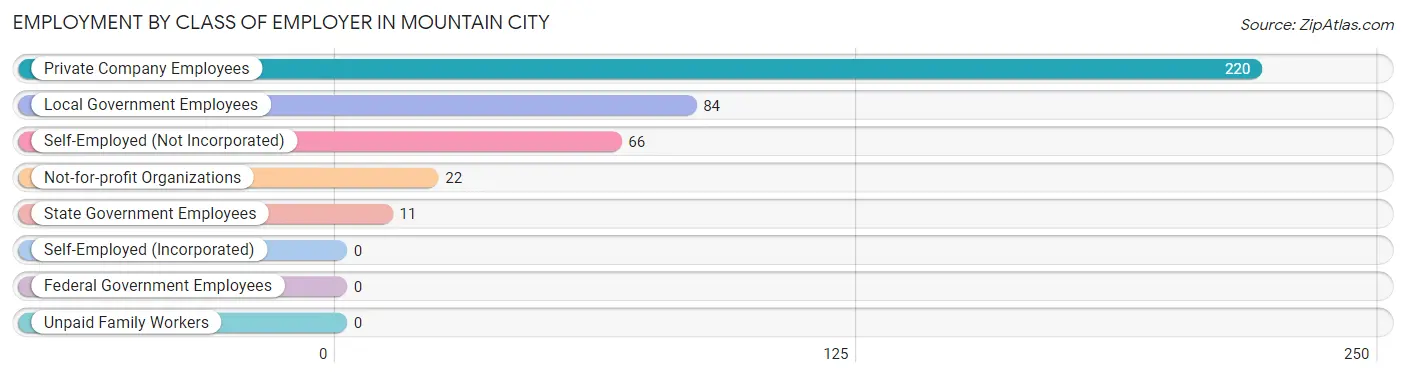
| Employer Class | # Employees | % Employees |
| Private Company Employees | 220 | 54.6% |
| Self-Employed (Incorporated) | 0 | 0.0% |
| Self-Employed (Not Incorporated) | 66 | 16.4% |
| Not-for-profit Organizations | 22 | 5.5% |
| Local Government Employees | 84 | 20.8% |
| State Government Employees | 11 | 2.7% |
| Federal Government Employees | 0 | 0.0% |
| Unpaid Family Workers | 0 | 0.0% |
| Total | 403 | 100.0% |
Employment Status by Age in Mountain City
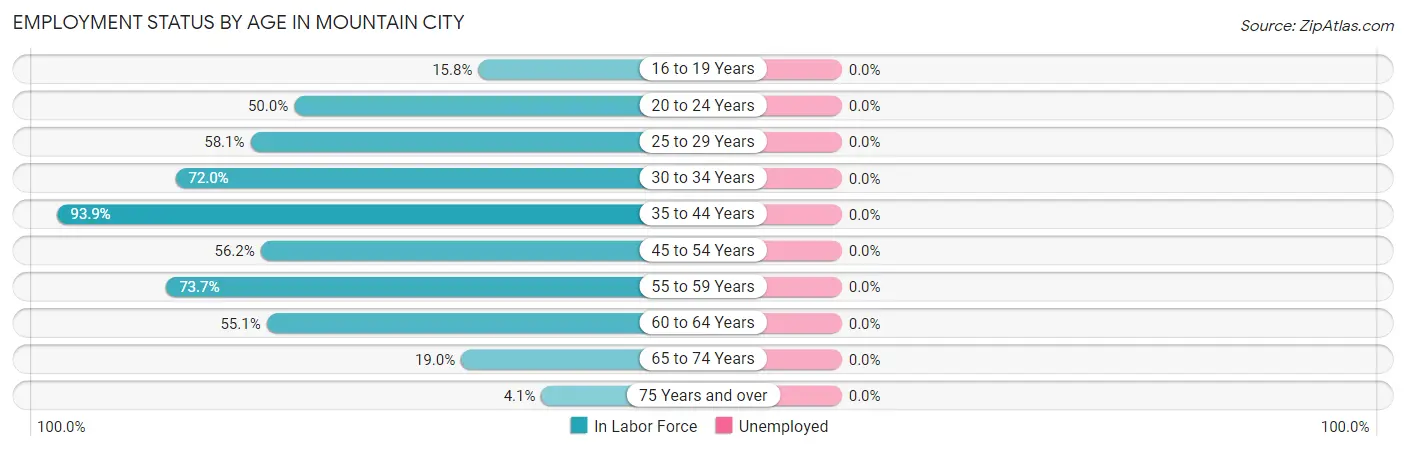
| Age Bracket | In Labor Force | Unemployed |
| 16 to 19 Years | 3 (15.8%) | 0 (0.0%) |
| 20 to 24 Years | 29 (50.0%) | 0 (0.0%) |
| 25 to 29 Years | 54 (58.1%) | 0 (0.0%) |
| 30 to 34 Years | 36 (72.0%) | 0 (0.0%) |
| 35 to 44 Years | 107 (93.9%) | 0 (0.0%) |
| 45 to 54 Years | 86 (56.2%) | 0 (0.0%) |
| 55 to 59 Years | 28 (73.7%) | 0 (0.0%) |
| 60 to 64 Years | 27 (55.1%) | 0 (0.0%) |
| 65 to 74 Years | 28 (19.0%) | 0 (0.0%) |
| 75 Years and over | 5 (4.1%) | 0 (0.0%) |
| Total | 403 (47.9%) | 0 (0.0%) |
Employment Status by Educational Attainment in Mountain City
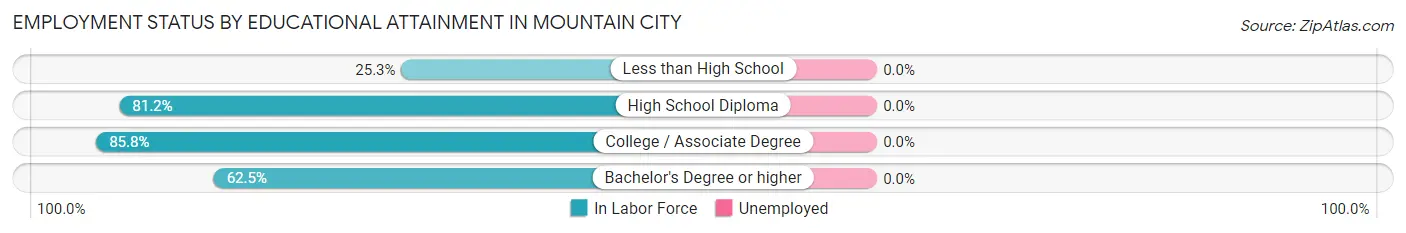
| Educational Attainment | In Labor Force | Unemployed |
| Less than High School | 22 (25.3%) | 0 (0.0%) |
| High School Diploma | 138 (81.2%) | 0 (0.0%) |
| College / Associate Degree | 103 (85.8%) | 0 (0.0%) |
| Bachelor's Degree or higher | 75 (62.5%) | 0 (0.0%) |
| Total | 338 (68.0%) | 0 (0.0%) |
Employment Occupations by Sex in Mountain City
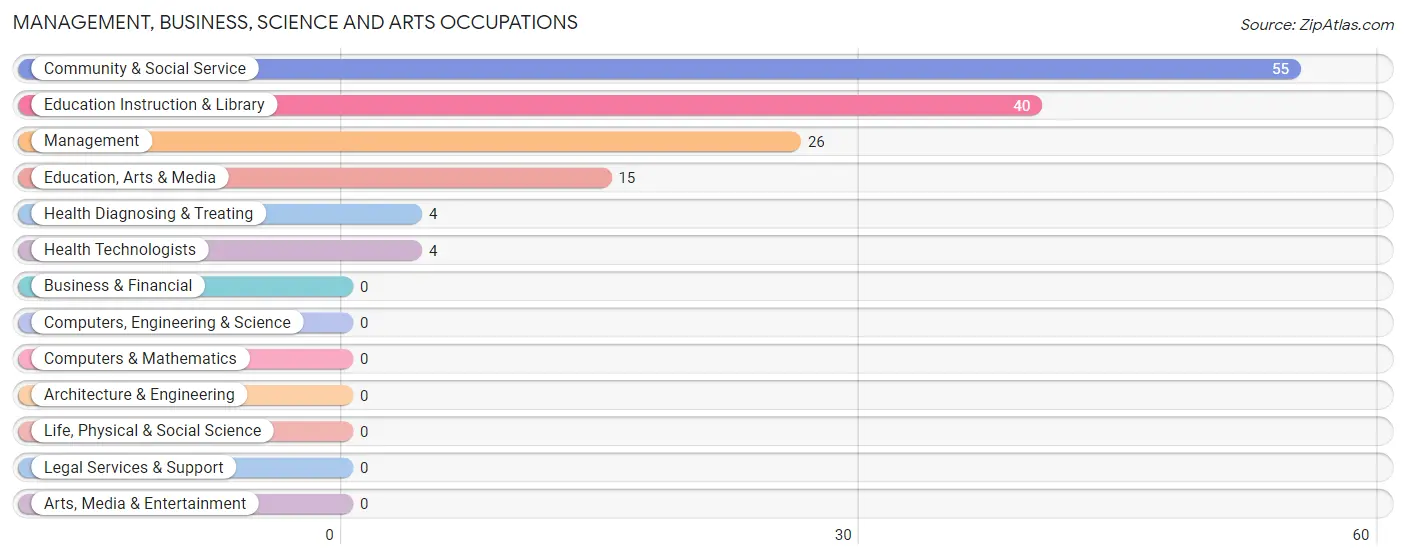
Management, Business, Science and Arts Occupations
The most common Management, Business, Science and Arts occupations in Mountain City are Community & Social Service (55 | 13.7%), Education Instruction & Library (40 | 9.9%), Management (26 | 6.5%), Education, Arts & Media (15 | 3.7%), and Health Diagnosing & Treating (4 | 1.0%).
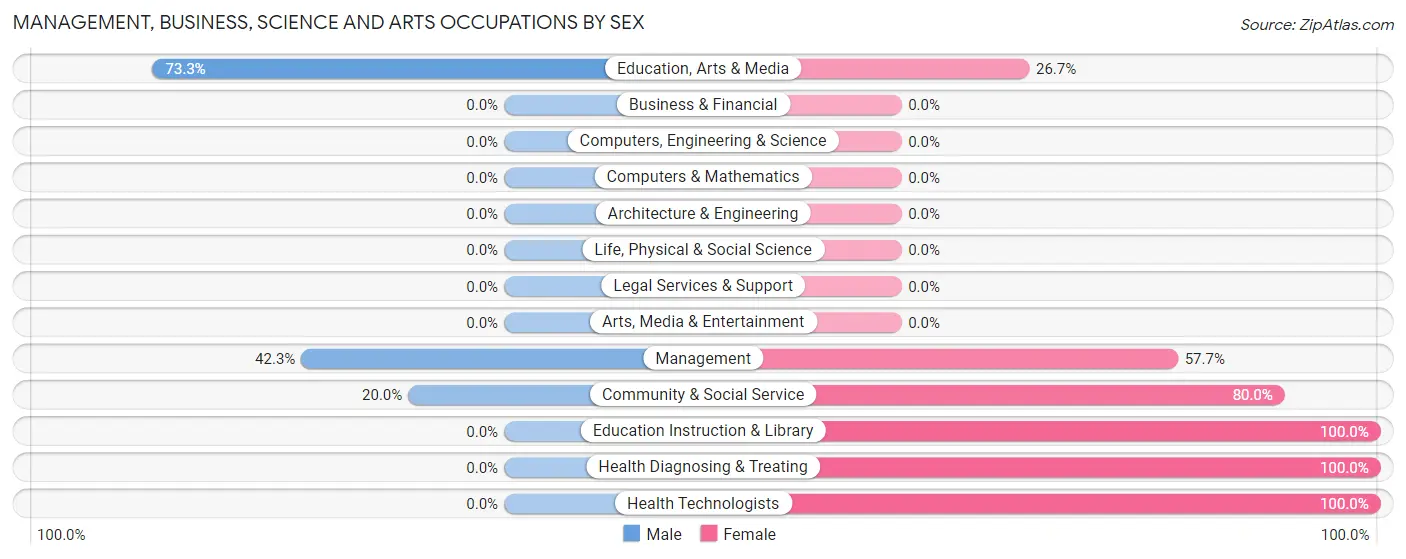
Management, Business, Science and Arts Occupations by Sex
Within the Management, Business, Science and Arts occupations in Mountain City, the most male-oriented occupations are Education, Arts & Media (73.3%), Management (42.3%), and Community & Social Service (20.0%), while the most female-oriented occupations are Education Instruction & Library (100.0%), Health Diagnosing & Treating (100.0%), and Health Technologists (100.0%).
| Occupation | Male | Female |
| Management | 11 (42.3%) | 15 (57.7%) |
| Business & Financial | 0 (0.0%) | 0 (0.0%) |
| Computers, Engineering & Science | 0 (0.0%) | 0 (0.0%) |
| Computers & Mathematics | 0 (0.0%) | 0 (0.0%) |
| Architecture & Engineering | 0 (0.0%) | 0 (0.0%) |
| Life, Physical & Social Science | 0 (0.0%) | 0 (0.0%) |
| Community & Social Service | 11 (20.0%) | 44 (80.0%) |
| Education, Arts & Media | 11 (73.3%) | 4 (26.7%) |
| Legal Services & Support | 0 (0.0%) | 0 (0.0%) |
| Education Instruction & Library | 0 (0.0%) | 40 (100.0%) |
| Arts, Media & Entertainment | 0 (0.0%) | 0 (0.0%) |
| Health Diagnosing & Treating | 0 (0.0%) | 4 (100.0%) |
| Health Technologists | 0 (0.0%) | 4 (100.0%) |
| Total (Category) | 22 (25.9%) | 63 (74.1%) |
| Total (Overall) | 175 (43.4%) | 228 (56.6%) |
Services Occupations
The most common Services occupations in Mountain City are Cleaning & Maintenance (35 | 8.7%), Personal Care & Service (28 | 7.0%), and Healthcare Support (25 | 6.2%).

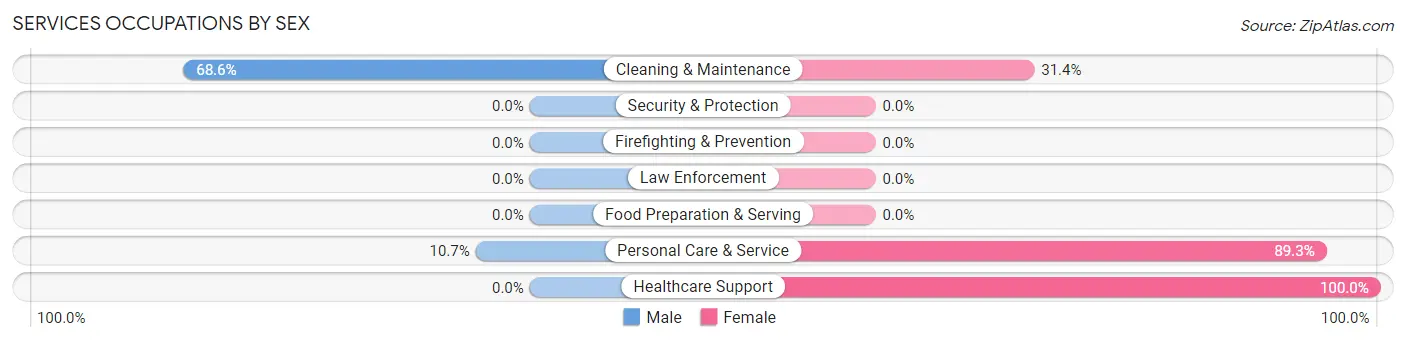
Services Occupations by Sex
Within the Services occupations in Mountain City, the most male-oriented occupations are Cleaning & Maintenance (68.6%), and Personal Care & Service (10.7%), while the most female-oriented occupations are Healthcare Support (100.0%), Personal Care & Service (89.3%), and Cleaning & Maintenance (31.4%).
| Occupation | Male | Female |
| Healthcare Support | 0 (0.0%) | 25 (100.0%) |
| Security & Protection | 0 (0.0%) | 0 (0.0%) |
| Firefighting & Prevention | 0 (0.0%) | 0 (0.0%) |
| Law Enforcement | 0 (0.0%) | 0 (0.0%) |
| Food Preparation & Serving | 0 (0.0%) | 0 (0.0%) |
| Cleaning & Maintenance | 24 (68.6%) | 11 (31.4%) |
| Personal Care & Service | 3 (10.7%) | 25 (89.3%) |
| Total (Category) | 27 (30.7%) | 61 (69.3%) |
| Total (Overall) | 175 (43.4%) | 228 (56.6%) |
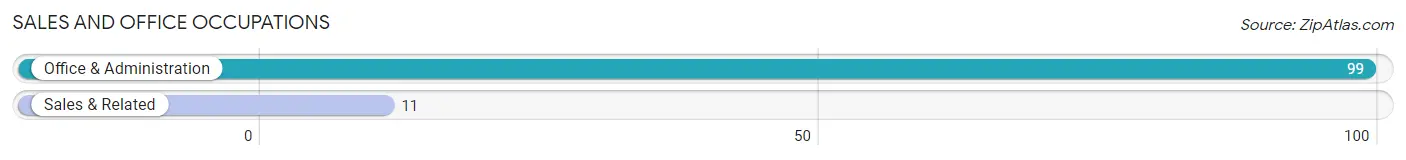
Sales and Office Occupations
The most common Sales and Office occupations in Mountain City are Office & Administration (99 | 24.6%), and Sales & Related (11 | 2.7%).
Sales and Office Occupations by Sex
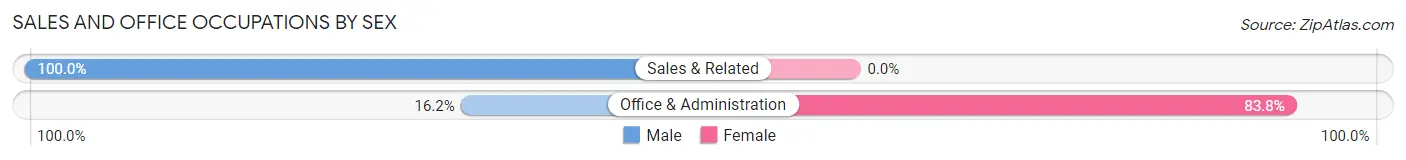
| Occupation | Male | Female |
| Sales & Related | 11 (100.0%) | 0 (0.0%) |
| Office & Administration | 16 (16.2%) | 83 (83.8%) |
| Total (Category) | 27 (24.5%) | 83 (75.4%) |
| Total (Overall) | 175 (43.4%) | 228 (56.6%) |
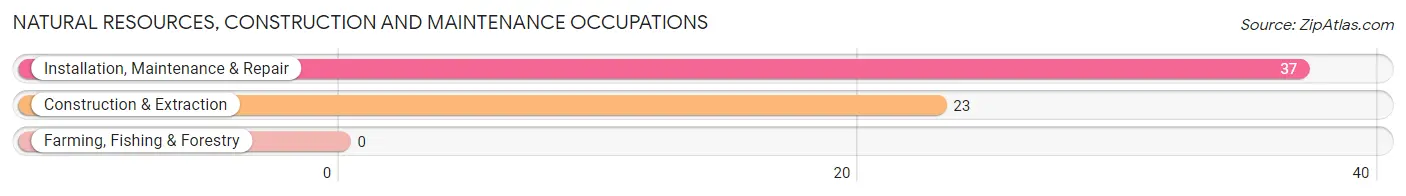
Natural Resources, Construction and Maintenance Occupations
The most common Natural Resources, Construction and Maintenance occupations in Mountain City are Installation, Maintenance & Repair (37 | 9.2%), and Construction & Extraction (23 | 5.7%).
Natural Resources, Construction and Maintenance Occupations by Sex
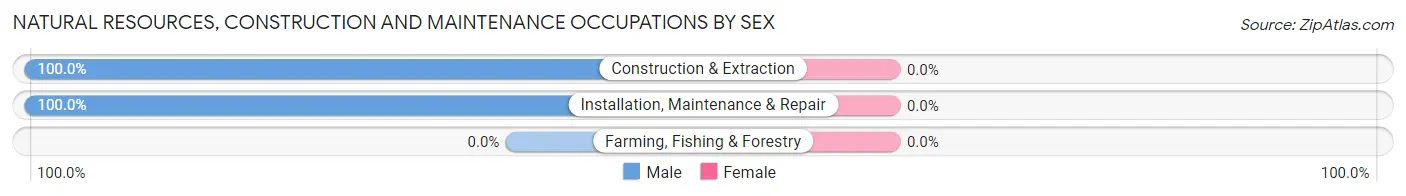
| Occupation | Male | Female |
| Farming, Fishing & Forestry | 0 (0.0%) | 0 (0.0%) |
| Construction & Extraction | 23 (100.0%) | 0 (0.0%) |
| Installation, Maintenance & Repair | 37 (100.0%) | 0 (0.0%) |
| Total (Category) | 60 (100.0%) | 0 (0.0%) |
| Total (Overall) | 175 (43.4%) | 228 (56.6%) |
Production, Transportation and Moving Occupations
The most common Production, Transportation and Moving occupations in Mountain City are Material Moving (43 | 10.7%), and Production (17 | 4.2%).
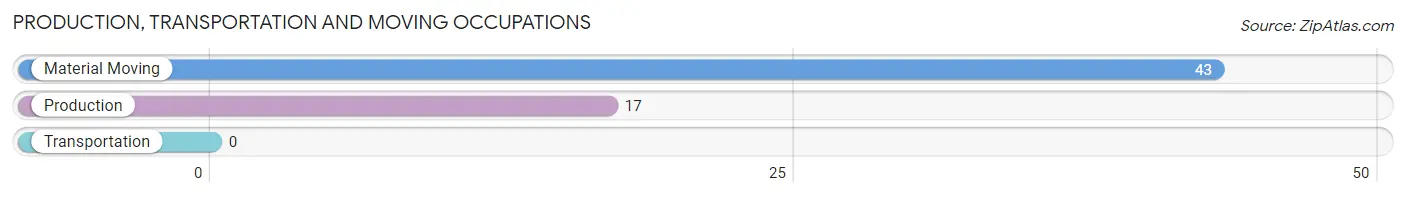
Production, Transportation and Moving Occupations by Sex
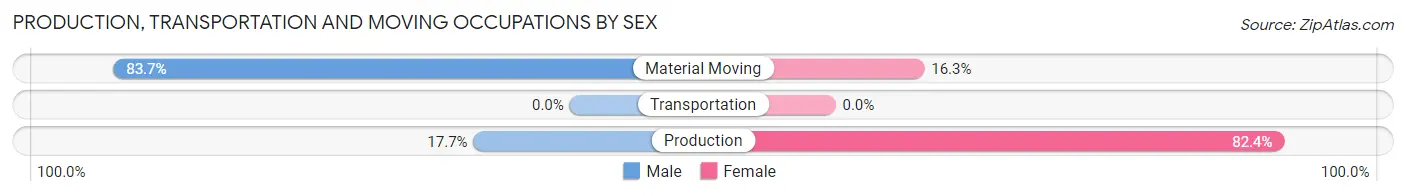
| Occupation | Male | Female |
| Production | 3 (17.6%) | 14 (82.4%) |
| Transportation | 0 (0.0%) | 0 (0.0%) |
| Material Moving | 36 (83.7%) | 7 (16.3%) |
| Total (Category) | 39 (65.0%) | 21 (35.0%) |
| Total (Overall) | 175 (43.4%) | 228 (56.6%) |
Employment Industries by Sex in Mountain City
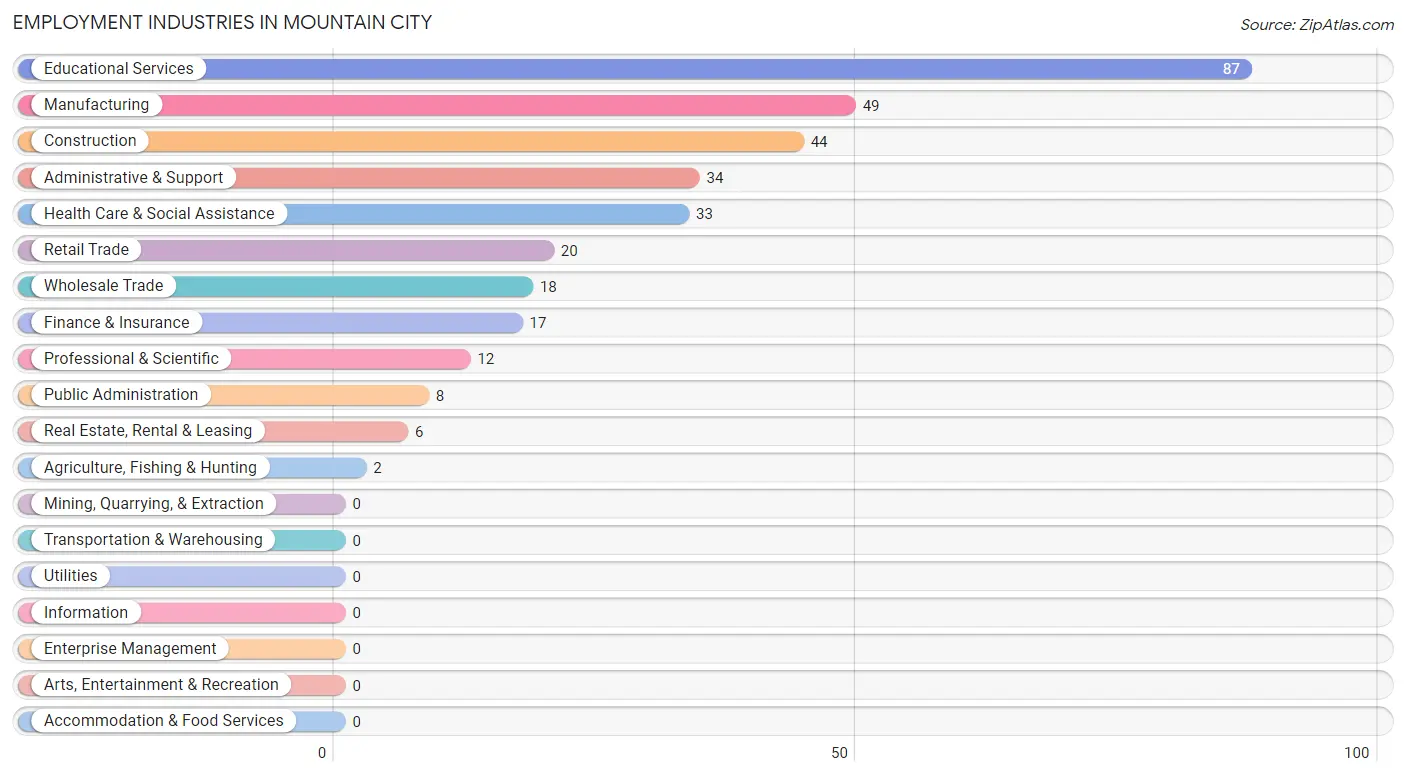
Employment Industries in Mountain City
The major employment industries in Mountain City include Educational Services (87 | 21.6%), Manufacturing (49 | 12.2%), Construction (44 | 10.9%), Administrative & Support (34 | 8.4%), and Health Care & Social Assistance (33 | 8.2%).
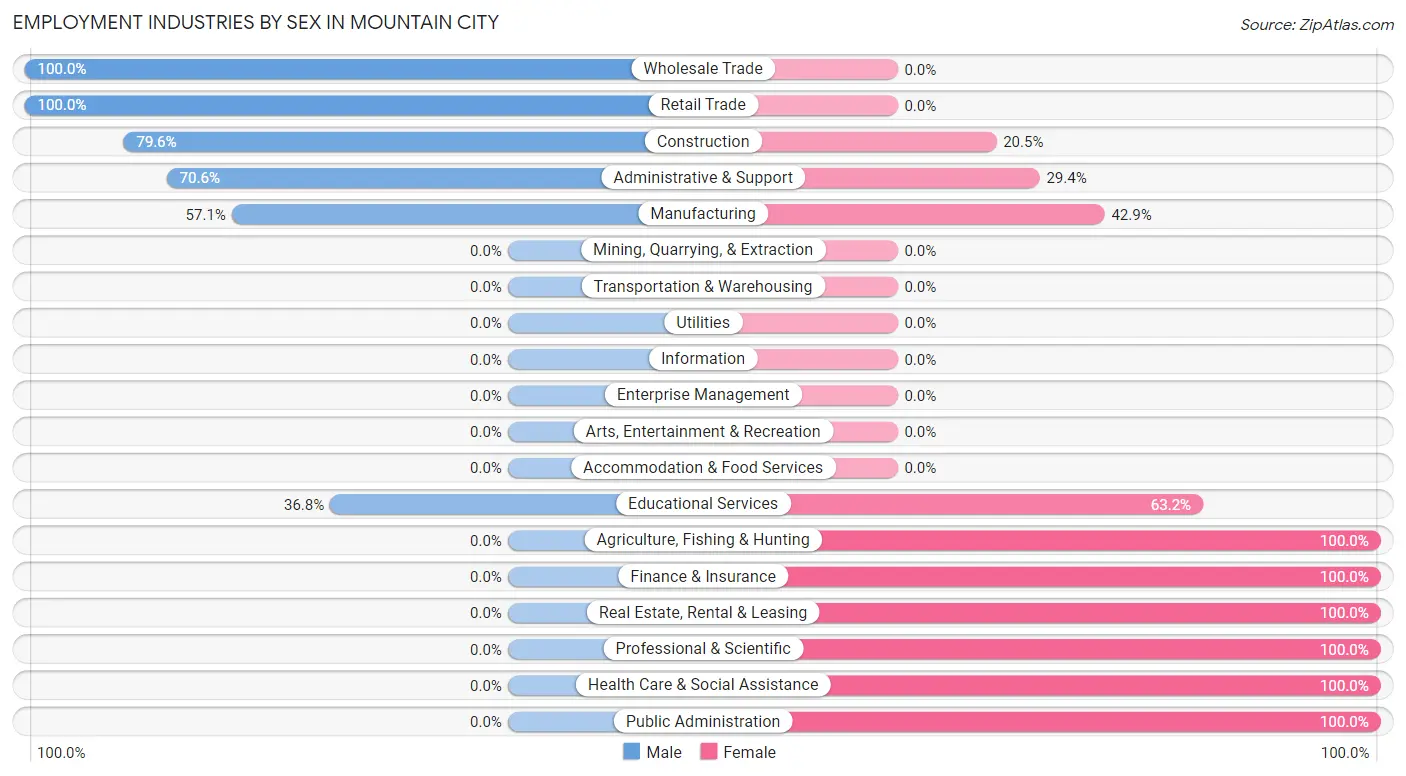
Employment Industries by Sex in Mountain City
The Mountain City industries that see more men than women are Wholesale Trade (100.0%), Retail Trade (100.0%), and Construction (79.5%), whereas the industries that tend to have a higher number of women are Agriculture, Fishing & Hunting (100.0%), Finance & Insurance (100.0%), and Real Estate, Rental & Leasing (100.0%).
| Industry | Male | Female |
| Agriculture, Fishing & Hunting | 0 (0.0%) | 2 (100.0%) |
| Mining, Quarrying, & Extraction | 0 (0.0%) | 0 (0.0%) |
| Construction | 35 (79.5%) | 9 (20.4%) |
| Manufacturing | 28 (57.1%) | 21 (42.9%) |
| Wholesale Trade | 18 (100.0%) | 0 (0.0%) |
| Retail Trade | 20 (100.0%) | 0 (0.0%) |
| Transportation & Warehousing | 0 (0.0%) | 0 (0.0%) |
| Utilities | 0 (0.0%) | 0 (0.0%) |
| Information | 0 (0.0%) | 0 (0.0%) |
| Finance & Insurance | 0 (0.0%) | 17 (100.0%) |
| Real Estate, Rental & Leasing | 0 (0.0%) | 6 (100.0%) |
| Professional & Scientific | 0 (0.0%) | 12 (100.0%) |
| Enterprise Management | 0 (0.0%) | 0 (0.0%) |
| Administrative & Support | 24 (70.6%) | 10 (29.4%) |
| Educational Services | 32 (36.8%) | 55 (63.2%) |
| Health Care & Social Assistance | 0 (0.0%) | 33 (100.0%) |
| Arts, Entertainment & Recreation | 0 (0.0%) | 0 (0.0%) |
| Accommodation & Food Services | 0 (0.0%) | 0 (0.0%) |
| Public Administration | 0 (0.0%) | 8 (100.0%) |
| Total | 175 (43.4%) | 228 (56.6%) |
Education in Mountain City
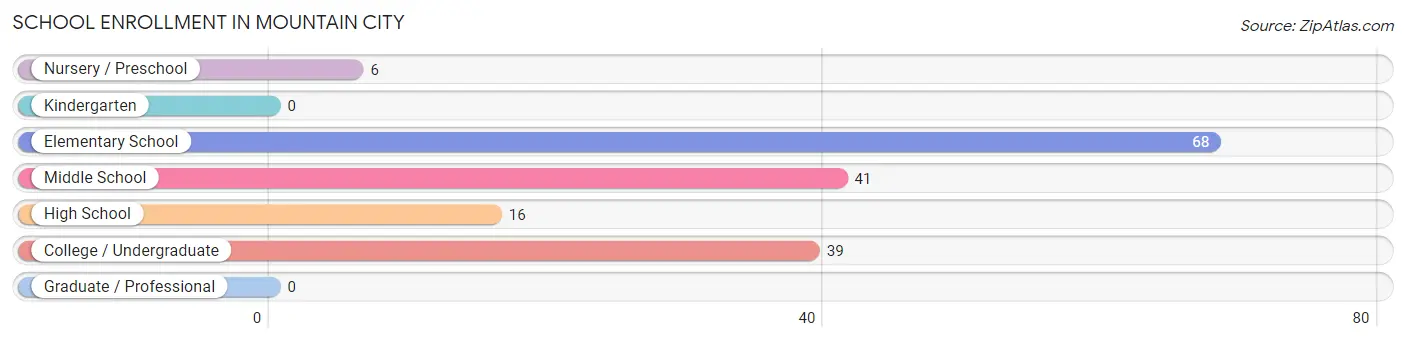
School Enrollment in Mountain City
The most common levels of schooling among the 170 students in Mountain City are elementary school (68 | 40.0%), middle school (41 | 24.1%), and college / undergraduate (39 | 22.9%).
| School Level | # Students | % Students |
| Nursery / Preschool | 6 | 3.5% |
| Kindergarten | 0 | 0.0% |
| Elementary School | 68 | 40.0% |
| Middle School | 41 | 24.1% |
| High School | 16 | 9.4% |
| College / Undergraduate | 39 | 22.9% |
| Graduate / Professional | 0 | 0.0% |
| Total | 170 | 100.0% |
School Enrollment by Age by Funding Source in Mountain City
Out of a total of 170 students who are enrolled in schools in Mountain City, 13 (7.6%) attend a private institution, while the remaining 157 (92.4%) are enrolled in public schools. The age group of 18 to 19 year olds has the highest likelihood of being enrolled in private schools, with 6 (100.0% in the age bracket) enrolled. Conversely, the age group of 5 to 9 year old has the lowest likelihood of being enrolled in a private school, with 35 (100.0% in the age bracket) attending a public institution.
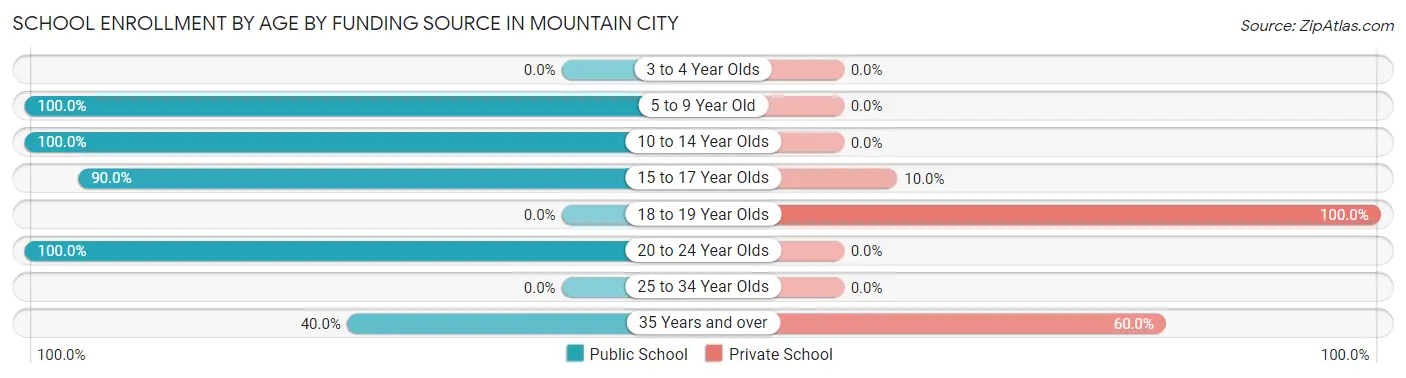
| Age Bracket | Public School | Private School |
| 3 to 4 Year Olds | 0 (0.0%) | 0 (0.0%) |
| 5 to 9 Year Old | 35 (100.0%) | 0 (0.0%) |
| 10 to 14 Year Olds | 80 (100.0%) | 0 (0.0%) |
| 15 to 17 Year Olds | 9 (90.0%) | 1 (10.0%) |
| 18 to 19 Year Olds | 0 (0.0%) | 6 (100.0%) |
| 20 to 24 Year Olds | 29 (100.0%) | 0 (0.0%) |
| 25 to 34 Year Olds | 0 (0.0%) | 0 (0.0%) |
| 35 Years and over | 4 (40.0%) | 6 (60.0%) |
| Total | 157 (92.4%) | 13 (7.6%) |
Educational Attainment by Field of Study in Mountain City
Science & technology (51 | 36.7%), business (48 | 34.5%), education (19 | 13.7%), social sciences (11 | 7.9%), and liberal arts & history (10 | 7.2%) are the most common fields of study among 139 individuals in Mountain City who have obtained a bachelor's degree or higher.
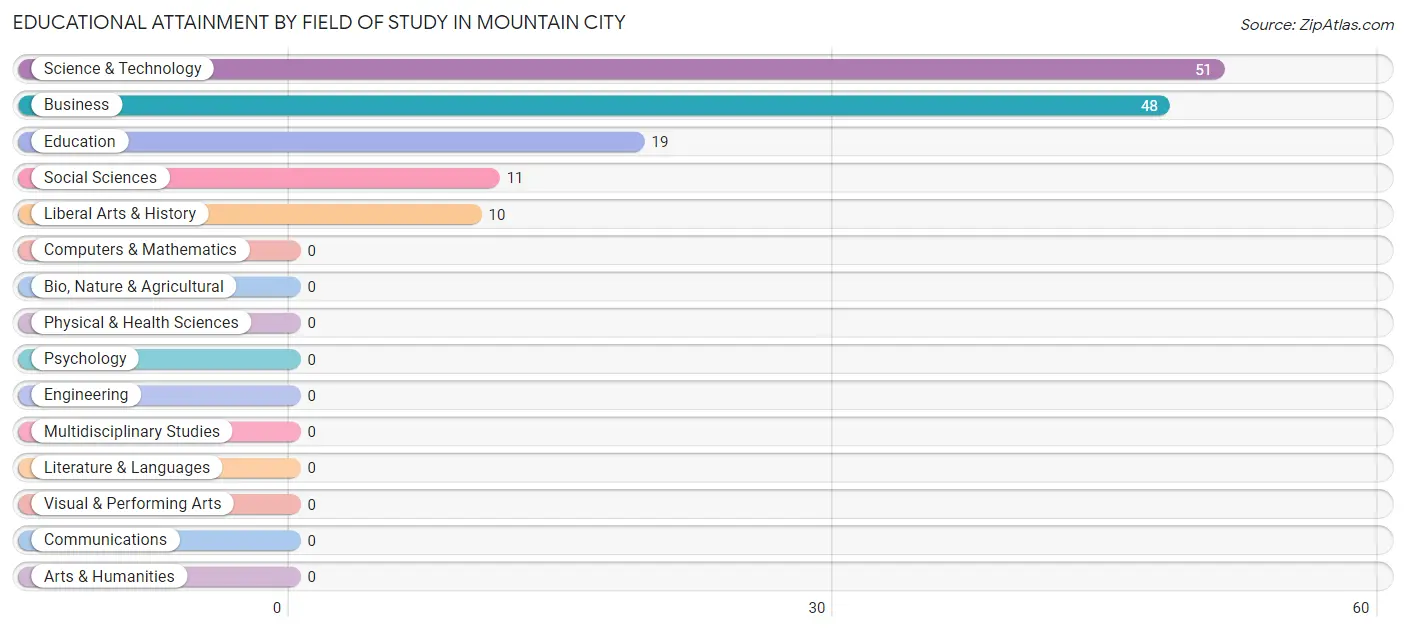
| Field of Study | # Graduates | % Graduates |
| Computers & Mathematics | 0 | 0.0% |
| Bio, Nature & Agricultural | 0 | 0.0% |
| Physical & Health Sciences | 0 | 0.0% |
| Psychology | 0 | 0.0% |
| Social Sciences | 11 | 7.9% |
| Engineering | 0 | 0.0% |
| Multidisciplinary Studies | 0 | 0.0% |
| Science & Technology | 51 | 36.7% |
| Business | 48 | 34.5% |
| Education | 19 | 13.7% |
| Literature & Languages | 0 | 0.0% |
| Liberal Arts & History | 10 | 7.2% |
| Visual & Performing Arts | 0 | 0.0% |
| Communications | 0 | 0.0% |
| Arts & Humanities | 0 | 0.0% |
| Total | 139 | 100.0% |
Transportation & Commute in Mountain City
Vehicle Availability by Sex in Mountain City
The most prevalent vehicle ownership categories in Mountain City are males with 2 vehicles (67, accounting for 38.3%) and females with 2 vehicles (48, making up 29.4%).
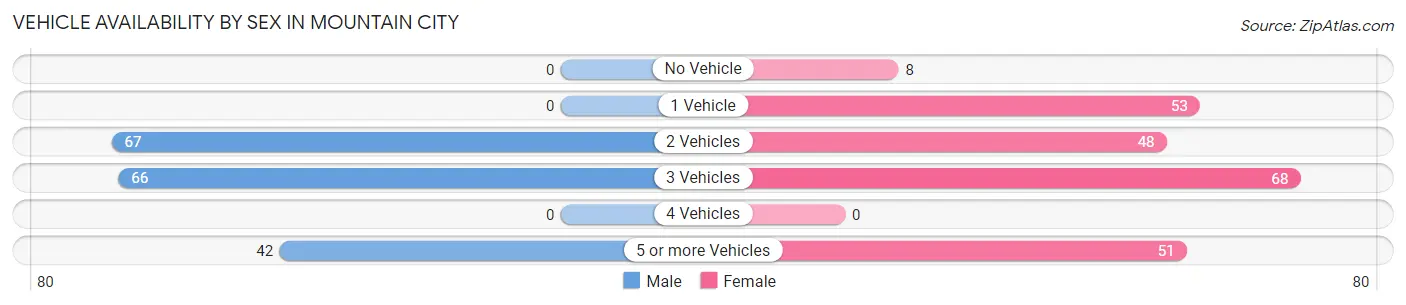
| Vehicles Available | Male | Female |
| No Vehicle | 0 (0.0%) | 8 (3.5%) |
| 1 Vehicle | 0 (0.0%) | 53 (23.3%) |
| 2 Vehicles | 67 (38.3%) | 48 (21.0%) |
| 3 Vehicles | 66 (37.7%) | 68 (29.8%) |
| 4 Vehicles | 0 (0.0%) | 0 (0.0%) |
| 5 or more Vehicles | 42 (24.0%) | 51 (22.4%) |
| Total | 175 (100.0%) | 228 (100.0%) |
Commute Time in Mountain City
The most frequently occuring commute durations in Mountain City are 10 to 14 minutes (116 commuters, 31.9%), 5 to 9 minutes (76 commuters, 20.9%), and 30 to 34 minutes (40 commuters, 11.0%).
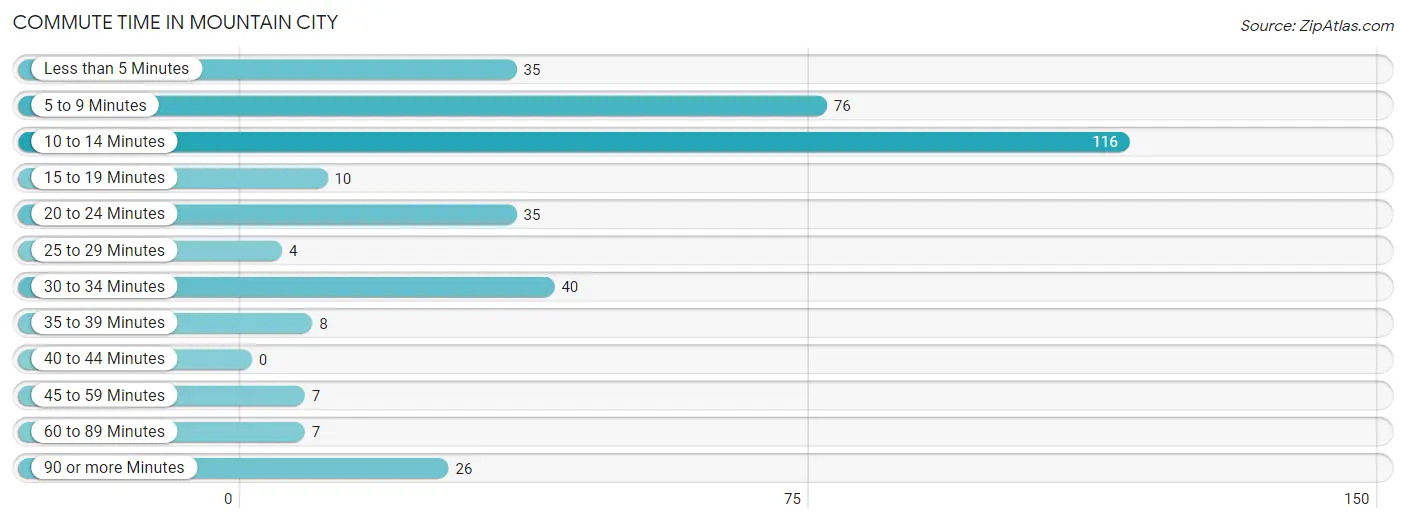
| Commute Time | # Commuters | % Commuters |
| Less than 5 Minutes | 35 | 9.6% |
| 5 to 9 Minutes | 76 | 20.9% |
| 10 to 14 Minutes | 116 | 31.9% |
| 15 to 19 Minutes | 10 | 2.8% |
| 20 to 24 Minutes | 35 | 9.6% |
| 25 to 29 Minutes | 4 | 1.1% |
| 30 to 34 Minutes | 40 | 11.0% |
| 35 to 39 Minutes | 8 | 2.2% |
| 40 to 44 Minutes | 0 | 0.0% |
| 45 to 59 Minutes | 7 | 1.9% |
| 60 to 89 Minutes | 7 | 1.9% |
| 90 or more Minutes | 26 | 7.1% |
Commute Time by Sex in Mountain City
The most common commute times in Mountain City are 10 to 14 minutes (51 commuters, 31.1%) for males and 10 to 14 minutes (65 commuters, 32.5%) for females.
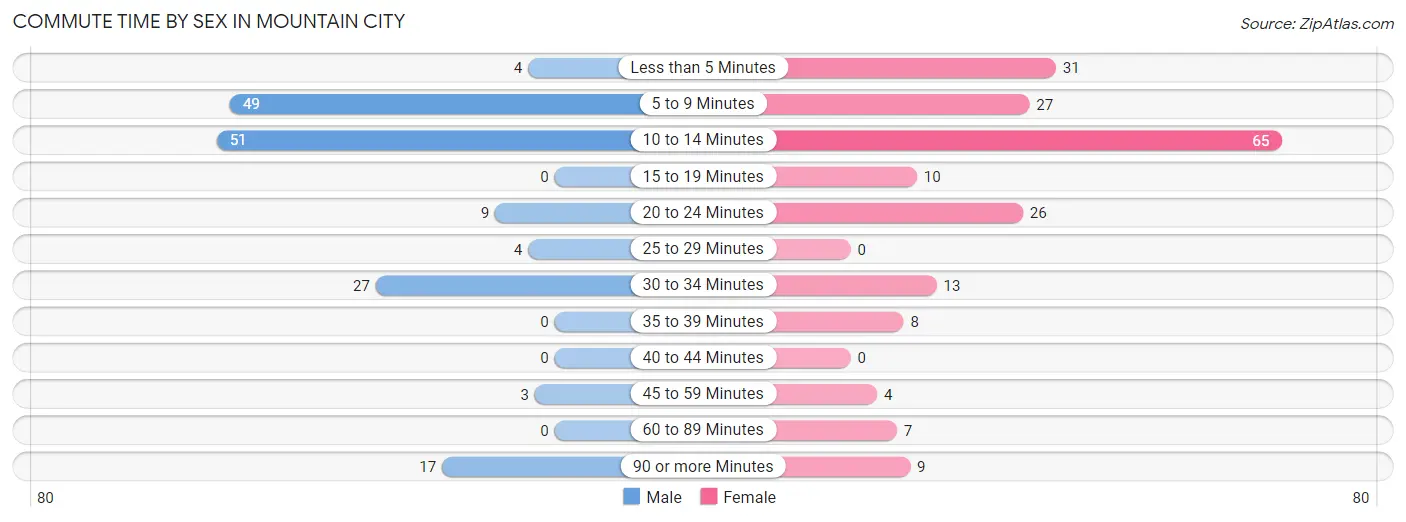
| Commute Time | Male | Female |
| Less than 5 Minutes | 4 (2.4%) | 31 (15.5%) |
| 5 to 9 Minutes | 49 (29.9%) | 27 (13.5%) |
| 10 to 14 Minutes | 51 (31.1%) | 65 (32.5%) |
| 15 to 19 Minutes | 0 (0.0%) | 10 (5.0%) |
| 20 to 24 Minutes | 9 (5.5%) | 26 (13.0%) |
| 25 to 29 Minutes | 4 (2.4%) | 0 (0.0%) |
| 30 to 34 Minutes | 27 (16.5%) | 13 (6.5%) |
| 35 to 39 Minutes | 0 (0.0%) | 8 (4.0%) |
| 40 to 44 Minutes | 0 (0.0%) | 0 (0.0%) |
| 45 to 59 Minutes | 3 (1.8%) | 4 (2.0%) |
| 60 to 89 Minutes | 0 (0.0%) | 7 (3.5%) |
| 90 or more Minutes | 17 (10.4%) | 9 (4.5%) |
Time of Departure to Work by Sex in Mountain City
The most frequent times of departure to work in Mountain City are 7:00 AM to 7:29 AM (36, 22.0%) for males and 6:00 AM to 6:29 AM (45, 22.5%) for females.
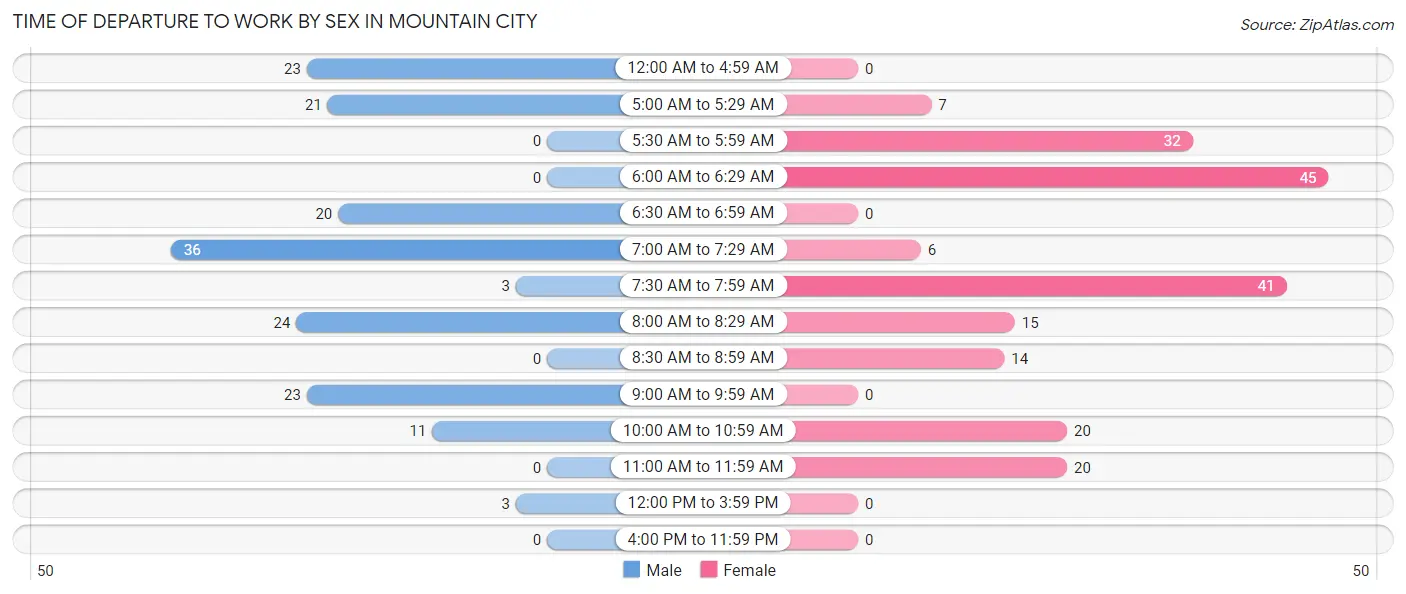
| Time of Departure | Male | Female |
| 12:00 AM to 4:59 AM | 23 (14.0%) | 0 (0.0%) |
| 5:00 AM to 5:29 AM | 21 (12.8%) | 7 (3.5%) |
| 5:30 AM to 5:59 AM | 0 (0.0%) | 32 (16.0%) |
| 6:00 AM to 6:29 AM | 0 (0.0%) | 45 (22.5%) |
| 6:30 AM to 6:59 AM | 20 (12.2%) | 0 (0.0%) |
| 7:00 AM to 7:29 AM | 36 (22.0%) | 6 (3.0%) |
| 7:30 AM to 7:59 AM | 3 (1.8%) | 41 (20.5%) |
| 8:00 AM to 8:29 AM | 24 (14.6%) | 15 (7.5%) |
| 8:30 AM to 8:59 AM | 0 (0.0%) | 14 (7.0%) |
| 9:00 AM to 9:59 AM | 23 (14.0%) | 0 (0.0%) |
| 10:00 AM to 10:59 AM | 11 (6.7%) | 20 (10.0%) |
| 11:00 AM to 11:59 AM | 0 (0.0%) | 20 (10.0%) |
| 12:00 PM to 3:59 PM | 3 (1.8%) | 0 (0.0%) |
| 4:00 PM to 11:59 PM | 0 (0.0%) | 0 (0.0%) |
| Total | 164 (100.0%) | 200 (100.0%) |
Housing Occupancy in Mountain City
Occupancy by Ownership in Mountain City
Of the total 402 dwellings in Mountain City, owner-occupied units account for 242 (60.2%), while renter-occupied units make up 160 (39.8%).
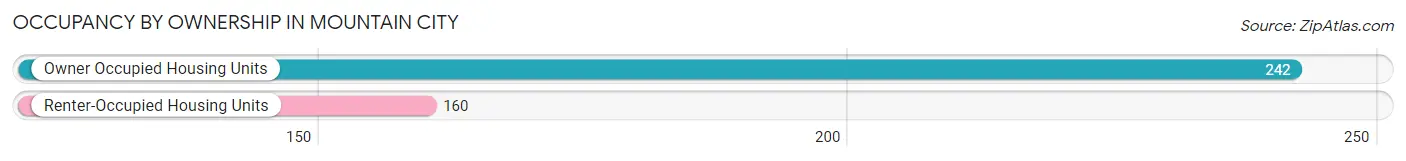
| Occupancy | # Housing Units | % Housing Units |
| Owner Occupied Housing Units | 242 | 60.2% |
| Renter-Occupied Housing Units | 160 | 39.8% |
| Total Occupied Housing Units | 402 | 100.0% |
Occupancy by Household Size in Mountain City
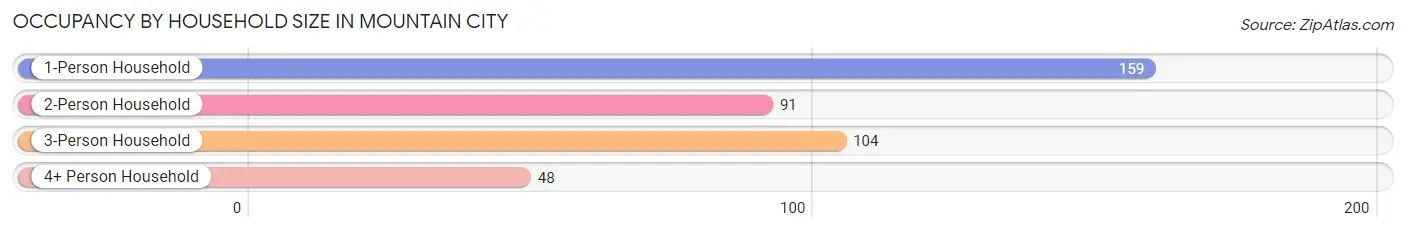
| Household Size | # Housing Units | % Housing Units |
| 1-Person Household | 159 | 39.6% |
| 2-Person Household | 91 | 22.6% |
| 3-Person Household | 104 | 25.9% |
| 4+ Person Household | 48 | 11.9% |
| Total Housing Units | 402 | 100.0% |
Occupancy by Ownership by Household Size in Mountain City
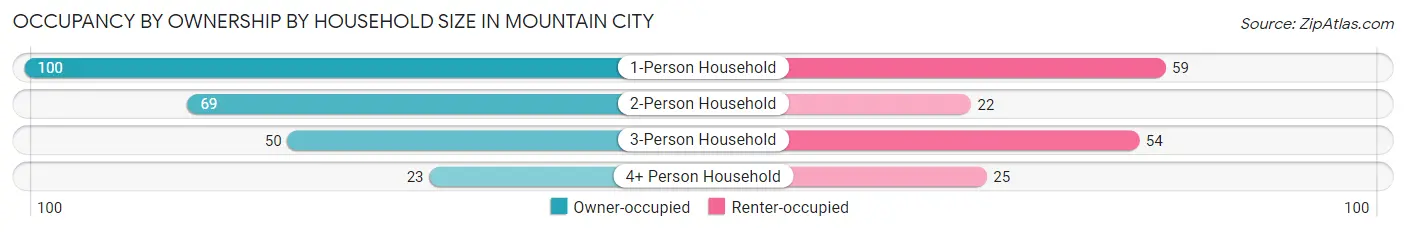
| Household Size | Owner-occupied | Renter-occupied |
| 1-Person Household | 100 (62.9%) | 59 (37.1%) |
| 2-Person Household | 69 (75.8%) | 22 (24.2%) |
| 3-Person Household | 50 (48.1%) | 54 (51.9%) |
| 4+ Person Household | 23 (47.9%) | 25 (52.1%) |
| Total Housing Units | 242 (60.2%) | 160 (39.8%) |
Occupancy by Educational Attainment in Mountain City
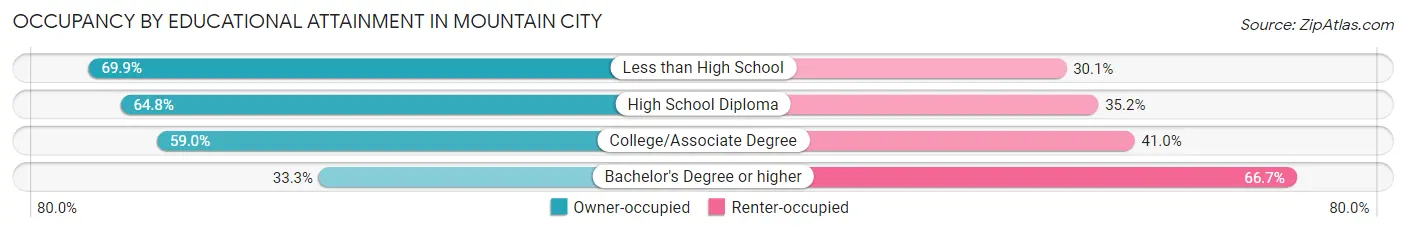
| Household Size | Owner-occupied | Renter-occupied |
| Less than High School | 51 (69.9%) | 22 (30.1%) |
| High School Diploma | 103 (64.8%) | 56 (35.2%) |
| College/Associate Degree | 72 (59.0%) | 50 (41.0%) |
| Bachelor's Degree or higher | 16 (33.3%) | 32 (66.7%) |
Occupancy by Age of Householder in Mountain City
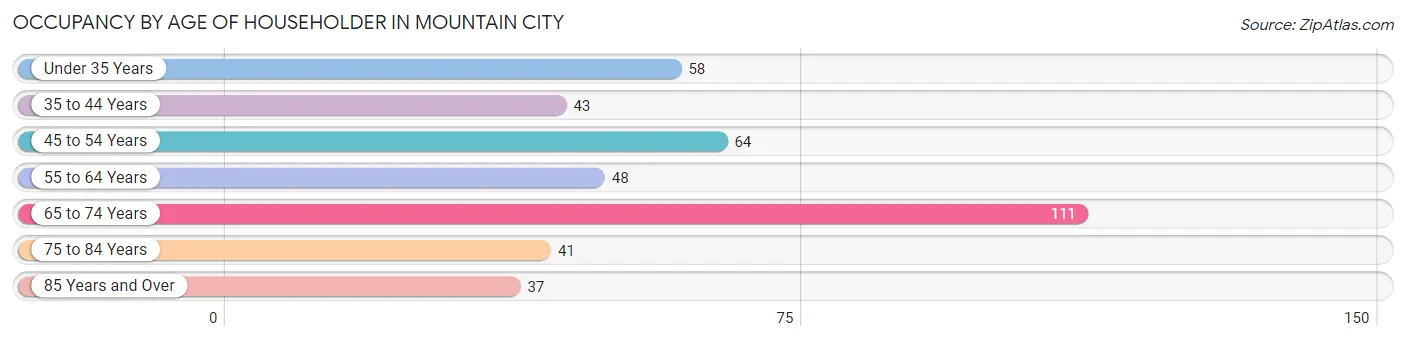
| Age Bracket | # Households | % Households |
| Under 35 Years | 58 | 14.4% |
| 35 to 44 Years | 43 | 10.7% |
| 45 to 54 Years | 64 | 15.9% |
| 55 to 64 Years | 48 | 11.9% |
| 65 to 74 Years | 111 | 27.6% |
| 75 to 84 Years | 41 | 10.2% |
| 85 Years and Over | 37 | 9.2% |
| Total | 402 | 100.0% |
Housing Finances in Mountain City
Median Income by Occupancy in Mountain City
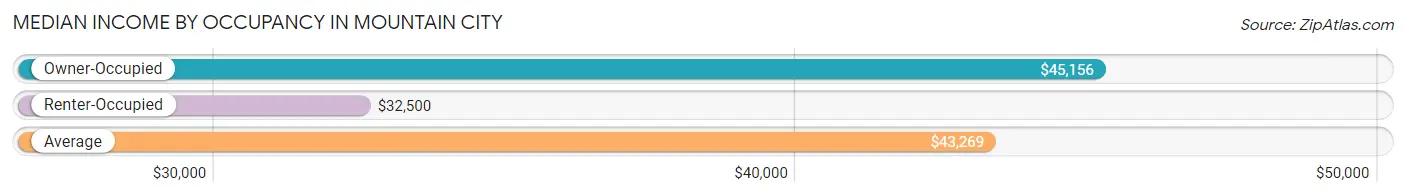
| Occupancy Type | # Households | Median Income |
| Owner-Occupied | 242 (60.2%) | $45,156 |
| Renter-Occupied | 160 (39.8%) | $32,500 |
| Average | 402 (100.0%) | $43,269 |
Occupancy by Householder Income Bracket in Mountain City
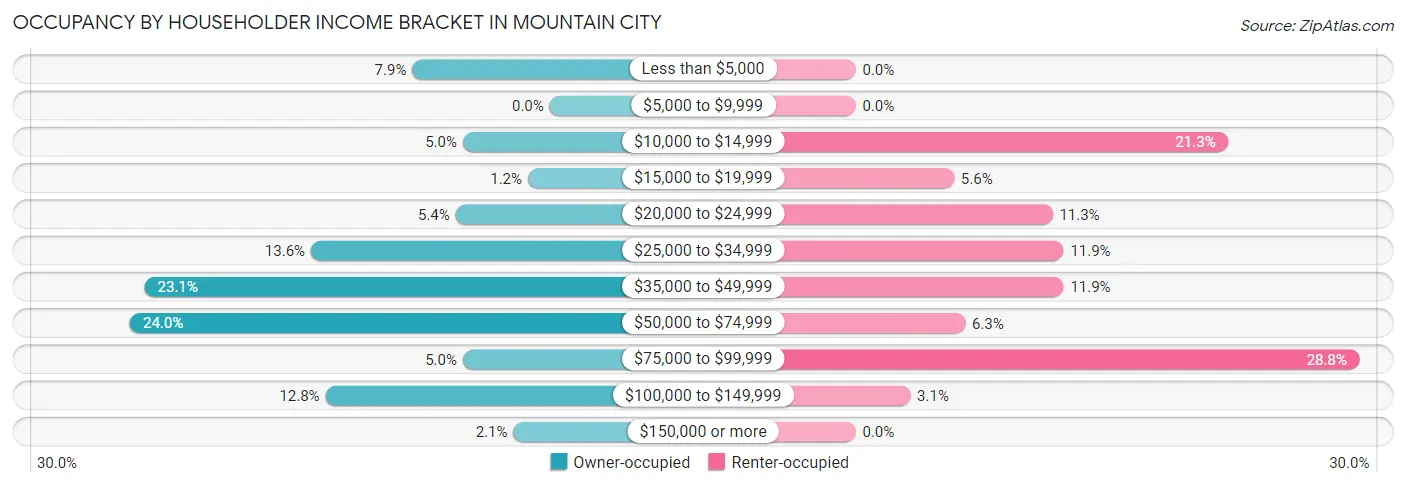
| Income Bracket | Owner-occupied | Renter-occupied |
| Less than $5,000 | 19 (7.9%) | 0 (0.0%) |
| $5,000 to $9,999 | 0 (0.0%) | 0 (0.0%) |
| $10,000 to $14,999 | 12 (5.0%) | 34 (21.2%) |
| $15,000 to $19,999 | 3 (1.2%) | 9 (5.6%) |
| $20,000 to $24,999 | 13 (5.4%) | 18 (11.3%) |
| $25,000 to $34,999 | 33 (13.6%) | 19 (11.9%) |
| $35,000 to $49,999 | 56 (23.1%) | 19 (11.9%) |
| $50,000 to $74,999 | 58 (24.0%) | 10 (6.2%) |
| $75,000 to $99,999 | 12 (5.0%) | 46 (28.7%) |
| $100,000 to $149,999 | 31 (12.8%) | 5 (3.1%) |
| $150,000 or more | 5 (2.1%) | 0 (0.0%) |
| Total | 242 (100.0%) | 160 (100.0%) |
Monthly Housing Cost Tiers in Mountain City
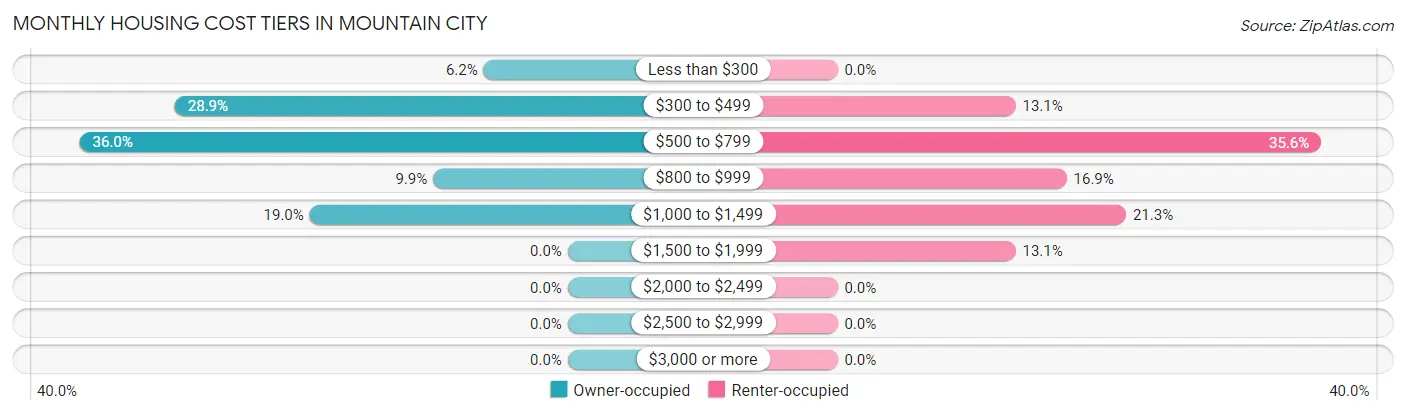
| Monthly Cost | Owner-occupied | Renter-occupied |
| Less than $300 | 15 (6.2%) | 0 (0.0%) |
| $300 to $499 | 70 (28.9%) | 21 (13.1%) |
| $500 to $799 | 87 (35.9%) | 57 (35.6%) |
| $800 to $999 | 24 (9.9%) | 27 (16.9%) |
| $1,000 to $1,499 | 46 (19.0%) | 34 (21.2%) |
| $1,500 to $1,999 | 0 (0.0%) | 21 (13.1%) |
| $2,000 to $2,499 | 0 (0.0%) | 0 (0.0%) |
| $2,500 to $2,999 | 0 (0.0%) | 0 (0.0%) |
| $3,000 or more | 0 (0.0%) | 0 (0.0%) |
| Total | 242 (100.0%) | 160 (100.0%) |
Physical Housing Characteristics in Mountain City
Housing Structures in Mountain City
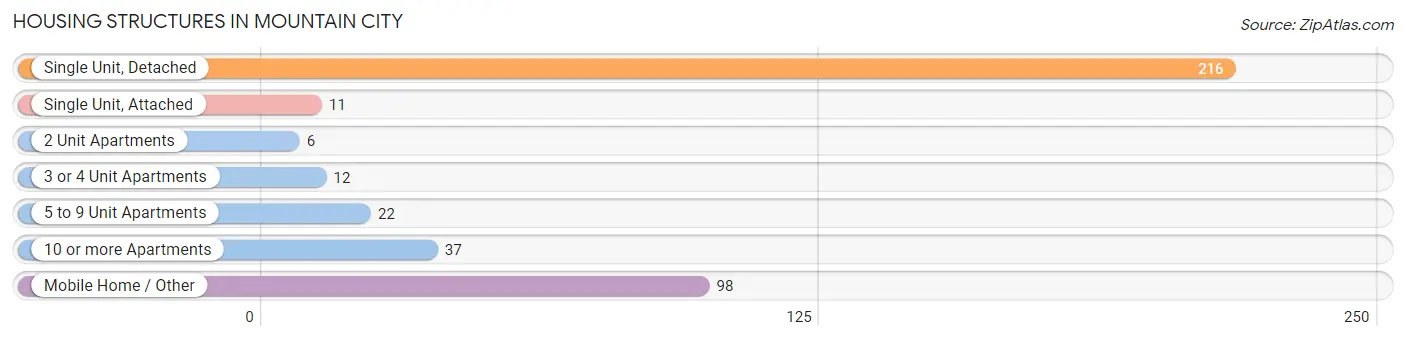
| Structure Type | # Housing Units | % Housing Units |
| Single Unit, Detached | 216 | 53.7% |
| Single Unit, Attached | 11 | 2.7% |
| 2 Unit Apartments | 6 | 1.5% |
| 3 or 4 Unit Apartments | 12 | 3.0% |
| 5 to 9 Unit Apartments | 22 | 5.5% |
| 10 or more Apartments | 37 | 9.2% |
| Mobile Home / Other | 98 | 24.4% |
| Total | 402 | 100.0% |
Housing Structures by Occupancy in Mountain City
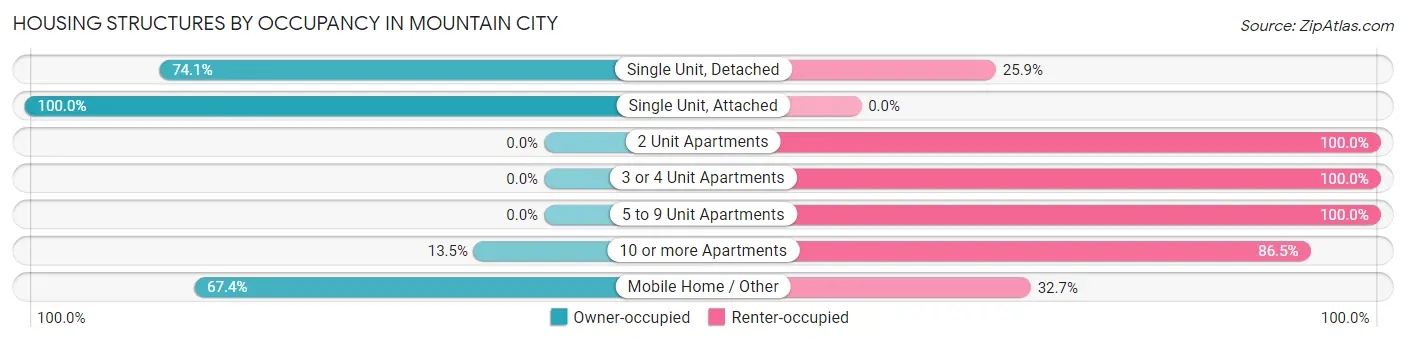
| Structure Type | Owner-occupied | Renter-occupied |
| Single Unit, Detached | 160 (74.1%) | 56 (25.9%) |
| Single Unit, Attached | 11 (100.0%) | 0 (0.0%) |
| 2 Unit Apartments | 0 (0.0%) | 6 (100.0%) |
| 3 or 4 Unit Apartments | 0 (0.0%) | 12 (100.0%) |
| 5 to 9 Unit Apartments | 0 (0.0%) | 22 (100.0%) |
| 10 or more Apartments | 5 (13.5%) | 32 (86.5%) |
| Mobile Home / Other | 66 (67.3%) | 32 (32.7%) |
| Total | 242 (60.2%) | 160 (39.8%) |
Housing Structures by Number of Rooms in Mountain City
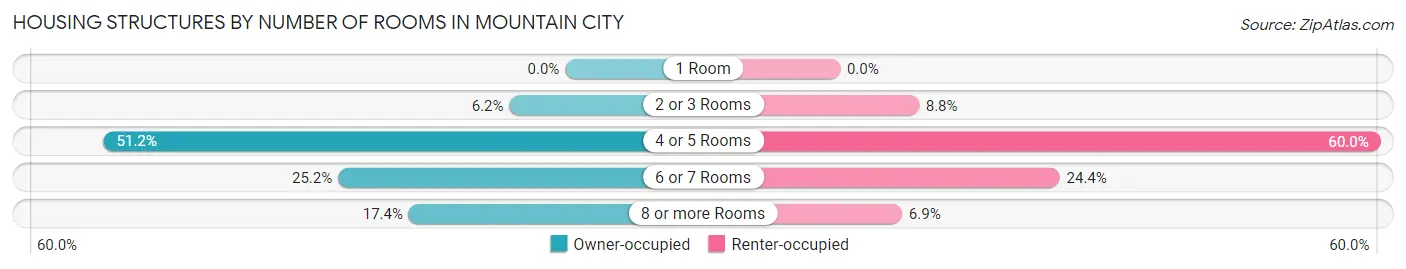
| Number of Rooms | Owner-occupied | Renter-occupied |
| 1 Room | 0 (0.0%) | 0 (0.0%) |
| 2 or 3 Rooms | 15 (6.2%) | 14 (8.7%) |
| 4 or 5 Rooms | 124 (51.2%) | 96 (60.0%) |
| 6 or 7 Rooms | 61 (25.2%) | 39 (24.4%) |
| 8 or more Rooms | 42 (17.4%) | 11 (6.9%) |
| Total | 242 (100.0%) | 160 (100.0%) |
Housing Structure by Heating Type in Mountain City
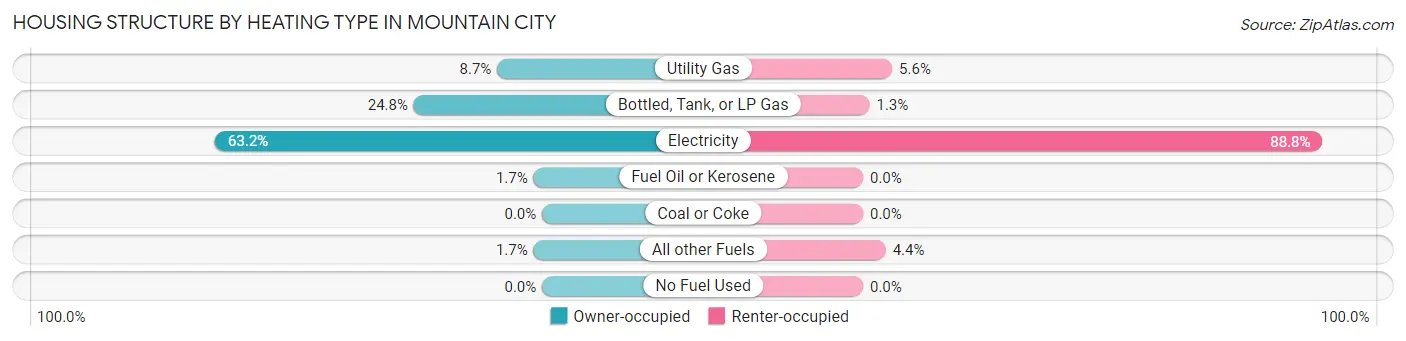
| Heating Type | Owner-occupied | Renter-occupied |
| Utility Gas | 21 (8.7%) | 9 (5.6%) |
| Bottled, Tank, or LP Gas | 60 (24.8%) | 2 (1.3%) |
| Electricity | 153 (63.2%) | 142 (88.7%) |
| Fuel Oil or Kerosene | 4 (1.7%) | 0 (0.0%) |
| Coal or Coke | 0 (0.0%) | 0 (0.0%) |
| All other Fuels | 4 (1.7%) | 7 (4.4%) |
| No Fuel Used | 0 (0.0%) | 0 (0.0%) |
| Total | 242 (100.0%) | 160 (100.0%) |
Household Vehicle Usage in Mountain City
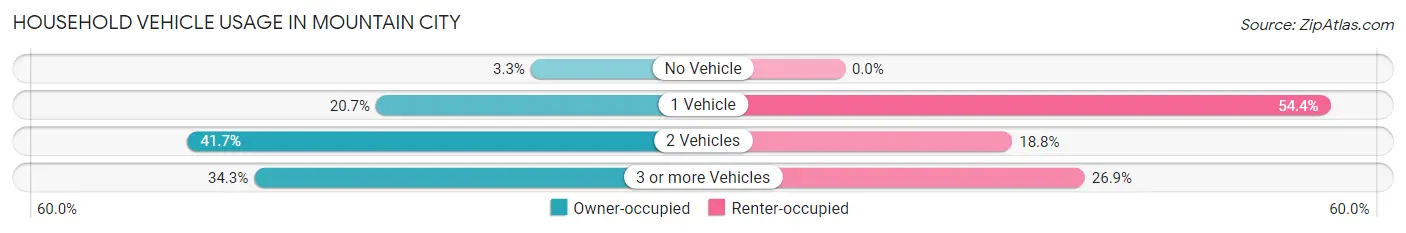
| Vehicles per Household | Owner-occupied | Renter-occupied |
| No Vehicle | 8 (3.3%) | 0 (0.0%) |
| 1 Vehicle | 50 (20.7%) | 87 (54.4%) |
| 2 Vehicles | 101 (41.7%) | 30 (18.8%) |
| 3 or more Vehicles | 83 (34.3%) | 43 (26.9%) |
| Total | 242 (100.0%) | 160 (100.0%) |
Real Estate & Mortgages in Mountain City
Real Estate and Mortgage Overview in Mountain City
| Characteristic | Without Mortgage | With Mortgage |
| Housing Units | 157 | 85 |
| Median Property Value | $106,500 | $196,300 |
| Median Household Income | $42,679 | $0 |
| Monthly Housing Costs | $399 | $0 |
| Real Estate Taxes | $600 | $9 |
Property Value by Mortgage Status in Mountain City
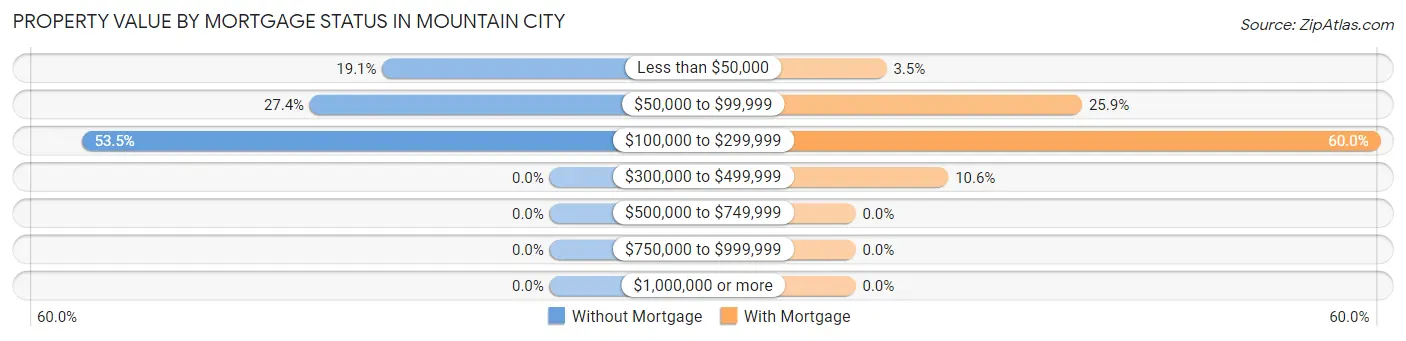
| Property Value | Without Mortgage | With Mortgage |
| Less than $50,000 | 30 (19.1%) | 3 (3.5%) |
| $50,000 to $99,999 | 43 (27.4%) | 22 (25.9%) |
| $100,000 to $299,999 | 84 (53.5%) | 51 (60.0%) |
| $300,000 to $499,999 | 0 (0.0%) | 9 (10.6%) |
| $500,000 to $749,999 | 0 (0.0%) | 0 (0.0%) |
| $750,000 to $999,999 | 0 (0.0%) | 0 (0.0%) |
| $1,000,000 or more | 0 (0.0%) | 0 (0.0%) |
| Total | 157 (100.0%) | 85 (100.0%) |
Household Income by Mortgage Status in Mountain City
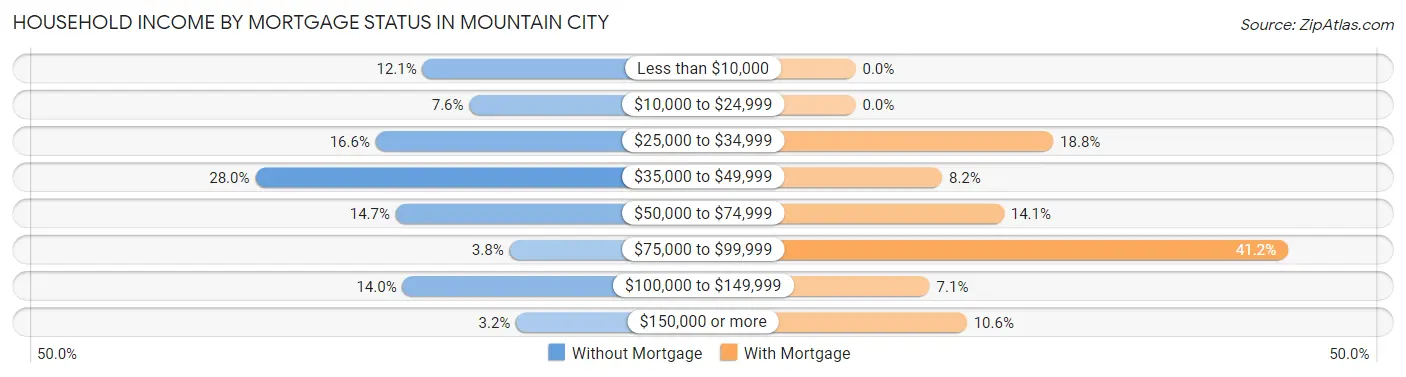
| Household Income | Without Mortgage | With Mortgage |
| Less than $10,000 | 19 (12.1%) | 0 (0.0%) |
| $10,000 to $24,999 | 12 (7.6%) | 0 (0.0%) |
| $25,000 to $34,999 | 26 (16.6%) | 16 (18.8%) |
| $35,000 to $49,999 | 44 (28.0%) | 7 (8.2%) |
| $50,000 to $74,999 | 23 (14.6%) | 12 (14.1%) |
| $75,000 to $99,999 | 6 (3.8%) | 35 (41.2%) |
| $100,000 to $149,999 | 22 (14.0%) | 6 (7.1%) |
| $150,000 or more | 5 (3.2%) | 9 (10.6%) |
| Total | 157 (100.0%) | 85 (100.0%) |
Property Value to Household Income Ratio in Mountain City
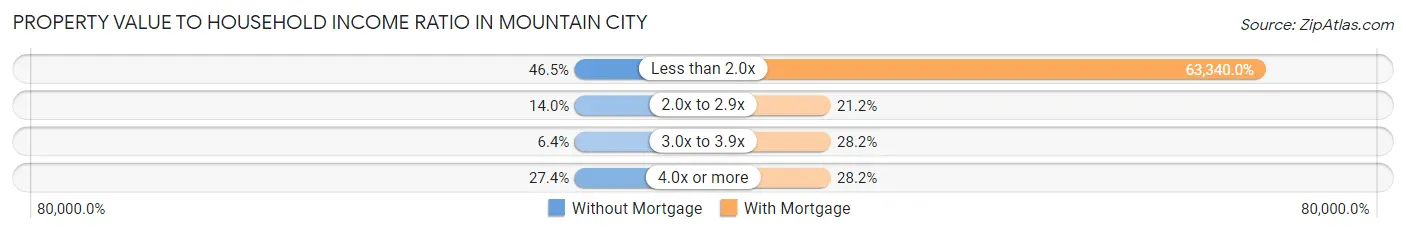
| Value-to-Income Ratio | Without Mortgage | With Mortgage |
| Less than 2.0x | 73 (46.5%) | 53,839 (63,340.0%) |
| 2.0x to 2.9x | 22 (14.0%) | 18 (21.2%) |
| 3.0x to 3.9x | 10 (6.4%) | 24 (28.2%) |
| 4.0x or more | 43 (27.4%) | 24 (28.2%) |
| Total | 157 (100.0%) | 85 (100.0%) |
Real Estate Taxes by Mortgage Status in Mountain City
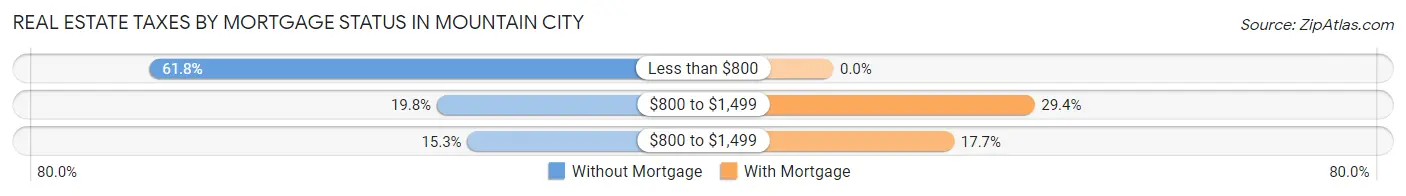
| Property Taxes | Without Mortgage | With Mortgage |
| Less than $800 | 97 (61.8%) | 0 (0.0%) |
| $800 to $1,499 | 31 (19.8%) | 25 (29.4%) |
| $800 to $1,499 | 24 (15.3%) | 15 (17.6%) |
| Total | 157 (100.0%) | 85 (100.0%) |
Health & Disability in Mountain City
Health Insurance Coverage by Age in Mountain City
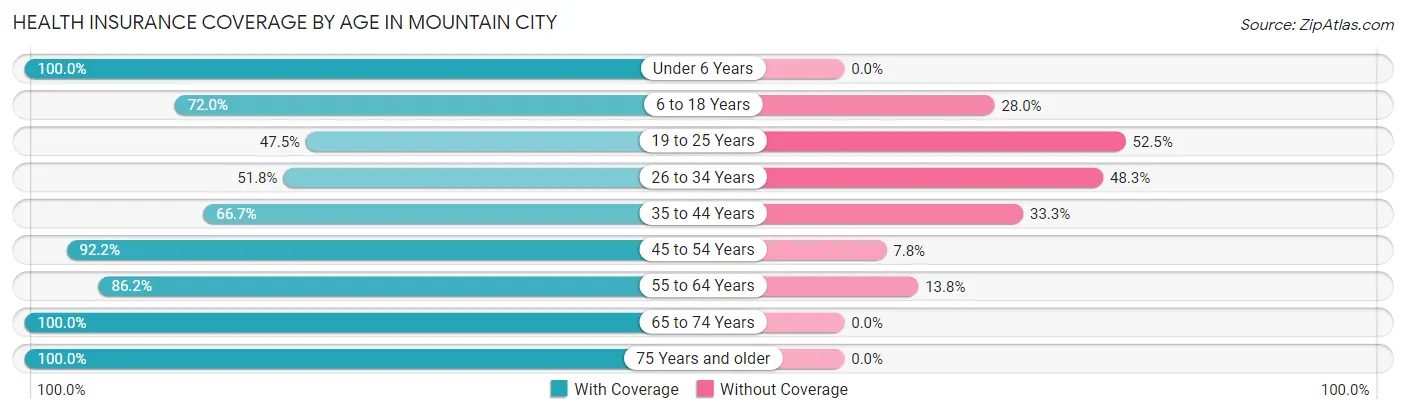
| Age Bracket | With Coverage | Without Coverage |
| Under 6 Years | 40 (100.0%) | 0 (0.0%) |
| 6 to 18 Years | 90 (72.0%) | 35 (28.0%) |
| 19 to 25 Years | 29 (47.5%) | 32 (52.5%) |
| 26 to 34 Years | 74 (51.7%) | 69 (48.2%) |
| 35 to 44 Years | 76 (66.7%) | 38 (33.3%) |
| 45 to 54 Years | 141 (92.2%) | 12 (7.8%) |
| 55 to 64 Years | 75 (86.2%) | 12 (13.8%) |
| 65 to 74 Years | 145 (100.0%) | 0 (0.0%) |
| 75 Years and older | 121 (100.0%) | 0 (0.0%) |
| Total | 791 (80.0%) | 198 (20.0%) |
Health Insurance Coverage by Citizenship Status in Mountain City
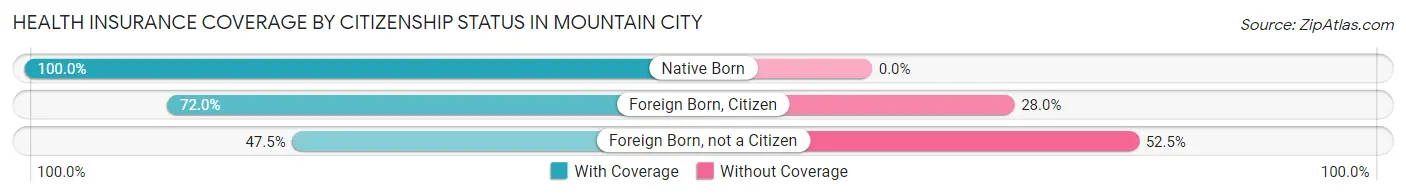
| Citizenship Status | With Coverage | Without Coverage |
| Native Born | 40 (100.0%) | 0 (0.0%) |
| Foreign Born, Citizen | 90 (72.0%) | 35 (28.0%) |
| Foreign Born, not a Citizen | 29 (47.5%) | 32 (52.5%) |
Health Insurance Coverage by Household Income in Mountain City
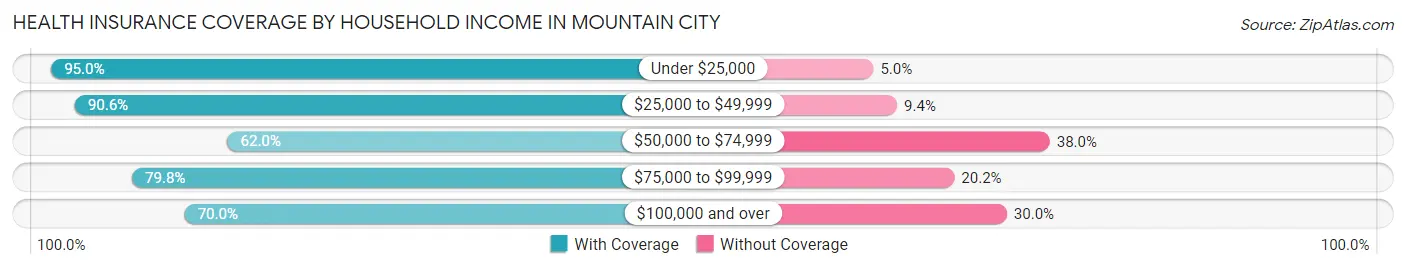
| Household Income | With Coverage | Without Coverage |
| Under $25,000 | 171 (95.0%) | 9 (5.0%) |
| $25,000 to $49,999 | 192 (90.6%) | 20 (9.4%) |
| $50,000 to $74,999 | 114 (62.0%) | 70 (38.0%) |
| $75,000 to $99,999 | 202 (79.8%) | 51 (20.2%) |
| $100,000 and over | 112 (70.0%) | 48 (30.0%) |
Public vs Private Health Insurance Coverage by Age in Mountain City
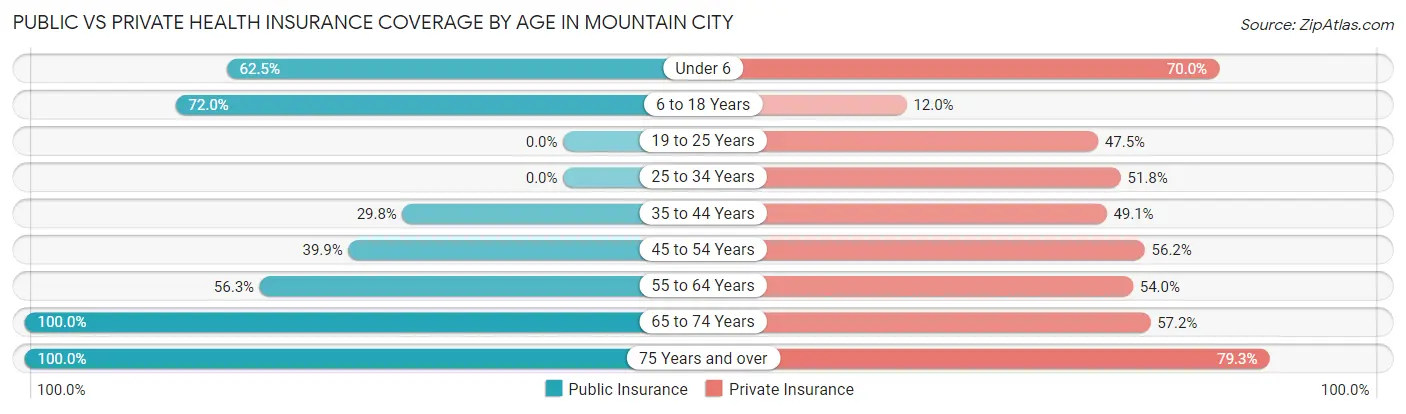
| Age Bracket | Public Insurance | Private Insurance |
| Under 6 | 25 (62.5%) | 28 (70.0%) |
| 6 to 18 Years | 90 (72.0%) | 15 (12.0%) |
| 19 to 25 Years | 0 (0.0%) | 29 (47.5%) |
| 25 to 34 Years | 0 (0.0%) | 74 (51.7%) |
| 35 to 44 Years | 34 (29.8%) | 56 (49.1%) |
| 45 to 54 Years | 61 (39.9%) | 86 (56.2%) |
| 55 to 64 Years | 49 (56.3%) | 47 (54.0%) |
| 65 to 74 Years | 145 (100.0%) | 83 (57.2%) |
| 75 Years and over | 121 (100.0%) | 96 (79.3%) |
| Total | 525 (53.1%) | 514 (52.0%) |
Disability Status by Sex by Age in Mountain City
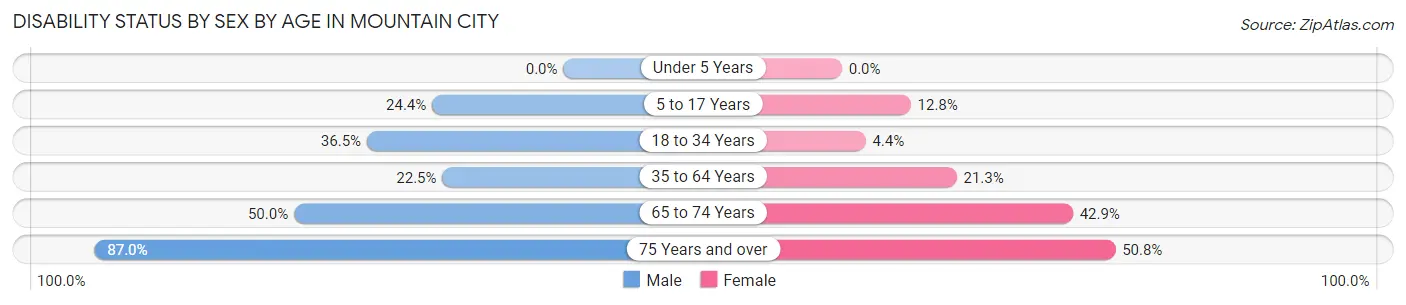
| Age Bracket | Male | Female |
| Under 5 Years | 0 (0.0%) | 0 (0.0%) |
| 5 to 17 Years | 19 (24.4%) | 6 (12.8%) |
| 18 to 34 Years | 35 (36.5%) | 5 (4.4%) |
| 35 to 64 Years | 31 (22.5%) | 46 (21.3%) |
| 65 to 74 Years | 27 (50.0%) | 39 (42.9%) |
| 75 Years and over | 47 (87.0%) | 34 (50.7%) |
Disability Class by Sex by Age in Mountain City
Disability Class: Hearing Difficulty
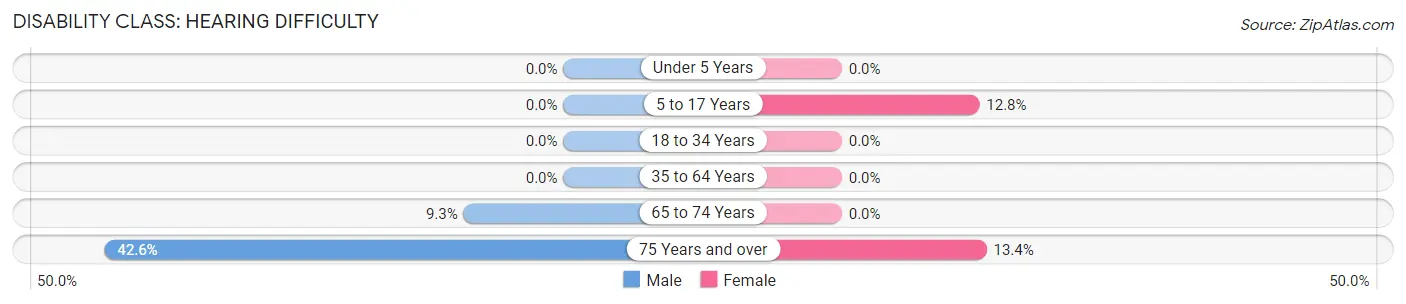
| Age Bracket | Male | Female |
| Under 5 Years | 0 (0.0%) | 0 (0.0%) |
| 5 to 17 Years | 0 (0.0%) | 6 (12.8%) |
| 18 to 34 Years | 0 (0.0%) | 0 (0.0%) |
| 35 to 64 Years | 0 (0.0%) | 0 (0.0%) |
| 65 to 74 Years | 5 (9.3%) | 0 (0.0%) |
| 75 Years and over | 23 (42.6%) | 9 (13.4%) |
Disability Class: Vision Difficulty
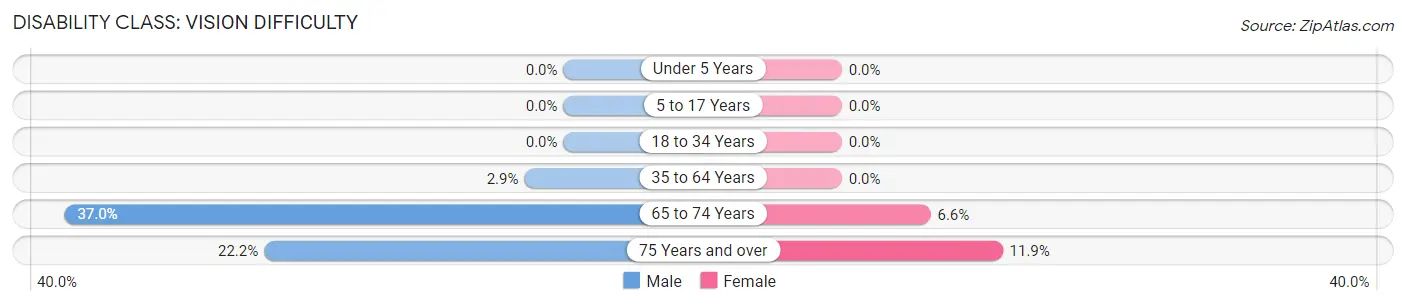
| Age Bracket | Male | Female |
| Under 5 Years | 0 (0.0%) | 0 (0.0%) |
| 5 to 17 Years | 0 (0.0%) | 0 (0.0%) |
| 18 to 34 Years | 0 (0.0%) | 0 (0.0%) |
| 35 to 64 Years | 4 (2.9%) | 0 (0.0%) |
| 65 to 74 Years | 20 (37.0%) | 6 (6.6%) |
| 75 Years and over | 12 (22.2%) | 8 (11.9%) |
Disability Class: Cognitive Difficulty
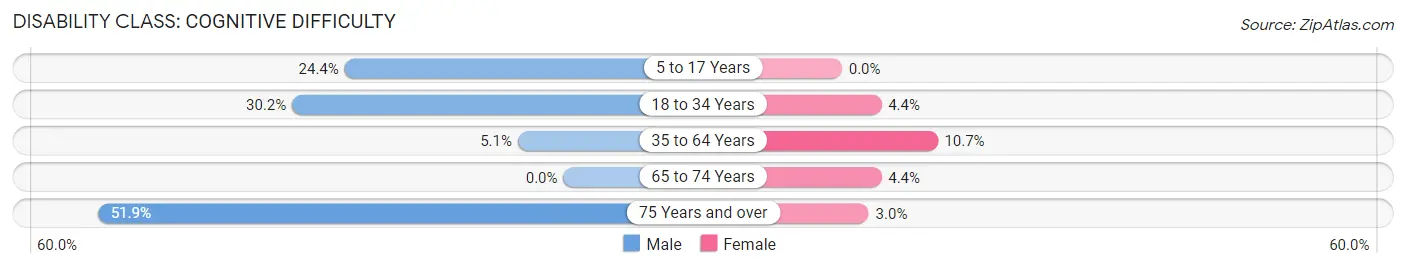
| Age Bracket | Male | Female |
| 5 to 17 Years | 19 (24.4%) | 0 (0.0%) |
| 18 to 34 Years | 29 (30.2%) | 5 (4.4%) |
| 35 to 64 Years | 7 (5.1%) | 23 (10.6%) |
| 65 to 74 Years | 0 (0.0%) | 4 (4.4%) |
| 75 Years and over | 28 (51.8%) | 2 (3.0%) |
Disability Class: Ambulatory Difficulty
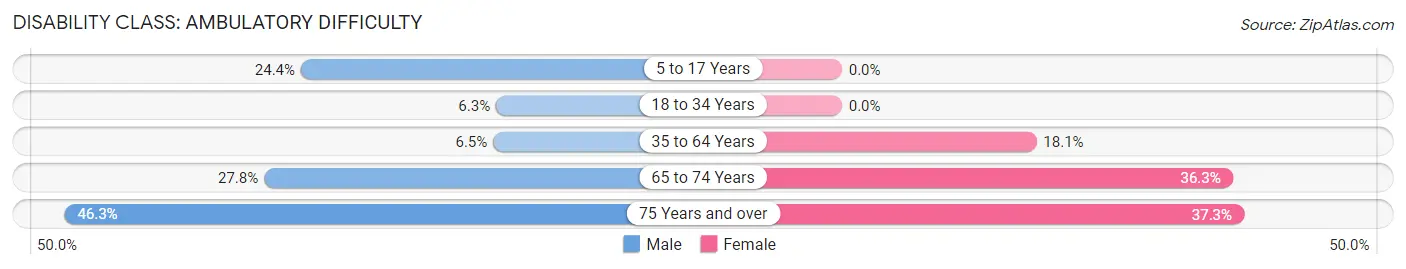
| Age Bracket | Male | Female |
| 5 to 17 Years | 19 (24.4%) | 0 (0.0%) |
| 18 to 34 Years | 6 (6.2%) | 0 (0.0%) |
| 35 to 64 Years | 9 (6.5%) | 39 (18.1%) |
| 65 to 74 Years | 15 (27.8%) | 33 (36.3%) |
| 75 Years and over | 25 (46.3%) | 25 (37.3%) |
Disability Class: Self-Care Difficulty
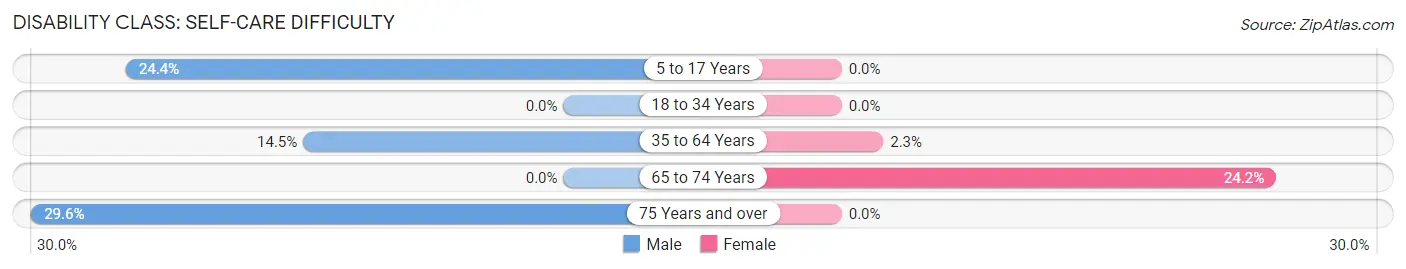
| Age Bracket | Male | Female |
| 5 to 17 Years | 19 (24.4%) | 0 (0.0%) |
| 18 to 34 Years | 0 (0.0%) | 0 (0.0%) |
| 35 to 64 Years | 20 (14.5%) | 5 (2.3%) |
| 65 to 74 Years | 0 (0.0%) | 22 (24.2%) |
| 75 Years and over | 16 (29.6%) | 0 (0.0%) |
Technology Access in Mountain City
Computing Device Access in Mountain City
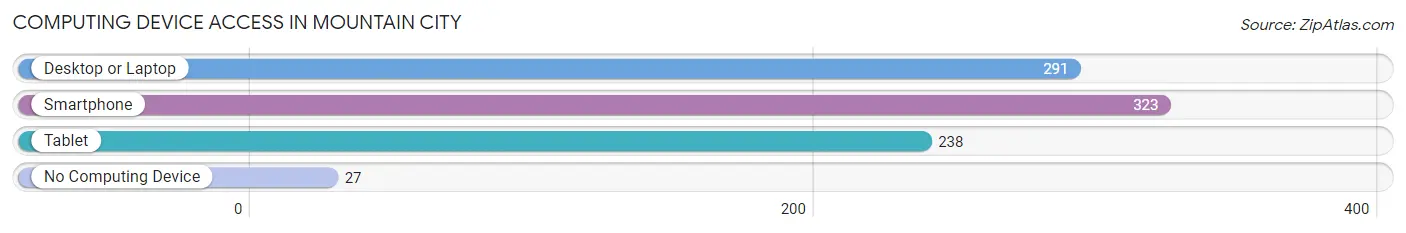
| Device Type | # Households | % Households |
| Desktop or Laptop | 291 | 72.4% |
| Smartphone | 323 | 80.3% |
| Tablet | 238 | 59.2% |
| No Computing Device | 27 | 6.7% |
| Total | 402 | 100.0% |
Internet Access in Mountain City
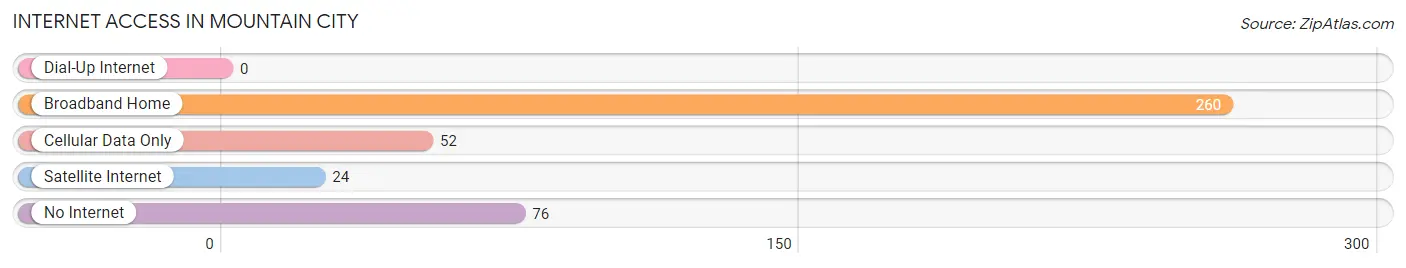
| Internet Type | # Households | % Households |
| Dial-Up Internet | 0 | 0.0% |
| Broadband Home | 260 | 64.7% |
| Cellular Data Only | 52 | 12.9% |
| Satellite Internet | 24 | 6.0% |
| No Internet | 76 | 18.9% |
| Total | 402 | 100.0% |
Mountain City Summary
Mountain City is a small town located in Rabun County, Georgia, United States. It is situated in the foothills of the Blue Ridge Mountains, and is the county seat of Rabun County. The town has a population of approximately 1,000 people, and is known for its rural charm and scenic beauty.
History
Mountain City was founded in 1819 by a group of settlers from North Carolina. The town was originally known as “Mountainville”, but the name was changed to “Mountain City” in 1820. The town was incorporated in 1821, and the first post office was established in 1822.
The town was an important stop on the stagecoach route between Athens and Asheville, North Carolina. The stagecoach route was used by many travelers, including President Andrew Jackson, who visited the town in 1825.
In the late 19th century, Mountain City became a popular tourist destination, due to its proximity to the Blue Ridge Mountains. The town was also known for its mineral springs, which were believed to have healing properties.
Geography
Mountain City is located in the foothills of the Blue Ridge Mountains, at an elevation of 1,890 feet (576 m). The town is situated on the banks of the Tallulah River, and is surrounded by the Chattahoochee National Forest.
The town is located approximately 30 miles (48 km) north of Athens, Georgia, and approximately 60 miles (97 km) south of Asheville, North Carolina.
Economy
Mountain City’s economy is largely based on tourism and agriculture. The town is home to several small businesses, including restaurants, antique stores, and art galleries.
The town is also home to several wineries, which produce a variety of wines from local grapes. The town is also home to several farms, which produce a variety of fruits and vegetables.
Demographics
As of the 2010 census, the population of Mountain City was 1,000 people. The racial makeup of the town was 95.2% White, 0.7% African American, 0.2% Native American, 0.2% Asian, 0.1% Pacific Islander, and 3.7% from other races.
The median household income in Mountain City was $30,000, and the median family income was $35,000. The per capita income in the town was $17,000.
Conclusion
Mountain City is a small town located in Rabun County, Georgia, United States. It is situated in the foothills of the Blue Ridge Mountains, and is the county seat of Rabun County. The town has a population of approximately 1,000 people, and is known for its rural charm and scenic beauty. The town’s economy is largely based on tourism and agriculture, and the town is home to several small businesses, wineries, and farms. The racial makeup of the town is predominantly White, with a small percentage of African American, Native American, Asian, and Pacific Islander residents. The median household income in Mountain City is $30,000, and the median family income is $35,000.
Common Questions
What is Per Capita Income in Mountain City?
Per Capita income in Mountain City is $23,619.
What is the Median Family Income in Mountain City?
Median Family Income in Mountain City is $59,444.
What is the Median Household income in Mountain City?
Median Household Income in Mountain City is $43,269.
What is Income or Wage Gap in Mountain City?
Income or Wage Gap in Mountain City is 13.5%.
Women in Mountain City earn 86.5 cents for every dollar earned by a man.
What is Inequality or Gini Index in Mountain City?
Inequality or Gini Index in Mountain City is 0.42.
What is the Total Population of Mountain City?
Total Population of Mountain City is 991.
What is the Total Male Population of Mountain City?
Total Male Population of Mountain City is 422.
What is the Total Female Population of Mountain City?
Total Female Population of Mountain City is 569.
What is the Ratio of Males per 100 Females in Mountain City?
There are 74.17 Males per 100 Females in Mountain City.
What is the Ratio of Females per 100 Males in Mountain City?
There are 134.83 Females per 100 Males in Mountain City.
What is the Median Population Age in Mountain City?
Median Population Age in Mountain City is 45.3 Years.
What is the Average Family Size in Mountain City
Average Family Size in Mountain City is 3.3 People.
What is the Average Household Size in Mountain City
Average Household Size in Mountain City is 2.5 People.
How Large is the Labor Force in Mountain City?
There are 403 People in the Labor Forcein in Mountain City.
What is the Percentage of People in the Labor Force in Mountain City?
47.9% of People are in the Labor Force in Mountain City.