Monticello, GA Map & Demographics
Monticello Map
Monticello Overview
$32,681
PER CAPITA INCOME
$52,695
AVG FAMILY INCOME
$41,779
AVG HOUSEHOLD INCOME
18.2%
WAGE / INCOME GAP [ % ]
81.8¢/ $1
WAGE / INCOME GAP [ $ ]
0.59
INEQUALITY / GINI INDEX
2,593
TOTAL POPULATION
1,136
MALE POPULATION
1,457
FEMALE POPULATION
77.97
MALES / 100 FEMALES
128.26
FEMALES / 100 MALES
43.8
MEDIAN AGE
3.0
AVG FAMILY SIZE
2.4
AVG HOUSEHOLD SIZE
1,231
LABOR FORCE [ PEOPLE ]
56.9%
PERCENT IN LABOR FORCE
5.8%
UNEMPLOYMENT RATE
Monticello Zip Codes
Income in Monticello
Income Overview in Monticello
Per Capita Income in Monticello is $32,681, while median incomes of families and households are $52,695 and $41,779 respectively.
| Characteristic | Number | Measure |
| Per Capita Income | 2,593 | $32,681 |
| Median Family Income | 681 | $52,695 |
| Mean Family Income | 681 | $106,219 |
| Median Household Income | 1,041 | $41,779 |
| Mean Household Income | 1,041 | $79,732 |
| Income Deficit | 681 | $0 |
| Wage / Income Gap (%) | 2,593 | 18.16% |
| Wage / Income Gap ($) | 2,593 | 81.84¢ per $1 |
| Gini / Inequality Index | 2,593 | 0.59 |
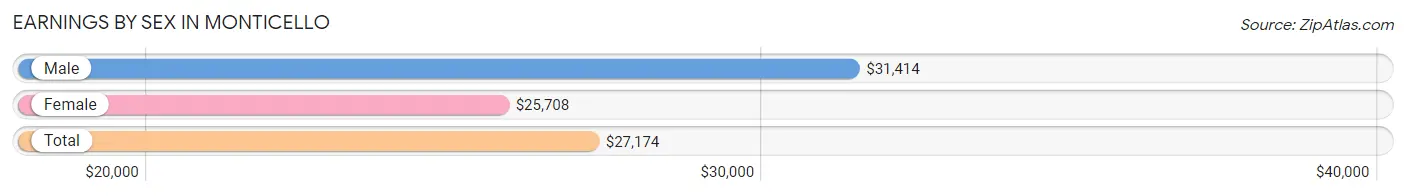
Earnings by Sex in Monticello
Average Earnings in Monticello are $27,174, $31,414 for men and $25,708 for women, a difference of 18.2%.
| Sex | Number | Average Earnings |
| Male | 547 (42.5%) | $31,414 |
| Female | 740 (57.5%) | $25,708 |
| Total | 1,287 (100.0%) | $27,174 |
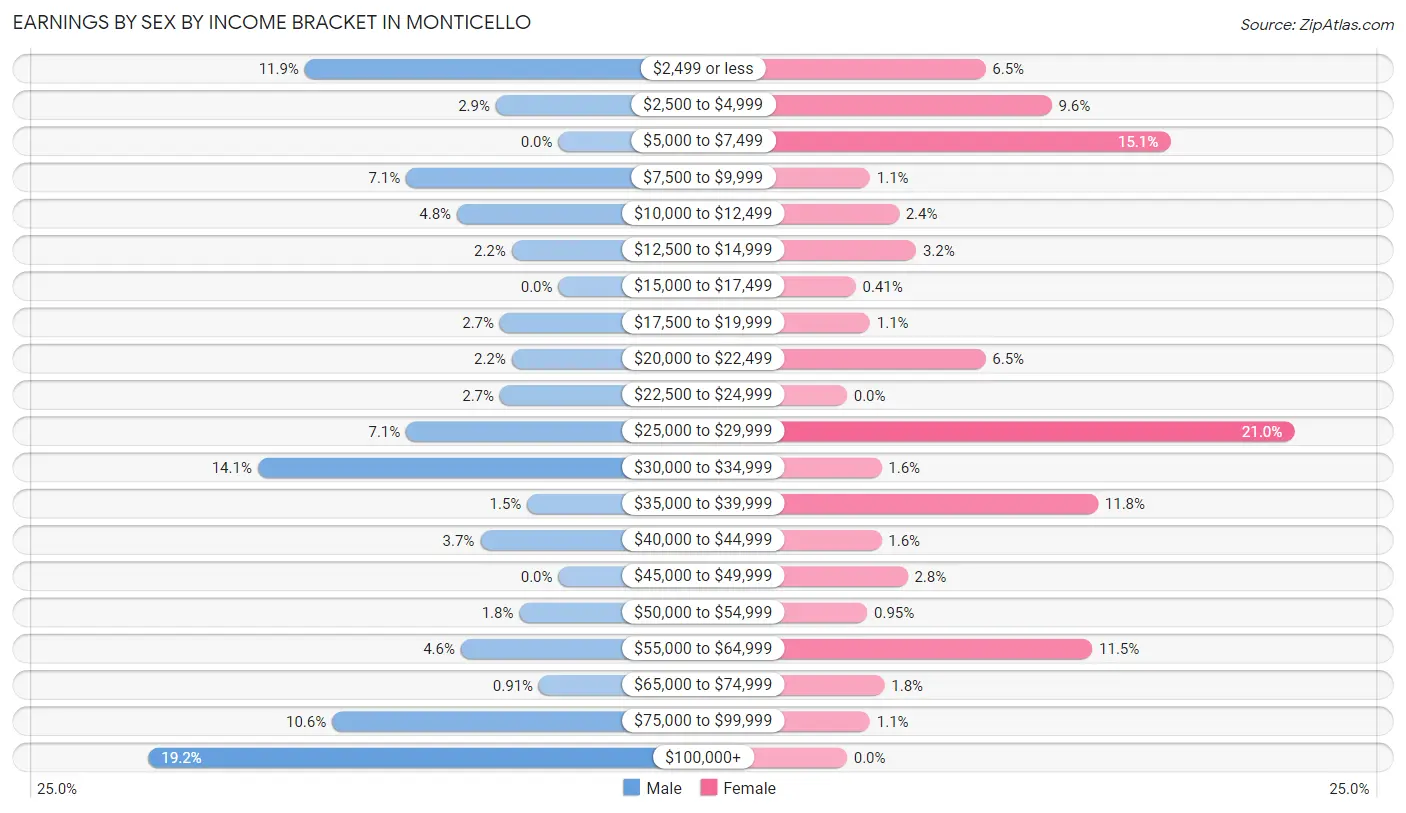
Earnings by Sex by Income Bracket in Monticello
The most common earnings brackets in Monticello are $100,000+ for men (105 | 19.2%) and $25,000 to $29,999 for women (155 | 20.9%).
| Income | Male | Female |
| $2,499 or less | 65 (11.9%) | 48 (6.5%) |
| $2,500 to $4,999 | 16 (2.9%) | 71 (9.6%) |
| $5,000 to $7,499 | 0 (0.0%) | 112 (15.1%) |
| $7,500 to $9,999 | 39 (7.1%) | 8 (1.1%) |
| $10,000 to $12,499 | 26 (4.8%) | 18 (2.4%) |
| $12,500 to $14,999 | 12 (2.2%) | 24 (3.2%) |
| $15,000 to $17,499 | 0 (0.0%) | 3 (0.4%) |
| $17,500 to $19,999 | 15 (2.7%) | 8 (1.1%) |
| $20,000 to $22,499 | 12 (2.2%) | 48 (6.5%) |
| $22,500 to $24,999 | 15 (2.7%) | 0 (0.0%) |
| $25,000 to $29,999 | 39 (7.1%) | 155 (20.9%) |
| $30,000 to $34,999 | 77 (14.1%) | 12 (1.6%) |
| $35,000 to $39,999 | 8 (1.5%) | 87 (11.8%) |
| $40,000 to $44,999 | 20 (3.7%) | 12 (1.6%) |
| $45,000 to $49,999 | 0 (0.0%) | 21 (2.8%) |
| $50,000 to $54,999 | 10 (1.8%) | 7 (0.9%) |
| $55,000 to $64,999 | 25 (4.6%) | 85 (11.5%) |
| $65,000 to $74,999 | 5 (0.9%) | 13 (1.8%) |
| $75,000 to $99,999 | 58 (10.6%) | 8 (1.1%) |
| $100,000+ | 105 (19.2%) | 0 (0.0%) |
| Total | 547 (100.0%) | 740 (100.0%) |
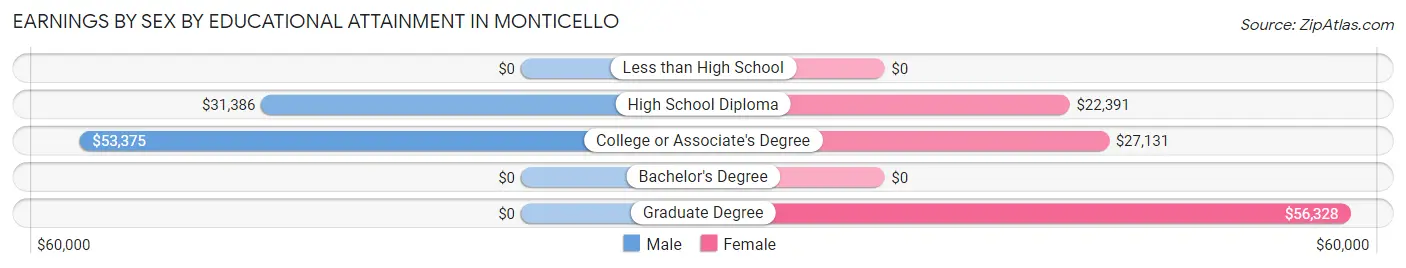
Earnings by Sex by Educational Attainment in Monticello
Average earnings in Monticello are $53,500 for men and $26,980 for women, a difference of 49.6%. Men with an educational attainment of college or associate's degree enjoy the highest average annual earnings of $53,375, while those with high school diploma education earn the least with $31,386. Women with an educational attainment of graduate degree earn the most with the average annual earnings of $56,328, while those with high school diploma education have the smallest earnings of $22,391.
| Educational Attainment | Male Income | Female Income |
| Less than High School | - | - |
| High School Diploma | $31,386 | $22,391 |
| College or Associate's Degree | $53,375 | $27,131 |
| Bachelor's Degree | - | - |
| Graduate Degree | - | - |
| Total | $53,500 | $26,980 |
Family Income in Monticello
Family Income Brackets in Monticello
According to the Monticello family income data, there are 154 families falling into the $35,000 to $49,999 income range, which is the most common income bracket and makes up 22.6% of all families. Conversely, the $150,000 to $199,999 income bracket is the least frequent group with only 5 families (0.7%) belonging to this category.
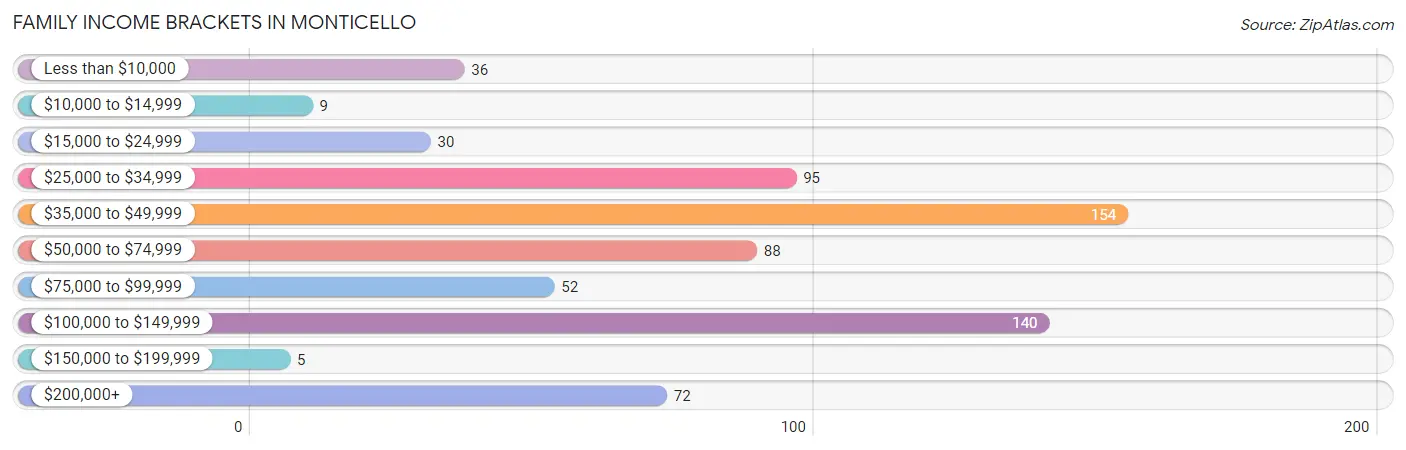
| Income Bracket | # Families | % Families |
| Less than $10,000 | 36 | 5.3% |
| $10,000 to $14,999 | 9 | 1.3% |
| $15,000 to $24,999 | 30 | 4.4% |
| $25,000 to $34,999 | 95 | 14.0% |
| $35,000 to $49,999 | 154 | 22.6% |
| $50,000 to $74,999 | 88 | 12.9% |
| $75,000 to $99,999 | 52 | 7.6% |
| $100,000 to $149,999 | 140 | 20.6% |
| $150,000 to $199,999 | 5 | 0.7% |
| $200,000+ | 72 | 10.6% |
Family Income by Famaliy Size in Monticello
2-person families (360 | 52.9%) account for the highest median family income in Monticello with $48,581 per family, while 2-person families (360 | 52.9%) have the highest median income of $24,290 per family member.
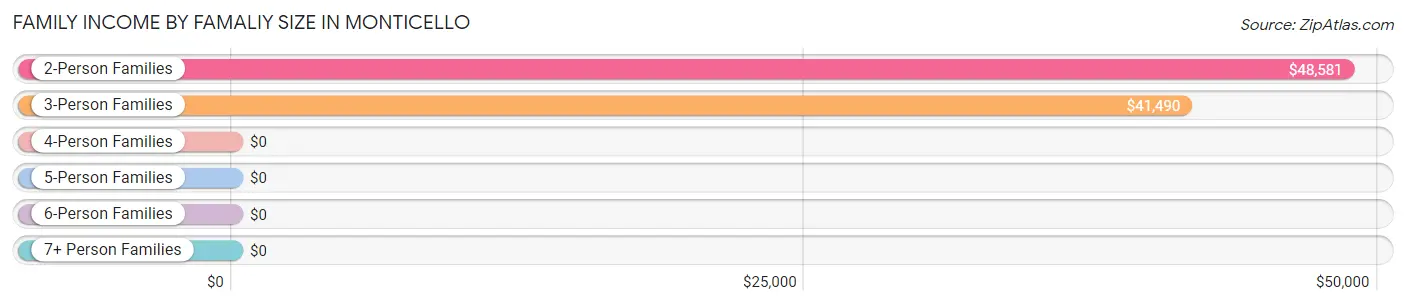
| Income Bracket | # Families | Median Income |
| 2-Person Families | 360 (52.9%) | $48,581 |
| 3-Person Families | 79 (11.6%) | $41,490 |
| 4-Person Families | 146 (21.4%) | $0 |
| 5-Person Families | 77 (11.3%) | $0 |
| 6-Person Families | 19 (2.8%) | $0 |
| 7+ Person Families | 0 (0.0%) | $0 |
| Total | 681 (100.0%) | $52,695 |
Family Income by Number of Earners in Monticello
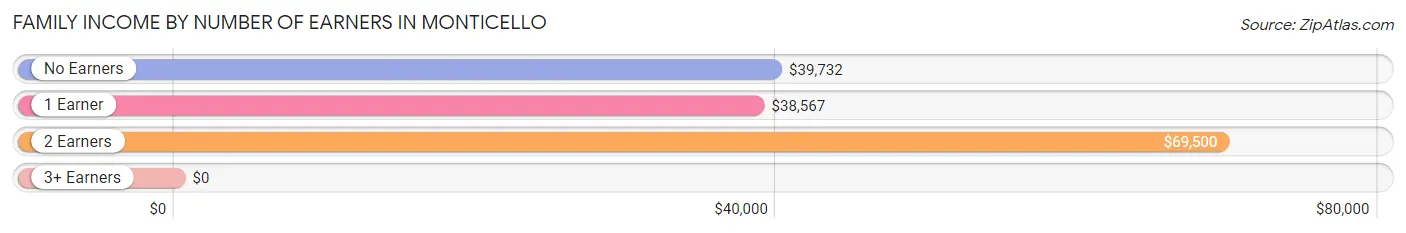
| Number of Earners | # Families | Median Income |
| No Earners | 99 (14.5%) | $39,732 |
| 1 Earner | 273 (40.1%) | $38,567 |
| 2 Earners | 184 (27.0%) | $69,500 |
| 3+ Earners | 125 (18.4%) | $0 |
| Total | 681 (100.0%) | $52,695 |
Household Income in Monticello
Household Income Brackets in Monticello
With 161 households falling in the category, the $35,000 to $49,999 income range is the most frequent in Monticello, accounting for 15.5% of all households. In contrast, only 11 households (1.1%) fall into the $150,000 to $199,999 income bracket, making it the least populous group.
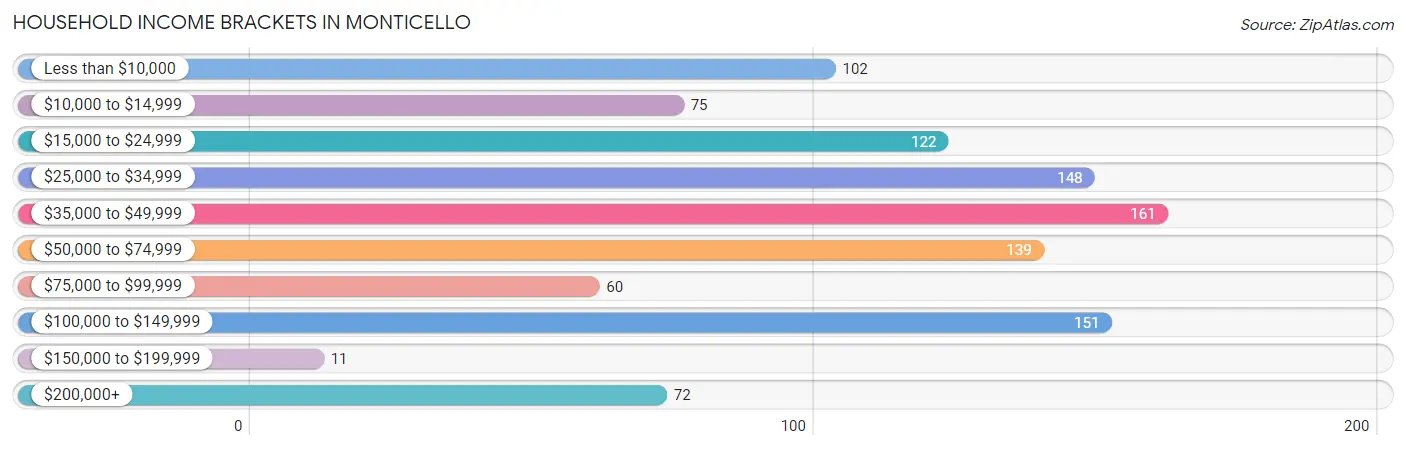
| Income Bracket | # Households | % Households |
| Less than $10,000 | 102 | 9.8% |
| $10,000 to $14,999 | 75 | 7.2% |
| $15,000 to $24,999 | 122 | 11.7% |
| $25,000 to $34,999 | 148 | 14.2% |
| $35,000 to $49,999 | 161 | 15.5% |
| $50,000 to $74,999 | 139 | 13.4% |
| $75,000 to $99,999 | 60 | 5.8% |
| $100,000 to $149,999 | 151 | 14.5% |
| $150,000 to $199,999 | 11 | 1.1% |
| $200,000+ | 72 | 6.9% |
Household Income by Householder Age in Monticello
The median household income in Monticello is $41,779, with the highest median household income of $51,518 found in the 45 to 64 years age bracket for the primary householder. A total of 441 households (42.4%) fall into this category. Meanwhile, the 15 to 24 years age bracket for the primary householder has the lowest median household income of $0, with 41 households (3.9%) in this group.
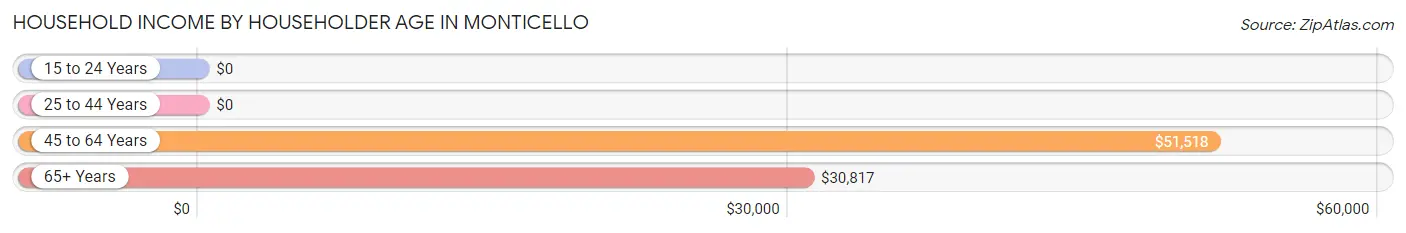
| Income Bracket | # Households | Median Income |
| 15 to 24 Years | 41 (3.9%) | $0 |
| 25 to 44 Years | 308 (29.6%) | $0 |
| 45 to 64 Years | 441 (42.4%) | $51,518 |
| 65+ Years | 251 (24.1%) | $30,817 |
| Total | 1,041 (100.0%) | $41,779 |
Poverty in Monticello
Income Below Poverty by Sex and Age in Monticello
With 22.3% poverty level for males and 13.4% for females among the residents of Monticello, under 5 year old males and 6 to 11 year old females are the most vulnerable to poverty, with 50 males (100.0%) and 24 females (40.7%) in their respective age groups living below the poverty level.
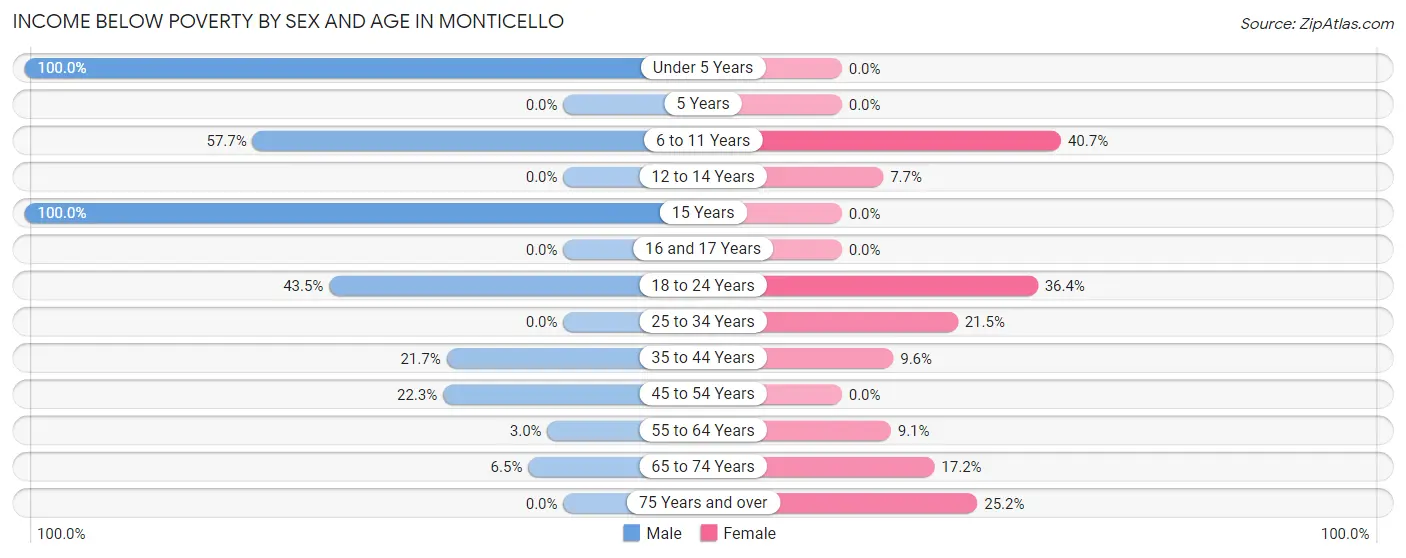
| Age Bracket | Male | Female |
| Under 5 Years | 50 (100.0%) | 0 (0.0%) |
| 5 Years | 0 (0.0%) | 0 (0.0%) |
| 6 to 11 Years | 30 (57.7%) | 24 (40.7%) |
| 12 to 14 Years | 0 (0.0%) | 4 (7.7%) |
| 15 Years | 10 (100.0%) | 0 (0.0%) |
| 16 and 17 Years | 0 (0.0%) | 0 (0.0%) |
| 18 to 24 Years | 83 (43.5%) | 32 (36.4%) |
| 25 to 34 Years | 0 (0.0%) | 17 (21.5%) |
| 35 to 44 Years | 18 (21.7%) | 24 (9.6%) |
| 45 to 54 Years | 46 (22.3%) | 0 (0.0%) |
| 55 to 64 Years | 4 (3.0%) | 22 (9.1%) |
| 65 to 74 Years | 6 (6.5%) | 22 (17.2%) |
| 75 Years and over | 0 (0.0%) | 41 (25.2%) |
| Total | 247 (22.3%) | 186 (13.4%) |
Income Above Poverty by Sex and Age in Monticello
According to the poverty statistics in Monticello, males aged 12 to 14 years and females aged under 5 years are the age groups that are most secure financially, with 100.0% of males and 100.0% of females in these age groups living above the poverty line.
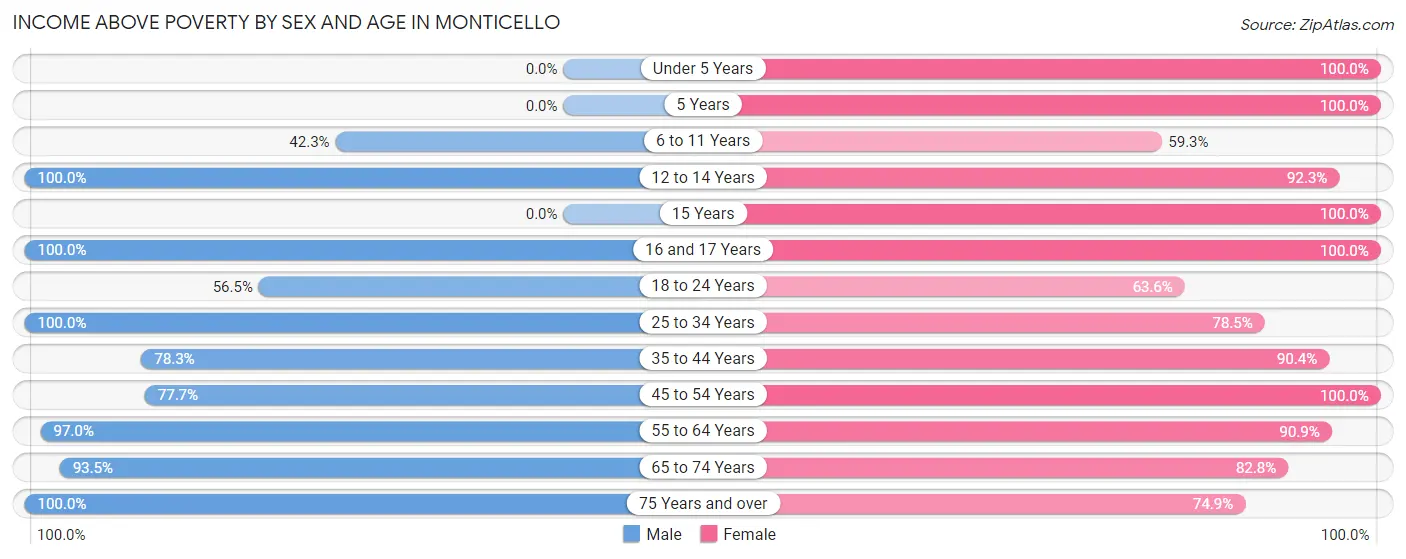
| Age Bracket | Male | Female |
| Under 5 Years | 0 (0.0%) | 28 (100.0%) |
| 5 Years | 0 (0.0%) | 30 (100.0%) |
| 6 to 11 Years | 22 (42.3%) | 35 (59.3%) |
| 12 to 14 Years | 105 (100.0%) | 48 (92.3%) |
| 15 Years | 0 (0.0%) | 7 (100.0%) |
| 16 and 17 Years | 33 (100.0%) | 99 (100.0%) |
| 18 to 24 Years | 108 (56.5%) | 56 (63.6%) |
| 25 to 34 Years | 130 (100.0%) | 62 (78.5%) |
| 35 to 44 Years | 65 (78.3%) | 227 (90.4%) |
| 45 to 54 Years | 160 (77.7%) | 166 (100.0%) |
| 55 to 64 Years | 131 (97.0%) | 220 (90.9%) |
| 65 to 74 Years | 86 (93.5%) | 106 (82.8%) |
| 75 Years and over | 21 (100.0%) | 122 (74.9%) |
| Total | 861 (77.7%) | 1,206 (86.6%) |
Income Below Poverty Among Married-Couple Families in Monticello
The poverty statistics for married-couple families in Monticello show that 1.1% or 4 of the total 377 families live below the poverty line. Families with 1 or 2 children have the highest poverty rate of 3.2%, comprising of 4 families. On the other hand, families with no children have the lowest poverty rate of 0.0%, which includes 0 families.
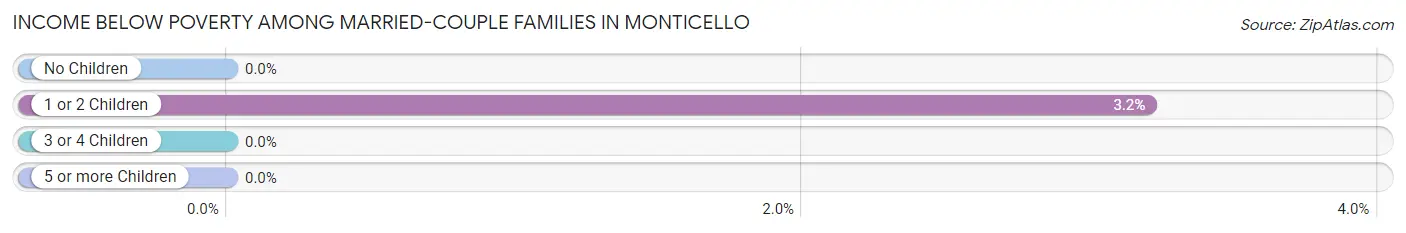
| Children | Above Poverty | Below Poverty |
| No Children | 235 (100.0%) | 0 (0.0%) |
| 1 or 2 Children | 121 (96.8%) | 4 (3.2%) |
| 3 or 4 Children | 17 (100.0%) | 0 (0.0%) |
| 5 or more Children | 0 (0.0%) | 0 (0.0%) |
| Total | 373 (98.9%) | 4 (1.1%) |
Income Below Poverty Among Single-Parent Households in Monticello
According to the poverty data in Monticello, 58.3% or 28 single-father households and 11.3% or 29 single-mother households are living below the poverty line. Among single-father households, those with 1 or 2 children have the highest poverty rate, with 28 households (100.0%) experiencing poverty. Likewise, among single-mother households, those with 3 or 4 children have the highest poverty rate, with 21 households (41.2%) falling below the poverty line.
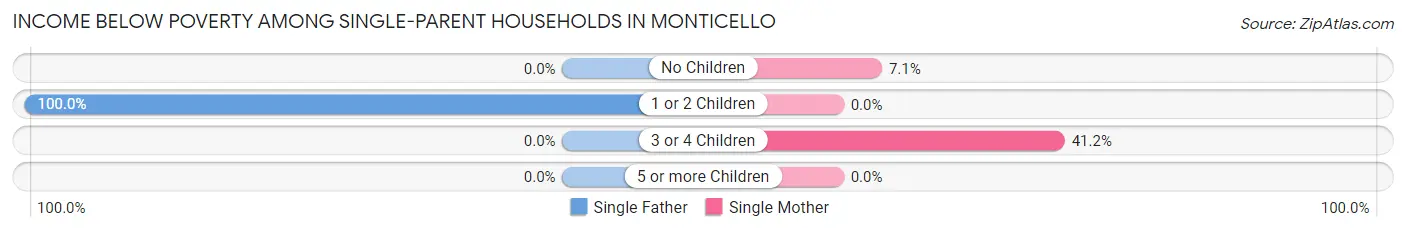
| Children | Single Father | Single Mother |
| No Children | 0 (0.0%) | 8 (7.1%) |
| 1 or 2 Children | 28 (100.0%) | 0 (0.0%) |
| 3 or 4 Children | 0 (0.0%) | 21 (41.2%) |
| 5 or more Children | 0 (0.0%) | 0 (0.0%) |
| Total | 28 (58.3%) | 29 (11.3%) |
Income Below Poverty Among Married-Couple vs Single-Parent Households in Monticello
The poverty data for Monticello shows that 4 of the married-couple family households (1.1%) and 57 of the single-parent households (18.8%) are living below the poverty level. Within the married-couple family households, those with 1 or 2 children have the highest poverty rate, with 4 households (3.2%) falling below the poverty line. Among the single-parent households, those with 3 or 4 children have the highest poverty rate, with 21 household (41.2%) living below poverty.
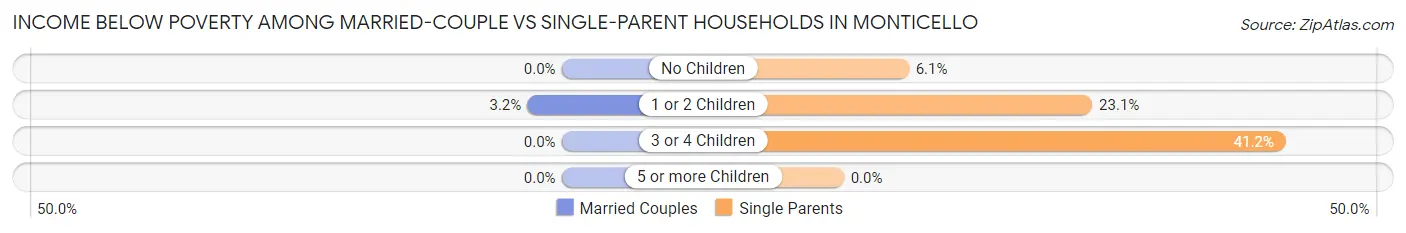
| Children | Married-Couple Families | Single-Parent Households |
| No Children | 0 (0.0%) | 8 (6.1%) |
| 1 or 2 Children | 4 (3.2%) | 28 (23.1%) |
| 3 or 4 Children | 0 (0.0%) | 21 (41.2%) |
| 5 or more Children | 0 (0.0%) | 0 (0.0%) |
| Total | 4 (1.1%) | 57 (18.8%) |
Race in Monticello
The most populous races in Monticello are White / Caucasian (1,193 | 46.0%), Black / African American (1,140 | 44.0%), and Some other Race (198 | 7.6%).
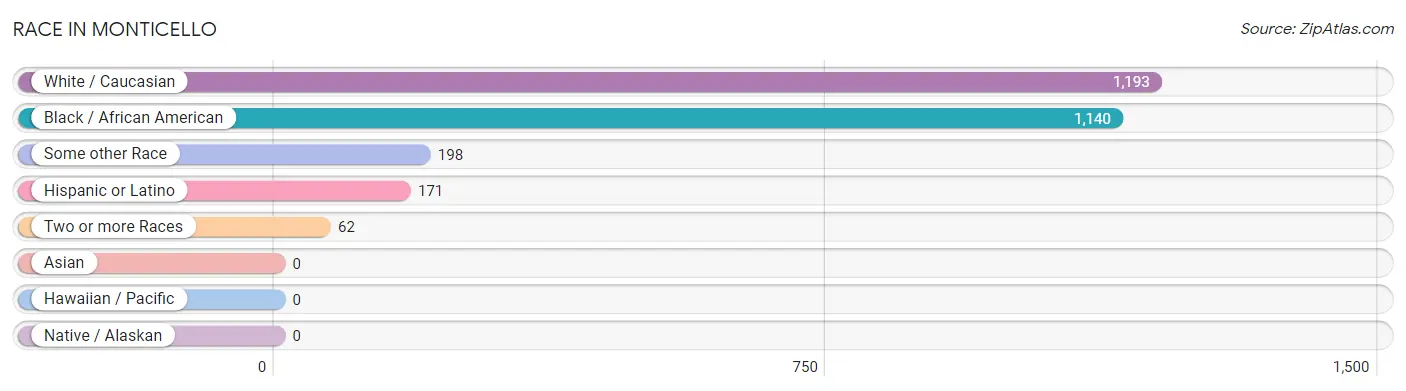
| Race | # Population | % Population |
| Asian | 0 | 0.0% |
| Black / African American | 1,140 | 44.0% |
| Hawaiian / Pacific | 0 | 0.0% |
| Hispanic or Latino | 171 | 6.6% |
| Native / Alaskan | 0 | 0.0% |
| White / Caucasian | 1,193 | 46.0% |
| Two or more Races | 62 | 2.4% |
| Some other Race | 198 | 7.6% |
| Total | 2,593 | 100.0% |
Ancestry in Monticello
The most populous ancestries reported in Monticello are English (311 | 12.0%), American (170 | 6.6%), Mexican (148 | 5.7%), German (140 | 5.4%), and Irish (134 | 5.2%), together accounting for 34.8% of all Monticello residents.
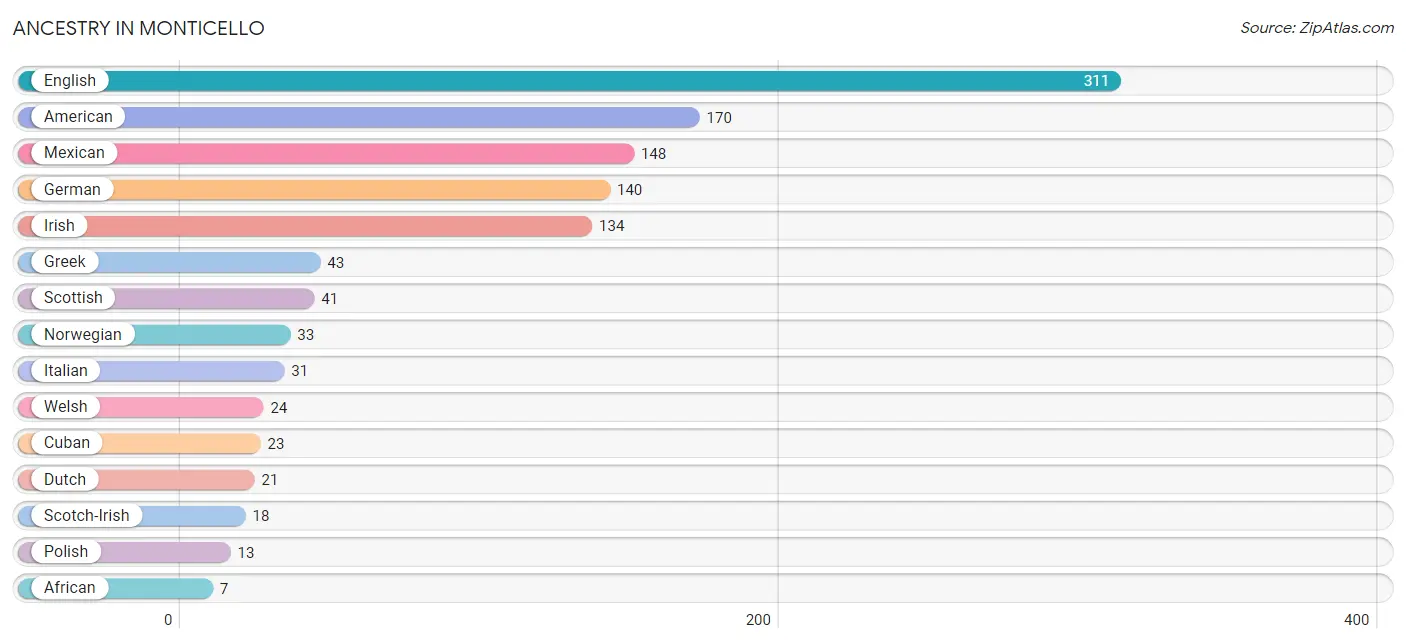
| Ancestry | # Population | % Population |
| African | 7 | 0.3% |
| American | 170 | 6.6% |
| Cuban | 23 | 0.9% |
| Dutch | 21 | 0.8% |
| English | 311 | 12.0% |
| German | 140 | 5.4% |
| Greek | 43 | 1.7% |
| Irish | 134 | 5.2% |
| Italian | 31 | 1.2% |
| Mexican | 148 | 5.7% |
| Norwegian | 33 | 1.3% |
| Polish | 13 | 0.5% |
| Scandinavian | 4 | 0.2% |
| Scotch-Irish | 18 | 0.7% |
| Scottish | 41 | 1.6% |
| Subsaharan African | 7 | 0.3% |
| Welsh | 24 | 0.9% | View All 17 Rows |
Immigrants in Monticello
The most numerous immigrant groups reported in Monticello came from Latin America (108 | 4.2%), Central America (85 | 3.3%), Mexico (85 | 3.3%), Caribbean (23 | 0.9%), and Cuba (23 | 0.9%), together accounting for 12.5% of all Monticello residents.
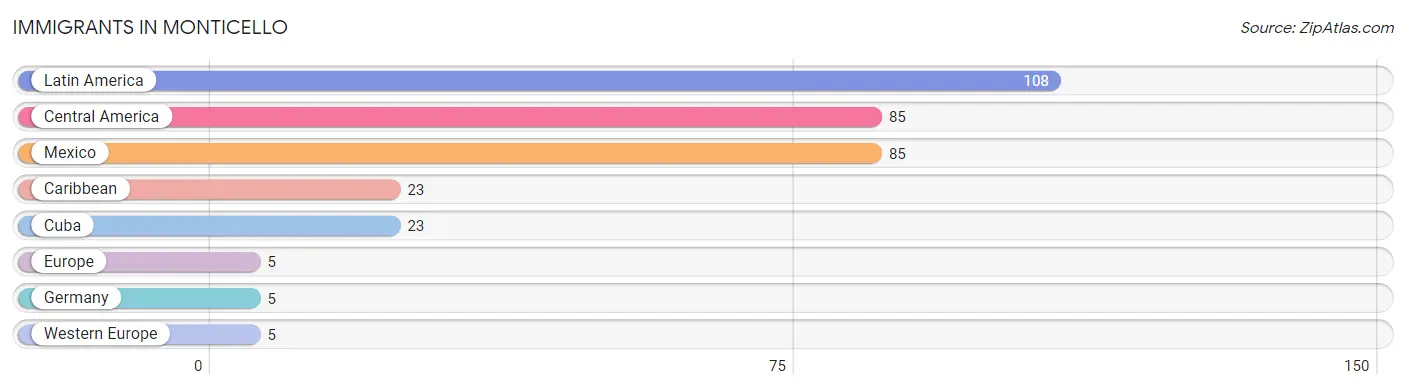
| Immigration Origin | # Population | % Population |
| Caribbean | 23 | 0.9% |
| Central America | 85 | 3.3% |
| Cuba | 23 | 0.9% |
| Europe | 5 | 0.2% |
| Germany | 5 | 0.2% |
| Latin America | 108 | 4.2% |
| Mexico | 85 | 3.3% |
| Western Europe | 5 | 0.2% | View All 8 Rows |
Sex and Age in Monticello
Sex and Age in Monticello
The most populous age groups in Monticello are 10 to 14 Years (123 | 10.8%) for men and 40 to 44 Years (186 | 12.8%) for women.
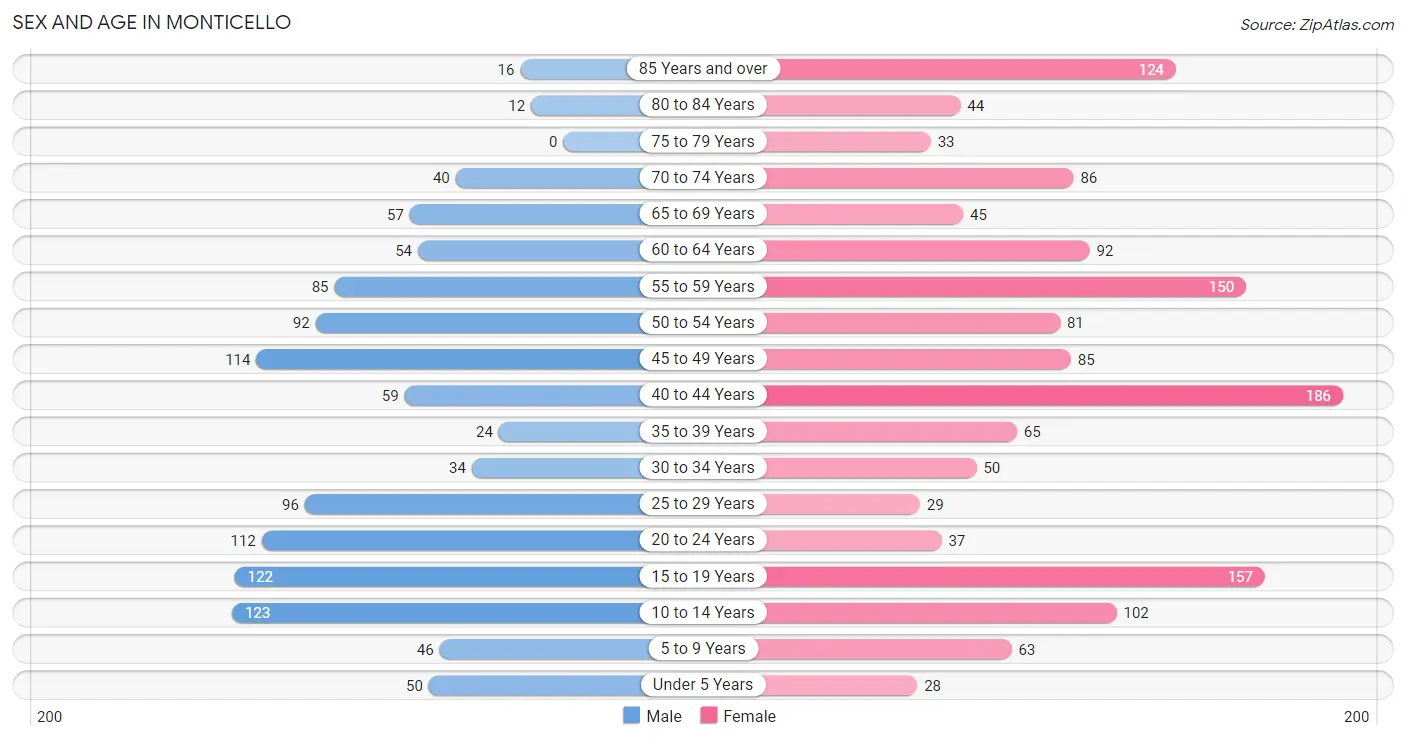
| Age Bracket | Male | Female |
| Under 5 Years | 50 (4.4%) | 28 (1.9%) |
| 5 to 9 Years | 46 (4.1%) | 63 (4.3%) |
| 10 to 14 Years | 123 (10.8%) | 102 (7.0%) |
| 15 to 19 Years | 122 (10.7%) | 157 (10.8%) |
| 20 to 24 Years | 112 (9.9%) | 37 (2.5%) |
| 25 to 29 Years | 96 (8.5%) | 29 (2.0%) |
| 30 to 34 Years | 34 (3.0%) | 50 (3.4%) |
| 35 to 39 Years | 24 (2.1%) | 65 (4.5%) |
| 40 to 44 Years | 59 (5.2%) | 186 (12.8%) |
| 45 to 49 Years | 114 (10.0%) | 85 (5.8%) |
| 50 to 54 Years | 92 (8.1%) | 81 (5.6%) |
| 55 to 59 Years | 85 (7.5%) | 150 (10.3%) |
| 60 to 64 Years | 54 (4.8%) | 92 (6.3%) |
| 65 to 69 Years | 57 (5.0%) | 45 (3.1%) |
| 70 to 74 Years | 40 (3.5%) | 86 (5.9%) |
| 75 to 79 Years | 0 (0.0%) | 33 (2.3%) |
| 80 to 84 Years | 12 (1.1%) | 44 (3.0%) |
| 85 Years and over | 16 (1.4%) | 124 (8.5%) |
| Total | 1,136 (100.0%) | 1,457 (100.0%) |
Families and Households in Monticello
Median Family Size in Monticello
The median family size in Monticello is 3.05 persons per family, with single female/mother families (256 | 37.6%) accounting for the largest median family size of 3.21 persons per family. On the other hand, single male/father families (48 | 7.0%) represent the smallest median family size with 2.94 persons per family.
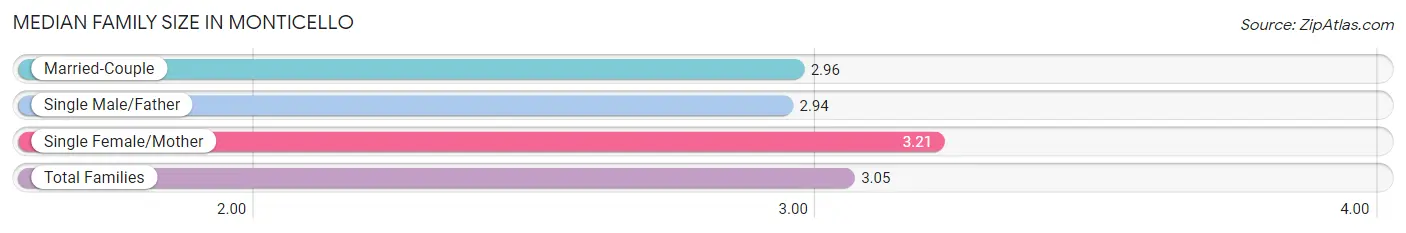
| Family Type | # Families | Family Size |
| Married-Couple | 377 (55.4%) | 2.96 |
| Single Male/Father | 48 (7.0%) | 2.94 |
| Single Female/Mother | 256 (37.6%) | 3.21 |
| Total Families | 681 (100.0%) | 3.05 |
Median Household Size in Monticello
The median household size in Monticello is 2.44 persons per household, with single female/mother households (256 | 24.6%) accounting for the largest median household size of 3.31 persons per household. non-family households (360 | 34.6%) represent the smallest median household size with 1.04 persons per household.
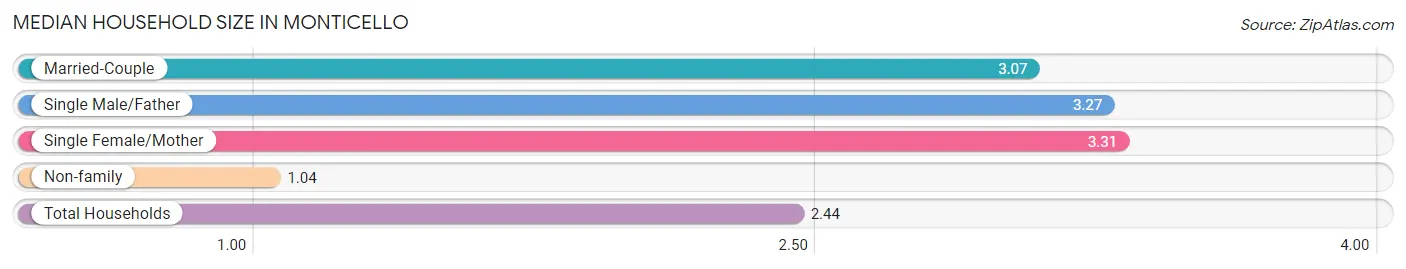
| Household Type | # Households | Household Size |
| Married-Couple | 377 (36.2%) | 3.07 |
| Single Male/Father | 48 (4.6%) | 3.27 |
| Single Female/Mother | 256 (24.6%) | 3.31 |
| Non-family | 360 (34.6%) | 1.04 |
| Total Households | 1,041 (100.0%) | 2.44 |
Household Size by Marriage Status in Monticello
Out of a total of 1,041 households in Monticello, 681 (65.4%) are family households, while 360 (34.6%) are nonfamily households. The most numerous type of family households are 2-person households, comprising 320, and the most common type of nonfamily households are 1-person households, comprising 351.
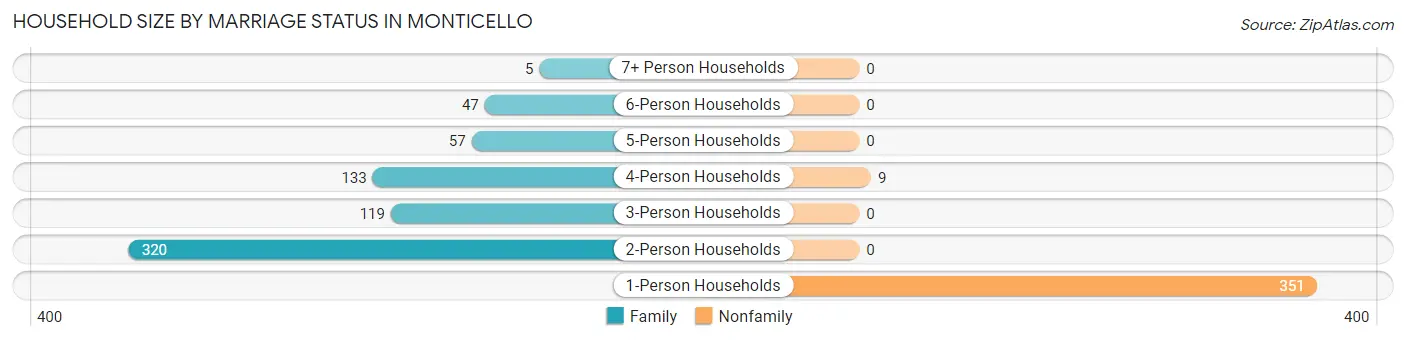
| Household Size | Family Households | Nonfamily Households |
| 1-Person Households | - | 351 (33.7%) |
| 2-Person Households | 320 (30.7%) | 0 (0.0%) |
| 3-Person Households | 119 (11.4%) | 0 (0.0%) |
| 4-Person Households | 133 (12.8%) | 9 (0.9%) |
| 5-Person Households | 57 (5.5%) | 0 (0.0%) |
| 6-Person Households | 47 (4.5%) | 0 (0.0%) |
| 7+ Person Households | 5 (0.5%) | 0 (0.0%) |
| Total | 681 (65.4%) | 360 (34.6%) |
Female Fertility in Monticello
Fertility by Age in Monticello
Average fertility rate in Monticello is 33.0 births per 1,000 women. Women in the age bracket of 20 to 34 years have the highest fertility rate with 43.0 births per 1,000 women. Women in the age bracket of 35 to 50 years acount for 76.2% of all women with births.
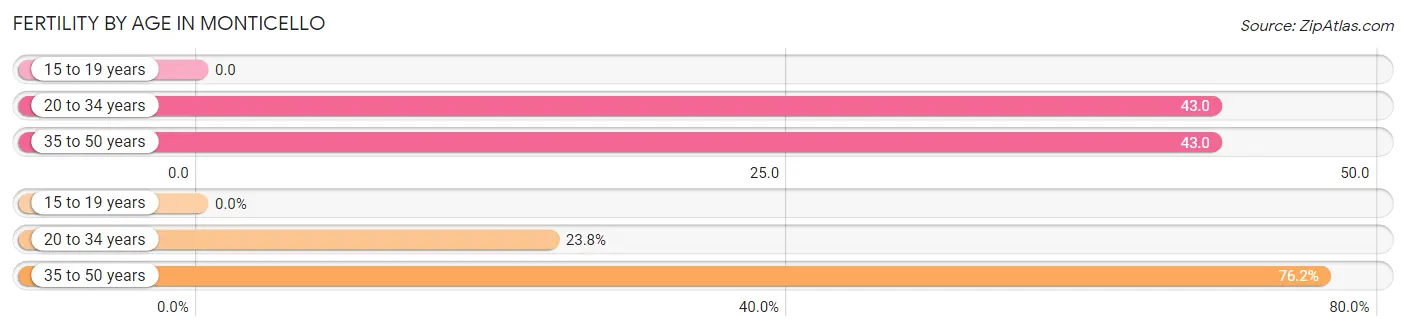
| Age Bracket | Women with Births | Births / 1,000 Women |
| 15 to 19 years | 0 (0.0%) | 0.0 |
| 20 to 34 years | 5 (23.8%) | 43.0 |
| 35 to 50 years | 16 (76.2%) | 43.0 |
| Total | 21 (100.0%) | 33.0 |
Fertility by Age by Marriage Status in Monticello
76.2% of women with births (21) in Monticello are married. The highest percentage of unmarried women with births falls into 20 to 34 years age bracket with 100.0% of them unmarried at the time of birth, while the lowest percentage of unmarried women with births belong to 35 to 50 years age bracket with 0.0% of them unmarried.
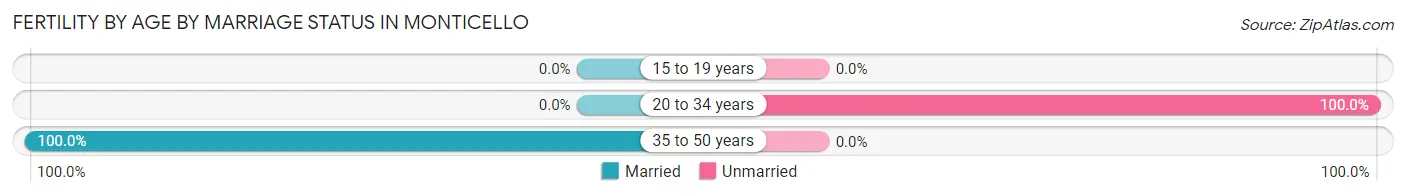
| Age Bracket | Married | Unmarried |
| 15 to 19 years | 0 (0.0%) | 0 (0.0%) |
| 20 to 34 years | 0 (0.0%) | 5 (100.0%) |
| 35 to 50 years | 16 (100.0%) | 0 (0.0%) |
| Total | 16 (76.2%) | 5 (23.8%) |
Fertility by Education in Monticello
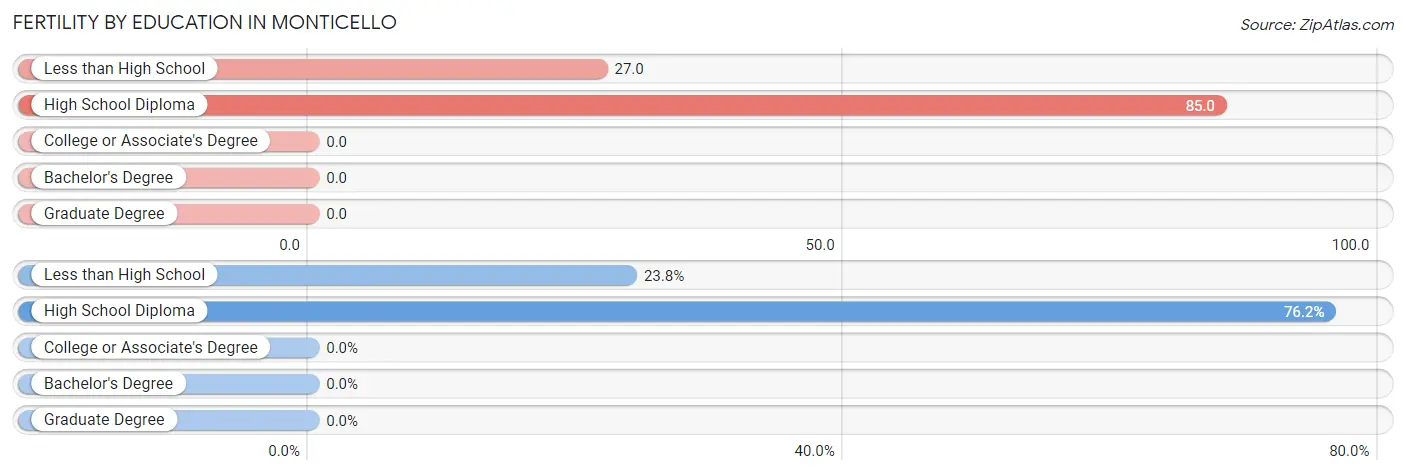
| Educational Attainment | Women with Births | Births / 1,000 Women |
| Less than High School | 5 (23.8%) | 27.0 |
| High School Diploma | 16 (76.2%) | 85.0 |
| College or Associate's Degree | 0 (0.0%) | 0.0 |
| Bachelor's Degree | 0 (0.0%) | 0.0 |
| Graduate Degree | 0 (0.0%) | 0.0 |
| Total | 21 (100.0%) | 33.0 |
Fertility by Education by Marriage Status in Monticello
23.8% of women with births in Monticello are unmarried. Women with the educational attainment of high school diploma are most likely to be married with 100.0% of them married at childbirth, while women with the educational attainment of less than high school are least likely to be married with 100.0% of them unmarried at childbirth.
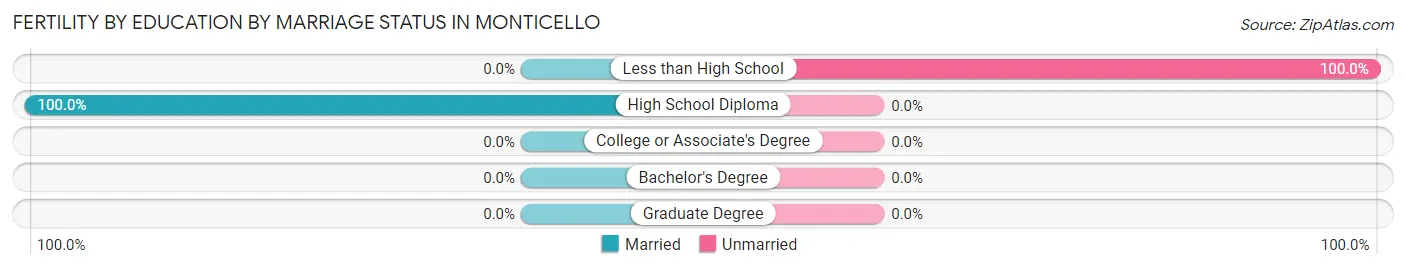
| Educational Attainment | Married | Unmarried |
| Less than High School | 0 (0.0%) | 5 (100.0%) |
| High School Diploma | 16 (100.0%) | 0 (0.0%) |
| College or Associate's Degree | 0 (0.0%) | 0 (0.0%) |
| Bachelor's Degree | 0 (0.0%) | 0 (0.0%) |
| Graduate Degree | 0 (0.0%) | 0 (0.0%) |
| Total | 16 (76.2%) | 5 (23.8%) |
Employment Characteristics in Monticello
Employment by Class of Employer in Monticello
Among the 1,106 employed individuals in Monticello, private company employees (781 | 70.6%), local government employees (227 | 20.5%), and self-employed (not incorporated) (26 | 2.4%) make up the most common classes of employment.
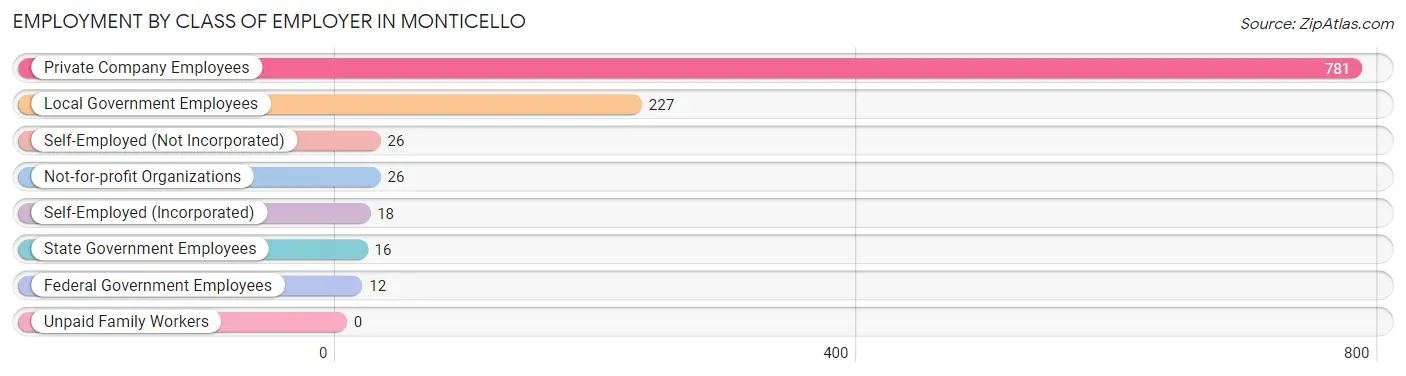
| Employer Class | # Employees | % Employees |
| Private Company Employees | 781 | 70.6% |
| Self-Employed (Incorporated) | 18 | 1.6% |
| Self-Employed (Not Incorporated) | 26 | 2.4% |
| Not-for-profit Organizations | 26 | 2.4% |
| Local Government Employees | 227 | 20.5% |
| State Government Employees | 16 | 1.5% |
| Federal Government Employees | 12 | 1.1% |
| Unpaid Family Workers | 0 | 0.0% |
| Total | 1,106 | 100.0% |
Employment Status by Age in Monticello
According to the labor force statistics for Monticello, out of the total population over 16 years of age (2,164), 56.9% or 1,231 individuals are in the labor force, with 5.8% or 71 of them unemployed. The age group with the highest labor force participation rate is 35 to 44 years, with 91.9% or 307 individuals in the labor force. Within the labor force, the 16 to 19 years age range has the highest percentage of unemployed individuals, with 29.5% or 46 of them being unemployed.
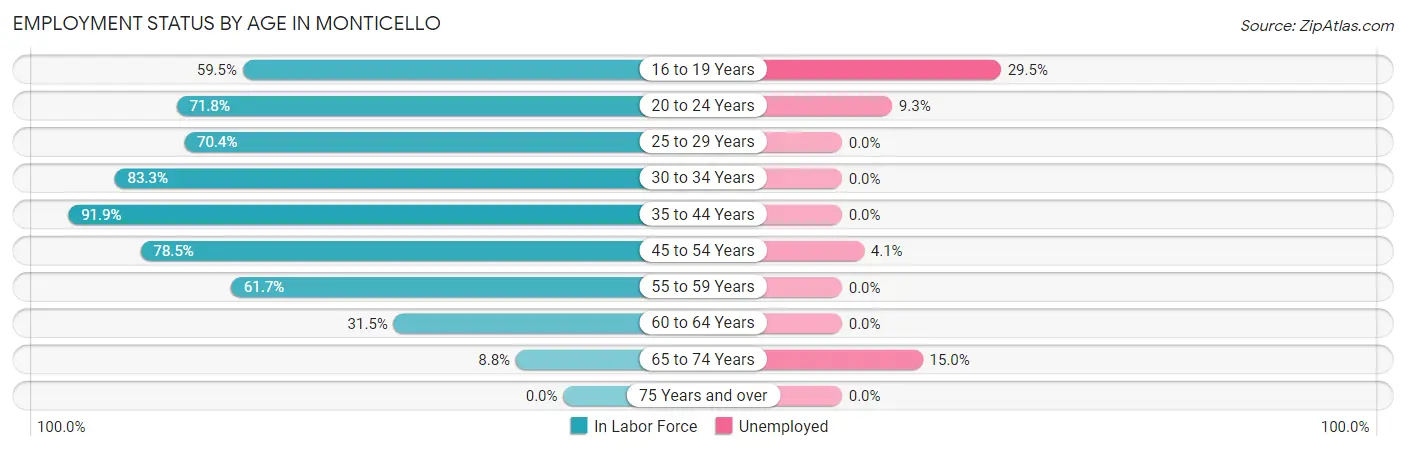
| Age Bracket | In Labor Force | Unemployed |
| 16 to 19 Years | 156 (59.5%) | 46 (29.5%) |
| 20 to 24 Years | 107 (71.8%) | 10 (9.3%) |
| 25 to 29 Years | 88 (70.4%) | 0 (0.0%) |
| 30 to 34 Years | 70 (83.3%) | 0 (0.0%) |
| 35 to 44 Years | 307 (91.9%) | 0 (0.0%) |
| 45 to 54 Years | 292 (78.5%) | 12 (4.1%) |
| 55 to 59 Years | 145 (61.7%) | 0 (0.0%) |
| 60 to 64 Years | 46 (31.5%) | 0 (0.0%) |
| 65 to 74 Years | 20 (8.8%) | 3 (15.0%) |
| 75 Years and over | 0 (0.0%) | 0 (0.0%) |
| Total | 1,231 (56.9%) | 71 (5.8%) |
Employment Status by Educational Attainment in Monticello
According to labor force statistics for Monticello, 73.1% of individuals (947) out of the total population between 25 and 64 years of age (1,296) are in the labor force, with 1.3% or 12 of them being unemployed. The group with the highest labor force participation rate are those with the educational attainment of college / associate degree, with 92.9% or 261 individuals in the labor force. Within the labor force, individuals with high school diploma education have the highest percentage of unemployment, with 3.3% or 12 of them being unemployed.
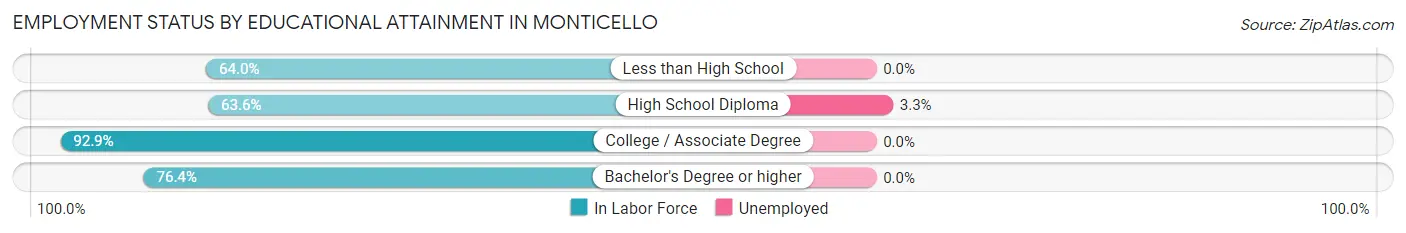
| Educational Attainment | In Labor Force | Unemployed |
| Less than High School | 80 (64.0%) | 0 (0.0%) |
| High School Diploma | 364 (63.6%) | 19 (3.3%) |
| College / Associate Degree | 261 (92.9%) | 0 (0.0%) |
| Bachelor's Degree or higher | 243 (76.4%) | 0 (0.0%) |
| Total | 947 (73.1%) | 17 (1.3%) |
Employment Occupations by Sex in Monticello
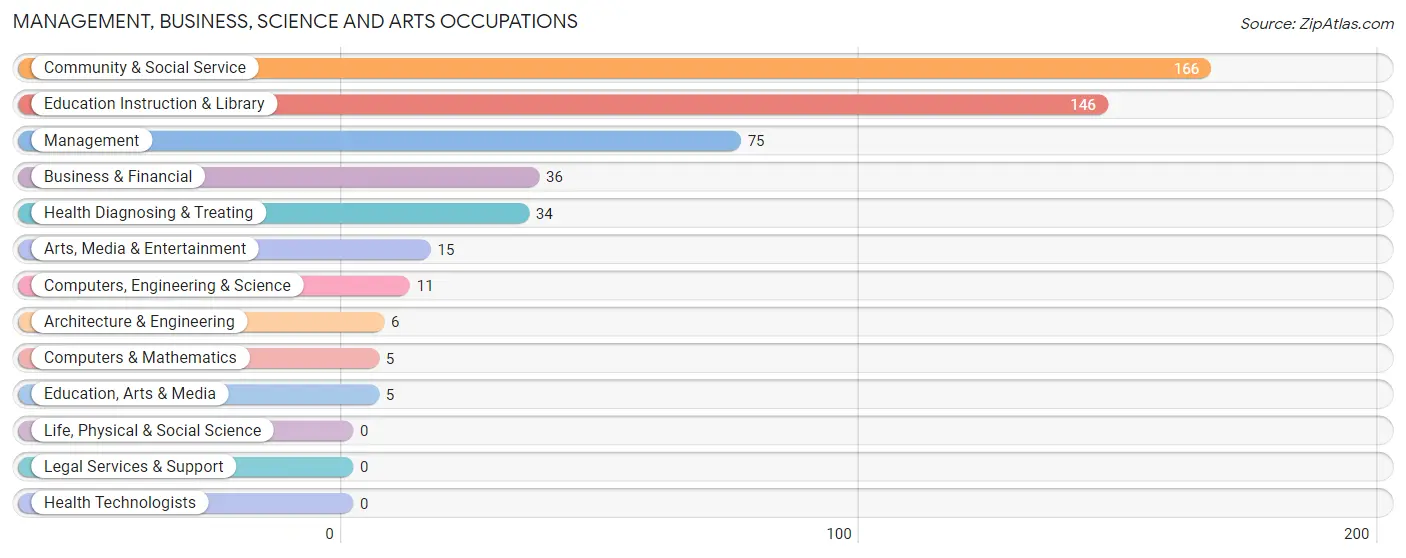
Management, Business, Science and Arts Occupations
The most common Management, Business, Science and Arts occupations in Monticello are Community & Social Service (166 | 14.3%), Education Instruction & Library (146 | 12.6%), Management (75 | 6.5%), Business & Financial (36 | 3.1%), and Health Diagnosing & Treating (34 | 2.9%).
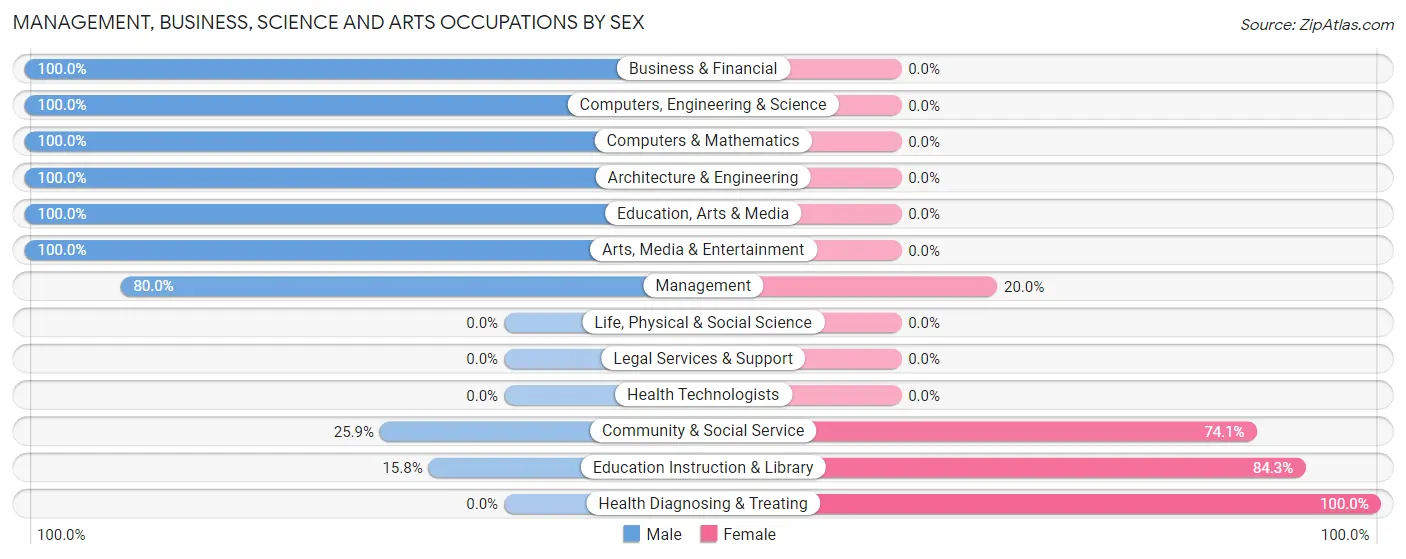
Management, Business, Science and Arts Occupations by Sex
Within the Management, Business, Science and Arts occupations in Monticello, the most male-oriented occupations are Business & Financial (100.0%), Computers, Engineering & Science (100.0%), and Computers & Mathematics (100.0%), while the most female-oriented occupations are Health Diagnosing & Treating (100.0%), Education Instruction & Library (84.3%), and Community & Social Service (74.1%).
| Occupation | Male | Female |
| Management | 60 (80.0%) | 15 (20.0%) |
| Business & Financial | 36 (100.0%) | 0 (0.0%) |
| Computers, Engineering & Science | 11 (100.0%) | 0 (0.0%) |
| Computers & Mathematics | 5 (100.0%) | 0 (0.0%) |
| Architecture & Engineering | 6 (100.0%) | 0 (0.0%) |
| Life, Physical & Social Science | 0 (0.0%) | 0 (0.0%) |
| Community & Social Service | 43 (25.9%) | 123 (74.1%) |
| Education, Arts & Media | 5 (100.0%) | 0 (0.0%) |
| Legal Services & Support | 0 (0.0%) | 0 (0.0%) |
| Education Instruction & Library | 23 (15.8%) | 123 (84.3%) |
| Arts, Media & Entertainment | 15 (100.0%) | 0 (0.0%) |
| Health Diagnosing & Treating | 0 (0.0%) | 34 (100.0%) |
| Health Technologists | 0 (0.0%) | 0 (0.0%) |
| Total (Category) | 150 (46.6%) | 172 (53.4%) |
| Total (Overall) | 510 (44.0%) | 650 (56.0%) |
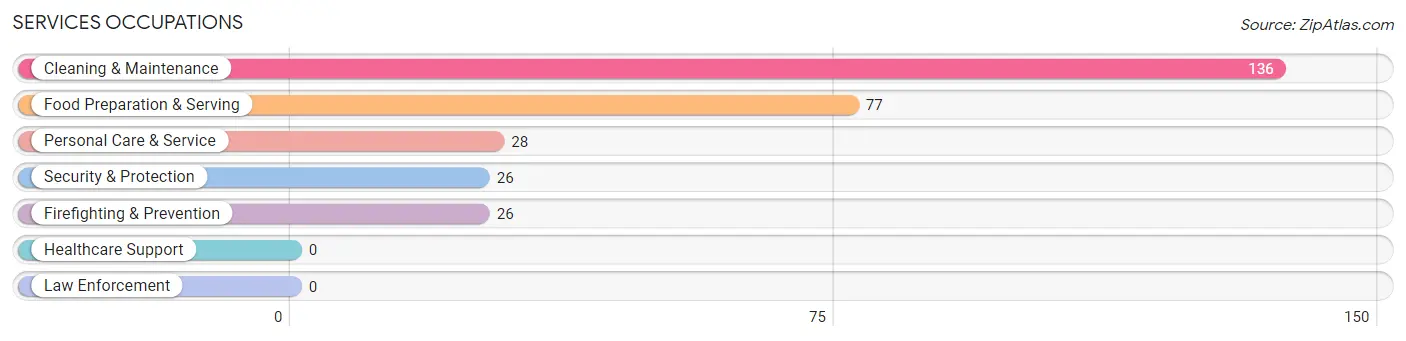
Services Occupations
The most common Services occupations in Monticello are Cleaning & Maintenance (136 | 11.7%), Food Preparation & Serving (77 | 6.6%), Personal Care & Service (28 | 2.4%), Security & Protection (26 | 2.2%), and Firefighting & Prevention (26 | 2.2%).
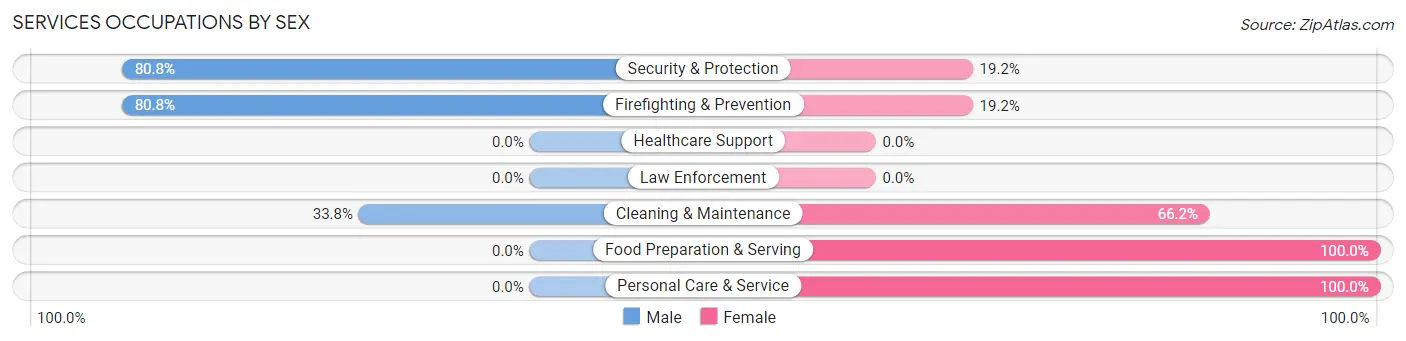
Services Occupations by Sex
Within the Services occupations in Monticello, the most male-oriented occupations are Security & Protection (80.8%), Firefighting & Prevention (80.8%), and Cleaning & Maintenance (33.8%), while the most female-oriented occupations are Food Preparation & Serving (100.0%), Personal Care & Service (100.0%), and Cleaning & Maintenance (66.2%).
| Occupation | Male | Female |
| Healthcare Support | 0 (0.0%) | 0 (0.0%) |
| Security & Protection | 21 (80.8%) | 5 (19.2%) |
| Firefighting & Prevention | 21 (80.8%) | 5 (19.2%) |
| Law Enforcement | 0 (0.0%) | 0 (0.0%) |
| Food Preparation & Serving | 0 (0.0%) | 77 (100.0%) |
| Cleaning & Maintenance | 46 (33.8%) | 90 (66.2%) |
| Personal Care & Service | 0 (0.0%) | 28 (100.0%) |
| Total (Category) | 67 (25.1%) | 200 (74.9%) |
| Total (Overall) | 510 (44.0%) | 650 (56.0%) |
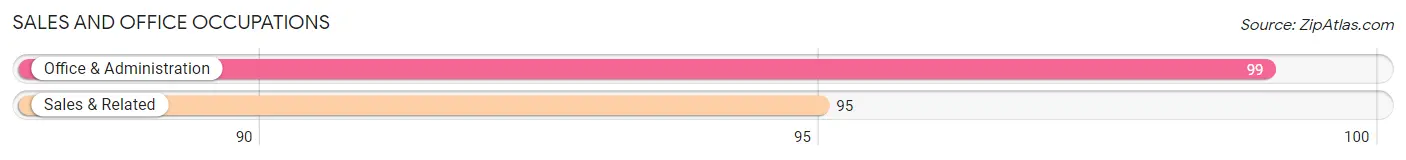
Sales and Office Occupations
The most common Sales and Office occupations in Monticello are Office & Administration (99 | 8.5%), and Sales & Related (95 | 8.2%).
Sales and Office Occupations by Sex
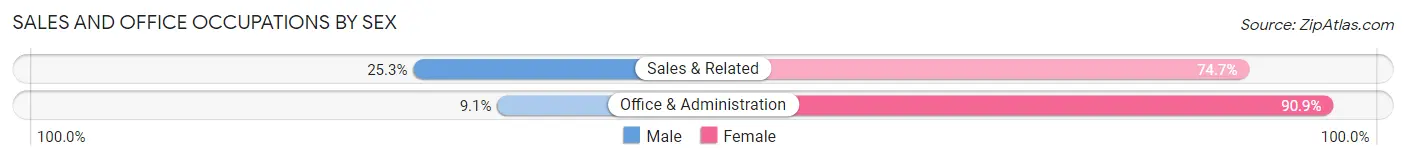
| Occupation | Male | Female |
| Sales & Related | 24 (25.3%) | 71 (74.7%) |
| Office & Administration | 9 (9.1%) | 90 (90.9%) |
| Total (Category) | 33 (17.0%) | 161 (83.0%) |
| Total (Overall) | 510 (44.0%) | 650 (56.0%) |
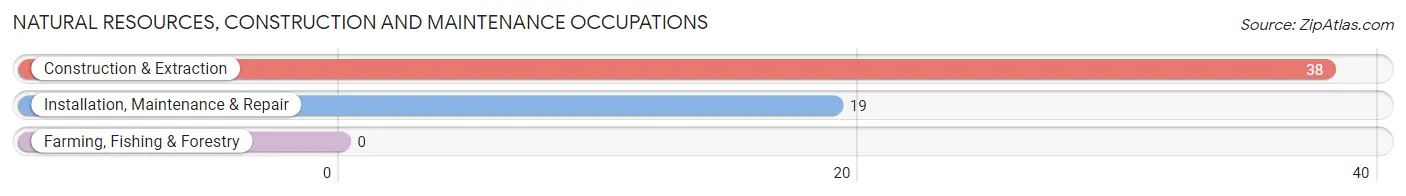
Natural Resources, Construction and Maintenance Occupations
The most common Natural Resources, Construction and Maintenance occupations in Monticello are Construction & Extraction (38 | 3.3%), and Installation, Maintenance & Repair (19 | 1.6%).
Natural Resources, Construction and Maintenance Occupations by Sex
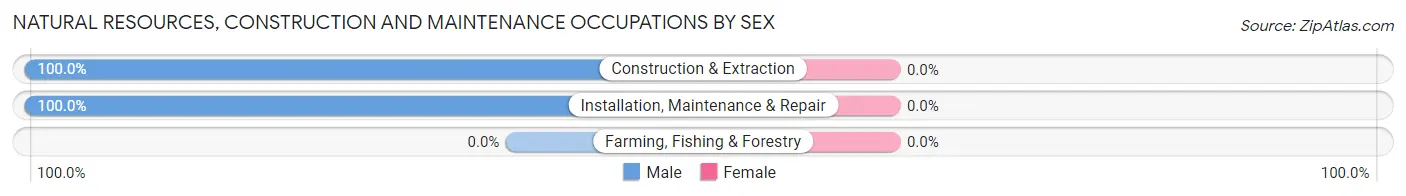
| Occupation | Male | Female |
| Farming, Fishing & Forestry | 0 (0.0%) | 0 (0.0%) |
| Construction & Extraction | 38 (100.0%) | 0 (0.0%) |
| Installation, Maintenance & Repair | 19 (100.0%) | 0 (0.0%) |
| Total (Category) | 57 (100.0%) | 0 (0.0%) |
| Total (Overall) | 510 (44.0%) | 650 (56.0%) |
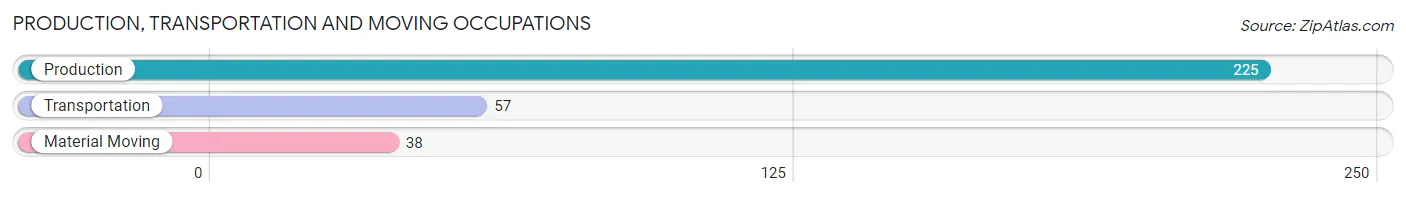
Production, Transportation and Moving Occupations
The most common Production, Transportation and Moving occupations in Monticello are Production (225 | 19.4%), Transportation (57 | 4.9%), and Material Moving (38 | 3.3%).
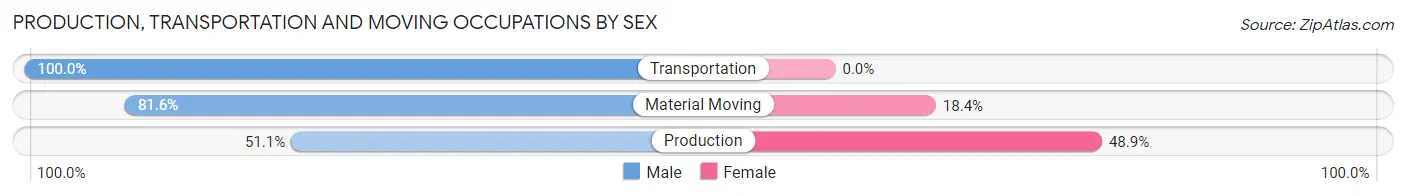
Production, Transportation and Moving Occupations by Sex
| Occupation | Male | Female |
| Production | 115 (51.1%) | 110 (48.9%) |
| Transportation | 57 (100.0%) | 0 (0.0%) |
| Material Moving | 31 (81.6%) | 7 (18.4%) |
| Total (Category) | 203 (63.4%) | 117 (36.6%) |
| Total (Overall) | 510 (44.0%) | 650 (56.0%) |
Employment Industries by Sex in Monticello
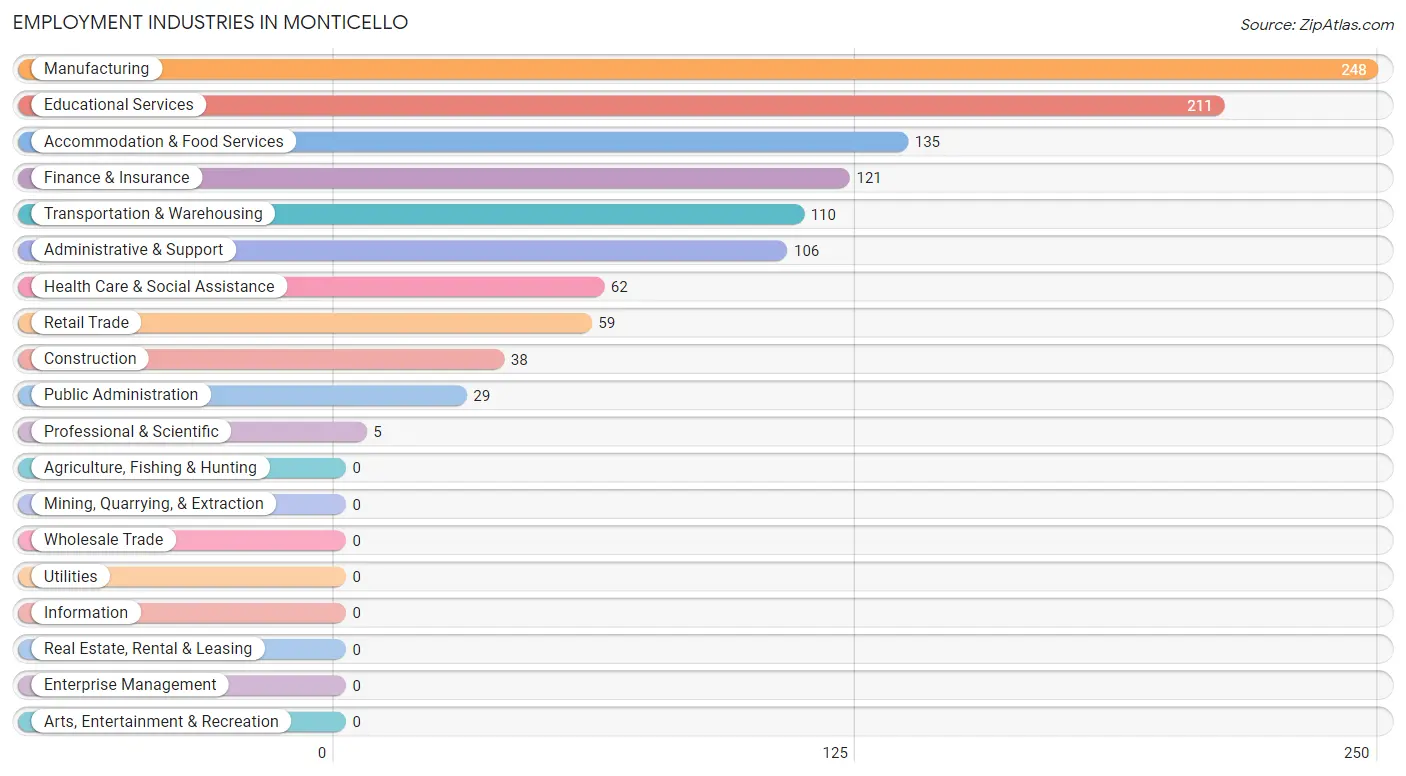
Employment Industries in Monticello
The major employment industries in Monticello include Manufacturing (248 | 21.4%), Educational Services (211 | 18.2%), Accommodation & Food Services (135 | 11.6%), Finance & Insurance (121 | 10.4%), and Transportation & Warehousing (110 | 9.5%).
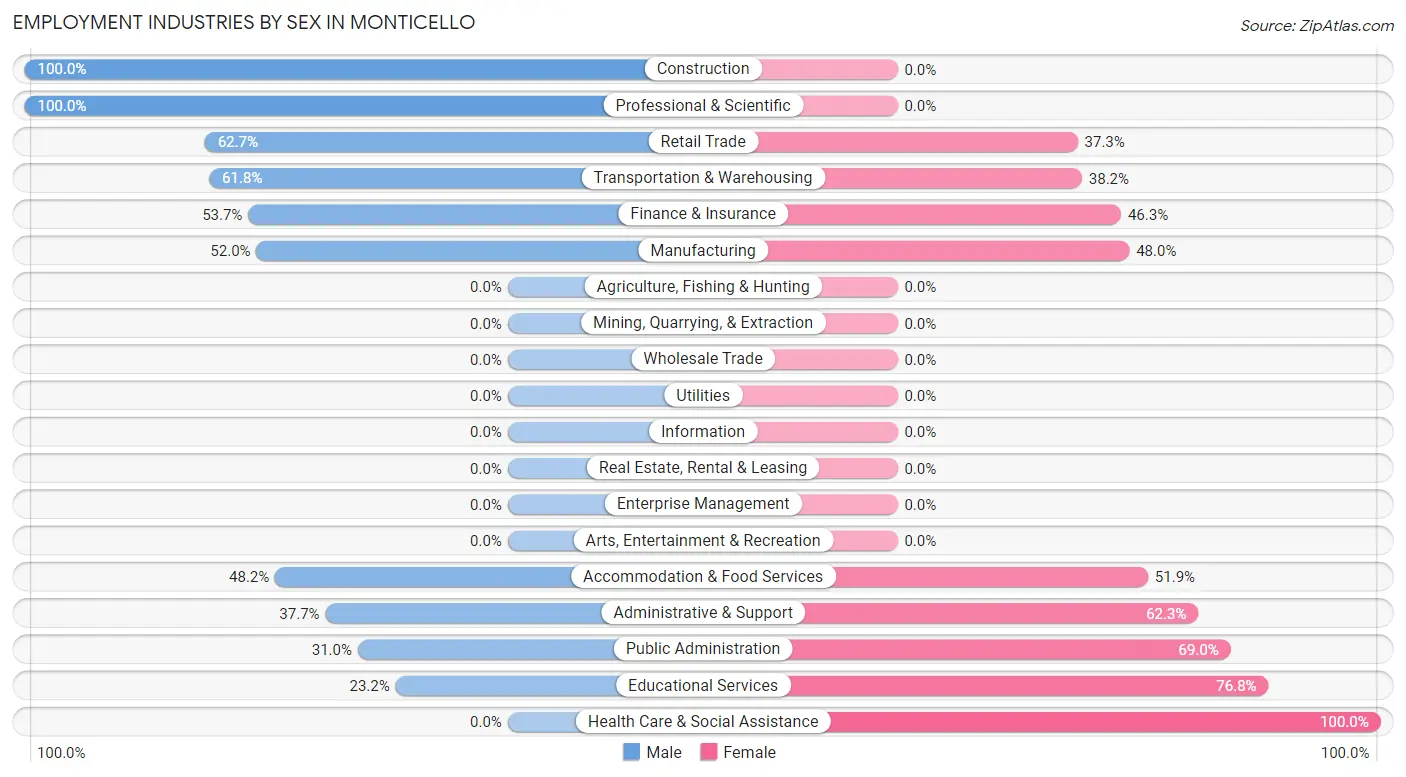
Employment Industries by Sex in Monticello
The Monticello industries that see more men than women are Construction (100.0%), Professional & Scientific (100.0%), and Retail Trade (62.7%), whereas the industries that tend to have a higher number of women are Health Care & Social Assistance (100.0%), Educational Services (76.8%), and Public Administration (69.0%).
| Industry | Male | Female |
| Agriculture, Fishing & Hunting | 0 (0.0%) | 0 (0.0%) |
| Mining, Quarrying, & Extraction | 0 (0.0%) | 0 (0.0%) |
| Construction | 38 (100.0%) | 0 (0.0%) |
| Manufacturing | 129 (52.0%) | 119 (48.0%) |
| Wholesale Trade | 0 (0.0%) | 0 (0.0%) |
| Retail Trade | 37 (62.7%) | 22 (37.3%) |
| Transportation & Warehousing | 68 (61.8%) | 42 (38.2%) |
| Utilities | 0 (0.0%) | 0 (0.0%) |
| Information | 0 (0.0%) | 0 (0.0%) |
| Finance & Insurance | 65 (53.7%) | 56 (46.3%) |
| Real Estate, Rental & Leasing | 0 (0.0%) | 0 (0.0%) |
| Professional & Scientific | 5 (100.0%) | 0 (0.0%) |
| Enterprise Management | 0 (0.0%) | 0 (0.0%) |
| Administrative & Support | 40 (37.7%) | 66 (62.3%) |
| Educational Services | 49 (23.2%) | 162 (76.8%) |
| Health Care & Social Assistance | 0 (0.0%) | 62 (100.0%) |
| Arts, Entertainment & Recreation | 0 (0.0%) | 0 (0.0%) |
| Accommodation & Food Services | 65 (48.1%) | 70 (51.8%) |
| Public Administration | 9 (31.0%) | 20 (69.0%) |
| Total | 510 (44.0%) | 650 (56.0%) |
Education in Monticello
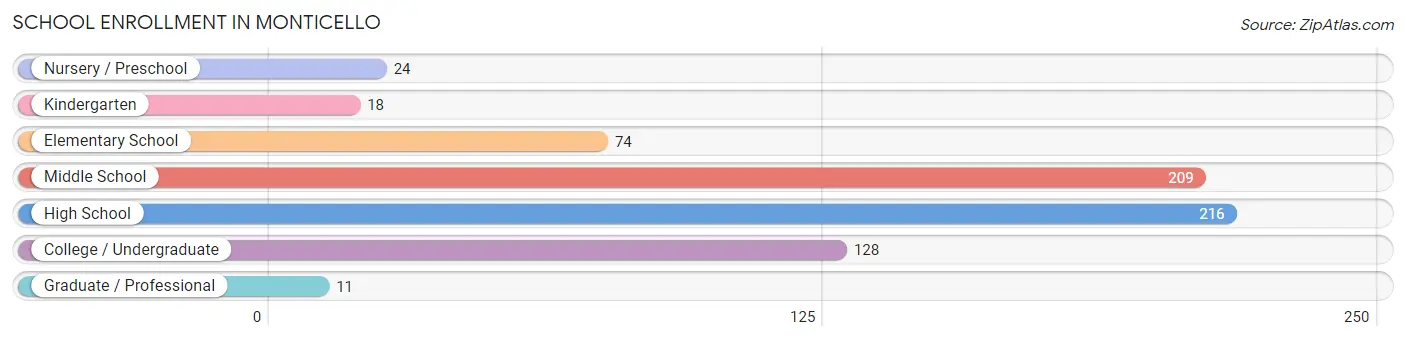
School Enrollment in Monticello
The most common levels of schooling among the 680 students in Monticello are high school (216 | 31.8%), middle school (209 | 30.7%), and college / undergraduate (128 | 18.8%).
| School Level | # Students | % Students |
| Nursery / Preschool | 24 | 3.5% |
| Kindergarten | 18 | 2.6% |
| Elementary School | 74 | 10.9% |
| Middle School | 209 | 30.7% |
| High School | 216 | 31.8% |
| College / Undergraduate | 128 | 18.8% |
| Graduate / Professional | 11 | 1.6% |
| Total | 680 | 100.0% |
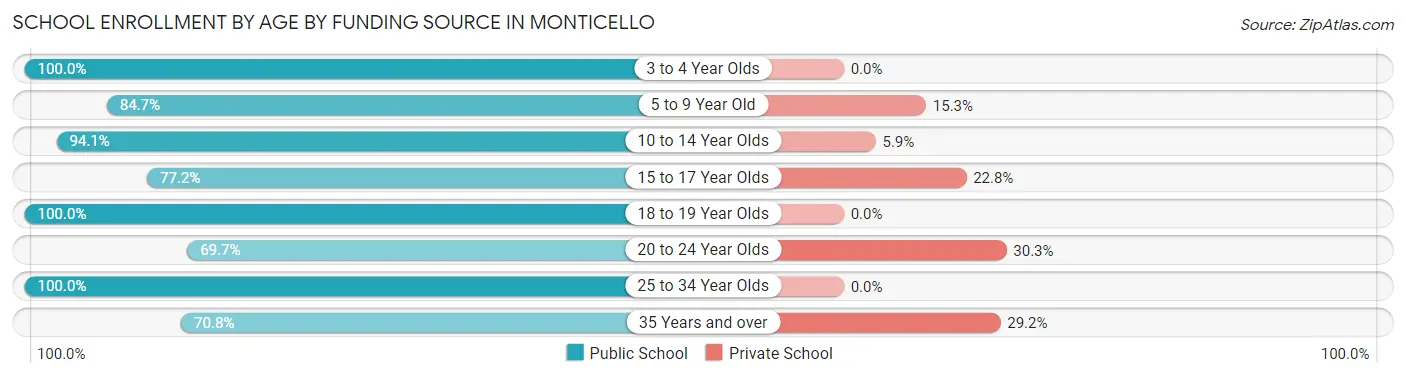
School Enrollment by Age by Funding Source in Monticello
Out of a total of 680 students who are enrolled in schools in Monticello, 86 (12.6%) attend a private institution, while the remaining 594 (87.4%) are enrolled in public schools. The age group of 20 to 24 year olds has the highest likelihood of being enrolled in private schools, with 10 (30.3% in the age bracket) enrolled. Conversely, the age group of 3 to 4 year olds has the lowest likelihood of being enrolled in a private school, with 8 (100.0% in the age bracket) attending a public institution.
| Age Bracket | Public School | Private School |
| 3 to 4 Year Olds | 8 (100.0%) | 0 (0.0%) |
| 5 to 9 Year Old | 83 (84.7%) | 15 (15.3%) |
| 10 to 14 Year Olds | 206 (94.1%) | 13 (5.9%) |
| 15 to 17 Year Olds | 115 (77.2%) | 34 (22.8%) |
| 18 to 19 Year Olds | 99 (100.0%) | 0 (0.0%) |
| 20 to 24 Year Olds | 23 (69.7%) | 10 (30.3%) |
| 25 to 34 Year Olds | 26 (100.0%) | 0 (0.0%) |
| 35 Years and over | 34 (70.8%) | 14 (29.2%) |
| Total | 594 (87.4%) | 86 (12.6%) |
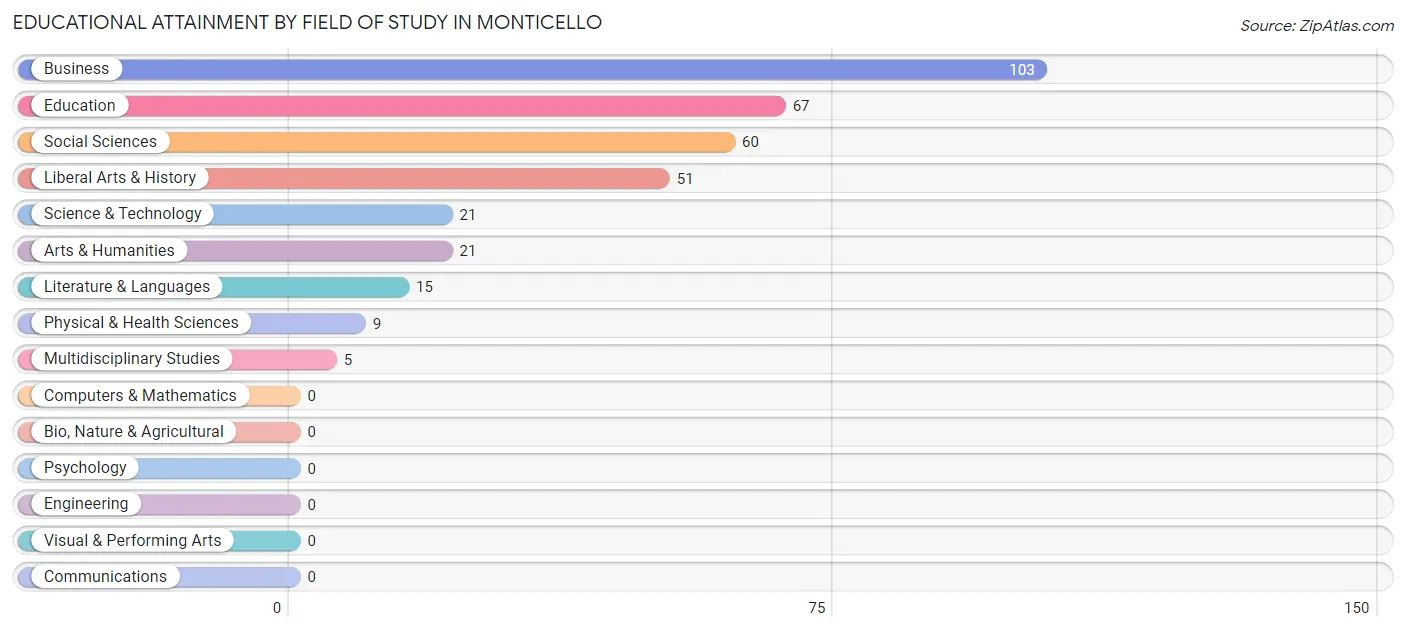
Educational Attainment by Field of Study in Monticello
Business (103 | 29.3%), education (67 | 19.0%), social sciences (60 | 17.1%), liberal arts & history (51 | 14.5%), and science & technology (21 | 6.0%) are the most common fields of study among 352 individuals in Monticello who have obtained a bachelor's degree or higher.
| Field of Study | # Graduates | % Graduates |
| Computers & Mathematics | 0 | 0.0% |
| Bio, Nature & Agricultural | 0 | 0.0% |
| Physical & Health Sciences | 9 | 2.6% |
| Psychology | 0 | 0.0% |
| Social Sciences | 60 | 17.1% |
| Engineering | 0 | 0.0% |
| Multidisciplinary Studies | 5 | 1.4% |
| Science & Technology | 21 | 6.0% |
| Business | 103 | 29.3% |
| Education | 67 | 19.0% |
| Literature & Languages | 15 | 4.3% |
| Liberal Arts & History | 51 | 14.5% |
| Visual & Performing Arts | 0 | 0.0% |
| Communications | 0 | 0.0% |
| Arts & Humanities | 21 | 6.0% |
| Total | 352 | 100.0% |
Transportation & Commute in Monticello
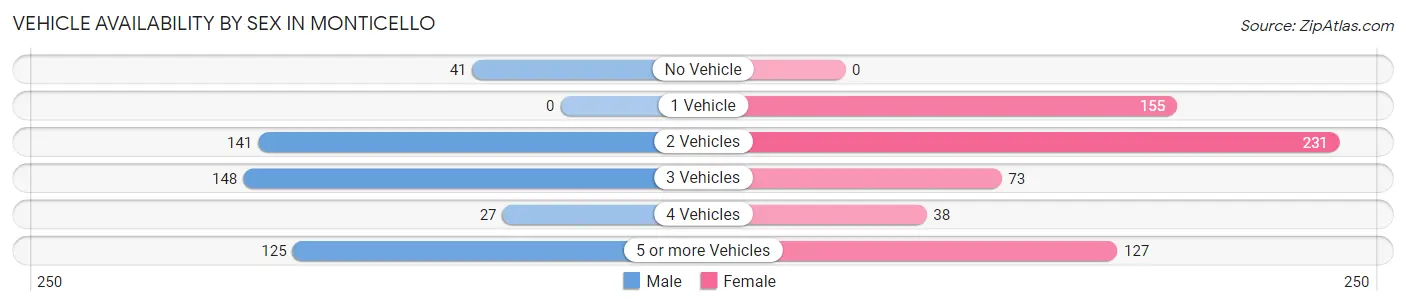
Vehicle Availability by Sex in Monticello
The most prevalent vehicle ownership categories in Monticello are males with 3 vehicles (148, accounting for 30.7%) and females with 3 vehicles (73, making up 23.7%).
| Vehicles Available | Male | Female |
| No Vehicle | 41 (8.5%) | 0 (0.0%) |
| 1 Vehicle | 0 (0.0%) | 155 (24.8%) |
| 2 Vehicles | 141 (29.2%) | 231 (37.0%) |
| 3 Vehicles | 148 (30.7%) | 73 (11.7%) |
| 4 Vehicles | 27 (5.6%) | 38 (6.1%) |
| 5 or more Vehicles | 125 (25.9%) | 127 (20.3%) |
| Total | 482 (100.0%) | 624 (100.0%) |
Commute Time in Monticello
The most frequently occuring commute durations in Monticello are 5 to 9 minutes (257 commuters, 26.9%), 90 or more minutes (131 commuters, 13.7%), and 30 to 34 minutes (107 commuters, 11.2%).
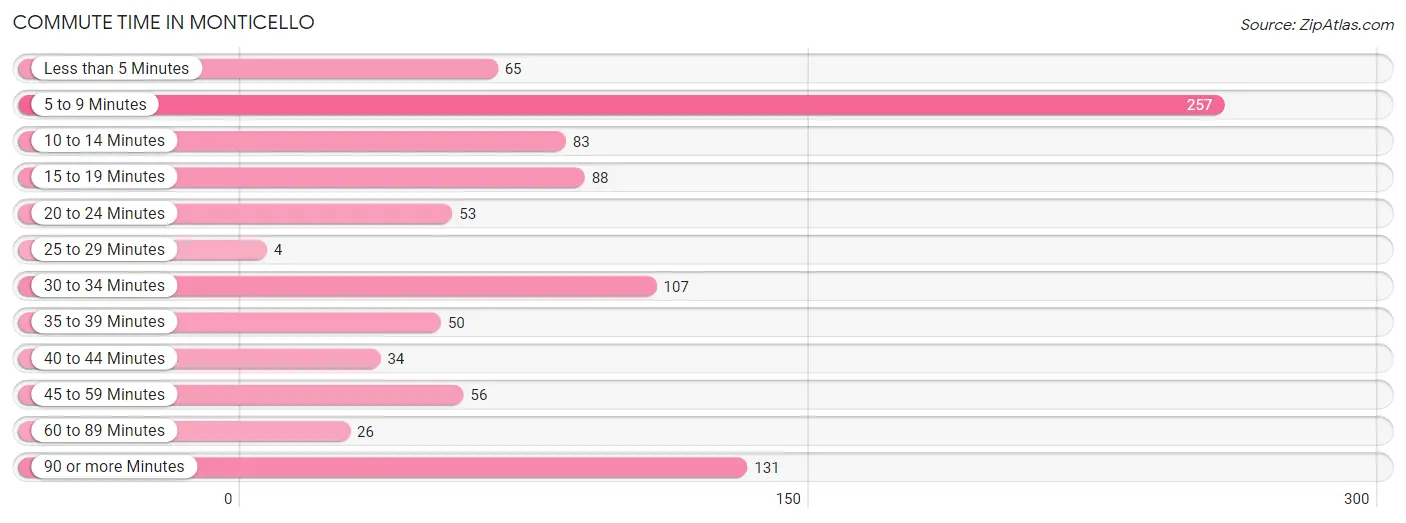
| Commute Time | # Commuters | % Commuters |
| Less than 5 Minutes | 65 | 6.8% |
| 5 to 9 Minutes | 257 | 26.9% |
| 10 to 14 Minutes | 83 | 8.7% |
| 15 to 19 Minutes | 88 | 9.2% |
| 20 to 24 Minutes | 53 | 5.6% |
| 25 to 29 Minutes | 4 | 0.4% |
| 30 to 34 Minutes | 107 | 11.2% |
| 35 to 39 Minutes | 50 | 5.2% |
| 40 to 44 Minutes | 34 | 3.6% |
| 45 to 59 Minutes | 56 | 5.9% |
| 60 to 89 Minutes | 26 | 2.7% |
| 90 or more Minutes | 131 | 13.7% |
Commute Time by Sex in Monticello
The most common commute times in Monticello are 90 or more minutes (91 commuters, 21.6%) for males and 5 to 9 minutes (206 commuters, 38.7%) for females.
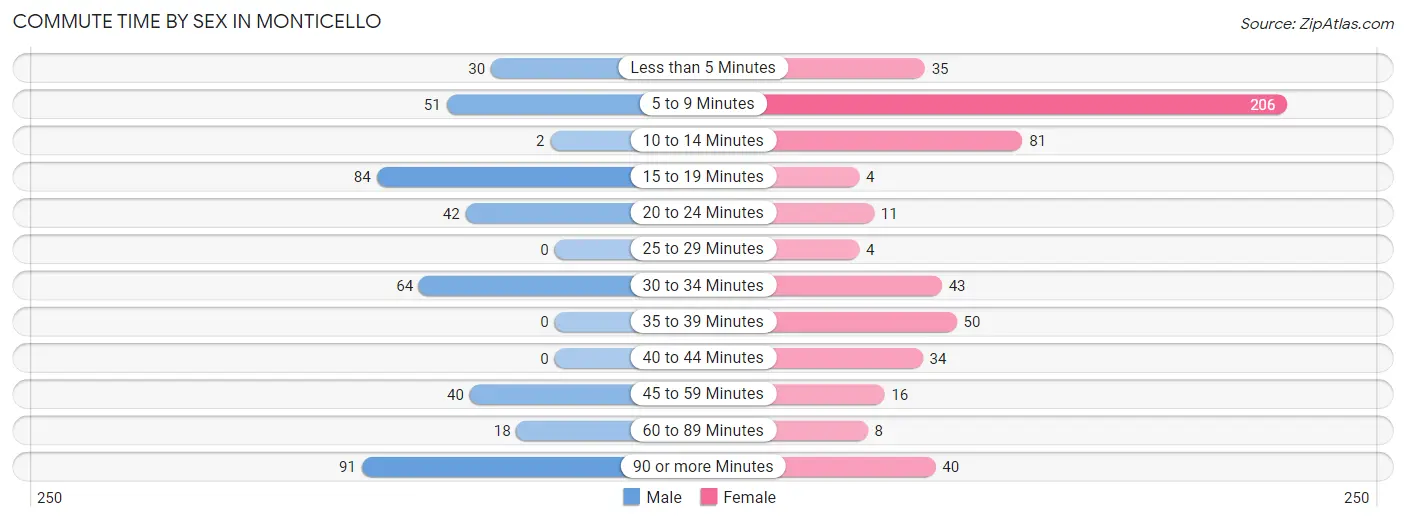
| Commute Time | Male | Female |
| Less than 5 Minutes | 30 (7.1%) | 35 (6.6%) |
| 5 to 9 Minutes | 51 (12.1%) | 206 (38.7%) |
| 10 to 14 Minutes | 2 (0.5%) | 81 (15.2%) |
| 15 to 19 Minutes | 84 (19.9%) | 4 (0.7%) |
| 20 to 24 Minutes | 42 (10.0%) | 11 (2.1%) |
| 25 to 29 Minutes | 0 (0.0%) | 4 (0.7%) |
| 30 to 34 Minutes | 64 (15.2%) | 43 (8.1%) |
| 35 to 39 Minutes | 0 (0.0%) | 50 (9.4%) |
| 40 to 44 Minutes | 0 (0.0%) | 34 (6.4%) |
| 45 to 59 Minutes | 40 (9.5%) | 16 (3.0%) |
| 60 to 89 Minutes | 18 (4.3%) | 8 (1.5%) |
| 90 or more Minutes | 91 (21.6%) | 40 (7.5%) |
Time of Departure to Work by Sex in Monticello
The most frequent times of departure to work in Monticello are 6:30 AM to 6:59 AM (105, 24.9%) for males and 6:30 AM to 6:59 AM (128, 24.1%) for females.
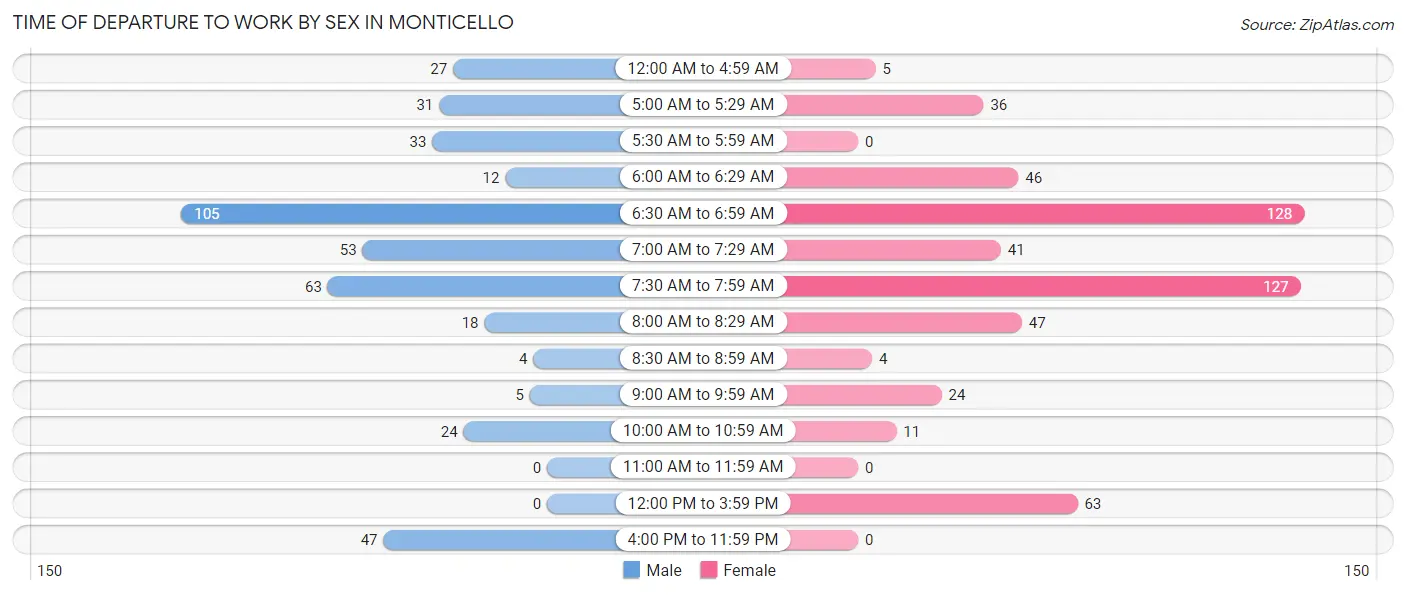
| Time of Departure | Male | Female |
| 12:00 AM to 4:59 AM | 27 (6.4%) | 5 (0.9%) |
| 5:00 AM to 5:29 AM | 31 (7.3%) | 36 (6.8%) |
| 5:30 AM to 5:59 AM | 33 (7.8%) | 0 (0.0%) |
| 6:00 AM to 6:29 AM | 12 (2.8%) | 46 (8.6%) |
| 6:30 AM to 6:59 AM | 105 (24.9%) | 128 (24.1%) |
| 7:00 AM to 7:29 AM | 53 (12.6%) | 41 (7.7%) |
| 7:30 AM to 7:59 AM | 63 (14.9%) | 127 (23.9%) |
| 8:00 AM to 8:29 AM | 18 (4.3%) | 47 (8.8%) |
| 8:30 AM to 8:59 AM | 4 (0.9%) | 4 (0.7%) |
| 9:00 AM to 9:59 AM | 5 (1.2%) | 24 (4.5%) |
| 10:00 AM to 10:59 AM | 24 (5.7%) | 11 (2.1%) |
| 11:00 AM to 11:59 AM | 0 (0.0%) | 0 (0.0%) |
| 12:00 PM to 3:59 PM | 0 (0.0%) | 63 (11.8%) |
| 4:00 PM to 11:59 PM | 47 (11.1%) | 0 (0.0%) |
| Total | 422 (100.0%) | 532 (100.0%) |
Housing Occupancy in Monticello
Occupancy by Ownership in Monticello
Of the total 1,041 dwellings in Monticello, owner-occupied units account for 578 (55.5%), while renter-occupied units make up 463 (44.5%).
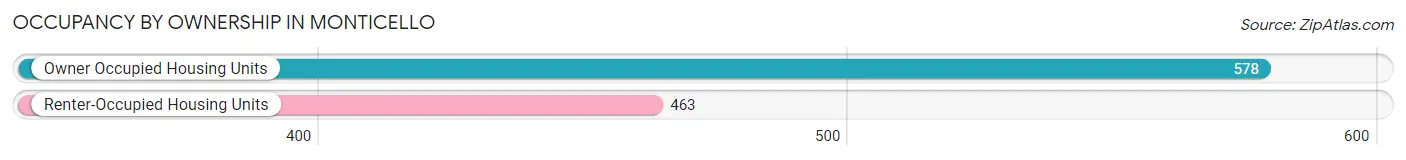
| Occupancy | # Housing Units | % Housing Units |
| Owner Occupied Housing Units | 578 | 55.5% |
| Renter-Occupied Housing Units | 463 | 44.5% |
| Total Occupied Housing Units | 1,041 | 100.0% |
Occupancy by Household Size in Monticello
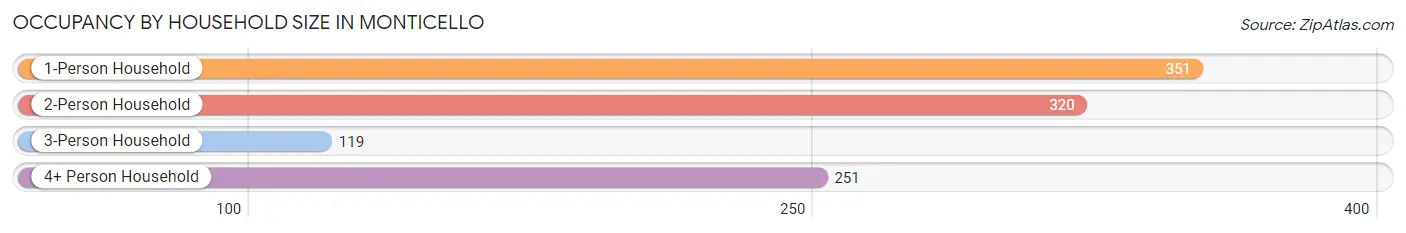
| Household Size | # Housing Units | % Housing Units |
| 1-Person Household | 351 | 33.7% |
| 2-Person Household | 320 | 30.7% |
| 3-Person Household | 119 | 11.4% |
| 4+ Person Household | 251 | 24.1% |
| Total Housing Units | 1,041 | 100.0% |
Occupancy by Ownership by Household Size in Monticello
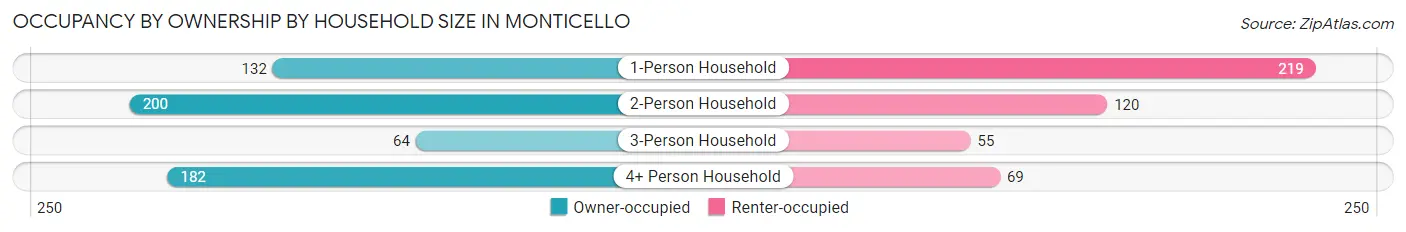
| Household Size | Owner-occupied | Renter-occupied |
| 1-Person Household | 132 (37.6%) | 219 (62.4%) |
| 2-Person Household | 200 (62.5%) | 120 (37.5%) |
| 3-Person Household | 64 (53.8%) | 55 (46.2%) |
| 4+ Person Household | 182 (72.5%) | 69 (27.5%) |
| Total Housing Units | 578 (55.5%) | 463 (44.5%) |
Occupancy by Educational Attainment in Monticello
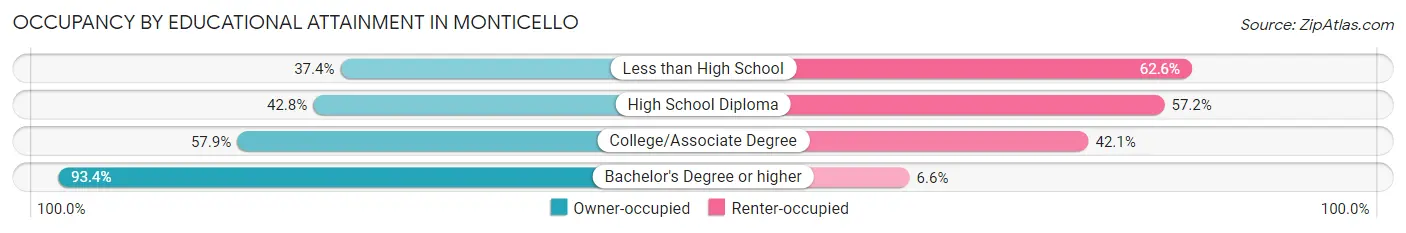
| Household Size | Owner-occupied | Renter-occupied |
| Less than High School | 61 (37.4%) | 102 (62.6%) |
| High School Diploma | 188 (42.8%) | 251 (57.2%) |
| College/Associate Degree | 132 (57.9%) | 96 (42.1%) |
| Bachelor's Degree or higher | 197 (93.4%) | 14 (6.6%) |
Occupancy by Age of Householder in Monticello
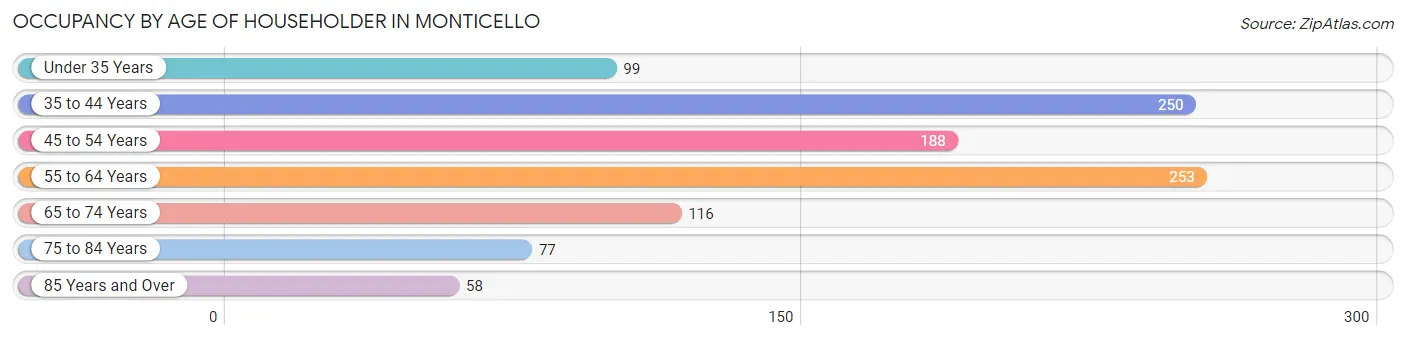
| Age Bracket | # Households | % Households |
| Under 35 Years | 99 | 9.5% |
| 35 to 44 Years | 250 | 24.0% |
| 45 to 54 Years | 188 | 18.1% |
| 55 to 64 Years | 253 | 24.3% |
| 65 to 74 Years | 116 | 11.1% |
| 75 to 84 Years | 77 | 7.4% |
| 85 Years and Over | 58 | 5.6% |
| Total | 1,041 | 100.0% |
Housing Finances in Monticello
Median Income by Occupancy in Monticello
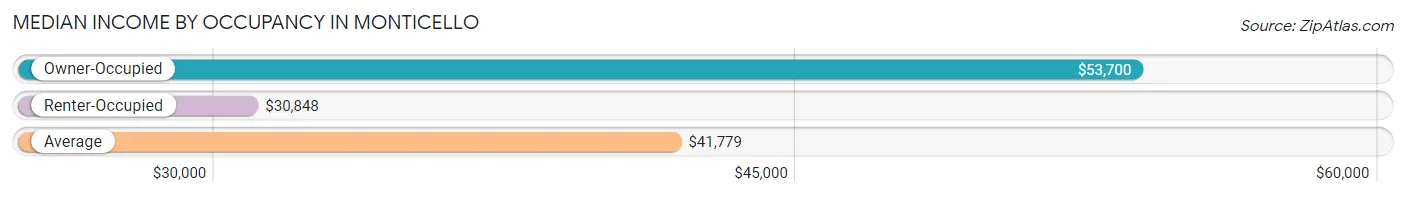
| Occupancy Type | # Households | Median Income |
| Owner-Occupied | 578 (55.5%) | $53,700 |
| Renter-Occupied | 463 (44.5%) | $30,848 |
| Average | 1,041 (100.0%) | $41,779 |
Occupancy by Householder Income Bracket in Monticello
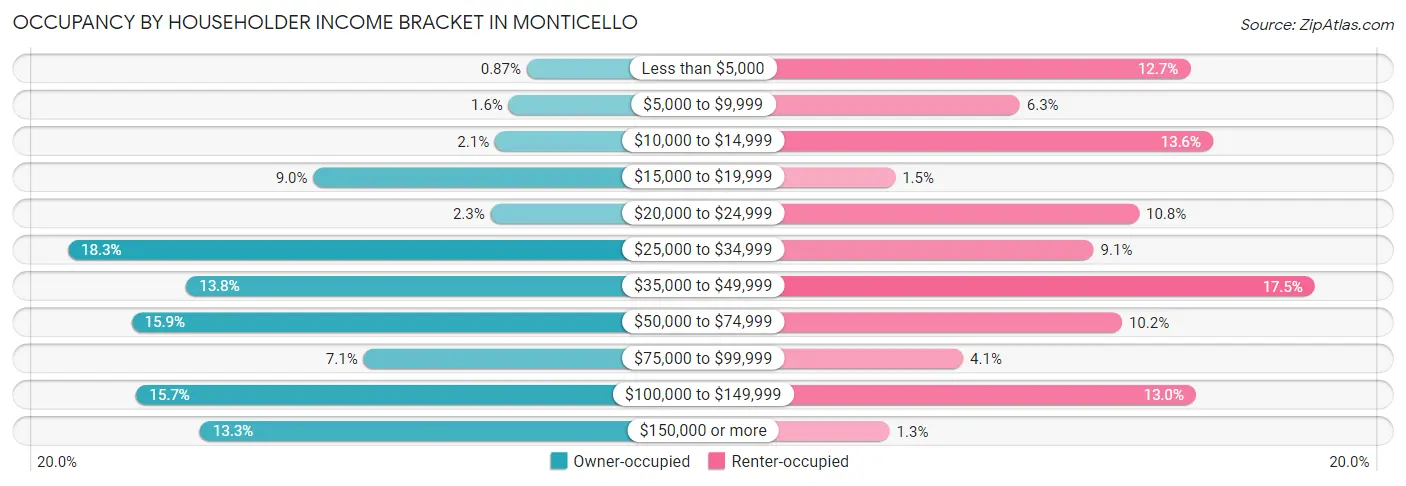
| Income Bracket | Owner-occupied | Renter-occupied |
| Less than $5,000 | 5 (0.9%) | 59 (12.7%) |
| $5,000 to $9,999 | 9 (1.6%) | 29 (6.3%) |
| $10,000 to $14,999 | 12 (2.1%) | 63 (13.6%) |
| $15,000 to $19,999 | 52 (9.0%) | 7 (1.5%) |
| $20,000 to $24,999 | 13 (2.2%) | 50 (10.8%) |
| $25,000 to $34,999 | 106 (18.3%) | 42 (9.1%) |
| $35,000 to $49,999 | 80 (13.8%) | 81 (17.5%) |
| $50,000 to $74,999 | 92 (15.9%) | 47 (10.2%) |
| $75,000 to $99,999 | 41 (7.1%) | 19 (4.1%) |
| $100,000 to $149,999 | 91 (15.7%) | 60 (13.0%) |
| $150,000 or more | 77 (13.3%) | 6 (1.3%) |
| Total | 578 (100.0%) | 463 (100.0%) |
Monthly Housing Cost Tiers in Monticello
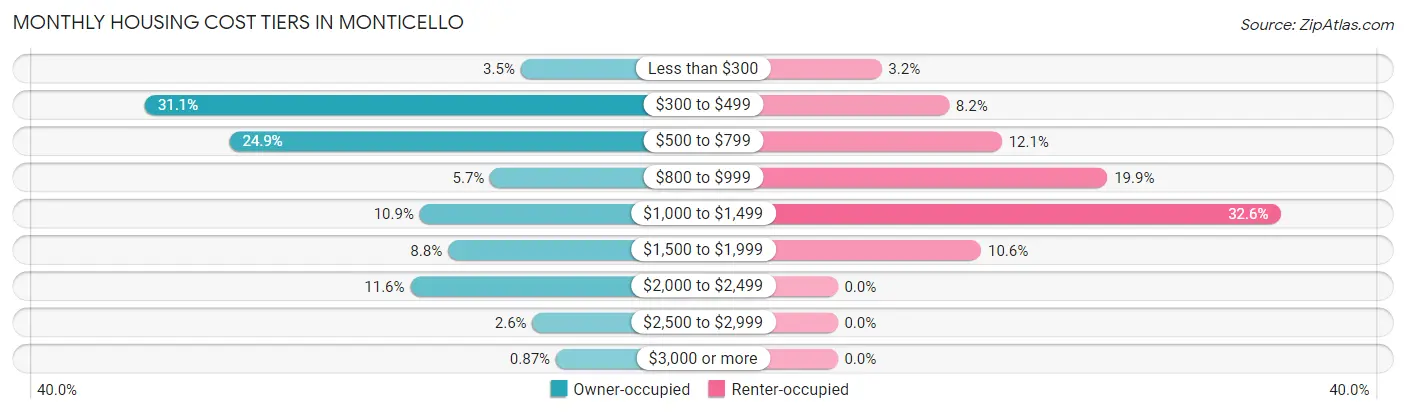
| Monthly Cost | Owner-occupied | Renter-occupied |
| Less than $300 | 20 (3.5%) | 15 (3.2%) |
| $300 to $499 | 180 (31.1%) | 38 (8.2%) |
| $500 to $799 | 144 (24.9%) | 56 (12.1%) |
| $800 to $999 | 33 (5.7%) | 92 (19.9%) |
| $1,000 to $1,499 | 63 (10.9%) | 151 (32.6%) |
| $1,500 to $1,999 | 51 (8.8%) | 49 (10.6%) |
| $2,000 to $2,499 | 67 (11.6%) | 0 (0.0%) |
| $2,500 to $2,999 | 15 (2.6%) | 0 (0.0%) |
| $3,000 or more | 5 (0.9%) | 0 (0.0%) |
| Total | 578 (100.0%) | 463 (100.0%) |
Physical Housing Characteristics in Monticello
Housing Structures in Monticello
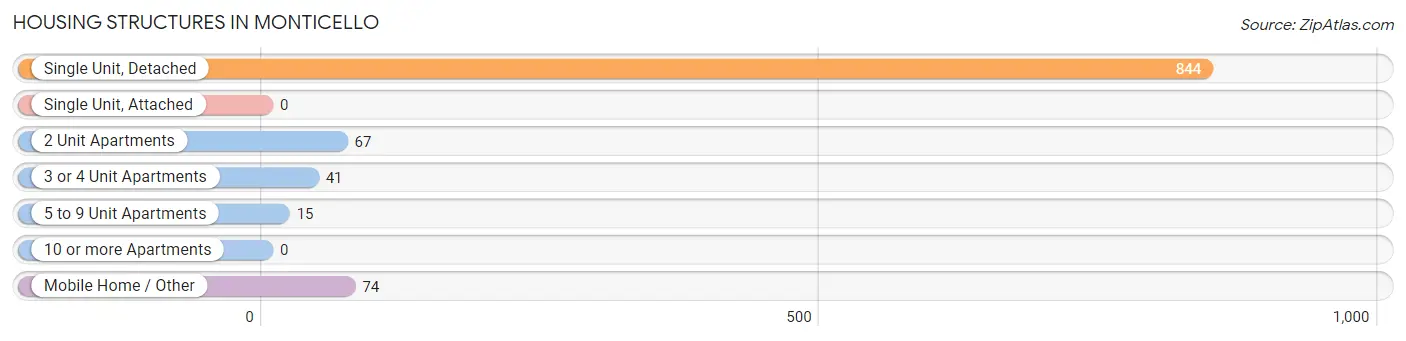
| Structure Type | # Housing Units | % Housing Units |
| Single Unit, Detached | 844 | 81.1% |
| Single Unit, Attached | 0 | 0.0% |
| 2 Unit Apartments | 67 | 6.4% |
| 3 or 4 Unit Apartments | 41 | 3.9% |
| 5 to 9 Unit Apartments | 15 | 1.4% |
| 10 or more Apartments | 0 | 0.0% |
| Mobile Home / Other | 74 | 7.1% |
| Total | 1,041 | 100.0% |
Housing Structures by Occupancy in Monticello
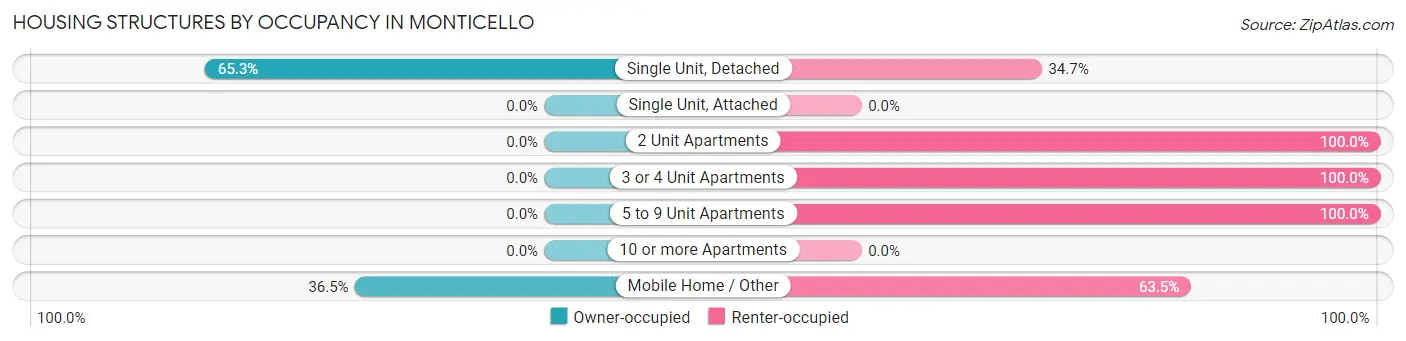
| Structure Type | Owner-occupied | Renter-occupied |
| Single Unit, Detached | 551 (65.3%) | 293 (34.7%) |
| Single Unit, Attached | 0 (0.0%) | 0 (0.0%) |
| 2 Unit Apartments | 0 (0.0%) | 67 (100.0%) |
| 3 or 4 Unit Apartments | 0 (0.0%) | 41 (100.0%) |
| 5 to 9 Unit Apartments | 0 (0.0%) | 15 (100.0%) |
| 10 or more Apartments | 0 (0.0%) | 0 (0.0%) |
| Mobile Home / Other | 27 (36.5%) | 47 (63.5%) |
| Total | 578 (55.5%) | 463 (44.5%) |
Housing Structures by Number of Rooms in Monticello
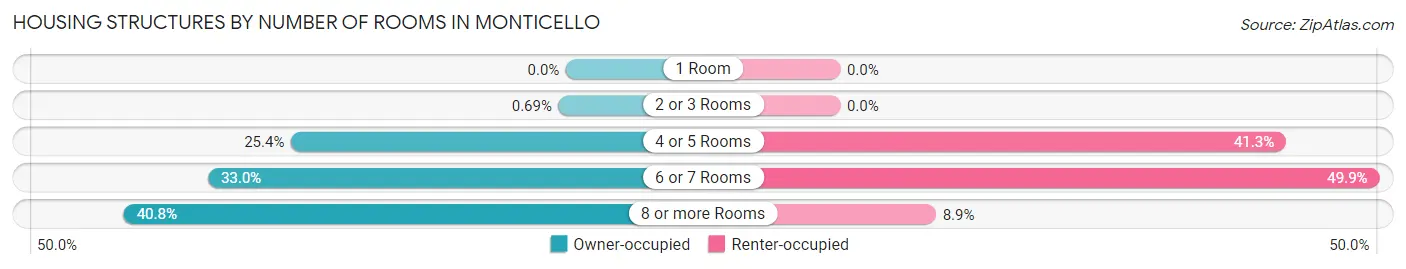
| Number of Rooms | Owner-occupied | Renter-occupied |
| 1 Room | 0 (0.0%) | 0 (0.0%) |
| 2 or 3 Rooms | 4 (0.7%) | 0 (0.0%) |
| 4 or 5 Rooms | 147 (25.4%) | 191 (41.2%) |
| 6 or 7 Rooms | 191 (33.0%) | 231 (49.9%) |
| 8 or more Rooms | 236 (40.8%) | 41 (8.9%) |
| Total | 578 (100.0%) | 463 (100.0%) |
Housing Structure by Heating Type in Monticello
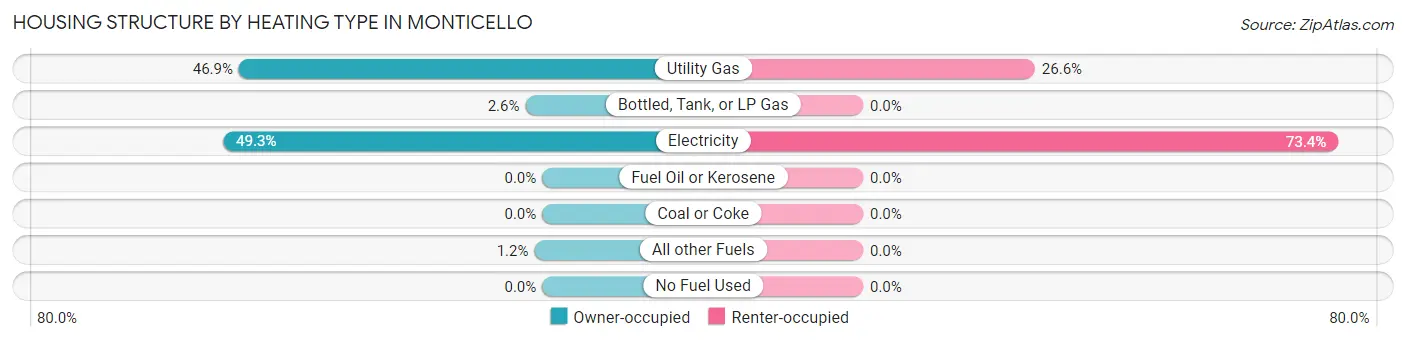
| Heating Type | Owner-occupied | Renter-occupied |
| Utility Gas | 271 (46.9%) | 123 (26.6%) |
| Bottled, Tank, or LP Gas | 15 (2.6%) | 0 (0.0%) |
| Electricity | 285 (49.3%) | 340 (73.4%) |
| Fuel Oil or Kerosene | 0 (0.0%) | 0 (0.0%) |
| Coal or Coke | 0 (0.0%) | 0 (0.0%) |
| All other Fuels | 7 (1.2%) | 0 (0.0%) |
| No Fuel Used | 0 (0.0%) | 0 (0.0%) |
| Total | 578 (100.0%) | 463 (100.0%) |
Household Vehicle Usage in Monticello
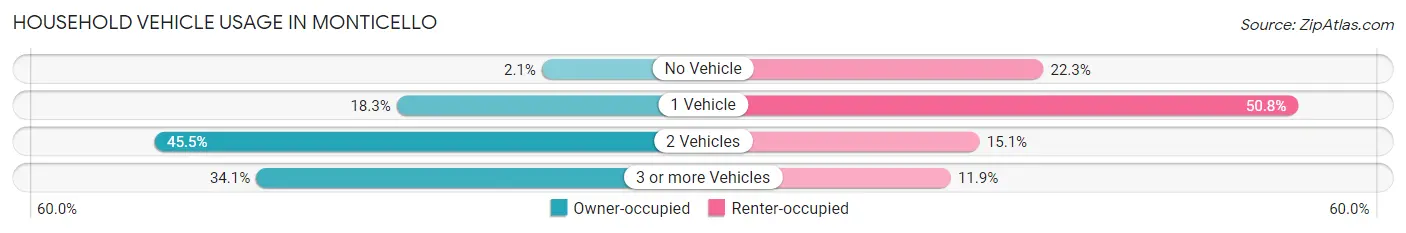
| Vehicles per Household | Owner-occupied | Renter-occupied |
| No Vehicle | 12 (2.1%) | 103 (22.3%) |
| 1 Vehicle | 106 (18.3%) | 235 (50.8%) |
| 2 Vehicles | 263 (45.5%) | 70 (15.1%) |
| 3 or more Vehicles | 197 (34.1%) | 55 (11.9%) |
| Total | 578 (100.0%) | 463 (100.0%) |
Real Estate & Mortgages in Monticello
Real Estate and Mortgage Overview in Monticello
| Characteristic | Without Mortgage | With Mortgage |
| Housing Units | 327 | 251 |
| Median Property Value | $148,000 | $187,500 |
| Median Household Income | $34,205 | $67 |
| Monthly Housing Costs | $470 | $5 |
| Real Estate Taxes | $1,507 | $9 |
Property Value by Mortgage Status in Monticello
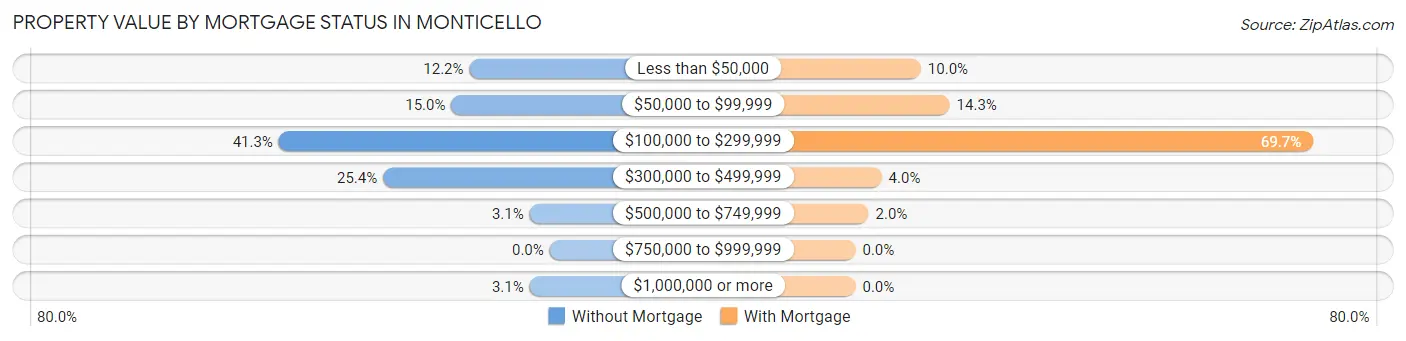
| Property Value | Without Mortgage | With Mortgage |
| Less than $50,000 | 40 (12.2%) | 25 (10.0%) |
| $50,000 to $99,999 | 49 (15.0%) | 36 (14.3%) |
| $100,000 to $299,999 | 135 (41.3%) | 175 (69.7%) |
| $300,000 to $499,999 | 83 (25.4%) | 10 (4.0%) |
| $500,000 to $749,999 | 10 (3.1%) | 5 (2.0%) |
| $750,000 to $999,999 | 0 (0.0%) | 0 (0.0%) |
| $1,000,000 or more | 10 (3.1%) | 0 (0.0%) |
| Total | 327 (100.0%) | 251 (100.0%) |
Household Income by Mortgage Status in Monticello
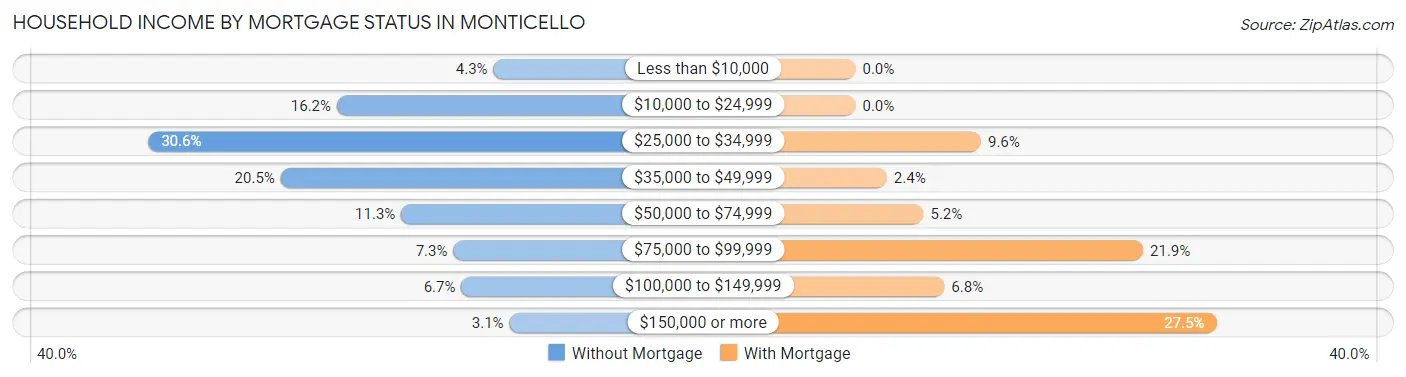
| Household Income | Without Mortgage | With Mortgage |
| Less than $10,000 | 14 (4.3%) | 0 (0.0%) |
| $10,000 to $24,999 | 53 (16.2%) | 0 (0.0%) |
| $25,000 to $34,999 | 100 (30.6%) | 24 (9.6%) |
| $35,000 to $49,999 | 67 (20.5%) | 6 (2.4%) |
| $50,000 to $74,999 | 37 (11.3%) | 13 (5.2%) |
| $75,000 to $99,999 | 24 (7.3%) | 55 (21.9%) |
| $100,000 to $149,999 | 22 (6.7%) | 17 (6.8%) |
| $150,000 or more | 10 (3.1%) | 69 (27.5%) |
| Total | 327 (100.0%) | 251 (100.0%) |
Property Value to Household Income Ratio in Monticello
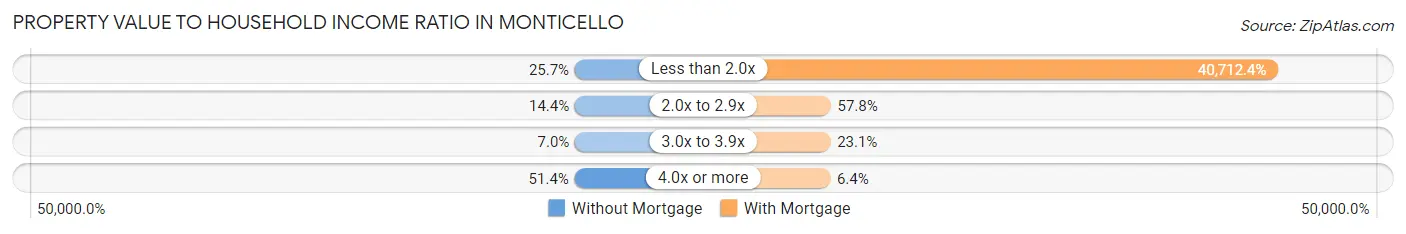
| Value-to-Income Ratio | Without Mortgage | With Mortgage |
| Less than 2.0x | 84 (25.7%) | 102,188 (40,712.3%) |
| 2.0x to 2.9x | 47 (14.4%) | 145 (57.8%) |
| 3.0x to 3.9x | 23 (7.0%) | 58 (23.1%) |
| 4.0x or more | 168 (51.4%) | 16 (6.4%) |
| Total | 327 (100.0%) | 251 (100.0%) |
Real Estate Taxes by Mortgage Status in Monticello
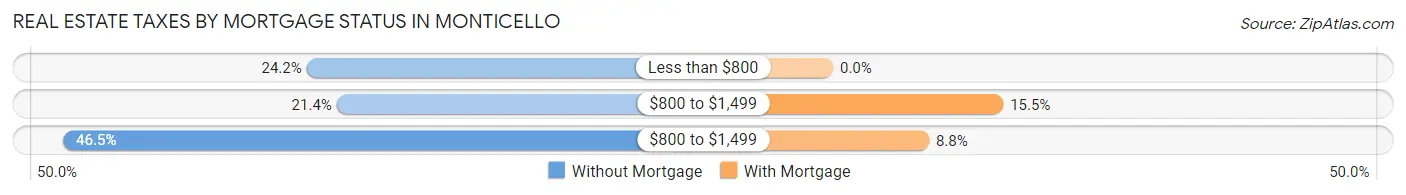
| Property Taxes | Without Mortgage | With Mortgage |
| Less than $800 | 79 (24.2%) | 0 (0.0%) |
| $800 to $1,499 | 70 (21.4%) | 39 (15.5%) |
| $800 to $1,499 | 152 (46.5%) | 22 (8.8%) |
| Total | 327 (100.0%) | 251 (100.0%) |
Health & Disability in Monticello
Health Insurance Coverage by Age in Monticello
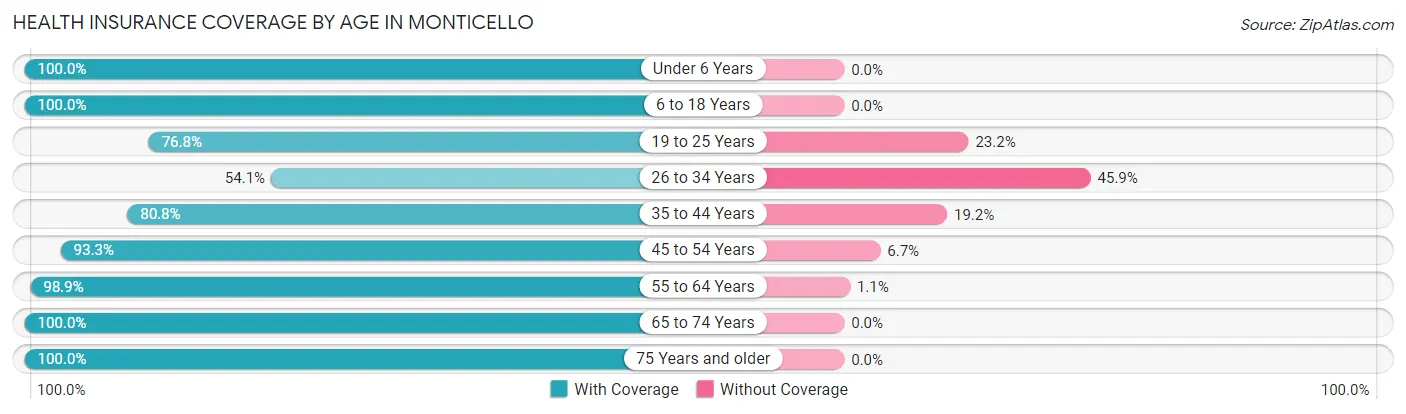
| Age Bracket | With Coverage | Without Coverage |
| Under 6 Years | 112 (100.0%) | 0 (0.0%) |
| 6 to 18 Years | 551 (100.0%) | 0 (0.0%) |
| 19 to 25 Years | 136 (76.8%) | 41 (23.2%) |
| 26 to 34 Years | 113 (54.1%) | 96 (45.9%) |
| 35 to 44 Years | 270 (80.8%) | 64 (19.2%) |
| 45 to 54 Years | 347 (93.3%) | 25 (6.7%) |
| 55 to 64 Years | 373 (98.9%) | 4 (1.1%) |
| 65 to 74 Years | 220 (100.0%) | 0 (0.0%) |
| 75 Years and older | 184 (100.0%) | 0 (0.0%) |
| Total | 2,306 (90.9%) | 230 (9.1%) |
Health Insurance Coverage by Citizenship Status in Monticello
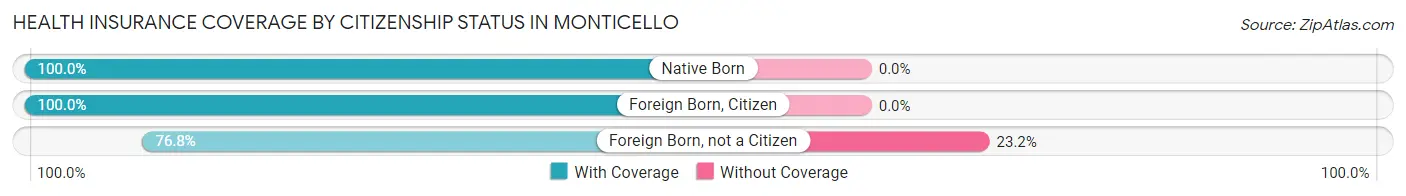
| Citizenship Status | With Coverage | Without Coverage |
| Native Born | 112 (100.0%) | 0 (0.0%) |
| Foreign Born, Citizen | 551 (100.0%) | 0 (0.0%) |
| Foreign Born, not a Citizen | 136 (76.8%) | 41 (23.2%) |
Health Insurance Coverage by Household Income in Monticello
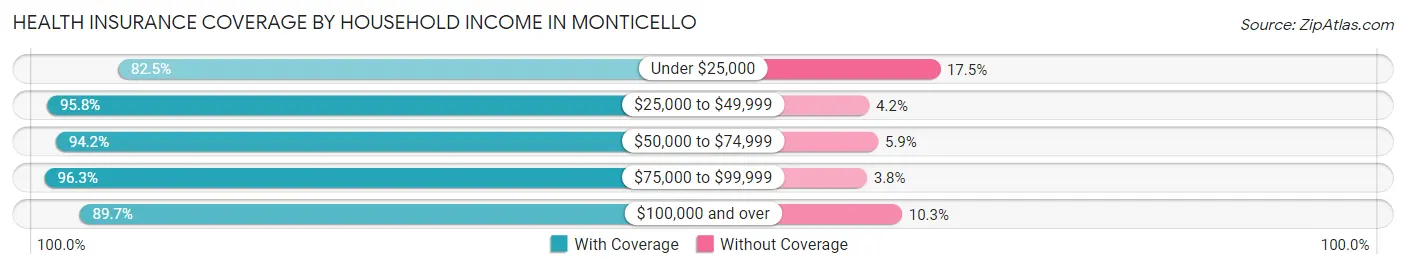
| Household Income | With Coverage | Without Coverage |
| Under $25,000 | 416 (82.5%) | 88 (17.5%) |
| $25,000 to $49,999 | 641 (95.8%) | 28 (4.2%) |
| $50,000 to $74,999 | 338 (94.2%) | 21 (5.9%) |
| $75,000 to $99,999 | 154 (96.3%) | 6 (3.7%) |
| $100,000 and over | 757 (89.7%) | 87 (10.3%) |
Public vs Private Health Insurance Coverage by Age in Monticello
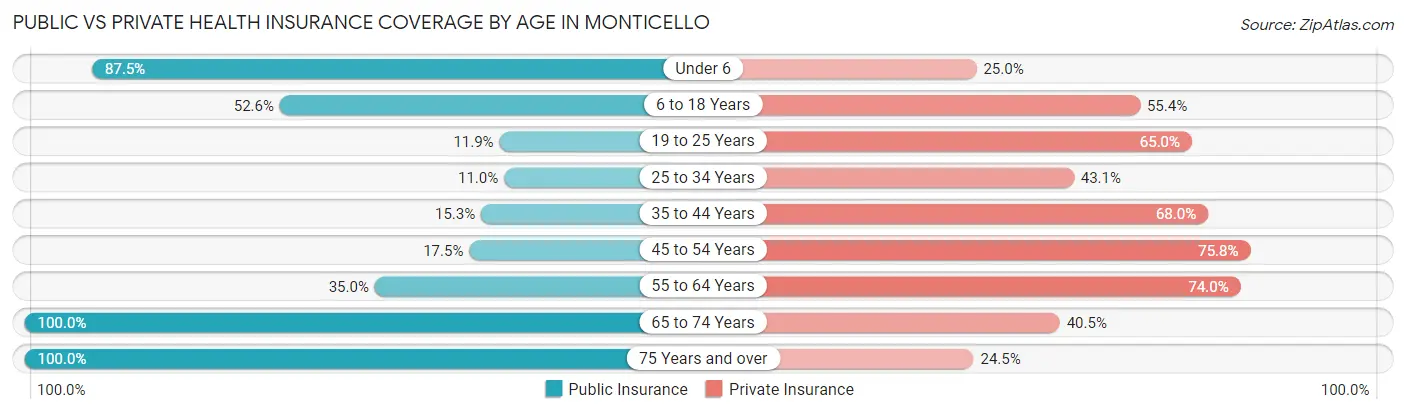
| Age Bracket | Public Insurance | Private Insurance |
| Under 6 | 98 (87.5%) | 28 (25.0%) |
| 6 to 18 Years | 290 (52.6%) | 305 (55.3%) |
| 19 to 25 Years | 21 (11.9%) | 115 (65.0%) |
| 25 to 34 Years | 23 (11.0%) | 90 (43.1%) |
| 35 to 44 Years | 51 (15.3%) | 227 (68.0%) |
| 45 to 54 Years | 65 (17.5%) | 282 (75.8%) |
| 55 to 64 Years | 132 (35.0%) | 279 (74.0%) |
| 65 to 74 Years | 220 (100.0%) | 89 (40.5%) |
| 75 Years and over | 184 (100.0%) | 45 (24.5%) |
| Total | 1,084 (42.7%) | 1,460 (57.6%) |
Disability Status by Sex by Age in Monticello
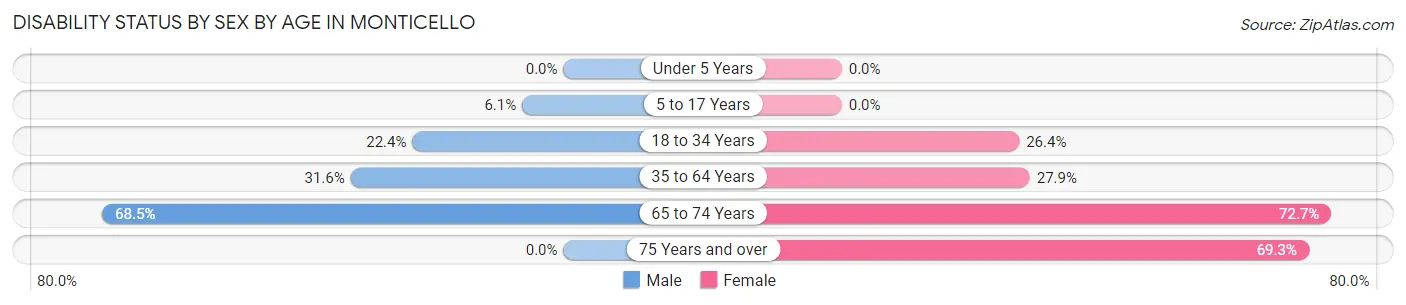
| Age Bracket | Male | Female |
| Under 5 Years | 0 (0.0%) | 0 (0.0%) |
| 5 to 17 Years | 13 (6.1%) | 0 (0.0%) |
| 18 to 34 Years | 72 (22.4%) | 44 (26.4%) |
| 35 to 64 Years | 134 (31.6%) | 184 (27.9%) |
| 65 to 74 Years | 63 (68.5%) | 93 (72.7%) |
| 75 Years and over | 0 (0.0%) | 113 (69.3%) |
Disability Class by Sex by Age in Monticello
Disability Class: Hearing Difficulty
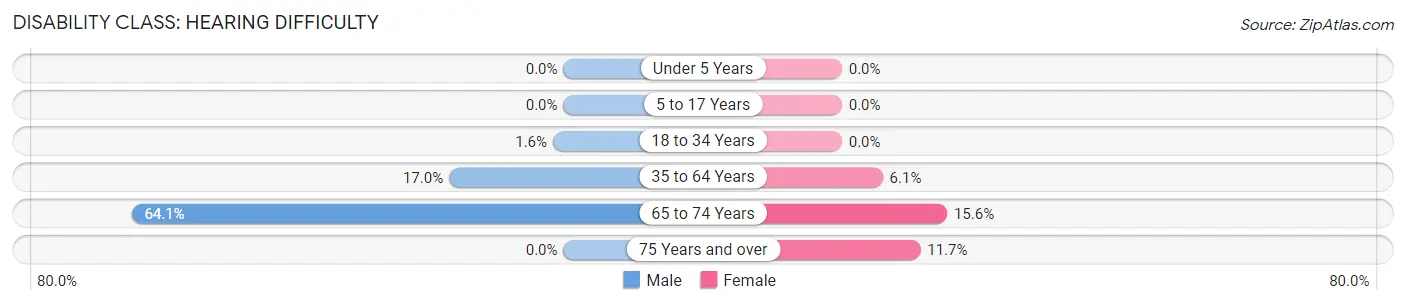
| Age Bracket | Male | Female |
| Under 5 Years | 0 (0.0%) | 0 (0.0%) |
| 5 to 17 Years | 0 (0.0%) | 0 (0.0%) |
| 18 to 34 Years | 5 (1.6%) | 0 (0.0%) |
| 35 to 64 Years | 72 (17.0%) | 40 (6.1%) |
| 65 to 74 Years | 59 (64.1%) | 20 (15.6%) |
| 75 Years and over | 0 (0.0%) | 19 (11.7%) |
Disability Class: Vision Difficulty
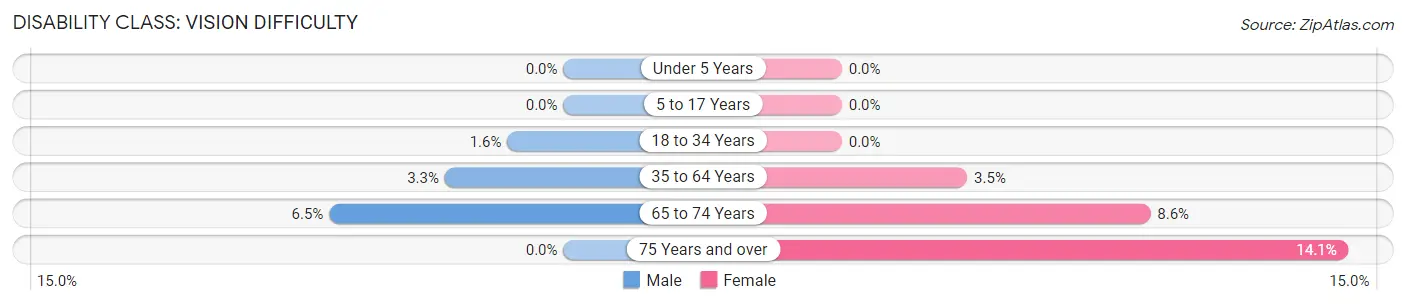
| Age Bracket | Male | Female |
| Under 5 Years | 0 (0.0%) | 0 (0.0%) |
| 5 to 17 Years | 0 (0.0%) | 0 (0.0%) |
| 18 to 34 Years | 5 (1.6%) | 0 (0.0%) |
| 35 to 64 Years | 14 (3.3%) | 23 (3.5%) |
| 65 to 74 Years | 6 (6.5%) | 11 (8.6%) |
| 75 Years and over | 0 (0.0%) | 23 (14.1%) |
Disability Class: Cognitive Difficulty
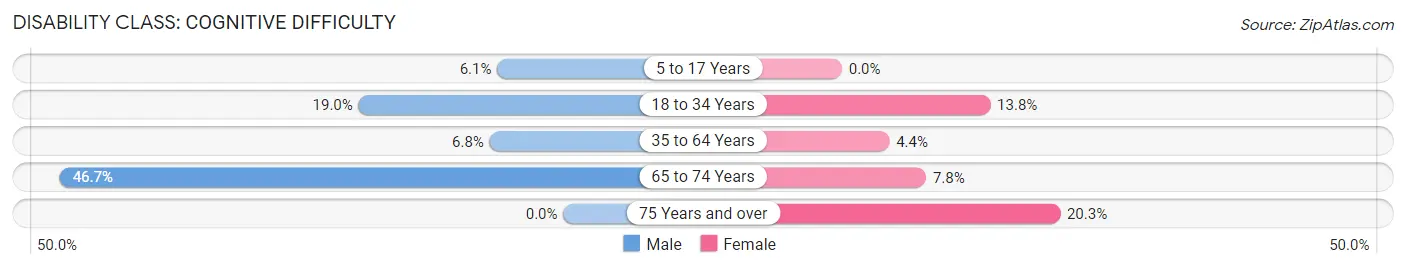
| Age Bracket | Male | Female |
| 5 to 17 Years | 13 (6.1%) | 0 (0.0%) |
| 18 to 34 Years | 61 (19.0%) | 23 (13.8%) |
| 35 to 64 Years | 29 (6.8%) | 29 (4.4%) |
| 65 to 74 Years | 43 (46.7%) | 10 (7.8%) |
| 75 Years and over | 0 (0.0%) | 33 (20.3%) |
Disability Class: Ambulatory Difficulty
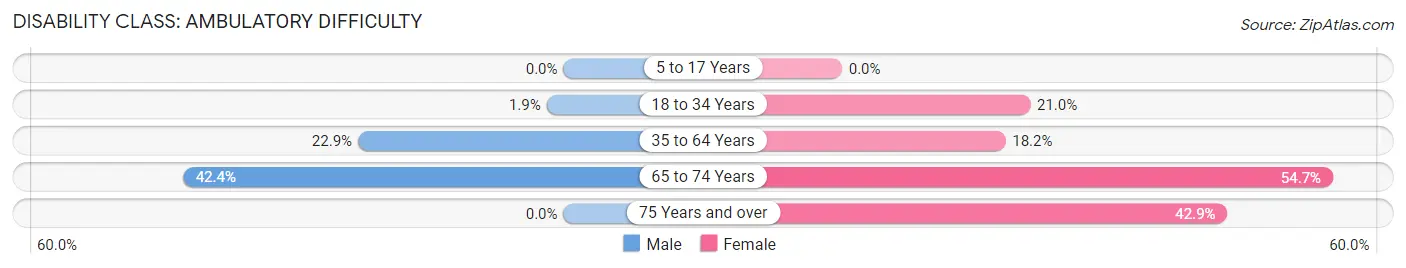
| Age Bracket | Male | Female |
| 5 to 17 Years | 0 (0.0%) | 0 (0.0%) |
| 18 to 34 Years | 6 (1.9%) | 35 (21.0%) |
| 35 to 64 Years | 97 (22.9%) | 120 (18.2%) |
| 65 to 74 Years | 39 (42.4%) | 70 (54.7%) |
| 75 Years and over | 0 (0.0%) | 70 (42.9%) |
Disability Class: Self-Care Difficulty
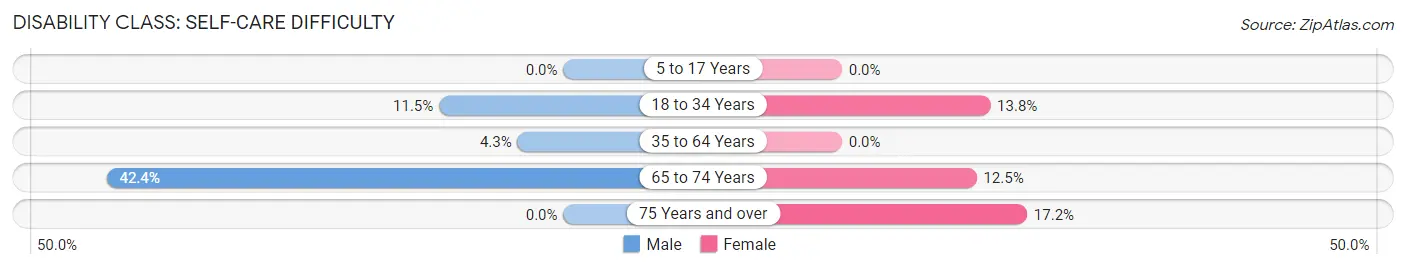
| Age Bracket | Male | Female |
| 5 to 17 Years | 0 (0.0%) | 0 (0.0%) |
| 18 to 34 Years | 37 (11.5%) | 23 (13.8%) |
| 35 to 64 Years | 18 (4.3%) | 0 (0.0%) |
| 65 to 74 Years | 39 (42.4%) | 16 (12.5%) |
| 75 Years and over | 0 (0.0%) | 28 (17.2%) |
Technology Access in Monticello
Computing Device Access in Monticello
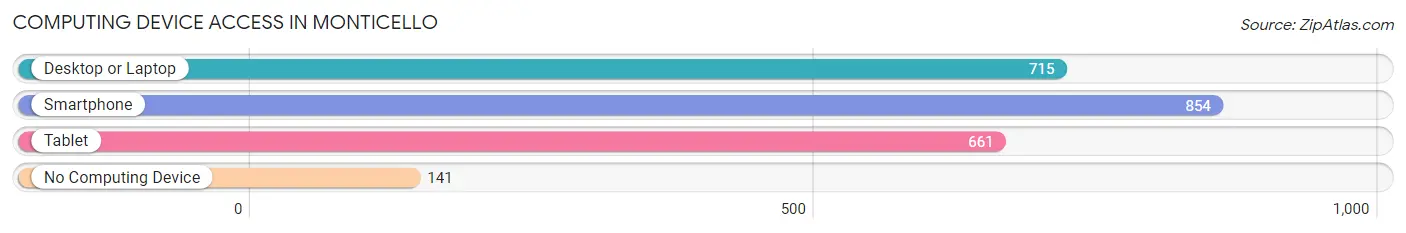
| Device Type | # Households | % Households |
| Desktop or Laptop | 715 | 68.7% |
| Smartphone | 854 | 82.0% |
| Tablet | 661 | 63.5% |
| No Computing Device | 141 | 13.5% |
| Total | 1,041 | 100.0% |
Internet Access in Monticello
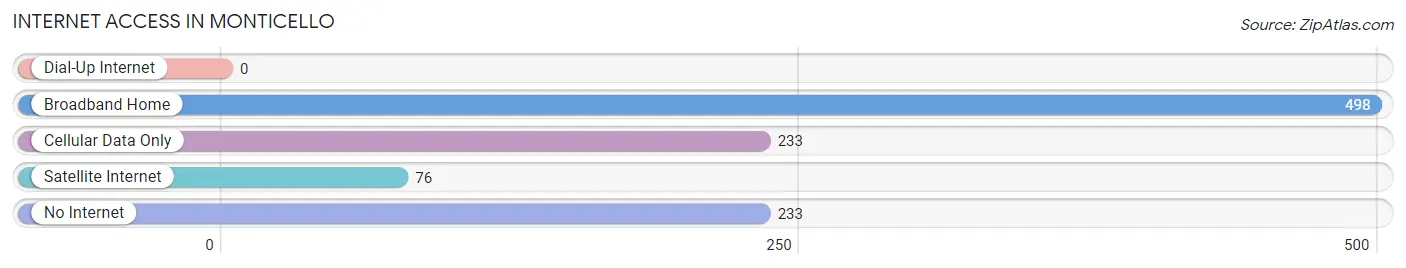
| Internet Type | # Households | % Households |
| Dial-Up Internet | 0 | 0.0% |
| Broadband Home | 498 | 47.8% |
| Cellular Data Only | 233 | 22.4% |
| Satellite Internet | 76 | 7.3% |
| No Internet | 233 | 22.4% |
| Total | 1,041 | 100.0% |
Monticello Summary
Monticello, Georgia is a small city located in Jasper County, Georgia, United States. It is the county seat of Jasper County and is located about 60 miles southeast of Atlanta. The city has a population of 2,945 as of the 2010 census.
History
Monticello was founded in 1809 and was named after Thomas Jefferson's home in Virginia. The city was incorporated in 1810 and was the county seat of Jasper County. The city was a major trading center for the surrounding area and was known for its cotton production.
In the late 19th century, Monticello was a major stop on the Central of Georgia Railway. The city was also home to a number of manufacturing plants, including a cotton mill, a sawmill, and a gristmill.
In the early 20th century, Monticello was a popular tourist destination. The city was home to a number of resorts, including the Monticello Hotel, which was built in 1906. The hotel was a popular destination for wealthy Atlantans and was known for its luxurious amenities.
Geography
Monticello is located in Jasper County, Georgia, United States. The city is situated at the intersection of U.S. Route 19 and Georgia State Route 11. The city is located about 60 miles southeast of Atlanta.
The city has a total area of 4.2 square miles, all of which is land. The city is located in the Piedmont region of Georgia and is surrounded by rolling hills and forests. The city is located near the Ocmulgee River, which flows through the city.
Economy
Monticello's economy is largely based on agriculture and manufacturing. The city is home to a number of manufacturing plants, including a cotton mill, a sawmill, and a gristmill. The city is also home to a number of agricultural businesses, including a poultry processing plant and a number of farms.
The city is also home to a number of retail businesses, including a number of antique stores and specialty shops. The city is also home to a number of restaurants and bars.
Demographics
As of the 2010 census, Monticello had a population of 2,945. The racial makeup of the city was 79.3% White, 17.2% African American, 0.3% Native American, 0.7% Asian, 0.1% Pacific Islander, 1.2% from other races, and 1.4% from two or more races. Hispanic or Latino of any race were 3.2% of the population.
The median income for a household in the city was $30,938, and the median income for a family was $37,917. The per capita income for the city was $17,845. About 17.2% of families and 20.2% of the population were below the poverty line, including 28.3% of those under age 18 and 15.2% of those age 65 or over.
Common Questions
What is Per Capita Income in Monticello?
Per Capita income in Monticello is $32,681.
What is the Median Family Income in Monticello?
Median Family Income in Monticello is $52,695.
What is the Median Household income in Monticello?
Median Household Income in Monticello is $41,779.
What is Income or Wage Gap in Monticello?
Income or Wage Gap in Monticello is 18.2%.
Women in Monticello earn 81.8 cents for every dollar earned by a man.
What is Inequality or Gini Index in Monticello?
Inequality or Gini Index in Monticello is 0.59.
What is the Total Population of Monticello?
Total Population of Monticello is 2,593.
What is the Total Male Population of Monticello?
Total Male Population of Monticello is 1,136.
What is the Total Female Population of Monticello?
Total Female Population of Monticello is 1,457.
What is the Ratio of Males per 100 Females in Monticello?
There are 77.97 Males per 100 Females in Monticello.
What is the Ratio of Females per 100 Males in Monticello?
There are 128.26 Females per 100 Males in Monticello.
What is the Median Population Age in Monticello?
Median Population Age in Monticello is 43.8 Years.
What is the Average Family Size in Monticello
Average Family Size in Monticello is 3.0 People.
What is the Average Household Size in Monticello
Average Household Size in Monticello is 2.4 People.
How Large is the Labor Force in Monticello?
There are 1,231 People in the Labor Forcein in Monticello.
What is the Percentage of People in the Labor Force in Monticello?
56.9% of People are in the Labor Force in Monticello.
What is the Unemployment Rate in Monticello?
Unemployment Rate in Monticello is 5.8%.