Menlo, GA Map & Demographics
Menlo Map
Menlo Overview
$26,553
PER CAPITA INCOME
$77,500
AVG FAMILY INCOME
$33,589
AVG HOUSEHOLD INCOME
57.4%
WAGE / INCOME GAP [ % ]
42.6¢/ $1
WAGE / INCOME GAP [ $ ]
0.42
INEQUALITY / GINI INDEX
469
TOTAL POPULATION
192
MALE POPULATION
277
FEMALE POPULATION
69.31
MALES / 100 FEMALES
144.27
FEMALES / 100 MALES
35.8
MEDIAN AGE
3.2
AVG FAMILY SIZE
2.0
AVG HOUSEHOLD SIZE
260
LABOR FORCE [ PEOPLE ]
66.8%
PERCENT IN LABOR FORCE
4.6%
UNEMPLOYMENT RATE
Menlo Zip Codes
Menlo Area Codes
Income in Menlo
Income Overview in Menlo
Per Capita Income in Menlo is $26,553, while median incomes of families and households are $77,500 and $33,589 respectively.
| Characteristic | Number | Measure |
| Per Capita Income | 469 | $26,553 |
| Median Family Income | 98 | $77,500 |
| Mean Family Income | 98 | $73,860 |
| Median Household Income | 229 | $33,589 |
| Mean Household Income | 229 | $51,449 |
| Income Deficit | 98 | $0 |
| Wage / Income Gap (%) | 469 | 57.42% |
| Wage / Income Gap ($) | 469 | 42.58¢ per $1 |
| Gini / Inequality Index | 469 | 0.42 |
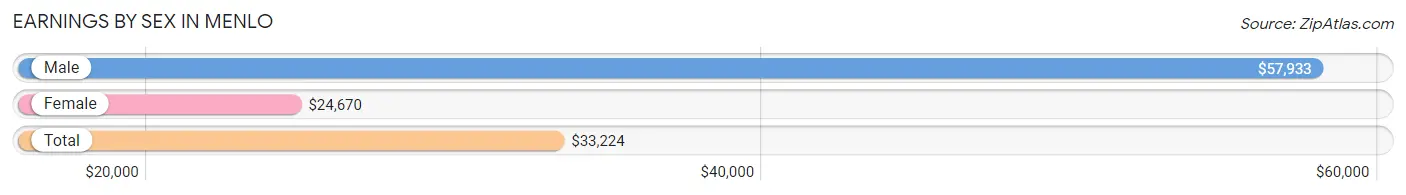
Earnings by Sex in Menlo
Average Earnings in Menlo are $33,224, $57,933 for men and $24,670 for women, a difference of 57.4%.
| Sex | Number | Average Earnings |
| Male | 125 (47.2%) | $57,933 |
| Female | 140 (52.8%) | $24,670 |
| Total | 265 (100.0%) | $33,224 |
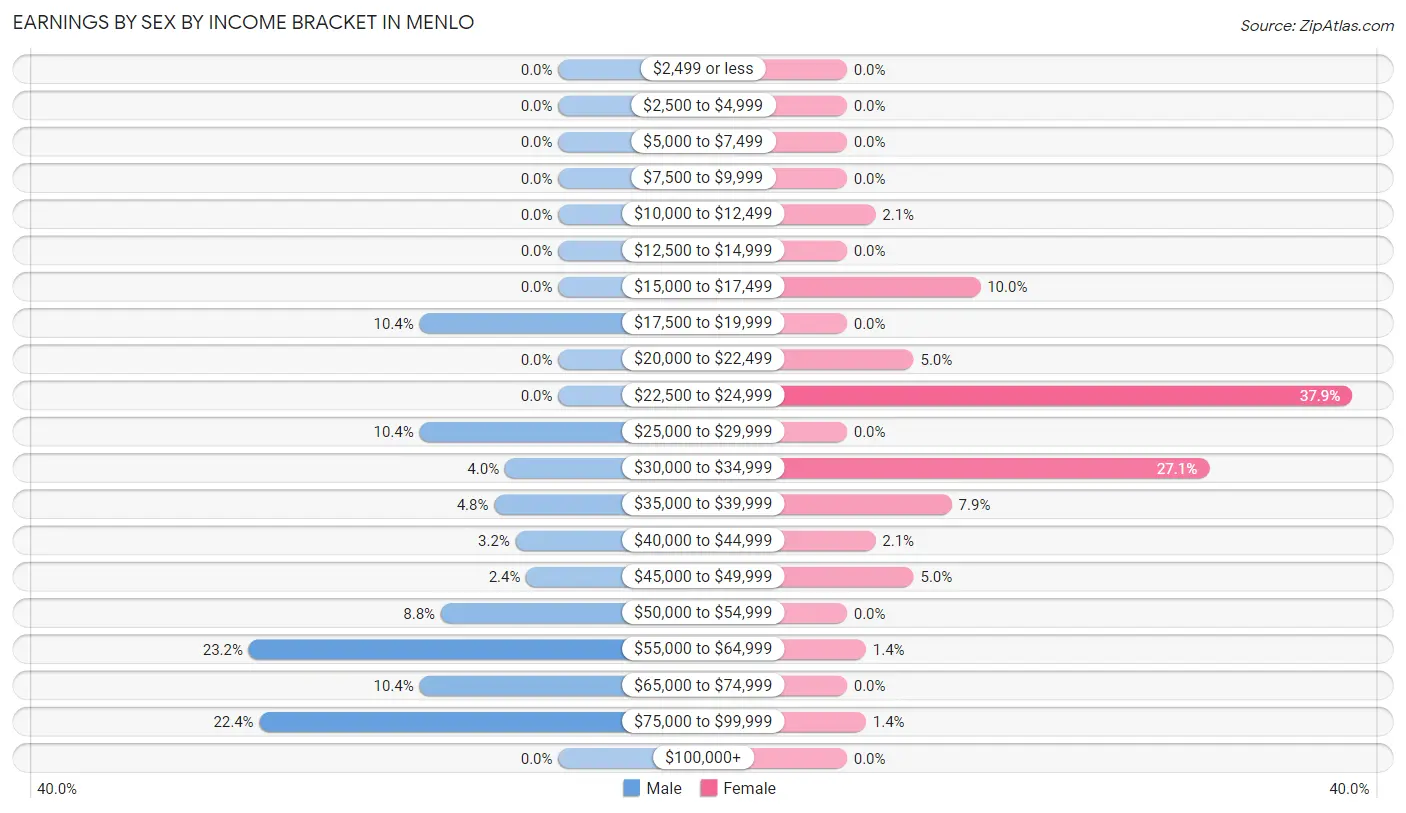
Earnings by Sex by Income Bracket in Menlo
The most common earnings brackets in Menlo are $55,000 to $64,999 for men (29 | 23.2%) and $22,500 to $24,999 for women (53 | 37.9%).
| Income | Male | Female |
| $2,499 or less | 0 (0.0%) | 0 (0.0%) |
| $2,500 to $4,999 | 0 (0.0%) | 0 (0.0%) |
| $5,000 to $7,499 | 0 (0.0%) | 0 (0.0%) |
| $7,500 to $9,999 | 0 (0.0%) | 0 (0.0%) |
| $10,000 to $12,499 | 0 (0.0%) | 3 (2.1%) |
| $12,500 to $14,999 | 0 (0.0%) | 0 (0.0%) |
| $15,000 to $17,499 | 0 (0.0%) | 14 (10.0%) |
| $17,500 to $19,999 | 13 (10.4%) | 0 (0.0%) |
| $20,000 to $22,499 | 0 (0.0%) | 7 (5.0%) |
| $22,500 to $24,999 | 0 (0.0%) | 53 (37.9%) |
| $25,000 to $29,999 | 13 (10.4%) | 0 (0.0%) |
| $30,000 to $34,999 | 5 (4.0%) | 38 (27.1%) |
| $35,000 to $39,999 | 6 (4.8%) | 11 (7.9%) |
| $40,000 to $44,999 | 4 (3.2%) | 3 (2.1%) |
| $45,000 to $49,999 | 3 (2.4%) | 7 (5.0%) |
| $50,000 to $54,999 | 11 (8.8%) | 0 (0.0%) |
| $55,000 to $64,999 | 29 (23.2%) | 2 (1.4%) |
| $65,000 to $74,999 | 13 (10.4%) | 0 (0.0%) |
| $75,000 to $99,999 | 28 (22.4%) | 2 (1.4%) |
| $100,000+ | 0 (0.0%) | 0 (0.0%) |
| Total | 125 (100.0%) | 140 (100.0%) |
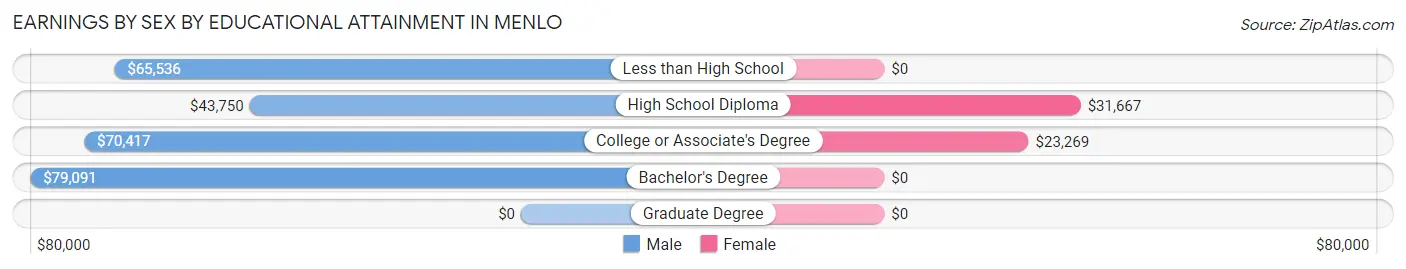
Earnings by Sex by Educational Attainment in Menlo
Average earnings in Menlo are $58,214 for men and $24,670 for women, a difference of 57.6%. Men with an educational attainment of bachelor's degree enjoy the highest average annual earnings of $79,091, while those with high school diploma education earn the least with $43,750. Women with an educational attainment of high school diploma earn the most with the average annual earnings of $31,667, while those with college or associate's degree education have the smallest earnings of $23,269.
| Educational Attainment | Male Income | Female Income |
| Less than High School | $65,536 | $0 |
| High School Diploma | $43,750 | $31,667 |
| College or Associate's Degree | $70,417 | $23,269 |
| Bachelor's Degree | $79,091 | $0 |
| Graduate Degree | - | - |
| Total | $58,214 | $24,670 |
Family Income in Menlo
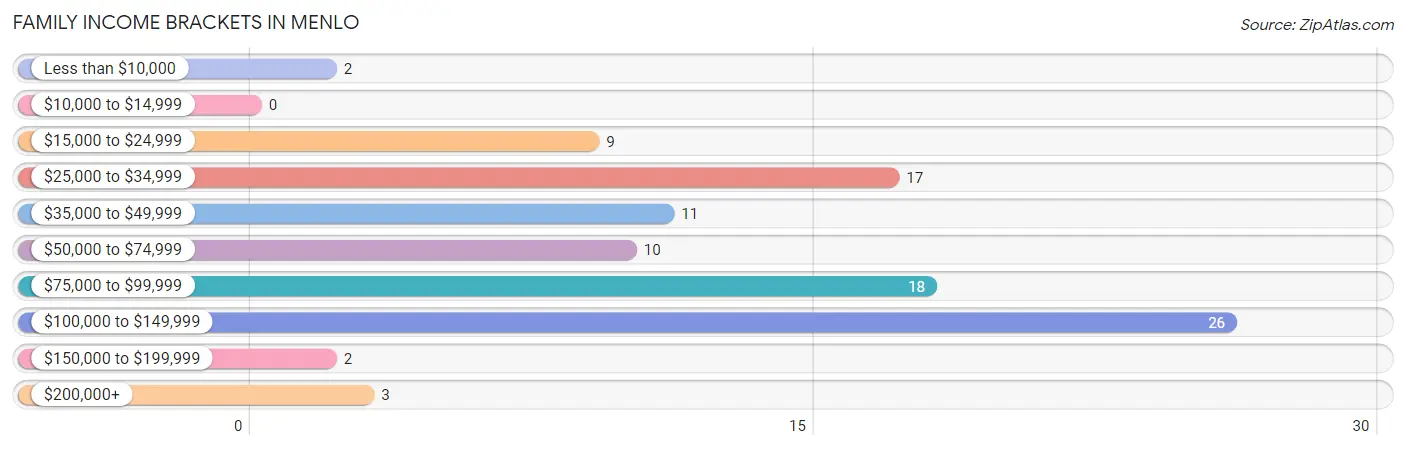
Family Income Brackets in Menlo
According to the Menlo family income data, there are 26 families falling into the $100,000 to $149,999 income range, which is the most common income bracket and makes up 26.5% of all families.
| Income Bracket | # Families | % Families |
| Less than $10,000 | 2 | 2.0% |
| $10,000 to $14,999 | 0 | 0.0% |
| $15,000 to $24,999 | 9 | 9.2% |
| $25,000 to $34,999 | 17 | 17.3% |
| $35,000 to $49,999 | 11 | 11.2% |
| $50,000 to $74,999 | 10 | 10.2% |
| $75,000 to $99,999 | 18 | 18.4% |
| $100,000 to $149,999 | 26 | 26.5% |
| $150,000 to $199,999 | 2 | 2.0% |
| $200,000+ | 3 | 3.1% |
Family Income by Famaliy Size in Menlo
| Income Bracket | # Families | Median Income |
| 2-Person Families | 33 (33.7%) | $0 |
| 3-Person Families | 29 (29.6%) | $0 |
| 4-Person Families | 15 (15.3%) | $0 |
| 5-Person Families | 15 (15.3%) | $0 |
| 6-Person Families | 3 (3.1%) | $0 |
| 7+ Person Families | 3 (3.1%) | $0 |
| Total | 98 (100.0%) | $77,500 |
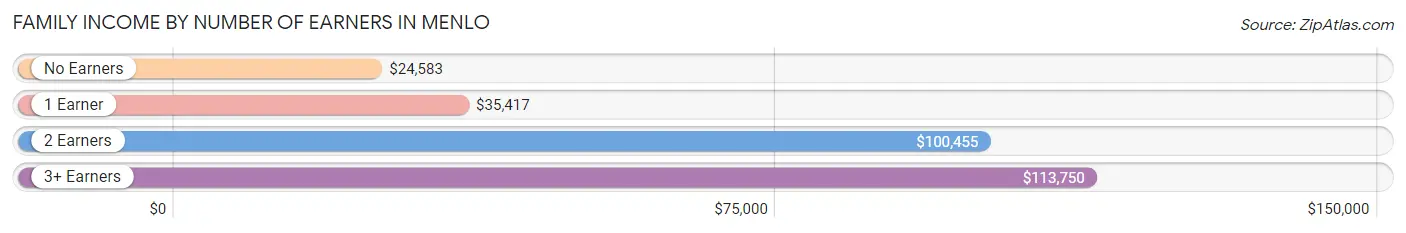
Family Income by Number of Earners in Menlo
The median family income in Menlo is $77,500, with families comprising 3+ earners (8) having the highest median family income of $113,750, while families with no earners (19) have the lowest median family income of $24,583, accounting for 8.2% and 19.4% of families, respectively.
| Number of Earners | # Families | Median Income |
| No Earners | 19 (19.4%) | $24,583 |
| 1 Earner | 23 (23.5%) | $35,417 |
| 2 Earners | 48 (49.0%) | $100,455 |
| 3+ Earners | 8 (8.2%) | $113,750 |
| Total | 98 (100.0%) | $77,500 |
Household Income in Menlo
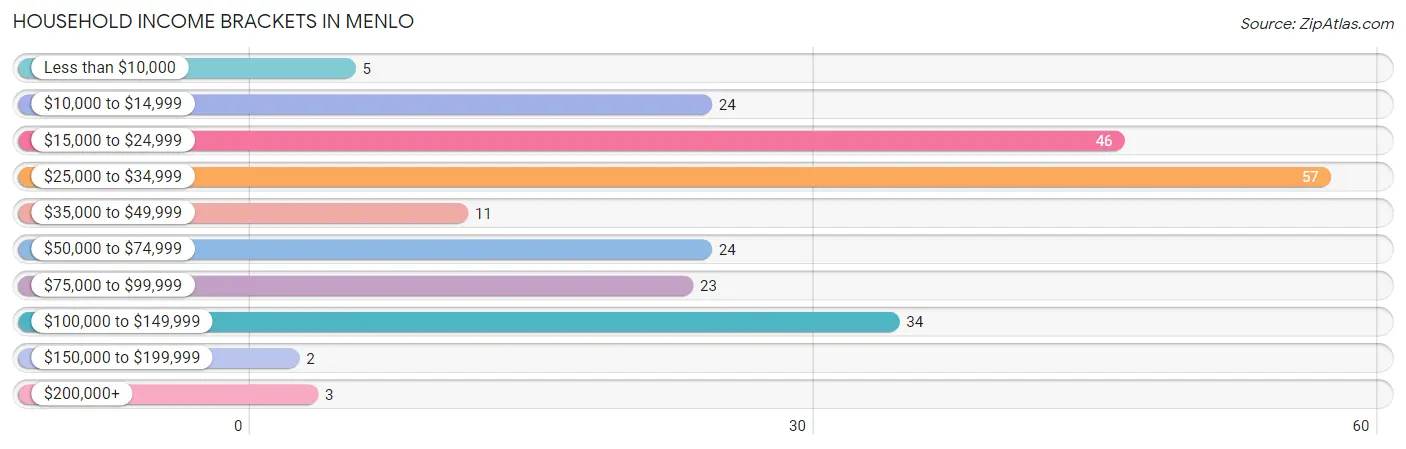
Household Income Brackets in Menlo
With 57 households falling in the category, the $25,000 to $34,999 income range is the most frequent in Menlo, accounting for 24.9% of all households. In contrast, only 2 households (0.9%) fall into the $150,000 to $199,999 income bracket, making it the least populous group.
| Income Bracket | # Households | % Households |
| Less than $10,000 | 5 | 2.2% |
| $10,000 to $14,999 | 24 | 10.5% |
| $15,000 to $24,999 | 46 | 20.1% |
| $25,000 to $34,999 | 57 | 24.9% |
| $35,000 to $49,999 | 11 | 4.8% |
| $50,000 to $74,999 | 24 | 10.5% |
| $75,000 to $99,999 | 23 | 10.0% |
| $100,000 to $149,999 | 34 | 14.8% |
| $150,000 to $199,999 | 2 | 0.9% |
| $200,000+ | 3 | 1.3% |
Household Income by Householder Age in Menlo
The median household income in Menlo is $33,589, with the highest median household income of $69,583 found in the 25 to 44 years age bracket for the primary householder. A total of 79 households (34.5%) fall into this category. Meanwhile, the 15 to 24 years age bracket for the primary householder has the lowest median household income of $0, with 17 households (7.4%) in this group.
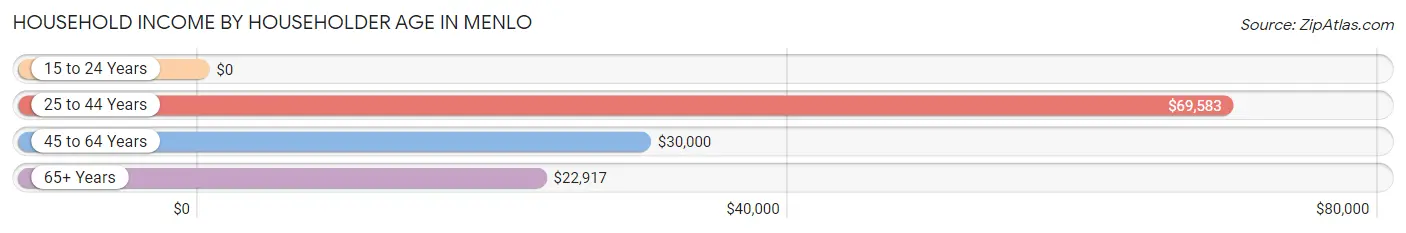
| Income Bracket | # Households | Median Income |
| 15 to 24 Years | 17 (7.4%) | $0 |
| 25 to 44 Years | 79 (34.5%) | $69,583 |
| 45 to 64 Years | 72 (31.4%) | $30,000 |
| 65+ Years | 61 (26.6%) | $22,917 |
| Total | 229 (100.0%) | $33,589 |
Poverty in Menlo
Income Below Poverty by Sex and Age in Menlo
With 2.1% poverty level for males and 10.5% for females among the residents of Menlo, 75 year old and over males and 55 to 64 year old females are the most vulnerable to poverty, with 2 males (14.3%) and 11 females (37.9%) in their respective age groups living below the poverty level.
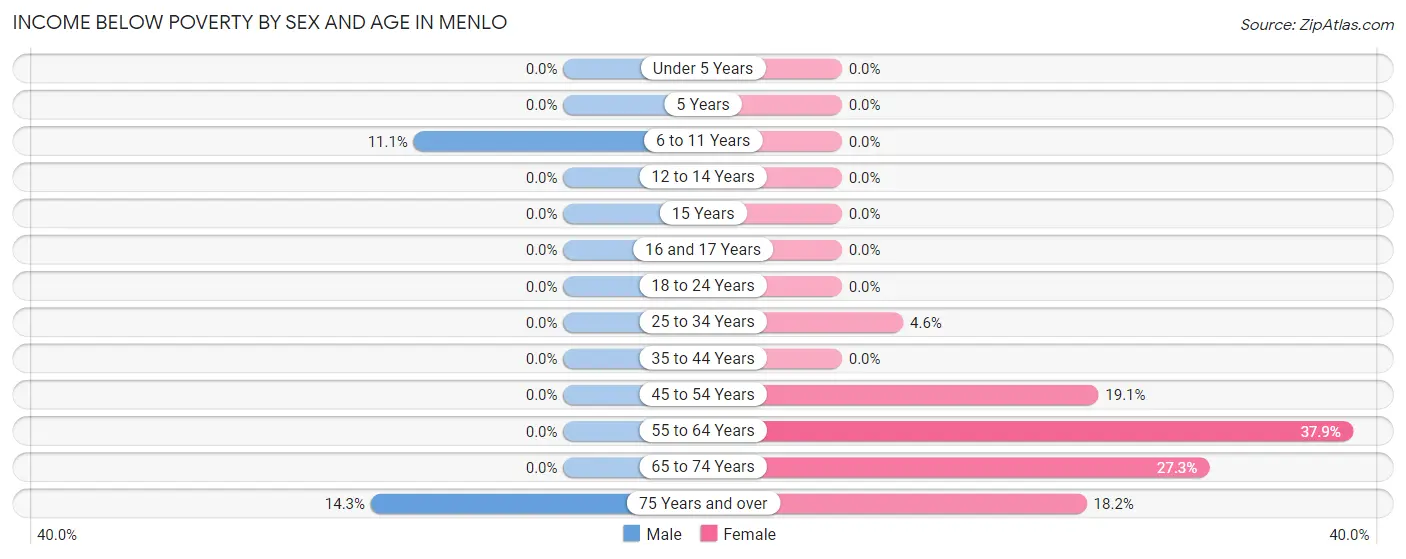
| Age Bracket | Male | Female |
| Under 5 Years | 0 (0.0%) | 0 (0.0%) |
| 5 Years | 0 (0.0%) | 0 (0.0%) |
| 6 to 11 Years | 2 (11.1%) | 0 (0.0%) |
| 12 to 14 Years | 0 (0.0%) | 0 (0.0%) |
| 15 Years | 0 (0.0%) | 0 (0.0%) |
| 16 and 17 Years | 0 (0.0%) | 0 (0.0%) |
| 18 to 24 Years | 0 (0.0%) | 0 (0.0%) |
| 25 to 34 Years | 0 (0.0%) | 2 (4.5%) |
| 35 to 44 Years | 0 (0.0%) | 0 (0.0%) |
| 45 to 54 Years | 0 (0.0%) | 4 (19.1%) |
| 55 to 64 Years | 0 (0.0%) | 11 (37.9%) |
| 65 to 74 Years | 0 (0.0%) | 6 (27.3%) |
| 75 Years and over | 2 (14.3%) | 6 (18.2%) |
| Total | 4 (2.1%) | 29 (10.5%) |
Income Above Poverty by Sex and Age in Menlo
According to the poverty statistics in Menlo, males aged under 5 years and females aged under 5 years are the age groups that are most secure financially, with 100.0% of males and 100.0% of females in these age groups living above the poverty line.
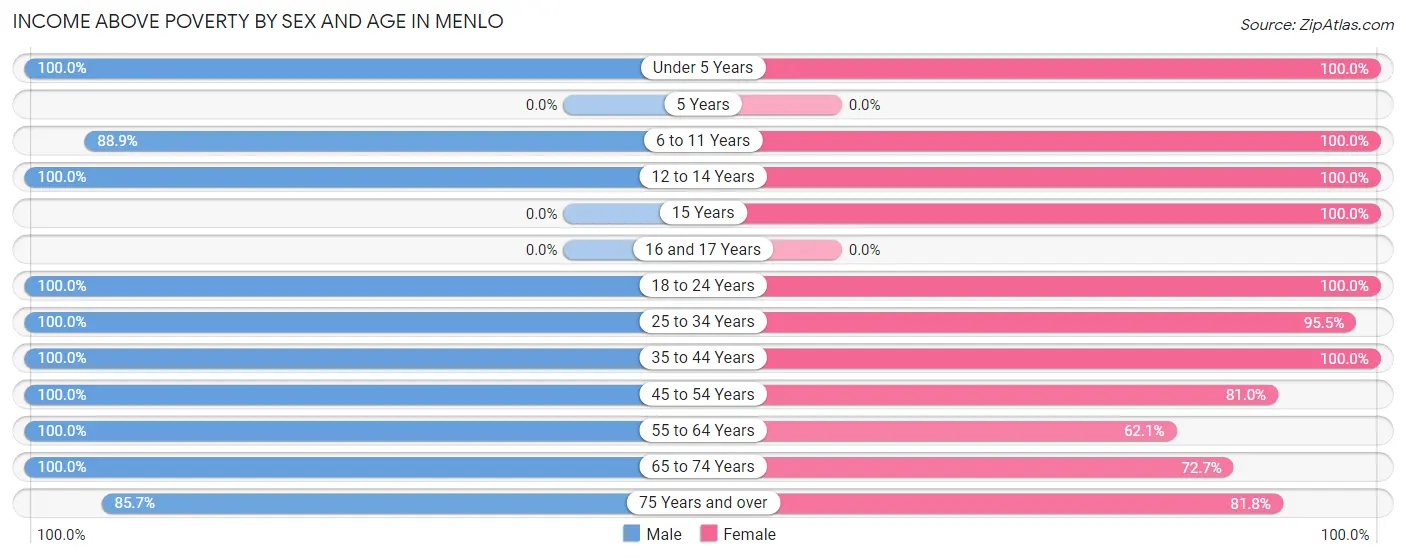
| Age Bracket | Male | Female |
| Under 5 Years | 8 (100.0%) | 11 (100.0%) |
| 5 Years | 0 (0.0%) | 0 (0.0%) |
| 6 to 11 Years | 16 (88.9%) | 23 (100.0%) |
| 12 to 14 Years | 5 (100.0%) | 11 (100.0%) |
| 15 Years | 0 (0.0%) | 4 (100.0%) |
| 16 and 17 Years | 0 (0.0%) | 0 (0.0%) |
| 18 to 24 Years | 47 (100.0%) | 8 (100.0%) |
| 25 to 34 Years | 33 (100.0%) | 42 (95.5%) |
| 35 to 44 Years | 10 (100.0%) | 71 (100.0%) |
| 45 to 54 Years | 30 (100.0%) | 17 (80.9%) |
| 55 to 64 Years | 22 (100.0%) | 18 (62.1%) |
| 65 to 74 Years | 5 (100.0%) | 16 (72.7%) |
| 75 Years and over | 12 (85.7%) | 27 (81.8%) |
| Total | 188 (97.9%) | 248 (89.5%) |
Income Below Poverty Among Married-Couple Families in Menlo
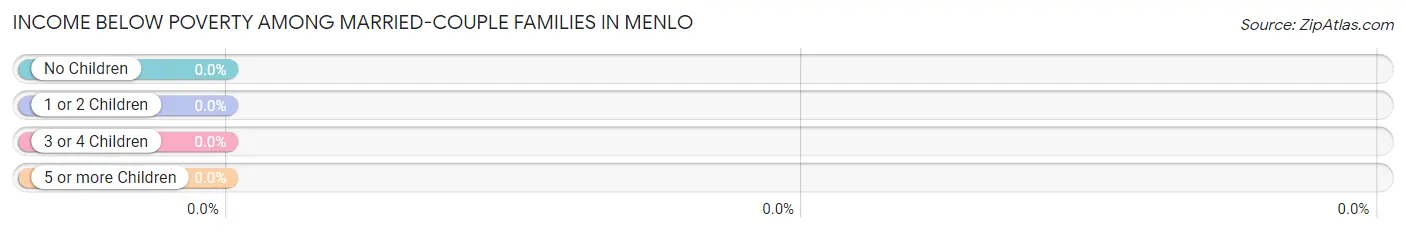
| Children | Above Poverty | Below Poverty |
| No Children | 31 (100.0%) | 0 (0.0%) |
| 1 or 2 Children | 38 (100.0%) | 0 (0.0%) |
| 3 or 4 Children | 6 (100.0%) | 0 (0.0%) |
| 5 or more Children | 0 (0.0%) | 0 (0.0%) |
| Total | 75 (100.0%) | 0 (0.0%) |
Income Below Poverty Among Single-Parent Households in Menlo
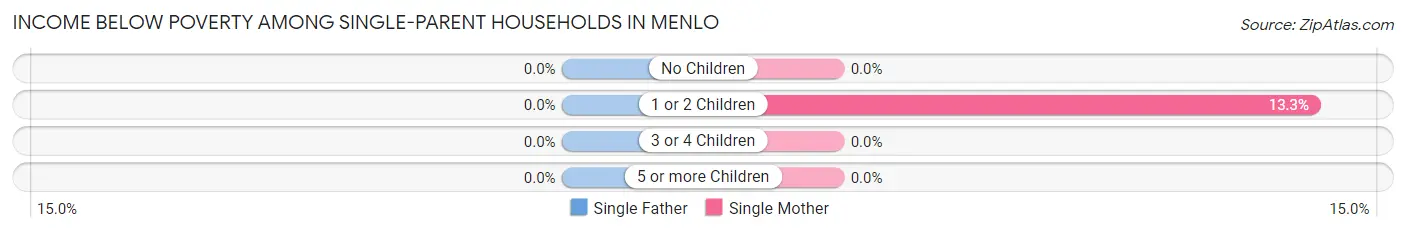
| Children | Single Father | Single Mother |
| No Children | 0 (0.0%) | 0 (0.0%) |
| 1 or 2 Children | 0 (0.0%) | 2 (13.3%) |
| 3 or 4 Children | 0 (0.0%) | 0 (0.0%) |
| 5 or more Children | 0 (0.0%) | 0 (0.0%) |
| Total | 0 (0.0%) | 2 (11.1%) |
Income Below Poverty Among Married-Couple vs Single-Parent Households in Menlo
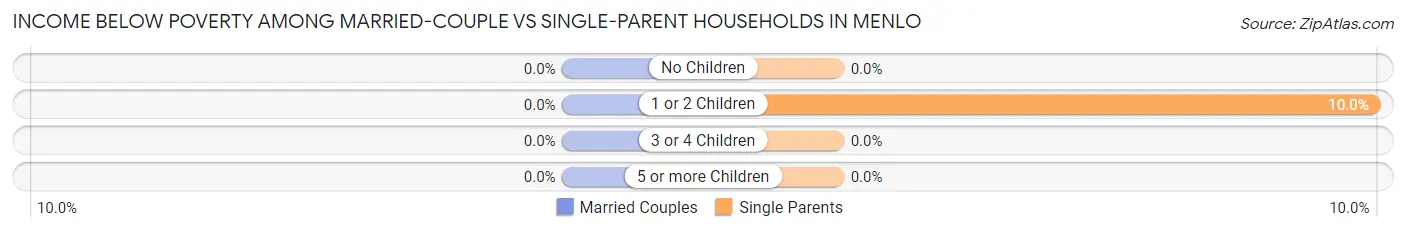
| Children | Married-Couple Families | Single-Parent Households |
| No Children | 0 (0.0%) | 0 (0.0%) |
| 1 or 2 Children | 0 (0.0%) | 2 (10.0%) |
| 3 or 4 Children | 0 (0.0%) | 0 (0.0%) |
| 5 or more Children | 0 (0.0%) | 0 (0.0%) |
| Total | 0 (0.0%) | 2 (8.7%) |
Race in Menlo
The most populous races in Menlo are White / Caucasian (461 | 98.3%), Two or more Races (4 | 0.9%), and Black / African American (3 | 0.6%).
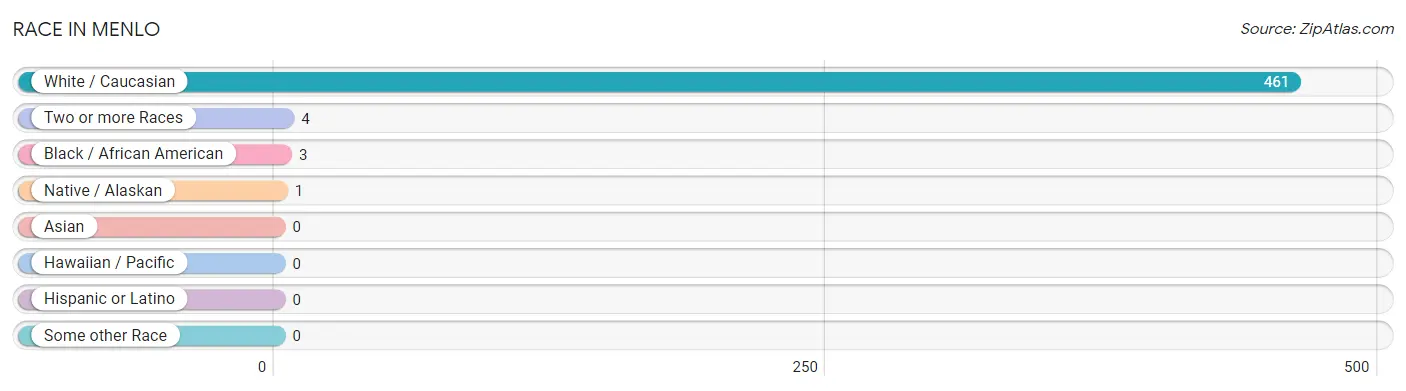
| Race | # Population | % Population |
| Asian | 0 | 0.0% |
| Black / African American | 3 | 0.6% |
| Hawaiian / Pacific | 0 | 0.0% |
| Hispanic or Latino | 0 | 0.0% |
| Native / Alaskan | 1 | 0.2% |
| White / Caucasian | 461 | 98.3% |
| Two or more Races | 4 | 0.9% |
| Some other Race | 0 | 0.0% |
| Total | 469 | 100.0% |
Ancestry in Menlo
The most populous ancestries reported in Menlo are American (190 | 40.5%), English (87 | 18.5%), Irish (38 | 8.1%), German (30 | 6.4%), and Scottish (17 | 3.6%), together accounting for 77.2% of all Menlo residents.
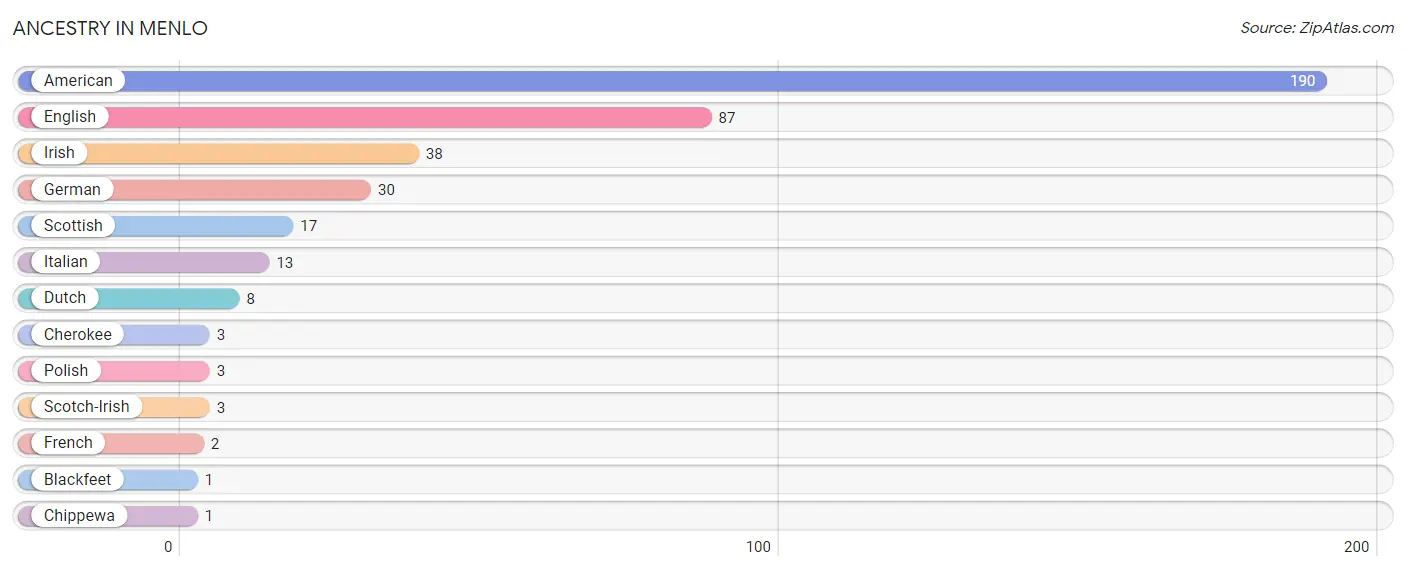
| Ancestry | # Population | % Population |
| American | 190 | 40.5% |
| Blackfeet | 1 | 0.2% |
| Cherokee | 3 | 0.6% |
| Chippewa | 1 | 0.2% |
| Dutch | 8 | 1.7% |
| English | 87 | 18.5% |
| French | 2 | 0.4% |
| German | 30 | 6.4% |
| Irish | 38 | 8.1% |
| Italian | 13 | 2.8% |
| Polish | 3 | 0.6% |
| Scotch-Irish | 3 | 0.6% |
| Scottish | 17 | 3.6% | View All 13 Rows |
Immigrants in Menlo
The most numerous immigrant groups reported in Menlo came from Europe (2 | 0.4%), Germany (2 | 0.4%), Western Europe (2 | 0.4%), and Canada (1 | 0.2%), together accounting for 1.5% of all Menlo residents.
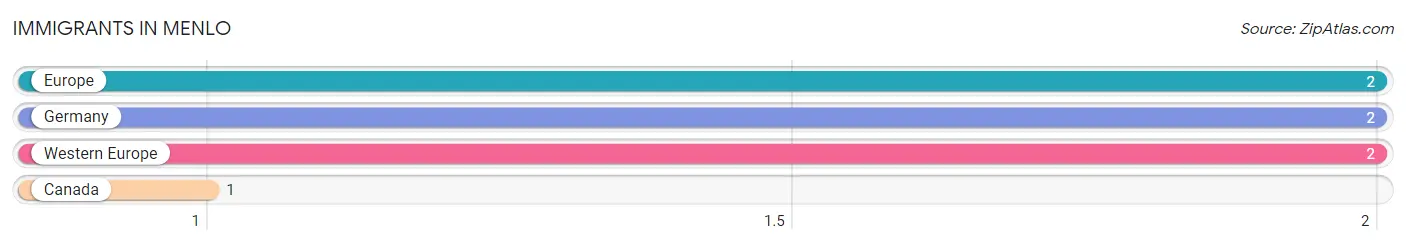
| Immigration Origin | # Population | % Population |
| Canada | 1 | 0.2% |
| Europe | 2 | 0.4% |
| Germany | 2 | 0.4% |
| Western Europe | 2 | 0.4% | View All 4 Rows |
Sex and Age in Menlo
Sex and Age in Menlo
The most populous age groups in Menlo are 15 to 19 Years (28 | 14.6%) for men and 25 to 29 Years (42 | 15.2%) for women.
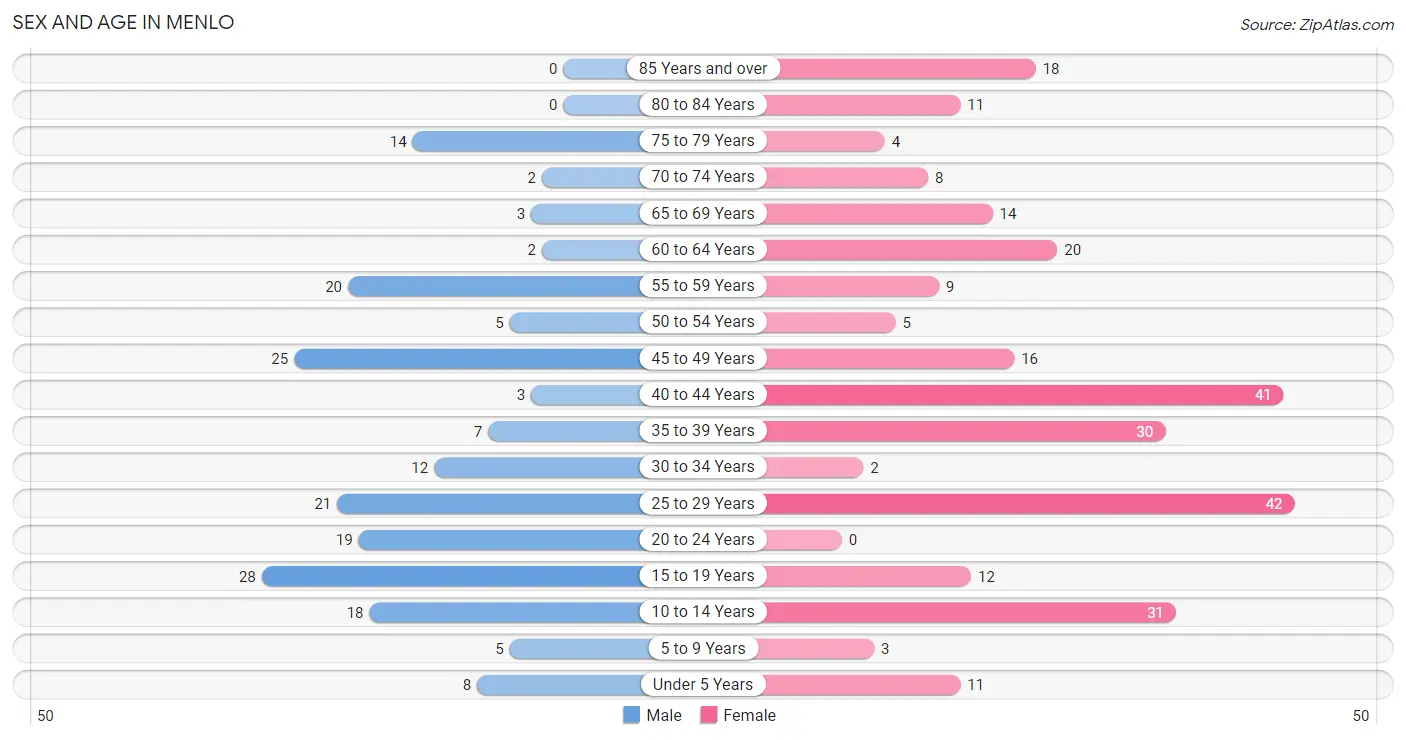
| Age Bracket | Male | Female |
| Under 5 Years | 8 (4.2%) | 11 (4.0%) |
| 5 to 9 Years | 5 (2.6%) | 3 (1.1%) |
| 10 to 14 Years | 18 (9.4%) | 31 (11.2%) |
| 15 to 19 Years | 28 (14.6%) | 12 (4.3%) |
| 20 to 24 Years | 19 (9.9%) | 0 (0.0%) |
| 25 to 29 Years | 21 (10.9%) | 42 (15.2%) |
| 30 to 34 Years | 12 (6.2%) | 2 (0.7%) |
| 35 to 39 Years | 7 (3.6%) | 30 (10.8%) |
| 40 to 44 Years | 3 (1.6%) | 41 (14.8%) |
| 45 to 49 Years | 25 (13.0%) | 16 (5.8%) |
| 50 to 54 Years | 5 (2.6%) | 5 (1.8%) |
| 55 to 59 Years | 20 (10.4%) | 9 (3.3%) |
| 60 to 64 Years | 2 (1.0%) | 20 (7.2%) |
| 65 to 69 Years | 3 (1.6%) | 14 (5.1%) |
| 70 to 74 Years | 2 (1.0%) | 8 (2.9%) |
| 75 to 79 Years | 14 (7.3%) | 4 (1.4%) |
| 80 to 84 Years | 0 (0.0%) | 11 (4.0%) |
| 85 Years and over | 0 (0.0%) | 18 (6.5%) |
| Total | 192 (100.0%) | 277 (100.0%) |
Families and Households in Menlo
Median Family Size in Menlo
The median family size in Menlo is 3.18 persons per family, with single male/father families (5 | 5.1%) accounting for the largest median family size of 4.8 persons per family. On the other hand, single female/mother families (18 | 18.4%) represent the smallest median family size with 2.39 persons per family.
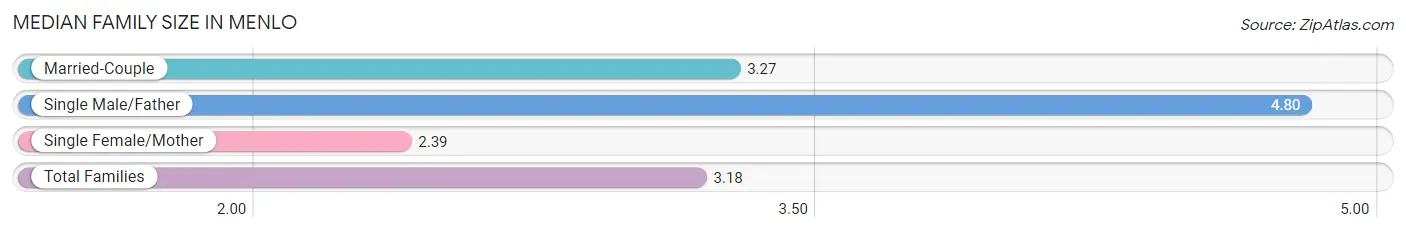
| Family Type | # Families | Family Size |
| Married-Couple | 75 (76.5%) | 3.27 |
| Single Male/Father | 5 (5.1%) | 4.80 |
| Single Female/Mother | 18 (18.4%) | 2.39 |
| Total Families | 98 (100.0%) | 3.18 |
Median Household Size in Menlo
The median household size in Menlo is 2.05 persons per household, with single male/father households (5 | 2.2%) accounting for the largest median household size of 5.6 persons per household. non-family households (131 | 57.2%) represent the smallest median household size with 1.14 persons per household.
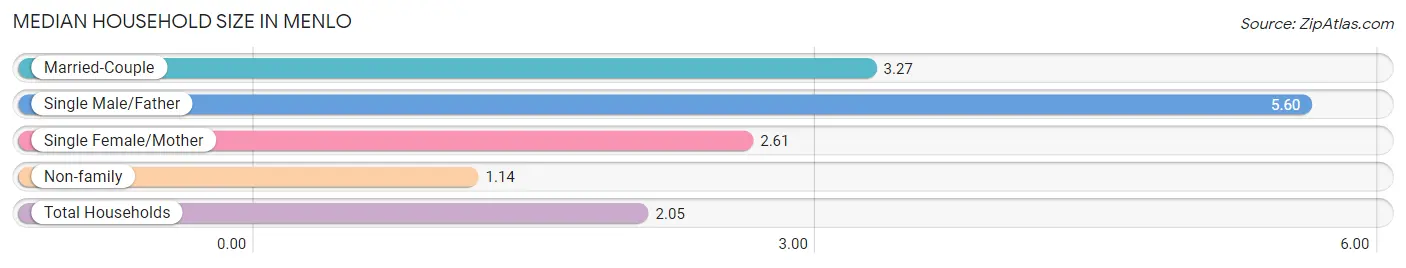
| Household Type | # Households | Household Size |
| Married-Couple | 75 (32.8%) | 3.27 |
| Single Male/Father | 5 (2.2%) | 5.60 |
| Single Female/Mother | 18 (7.9%) | 2.61 |
| Non-family | 131 (57.2%) | 1.14 |
| Total Households | 229 (100.0%) | 2.05 |
Household Size by Marriage Status in Menlo
Out of a total of 229 households in Menlo, 98 (42.8%) are family households, while 131 (57.2%) are nonfamily households. The most numerous type of family households are 2-person households, comprising 31, and the most common type of nonfamily households are 1-person households, comprising 120.
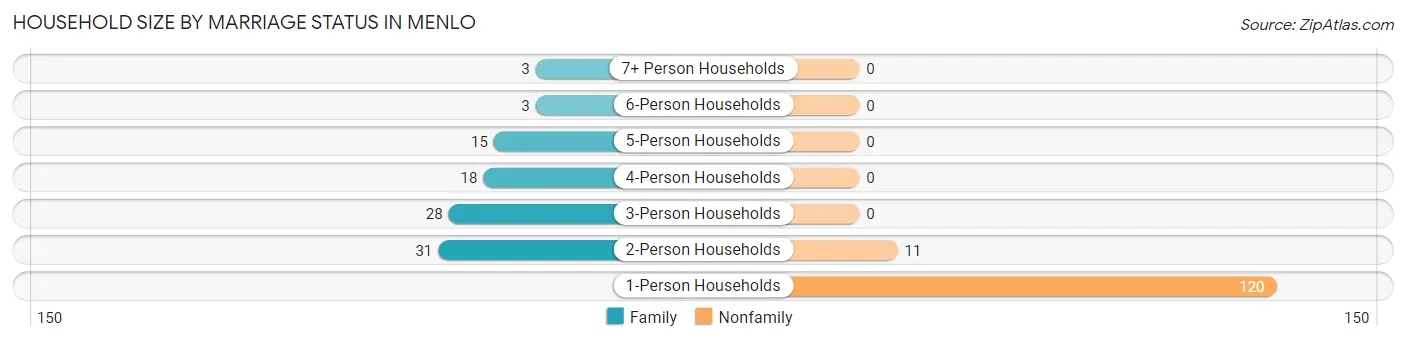
| Household Size | Family Households | Nonfamily Households |
| 1-Person Households | - | 120 (52.4%) |
| 2-Person Households | 31 (13.5%) | 11 (4.8%) |
| 3-Person Households | 28 (12.2%) | 0 (0.0%) |
| 4-Person Households | 18 (7.9%) | 0 (0.0%) |
| 5-Person Households | 15 (6.6%) | 0 (0.0%) |
| 6-Person Households | 3 (1.3%) | 0 (0.0%) |
| 7+ Person Households | 3 (1.3%) | 0 (0.0%) |
| Total | 98 (42.8%) | 131 (57.2%) |
Female Fertility in Menlo
Fertility by Age in Menlo
Average fertility rate in Menlo is 159.0 births per 1,000 women. Women in the age bracket of 20 to 34 years have the highest fertility rate with 523.0 births per 1,000 women. Women in the age bracket of 20 to 34 years acount for 100.0% of all women with births.
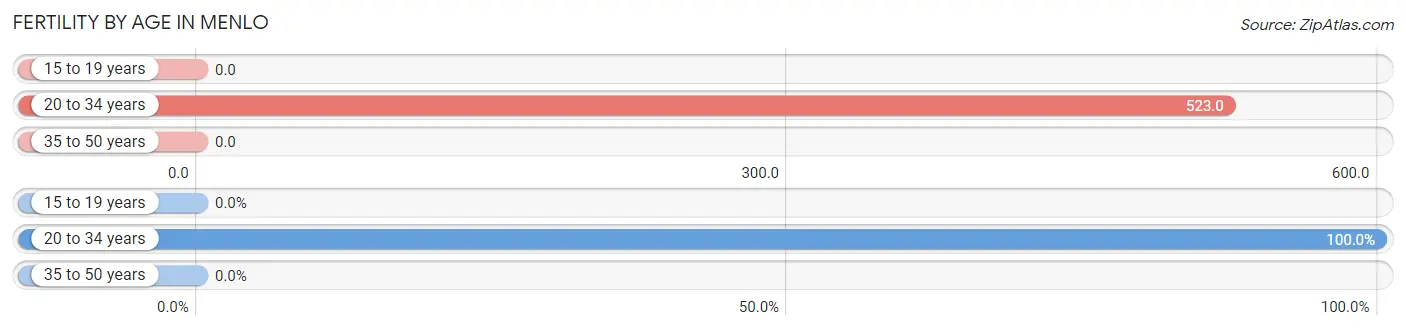
| Age Bracket | Women with Births | Births / 1,000 Women |
| 15 to 19 years | 0 (0.0%) | 0.0 |
| 20 to 34 years | 23 (100.0%) | 523.0 |
| 35 to 50 years | 0 (0.0%) | 0.0 |
| Total | 23 (100.0%) | 159.0 |
Fertility by Age by Marriage Status in Menlo
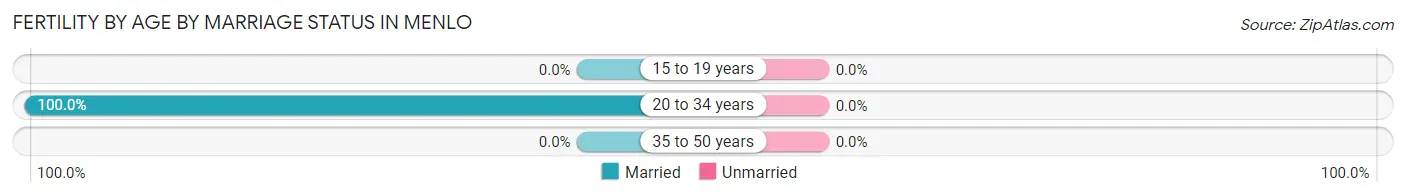
| Age Bracket | Married | Unmarried |
| 15 to 19 years | 0 (0.0%) | 0 (0.0%) |
| 20 to 34 years | 23 (100.0%) | 0 (0.0%) |
| 35 to 50 years | 0 (0.0%) | 0 (0.0%) |
| Total | 23 (100.0%) | 0 (0.0%) |
Fertility by Education in Menlo
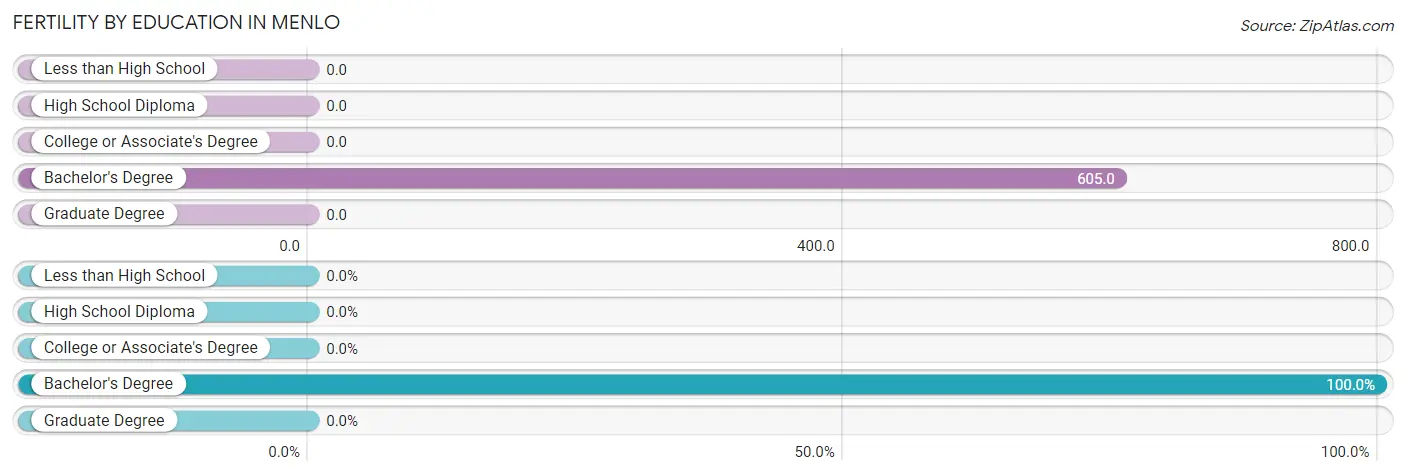
| Educational Attainment | Women with Births | Births / 1,000 Women |
| Less than High School | 0 (0.0%) | 0.0 |
| High School Diploma | 0 (0.0%) | 0.0 |
| College or Associate's Degree | 0 (0.0%) | 0.0 |
| Bachelor's Degree | 23 (100.0%) | 605.0 |
| Graduate Degree | 0 (0.0%) | 0.0 |
| Total | 23 (100.0%) | 159.0 |
Fertility by Education by Marriage Status in Menlo
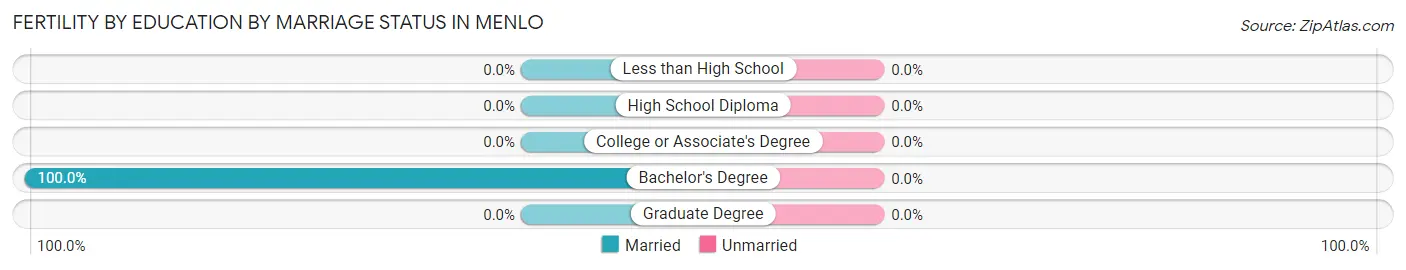
| Educational Attainment | Married | Unmarried |
| Less than High School | 0 (0.0%) | 0 (0.0%) |
| High School Diploma | 0 (0.0%) | 0 (0.0%) |
| College or Associate's Degree | 0 (0.0%) | 0 (0.0%) |
| Bachelor's Degree | 23 (100.0%) | 0 (0.0%) |
| Graduate Degree | 0 (0.0%) | 0 (0.0%) |
| Total | 23 (100.0%) | 0 (0.0%) |
Employment Characteristics in Menlo
Employment by Class of Employer in Menlo
Among the 222 employed individuals in Menlo, private company employees (193 | 86.9%), local government employees (10 | 4.5%), and self-employed (not incorporated) (9 | 4.1%) make up the most common classes of employment.
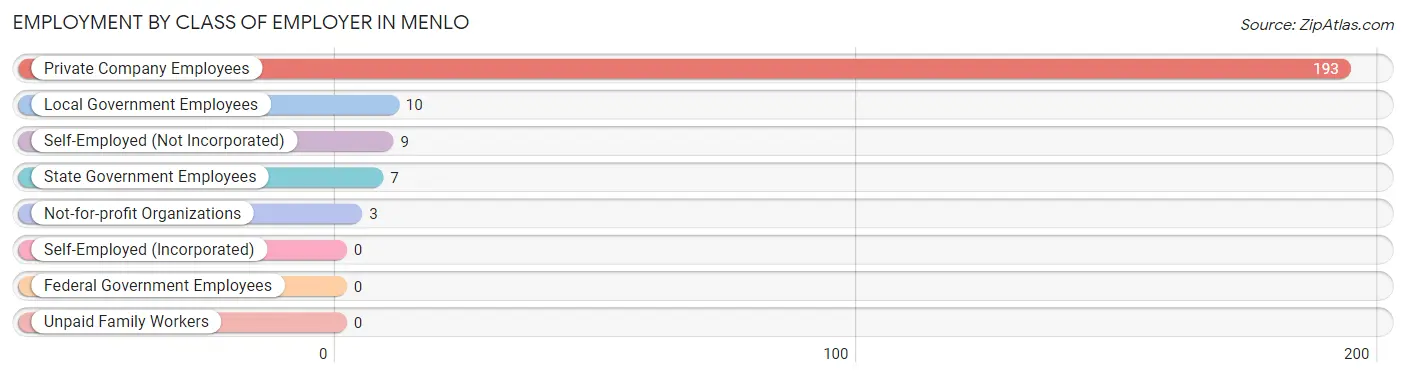
| Employer Class | # Employees | % Employees |
| Private Company Employees | 193 | 86.9% |
| Self-Employed (Incorporated) | 0 | 0.0% |
| Self-Employed (Not Incorporated) | 9 | 4.1% |
| Not-for-profit Organizations | 3 | 1.3% |
| Local Government Employees | 10 | 4.5% |
| State Government Employees | 7 | 3.2% |
| Federal Government Employees | 0 | 0.0% |
| Unpaid Family Workers | 0 | 0.0% |
| Total | 222 | 100.0% |
Employment Status by Age in Menlo
According to the labor force statistics for Menlo, out of the total population over 16 years of age (389), 66.8% or 260 individuals are in the labor force, with 4.6% or 12 of them unemployed. The age group with the highest labor force participation rate is 20 to 24 years, with 100.0% or 19 individuals in the labor force. Within the labor force, the 60 to 64 years age range has the highest percentage of unemployed individuals, with 18.2% or 2 of them being unemployed.
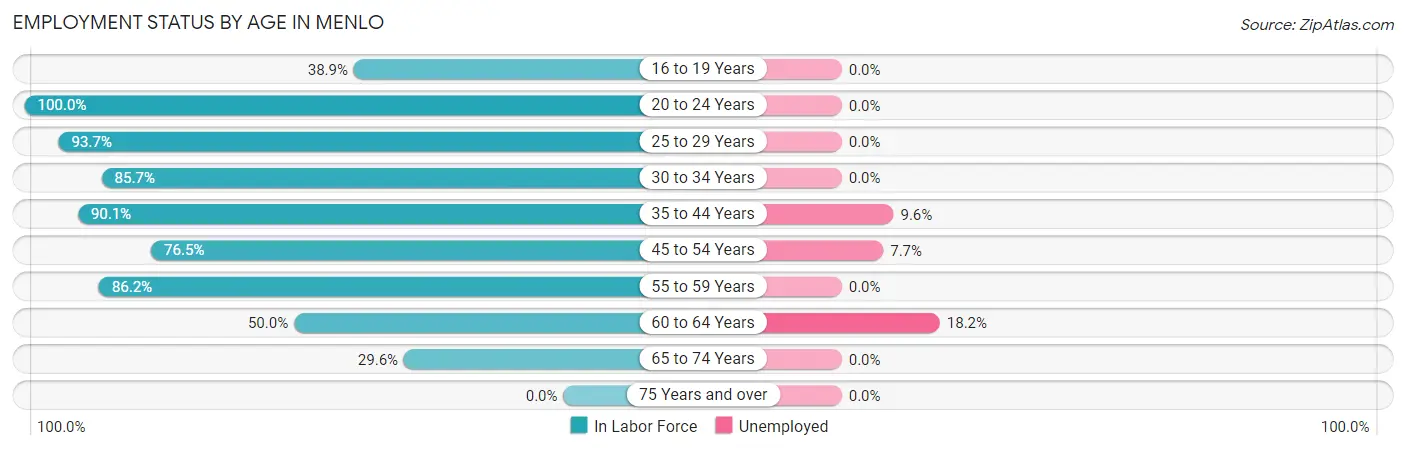
| Age Bracket | In Labor Force | Unemployed |
| 16 to 19 Years | 14 (38.9%) | 0 (0.0%) |
| 20 to 24 Years | 19 (100.0%) | 0 (0.0%) |
| 25 to 29 Years | 59 (93.7%) | 0 (0.0%) |
| 30 to 34 Years | 12 (85.7%) | 0 (0.0%) |
| 35 to 44 Years | 73 (90.1%) | 7 (9.6%) |
| 45 to 54 Years | 39 (76.5%) | 3 (7.7%) |
| 55 to 59 Years | 25 (86.2%) | 0 (0.0%) |
| 60 to 64 Years | 11 (50.0%) | 2 (18.2%) |
| 65 to 74 Years | 8 (29.6%) | 0 (0.0%) |
| 75 Years and over | 0 (0.0%) | 0 (0.0%) |
| Total | 260 (66.8%) | 12 (4.6%) |
Employment Status by Educational Attainment in Menlo
According to labor force statistics for Menlo, 84.2% of individuals (219) out of the total population between 25 and 64 years of age (260) are in the labor force, with 5.5% or 12 of them being unemployed. The group with the highest labor force participation rate are those with the educational attainment of bachelor's degree or higher, with 100.0% or 85 individuals in the labor force. Within the labor force, individuals with college / associate degree education have the highest percentage of unemployment, with 16.1% or 9 of them being unemployed.
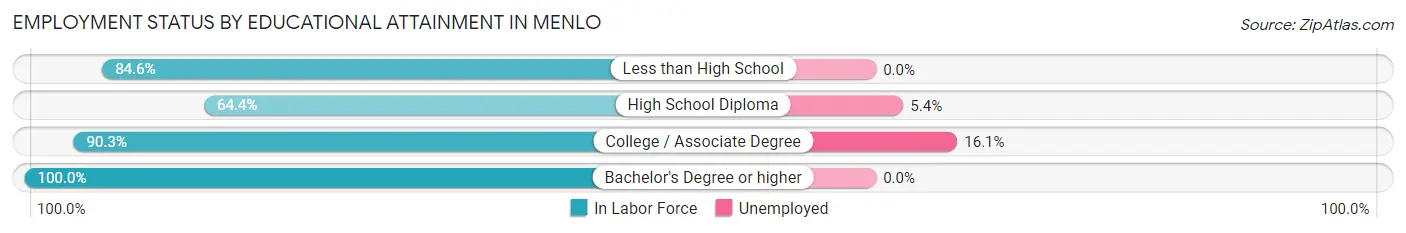
| Educational Attainment | In Labor Force | Unemployed |
| Less than High School | 22 (84.6%) | 0 (0.0%) |
| High School Diploma | 56 (64.4%) | 5 (5.4%) |
| College / Associate Degree | 56 (90.3%) | 10 (16.1%) |
| Bachelor's Degree or higher | 85 (100.0%) | 0 (0.0%) |
| Total | 219 (84.2%) | 14 (5.5%) |
Employment Occupations by Sex in Menlo
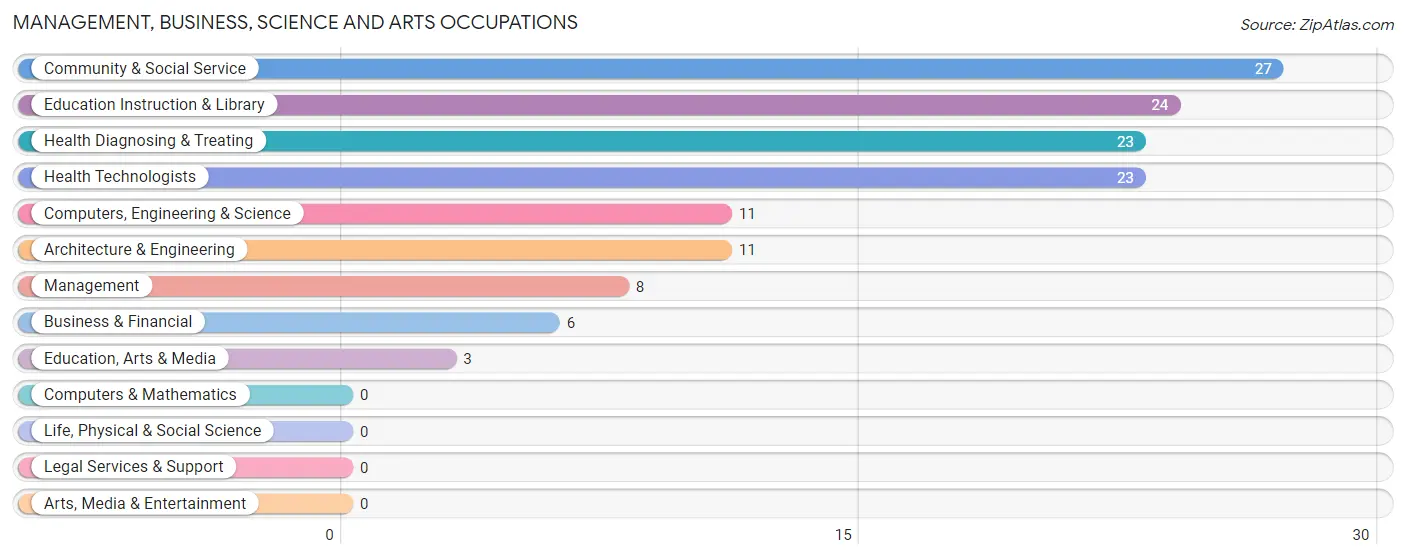
Management, Business, Science and Arts Occupations
The most common Management, Business, Science and Arts occupations in Menlo are Community & Social Service (27 | 10.9%), Education Instruction & Library (24 | 9.7%), Health Diagnosing & Treating (23 | 9.3%), Health Technologists (23 | 9.3%), and Computers, Engineering & Science (11 | 4.4%).
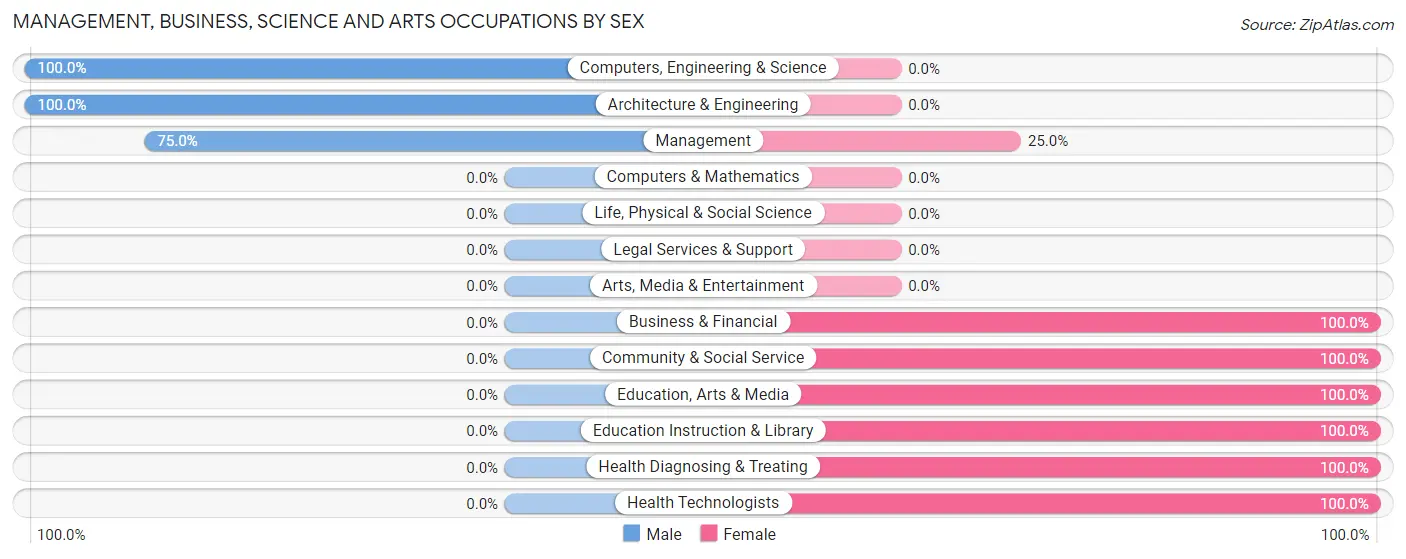
Management, Business, Science and Arts Occupations by Sex
Within the Management, Business, Science and Arts occupations in Menlo, the most male-oriented occupations are Computers, Engineering & Science (100.0%), Architecture & Engineering (100.0%), and Management (75.0%), while the most female-oriented occupations are Business & Financial (100.0%), Community & Social Service (100.0%), and Education, Arts & Media (100.0%).
| Occupation | Male | Female |
| Management | 6 (75.0%) | 2 (25.0%) |
| Business & Financial | 0 (0.0%) | 6 (100.0%) |
| Computers, Engineering & Science | 11 (100.0%) | 0 (0.0%) |
| Computers & Mathematics | 0 (0.0%) | 0 (0.0%) |
| Architecture & Engineering | 11 (100.0%) | 0 (0.0%) |
| Life, Physical & Social Science | 0 (0.0%) | 0 (0.0%) |
| Community & Social Service | 0 (0.0%) | 27 (100.0%) |
| Education, Arts & Media | 0 (0.0%) | 3 (100.0%) |
| Legal Services & Support | 0 (0.0%) | 0 (0.0%) |
| Education Instruction & Library | 0 (0.0%) | 24 (100.0%) |
| Arts, Media & Entertainment | 0 (0.0%) | 0 (0.0%) |
| Health Diagnosing & Treating | 0 (0.0%) | 23 (100.0%) |
| Health Technologists | 0 (0.0%) | 23 (100.0%) |
| Total (Category) | 17 (22.7%) | 58 (77.3%) |
| Total (Overall) | 119 (48.0%) | 129 (52.0%) |
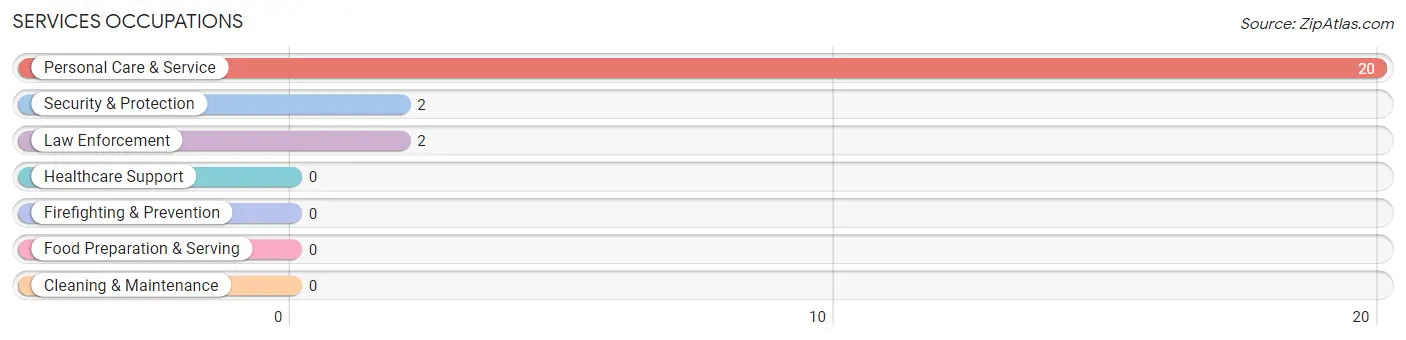
Services Occupations
The most common Services occupations in Menlo are Personal Care & Service (20 | 8.1%), Security & Protection (2 | 0.8%), and Law Enforcement (2 | 0.8%).
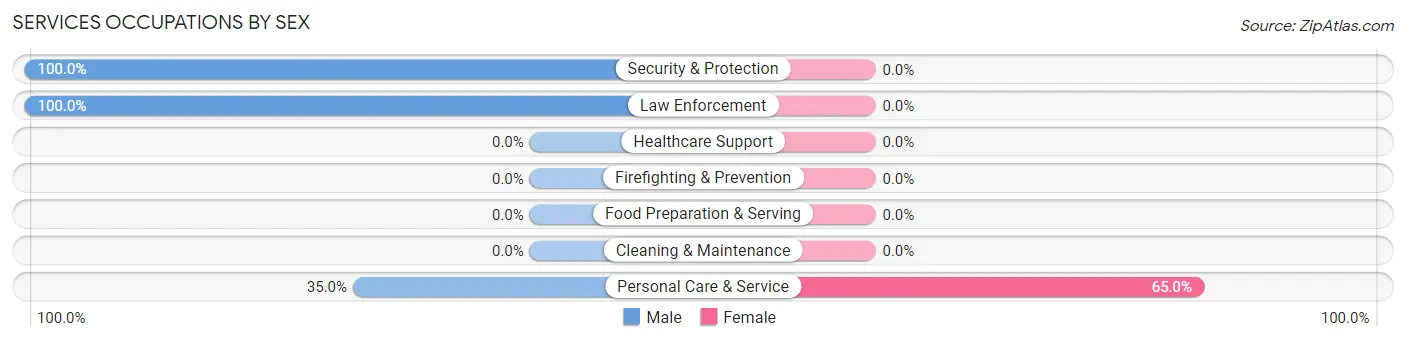
Services Occupations by Sex
| Occupation | Male | Female |
| Healthcare Support | 0 (0.0%) | 0 (0.0%) |
| Security & Protection | 2 (100.0%) | 0 (0.0%) |
| Firefighting & Prevention | 0 (0.0%) | 0 (0.0%) |
| Law Enforcement | 2 (100.0%) | 0 (0.0%) |
| Food Preparation & Serving | 0 (0.0%) | 0 (0.0%) |
| Cleaning & Maintenance | 0 (0.0%) | 0 (0.0%) |
| Personal Care & Service | 7 (35.0%) | 13 (65.0%) |
| Total (Category) | 9 (40.9%) | 13 (59.1%) |
| Total (Overall) | 119 (48.0%) | 129 (52.0%) |
Sales and Office Occupations
The most common Sales and Office occupations in Menlo are Office & Administration (48 | 19.4%), and Sales & Related (11 | 4.4%).

Sales and Office Occupations by Sex

| Occupation | Male | Female |
| Sales & Related | 9 (81.8%) | 2 (18.2%) |
| Office & Administration | 11 (22.9%) | 37 (77.1%) |
| Total (Category) | 20 (33.9%) | 39 (66.1%) |
| Total (Overall) | 119 (48.0%) | 129 (52.0%) |
Natural Resources, Construction and Maintenance Occupations
The most common Natural Resources, Construction and Maintenance occupations in Menlo are Construction & Extraction (18 | 7.3%), and Installation, Maintenance & Repair (18 | 7.3%).
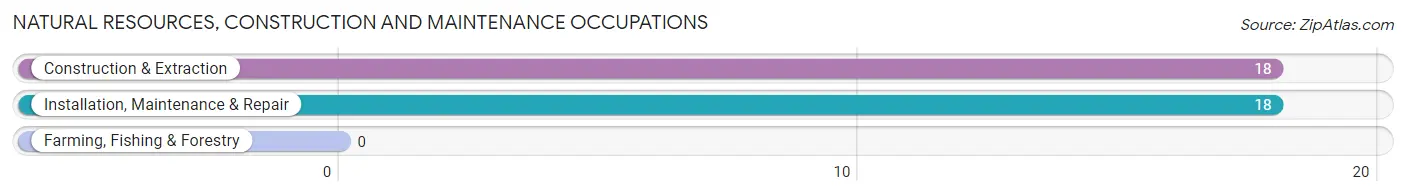
Natural Resources, Construction and Maintenance Occupations by Sex

| Occupation | Male | Female |
| Farming, Fishing & Forestry | 0 (0.0%) | 0 (0.0%) |
| Construction & Extraction | 18 (100.0%) | 0 (0.0%) |
| Installation, Maintenance & Repair | 18 (100.0%) | 0 (0.0%) |
| Total (Category) | 36 (100.0%) | 0 (0.0%) |
| Total (Overall) | 119 (48.0%) | 129 (52.0%) |
Production, Transportation and Moving Occupations
The most common Production, Transportation and Moving occupations in Menlo are Production (53 | 21.4%), and Material Moving (3 | 1.2%).
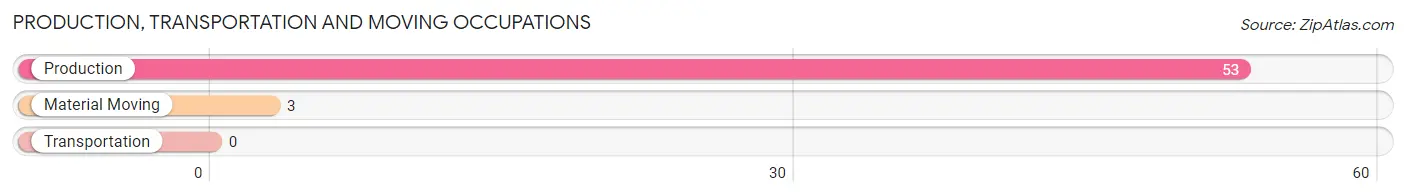
Production, Transportation and Moving Occupations by Sex

| Occupation | Male | Female |
| Production | 37 (69.8%) | 16 (30.2%) |
| Transportation | 0 (0.0%) | 0 (0.0%) |
| Material Moving | 0 (0.0%) | 3 (100.0%) |
| Total (Category) | 37 (66.1%) | 19 (33.9%) |
| Total (Overall) | 119 (48.0%) | 129 (52.0%) |
Employment Industries by Sex in Menlo
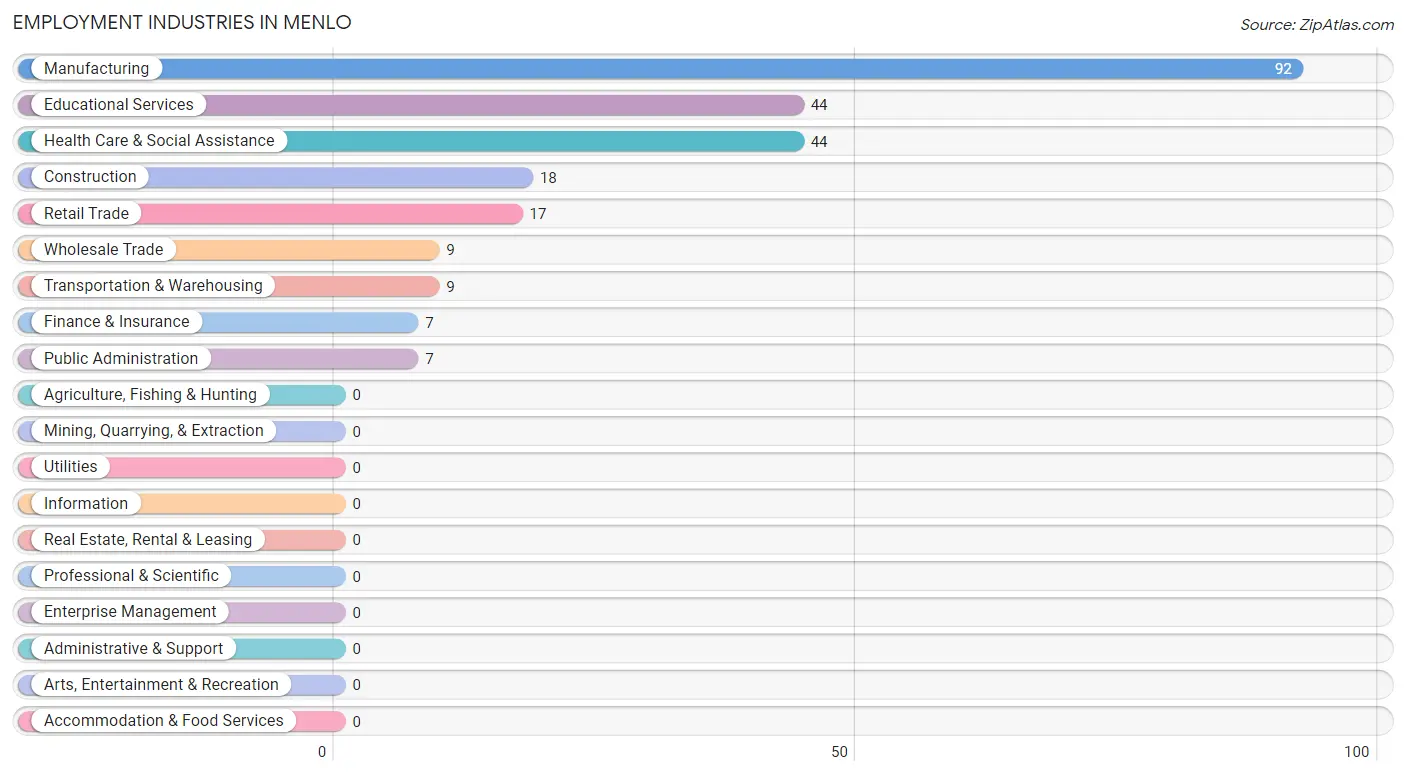
Employment Industries in Menlo
The major employment industries in Menlo include Manufacturing (92 | 37.1%), Educational Services (44 | 17.7%), Health Care & Social Assistance (44 | 17.7%), Construction (18 | 7.3%), and Retail Trade (17 | 6.9%).
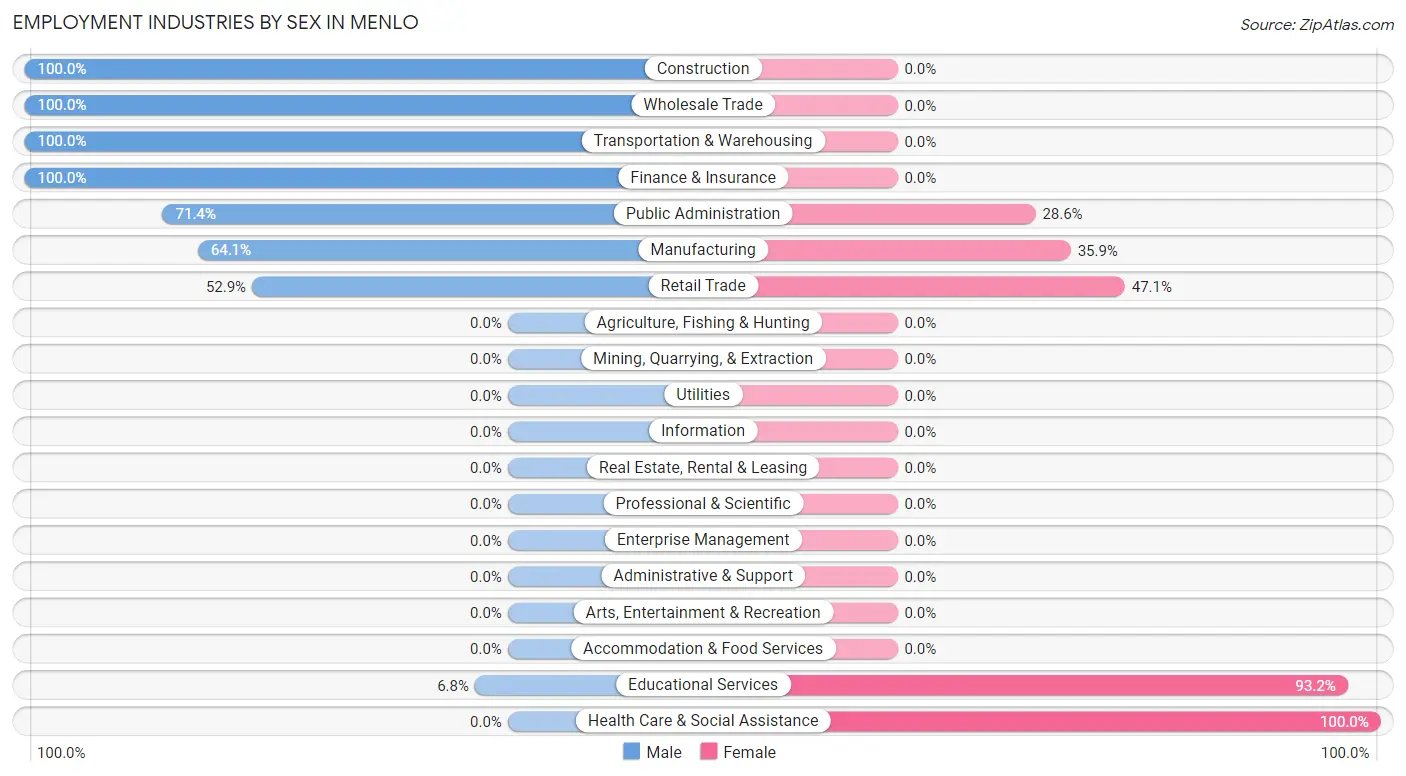
Employment Industries by Sex in Menlo
The Menlo industries that see more men than women are Construction (100.0%), Wholesale Trade (100.0%), and Transportation & Warehousing (100.0%), whereas the industries that tend to have a higher number of women are Health Care & Social Assistance (100.0%), Educational Services (93.2%), and Retail Trade (47.1%).
| Industry | Male | Female |
| Agriculture, Fishing & Hunting | 0 (0.0%) | 0 (0.0%) |
| Mining, Quarrying, & Extraction | 0 (0.0%) | 0 (0.0%) |
| Construction | 18 (100.0%) | 0 (0.0%) |
| Manufacturing | 59 (64.1%) | 33 (35.9%) |
| Wholesale Trade | 9 (100.0%) | 0 (0.0%) |
| Retail Trade | 9 (52.9%) | 8 (47.1%) |
| Transportation & Warehousing | 9 (100.0%) | 0 (0.0%) |
| Utilities | 0 (0.0%) | 0 (0.0%) |
| Information | 0 (0.0%) | 0 (0.0%) |
| Finance & Insurance | 7 (100.0%) | 0 (0.0%) |
| Real Estate, Rental & Leasing | 0 (0.0%) | 0 (0.0%) |
| Professional & Scientific | 0 (0.0%) | 0 (0.0%) |
| Enterprise Management | 0 (0.0%) | 0 (0.0%) |
| Administrative & Support | 0 (0.0%) | 0 (0.0%) |
| Educational Services | 3 (6.8%) | 41 (93.2%) |
| Health Care & Social Assistance | 0 (0.0%) | 44 (100.0%) |
| Arts, Entertainment & Recreation | 0 (0.0%) | 0 (0.0%) |
| Accommodation & Food Services | 0 (0.0%) | 0 (0.0%) |
| Public Administration | 5 (71.4%) | 2 (28.6%) |
| Total | 119 (48.0%) | 129 (52.0%) |
Education in Menlo
School Enrollment in Menlo
The most common levels of schooling among the 75 students in Menlo are middle school (34 | 45.3%), elementary school (15 | 20.0%), and college / undergraduate (13 | 17.3%).
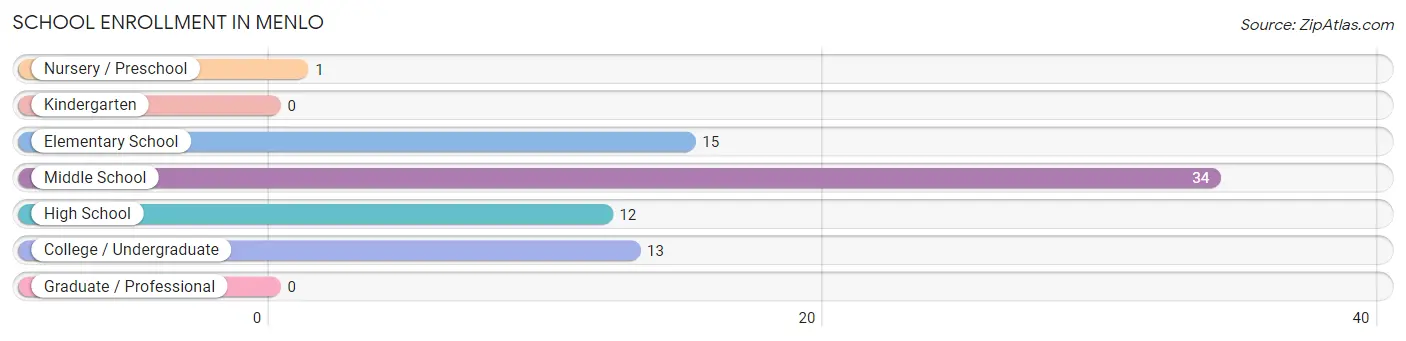
| School Level | # Students | % Students |
| Nursery / Preschool | 1 | 1.3% |
| Kindergarten | 0 | 0.0% |
| Elementary School | 15 | 20.0% |
| Middle School | 34 | 45.3% |
| High School | 12 | 16.0% |
| College / Undergraduate | 13 | 17.3% |
| Graduate / Professional | 0 | 0.0% |
| Total | 75 | 100.0% |
School Enrollment by Age by Funding Source in Menlo
Out of a total of 75 students who are enrolled in schools in Menlo, 8 (10.7%) attend a private institution, while the remaining 67 (89.3%) are enrolled in public schools. The age group of 3 to 4 year olds has the highest likelihood of being enrolled in private schools, with 1 (100.0% in the age bracket) enrolled. Conversely, the age group of 5 to 9 year old has the lowest likelihood of being enrolled in a private school, with 8 (100.0% in the age bracket) attending a public institution.
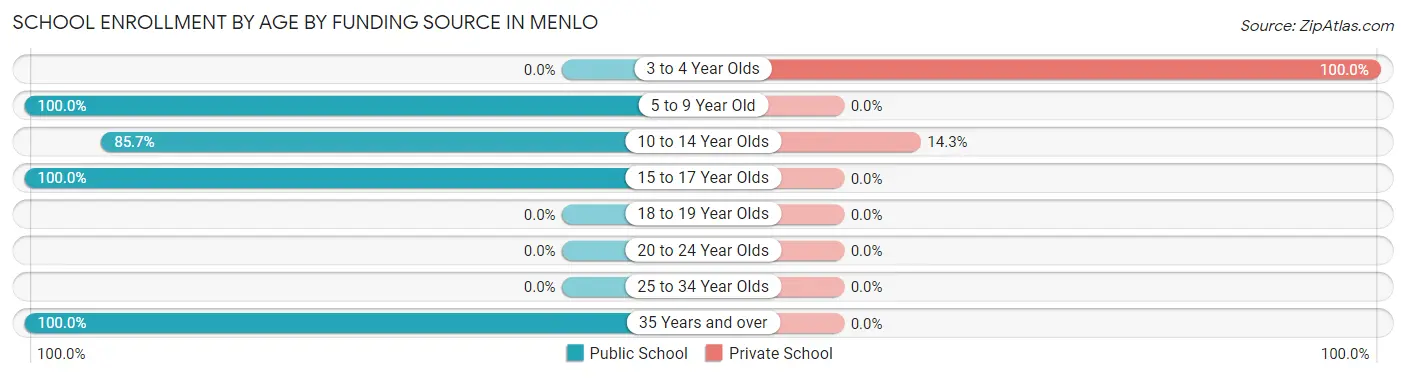
| Age Bracket | Public School | Private School |
| 3 to 4 Year Olds | 0 (0.0%) | 1 (100.0%) |
| 5 to 9 Year Old | 8 (100.0%) | 0 (0.0%) |
| 10 to 14 Year Olds | 42 (85.7%) | 7 (14.3%) |
| 15 to 17 Year Olds | 4 (100.0%) | 0 (0.0%) |
| 18 to 19 Year Olds | 0 (0.0%) | 0 (0.0%) |
| 20 to 24 Year Olds | 0 (0.0%) | 0 (0.0%) |
| 25 to 34 Year Olds | 0 (0.0%) | 0 (0.0%) |
| 35 Years and over | 13 (100.0%) | 0 (0.0%) |
| Total | 67 (89.3%) | 8 (10.7%) |
Educational Attainment by Field of Study in Menlo
Science & technology (23 | 27.1%), social sciences (17 | 20.0%), education (17 | 20.0%), engineering (14 | 16.5%), and business (14 | 16.5%) are the most common fields of study among 85 individuals in Menlo who have obtained a bachelor's degree or higher.
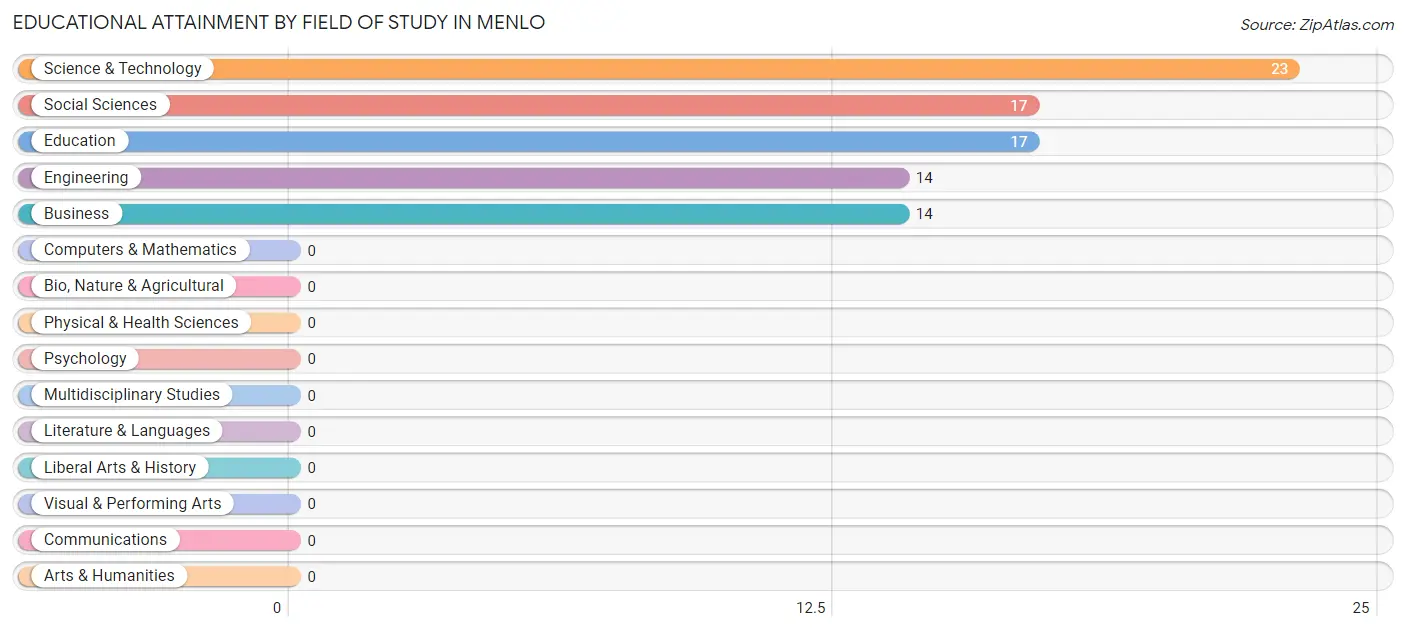
| Field of Study | # Graduates | % Graduates |
| Computers & Mathematics | 0 | 0.0% |
| Bio, Nature & Agricultural | 0 | 0.0% |
| Physical & Health Sciences | 0 | 0.0% |
| Psychology | 0 | 0.0% |
| Social Sciences | 17 | 20.0% |
| Engineering | 14 | 16.5% |
| Multidisciplinary Studies | 0 | 0.0% |
| Science & Technology | 23 | 27.1% |
| Business | 14 | 16.5% |
| Education | 17 | 20.0% |
| Literature & Languages | 0 | 0.0% |
| Liberal Arts & History | 0 | 0.0% |
| Visual & Performing Arts | 0 | 0.0% |
| Communications | 0 | 0.0% |
| Arts & Humanities | 0 | 0.0% |
| Total | 85 | 100.0% |
Transportation & Commute in Menlo
Vehicle Availability by Sex in Menlo
The most prevalent vehicle ownership categories in Menlo are males with 3 vehicles (50, accounting for 42.0%) and females with 3 vehicles (18, making up 48.5%).
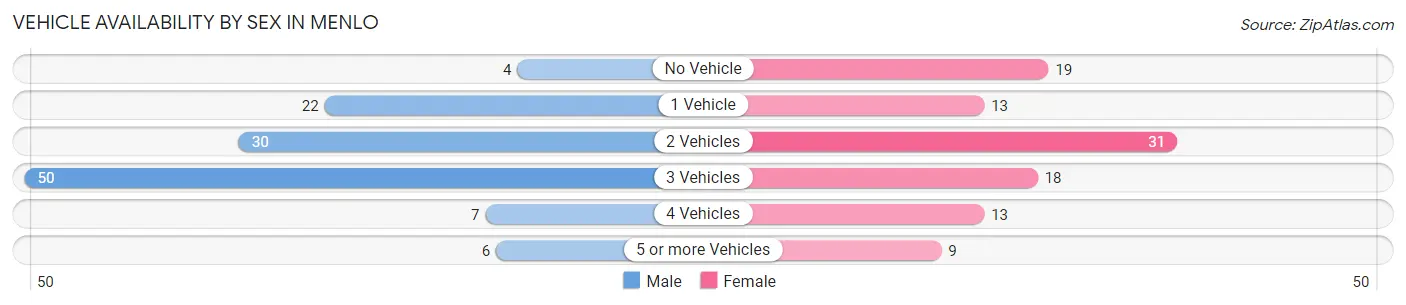
| Vehicles Available | Male | Female |
| No Vehicle | 4 (3.4%) | 19 (18.4%) |
| 1 Vehicle | 22 (18.5%) | 13 (12.6%) |
| 2 Vehicles | 30 (25.2%) | 31 (30.1%) |
| 3 Vehicles | 50 (42.0%) | 18 (17.5%) |
| 4 Vehicles | 7 (5.9%) | 13 (12.6%) |
| 5 or more Vehicles | 6 (5.0%) | 9 (8.7%) |
| Total | 119 (100.0%) | 103 (100.0%) |
Commute Time in Menlo
The most frequently occuring commute durations in Menlo are 30 to 34 minutes (51 commuters, 23.0%), 20 to 24 minutes (41 commuters, 18.5%), and 45 to 59 minutes (24 commuters, 10.8%).
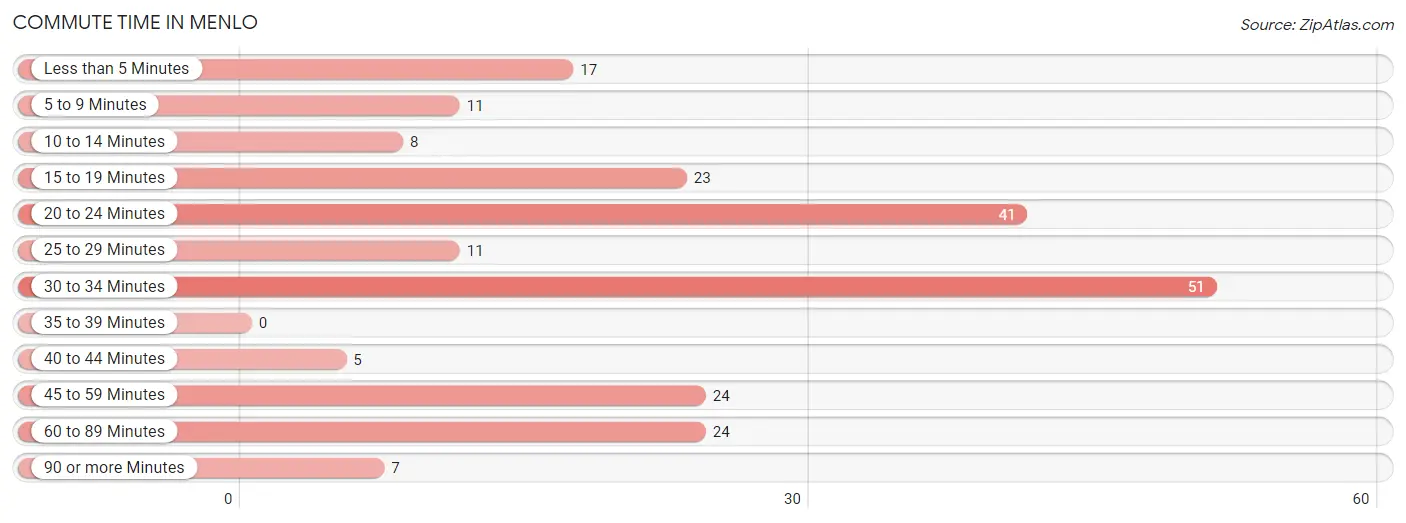
| Commute Time | # Commuters | % Commuters |
| Less than 5 Minutes | 17 | 7.7% |
| 5 to 9 Minutes | 11 | 5.0% |
| 10 to 14 Minutes | 8 | 3.6% |
| 15 to 19 Minutes | 23 | 10.4% |
| 20 to 24 Minutes | 41 | 18.5% |
| 25 to 29 Minutes | 11 | 5.0% |
| 30 to 34 Minutes | 51 | 23.0% |
| 35 to 39 Minutes | 0 | 0.0% |
| 40 to 44 Minutes | 5 | 2.2% |
| 45 to 59 Minutes | 24 | 10.8% |
| 60 to 89 Minutes | 24 | 10.8% |
| 90 or more Minutes | 7 | 3.2% |
Commute Time by Sex in Menlo
The most common commute times in Menlo are 20 to 24 minutes (39 commuters, 32.8%) for males and 30 to 34 minutes (24 commuters, 23.3%) for females.
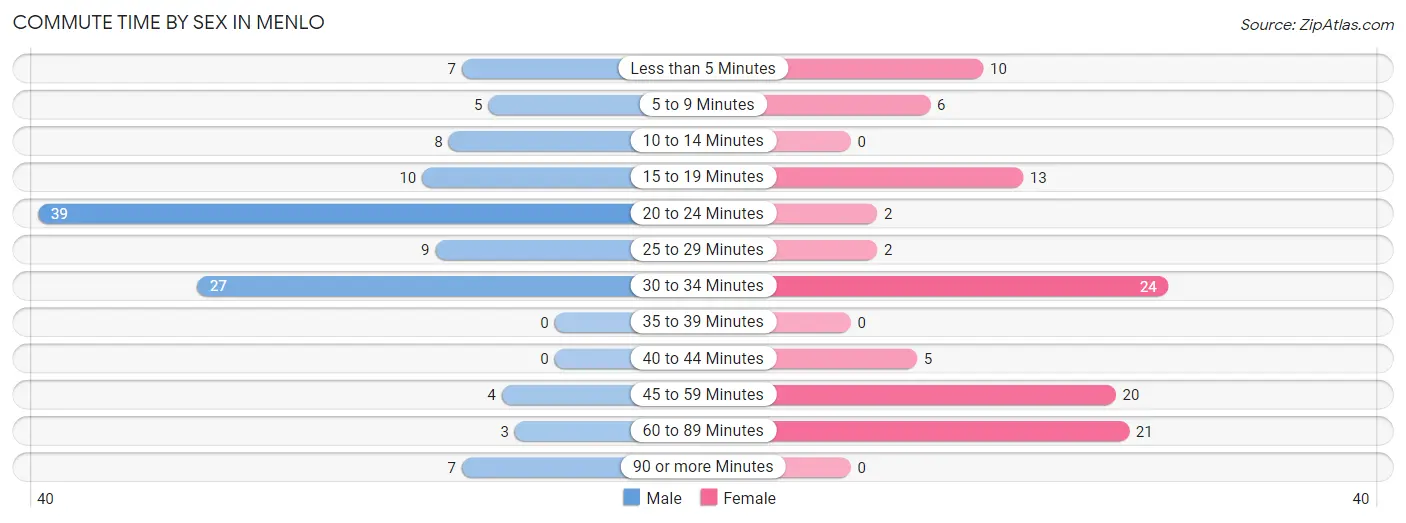
| Commute Time | Male | Female |
| Less than 5 Minutes | 7 (5.9%) | 10 (9.7%) |
| 5 to 9 Minutes | 5 (4.2%) | 6 (5.8%) |
| 10 to 14 Minutes | 8 (6.7%) | 0 (0.0%) |
| 15 to 19 Minutes | 10 (8.4%) | 13 (12.6%) |
| 20 to 24 Minutes | 39 (32.8%) | 2 (1.9%) |
| 25 to 29 Minutes | 9 (7.6%) | 2 (1.9%) |
| 30 to 34 Minutes | 27 (22.7%) | 24 (23.3%) |
| 35 to 39 Minutes | 0 (0.0%) | 0 (0.0%) |
| 40 to 44 Minutes | 0 (0.0%) | 5 (4.9%) |
| 45 to 59 Minutes | 4 (3.4%) | 20 (19.4%) |
| 60 to 89 Minutes | 3 (2.5%) | 21 (20.4%) |
| 90 or more Minutes | 7 (5.9%) | 0 (0.0%) |
Time of Departure to Work by Sex in Menlo
The most frequent times of departure to work in Menlo are 7:00 AM to 7:29 AM (49, 41.2%) for males and 7:30 AM to 7:59 AM (28, 27.2%) for females.
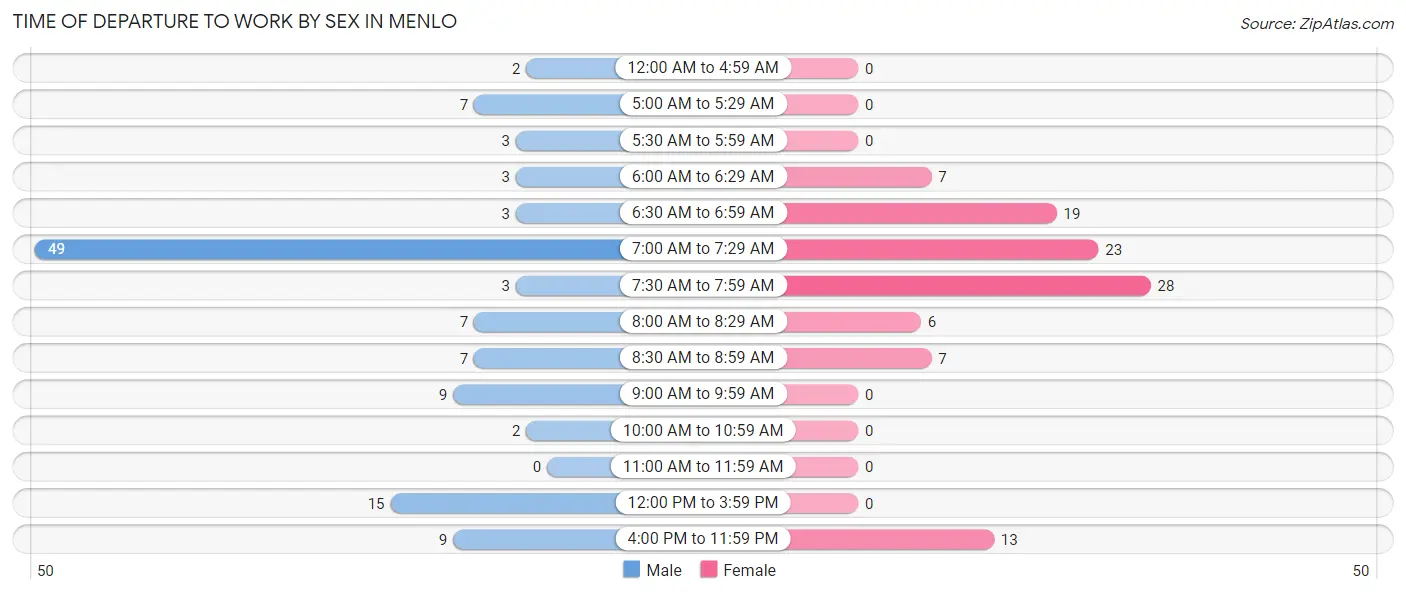
| Time of Departure | Male | Female |
| 12:00 AM to 4:59 AM | 2 (1.7%) | 0 (0.0%) |
| 5:00 AM to 5:29 AM | 7 (5.9%) | 0 (0.0%) |
| 5:30 AM to 5:59 AM | 3 (2.5%) | 0 (0.0%) |
| 6:00 AM to 6:29 AM | 3 (2.5%) | 7 (6.8%) |
| 6:30 AM to 6:59 AM | 3 (2.5%) | 19 (18.4%) |
| 7:00 AM to 7:29 AM | 49 (41.2%) | 23 (22.3%) |
| 7:30 AM to 7:59 AM | 3 (2.5%) | 28 (27.2%) |
| 8:00 AM to 8:29 AM | 7 (5.9%) | 6 (5.8%) |
| 8:30 AM to 8:59 AM | 7 (5.9%) | 7 (6.8%) |
| 9:00 AM to 9:59 AM | 9 (7.6%) | 0 (0.0%) |
| 10:00 AM to 10:59 AM | 2 (1.7%) | 0 (0.0%) |
| 11:00 AM to 11:59 AM | 0 (0.0%) | 0 (0.0%) |
| 12:00 PM to 3:59 PM | 15 (12.6%) | 0 (0.0%) |
| 4:00 PM to 11:59 PM | 9 (7.6%) | 13 (12.6%) |
| Total | 119 (100.0%) | 103 (100.0%) |
Housing Occupancy in Menlo
Occupancy by Ownership in Menlo
Of the total 229 dwellings in Menlo, owner-occupied units account for 107 (46.7%), while renter-occupied units make up 122 (53.3%).
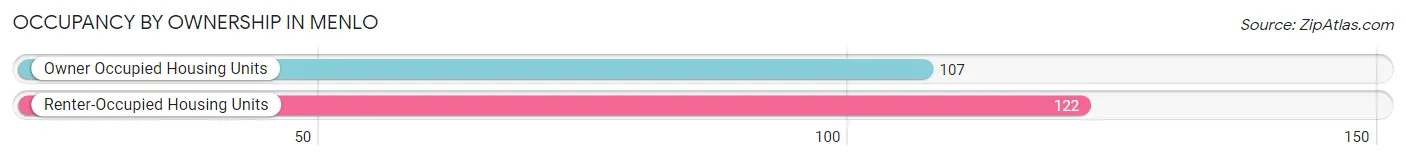
| Occupancy | # Housing Units | % Housing Units |
| Owner Occupied Housing Units | 107 | 46.7% |
| Renter-Occupied Housing Units | 122 | 53.3% |
| Total Occupied Housing Units | 229 | 100.0% |
Occupancy by Household Size in Menlo
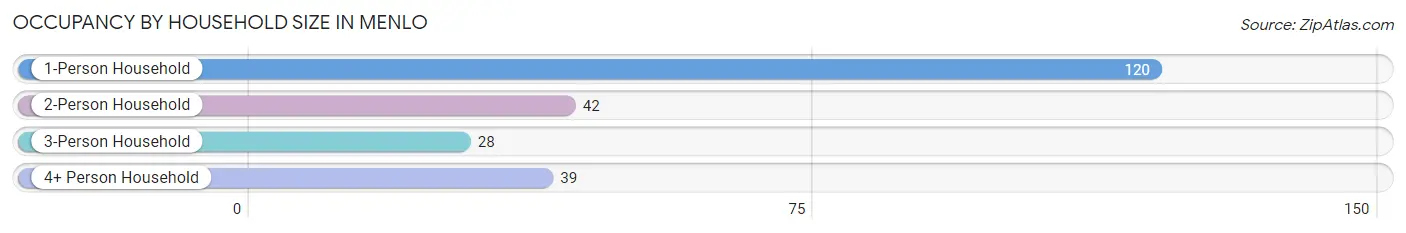
| Household Size | # Housing Units | % Housing Units |
| 1-Person Household | 120 | 52.4% |
| 2-Person Household | 42 | 18.3% |
| 3-Person Household | 28 | 12.2% |
| 4+ Person Household | 39 | 17.0% |
| Total Housing Units | 229 | 100.0% |
Occupancy by Ownership by Household Size in Menlo
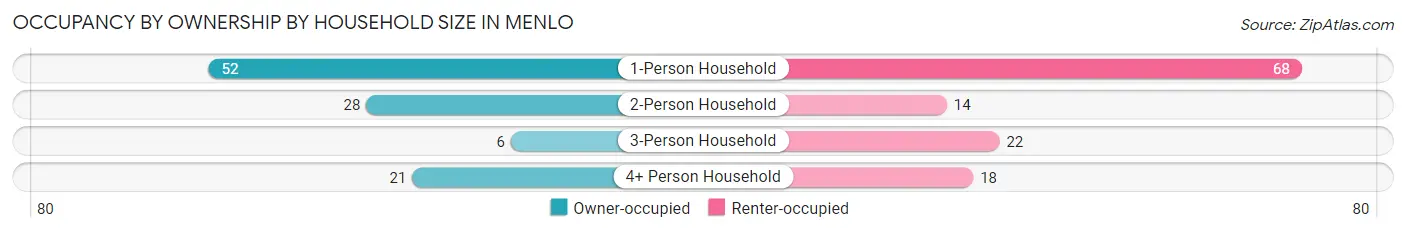
| Household Size | Owner-occupied | Renter-occupied |
| 1-Person Household | 52 (43.3%) | 68 (56.7%) |
| 2-Person Household | 28 (66.7%) | 14 (33.3%) |
| 3-Person Household | 6 (21.4%) | 22 (78.6%) |
| 4+ Person Household | 21 (53.8%) | 18 (46.2%) |
| Total Housing Units | 107 (46.7%) | 122 (53.3%) |
Occupancy by Educational Attainment in Menlo
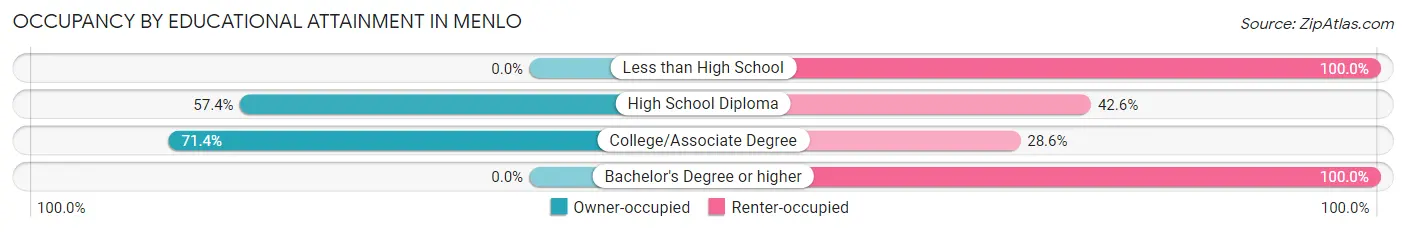
| Household Size | Owner-occupied | Renter-occupied |
| Less than High School | 0 (0.0%) | 23 (100.0%) |
| High School Diploma | 62 (57.4%) | 46 (42.6%) |
| College/Associate Degree | 45 (71.4%) | 18 (28.6%) |
| Bachelor's Degree or higher | 0 (0.0%) | 35 (100.0%) |
Occupancy by Age of Householder in Menlo
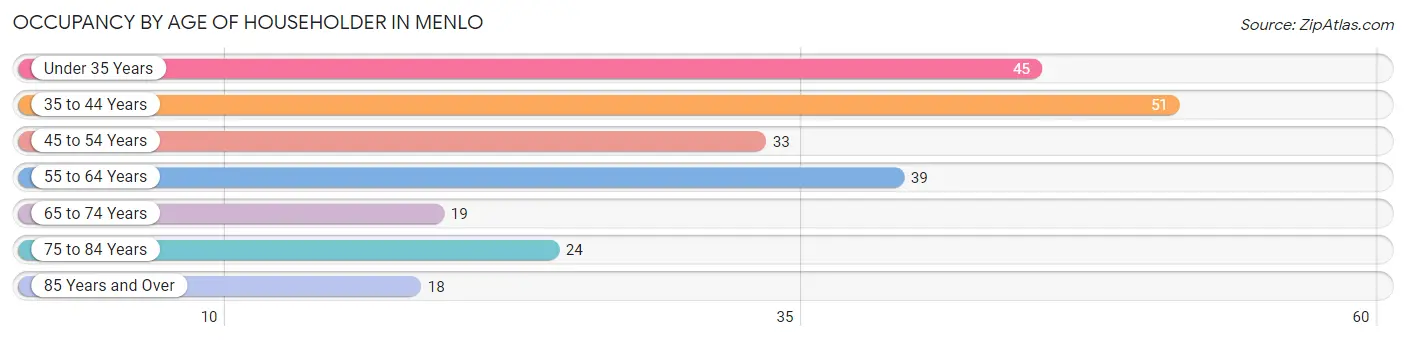
| Age Bracket | # Households | % Households |
| Under 35 Years | 45 | 19.7% |
| 35 to 44 Years | 51 | 22.3% |
| 45 to 54 Years | 33 | 14.4% |
| 55 to 64 Years | 39 | 17.0% |
| 65 to 74 Years | 19 | 8.3% |
| 75 to 84 Years | 24 | 10.5% |
| 85 Years and Over | 18 | 7.9% |
| Total | 229 | 100.0% |
Housing Finances in Menlo
Median Income by Occupancy in Menlo
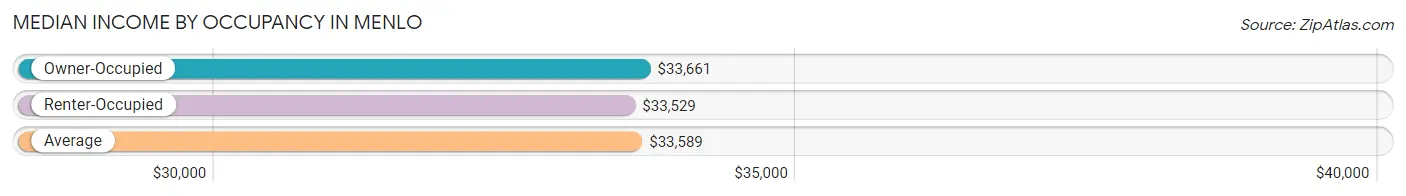
| Occupancy Type | # Households | Median Income |
| Owner-Occupied | 107 (46.7%) | $33,661 |
| Renter-Occupied | 122 (53.3%) | $33,529 |
| Average | 229 (100.0%) | $33,589 |
Occupancy by Householder Income Bracket in Menlo
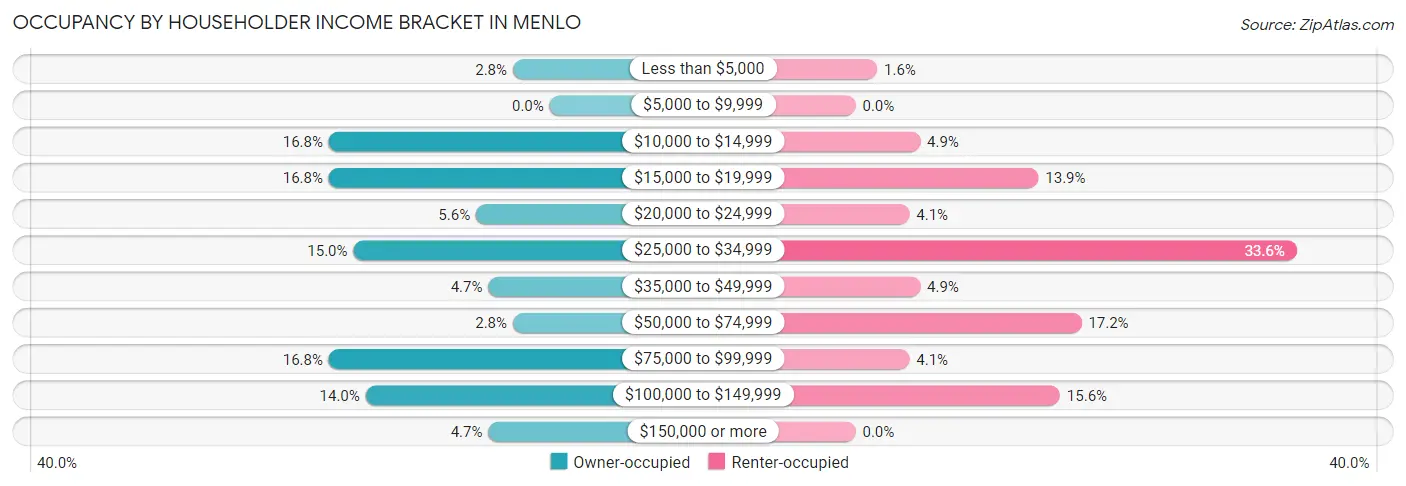
| Income Bracket | Owner-occupied | Renter-occupied |
| Less than $5,000 | 3 (2.8%) | 2 (1.6%) |
| $5,000 to $9,999 | 0 (0.0%) | 0 (0.0%) |
| $10,000 to $14,999 | 18 (16.8%) | 6 (4.9%) |
| $15,000 to $19,999 | 18 (16.8%) | 17 (13.9%) |
| $20,000 to $24,999 | 6 (5.6%) | 5 (4.1%) |
| $25,000 to $34,999 | 16 (14.9%) | 41 (33.6%) |
| $35,000 to $49,999 | 5 (4.7%) | 6 (4.9%) |
| $50,000 to $74,999 | 3 (2.8%) | 21 (17.2%) |
| $75,000 to $99,999 | 18 (16.8%) | 5 (4.1%) |
| $100,000 to $149,999 | 15 (14.0%) | 19 (15.6%) |
| $150,000 or more | 5 (4.7%) | 0 (0.0%) |
| Total | 107 (100.0%) | 122 (100.0%) |
Monthly Housing Cost Tiers in Menlo
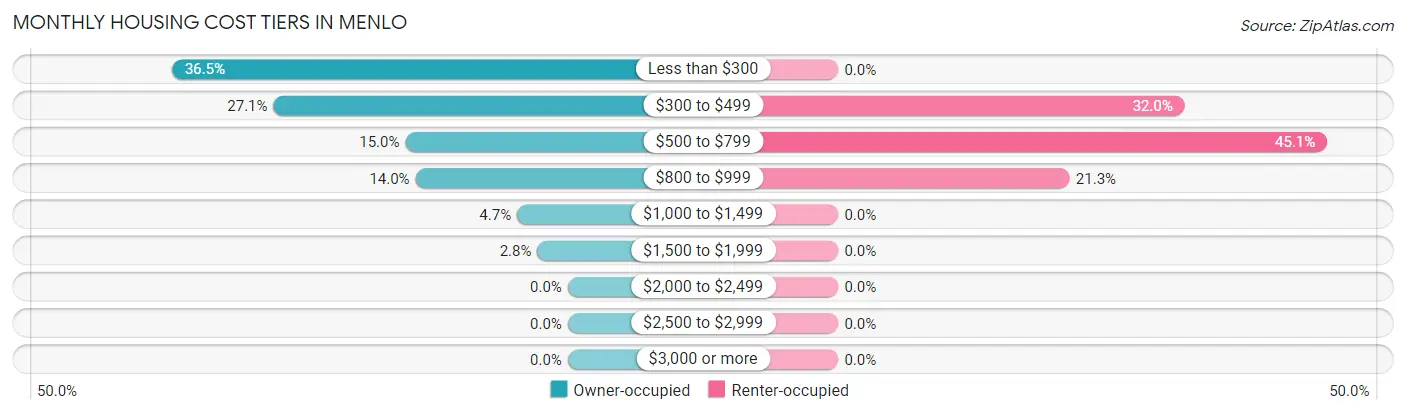
| Monthly Cost | Owner-occupied | Renter-occupied |
| Less than $300 | 39 (36.4%) | 0 (0.0%) |
| $300 to $499 | 29 (27.1%) | 39 (32.0%) |
| $500 to $799 | 16 (14.9%) | 55 (45.1%) |
| $800 to $999 | 15 (14.0%) | 26 (21.3%) |
| $1,000 to $1,499 | 5 (4.7%) | 0 (0.0%) |
| $1,500 to $1,999 | 3 (2.8%) | 0 (0.0%) |
| $2,000 to $2,499 | 0 (0.0%) | 0 (0.0%) |
| $2,500 to $2,999 | 0 (0.0%) | 0 (0.0%) |
| $3,000 or more | 0 (0.0%) | 0 (0.0%) |
| Total | 107 (100.0%) | 122 (100.0%) |
Physical Housing Characteristics in Menlo
Housing Structures in Menlo
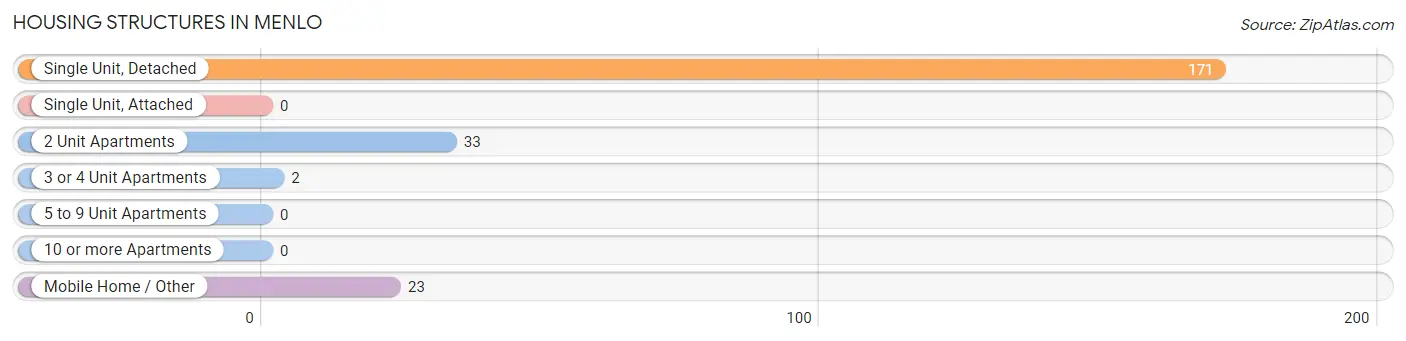
| Structure Type | # Housing Units | % Housing Units |
| Single Unit, Detached | 171 | 74.7% |
| Single Unit, Attached | 0 | 0.0% |
| 2 Unit Apartments | 33 | 14.4% |
| 3 or 4 Unit Apartments | 2 | 0.9% |
| 5 to 9 Unit Apartments | 0 | 0.0% |
| 10 or more Apartments | 0 | 0.0% |
| Mobile Home / Other | 23 | 10.0% |
| Total | 229 | 100.0% |
Housing Structures by Occupancy in Menlo
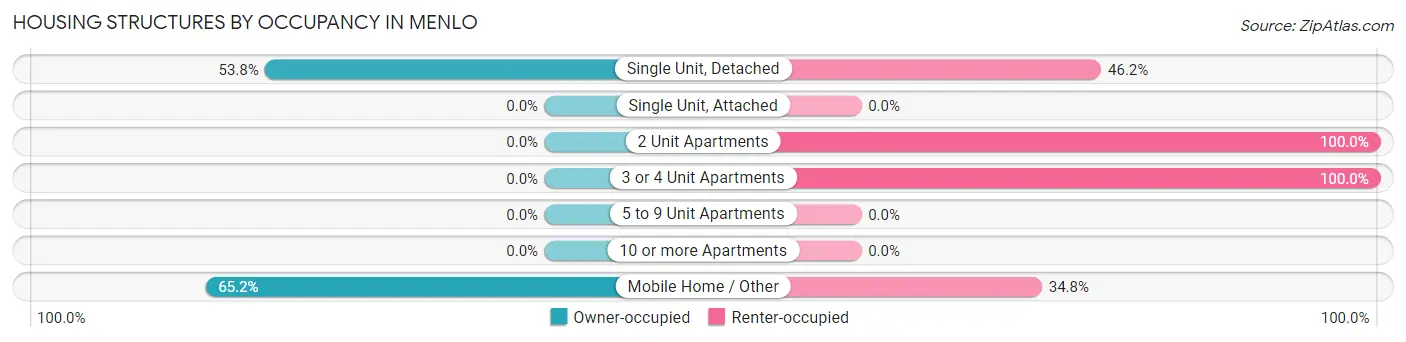
| Structure Type | Owner-occupied | Renter-occupied |
| Single Unit, Detached | 92 (53.8%) | 79 (46.2%) |
| Single Unit, Attached | 0 (0.0%) | 0 (0.0%) |
| 2 Unit Apartments | 0 (0.0%) | 33 (100.0%) |
| 3 or 4 Unit Apartments | 0 (0.0%) | 2 (100.0%) |
| 5 to 9 Unit Apartments | 0 (0.0%) | 0 (0.0%) |
| 10 or more Apartments | 0 (0.0%) | 0 (0.0%) |
| Mobile Home / Other | 15 (65.2%) | 8 (34.8%) |
| Total | 107 (46.7%) | 122 (53.3%) |
Housing Structures by Number of Rooms in Menlo
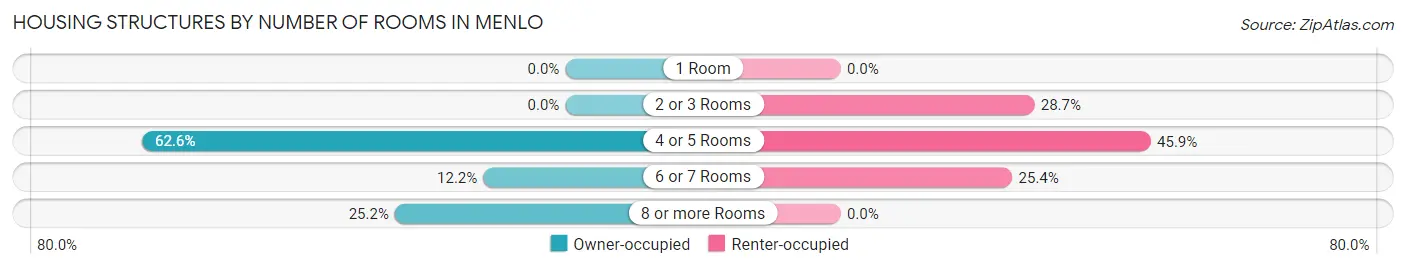
| Number of Rooms | Owner-occupied | Renter-occupied |
| 1 Room | 0 (0.0%) | 0 (0.0%) |
| 2 or 3 Rooms | 0 (0.0%) | 35 (28.7%) |
| 4 or 5 Rooms | 67 (62.6%) | 56 (45.9%) |
| 6 or 7 Rooms | 13 (12.1%) | 31 (25.4%) |
| 8 or more Rooms | 27 (25.2%) | 0 (0.0%) |
| Total | 107 (100.0%) | 122 (100.0%) |
Housing Structure by Heating Type in Menlo
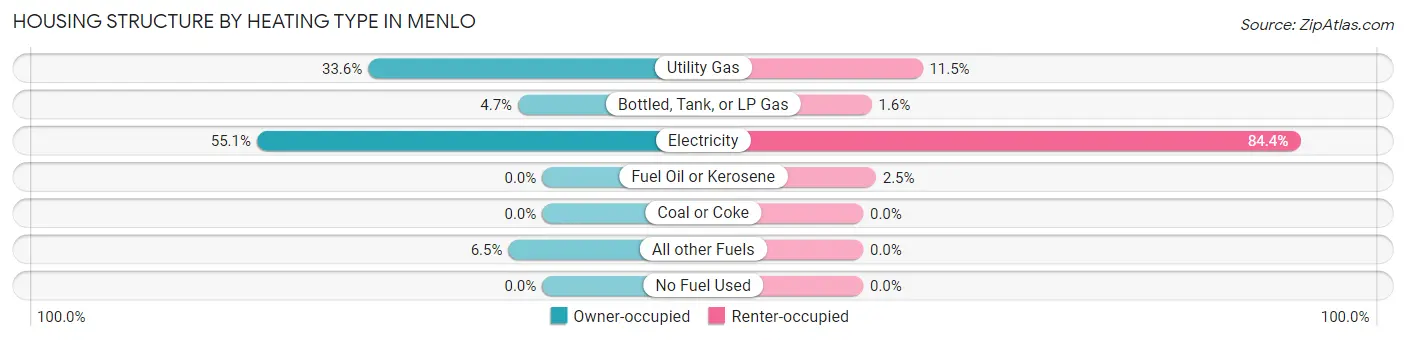
| Heating Type | Owner-occupied | Renter-occupied |
| Utility Gas | 36 (33.6%) | 14 (11.5%) |
| Bottled, Tank, or LP Gas | 5 (4.7%) | 2 (1.6%) |
| Electricity | 59 (55.1%) | 103 (84.4%) |
| Fuel Oil or Kerosene | 0 (0.0%) | 3 (2.5%) |
| Coal or Coke | 0 (0.0%) | 0 (0.0%) |
| All other Fuels | 7 (6.5%) | 0 (0.0%) |
| No Fuel Used | 0 (0.0%) | 0 (0.0%) |
| Total | 107 (100.0%) | 122 (100.0%) |
Household Vehicle Usage in Menlo
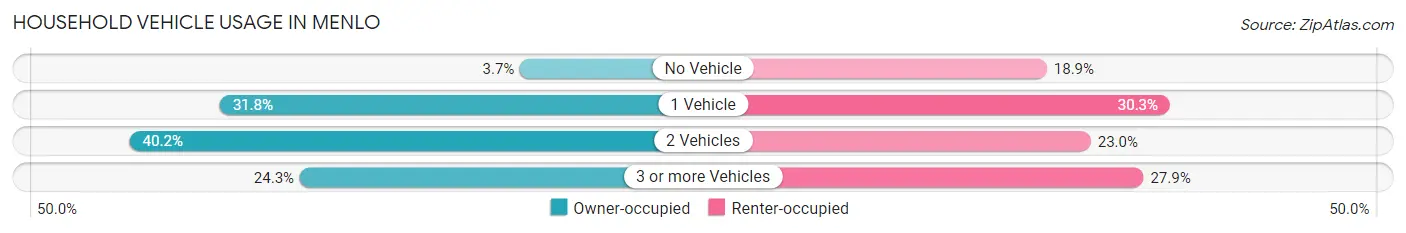
| Vehicles per Household | Owner-occupied | Renter-occupied |
| No Vehicle | 4 (3.7%) | 23 (18.9%) |
| 1 Vehicle | 34 (31.8%) | 37 (30.3%) |
| 2 Vehicles | 43 (40.2%) | 28 (23.0%) |
| 3 or more Vehicles | 26 (24.3%) | 34 (27.9%) |
| Total | 107 (100.0%) | 122 (100.0%) |
Real Estate & Mortgages in Menlo
Real Estate and Mortgage Overview in Menlo
| Characteristic | Without Mortgage | With Mortgage |
| Housing Units | 84 | 23 |
| Median Property Value | $95,000 | $0 |
| Median Household Income | $23,750 | $0 |
| Monthly Housing Costs | $309 | $0 |
| Real Estate Taxes | $886 | $0 |
Property Value by Mortgage Status in Menlo
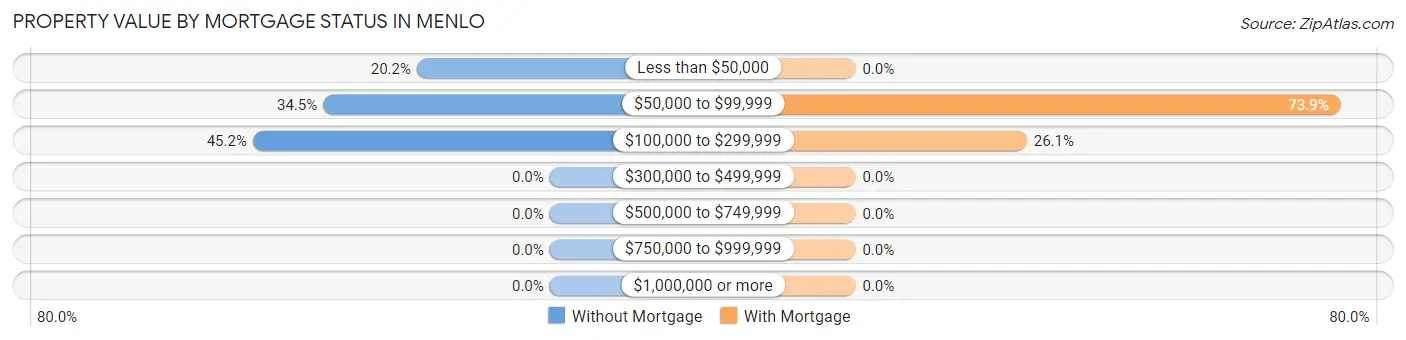
| Property Value | Without Mortgage | With Mortgage |
| Less than $50,000 | 17 (20.2%) | 0 (0.0%) |
| $50,000 to $99,999 | 29 (34.5%) | 17 (73.9%) |
| $100,000 to $299,999 | 38 (45.2%) | 6 (26.1%) |
| $300,000 to $499,999 | 0 (0.0%) | 0 (0.0%) |
| $500,000 to $749,999 | 0 (0.0%) | 0 (0.0%) |
| $750,000 to $999,999 | 0 (0.0%) | 0 (0.0%) |
| $1,000,000 or more | 0 (0.0%) | 0 (0.0%) |
| Total | 84 (100.0%) | 23 (100.0%) |
Household Income by Mortgage Status in Menlo
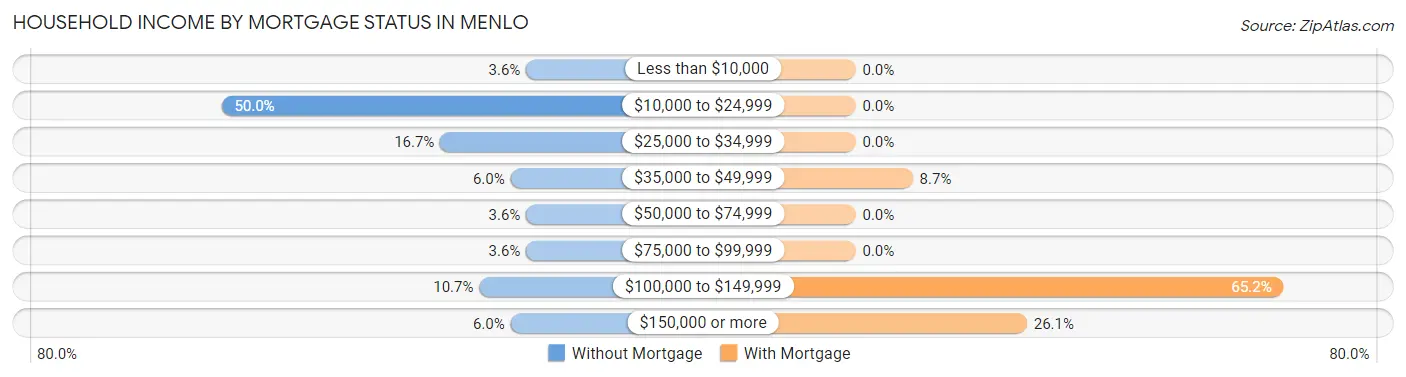
| Household Income | Without Mortgage | With Mortgage |
| Less than $10,000 | 3 (3.6%) | 0 (0.0%) |
| $10,000 to $24,999 | 42 (50.0%) | 0 (0.0%) |
| $25,000 to $34,999 | 14 (16.7%) | 0 (0.0%) |
| $35,000 to $49,999 | 5 (5.9%) | 2 (8.7%) |
| $50,000 to $74,999 | 3 (3.6%) | 0 (0.0%) |
| $75,000 to $99,999 | 3 (3.6%) | 0 (0.0%) |
| $100,000 to $149,999 | 9 (10.7%) | 15 (65.2%) |
| $150,000 or more | 5 (5.9%) | 6 (26.1%) |
| Total | 84 (100.0%) | 23 (100.0%) |
Property Value to Household Income Ratio in Menlo
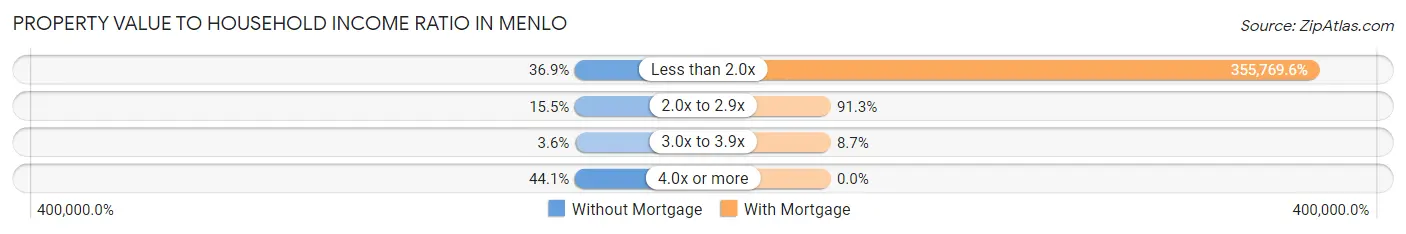
| Value-to-Income Ratio | Without Mortgage | With Mortgage |
| Less than 2.0x | 31 (36.9%) | 81,827 (355,769.6%) |
| 2.0x to 2.9x | 13 (15.5%) | 21 (91.3%) |
| 3.0x to 3.9x | 3 (3.6%) | 2 (8.7%) |
| 4.0x or more | 37 (44.1%) | 0 (0.0%) |
| Total | 84 (100.0%) | 23 (100.0%) |
Real Estate Taxes by Mortgage Status in Menlo
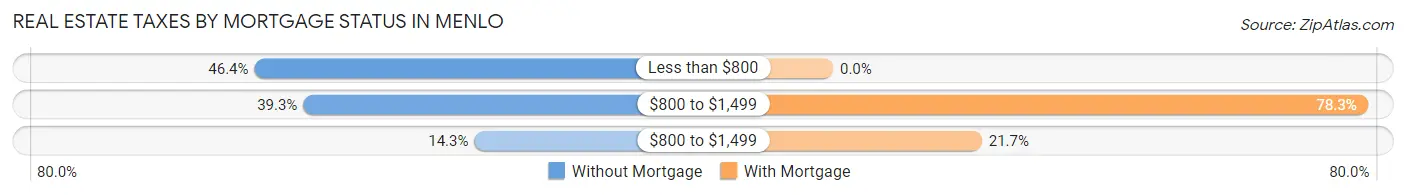
| Property Taxes | Without Mortgage | With Mortgage |
| Less than $800 | 39 (46.4%) | 0 (0.0%) |
| $800 to $1,499 | 33 (39.3%) | 18 (78.3%) |
| $800 to $1,499 | 12 (14.3%) | 5 (21.7%) |
| Total | 84 (100.0%) | 23 (100.0%) |
Health & Disability in Menlo
Health Insurance Coverage by Age in Menlo
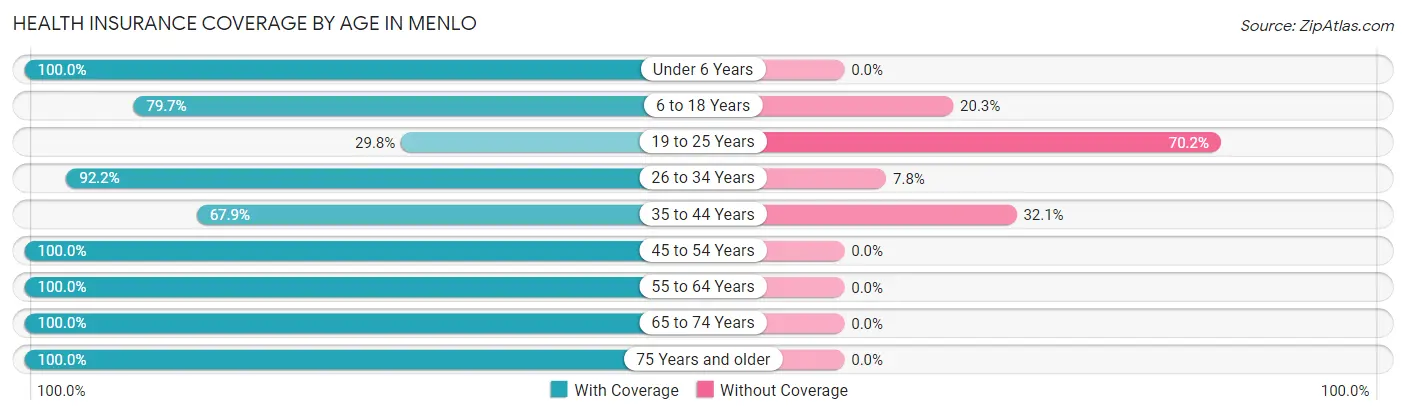
| Age Bracket | With Coverage | Without Coverage |
| Under 6 Years | 19 (100.0%) | 0 (0.0%) |
| 6 to 18 Years | 55 (79.7%) | 14 (20.3%) |
| 19 to 25 Years | 14 (29.8%) | 33 (70.2%) |
| 26 to 34 Years | 71 (92.2%) | 6 (7.8%) |
| 35 to 44 Years | 55 (67.9%) | 26 (32.1%) |
| 45 to 54 Years | 51 (100.0%) | 0 (0.0%) |
| 55 to 64 Years | 51 (100.0%) | 0 (0.0%) |
| 65 to 74 Years | 27 (100.0%) | 0 (0.0%) |
| 75 Years and older | 47 (100.0%) | 0 (0.0%) |
| Total | 390 (83.2%) | 79 (16.8%) |
Health Insurance Coverage by Citizenship Status in Menlo
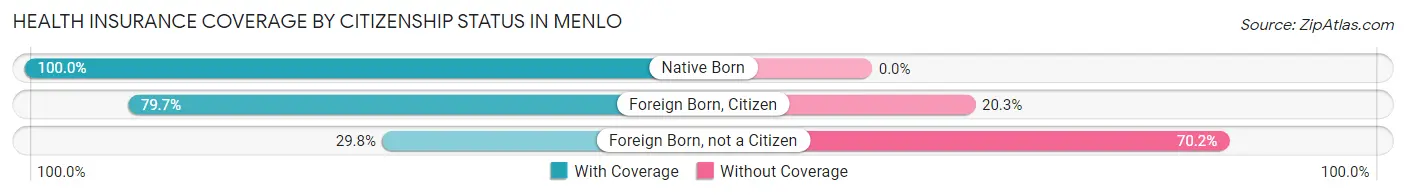
| Citizenship Status | With Coverage | Without Coverage |
| Native Born | 19 (100.0%) | 0 (0.0%) |
| Foreign Born, Citizen | 55 (79.7%) | 14 (20.3%) |
| Foreign Born, not a Citizen | 14 (29.8%) | 33 (70.2%) |
Health Insurance Coverage by Household Income in Menlo
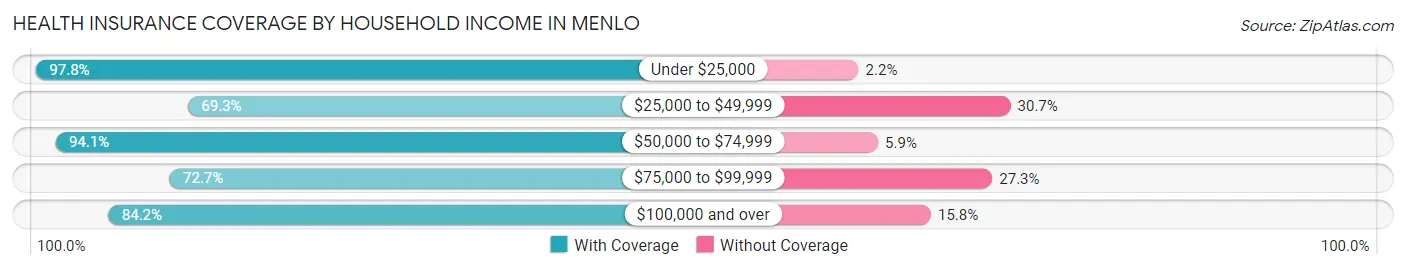
| Household Income | With Coverage | Without Coverage |
| Under $25,000 | 88 (97.8%) | 2 (2.2%) |
| $25,000 to $49,999 | 70 (69.3%) | 31 (30.7%) |
| $50,000 to $74,999 | 64 (94.1%) | 4 (5.9%) |
| $75,000 to $99,999 | 56 (72.7%) | 21 (27.3%) |
| $100,000 and over | 112 (84.2%) | 21 (15.8%) |
Public vs Private Health Insurance Coverage by Age in Menlo
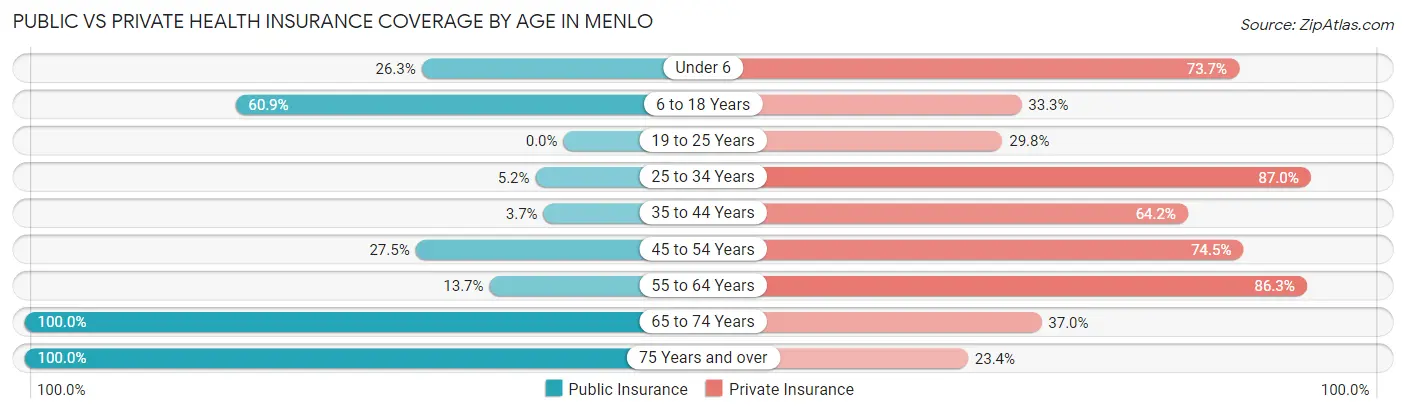
| Age Bracket | Public Insurance | Private Insurance |
| Under 6 | 5 (26.3%) | 14 (73.7%) |
| 6 to 18 Years | 42 (60.9%) | 23 (33.3%) |
| 19 to 25 Years | 0 (0.0%) | 14 (29.8%) |
| 25 to 34 Years | 4 (5.2%) | 67 (87.0%) |
| 35 to 44 Years | 3 (3.7%) | 52 (64.2%) |
| 45 to 54 Years | 14 (27.5%) | 38 (74.5%) |
| 55 to 64 Years | 7 (13.7%) | 44 (86.3%) |
| 65 to 74 Years | 27 (100.0%) | 10 (37.0%) |
| 75 Years and over | 47 (100.0%) | 11 (23.4%) |
| Total | 149 (31.8%) | 273 (58.2%) |
Disability Status by Sex by Age in Menlo
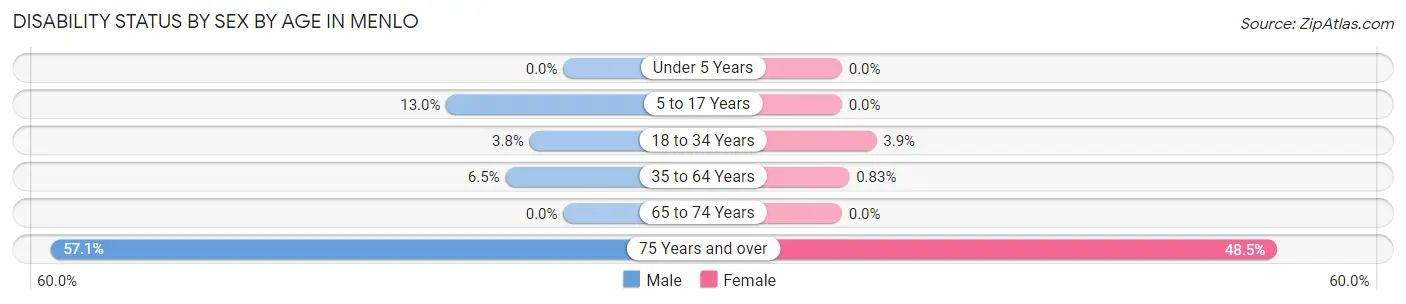
| Age Bracket | Male | Female |
| Under 5 Years | 0 (0.0%) | 0 (0.0%) |
| 5 to 17 Years | 3 (13.0%) | 0 (0.0%) |
| 18 to 34 Years | 3 (3.7%) | 2 (3.8%) |
| 35 to 64 Years | 4 (6.5%) | 1 (0.8%) |
| 65 to 74 Years | 0 (0.0%) | 0 (0.0%) |
| 75 Years and over | 8 (57.1%) | 16 (48.5%) |
Disability Class by Sex by Age in Menlo
Disability Class: Hearing Difficulty
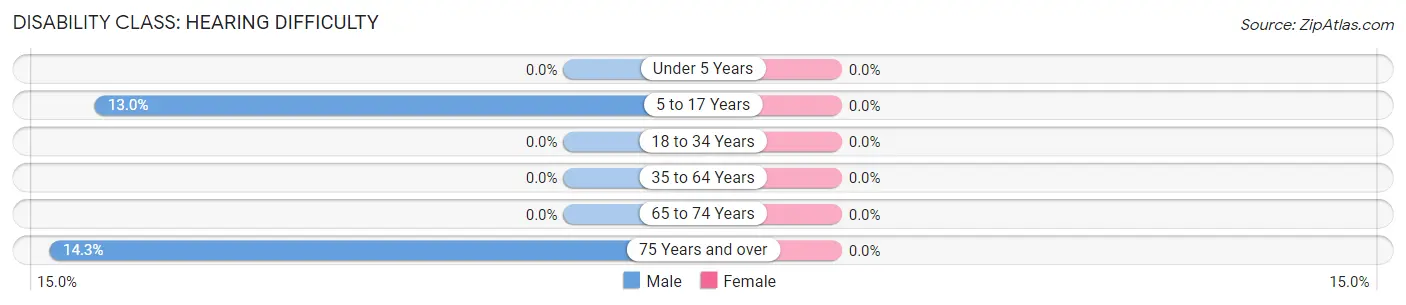
| Age Bracket | Male | Female |
| Under 5 Years | 0 (0.0%) | 0 (0.0%) |
| 5 to 17 Years | 3 (13.0%) | 0 (0.0%) |
| 18 to 34 Years | 0 (0.0%) | 0 (0.0%) |
| 35 to 64 Years | 0 (0.0%) | 0 (0.0%) |
| 65 to 74 Years | 0 (0.0%) | 0 (0.0%) |
| 75 Years and over | 2 (14.3%) | 0 (0.0%) |
Disability Class: Vision Difficulty
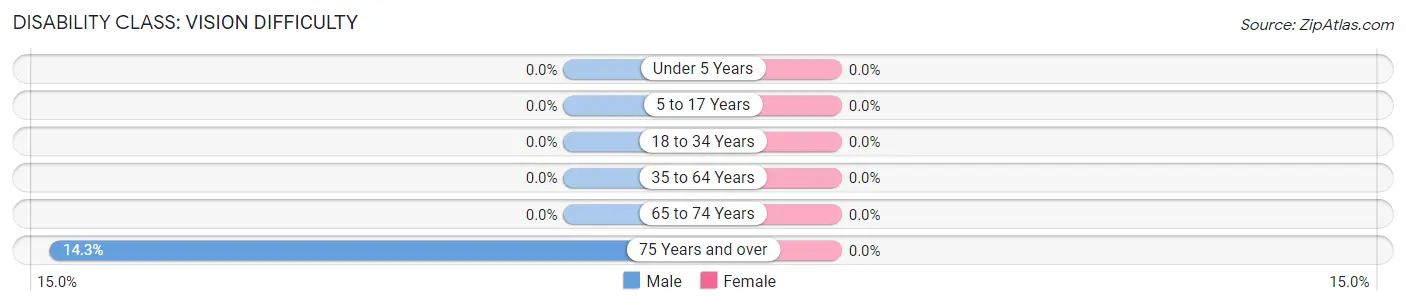
| Age Bracket | Male | Female |
| Under 5 Years | 0 (0.0%) | 0 (0.0%) |
| 5 to 17 Years | 0 (0.0%) | 0 (0.0%) |
| 18 to 34 Years | 0 (0.0%) | 0 (0.0%) |
| 35 to 64 Years | 0 (0.0%) | 0 (0.0%) |
| 65 to 74 Years | 0 (0.0%) | 0 (0.0%) |
| 75 Years and over | 2 (14.3%) | 0 (0.0%) |
Disability Class: Cognitive Difficulty
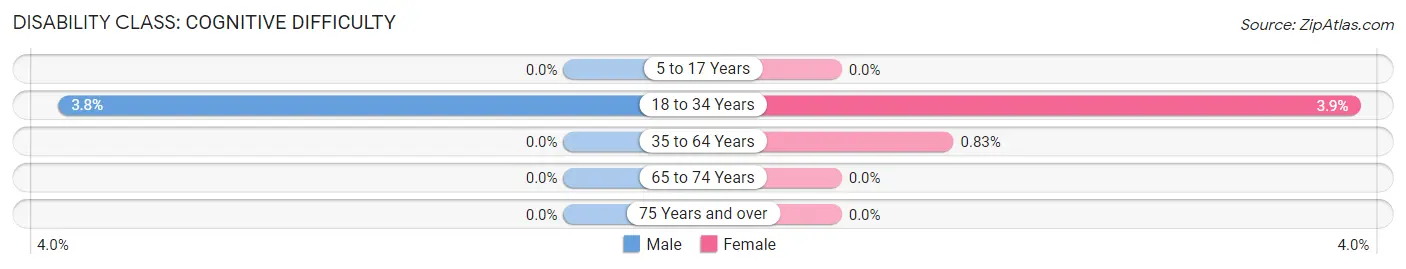
| Age Bracket | Male | Female |
| 5 to 17 Years | 0 (0.0%) | 0 (0.0%) |
| 18 to 34 Years | 3 (3.7%) | 2 (3.8%) |
| 35 to 64 Years | 0 (0.0%) | 1 (0.8%) |
| 65 to 74 Years | 0 (0.0%) | 0 (0.0%) |
| 75 Years and over | 0 (0.0%) | 0 (0.0%) |
Disability Class: Ambulatory Difficulty
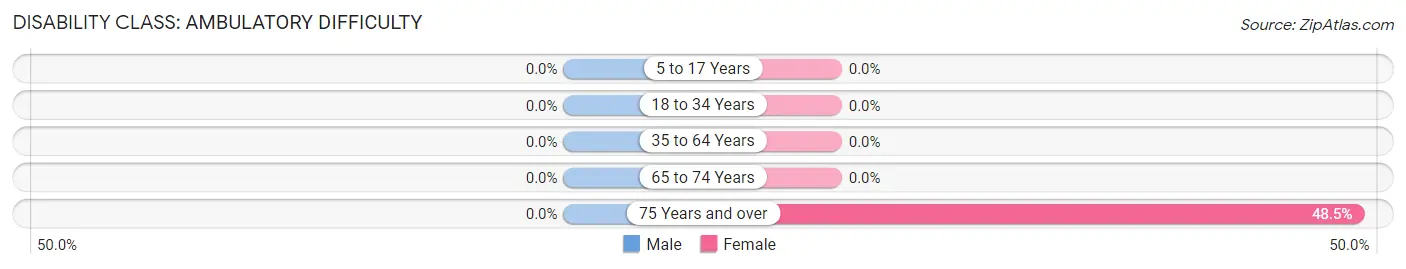
| Age Bracket | Male | Female |
| 5 to 17 Years | 0 (0.0%) | 0 (0.0%) |
| 18 to 34 Years | 0 (0.0%) | 0 (0.0%) |
| 35 to 64 Years | 0 (0.0%) | 0 (0.0%) |
| 65 to 74 Years | 0 (0.0%) | 0 (0.0%) |
| 75 Years and over | 0 (0.0%) | 16 (48.5%) |
Disability Class: Self-Care Difficulty
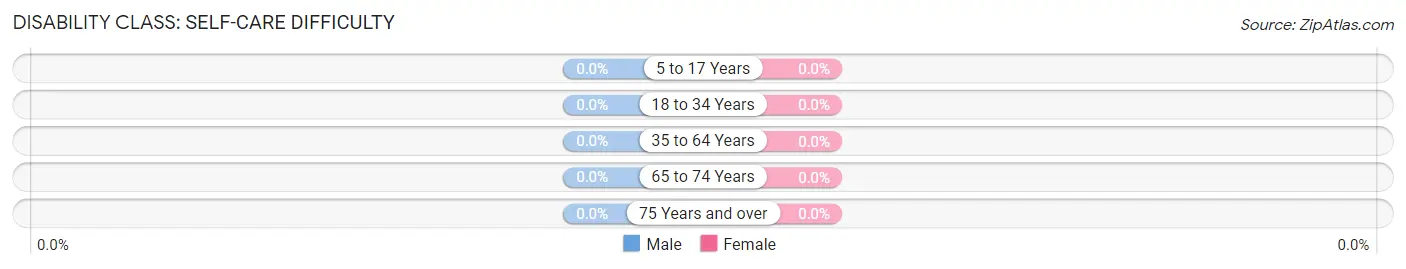
| Age Bracket | Male | Female |
| 5 to 17 Years | 0 (0.0%) | 0 (0.0%) |
| 18 to 34 Years | 0 (0.0%) | 0 (0.0%) |
| 35 to 64 Years | 0 (0.0%) | 0 (0.0%) |
| 65 to 74 Years | 0 (0.0%) | 0 (0.0%) |
| 75 Years and over | 0 (0.0%) | 0 (0.0%) |
Technology Access in Menlo
Computing Device Access in Menlo
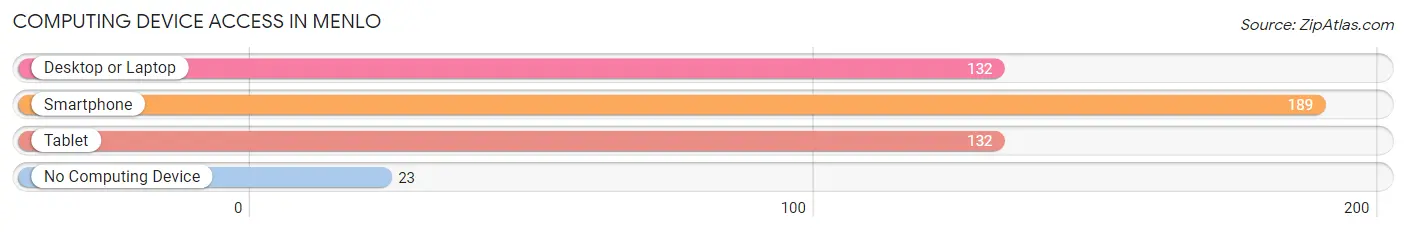
| Device Type | # Households | % Households |
| Desktop or Laptop | 132 | 57.6% |
| Smartphone | 189 | 82.5% |
| Tablet | 132 | 57.6% |
| No Computing Device | 23 | 10.0% |
| Total | 229 | 100.0% |
Internet Access in Menlo
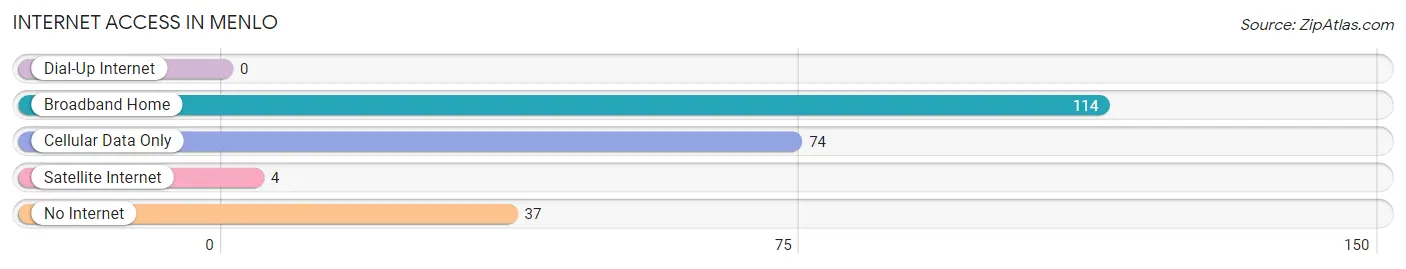
| Internet Type | # Households | % Households |
| Dial-Up Internet | 0 | 0.0% |
| Broadband Home | 114 | 49.8% |
| Cellular Data Only | 74 | 32.3% |
| Satellite Internet | 4 | 1.8% |
| No Internet | 37 | 16.2% |
| Total | 229 | 100.0% |
Menlo Summary
Menlo, Georgia is a small town located in the northwest corner of the state, in the foothills of the Appalachian Mountains. It is situated in the Chattahoochee National Forest, and is part of the larger metropolitan area of Dalton, Georgia. The town has a population of just over 1,000 people, and is known for its rural charm and small-town atmosphere.
Geography
Menlo is located in the northwest corner of Georgia, in the foothills of the Appalachian Mountains. It is situated in the Chattahoochee National Forest, and is part of the larger metropolitan area of Dalton, Georgia. The town is located at the intersection of US Highway 41 and Georgia State Route 2. The town is surrounded by the Chattahoochee National Forest, and is home to several small lakes and streams. The town is located at an elevation of 1,000 feet, and has a humid subtropical climate.
History
Menlo was founded in 1887 by a group of settlers from the nearby town of Dalton. The town was named after the nearby Menlo Creek, which was named after the nearby Menlo Church. The town was originally a farming community, and the main crops grown were cotton, corn, and tobacco. The town was also home to several small businesses, including a general store, a blacksmith, and a sawmill.
In the early 1900s, the town began to grow and develop. The town was home to several churches, a school, and a post office. The town also had a railroad station, which connected the town to the larger cities of Dalton and Chattanooga.
In the 1950s, the town began to decline as the railroad station closed and the population began to move away. The town was eventually incorporated in 1967, and the population has remained relatively stable since then.
Economy
The economy of Menlo is largely based on agriculture and tourism. The town is home to several small farms, which produce a variety of crops, including corn, cotton, and tobacco. The town is also home to several small businesses, including a general store, a blacksmith, and a sawmill.
The town is also home to several tourist attractions, including the Menlo Creek Nature Preserve, which is home to a variety of wildlife, and the Menlo Historical Society Museum, which houses artifacts from the town's history. The town is also home to several small restaurants and shops, which cater to both locals and tourists.
Demographics
As of the 2010 census, the population of Menlo was 1,072. The racial makeup of the town was 95.3% White, 0.9% African American, 0.3% Native American, 0.3% Asian, 0.1% Pacific Islander, 1.2% from other races, and 1.9% from two or more races. Hispanic or Latino of any race were 3.2% of the population.
The median income for a household in Menlo was $35,625, and the median income for a family was $41,250. The per capita income for the town was $17,845. About 11.2% of families and 14.2% of the population were below the poverty line, including 18.2% of those under age 18 and 8.3% of those age 65 or over.
Common Questions
What is Per Capita Income in Menlo?
Per Capita income in Menlo is $26,553.
What is the Median Family Income in Menlo?
Median Family Income in Menlo is $77,500.
What is the Median Household income in Menlo?
Median Household Income in Menlo is $33,589.
What is Income or Wage Gap in Menlo?
Income or Wage Gap in Menlo is 57.4%.
Women in Menlo earn 42.6 cents for every dollar earned by a man.
What is Inequality or Gini Index in Menlo?
Inequality or Gini Index in Menlo is 0.42.
What is the Total Population of Menlo?
Total Population of Menlo is 469.
What is the Total Male Population of Menlo?
Total Male Population of Menlo is 192.
What is the Total Female Population of Menlo?
Total Female Population of Menlo is 277.
What is the Ratio of Males per 100 Females in Menlo?
There are 69.31 Males per 100 Females in Menlo.
What is the Ratio of Females per 100 Males in Menlo?
There are 144.27 Females per 100 Males in Menlo.
What is the Median Population Age in Menlo?
Median Population Age in Menlo is 35.8 Years.
What is the Average Family Size in Menlo
Average Family Size in Menlo is 3.2 People.
What is the Average Household Size in Menlo
Average Household Size in Menlo is 2.0 People.
How Large is the Labor Force in Menlo?
There are 260 People in the Labor Forcein in Menlo.
What is the Percentage of People in the Labor Force in Menlo?
66.8% of People are in the Labor Force in Menlo.
What is the Unemployment Rate in Menlo?
Unemployment Rate in Menlo is 4.6%.