Manchester, GA Map & Demographics
Manchester Map
Manchester Overview
$22,685
PER CAPITA INCOME
$63,365
AVG FAMILY INCOME
$48,301
AVG HOUSEHOLD INCOME
41.7%
WAGE / INCOME GAP [ % ]
58.3¢/ $1
WAGE / INCOME GAP [ $ ]
0.44
INEQUALITY / GINI INDEX
3,612
TOTAL POPULATION
1,690
MALE POPULATION
1,922
FEMALE POPULATION
87.93
MALES / 100 FEMALES
113.73
FEMALES / 100 MALES
33.0
MEDIAN AGE
3.1
AVG FAMILY SIZE
2.5
AVG HOUSEHOLD SIZE
1,291
LABOR FORCE [ PEOPLE ]
47.7%
PERCENT IN LABOR FORCE
6.6%
UNEMPLOYMENT RATE
Manchester Zip Codes
Manchester Area Codes
Income in Manchester
Income Overview in Manchester
Per Capita Income in Manchester is $22,685, while median incomes of families and households are $63,365 and $48,301 respectively.
| Characteristic | Number | Measure |
| Per Capita Income | 3,612 | $22,685 |
| Median Family Income | 993 | $63,365 |
| Mean Family Income | 993 | $67,642 |
| Median Household Income | 1,458 | $48,301 |
| Mean Household Income | 1,458 | $58,745 |
| Income Deficit | 993 | $0 |
| Wage / Income Gap (%) | 3,612 | 41.69% |
| Wage / Income Gap ($) | 3,612 | 58.31¢ per $1 |
| Gini / Inequality Index | 3,612 | 0.44 |
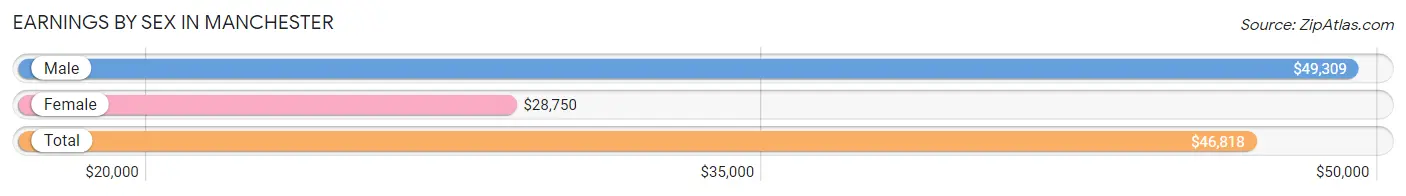
Earnings by Sex in Manchester
Average Earnings in Manchester are $46,818, $49,309 for men and $28,750 for women, a difference of 41.7%.
| Sex | Number | Average Earnings |
| Male | 792 (61.4%) | $49,309 |
| Female | 498 (38.6%) | $28,750 |
| Total | 1,290 (100.0%) | $46,818 |
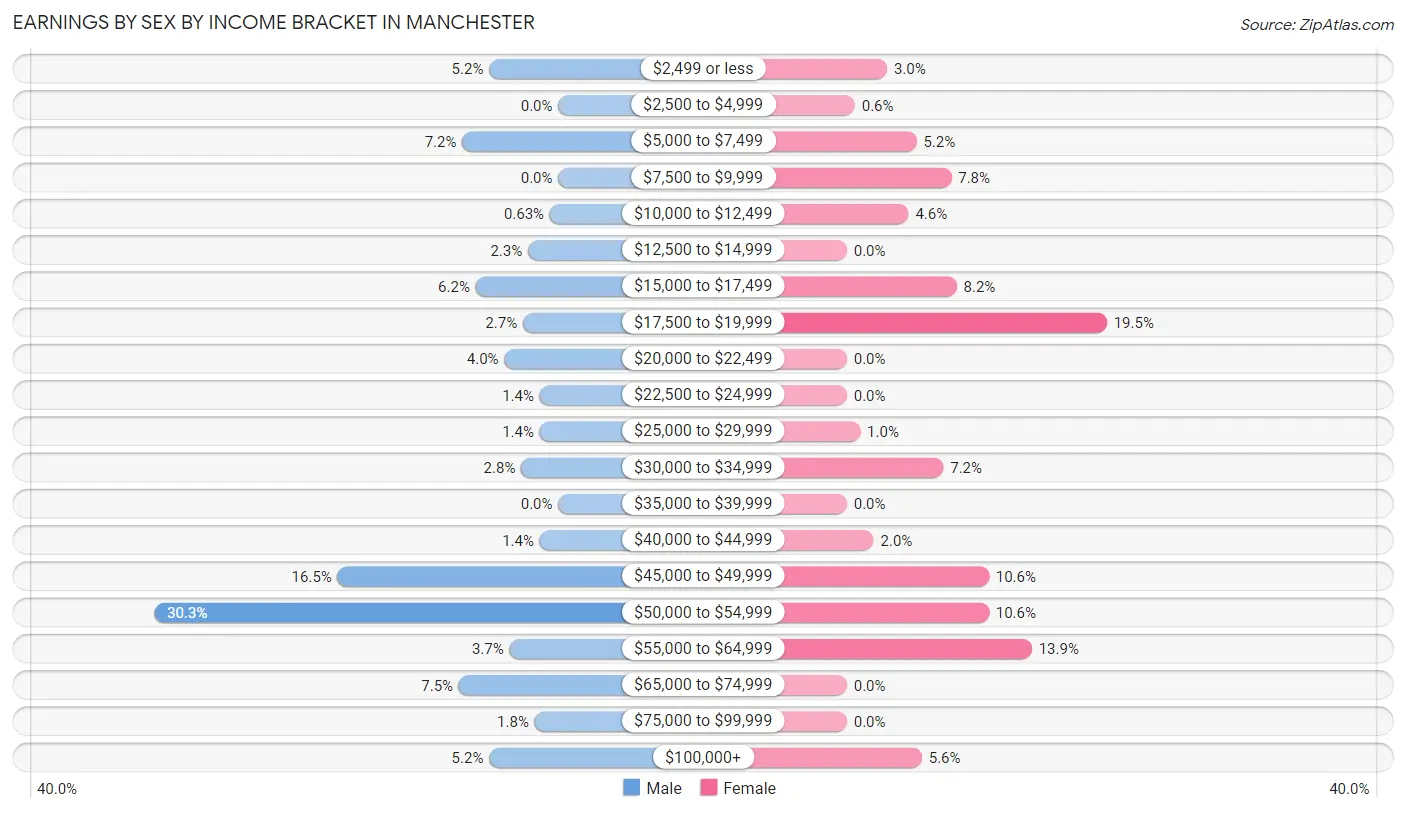
Earnings by Sex by Income Bracket in Manchester
The most common earnings brackets in Manchester are $50,000 to $54,999 for men (240 | 30.3%) and $17,500 to $19,999 for women (97 | 19.5%).
| Income | Male | Female |
| $2,499 or less | 41 (5.2%) | 15 (3.0%) |
| $2,500 to $4,999 | 0 (0.0%) | 3 (0.6%) |
| $5,000 to $7,499 | 57 (7.2%) | 26 (5.2%) |
| $7,500 to $9,999 | 0 (0.0%) | 39 (7.8%) |
| $10,000 to $12,499 | 5 (0.6%) | 23 (4.6%) |
| $12,500 to $14,999 | 18 (2.3%) | 0 (0.0%) |
| $15,000 to $17,499 | 49 (6.2%) | 41 (8.2%) |
| $17,500 to $19,999 | 21 (2.6%) | 97 (19.5%) |
| $20,000 to $22,499 | 32 (4.0%) | 0 (0.0%) |
| $22,500 to $24,999 | 11 (1.4%) | 0 (0.0%) |
| $25,000 to $29,999 | 11 (1.4%) | 5 (1.0%) |
| $30,000 to $34,999 | 22 (2.8%) | 36 (7.2%) |
| $35,000 to $39,999 | 0 (0.0%) | 0 (0.0%) |
| $40,000 to $44,999 | 11 (1.4%) | 10 (2.0%) |
| $45,000 to $49,999 | 131 (16.5%) | 53 (10.6%) |
| $50,000 to $54,999 | 240 (30.3%) | 53 (10.6%) |
| $55,000 to $64,999 | 29 (3.7%) | 69 (13.9%) |
| $65,000 to $74,999 | 59 (7.4%) | 0 (0.0%) |
| $75,000 to $99,999 | 14 (1.8%) | 0 (0.0%) |
| $100,000+ | 41 (5.2%) | 28 (5.6%) |
| Total | 792 (100.0%) | 498 (100.0%) |
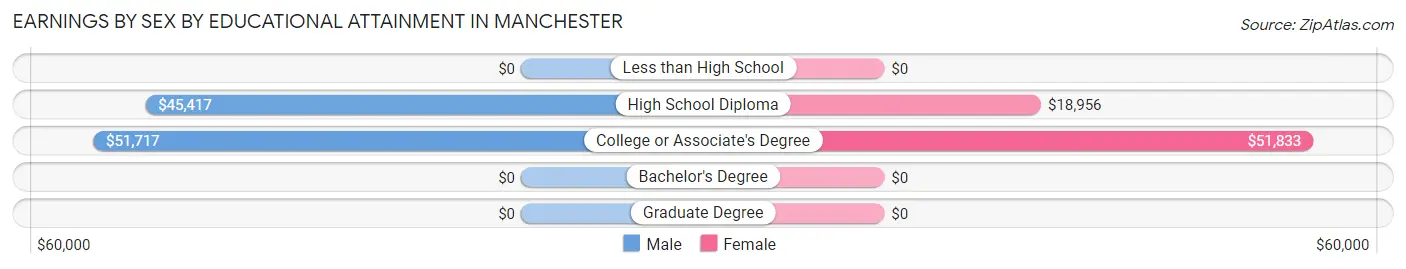
Earnings by Sex by Educational Attainment in Manchester
Average earnings in Manchester are $47,381 for men and $33,831 for women, a difference of 28.6%. Men with an educational attainment of college or associate's degree enjoy the highest average annual earnings of $51,717, while those with high school diploma education earn the least with $45,417. Women with an educational attainment of college or associate's degree earn the most with the average annual earnings of $51,833, while those with high school diploma education have the smallest earnings of $18,956.
| Educational Attainment | Male Income | Female Income |
| Less than High School | - | - |
| High School Diploma | $45,417 | $18,956 |
| College or Associate's Degree | $51,717 | $51,833 |
| Bachelor's Degree | - | - |
| Graduate Degree | - | - |
| Total | $47,381 | $33,831 |
Family Income in Manchester
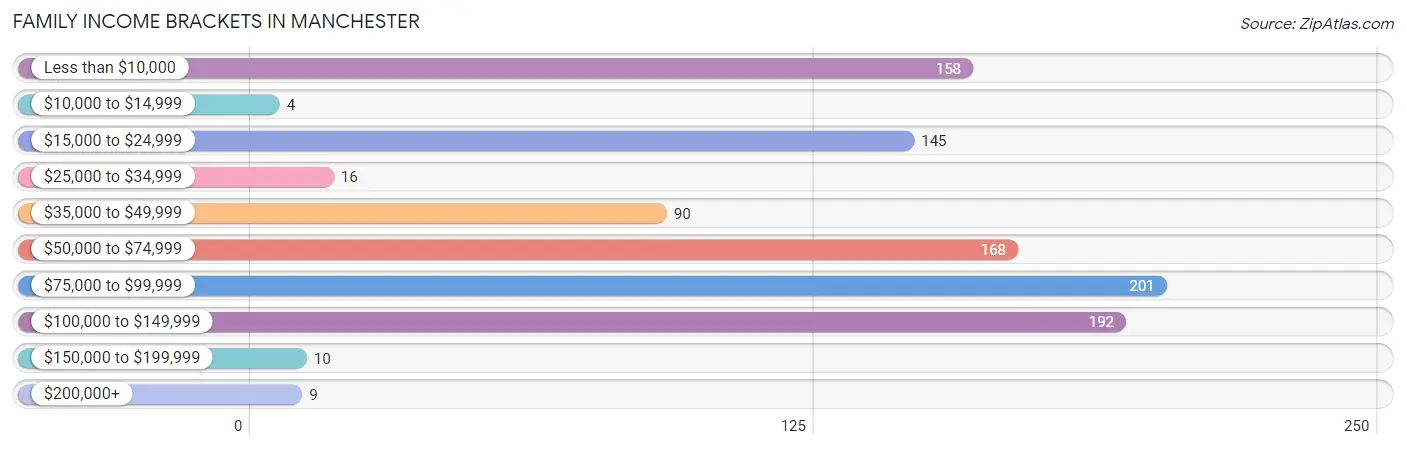
Family Income Brackets in Manchester
According to the Manchester family income data, there are 201 families falling into the $75,000 to $99,999 income range, which is the most common income bracket and makes up 20.2% of all families. Conversely, the $10,000 to $14,999 income bracket is the least frequent group with only 4 families (0.4%) belonging to this category.
| Income Bracket | # Families | % Families |
| Less than $10,000 | 158 | 15.9% |
| $10,000 to $14,999 | 4 | 0.4% |
| $15,000 to $24,999 | 145 | 14.6% |
| $25,000 to $34,999 | 16 | 1.6% |
| $35,000 to $49,999 | 90 | 9.1% |
| $50,000 to $74,999 | 168 | 16.9% |
| $75,000 to $99,999 | 201 | 20.2% |
| $100,000 to $149,999 | 192 | 19.3% |
| $150,000 to $199,999 | 10 | 1.0% |
| $200,000+ | 9 | 0.9% |
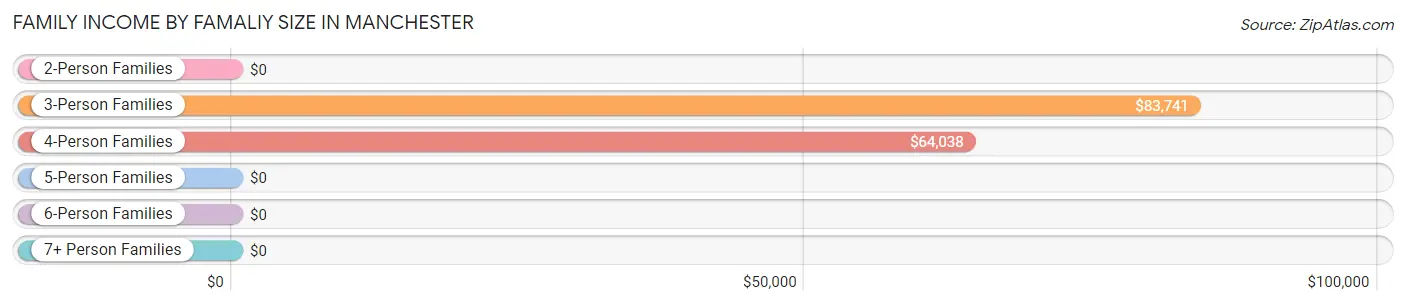
Family Income by Famaliy Size in Manchester
3-person families (384 | 38.7%) account for the highest median family income in Manchester with $83,741 per family, while 3-person families (384 | 38.7%) have the highest median income of $27,914 per family member.
| Income Bracket | # Families | Median Income |
| 2-Person Families | 285 (28.7%) | $0 |
| 3-Person Families | 384 (38.7%) | $83,741 |
| 4-Person Families | 122 (12.3%) | $64,038 |
| 5-Person Families | 150 (15.1%) | $0 |
| 6-Person Families | 52 (5.2%) | $0 |
| 7+ Person Families | 0 (0.0%) | $0 |
| Total | 993 (100.0%) | $63,365 |
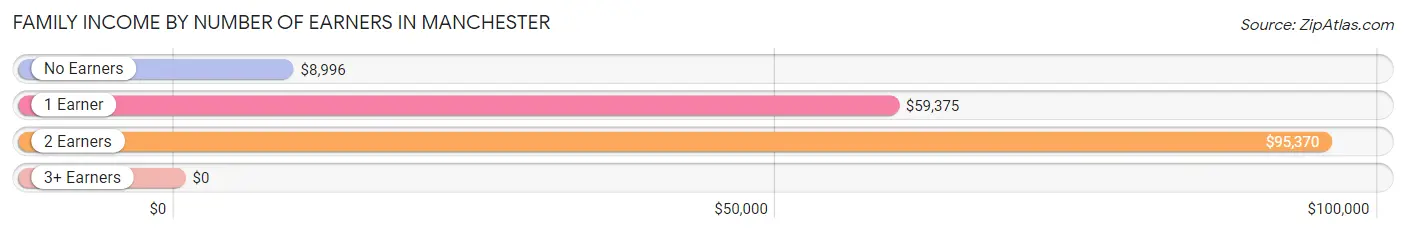
Family Income by Number of Earners in Manchester
| Number of Earners | # Families | Median Income |
| No Earners | 208 (20.9%) | $8,996 |
| 1 Earner | 535 (53.9%) | $59,375 |
| 2 Earners | 196 (19.7%) | $95,370 |
| 3+ Earners | 54 (5.4%) | $0 |
| Total | 993 (100.0%) | $63,365 |
Household Income in Manchester
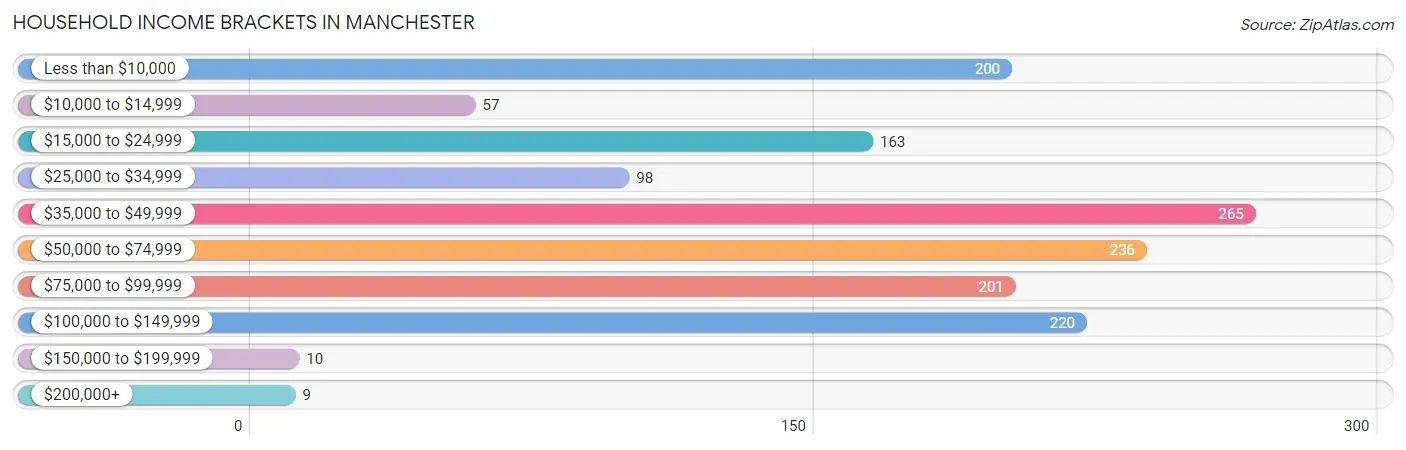
Household Income Brackets in Manchester
With 265 households falling in the category, the $35,000 to $49,999 income range is the most frequent in Manchester, accounting for 18.2% of all households. In contrast, only 9 households (0.6%) fall into the $200,000+ income bracket, making it the least populous group.
| Income Bracket | # Households | % Households |
| Less than $10,000 | 200 | 13.7% |
| $10,000 to $14,999 | 57 | 3.9% |
| $15,000 to $24,999 | 163 | 11.2% |
| $25,000 to $34,999 | 98 | 6.7% |
| $35,000 to $49,999 | 265 | 18.2% |
| $50,000 to $74,999 | 236 | 16.2% |
| $75,000 to $99,999 | 201 | 13.8% |
| $100,000 to $149,999 | 220 | 15.1% |
| $150,000 to $199,999 | 10 | 0.7% |
| $200,000+ | 9 | 0.6% |
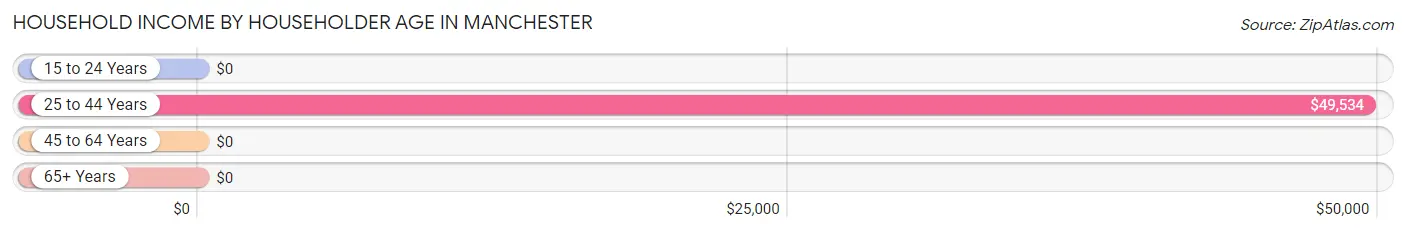
Household Income by Householder Age in Manchester
The median household income in Manchester is $48,301, with the highest median household income of $49,534 found in the 25 to 44 years age bracket for the primary householder. A total of 471 households (32.3%) fall into this category. Meanwhile, the 15 to 24 years age bracket for the primary householder has the lowest median household income of $0, with 22 households (1.5%) in this group.
| Income Bracket | # Households | Median Income |
| 15 to 24 Years | 22 (1.5%) | $0 |
| 25 to 44 Years | 471 (32.3%) | $49,534 |
| 45 to 64 Years | 476 (32.7%) | $0 |
| 65+ Years | 489 (33.5%) | $0 |
| Total | 1,458 (100.0%) | $48,301 |
Poverty in Manchester
Income Below Poverty by Sex and Age in Manchester
With 14.9% poverty level for males and 32.6% for females among the residents of Manchester, 6 to 11 year old males and 6 to 11 year old females are the most vulnerable to poverty, with 87 males (61.3%) and 191 females (87.6%) in their respective age groups living below the poverty level.
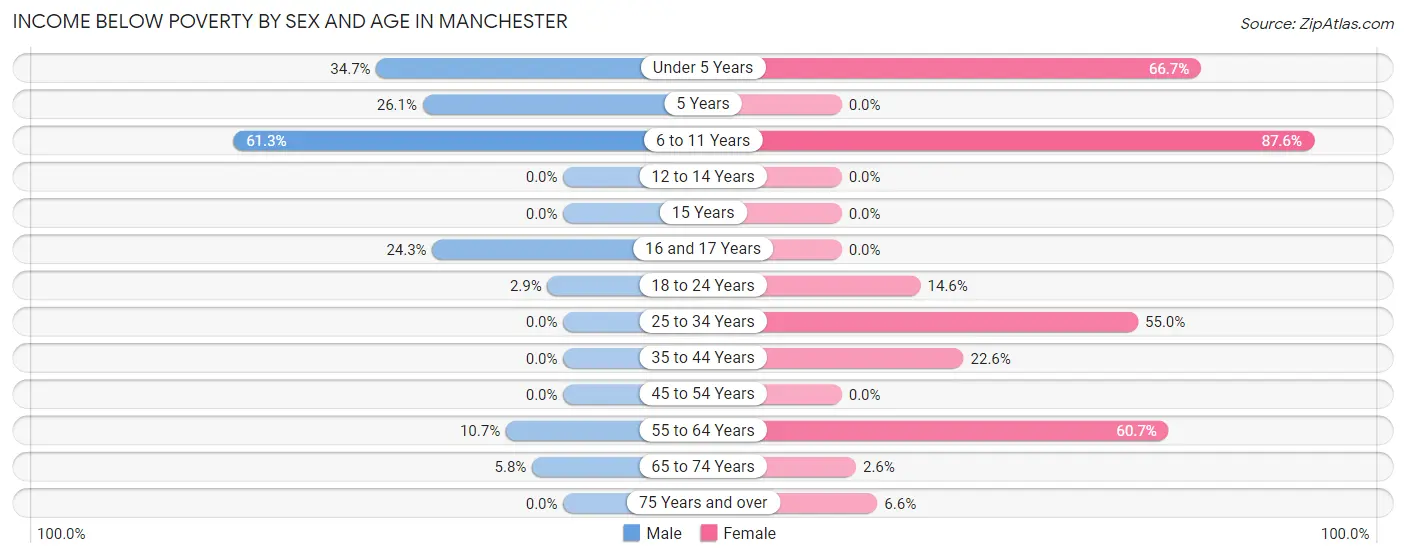
| Age Bracket | Male | Female |
| Under 5 Years | 93 (34.7%) | 76 (66.7%) |
| 5 Years | 6 (26.1%) | 0 (0.0%) |
| 6 to 11 Years | 87 (61.3%) | 191 (87.6%) |
| 12 to 14 Years | 0 (0.0%) | 0 (0.0%) |
| 15 Years | 0 (0.0%) | 0 (0.0%) |
| 16 and 17 Years | 26 (24.3%) | 0 (0.0%) |
| 18 to 24 Years | 6 (2.9%) | 30 (14.6%) |
| 25 to 34 Years | 0 (0.0%) | 121 (55.0%) |
| 35 to 44 Years | 0 (0.0%) | 26 (22.6%) |
| 45 to 54 Years | 0 (0.0%) | 0 (0.0%) |
| 55 to 64 Years | 23 (10.6%) | 165 (60.7%) |
| 65 to 74 Years | 11 (5.8%) | 9 (2.6%) |
| 75 Years and over | 0 (0.0%) | 8 (6.6%) |
| Total | 252 (14.9%) | 626 (32.6%) |
Income Above Poverty by Sex and Age in Manchester
According to the poverty statistics in Manchester, males aged 12 to 14 years and females aged 5 years are the age groups that are most secure financially, with 100.0% of males and 100.0% of females in these age groups living above the poverty line.
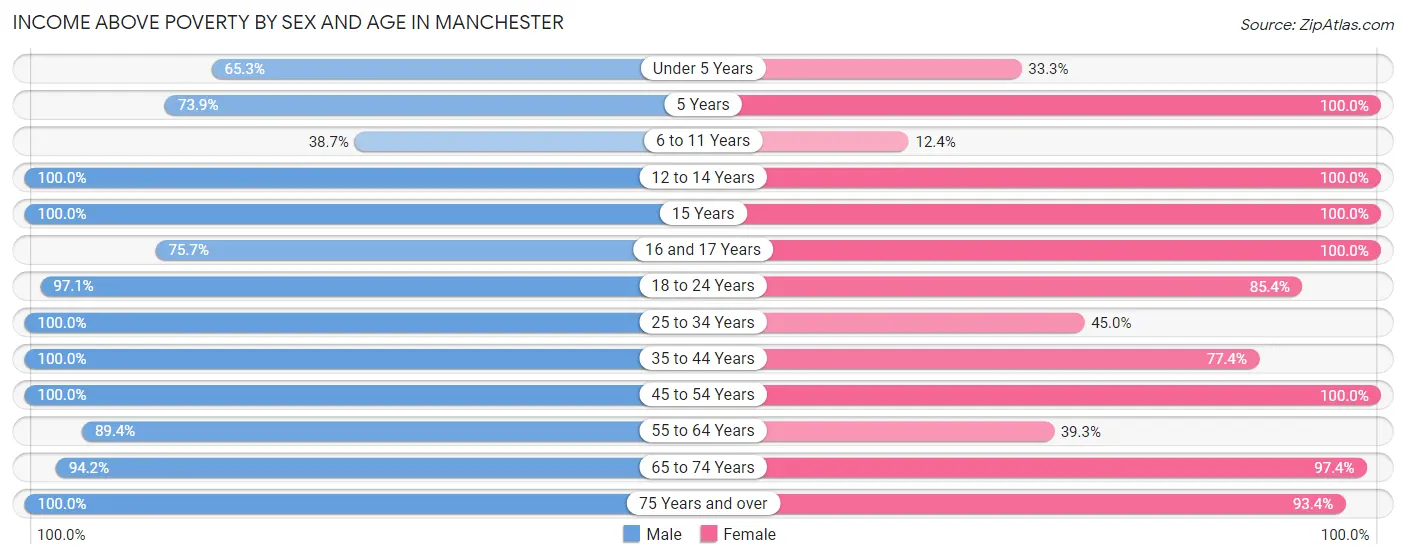
| Age Bracket | Male | Female |
| Under 5 Years | 175 (65.3%) | 38 (33.3%) |
| 5 Years | 17 (73.9%) | 28 (100.0%) |
| 6 to 11 Years | 55 (38.7%) | 27 (12.4%) |
| 12 to 14 Years | 13 (100.0%) | 10 (100.0%) |
| 15 Years | 37 (100.0%) | 52 (100.0%) |
| 16 and 17 Years | 81 (75.7%) | 52 (100.0%) |
| 18 to 24 Years | 198 (97.1%) | 175 (85.4%) |
| 25 to 34 Years | 152 (100.0%) | 99 (45.0%) |
| 35 to 44 Years | 202 (100.0%) | 89 (77.4%) |
| 45 to 54 Years | 91 (100.0%) | 174 (100.0%) |
| 55 to 64 Years | 193 (89.3%) | 107 (39.3%) |
| 65 to 74 Years | 179 (94.2%) | 332 (97.4%) |
| 75 Years and over | 45 (100.0%) | 113 (93.4%) |
| Total | 1,438 (85.1%) | 1,296 (67.4%) |
Income Below Poverty Among Married-Couple Families in Manchester
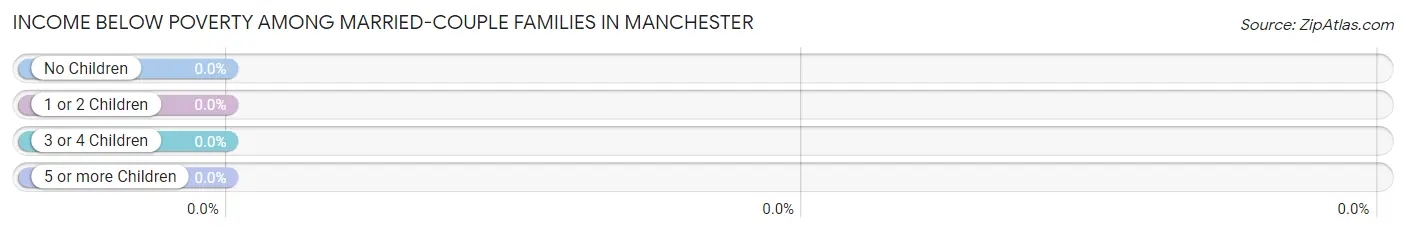
| Children | Above Poverty | Below Poverty |
| No Children | 297 (100.0%) | 0 (0.0%) |
| 1 or 2 Children | 186 (100.0%) | 0 (0.0%) |
| 3 or 4 Children | 25 (100.0%) | 0 (0.0%) |
| 5 or more Children | 0 (0.0%) | 0 (0.0%) |
| Total | 508 (100.0%) | 0 (0.0%) |
Income Below Poverty Among Single-Parent Households in Manchester
According to the poverty data in Manchester, 11.0% or 9 single-father households and 69.2% or 279 single-mother households are living below the poverty line. Among single-father households, those with 1 or 2 children have the highest poverty rate, with 9 households (12.7%) experiencing poverty. Likewise, among single-mother households, those with 3 or 4 children have the highest poverty rate, with 55 households (100.0%) falling below the poverty line.
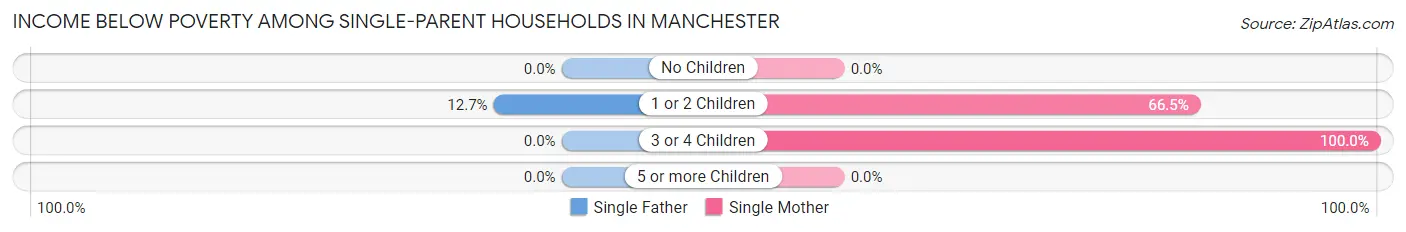
| Children | Single Father | Single Mother |
| No Children | 0 (0.0%) | 0 (0.0%) |
| 1 or 2 Children | 9 (12.7%) | 224 (66.5%) |
| 3 or 4 Children | 0 (0.0%) | 55 (100.0%) |
| 5 or more Children | 0 (0.0%) | 0 (0.0%) |
| Total | 9 (11.0%) | 279 (69.2%) |
Income Below Poverty Among Married-Couple vs Single-Parent Households in Manchester
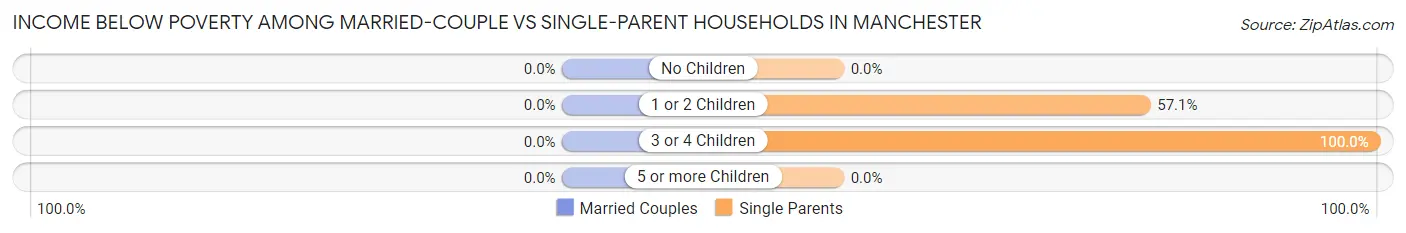
| Children | Married-Couple Families | Single-Parent Households |
| No Children | 0 (0.0%) | 0 (0.0%) |
| 1 or 2 Children | 0 (0.0%) | 233 (57.1%) |
| 3 or 4 Children | 0 (0.0%) | 55 (100.0%) |
| 5 or more Children | 0 (0.0%) | 0 (0.0%) |
| Total | 0 (0.0%) | 288 (59.4%) |
Race in Manchester
The most populous races in Manchester are Black / African American (2,110 | 58.4%), White / Caucasian (1,283 | 35.5%), and Hispanic or Latino (133 | 3.7%).
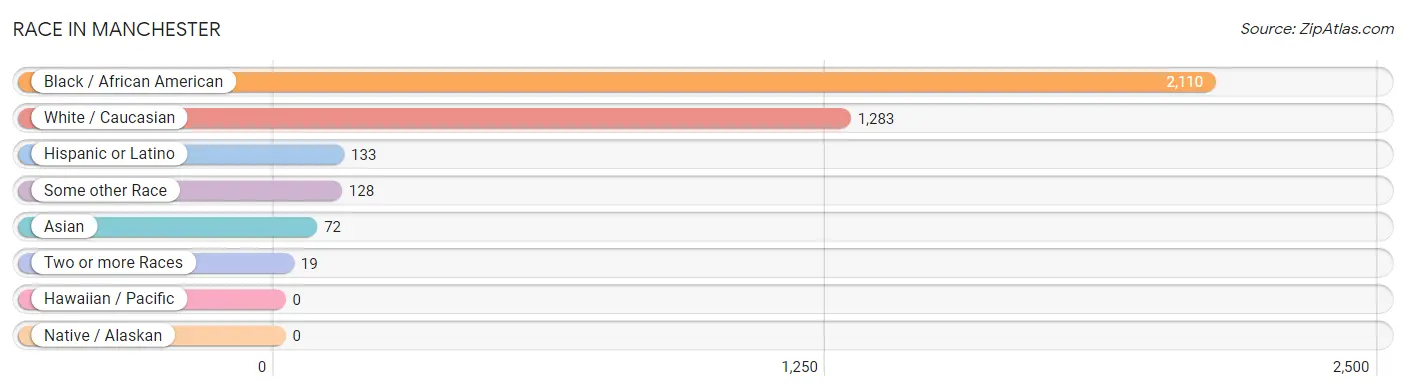
| Race | # Population | % Population |
| Asian | 72 | 2.0% |
| Black / African American | 2,110 | 58.4% |
| Hawaiian / Pacific | 0 | 0.0% |
| Hispanic or Latino | 133 | 3.7% |
| Native / Alaskan | 0 | 0.0% |
| White / Caucasian | 1,283 | 35.5% |
| Two or more Races | 19 | 0.5% |
| Some other Race | 128 | 3.5% |
| Total | 3,612 | 100.0% |
Ancestry in Manchester
The most populous ancestries reported in Manchester are American (214 | 5.9%), English (199 | 5.5%), Irish (153 | 4.2%), Mexican (133 | 3.7%), and German (108 | 3.0%), together accounting for 22.3% of all Manchester residents.
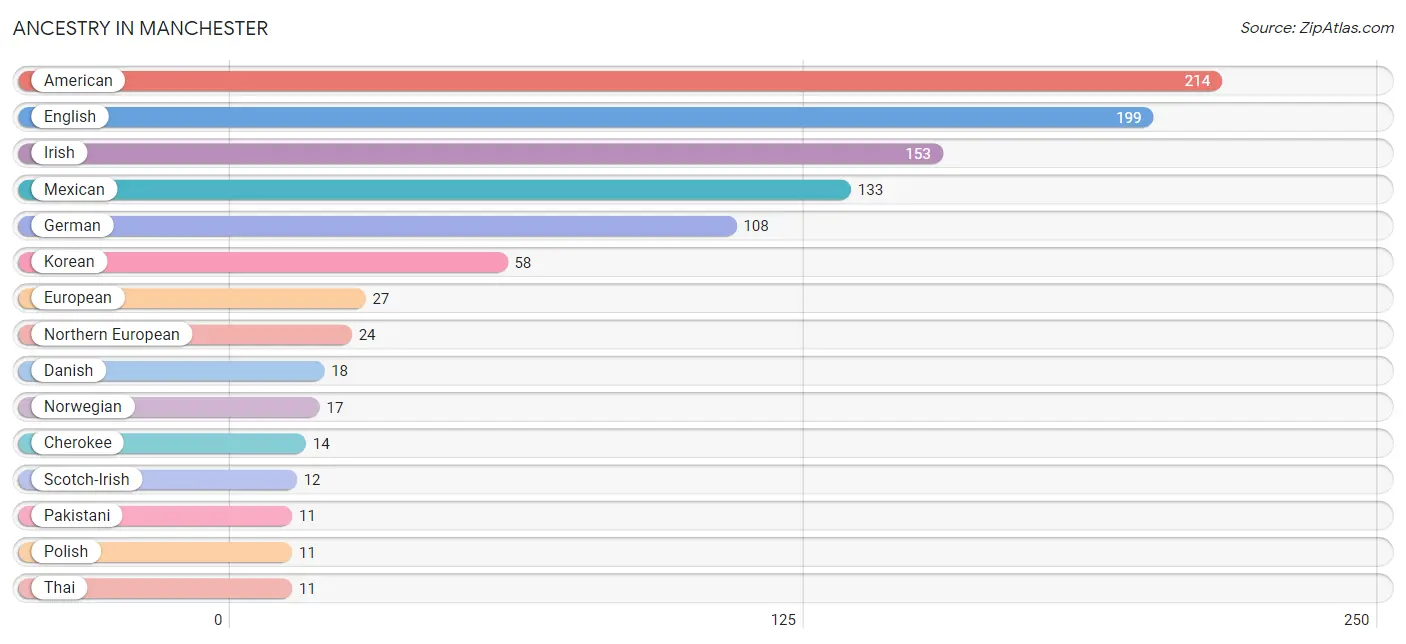
| Ancestry | # Population | % Population |
| American | 214 | 5.9% |
| Burmese | 7 | 0.2% |
| Cherokee | 14 | 0.4% |
| Danish | 18 | 0.5% |
| Dutch | 5 | 0.1% |
| English | 199 | 5.5% |
| European | 27 | 0.7% |
| German | 108 | 3.0% |
| Irish | 153 | 4.2% |
| Korean | 58 | 1.6% |
| Mexican | 133 | 3.7% |
| Northern European | 24 | 0.7% |
| Norwegian | 17 | 0.5% |
| Pakistani | 11 | 0.3% |
| Polish | 11 | 0.3% |
| Scandinavian | 6 | 0.2% |
| Scotch-Irish | 12 | 0.3% |
| Thai | 11 | 0.3% | View All 18 Rows |
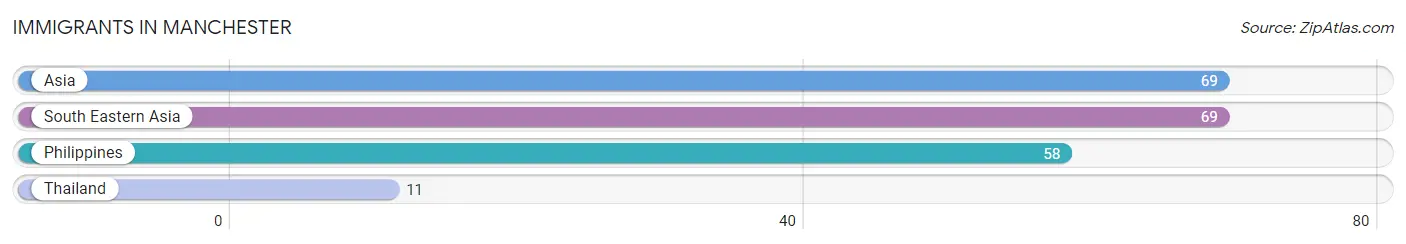
Immigrants in Manchester
The most numerous immigrant groups reported in Manchester came from Asia (69 | 1.9%), South Eastern Asia (69 | 1.9%), Philippines (58 | 1.6%), and Thailand (11 | 0.3%), together accounting for 5.7% of all Manchester residents.
| Immigration Origin | # Population | % Population |
| Asia | 69 | 1.9% |
| Philippines | 58 | 1.6% |
| South Eastern Asia | 69 | 1.9% |
| Thailand | 11 | 0.3% | View All 4 Rows |
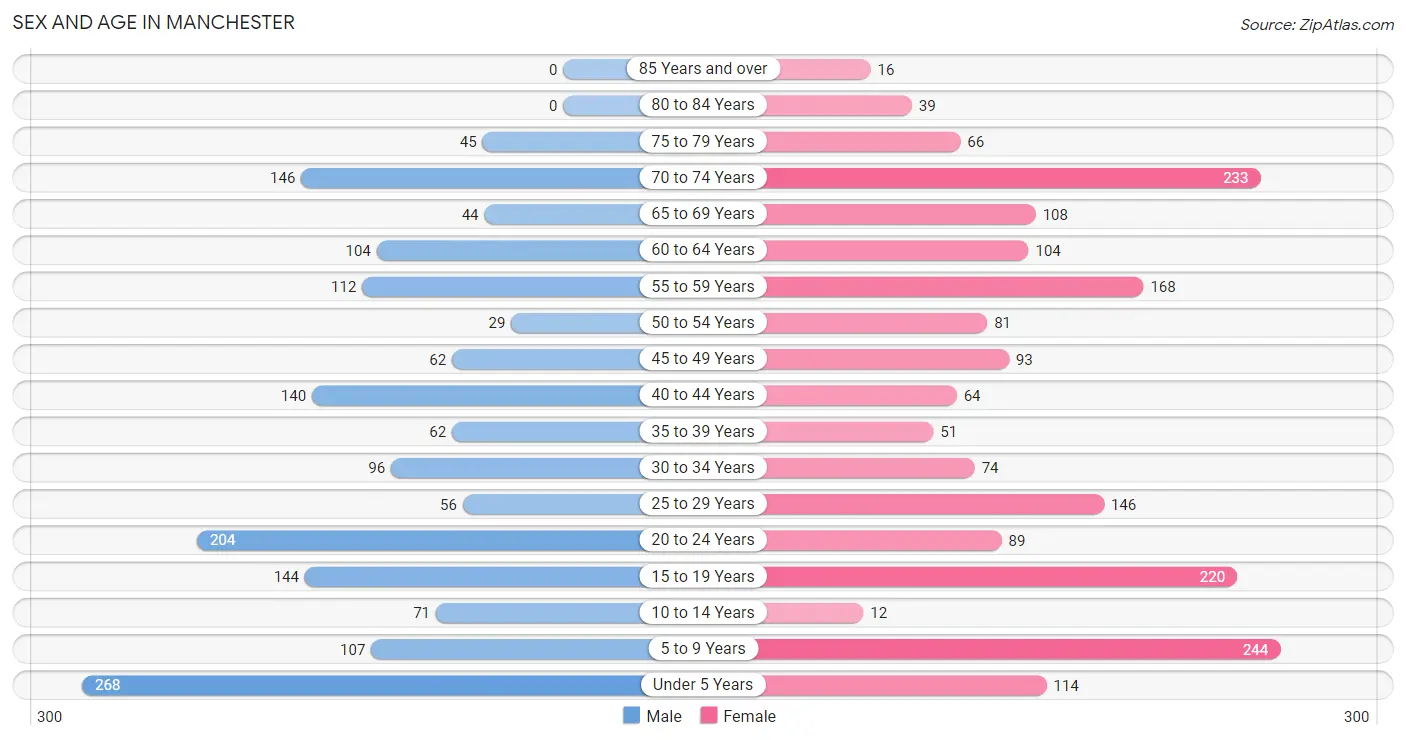
Sex and Age in Manchester
Sex and Age in Manchester
The most populous age groups in Manchester are Under 5 Years (268 | 15.9%) for men and 5 to 9 Years (244 | 12.7%) for women.
| Age Bracket | Male | Female |
| Under 5 Years | 268 (15.9%) | 114 (5.9%) |
| 5 to 9 Years | 107 (6.3%) | 244 (12.7%) |
| 10 to 14 Years | 71 (4.2%) | 12 (0.6%) |
| 15 to 19 Years | 144 (8.5%) | 220 (11.5%) |
| 20 to 24 Years | 204 (12.1%) | 89 (4.6%) |
| 25 to 29 Years | 56 (3.3%) | 146 (7.6%) |
| 30 to 34 Years | 96 (5.7%) | 74 (3.8%) |
| 35 to 39 Years | 62 (3.7%) | 51 (2.6%) |
| 40 to 44 Years | 140 (8.3%) | 64 (3.3%) |
| 45 to 49 Years | 62 (3.7%) | 93 (4.8%) |
| 50 to 54 Years | 29 (1.7%) | 81 (4.2%) |
| 55 to 59 Years | 112 (6.6%) | 168 (8.7%) |
| 60 to 64 Years | 104 (6.1%) | 104 (5.4%) |
| 65 to 69 Years | 44 (2.6%) | 108 (5.6%) |
| 70 to 74 Years | 146 (8.6%) | 233 (12.1%) |
| 75 to 79 Years | 45 (2.7%) | 66 (3.4%) |
| 80 to 84 Years | 0 (0.0%) | 39 (2.0%) |
| 85 Years and over | 0 (0.0%) | 16 (0.8%) |
| Total | 1,690 (100.0%) | 1,922 (100.0%) |
Families and Households in Manchester
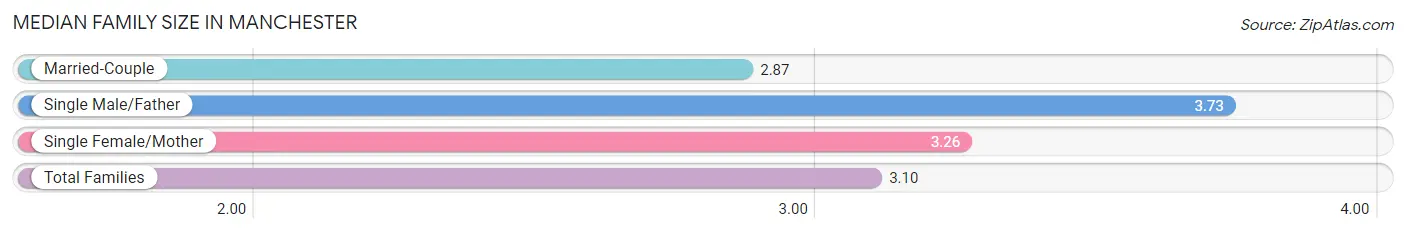
Median Family Size in Manchester
The median family size in Manchester is 3.10 persons per family, with single male/father families (82 | 8.3%) accounting for the largest median family size of 3.73 persons per family. On the other hand, married-couple families (508 | 51.2%) represent the smallest median family size with 2.87 persons per family.
| Family Type | # Families | Family Size |
| Married-Couple | 508 (51.2%) | 2.87 |
| Single Male/Father | 82 (8.3%) | 3.73 |
| Single Female/Mother | 403 (40.6%) | 3.26 |
| Total Families | 993 (100.0%) | 3.10 |
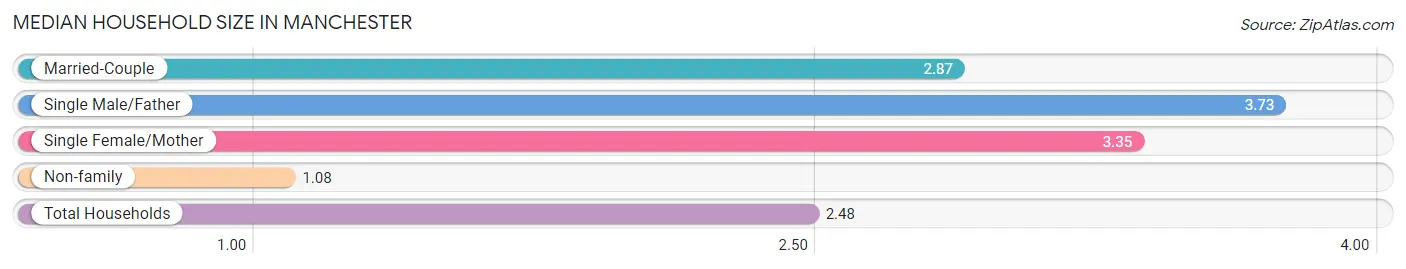
Median Household Size in Manchester
The median household size in Manchester is 2.48 persons per household, with single male/father households (82 | 5.6%) accounting for the largest median household size of 3.73 persons per household. non-family households (465 | 31.9%) represent the smallest median household size with 1.08 persons per household.
| Household Type | # Households | Household Size |
| Married-Couple | 508 (34.8%) | 2.87 |
| Single Male/Father | 82 (5.6%) | 3.73 |
| Single Female/Mother | 403 (27.6%) | 3.35 |
| Non-family | 465 (31.9%) | 1.08 |
| Total Households | 1,458 (100.0%) | 2.48 |
Household Size by Marriage Status in Manchester
Out of a total of 1,458 households in Manchester, 993 (68.1%) are family households, while 465 (31.9%) are nonfamily households. The most numerous type of family households are 2-person households, comprising 285, and the most common type of nonfamily households are 1-person households, comprising 420.
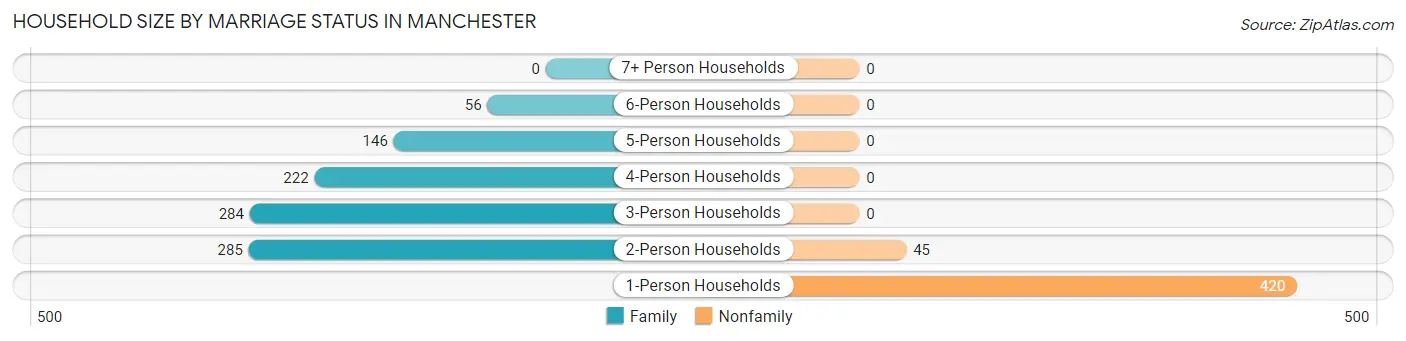
| Household Size | Family Households | Nonfamily Households |
| 1-Person Households | - | 420 (28.8%) |
| 2-Person Households | 285 (19.6%) | 45 (3.1%) |
| 3-Person Households | 284 (19.5%) | 0 (0.0%) |
| 4-Person Households | 222 (15.2%) | 0 (0.0%) |
| 5-Person Households | 146 (10.0%) | 0 (0.0%) |
| 6-Person Households | 56 (3.8%) | 0 (0.0%) |
| 7+ Person Households | 0 (0.0%) | 0 (0.0%) |
| Total | 993 (68.1%) | 465 (31.9%) |
Female Fertility in Manchester
Fertility by Age in Manchester
Average fertility rate in Manchester is 169.0 births per 1,000 women. Women in the age bracket of 20 to 34 years have the highest fertility rate with 408.0 births per 1,000 women. Women in the age bracket of 20 to 34 years acount for 100.0% of all women with births.
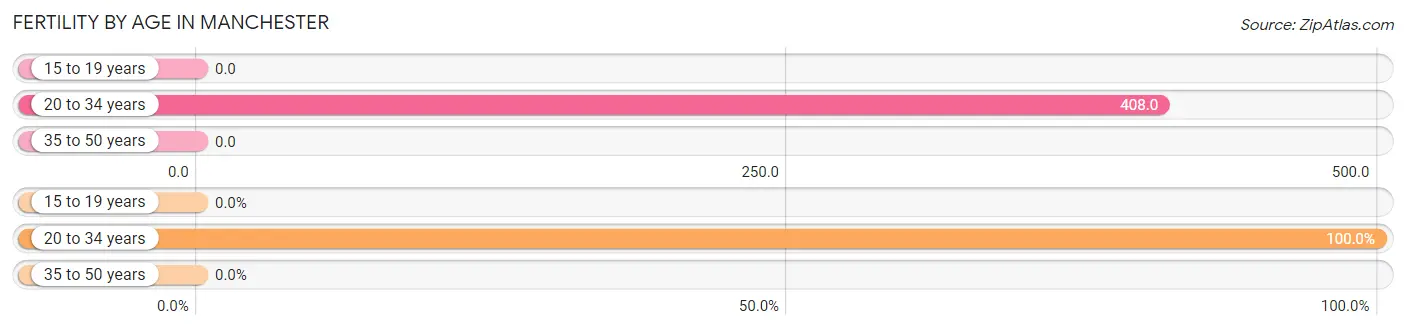
| Age Bracket | Women with Births | Births / 1,000 Women |
| 15 to 19 years | 0 (0.0%) | 0.0 |
| 20 to 34 years | 126 (100.0%) | 408.0 |
| 35 to 50 years | 0 (0.0%) | 0.0 |
| Total | 126 (100.0%) | 169.0 |
Fertility by Age by Marriage Status in Manchester
16.7% of women with births (126) in Manchester are married. The highest percentage of unmarried women with births falls into 20 to 34 years age bracket with 83.3% of them unmarried at the time of birth, while the lowest percentage of unmarried women with births belong to 20 to 34 years age bracket with 83.3% of them unmarried.
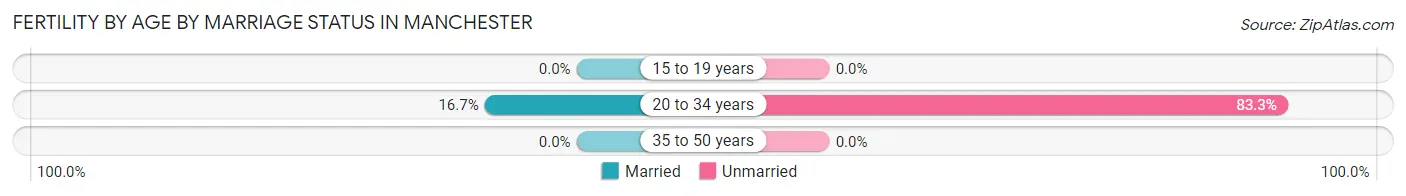
| Age Bracket | Married | Unmarried |
| 15 to 19 years | 0 (0.0%) | 0 (0.0%) |
| 20 to 34 years | 21 (16.7%) | 105 (83.3%) |
| 35 to 50 years | 0 (0.0%) | 0 (0.0%) |
| Total | 21 (16.7%) | 105 (83.3%) |
Fertility by Education in Manchester
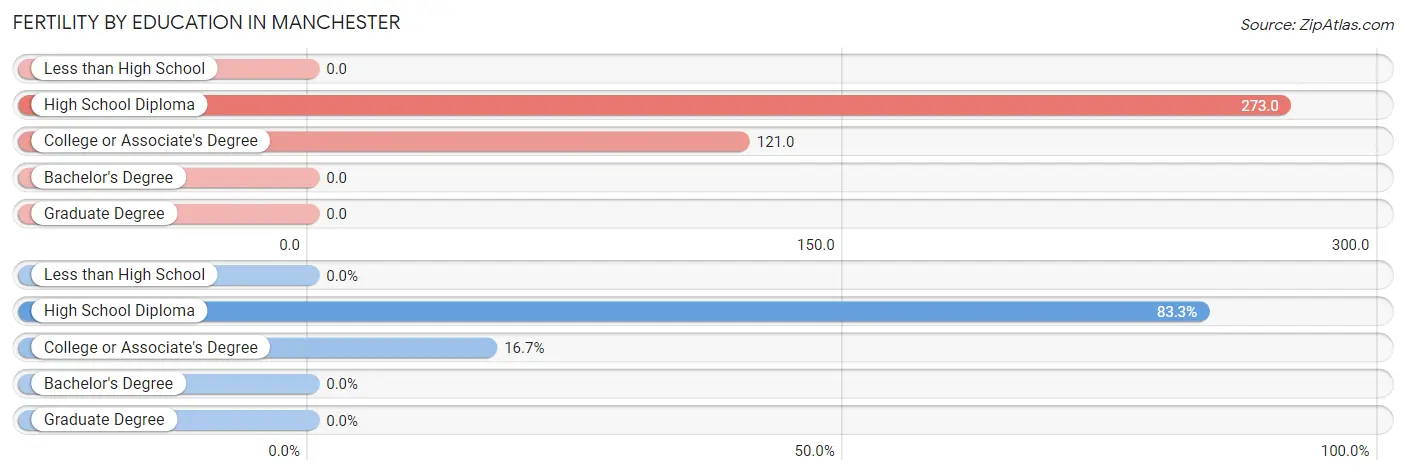
| Educational Attainment | Women with Births | Births / 1,000 Women |
| Less than High School | 0 (0.0%) | 0.0 |
| High School Diploma | 105 (83.3%) | 273.0 |
| College or Associate's Degree | 21 (16.7%) | 121.0 |
| Bachelor's Degree | 0 (0.0%) | 0.0 |
| Graduate Degree | 0 (0.0%) | 0.0 |
| Total | 126 (100.0%) | 169.0 |
Fertility by Education by Marriage Status in Manchester
83.3% of women with births in Manchester are unmarried. Women with the educational attainment of college or associate's degree are most likely to be married with 100.0% of them married at childbirth, while women with the educational attainment of high school diploma are least likely to be married with 100.0% of them unmarried at childbirth.
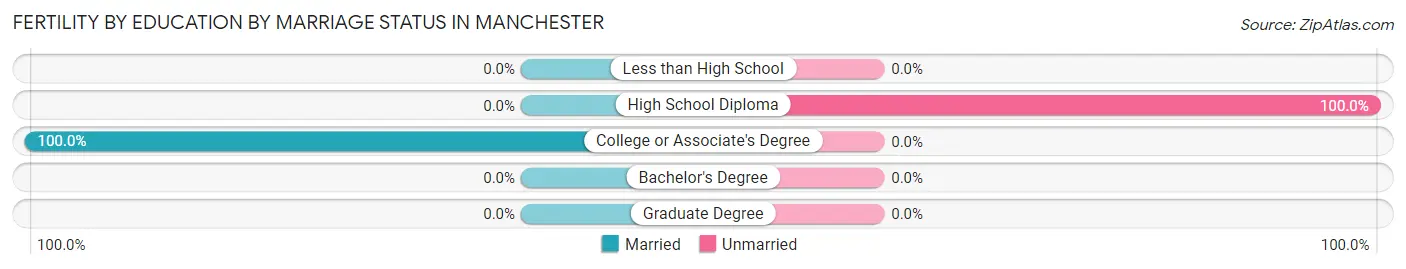
| Educational Attainment | Married | Unmarried |
| Less than High School | 0 (0.0%) | 0 (0.0%) |
| High School Diploma | 0 (0.0%) | 105 (100.0%) |
| College or Associate's Degree | 21 (100.0%) | 0 (0.0%) |
| Bachelor's Degree | 0 (0.0%) | 0 (0.0%) |
| Graduate Degree | 0 (0.0%) | 0 (0.0%) |
| Total | 21 (16.7%) | 105 (83.3%) |
Employment Characteristics in Manchester
Employment by Class of Employer in Manchester
Among the 1,022 employed individuals in Manchester, private company employees (720 | 70.5%), local government employees (97 | 9.5%), and state government employees (75 | 7.3%) make up the most common classes of employment.
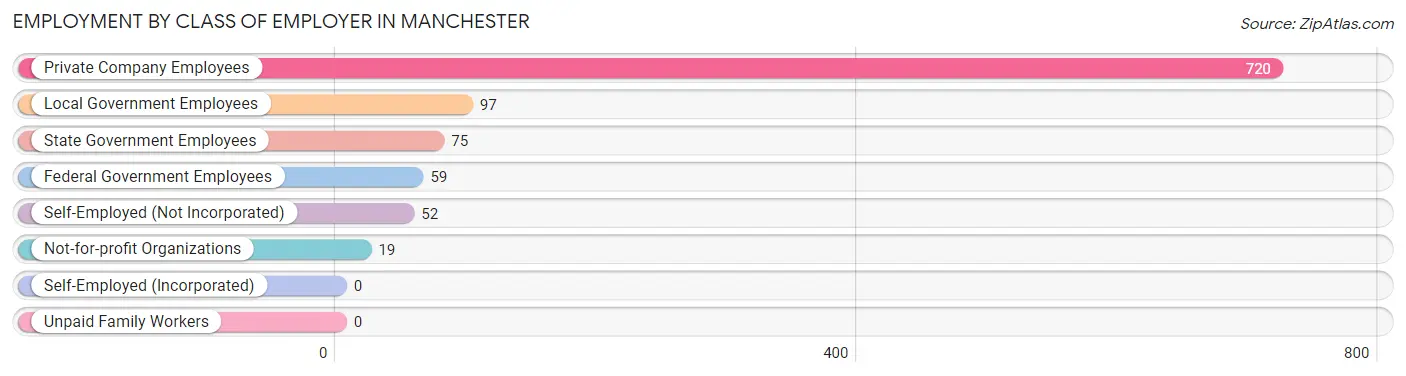
| Employer Class | # Employees | % Employees |
| Private Company Employees | 720 | 70.5% |
| Self-Employed (Incorporated) | 0 | 0.0% |
| Self-Employed (Not Incorporated) | 52 | 5.1% |
| Not-for-profit Organizations | 19 | 1.9% |
| Local Government Employees | 97 | 9.5% |
| State Government Employees | 75 | 7.3% |
| Federal Government Employees | 59 | 5.8% |
| Unpaid Family Workers | 0 | 0.0% |
| Total | 1,022 | 100.0% |
Employment Status by Age in Manchester
According to the labor force statistics for Manchester, out of the total population over 16 years of age (2,707), 47.7% or 1,291 individuals are in the labor force, with 6.6% or 85 of them unemployed. The age group with the highest labor force participation rate is 35 to 44 years, with 100.0% or 317 individuals in the labor force. Within the labor force, the 25 to 29 years age range has the highest percentage of unemployed individuals, with 29.1% or 55 of them being unemployed.
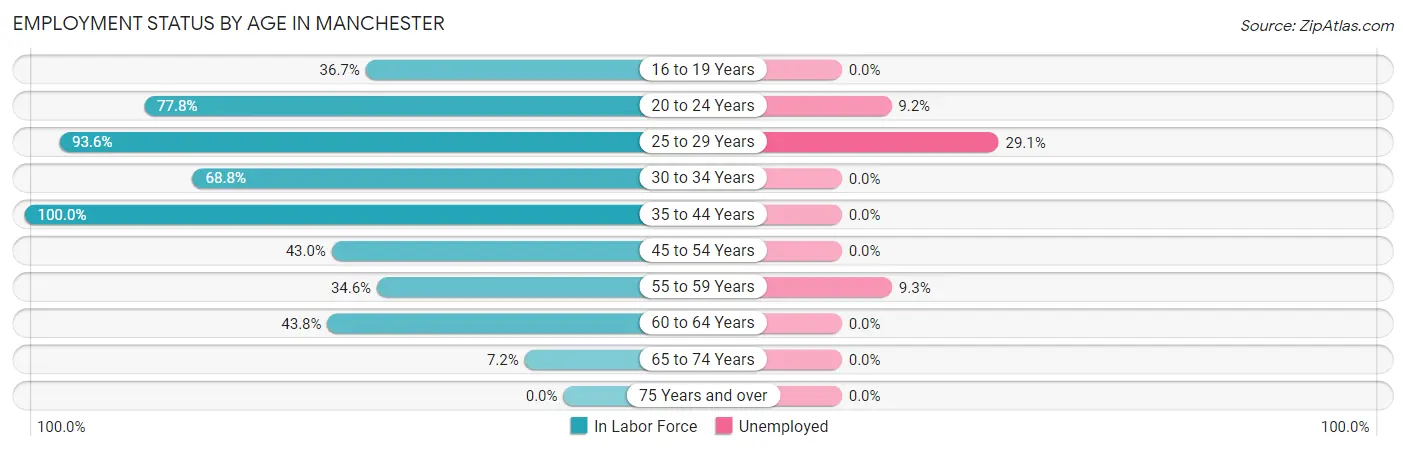
| Age Bracket | In Labor Force | Unemployed |
| 16 to 19 Years | 101 (36.7%) | 0 (0.0%) |
| 20 to 24 Years | 228 (77.8%) | 21 (9.2%) |
| 25 to 29 Years | 189 (93.6%) | 55 (29.1%) |
| 30 to 34 Years | 117 (68.8%) | 0 (0.0%) |
| 35 to 44 Years | 317 (100.0%) | 0 (0.0%) |
| 45 to 54 Years | 114 (43.0%) | 0 (0.0%) |
| 55 to 59 Years | 97 (34.6%) | 9 (9.3%) |
| 60 to 64 Years | 91 (43.8%) | 0 (0.0%) |
| 65 to 74 Years | 38 (7.2%) | 0 (0.0%) |
| 75 Years and over | 0 (0.0%) | 0 (0.0%) |
| Total | 1,291 (47.7%) | 85 (6.6%) |
Employment Status by Educational Attainment in Manchester
According to labor force statistics for Manchester, 64.1% of individuals (924) out of the total population between 25 and 64 years of age (1,442) are in the labor force, with 6.9% or 64 of them being unemployed. The group with the highest labor force participation rate are those with the educational attainment of bachelor's degree or higher, with 91.9% or 57 individuals in the labor force. Within the labor force, individuals with less than high school education have the highest percentage of unemployment, with 52.6% or 10 of them being unemployed.
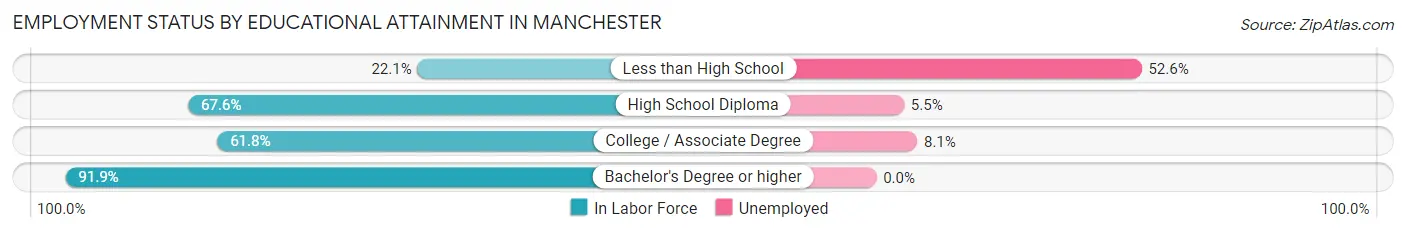
| Educational Attainment | In Labor Force | Unemployed |
| Less than High School | 19 (22.1%) | 45 (52.6%) |
| High School Diploma | 577 (67.6%) | 47 (5.5%) |
| College / Associate Degree | 272 (61.8%) | 36 (8.1%) |
| Bachelor's Degree or higher | 57 (91.9%) | 0 (0.0%) |
| Total | 924 (64.1%) | 99 (6.9%) |
Employment Occupations by Sex in Manchester
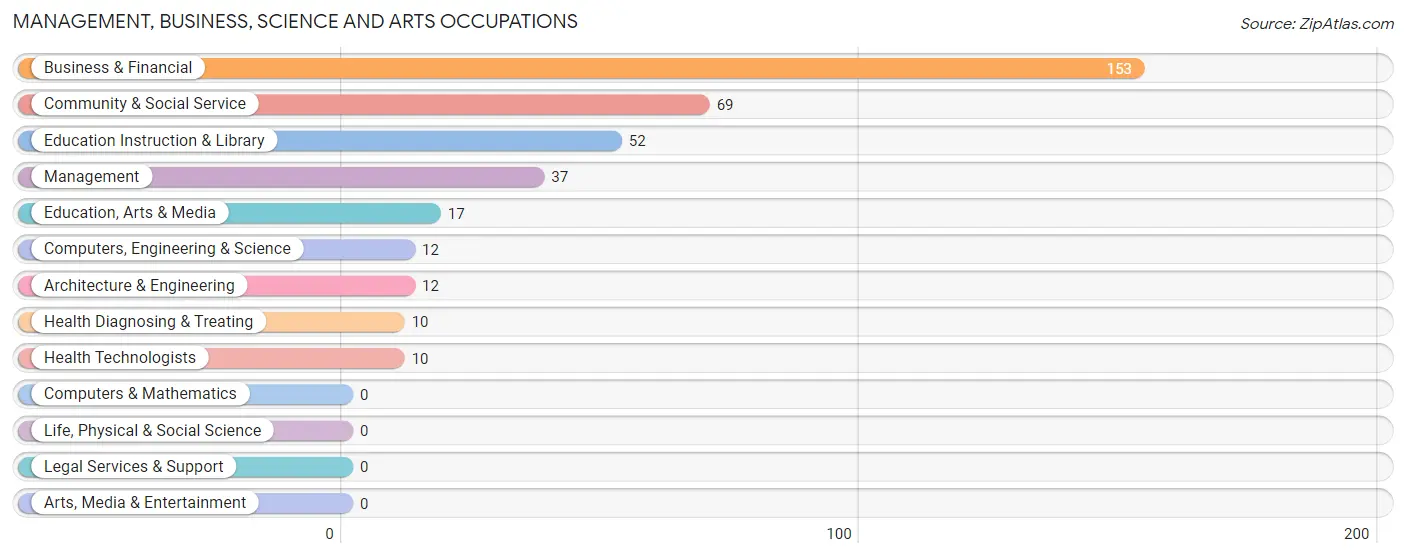
Management, Business, Science and Arts Occupations
The most common Management, Business, Science and Arts occupations in Manchester are Business & Financial (153 | 12.7%), Community & Social Service (69 | 5.7%), Education Instruction & Library (52 | 4.3%), Management (37 | 3.1%), and Education, Arts & Media (17 | 1.4%).
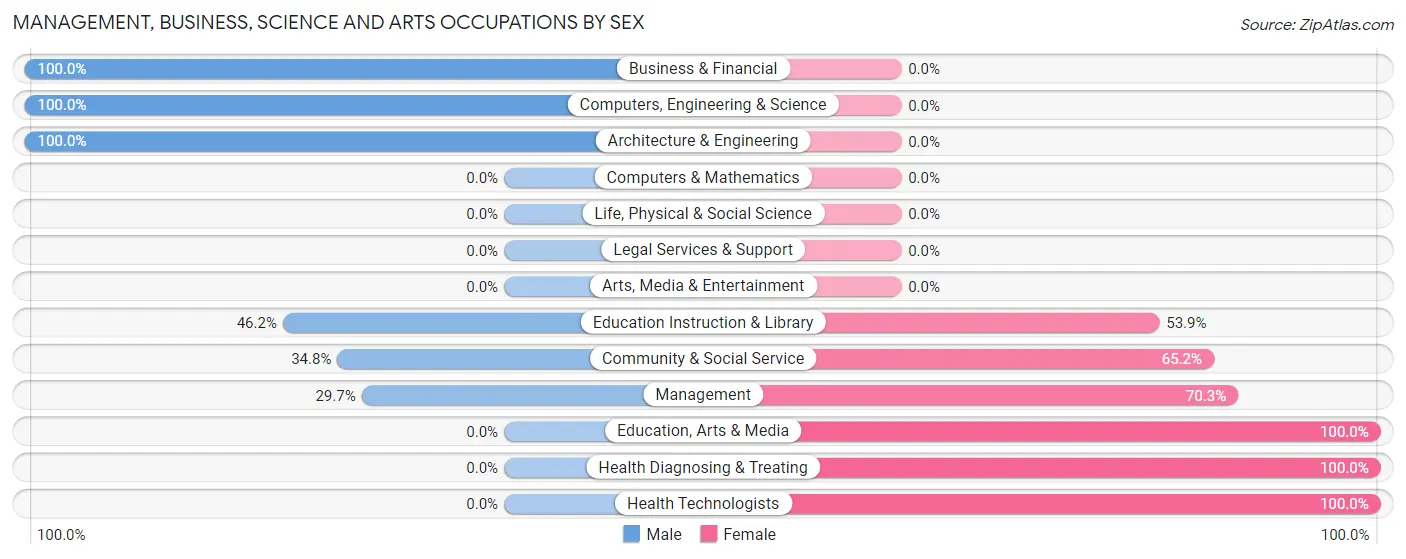
Management, Business, Science and Arts Occupations by Sex
Within the Management, Business, Science and Arts occupations in Manchester, the most male-oriented occupations are Business & Financial (100.0%), Computers, Engineering & Science (100.0%), and Architecture & Engineering (100.0%), while the most female-oriented occupations are Education, Arts & Media (100.0%), Health Diagnosing & Treating (100.0%), and Health Technologists (100.0%).
| Occupation | Male | Female |
| Management | 11 (29.7%) | 26 (70.3%) |
| Business & Financial | 153 (100.0%) | 0 (0.0%) |
| Computers, Engineering & Science | 12 (100.0%) | 0 (0.0%) |
| Computers & Mathematics | 0 (0.0%) | 0 (0.0%) |
| Architecture & Engineering | 12 (100.0%) | 0 (0.0%) |
| Life, Physical & Social Science | 0 (0.0%) | 0 (0.0%) |
| Community & Social Service | 24 (34.8%) | 45 (65.2%) |
| Education, Arts & Media | 0 (0.0%) | 17 (100.0%) |
| Legal Services & Support | 0 (0.0%) | 0 (0.0%) |
| Education Instruction & Library | 24 (46.2%) | 28 (53.8%) |
| Arts, Media & Entertainment | 0 (0.0%) | 0 (0.0%) |
| Health Diagnosing & Treating | 0 (0.0%) | 10 (100.0%) |
| Health Technologists | 0 (0.0%) | 10 (100.0%) |
| Total (Category) | 200 (71.2%) | 81 (28.8%) |
| Total (Overall) | 733 (60.7%) | 474 (39.3%) |
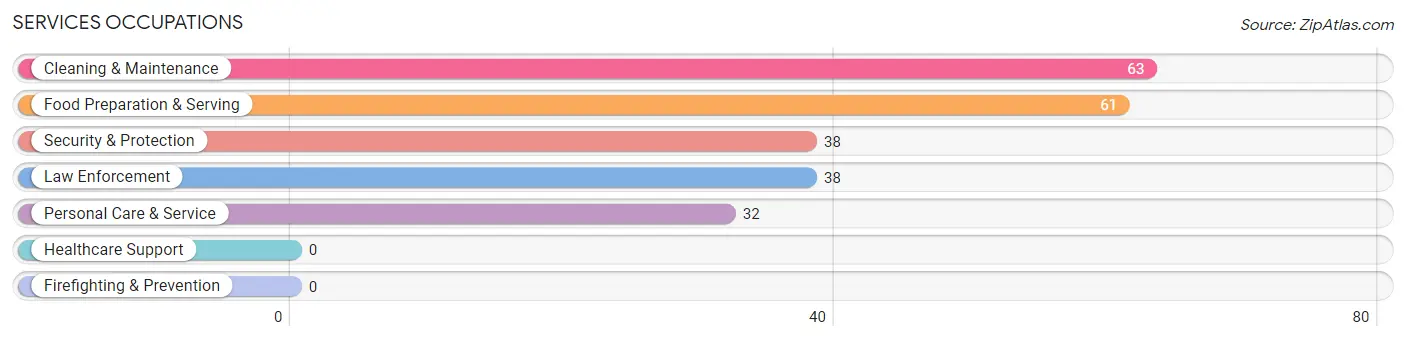
Services Occupations
The most common Services occupations in Manchester are Cleaning & Maintenance (63 | 5.2%), Food Preparation & Serving (61 | 5.1%), Security & Protection (38 | 3.2%), Law Enforcement (38 | 3.2%), and Personal Care & Service (32 | 2.6%).
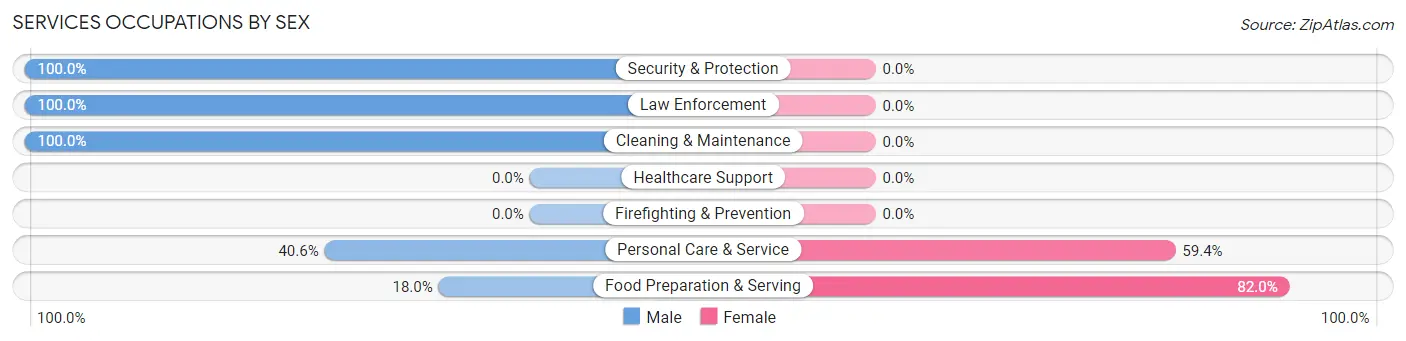
Services Occupations by Sex
Within the Services occupations in Manchester, the most male-oriented occupations are Security & Protection (100.0%), Law Enforcement (100.0%), and Cleaning & Maintenance (100.0%), while the most female-oriented occupations are Food Preparation & Serving (82.0%), and Personal Care & Service (59.4%).
| Occupation | Male | Female |
| Healthcare Support | 0 (0.0%) | 0 (0.0%) |
| Security & Protection | 38 (100.0%) | 0 (0.0%) |
| Firefighting & Prevention | 0 (0.0%) | 0 (0.0%) |
| Law Enforcement | 38 (100.0%) | 0 (0.0%) |
| Food Preparation & Serving | 11 (18.0%) | 50 (82.0%) |
| Cleaning & Maintenance | 63 (100.0%) | 0 (0.0%) |
| Personal Care & Service | 13 (40.6%) | 19 (59.4%) |
| Total (Category) | 125 (64.4%) | 69 (35.6%) |
| Total (Overall) | 733 (60.7%) | 474 (39.3%) |
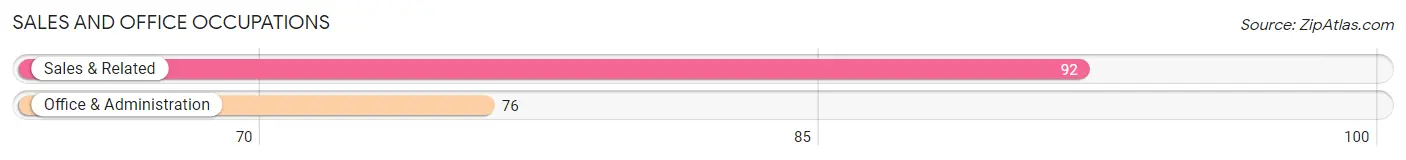
Sales and Office Occupations
The most common Sales and Office occupations in Manchester are Sales & Related (92 | 7.6%), and Office & Administration (76 | 6.3%).
Sales and Office Occupations by Sex
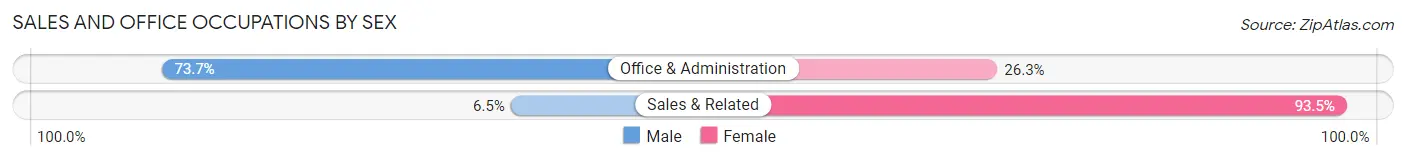
| Occupation | Male | Female |
| Sales & Related | 6 (6.5%) | 86 (93.5%) |
| Office & Administration | 56 (73.7%) | 20 (26.3%) |
| Total (Category) | 62 (36.9%) | 106 (63.1%) |
| Total (Overall) | 733 (60.7%) | 474 (39.3%) |
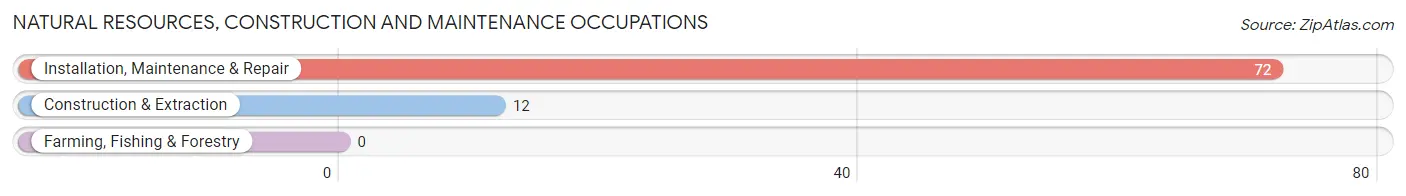
Natural Resources, Construction and Maintenance Occupations
The most common Natural Resources, Construction and Maintenance occupations in Manchester are Installation, Maintenance & Repair (72 | 6.0%), and Construction & Extraction (12 | 1.0%).
Natural Resources, Construction and Maintenance Occupations by Sex
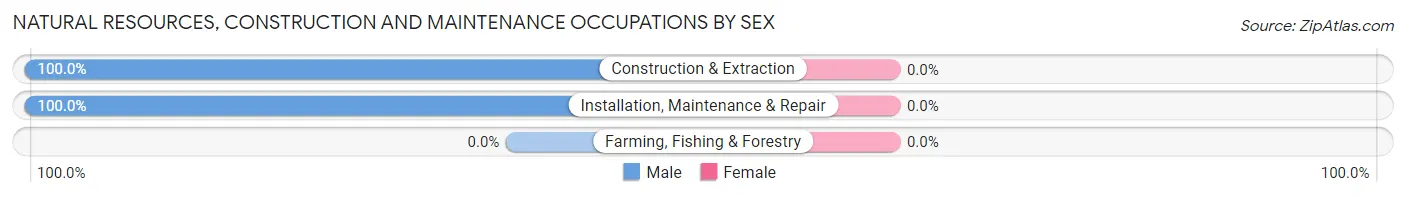
| Occupation | Male | Female |
| Farming, Fishing & Forestry | 0 (0.0%) | 0 (0.0%) |
| Construction & Extraction | 12 (100.0%) | 0 (0.0%) |
| Installation, Maintenance & Repair | 72 (100.0%) | 0 (0.0%) |
| Total (Category) | 84 (100.0%) | 0 (0.0%) |
| Total (Overall) | 733 (60.7%) | 474 (39.3%) |
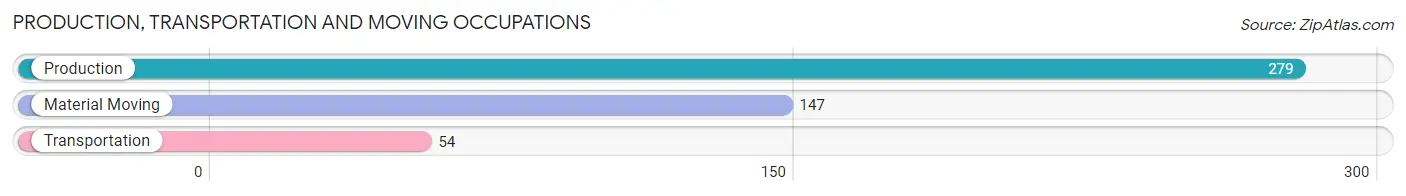
Production, Transportation and Moving Occupations
The most common Production, Transportation and Moving occupations in Manchester are Production (279 | 23.1%), Material Moving (147 | 12.2%), and Transportation (54 | 4.5%).
Production, Transportation and Moving Occupations by Sex

| Occupation | Male | Female |
| Production | 70 (25.1%) | 209 (74.9%) |
| Transportation | 45 (83.3%) | 9 (16.7%) |
| Material Moving | 147 (100.0%) | 0 (0.0%) |
| Total (Category) | 262 (54.6%) | 218 (45.4%) |
| Total (Overall) | 733 (60.7%) | 474 (39.3%) |
Employment Industries by Sex in Manchester
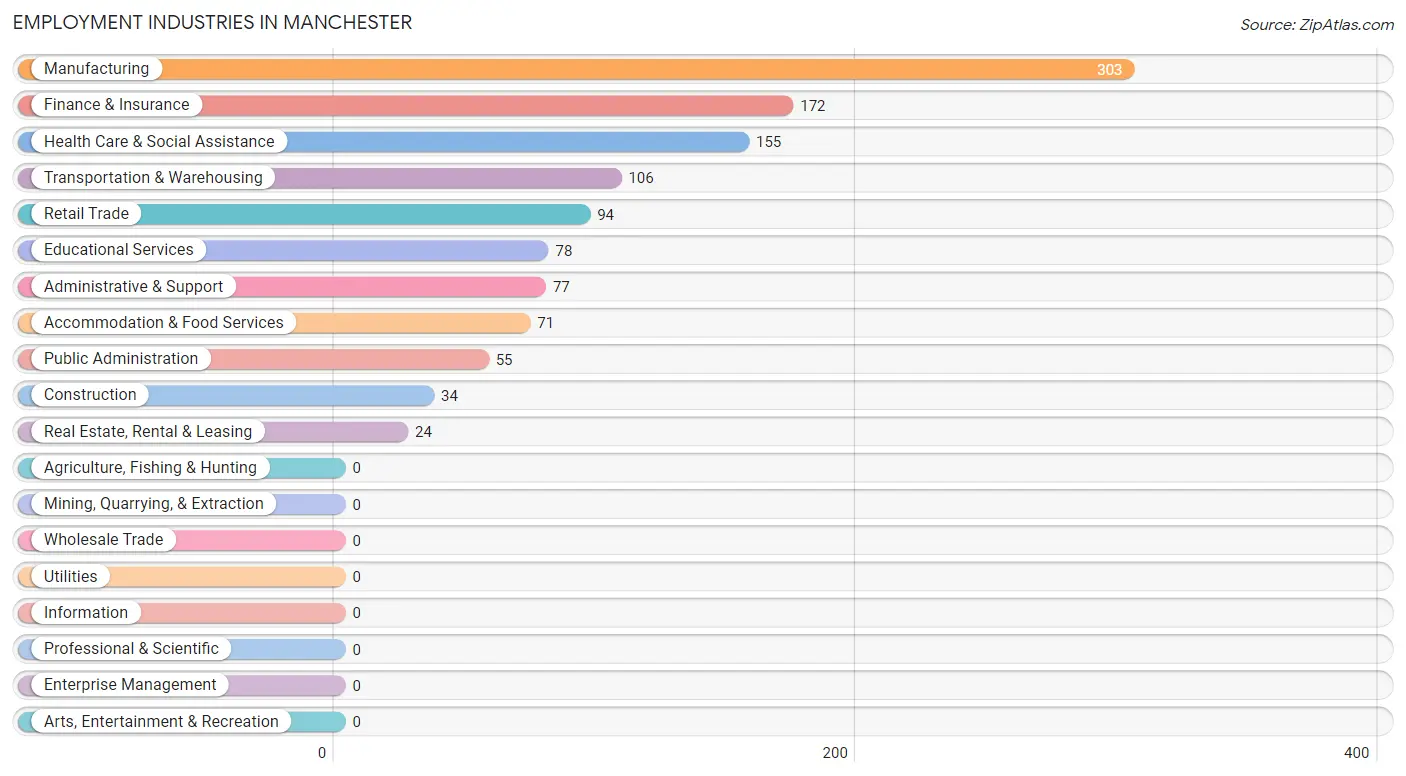
Employment Industries in Manchester
The major employment industries in Manchester include Manufacturing (303 | 25.1%), Finance & Insurance (172 | 14.2%), Health Care & Social Assistance (155 | 12.8%), Transportation & Warehousing (106 | 8.8%), and Retail Trade (94 | 7.8%).
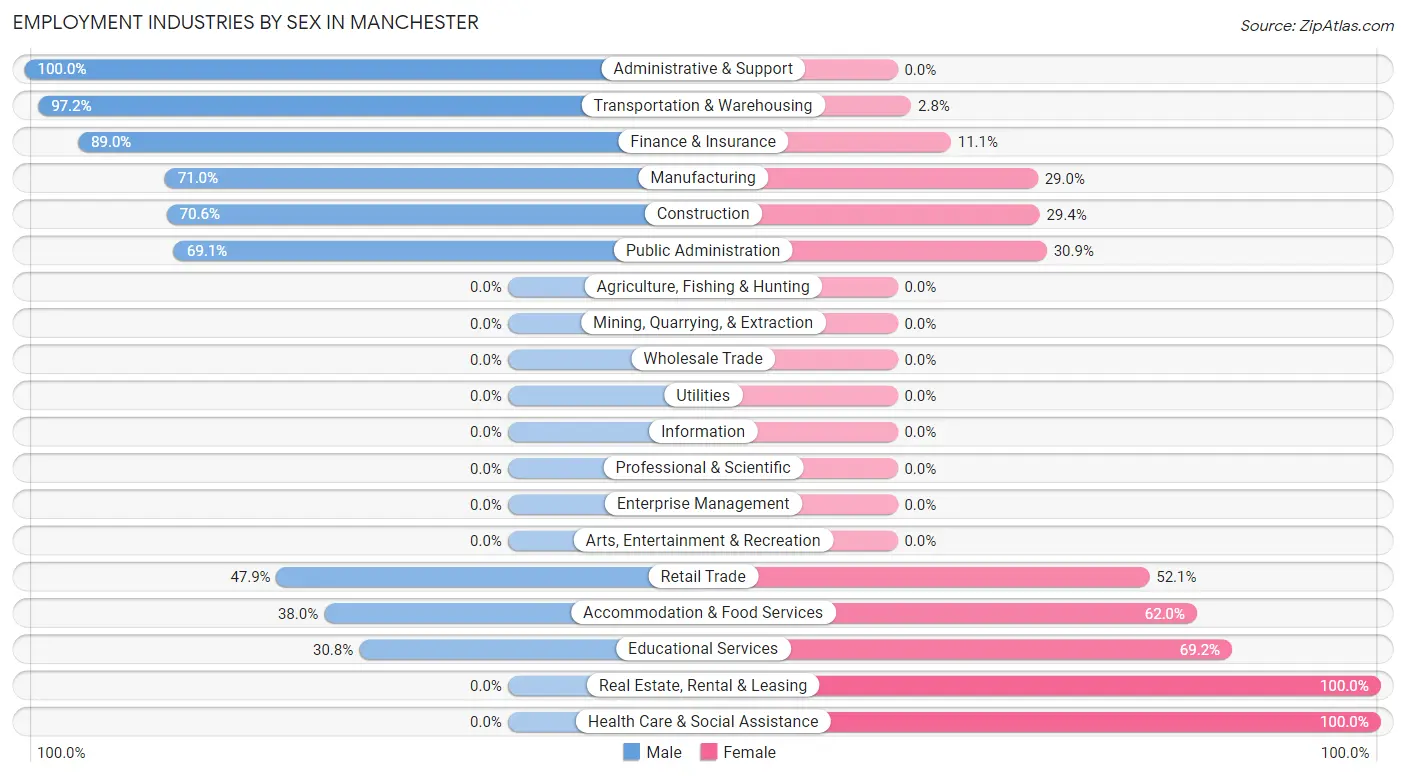
Employment Industries by Sex in Manchester
The Manchester industries that see more men than women are Administrative & Support (100.0%), Transportation & Warehousing (97.2%), and Finance & Insurance (88.9%), whereas the industries that tend to have a higher number of women are Real Estate, Rental & Leasing (100.0%), Health Care & Social Assistance (100.0%), and Educational Services (69.2%).
| Industry | Male | Female |
| Agriculture, Fishing & Hunting | 0 (0.0%) | 0 (0.0%) |
| Mining, Quarrying, & Extraction | 0 (0.0%) | 0 (0.0%) |
| Construction | 24 (70.6%) | 10 (29.4%) |
| Manufacturing | 215 (71.0%) | 88 (29.0%) |
| Wholesale Trade | 0 (0.0%) | 0 (0.0%) |
| Retail Trade | 45 (47.9%) | 49 (52.1%) |
| Transportation & Warehousing | 103 (97.2%) | 3 (2.8%) |
| Utilities | 0 (0.0%) | 0 (0.0%) |
| Information | 0 (0.0%) | 0 (0.0%) |
| Finance & Insurance | 153 (88.9%) | 19 (11.1%) |
| Real Estate, Rental & Leasing | 0 (0.0%) | 24 (100.0%) |
| Professional & Scientific | 0 (0.0%) | 0 (0.0%) |
| Enterprise Management | 0 (0.0%) | 0 (0.0%) |
| Administrative & Support | 77 (100.0%) | 0 (0.0%) |
| Educational Services | 24 (30.8%) | 54 (69.2%) |
| Health Care & Social Assistance | 0 (0.0%) | 155 (100.0%) |
| Arts, Entertainment & Recreation | 0 (0.0%) | 0 (0.0%) |
| Accommodation & Food Services | 27 (38.0%) | 44 (62.0%) |
| Public Administration | 38 (69.1%) | 17 (30.9%) |
| Total | 733 (60.7%) | 474 (39.3%) |
Education in Manchester
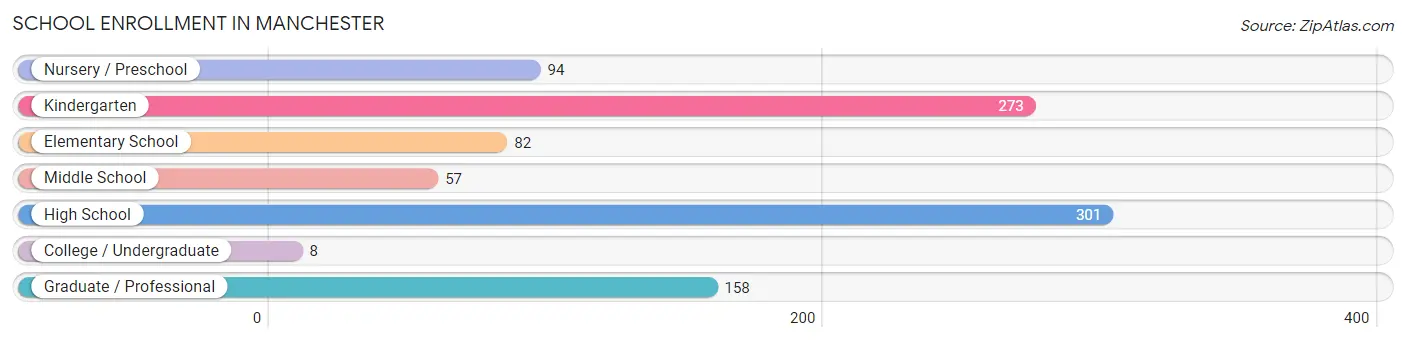
School Enrollment in Manchester
The most common levels of schooling among the 973 students in Manchester are high school (301 | 30.9%), kindergarten (273 | 28.1%), and graduate / professional (158 | 16.2%).
| School Level | # Students | % Students |
| Nursery / Preschool | 94 | 9.7% |
| Kindergarten | 273 | 28.1% |
| Elementary School | 82 | 8.4% |
| Middle School | 57 | 5.9% |
| High School | 301 | 30.9% |
| College / Undergraduate | 8 | 0.8% |
| Graduate / Professional | 158 | 16.2% |
| Total | 973 | 100.0% |
School Enrollment by Age by Funding Source in Manchester
Out of a total of 973 students who are enrolled in schools in Manchester, 193 (19.8%) attend a private institution, while the remaining 780 (80.2%) are enrolled in public schools. The age group of 20 to 24 year olds has the highest likelihood of being enrolled in private schools, with 153 (96.8% in the age bracket) enrolled. Conversely, the age group of 3 to 4 year olds has the lowest likelihood of being enrolled in a private school, with 72 (100.0% in the age bracket) attending a public institution.
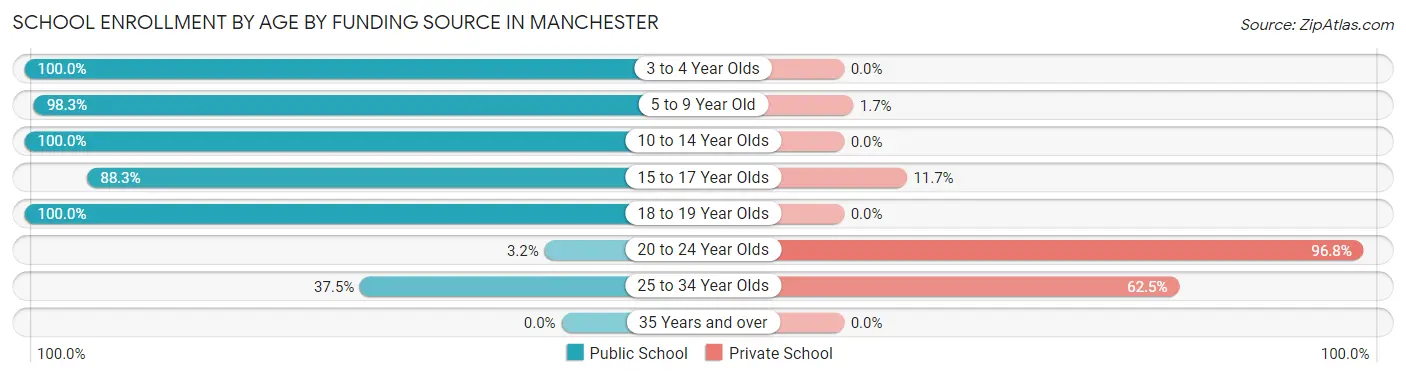
| Age Bracket | Public School | Private School |
| 3 to 4 Year Olds | 72 (100.0%) | 0 (0.0%) |
| 5 to 9 Year Old | 345 (98.3%) | 6 (1.7%) |
| 10 to 14 Year Olds | 83 (100.0%) | 0 (0.0%) |
| 15 to 17 Year Olds | 219 (88.3%) | 29 (11.7%) |
| 18 to 19 Year Olds | 53 (100.0%) | 0 (0.0%) |
| 20 to 24 Year Olds | 5 (3.2%) | 153 (96.8%) |
| 25 to 34 Year Olds | 3 (37.5%) | 5 (62.5%) |
| 35 Years and over | 0 (0.0%) | 0 (0.0%) |
| Total | 780 (80.2%) | 193 (19.8%) |
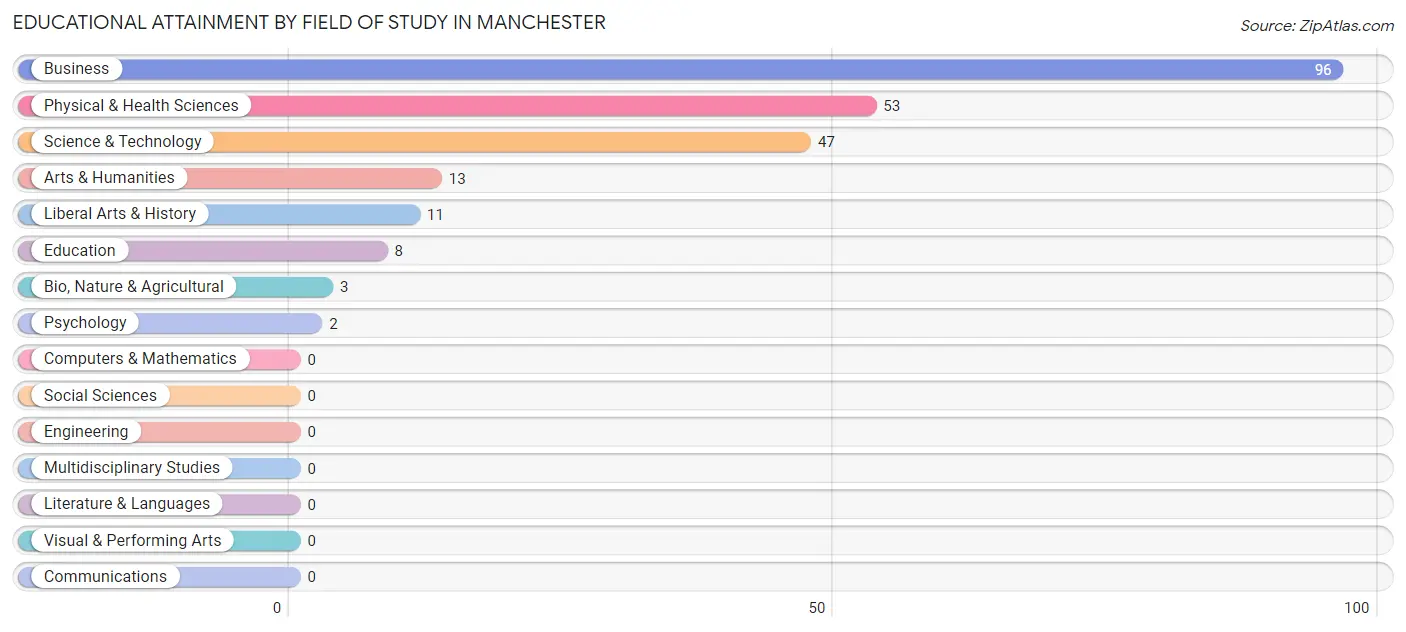
Educational Attainment by Field of Study in Manchester
Business (96 | 41.2%), physical & health sciences (53 | 22.8%), science & technology (47 | 20.2%), arts & humanities (13 | 5.6%), and liberal arts & history (11 | 4.7%) are the most common fields of study among 233 individuals in Manchester who have obtained a bachelor's degree or higher.
| Field of Study | # Graduates | % Graduates |
| Computers & Mathematics | 0 | 0.0% |
| Bio, Nature & Agricultural | 3 | 1.3% |
| Physical & Health Sciences | 53 | 22.8% |
| Psychology | 2 | 0.9% |
| Social Sciences | 0 | 0.0% |
| Engineering | 0 | 0.0% |
| Multidisciplinary Studies | 0 | 0.0% |
| Science & Technology | 47 | 20.2% |
| Business | 96 | 41.2% |
| Education | 8 | 3.4% |
| Literature & Languages | 0 | 0.0% |
| Liberal Arts & History | 11 | 4.7% |
| Visual & Performing Arts | 0 | 0.0% |
| Communications | 0 | 0.0% |
| Arts & Humanities | 13 | 5.6% |
| Total | 233 | 100.0% |
Transportation & Commute in Manchester
Vehicle Availability by Sex in Manchester
The most prevalent vehicle ownership categories in Manchester are males with 2 vehicles (236, accounting for 43.1%) and females with 2 vehicles (164, making up 49.8%).
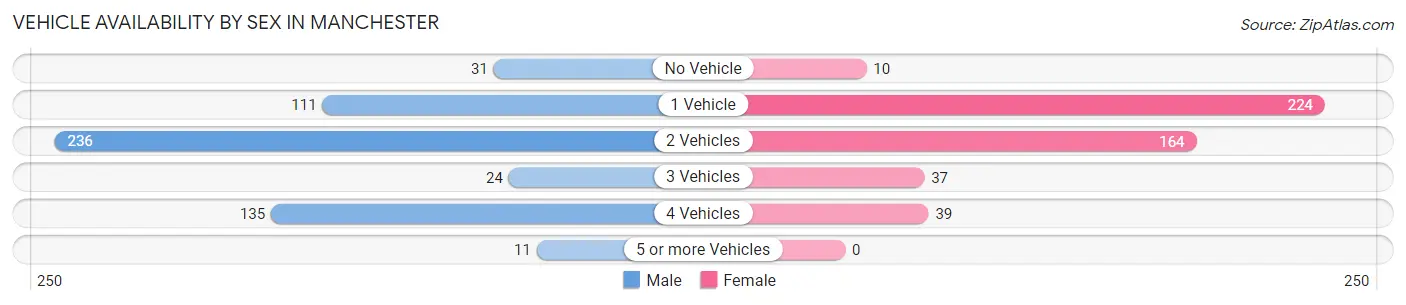
| Vehicles Available | Male | Female |
| No Vehicle | 31 (5.7%) | 10 (2.1%) |
| 1 Vehicle | 111 (20.3%) | 224 (47.3%) |
| 2 Vehicles | 236 (43.1%) | 164 (34.6%) |
| 3 Vehicles | 24 (4.4%) | 37 (7.8%) |
| 4 Vehicles | 135 (24.6%) | 39 (8.2%) |
| 5 or more Vehicles | 11 (2.0%) | 0 (0.0%) |
| Total | 548 (100.0%) | 474 (100.0%) |
Commute Time in Manchester
The most frequently occuring commute durations in Manchester are 45 to 59 minutes (250 commuters, 25.0%), 5 to 9 minutes (220 commuters, 22.0%), and 60 to 89 minutes (143 commuters, 14.3%).
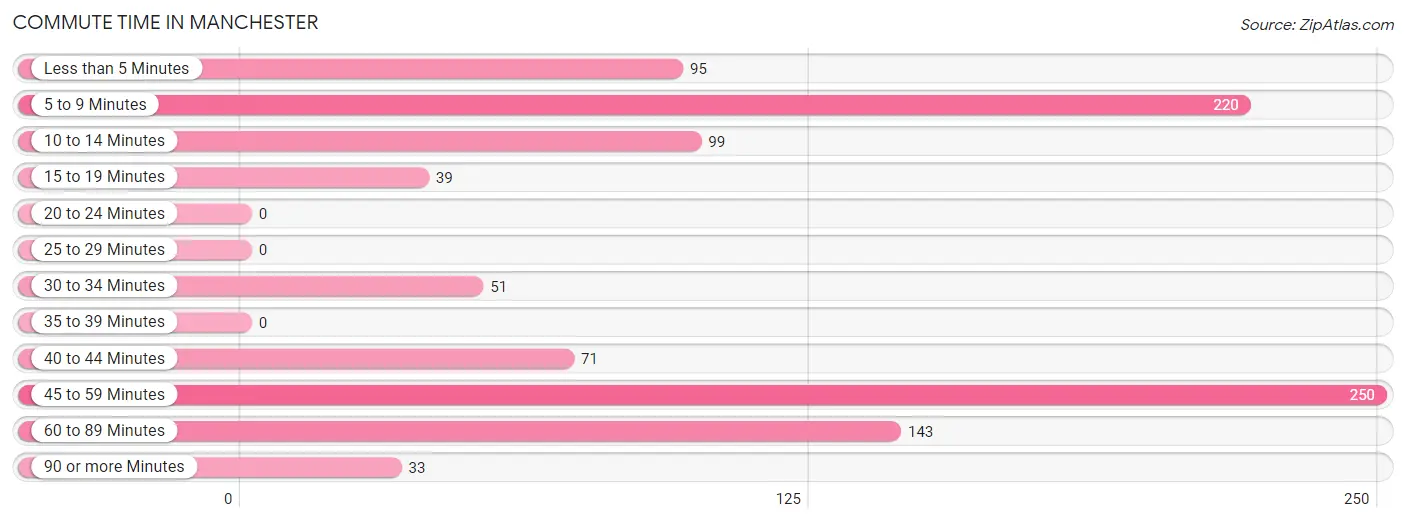
| Commute Time | # Commuters | % Commuters |
| Less than 5 Minutes | 95 | 9.5% |
| 5 to 9 Minutes | 220 | 22.0% |
| 10 to 14 Minutes | 99 | 9.9% |
| 15 to 19 Minutes | 39 | 3.9% |
| 20 to 24 Minutes | 0 | 0.0% |
| 25 to 29 Minutes | 0 | 0.0% |
| 30 to 34 Minutes | 51 | 5.1% |
| 35 to 39 Minutes | 0 | 0.0% |
| 40 to 44 Minutes | 71 | 7.1% |
| 45 to 59 Minutes | 250 | 25.0% |
| 60 to 89 Minutes | 143 | 14.3% |
| 90 or more Minutes | 33 | 3.3% |
Commute Time by Sex in Manchester
The most common commute times in Manchester are 45 to 59 minutes (144 commuters, 27.3%) for males and 5 to 9 minutes (186 commuters, 39.2%) for females.
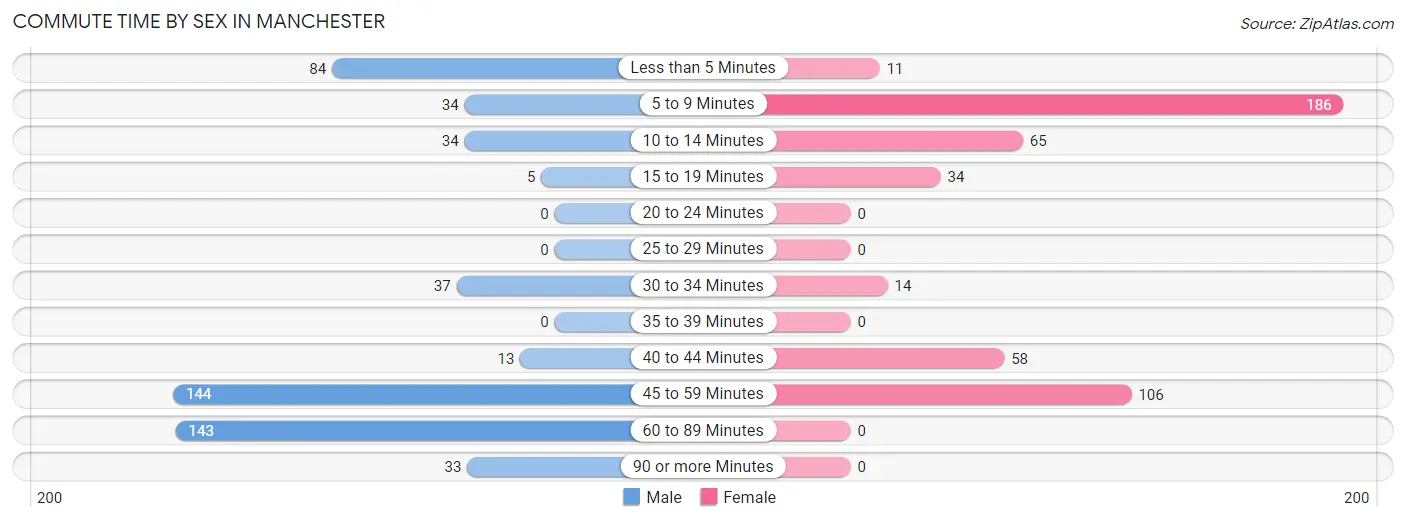
| Commute Time | Male | Female |
| Less than 5 Minutes | 84 (15.9%) | 11 (2.3%) |
| 5 to 9 Minutes | 34 (6.5%) | 186 (39.2%) |
| 10 to 14 Minutes | 34 (6.5%) | 65 (13.7%) |
| 15 to 19 Minutes | 5 (0.9%) | 34 (7.2%) |
| 20 to 24 Minutes | 0 (0.0%) | 0 (0.0%) |
| 25 to 29 Minutes | 0 (0.0%) | 0 (0.0%) |
| 30 to 34 Minutes | 37 (7.0%) | 14 (2.9%) |
| 35 to 39 Minutes | 0 (0.0%) | 0 (0.0%) |
| 40 to 44 Minutes | 13 (2.5%) | 58 (12.2%) |
| 45 to 59 Minutes | 144 (27.3%) | 106 (22.4%) |
| 60 to 89 Minutes | 143 (27.1%) | 0 (0.0%) |
| 90 or more Minutes | 33 (6.3%) | 0 (0.0%) |
Time of Departure to Work by Sex in Manchester
The most frequent times of departure to work in Manchester are 7:30 AM to 7:59 AM (121, 23.0%) for males and 7:30 AM to 7:59 AM (162, 34.2%) for females.
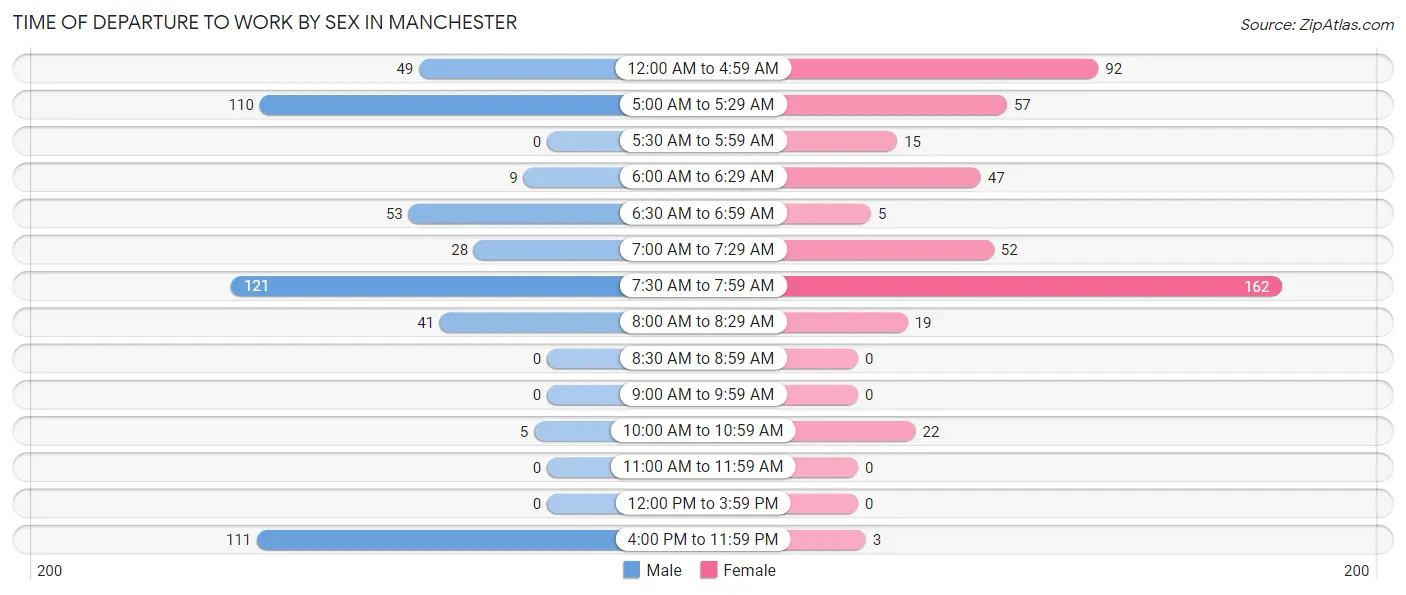
| Time of Departure | Male | Female |
| 12:00 AM to 4:59 AM | 49 (9.3%) | 92 (19.4%) |
| 5:00 AM to 5:29 AM | 110 (20.9%) | 57 (12.0%) |
| 5:30 AM to 5:59 AM | 0 (0.0%) | 15 (3.2%) |
| 6:00 AM to 6:29 AM | 9 (1.7%) | 47 (9.9%) |
| 6:30 AM to 6:59 AM | 53 (10.1%) | 5 (1.1%) |
| 7:00 AM to 7:29 AM | 28 (5.3%) | 52 (11.0%) |
| 7:30 AM to 7:59 AM | 121 (23.0%) | 162 (34.2%) |
| 8:00 AM to 8:29 AM | 41 (7.8%) | 19 (4.0%) |
| 8:30 AM to 8:59 AM | 0 (0.0%) | 0 (0.0%) |
| 9:00 AM to 9:59 AM | 0 (0.0%) | 0 (0.0%) |
| 10:00 AM to 10:59 AM | 5 (0.9%) | 22 (4.6%) |
| 11:00 AM to 11:59 AM | 0 (0.0%) | 0 (0.0%) |
| 12:00 PM to 3:59 PM | 0 (0.0%) | 0 (0.0%) |
| 4:00 PM to 11:59 PM | 111 (21.1%) | 3 (0.6%) |
| Total | 527 (100.0%) | 474 (100.0%) |
Housing Occupancy in Manchester
Occupancy by Ownership in Manchester
Of the total 1,458 dwellings in Manchester, owner-occupied units account for 677 (46.4%), while renter-occupied units make up 781 (53.6%).
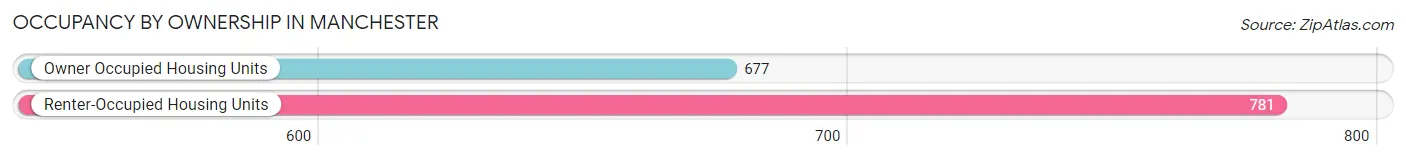
| Occupancy | # Housing Units | % Housing Units |
| Owner Occupied Housing Units | 677 | 46.4% |
| Renter-Occupied Housing Units | 781 | 53.6% |
| Total Occupied Housing Units | 1,458 | 100.0% |
Occupancy by Household Size in Manchester
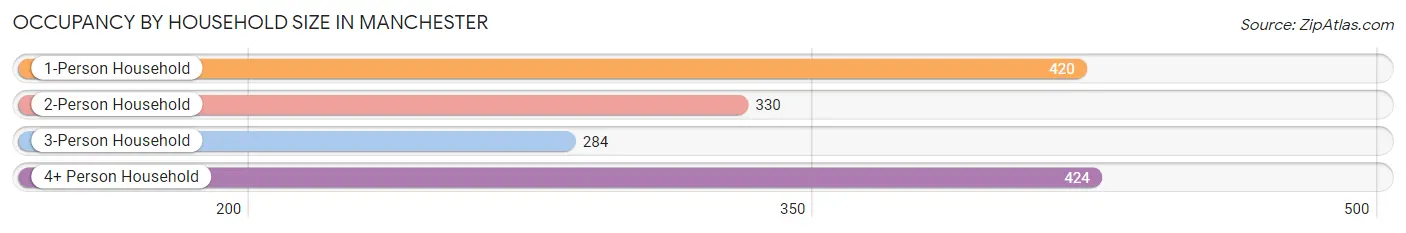
| Household Size | # Housing Units | % Housing Units |
| 1-Person Household | 420 | 28.8% |
| 2-Person Household | 330 | 22.6% |
| 3-Person Household | 284 | 19.5% |
| 4+ Person Household | 424 | 29.1% |
| Total Housing Units | 1,458 | 100.0% |
Occupancy by Ownership by Household Size in Manchester
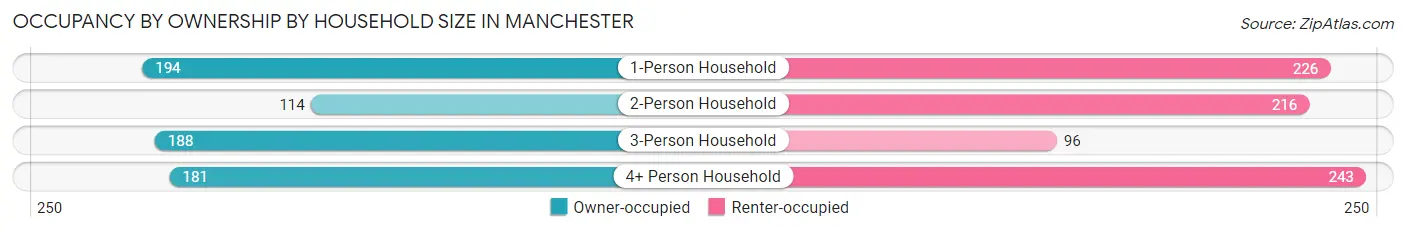
| Household Size | Owner-occupied | Renter-occupied |
| 1-Person Household | 194 (46.2%) | 226 (53.8%) |
| 2-Person Household | 114 (34.5%) | 216 (65.4%) |
| 3-Person Household | 188 (66.2%) | 96 (33.8%) |
| 4+ Person Household | 181 (42.7%) | 243 (57.3%) |
| Total Housing Units | 677 (46.4%) | 781 (53.6%) |
Occupancy by Educational Attainment in Manchester
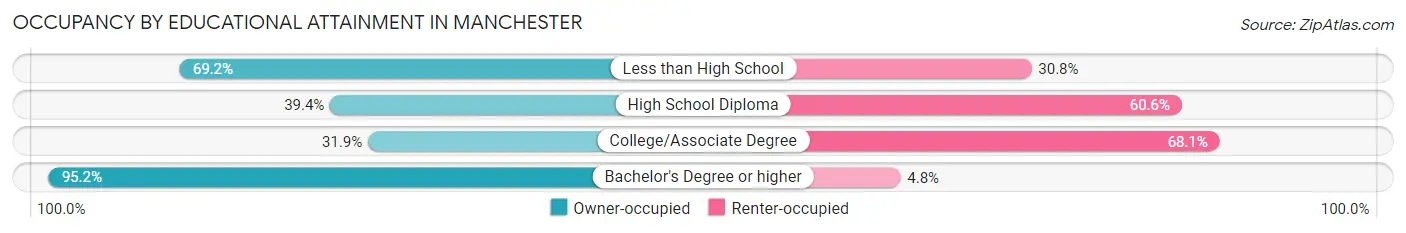
| Household Size | Owner-occupied | Renter-occupied |
| Less than High School | 63 (69.2%) | 28 (30.8%) |
| High School Diploma | 309 (39.4%) | 475 (60.6%) |
| College/Associate Degree | 126 (31.9%) | 269 (68.1%) |
| Bachelor's Degree or higher | 179 (95.2%) | 9 (4.8%) |
Occupancy by Age of Householder in Manchester
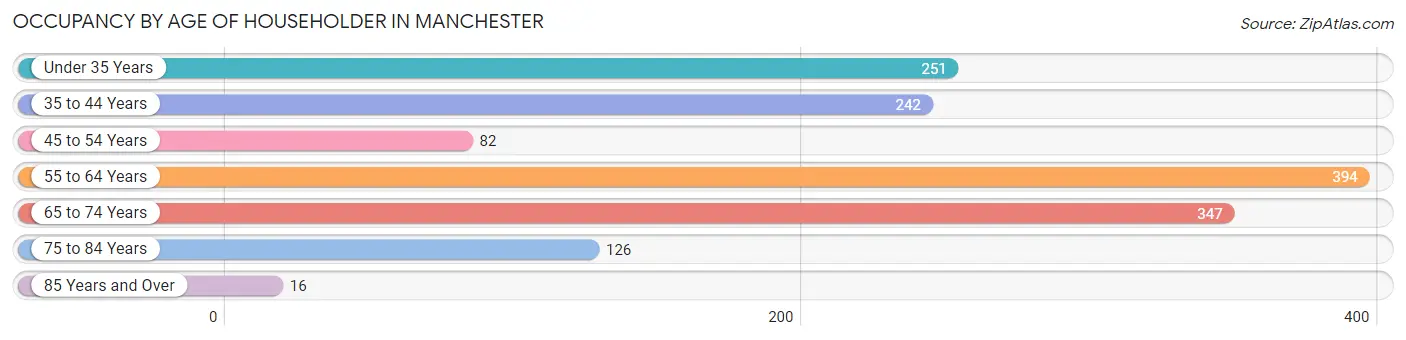
| Age Bracket | # Households | % Households |
| Under 35 Years | 251 | 17.2% |
| 35 to 44 Years | 242 | 16.6% |
| 45 to 54 Years | 82 | 5.6% |
| 55 to 64 Years | 394 | 27.0% |
| 65 to 74 Years | 347 | 23.8% |
| 75 to 84 Years | 126 | 8.6% |
| 85 Years and Over | 16 | 1.1% |
| Total | 1,458 | 100.0% |
Housing Finances in Manchester
Median Income by Occupancy in Manchester
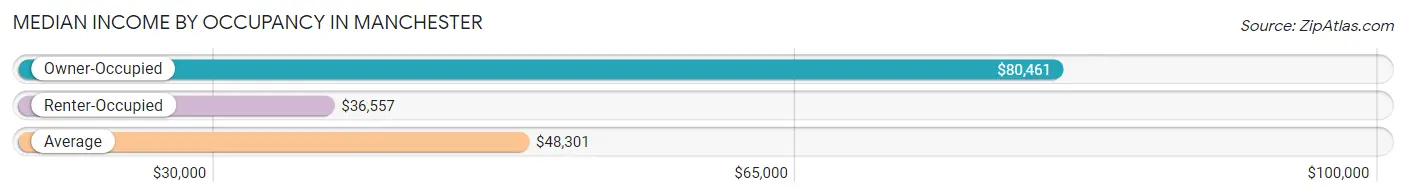
| Occupancy Type | # Households | Median Income |
| Owner-Occupied | 677 (46.4%) | $80,461 |
| Renter-Occupied | 781 (53.6%) | $36,557 |
| Average | 1,458 (100.0%) | $48,301 |
Occupancy by Householder Income Bracket in Manchester
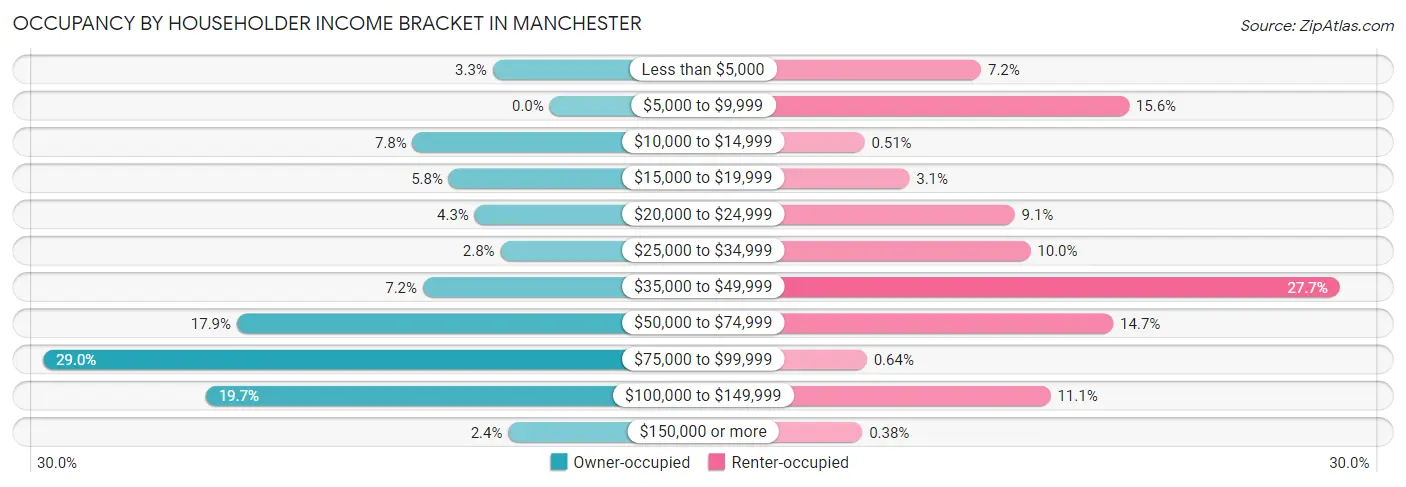
| Income Bracket | Owner-occupied | Renter-occupied |
| Less than $5,000 | 22 (3.3%) | 56 (7.2%) |
| $5,000 to $9,999 | 0 (0.0%) | 122 (15.6%) |
| $10,000 to $14,999 | 53 (7.8%) | 4 (0.5%) |
| $15,000 to $19,999 | 39 (5.8%) | 24 (3.1%) |
| $20,000 to $24,999 | 29 (4.3%) | 71 (9.1%) |
| $25,000 to $34,999 | 19 (2.8%) | 78 (10.0%) |
| $35,000 to $49,999 | 49 (7.2%) | 216 (27.7%) |
| $50,000 to $74,999 | 121 (17.9%) | 115 (14.7%) |
| $75,000 to $99,999 | 196 (28.9%) | 5 (0.6%) |
| $100,000 to $149,999 | 133 (19.7%) | 87 (11.1%) |
| $150,000 or more | 16 (2.4%) | 3 (0.4%) |
| Total | 677 (100.0%) | 781 (100.0%) |
Monthly Housing Cost Tiers in Manchester
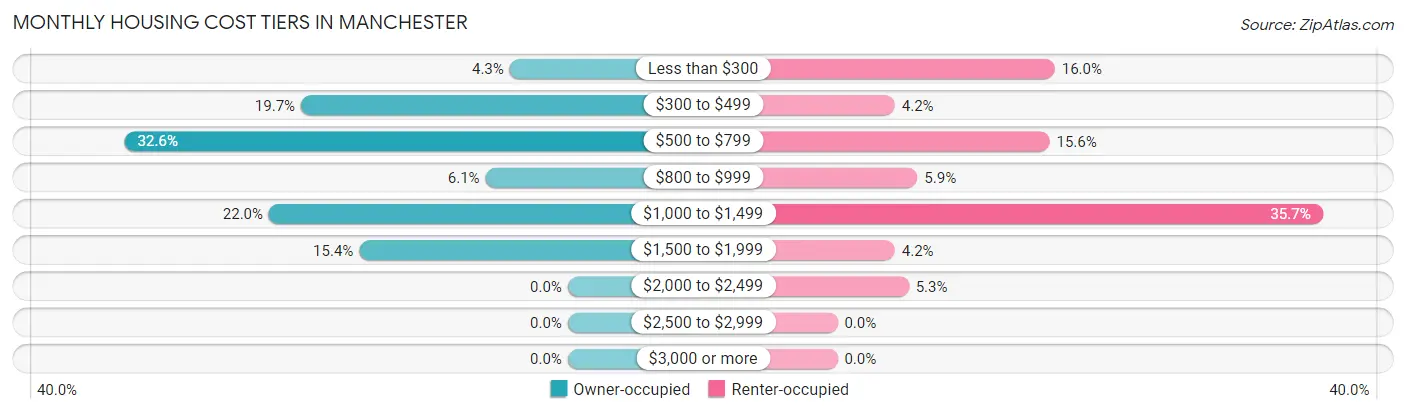
| Monthly Cost | Owner-occupied | Renter-occupied |
| Less than $300 | 29 (4.3%) | 125 (16.0%) |
| $300 to $499 | 133 (19.7%) | 33 (4.2%) |
| $500 to $799 | 221 (32.6%) | 122 (15.6%) |
| $800 to $999 | 41 (6.1%) | 46 (5.9%) |
| $1,000 to $1,499 | 149 (22.0%) | 279 (35.7%) |
| $1,500 to $1,999 | 104 (15.4%) | 33 (4.2%) |
| $2,000 to $2,499 | 0 (0.0%) | 41 (5.2%) |
| $2,500 to $2,999 | 0 (0.0%) | 0 (0.0%) |
| $3,000 or more | 0 (0.0%) | 0 (0.0%) |
| Total | 677 (100.0%) | 781 (100.0%) |
Physical Housing Characteristics in Manchester
Housing Structures in Manchester
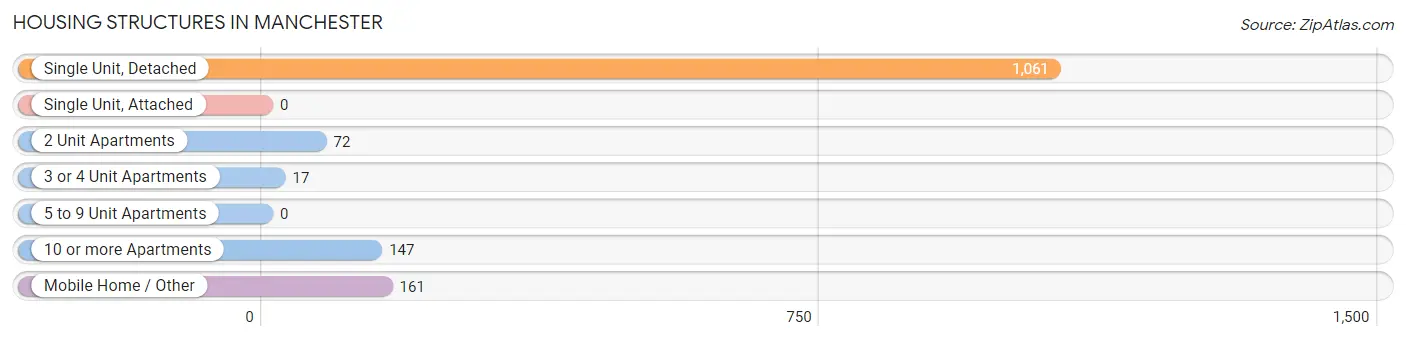
| Structure Type | # Housing Units | % Housing Units |
| Single Unit, Detached | 1,061 | 72.8% |
| Single Unit, Attached | 0 | 0.0% |
| 2 Unit Apartments | 72 | 4.9% |
| 3 or 4 Unit Apartments | 17 | 1.2% |
| 5 to 9 Unit Apartments | 0 | 0.0% |
| 10 or more Apartments | 147 | 10.1% |
| Mobile Home / Other | 161 | 11.0% |
| Total | 1,458 | 100.0% |
Housing Structures by Occupancy in Manchester
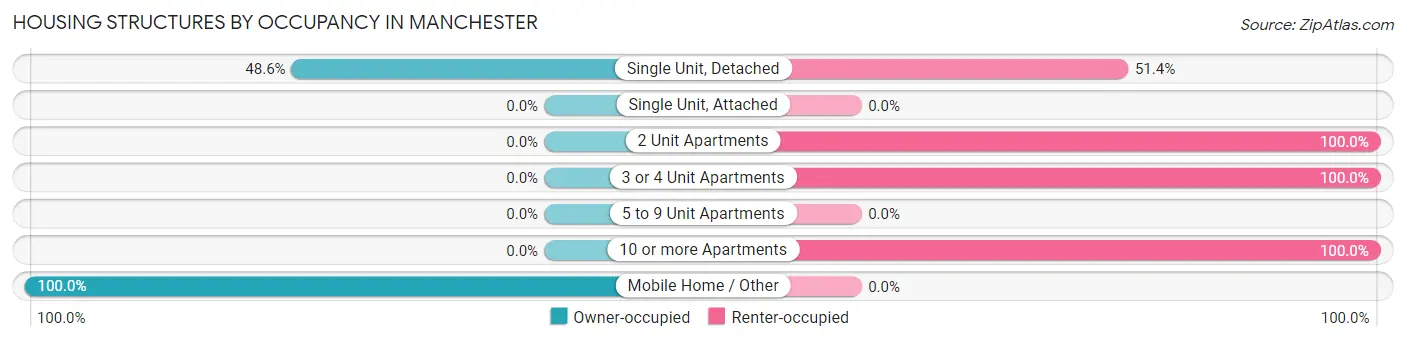
| Structure Type | Owner-occupied | Renter-occupied |
| Single Unit, Detached | 516 (48.6%) | 545 (51.4%) |
| Single Unit, Attached | 0 (0.0%) | 0 (0.0%) |
| 2 Unit Apartments | 0 (0.0%) | 72 (100.0%) |
| 3 or 4 Unit Apartments | 0 (0.0%) | 17 (100.0%) |
| 5 to 9 Unit Apartments | 0 (0.0%) | 0 (0.0%) |
| 10 or more Apartments | 0 (0.0%) | 147 (100.0%) |
| Mobile Home / Other | 161 (100.0%) | 0 (0.0%) |
| Total | 677 (46.4%) | 781 (53.6%) |
Housing Structures by Number of Rooms in Manchester
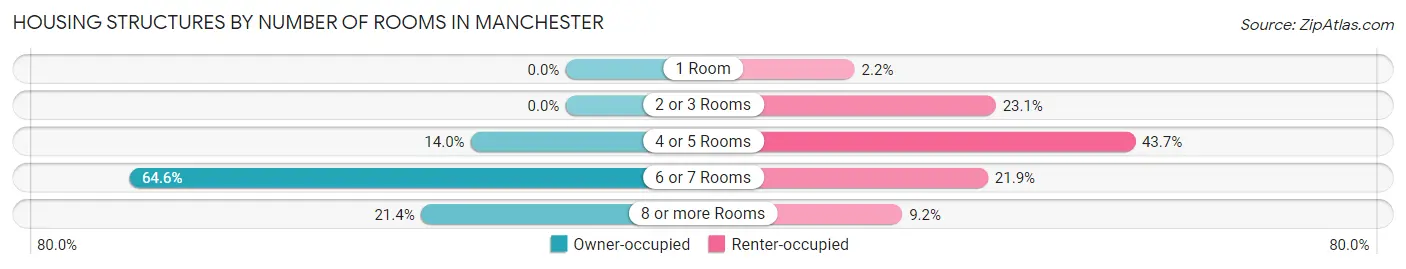
| Number of Rooms | Owner-occupied | Renter-occupied |
| 1 Room | 0 (0.0%) | 17 (2.2%) |
| 2 or 3 Rooms | 0 (0.0%) | 180 (23.1%) |
| 4 or 5 Rooms | 95 (14.0%) | 341 (43.7%) |
| 6 or 7 Rooms | 437 (64.5%) | 171 (21.9%) |
| 8 or more Rooms | 145 (21.4%) | 72 (9.2%) |
| Total | 677 (100.0%) | 781 (100.0%) |
Housing Structure by Heating Type in Manchester
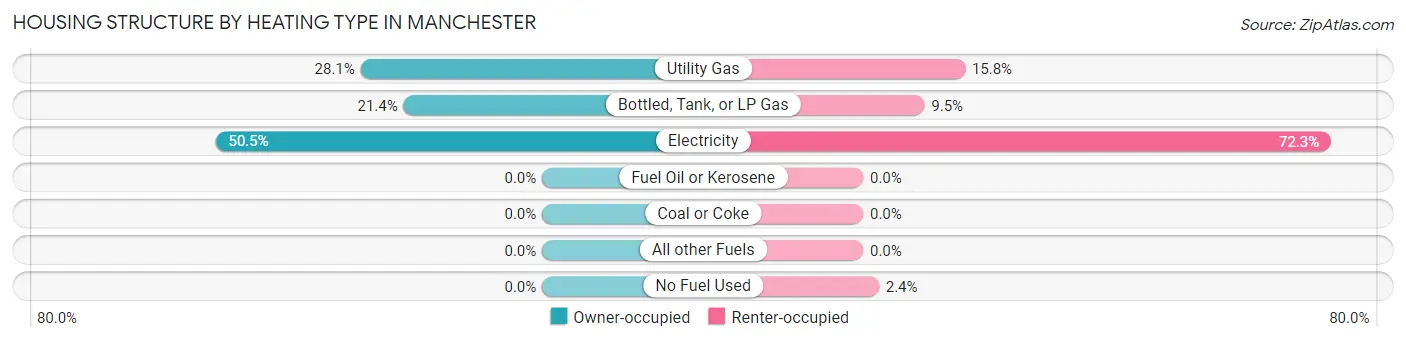
| Heating Type | Owner-occupied | Renter-occupied |
| Utility Gas | 190 (28.1%) | 123 (15.8%) |
| Bottled, Tank, or LP Gas | 145 (21.4%) | 74 (9.5%) |
| Electricity | 342 (50.5%) | 565 (72.3%) |
| Fuel Oil or Kerosene | 0 (0.0%) | 0 (0.0%) |
| Coal or Coke | 0 (0.0%) | 0 (0.0%) |
| All other Fuels | 0 (0.0%) | 0 (0.0%) |
| No Fuel Used | 0 (0.0%) | 19 (2.4%) |
| Total | 677 (100.0%) | 781 (100.0%) |
Household Vehicle Usage in Manchester
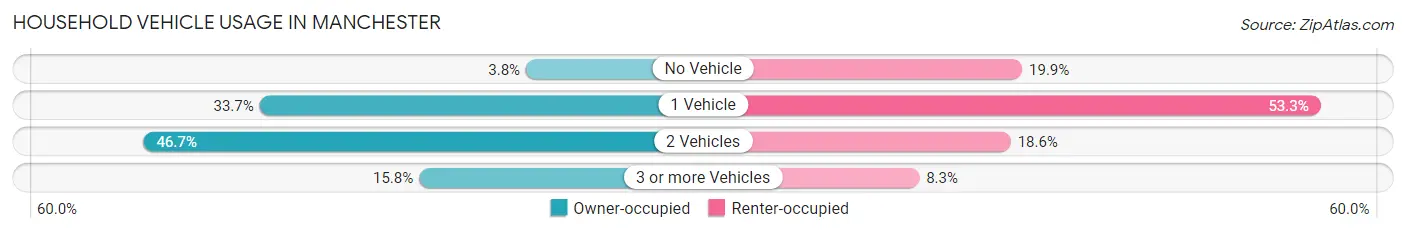
| Vehicles per Household | Owner-occupied | Renter-occupied |
| No Vehicle | 26 (3.8%) | 155 (19.9%) |
| 1 Vehicle | 228 (33.7%) | 416 (53.3%) |
| 2 Vehicles | 316 (46.7%) | 145 (18.6%) |
| 3 or more Vehicles | 107 (15.8%) | 65 (8.3%) |
| Total | 677 (100.0%) | 781 (100.0%) |
Real Estate & Mortgages in Manchester
Real Estate and Mortgage Overview in Manchester
| Characteristic | Without Mortgage | With Mortgage |
| Housing Units | 350 | 327 |
| Median Property Value | - | - |
| Median Household Income | $82,931 | $16 |
| Monthly Housing Costs | $615 | $0 |
| Real Estate Taxes | $790 | $19 |
Property Value by Mortgage Status in Manchester
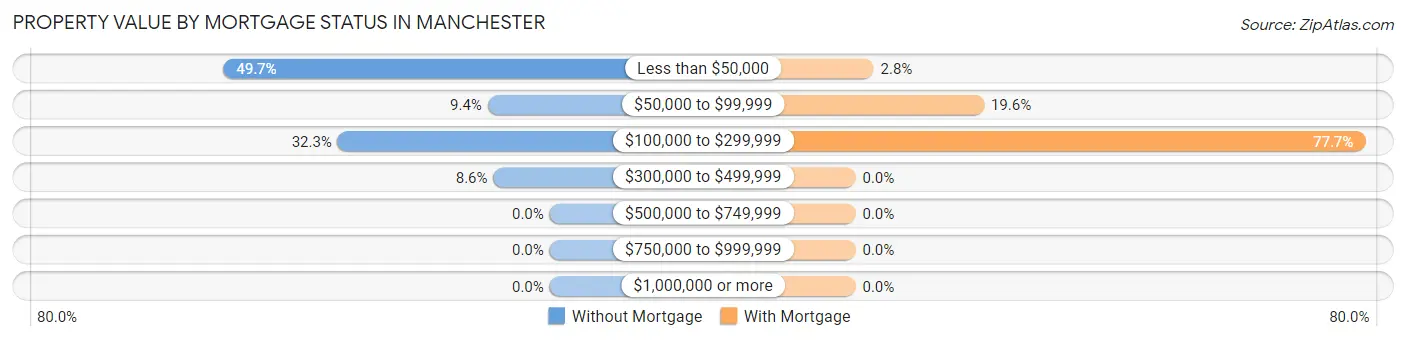
| Property Value | Without Mortgage | With Mortgage |
| Less than $50,000 | 174 (49.7%) | 9 (2.8%) |
| $50,000 to $99,999 | 33 (9.4%) | 64 (19.6%) |
| $100,000 to $299,999 | 113 (32.3%) | 254 (77.7%) |
| $300,000 to $499,999 | 30 (8.6%) | 0 (0.0%) |
| $500,000 to $749,999 | 0 (0.0%) | 0 (0.0%) |
| $750,000 to $999,999 | 0 (0.0%) | 0 (0.0%) |
| $1,000,000 or more | 0 (0.0%) | 0 (0.0%) |
| Total | 350 (100.0%) | 327 (100.0%) |
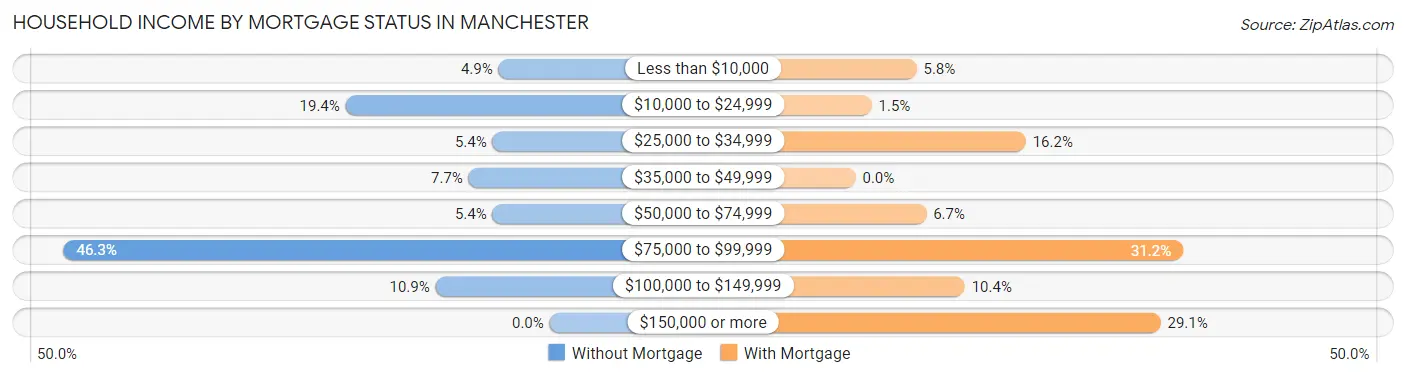
Household Income by Mortgage Status in Manchester
| Household Income | Without Mortgage | With Mortgage |
| Less than $10,000 | 17 (4.9%) | 19 (5.8%) |
| $10,000 to $24,999 | 68 (19.4%) | 5 (1.5%) |
| $25,000 to $34,999 | 19 (5.4%) | 53 (16.2%) |
| $35,000 to $49,999 | 27 (7.7%) | 0 (0.0%) |
| $50,000 to $74,999 | 19 (5.4%) | 22 (6.7%) |
| $75,000 to $99,999 | 162 (46.3%) | 102 (31.2%) |
| $100,000 to $149,999 | 38 (10.9%) | 34 (10.4%) |
| $150,000 or more | 0 (0.0%) | 95 (29.0%) |
| Total | 350 (100.0%) | 327 (100.0%) |
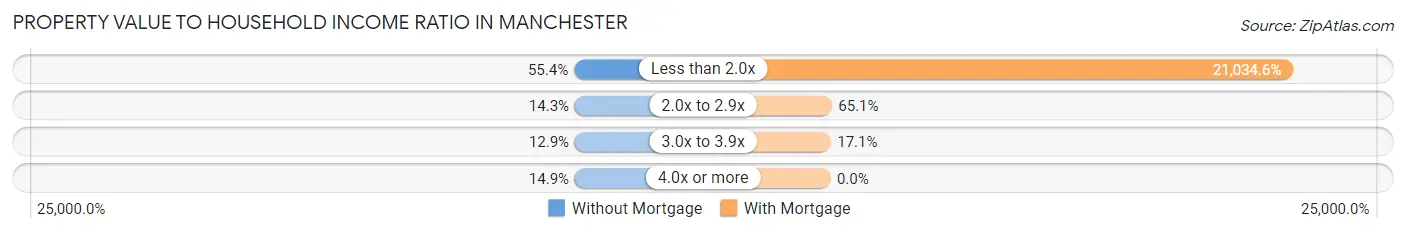
Property Value to Household Income Ratio in Manchester
| Value-to-Income Ratio | Without Mortgage | With Mortgage |
| Less than 2.0x | 194 (55.4%) | 68,783 (21,034.6%) |
| 2.0x to 2.9x | 50 (14.3%) | 213 (65.1%) |
| 3.0x to 3.9x | 45 (12.9%) | 56 (17.1%) |
| 4.0x or more | 52 (14.9%) | 0 (0.0%) |
| Total | 350 (100.0%) | 327 (100.0%) |
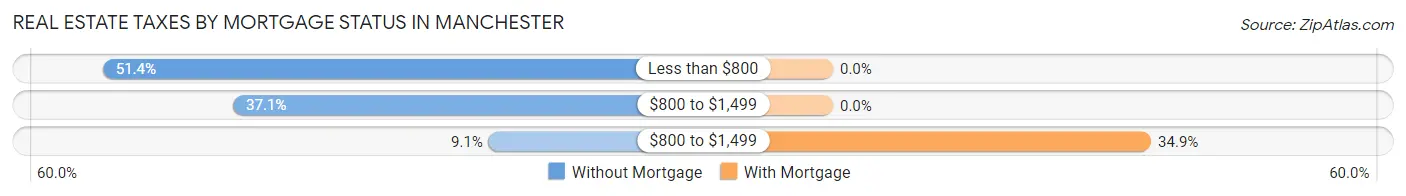
Real Estate Taxes by Mortgage Status in Manchester
| Property Taxes | Without Mortgage | With Mortgage |
| Less than $800 | 180 (51.4%) | 0 (0.0%) |
| $800 to $1,499 | 130 (37.1%) | 0 (0.0%) |
| $800 to $1,499 | 32 (9.1%) | 114 (34.9%) |
| Total | 350 (100.0%) | 327 (100.0%) |
Health & Disability in Manchester
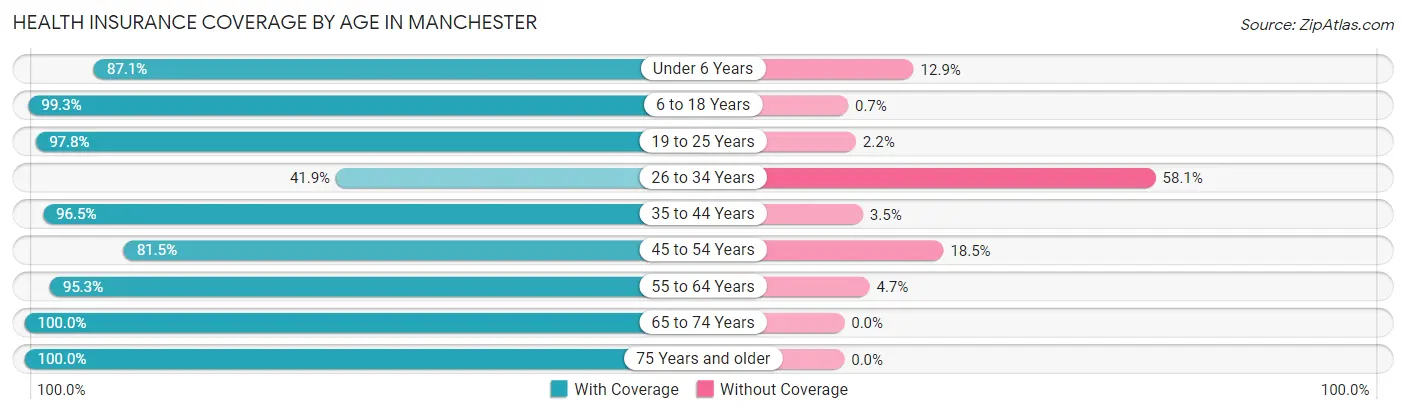
Health Insurance Coverage by Age in Manchester
| Age Bracket | With Coverage | Without Coverage |
| Under 6 Years | 377 (87.1%) | 56 (12.9%) |
| 6 to 18 Years | 713 (99.3%) | 5 (0.7%) |
| 19 to 25 Years | 315 (97.8%) | 7 (2.2%) |
| 26 to 34 Years | 156 (41.9%) | 216 (58.1%) |
| 35 to 44 Years | 306 (96.5%) | 11 (3.5%) |
| 45 to 54 Years | 216 (81.5%) | 49 (18.5%) |
| 55 to 64 Years | 465 (95.3%) | 23 (4.7%) |
| 65 to 74 Years | 531 (100.0%) | 0 (0.0%) |
| 75 Years and older | 166 (100.0%) | 0 (0.0%) |
| Total | 3,245 (89.8%) | 367 (10.2%) |
Health Insurance Coverage by Citizenship Status in Manchester
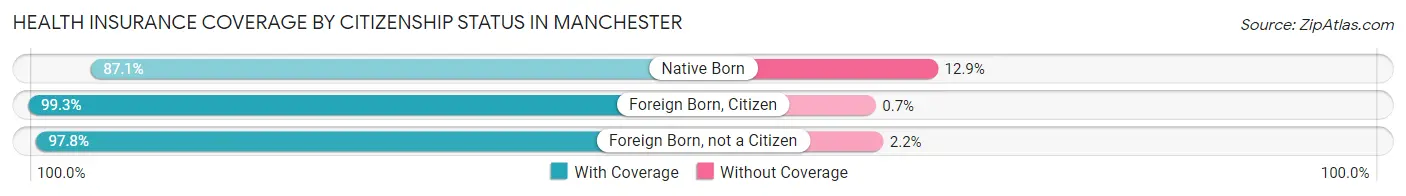
| Citizenship Status | With Coverage | Without Coverage |
| Native Born | 377 (87.1%) | 56 (12.9%) |
| Foreign Born, Citizen | 713 (99.3%) | 5 (0.7%) |
| Foreign Born, not a Citizen | 315 (97.8%) | 7 (2.2%) |
Health Insurance Coverage by Household Income in Manchester
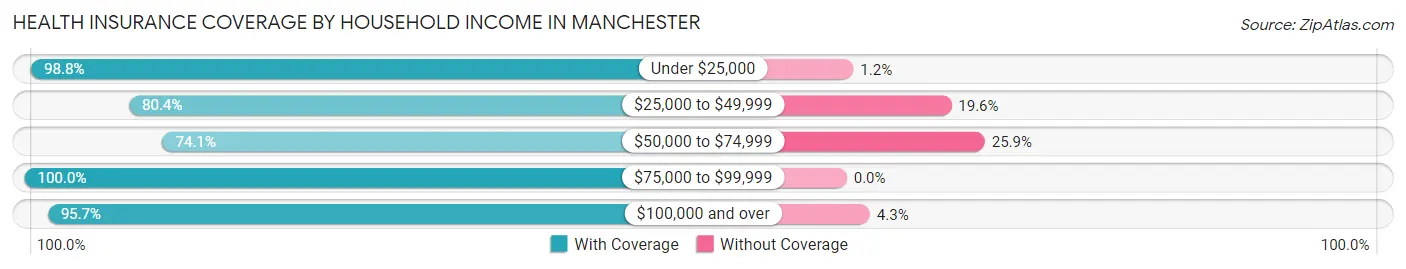
| Household Income | With Coverage | Without Coverage |
| Under $25,000 | 875 (98.8%) | 11 (1.2%) |
| $25,000 to $49,999 | 698 (80.4%) | 170 (19.6%) |
| $50,000 to $74,999 | 450 (74.1%) | 157 (25.9%) |
| $75,000 to $99,999 | 581 (100.0%) | 0 (0.0%) |
| $100,000 and over | 641 (95.7%) | 29 (4.3%) |
Public vs Private Health Insurance Coverage by Age in Manchester
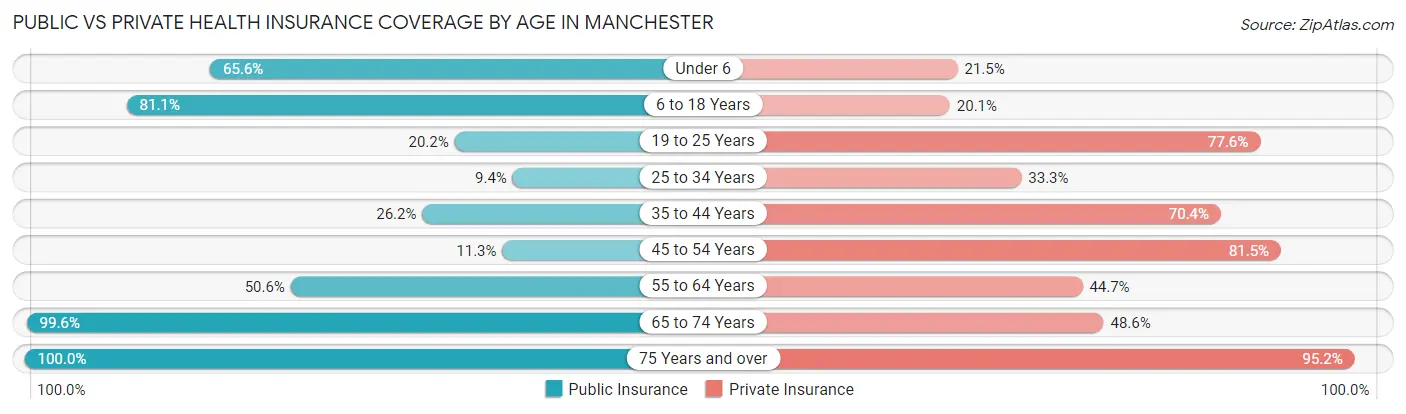
| Age Bracket | Public Insurance | Private Insurance |
| Under 6 | 284 (65.6%) | 93 (21.5%) |
| 6 to 18 Years | 582 (81.1%) | 144 (20.1%) |
| 19 to 25 Years | 65 (20.2%) | 250 (77.6%) |
| 25 to 34 Years | 35 (9.4%) | 124 (33.3%) |
| 35 to 44 Years | 83 (26.2%) | 223 (70.4%) |
| 45 to 54 Years | 30 (11.3%) | 216 (81.5%) |
| 55 to 64 Years | 247 (50.6%) | 218 (44.7%) |
| 65 to 74 Years | 529 (99.6%) | 258 (48.6%) |
| 75 Years and over | 166 (100.0%) | 158 (95.2%) |
| Total | 2,021 (55.9%) | 1,684 (46.6%) |
Disability Status by Sex by Age in Manchester
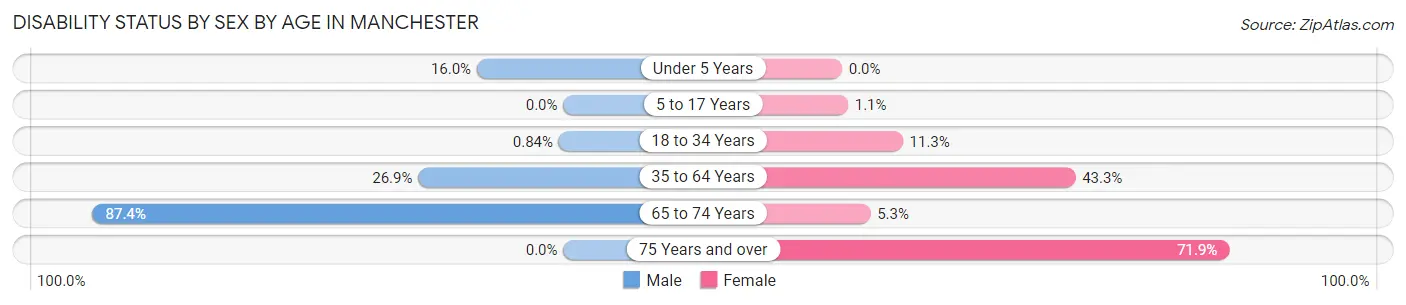
| Age Bracket | Male | Female |
| Under 5 Years | 43 (16.0%) | 0 (0.0%) |
| 5 to 17 Years | 0 (0.0%) | 4 (1.1%) |
| 18 to 34 Years | 3 (0.8%) | 48 (11.3%) |
| 35 to 64 Years | 137 (26.9%) | 243 (43.3%) |
| 65 to 74 Years | 166 (87.4%) | 18 (5.3%) |
| 75 Years and over | 0 (0.0%) | 87 (71.9%) |
Disability Class by Sex by Age in Manchester
Disability Class: Hearing Difficulty
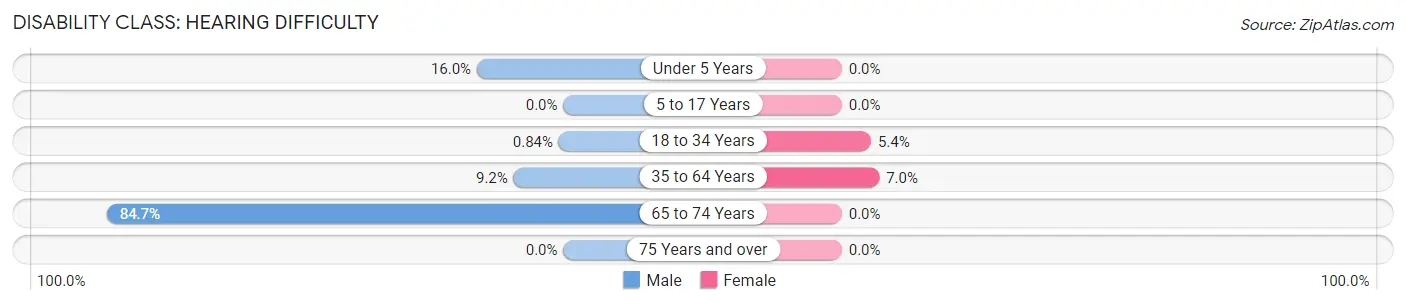
| Age Bracket | Male | Female |
| Under 5 Years | 43 (16.0%) | 0 (0.0%) |
| 5 to 17 Years | 0 (0.0%) | 0 (0.0%) |
| 18 to 34 Years | 3 (0.8%) | 23 (5.4%) |
| 35 to 64 Years | 47 (9.2%) | 39 (7.0%) |
| 65 to 74 Years | 161 (84.7%) | 0 (0.0%) |
| 75 Years and over | 0 (0.0%) | 0 (0.0%) |
Disability Class: Vision Difficulty
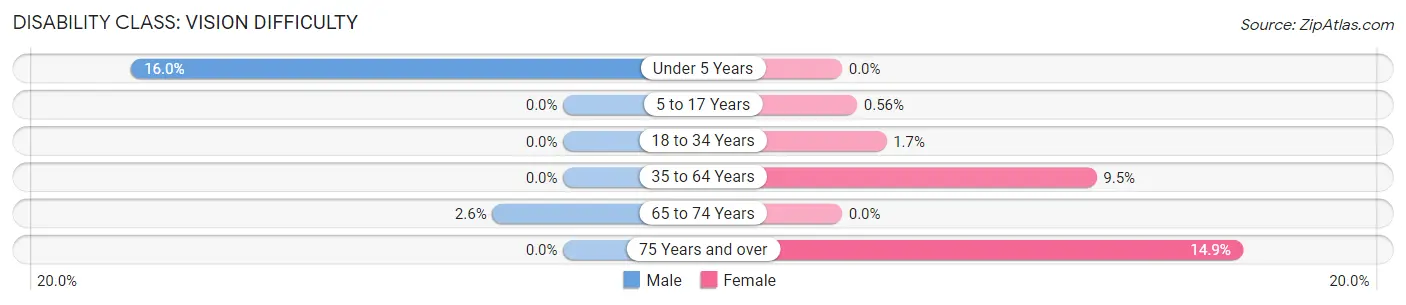
| Age Bracket | Male | Female |
| Under 5 Years | 43 (16.0%) | 0 (0.0%) |
| 5 to 17 Years | 0 (0.0%) | 2 (0.6%) |
| 18 to 34 Years | 0 (0.0%) | 7 (1.7%) |
| 35 to 64 Years | 0 (0.0%) | 53 (9.5%) |
| 65 to 74 Years | 5 (2.6%) | 0 (0.0%) |
| 75 Years and over | 0 (0.0%) | 18 (14.9%) |
Disability Class: Cognitive Difficulty
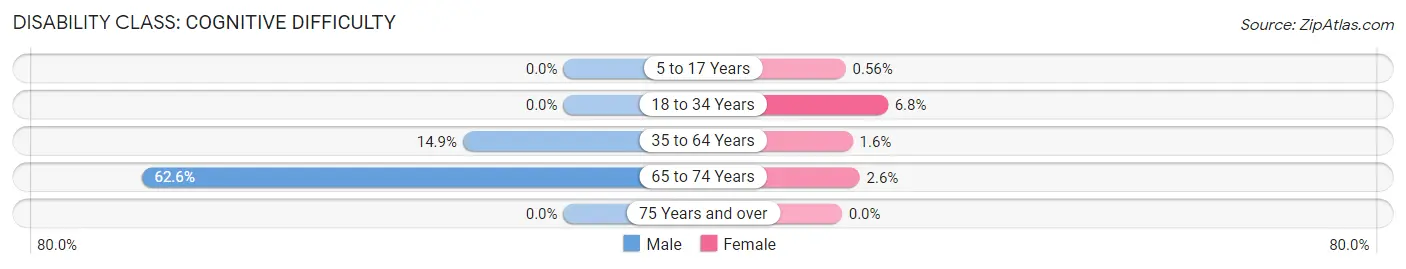
| Age Bracket | Male | Female |
| 5 to 17 Years | 0 (0.0%) | 2 (0.6%) |
| 18 to 34 Years | 0 (0.0%) | 29 (6.8%) |
| 35 to 64 Years | 76 (14.9%) | 9 (1.6%) |
| 65 to 74 Years | 119 (62.6%) | 9 (2.6%) |
| 75 Years and over | 0 (0.0%) | 0 (0.0%) |
Disability Class: Ambulatory Difficulty
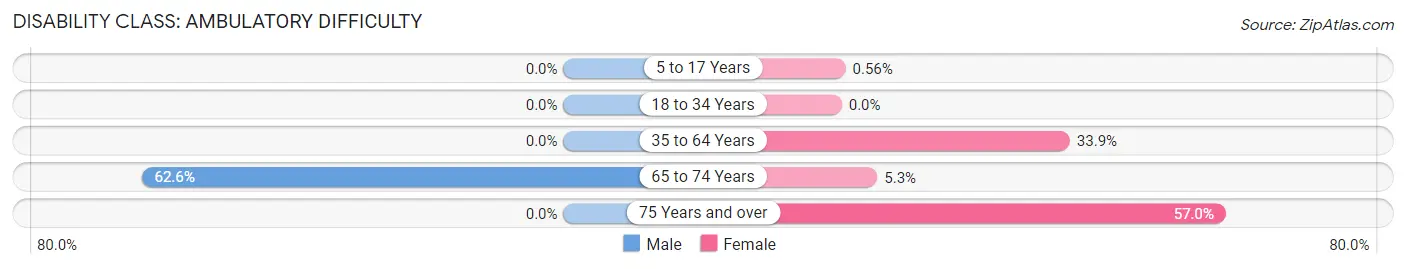
| Age Bracket | Male | Female |
| 5 to 17 Years | 0 (0.0%) | 2 (0.6%) |
| 18 to 34 Years | 0 (0.0%) | 0 (0.0%) |
| 35 to 64 Years | 0 (0.0%) | 190 (33.9%) |
| 65 to 74 Years | 119 (62.6%) | 18 (5.3%) |
| 75 Years and over | 0 (0.0%) | 69 (57.0%) |
Disability Class: Self-Care Difficulty
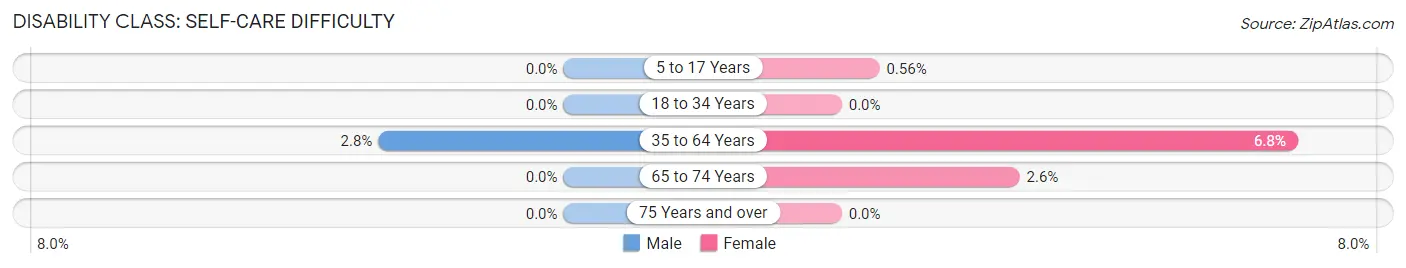
| Age Bracket | Male | Female |
| 5 to 17 Years | 0 (0.0%) | 2 (0.6%) |
| 18 to 34 Years | 0 (0.0%) | 0 (0.0%) |
| 35 to 64 Years | 14 (2.8%) | 38 (6.8%) |
| 65 to 74 Years | 0 (0.0%) | 9 (2.6%) |
| 75 Years and over | 0 (0.0%) | 0 (0.0%) |
Technology Access in Manchester
Computing Device Access in Manchester
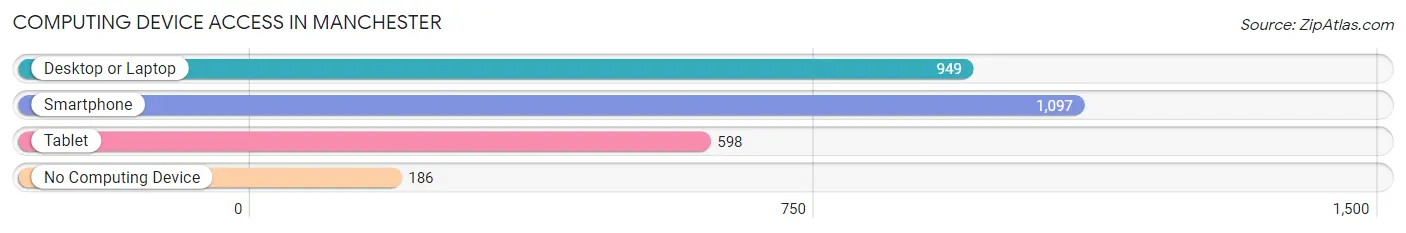
| Device Type | # Households | % Households |
| Desktop or Laptop | 949 | 65.1% |
| Smartphone | 1,097 | 75.2% |
| Tablet | 598 | 41.0% |
| No Computing Device | 186 | 12.8% |
| Total | 1,458 | 100.0% |
Internet Access in Manchester
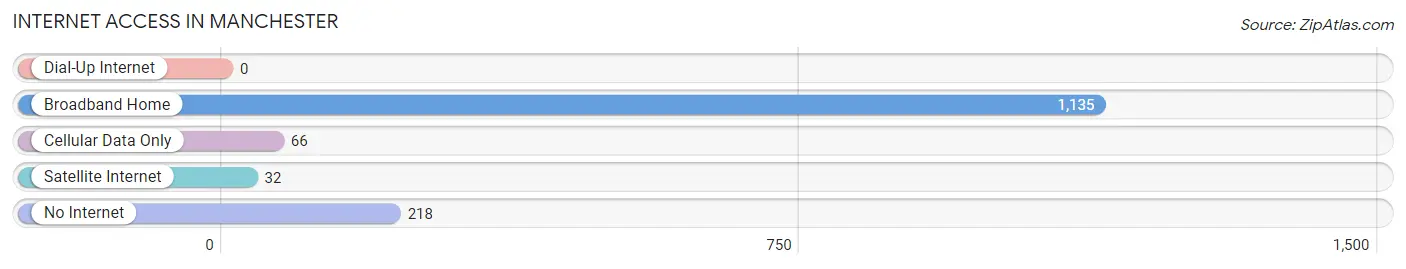
| Internet Type | # Households | % Households |
| Dial-Up Internet | 0 | 0.0% |
| Broadband Home | 1,135 | 77.8% |
| Cellular Data Only | 66 | 4.5% |
| Satellite Internet | 32 | 2.2% |
| No Internet | 218 | 14.9% |
| Total | 1,458 | 100.0% |
Manchester Summary
Manchester, Georgia is a small city located in Meriwether County, Georgia. It is situated in the foothills of the Appalachian Mountains, approximately 50 miles south of Atlanta. The city has a population of approximately 2,000 people and is the county seat of Meriwether County.
History
The area that is now Manchester was first settled in the early 1800s by settlers from North Carolina. The town was originally known as “Crossroads” due to its location at the intersection of two major roads. In 1832, the town was renamed Manchester after the city of Manchester, England.
The city was incorporated in 1837 and quickly became a center of commerce and industry. The city was home to several cotton mills, a grist mill, and a sawmill. The city also had a thriving railroad industry, with several lines running through the city.
In the late 1800s, Manchester was a popular tourist destination due to its proximity to the Appalachian Mountains. The city was home to several resorts and hotels, as well as a popular amusement park.
Geography
Manchester is located in the foothills of the Appalachian Mountains, approximately 50 miles south of Atlanta. The city is situated on the banks of the Flint River, which flows through the city. The city is surrounded by rolling hills and forests, making it a popular destination for outdoor activities such as hiking, camping, and fishing.
The climate in Manchester is mild and humid, with hot summers and mild winters. The average temperature in the summer is around 80 degrees Fahrenheit, and the average temperature in the winter is around 50 degrees Fahrenheit.
Economy
Manchester’s economy is largely based on agriculture and tourism. The city is home to several farms, which produce a variety of crops such as cotton, corn, and soybeans. The city is also home to several tourist attractions, such as the Manchester Historical Museum and the Manchester Amusement Park.
The city is also home to several manufacturing companies, such as the Manchester Textile Company and the Manchester Machine Company. These companies produce a variety of products, including textiles, machinery, and automotive parts.
Demographics
As of the 2010 census, the population of Manchester was 2,000 people. The racial makeup of the city was 79.2% White, 17.2% African American, 0.7% Native American, 0.3% Asian, and 2.6% from other races. The median household income in Manchester was $31,250, and the median family income was $37,500.
The city is home to several churches, including the Manchester United Methodist Church, the Manchester Baptist Church, and the Manchester Presbyterian Church. The city is also home to several schools, including Manchester Elementary School, Manchester Middle School, and Manchester High School.
Manchester is a small city with a rich history and a vibrant economy. The city is home to several tourist attractions, manufacturing companies, and farms. The city is also home to several churches and schools, making it a great place to live and raise a family.
Common Questions
What is Per Capita Income in Manchester?
Per Capita income in Manchester is $22,685.
What is the Median Family Income in Manchester?
Median Family Income in Manchester is $63,365.
What is the Median Household income in Manchester?
Median Household Income in Manchester is $48,301.
What is Income or Wage Gap in Manchester?
Income or Wage Gap in Manchester is 41.7%.
Women in Manchester earn 58.3 cents for every dollar earned by a man.
What is Inequality or Gini Index in Manchester?
Inequality or Gini Index in Manchester is 0.44.
What is the Total Population of Manchester?
Total Population of Manchester is 3,612.
What is the Total Male Population of Manchester?
Total Male Population of Manchester is 1,690.
What is the Total Female Population of Manchester?
Total Female Population of Manchester is 1,922.
What is the Ratio of Males per 100 Females in Manchester?
There are 87.93 Males per 100 Females in Manchester.
What is the Ratio of Females per 100 Males in Manchester?
There are 113.73 Females per 100 Males in Manchester.
What is the Median Population Age in Manchester?
Median Population Age in Manchester is 33.0 Years.
What is the Average Family Size in Manchester
Average Family Size in Manchester is 3.1 People.
What is the Average Household Size in Manchester
Average Household Size in Manchester is 2.5 People.
How Large is the Labor Force in Manchester?
There are 1,291 People in the Labor Forcein in Manchester.
What is the Percentage of People in the Labor Force in Manchester?
47.7% of People are in the Labor Force in Manchester.
What is the Unemployment Rate in Manchester?
Unemployment Rate in Manchester is 6.6%.