Luthersville, GA Map & Demographics
Luthersville Map
Luthersville Overview
$23,949
PER CAPITA INCOME
$53,287
AVG FAMILY INCOME
$52,917
AVG HOUSEHOLD INCOME
28.2%
WAGE / INCOME GAP [ % ]
71.8¢/ $1
WAGE / INCOME GAP [ $ ]
0.40
INEQUALITY / GINI INDEX
792
TOTAL POPULATION
394
MALE POPULATION
398
FEMALE POPULATION
98.99
MALES / 100 FEMALES
101.02
FEMALES / 100 MALES
39.7
MEDIAN AGE
2.9
AVG FAMILY SIZE
2.8
AVG HOUSEHOLD SIZE
357
LABOR FORCE [ PEOPLE ]
54.0%
PERCENT IN LABOR FORCE
2.8%
UNEMPLOYMENT RATE
Luthersville Zip Codes
Income in Luthersville
Income Overview in Luthersville
Per Capita Income in Luthersville is $23,949, while median incomes of families and households are $53,287 and $52,917 respectively.
| Characteristic | Number | Measure |
| Per Capita Income | 792 | $23,949 |
| Median Family Income | 243 | $53,287 |
| Mean Family Income | 243 | $61,688 |
| Median Household Income | 285 | $52,917 |
| Mean Household Income | 285 | $60,739 |
| Income Deficit | 243 | $0 |
| Wage / Income Gap (%) | 792 | 28.17% |
| Wage / Income Gap ($) | 792 | 71.83¢ per $1 |
| Gini / Inequality Index | 792 | 0.40 |
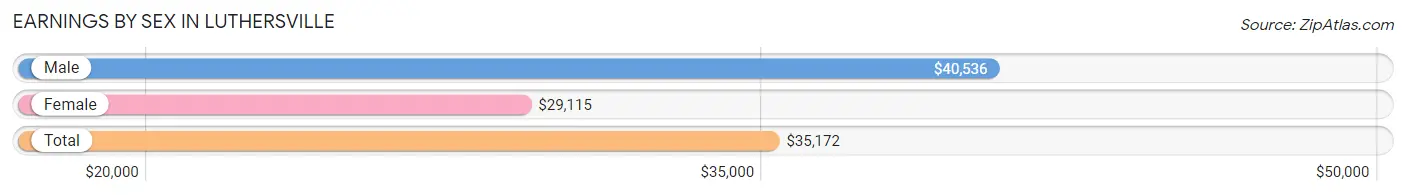
Earnings by Sex in Luthersville
Average Earnings in Luthersville are $35,172, $40,536 for men and $29,115 for women, a difference of 28.2%.
| Sex | Number | Average Earnings |
| Male | 189 (51.6%) | $40,536 |
| Female | 177 (48.4%) | $29,115 |
| Total | 366 (100.0%) | $35,172 |
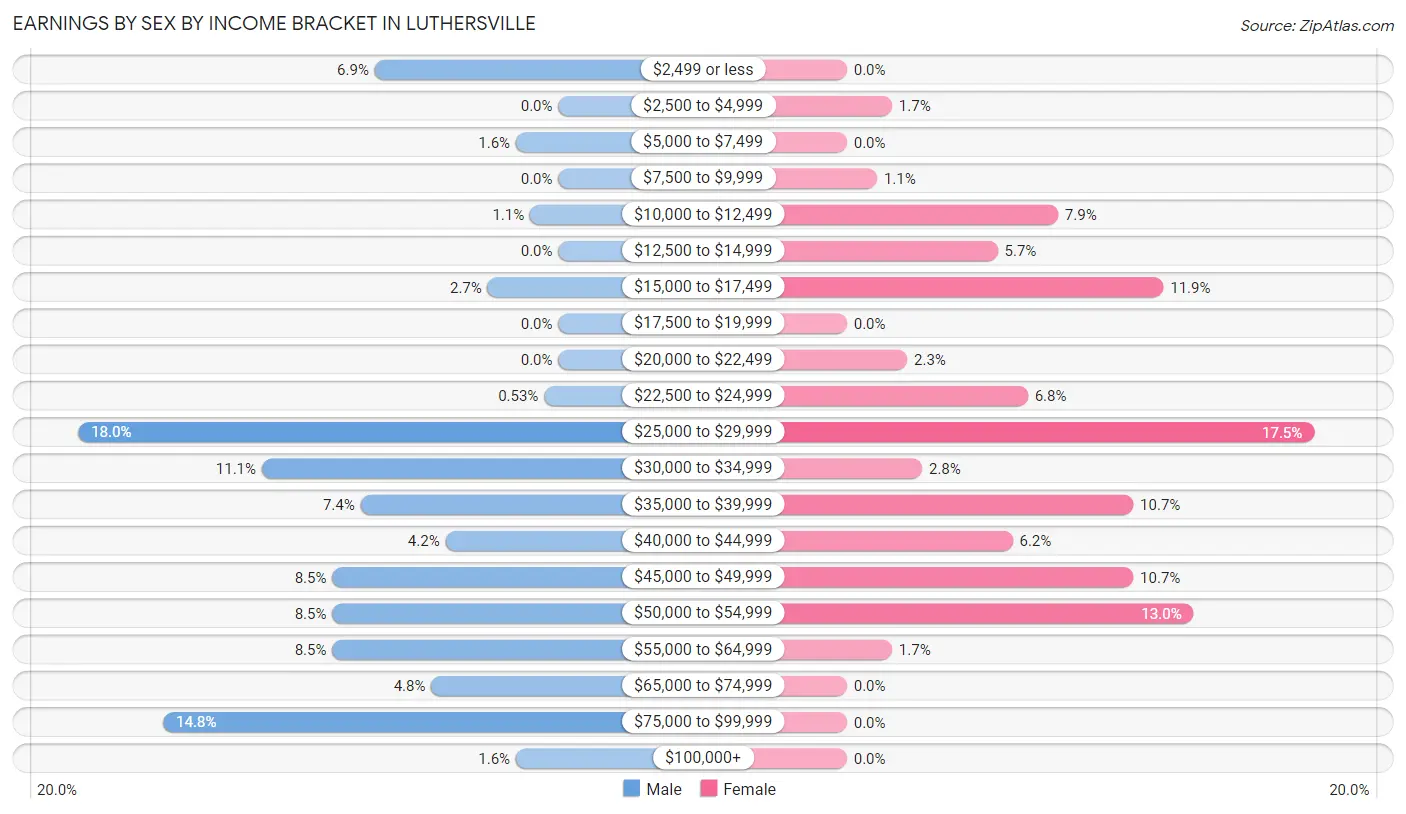
Earnings by Sex by Income Bracket in Luthersville
The most common earnings brackets in Luthersville are $25,000 to $29,999 for men (34 | 18.0%) and $25,000 to $29,999 for women (31 | 17.5%).
| Income | Male | Female |
| $2,499 or less | 13 (6.9%) | 0 (0.0%) |
| $2,500 to $4,999 | 0 (0.0%) | 3 (1.7%) |
| $5,000 to $7,499 | 3 (1.6%) | 0 (0.0%) |
| $7,500 to $9,999 | 0 (0.0%) | 2 (1.1%) |
| $10,000 to $12,499 | 2 (1.1%) | 14 (7.9%) |
| $12,500 to $14,999 | 0 (0.0%) | 10 (5.7%) |
| $15,000 to $17,499 | 5 (2.6%) | 21 (11.9%) |
| $17,500 to $19,999 | 0 (0.0%) | 0 (0.0%) |
| $20,000 to $22,499 | 0 (0.0%) | 4 (2.3%) |
| $22,500 to $24,999 | 1 (0.5%) | 12 (6.8%) |
| $25,000 to $29,999 | 34 (18.0%) | 31 (17.5%) |
| $30,000 to $34,999 | 21 (11.1%) | 5 (2.8%) |
| $35,000 to $39,999 | 14 (7.4%) | 19 (10.7%) |
| $40,000 to $44,999 | 8 (4.2%) | 11 (6.2%) |
| $45,000 to $49,999 | 16 (8.5%) | 19 (10.7%) |
| $50,000 to $54,999 | 16 (8.5%) | 23 (13.0%) |
| $55,000 to $64,999 | 16 (8.5%) | 3 (1.7%) |
| $65,000 to $74,999 | 9 (4.8%) | 0 (0.0%) |
| $75,000 to $99,999 | 28 (14.8%) | 0 (0.0%) |
| $100,000+ | 3 (1.6%) | 0 (0.0%) |
| Total | 189 (100.0%) | 177 (100.0%) |
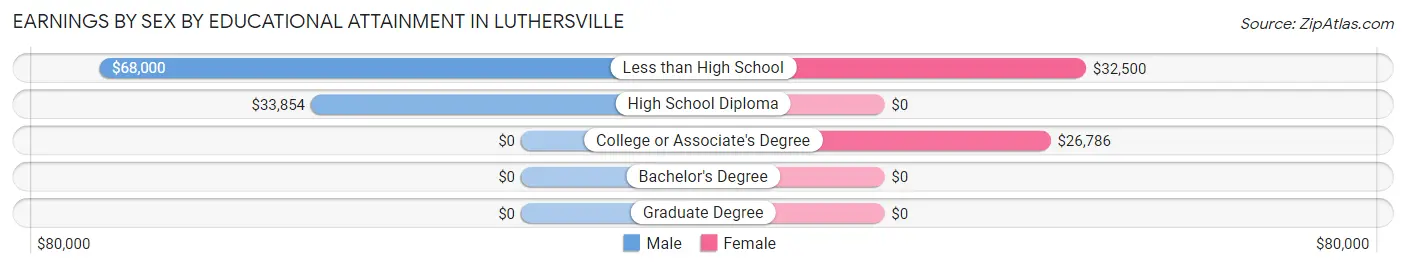
Earnings by Sex by Educational Attainment in Luthersville
Average earnings in Luthersville are $42,143 for men and $28,681 for women, a difference of 31.9%. Men with an educational attainment of less than high school enjoy the highest average annual earnings of $68,000, while those with high school diploma education earn the least with $33,854. Women with an educational attainment of less than high school earn the most with the average annual earnings of $32,500, while those with college or associate's degree education have the smallest earnings of $26,786.
| Educational Attainment | Male Income | Female Income |
| Less than High School | $68,000 | $32,500 |
| High School Diploma | $33,854 | $0 |
| College or Associate's Degree | - | - |
| Bachelor's Degree | - | - |
| Graduate Degree | - | - |
| Total | $42,143 | $28,681 |
Family Income in Luthersville
Family Income Brackets in Luthersville
According to the Luthersville family income data, there are 50 families falling into the $50,000 to $74,999 income range, which is the most common income bracket and makes up 20.6% of all families. Conversely, the $200,000+ income bracket is the least frequent group with only 2 families (0.8%) belonging to this category.
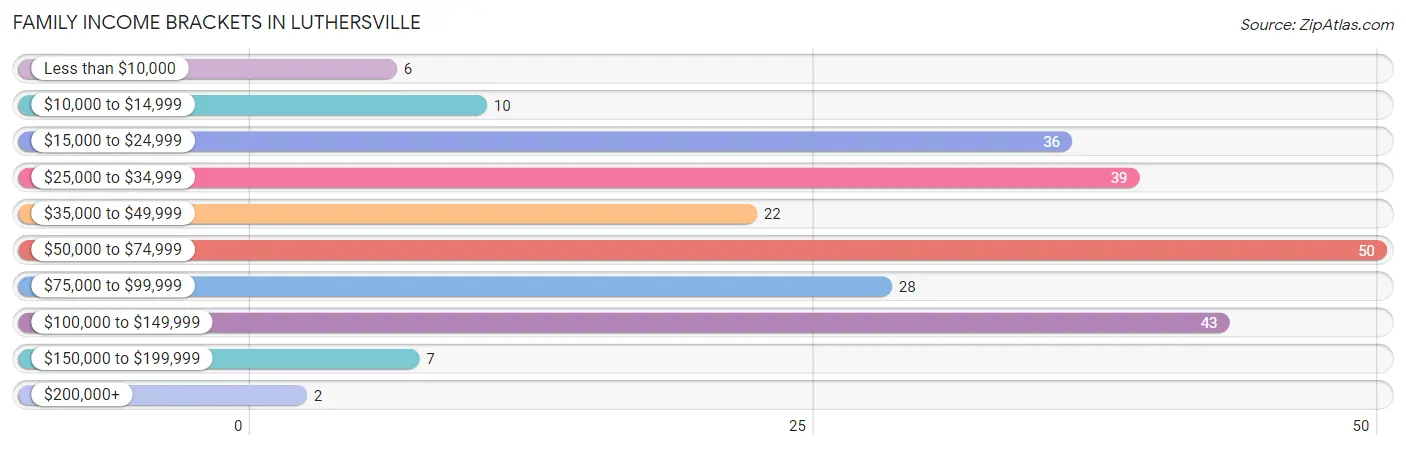
| Income Bracket | # Families | % Families |
| Less than $10,000 | 6 | 2.5% |
| $10,000 to $14,999 | 10 | 4.1% |
| $15,000 to $24,999 | 36 | 14.8% |
| $25,000 to $34,999 | 39 | 16.0% |
| $35,000 to $49,999 | 22 | 9.1% |
| $50,000 to $74,999 | 50 | 20.6% |
| $75,000 to $99,999 | 28 | 11.5% |
| $100,000 to $149,999 | 43 | 17.7% |
| $150,000 to $199,999 | 7 | 2.9% |
| $200,000+ | 2 | 0.8% |
Family Income by Famaliy Size in Luthersville
4-person families (10 | 4.1%) account for the highest median family income in Luthersville with $156,000 per family, while 4-person families (10 | 4.1%) have the highest median income of $39,000 per family member.
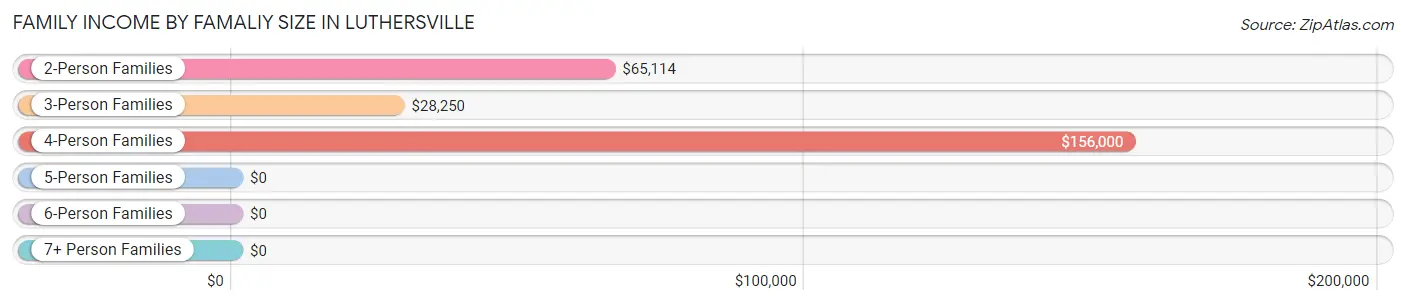
| Income Bracket | # Families | Median Income |
| 2-Person Families | 103 (42.4%) | $65,114 |
| 3-Person Families | 95 (39.1%) | $28,250 |
| 4-Person Families | 10 (4.1%) | $156,000 |
| 5-Person Families | 35 (14.4%) | $0 |
| 6-Person Families | 0 (0.0%) | $0 |
| 7+ Person Families | 0 (0.0%) | $0 |
| Total | 243 (100.0%) | $53,287 |
Family Income by Number of Earners in Luthersville
The median family income in Luthersville is $53,287, with families comprising 3+ earners (19) having the highest median family income of $129,306, while families with no earners (46) have the lowest median family income of $21,786, accounting for 7.8% and 18.9% of families, respectively.
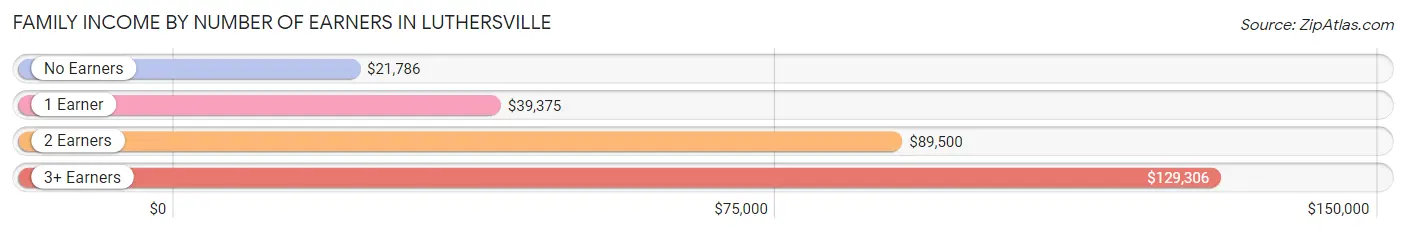
| Number of Earners | # Families | Median Income |
| No Earners | 46 (18.9%) | $21,786 |
| 1 Earner | 112 (46.1%) | $39,375 |
| 2 Earners | 66 (27.2%) | $89,500 |
| 3+ Earners | 19 (7.8%) | $129,306 |
| Total | 243 (100.0%) | $53,287 |
Household Income in Luthersville
Household Income Brackets in Luthersville
With 57 households falling in the category, the $50,000 to $74,999 income range is the most frequent in Luthersville, accounting for 20.0% of all households. In contrast, only 2 households (0.7%) fall into the $200,000+ income bracket, making it the least populous group.
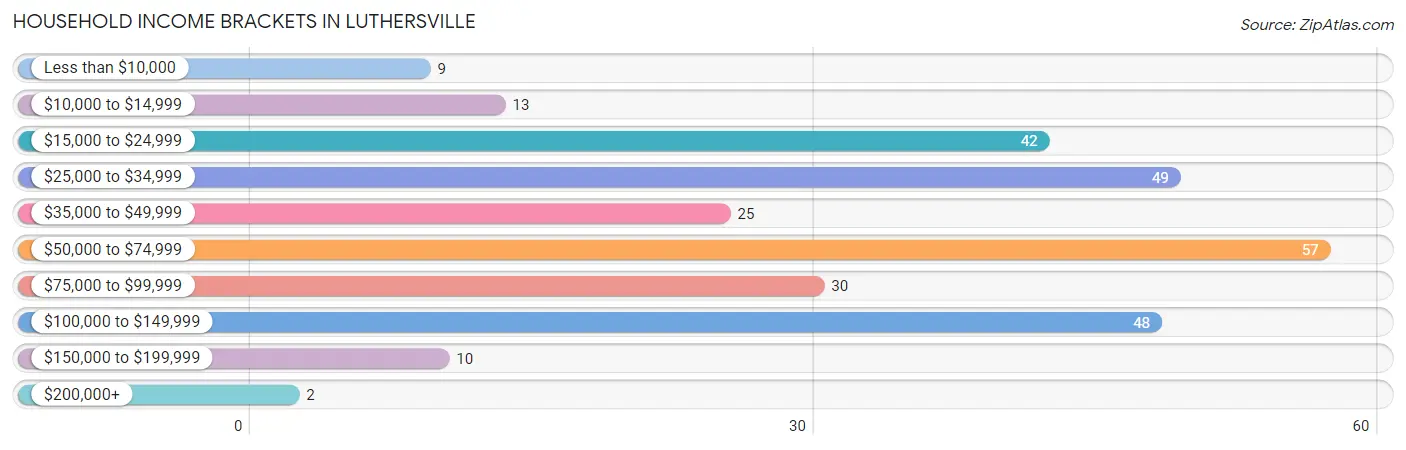
| Income Bracket | # Households | % Households |
| Less than $10,000 | 9 | 3.2% |
| $10,000 to $14,999 | 13 | 4.6% |
| $15,000 to $24,999 | 42 | 14.7% |
| $25,000 to $34,999 | 49 | 17.2% |
| $35,000 to $49,999 | 25 | 8.8% |
| $50,000 to $74,999 | 57 | 20.0% |
| $75,000 to $99,999 | 30 | 10.5% |
| $100,000 to $149,999 | 48 | 16.8% |
| $150,000 to $199,999 | 10 | 3.5% |
| $200,000+ | 2 | 0.7% |
Household Income by Householder Age in Luthersville
The median household income in Luthersville is $52,917, with the highest median household income of $83,750 found in the 45 to 64 years age bracket for the primary householder. A total of 100 households (35.1%) fall into this category. Meanwhile, the 15 to 24 years age bracket for the primary householder has the lowest median household income of $0, with 5 households (1.8%) in this group.
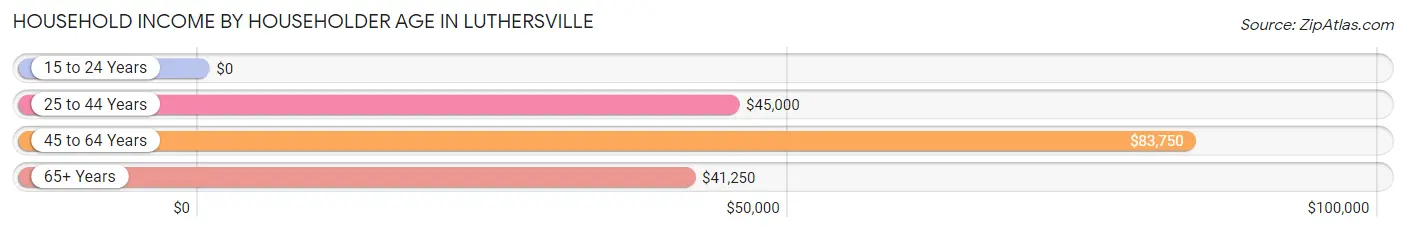
| Income Bracket | # Households | Median Income |
| 15 to 24 Years | 5 (1.8%) | $0 |
| 25 to 44 Years | 116 (40.7%) | $45,000 |
| 45 to 64 Years | 100 (35.1%) | $83,750 |
| 65+ Years | 64 (22.5%) | $41,250 |
| Total | 285 (100.0%) | $52,917 |
Poverty in Luthersville
Income Below Poverty by Sex and Age in Luthersville
With 12.5% poverty level for males and 22.9% for females among the residents of Luthersville, 16 and 17 year old males and 25 to 34 year old females are the most vulnerable to poverty, with 10 males (100.0%) and 38 females (45.2%) in their respective age groups living below the poverty level.
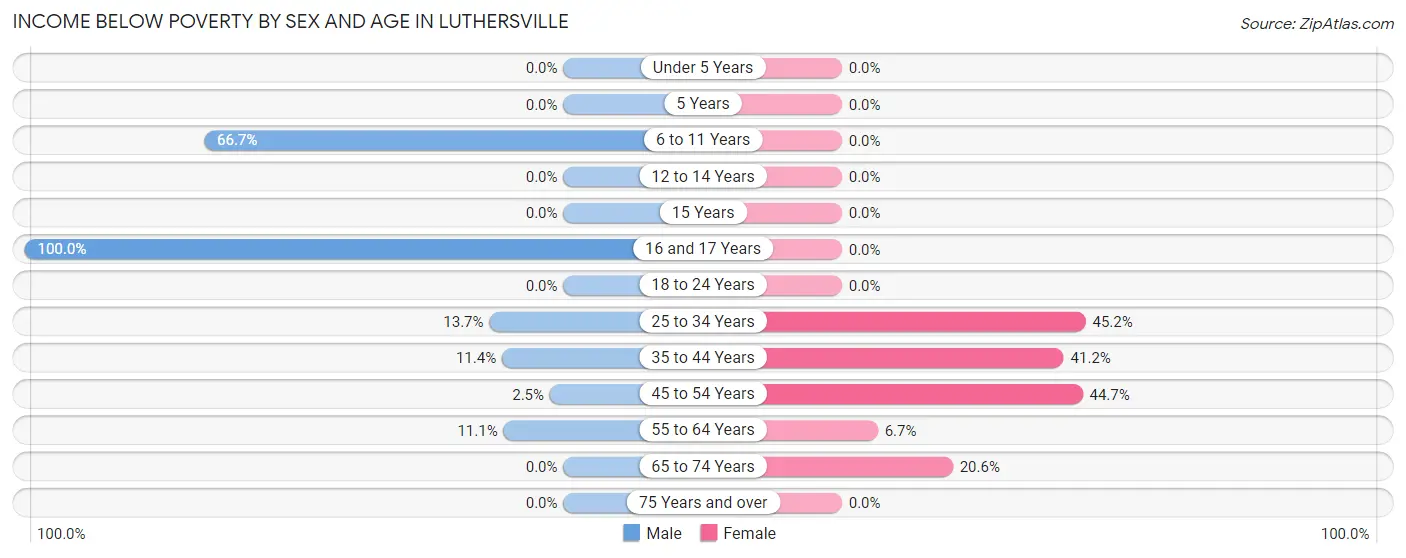
| Age Bracket | Male | Female |
| Under 5 Years | 0 (0.0%) | 0 (0.0%) |
| 5 Years | 0 (0.0%) | 0 (0.0%) |
| 6 to 11 Years | 18 (66.7%) | 0 (0.0%) |
| 12 to 14 Years | 0 (0.0%) | 0 (0.0%) |
| 15 Years | 0 (0.0%) | 0 (0.0%) |
| 16 and 17 Years | 10 (100.0%) | 0 (0.0%) |
| 18 to 24 Years | 0 (0.0%) | 0 (0.0%) |
| 25 to 34 Years | 7 (13.7%) | 38 (45.2%) |
| 35 to 44 Years | 9 (11.4%) | 21 (41.2%) |
| 45 to 54 Years | 2 (2.5%) | 21 (44.7%) |
| 55 to 64 Years | 3 (11.1%) | 4 (6.7%) |
| 65 to 74 Years | 0 (0.0%) | 7 (20.6%) |
| 75 Years and over | 0 (0.0%) | 0 (0.0%) |
| Total | 49 (12.5%) | 91 (22.9%) |
Income Above Poverty by Sex and Age in Luthersville
According to the poverty statistics in Luthersville, males aged under 5 years and females aged under 5 years are the age groups that are most secure financially, with 100.0% of males and 100.0% of females in these age groups living above the poverty line.
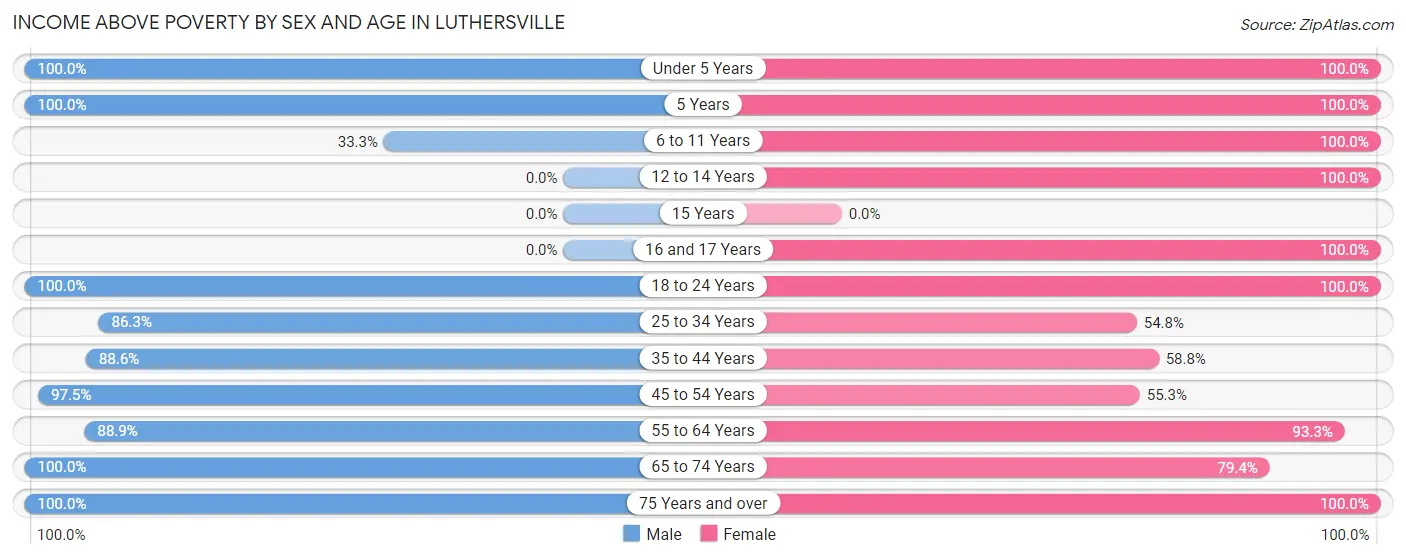
| Age Bracket | Male | Female |
| Under 5 Years | 31 (100.0%) | 14 (100.0%) |
| 5 Years | 13 (100.0%) | 2 (100.0%) |
| 6 to 11 Years | 9 (33.3%) | 12 (100.0%) |
| 12 to 14 Years | 0 (0.0%) | 29 (100.0%) |
| 15 Years | 0 (0.0%) | 0 (0.0%) |
| 16 and 17 Years | 0 (0.0%) | 30 (100.0%) |
| 18 to 24 Years | 26 (100.0%) | 23 (100.0%) |
| 25 to 34 Years | 44 (86.3%) | 46 (54.8%) |
| 35 to 44 Years | 70 (88.6%) | 30 (58.8%) |
| 45 to 54 Years | 78 (97.5%) | 26 (55.3%) |
| 55 to 64 Years | 24 (88.9%) | 56 (93.3%) |
| 65 to 74 Years | 13 (100.0%) | 27 (79.4%) |
| 75 Years and over | 34 (100.0%) | 12 (100.0%) |
| Total | 342 (87.5%) | 307 (77.1%) |
Income Below Poverty Among Married-Couple Families in Luthersville
The poverty statistics for married-couple families in Luthersville show that 8.3% or 8 of the total 96 families live below the poverty line. Families with no children have the highest poverty rate of 8.9%, comprising of 8 families. On the other hand, families with 1 or 2 children have the lowest poverty rate of 0.0%, which includes 0 families.
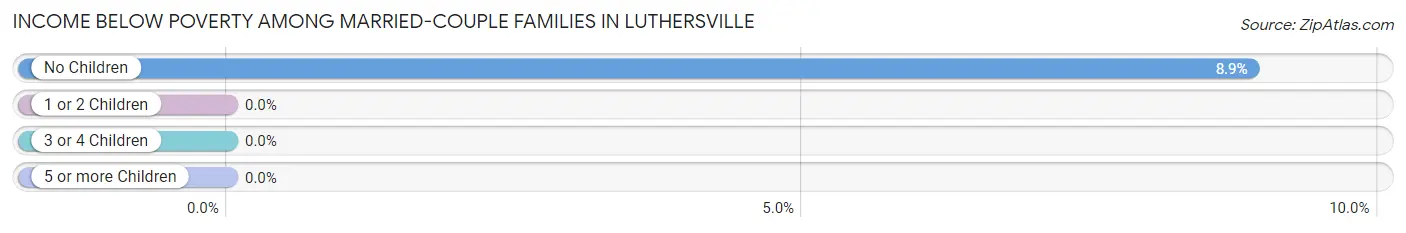
| Children | Above Poverty | Below Poverty |
| No Children | 82 (91.1%) | 8 (8.9%) |
| 1 or 2 Children | 6 (100.0%) | 0 (0.0%) |
| 3 or 4 Children | 0 (0.0%) | 0 (0.0%) |
| 5 or more Children | 0 (0.0%) | 0 (0.0%) |
| Total | 88 (91.7%) | 8 (8.3%) |
Income Below Poverty Among Single-Parent Households in Luthersville
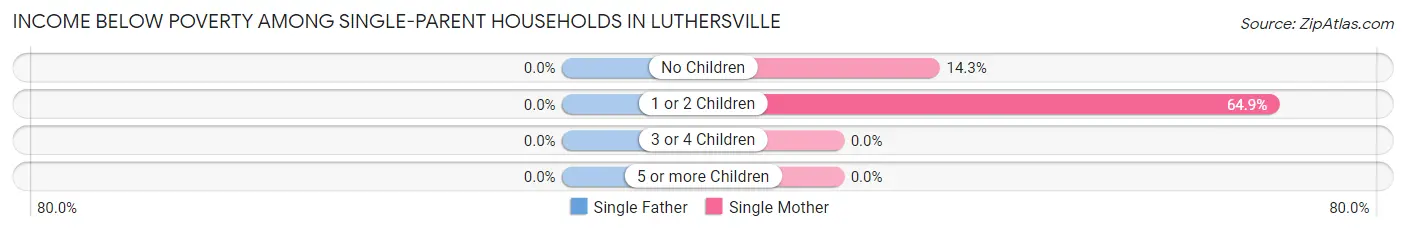
| Children | Single Father | Single Mother |
| No Children | 0 (0.0%) | 6 (14.3%) |
| 1 or 2 Children | 0 (0.0%) | 24 (64.9%) |
| 3 or 4 Children | 0 (0.0%) | 0 (0.0%) |
| 5 or more Children | 0 (0.0%) | 0 (0.0%) |
| Total | 0 (0.0%) | 30 (29.4%) |
Income Below Poverty Among Married-Couple vs Single-Parent Households in Luthersville
The poverty data for Luthersville shows that 8 of the married-couple family households (8.3%) and 30 of the single-parent households (20.4%) are living below the poverty level. Within the married-couple family households, those with no children have the highest poverty rate, with 8 households (8.9%) falling below the poverty line. Among the single-parent households, those with 1 or 2 children have the highest poverty rate, with 24 household (33.8%) living below poverty.
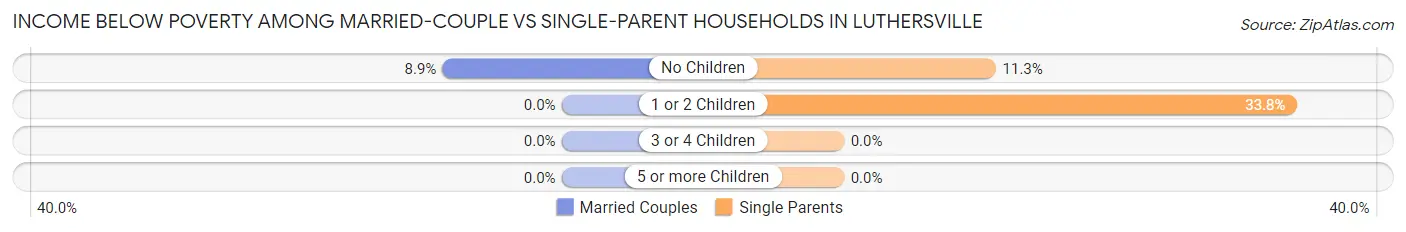
| Children | Married-Couple Families | Single-Parent Households |
| No Children | 8 (8.9%) | 6 (11.3%) |
| 1 or 2 Children | 0 (0.0%) | 24 (33.8%) |
| 3 or 4 Children | 0 (0.0%) | 0 (0.0%) |
| 5 or more Children | 0 (0.0%) | 0 (0.0%) |
| Total | 8 (8.3%) | 30 (20.4%) |
Race in Luthersville
The most populous races in Luthersville are Black / African American (411 | 51.9%), White / Caucasian (352 | 44.4%), and Two or more Races (22 | 2.8%).
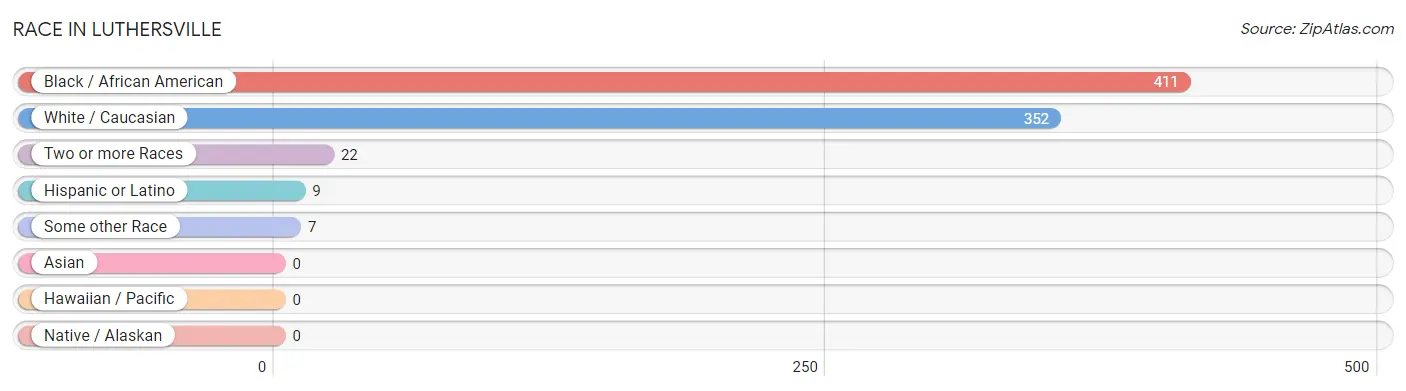
| Race | # Population | % Population |
| Asian | 0 | 0.0% |
| Black / African American | 411 | 51.9% |
| Hawaiian / Pacific | 0 | 0.0% |
| Hispanic or Latino | 9 | 1.1% |
| Native / Alaskan | 0 | 0.0% |
| White / Caucasian | 352 | 44.4% |
| Two or more Races | 22 | 2.8% |
| Some other Race | 7 | 0.9% |
| Total | 792 | 100.0% |
Ancestry in Luthersville
The most populous ancestries reported in Luthersville are American (84 | 10.6%), English (63 | 8.0%), European (45 | 5.7%), African (28 | 3.5%), and Subsaharan African (28 | 3.5%), together accounting for 31.3% of all Luthersville residents.
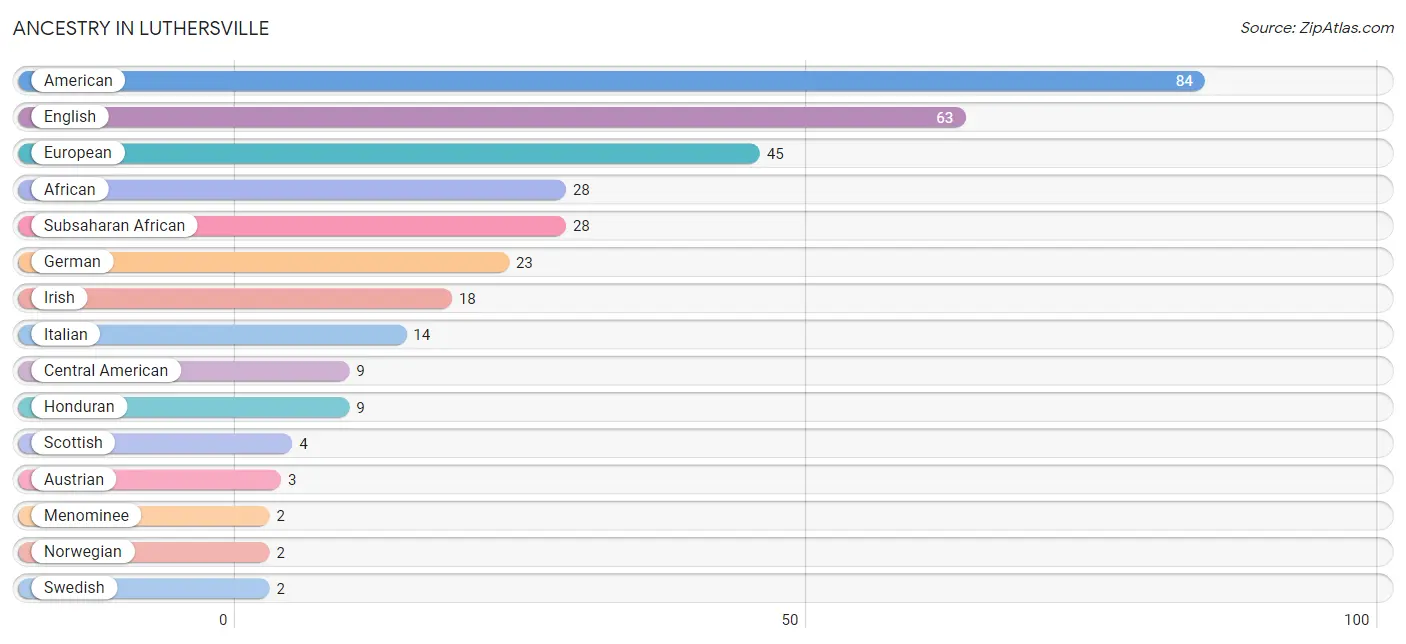
| Ancestry | # Population | % Population |
| African | 28 | 3.5% |
| American | 84 | 10.6% |
| Austrian | 3 | 0.4% |
| Central American | 9 | 1.1% |
| Cherokee | 1 | 0.1% |
| English | 63 | 8.0% |
| European | 45 | 5.7% |
| German | 23 | 2.9% |
| Honduran | 9 | 1.1% |
| Irish | 18 | 2.3% |
| Italian | 14 | 1.8% |
| Menominee | 2 | 0.3% |
| Norwegian | 2 | 0.3% |
| Scottish | 4 | 0.5% |
| Subsaharan African | 28 | 3.5% |
| Swedish | 2 | 0.3% | View All 16 Rows |
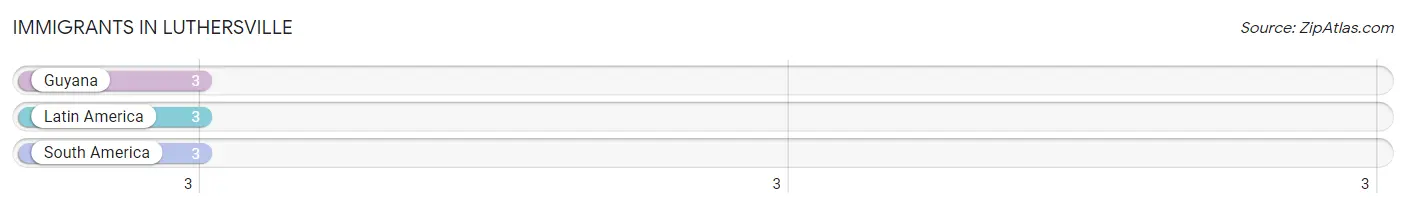
Immigrants in Luthersville
The most numerous immigrant groups reported in Luthersville came from Guyana (3 | 0.4%), Latin America (3 | 0.4%), and South America (3 | 0.4%), together accounting for 1.1% of all Luthersville residents.
| Immigration Origin | # Population | % Population |
| Guyana | 3 | 0.4% |
| Latin America | 3 | 0.4% |
| South America | 3 | 0.4% | View All 3 Rows |
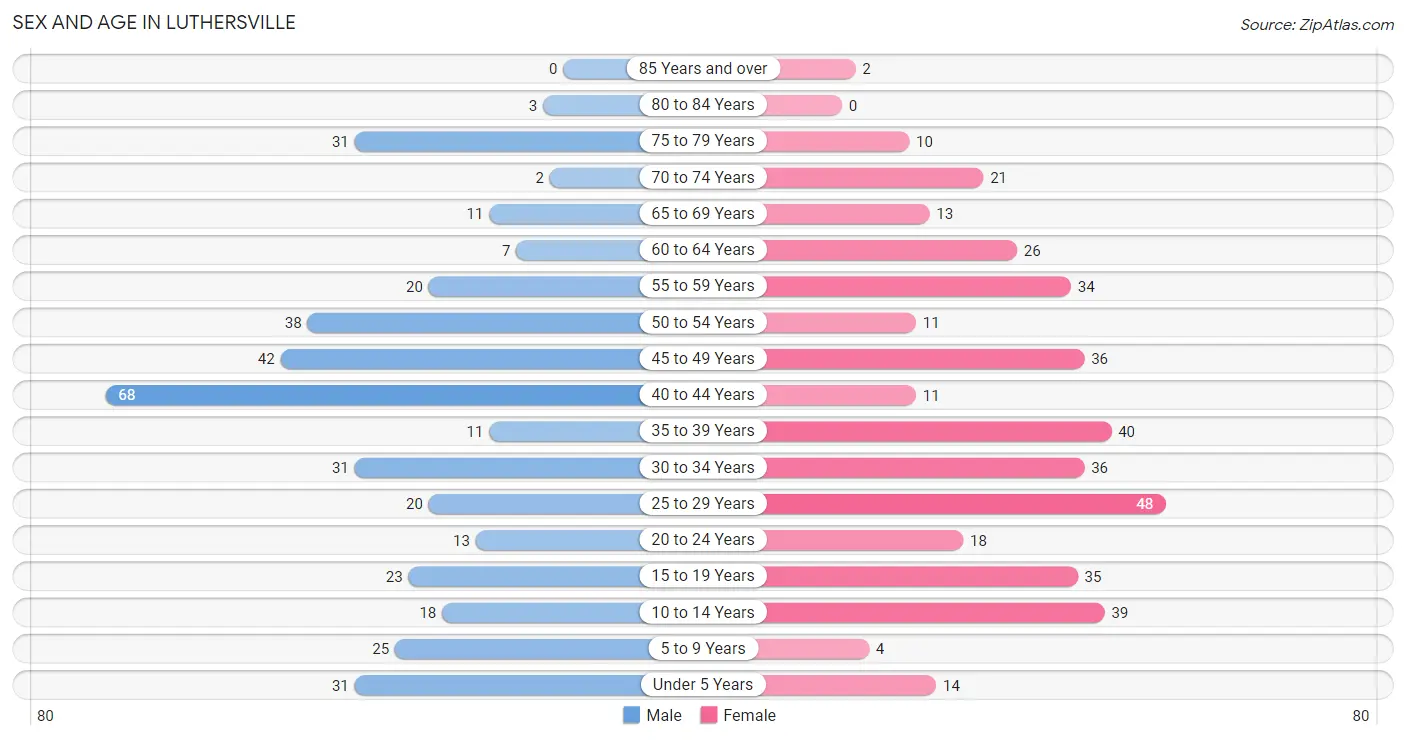
Sex and Age in Luthersville
Sex and Age in Luthersville
The most populous age groups in Luthersville are 40 to 44 Years (68 | 17.3%) for men and 25 to 29 Years (48 | 12.1%) for women.
| Age Bracket | Male | Female |
| Under 5 Years | 31 (7.9%) | 14 (3.5%) |
| 5 to 9 Years | 25 (6.4%) | 4 (1.0%) |
| 10 to 14 Years | 18 (4.6%) | 39 (9.8%) |
| 15 to 19 Years | 23 (5.8%) | 35 (8.8%) |
| 20 to 24 Years | 13 (3.3%) | 18 (4.5%) |
| 25 to 29 Years | 20 (5.1%) | 48 (12.1%) |
| 30 to 34 Years | 31 (7.9%) | 36 (9.0%) |
| 35 to 39 Years | 11 (2.8%) | 40 (10.1%) |
| 40 to 44 Years | 68 (17.3%) | 11 (2.8%) |
| 45 to 49 Years | 42 (10.7%) | 36 (9.0%) |
| 50 to 54 Years | 38 (9.6%) | 11 (2.8%) |
| 55 to 59 Years | 20 (5.1%) | 34 (8.5%) |
| 60 to 64 Years | 7 (1.8%) | 26 (6.5%) |
| 65 to 69 Years | 11 (2.8%) | 13 (3.3%) |
| 70 to 74 Years | 2 (0.5%) | 21 (5.3%) |
| 75 to 79 Years | 31 (7.9%) | 10 (2.5%) |
| 80 to 84 Years | 3 (0.8%) | 0 (0.0%) |
| 85 Years and over | 0 (0.0%) | 2 (0.5%) |
| Total | 394 (100.0%) | 398 (100.0%) |
Families and Households in Luthersville
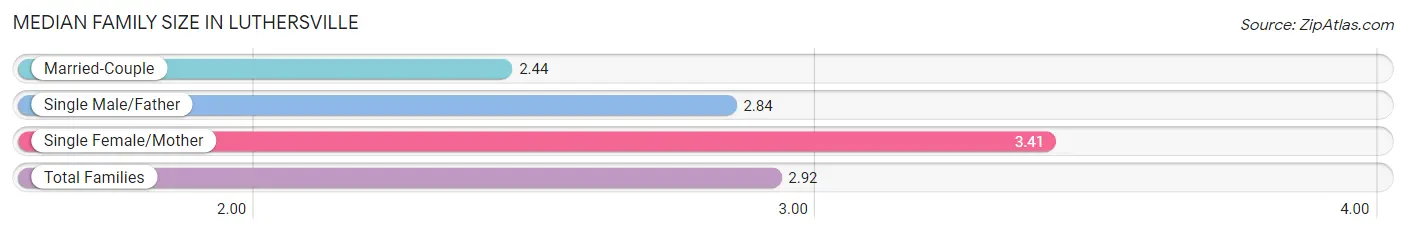
Median Family Size in Luthersville
The median family size in Luthersville is 2.92 persons per family, with single female/mother families (102 | 42.0%) accounting for the largest median family size of 3.41 persons per family. On the other hand, married-couple families (96 | 39.5%) represent the smallest median family size with 2.44 persons per family.
| Family Type | # Families | Family Size |
| Married-Couple | 96 (39.5%) | 2.44 |
| Single Male/Father | 45 (18.5%) | 2.84 |
| Single Female/Mother | 102 (42.0%) | 3.41 |
| Total Families | 243 (100.0%) | 2.92 |
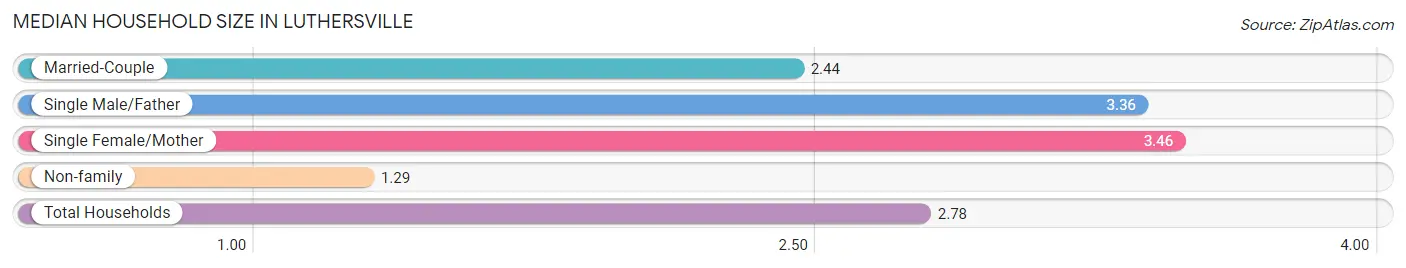
Median Household Size in Luthersville
The median household size in Luthersville is 2.78 persons per household, with single female/mother households (102 | 35.8%) accounting for the largest median household size of 3.46 persons per household. non-family households (42 | 14.7%) represent the smallest median household size with 1.29 persons per household.
| Household Type | # Households | Household Size |
| Married-Couple | 96 (33.7%) | 2.44 |
| Single Male/Father | 45 (15.8%) | 3.36 |
| Single Female/Mother | 102 (35.8%) | 3.46 |
| Non-family | 42 (14.7%) | 1.29 |
| Total Households | 285 (100.0%) | 2.78 |
Household Size by Marriage Status in Luthersville
Out of a total of 285 households in Luthersville, 243 (85.3%) are family households, while 42 (14.7%) are nonfamily households. The most numerous type of family households are 2-person households, comprising 96, and the most common type of nonfamily households are 1-person households, comprising 33.
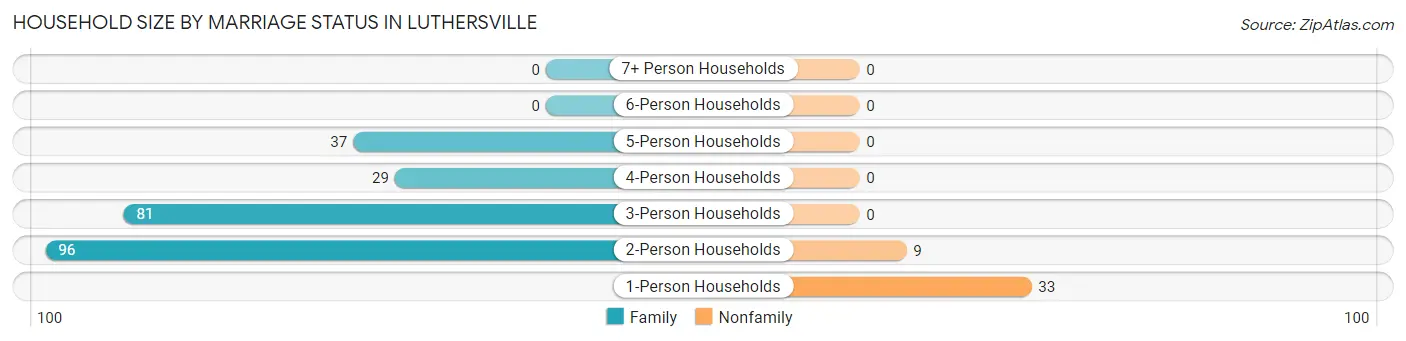
| Household Size | Family Households | Nonfamily Households |
| 1-Person Households | - | 33 (11.6%) |
| 2-Person Households | 96 (33.7%) | 9 (3.2%) |
| 3-Person Households | 81 (28.4%) | 0 (0.0%) |
| 4-Person Households | 29 (10.2%) | 0 (0.0%) |
| 5-Person Households | 37 (13.0%) | 0 (0.0%) |
| 6-Person Households | 0 (0.0%) | 0 (0.0%) |
| 7+ Person Households | 0 (0.0%) | 0 (0.0%) |
| Total | 243 (85.3%) | 42 (14.7%) |
Female Fertility in Luthersville
Fertility by Age in Luthersville
Average fertility rate in Luthersville is 58.0 births per 1,000 women. Women in the age bracket of 15 to 19 years have the highest fertility rate with 143.0 births per 1,000 women. Women in the age bracket of 20 to 34 years acount for 61.5% of all women with births.
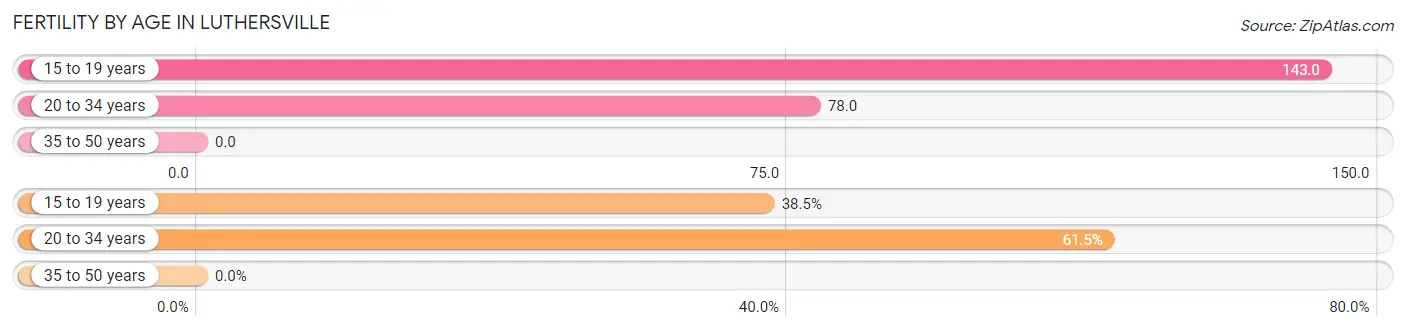
| Age Bracket | Women with Births | Births / 1,000 Women |
| 15 to 19 years | 5 (38.5%) | 143.0 |
| 20 to 34 years | 8 (61.5%) | 78.0 |
| 35 to 50 years | 0 (0.0%) | 0.0 |
| Total | 13 (100.0%) | 58.0 |
Fertility by Age by Marriage Status in Luthersville
15.4% of women with births (13) in Luthersville are married. The highest percentage of unmarried women with births falls into 15 to 19 years age bracket with 100.0% of them unmarried at the time of birth, while the lowest percentage of unmarried women with births belong to 20 to 34 years age bracket with 75.0% of them unmarried.
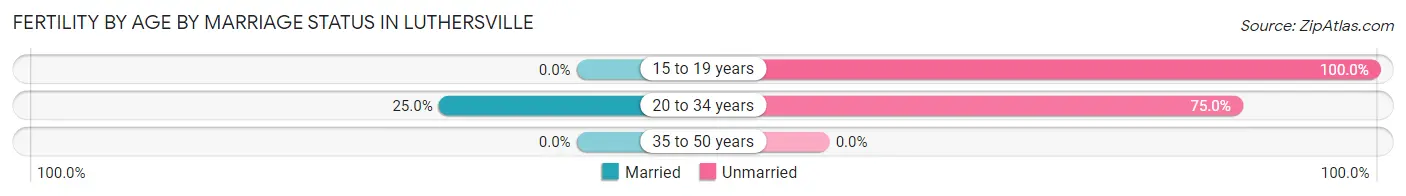
| Age Bracket | Married | Unmarried |
| 15 to 19 years | 0 (0.0%) | 5 (100.0%) |
| 20 to 34 years | 2 (25.0%) | 6 (75.0%) |
| 35 to 50 years | 0 (0.0%) | 0 (0.0%) |
| Total | 2 (15.4%) | 11 (84.6%) |
Fertility by Education in Luthersville
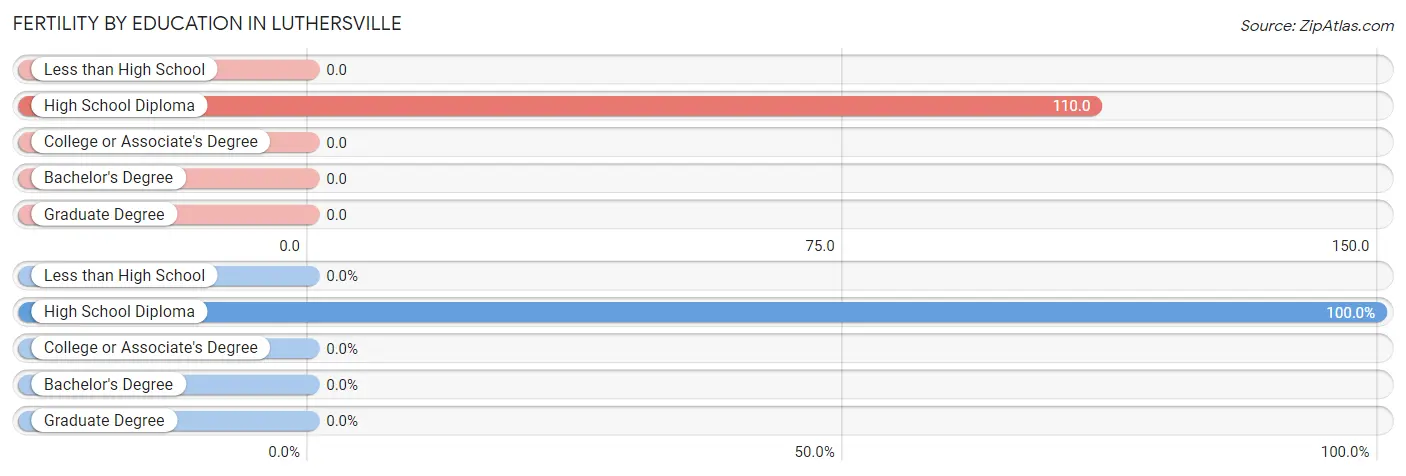
| Educational Attainment | Women with Births | Births / 1,000 Women |
| Less than High School | 0 (0.0%) | 0.0 |
| High School Diploma | 13 (100.0%) | 110.0 |
| College or Associate's Degree | 0 (0.0%) | 0.0 |
| Bachelor's Degree | 0 (0.0%) | 0.0 |
| Graduate Degree | 0 (0.0%) | 0.0 |
| Total | 13 (100.0%) | 58.0 |
Fertility by Education by Marriage Status in Luthersville
84.6% of women with births in Luthersville are unmarried. Women with the educational attainment of high school diploma are most likely to be married with 15.4% of them married at childbirth, while women with the educational attainment of high school diploma are least likely to be married with 84.6% of them unmarried at childbirth.
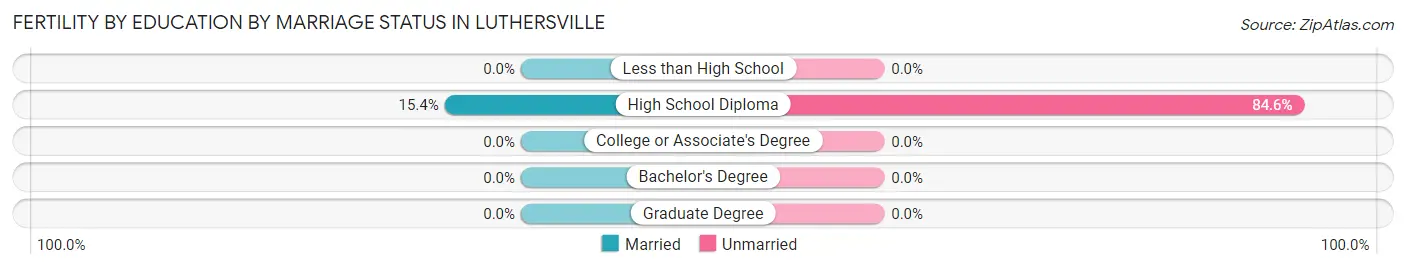
| Educational Attainment | Married | Unmarried |
| Less than High School | 0 (0.0%) | 0 (0.0%) |
| High School Diploma | 2 (15.4%) | 11 (84.6%) |
| College or Associate's Degree | 0 (0.0%) | 0 (0.0%) |
| Bachelor's Degree | 0 (0.0%) | 0 (0.0%) |
| Graduate Degree | 0 (0.0%) | 0 (0.0%) |
| Total | 2 (15.4%) | 11 (84.6%) |
Employment Characteristics in Luthersville
Employment by Class of Employer in Luthersville
Among the 327 employed individuals in Luthersville, private company employees (263 | 80.4%), not-for-profit organizations (29 | 8.9%), and self-employed (not incorporated) (19 | 5.8%) make up the most common classes of employment.
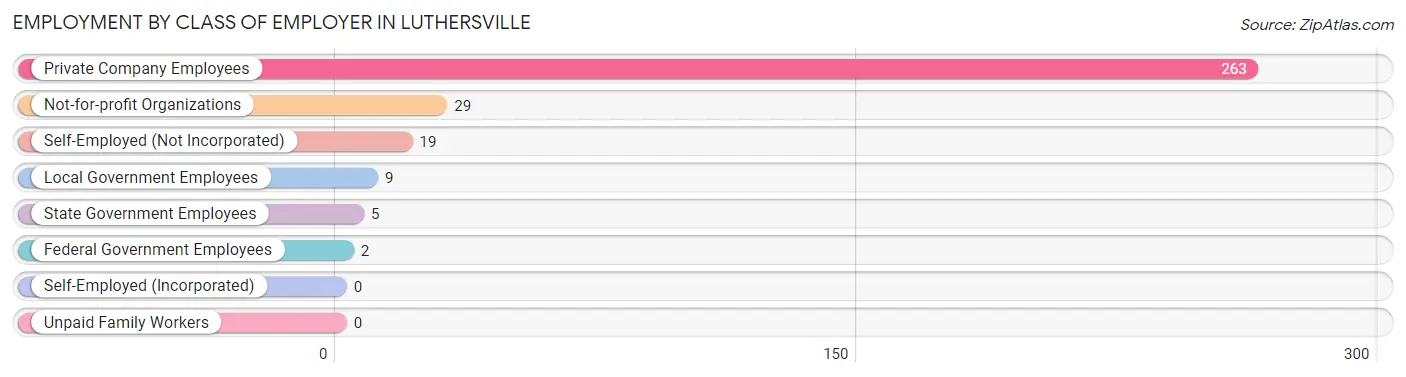
| Employer Class | # Employees | % Employees |
| Private Company Employees | 263 | 80.4% |
| Self-Employed (Incorporated) | 0 | 0.0% |
| Self-Employed (Not Incorporated) | 19 | 5.8% |
| Not-for-profit Organizations | 29 | 8.9% |
| Local Government Employees | 9 | 2.8% |
| State Government Employees | 5 | 1.5% |
| Federal Government Employees | 2 | 0.6% |
| Unpaid Family Workers | 0 | 0.0% |
| Total | 327 | 100.0% |
Employment Status by Age in Luthersville
According to the labor force statistics for Luthersville, out of the total population over 16 years of age (661), 54.0% or 357 individuals are in the labor force, with 2.8% or 10 of them unemployed. The age group with the highest labor force participation rate is 30 to 34 years, with 85.1% or 57 individuals in the labor force. Within the labor force, the 35 to 44 years age range has the highest percentage of unemployed individuals, with 7.5% or 8 of them being unemployed.
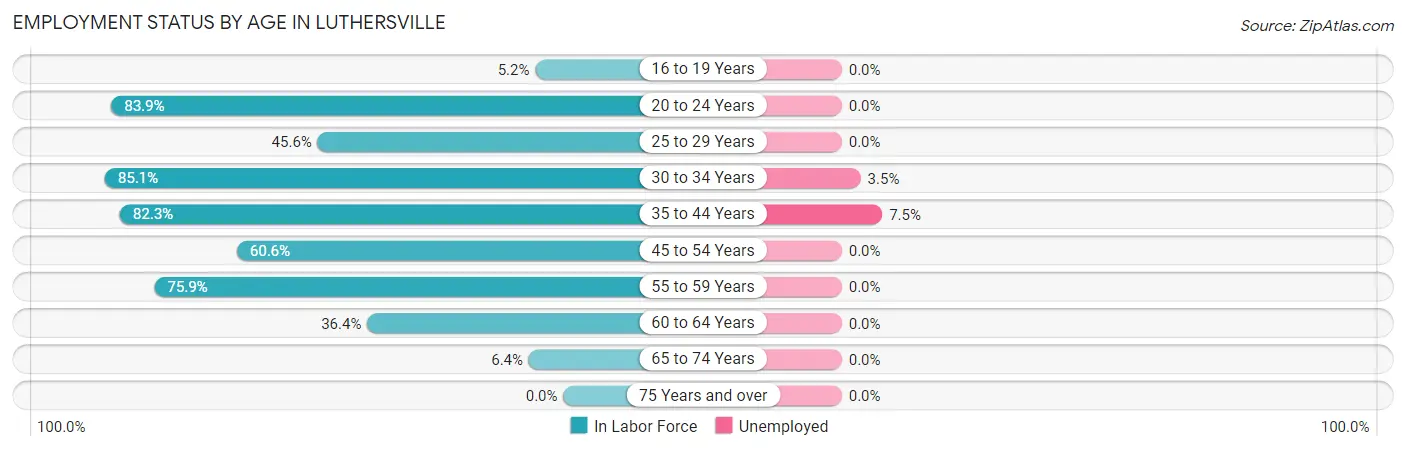
| Age Bracket | In Labor Force | Unemployed |
| 16 to 19 Years | 3 (5.2%) | 0 (0.0%) |
| 20 to 24 Years | 26 (83.9%) | 0 (0.0%) |
| 25 to 29 Years | 31 (45.6%) | 0 (0.0%) |
| 30 to 34 Years | 57 (85.1%) | 2 (3.5%) |
| 35 to 44 Years | 107 (82.3%) | 8 (7.5%) |
| 45 to 54 Years | 77 (60.6%) | 0 (0.0%) |
| 55 to 59 Years | 41 (75.9%) | 0 (0.0%) |
| 60 to 64 Years | 12 (36.4%) | 0 (0.0%) |
| 65 to 74 Years | 3 (6.4%) | 0 (0.0%) |
| 75 Years and over | 0 (0.0%) | 0 (0.0%) |
| Total | 357 (54.0%) | 10 (2.8%) |
Employment Status by Educational Attainment in Luthersville
According to labor force statistics for Luthersville, 67.8% of individuals (325) out of the total population between 25 and 64 years of age (479) are in the labor force, with 3.1% or 10 of them being unemployed. The group with the highest labor force participation rate are those with the educational attainment of college / associate degree, with 80.0% or 68 individuals in the labor force. Within the labor force, individuals with high school diploma education have the highest percentage of unemployment, with 7.4% or 10 of them being unemployed.
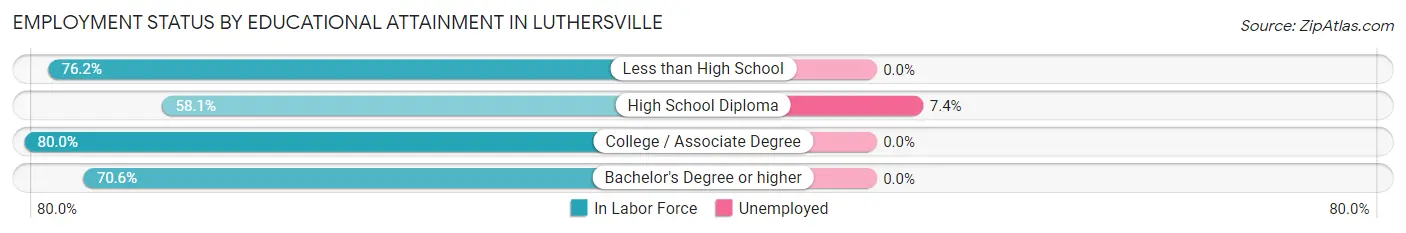
| Educational Attainment | In Labor Force | Unemployed |
| Less than High School | 109 (76.2%) | 0 (0.0%) |
| High School Diploma | 136 (58.1%) | 17 (7.4%) |
| College / Associate Degree | 68 (80.0%) | 0 (0.0%) |
| Bachelor's Degree or higher | 12 (70.6%) | 0 (0.0%) |
| Total | 325 (67.8%) | 15 (3.1%) |
Employment Occupations by Sex in Luthersville
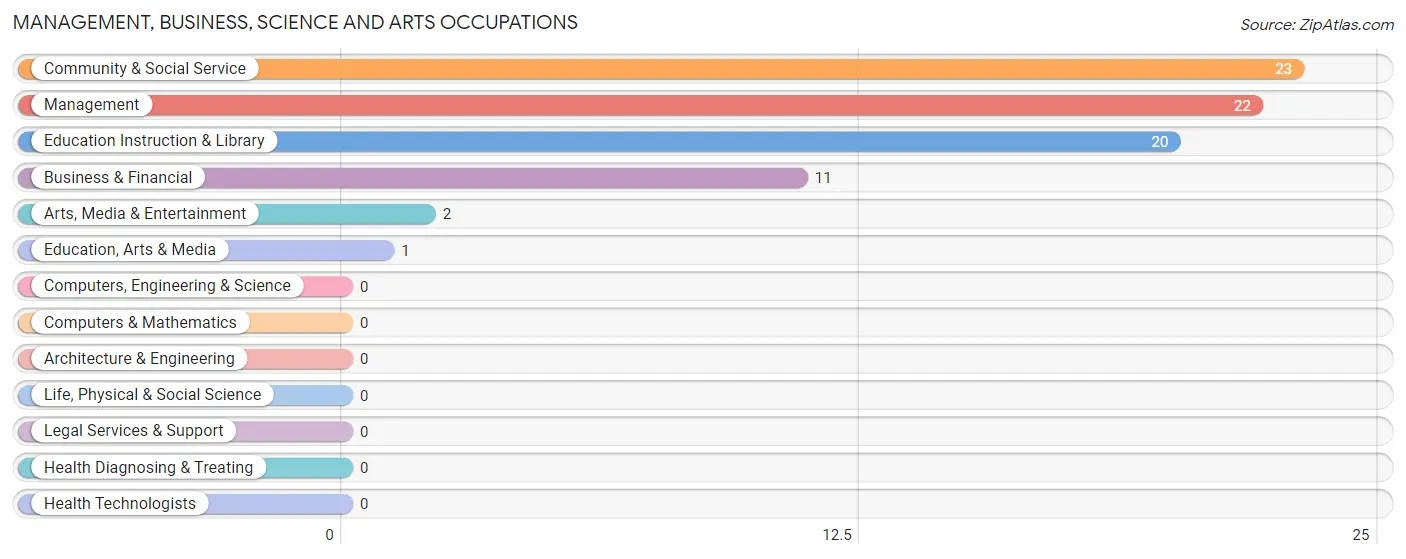
Management, Business, Science and Arts Occupations
The most common Management, Business, Science and Arts occupations in Luthersville are Community & Social Service (23 | 6.6%), Management (22 | 6.3%), Education Instruction & Library (20 | 5.8%), Business & Financial (11 | 3.2%), and Arts, Media & Entertainment (2 | 0.6%).
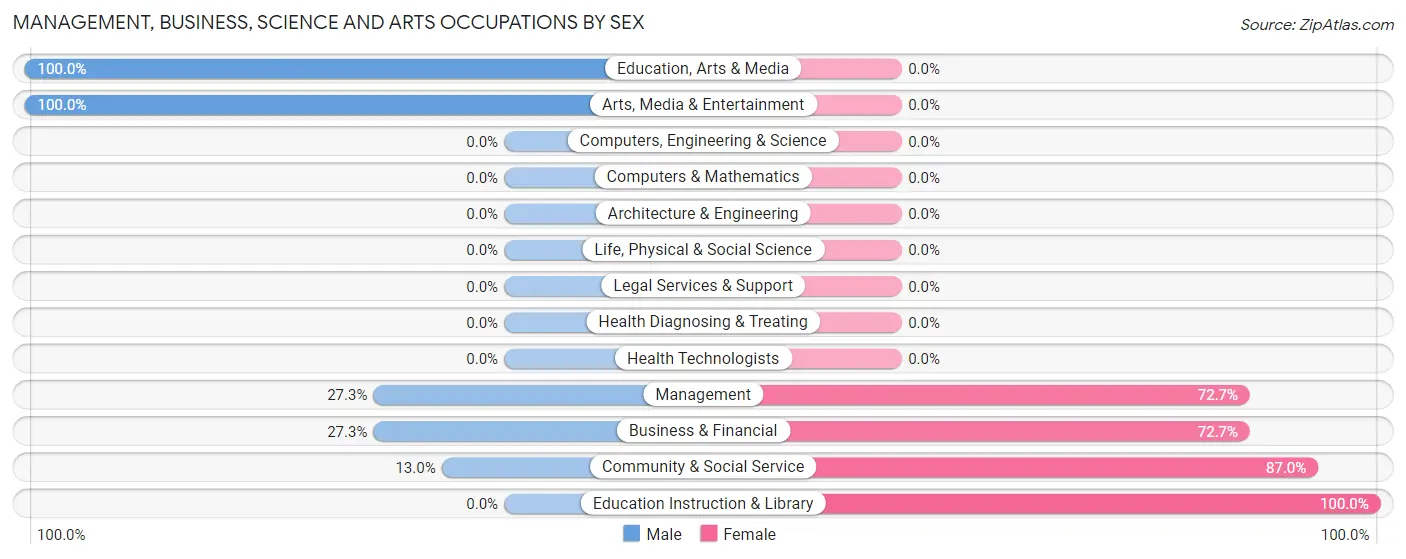
Management, Business, Science and Arts Occupations by Sex
Within the Management, Business, Science and Arts occupations in Luthersville, the most male-oriented occupations are Education, Arts & Media (100.0%), Arts, Media & Entertainment (100.0%), and Management (27.3%), while the most female-oriented occupations are Education Instruction & Library (100.0%), Community & Social Service (87.0%), and Management (72.7%).
| Occupation | Male | Female |
| Management | 6 (27.3%) | 16 (72.7%) |
| Business & Financial | 3 (27.3%) | 8 (72.7%) |
| Computers, Engineering & Science | 0 (0.0%) | 0 (0.0%) |
| Computers & Mathematics | 0 (0.0%) | 0 (0.0%) |
| Architecture & Engineering | 0 (0.0%) | 0 (0.0%) |
| Life, Physical & Social Science | 0 (0.0%) | 0 (0.0%) |
| Community & Social Service | 3 (13.0%) | 20 (87.0%) |
| Education, Arts & Media | 1 (100.0%) | 0 (0.0%) |
| Legal Services & Support | 0 (0.0%) | 0 (0.0%) |
| Education Instruction & Library | 0 (0.0%) | 20 (100.0%) |
| Arts, Media & Entertainment | 2 (100.0%) | 0 (0.0%) |
| Health Diagnosing & Treating | 0 (0.0%) | 0 (0.0%) |
| Health Technologists | 0 (0.0%) | 0 (0.0%) |
| Total (Category) | 12 (21.4%) | 44 (78.6%) |
| Total (Overall) | 176 (50.7%) | 171 (49.3%) |
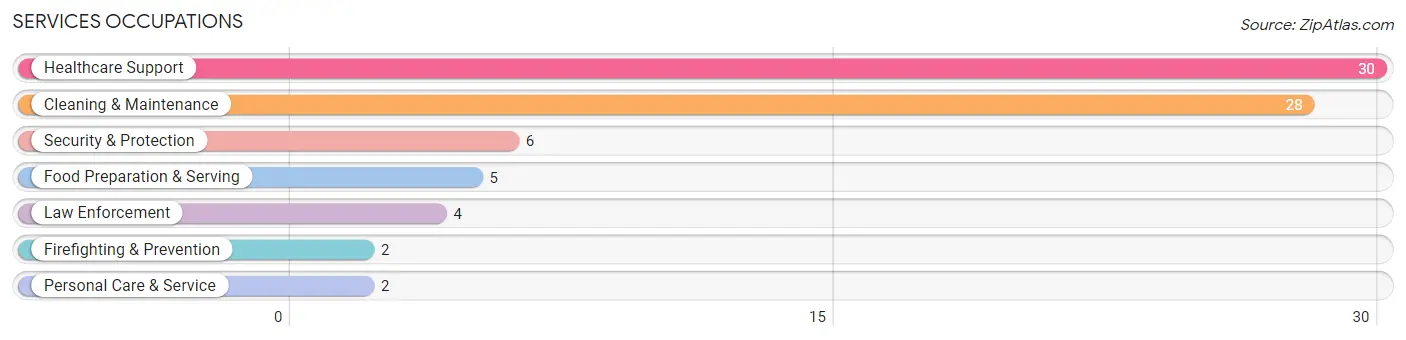
Services Occupations
The most common Services occupations in Luthersville are Healthcare Support (30 | 8.6%), Cleaning & Maintenance (28 | 8.1%), Security & Protection (6 | 1.7%), Food Preparation & Serving (5 | 1.4%), and Law Enforcement (4 | 1.1%).
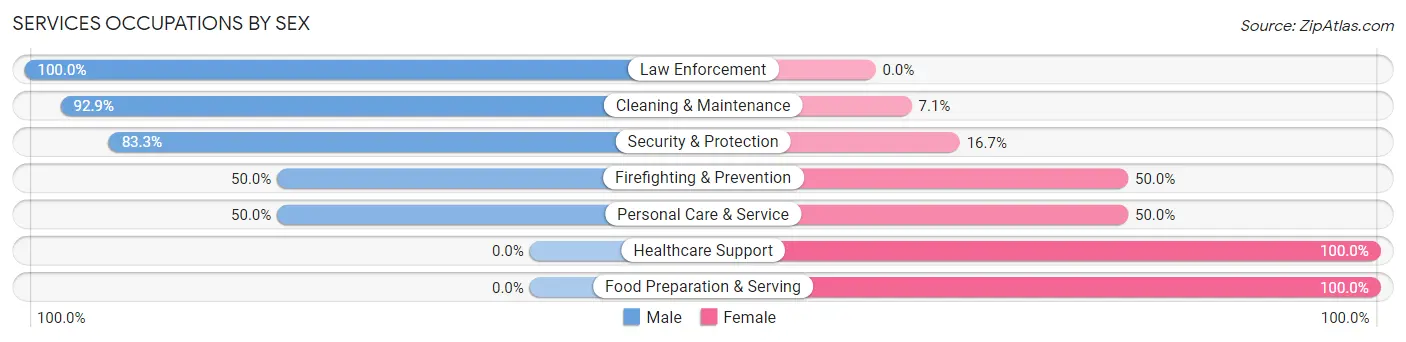
Services Occupations by Sex
Within the Services occupations in Luthersville, the most male-oriented occupations are Law Enforcement (100.0%), Cleaning & Maintenance (92.9%), and Security & Protection (83.3%), while the most female-oriented occupations are Healthcare Support (100.0%), Food Preparation & Serving (100.0%), and Firefighting & Prevention (50.0%).
| Occupation | Male | Female |
| Healthcare Support | 0 (0.0%) | 30 (100.0%) |
| Security & Protection | 5 (83.3%) | 1 (16.7%) |
| Firefighting & Prevention | 1 (50.0%) | 1 (50.0%) |
| Law Enforcement | 4 (100.0%) | 0 (0.0%) |
| Food Preparation & Serving | 0 (0.0%) | 5 (100.0%) |
| Cleaning & Maintenance | 26 (92.9%) | 2 (7.1%) |
| Personal Care & Service | 1 (50.0%) | 1 (50.0%) |
| Total (Category) | 32 (45.1%) | 39 (54.9%) |
| Total (Overall) | 176 (50.7%) | 171 (49.3%) |
Sales and Office Occupations
The most common Sales and Office occupations in Luthersville are Office & Administration (20 | 5.8%), and Sales & Related (8 | 2.3%).

Sales and Office Occupations by Sex

| Occupation | Male | Female |
| Sales & Related | 6 (75.0%) | 2 (25.0%) |
| Office & Administration | 9 (45.0%) | 11 (55.0%) |
| Total (Category) | 15 (53.6%) | 13 (46.4%) |
| Total (Overall) | 176 (50.7%) | 171 (49.3%) |
Natural Resources, Construction and Maintenance Occupations
The most common Natural Resources, Construction and Maintenance occupations in Luthersville are Installation, Maintenance & Repair (34 | 9.8%), and Construction & Extraction (5 | 1.4%).

Natural Resources, Construction and Maintenance Occupations by Sex

| Occupation | Male | Female |
| Farming, Fishing & Forestry | 0 (0.0%) | 0 (0.0%) |
| Construction & Extraction | 5 (100.0%) | 0 (0.0%) |
| Installation, Maintenance & Repair | 34 (100.0%) | 0 (0.0%) |
| Total (Category) | 39 (100.0%) | 0 (0.0%) |
| Total (Overall) | 176 (50.7%) | 171 (49.3%) |
Production, Transportation and Moving Occupations
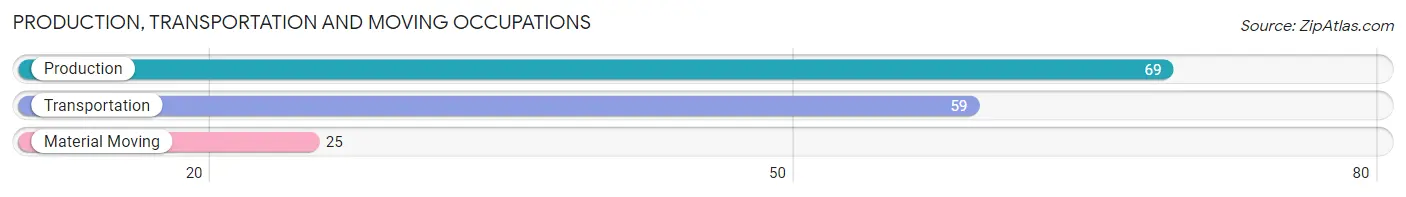
The most common Production, Transportation and Moving occupations in Luthersville are Production (69 | 19.9%), Transportation (59 | 17.0%), and Material Moving (25 | 7.2%).
Production, Transportation and Moving Occupations by Sex
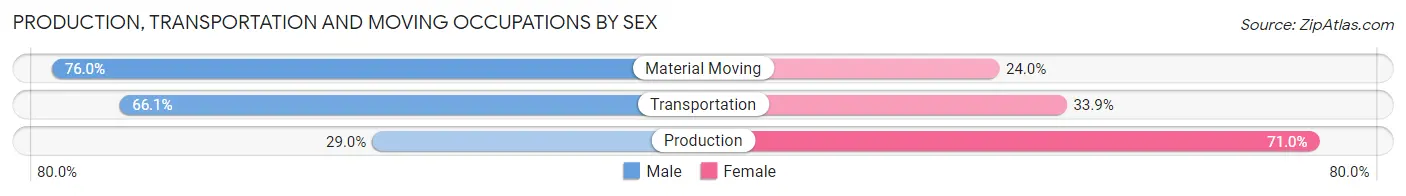
| Occupation | Male | Female |
| Production | 20 (29.0%) | 49 (71.0%) |
| Transportation | 39 (66.1%) | 20 (33.9%) |
| Material Moving | 19 (76.0%) | 6 (24.0%) |
| Total (Category) | 78 (51.0%) | 75 (49.0%) |
| Total (Overall) | 176 (50.7%) | 171 (49.3%) |
Employment Industries by Sex in Luthersville
Employment Industries in Luthersville
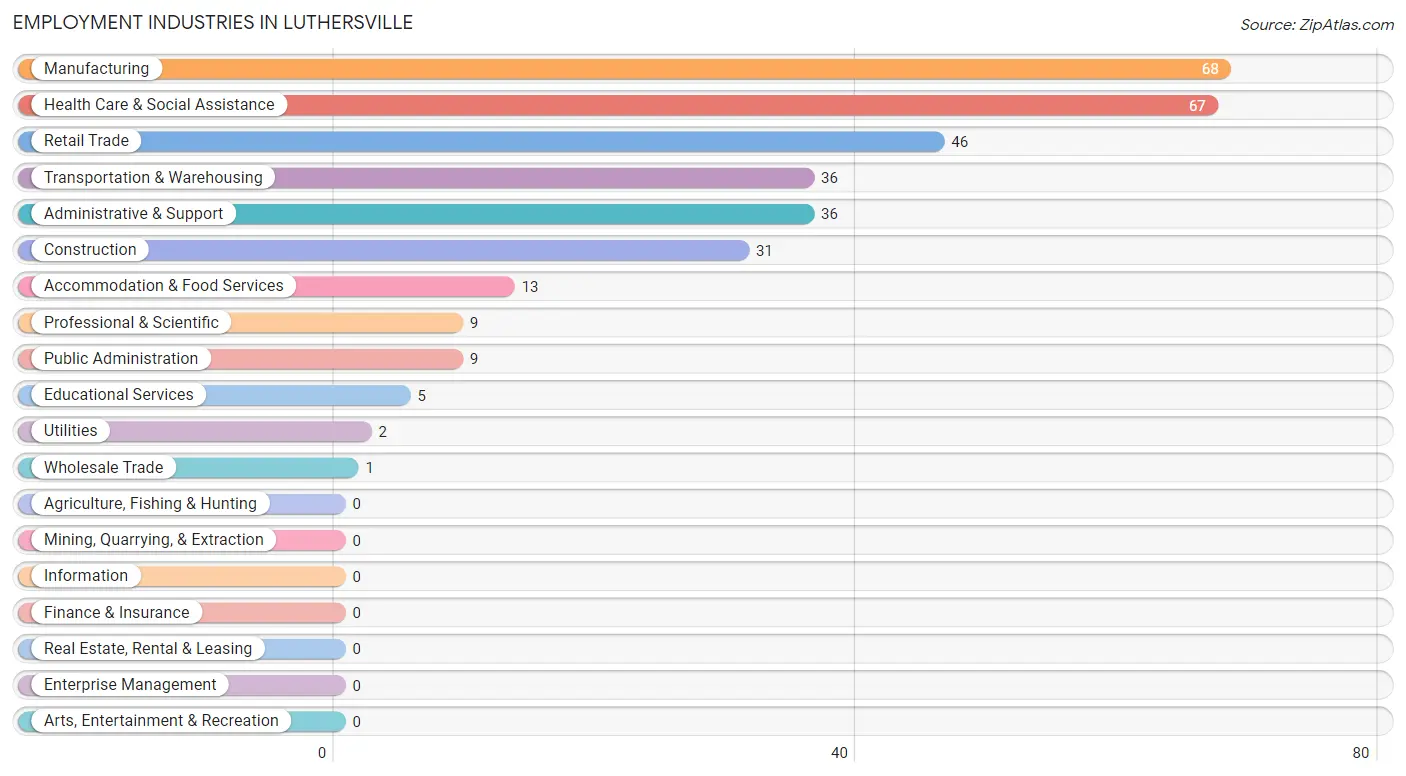
The major employment industries in Luthersville include Manufacturing (68 | 19.6%), Health Care & Social Assistance (67 | 19.3%), Retail Trade (46 | 13.3%), Transportation & Warehousing (36 | 10.4%), and Administrative & Support (36 | 10.4%).
Employment Industries by Sex in Luthersville
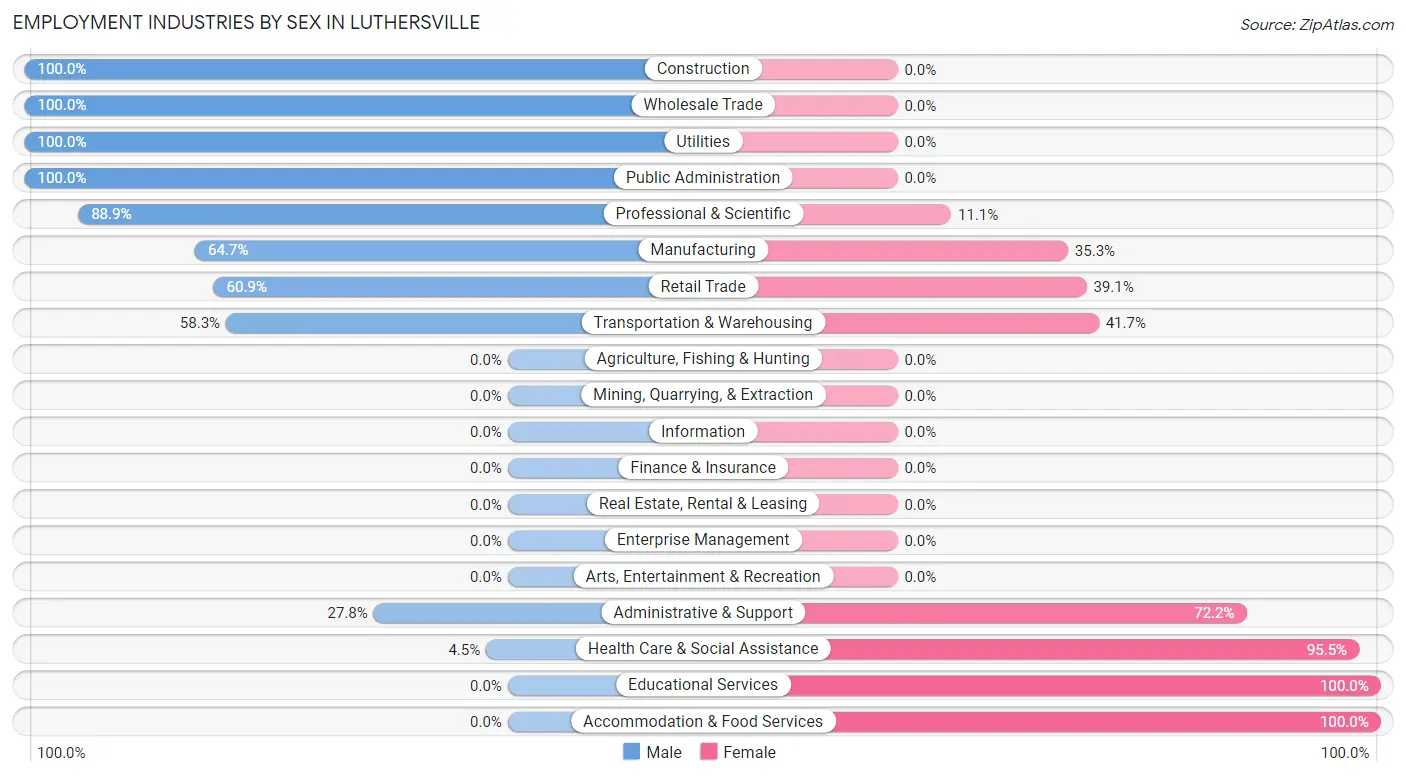
The Luthersville industries that see more men than women are Construction (100.0%), Wholesale Trade (100.0%), and Utilities (100.0%), whereas the industries that tend to have a higher number of women are Educational Services (100.0%), Accommodation & Food Services (100.0%), and Health Care & Social Assistance (95.5%).
| Industry | Male | Female |
| Agriculture, Fishing & Hunting | 0 (0.0%) | 0 (0.0%) |
| Mining, Quarrying, & Extraction | 0 (0.0%) | 0 (0.0%) |
| Construction | 31 (100.0%) | 0 (0.0%) |
| Manufacturing | 44 (64.7%) | 24 (35.3%) |
| Wholesale Trade | 1 (100.0%) | 0 (0.0%) |
| Retail Trade | 28 (60.9%) | 18 (39.1%) |
| Transportation & Warehousing | 21 (58.3%) | 15 (41.7%) |
| Utilities | 2 (100.0%) | 0 (0.0%) |
| Information | 0 (0.0%) | 0 (0.0%) |
| Finance & Insurance | 0 (0.0%) | 0 (0.0%) |
| Real Estate, Rental & Leasing | 0 (0.0%) | 0 (0.0%) |
| Professional & Scientific | 8 (88.9%) | 1 (11.1%) |
| Enterprise Management | 0 (0.0%) | 0 (0.0%) |
| Administrative & Support | 10 (27.8%) | 26 (72.2%) |
| Educational Services | 0 (0.0%) | 5 (100.0%) |
| Health Care & Social Assistance | 3 (4.5%) | 64 (95.5%) |
| Arts, Entertainment & Recreation | 0 (0.0%) | 0 (0.0%) |
| Accommodation & Food Services | 0 (0.0%) | 13 (100.0%) |
| Public Administration | 9 (100.0%) | 0 (0.0%) |
| Total | 176 (50.7%) | 171 (49.3%) |
Education in Luthersville
School Enrollment in Luthersville
The most common levels of schooling among the 149 students in Luthersville are high school (44 | 29.5%), middle school (43 | 28.9%), and college / undergraduate (25 | 16.8%).
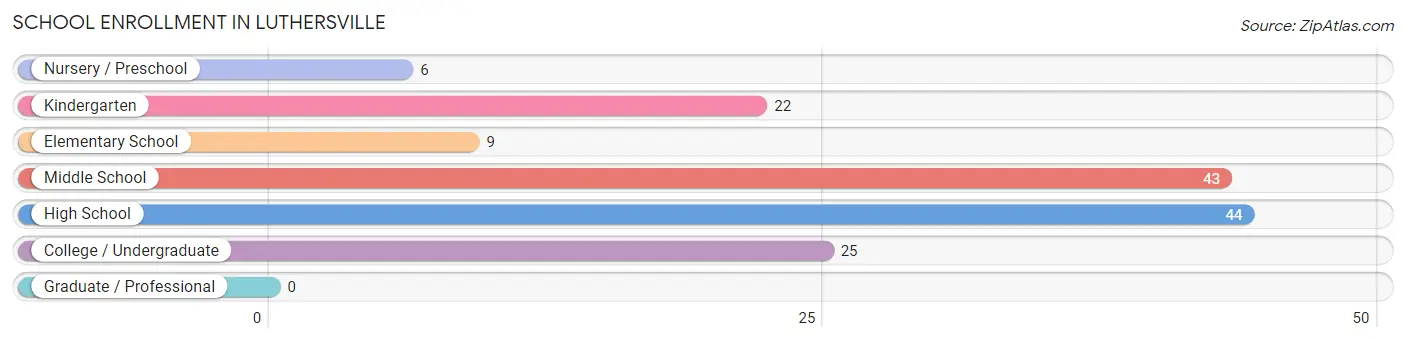
| School Level | # Students | % Students |
| Nursery / Preschool | 6 | 4.0% |
| Kindergarten | 22 | 14.8% |
| Elementary School | 9 | 6.0% |
| Middle School | 43 | 28.9% |
| High School | 44 | 29.5% |
| College / Undergraduate | 25 | 16.8% |
| Graduate / Professional | 0 | 0.0% |
| Total | 149 | 100.0% |
School Enrollment by Age by Funding Source in Luthersville
Out of a total of 149 students who are enrolled in schools in Luthersville, 4 (2.7%) attend a private institution, while the remaining 145 (97.3%) are enrolled in public schools. The age group of 3 to 4 year olds has the highest likelihood of being enrolled in private schools, with 2 (25.0% in the age bracket) enrolled. Conversely, the age group of 5 to 9 year old has the lowest likelihood of being enrolled in a private school, with 29 (100.0% in the age bracket) attending a public institution.
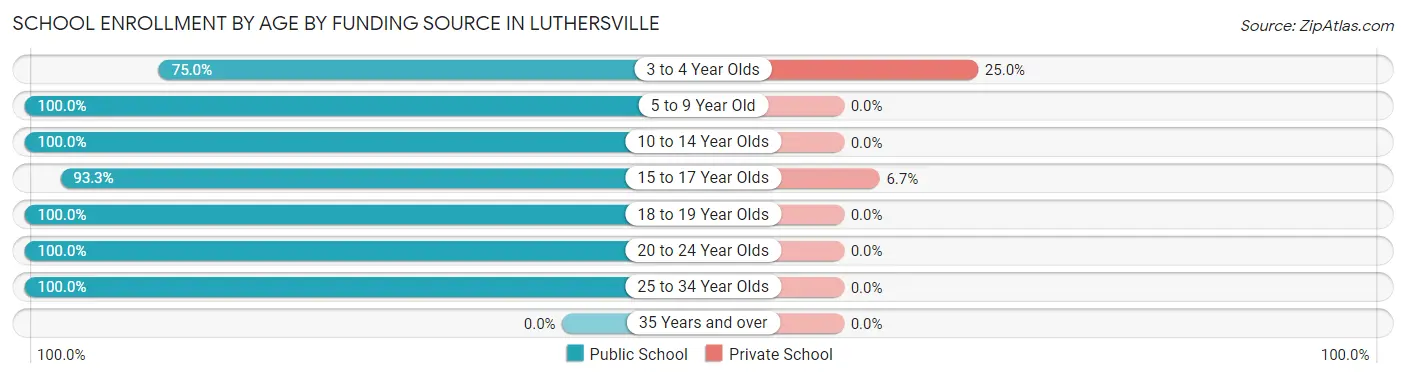
| Age Bracket | Public School | Private School |
| 3 to 4 Year Olds | 6 (75.0%) | 2 (25.0%) |
| 5 to 9 Year Old | 29 (100.0%) | 0 (0.0%) |
| 10 to 14 Year Olds | 57 (100.0%) | 0 (0.0%) |
| 15 to 17 Year Olds | 28 (93.3%) | 2 (6.7%) |
| 18 to 19 Year Olds | 12 (100.0%) | 0 (0.0%) |
| 20 to 24 Year Olds | 6 (100.0%) | 0 (0.0%) |
| 25 to 34 Year Olds | 7 (100.0%) | 0 (0.0%) |
| 35 Years and over | 0 (0.0%) | 0 (0.0%) |
| Total | 145 (97.3%) | 4 (2.7%) |
Educational Attainment by Field of Study in Luthersville
Education (10 | 25.6%), social sciences (9 | 23.1%), physical & health sciences (7 | 17.9%), business (5 | 12.8%), and engineering (4 | 10.3%) are the most common fields of study among 39 individuals in Luthersville who have obtained a bachelor's degree or higher.
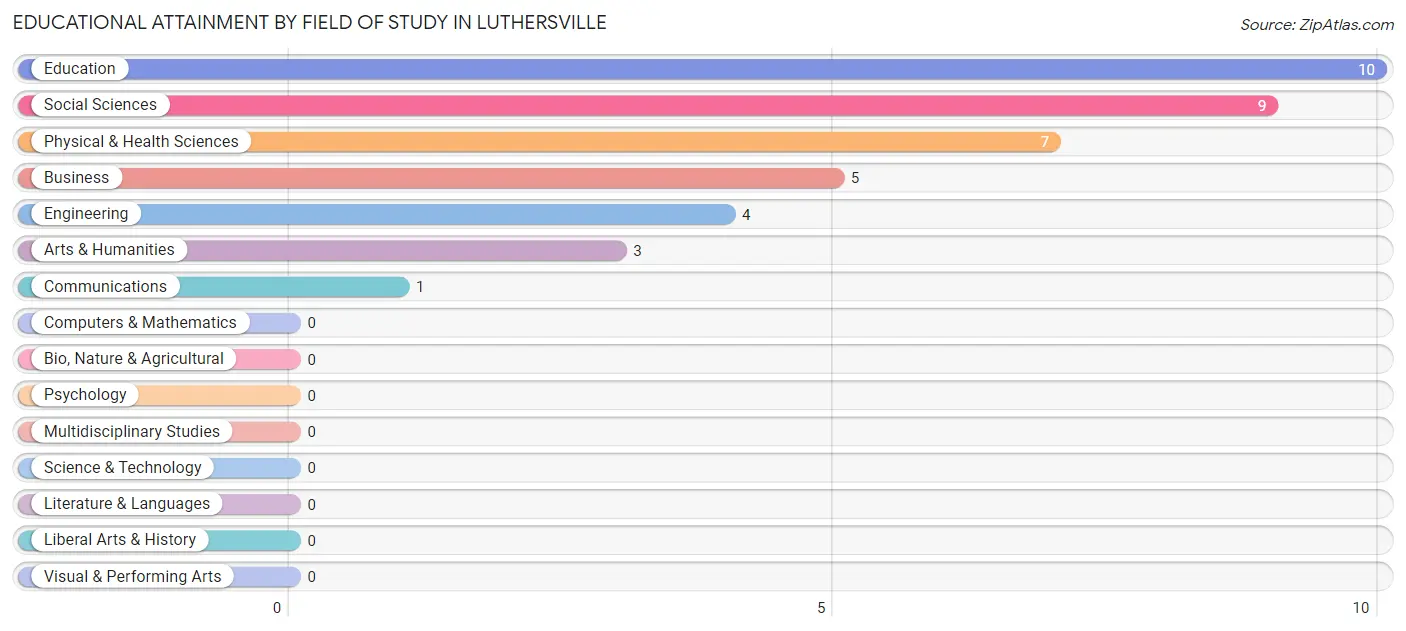
| Field of Study | # Graduates | % Graduates |
| Computers & Mathematics | 0 | 0.0% |
| Bio, Nature & Agricultural | 0 | 0.0% |
| Physical & Health Sciences | 7 | 17.9% |
| Psychology | 0 | 0.0% |
| Social Sciences | 9 | 23.1% |
| Engineering | 4 | 10.3% |
| Multidisciplinary Studies | 0 | 0.0% |
| Science & Technology | 0 | 0.0% |
| Business | 5 | 12.8% |
| Education | 10 | 25.6% |
| Literature & Languages | 0 | 0.0% |
| Liberal Arts & History | 0 | 0.0% |
| Visual & Performing Arts | 0 | 0.0% |
| Communications | 1 | 2.6% |
| Arts & Humanities | 3 | 7.7% |
| Total | 39 | 100.0% |
Transportation & Commute in Luthersville
Vehicle Availability by Sex in Luthersville
The most prevalent vehicle ownership categories in Luthersville are males with 2 vehicles (71, accounting for 43.6%) and females with 2 vehicles (69, making up 43.3%).
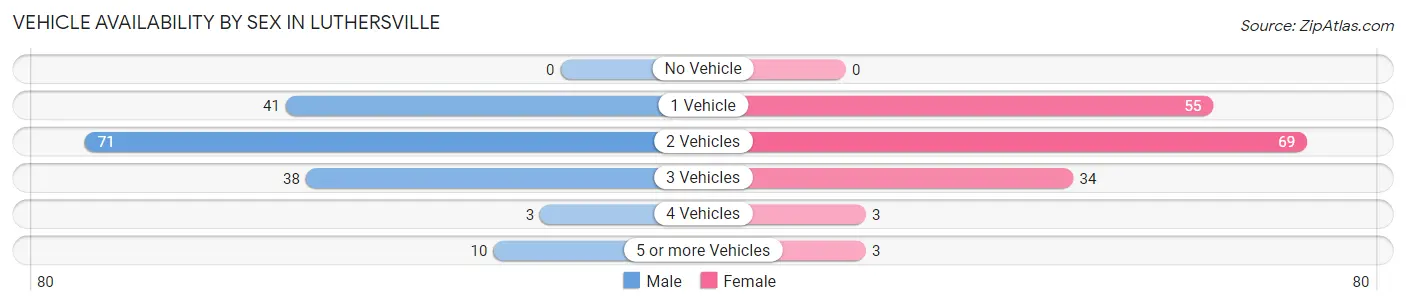
| Vehicles Available | Male | Female |
| No Vehicle | 0 (0.0%) | 0 (0.0%) |
| 1 Vehicle | 41 (25.2%) | 55 (33.5%) |
| 2 Vehicles | 71 (43.6%) | 69 (42.1%) |
| 3 Vehicles | 38 (23.3%) | 34 (20.7%) |
| 4 Vehicles | 3 (1.8%) | 3 (1.8%) |
| 5 or more Vehicles | 10 (6.1%) | 3 (1.8%) |
| Total | 163 (100.0%) | 164 (100.0%) |
Commute Time in Luthersville
The most frequently occuring commute durations in Luthersville are 20 to 24 minutes (69 commuters, 22.5%), 45 to 59 minutes (68 commuters, 22.2%), and 30 to 34 minutes (59 commuters, 19.2%).
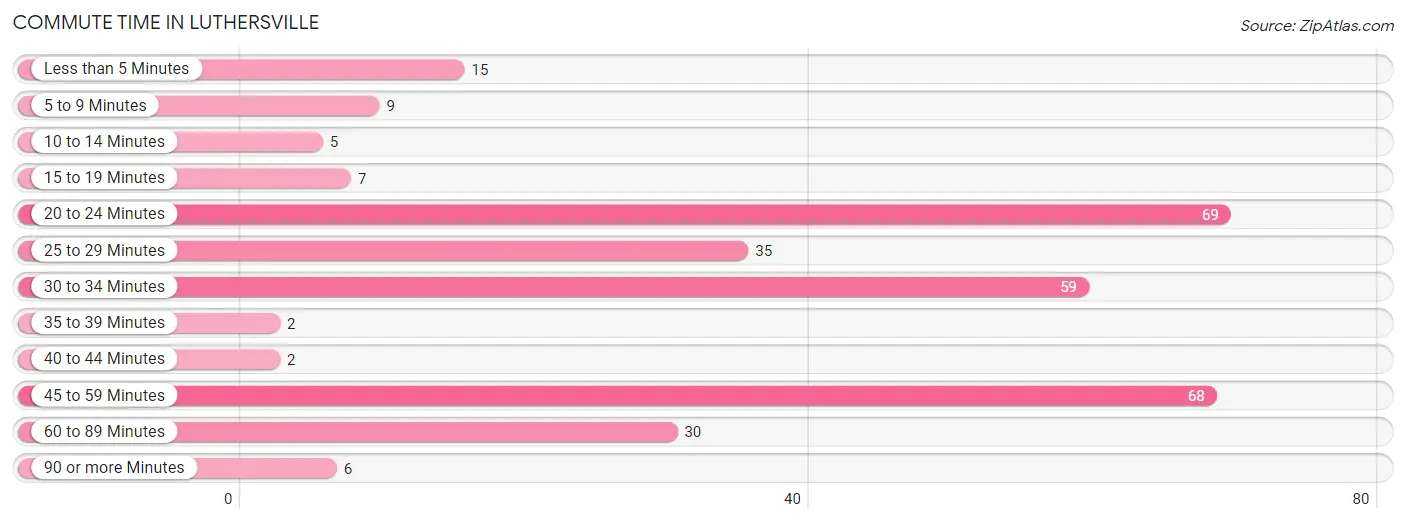
| Commute Time | # Commuters | % Commuters |
| Less than 5 Minutes | 15 | 4.9% |
| 5 to 9 Minutes | 9 | 2.9% |
| 10 to 14 Minutes | 5 | 1.6% |
| 15 to 19 Minutes | 7 | 2.3% |
| 20 to 24 Minutes | 69 | 22.5% |
| 25 to 29 Minutes | 35 | 11.4% |
| 30 to 34 Minutes | 59 | 19.2% |
| 35 to 39 Minutes | 2 | 0.6% |
| 40 to 44 Minutes | 2 | 0.6% |
| 45 to 59 Minutes | 68 | 22.2% |
| 60 to 89 Minutes | 30 | 9.8% |
| 90 or more Minutes | 6 | 1.9% |
Commute Time by Sex in Luthersville
The most common commute times in Luthersville are 45 to 59 minutes (34 commuters, 23.4%) for males and 30 to 34 minutes (48 commuters, 29.6%) for females.
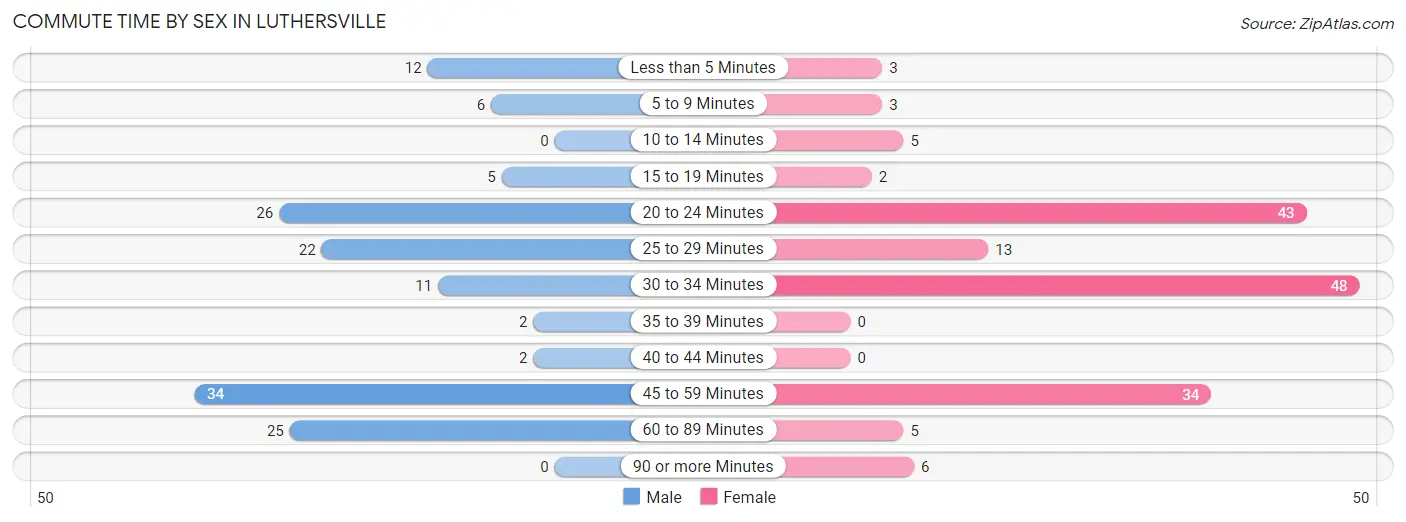
| Commute Time | Male | Female |
| Less than 5 Minutes | 12 (8.3%) | 3 (1.8%) |
| 5 to 9 Minutes | 6 (4.1%) | 3 (1.8%) |
| 10 to 14 Minutes | 0 (0.0%) | 5 (3.1%) |
| 15 to 19 Minutes | 5 (3.5%) | 2 (1.2%) |
| 20 to 24 Minutes | 26 (17.9%) | 43 (26.5%) |
| 25 to 29 Minutes | 22 (15.2%) | 13 (8.0%) |
| 30 to 34 Minutes | 11 (7.6%) | 48 (29.6%) |
| 35 to 39 Minutes | 2 (1.4%) | 0 (0.0%) |
| 40 to 44 Minutes | 2 (1.4%) | 0 (0.0%) |
| 45 to 59 Minutes | 34 (23.4%) | 34 (21.0%) |
| 60 to 89 Minutes | 25 (17.2%) | 5 (3.1%) |
| 90 or more Minutes | 0 (0.0%) | 6 (3.7%) |
Time of Departure to Work by Sex in Luthersville
The most frequent times of departure to work in Luthersville are 12:00 PM to 3:59 PM (44, 30.3%) for males and 5:00 AM to 5:29 AM (31, 19.1%) for females.
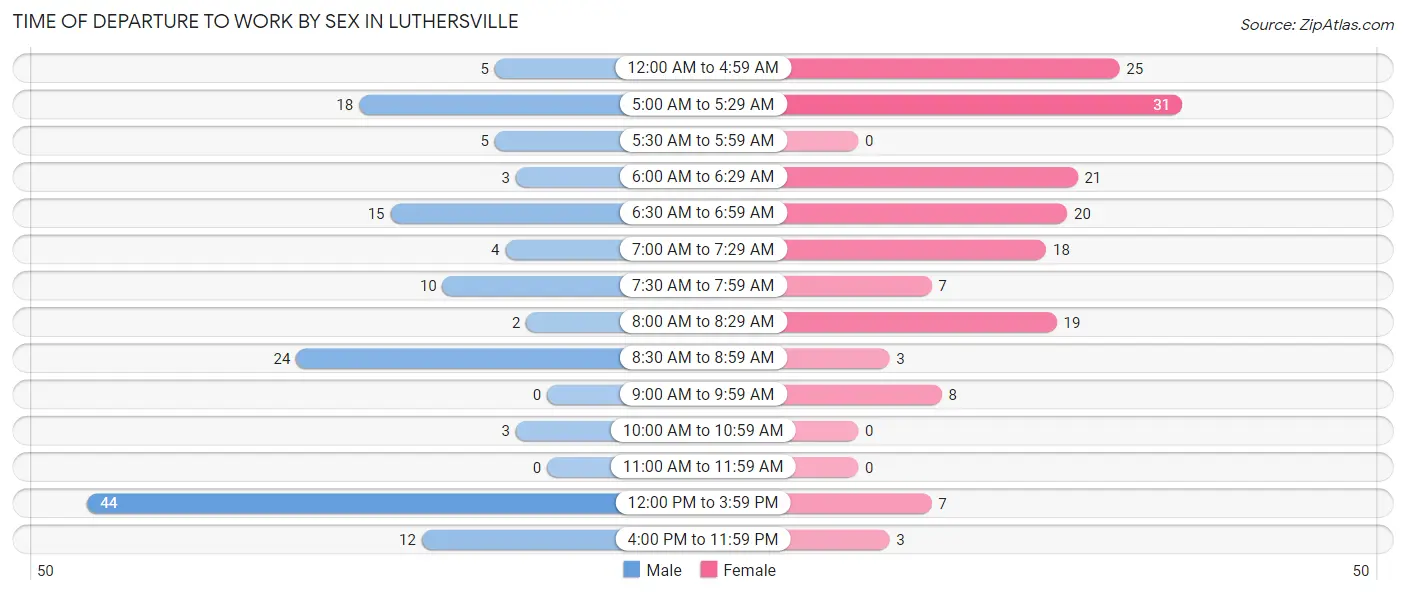
| Time of Departure | Male | Female |
| 12:00 AM to 4:59 AM | 5 (3.5%) | 25 (15.4%) |
| 5:00 AM to 5:29 AM | 18 (12.4%) | 31 (19.1%) |
| 5:30 AM to 5:59 AM | 5 (3.5%) | 0 (0.0%) |
| 6:00 AM to 6:29 AM | 3 (2.1%) | 21 (13.0%) |
| 6:30 AM to 6:59 AM | 15 (10.3%) | 20 (12.3%) |
| 7:00 AM to 7:29 AM | 4 (2.8%) | 18 (11.1%) |
| 7:30 AM to 7:59 AM | 10 (6.9%) | 7 (4.3%) |
| 8:00 AM to 8:29 AM | 2 (1.4%) | 19 (11.7%) |
| 8:30 AM to 8:59 AM | 24 (16.6%) | 3 (1.8%) |
| 9:00 AM to 9:59 AM | 0 (0.0%) | 8 (4.9%) |
| 10:00 AM to 10:59 AM | 3 (2.1%) | 0 (0.0%) |
| 11:00 AM to 11:59 AM | 0 (0.0%) | 0 (0.0%) |
| 12:00 PM to 3:59 PM | 44 (30.3%) | 7 (4.3%) |
| 4:00 PM to 11:59 PM | 12 (8.3%) | 3 (1.8%) |
| Total | 145 (100.0%) | 162 (100.0%) |
Housing Occupancy in Luthersville
Occupancy by Ownership in Luthersville
Of the total 285 dwellings in Luthersville, owner-occupied units account for 118 (41.4%), while renter-occupied units make up 167 (58.6%).
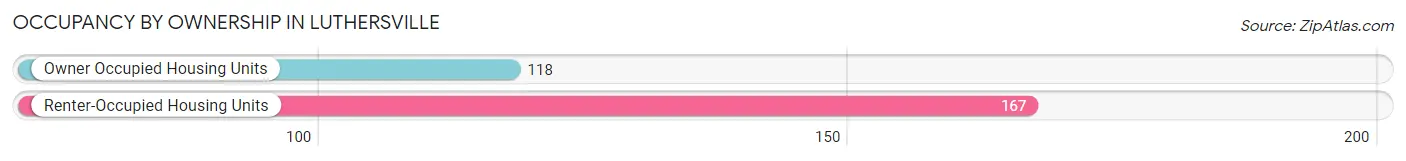
| Occupancy | # Housing Units | % Housing Units |
| Owner Occupied Housing Units | 118 | 41.4% |
| Renter-Occupied Housing Units | 167 | 58.6% |
| Total Occupied Housing Units | 285 | 100.0% |
Occupancy by Household Size in Luthersville
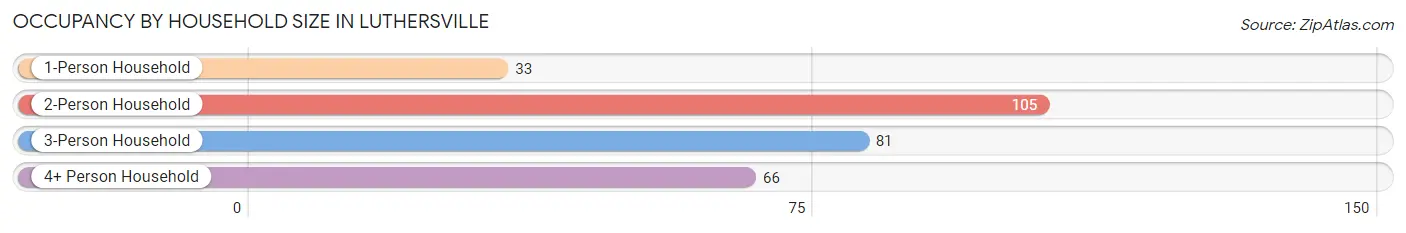
| Household Size | # Housing Units | % Housing Units |
| 1-Person Household | 33 | 11.6% |
| 2-Person Household | 105 | 36.8% |
| 3-Person Household | 81 | 28.4% |
| 4+ Person Household | 66 | 23.2% |
| Total Housing Units | 285 | 100.0% |
Occupancy by Ownership by Household Size in Luthersville
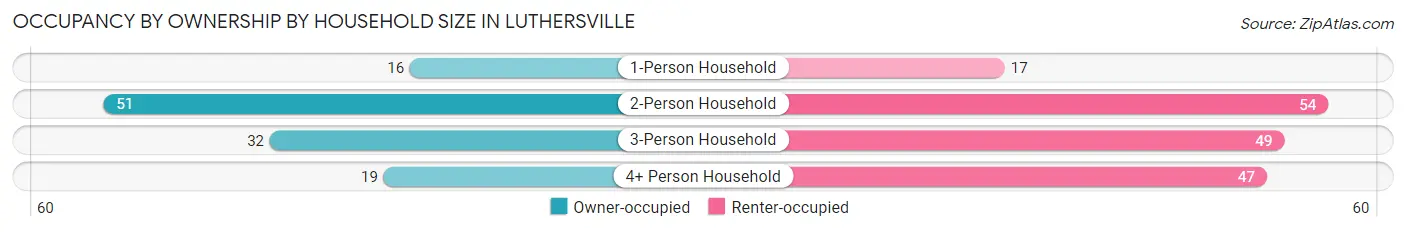
| Household Size | Owner-occupied | Renter-occupied |
| 1-Person Household | 16 (48.5%) | 17 (51.5%) |
| 2-Person Household | 51 (48.6%) | 54 (51.4%) |
| 3-Person Household | 32 (39.5%) | 49 (60.5%) |
| 4+ Person Household | 19 (28.8%) | 47 (71.2%) |
| Total Housing Units | 118 (41.4%) | 167 (58.6%) |
Occupancy by Educational Attainment in Luthersville
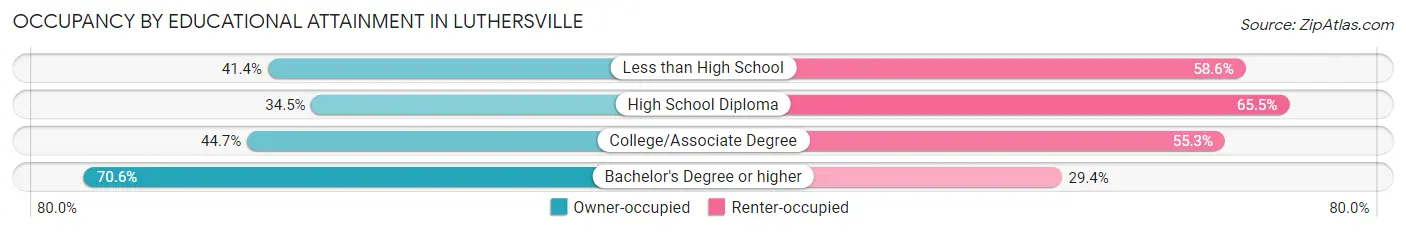
| Household Size | Owner-occupied | Renter-occupied |
| Less than High School | 29 (41.4%) | 41 (58.6%) |
| High School Diploma | 39 (34.5%) | 74 (65.5%) |
| College/Associate Degree | 38 (44.7%) | 47 (55.3%) |
| Bachelor's Degree or higher | 12 (70.6%) | 5 (29.4%) |
Occupancy by Age of Householder in Luthersville
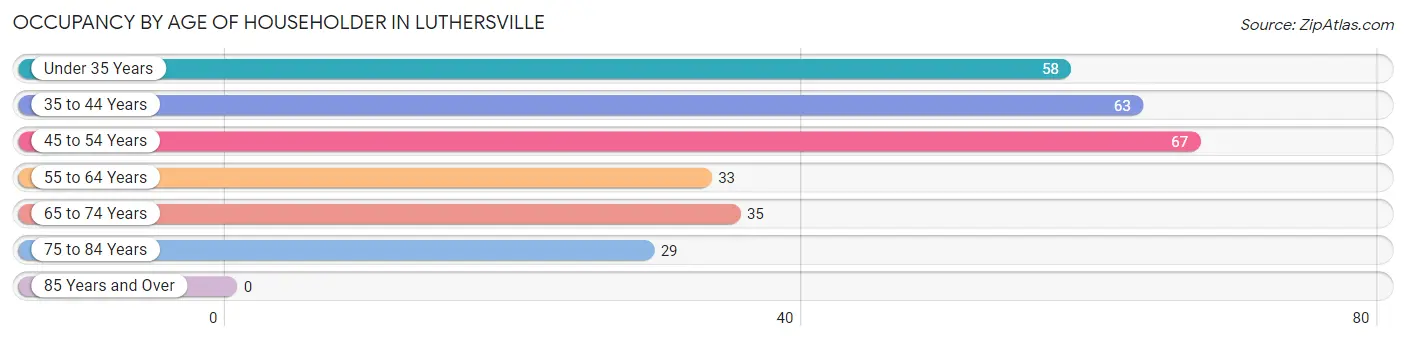
| Age Bracket | # Households | % Households |
| Under 35 Years | 58 | 20.3% |
| 35 to 44 Years | 63 | 22.1% |
| 45 to 54 Years | 67 | 23.5% |
| 55 to 64 Years | 33 | 11.6% |
| 65 to 74 Years | 35 | 12.3% |
| 75 to 84 Years | 29 | 10.2% |
| 85 Years and Over | 0 | 0.0% |
| Total | 285 | 100.0% |
Housing Finances in Luthersville
Median Income by Occupancy in Luthersville
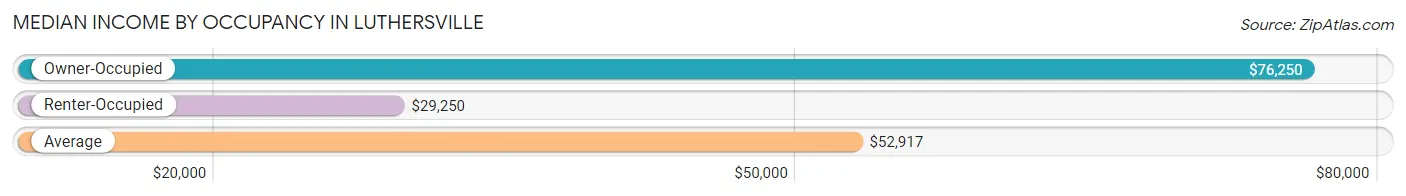
| Occupancy Type | # Households | Median Income |
| Owner-Occupied | 118 (41.4%) | $76,250 |
| Renter-Occupied | 167 (58.6%) | $29,250 |
| Average | 285 (100.0%) | $52,917 |
Occupancy by Householder Income Bracket in Luthersville
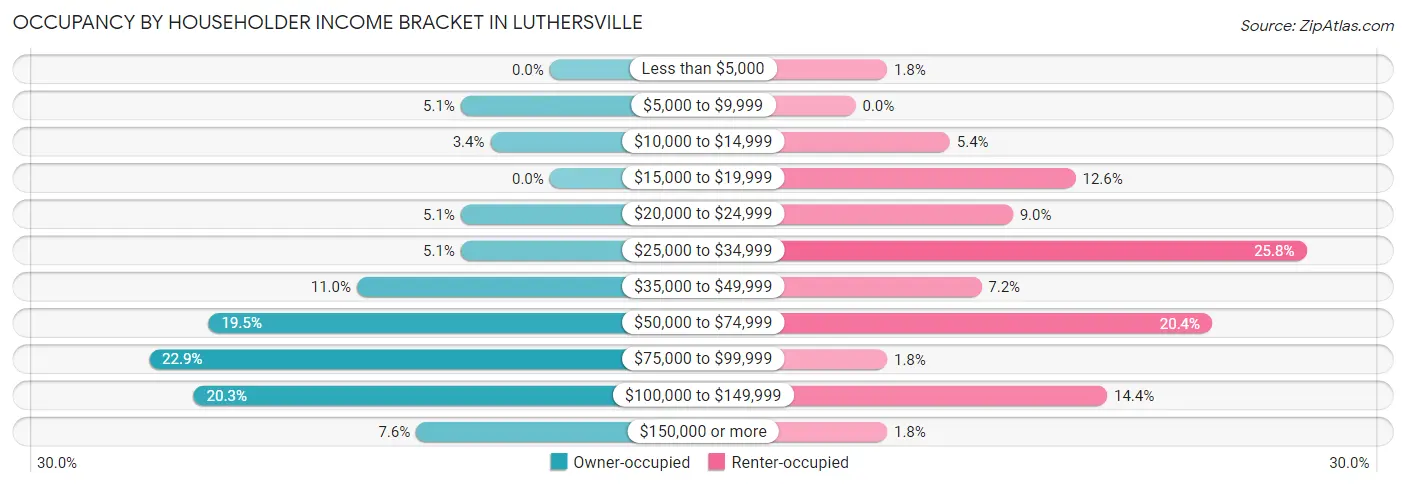
| Income Bracket | Owner-occupied | Renter-occupied |
| Less than $5,000 | 0 (0.0%) | 3 (1.8%) |
| $5,000 to $9,999 | 6 (5.1%) | 0 (0.0%) |
| $10,000 to $14,999 | 4 (3.4%) | 9 (5.4%) |
| $15,000 to $19,999 | 0 (0.0%) | 21 (12.6%) |
| $20,000 to $24,999 | 6 (5.1%) | 15 (9.0%) |
| $25,000 to $34,999 | 6 (5.1%) | 43 (25.8%) |
| $35,000 to $49,999 | 13 (11.0%) | 12 (7.2%) |
| $50,000 to $74,999 | 23 (19.5%) | 34 (20.4%) |
| $75,000 to $99,999 | 27 (22.9%) | 3 (1.8%) |
| $100,000 to $149,999 | 24 (20.3%) | 24 (14.4%) |
| $150,000 or more | 9 (7.6%) | 3 (1.8%) |
| Total | 118 (100.0%) | 167 (100.0%) |
Monthly Housing Cost Tiers in Luthersville
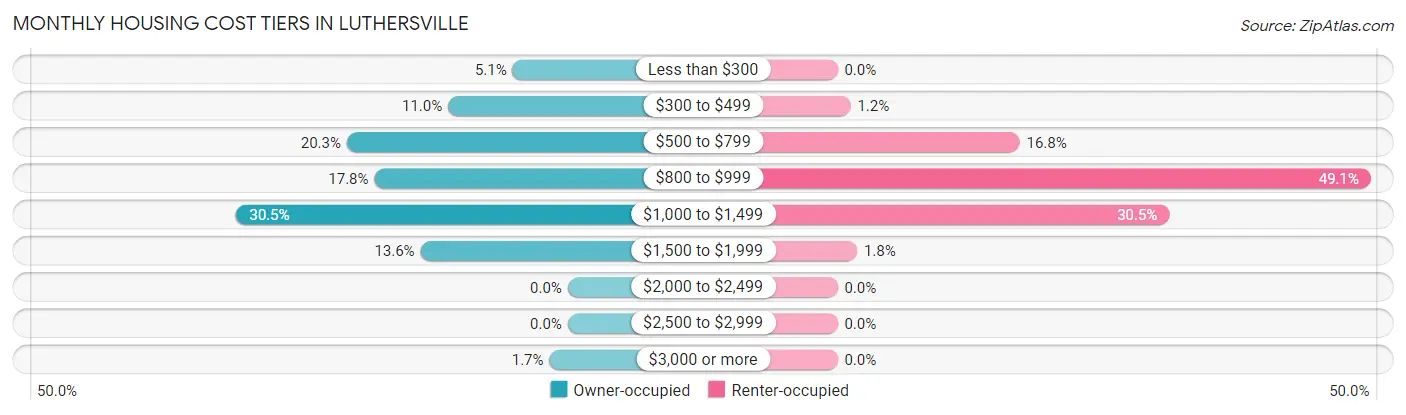
| Monthly Cost | Owner-occupied | Renter-occupied |
| Less than $300 | 6 (5.1%) | 0 (0.0%) |
| $300 to $499 | 13 (11.0%) | 2 (1.2%) |
| $500 to $799 | 24 (20.3%) | 28 (16.8%) |
| $800 to $999 | 21 (17.8%) | 82 (49.1%) |
| $1,000 to $1,499 | 36 (30.5%) | 51 (30.5%) |
| $1,500 to $1,999 | 16 (13.6%) | 3 (1.8%) |
| $2,000 to $2,499 | 0 (0.0%) | 0 (0.0%) |
| $2,500 to $2,999 | 0 (0.0%) | 0 (0.0%) |
| $3,000 or more | 2 (1.7%) | 0 (0.0%) |
| Total | 118 (100.0%) | 167 (100.0%) |
Physical Housing Characteristics in Luthersville
Housing Structures in Luthersville
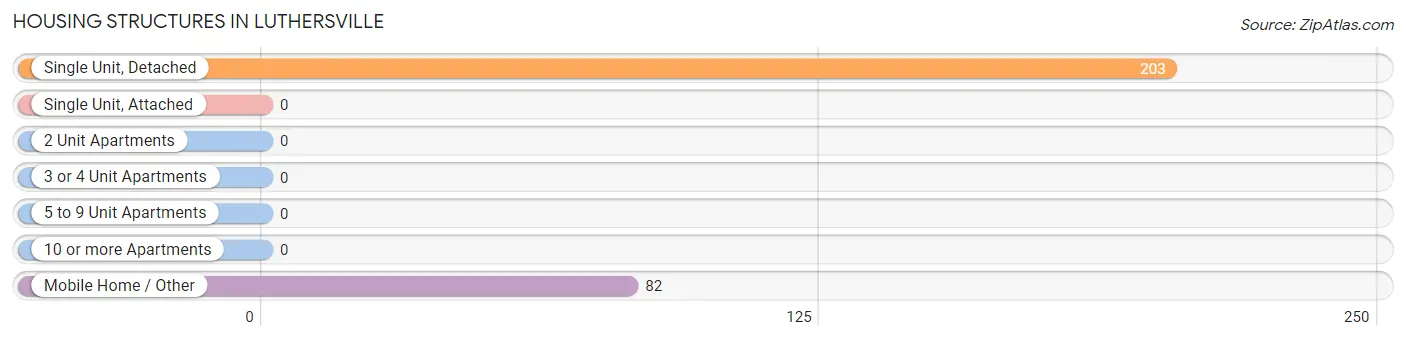
| Structure Type | # Housing Units | % Housing Units |
| Single Unit, Detached | 203 | 71.2% |
| Single Unit, Attached | 0 | 0.0% |
| 2 Unit Apartments | 0 | 0.0% |
| 3 or 4 Unit Apartments | 0 | 0.0% |
| 5 to 9 Unit Apartments | 0 | 0.0% |
| 10 or more Apartments | 0 | 0.0% |
| Mobile Home / Other | 82 | 28.8% |
| Total | 285 | 100.0% |
Housing Structures by Occupancy in Luthersville
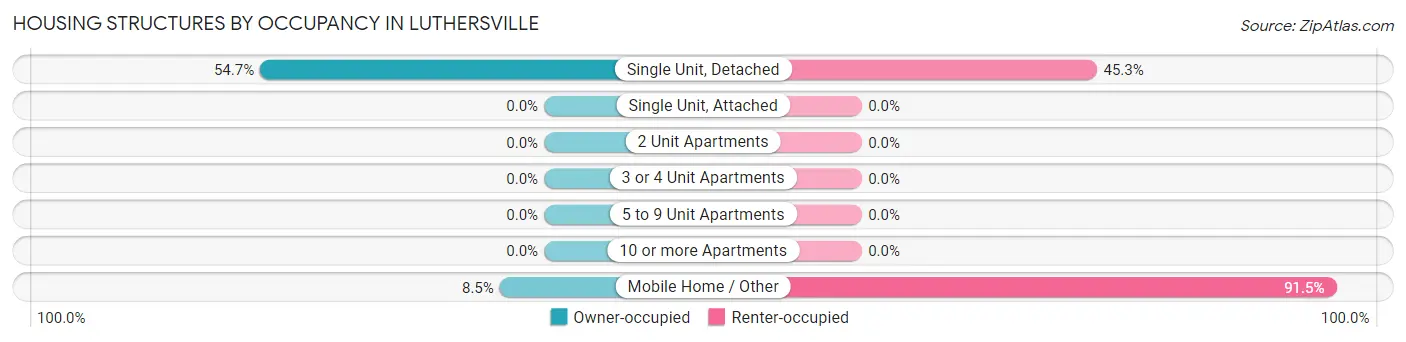
| Structure Type | Owner-occupied | Renter-occupied |
| Single Unit, Detached | 111 (54.7%) | 92 (45.3%) |
| Single Unit, Attached | 0 (0.0%) | 0 (0.0%) |
| 2 Unit Apartments | 0 (0.0%) | 0 (0.0%) |
| 3 or 4 Unit Apartments | 0 (0.0%) | 0 (0.0%) |
| 5 to 9 Unit Apartments | 0 (0.0%) | 0 (0.0%) |
| 10 or more Apartments | 0 (0.0%) | 0 (0.0%) |
| Mobile Home / Other | 7 (8.5%) | 75 (91.5%) |
| Total | 118 (41.4%) | 167 (58.6%) |
Housing Structures by Number of Rooms in Luthersville
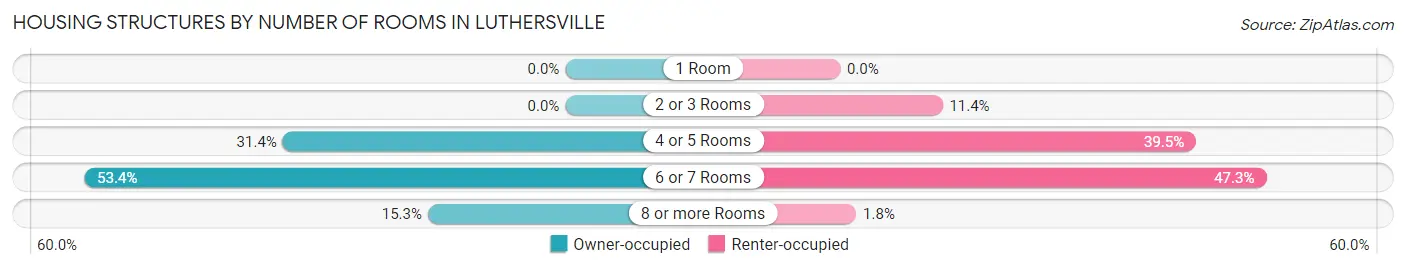
| Number of Rooms | Owner-occupied | Renter-occupied |
| 1 Room | 0 (0.0%) | 0 (0.0%) |
| 2 or 3 Rooms | 0 (0.0%) | 19 (11.4%) |
| 4 or 5 Rooms | 37 (31.4%) | 66 (39.5%) |
| 6 or 7 Rooms | 63 (53.4%) | 79 (47.3%) |
| 8 or more Rooms | 18 (15.2%) | 3 (1.8%) |
| Total | 118 (100.0%) | 167 (100.0%) |
Housing Structure by Heating Type in Luthersville
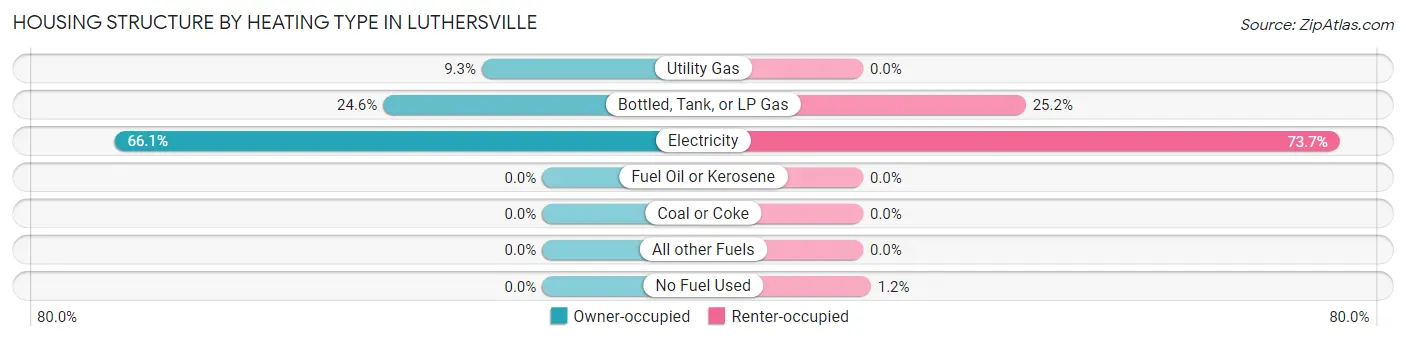
| Heating Type | Owner-occupied | Renter-occupied |
| Utility Gas | 11 (9.3%) | 0 (0.0%) |
| Bottled, Tank, or LP Gas | 29 (24.6%) | 42 (25.2%) |
| Electricity | 78 (66.1%) | 123 (73.7%) |
| Fuel Oil or Kerosene | 0 (0.0%) | 0 (0.0%) |
| Coal or Coke | 0 (0.0%) | 0 (0.0%) |
| All other Fuels | 0 (0.0%) | 0 (0.0%) |
| No Fuel Used | 0 (0.0%) | 2 (1.2%) |
| Total | 118 (100.0%) | 167 (100.0%) |
Household Vehicle Usage in Luthersville
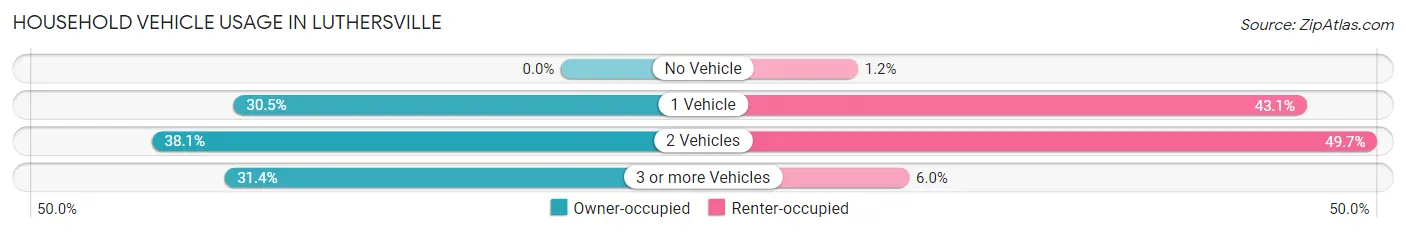
| Vehicles per Household | Owner-occupied | Renter-occupied |
| No Vehicle | 0 (0.0%) | 2 (1.2%) |
| 1 Vehicle | 36 (30.5%) | 72 (43.1%) |
| 2 Vehicles | 45 (38.1%) | 83 (49.7%) |
| 3 or more Vehicles | 37 (31.4%) | 10 (6.0%) |
| Total | 118 (100.0%) | 167 (100.0%) |
Real Estate & Mortgages in Luthersville
Real Estate and Mortgage Overview in Luthersville
| Characteristic | Without Mortgage | With Mortgage |
| Housing Units | 48 | 70 |
| Median Property Value | - | - |
| Median Household Income | $77,500 | $2 |
| Monthly Housing Costs | $523 | $2 |
| Real Estate Taxes | - | - |
Property Value by Mortgage Status in Luthersville
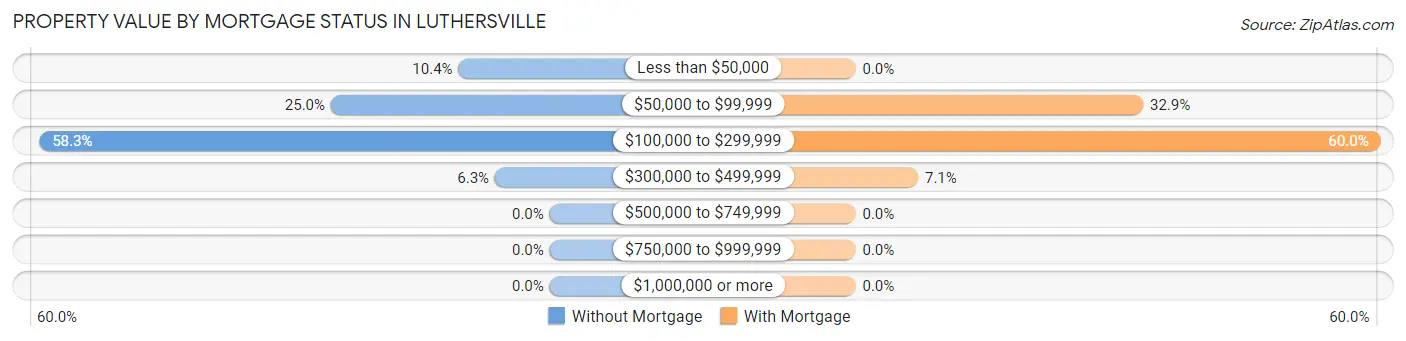
| Property Value | Without Mortgage | With Mortgage |
| Less than $50,000 | 5 (10.4%) | 0 (0.0%) |
| $50,000 to $99,999 | 12 (25.0%) | 23 (32.9%) |
| $100,000 to $299,999 | 28 (58.3%) | 42 (60.0%) |
| $300,000 to $499,999 | 3 (6.2%) | 5 (7.1%) |
| $500,000 to $749,999 | 0 (0.0%) | 0 (0.0%) |
| $750,000 to $999,999 | 0 (0.0%) | 0 (0.0%) |
| $1,000,000 or more | 0 (0.0%) | 0 (0.0%) |
| Total | 48 (100.0%) | 70 (100.0%) |
Household Income by Mortgage Status in Luthersville
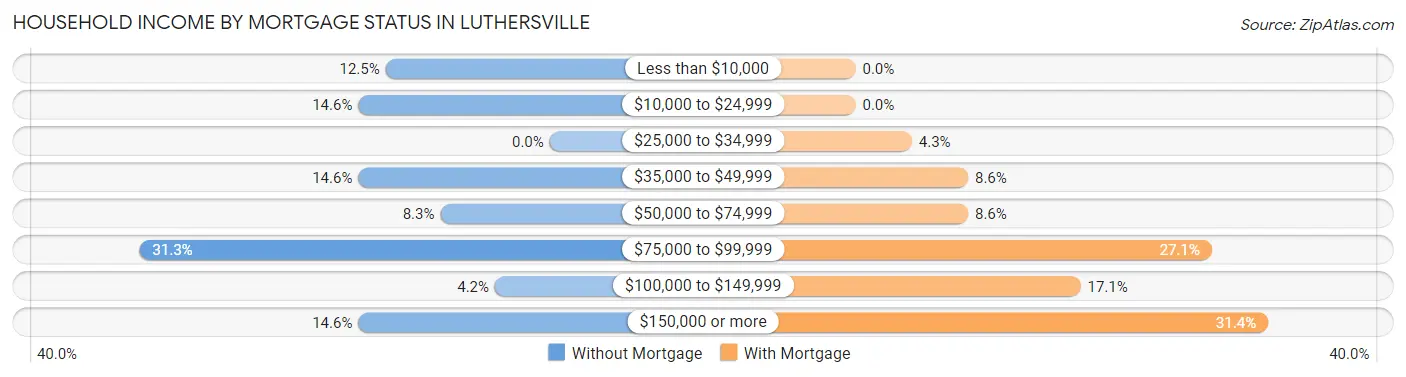
| Household Income | Without Mortgage | With Mortgage |
| Less than $10,000 | 6 (12.5%) | 0 (0.0%) |
| $10,000 to $24,999 | 7 (14.6%) | 0 (0.0%) |
| $25,000 to $34,999 | 0 (0.0%) | 3 (4.3%) |
| $35,000 to $49,999 | 7 (14.6%) | 6 (8.6%) |
| $50,000 to $74,999 | 4 (8.3%) | 6 (8.6%) |
| $75,000 to $99,999 | 15 (31.2%) | 19 (27.1%) |
| $100,000 to $149,999 | 2 (4.2%) | 12 (17.1%) |
| $150,000 or more | 7 (14.6%) | 22 (31.4%) |
| Total | 48 (100.0%) | 70 (100.0%) |
Property Value to Household Income Ratio in Luthersville
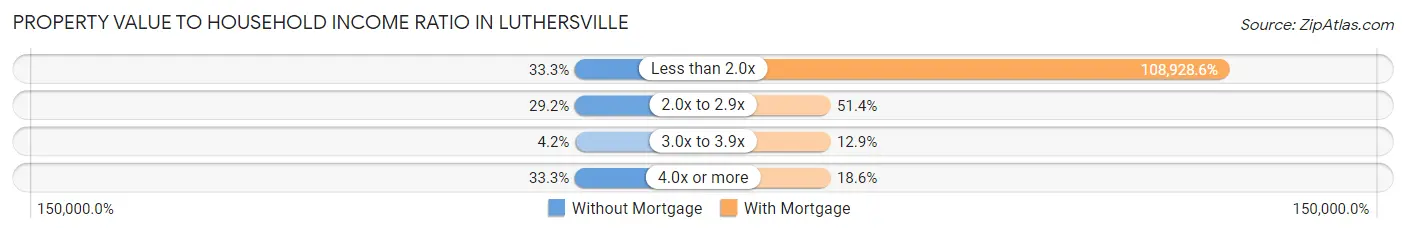
| Value-to-Income Ratio | Without Mortgage | With Mortgage |
| Less than 2.0x | 16 (33.3%) | 76,250 (108,928.6%) |
| 2.0x to 2.9x | 14 (29.2%) | 36 (51.4%) |
| 3.0x to 3.9x | 2 (4.2%) | 9 (12.9%) |
| 4.0x or more | 16 (33.3%) | 13 (18.6%) |
| Total | 48 (100.0%) | 70 (100.0%) |
Real Estate Taxes by Mortgage Status in Luthersville
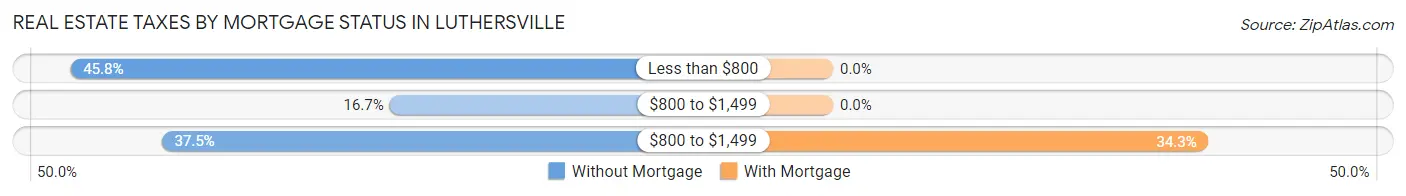
| Property Taxes | Without Mortgage | With Mortgage |
| Less than $800 | 22 (45.8%) | 0 (0.0%) |
| $800 to $1,499 | 8 (16.7%) | 0 (0.0%) |
| $800 to $1,499 | 18 (37.5%) | 24 (34.3%) |
| Total | 48 (100.0%) | 70 (100.0%) |
Health & Disability in Luthersville
Health Insurance Coverage by Age in Luthersville
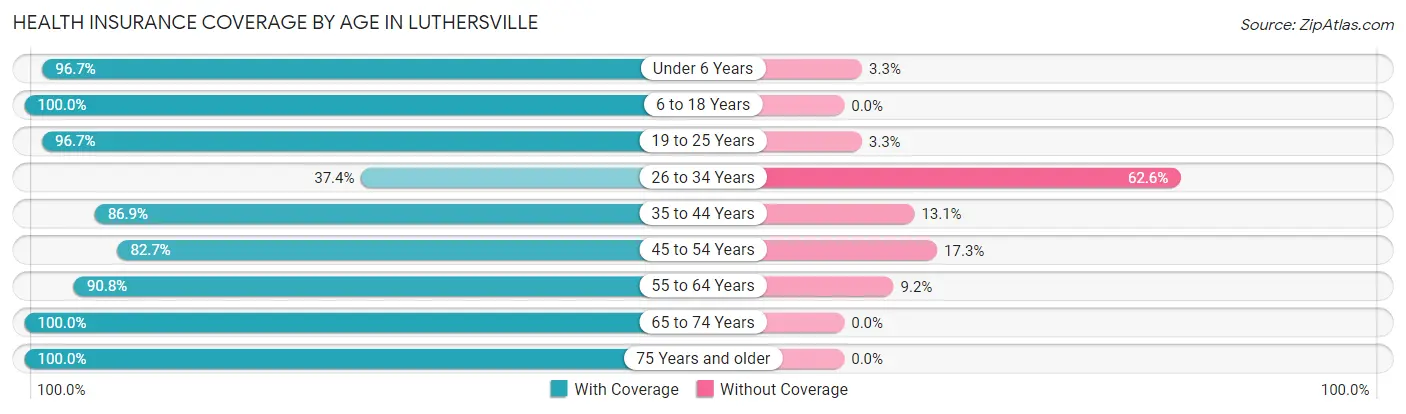
| Age Bracket | With Coverage | Without Coverage |
| Under 6 Years | 58 (96.7%) | 2 (3.3%) |
| 6 to 18 Years | 111 (100.0%) | 0 (0.0%) |
| 19 to 25 Years | 59 (96.7%) | 2 (3.3%) |
| 26 to 34 Years | 46 (37.4%) | 77 (62.6%) |
| 35 to 44 Years | 113 (86.9%) | 17 (13.1%) |
| 45 to 54 Years | 105 (82.7%) | 22 (17.3%) |
| 55 to 64 Years | 79 (90.8%) | 8 (9.2%) |
| 65 to 74 Years | 47 (100.0%) | 0 (0.0%) |
| 75 Years and older | 46 (100.0%) | 0 (0.0%) |
| Total | 664 (83.8%) | 128 (16.2%) |
Health Insurance Coverage by Citizenship Status in Luthersville

| Citizenship Status | With Coverage | Without Coverage |
| Native Born | 58 (96.7%) | 2 (3.3%) |
| Foreign Born, Citizen | 111 (100.0%) | 0 (0.0%) |
| Foreign Born, not a Citizen | 59 (96.7%) | 2 (3.3%) |
Health Insurance Coverage by Household Income in Luthersville
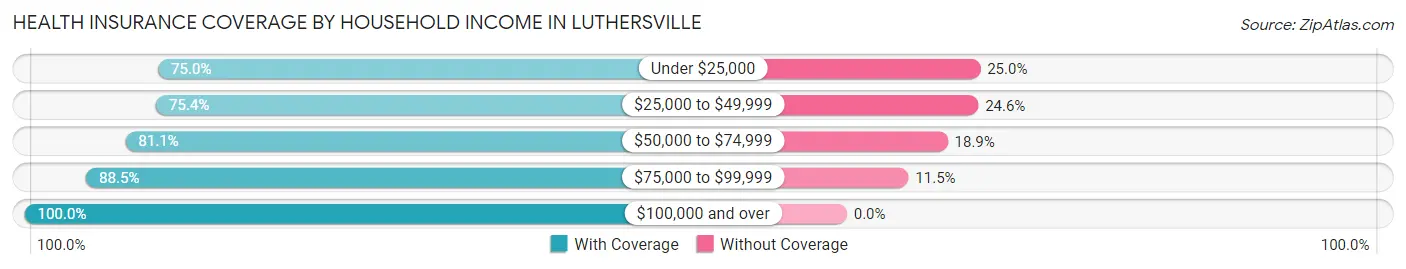
| Household Income | With Coverage | Without Coverage |
| Under $25,000 | 111 (75.0%) | 37 (25.0%) |
| $25,000 to $49,999 | 147 (75.4%) | 48 (24.6%) |
| $50,000 to $74,999 | 146 (81.1%) | 34 (18.9%) |
| $75,000 to $99,999 | 69 (88.5%) | 9 (11.5%) |
| $100,000 and over | 191 (100.0%) | 0 (0.0%) |
Public vs Private Health Insurance Coverage by Age in Luthersville
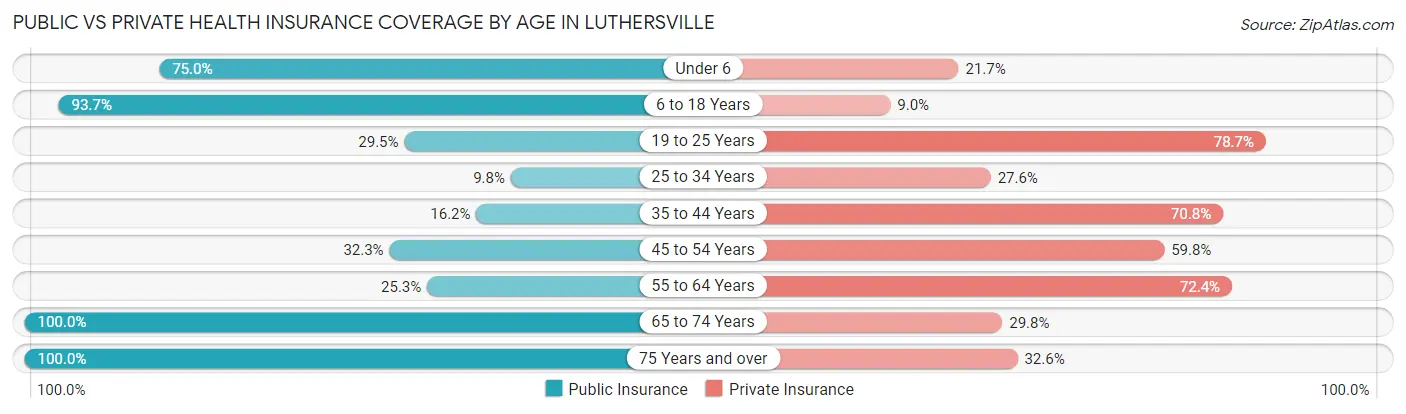
| Age Bracket | Public Insurance | Private Insurance |
| Under 6 | 45 (75.0%) | 13 (21.7%) |
| 6 to 18 Years | 104 (93.7%) | 10 (9.0%) |
| 19 to 25 Years | 18 (29.5%) | 48 (78.7%) |
| 25 to 34 Years | 12 (9.8%) | 34 (27.6%) |
| 35 to 44 Years | 21 (16.2%) | 92 (70.8%) |
| 45 to 54 Years | 41 (32.3%) | 76 (59.8%) |
| 55 to 64 Years | 22 (25.3%) | 63 (72.4%) |
| 65 to 74 Years | 47 (100.0%) | 14 (29.8%) |
| 75 Years and over | 46 (100.0%) | 15 (32.6%) |
| Total | 356 (45.0%) | 365 (46.1%) |
Disability Status by Sex by Age in Luthersville
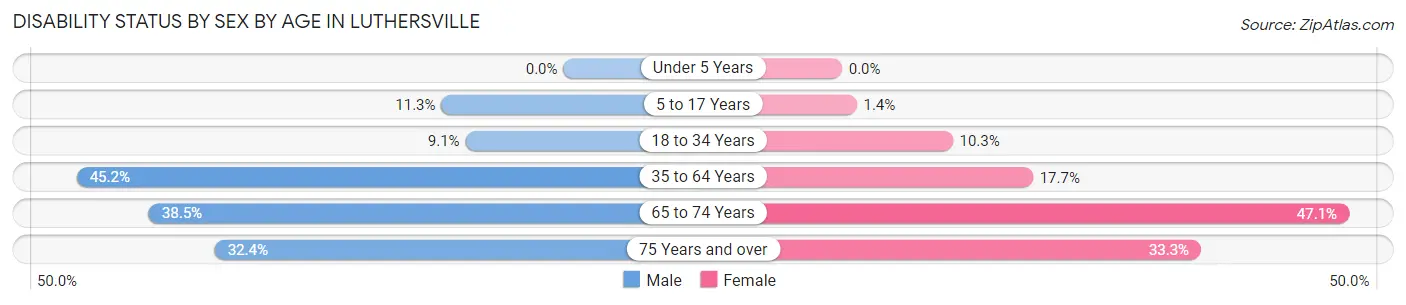
| Age Bracket | Male | Female |
| Under 5 Years | 0 (0.0%) | 0 (0.0%) |
| 5 to 17 Years | 6 (11.3%) | 1 (1.4%) |
| 18 to 34 Years | 7 (9.1%) | 11 (10.3%) |
| 35 to 64 Years | 84 (45.2%) | 28 (17.7%) |
| 65 to 74 Years | 5 (38.5%) | 16 (47.1%) |
| 75 Years and over | 11 (32.4%) | 4 (33.3%) |
Disability Class by Sex by Age in Luthersville
Disability Class: Hearing Difficulty
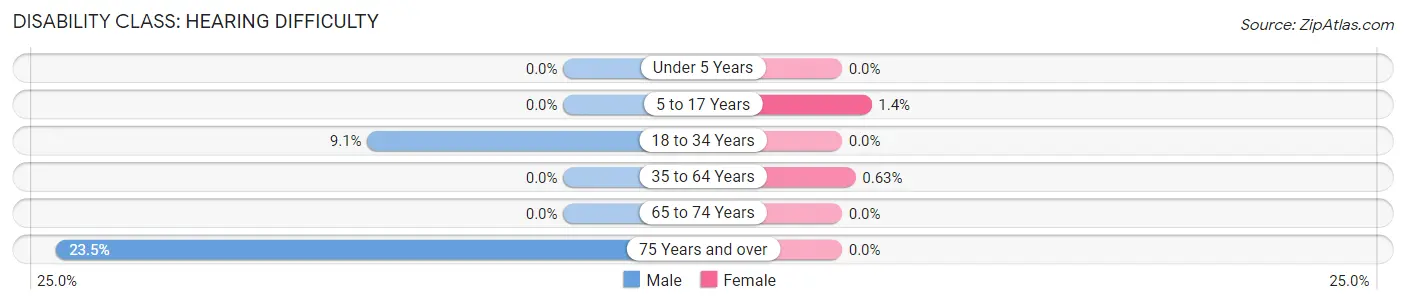
| Age Bracket | Male | Female |
| Under 5 Years | 0 (0.0%) | 0 (0.0%) |
| 5 to 17 Years | 0 (0.0%) | 1 (1.4%) |
| 18 to 34 Years | 7 (9.1%) | 0 (0.0%) |
| 35 to 64 Years | 0 (0.0%) | 1 (0.6%) |
| 65 to 74 Years | 0 (0.0%) | 0 (0.0%) |
| 75 Years and over | 8 (23.5%) | 0 (0.0%) |
Disability Class: Vision Difficulty
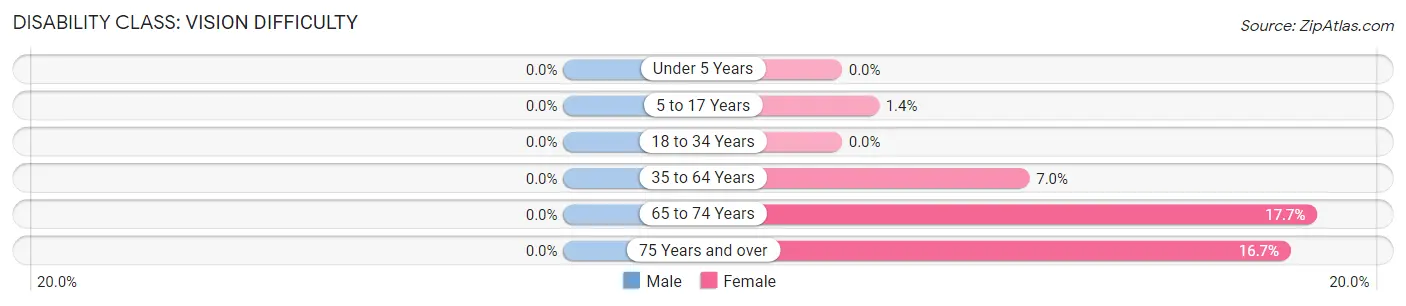
| Age Bracket | Male | Female |
| Under 5 Years | 0 (0.0%) | 0 (0.0%) |
| 5 to 17 Years | 0 (0.0%) | 1 (1.4%) |
| 18 to 34 Years | 0 (0.0%) | 0 (0.0%) |
| 35 to 64 Years | 0 (0.0%) | 11 (7.0%) |
| 65 to 74 Years | 0 (0.0%) | 6 (17.6%) |
| 75 Years and over | 0 (0.0%) | 2 (16.7%) |
Disability Class: Cognitive Difficulty
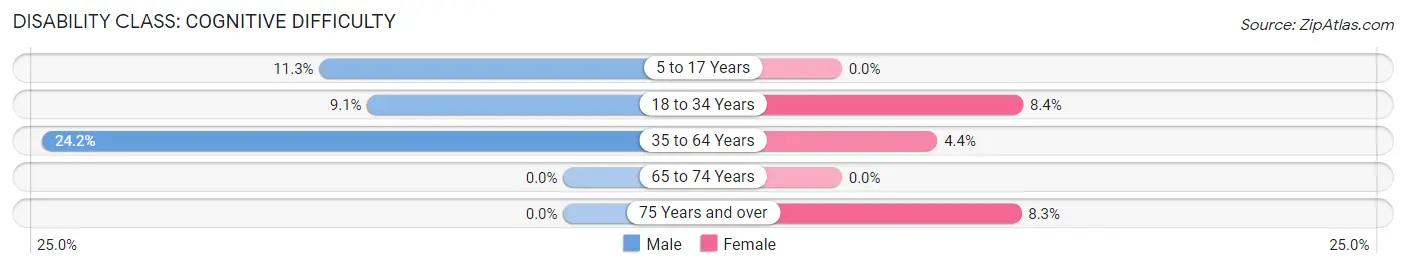
| Age Bracket | Male | Female |
| 5 to 17 Years | 6 (11.3%) | 0 (0.0%) |
| 18 to 34 Years | 7 (9.1%) | 9 (8.4%) |
| 35 to 64 Years | 45 (24.2%) | 7 (4.4%) |
| 65 to 74 Years | 0 (0.0%) | 0 (0.0%) |
| 75 Years and over | 0 (0.0%) | 1 (8.3%) |
Disability Class: Ambulatory Difficulty
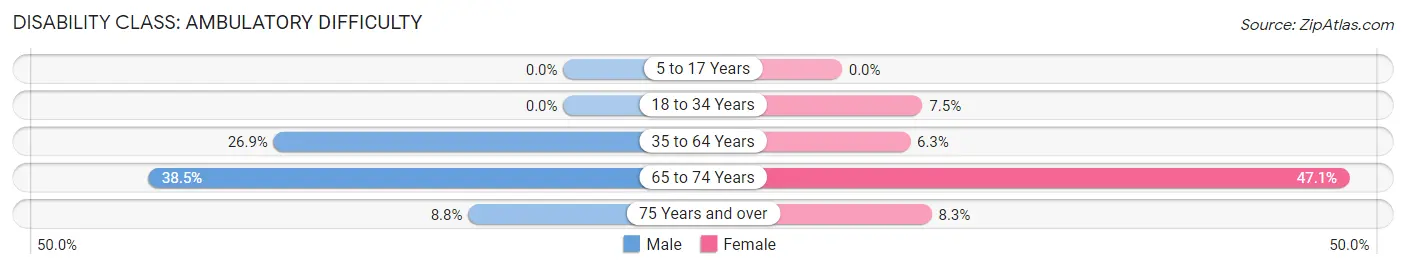
| Age Bracket | Male | Female |
| 5 to 17 Years | 0 (0.0%) | 0 (0.0%) |
| 18 to 34 Years | 0 (0.0%) | 8 (7.5%) |
| 35 to 64 Years | 50 (26.9%) | 10 (6.3%) |
| 65 to 74 Years | 5 (38.5%) | 16 (47.1%) |
| 75 Years and over | 3 (8.8%) | 1 (8.3%) |
Disability Class: Self-Care Difficulty
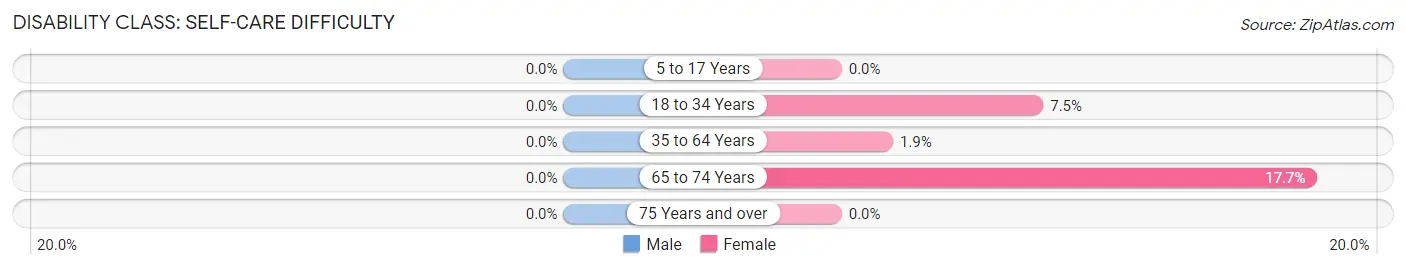
| Age Bracket | Male | Female |
| 5 to 17 Years | 0 (0.0%) | 0 (0.0%) |
| 18 to 34 Years | 0 (0.0%) | 8 (7.5%) |
| 35 to 64 Years | 0 (0.0%) | 3 (1.9%) |
| 65 to 74 Years | 0 (0.0%) | 6 (17.6%) |
| 75 Years and over | 0 (0.0%) | 0 (0.0%) |
Technology Access in Luthersville
Computing Device Access in Luthersville
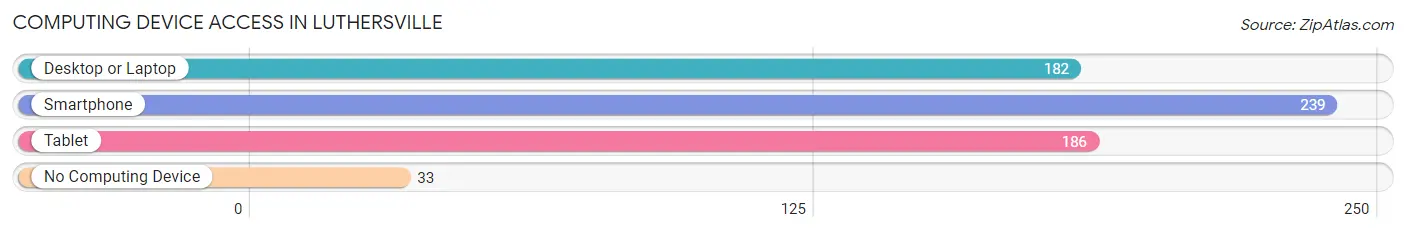
| Device Type | # Households | % Households |
| Desktop or Laptop | 182 | 63.9% |
| Smartphone | 239 | 83.9% |
| Tablet | 186 | 65.3% |
| No Computing Device | 33 | 11.6% |
| Total | 285 | 100.0% |
Internet Access in Luthersville
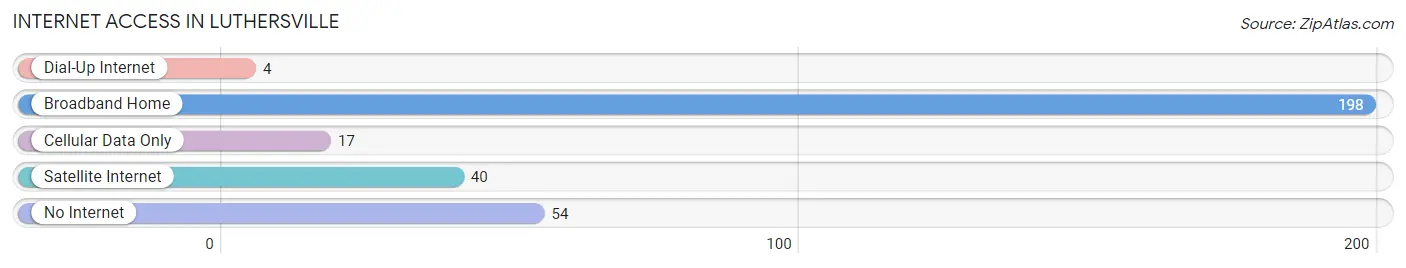
| Internet Type | # Households | % Households |
| Dial-Up Internet | 4 | 1.4% |
| Broadband Home | 198 | 69.5% |
| Cellular Data Only | 17 | 6.0% |
| Satellite Internet | 40 | 14.0% |
| No Internet | 54 | 19.0% |
| Total | 285 | 100.0% |
Luthersville Summary
Luthersville is a small town located in Meriwether County, Georgia, United States. It is situated about 40 miles southwest of Atlanta and is part of the Atlanta metropolitan area. The population of Luthersville was 1,072 at the 2010 census.
History
Luthersville was founded in 1854 by a group of German Lutherans who had migrated from Pennsylvania. The town was named after Martin Luther, the founder of the Lutheran Church. The town was incorporated in 1856 and was the first incorporated town in Meriwether County.
The town was a major stop on the Atlanta and West Point Railroad, which ran from Atlanta to West Point, Georgia. The railroad was a major factor in the growth of the town, as it allowed for the transportation of goods and people.
In the late 19th century, Luthersville was a thriving agricultural center, with cotton, corn, and tobacco being the main crops. The town also had a number of businesses, including a hotel, a bank, a sawmill, and a gristmill.
In the early 20th century, the town began to decline as the railroad was replaced by automobiles and trucks. The town's population decreased and many of the businesses closed.
Geography
Luthersville is located at 33°37'25" North, 84°45'17" West (33.623, -84.752). The town is situated in the foothills of the Appalachian Mountains and is surrounded by rolling hills and forests.
The town is located on the banks of the Flint River, which flows through the town. The river is a popular spot for fishing and canoeing.
The town is located about 40 miles southwest of Atlanta and is part of the Atlanta metropolitan area.
Economy
The economy of Luthersville is largely based on agriculture. The town is home to several farms, which produce a variety of crops, including cotton, corn, and tobacco.
The town also has a number of small businesses, including a grocery store, a hardware store, and a restaurant.
Demographics
As of the 2010 census, the population of Luthersville was 1,072. The racial makeup of the town was 79.2% White, 17.3% African American, 0.7% Native American, 0.3% Asian, 0.1% Pacific Islander, and 2.5% from other races.
The median household income in Luthersville was $31,250, and the median family income was $37,500. The per capita income was $17,845. About 17.3% of the population was below the poverty line.
Conclusion
Luthersville is a small town located in Meriwether County, Georgia, United States. It was founded in 1854 by a group of German Lutherans and was incorporated in 1856. The town was a major stop on the Atlanta and West Point Railroad and was a thriving agricultural center in the late 19th century. The town has since declined, but still has a number of small businesses and farms. The population of Luthersville was 1,072 at the 2010 census. The town has a median household income of $31,250 and a per capita income of $17,845.
Common Questions
What is Per Capita Income in Luthersville?
Per Capita income in Luthersville is $23,949.
What is the Median Family Income in Luthersville?
Median Family Income in Luthersville is $53,287.
What is the Median Household income in Luthersville?
Median Household Income in Luthersville is $52,917.
What is Income or Wage Gap in Luthersville?
Income or Wage Gap in Luthersville is 28.2%.
Women in Luthersville earn 71.8 cents for every dollar earned by a man.
What is Inequality or Gini Index in Luthersville?
Inequality or Gini Index in Luthersville is 0.40.
What is the Total Population of Luthersville?
Total Population of Luthersville is 792.
What is the Total Male Population of Luthersville?
Total Male Population of Luthersville is 394.
What is the Total Female Population of Luthersville?
Total Female Population of Luthersville is 398.
What is the Ratio of Males per 100 Females in Luthersville?
There are 98.99 Males per 100 Females in Luthersville.
What is the Ratio of Females per 100 Males in Luthersville?
There are 101.02 Females per 100 Males in Luthersville.
What is the Median Population Age in Luthersville?
Median Population Age in Luthersville is 39.7 Years.
What is the Average Family Size in Luthersville
Average Family Size in Luthersville is 2.9 People.
What is the Average Household Size in Luthersville
Average Household Size in Luthersville is 2.8 People.
How Large is the Labor Force in Luthersville?
There are 357 People in the Labor Forcein in Luthersville.
What is the Percentage of People in the Labor Force in Luthersville?
54.0% of People are in the Labor Force in Luthersville.
What is the Unemployment Rate in Luthersville?
Unemployment Rate in Luthersville is 2.8%.