Lula, GA Map & Demographics
Lula Map
Lula Overview
$25,223
PER CAPITA INCOME
$68,704
AVG FAMILY INCOME
$60,174
AVG HOUSEHOLD INCOME
13.9%
WAGE / INCOME GAP [ % ]
86.1¢/ $1
WAGE / INCOME GAP [ $ ]
0.37
INEQUALITY / GINI INDEX
2,880
TOTAL POPULATION
1,416
MALE POPULATION
1,464
FEMALE POPULATION
96.72
MALES / 100 FEMALES
103.39
FEMALES / 100 MALES
38.4
MEDIAN AGE
3.2
AVG FAMILY SIZE
2.7
AVG HOUSEHOLD SIZE
1,431
LABOR FORCE [ PEOPLE ]
61.2%
PERCENT IN LABOR FORCE
2.2%
UNEMPLOYMENT RATE
Lula Zip Codes
Income in Lula
Income Overview in Lula
Per Capita Income in Lula is $25,223, while median incomes of families and households are $68,704 and $60,174 respectively.
| Characteristic | Number | Measure |
| Per Capita Income | 2,880 | $25,223 |
| Median Family Income | 726 | $68,704 |
| Mean Family Income | 726 | $75,033 |
| Median Household Income | 1,050 | $60,174 |
| Mean Household Income | 1,050 | $67,095 |
| Income Deficit | 726 | $0 |
| Wage / Income Gap (%) | 2,880 | 13.87% |
| Wage / Income Gap ($) | 2,880 | 86.13¢ per $1 |
| Gini / Inequality Index | 2,880 | 0.37 |
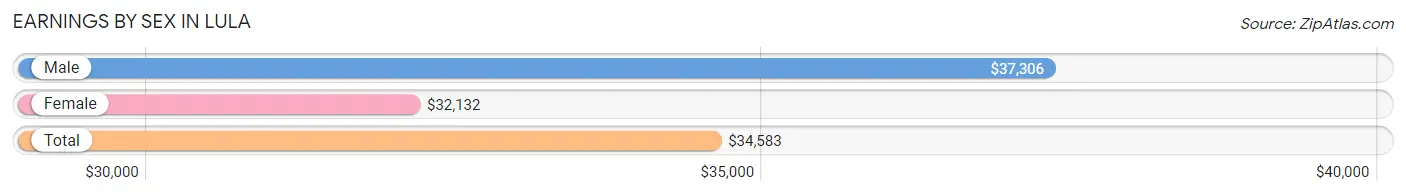
Earnings by Sex in Lula
Average Earnings in Lula are $34,583, $37,306 for men and $32,132 for women, a difference of 13.9%.
| Sex | Number | Average Earnings |
| Male | 863 (55.0%) | $37,306 |
| Female | 707 (45.0%) | $32,132 |
| Total | 1,570 (100.0%) | $34,583 |
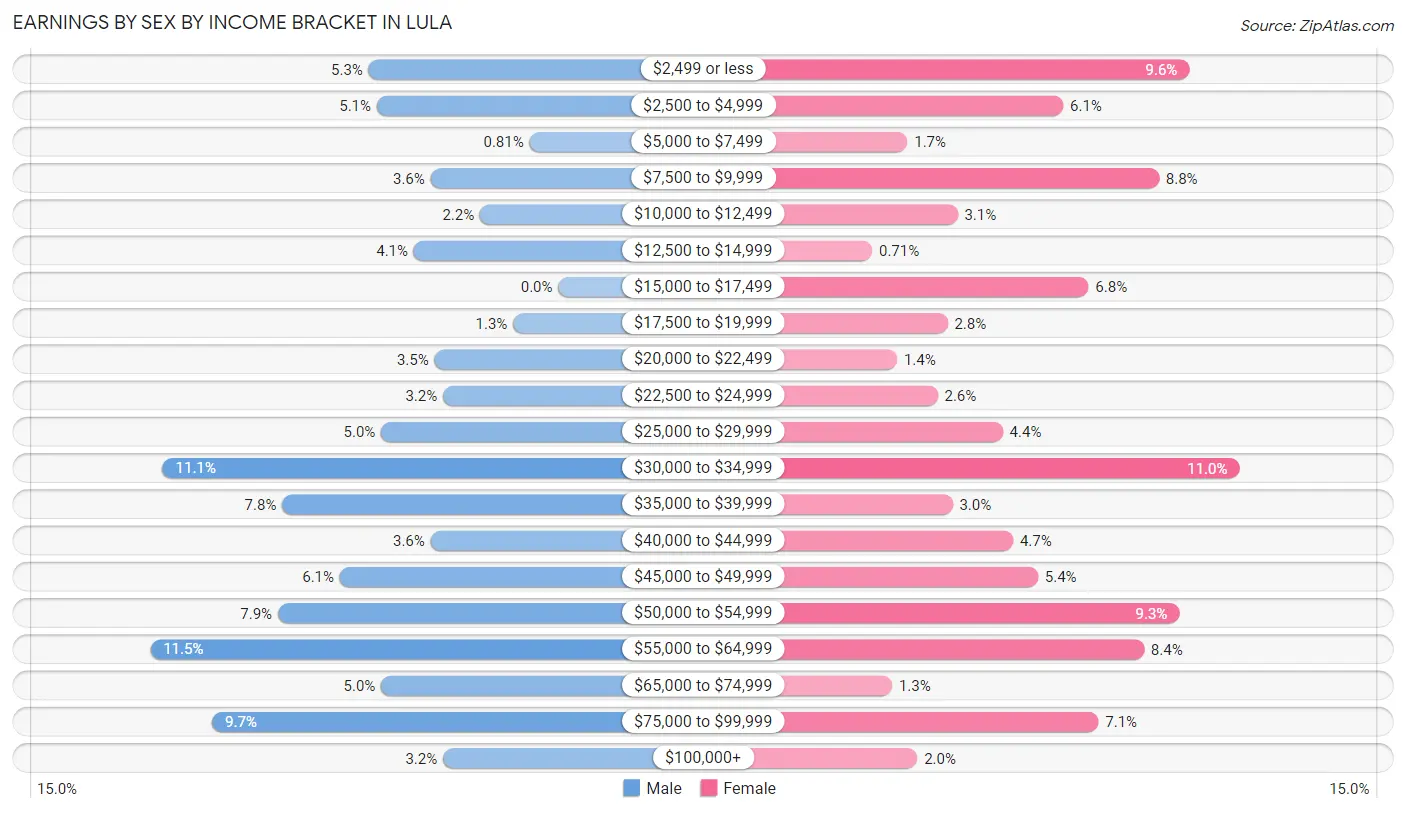
Earnings by Sex by Income Bracket in Lula
The most common earnings brackets in Lula are $55,000 to $64,999 for men (99 | 11.5%) and $30,000 to $34,999 for women (78 | 11.0%).
| Income | Male | Female |
| $2,499 or less | 46 (5.3%) | 68 (9.6%) |
| $2,500 to $4,999 | 44 (5.1%) | 43 (6.1%) |
| $5,000 to $7,499 | 7 (0.8%) | 12 (1.7%) |
| $7,500 to $9,999 | 31 (3.6%) | 62 (8.8%) |
| $10,000 to $12,499 | 19 (2.2%) | 22 (3.1%) |
| $12,500 to $14,999 | 35 (4.1%) | 5 (0.7%) |
| $15,000 to $17,499 | 0 (0.0%) | 48 (6.8%) |
| $17,500 to $19,999 | 11 (1.3%) | 20 (2.8%) |
| $20,000 to $22,499 | 30 (3.5%) | 10 (1.4%) |
| $22,500 to $24,999 | 28 (3.2%) | 18 (2.5%) |
| $25,000 to $29,999 | 43 (5.0%) | 31 (4.4%) |
| $30,000 to $34,999 | 96 (11.1%) | 78 (11.0%) |
| $35,000 to $39,999 | 67 (7.8%) | 21 (3.0%) |
| $40,000 to $44,999 | 31 (3.6%) | 33 (4.7%) |
| $45,000 to $49,999 | 53 (6.1%) | 38 (5.4%) |
| $50,000 to $54,999 | 68 (7.9%) | 66 (9.3%) |
| $55,000 to $64,999 | 99 (11.5%) | 59 (8.4%) |
| $65,000 to $74,999 | 43 (5.0%) | 9 (1.3%) |
| $75,000 to $99,999 | 84 (9.7%) | 50 (7.1%) |
| $100,000+ | 28 (3.2%) | 14 (2.0%) |
| Total | 863 (100.0%) | 707 (100.0%) |
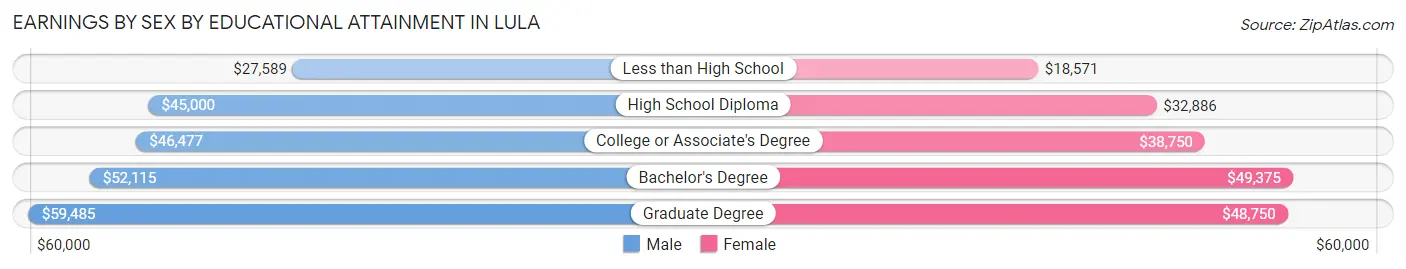
Earnings by Sex by Educational Attainment in Lula
Average earnings in Lula are $45,524 for men and $33,750 for women, a difference of 25.9%. Men with an educational attainment of graduate degree enjoy the highest average annual earnings of $59,485, while those with less than high school education earn the least with $27,589. Women with an educational attainment of bachelor's degree earn the most with the average annual earnings of $49,375, while those with less than high school education have the smallest earnings of $18,571.
| Educational Attainment | Male Income | Female Income |
| Less than High School | $27,589 | $18,571 |
| High School Diploma | $45,000 | $32,886 |
| College or Associate's Degree | $46,477 | $38,750 |
| Bachelor's Degree | $52,115 | $49,375 |
| Graduate Degree | $59,485 | $48,750 |
| Total | $45,524 | $33,750 |
Family Income in Lula
Family Income Brackets in Lula
According to the Lula family income data, there are 165 families falling into the $100,000 to $149,999 income range, which is the most common income bracket and makes up 22.7% of all families. Conversely, the $200,000+ income bracket is the least frequent group with only 6 families (0.8%) belonging to this category.
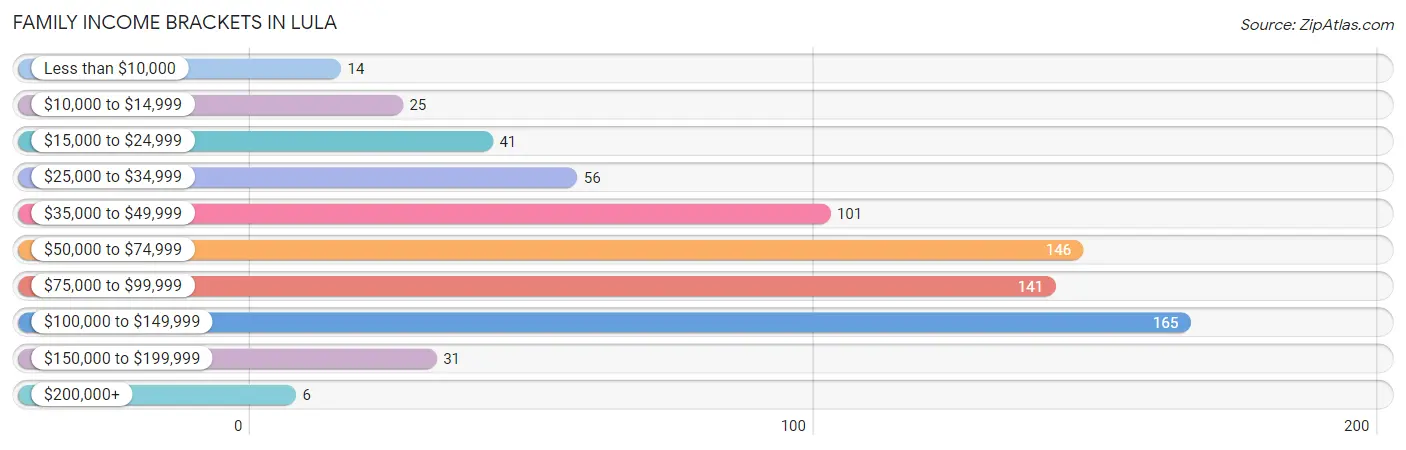
| Income Bracket | # Families | % Families |
| Less than $10,000 | 14 | 1.9% |
| $10,000 to $14,999 | 25 | 3.4% |
| $15,000 to $24,999 | 41 | 5.6% |
| $25,000 to $34,999 | 56 | 7.7% |
| $35,000 to $49,999 | 101 | 13.9% |
| $50,000 to $74,999 | 146 | 20.1% |
| $75,000 to $99,999 | 141 | 19.4% |
| $100,000 to $149,999 | 165 | 22.7% |
| $150,000 to $199,999 | 31 | 4.3% |
| $200,000+ | 6 | 0.8% |
Family Income by Famaliy Size in Lula
5-person families (70 | 9.6%) account for the highest median family income in Lula with $120,217 per family, while 2-person families (302 | 41.6%) have the highest median income of $30,080 per family member.
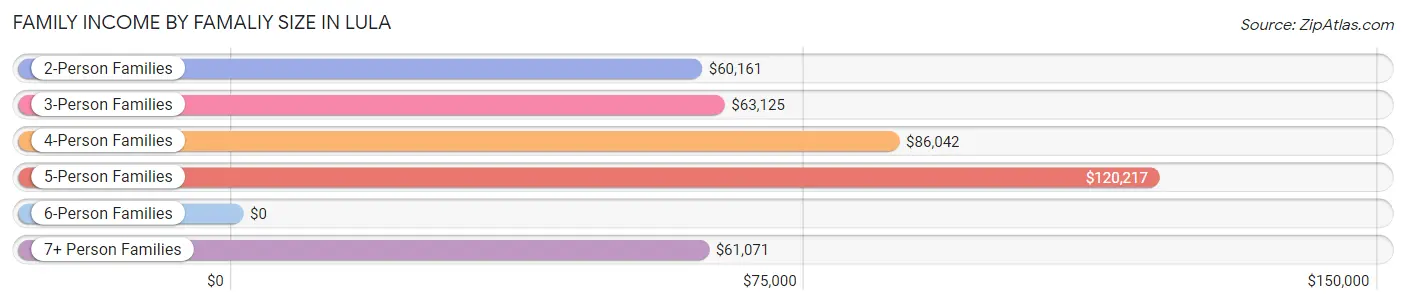
| Income Bracket | # Families | Median Income |
| 2-Person Families | 302 (41.6%) | $60,161 |
| 3-Person Families | 185 (25.5%) | $63,125 |
| 4-Person Families | 137 (18.9%) | $86,042 |
| 5-Person Families | 70 (9.6%) | $120,217 |
| 6-Person Families | 14 (1.9%) | $0 |
| 7+ Person Families | 18 (2.5%) | $61,071 |
| Total | 726 (100.0%) | $68,704 |
Family Income by Number of Earners in Lula
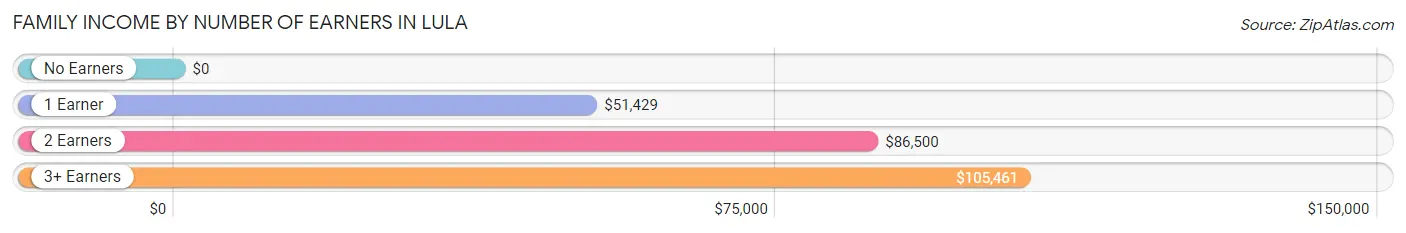
| Number of Earners | # Families | Median Income |
| No Earners | 65 (8.9%) | $0 |
| 1 Earner | 244 (33.6%) | $51,429 |
| 2 Earners | 332 (45.7%) | $86,500 |
| 3+ Earners | 85 (11.7%) | $105,461 |
| Total | 726 (100.0%) | $68,704 |
Household Income in Lula
Household Income Brackets in Lula
With 213 households falling in the category, the $50,000 to $74,999 income range is the most frequent in Lula, accounting for 20.3% of all households. In contrast, only 8 households (0.8%) fall into the $10,000 to $14,999 income bracket, making it the least populous group.
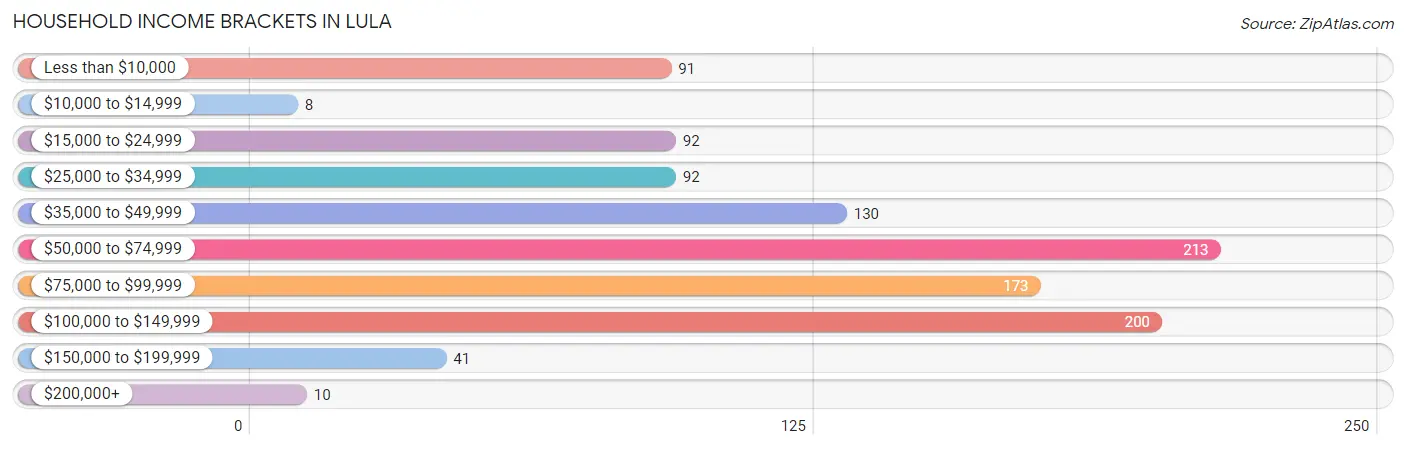
| Income Bracket | # Households | % Households |
| Less than $10,000 | 91 | 8.7% |
| $10,000 to $14,999 | 8 | 0.8% |
| $15,000 to $24,999 | 92 | 8.8% |
| $25,000 to $34,999 | 92 | 8.8% |
| $35,000 to $49,999 | 130 | 12.4% |
| $50,000 to $74,999 | 213 | 20.3% |
| $75,000 to $99,999 | 173 | 16.5% |
| $100,000 to $149,999 | 200 | 19.0% |
| $150,000 to $199,999 | 41 | 3.9% |
| $200,000+ | 10 | 1.0% |
Household Income by Householder Age in Lula
The median household income in Lula is $60,174, with the highest median household income of $72,917 found in the 25 to 44 years age bracket for the primary householder. A total of 410 households (39.1%) fall into this category. Meanwhile, the 15 to 24 years age bracket for the primary householder has the lowest median household income of $0, with 43 households (4.1%) in this group.
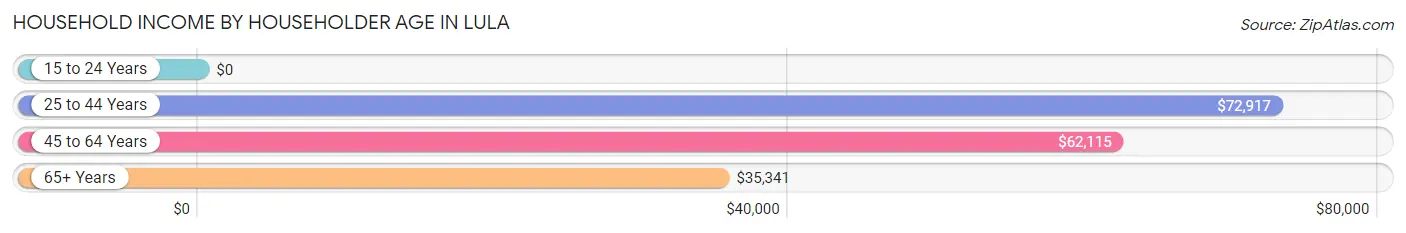
| Income Bracket | # Households | Median Income |
| 15 to 24 Years | 43 (4.1%) | $0 |
| 25 to 44 Years | 410 (39.1%) | $72,917 |
| 45 to 64 Years | 390 (37.1%) | $62,115 |
| 65+ Years | 207 (19.7%) | $35,341 |
| Total | 1,050 (100.0%) | $60,174 |
Poverty in Lula
Income Below Poverty by Sex and Age in Lula
With 13.5% poverty level for males and 17.3% for females among the residents of Lula, 15 year old males and 16 and 17 year old females are the most vulnerable to poverty, with 16 males (43.2%) and 18 females (52.9%) in their respective age groups living below the poverty level.
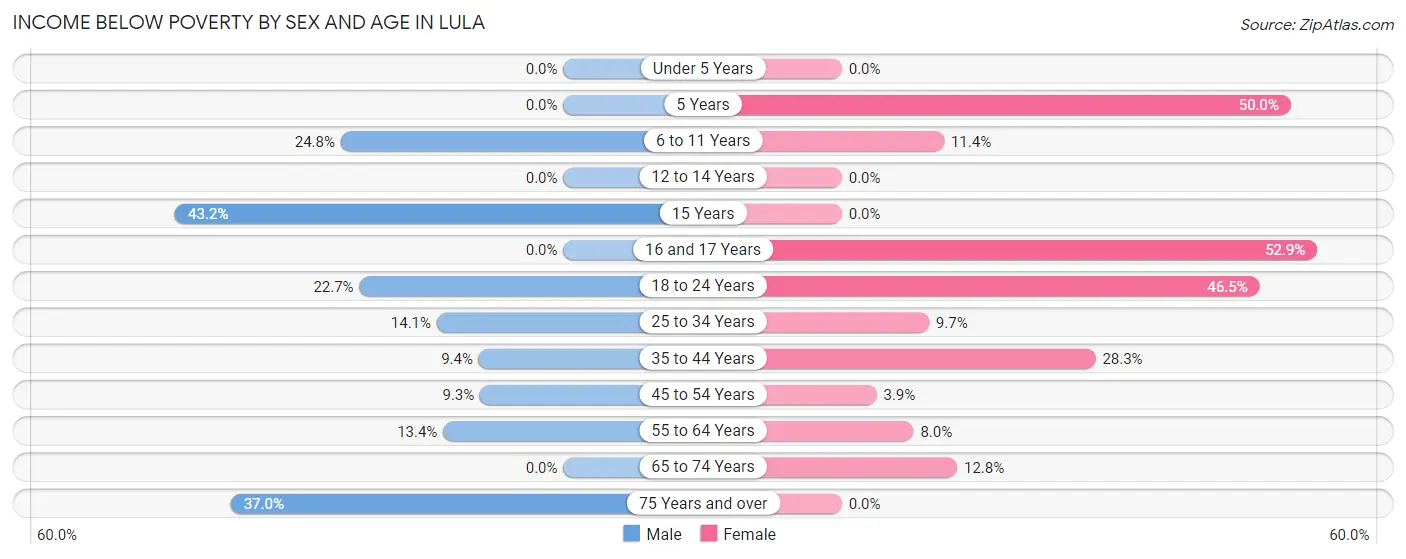
| Age Bracket | Male | Female |
| Under 5 Years | 0 (0.0%) | 0 (0.0%) |
| 5 Years | 0 (0.0%) | 6 (50.0%) |
| 6 to 11 Years | 29 (24.8%) | 14 (11.4%) |
| 12 to 14 Years | 0 (0.0%) | 0 (0.0%) |
| 15 Years | 16 (43.2%) | 0 (0.0%) |
| 16 and 17 Years | 0 (0.0%) | 18 (52.9%) |
| 18 to 24 Years | 47 (22.7%) | 67 (46.5%) |
| 25 to 34 Years | 31 (14.1%) | 13 (9.7%) |
| 35 to 44 Years | 18 (9.4%) | 100 (28.2%) |
| 45 to 54 Years | 19 (9.3%) | 7 (3.9%) |
| 55 to 64 Years | 21 (13.4%) | 15 (8.0%) |
| 65 to 74 Years | 0 (0.0%) | 14 (12.8%) |
| 75 Years and over | 10 (37.0%) | 0 (0.0%) |
| Total | 191 (13.5%) | 254 (17.3%) |
Income Above Poverty by Sex and Age in Lula
According to the poverty statistics in Lula, males aged under 5 years and females aged under 5 years are the age groups that are most secure financially, with 100.0% of males and 100.0% of females in these age groups living above the poverty line.
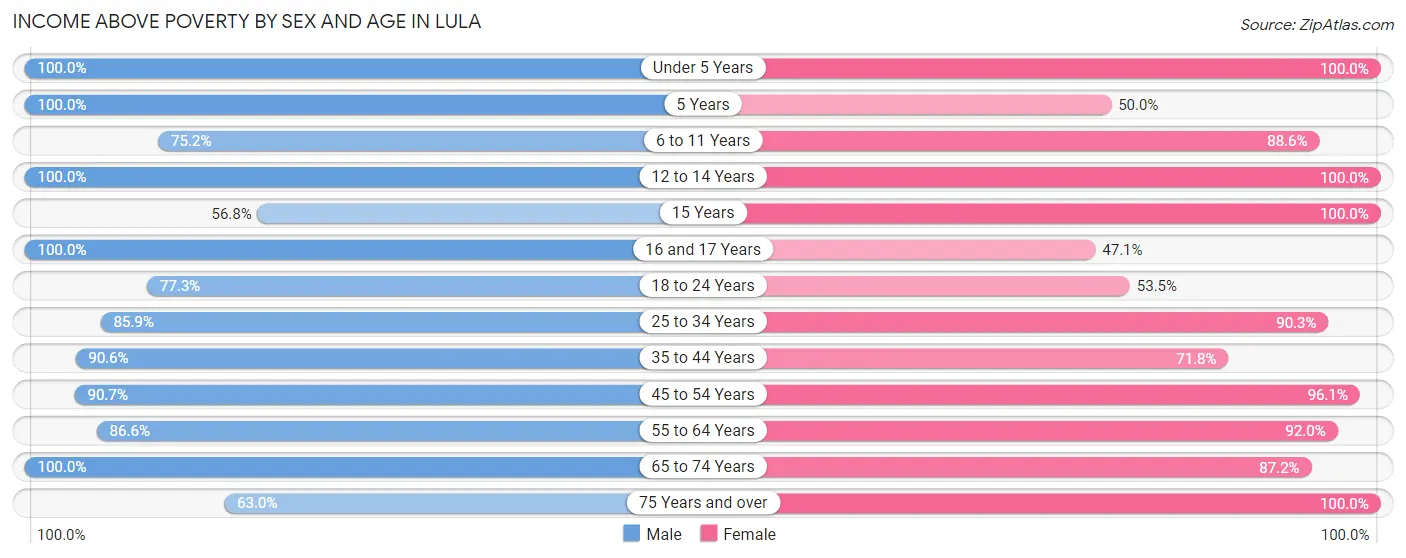
| Age Bracket | Male | Female |
| Under 5 Years | 39 (100.0%) | 31 (100.0%) |
| 5 Years | 12 (100.0%) | 6 (50.0%) |
| 6 to 11 Years | 88 (75.2%) | 109 (88.6%) |
| 12 to 14 Years | 86 (100.0%) | 61 (100.0%) |
| 15 Years | 21 (56.8%) | 19 (100.0%) |
| 16 and 17 Years | 41 (100.0%) | 16 (47.1%) |
| 18 to 24 Years | 160 (77.3%) | 77 (53.5%) |
| 25 to 34 Years | 189 (85.9%) | 121 (90.3%) |
| 35 to 44 Years | 173 (90.6%) | 254 (71.8%) |
| 45 to 54 Years | 186 (90.7%) | 174 (96.1%) |
| 55 to 64 Years | 136 (86.6%) | 173 (92.0%) |
| 65 to 74 Years | 72 (100.0%) | 95 (87.2%) |
| 75 Years and over | 17 (63.0%) | 74 (100.0%) |
| Total | 1,220 (86.5%) | 1,210 (82.7%) |
Income Below Poverty Among Married-Couple Families in Lula
The poverty statistics for married-couple families in Lula show that 5.4% or 25 of the total 462 families live below the poverty line. Families with no children have the highest poverty rate of 7.9%, comprising of 17 families. On the other hand, families with 3 or 4 children have the lowest poverty rate of 0.0%, which includes 0 families.
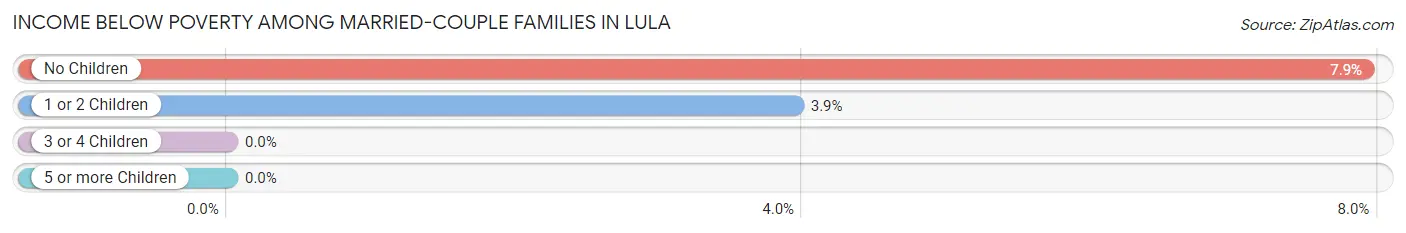
| Children | Above Poverty | Below Poverty |
| No Children | 198 (92.1%) | 17 (7.9%) |
| 1 or 2 Children | 195 (96.1%) | 8 (3.9%) |
| 3 or 4 Children | 44 (100.0%) | 0 (0.0%) |
| 5 or more Children | 0 (0.0%) | 0 (0.0%) |
| Total | 437 (94.6%) | 25 (5.4%) |
Income Below Poverty Among Single-Parent Households in Lula
According to the poverty data in Lula, 5.6% or 5 single-father households and 25.7% or 45 single-mother households are living below the poverty line. Among single-father households, those with 3 or 4 children have the highest poverty rate, with 5 households (100.0%) experiencing poverty. Likewise, among single-mother households, those with 1 or 2 children have the highest poverty rate, with 38 households (47.5%) falling below the poverty line.
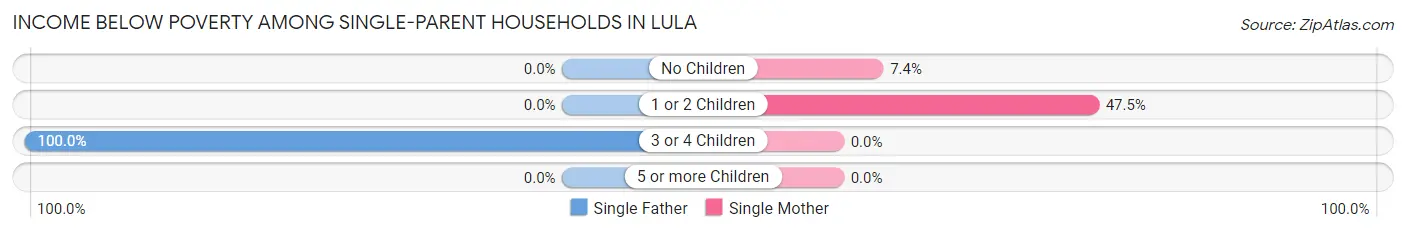
| Children | Single Father | Single Mother |
| No Children | 0 (0.0%) | 7 (7.4%) |
| 1 or 2 Children | 0 (0.0%) | 38 (47.5%) |
| 3 or 4 Children | 5 (100.0%) | 0 (0.0%) |
| 5 or more Children | 0 (0.0%) | 0 (0.0%) |
| Total | 5 (5.6%) | 45 (25.7%) |
Income Below Poverty Among Married-Couple vs Single-Parent Households in Lula
The poverty data for Lula shows that 25 of the married-couple family households (5.4%) and 50 of the single-parent households (18.9%) are living below the poverty level. Within the married-couple family households, those with no children have the highest poverty rate, with 17 households (7.9%) falling below the poverty line. Among the single-parent households, those with 3 or 4 children have the highest poverty rate, with 5 household (100.0%) living below poverty.
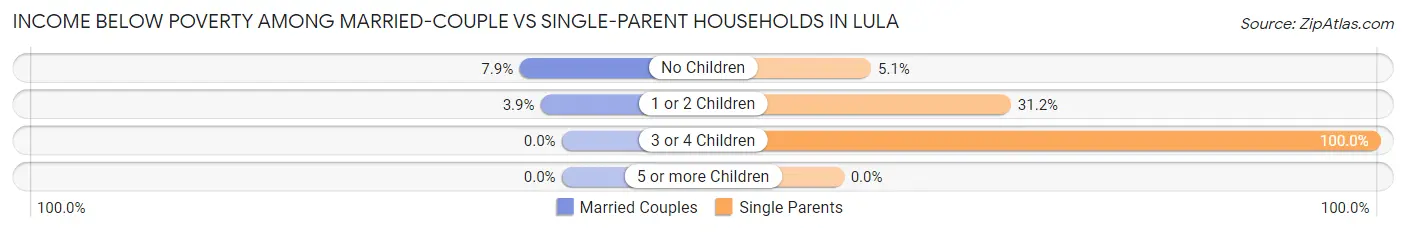
| Children | Married-Couple Families | Single-Parent Households |
| No Children | 17 (7.9%) | 7 (5.1%) |
| 1 or 2 Children | 8 (3.9%) | 38 (31.1%) |
| 3 or 4 Children | 0 (0.0%) | 5 (100.0%) |
| 5 or more Children | 0 (0.0%) | 0 (0.0%) |
| Total | 25 (5.4%) | 50 (18.9%) |
Race in Lula
The most populous races in Lula are White / Caucasian (2,320 | 80.6%), Two or more Races (328 | 11.4%), and Hispanic or Latino (302 | 10.5%).
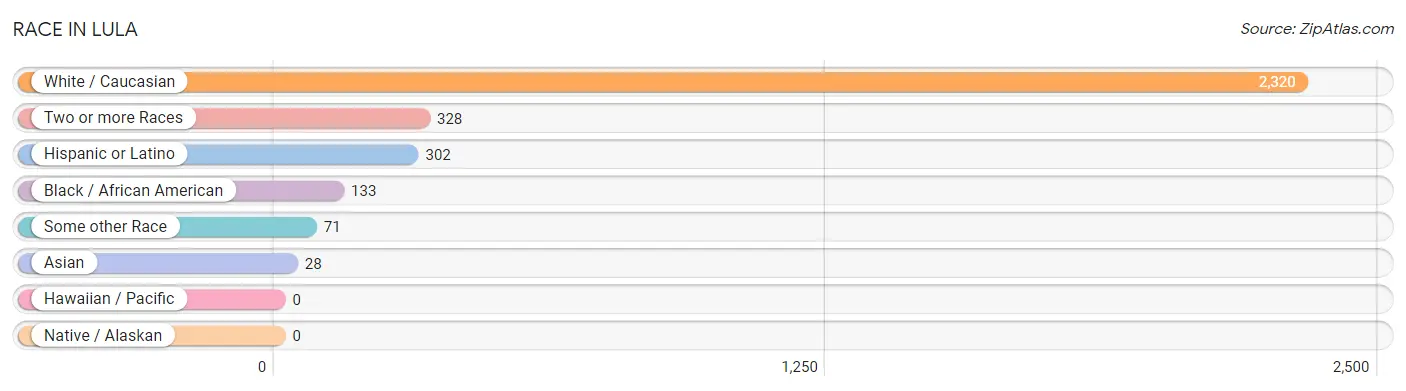
| Race | # Population | % Population |
| Asian | 28 | 1.0% |
| Black / African American | 133 | 4.6% |
| Hawaiian / Pacific | 0 | 0.0% |
| Hispanic or Latino | 302 | 10.5% |
| Native / Alaskan | 0 | 0.0% |
| White / Caucasian | 2,320 | 80.6% |
| Two or more Races | 328 | 11.4% |
| Some other Race | 71 | 2.5% |
| Total | 2,880 | 100.0% |
Ancestry in Lula
The most populous ancestries reported in Lula are American (448 | 15.6%), German (226 | 7.9%), Irish (221 | 7.7%), English (216 | 7.5%), and Mexican (168 | 5.8%), together accounting for 44.4% of all Lula residents.
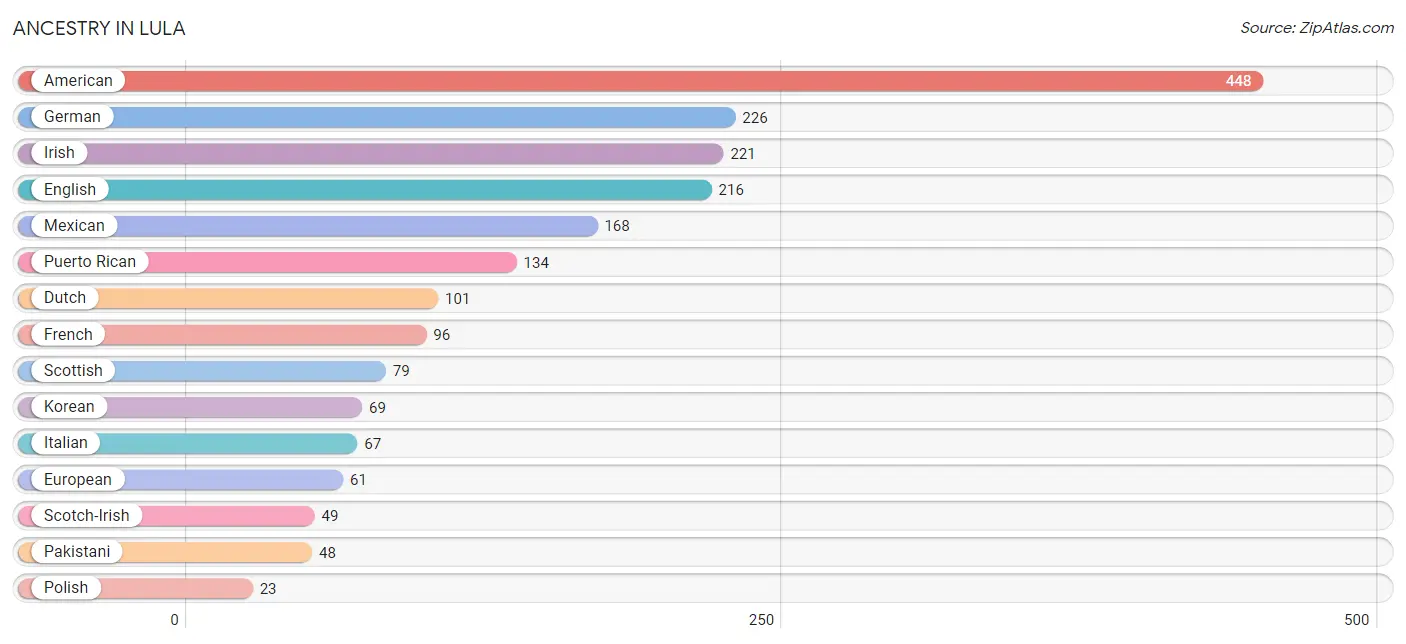
| Ancestry | # Population | % Population |
| American | 448 | 15.6% |
| British | 12 | 0.4% |
| Canadian | 8 | 0.3% |
| Cherokee | 6 | 0.2% |
| Czechoslovakian | 6 | 0.2% |
| Dutch | 101 | 3.5% |
| Eastern European | 5 | 0.2% |
| English | 216 | 7.5% |
| European | 61 | 2.1% |
| French | 96 | 3.3% |
| French Canadian | 15 | 0.5% |
| German | 226 | 7.9% |
| Hungarian | 7 | 0.2% |
| Irish | 221 | 7.7% |
| Italian | 67 | 2.3% |
| Korean | 69 | 2.4% |
| Mexican | 168 | 5.8% |
| Northern European | 4 | 0.1% |
| Pakistani | 48 | 1.7% |
| Polish | 23 | 0.8% |
| Puerto Rican | 134 | 4.6% |
| Scandinavian | 3 | 0.1% |
| Scotch-Irish | 49 | 1.7% |
| Scottish | 79 | 2.7% |
| Turkish | 9 | 0.3% |
| Ukrainian | 11 | 0.4% |
| Welsh | 6 | 0.2% | View All 27 Rows |
Immigrants in Lula
The most numerous immigrant groups reported in Lula came from Asia (33 | 1.1%), Central America (23 | 0.8%), Latin America (23 | 0.8%), Mexico (23 | 0.8%), and Philippines (23 | 0.8%), together accounting for 4.4% of all Lula residents.
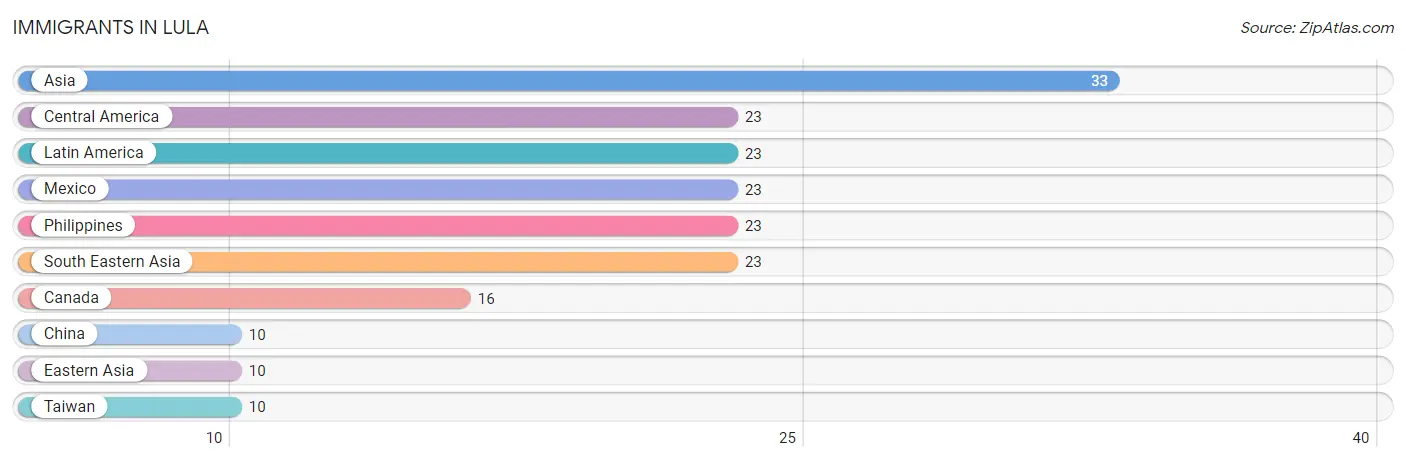
| Immigration Origin | # Population | % Population |
| Asia | 33 | 1.1% |
| Canada | 16 | 0.6% |
| Central America | 23 | 0.8% |
| China | 10 | 0.4% |
| Eastern Asia | 10 | 0.4% |
| Latin America | 23 | 0.8% |
| Mexico | 23 | 0.8% |
| Philippines | 23 | 0.8% |
| South Eastern Asia | 23 | 0.8% |
| Taiwan | 10 | 0.4% | View All 10 Rows |
Sex and Age in Lula
Sex and Age in Lula
The most populous age groups in Lula are 30 to 34 Years (164 | 11.6%) for men and 40 to 44 Years (196 | 13.4%) for women.
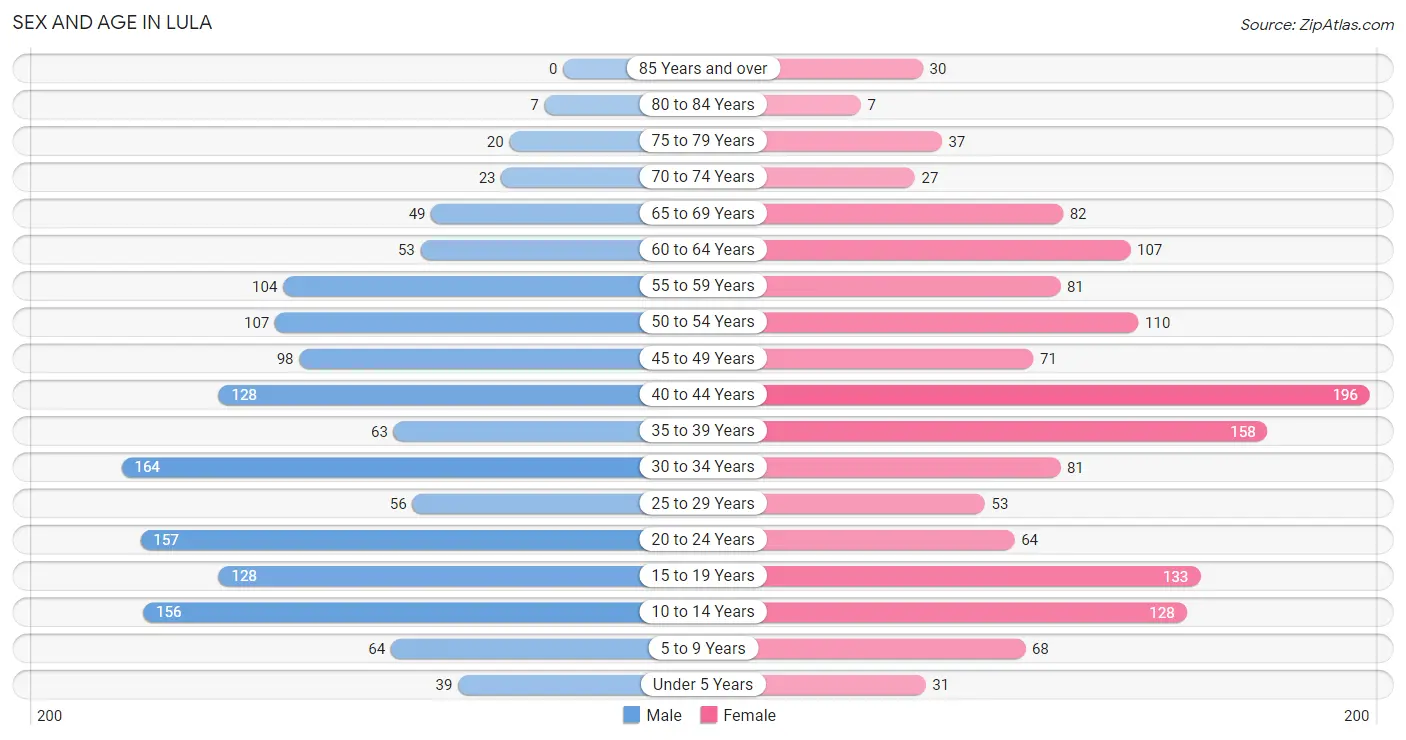
| Age Bracket | Male | Female |
| Under 5 Years | 39 (2.8%) | 31 (2.1%) |
| 5 to 9 Years | 64 (4.5%) | 68 (4.6%) |
| 10 to 14 Years | 156 (11.0%) | 128 (8.7%) |
| 15 to 19 Years | 128 (9.0%) | 133 (9.1%) |
| 20 to 24 Years | 157 (11.1%) | 64 (4.4%) |
| 25 to 29 Years | 56 (4.0%) | 53 (3.6%) |
| 30 to 34 Years | 164 (11.6%) | 81 (5.5%) |
| 35 to 39 Years | 63 (4.4%) | 158 (10.8%) |
| 40 to 44 Years | 128 (9.0%) | 196 (13.4%) |
| 45 to 49 Years | 98 (6.9%) | 71 (4.9%) |
| 50 to 54 Years | 107 (7.6%) | 110 (7.5%) |
| 55 to 59 Years | 104 (7.3%) | 81 (5.5%) |
| 60 to 64 Years | 53 (3.7%) | 107 (7.3%) |
| 65 to 69 Years | 49 (3.5%) | 82 (5.6%) |
| 70 to 74 Years | 23 (1.6%) | 27 (1.8%) |
| 75 to 79 Years | 20 (1.4%) | 37 (2.5%) |
| 80 to 84 Years | 7 (0.5%) | 7 (0.5%) |
| 85 Years and over | 0 (0.0%) | 30 (2.1%) |
| Total | 1,416 (100.0%) | 1,464 (100.0%) |
Families and Households in Lula
Median Family Size in Lula
The median family size in Lula is 3.24 persons per family, with married-couple families (462 | 63.6%) accounting for the largest median family size of 3.52 persons per family. On the other hand, single male/father families (89 | 12.3%) represent the smallest median family size with 2.28 persons per family.
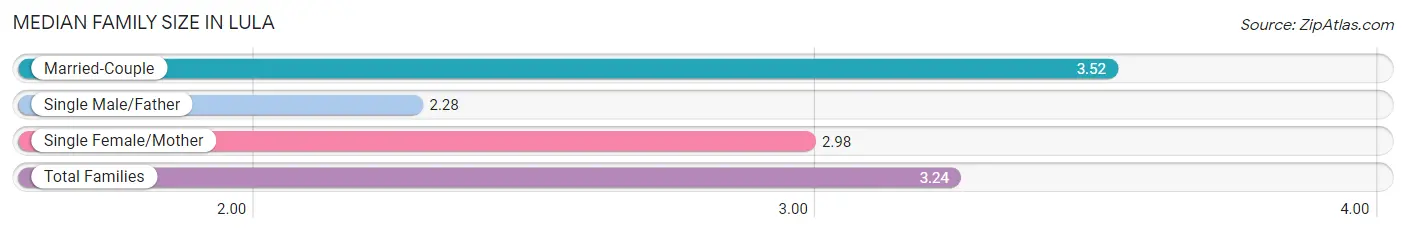
| Family Type | # Families | Family Size |
| Married-Couple | 462 (63.6%) | 3.52 |
| Single Male/Father | 89 (12.3%) | 2.28 |
| Single Female/Mother | 175 (24.1%) | 2.98 |
| Total Families | 726 (100.0%) | 3.24 |
Median Household Size in Lula
The median household size in Lula is 2.74 persons per household, with married-couple households (462 | 44.0%) accounting for the largest median household size of 3.57 persons per household. non-family households (324 | 30.9%) represent the smallest median household size with 1.14 persons per household.
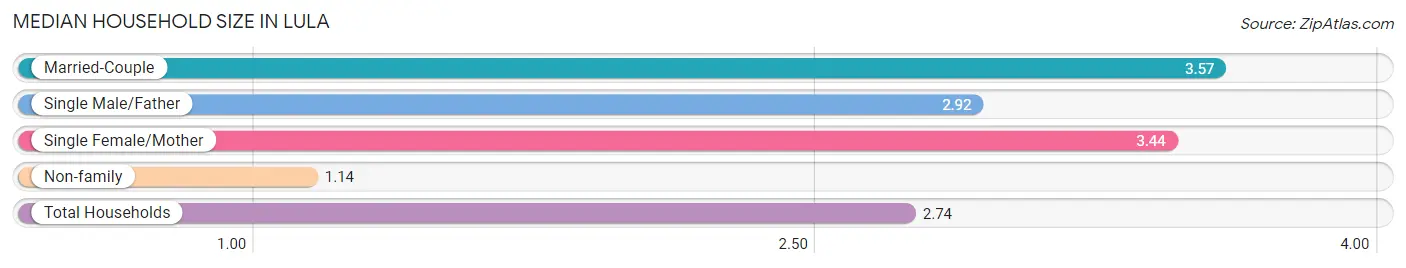
| Household Type | # Households | Household Size |
| Married-Couple | 462 (44.0%) | 3.57 |
| Single Male/Father | 89 (8.5%) | 2.92 |
| Single Female/Mother | 175 (16.7%) | 3.44 |
| Non-family | 324 (30.9%) | 1.14 |
| Total Households | 1,050 (100.0%) | 2.74 |
Household Size by Marriage Status in Lula
Out of a total of 1,050 households in Lula, 726 (69.1%) are family households, while 324 (30.9%) are nonfamily households. The most numerous type of family households are 2-person households, comprising 258, and the most common type of nonfamily households are 1-person households, comprising 282.
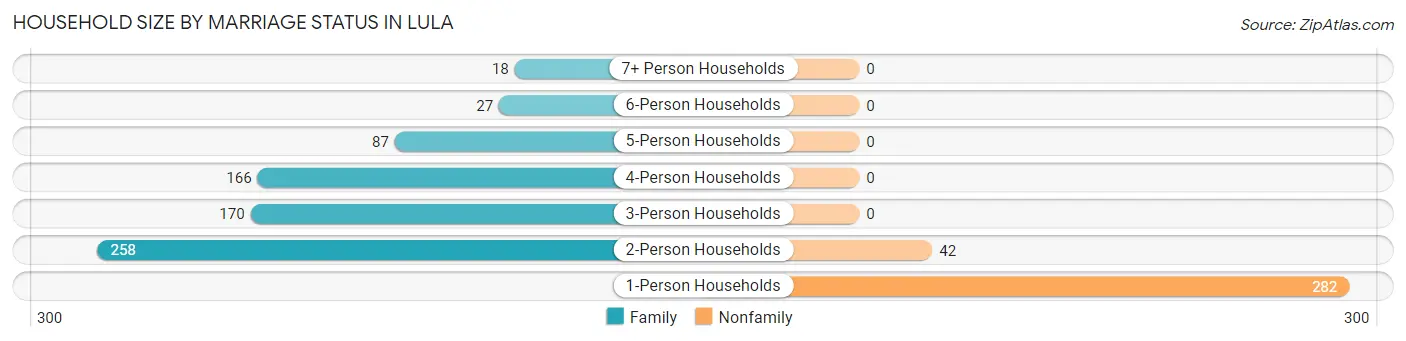
| Household Size | Family Households | Nonfamily Households |
| 1-Person Households | - | 282 (26.9%) |
| 2-Person Households | 258 (24.6%) | 42 (4.0%) |
| 3-Person Households | 170 (16.2%) | 0 (0.0%) |
| 4-Person Households | 166 (15.8%) | 0 (0.0%) |
| 5-Person Households | 87 (8.3%) | 0 (0.0%) |
| 6-Person Households | 27 (2.6%) | 0 (0.0%) |
| 7+ Person Households | 18 (1.7%) | 0 (0.0%) |
| Total | 726 (69.1%) | 324 (30.9%) |
Female Fertility in Lula
Fertility by Age in Lula
Average fertility rate in Lula is 16.0 births per 1,000 women. Women in the age bracket of 20 to 34 years have the highest fertility rate with 56.0 births per 1,000 women. Women in the age bracket of 20 to 34 years acount for 84.6% of all women with births.
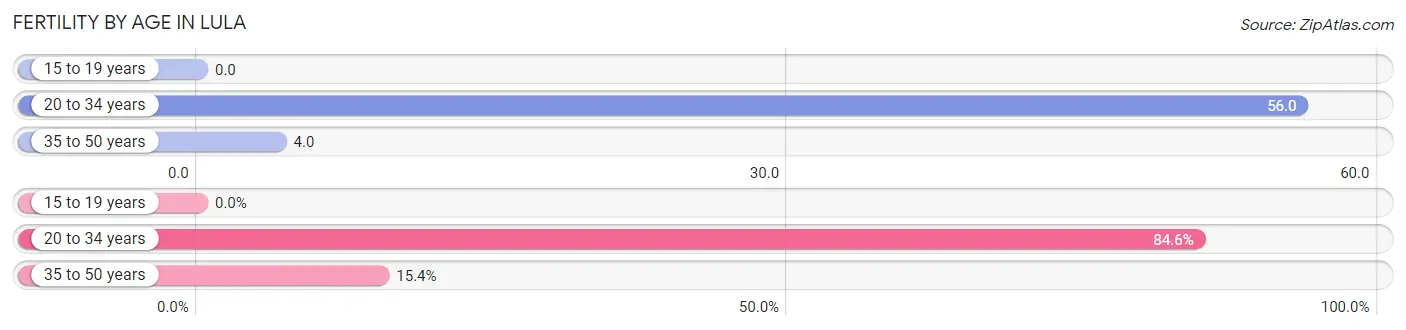
| Age Bracket | Women with Births | Births / 1,000 Women |
| 15 to 19 years | 0 (0.0%) | 0.0 |
| 20 to 34 years | 11 (84.6%) | 56.0 |
| 35 to 50 years | 2 (15.4%) | 4.0 |
| Total | 13 (100.0%) | 16.0 |
Fertility by Age by Marriage Status in Lula
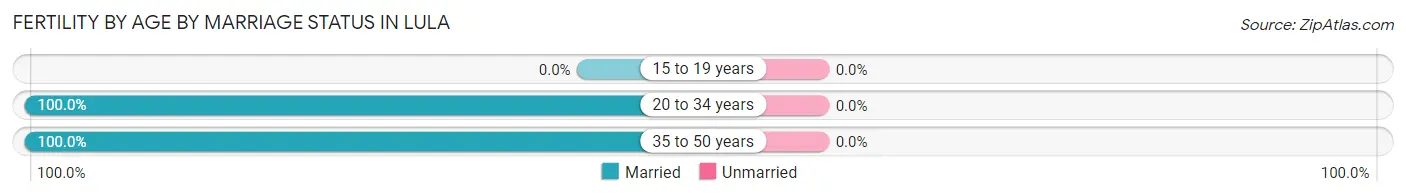
| Age Bracket | Married | Unmarried |
| 15 to 19 years | 0 (0.0%) | 0 (0.0%) |
| 20 to 34 years | 11 (100.0%) | 0 (0.0%) |
| 35 to 50 years | 2 (100.0%) | 0 (0.0%) |
| Total | 13 (100.0%) | 0 (0.0%) |
Fertility by Education in Lula
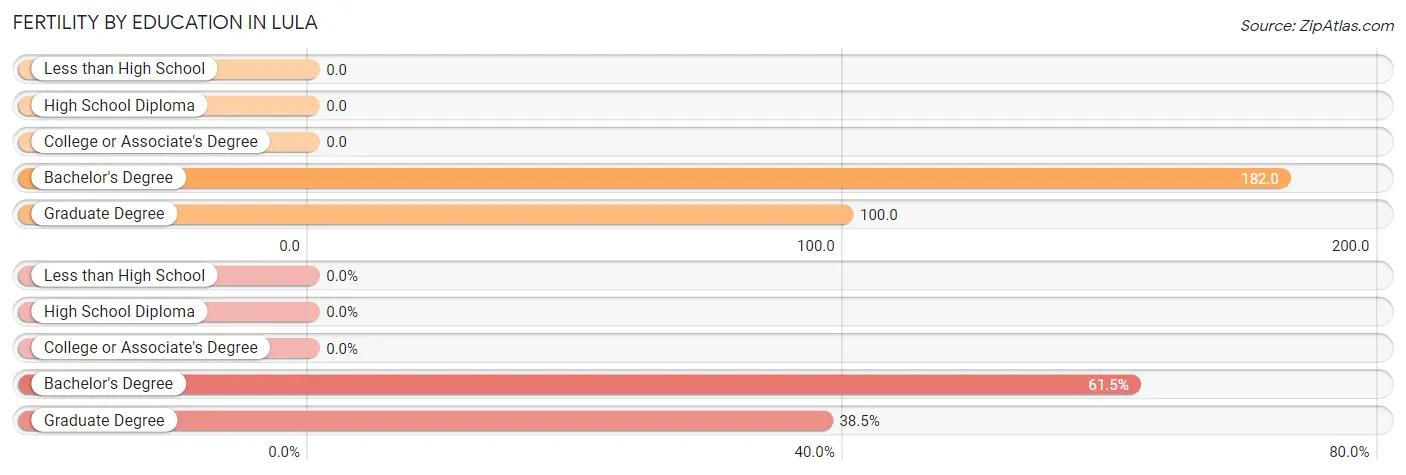
| Educational Attainment | Women with Births | Births / 1,000 Women |
| Less than High School | 0 (0.0%) | 0.0 |
| High School Diploma | 0 (0.0%) | 0.0 |
| College or Associate's Degree | 0 (0.0%) | 0.0 |
| Bachelor's Degree | 8 (61.5%) | 182.0 |
| Graduate Degree | 5 (38.5%) | 100.0 |
| Total | 13 (100.0%) | 16.0 |
Fertility by Education by Marriage Status in Lula
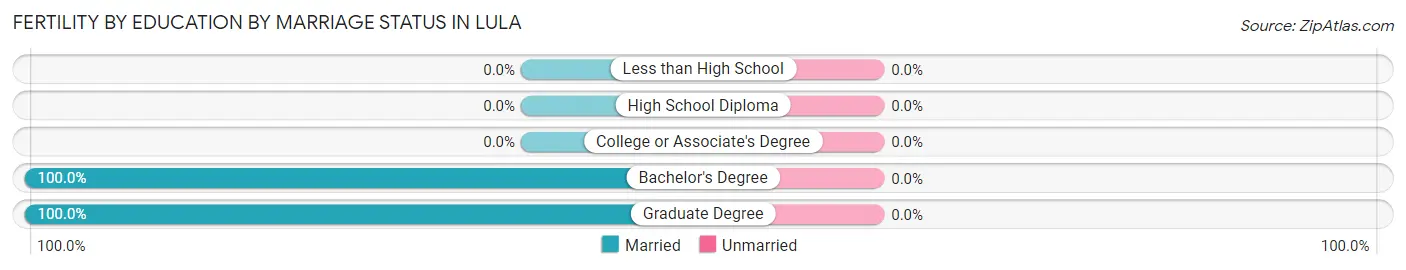
| Educational Attainment | Married | Unmarried |
| Less than High School | 0 (0.0%) | 0 (0.0%) |
| High School Diploma | 0 (0.0%) | 0 (0.0%) |
| College or Associate's Degree | 0 (0.0%) | 0 (0.0%) |
| Bachelor's Degree | 8 (100.0%) | 0 (0.0%) |
| Graduate Degree | 5 (100.0%) | 0 (0.0%) |
| Total | 13 (100.0%) | 0 (0.0%) |
Employment Characteristics in Lula
Employment by Class of Employer in Lula
Among the 1,309 employed individuals in Lula, private company employees (951 | 72.7%), local government employees (111 | 8.5%), and not-for-profit organizations (95 | 7.3%) make up the most common classes of employment.
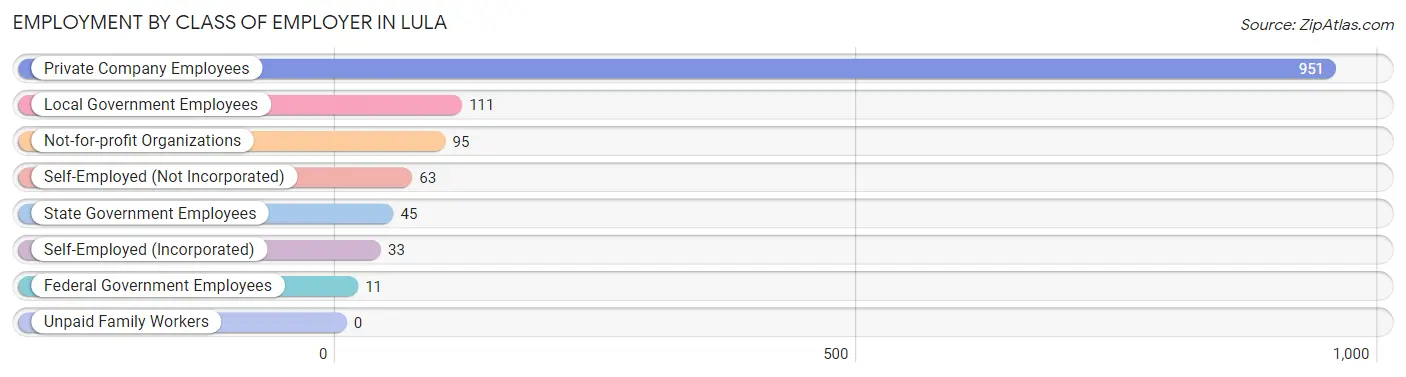
| Employer Class | # Employees | % Employees |
| Private Company Employees | 951 | 72.7% |
| Self-Employed (Incorporated) | 33 | 2.5% |
| Self-Employed (Not Incorporated) | 63 | 4.8% |
| Not-for-profit Organizations | 95 | 7.3% |
| Local Government Employees | 111 | 8.5% |
| State Government Employees | 45 | 3.4% |
| Federal Government Employees | 11 | 0.8% |
| Unpaid Family Workers | 0 | 0.0% |
| Total | 1,309 | 100.0% |
Employment Status by Age in Lula
According to the labor force statistics for Lula, out of the total population over 16 years of age (2,338), 61.2% or 1,431 individuals are in the labor force, with 2.2% or 31 of them unemployed. The age group with the highest labor force participation rate is 30 to 34 years, with 94.3% or 231 individuals in the labor force. Within the labor force, the 30 to 34 years age range has the highest percentage of unemployed individuals, with 10.4% or 24 of them being unemployed.
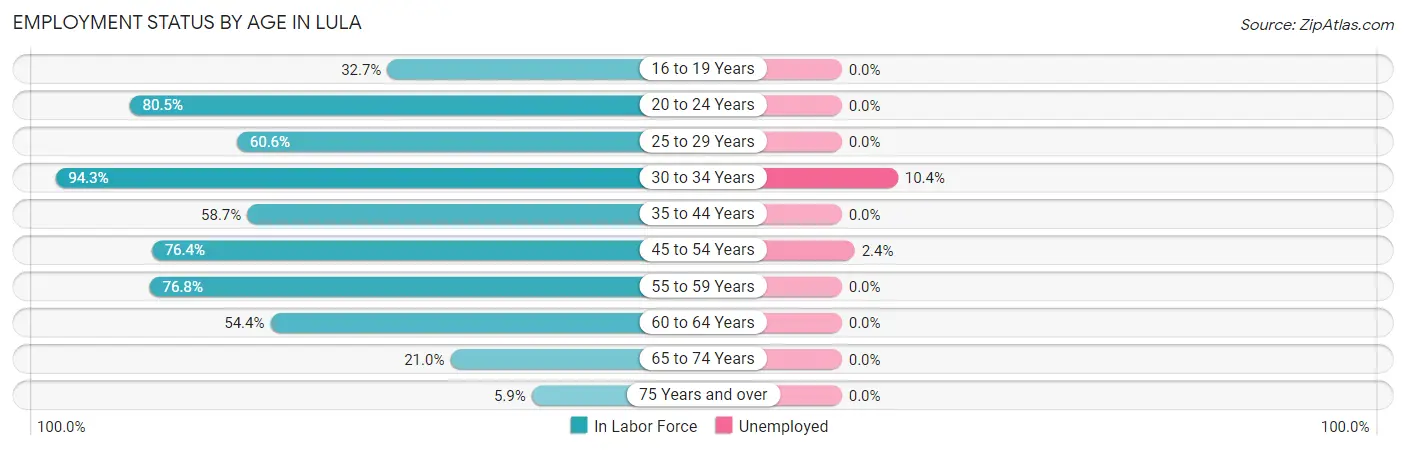
| Age Bracket | In Labor Force | Unemployed |
| 16 to 19 Years | 67 (32.7%) | 0 (0.0%) |
| 20 to 24 Years | 178 (80.5%) | 0 (0.0%) |
| 25 to 29 Years | 66 (60.6%) | 0 (0.0%) |
| 30 to 34 Years | 231 (94.3%) | 24 (10.4%) |
| 35 to 44 Years | 320 (58.7%) | 0 (0.0%) |
| 45 to 54 Years | 295 (76.4%) | 7 (2.4%) |
| 55 to 59 Years | 142 (76.8%) | 0 (0.0%) |
| 60 to 64 Years | 87 (54.4%) | 0 (0.0%) |
| 65 to 74 Years | 38 (21.0%) | 0 (0.0%) |
| 75 Years and over | 6 (5.9%) | 0 (0.0%) |
| Total | 1,431 (61.2%) | 31 (2.2%) |
Employment Status by Educational Attainment in Lula
According to labor force statistics for Lula, 70.0% of individuals (1,141) out of the total population between 25 and 64 years of age (1,630) are in the labor force, with 2.7% or 31 of them being unemployed. The group with the highest labor force participation rate are those with the educational attainment of bachelor's degree or higher, with 92.0% or 230 individuals in the labor force. Within the labor force, individuals with college / associate degree education have the highest percentage of unemployment, with 7.0% or 24 of them being unemployed.
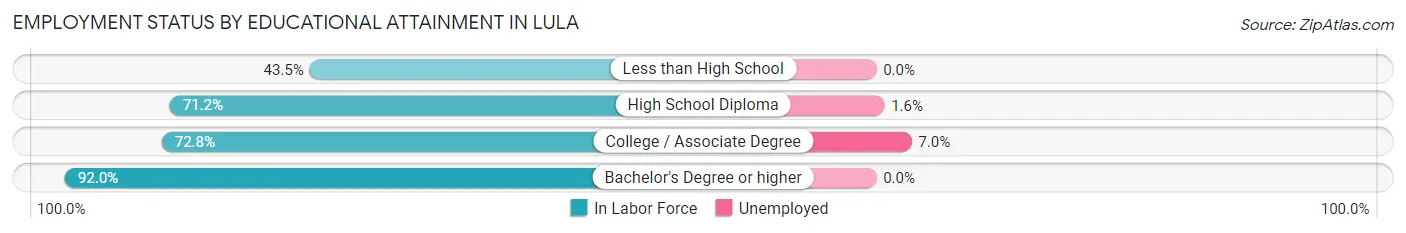
| Educational Attainment | In Labor Force | Unemployed |
| Less than High School | 124 (43.5%) | 0 (0.0%) |
| High School Diploma | 444 (71.2%) | 10 (1.6%) |
| College / Associate Degree | 343 (72.8%) | 33 (7.0%) |
| Bachelor's Degree or higher | 230 (92.0%) | 0 (0.0%) |
| Total | 1,141 (70.0%) | 44 (2.7%) |
Employment Occupations by Sex in Lula
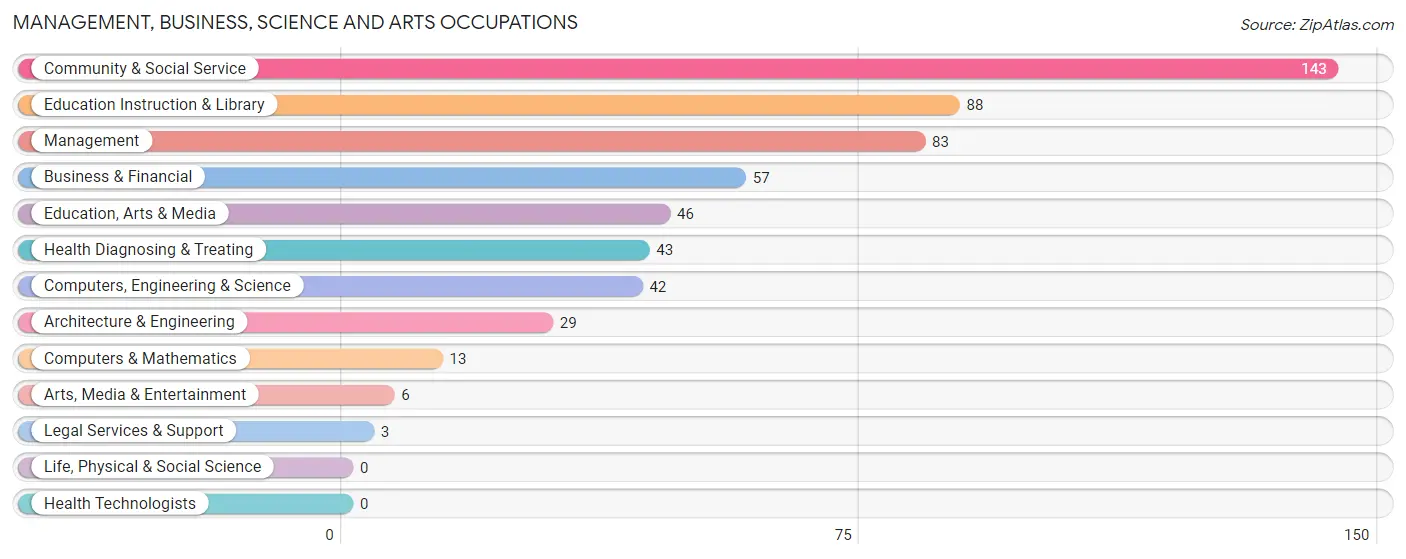
Management, Business, Science and Arts Occupations
The most common Management, Business, Science and Arts occupations in Lula are Community & Social Service (143 | 10.3%), Education Instruction & Library (88 | 6.3%), Management (83 | 6.0%), Business & Financial (57 | 4.1%), and Education, Arts & Media (46 | 3.3%).
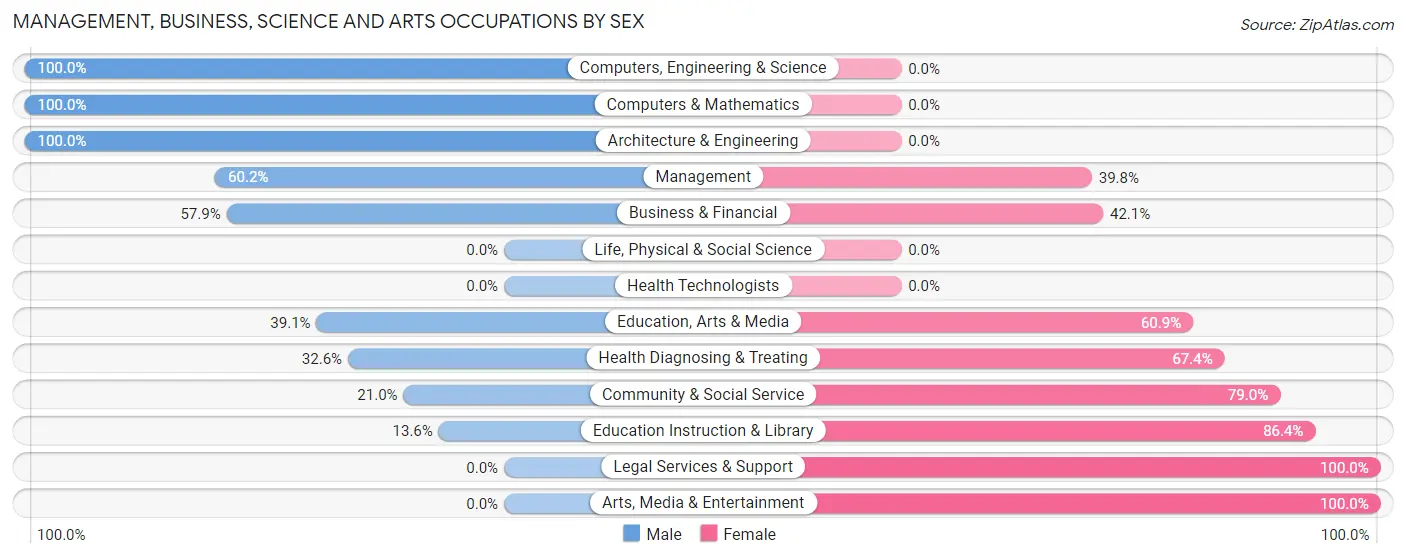
Management, Business, Science and Arts Occupations by Sex
Within the Management, Business, Science and Arts occupations in Lula, the most male-oriented occupations are Computers, Engineering & Science (100.0%), Computers & Mathematics (100.0%), and Architecture & Engineering (100.0%), while the most female-oriented occupations are Legal Services & Support (100.0%), Arts, Media & Entertainment (100.0%), and Education Instruction & Library (86.4%).
| Occupation | Male | Female |
| Management | 50 (60.2%) | 33 (39.8%) |
| Business & Financial | 33 (57.9%) | 24 (42.1%) |
| Computers, Engineering & Science | 42 (100.0%) | 0 (0.0%) |
| Computers & Mathematics | 13 (100.0%) | 0 (0.0%) |
| Architecture & Engineering | 29 (100.0%) | 0 (0.0%) |
| Life, Physical & Social Science | 0 (0.0%) | 0 (0.0%) |
| Community & Social Service | 30 (21.0%) | 113 (79.0%) |
| Education, Arts & Media | 18 (39.1%) | 28 (60.9%) |
| Legal Services & Support | 0 (0.0%) | 3 (100.0%) |
| Education Instruction & Library | 12 (13.6%) | 76 (86.4%) |
| Arts, Media & Entertainment | 0 (0.0%) | 6 (100.0%) |
| Health Diagnosing & Treating | 14 (32.6%) | 29 (67.4%) |
| Health Technologists | 0 (0.0%) | 0 (0.0%) |
| Total (Category) | 169 (45.9%) | 199 (54.1%) |
| Total (Overall) | 766 (55.0%) | 627 (45.0%) |
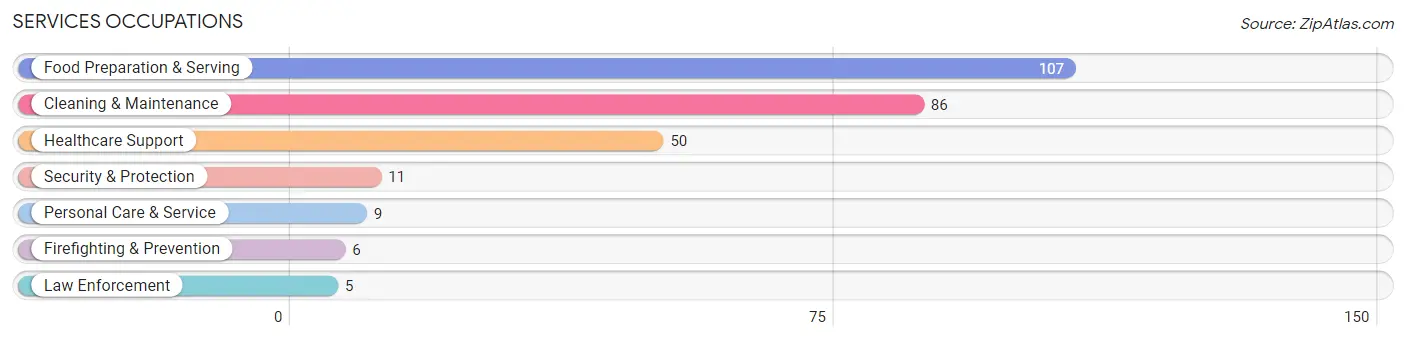
Services Occupations
The most common Services occupations in Lula are Food Preparation & Serving (107 | 7.7%), Cleaning & Maintenance (86 | 6.2%), Healthcare Support (50 | 3.6%), Security & Protection (11 | 0.8%), and Personal Care & Service (9 | 0.6%).
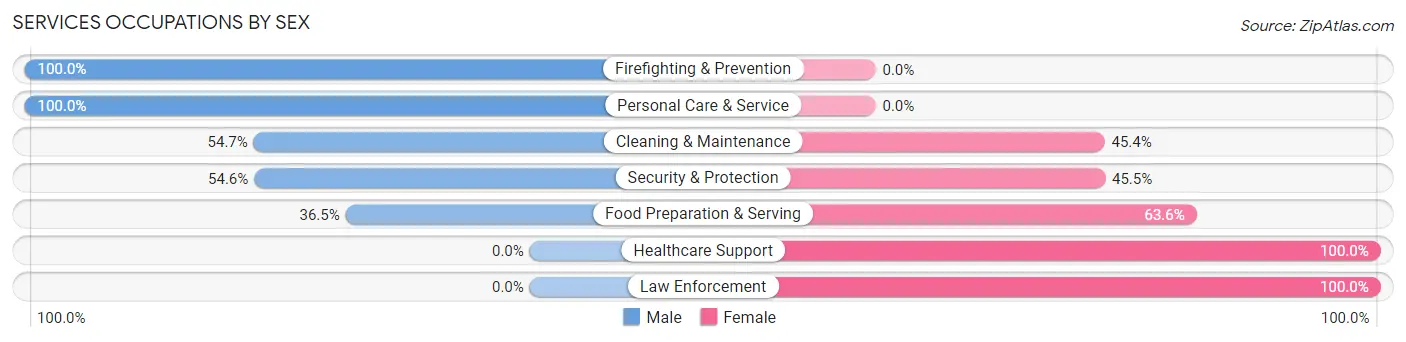
Services Occupations by Sex
Within the Services occupations in Lula, the most male-oriented occupations are Firefighting & Prevention (100.0%), Personal Care & Service (100.0%), and Cleaning & Maintenance (54.6%), while the most female-oriented occupations are Healthcare Support (100.0%), Law Enforcement (100.0%), and Food Preparation & Serving (63.5%).
| Occupation | Male | Female |
| Healthcare Support | 0 (0.0%) | 50 (100.0%) |
| Security & Protection | 6 (54.5%) | 5 (45.5%) |
| Firefighting & Prevention | 6 (100.0%) | 0 (0.0%) |
| Law Enforcement | 0 (0.0%) | 5 (100.0%) |
| Food Preparation & Serving | 39 (36.4%) | 68 (63.5%) |
| Cleaning & Maintenance | 47 (54.6%) | 39 (45.4%) |
| Personal Care & Service | 9 (100.0%) | 0 (0.0%) |
| Total (Category) | 101 (38.4%) | 162 (61.6%) |
| Total (Overall) | 766 (55.0%) | 627 (45.0%) |
Sales and Office Occupations
The most common Sales and Office occupations in Lula are Sales & Related (166 | 11.9%), and Office & Administration (73 | 5.2%).

Sales and Office Occupations by Sex

| Occupation | Male | Female |
| Sales & Related | 76 (45.8%) | 90 (54.2%) |
| Office & Administration | 11 (15.1%) | 62 (84.9%) |
| Total (Category) | 87 (36.4%) | 152 (63.6%) |
| Total (Overall) | 766 (55.0%) | 627 (45.0%) |
Natural Resources, Construction and Maintenance Occupations
The most common Natural Resources, Construction and Maintenance occupations in Lula are Installation, Maintenance & Repair (90 | 6.5%), Construction & Extraction (71 | 5.1%), and Farming, Fishing & Forestry (15 | 1.1%).
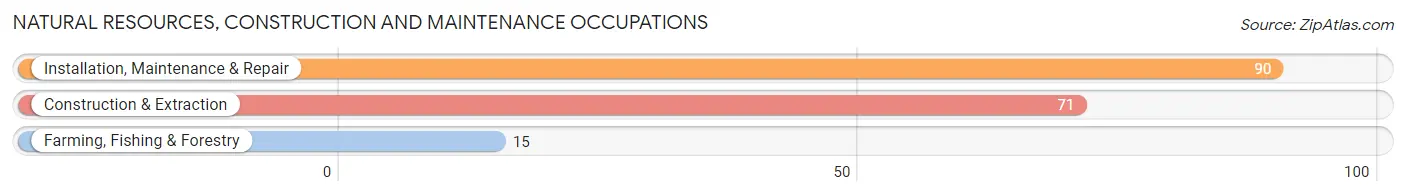
Natural Resources, Construction and Maintenance Occupations by Sex
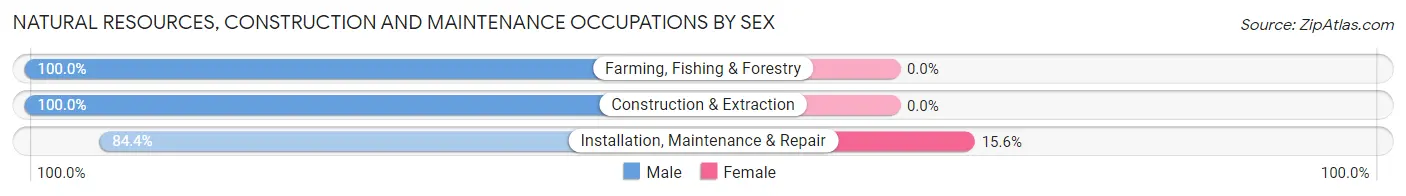
| Occupation | Male | Female |
| Farming, Fishing & Forestry | 15 (100.0%) | 0 (0.0%) |
| Construction & Extraction | 71 (100.0%) | 0 (0.0%) |
| Installation, Maintenance & Repair | 76 (84.4%) | 14 (15.6%) |
| Total (Category) | 162 (92.0%) | 14 (8.0%) |
| Total (Overall) | 766 (55.0%) | 627 (45.0%) |
Production, Transportation and Moving Occupations
The most common Production, Transportation and Moving occupations in Lula are Production (172 | 12.3%), Material Moving (135 | 9.7%), and Transportation (40 | 2.9%).
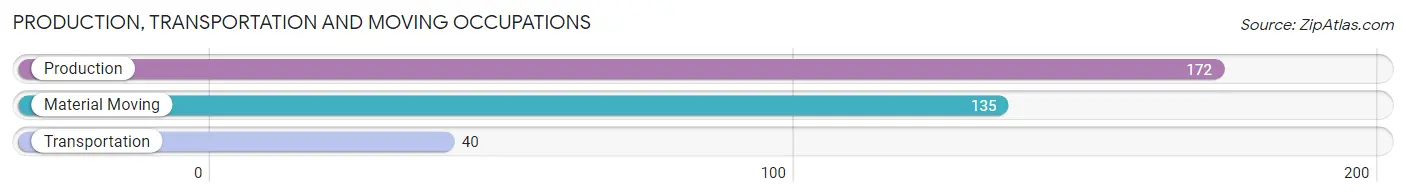
Production, Transportation and Moving Occupations by Sex
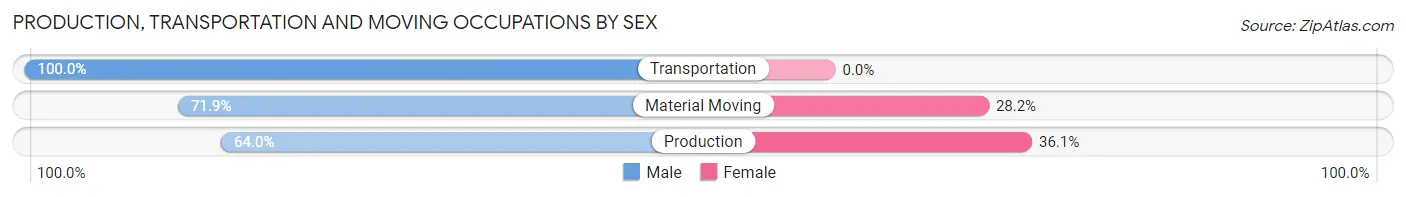
| Occupation | Male | Female |
| Production | 110 (63.9%) | 62 (36.0%) |
| Transportation | 40 (100.0%) | 0 (0.0%) |
| Material Moving | 97 (71.9%) | 38 (28.1%) |
| Total (Category) | 247 (71.2%) | 100 (28.8%) |
| Total (Overall) | 766 (55.0%) | 627 (45.0%) |
Employment Industries by Sex in Lula
Employment Industries in Lula
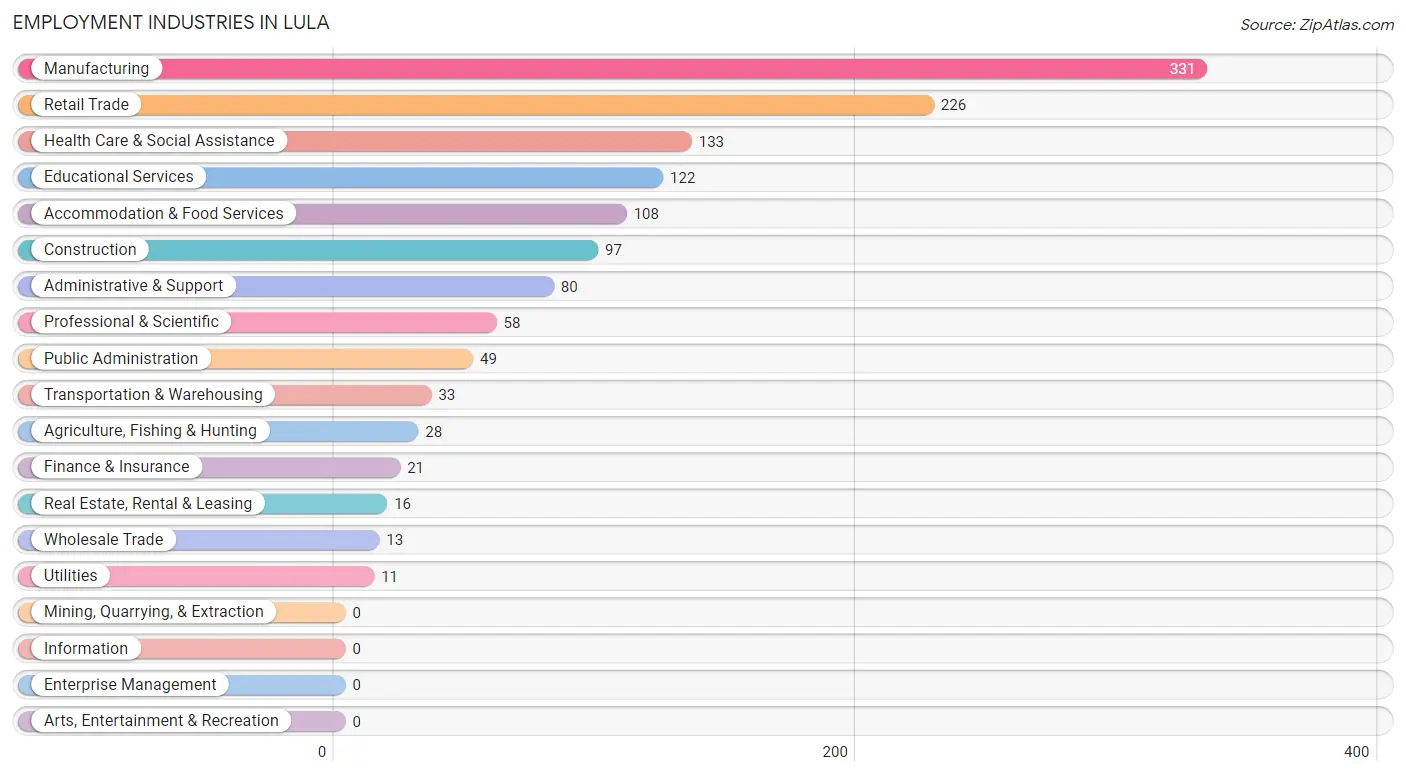
The major employment industries in Lula include Manufacturing (331 | 23.8%), Retail Trade (226 | 16.2%), Health Care & Social Assistance (133 | 9.6%), Educational Services (122 | 8.8%), and Accommodation & Food Services (108 | 7.7%).
Employment Industries by Sex in Lula
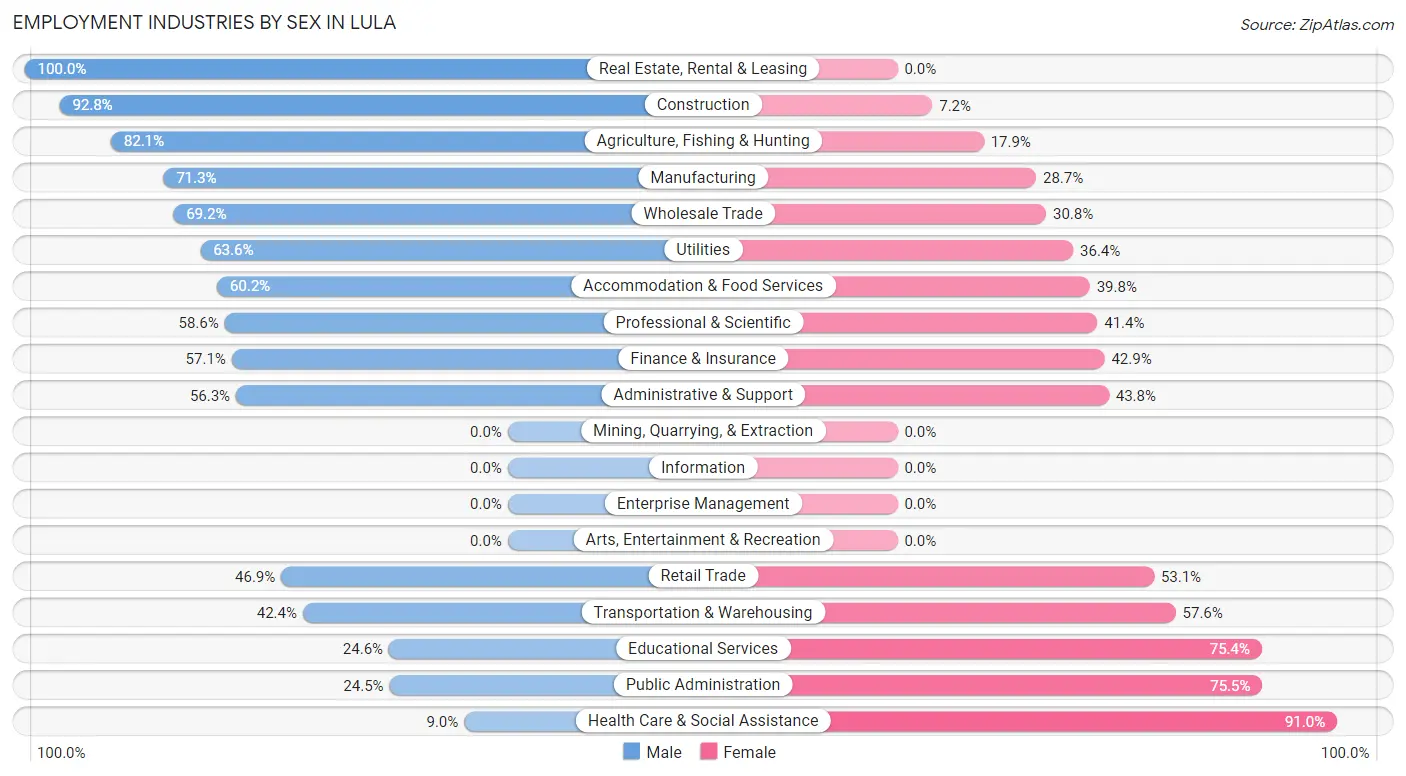
The Lula industries that see more men than women are Real Estate, Rental & Leasing (100.0%), Construction (92.8%), and Agriculture, Fishing & Hunting (82.1%), whereas the industries that tend to have a higher number of women are Health Care & Social Assistance (91.0%), Public Administration (75.5%), and Educational Services (75.4%).
| Industry | Male | Female |
| Agriculture, Fishing & Hunting | 23 (82.1%) | 5 (17.9%) |
| Mining, Quarrying, & Extraction | 0 (0.0%) | 0 (0.0%) |
| Construction | 90 (92.8%) | 7 (7.2%) |
| Manufacturing | 236 (71.3%) | 95 (28.7%) |
| Wholesale Trade | 9 (69.2%) | 4 (30.8%) |
| Retail Trade | 106 (46.9%) | 120 (53.1%) |
| Transportation & Warehousing | 14 (42.4%) | 19 (57.6%) |
| Utilities | 7 (63.6%) | 4 (36.4%) |
| Information | 0 (0.0%) | 0 (0.0%) |
| Finance & Insurance | 12 (57.1%) | 9 (42.9%) |
| Real Estate, Rental & Leasing | 16 (100.0%) | 0 (0.0%) |
| Professional & Scientific | 34 (58.6%) | 24 (41.4%) |
| Enterprise Management | 0 (0.0%) | 0 (0.0%) |
| Administrative & Support | 45 (56.2%) | 35 (43.8%) |
| Educational Services | 30 (24.6%) | 92 (75.4%) |
| Health Care & Social Assistance | 12 (9.0%) | 121 (91.0%) |
| Arts, Entertainment & Recreation | 0 (0.0%) | 0 (0.0%) |
| Accommodation & Food Services | 65 (60.2%) | 43 (39.8%) |
| Public Administration | 12 (24.5%) | 37 (75.5%) |
| Total | 766 (55.0%) | 627 (45.0%) |
Education in Lula
School Enrollment in Lula
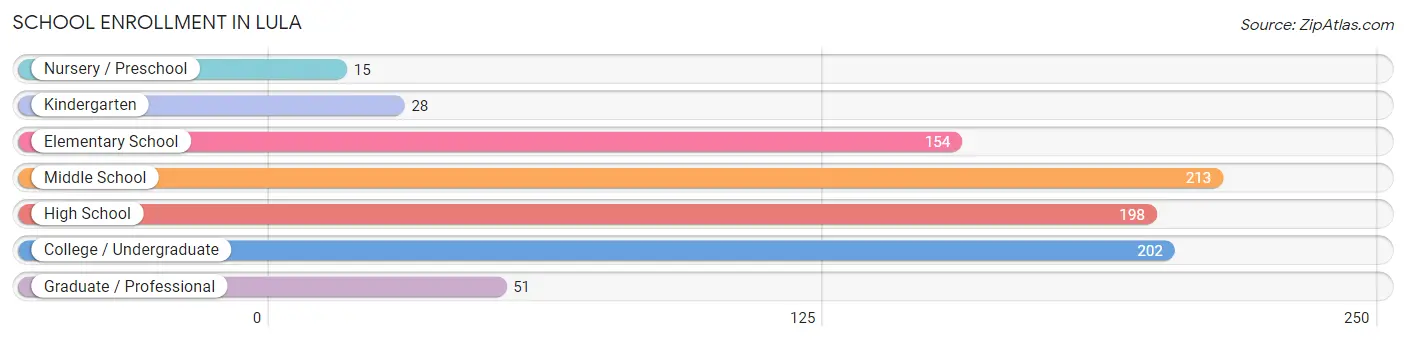
The most common levels of schooling among the 861 students in Lula are middle school (213 | 24.7%), college / undergraduate (202 | 23.5%), and high school (198 | 23.0%).
| School Level | # Students | % Students |
| Nursery / Preschool | 15 | 1.7% |
| Kindergarten | 28 | 3.3% |
| Elementary School | 154 | 17.9% |
| Middle School | 213 | 24.7% |
| High School | 198 | 23.0% |
| College / Undergraduate | 202 | 23.5% |
| Graduate / Professional | 51 | 5.9% |
| Total | 861 | 100.0% |
School Enrollment by Age by Funding Source in Lula
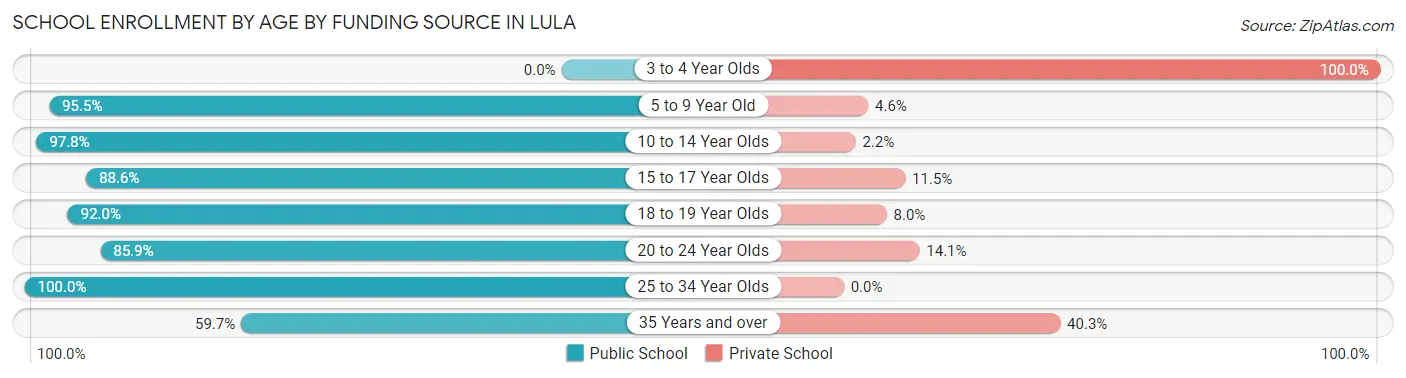
Out of a total of 861 students who are enrolled in schools in Lula, 80 (9.3%) attend a private institution, while the remaining 781 (90.7%) are enrolled in public schools. The age group of 3 to 4 year olds has the highest likelihood of being enrolled in private schools, with 9 (100.0% in the age bracket) enrolled. Conversely, the age group of 25 to 34 year olds has the lowest likelihood of being enrolled in a private school, with 76 (100.0% in the age bracket) attending a public institution.
| Age Bracket | Public School | Private School |
| 3 to 4 Year Olds | 0 (0.0%) | 9 (100.0%) |
| 5 to 9 Year Old | 126 (95.5%) | 6 (4.5%) |
| 10 to 14 Year Olds | 267 (97.8%) | 6 (2.2%) |
| 15 to 17 Year Olds | 116 (88.5%) | 15 (11.5%) |
| 18 to 19 Year Olds | 92 (92.0%) | 8 (8.0%) |
| 20 to 24 Year Olds | 67 (85.9%) | 11 (14.1%) |
| 25 to 34 Year Olds | 76 (100.0%) | 0 (0.0%) |
| 35 Years and over | 37 (59.7%) | 25 (40.3%) |
| Total | 781 (90.7%) | 80 (9.3%) |
Educational Attainment by Field of Study in Lula
Business (108 | 32.7%), education (90 | 27.3%), physical & health sciences (26 | 7.9%), arts & humanities (19 | 5.8%), and social sciences (17 | 5.1%) are the most common fields of study among 330 individuals in Lula who have obtained a bachelor's degree or higher.
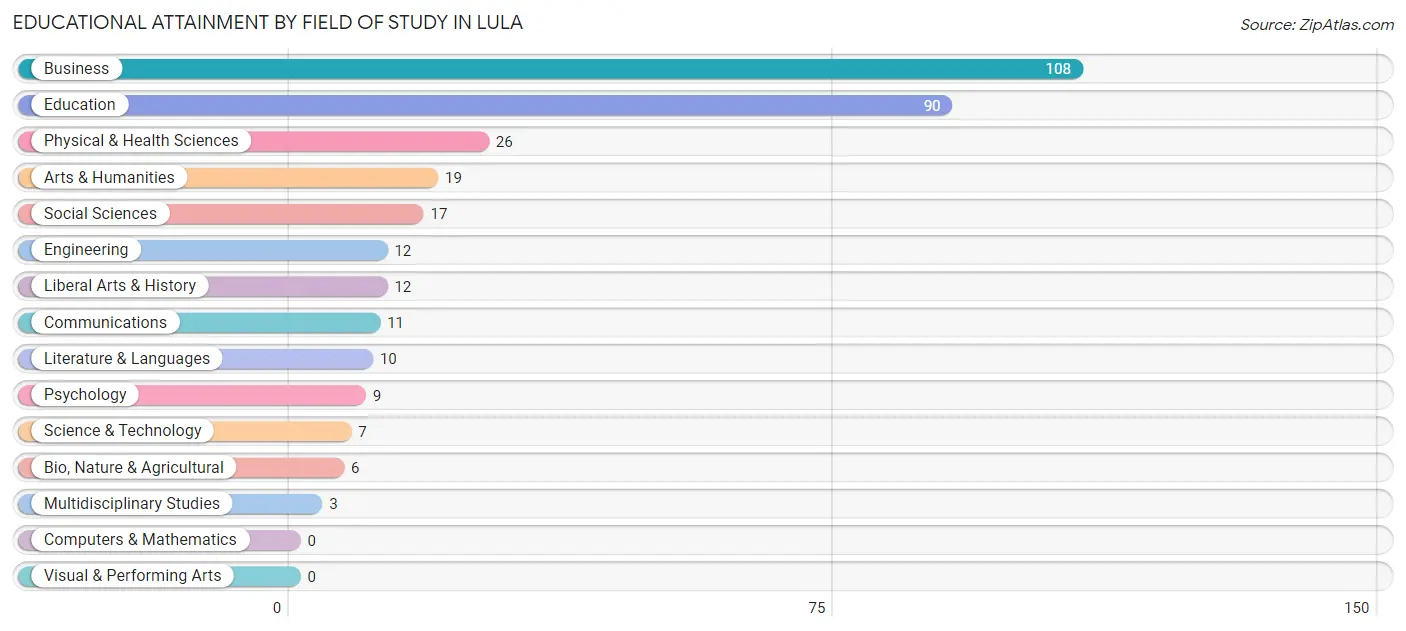
| Field of Study | # Graduates | % Graduates |
| Computers & Mathematics | 0 | 0.0% |
| Bio, Nature & Agricultural | 6 | 1.8% |
| Physical & Health Sciences | 26 | 7.9% |
| Psychology | 9 | 2.7% |
| Social Sciences | 17 | 5.1% |
| Engineering | 12 | 3.6% |
| Multidisciplinary Studies | 3 | 0.9% |
| Science & Technology | 7 | 2.1% |
| Business | 108 | 32.7% |
| Education | 90 | 27.3% |
| Literature & Languages | 10 | 3.0% |
| Liberal Arts & History | 12 | 3.6% |
| Visual & Performing Arts | 0 | 0.0% |
| Communications | 11 | 3.3% |
| Arts & Humanities | 19 | 5.8% |
| Total | 330 | 100.0% |
Transportation & Commute in Lula
Vehicle Availability by Sex in Lula
The most prevalent vehicle ownership categories in Lula are males with 2 vehicles (331, accounting for 47.2%) and females with 2 vehicles (320, making up 54.4%).
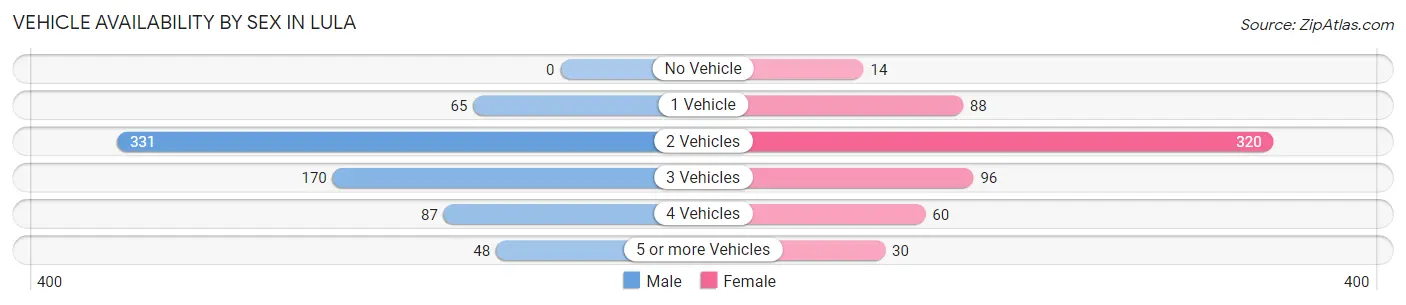
| Vehicles Available | Male | Female |
| No Vehicle | 0 (0.0%) | 14 (2.3%) |
| 1 Vehicle | 65 (9.3%) | 88 (14.5%) |
| 2 Vehicles | 331 (47.2%) | 320 (52.6%) |
| 3 Vehicles | 170 (24.2%) | 96 (15.8%) |
| 4 Vehicles | 87 (12.4%) | 60 (9.9%) |
| 5 or more Vehicles | 48 (6.9%) | 30 (4.9%) |
| Total | 701 (100.0%) | 608 (100.0%) |
Commute Time in Lula
The most frequently occuring commute durations in Lula are 30 to 34 minutes (221 commuters, 18.2%), 20 to 24 minutes (215 commuters, 17.7%), and 25 to 29 minutes (210 commuters, 17.3%).
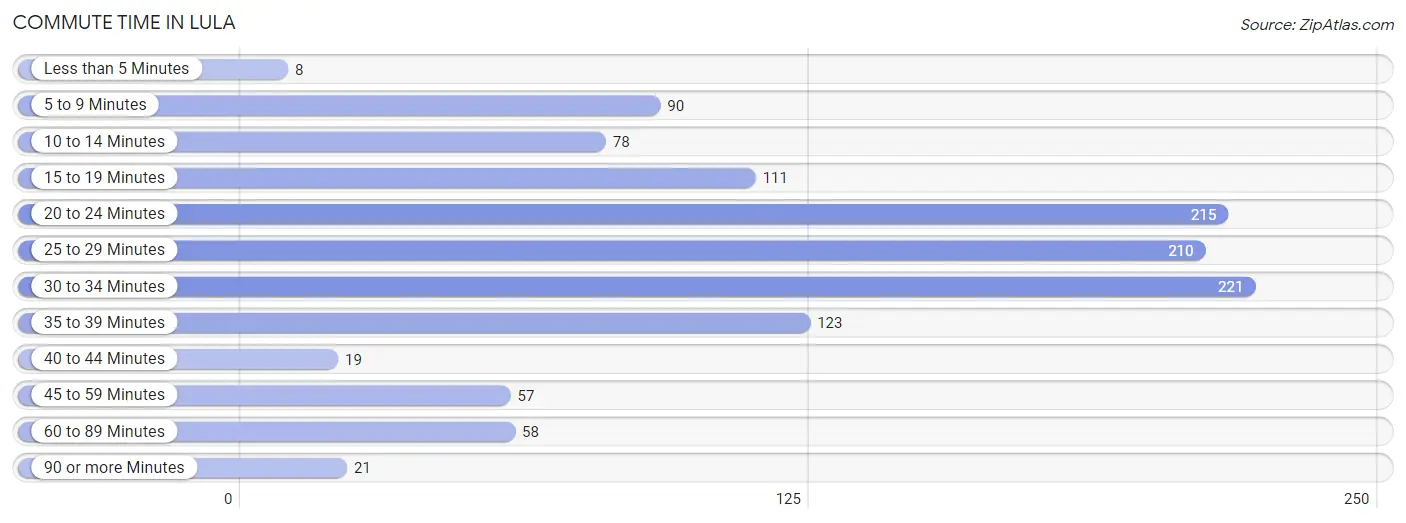
| Commute Time | # Commuters | % Commuters |
| Less than 5 Minutes | 8 | 0.7% |
| 5 to 9 Minutes | 90 | 7.4% |
| 10 to 14 Minutes | 78 | 6.4% |
| 15 to 19 Minutes | 111 | 9.2% |
| 20 to 24 Minutes | 215 | 17.7% |
| 25 to 29 Minutes | 210 | 17.3% |
| 30 to 34 Minutes | 221 | 18.2% |
| 35 to 39 Minutes | 123 | 10.2% |
| 40 to 44 Minutes | 19 | 1.6% |
| 45 to 59 Minutes | 57 | 4.7% |
| 60 to 89 Minutes | 58 | 4.8% |
| 90 or more Minutes | 21 | 1.7% |
Commute Time by Sex in Lula
The most common commute times in Lula are 30 to 34 minutes (117 commuters, 18.4%) for males and 20 to 24 minutes (155 commuters, 26.9%) for females.
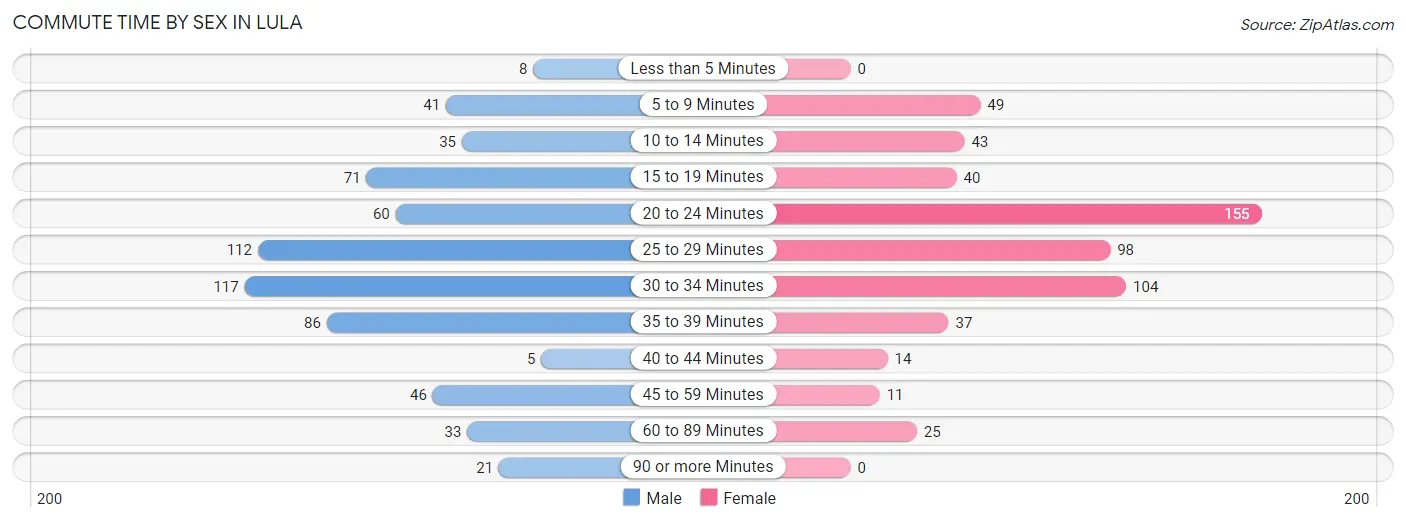
| Commute Time | Male | Female |
| Less than 5 Minutes | 8 (1.3%) | 0 (0.0%) |
| 5 to 9 Minutes | 41 (6.5%) | 49 (8.5%) |
| 10 to 14 Minutes | 35 (5.5%) | 43 (7.5%) |
| 15 to 19 Minutes | 71 (11.2%) | 40 (6.9%) |
| 20 to 24 Minutes | 60 (9.5%) | 155 (26.9%) |
| 25 to 29 Minutes | 112 (17.6%) | 98 (17.0%) |
| 30 to 34 Minutes | 117 (18.4%) | 104 (18.1%) |
| 35 to 39 Minutes | 86 (13.5%) | 37 (6.4%) |
| 40 to 44 Minutes | 5 (0.8%) | 14 (2.4%) |
| 45 to 59 Minutes | 46 (7.2%) | 11 (1.9%) |
| 60 to 89 Minutes | 33 (5.2%) | 25 (4.3%) |
| 90 or more Minutes | 21 (3.3%) | 0 (0.0%) |
Time of Departure to Work by Sex in Lula
The most frequent times of departure to work in Lula are 12:00 AM to 4:59 AM (105, 16.5%) for males and 7:30 AM to 7:59 AM (89, 15.4%) for females.
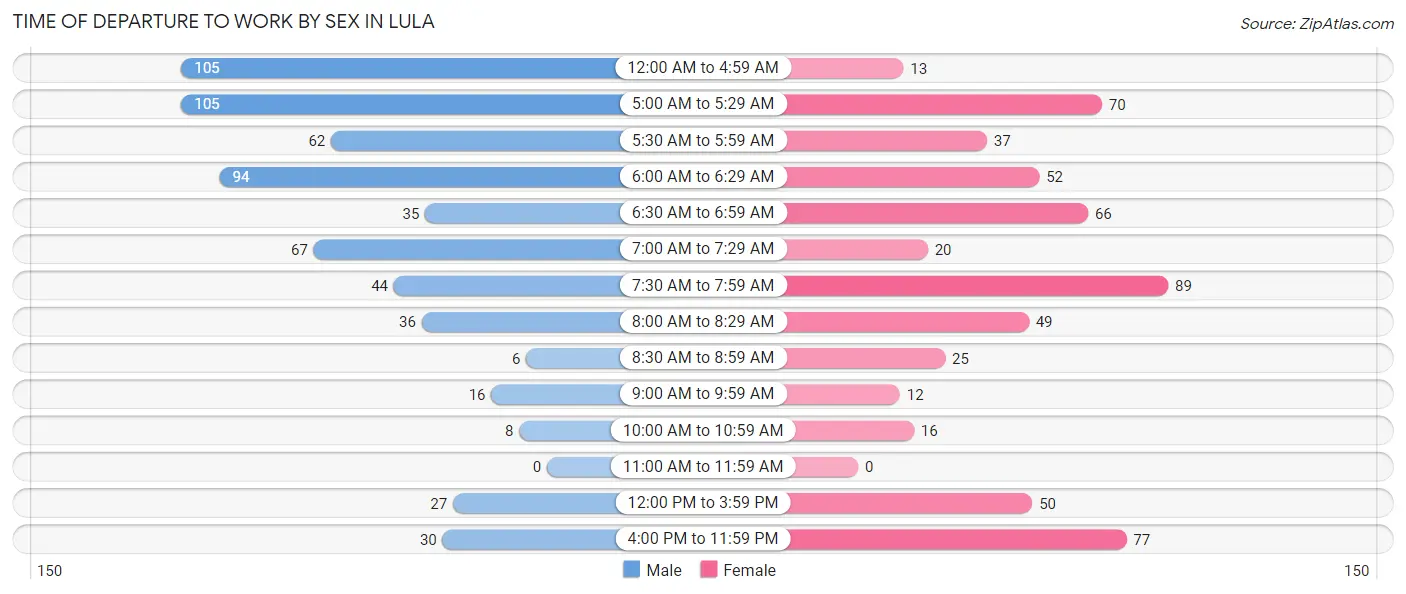
| Time of Departure | Male | Female |
| 12:00 AM to 4:59 AM | 105 (16.5%) | 13 (2.3%) |
| 5:00 AM to 5:29 AM | 105 (16.5%) | 70 (12.1%) |
| 5:30 AM to 5:59 AM | 62 (9.8%) | 37 (6.4%) |
| 6:00 AM to 6:29 AM | 94 (14.8%) | 52 (9.0%) |
| 6:30 AM to 6:59 AM | 35 (5.5%) | 66 (11.5%) |
| 7:00 AM to 7:29 AM | 67 (10.5%) | 20 (3.5%) |
| 7:30 AM to 7:59 AM | 44 (6.9%) | 89 (15.4%) |
| 8:00 AM to 8:29 AM | 36 (5.7%) | 49 (8.5%) |
| 8:30 AM to 8:59 AM | 6 (0.9%) | 25 (4.3%) |
| 9:00 AM to 9:59 AM | 16 (2.5%) | 12 (2.1%) |
| 10:00 AM to 10:59 AM | 8 (1.3%) | 16 (2.8%) |
| 11:00 AM to 11:59 AM | 0 (0.0%) | 0 (0.0%) |
| 12:00 PM to 3:59 PM | 27 (4.3%) | 50 (8.7%) |
| 4:00 PM to 11:59 PM | 30 (4.7%) | 77 (13.4%) |
| Total | 635 (100.0%) | 576 (100.0%) |
Housing Occupancy in Lula
Occupancy by Ownership in Lula
Of the total 1,050 dwellings in Lula, owner-occupied units account for 704 (67.0%), while renter-occupied units make up 346 (33.0%).
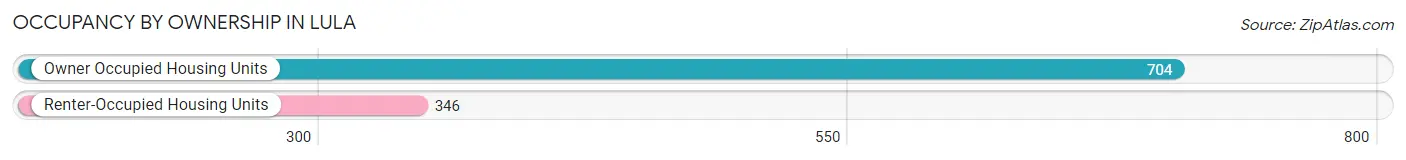
| Occupancy | # Housing Units | % Housing Units |
| Owner Occupied Housing Units | 704 | 67.0% |
| Renter-Occupied Housing Units | 346 | 33.0% |
| Total Occupied Housing Units | 1,050 | 100.0% |
Occupancy by Household Size in Lula
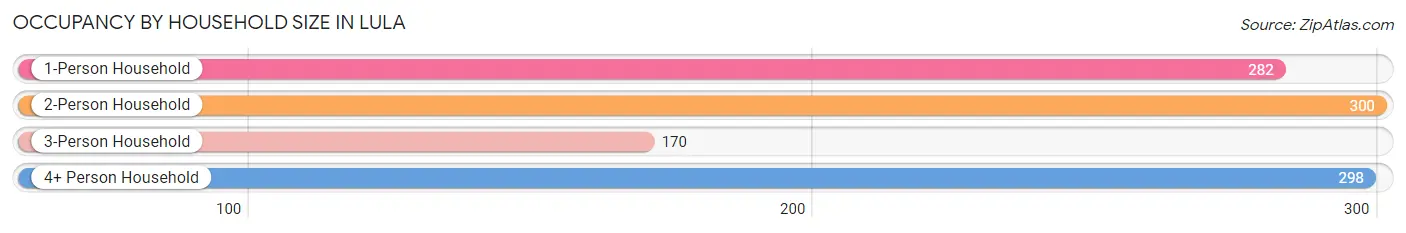
| Household Size | # Housing Units | % Housing Units |
| 1-Person Household | 282 | 26.9% |
| 2-Person Household | 300 | 28.6% |
| 3-Person Household | 170 | 16.2% |
| 4+ Person Household | 298 | 28.4% |
| Total Housing Units | 1,050 | 100.0% |
Occupancy by Ownership by Household Size in Lula
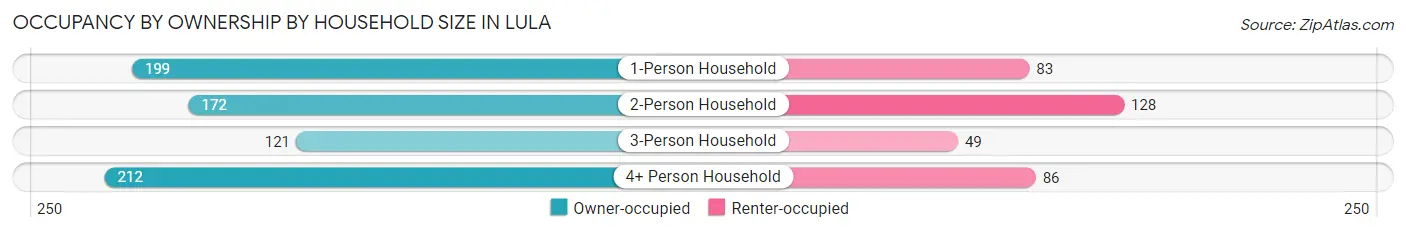
| Household Size | Owner-occupied | Renter-occupied |
| 1-Person Household | 199 (70.6%) | 83 (29.4%) |
| 2-Person Household | 172 (57.3%) | 128 (42.7%) |
| 3-Person Household | 121 (71.2%) | 49 (28.8%) |
| 4+ Person Household | 212 (71.1%) | 86 (28.9%) |
| Total Housing Units | 704 (67.0%) | 346 (33.0%) |
Occupancy by Educational Attainment in Lula
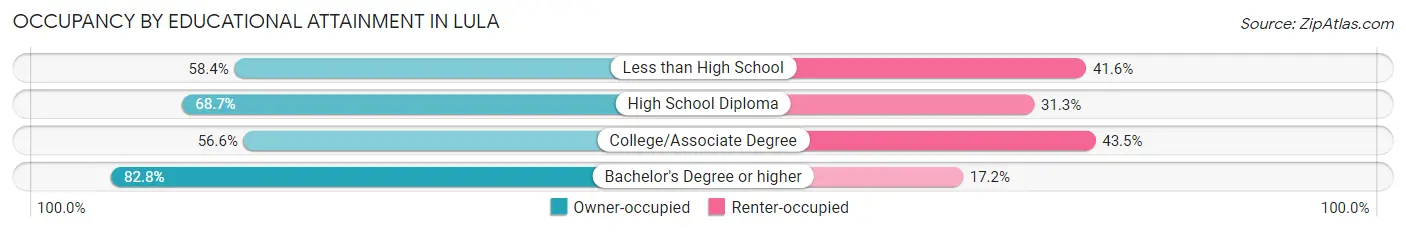
| Household Size | Owner-occupied | Renter-occupied |
| Less than High School | 101 (58.4%) | 72 (41.6%) |
| High School Diploma | 259 (68.7%) | 118 (31.3%) |
| College/Associate Degree | 151 (56.6%) | 116 (43.4%) |
| Bachelor's Degree or higher | 193 (82.8%) | 40 (17.2%) |
Occupancy by Age of Householder in Lula
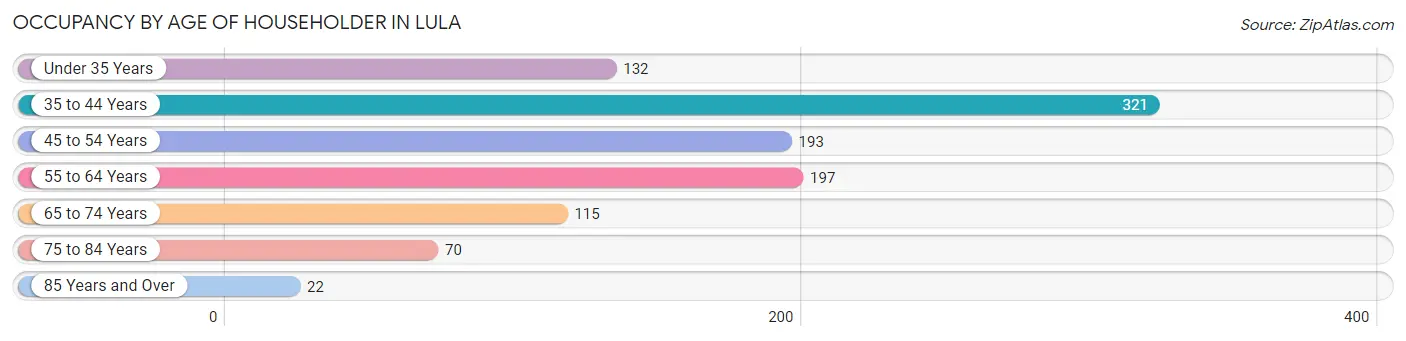
| Age Bracket | # Households | % Households |
| Under 35 Years | 132 | 12.6% |
| 35 to 44 Years | 321 | 30.6% |
| 45 to 54 Years | 193 | 18.4% |
| 55 to 64 Years | 197 | 18.8% |
| 65 to 74 Years | 115 | 11.0% |
| 75 to 84 Years | 70 | 6.7% |
| 85 Years and Over | 22 | 2.1% |
| Total | 1,050 | 100.0% |
Housing Finances in Lula
Median Income by Occupancy in Lula
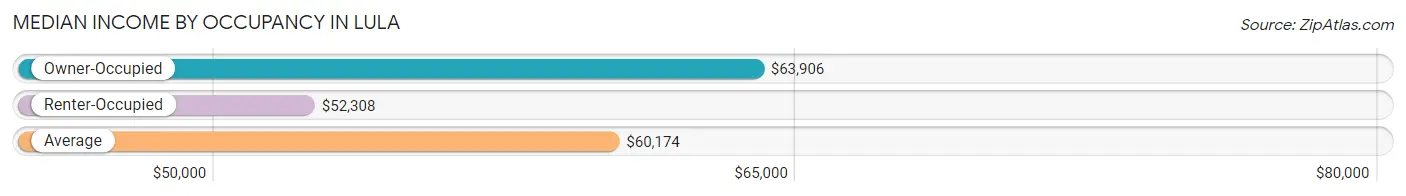
| Occupancy Type | # Households | Median Income |
| Owner-Occupied | 704 (67.0%) | $63,906 |
| Renter-Occupied | 346 (33.0%) | $52,308 |
| Average | 1,050 (100.0%) | $60,174 |
Occupancy by Householder Income Bracket in Lula
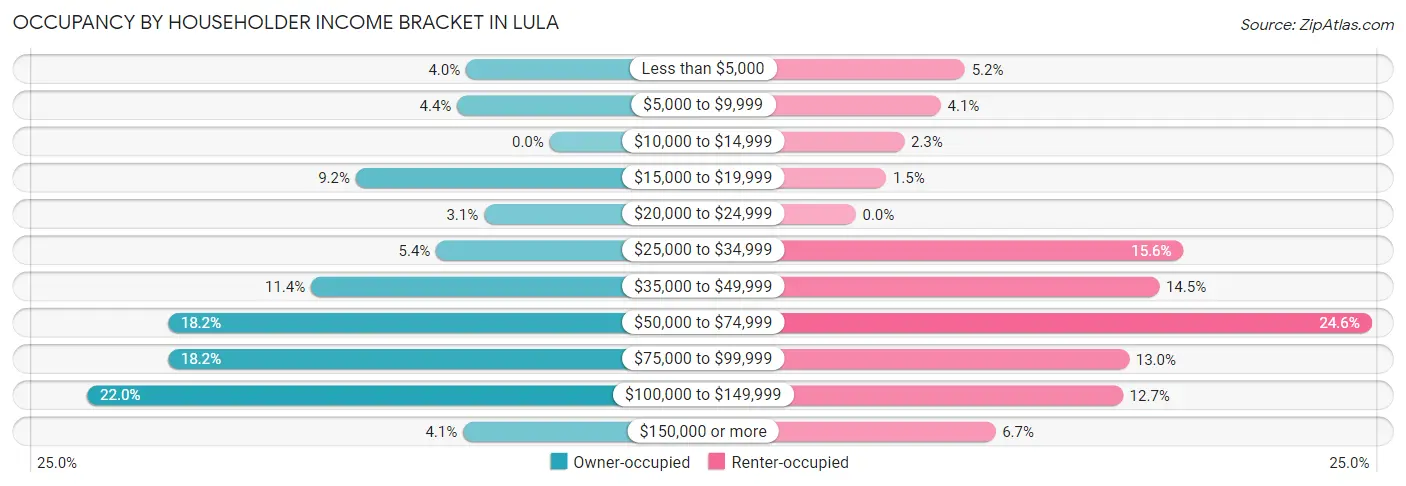
| Income Bracket | Owner-occupied | Renter-occupied |
| Less than $5,000 | 28 (4.0%) | 18 (5.2%) |
| $5,000 to $9,999 | 31 (4.4%) | 14 (4.1%) |
| $10,000 to $14,999 | 0 (0.0%) | 8 (2.3%) |
| $15,000 to $19,999 | 65 (9.2%) | 5 (1.5%) |
| $20,000 to $24,999 | 22 (3.1%) | 0 (0.0%) |
| $25,000 to $34,999 | 38 (5.4%) | 54 (15.6%) |
| $35,000 to $49,999 | 80 (11.4%) | 50 (14.4%) |
| $50,000 to $74,999 | 128 (18.2%) | 85 (24.6%) |
| $75,000 to $99,999 | 128 (18.2%) | 45 (13.0%) |
| $100,000 to $149,999 | 155 (22.0%) | 44 (12.7%) |
| $150,000 or more | 29 (4.1%) | 23 (6.7%) |
| Total | 704 (100.0%) | 346 (100.0%) |
Monthly Housing Cost Tiers in Lula
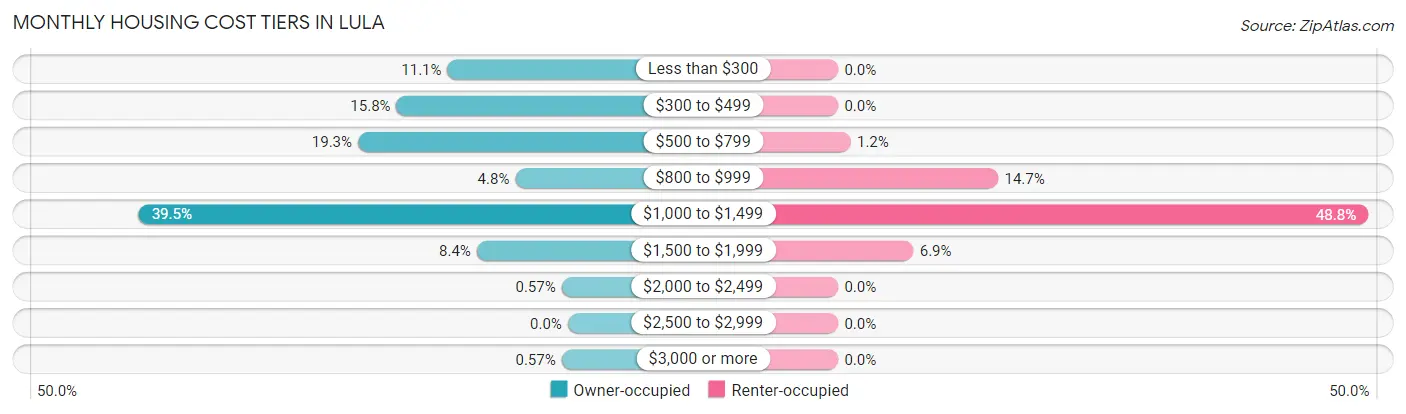
| Monthly Cost | Owner-occupied | Renter-occupied |
| Less than $300 | 78 (11.1%) | 0 (0.0%) |
| $300 to $499 | 111 (15.8%) | 0 (0.0%) |
| $500 to $799 | 136 (19.3%) | 4 (1.2%) |
| $800 to $999 | 34 (4.8%) | 51 (14.7%) |
| $1,000 to $1,499 | 278 (39.5%) | 169 (48.8%) |
| $1,500 to $1,999 | 59 (8.4%) | 24 (6.9%) |
| $2,000 to $2,499 | 4 (0.6%) | 0 (0.0%) |
| $2,500 to $2,999 | 0 (0.0%) | 0 (0.0%) |
| $3,000 or more | 4 (0.6%) | 0 (0.0%) |
| Total | 704 (100.0%) | 346 (100.0%) |
Physical Housing Characteristics in Lula
Housing Structures in Lula
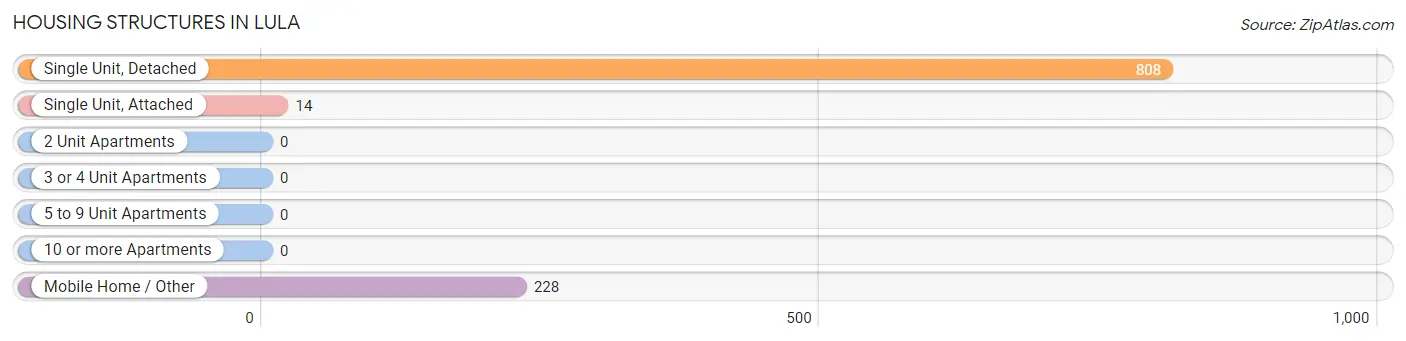
| Structure Type | # Housing Units | % Housing Units |
| Single Unit, Detached | 808 | 76.9% |
| Single Unit, Attached | 14 | 1.3% |
| 2 Unit Apartments | 0 | 0.0% |
| 3 or 4 Unit Apartments | 0 | 0.0% |
| 5 to 9 Unit Apartments | 0 | 0.0% |
| 10 or more Apartments | 0 | 0.0% |
| Mobile Home / Other | 228 | 21.7% |
| Total | 1,050 | 100.0% |
Housing Structures by Occupancy in Lula
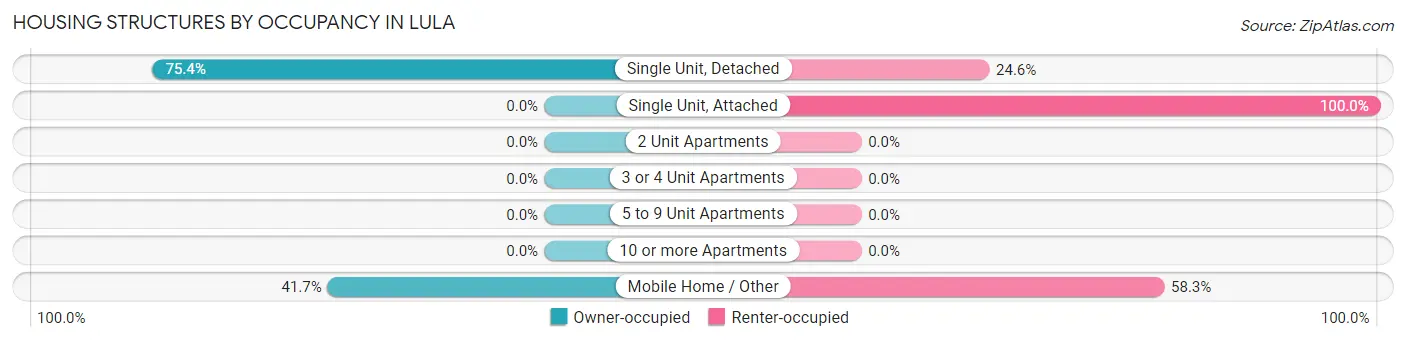
| Structure Type | Owner-occupied | Renter-occupied |
| Single Unit, Detached | 609 (75.4%) | 199 (24.6%) |
| Single Unit, Attached | 0 (0.0%) | 14 (100.0%) |
| 2 Unit Apartments | 0 (0.0%) | 0 (0.0%) |
| 3 or 4 Unit Apartments | 0 (0.0%) | 0 (0.0%) |
| 5 to 9 Unit Apartments | 0 (0.0%) | 0 (0.0%) |
| 10 or more Apartments | 0 (0.0%) | 0 (0.0%) |
| Mobile Home / Other | 95 (41.7%) | 133 (58.3%) |
| Total | 704 (67.0%) | 346 (33.0%) |
Housing Structures by Number of Rooms in Lula
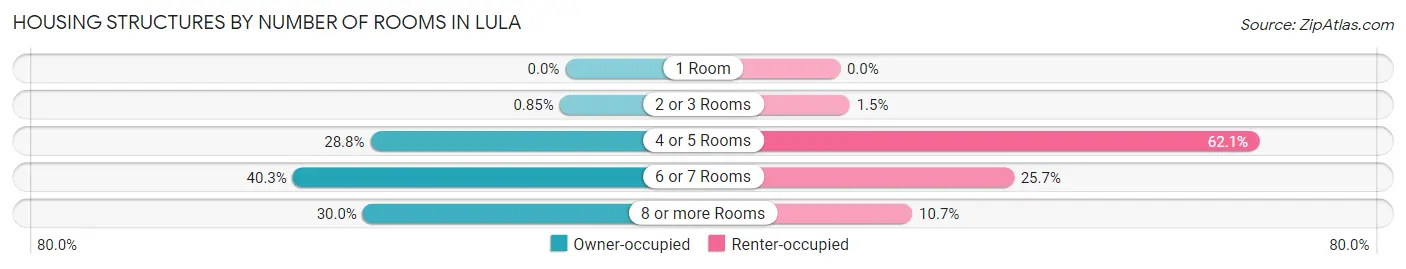
| Number of Rooms | Owner-occupied | Renter-occupied |
| 1 Room | 0 (0.0%) | 0 (0.0%) |
| 2 or 3 Rooms | 6 (0.9%) | 5 (1.5%) |
| 4 or 5 Rooms | 203 (28.8%) | 215 (62.1%) |
| 6 or 7 Rooms | 284 (40.3%) | 89 (25.7%) |
| 8 or more Rooms | 211 (30.0%) | 37 (10.7%) |
| Total | 704 (100.0%) | 346 (100.0%) |
Housing Structure by Heating Type in Lula
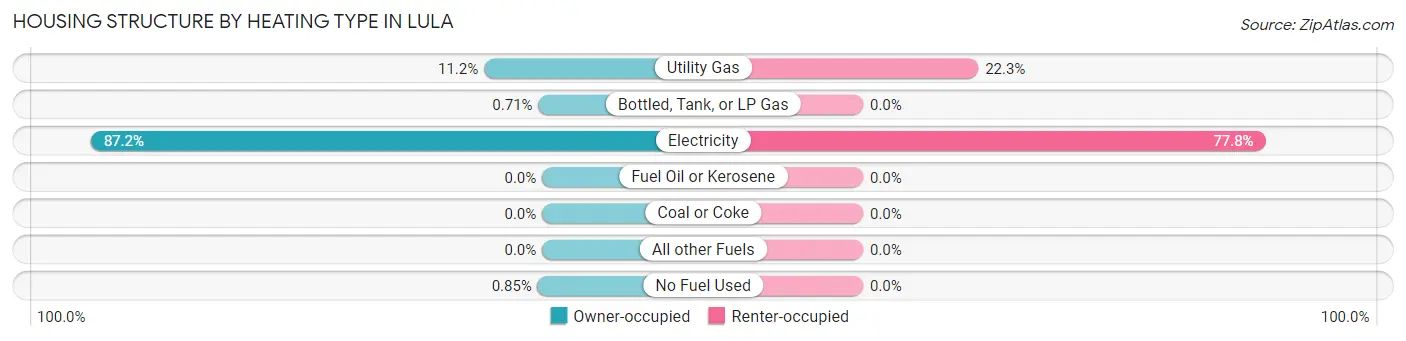
| Heating Type | Owner-occupied | Renter-occupied |
| Utility Gas | 79 (11.2%) | 77 (22.3%) |
| Bottled, Tank, or LP Gas | 5 (0.7%) | 0 (0.0%) |
| Electricity | 614 (87.2%) | 269 (77.7%) |
| Fuel Oil or Kerosene | 0 (0.0%) | 0 (0.0%) |
| Coal or Coke | 0 (0.0%) | 0 (0.0%) |
| All other Fuels | 0 (0.0%) | 0 (0.0%) |
| No Fuel Used | 6 (0.9%) | 0 (0.0%) |
| Total | 704 (100.0%) | 346 (100.0%) |
Household Vehicle Usage in Lula
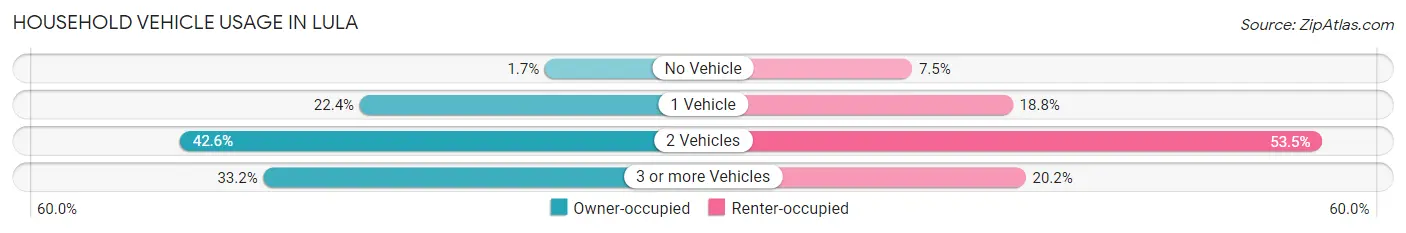
| Vehicles per Household | Owner-occupied | Renter-occupied |
| No Vehicle | 12 (1.7%) | 26 (7.5%) |
| 1 Vehicle | 158 (22.4%) | 65 (18.8%) |
| 2 Vehicles | 300 (42.6%) | 185 (53.5%) |
| 3 or more Vehicles | 234 (33.2%) | 70 (20.2%) |
| Total | 704 (100.0%) | 346 (100.0%) |
Real Estate & Mortgages in Lula
Real Estate and Mortgage Overview in Lula
| Characteristic | Without Mortgage | With Mortgage |
| Housing Units | 310 | 394 |
| Median Property Value | $152,300 | $200,000 |
| Median Household Income | $36,579 | $9 |
| Monthly Housing Costs | $436 | $4 |
| Real Estate Taxes | $846 | $5 |
Property Value by Mortgage Status in Lula
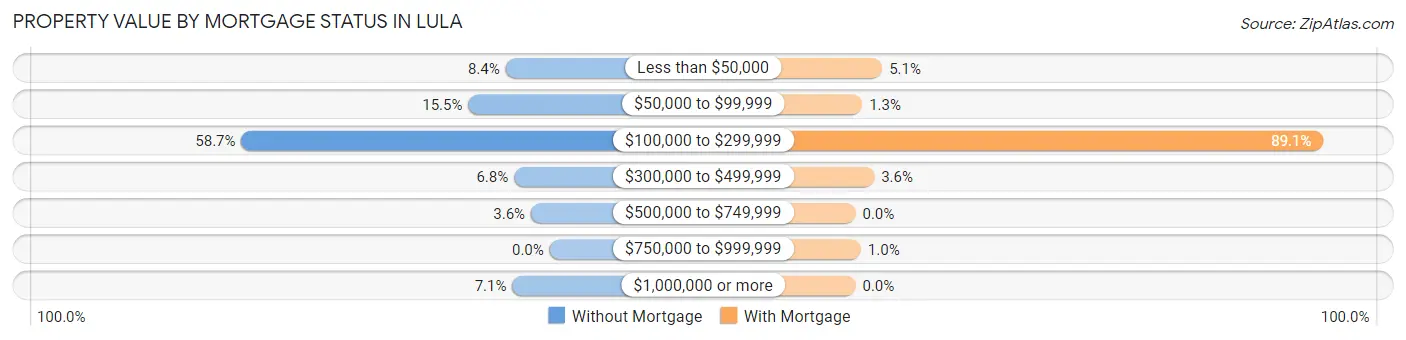
| Property Value | Without Mortgage | With Mortgage |
| Less than $50,000 | 26 (8.4%) | 20 (5.1%) |
| $50,000 to $99,999 | 48 (15.5%) | 5 (1.3%) |
| $100,000 to $299,999 | 182 (58.7%) | 351 (89.1%) |
| $300,000 to $499,999 | 21 (6.8%) | 14 (3.5%) |
| $500,000 to $749,999 | 11 (3.5%) | 0 (0.0%) |
| $750,000 to $999,999 | 0 (0.0%) | 4 (1.0%) |
| $1,000,000 or more | 22 (7.1%) | 0 (0.0%) |
| Total | 310 (100.0%) | 394 (100.0%) |
Household Income by Mortgage Status in Lula
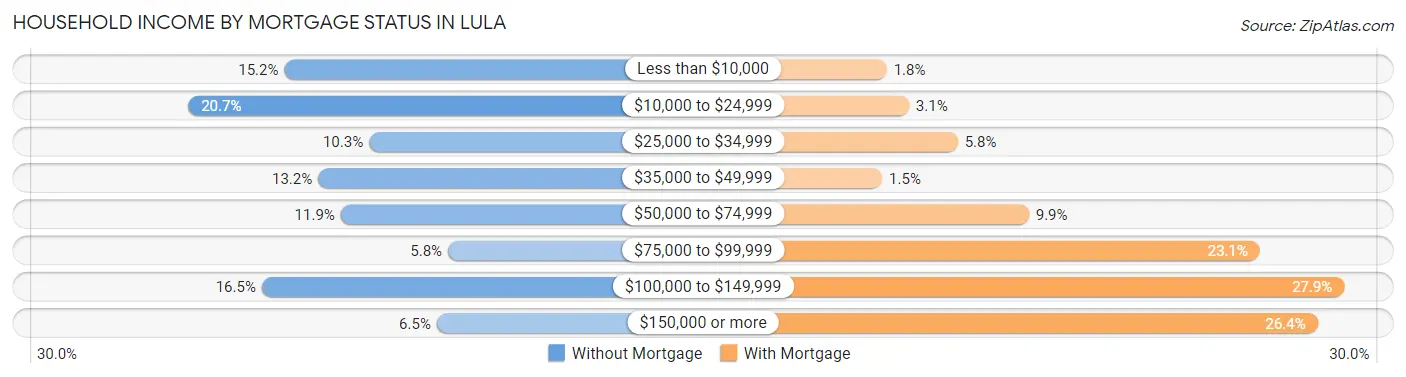
| Household Income | Without Mortgage | With Mortgage |
| Less than $10,000 | 47 (15.2%) | 7 (1.8%) |
| $10,000 to $24,999 | 64 (20.6%) | 12 (3.0%) |
| $25,000 to $34,999 | 32 (10.3%) | 23 (5.8%) |
| $35,000 to $49,999 | 41 (13.2%) | 6 (1.5%) |
| $50,000 to $74,999 | 37 (11.9%) | 39 (9.9%) |
| $75,000 to $99,999 | 18 (5.8%) | 91 (23.1%) |
| $100,000 to $149,999 | 51 (16.5%) | 110 (27.9%) |
| $150,000 or more | 20 (6.5%) | 104 (26.4%) |
| Total | 310 (100.0%) | 394 (100.0%) |
Property Value to Household Income Ratio in Lula
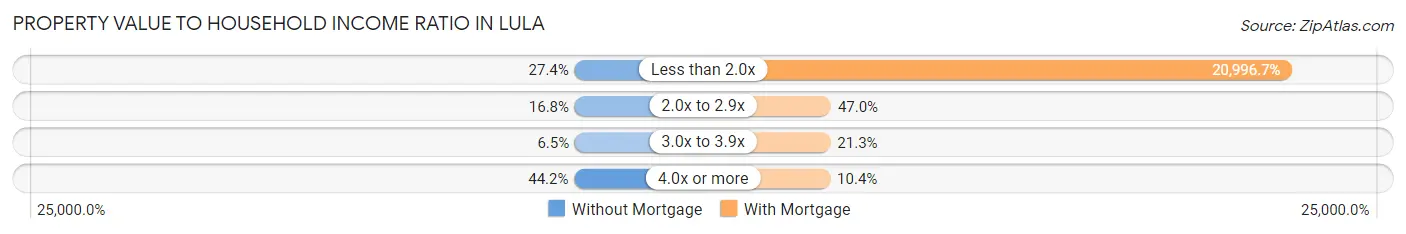
| Value-to-Income Ratio | Without Mortgage | With Mortgage |
| Less than 2.0x | 85 (27.4%) | 82,727 (20,996.7%) |
| 2.0x to 2.9x | 52 (16.8%) | 185 (46.9%) |
| 3.0x to 3.9x | 20 (6.5%) | 84 (21.3%) |
| 4.0x or more | 137 (44.2%) | 41 (10.4%) |
| Total | 310 (100.0%) | 394 (100.0%) |
Real Estate Taxes by Mortgage Status in Lula
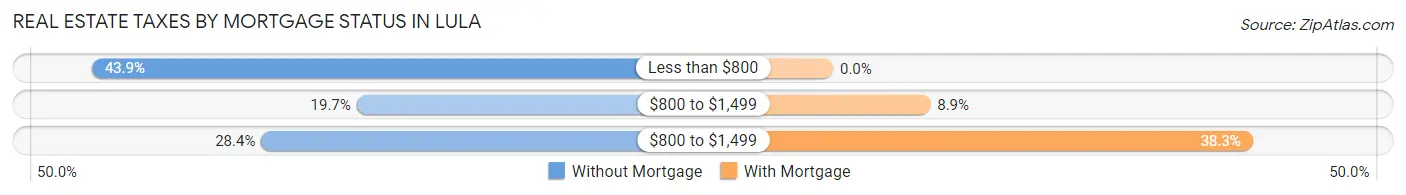
| Property Taxes | Without Mortgage | With Mortgage |
| Less than $800 | 136 (43.9%) | 0 (0.0%) |
| $800 to $1,499 | 61 (19.7%) | 35 (8.9%) |
| $800 to $1,499 | 88 (28.4%) | 151 (38.3%) |
| Total | 310 (100.0%) | 394 (100.0%) |
Health & Disability in Lula
Health Insurance Coverage by Age in Lula
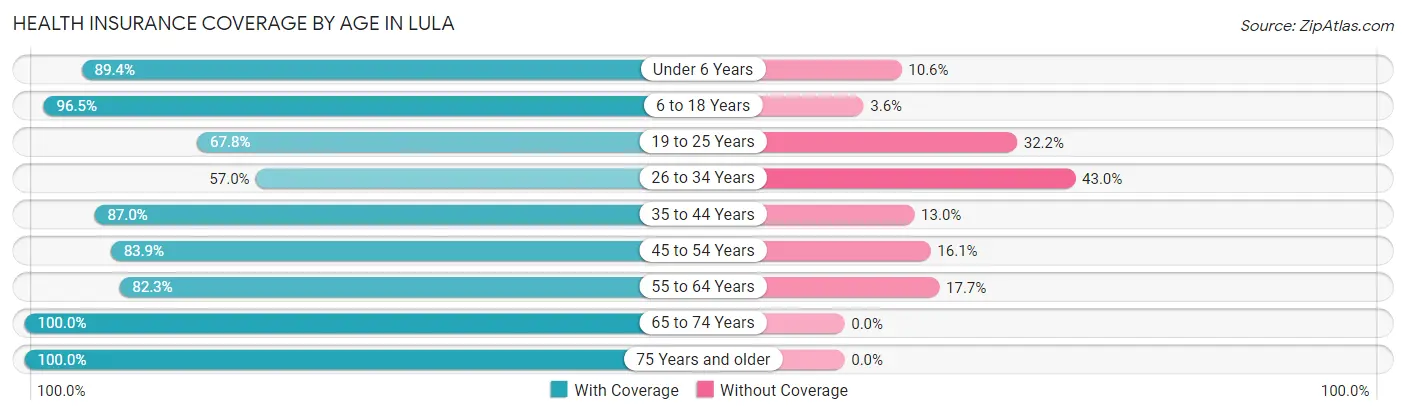
| Age Bracket | With Coverage | Without Coverage |
| Under 6 Years | 84 (89.4%) | 10 (10.6%) |
| 6 to 18 Years | 598 (96.5%) | 22 (3.5%) |
| 19 to 25 Years | 194 (67.8%) | 92 (32.2%) |
| 26 to 34 Years | 180 (57.0%) | 136 (43.0%) |
| 35 to 44 Years | 474 (87.0%) | 71 (13.0%) |
| 45 to 54 Years | 324 (83.9%) | 62 (16.1%) |
| 55 to 64 Years | 284 (82.3%) | 61 (17.7%) |
| 65 to 74 Years | 181 (100.0%) | 0 (0.0%) |
| 75 Years and older | 101 (100.0%) | 0 (0.0%) |
| Total | 2,420 (84.2%) | 454 (15.8%) |
Health Insurance Coverage by Citizenship Status in Lula
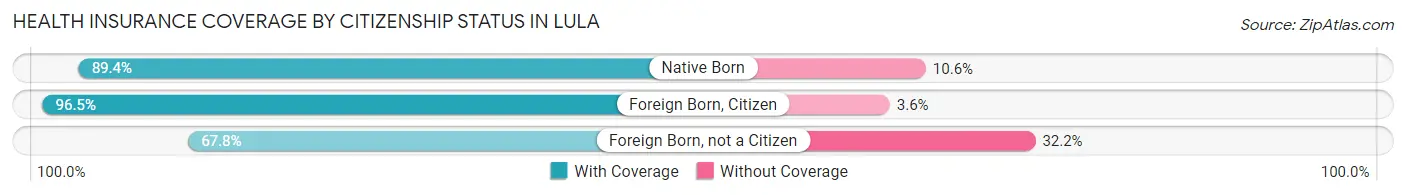
| Citizenship Status | With Coverage | Without Coverage |
| Native Born | 84 (89.4%) | 10 (10.6%) |
| Foreign Born, Citizen | 598 (96.5%) | 22 (3.5%) |
| Foreign Born, not a Citizen | 194 (67.8%) | 92 (32.2%) |
Health Insurance Coverage by Household Income in Lula
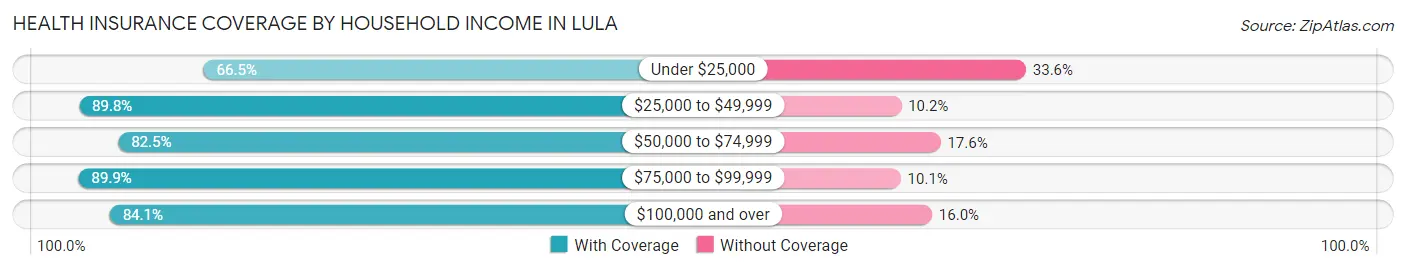
| Household Income | With Coverage | Without Coverage |
| Under $25,000 | 200 (66.4%) | 101 (33.6%) |
| $25,000 to $49,999 | 511 (89.8%) | 58 (10.2%) |
| $50,000 to $74,999 | 498 (82.5%) | 106 (17.5%) |
| $75,000 to $99,999 | 526 (89.9%) | 59 (10.1%) |
| $100,000 and over | 685 (84.1%) | 130 (16.0%) |
Public vs Private Health Insurance Coverage by Age in Lula
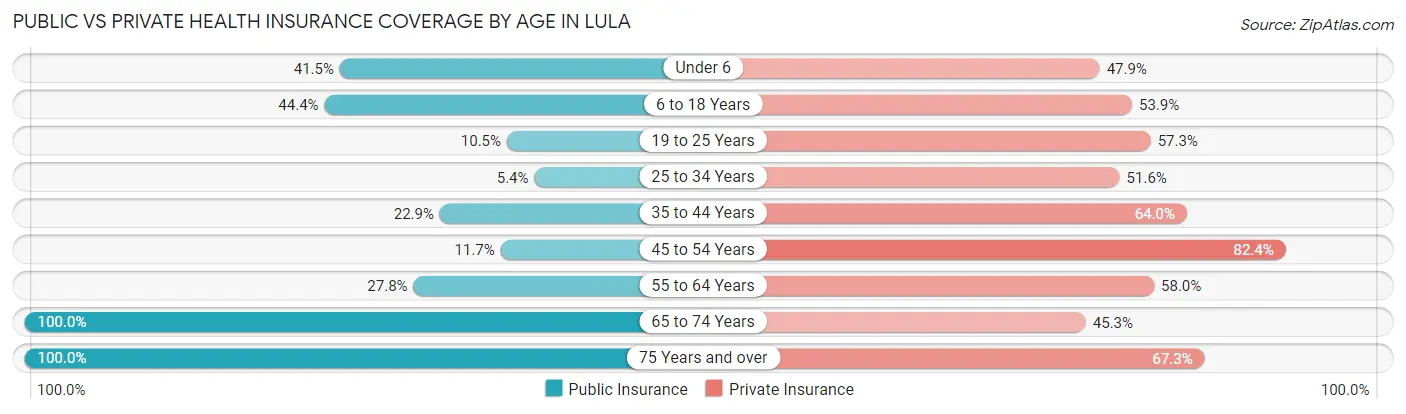
| Age Bracket | Public Insurance | Private Insurance |
| Under 6 | 39 (41.5%) | 45 (47.9%) |
| 6 to 18 Years | 275 (44.4%) | 334 (53.9%) |
| 19 to 25 Years | 30 (10.5%) | 164 (57.3%) |
| 25 to 34 Years | 17 (5.4%) | 163 (51.6%) |
| 35 to 44 Years | 125 (22.9%) | 349 (64.0%) |
| 45 to 54 Years | 45 (11.7%) | 318 (82.4%) |
| 55 to 64 Years | 96 (27.8%) | 200 (58.0%) |
| 65 to 74 Years | 181 (100.0%) | 82 (45.3%) |
| 75 Years and over | 101 (100.0%) | 68 (67.3%) |
| Total | 909 (31.6%) | 1,723 (60.0%) |
Disability Status by Sex by Age in Lula
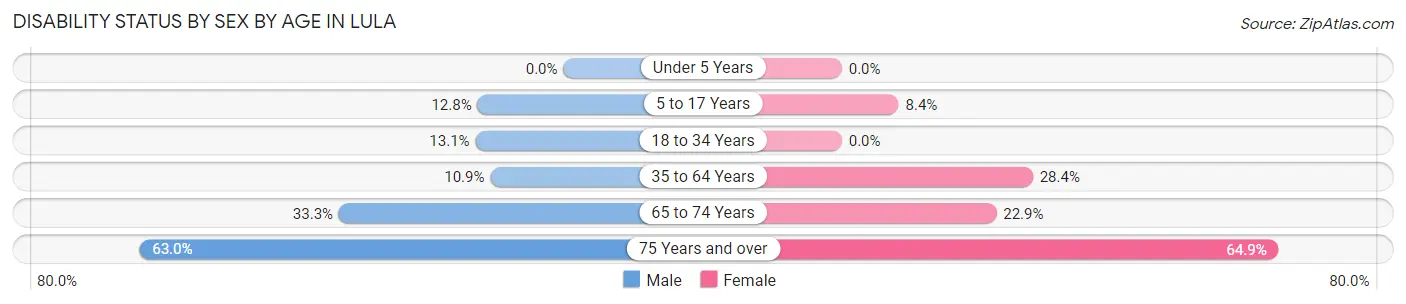
| Age Bracket | Male | Female |
| Under 5 Years | 0 (0.0%) | 0 (0.0%) |
| 5 to 17 Years | 38 (12.8%) | 21 (8.4%) |
| 18 to 34 Years | 55 (13.1%) | 0 (0.0%) |
| 35 to 64 Years | 60 (10.8%) | 205 (28.3%) |
| 65 to 74 Years | 24 (33.3%) | 25 (22.9%) |
| 75 Years and over | 17 (63.0%) | 48 (64.9%) |
Disability Class by Sex by Age in Lula
Disability Class: Hearing Difficulty
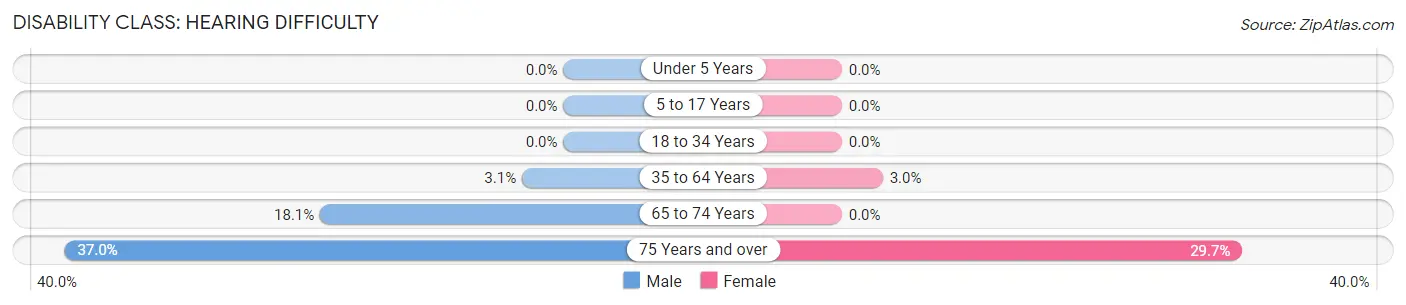
| Age Bracket | Male | Female |
| Under 5 Years | 0 (0.0%) | 0 (0.0%) |
| 5 to 17 Years | 0 (0.0%) | 0 (0.0%) |
| 18 to 34 Years | 0 (0.0%) | 0 (0.0%) |
| 35 to 64 Years | 17 (3.1%) | 22 (3.0%) |
| 65 to 74 Years | 13 (18.1%) | 0 (0.0%) |
| 75 Years and over | 10 (37.0%) | 22 (29.7%) |
Disability Class: Vision Difficulty
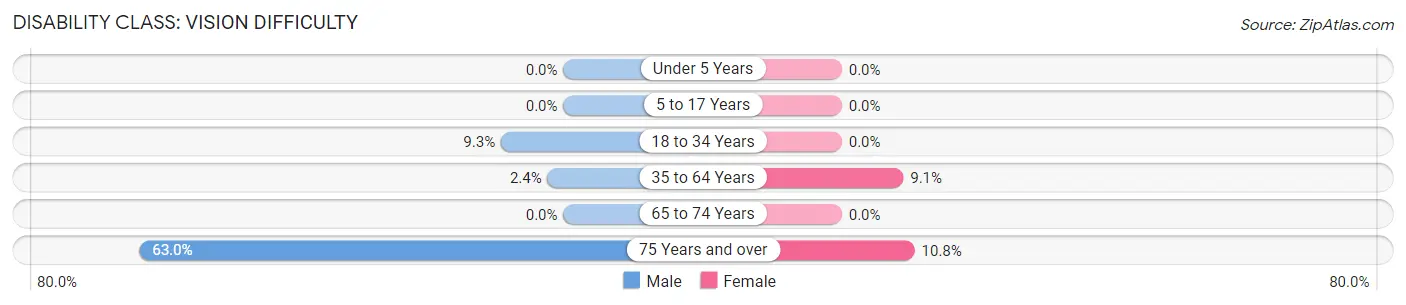
| Age Bracket | Male | Female |
| Under 5 Years | 0 (0.0%) | 0 (0.0%) |
| 5 to 17 Years | 0 (0.0%) | 0 (0.0%) |
| 18 to 34 Years | 39 (9.3%) | 0 (0.0%) |
| 35 to 64 Years | 13 (2.4%) | 66 (9.1%) |
| 65 to 74 Years | 0 (0.0%) | 0 (0.0%) |
| 75 Years and over | 17 (63.0%) | 8 (10.8%) |
Disability Class: Cognitive Difficulty
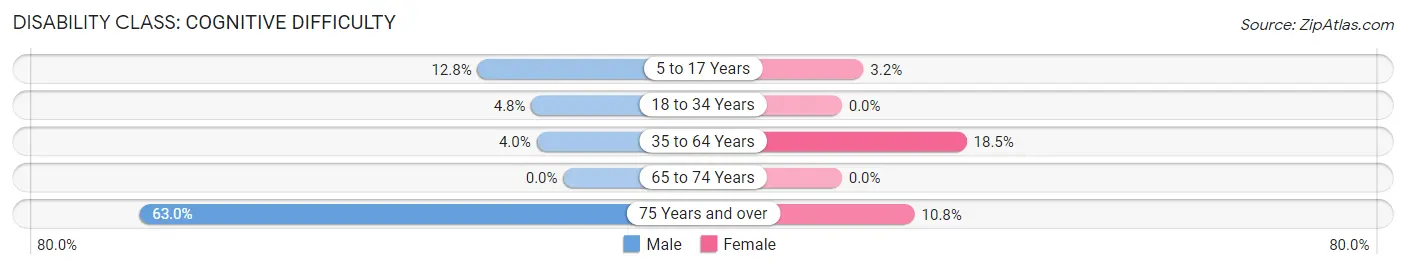
| Age Bracket | Male | Female |
| 5 to 17 Years | 38 (12.8%) | 8 (3.2%) |
| 18 to 34 Years | 20 (4.8%) | 0 (0.0%) |
| 35 to 64 Years | 22 (4.0%) | 134 (18.5%) |
| 65 to 74 Years | 0 (0.0%) | 0 (0.0%) |
| 75 Years and over | 17 (63.0%) | 8 (10.8%) |
Disability Class: Ambulatory Difficulty
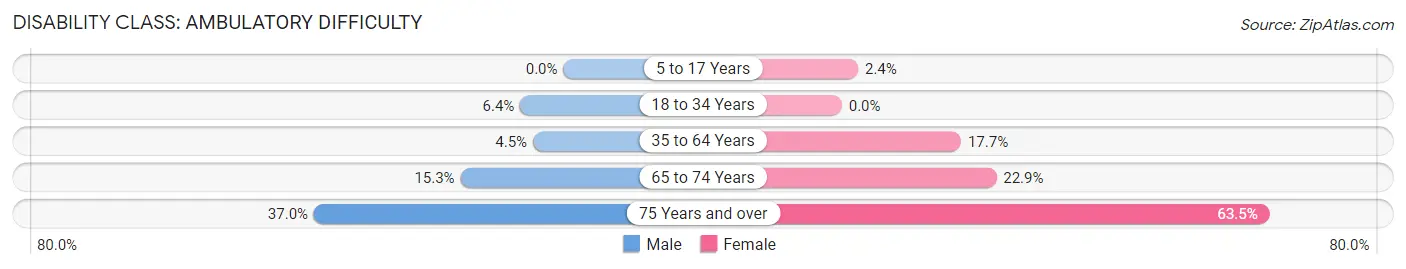
| Age Bracket | Male | Female |
| 5 to 17 Years | 0 (0.0%) | 6 (2.4%) |
| 18 to 34 Years | 27 (6.4%) | 0 (0.0%) |
| 35 to 64 Years | 25 (4.5%) | 128 (17.7%) |
| 65 to 74 Years | 11 (15.3%) | 25 (22.9%) |
| 75 Years and over | 10 (37.0%) | 47 (63.5%) |
Disability Class: Self-Care Difficulty
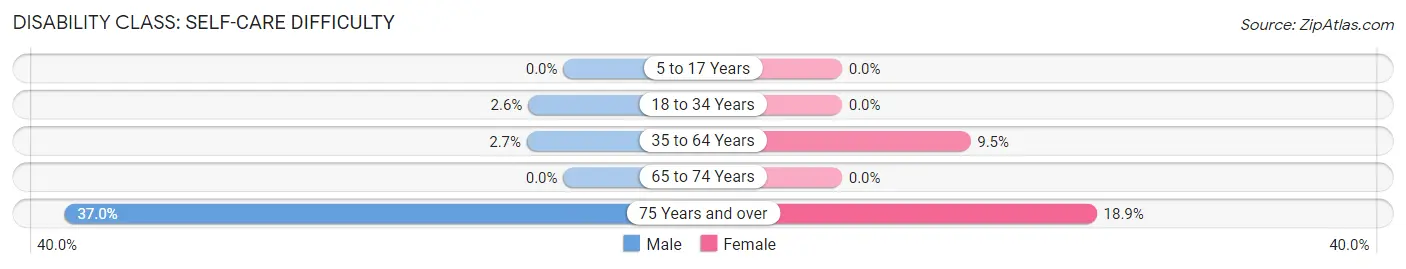
| Age Bracket | Male | Female |
| 5 to 17 Years | 0 (0.0%) | 0 (0.0%) |
| 18 to 34 Years | 11 (2.6%) | 0 (0.0%) |
| 35 to 64 Years | 15 (2.7%) | 69 (9.5%) |
| 65 to 74 Years | 0 (0.0%) | 0 (0.0%) |
| 75 Years and over | 10 (37.0%) | 14 (18.9%) |
Technology Access in Lula
Computing Device Access in Lula
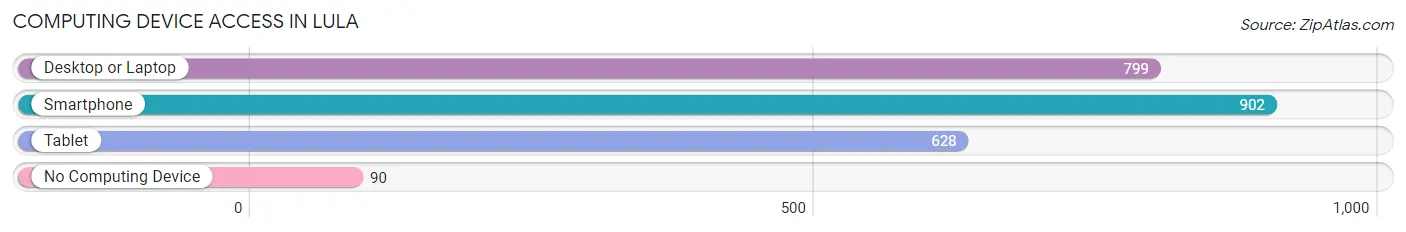
| Device Type | # Households | % Households |
| Desktop or Laptop | 799 | 76.1% |
| Smartphone | 902 | 85.9% |
| Tablet | 628 | 59.8% |
| No Computing Device | 90 | 8.6% |
| Total | 1,050 | 100.0% |
Internet Access in Lula
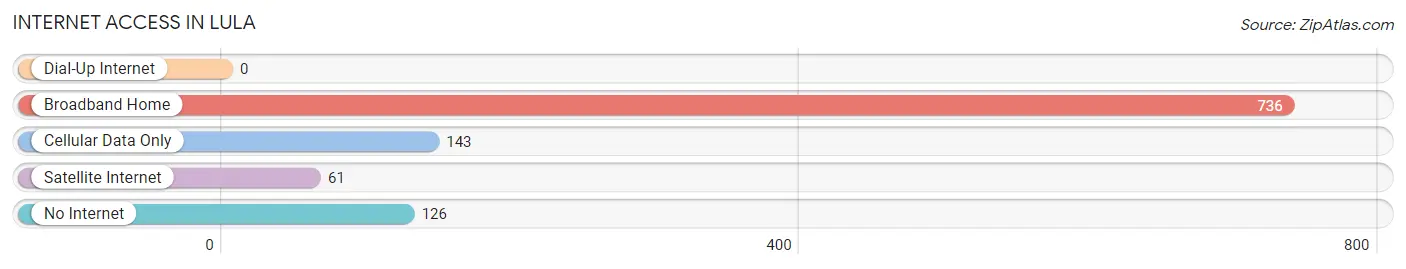
| Internet Type | # Households | % Households |
| Dial-Up Internet | 0 | 0.0% |
| Broadband Home | 736 | 70.1% |
| Cellular Data Only | 143 | 13.6% |
| Satellite Internet | 61 | 5.8% |
| No Internet | 126 | 12.0% |
| Total | 1,050 | 100.0% |
Lula Summary
Lula is a small city located in Hall County, Georgia, United States. It is situated in the foothills of the Blue Ridge Mountains, approximately 50 miles northeast of Atlanta. The city has a population of approximately 1,800 people and is part of the Gainesville, Georgia Metropolitan Statistical Area.
History
The city of Lula was founded in 1883 by the Lula Land Company. The company was formed by a group of investors from Atlanta who purchased the land from the Cherokee Indians. The city was named after the daughter of one of the investors, Lula Smith. The city was incorporated in 1887 and quickly became a thriving agricultural center. The city was known for its production of cotton, corn, and tobacco.
Geography
Lula is located in Hall County, Georgia, in the foothills of the Blue Ridge Mountains. The city is situated at an elevation of 890 feet above sea level. The city is located approximately 50 miles northeast of Atlanta and is part of the Gainesville, Georgia Metropolitan Statistical Area. The city is bordered by the Chattahoochee National Forest to the north and the city of Gainesville to the south.
Economy
The economy of Lula is largely based on agriculture. The city is known for its production of cotton, corn, and tobacco. In addition, the city is home to several manufacturing companies, including a paper mill and a furniture factory. The city also has a thriving tourism industry, with visitors coming to the area to enjoy the natural beauty of the Blue Ridge Mountains.
Demographics
As of the 2010 census, the population of Lula was 1,814. The racial makeup of the city was 79.2% White, 17.2% African American, 0.3% Native American, 0.7% Asian, 0.1% Pacific Islander, 1.2% from other races, and 1.3% from two or more races. Hispanic or Latino of any race were 3.2% of the population.
The median household income in Lula was $37,917, and the median family income was $45,938. The per capita income for the city was $19,945. About 15.2% of families and 18.2% of the population were below the poverty line, including 25.2% of those under age 18 and 11.2% of those age 65 or over.
Conclusion
Lula is a small city located in Hall County, Georgia, United States. It is situated in the foothills of the Blue Ridge Mountains, approximately 50 miles northeast of Atlanta. The city has a population of approximately 1,800 people and is part of the Gainesville, Georgia Metropolitan Statistical Area. The economy of Lula is largely based on agriculture, with the city being known for its production of cotton, corn, and tobacco. In addition, the city is home to several manufacturing companies and has a thriving tourism industry. The population of Lula is largely White, with African Americans, Native Americans, Asians, and Pacific Islanders making up the remainder of the population. The median household income in Lula is $37,917, and the median family income is $45,938. The city has a rich history and is a great place to visit and live.
Common Questions
What is Per Capita Income in Lula?
Per Capita income in Lula is $25,223.
What is the Median Family Income in Lula?
Median Family Income in Lula is $68,704.
What is the Median Household income in Lula?
Median Household Income in Lula is $60,174.
What is Income or Wage Gap in Lula?
Income or Wage Gap in Lula is 13.9%.
Women in Lula earn 86.1 cents for every dollar earned by a man.
What is Inequality or Gini Index in Lula?
Inequality or Gini Index in Lula is 0.37.
What is the Total Population of Lula?
Total Population of Lula is 2,880.
What is the Total Male Population of Lula?
Total Male Population of Lula is 1,416.
What is the Total Female Population of Lula?
Total Female Population of Lula is 1,464.
What is the Ratio of Males per 100 Females in Lula?
There are 96.72 Males per 100 Females in Lula.
What is the Ratio of Females per 100 Males in Lula?
There are 103.39 Females per 100 Males in Lula.
What is the Median Population Age in Lula?
Median Population Age in Lula is 38.4 Years.
What is the Average Family Size in Lula
Average Family Size in Lula is 3.2 People.
What is the Average Household Size in Lula
Average Household Size in Lula is 2.7 People.
How Large is the Labor Force in Lula?
There are 1,431 People in the Labor Forcein in Lula.
What is the Percentage of People in the Labor Force in Lula?
61.2% of People are in the Labor Force in Lula.
What is the Unemployment Rate in Lula?
Unemployment Rate in Lula is 2.2%.