Leslie, GA Map & Demographics
Leslie Map
Leslie Overview
$31,988
PER CAPITA INCOME
$80,000
AVG FAMILY INCOME
$51,688
AVG HOUSEHOLD INCOME
25.1%
WAGE / INCOME GAP [ % ]
74.9¢/ $1
WAGE / INCOME GAP [ $ ]
0.42
INEQUALITY / GINI INDEX
525
TOTAL POPULATION
291
MALE POPULATION
234
FEMALE POPULATION
124.36
MALES / 100 FEMALES
80.41
FEMALES / 100 MALES
40.3
MEDIAN AGE
4.1
AVG FAMILY SIZE
3.1
AVG HOUSEHOLD SIZE
221
LABOR FORCE [ PEOPLE ]
53.1%
PERCENT IN LABOR FORCE
4.1%
UNEMPLOYMENT RATE
Leslie Zip Codes
Leslie Area Codes
Income in Leslie
Income Overview in Leslie
Per Capita Income in Leslie is $31,988, while median incomes of families and households are $80,000 and $51,688 respectively.
| Characteristic | Number | Measure |
| Per Capita Income | 525 | $31,988 |
| Median Family Income | 106 | $80,000 |
| Mean Family Income | 106 | $86,122 |
| Median Household Income | 171 | $51,688 |
| Mean Household Income | 171 | $71,862 |
| Income Deficit | 106 | $0 |
| Wage / Income Gap (%) | 525 | 25.12% |
| Wage / Income Gap ($) | 525 | 74.88¢ per $1 |
| Gini / Inequality Index | 525 | 0.42 |
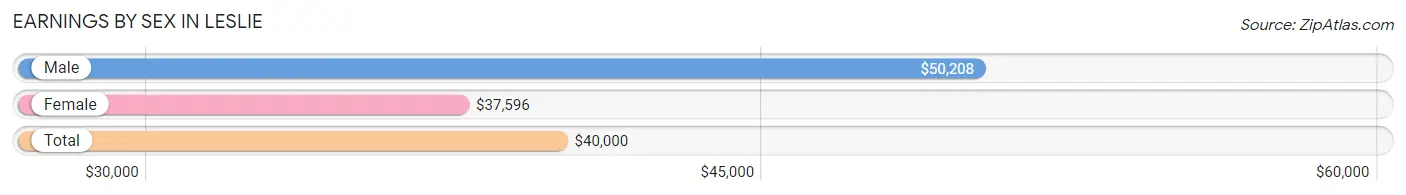
Earnings by Sex in Leslie
Average Earnings in Leslie are $40,000, $50,208 for men and $37,596 for women, a difference of 25.1%.
| Sex | Number | Average Earnings |
| Male | 109 (46.2%) | $50,208 |
| Female | 127 (53.8%) | $37,596 |
| Total | 236 (100.0%) | $40,000 |
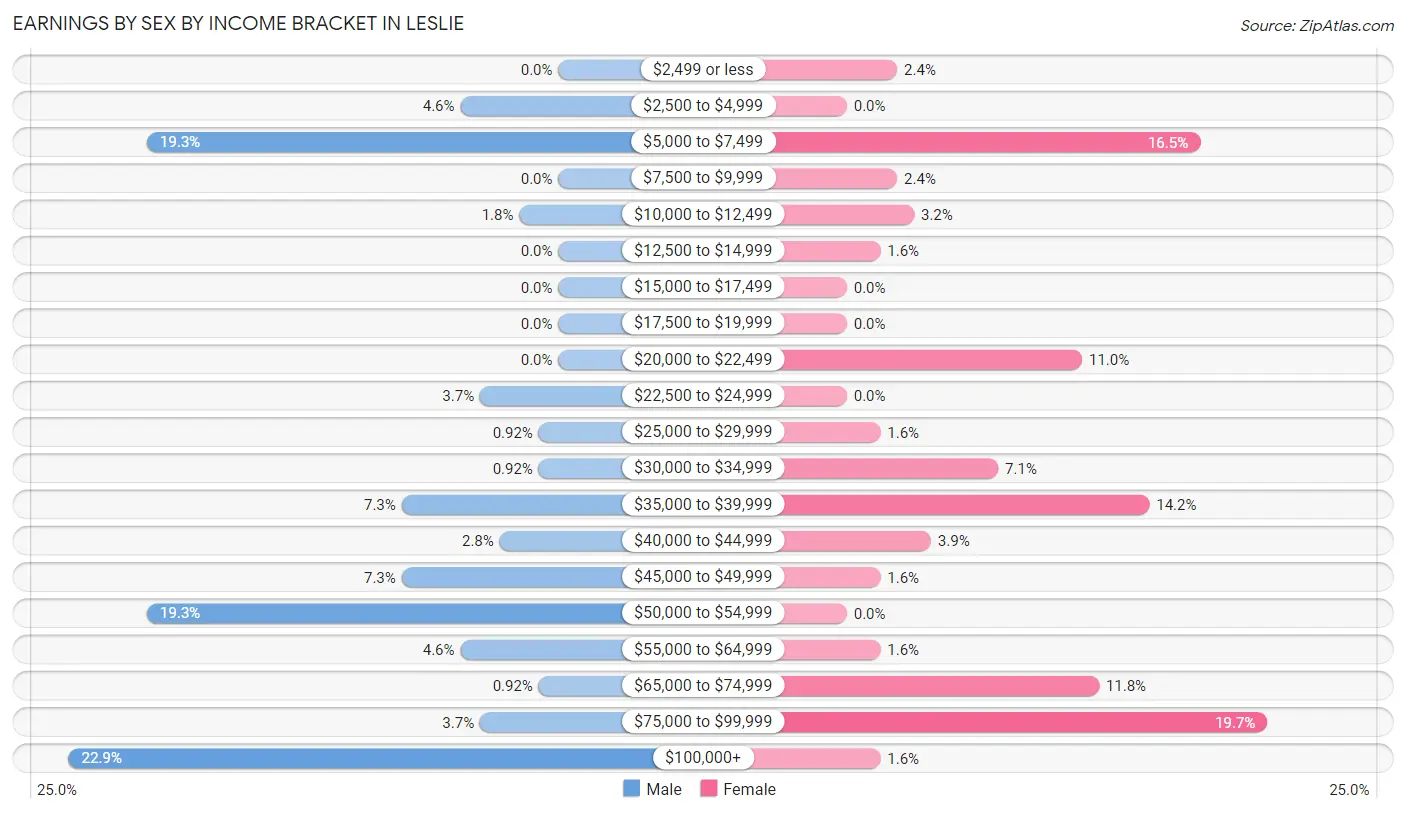
Earnings by Sex by Income Bracket in Leslie
The most common earnings brackets in Leslie are $100,000+ for men (25 | 22.9%) and $75,000 to $99,999 for women (25 | 19.7%).
| Income | Male | Female |
| $2,499 or less | 0 (0.0%) | 3 (2.4%) |
| $2,500 to $4,999 | 5 (4.6%) | 0 (0.0%) |
| $5,000 to $7,499 | 21 (19.3%) | 21 (16.5%) |
| $7,500 to $9,999 | 0 (0.0%) | 3 (2.4%) |
| $10,000 to $12,499 | 2 (1.8%) | 4 (3.2%) |
| $12,500 to $14,999 | 0 (0.0%) | 2 (1.6%) |
| $15,000 to $17,499 | 0 (0.0%) | 0 (0.0%) |
| $17,500 to $19,999 | 0 (0.0%) | 0 (0.0%) |
| $20,000 to $22,499 | 0 (0.0%) | 14 (11.0%) |
| $22,500 to $24,999 | 4 (3.7%) | 0 (0.0%) |
| $25,000 to $29,999 | 1 (0.9%) | 2 (1.6%) |
| $30,000 to $34,999 | 1 (0.9%) | 9 (7.1%) |
| $35,000 to $39,999 | 8 (7.3%) | 18 (14.2%) |
| $40,000 to $44,999 | 3 (2.8%) | 5 (3.9%) |
| $45,000 to $49,999 | 8 (7.3%) | 2 (1.6%) |
| $50,000 to $54,999 | 21 (19.3%) | 0 (0.0%) |
| $55,000 to $64,999 | 5 (4.6%) | 2 (1.6%) |
| $65,000 to $74,999 | 1 (0.9%) | 15 (11.8%) |
| $75,000 to $99,999 | 4 (3.7%) | 25 (19.7%) |
| $100,000+ | 25 (22.9%) | 2 (1.6%) |
| Total | 109 (100.0%) | 127 (100.0%) |
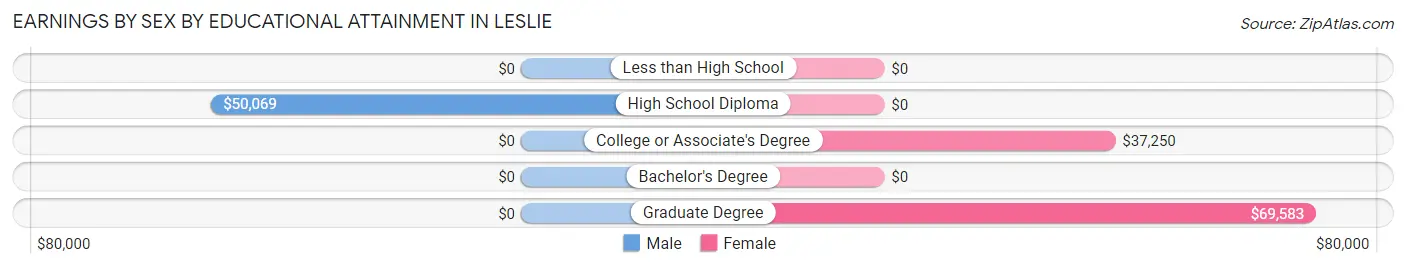
Earnings by Sex by Educational Attainment in Leslie
Average earnings in Leslie are $51,111 for men and $38,365 for women, a difference of 24.9%. Men with an educational attainment of high school diploma enjoy the highest average annual earnings of $50,069, while those with high school diploma education earn the least with $50,069. Women with an educational attainment of graduate degree earn the most with the average annual earnings of $69,583, while those with college or associate's degree education have the smallest earnings of $37,250.
| Educational Attainment | Male Income | Female Income |
| Less than High School | - | - |
| High School Diploma | $50,069 | $0 |
| College or Associate's Degree | - | - |
| Bachelor's Degree | - | - |
| Graduate Degree | - | - |
| Total | $51,111 | $38,365 |
Family Income in Leslie
Family Income Brackets in Leslie
According to the Leslie family income data, there are 40 families falling into the $100,000 to $149,999 income range, which is the most common income bracket and makes up 37.7% of all families. Conversely, the $200,000+ income bracket is the least frequent group with only 2 families (1.9%) belonging to this category.
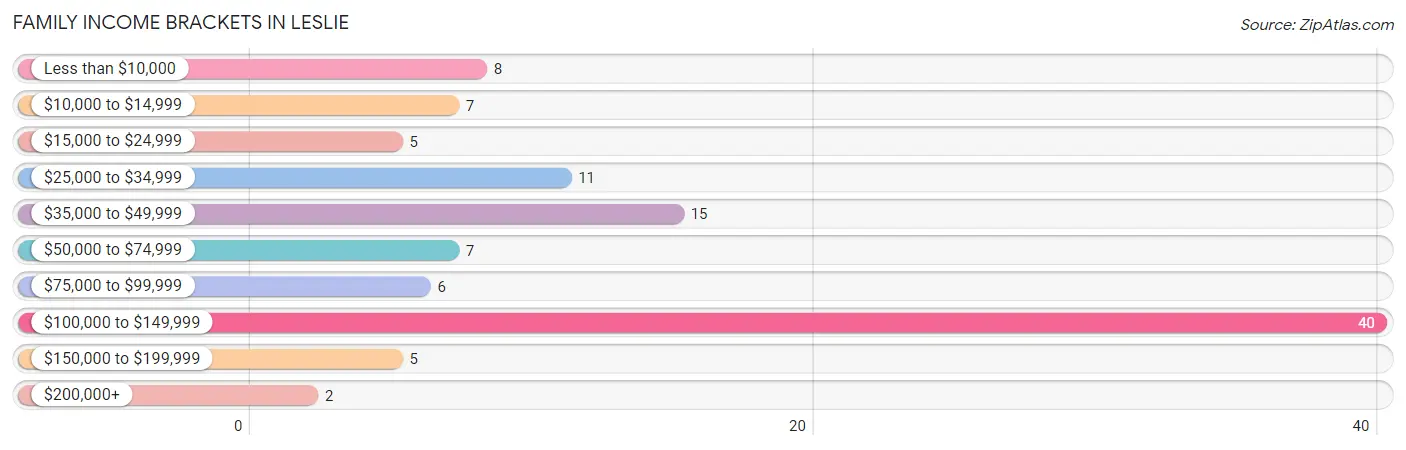
| Income Bracket | # Families | % Families |
| Less than $10,000 | 8 | 7.5% |
| $10,000 to $14,999 | 7 | 6.6% |
| $15,000 to $24,999 | 5 | 4.7% |
| $25,000 to $34,999 | 11 | 10.4% |
| $35,000 to $49,999 | 15 | 14.2% |
| $50,000 to $74,999 | 7 | 6.6% |
| $75,000 to $99,999 | 6 | 5.7% |
| $100,000 to $149,999 | 40 | 37.7% |
| $150,000 to $199,999 | 5 | 4.7% |
| $200,000+ | 2 | 1.9% |
Family Income by Famaliy Size in Leslie
3-person families (20 | 18.9%) account for the highest median family income in Leslie with $102,500 per family, while 3-person families (20 | 18.9%) have the highest median income of $34,167 per family member.
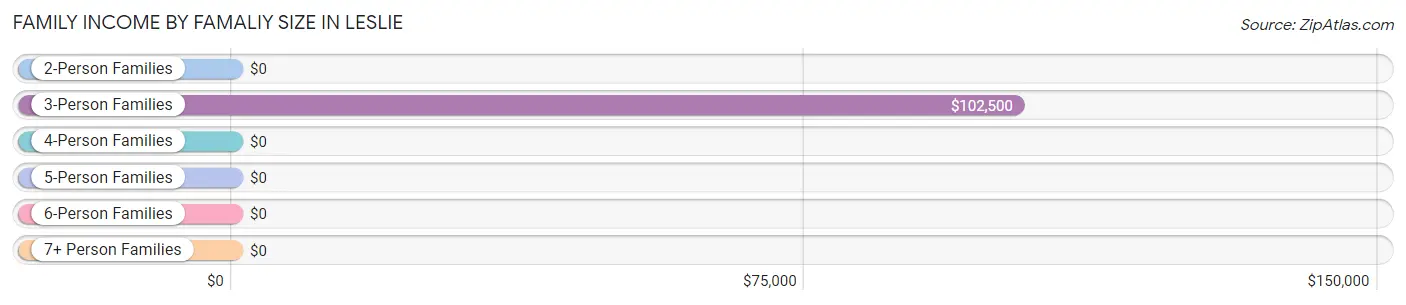
| Income Bracket | # Families | Median Income |
| 2-Person Families | 62 (58.5%) | $0 |
| 3-Person Families | 20 (18.9%) | $102,500 |
| 4-Person Families | 9 (8.5%) | $0 |
| 5-Person Families | 15 (14.1%) | $0 |
| 6-Person Families | 0 (0.0%) | $0 |
| 7+ Person Families | 0 (0.0%) | $0 |
| Total | 106 (100.0%) | $80,000 |
Family Income by Number of Earners in Leslie
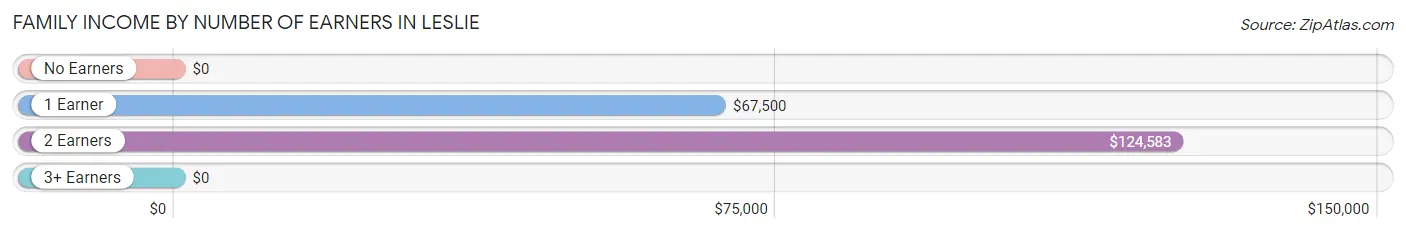
| Number of Earners | # Families | Median Income |
| No Earners | 17 (16.0%) | $0 |
| 1 Earner | 36 (34.0%) | $67,500 |
| 2 Earners | 47 (44.3%) | $124,583 |
| 3+ Earners | 6 (5.7%) | $0 |
| Total | 106 (100.0%) | $80,000 |
Household Income in Leslie
Household Income Brackets in Leslie
With 42 households falling in the category, the $100,000 to $149,999 income range is the most frequent in Leslie, accounting for 24.6% of all households. In contrast, only 2 households (1.2%) fall into the $200,000+ income bracket, making it the least populous group.
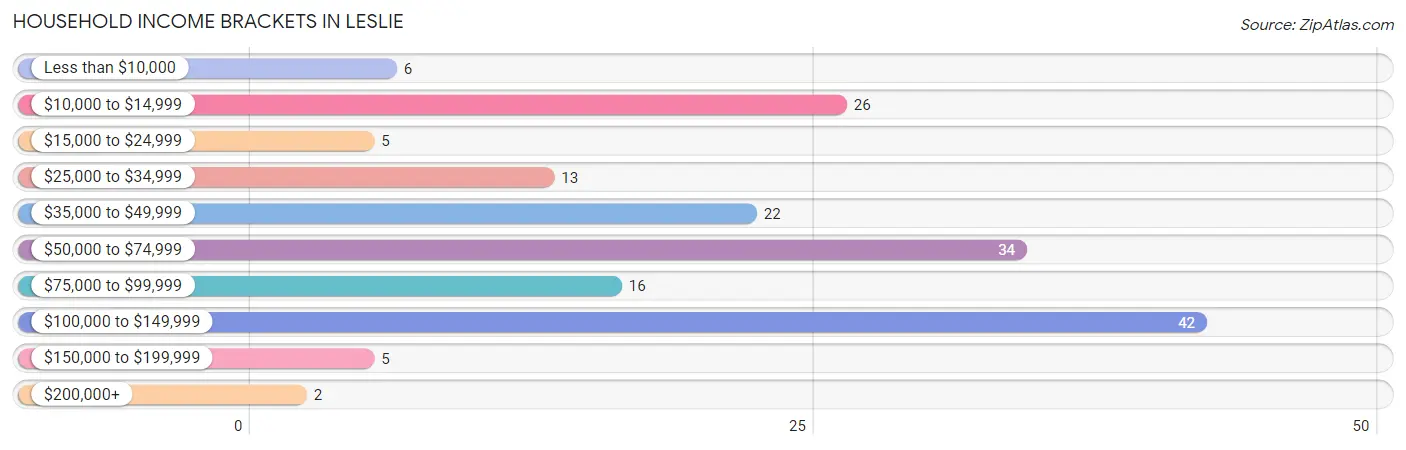
| Income Bracket | # Households | % Households |
| Less than $10,000 | 6 | 3.5% |
| $10,000 to $14,999 | 26 | 15.2% |
| $15,000 to $24,999 | 5 | 2.9% |
| $25,000 to $34,999 | 13 | 7.6% |
| $35,000 to $49,999 | 22 | 12.9% |
| $50,000 to $74,999 | 34 | 19.9% |
| $75,000 to $99,999 | 16 | 9.4% |
| $100,000 to $149,999 | 42 | 24.6% |
| $150,000 to $199,999 | 5 | 2.9% |
| $200,000+ | 2 | 1.2% |
Household Income by Householder Age in Leslie
The median household income in Leslie is $51,688, with the highest median household income of $52,222 found in the 45 to 64 years age bracket for the primary householder. A total of 90 households (52.6%) fall into this category.
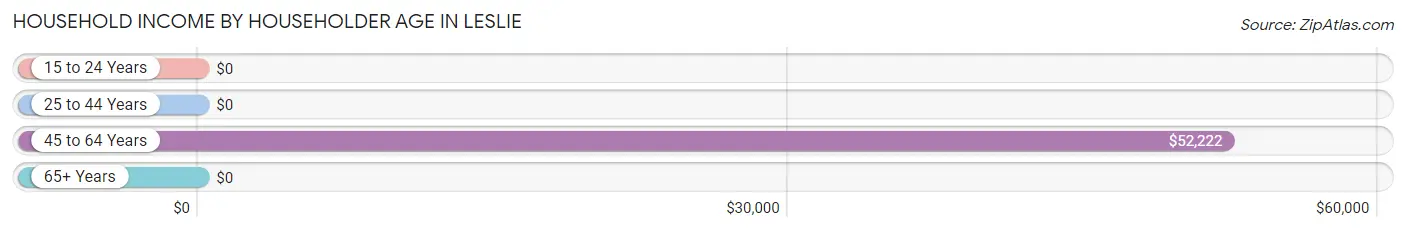
| Income Bracket | # Households | Median Income |
| 15 to 24 Years | 0 (0.0%) | $0 |
| 25 to 44 Years | 35 (20.5%) | $0 |
| 45 to 64 Years | 90 (52.6%) | $52,222 |
| 65+ Years | 46 (26.9%) | $0 |
| Total | 171 (100.0%) | $51,688 |
Poverty in Leslie
Income Below Poverty by Sex and Age in Leslie
With 40.9% poverty level for males and 32.1% for females among the residents of Leslie, 6 to 11 year old males and 25 to 34 year old females are the most vulnerable to poverty, with 8 males (100.0%) and 5 females (100.0%) in their respective age groups living below the poverty level.
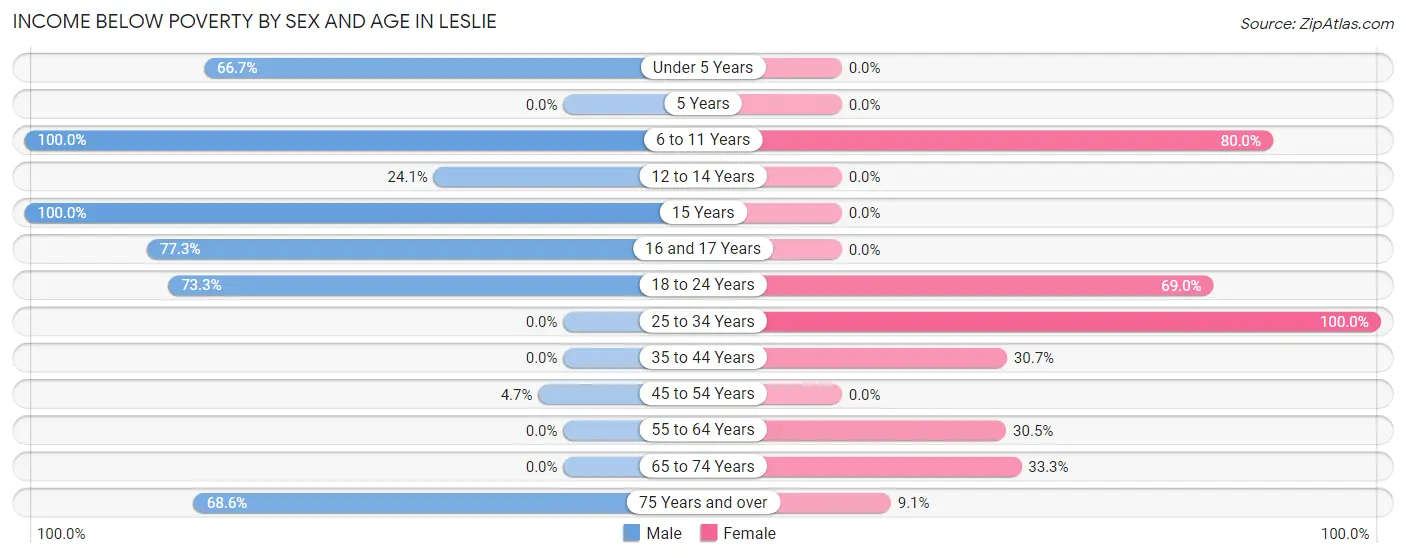
| Age Bracket | Male | Female |
| Under 5 Years | 4 (66.7%) | 0 (0.0%) |
| 5 Years | 0 (0.0%) | 0 (0.0%) |
| 6 to 11 Years | 8 (100.0%) | 8 (80.0%) |
| 12 to 14 Years | 13 (24.1%) | 0 (0.0%) |
| 15 Years | 18 (100.0%) | 0 (0.0%) |
| 16 and 17 Years | 17 (77.3%) | 0 (0.0%) |
| 18 to 24 Years | 33 (73.3%) | 20 (69.0%) |
| 25 to 34 Years | 0 (0.0%) | 5 (100.0%) |
| 35 to 44 Years | 0 (0.0%) | 19 (30.6%) |
| 45 to 54 Years | 2 (4.6%) | 0 (0.0%) |
| 55 to 64 Years | 0 (0.0%) | 18 (30.5%) |
| 65 to 74 Years | 0 (0.0%) | 4 (33.3%) |
| 75 Years and over | 24 (68.6%) | 1 (9.1%) |
| Total | 119 (40.9%) | 75 (32.1%) |
Income Above Poverty by Sex and Age in Leslie
According to the poverty statistics in Leslie, males aged 5 years and females aged 12 to 14 years are the age groups that are most secure financially, with 100.0% of males and 100.0% of females in these age groups living above the poverty line.
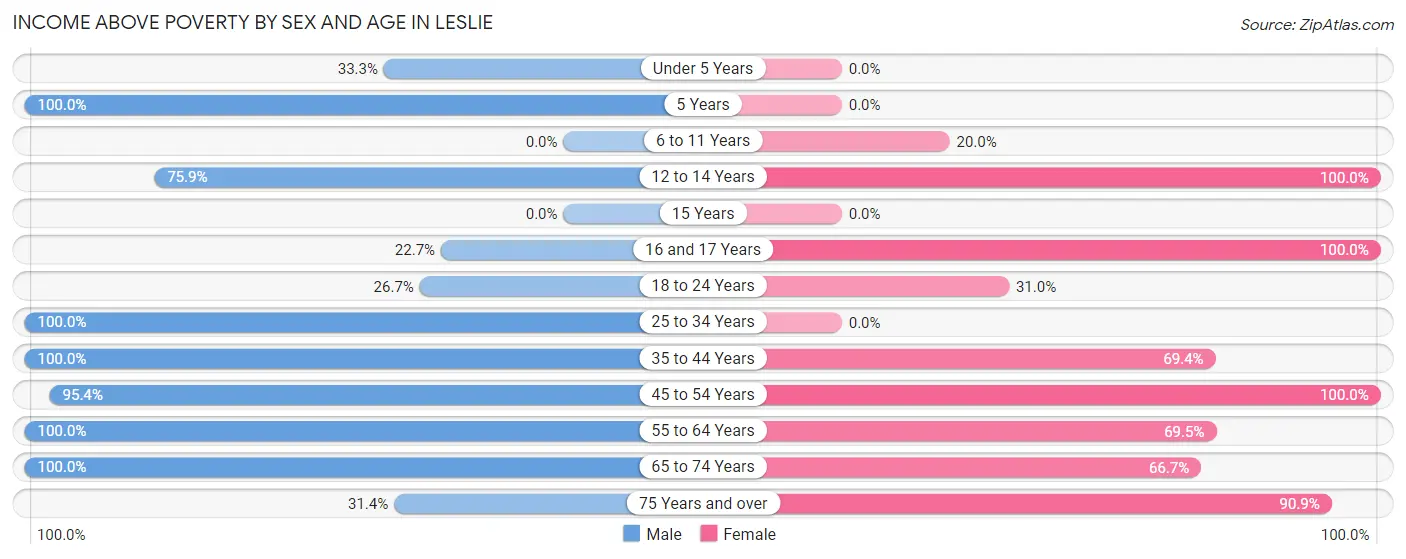
| Age Bracket | Male | Female |
| Under 5 Years | 2 (33.3%) | 0 (0.0%) |
| 5 Years | 5 (100.0%) | 0 (0.0%) |
| 6 to 11 Years | 0 (0.0%) | 2 (20.0%) |
| 12 to 14 Years | 41 (75.9%) | 8 (100.0%) |
| 15 Years | 0 (0.0%) | 0 (0.0%) |
| 16 and 17 Years | 5 (22.7%) | 6 (100.0%) |
| 18 to 24 Years | 12 (26.7%) | 9 (31.0%) |
| 25 to 34 Years | 6 (100.0%) | 0 (0.0%) |
| 35 to 44 Years | 16 (100.0%) | 43 (69.4%) |
| 45 to 54 Years | 41 (95.4%) | 32 (100.0%) |
| 55 to 64 Years | 24 (100.0%) | 41 (69.5%) |
| 65 to 74 Years | 9 (100.0%) | 8 (66.7%) |
| 75 Years and over | 11 (31.4%) | 10 (90.9%) |
| Total | 172 (59.1%) | 159 (67.9%) |
Income Below Poverty Among Married-Couple Families in Leslie
The poverty statistics for married-couple families in Leslie show that 7.1% or 5 of the total 70 families live below the poverty line. Families with 1 or 2 children have the highest poverty rate of 11.1%, comprising of 1 families. On the other hand, families with no children have the lowest poverty rate of 6.6%, which includes 4 families.
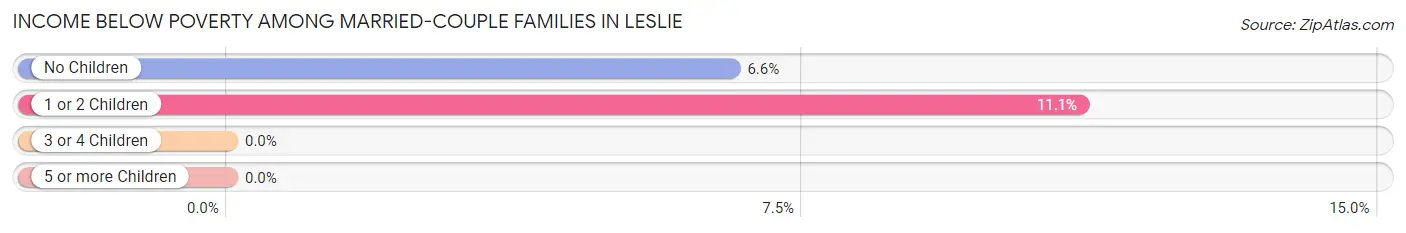
| Children | Above Poverty | Below Poverty |
| No Children | 57 (93.4%) | 4 (6.6%) |
| 1 or 2 Children | 8 (88.9%) | 1 (11.1%) |
| 3 or 4 Children | 0 (0.0%) | 0 (0.0%) |
| 5 or more Children | 0 (0.0%) | 0 (0.0%) |
| Total | 65 (92.9%) | 5 (7.1%) |
Income Below Poverty Among Single-Parent Households in Leslie
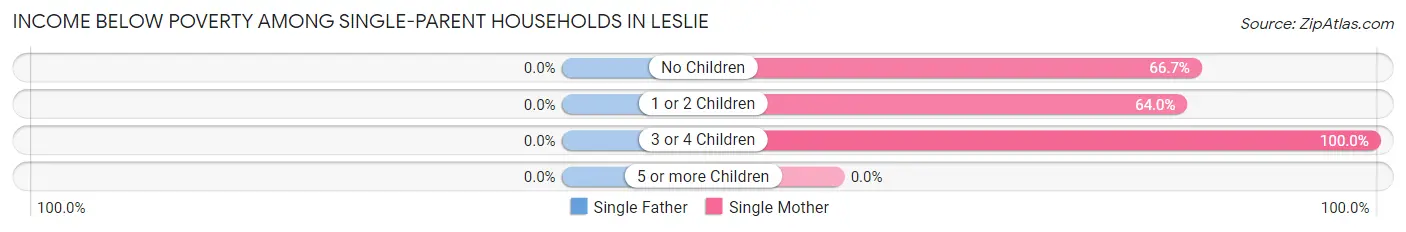
| Children | Single Father | Single Mother |
| No Children | 0 (0.0%) | 2 (66.7%) |
| 1 or 2 Children | 0 (0.0%) | 16 (64.0%) |
| 3 or 4 Children | 0 (0.0%) | 5 (100.0%) |
| 5 or more Children | 0 (0.0%) | 0 (0.0%) |
| Total | 0 (0.0%) | 23 (69.7%) |
Income Below Poverty Among Married-Couple vs Single-Parent Households in Leslie
The poverty data for Leslie shows that 5 of the married-couple family households (7.1%) and 23 of the single-parent households (63.9%) are living below the poverty level. Within the married-couple family households, those with 1 or 2 children have the highest poverty rate, with 1 households (11.1%) falling below the poverty line. Among the single-parent households, those with 3 or 4 children have the highest poverty rate, with 5 household (100.0%) living below poverty.
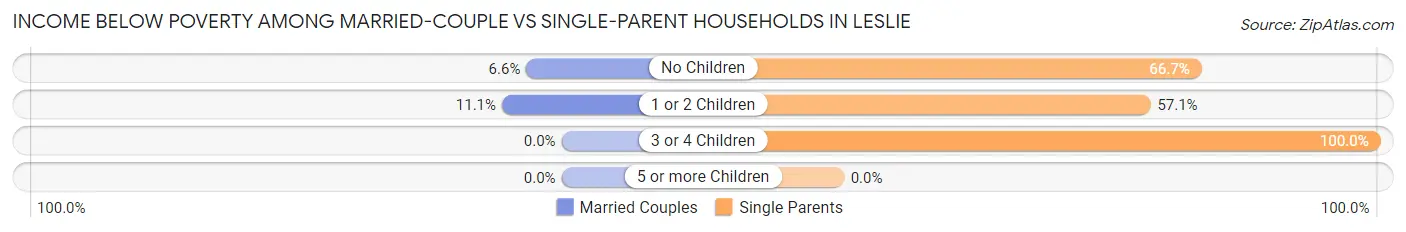
| Children | Married-Couple Families | Single-Parent Households |
| No Children | 4 (6.6%) | 2 (66.7%) |
| 1 or 2 Children | 1 (11.1%) | 16 (57.1%) |
| 3 or 4 Children | 0 (0.0%) | 5 (100.0%) |
| 5 or more Children | 0 (0.0%) | 0 (0.0%) |
| Total | 5 (7.1%) | 23 (63.9%) |
Race in Leslie
The most populous races in Leslie are Black / African American (303 | 57.7%), White / Caucasian (221 | 42.1%), and Asian (1 | 0.2%).
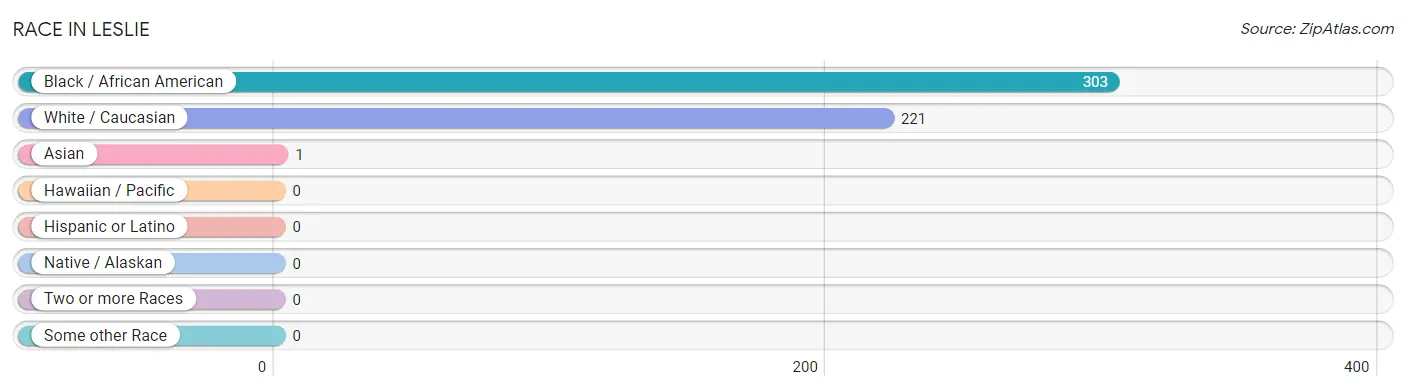
| Race | # Population | % Population |
| Asian | 1 | 0.2% |
| Black / African American | 303 | 57.7% |
| Hawaiian / Pacific | 0 | 0.0% |
| Hispanic or Latino | 0 | 0.0% |
| Native / Alaskan | 0 | 0.0% |
| White / Caucasian | 221 | 42.1% |
| Two or more Races | 0 | 0.0% |
| Some other Race | 0 | 0.0% |
| Total | 525 | 100.0% |
Ancestry in Leslie
The most populous ancestries reported in Leslie are English (31 | 5.9%), American (25 | 4.8%), Scottish (15 | 2.9%), European (14 | 2.7%), and Irish (11 | 2.1%), together accounting for 18.3% of all Leslie residents.
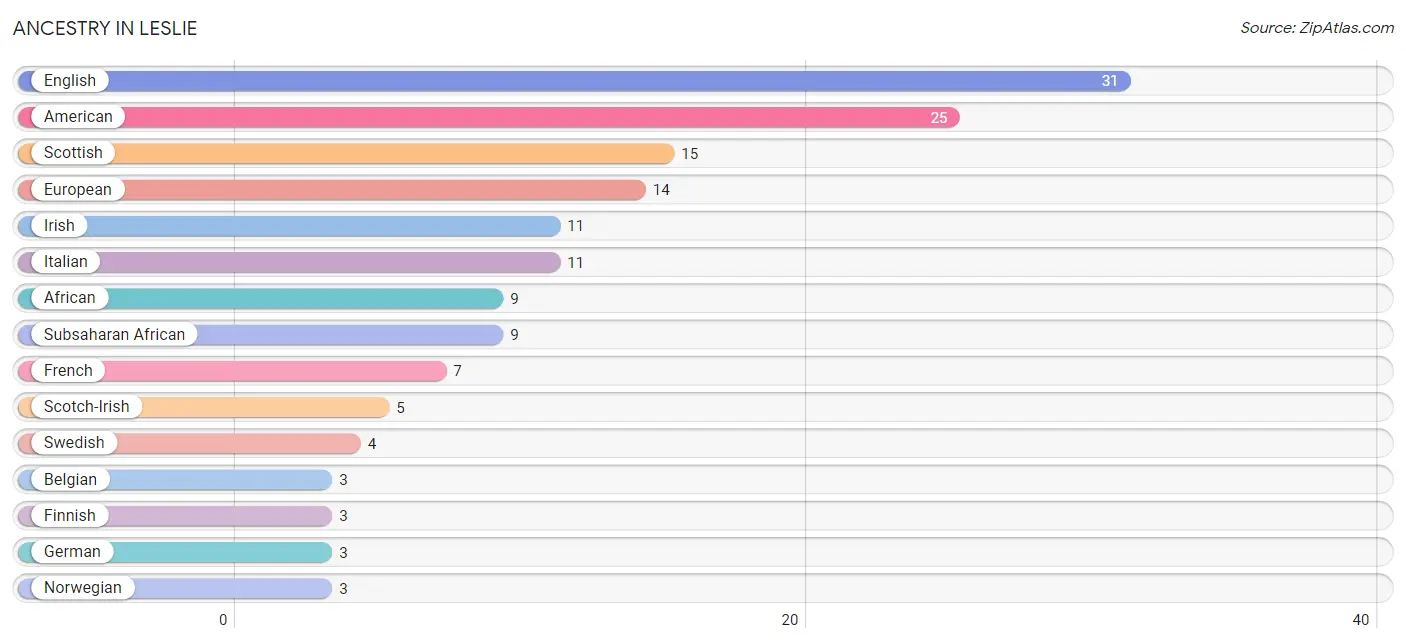
| Ancestry | # Population | % Population |
| African | 9 | 1.7% |
| American | 25 | 4.8% |
| Belgian | 3 | 0.6% |
| Bhutanese | 1 | 0.2% |
| Dutch | 1 | 0.2% |
| English | 31 | 5.9% |
| European | 14 | 2.7% |
| Finnish | 3 | 0.6% |
| French | 7 | 1.3% |
| German | 3 | 0.6% |
| Irish | 11 | 2.1% |
| Italian | 11 | 2.1% |
| Norwegian | 3 | 0.6% |
| Scotch-Irish | 5 | 0.9% |
| Scottish | 15 | 2.9% |
| Subsaharan African | 9 | 1.7% |
| Swedish | 4 | 0.8% | View All 17 Rows |
Immigrants in Leslie
The most numerous immigrant groups reported in Leslie came from Asia (1 | 0.2%), Eastern Asia (1 | 0.2%), and Japan (1 | 0.2%), together accounting for 0.6% of all Leslie residents.
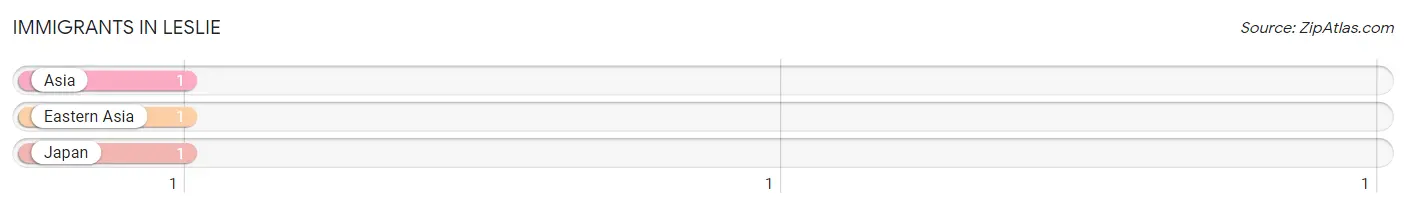
| Immigration Origin | # Population | % Population |
| Asia | 1 | 0.2% |
| Eastern Asia | 1 | 0.2% |
| Japan | 1 | 0.2% | View All 3 Rows |
Sex and Age in Leslie
Sex and Age in Leslie
The most populous age groups in Leslie are 15 to 19 Years (70 | 24.0%) for men and 55 to 59 Years (43 | 18.4%) for women.
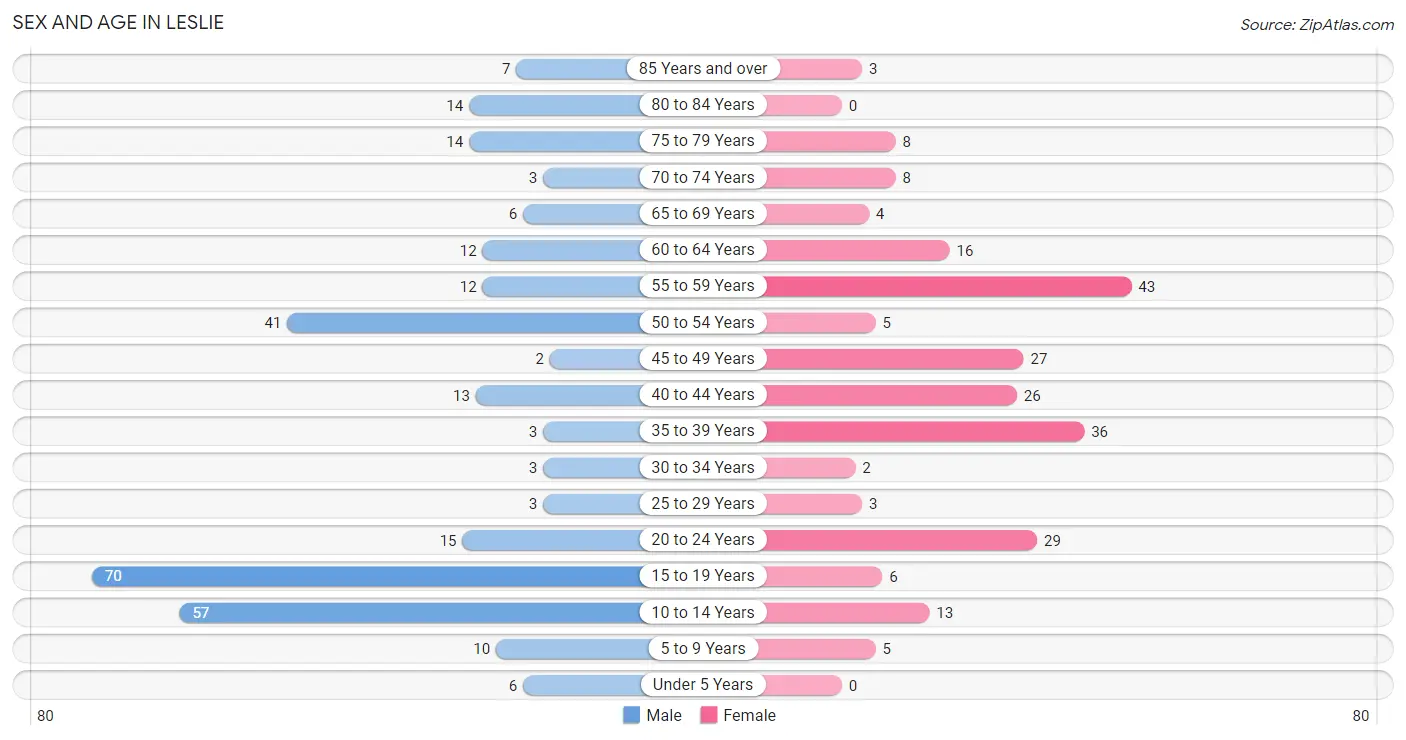
| Age Bracket | Male | Female |
| Under 5 Years | 6 (2.1%) | 0 (0.0%) |
| 5 to 9 Years | 10 (3.4%) | 5 (2.1%) |
| 10 to 14 Years | 57 (19.6%) | 13 (5.6%) |
| 15 to 19 Years | 70 (24.0%) | 6 (2.6%) |
| 20 to 24 Years | 15 (5.1%) | 29 (12.4%) |
| 25 to 29 Years | 3 (1.0%) | 3 (1.3%) |
| 30 to 34 Years | 3 (1.0%) | 2 (0.9%) |
| 35 to 39 Years | 3 (1.0%) | 36 (15.4%) |
| 40 to 44 Years | 13 (4.5%) | 26 (11.1%) |
| 45 to 49 Years | 2 (0.7%) | 27 (11.5%) |
| 50 to 54 Years | 41 (14.1%) | 5 (2.1%) |
| 55 to 59 Years | 12 (4.1%) | 43 (18.4%) |
| 60 to 64 Years | 12 (4.1%) | 16 (6.8%) |
| 65 to 69 Years | 6 (2.1%) | 4 (1.7%) |
| 70 to 74 Years | 3 (1.0%) | 8 (3.4%) |
| 75 to 79 Years | 14 (4.8%) | 8 (3.4%) |
| 80 to 84 Years | 14 (4.8%) | 0 (0.0%) |
| 85 Years and over | 7 (2.4%) | 3 (1.3%) |
| Total | 291 (100.0%) | 234 (100.0%) |
Families and Households in Leslie
Median Family Size in Leslie
The median family size in Leslie is 4.14 persons per family, with single female/mother families (33 | 31.1%) accounting for the largest median family size of 6.79 persons per family. On the other hand, single male/father families (3 | 2.8%) represent the smallest median family size with 2.67 persons per family.
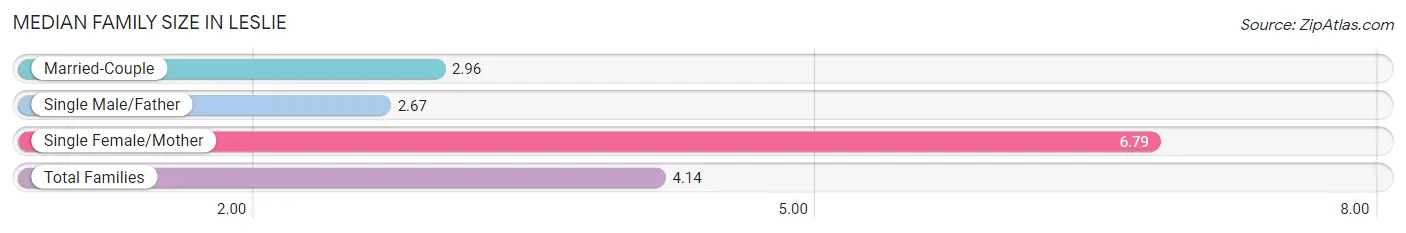
| Family Type | # Families | Family Size |
| Married-Couple | 70 (66.0%) | 2.96 |
| Single Male/Father | 3 (2.8%) | 2.67 |
| Single Female/Mother | 33 (31.1%) | 6.79 |
| Total Families | 106 (100.0%) | 4.14 |
Median Household Size in Leslie
The median household size in Leslie is 3.07 persons per household, with single female/mother households (33 | 19.3%) accounting for the largest median household size of 6.94 persons per household. non-family households (65 | 38.0%) represent the smallest median household size with 1.20 persons per household.
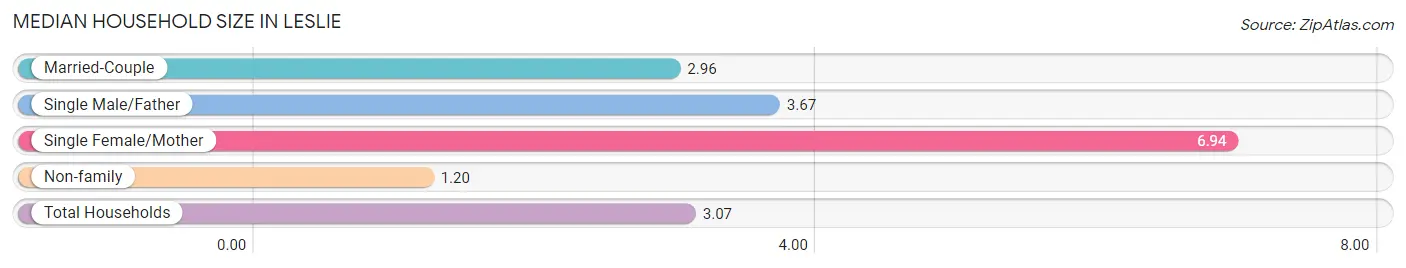
| Household Type | # Households | Household Size |
| Married-Couple | 70 (40.9%) | 2.96 |
| Single Male/Father | 3 (1.8%) | 3.67 |
| Single Female/Mother | 33 (19.3%) | 6.94 |
| Non-family | 65 (38.0%) | 1.20 |
| Total Households | 171 (100.0%) | 3.07 |
Household Size by Marriage Status in Leslie
Out of a total of 171 households in Leslie, 106 (62.0%) are family households, while 65 (38.0%) are nonfamily households. The most numerous type of family households are 2-person households, comprising 56, and the most common type of nonfamily households are 1-person households, comprising 47.
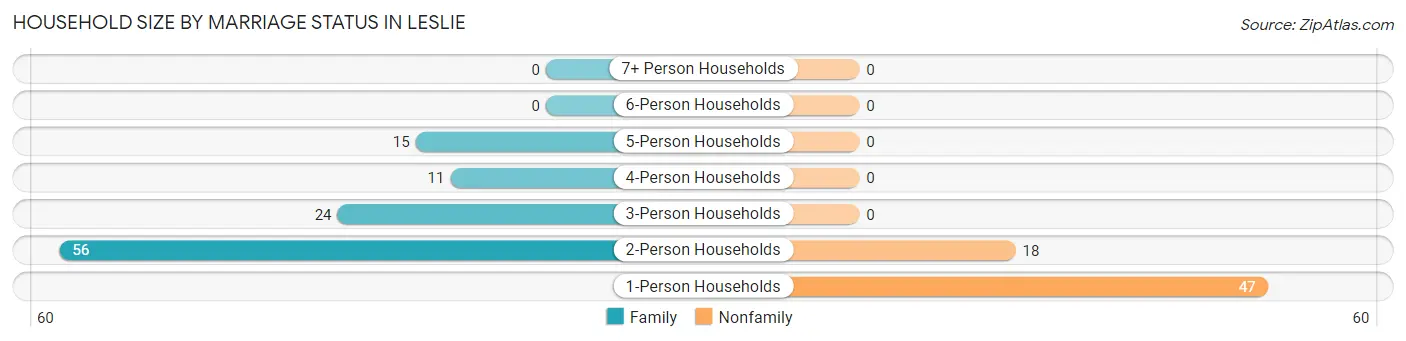
| Household Size | Family Households | Nonfamily Households |
| 1-Person Households | - | 47 (27.5%) |
| 2-Person Households | 56 (32.8%) | 18 (10.5%) |
| 3-Person Households | 24 (14.0%) | 0 (0.0%) |
| 4-Person Households | 11 (6.4%) | 0 (0.0%) |
| 5-Person Households | 15 (8.8%) | 0 (0.0%) |
| 6-Person Households | 0 (0.0%) | 0 (0.0%) |
| 7+ Person Households | 0 (0.0%) | 0 (0.0%) |
| Total | 106 (62.0%) | 65 (38.0%) |
Female Fertility in Leslie
Fertility by Age in Leslie
Average fertility rate in Leslie is 61.0 births per 1,000 women. Women in the age bracket of 20 to 34 years have the highest fertility rate with 147.0 births per 1,000 women. Women in the age bracket of 20 to 34 years acount for 62.5% of all women with births.
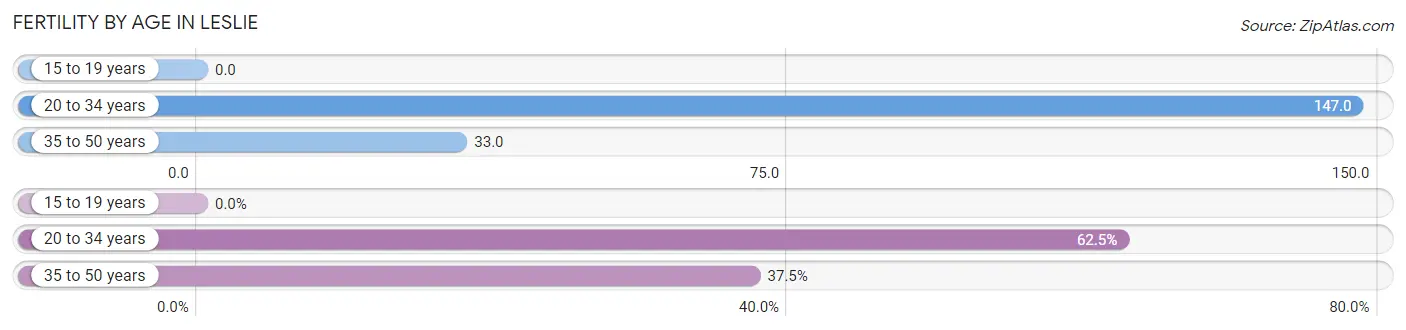
| Age Bracket | Women with Births | Births / 1,000 Women |
| 15 to 19 years | 0 (0.0%) | 0.0 |
| 20 to 34 years | 5 (62.5%) | 147.0 |
| 35 to 50 years | 3 (37.5%) | 33.0 |
| Total | 8 (100.0%) | 61.0 |
Fertility by Age by Marriage Status in Leslie
37.5% of women with births (8) in Leslie are married. The highest percentage of unmarried women with births falls into 20 to 34 years age bracket with 100.0% of them unmarried at the time of birth, while the lowest percentage of unmarried women with births belong to 35 to 50 years age bracket with 0.0% of them unmarried.
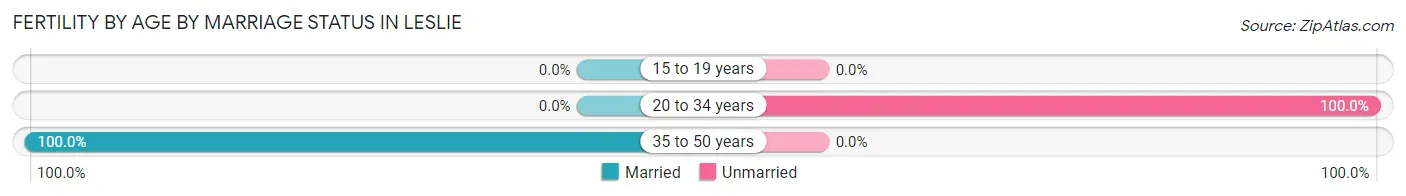
| Age Bracket | Married | Unmarried |
| 15 to 19 years | 0 (0.0%) | 0 (0.0%) |
| 20 to 34 years | 0 (0.0%) | 5 (100.0%) |
| 35 to 50 years | 3 (100.0%) | 0 (0.0%) |
| Total | 3 (37.5%) | 5 (62.5%) |
Fertility by Education in Leslie
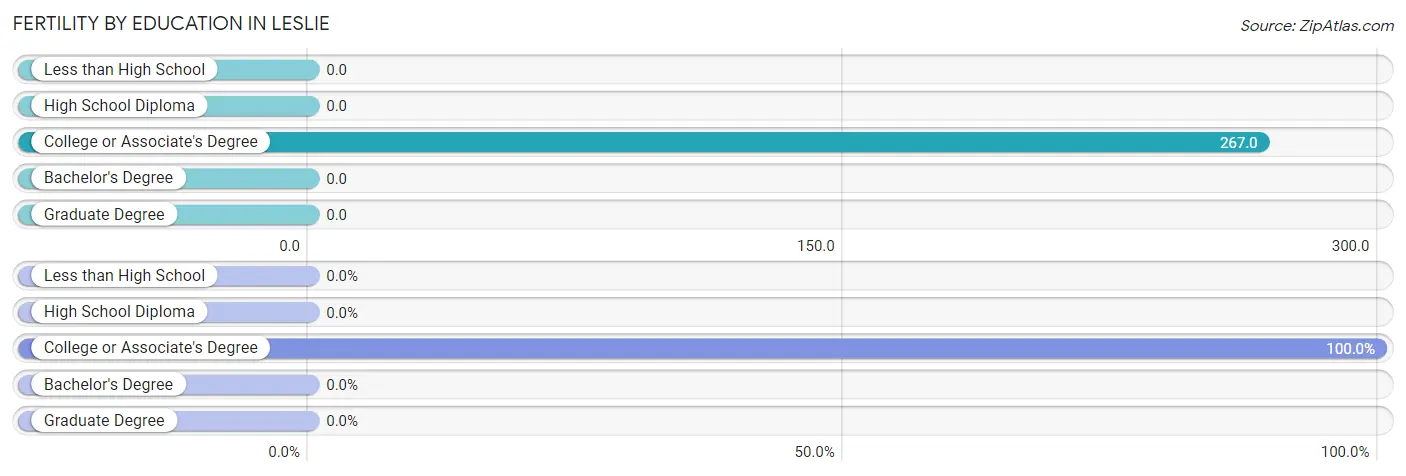
| Educational Attainment | Women with Births | Births / 1,000 Women |
| Less than High School | 0 (0.0%) | 0.0 |
| High School Diploma | 0 (0.0%) | 0.0 |
| College or Associate's Degree | 8 (100.0%) | 267.0 |
| Bachelor's Degree | 0 (0.0%) | 0.0 |
| Graduate Degree | 0 (0.0%) | 0.0 |
| Total | 8 (100.0%) | 61.0 |
Fertility by Education by Marriage Status in Leslie
62.5% of women with births in Leslie are unmarried. Women with the educational attainment of college or associate's degree are most likely to be married with 37.5% of them married at childbirth, while women with the educational attainment of college or associate's degree are least likely to be married with 62.5% of them unmarried at childbirth.
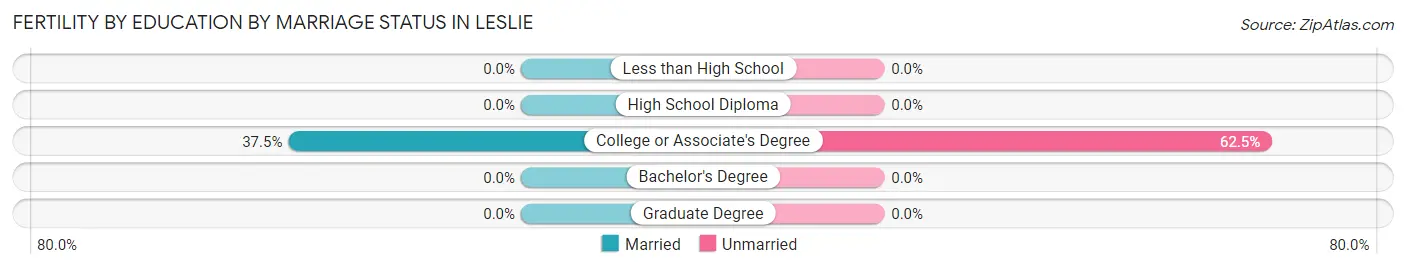
| Educational Attainment | Married | Unmarried |
| Less than High School | 0 (0.0%) | 0 (0.0%) |
| High School Diploma | 0 (0.0%) | 0 (0.0%) |
| College or Associate's Degree | 3 (37.5%) | 5 (62.5%) |
| Bachelor's Degree | 0 (0.0%) | 0 (0.0%) |
| Graduate Degree | 0 (0.0%) | 0 (0.0%) |
| Total | 3 (37.5%) | 5 (62.5%) |
Employment Characteristics in Leslie
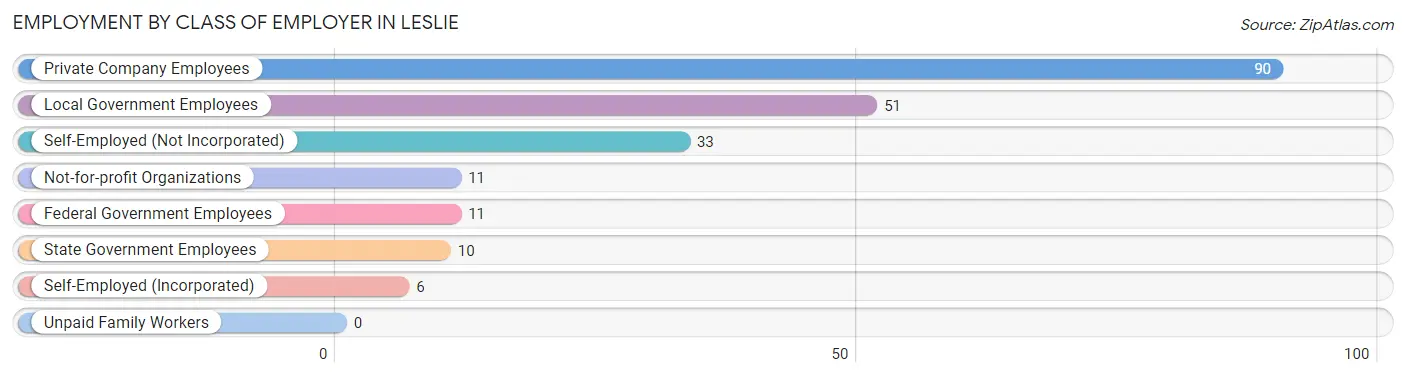
Employment by Class of Employer in Leslie
Among the 212 employed individuals in Leslie, private company employees (90 | 42.4%), local government employees (51 | 24.1%), and self-employed (not incorporated) (33 | 15.6%) make up the most common classes of employment.
| Employer Class | # Employees | % Employees |
| Private Company Employees | 90 | 42.4% |
| Self-Employed (Incorporated) | 6 | 2.8% |
| Self-Employed (Not Incorporated) | 33 | 15.6% |
| Not-for-profit Organizations | 11 | 5.2% |
| Local Government Employees | 51 | 24.1% |
| State Government Employees | 10 | 4.7% |
| Federal Government Employees | 11 | 5.2% |
| Unpaid Family Workers | 0 | 0.0% |
| Total | 212 | 100.0% |
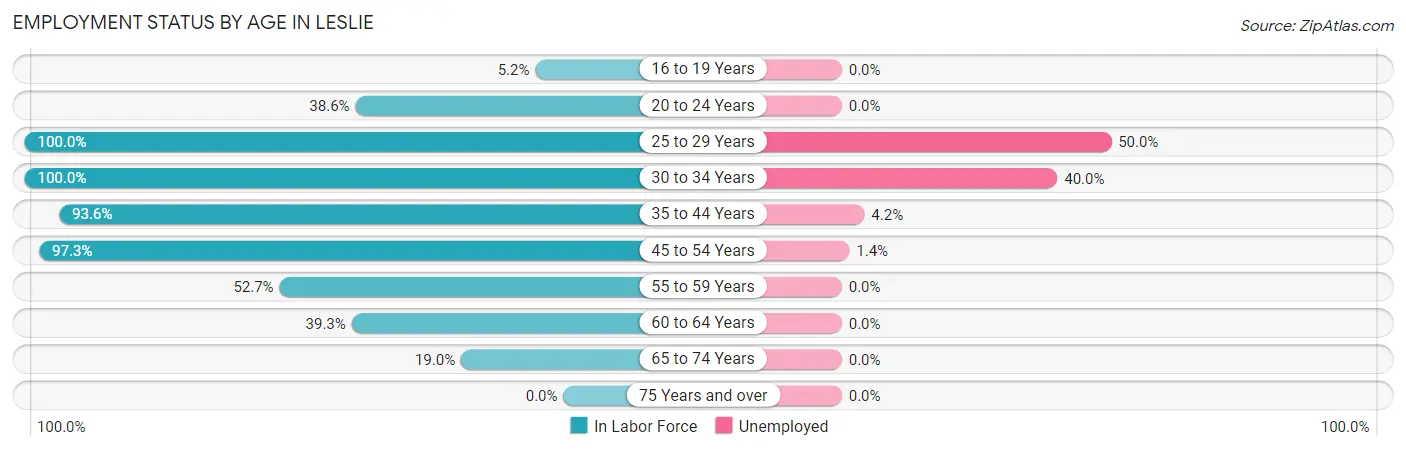
Employment Status by Age in Leslie
According to the labor force statistics for Leslie, out of the total population over 16 years of age (416), 53.1% or 221 individuals are in the labor force, with 4.1% or 9 of them unemployed. The age group with the highest labor force participation rate is 25 to 29 years, with 100.0% or 6 individuals in the labor force. Within the labor force, the 25 to 29 years age range has the highest percentage of unemployed individuals, with 50.0% or 3 of them being unemployed.
| Age Bracket | In Labor Force | Unemployed |
| 16 to 19 Years | 3 (5.2%) | 0 (0.0%) |
| 20 to 24 Years | 17 (38.6%) | 0 (0.0%) |
| 25 to 29 Years | 6 (100.0%) | 3 (50.0%) |
| 30 to 34 Years | 5 (100.0%) | 2 (40.0%) |
| 35 to 44 Years | 73 (93.6%) | 3 (4.2%) |
| 45 to 54 Years | 73 (97.3%) | 1 (1.4%) |
| 55 to 59 Years | 29 (52.7%) | 0 (0.0%) |
| 60 to 64 Years | 11 (39.3%) | 0 (0.0%) |
| 65 to 74 Years | 4 (19.0%) | 0 (0.0%) |
| 75 Years and over | 0 (0.0%) | 0 (0.0%) |
| Total | 221 (53.1%) | 9 (4.1%) |
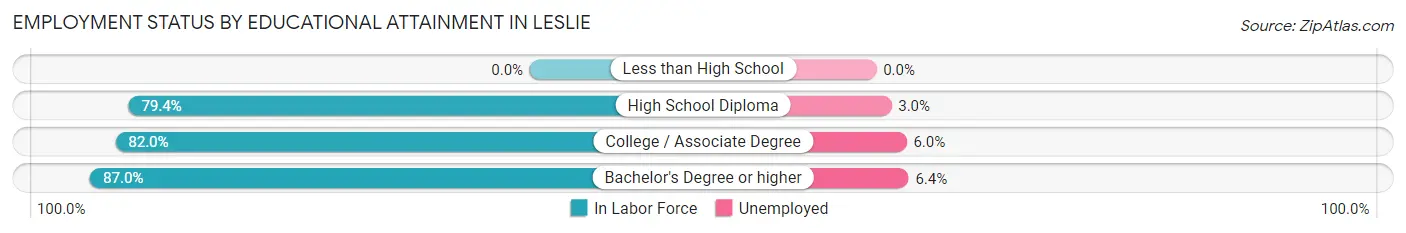
Employment Status by Educational Attainment in Leslie
According to labor force statistics for Leslie, 79.8% of individuals (197) out of the total population between 25 and 64 years of age (247) are in the labor force, with 4.6% or 9 of them being unemployed. The group with the highest labor force participation rate are those with the educational attainment of bachelor's degree or higher, with 87.0% or 47 individuals in the labor force. Within the labor force, individuals with bachelor's degree or higher education have the highest percentage of unemployment, with 6.4% or 3 of them being unemployed.
| Educational Attainment | In Labor Force | Unemployed |
| Less than High School | 0 (0.0%) | 0 (0.0%) |
| High School Diploma | 100 (79.4%) | 4 (3.0%) |
| College / Associate Degree | 50 (82.0%) | 4 (6.0%) |
| Bachelor's Degree or higher | 47 (87.0%) | 3 (6.4%) |
| Total | 197 (79.8%) | 11 (4.6%) |
Employment Occupations by Sex in Leslie
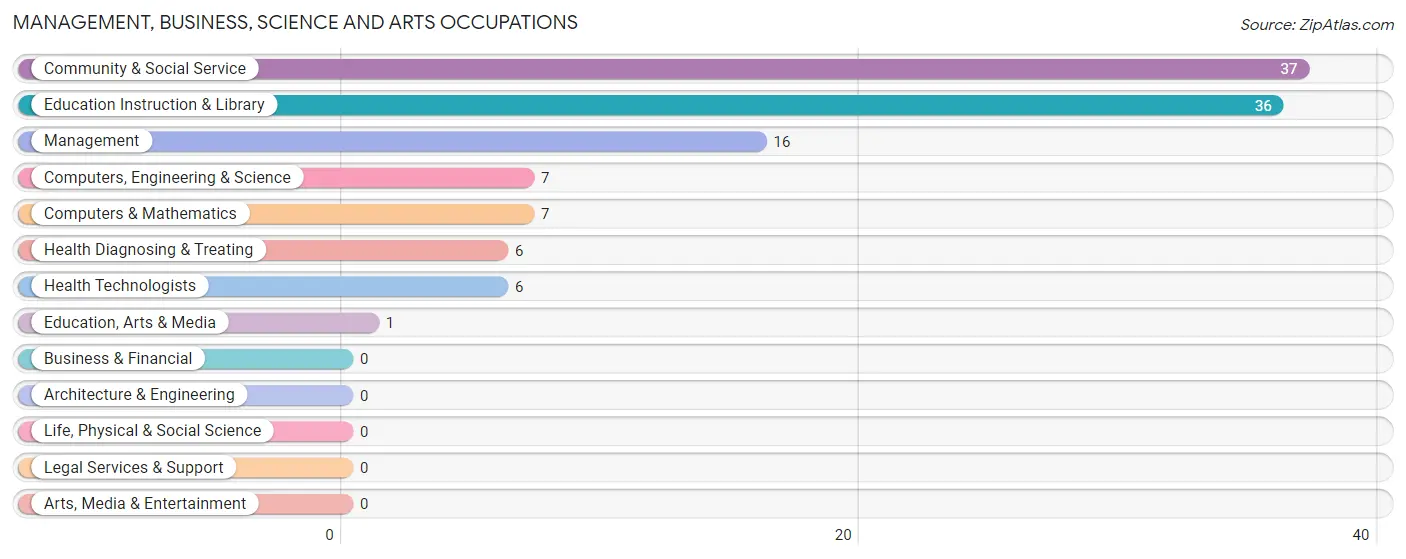
Management, Business, Science and Arts Occupations
The most common Management, Business, Science and Arts occupations in Leslie are Community & Social Service (37 | 17.5%), Education Instruction & Library (36 | 17.1%), Management (16 | 7.6%), Computers, Engineering & Science (7 | 3.3%), and Computers & Mathematics (7 | 3.3%).
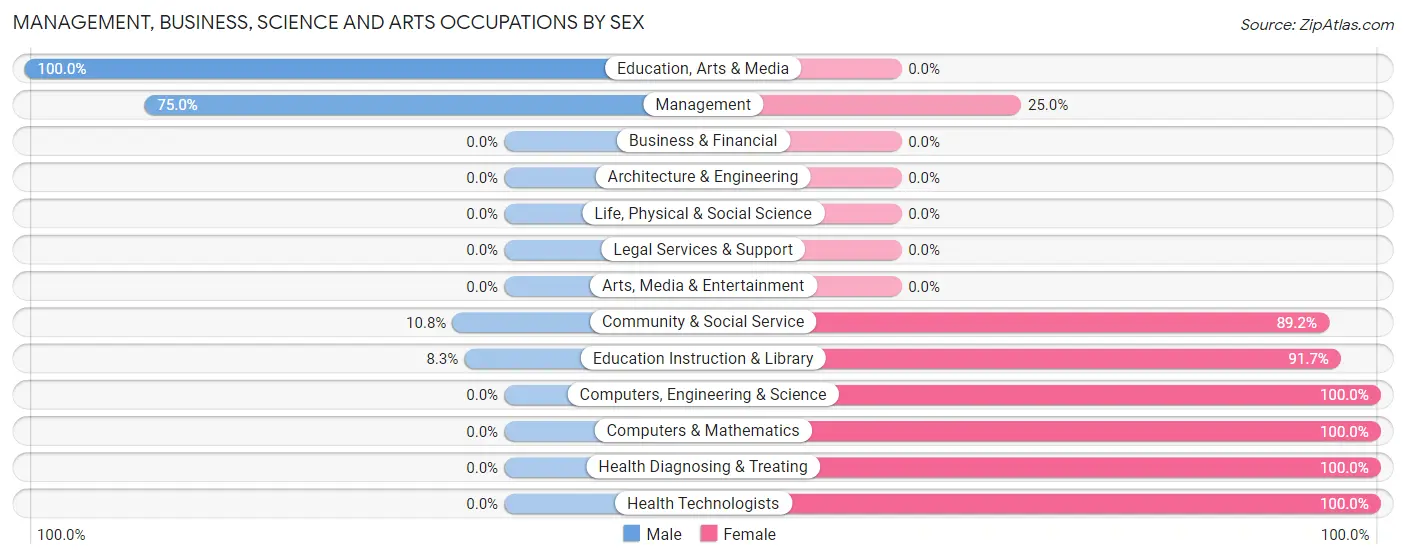
Management, Business, Science and Arts Occupations by Sex
Within the Management, Business, Science and Arts occupations in Leslie, the most male-oriented occupations are Education, Arts & Media (100.0%), Management (75.0%), and Community & Social Service (10.8%), while the most female-oriented occupations are Computers, Engineering & Science (100.0%), Computers & Mathematics (100.0%), and Health Diagnosing & Treating (100.0%).
| Occupation | Male | Female |
| Management | 12 (75.0%) | 4 (25.0%) |
| Business & Financial | 0 (0.0%) | 0 (0.0%) |
| Computers, Engineering & Science | 0 (0.0%) | 7 (100.0%) |
| Computers & Mathematics | 0 (0.0%) | 7 (100.0%) |
| Architecture & Engineering | 0 (0.0%) | 0 (0.0%) |
| Life, Physical & Social Science | 0 (0.0%) | 0 (0.0%) |
| Community & Social Service | 4 (10.8%) | 33 (89.2%) |
| Education, Arts & Media | 1 (100.0%) | 0 (0.0%) |
| Legal Services & Support | 0 (0.0%) | 0 (0.0%) |
| Education Instruction & Library | 3 (8.3%) | 33 (91.7%) |
| Arts, Media & Entertainment | 0 (0.0%) | 0 (0.0%) |
| Health Diagnosing & Treating | 0 (0.0%) | 6 (100.0%) |
| Health Technologists | 0 (0.0%) | 6 (100.0%) |
| Total (Category) | 16 (24.2%) | 50 (75.8%) |
| Total (Overall) | 89 (42.2%) | 122 (57.8%) |
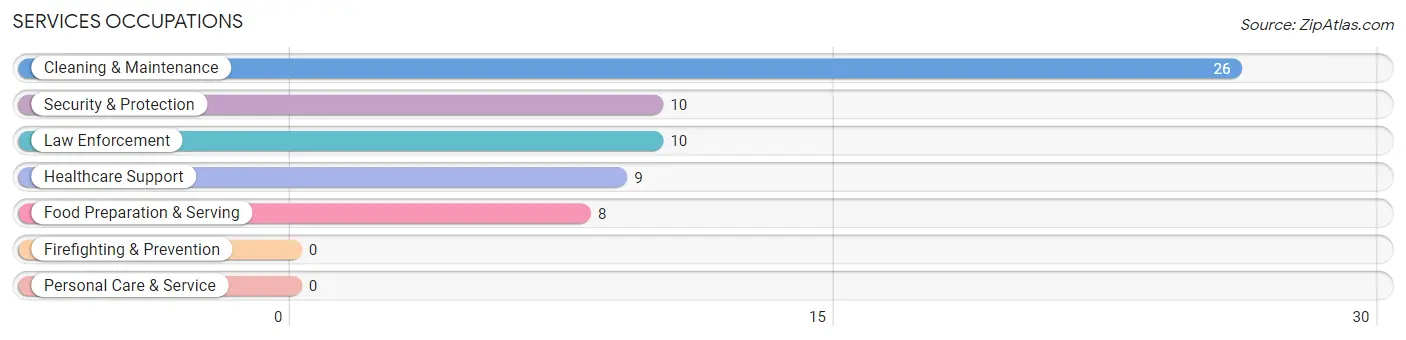
Services Occupations
The most common Services occupations in Leslie are Cleaning & Maintenance (26 | 12.3%), Security & Protection (10 | 4.7%), Law Enforcement (10 | 4.7%), Healthcare Support (9 | 4.3%), and Food Preparation & Serving (8 | 3.8%).
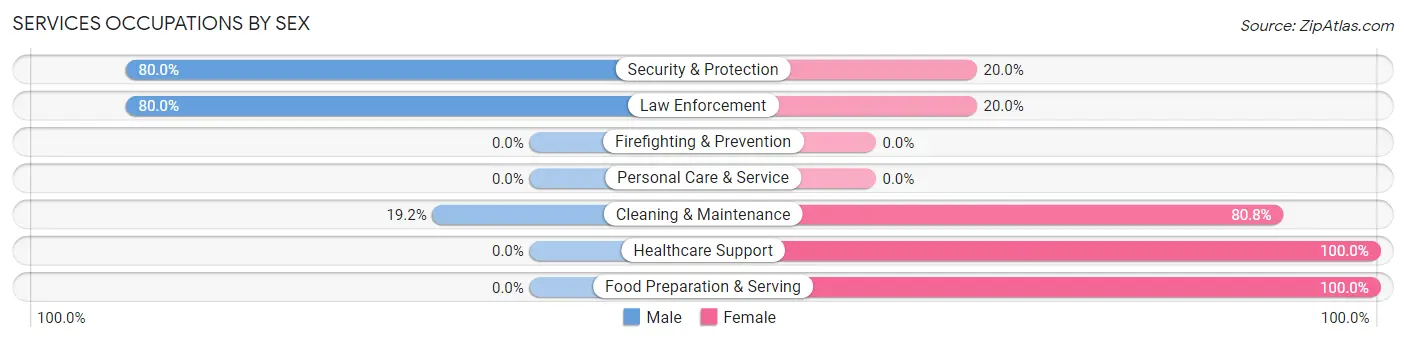
Services Occupations by Sex
Within the Services occupations in Leslie, the most male-oriented occupations are Security & Protection (80.0%), Law Enforcement (80.0%), and Cleaning & Maintenance (19.2%), while the most female-oriented occupations are Healthcare Support (100.0%), Food Preparation & Serving (100.0%), and Cleaning & Maintenance (80.8%).
| Occupation | Male | Female |
| Healthcare Support | 0 (0.0%) | 9 (100.0%) |
| Security & Protection | 8 (80.0%) | 2 (20.0%) |
| Firefighting & Prevention | 0 (0.0%) | 0 (0.0%) |
| Law Enforcement | 8 (80.0%) | 2 (20.0%) |
| Food Preparation & Serving | 0 (0.0%) | 8 (100.0%) |
| Cleaning & Maintenance | 5 (19.2%) | 21 (80.8%) |
| Personal Care & Service | 0 (0.0%) | 0 (0.0%) |
| Total (Category) | 13 (24.5%) | 40 (75.5%) |
| Total (Overall) | 89 (42.2%) | 122 (57.8%) |
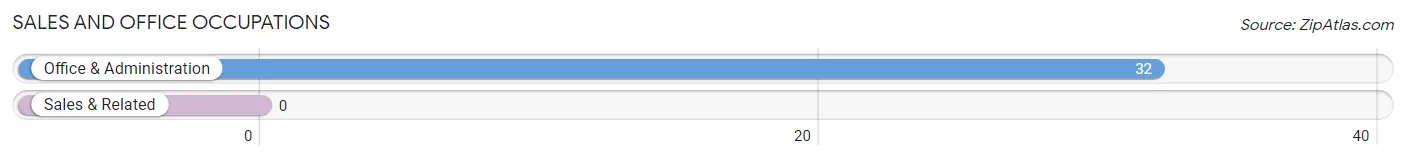
Sales and Office Occupations
The most common Sales and Office occupations in Leslie are , and Office & Administration (32 | 15.2%).
Sales and Office Occupations by Sex
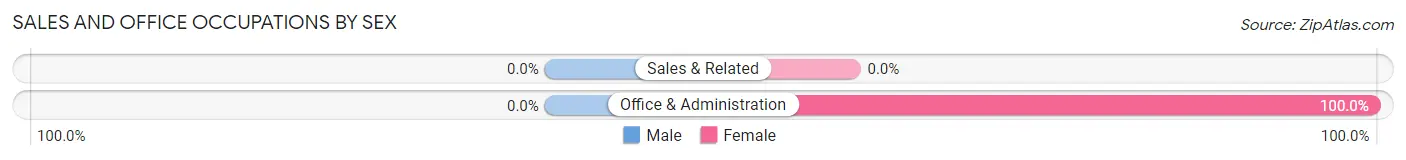
| Occupation | Male | Female |
| Sales & Related | 0 (0.0%) | 0 (0.0%) |
| Office & Administration | 0 (0.0%) | 32 (100.0%) |
| Total (Category) | 0 (0.0%) | 32 (100.0%) |
| Total (Overall) | 89 (42.2%) | 122 (57.8%) |
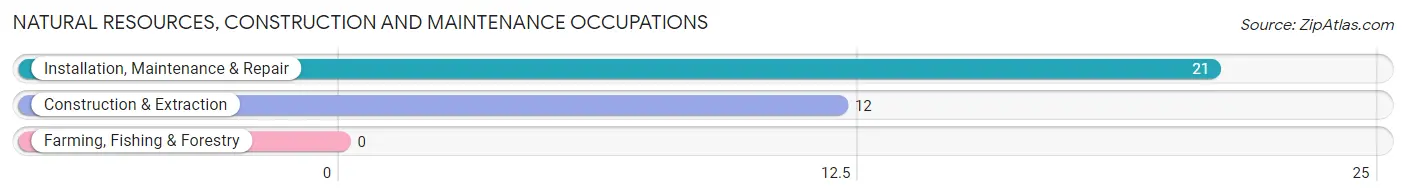
Natural Resources, Construction and Maintenance Occupations
The most common Natural Resources, Construction and Maintenance occupations in Leslie are Installation, Maintenance & Repair (21 | 10.0%), and Construction & Extraction (12 | 5.7%).
Natural Resources, Construction and Maintenance Occupations by Sex
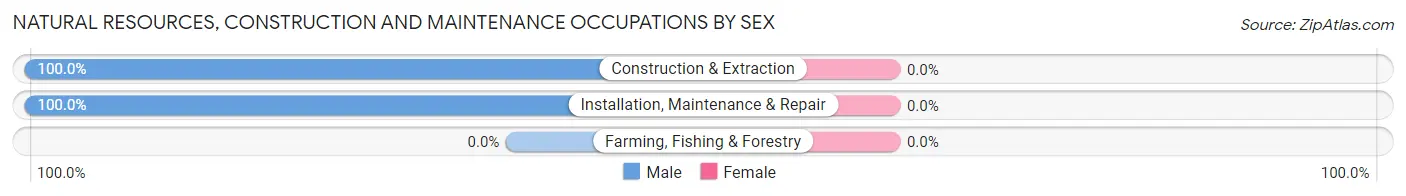
| Occupation | Male | Female |
| Farming, Fishing & Forestry | 0 (0.0%) | 0 (0.0%) |
| Construction & Extraction | 12 (100.0%) | 0 (0.0%) |
| Installation, Maintenance & Repair | 21 (100.0%) | 0 (0.0%) |
| Total (Category) | 33 (100.0%) | 0 (0.0%) |
| Total (Overall) | 89 (42.2%) | 122 (57.8%) |
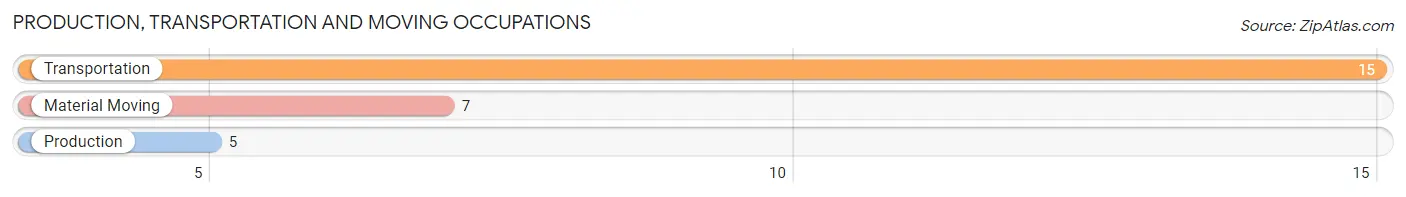
Production, Transportation and Moving Occupations
The most common Production, Transportation and Moving occupations in Leslie are Transportation (15 | 7.1%), Material Moving (7 | 3.3%), and Production (5 | 2.4%).
Production, Transportation and Moving Occupations by Sex
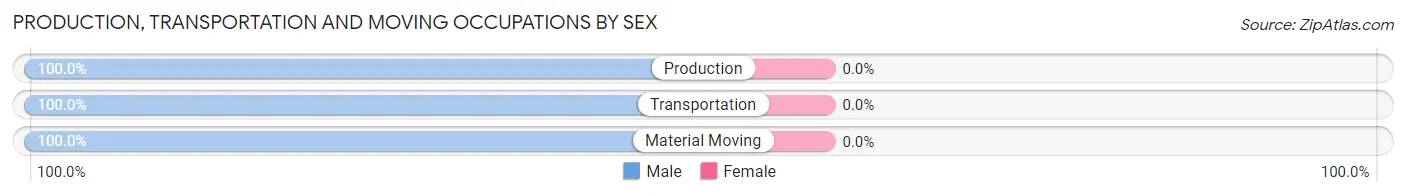
| Occupation | Male | Female |
| Production | 5 (100.0%) | 0 (0.0%) |
| Transportation | 15 (100.0%) | 0 (0.0%) |
| Material Moving | 7 (100.0%) | 0 (0.0%) |
| Total (Category) | 27 (100.0%) | 0 (0.0%) |
| Total (Overall) | 89 (42.2%) | 122 (57.8%) |
Employment Industries by Sex in Leslie
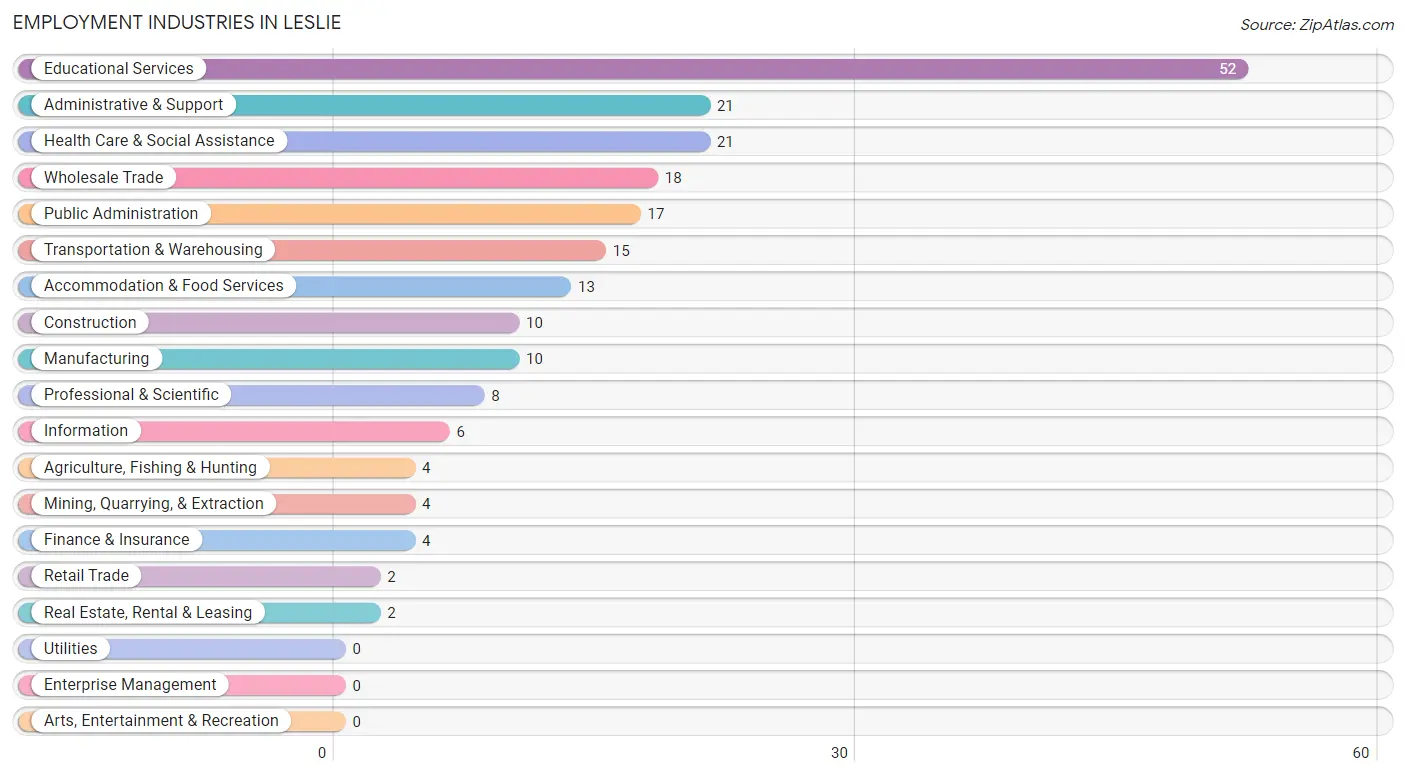
Employment Industries in Leslie
The major employment industries in Leslie include Educational Services (52 | 24.6%), Administrative & Support (21 | 10.0%), Health Care & Social Assistance (21 | 10.0%), Wholesale Trade (18 | 8.5%), and Public Administration (17 | 8.1%).
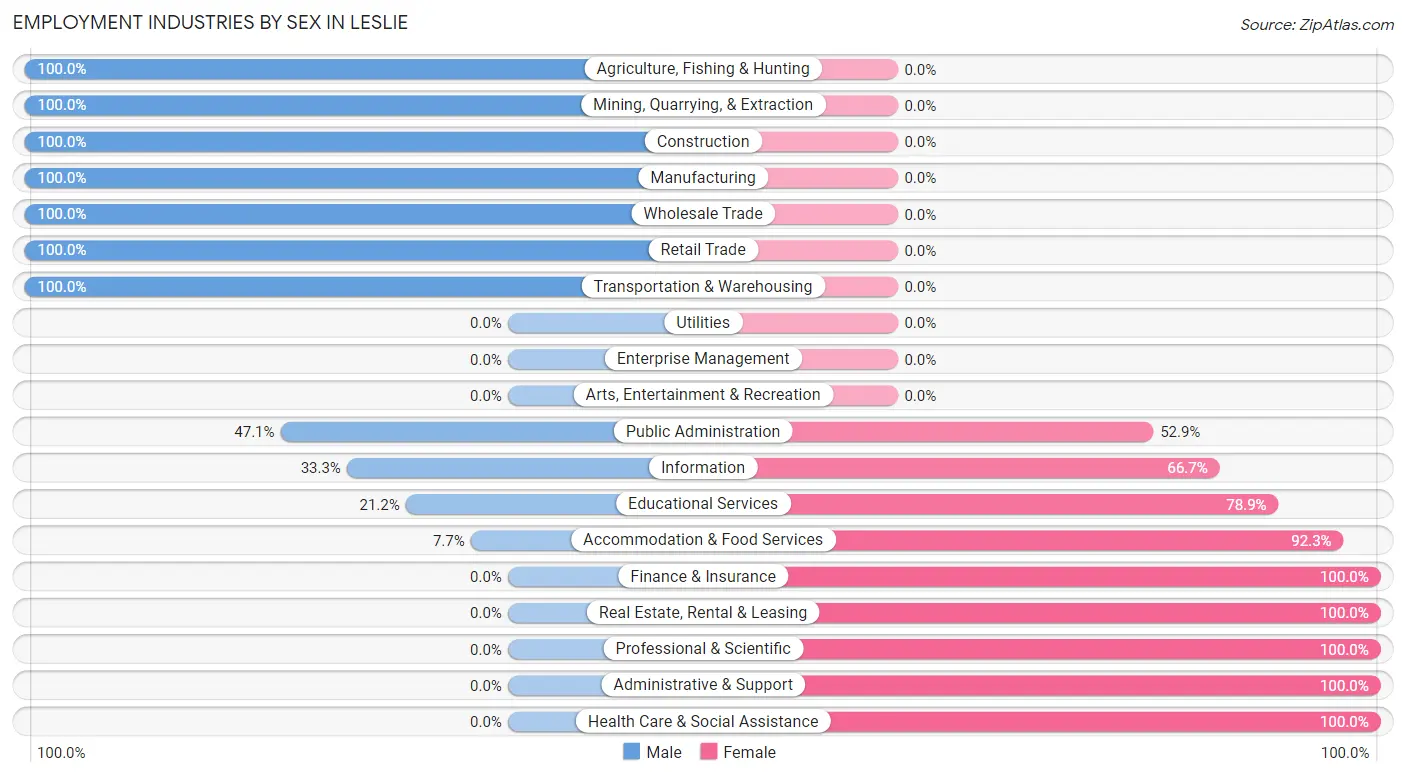
Employment Industries by Sex in Leslie
The Leslie industries that see more men than women are Agriculture, Fishing & Hunting (100.0%), Mining, Quarrying, & Extraction (100.0%), and Construction (100.0%), whereas the industries that tend to have a higher number of women are Finance & Insurance (100.0%), Real Estate, Rental & Leasing (100.0%), and Professional & Scientific (100.0%).
| Industry | Male | Female |
| Agriculture, Fishing & Hunting | 4 (100.0%) | 0 (0.0%) |
| Mining, Quarrying, & Extraction | 4 (100.0%) | 0 (0.0%) |
| Construction | 10 (100.0%) | 0 (0.0%) |
| Manufacturing | 10 (100.0%) | 0 (0.0%) |
| Wholesale Trade | 18 (100.0%) | 0 (0.0%) |
| Retail Trade | 2 (100.0%) | 0 (0.0%) |
| Transportation & Warehousing | 15 (100.0%) | 0 (0.0%) |
| Utilities | 0 (0.0%) | 0 (0.0%) |
| Information | 2 (33.3%) | 4 (66.7%) |
| Finance & Insurance | 0 (0.0%) | 4 (100.0%) |
| Real Estate, Rental & Leasing | 0 (0.0%) | 2 (100.0%) |
| Professional & Scientific | 0 (0.0%) | 8 (100.0%) |
| Enterprise Management | 0 (0.0%) | 0 (0.0%) |
| Administrative & Support | 0 (0.0%) | 21 (100.0%) |
| Educational Services | 11 (21.1%) | 41 (78.8%) |
| Health Care & Social Assistance | 0 (0.0%) | 21 (100.0%) |
| Arts, Entertainment & Recreation | 0 (0.0%) | 0 (0.0%) |
| Accommodation & Food Services | 1 (7.7%) | 12 (92.3%) |
| Public Administration | 8 (47.1%) | 9 (52.9%) |
| Total | 89 (42.2%) | 122 (57.8%) |
Education in Leslie
School Enrollment in Leslie
The most common levels of schooling among the 175 students in Leslie are high school (76 | 43.4%), middle school (69 | 39.4%), and elementary school (11 | 6.3%).
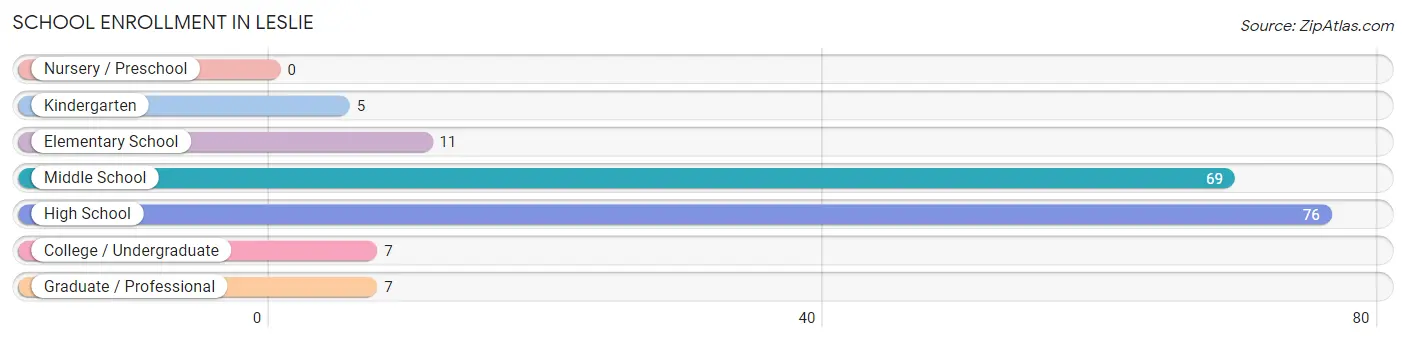
| School Level | # Students | % Students |
| Nursery / Preschool | 0 | 0.0% |
| Kindergarten | 5 | 2.9% |
| Elementary School | 11 | 6.3% |
| Middle School | 69 | 39.4% |
| High School | 76 | 43.4% |
| College / Undergraduate | 7 | 4.0% |
| Graduate / Professional | 7 | 4.0% |
| Total | 175 | 100.0% |
School Enrollment by Age by Funding Source in Leslie
Out of a total of 175 students who are enrolled in schools in Leslie, 14 (8.0%) attend a private institution, while the remaining 161 (92.0%) are enrolled in public schools. The age group of 5 to 9 year old has the highest likelihood of being enrolled in private schools, with 5 (33.3% in the age bracket) enrolled. Conversely, the age group of 18 to 19 year olds has the lowest likelihood of being enrolled in a private school, with 30 (100.0% in the age bracket) attending a public institution.
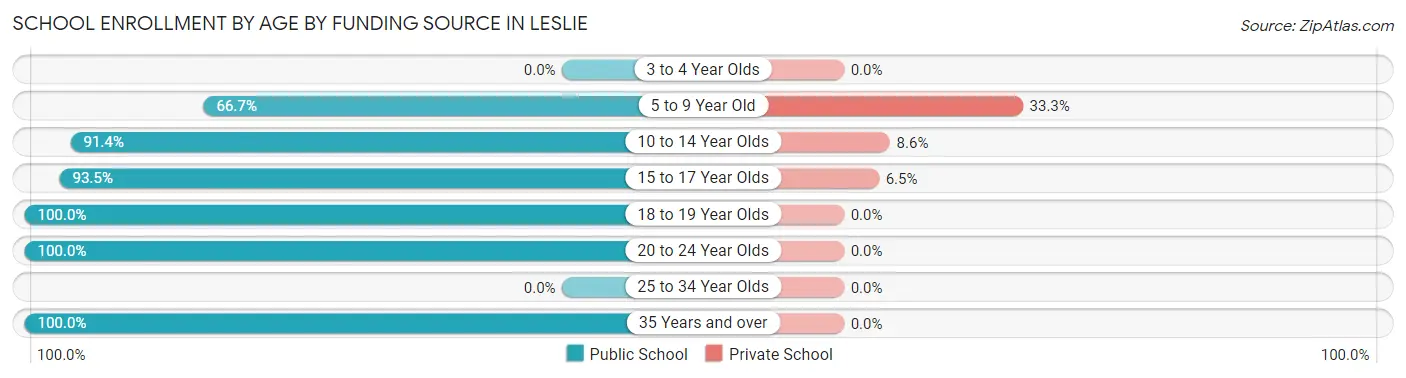
| Age Bracket | Public School | Private School |
| 3 to 4 Year Olds | 0 (0.0%) | 0 (0.0%) |
| 5 to 9 Year Old | 10 (66.7%) | 5 (33.3%) |
| 10 to 14 Year Olds | 64 (91.4%) | 6 (8.6%) |
| 15 to 17 Year Olds | 43 (93.5%) | 3 (6.5%) |
| 18 to 19 Year Olds | 30 (100.0%) | 0 (0.0%) |
| 20 to 24 Year Olds | 4 (100.0%) | 0 (0.0%) |
| 25 to 34 Year Olds | 0 (0.0%) | 0 (0.0%) |
| 35 Years and over | 10 (100.0%) | 0 (0.0%) |
| Total | 161 (92.0%) | 14 (8.0%) |
Educational Attainment by Field of Study in Leslie
Arts & humanities (17 | 24.3%), education (15 | 21.4%), business (14 | 20.0%), engineering (7 | 10.0%), and communications (5 | 7.1%) are the most common fields of study among 70 individuals in Leslie who have obtained a bachelor's degree or higher.
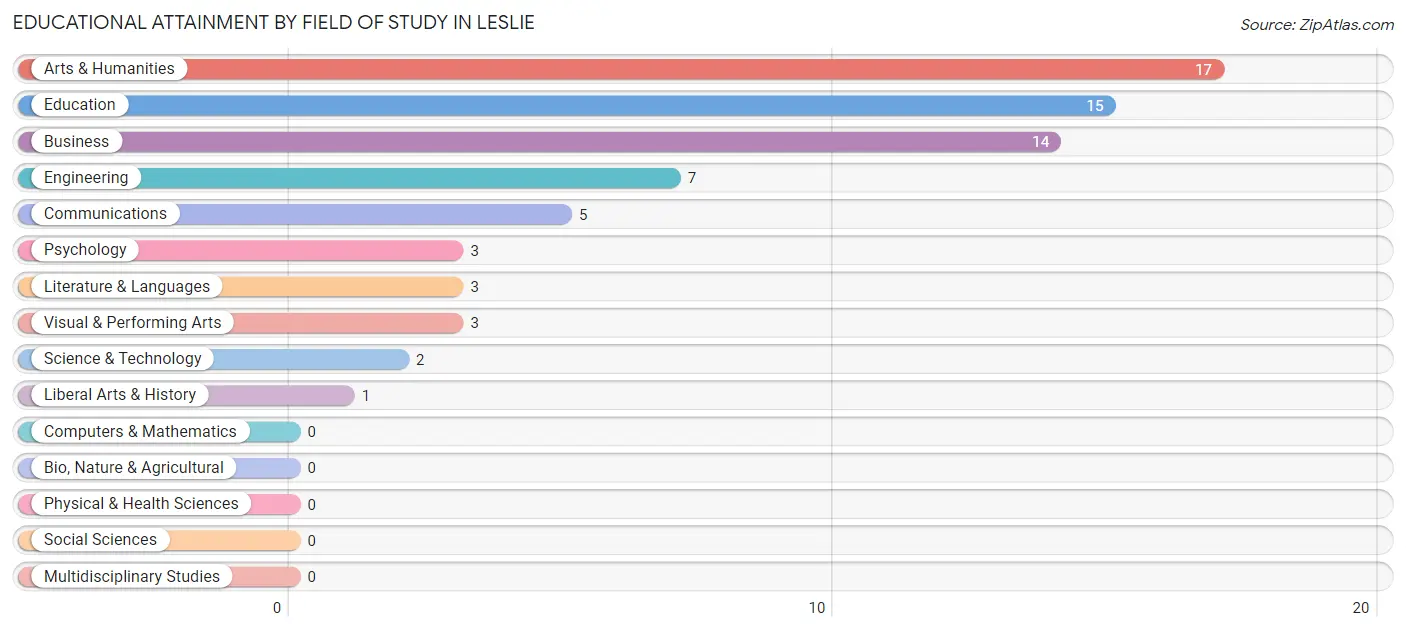
| Field of Study | # Graduates | % Graduates |
| Computers & Mathematics | 0 | 0.0% |
| Bio, Nature & Agricultural | 0 | 0.0% |
| Physical & Health Sciences | 0 | 0.0% |
| Psychology | 3 | 4.3% |
| Social Sciences | 0 | 0.0% |
| Engineering | 7 | 10.0% |
| Multidisciplinary Studies | 0 | 0.0% |
| Science & Technology | 2 | 2.9% |
| Business | 14 | 20.0% |
| Education | 15 | 21.4% |
| Literature & Languages | 3 | 4.3% |
| Liberal Arts & History | 1 | 1.4% |
| Visual & Performing Arts | 3 | 4.3% |
| Communications | 5 | 7.1% |
| Arts & Humanities | 17 | 24.3% |
| Total | 70 | 100.0% |
Transportation & Commute in Leslie
Vehicle Availability by Sex in Leslie
The most prevalent vehicle ownership categories in Leslie are males with 3 vehicles (42, accounting for 46.7%) and females with 3 vehicles (34, making up 34.4%).
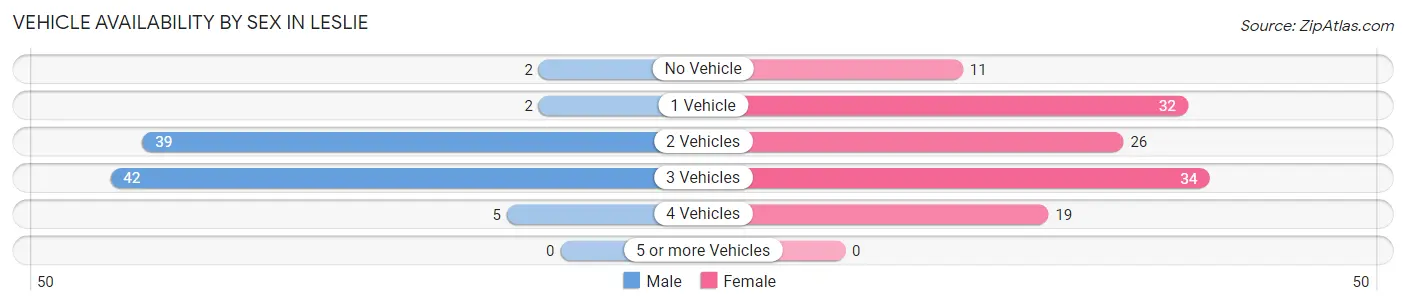
| Vehicles Available | Male | Female |
| No Vehicle | 2 (2.2%) | 11 (9.0%) |
| 1 Vehicle | 2 (2.2%) | 32 (26.2%) |
| 2 Vehicles | 39 (43.3%) | 26 (21.3%) |
| 3 Vehicles | 42 (46.7%) | 34 (27.9%) |
| 4 Vehicles | 5 (5.6%) | 19 (15.6%) |
| 5 or more Vehicles | 0 (0.0%) | 0 (0.0%) |
| Total | 90 (100.0%) | 122 (100.0%) |
Commute Time in Leslie
The most frequently occuring commute durations in Leslie are 30 to 34 minutes (56 commuters, 26.8%), 5 to 9 minutes (43 commuters, 20.6%), and 20 to 24 minutes (41 commuters, 19.6%).
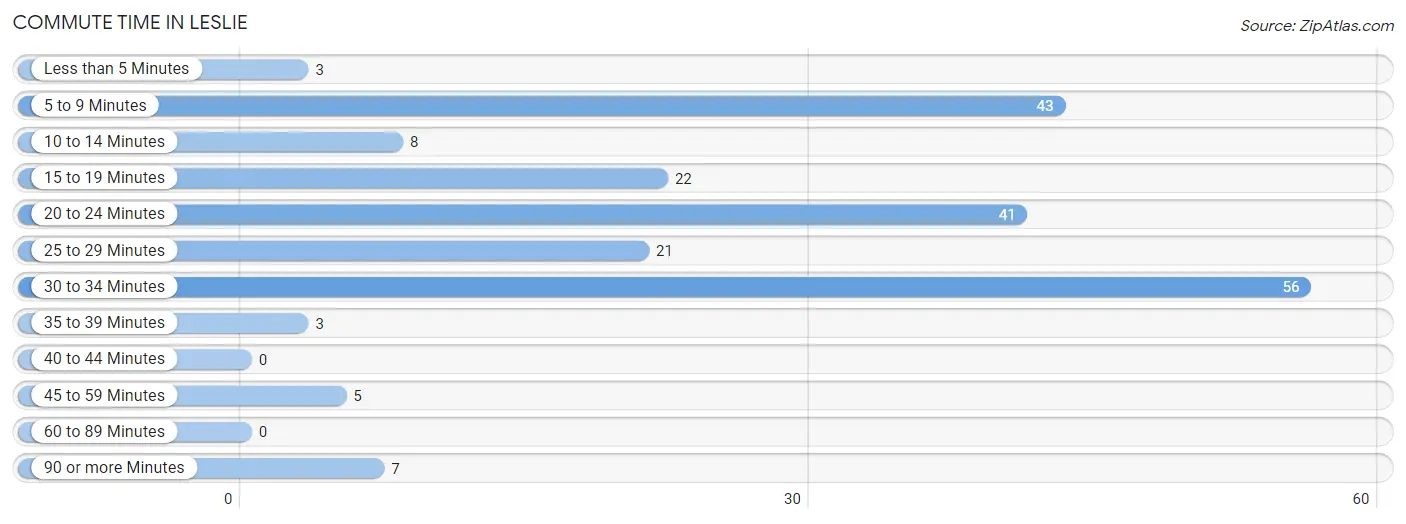
| Commute Time | # Commuters | % Commuters |
| Less than 5 Minutes | 3 | 1.4% |
| 5 to 9 Minutes | 43 | 20.6% |
| 10 to 14 Minutes | 8 | 3.8% |
| 15 to 19 Minutes | 22 | 10.5% |
| 20 to 24 Minutes | 41 | 19.6% |
| 25 to 29 Minutes | 21 | 10.1% |
| 30 to 34 Minutes | 56 | 26.8% |
| 35 to 39 Minutes | 3 | 1.4% |
| 40 to 44 Minutes | 0 | 0.0% |
| 45 to 59 Minutes | 5 | 2.4% |
| 60 to 89 Minutes | 0 | 0.0% |
| 90 or more Minutes | 7 | 3.4% |
Commute Time by Sex in Leslie
The most common commute times in Leslie are 30 to 34 minutes (28 commuters, 32.2%) for males and 20 to 24 minutes (28 commuters, 23.0%) for females.
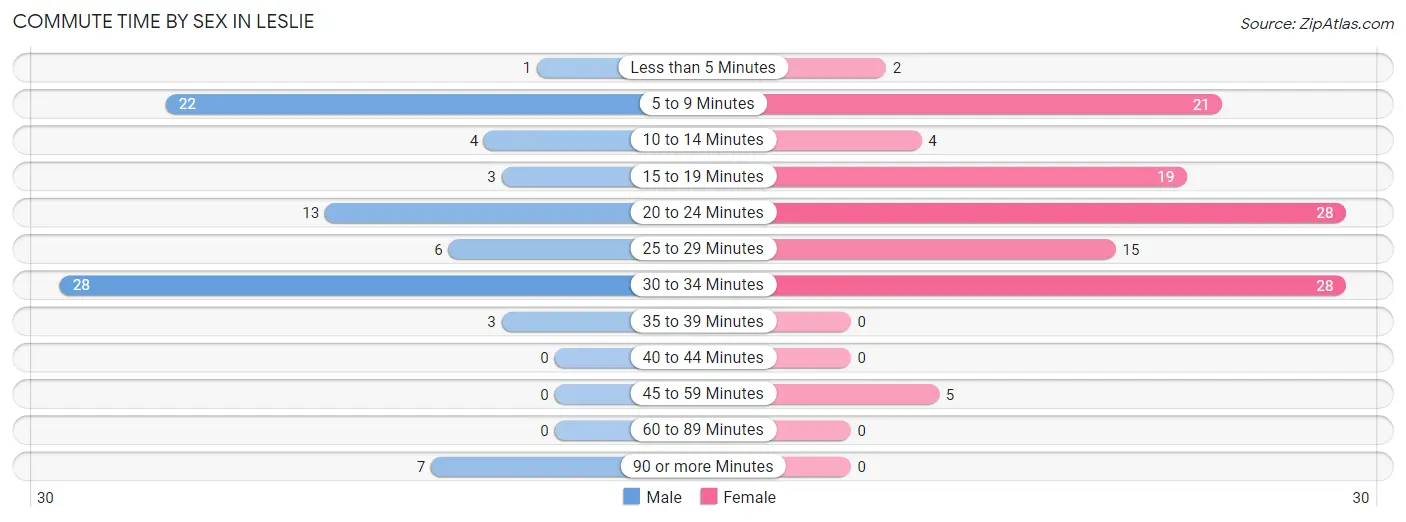
| Commute Time | Male | Female |
| Less than 5 Minutes | 1 (1.1%) | 2 (1.6%) |
| 5 to 9 Minutes | 22 (25.3%) | 21 (17.2%) |
| 10 to 14 Minutes | 4 (4.6%) | 4 (3.3%) |
| 15 to 19 Minutes | 3 (3.5%) | 19 (15.6%) |
| 20 to 24 Minutes | 13 (14.9%) | 28 (23.0%) |
| 25 to 29 Minutes | 6 (6.9%) | 15 (12.3%) |
| 30 to 34 Minutes | 28 (32.2%) | 28 (23.0%) |
| 35 to 39 Minutes | 3 (3.5%) | 0 (0.0%) |
| 40 to 44 Minutes | 0 (0.0%) | 0 (0.0%) |
| 45 to 59 Minutes | 0 (0.0%) | 5 (4.1%) |
| 60 to 89 Minutes | 0 (0.0%) | 0 (0.0%) |
| 90 or more Minutes | 7 (8.1%) | 0 (0.0%) |
Time of Departure to Work by Sex in Leslie
The most frequent times of departure to work in Leslie are 12:00 AM to 4:59 AM (21, 24.1%) for males and 7:00 AM to 7:29 AM (44, 36.1%) for females.
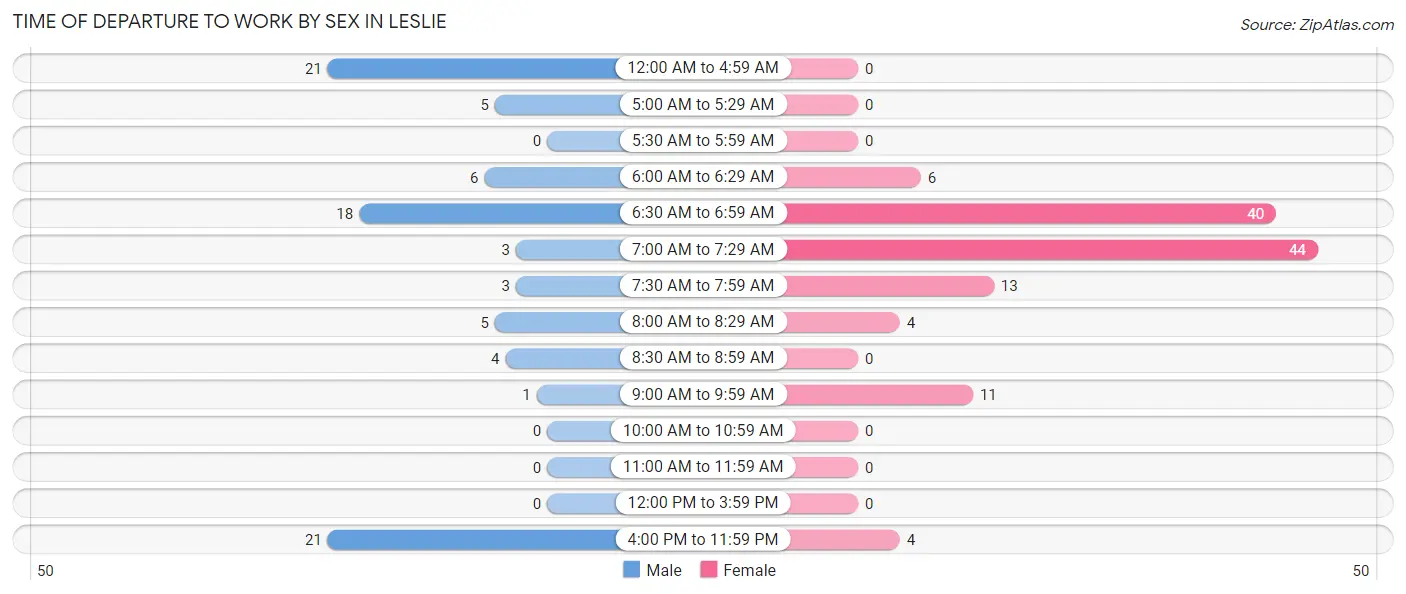
| Time of Departure | Male | Female |
| 12:00 AM to 4:59 AM | 21 (24.1%) | 0 (0.0%) |
| 5:00 AM to 5:29 AM | 5 (5.8%) | 0 (0.0%) |
| 5:30 AM to 5:59 AM | 0 (0.0%) | 0 (0.0%) |
| 6:00 AM to 6:29 AM | 6 (6.9%) | 6 (4.9%) |
| 6:30 AM to 6:59 AM | 18 (20.7%) | 40 (32.8%) |
| 7:00 AM to 7:29 AM | 3 (3.5%) | 44 (36.1%) |
| 7:30 AM to 7:59 AM | 3 (3.5%) | 13 (10.7%) |
| 8:00 AM to 8:29 AM | 5 (5.8%) | 4 (3.3%) |
| 8:30 AM to 8:59 AM | 4 (4.6%) | 0 (0.0%) |
| 9:00 AM to 9:59 AM | 1 (1.1%) | 11 (9.0%) |
| 10:00 AM to 10:59 AM | 0 (0.0%) | 0 (0.0%) |
| 11:00 AM to 11:59 AM | 0 (0.0%) | 0 (0.0%) |
| 12:00 PM to 3:59 PM | 0 (0.0%) | 0 (0.0%) |
| 4:00 PM to 11:59 PM | 21 (24.1%) | 4 (3.3%) |
| Total | 87 (100.0%) | 122 (100.0%) |
Housing Occupancy in Leslie
Occupancy by Ownership in Leslie
Of the total 171 dwellings in Leslie, owner-occupied units account for 130 (76.0%), while renter-occupied units make up 41 (24.0%).
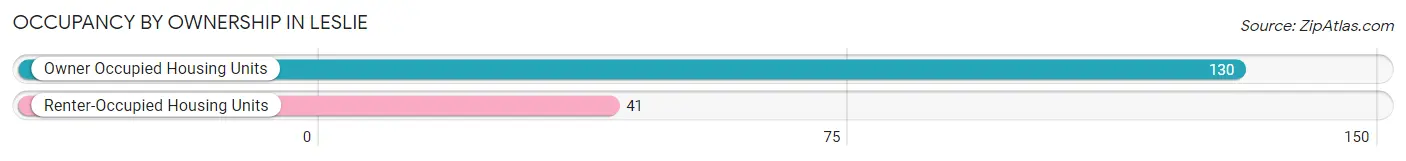
| Occupancy | # Housing Units | % Housing Units |
| Owner Occupied Housing Units | 130 | 76.0% |
| Renter-Occupied Housing Units | 41 | 24.0% |
| Total Occupied Housing Units | 171 | 100.0% |
Occupancy by Household Size in Leslie
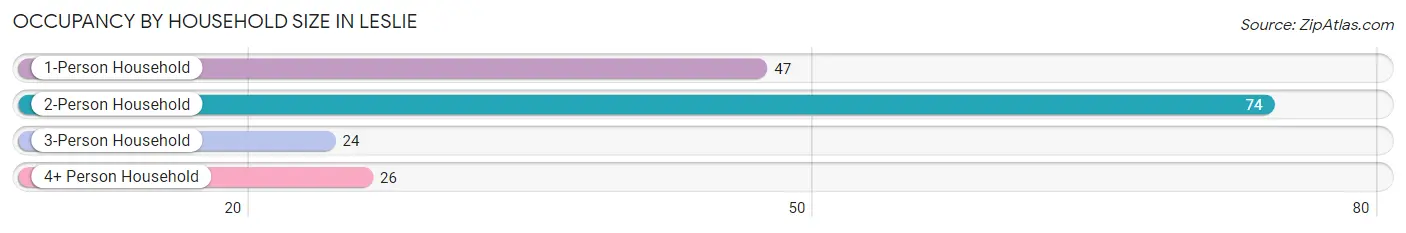
| Household Size | # Housing Units | % Housing Units |
| 1-Person Household | 47 | 27.5% |
| 2-Person Household | 74 | 43.3% |
| 3-Person Household | 24 | 14.0% |
| 4+ Person Household | 26 | 15.2% |
| Total Housing Units | 171 | 100.0% |
Occupancy by Ownership by Household Size in Leslie
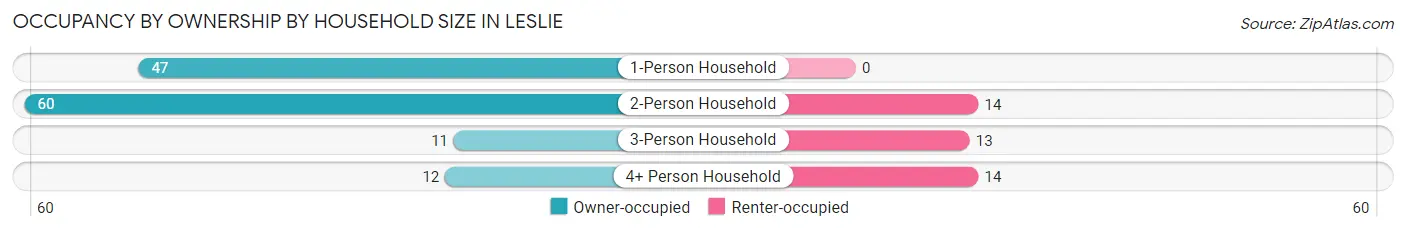
| Household Size | Owner-occupied | Renter-occupied |
| 1-Person Household | 47 (100.0%) | 0 (0.0%) |
| 2-Person Household | 60 (81.1%) | 14 (18.9%) |
| 3-Person Household | 11 (45.8%) | 13 (54.2%) |
| 4+ Person Household | 12 (46.2%) | 14 (53.8%) |
| Total Housing Units | 130 (76.0%) | 41 (24.0%) |
Occupancy by Educational Attainment in Leslie
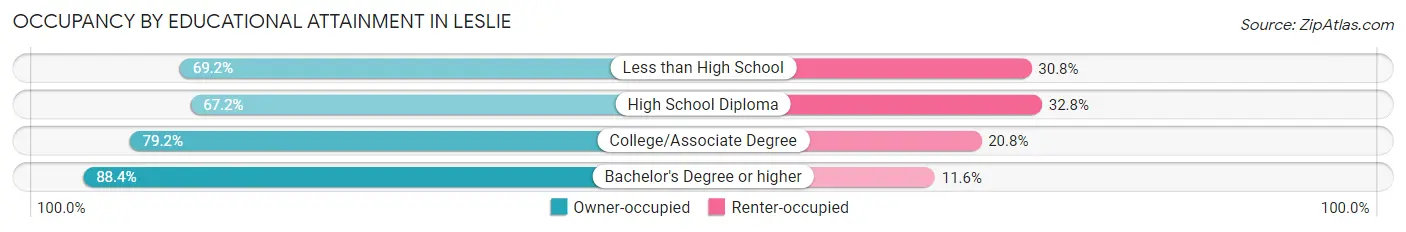
| Household Size | Owner-occupied | Renter-occupied |
| Less than High School | 9 (69.2%) | 4 (30.8%) |
| High School Diploma | 45 (67.2%) | 22 (32.8%) |
| College/Associate Degree | 38 (79.2%) | 10 (20.8%) |
| Bachelor's Degree or higher | 38 (88.4%) | 5 (11.6%) |
Occupancy by Age of Householder in Leslie
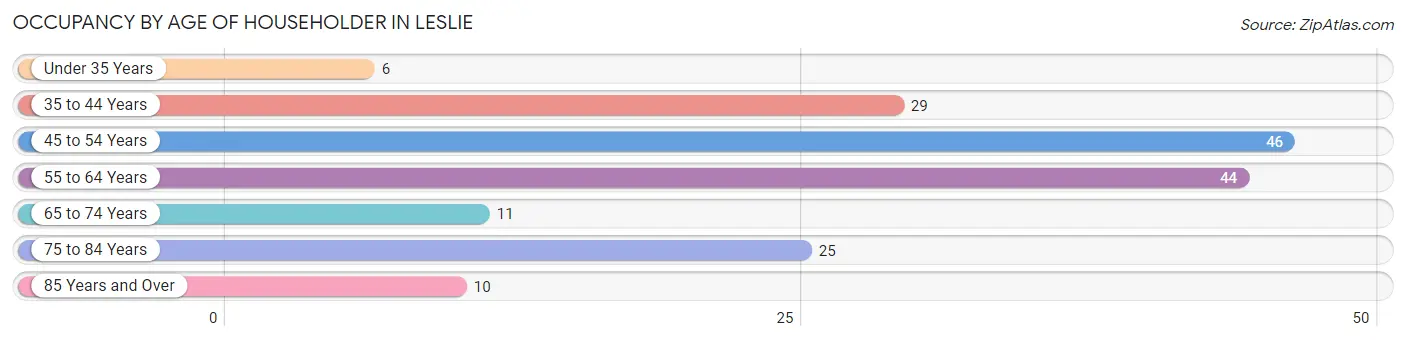
| Age Bracket | # Households | % Households |
| Under 35 Years | 6 | 3.5% |
| 35 to 44 Years | 29 | 17.0% |
| 45 to 54 Years | 46 | 26.9% |
| 55 to 64 Years | 44 | 25.7% |
| 65 to 74 Years | 11 | 6.4% |
| 75 to 84 Years | 25 | 14.6% |
| 85 Years and Over | 10 | 5.9% |
| Total | 171 | 100.0% |
Housing Finances in Leslie
Median Income by Occupancy in Leslie
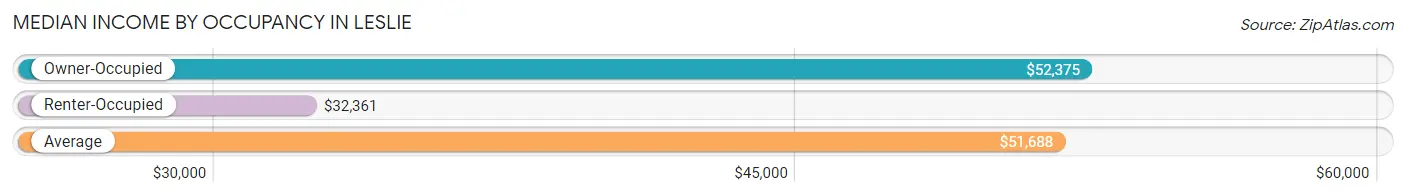
| Occupancy Type | # Households | Median Income |
| Owner-Occupied | 130 (76.0%) | $52,375 |
| Renter-Occupied | 41 (24.0%) | $32,361 |
| Average | 171 (100.0%) | $51,688 |
Occupancy by Householder Income Bracket in Leslie
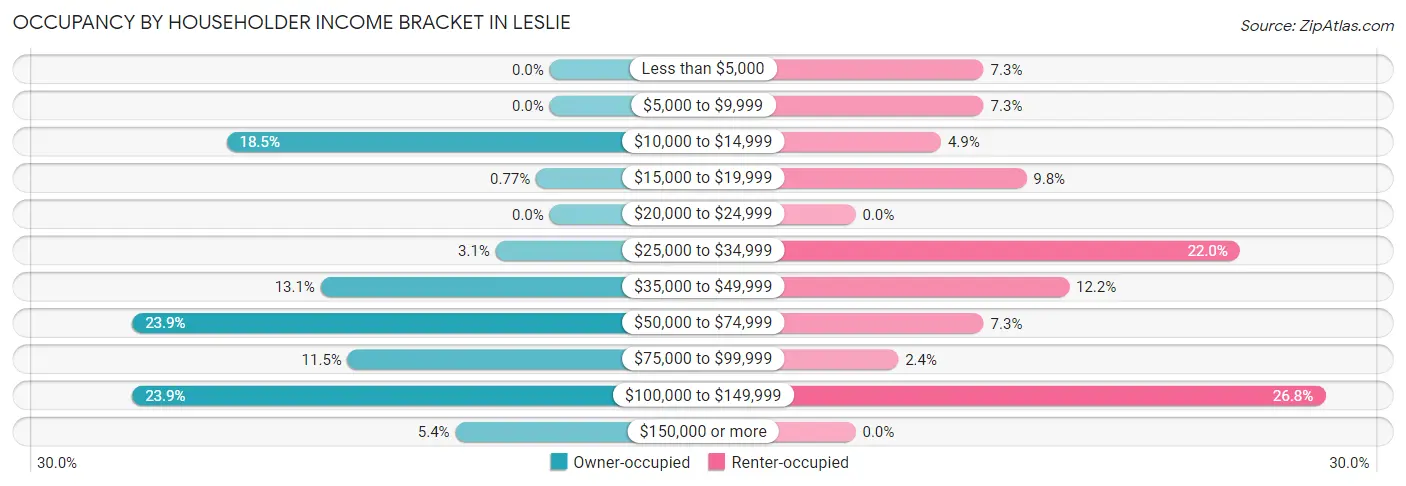
| Income Bracket | Owner-occupied | Renter-occupied |
| Less than $5,000 | 0 (0.0%) | 3 (7.3%) |
| $5,000 to $9,999 | 0 (0.0%) | 3 (7.3%) |
| $10,000 to $14,999 | 24 (18.5%) | 2 (4.9%) |
| $15,000 to $19,999 | 1 (0.8%) | 4 (9.8%) |
| $20,000 to $24,999 | 0 (0.0%) | 0 (0.0%) |
| $25,000 to $34,999 | 4 (3.1%) | 9 (22.0%) |
| $35,000 to $49,999 | 17 (13.1%) | 5 (12.2%) |
| $50,000 to $74,999 | 31 (23.8%) | 3 (7.3%) |
| $75,000 to $99,999 | 15 (11.5%) | 1 (2.4%) |
| $100,000 to $149,999 | 31 (23.8%) | 11 (26.8%) |
| $150,000 or more | 7 (5.4%) | 0 (0.0%) |
| Total | 130 (100.0%) | 41 (100.0%) |
Monthly Housing Cost Tiers in Leslie
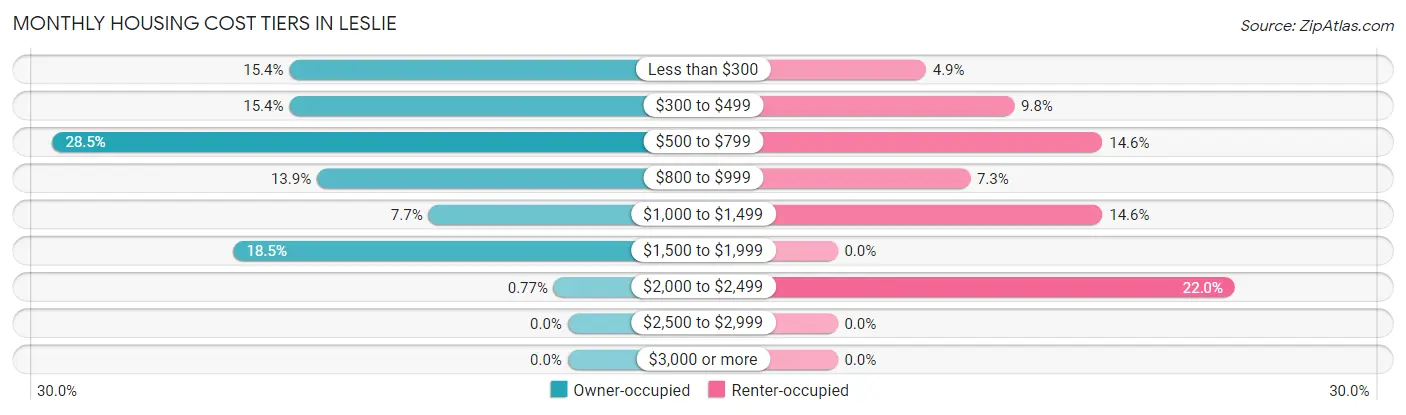
| Monthly Cost | Owner-occupied | Renter-occupied |
| Less than $300 | 20 (15.4%) | 2 (4.9%) |
| $300 to $499 | 20 (15.4%) | 4 (9.8%) |
| $500 to $799 | 37 (28.5%) | 6 (14.6%) |
| $800 to $999 | 18 (13.9%) | 3 (7.3%) |
| $1,000 to $1,499 | 10 (7.7%) | 6 (14.6%) |
| $1,500 to $1,999 | 24 (18.5%) | 0 (0.0%) |
| $2,000 to $2,499 | 1 (0.8%) | 9 (22.0%) |
| $2,500 to $2,999 | 0 (0.0%) | 0 (0.0%) |
| $3,000 or more | 0 (0.0%) | 0 (0.0%) |
| Total | 130 (100.0%) | 41 (100.0%) |
Physical Housing Characteristics in Leslie
Housing Structures in Leslie
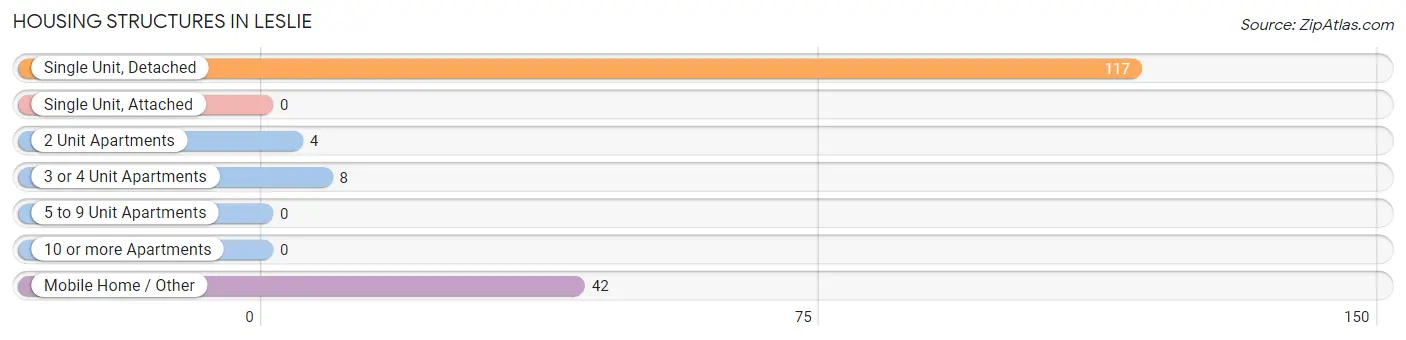
| Structure Type | # Housing Units | % Housing Units |
| Single Unit, Detached | 117 | 68.4% |
| Single Unit, Attached | 0 | 0.0% |
| 2 Unit Apartments | 4 | 2.3% |
| 3 or 4 Unit Apartments | 8 | 4.7% |
| 5 to 9 Unit Apartments | 0 | 0.0% |
| 10 or more Apartments | 0 | 0.0% |
| Mobile Home / Other | 42 | 24.6% |
| Total | 171 | 100.0% |
Housing Structures by Occupancy in Leslie
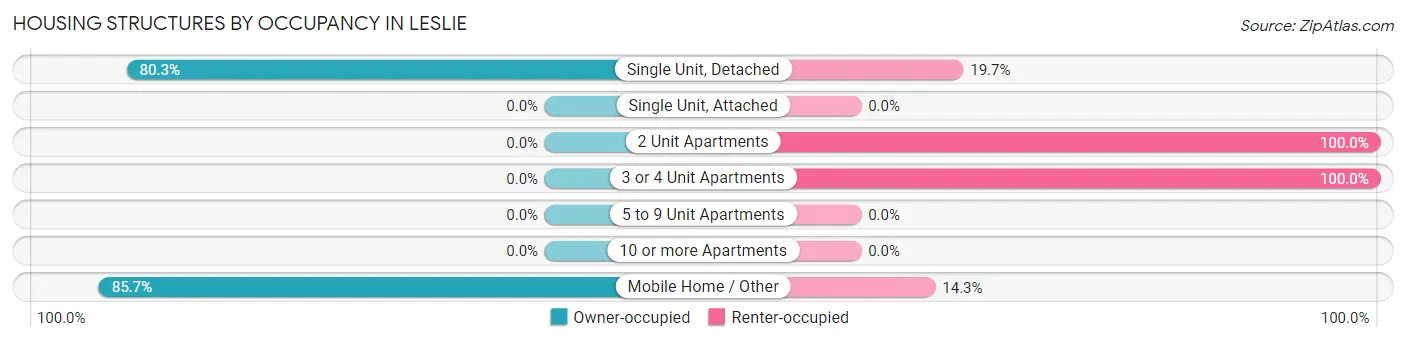
| Structure Type | Owner-occupied | Renter-occupied |
| Single Unit, Detached | 94 (80.3%) | 23 (19.7%) |
| Single Unit, Attached | 0 (0.0%) | 0 (0.0%) |
| 2 Unit Apartments | 0 (0.0%) | 4 (100.0%) |
| 3 or 4 Unit Apartments | 0 (0.0%) | 8 (100.0%) |
| 5 to 9 Unit Apartments | 0 (0.0%) | 0 (0.0%) |
| 10 or more Apartments | 0 (0.0%) | 0 (0.0%) |
| Mobile Home / Other | 36 (85.7%) | 6 (14.3%) |
| Total | 130 (76.0%) | 41 (24.0%) |
Housing Structures by Number of Rooms in Leslie
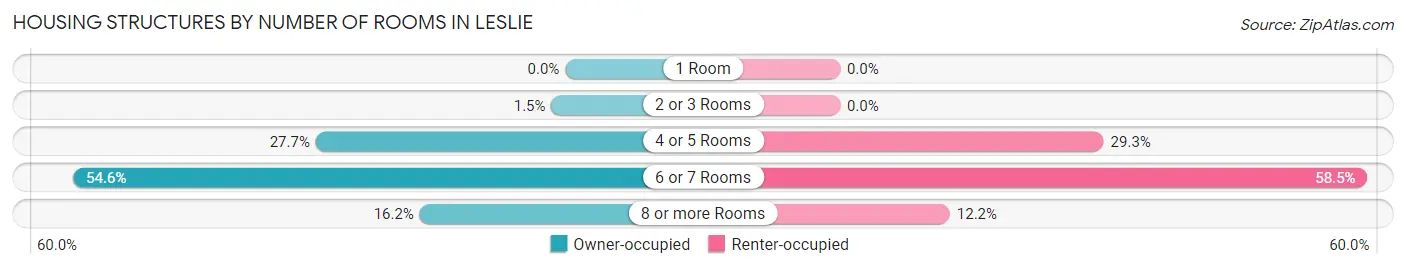
| Number of Rooms | Owner-occupied | Renter-occupied |
| 1 Room | 0 (0.0%) | 0 (0.0%) |
| 2 or 3 Rooms | 2 (1.5%) | 0 (0.0%) |
| 4 or 5 Rooms | 36 (27.7%) | 12 (29.3%) |
| 6 or 7 Rooms | 71 (54.6%) | 24 (58.5%) |
| 8 or more Rooms | 21 (16.2%) | 5 (12.2%) |
| Total | 130 (100.0%) | 41 (100.0%) |
Housing Structure by Heating Type in Leslie
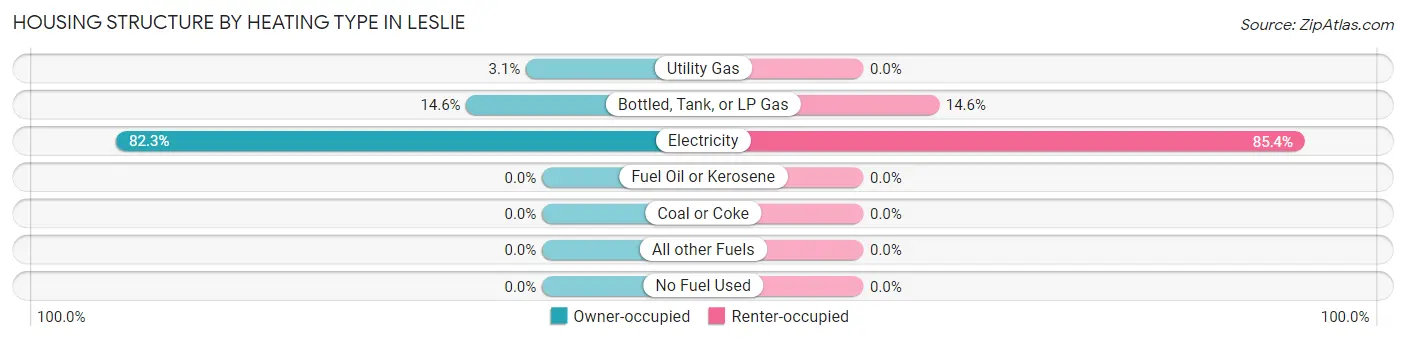
| Heating Type | Owner-occupied | Renter-occupied |
| Utility Gas | 4 (3.1%) | 0 (0.0%) |
| Bottled, Tank, or LP Gas | 19 (14.6%) | 6 (14.6%) |
| Electricity | 107 (82.3%) | 35 (85.4%) |
| Fuel Oil or Kerosene | 0 (0.0%) | 0 (0.0%) |
| Coal or Coke | 0 (0.0%) | 0 (0.0%) |
| All other Fuels | 0 (0.0%) | 0 (0.0%) |
| No Fuel Used | 0 (0.0%) | 0 (0.0%) |
| Total | 130 (100.0%) | 41 (100.0%) |
Household Vehicle Usage in Leslie
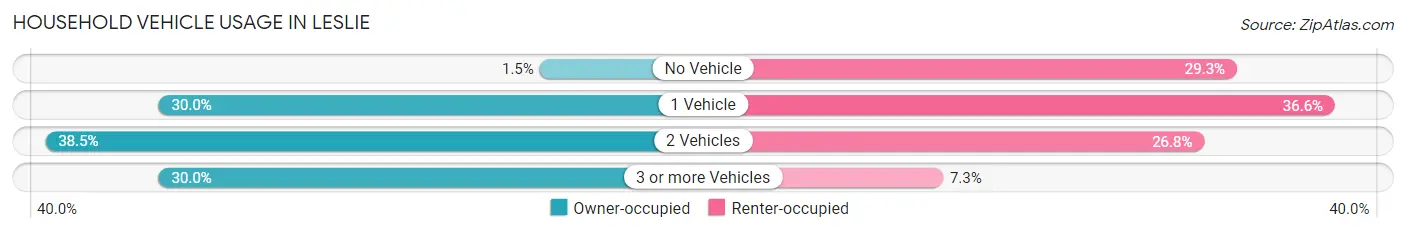
| Vehicles per Household | Owner-occupied | Renter-occupied |
| No Vehicle | 2 (1.5%) | 12 (29.3%) |
| 1 Vehicle | 39 (30.0%) | 15 (36.6%) |
| 2 Vehicles | 50 (38.5%) | 11 (26.8%) |
| 3 or more Vehicles | 39 (30.0%) | 3 (7.3%) |
| Total | 130 (100.0%) | 41 (100.0%) |
Real Estate & Mortgages in Leslie
Real Estate and Mortgage Overview in Leslie
| Characteristic | Without Mortgage | With Mortgage |
| Housing Units | 58 | 72 |
| Median Property Value | - | - |
| Median Household Income | - | - |
| Monthly Housing Costs | $378 | $0 |
| Real Estate Taxes | - | - |
Property Value by Mortgage Status in Leslie
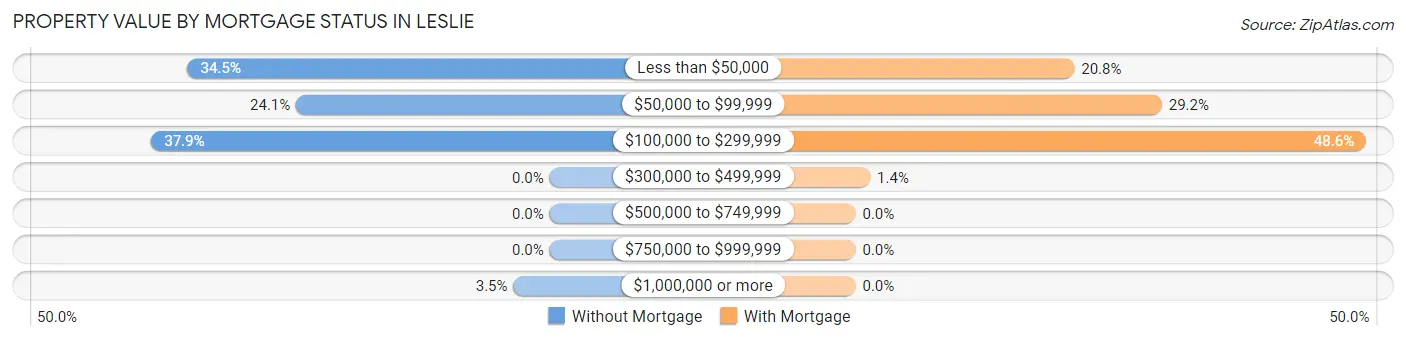
| Property Value | Without Mortgage | With Mortgage |
| Less than $50,000 | 20 (34.5%) | 15 (20.8%) |
| $50,000 to $99,999 | 14 (24.1%) | 21 (29.2%) |
| $100,000 to $299,999 | 22 (37.9%) | 35 (48.6%) |
| $300,000 to $499,999 | 0 (0.0%) | 1 (1.4%) |
| $500,000 to $749,999 | 0 (0.0%) | 0 (0.0%) |
| $750,000 to $999,999 | 0 (0.0%) | 0 (0.0%) |
| $1,000,000 or more | 2 (3.5%) | 0 (0.0%) |
| Total | 58 (100.0%) | 72 (100.0%) |
Household Income by Mortgage Status in Leslie
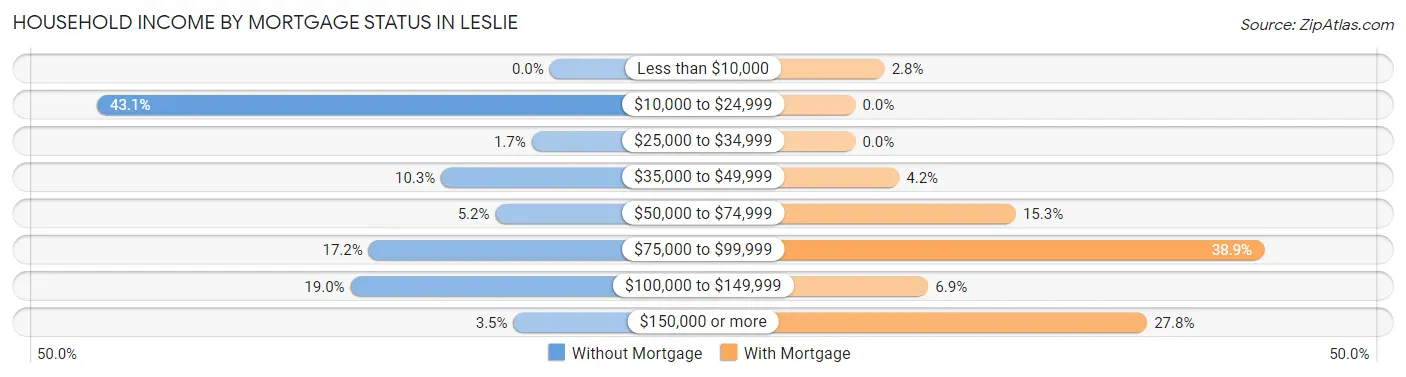
| Household Income | Without Mortgage | With Mortgage |
| Less than $10,000 | 0 (0.0%) | 2 (2.8%) |
| $10,000 to $24,999 | 25 (43.1%) | 0 (0.0%) |
| $25,000 to $34,999 | 1 (1.7%) | 0 (0.0%) |
| $35,000 to $49,999 | 6 (10.3%) | 3 (4.2%) |
| $50,000 to $74,999 | 3 (5.2%) | 11 (15.3%) |
| $75,000 to $99,999 | 10 (17.2%) | 28 (38.9%) |
| $100,000 to $149,999 | 11 (19.0%) | 5 (6.9%) |
| $150,000 or more | 2 (3.5%) | 20 (27.8%) |
| Total | 58 (100.0%) | 72 (100.0%) |
Property Value to Household Income Ratio in Leslie
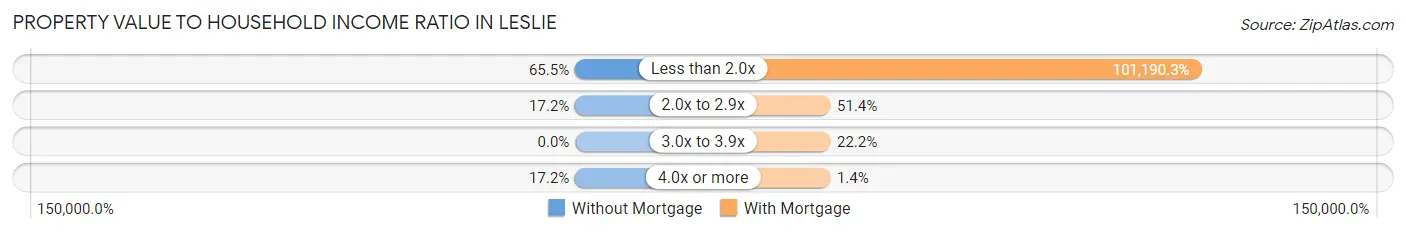
| Value-to-Income Ratio | Without Mortgage | With Mortgage |
| Less than 2.0x | 38 (65.5%) | 72,857 (101,190.3%) |
| 2.0x to 2.9x | 10 (17.2%) | 37 (51.4%) |
| 3.0x to 3.9x | 0 (0.0%) | 16 (22.2%) |
| 4.0x or more | 10 (17.2%) | 1 (1.4%) |
| Total | 58 (100.0%) | 72 (100.0%) |
Real Estate Taxes by Mortgage Status in Leslie
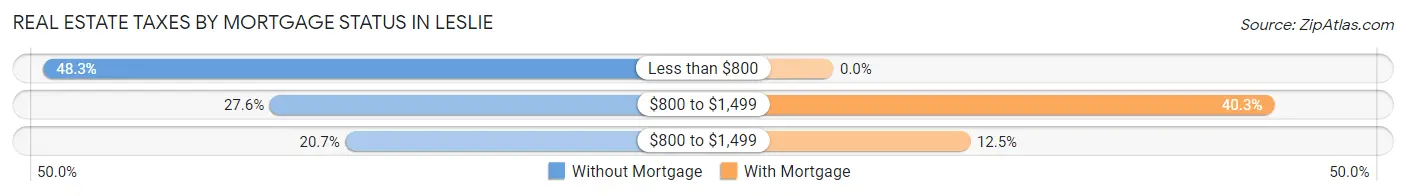
| Property Taxes | Without Mortgage | With Mortgage |
| Less than $800 | 28 (48.3%) | 0 (0.0%) |
| $800 to $1,499 | 16 (27.6%) | 29 (40.3%) |
| $800 to $1,499 | 12 (20.7%) | 9 (12.5%) |
| Total | 58 (100.0%) | 72 (100.0%) |
Health & Disability in Leslie
Health Insurance Coverage by Age in Leslie
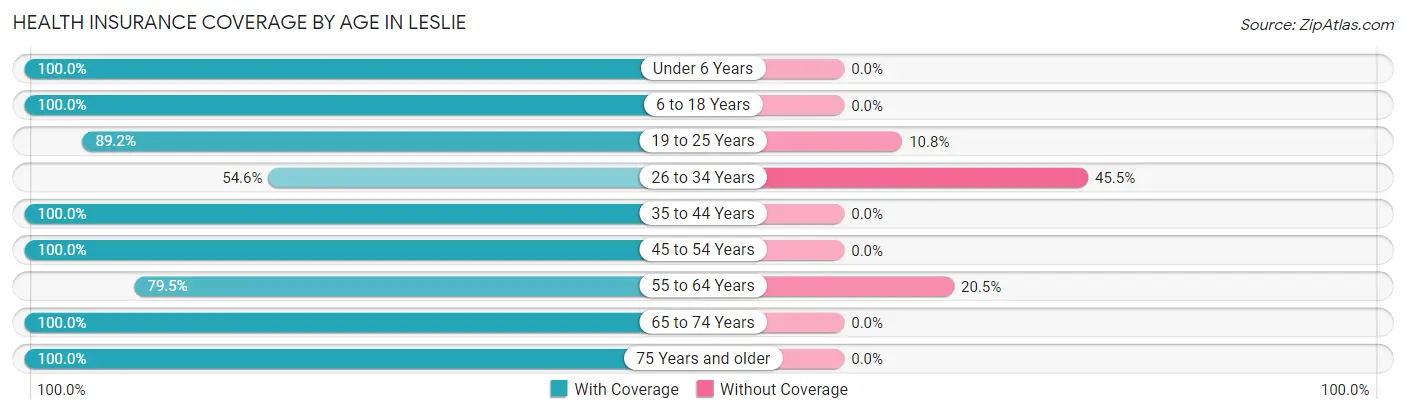
| Age Bracket | With Coverage | Without Coverage |
| Under 6 Years | 11 (100.0%) | 0 (0.0%) |
| 6 to 18 Years | 126 (100.0%) | 0 (0.0%) |
| 19 to 25 Years | 66 (89.2%) | 8 (10.8%) |
| 26 to 34 Years | 6 (54.5%) | 5 (45.5%) |
| 35 to 44 Years | 77 (100.0%) | 0 (0.0%) |
| 45 to 54 Years | 75 (100.0%) | 0 (0.0%) |
| 55 to 64 Years | 66 (79.5%) | 17 (20.5%) |
| 65 to 74 Years | 21 (100.0%) | 0 (0.0%) |
| 75 Years and older | 46 (100.0%) | 0 (0.0%) |
| Total | 494 (94.3%) | 30 (5.7%) |
Health Insurance Coverage by Citizenship Status in Leslie
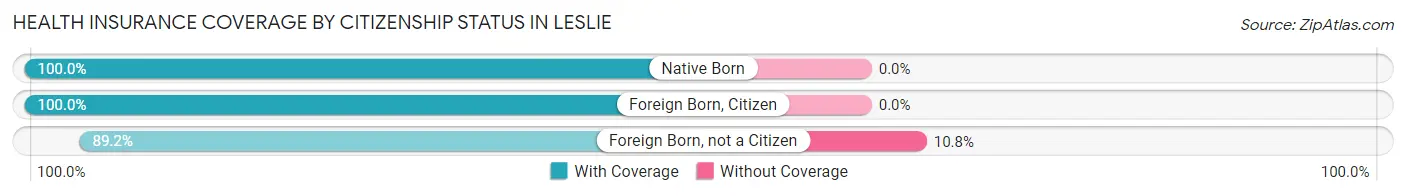
| Citizenship Status | With Coverage | Without Coverage |
| Native Born | 11 (100.0%) | 0 (0.0%) |
| Foreign Born, Citizen | 126 (100.0%) | 0 (0.0%) |
| Foreign Born, not a Citizen | 66 (89.2%) | 8 (10.8%) |
Health Insurance Coverage by Household Income in Leslie
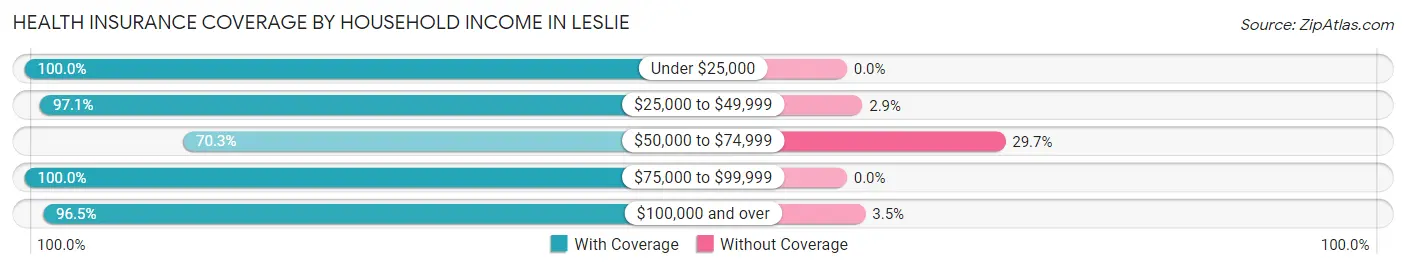
| Household Income | With Coverage | Without Coverage |
| Under $25,000 | 83 (100.0%) | 0 (0.0%) |
| $25,000 to $49,999 | 134 (97.1%) | 4 (2.9%) |
| $50,000 to $74,999 | 45 (70.3%) | 19 (29.7%) |
| $75,000 to $99,999 | 37 (100.0%) | 0 (0.0%) |
| $100,000 and over | 195 (96.5%) | 7 (3.5%) |
Public vs Private Health Insurance Coverage by Age in Leslie
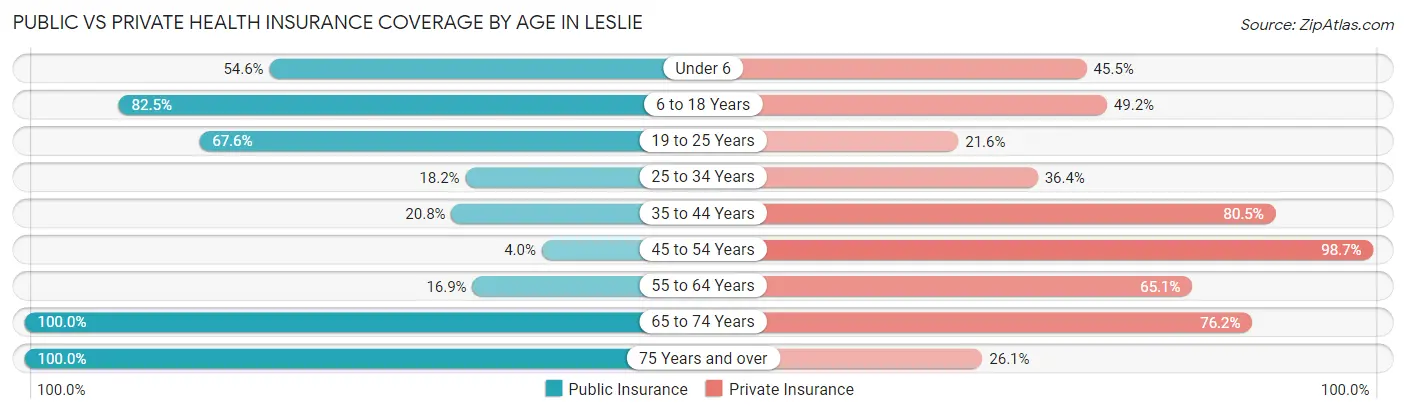
| Age Bracket | Public Insurance | Private Insurance |
| Under 6 | 6 (54.5%) | 5 (45.5%) |
| 6 to 18 Years | 104 (82.5%) | 62 (49.2%) |
| 19 to 25 Years | 50 (67.6%) | 16 (21.6%) |
| 25 to 34 Years | 2 (18.2%) | 4 (36.4%) |
| 35 to 44 Years | 16 (20.8%) | 62 (80.5%) |
| 45 to 54 Years | 3 (4.0%) | 74 (98.7%) |
| 55 to 64 Years | 14 (16.9%) | 54 (65.1%) |
| 65 to 74 Years | 21 (100.0%) | 16 (76.2%) |
| 75 Years and over | 46 (100.0%) | 12 (26.1%) |
| Total | 262 (50.0%) | 305 (58.2%) |
Disability Status by Sex by Age in Leslie
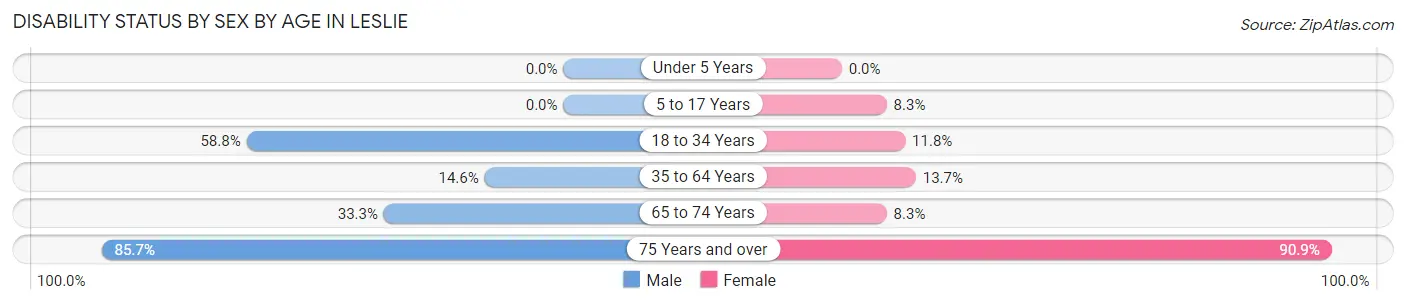
| Age Bracket | Male | Female |
| Under 5 Years | 0 (0.0%) | 0 (0.0%) |
| 5 to 17 Years | 0 (0.0%) | 2 (8.3%) |
| 18 to 34 Years | 30 (58.8%) | 4 (11.8%) |
| 35 to 64 Years | 12 (14.6%) | 21 (13.7%) |
| 65 to 74 Years | 3 (33.3%) | 1 (8.3%) |
| 75 Years and over | 30 (85.7%) | 10 (90.9%) |
Disability Class by Sex by Age in Leslie
Disability Class: Hearing Difficulty
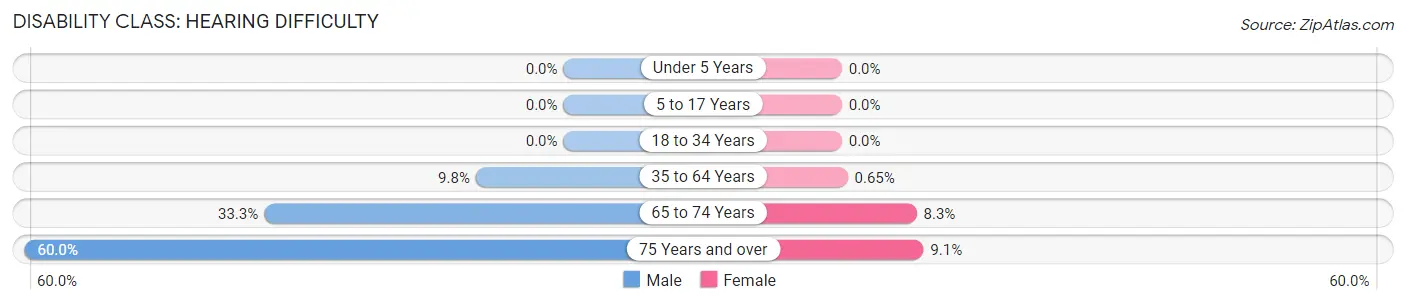
| Age Bracket | Male | Female |
| Under 5 Years | 0 (0.0%) | 0 (0.0%) |
| 5 to 17 Years | 0 (0.0%) | 0 (0.0%) |
| 18 to 34 Years | 0 (0.0%) | 0 (0.0%) |
| 35 to 64 Years | 8 (9.8%) | 1 (0.6%) |
| 65 to 74 Years | 3 (33.3%) | 1 (8.3%) |
| 75 Years and over | 21 (60.0%) | 1 (9.1%) |
Disability Class: Vision Difficulty
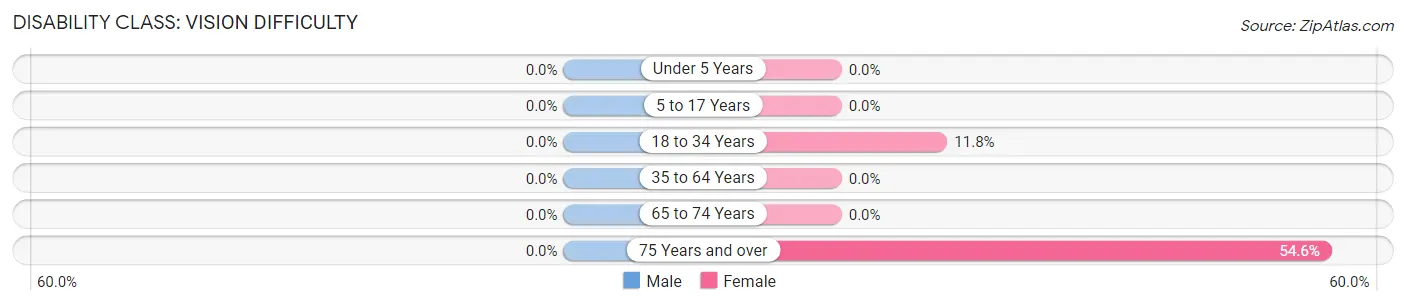
| Age Bracket | Male | Female |
| Under 5 Years | 0 (0.0%) | 0 (0.0%) |
| 5 to 17 Years | 0 (0.0%) | 0 (0.0%) |
| 18 to 34 Years | 0 (0.0%) | 4 (11.8%) |
| 35 to 64 Years | 0 (0.0%) | 0 (0.0%) |
| 65 to 74 Years | 0 (0.0%) | 0 (0.0%) |
| 75 Years and over | 0 (0.0%) | 6 (54.5%) |
Disability Class: Cognitive Difficulty
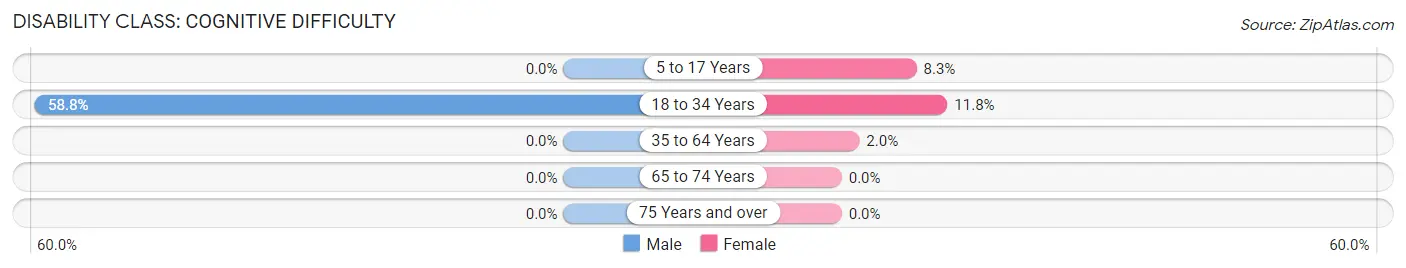
| Age Bracket | Male | Female |
| 5 to 17 Years | 0 (0.0%) | 2 (8.3%) |
| 18 to 34 Years | 30 (58.8%) | 4 (11.8%) |
| 35 to 64 Years | 0 (0.0%) | 3 (2.0%) |
| 65 to 74 Years | 0 (0.0%) | 0 (0.0%) |
| 75 Years and over | 0 (0.0%) | 0 (0.0%) |
Disability Class: Ambulatory Difficulty
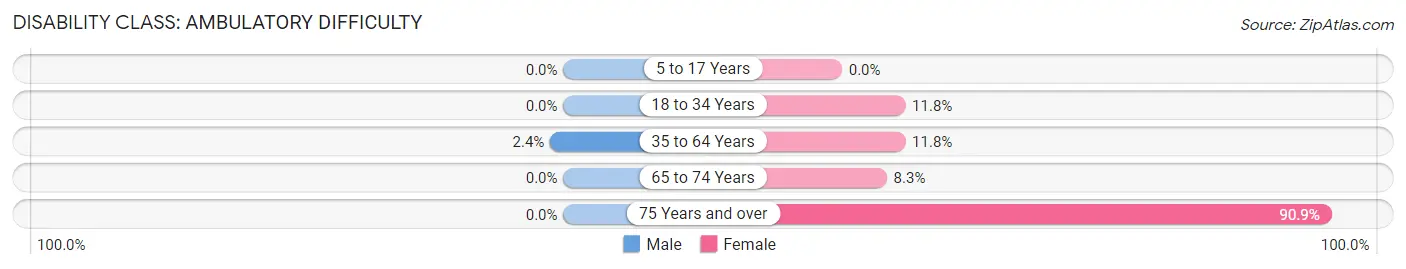
| Age Bracket | Male | Female |
| 5 to 17 Years | 0 (0.0%) | 0 (0.0%) |
| 18 to 34 Years | 0 (0.0%) | 4 (11.8%) |
| 35 to 64 Years | 2 (2.4%) | 18 (11.8%) |
| 65 to 74 Years | 0 (0.0%) | 1 (8.3%) |
| 75 Years and over | 0 (0.0%) | 10 (90.9%) |
Disability Class: Self-Care Difficulty
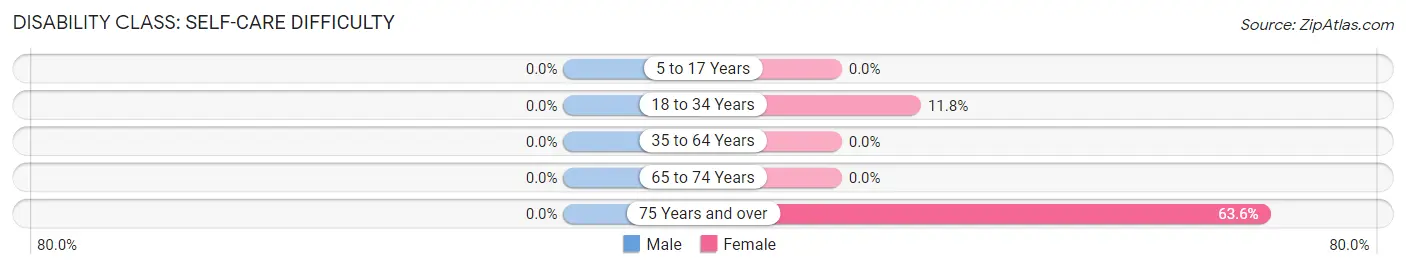
| Age Bracket | Male | Female |
| 5 to 17 Years | 0 (0.0%) | 0 (0.0%) |
| 18 to 34 Years | 0 (0.0%) | 4 (11.8%) |
| 35 to 64 Years | 0 (0.0%) | 0 (0.0%) |
| 65 to 74 Years | 0 (0.0%) | 0 (0.0%) |
| 75 Years and over | 0 (0.0%) | 7 (63.6%) |
Technology Access in Leslie
Computing Device Access in Leslie
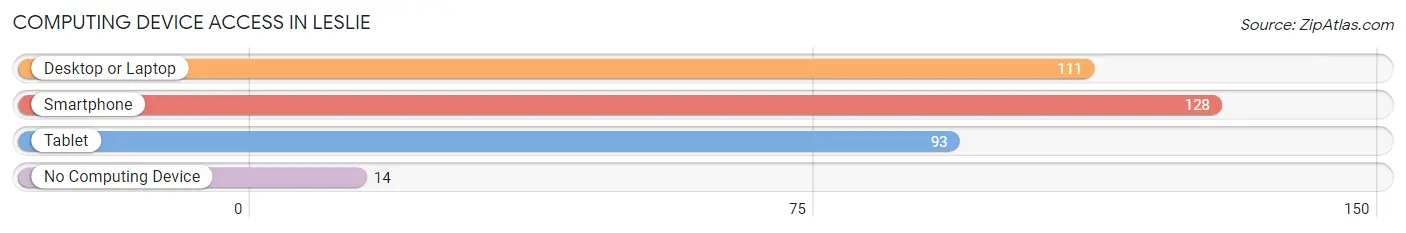
| Device Type | # Households | % Households |
| Desktop or Laptop | 111 | 64.9% |
| Smartphone | 128 | 74.9% |
| Tablet | 93 | 54.4% |
| No Computing Device | 14 | 8.2% |
| Total | 171 | 100.0% |
Internet Access in Leslie
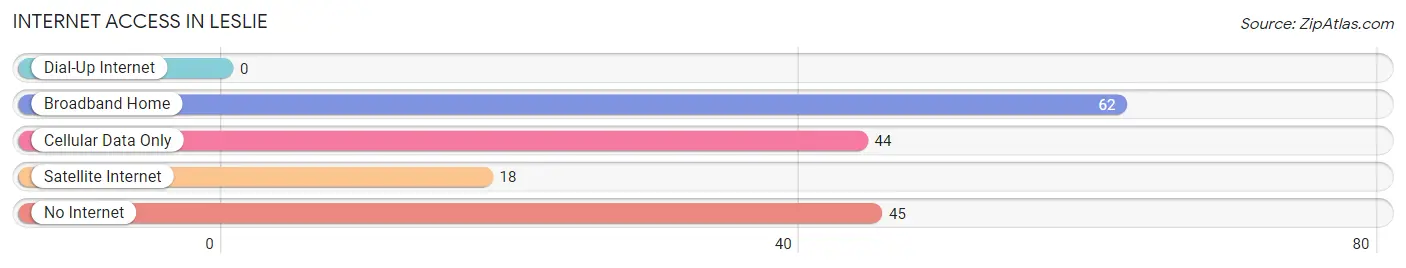
| Internet Type | # Households | % Households |
| Dial-Up Internet | 0 | 0.0% |
| Broadband Home | 62 | 36.3% |
| Cellular Data Only | 44 | 25.7% |
| Satellite Internet | 18 | 10.5% |
| No Internet | 45 | 26.3% |
| Total | 171 | 100.0% |
Leslie Summary
Leslie, Georgia is a small town located in Sumter County, Georgia. It is situated in the southwestern part of the state, about 40 miles south of Macon and about 60 miles north of Albany. The town was founded in 1854 and was named after the first postmaster, William Leslie. The population of Leslie was estimated to be 1,072 in 2019.
Geography
Leslie is located in the southwestern part of Sumter County, Georgia. It is situated in the Flint River Valley, which is part of the larger Chattahoochee River Valley. The town is located at an elevation of about 300 feet above sea level. The climate in Leslie is humid subtropical, with hot summers and mild winters. The average annual temperature is around 70 degrees Fahrenheit.
The town is surrounded by a variety of natural features, including the Flint River, which runs through the town. Other nearby bodies of water include Lake Blackshear, Lake Walter F. George, and the Ocmulgee River. The town is also located near several state parks, including the Georgia Veterans State Park, the Florence Marina State Park, and the Providence Canyon State Park.
Economy
The economy of Leslie is largely based on agriculture. The town is home to several farms, which produce a variety of crops, including cotton, corn, soybeans, and peanuts. The town is also home to several manufacturing companies, which produce a variety of products, including furniture, textiles, and automotive parts.
The town is also home to several small businesses, including restaurants, retail stores, and service providers. The town is also home to a few small-scale industries, such as a sawmill and a woodworking shop.
Demographics
The population of Leslie was estimated to be 1,072 in 2019. The town is predominantly white, with about 75% of the population identifying as white. The remaining 25% of the population is made up of African Americans, Hispanics, and other ethnicities.
The median household income in Leslie is around $35,000, which is slightly lower than the national average. The median home value in the town is around $90,000, which is also lower than the national average.
The town has a low unemployment rate, with only about 4% of the population being unemployed. The town also has a low poverty rate, with only about 10% of the population living below the poverty line.
Conclusion
Leslie, Georgia is a small town located in Sumter County, Georgia. It is situated in the southwestern part of the state, about 40 miles south of Macon and about 60 miles north of Albany. The town was founded in 1854 and was named after the first postmaster, William Leslie. The population of Leslie was estimated to be 1,072 in 2019. The town is predominantly white, with about 75% of the population identifying as white. The economy of Leslie is largely based on agriculture, with several farms producing a variety of crops. The town is also home to several small businesses, including restaurants, retail stores, and service providers. The median household income in Leslie is around $35,000, which is slightly lower than the national average. The town has a low unemployment rate, with only about 4% of the population being unemployed. The town also has a low poverty rate, with only about 10% of the population living below the poverty line.
Common Questions
What is Per Capita Income in Leslie?
Per Capita income in Leslie is $31,988.
What is the Median Family Income in Leslie?
Median Family Income in Leslie is $80,000.
What is the Median Household income in Leslie?
Median Household Income in Leslie is $51,688.
What is Income or Wage Gap in Leslie?
Income or Wage Gap in Leslie is 25.1%.
Women in Leslie earn 74.9 cents for every dollar earned by a man.
What is Inequality or Gini Index in Leslie?
Inequality or Gini Index in Leslie is 0.42.
What is the Total Population of Leslie?
Total Population of Leslie is 525.
What is the Total Male Population of Leslie?
Total Male Population of Leslie is 291.
What is the Total Female Population of Leslie?
Total Female Population of Leslie is 234.
What is the Ratio of Males per 100 Females in Leslie?
There are 124.36 Males per 100 Females in Leslie.
What is the Ratio of Females per 100 Males in Leslie?
There are 80.41 Females per 100 Males in Leslie.
What is the Median Population Age in Leslie?
Median Population Age in Leslie is 40.3 Years.
What is the Average Family Size in Leslie
Average Family Size in Leslie is 4.1 People.
What is the Average Household Size in Leslie
Average Household Size in Leslie is 3.1 People.
How Large is the Labor Force in Leslie?
There are 221 People in the Labor Forcein in Leslie.
What is the Percentage of People in the Labor Force in Leslie?
53.1% of People are in the Labor Force in Leslie.
What is the Unemployment Rate in Leslie?
Unemployment Rate in Leslie is 4.1%.