Keysville, GA Map & Demographics
Keysville Map
Keysville Overview
$20,832
PER CAPITA INCOME
$42,813
AVG HOUSEHOLD INCOME
14.5%
WAGE / INCOME GAP [ % ]
85.5¢/ $1
WAGE / INCOME GAP [ $ ]
0.47
INEQUALITY / GINI INDEX
403
TOTAL POPULATION
243
MALE POPULATION
160
FEMALE POPULATION
151.88
MALES / 100 FEMALES
65.84
FEMALES / 100 MALES
52.2
MEDIAN AGE
4.8
AVG FAMILY SIZE
3.5
AVG HOUSEHOLD SIZE
109
LABOR FORCE [ PEOPLE ]
31.9%
PERCENT IN LABOR FORCE
Keysville Zip Codes
Income in Keysville
Income Overview in Keysville
| Characteristic | Number | Measure |
| Per Capita Income | 403 | $20,832 |
| Median Family Income | 66 | $0 |
| Mean Family Income | 66 | $55,188 |
| Median Household Income | 111 | $42,813 |
| Mean Household Income | 111 | $50,286 |
| Income Deficit | 66 | $0 |
| Wage / Income Gap (%) | 403 | 14.49% |
| Wage / Income Gap ($) | 403 | 85.51¢ per $1 |
| Gini / Inequality Index | 403 | 0.47 |
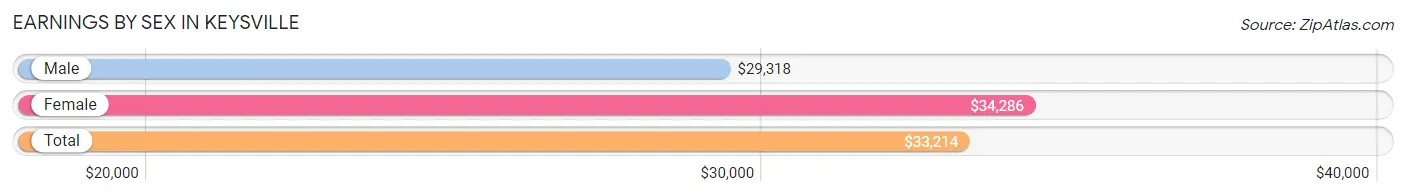
Earnings by Sex in Keysville
Average Earnings in Keysville are $33,214, $29,318 for men and $34,286 for women, a difference of 14.5%.
| Sex | Number | Average Earnings |
| Male | 58 (51.8%) | $29,318 |
| Female | 54 (48.2%) | $34,286 |
| Total | 112 (100.0%) | $33,214 |
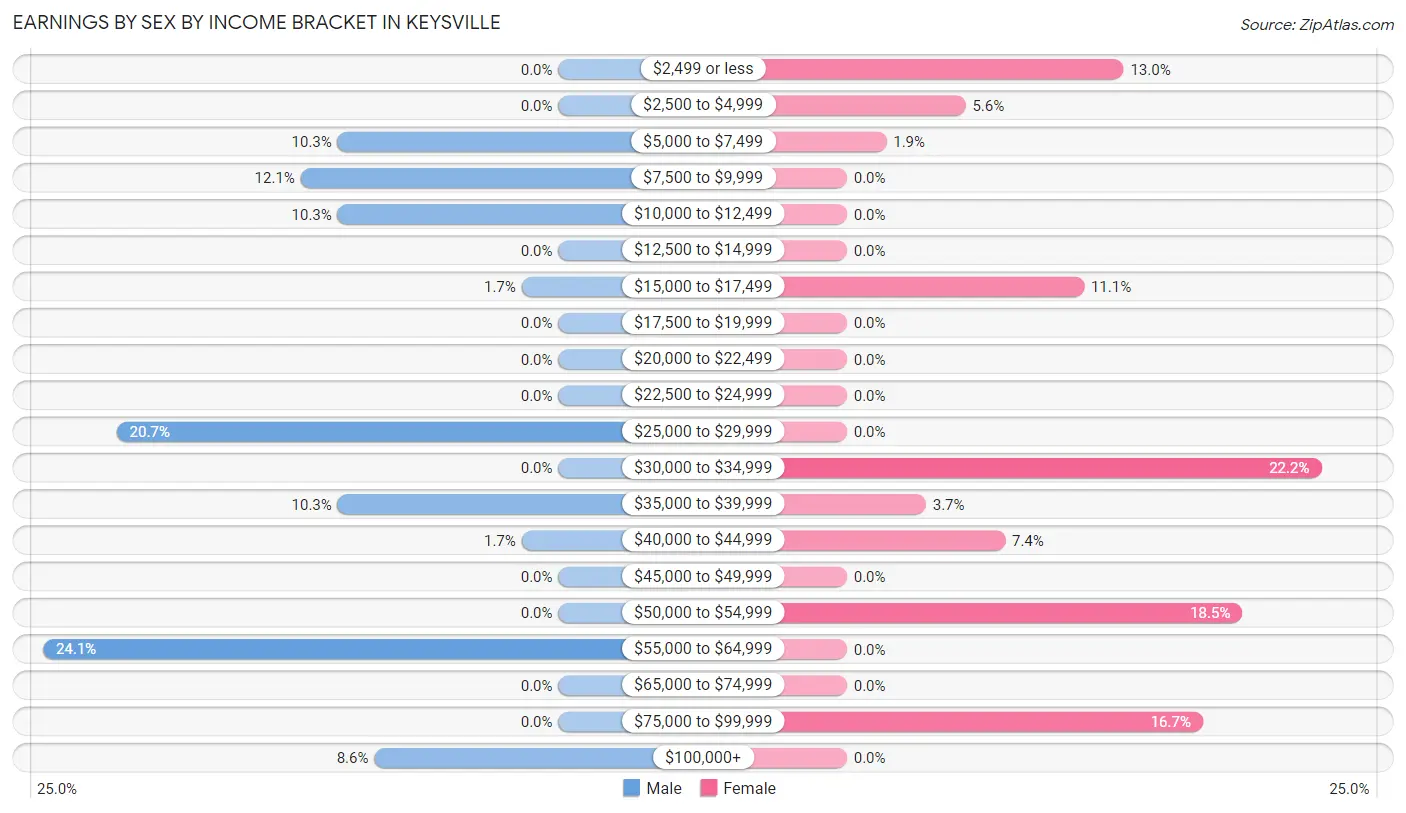
Earnings by Sex by Income Bracket in Keysville
The most common earnings brackets in Keysville are $55,000 to $64,999 for men (14 | 24.1%) and $30,000 to $34,999 for women (12 | 22.2%).
| Income | Male | Female |
| $2,499 or less | 0 (0.0%) | 7 (13.0%) |
| $2,500 to $4,999 | 0 (0.0%) | 3 (5.6%) |
| $5,000 to $7,499 | 6 (10.3%) | 1 (1.8%) |
| $7,500 to $9,999 | 7 (12.1%) | 0 (0.0%) |
| $10,000 to $12,499 | 6 (10.3%) | 0 (0.0%) |
| $12,500 to $14,999 | 0 (0.0%) | 0 (0.0%) |
| $15,000 to $17,499 | 1 (1.7%) | 6 (11.1%) |
| $17,500 to $19,999 | 0 (0.0%) | 0 (0.0%) |
| $20,000 to $22,499 | 0 (0.0%) | 0 (0.0%) |
| $22,500 to $24,999 | 0 (0.0%) | 0 (0.0%) |
| $25,000 to $29,999 | 12 (20.7%) | 0 (0.0%) |
| $30,000 to $34,999 | 0 (0.0%) | 12 (22.2%) |
| $35,000 to $39,999 | 6 (10.3%) | 2 (3.7%) |
| $40,000 to $44,999 | 1 (1.7%) | 4 (7.4%) |
| $45,000 to $49,999 | 0 (0.0%) | 0 (0.0%) |
| $50,000 to $54,999 | 0 (0.0%) | 10 (18.5%) |
| $55,000 to $64,999 | 14 (24.1%) | 0 (0.0%) |
| $65,000 to $74,999 | 0 (0.0%) | 0 (0.0%) |
| $75,000 to $99,999 | 0 (0.0%) | 9 (16.7%) |
| $100,000+ | 5 (8.6%) | 0 (0.0%) |
| Total | 58 (100.0%) | 54 (100.0%) |
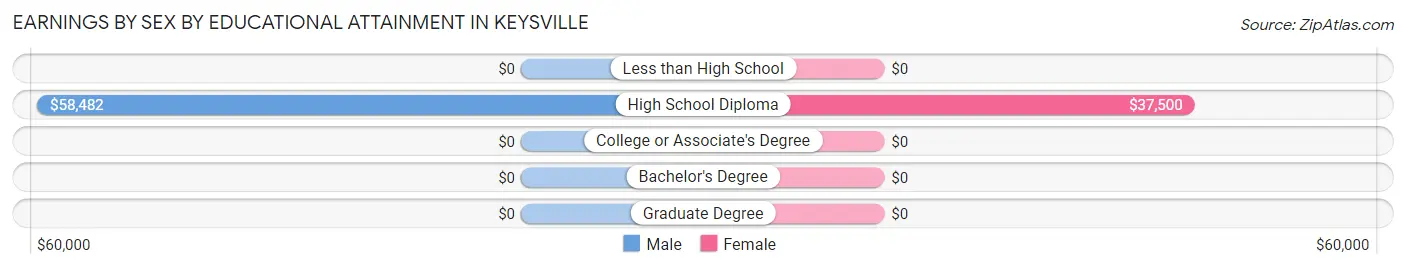
Earnings by Sex by Educational Attainment in Keysville
Average earnings in Keysville are $36,667 for men and $36,250 for women, a difference of 1.1%. Men with an educational attainment of high school diploma enjoy the highest average annual earnings of $58,482, while those with high school diploma education earn the least with $58,482. Women with an educational attainment of high school diploma earn the most with the average annual earnings of $37,500, while those with high school diploma education have the smallest earnings of $37,500.
| Educational Attainment | Male Income | Female Income |
| Less than High School | - | - |
| High School Diploma | $58,482 | $37,500 |
| College or Associate's Degree | - | - |
| Bachelor's Degree | - | - |
| Graduate Degree | - | - |
| Total | $36,667 | $36,250 |
Family Income in Keysville
Family Income Brackets in Keysville
According to the Keysville family income data, there are 15 families falling into the $15,000 to $24,999 income range, which is the most common income bracket and makes up 22.7% of all families.
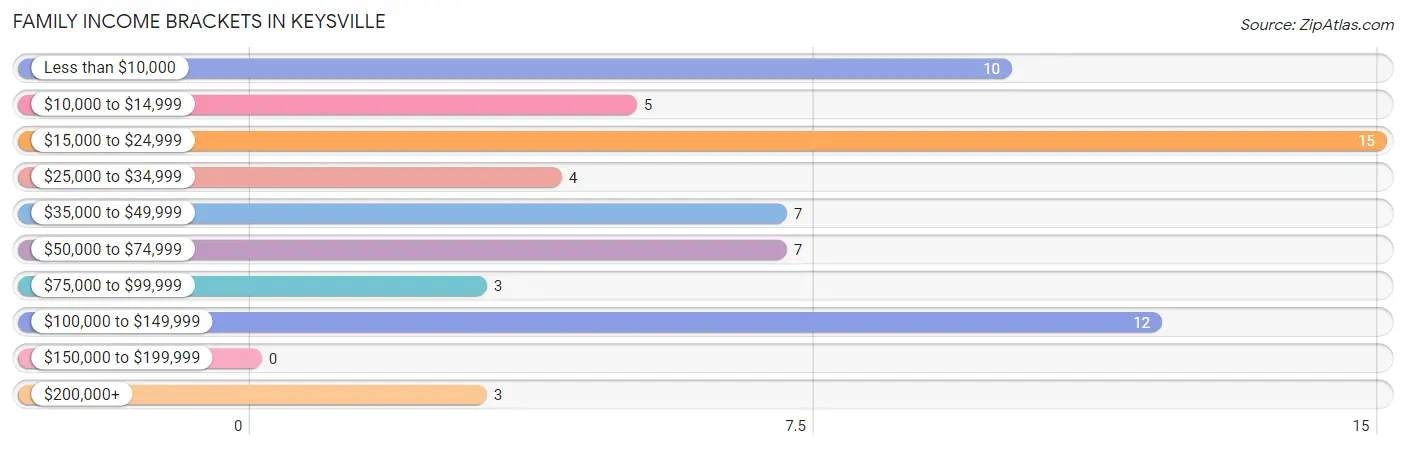
| Income Bracket | # Families | % Families |
| Less than $10,000 | 10 | 15.2% |
| $10,000 to $14,999 | 5 | 7.6% |
| $15,000 to $24,999 | 15 | 22.7% |
| $25,000 to $34,999 | 4 | 6.1% |
| $35,000 to $49,999 | 7 | 10.6% |
| $50,000 to $74,999 | 7 | 10.6% |
| $75,000 to $99,999 | 3 | 4.5% |
| $100,000 to $149,999 | 12 | 18.2% |
| $150,000 to $199,999 | 0 | 0.0% |
| $200,000+ | 3 | 4.5% |
Family Income by Famaliy Size in Keysville
2-person families (35 | 53.0%) account for the highest median family income in Keysville with $17,292 per family, while 2-person families (35 | 53.0%) have the highest median income of $8,646 per family member.
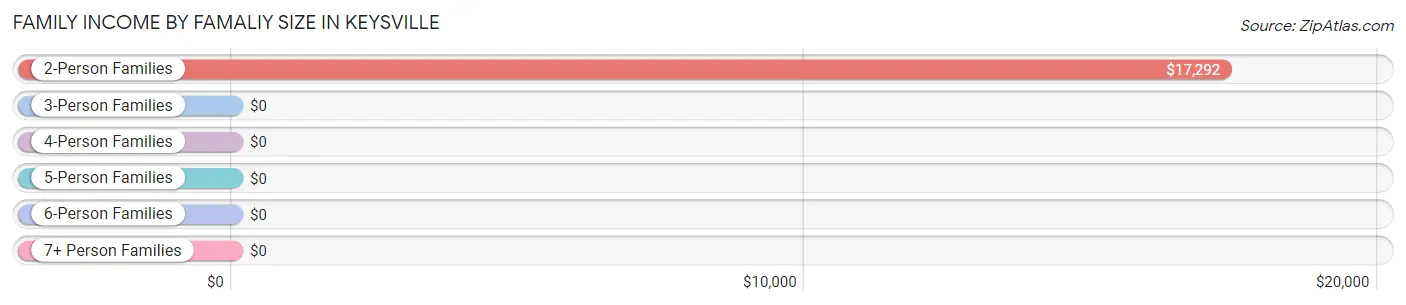
| Income Bracket | # Families | Median Income |
| 2-Person Families | 35 (53.0%) | $17,292 |
| 3-Person Families | 18 (27.3%) | $0 |
| 4-Person Families | 0 (0.0%) | $0 |
| 5-Person Families | 10 (15.1%) | $0 |
| 6-Person Families | 3 (4.5%) | $0 |
| 7+ Person Families | 0 (0.0%) | $0 |
| Total | 66 (100.0%) | $0 |
Family Income by Number of Earners in Keysville
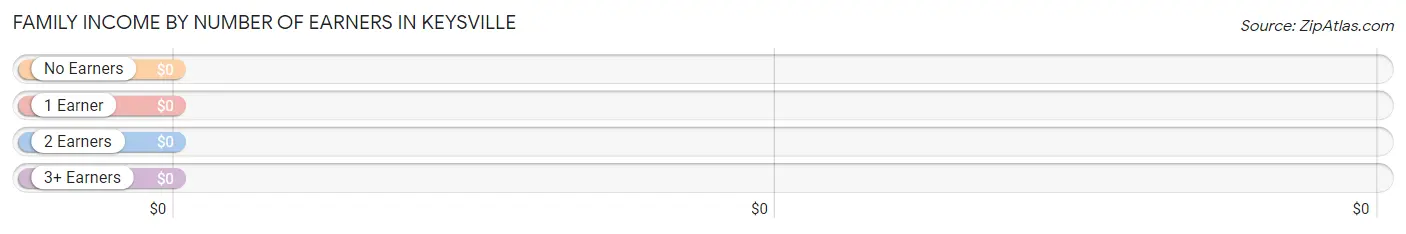
| Number of Earners | # Families | Median Income |
| No Earners | 21 (31.8%) | $0 |
| 1 Earner | 20 (30.3%) | $0 |
| 2 Earners | 19 (28.8%) | $0 |
| 3+ Earners | 6 (9.1%) | $0 |
| Total | 66 (100.0%) | $0 |
Household Income in Keysville
Household Income Brackets in Keysville
With 33 households falling in the category, the $50,000 to $74,999 income range is the most frequent in Keysville, accounting for 29.7% of all households. In contrast, only 1 households (0.9%) fall into the $150,000 to $199,999 income bracket, making it the least populous group.
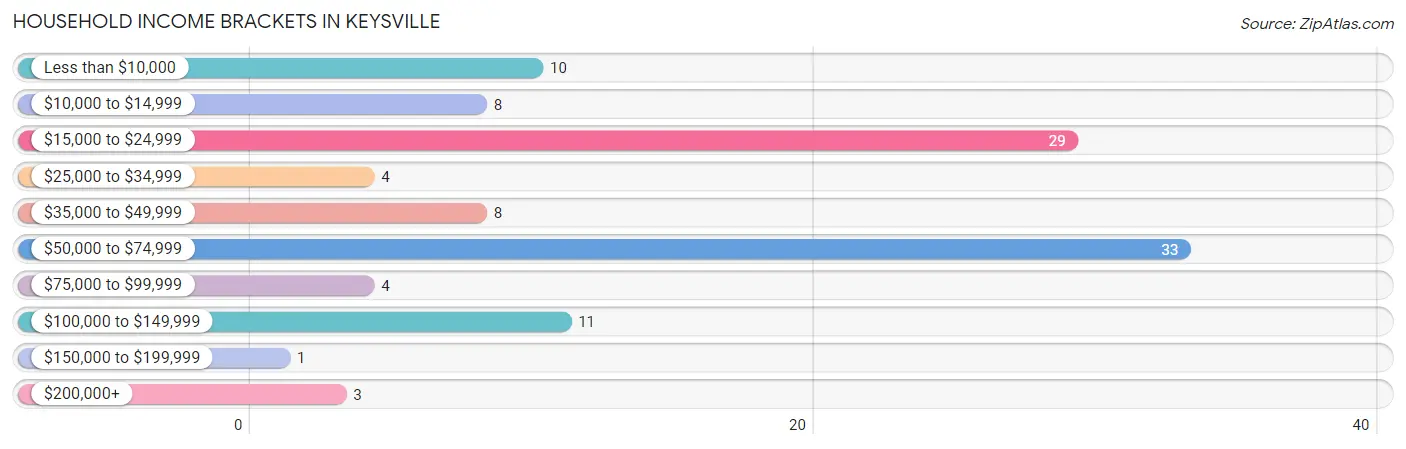
| Income Bracket | # Households | % Households |
| Less than $10,000 | 10 | 9.0% |
| $10,000 to $14,999 | 8 | 7.2% |
| $15,000 to $24,999 | 29 | 26.1% |
| $25,000 to $34,999 | 4 | 3.6% |
| $35,000 to $49,999 | 8 | 7.2% |
| $50,000 to $74,999 | 33 | 29.7% |
| $75,000 to $99,999 | 4 | 3.6% |
| $100,000 to $149,999 | 11 | 9.9% |
| $150,000 to $199,999 | 1 | 0.9% |
| $200,000+ | 3 | 2.7% |
Household Income by Householder Age in Keysville
The median household income in Keysville is $42,813, with the highest median household income of $58,393 found in the 25 to 44 years age bracket for the primary householder. A total of 24 households (21.6%) fall into this category. Meanwhile, the 15 to 24 years age bracket for the primary householder has the lowest median household income of $0, with 5 households (4.5%) in this group.
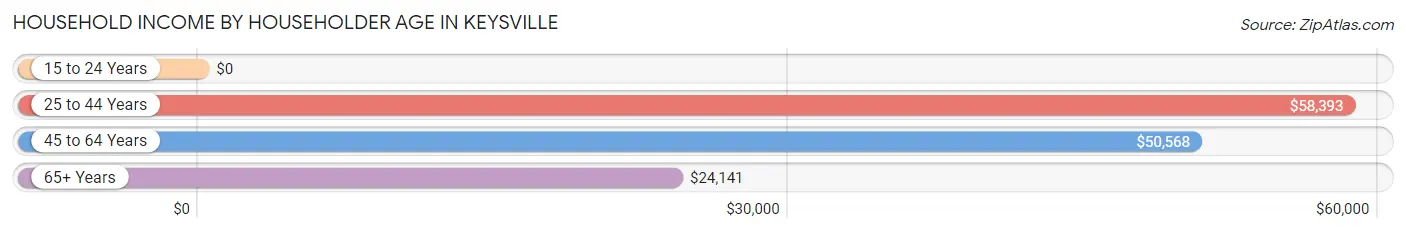
| Income Bracket | # Households | Median Income |
| 15 to 24 Years | 5 (4.5%) | $0 |
| 25 to 44 Years | 24 (21.6%) | $58,393 |
| 45 to 64 Years | 41 (36.9%) | $50,568 |
| 65+ Years | 41 (36.9%) | $24,141 |
| Total | 111 (100.0%) | $42,813 |
Poverty in Keysville
Income Below Poverty by Sex and Age in Keysville
With 13.0% poverty level for males and 20.1% for females among the residents of Keysville, 6 to 11 year old males and 6 to 11 year old females are the most vulnerable to poverty, with 14 males (60.9%) and 3 females (100.0%) in their respective age groups living below the poverty level.
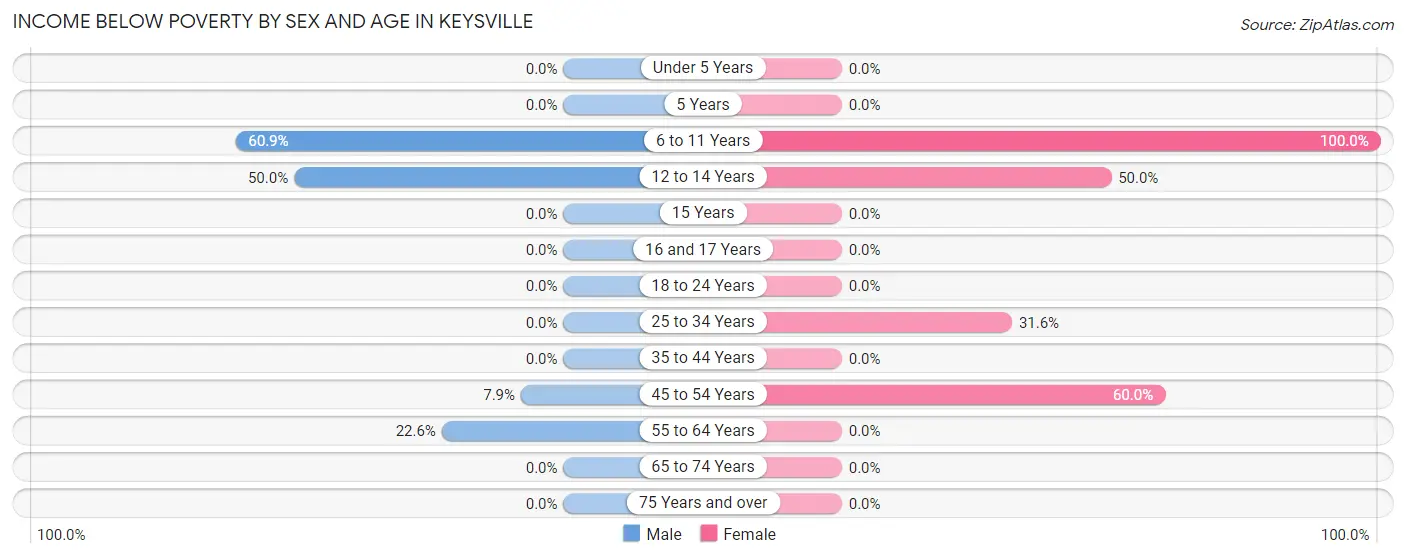
| Age Bracket | Male | Female |
| Under 5 Years | 0 (0.0%) | 0 (0.0%) |
| 5 Years | 0 (0.0%) | 0 (0.0%) |
| 6 to 11 Years | 14 (60.9%) | 3 (100.0%) |
| 12 to 14 Years | 4 (50.0%) | 6 (50.0%) |
| 15 Years | 0 (0.0%) | 0 (0.0%) |
| 16 and 17 Years | 0 (0.0%) | 0 (0.0%) |
| 18 to 24 Years | 0 (0.0%) | 0 (0.0%) |
| 25 to 34 Years | 0 (0.0%) | 6 (31.6%) |
| 35 to 44 Years | 0 (0.0%) | 0 (0.0%) |
| 45 to 54 Years | 6 (7.9%) | 15 (60.0%) |
| 55 to 64 Years | 7 (22.6%) | 0 (0.0%) |
| 65 to 74 Years | 0 (0.0%) | 0 (0.0%) |
| 75 Years and over | 0 (0.0%) | 0 (0.0%) |
| Total | 31 (13.0%) | 30 (20.1%) |
Income Above Poverty by Sex and Age in Keysville
According to the poverty statistics in Keysville, males aged under 5 years and females aged 15 years are the age groups that are most secure financially, with 100.0% of males and 100.0% of females in these age groups living above the poverty line.
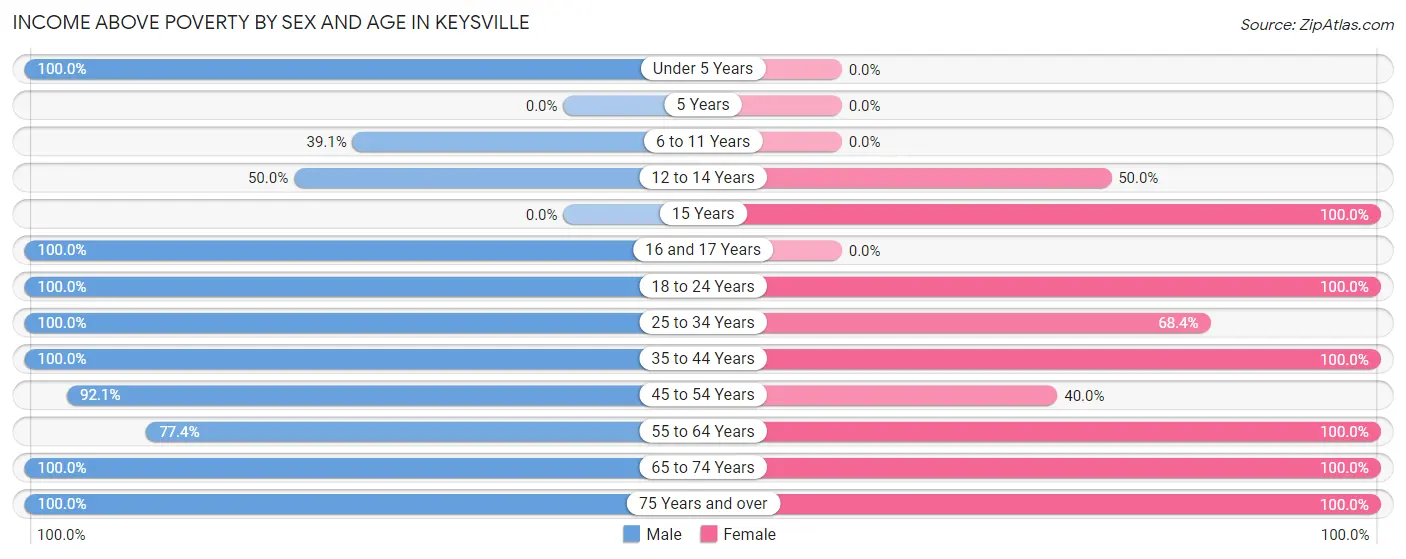
| Age Bracket | Male | Female |
| Under 5 Years | 4 (100.0%) | 0 (0.0%) |
| 5 Years | 0 (0.0%) | 0 (0.0%) |
| 6 to 11 Years | 9 (39.1%) | 0 (0.0%) |
| 12 to 14 Years | 4 (50.0%) | 6 (50.0%) |
| 15 Years | 0 (0.0%) | 5 (100.0%) |
| 16 and 17 Years | 4 (100.0%) | 0 (0.0%) |
| 18 to 24 Years | 10 (100.0%) | 5 (100.0%) |
| 25 to 34 Years | 41 (100.0%) | 13 (68.4%) |
| 35 to 44 Years | 18 (100.0%) | 12 (100.0%) |
| 45 to 54 Years | 70 (92.1%) | 10 (40.0%) |
| 55 to 64 Years | 24 (77.4%) | 16 (100.0%) |
| 65 to 74 Years | 7 (100.0%) | 16 (100.0%) |
| 75 Years and over | 17 (100.0%) | 36 (100.0%) |
| Total | 208 (87.0%) | 119 (79.9%) |
Income Below Poverty Among Married-Couple Families in Keysville
The poverty statistics for married-couple families in Keysville show that 28.6% or 12 of the total 42 families live below the poverty line. Families with no children have the highest poverty rate of 34.3%, comprising of 12 families. On the other hand, families with 1 or 2 children have the lowest poverty rate of 0.0%, which includes 0 families.
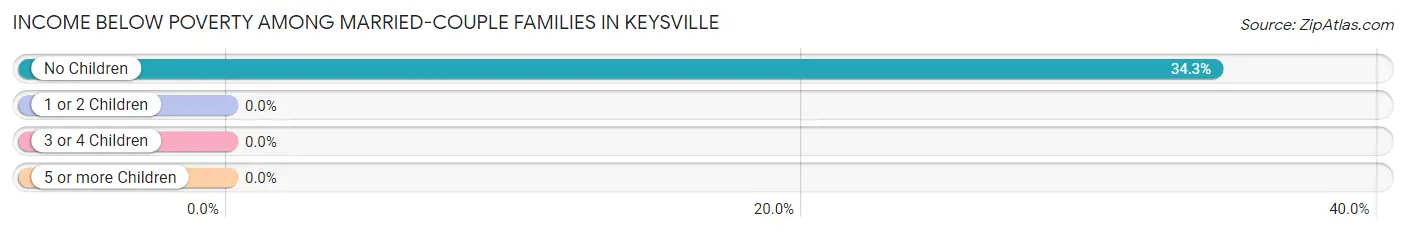
| Children | Above Poverty | Below Poverty |
| No Children | 23 (65.7%) | 12 (34.3%) |
| 1 or 2 Children | 7 (100.0%) | 0 (0.0%) |
| 3 or 4 Children | 0 (0.0%) | 0 (0.0%) |
| 5 or more Children | 0 (0.0%) | 0 (0.0%) |
| Total | 30 (71.4%) | 12 (28.6%) |
Income Below Poverty Among Single-Parent Households in Keysville
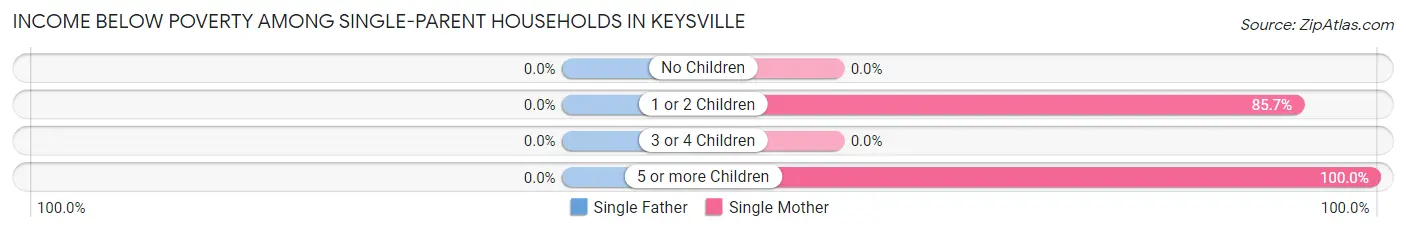
| Children | Single Father | Single Mother |
| No Children | 0 (0.0%) | 0 (0.0%) |
| 1 or 2 Children | 0 (0.0%) | 6 (85.7%) |
| 3 or 4 Children | 0 (0.0%) | 0 (0.0%) |
| 5 or more Children | 0 (0.0%) | 3 (100.0%) |
| Total | 0 (0.0%) | 9 (45.0%) |
Income Below Poverty Among Married-Couple vs Single-Parent Households in Keysville
The poverty data for Keysville shows that 12 of the married-couple family households (28.6%) and 9 of the single-parent households (37.5%) are living below the poverty level. Within the married-couple family households, those with no children have the highest poverty rate, with 12 households (34.3%) falling below the poverty line. Among the single-parent households, those with 5 or more children have the highest poverty rate, with 3 household (100.0%) living below poverty.
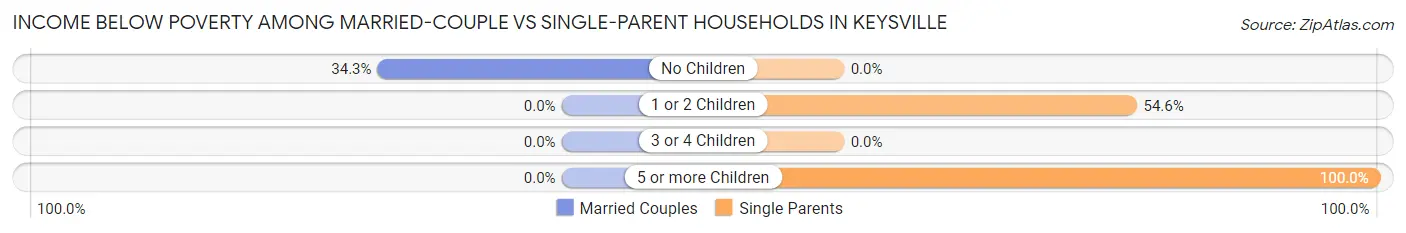
| Children | Married-Couple Families | Single-Parent Households |
| No Children | 12 (34.3%) | 0 (0.0%) |
| 1 or 2 Children | 0 (0.0%) | 6 (54.5%) |
| 3 or 4 Children | 0 (0.0%) | 0 (0.0%) |
| 5 or more Children | 0 (0.0%) | 3 (100.0%) |
| Total | 12 (28.6%) | 9 (37.5%) |
Race in Keysville
The most populous races in Keysville are Black / African American (190 | 47.1%), White / Caucasian (106 | 26.3%), and Hispanic or Latino (71 | 17.6%).
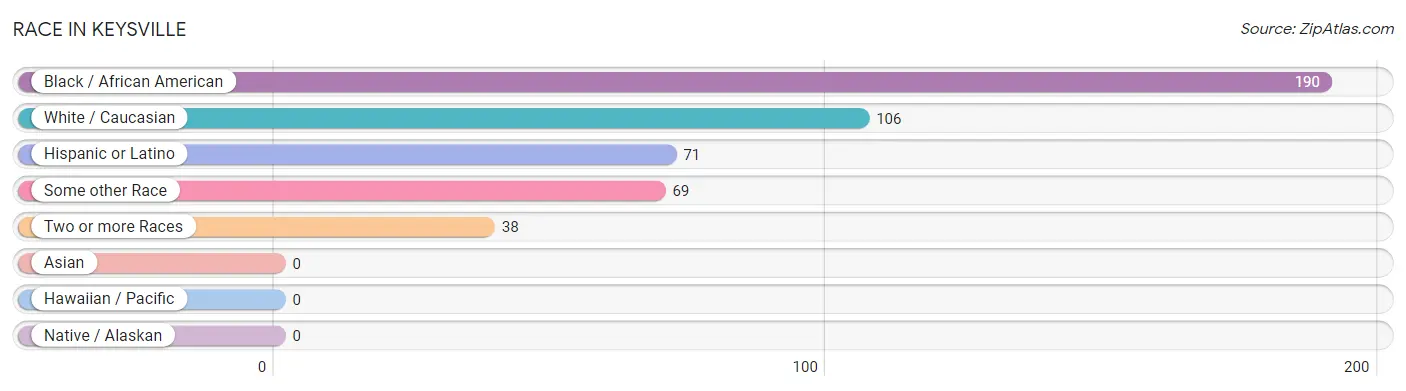
| Race | # Population | % Population |
| Asian | 0 | 0.0% |
| Black / African American | 190 | 47.1% |
| Hawaiian / Pacific | 0 | 0.0% |
| Hispanic or Latino | 71 | 17.6% |
| Native / Alaskan | 0 | 0.0% |
| White / Caucasian | 106 | 26.3% |
| Two or more Races | 38 | 9.4% |
| Some other Race | 69 | 17.1% |
| Total | 403 | 100.0% |
Ancestry in Keysville
The most populous ancestries reported in Keysville are Dominican (69 | 17.1%), American (40 | 9.9%), Irish (20 | 5.0%), European (13 | 3.2%), and German (10 | 2.5%), together accounting for 37.7% of all Keysville residents.
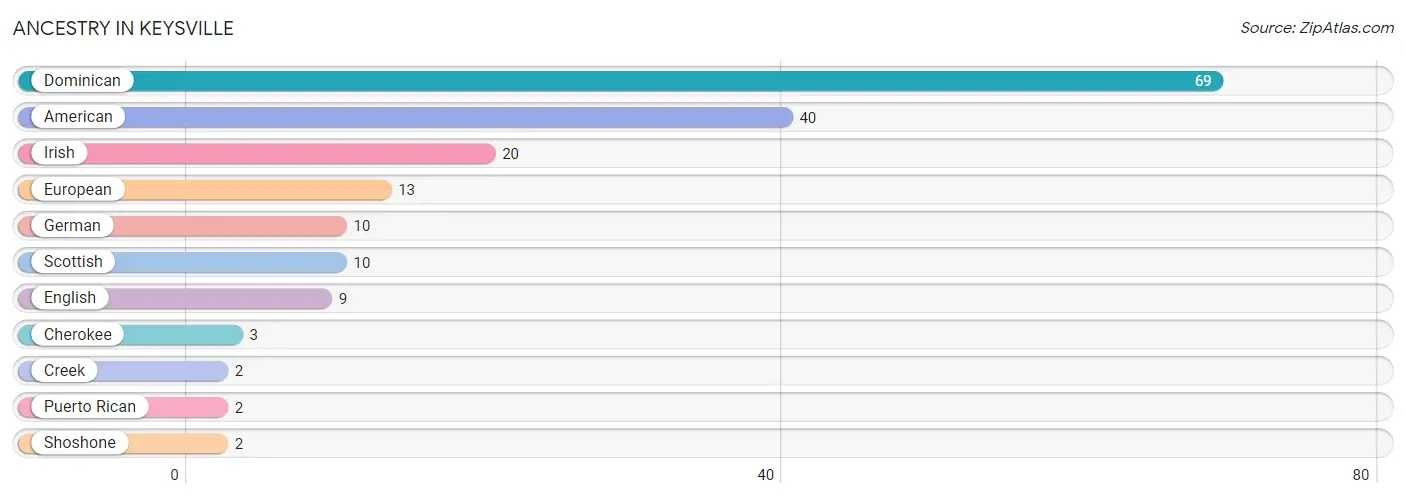
| Ancestry | # Population | % Population |
| American | 40 | 9.9% |
| Cherokee | 3 | 0.7% |
| Creek | 2 | 0.5% |
| Dominican | 69 | 17.1% |
| English | 9 | 2.2% |
| European | 13 | 3.2% |
| German | 10 | 2.5% |
| Irish | 20 | 5.0% |
| Puerto Rican | 2 | 0.5% |
| Scottish | 10 | 2.5% |
| Shoshone | 2 | 0.5% | View All 11 Rows |
Immigrants in Keysville

| Immigration Origin | # Population | % Population | View All 0 Rows |
Sex and Age in Keysville
Sex and Age in Keysville
The most populous age groups in Keysville are 50 to 54 Years (75 | 30.9%) for men and 70 to 74 Years (23 | 14.4%) for women.
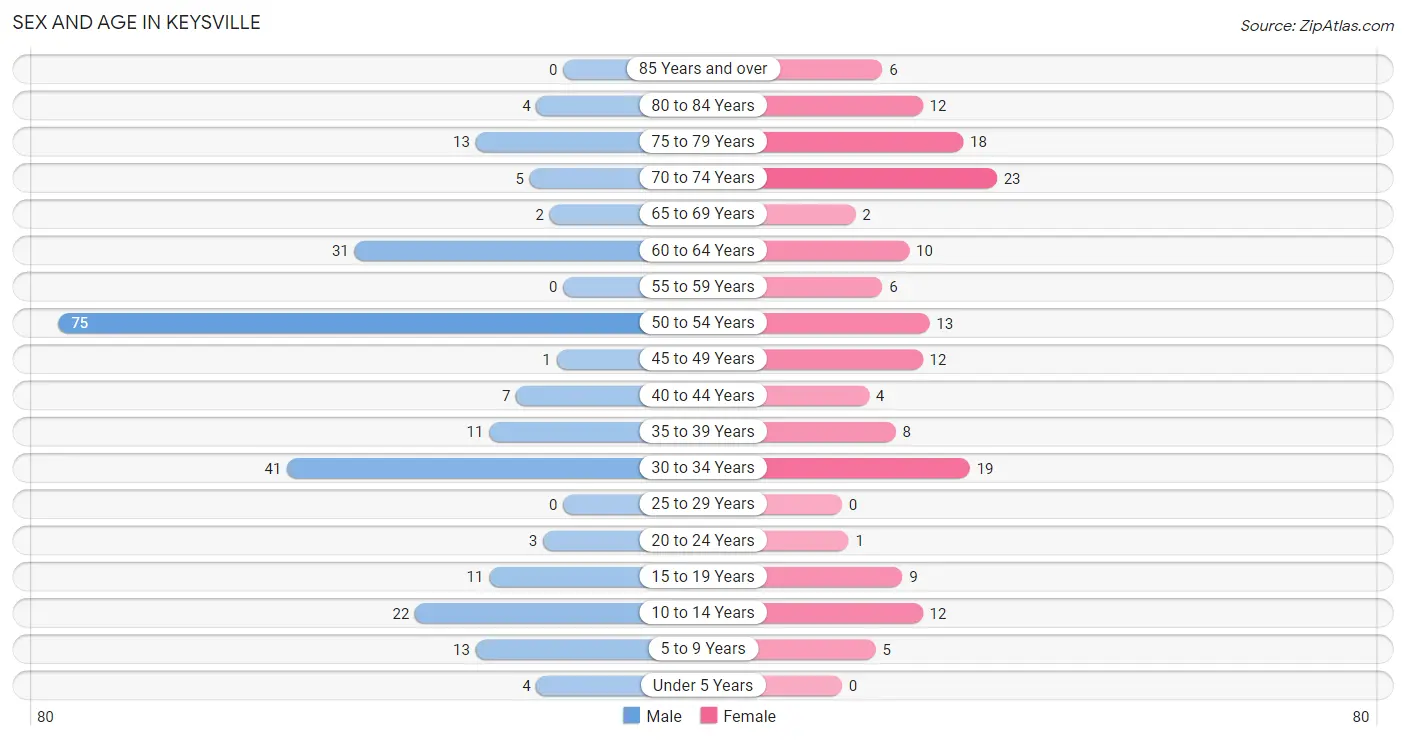
| Age Bracket | Male | Female |
| Under 5 Years | 4 (1.7%) | 0 (0.0%) |
| 5 to 9 Years | 13 (5.3%) | 5 (3.1%) |
| 10 to 14 Years | 22 (9.0%) | 12 (7.5%) |
| 15 to 19 Years | 11 (4.5%) | 9 (5.6%) |
| 20 to 24 Years | 3 (1.2%) | 1 (0.6%) |
| 25 to 29 Years | 0 (0.0%) | 0 (0.0%) |
| 30 to 34 Years | 41 (16.9%) | 19 (11.9%) |
| 35 to 39 Years | 11 (4.5%) | 8 (5.0%) |
| 40 to 44 Years | 7 (2.9%) | 4 (2.5%) |
| 45 to 49 Years | 1 (0.4%) | 12 (7.5%) |
| 50 to 54 Years | 75 (30.9%) | 13 (8.1%) |
| 55 to 59 Years | 0 (0.0%) | 6 (3.7%) |
| 60 to 64 Years | 31 (12.8%) | 10 (6.2%) |
| 65 to 69 Years | 2 (0.8%) | 2 (1.3%) |
| 70 to 74 Years | 5 (2.1%) | 23 (14.4%) |
| 75 to 79 Years | 13 (5.3%) | 18 (11.3%) |
| 80 to 84 Years | 4 (1.7%) | 12 (7.5%) |
| 85 Years and over | 0 (0.0%) | 6 (3.7%) |
| Total | 243 (100.0%) | 160 (100.0%) |
Families and Households in Keysville
Median Family Size in Keysville
The median family size in Keysville is 4.77 persons per family, with single male/father families (4 | 6.1%) accounting for the largest median family size of 8.75 persons per family. On the other hand, single female/mother families (20 | 30.3%) represent the smallest median family size with 4.30 persons per family.
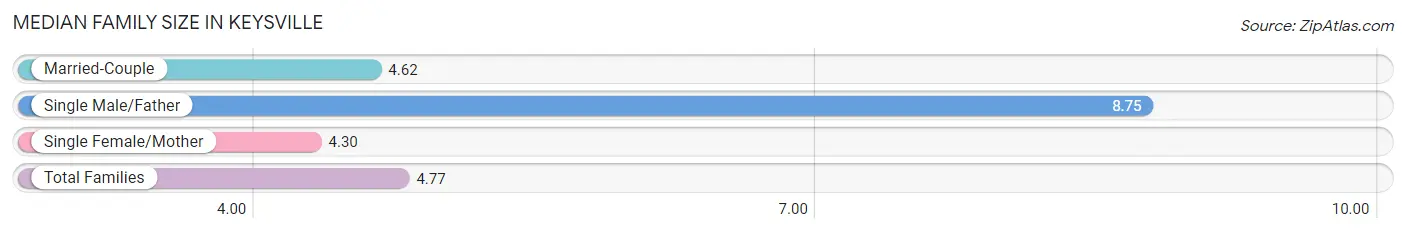
| Family Type | # Families | Family Size |
| Married-Couple | 42 (63.6%) | 4.62 |
| Single Male/Father | 4 (6.1%) | 8.75 |
| Single Female/Mother | 20 (30.3%) | 4.30 |
| Total Families | 66 (100.0%) | 4.77 |
Median Household Size in Keysville
The median household size in Keysville is 3.45 persons per household, with single male/father households (4 | 3.6%) accounting for the largest median household size of 8.75 persons per household. non-family households (45 | 40.5%) represent the smallest median household size with 1.16 persons per household.
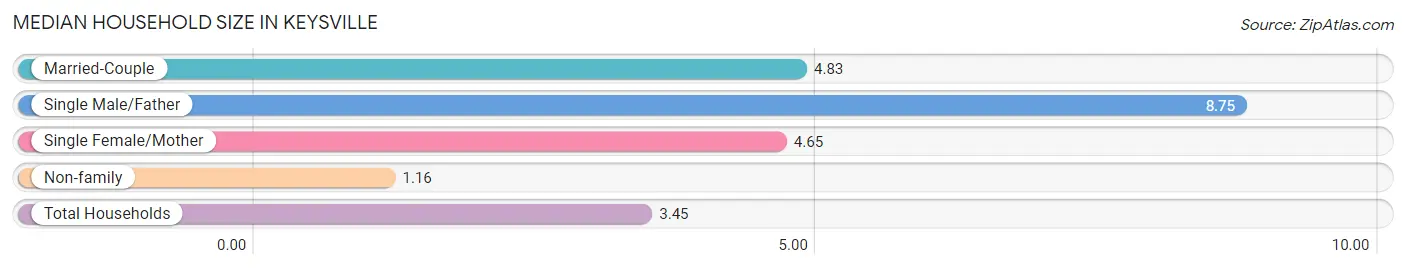
| Household Type | # Households | Household Size |
| Married-Couple | 42 (37.8%) | 4.83 |
| Single Male/Father | 4 (3.6%) | 8.75 |
| Single Female/Mother | 20 (18.0%) | 4.65 |
| Non-family | 45 (40.5%) | 1.16 |
| Total Households | 111 (100.0%) | 3.45 |
Household Size by Marriage Status in Keysville
Out of a total of 111 households in Keysville, 66 (59.5%) are family households, while 45 (40.5%) are nonfamily households. The most numerous type of family households are 2-person households, comprising 35, and the most common type of nonfamily households are 1-person households, comprising 42.
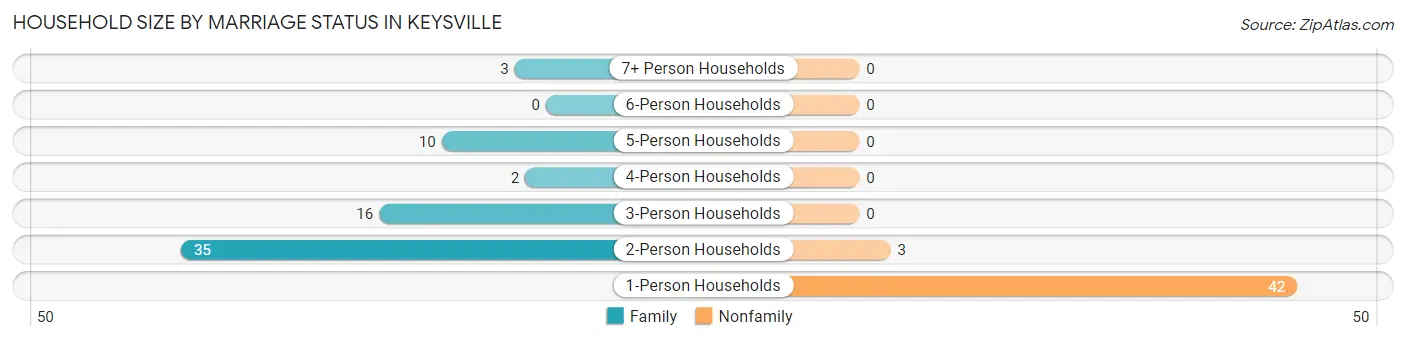
| Household Size | Family Households | Nonfamily Households |
| 1-Person Households | - | 42 (37.8%) |
| 2-Person Households | 35 (31.5%) | 3 (2.7%) |
| 3-Person Households | 16 (14.4%) | 0 (0.0%) |
| 4-Person Households | 2 (1.8%) | 0 (0.0%) |
| 5-Person Households | 10 (9.0%) | 0 (0.0%) |
| 6-Person Households | 0 (0.0%) | 0 (0.0%) |
| 7+ Person Households | 3 (2.7%) | 0 (0.0%) |
| Total | 66 (59.5%) | 45 (40.5%) |
Female Fertility in Keysville
Fertility by Age in Keysville
Average fertility rate in Keysville is 52.0 births per 1,000 women. Women in the age bracket of 20 to 34 years have the highest fertility rate with 150.0 births per 1,000 women. Women in the age bracket of 20 to 34 years acount for 100.0% of all women with births.
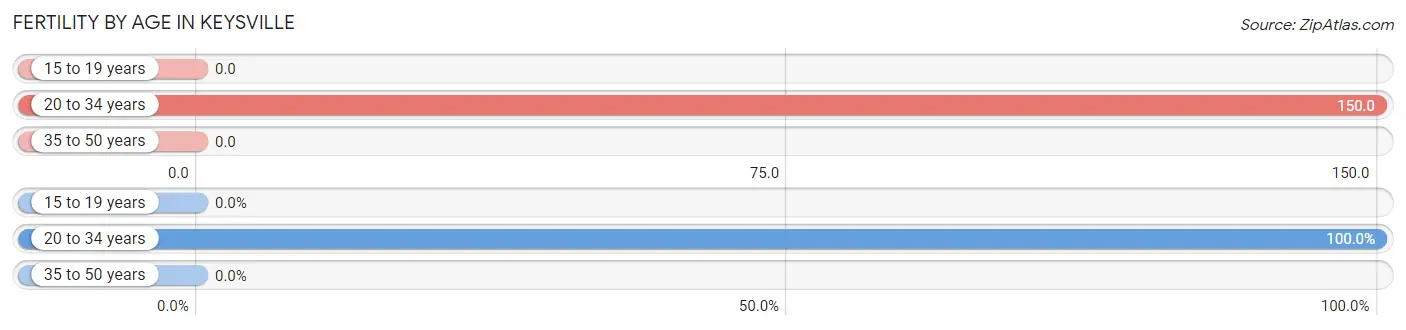
| Age Bracket | Women with Births | Births / 1,000 Women |
| 15 to 19 years | 0 (0.0%) | 0.0 |
| 20 to 34 years | 3 (100.0%) | 150.0 |
| 35 to 50 years | 0 (0.0%) | 0.0 |
| Total | 3 (100.0%) | 52.0 |
Fertility by Age by Marriage Status in Keysville
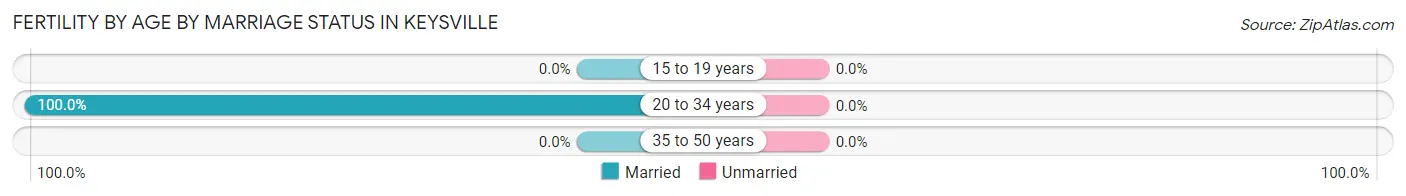
| Age Bracket | Married | Unmarried |
| 15 to 19 years | 0 (0.0%) | 0 (0.0%) |
| 20 to 34 years | 3 (100.0%) | 0 (0.0%) |
| 35 to 50 years | 0 (0.0%) | 0 (0.0%) |
| Total | 3 (100.0%) | 0 (0.0%) |
Fertility by Education in Keysville
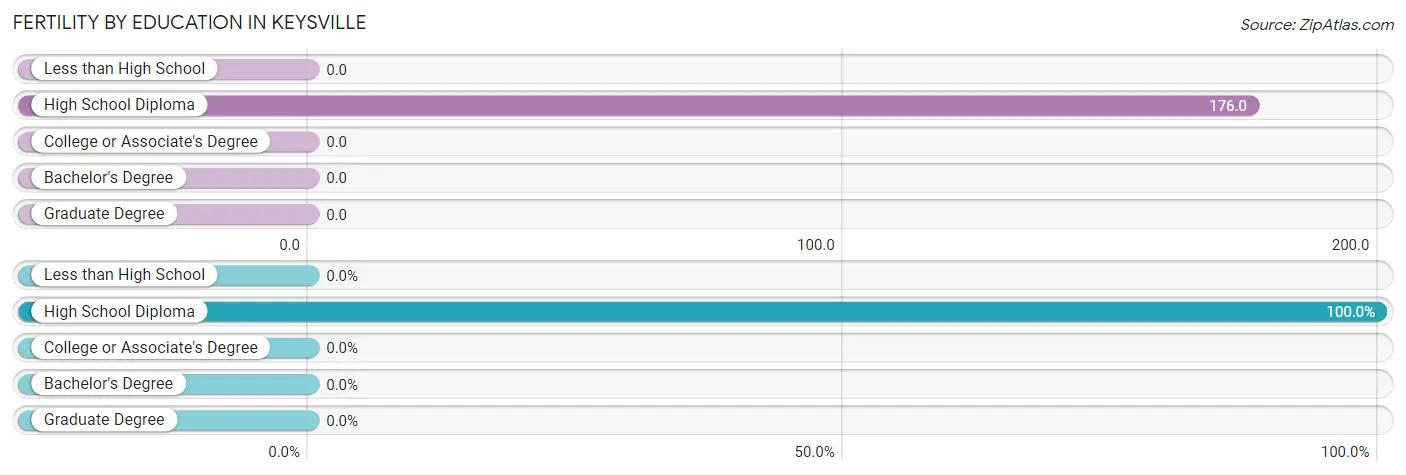
| Educational Attainment | Women with Births | Births / 1,000 Women |
| Less than High School | 0 (0.0%) | 0.0 |
| High School Diploma | 3 (100.0%) | 176.0 |
| College or Associate's Degree | 0 (0.0%) | 0.0 |
| Bachelor's Degree | 0 (0.0%) | 0.0 |
| Graduate Degree | 0 (0.0%) | 0.0 |
| Total | 3 (100.0%) | 52.0 |
Fertility by Education by Marriage Status in Keysville
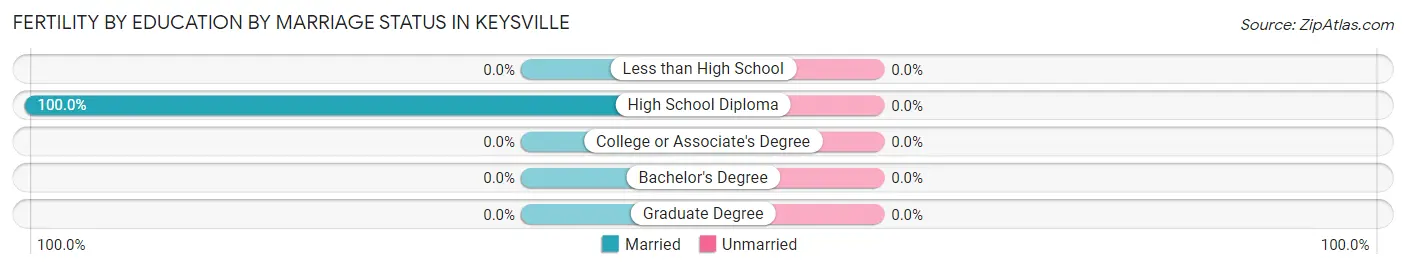
| Educational Attainment | Married | Unmarried |
| Less than High School | 0 (0.0%) | 0 (0.0%) |
| High School Diploma | 3 (100.0%) | 0 (0.0%) |
| College or Associate's Degree | 0 (0.0%) | 0 (0.0%) |
| Bachelor's Degree | 0 (0.0%) | 0 (0.0%) |
| Graduate Degree | 0 (0.0%) | 0 (0.0%) |
| Total | 3 (100.0%) | 0 (0.0%) |
Employment Characteristics in Keysville
Employment by Class of Employer in Keysville
Among the 109 employed individuals in Keysville, private company employees (91 | 83.5%), self-employed (incorporated) (5 | 4.6%), and state government employees (5 | 4.6%) make up the most common classes of employment.
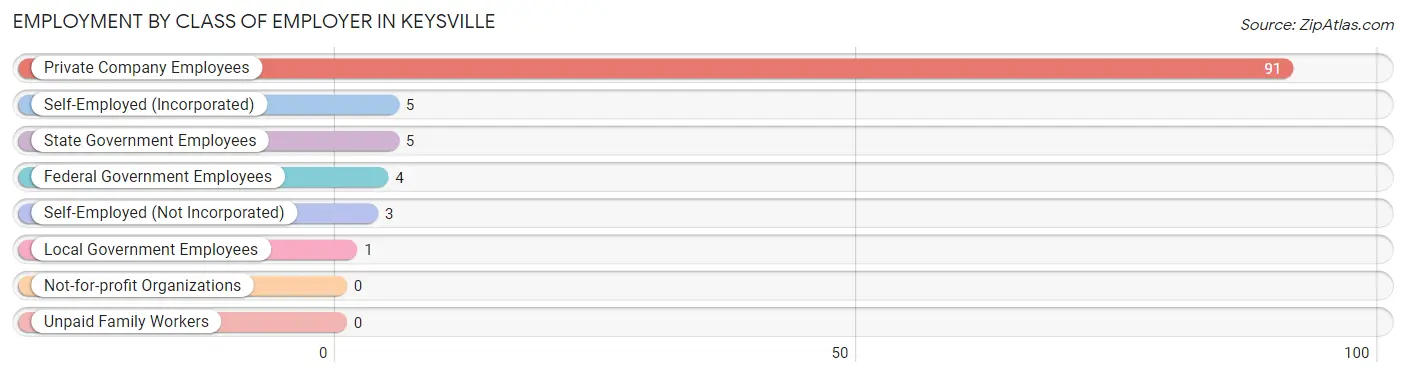
| Employer Class | # Employees | % Employees |
| Private Company Employees | 91 | 83.5% |
| Self-Employed (Incorporated) | 5 | 4.6% |
| Self-Employed (Not Incorporated) | 3 | 2.8% |
| Not-for-profit Organizations | 0 | 0.0% |
| Local Government Employees | 1 | 0.9% |
| State Government Employees | 5 | 4.6% |
| Federal Government Employees | 4 | 3.7% |
| Unpaid Family Workers | 0 | 0.0% |
| Total | 109 | 100.0% |
Employment Status by Age in Keysville
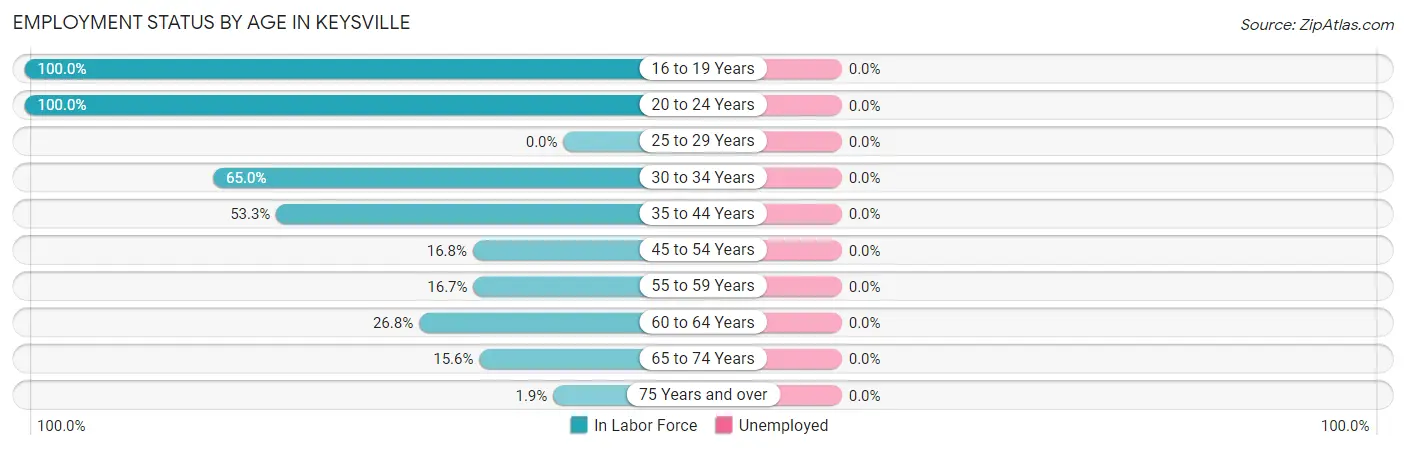
| Age Bracket | In Labor Force | Unemployed |
| 16 to 19 Years | 15 (100.0%) | 0 (0.0%) |
| 20 to 24 Years | 4 (100.0%) | 0 (0.0%) |
| 25 to 29 Years | 0 (0.0%) | 0 (0.0%) |
| 30 to 34 Years | 39 (65.0%) | 0 (0.0%) |
| 35 to 44 Years | 16 (53.3%) | 0 (0.0%) |
| 45 to 54 Years | 17 (16.8%) | 0 (0.0%) |
| 55 to 59 Years | 1 (16.7%) | 0 (0.0%) |
| 60 to 64 Years | 11 (26.8%) | 0 (0.0%) |
| 65 to 74 Years | 5 (15.6%) | 0 (0.0%) |
| 75 Years and over | 1 (1.9%) | 0 (0.0%) |
| Total | 109 (31.9%) | 0 (0.0%) |
Employment Status by Educational Attainment in Keysville
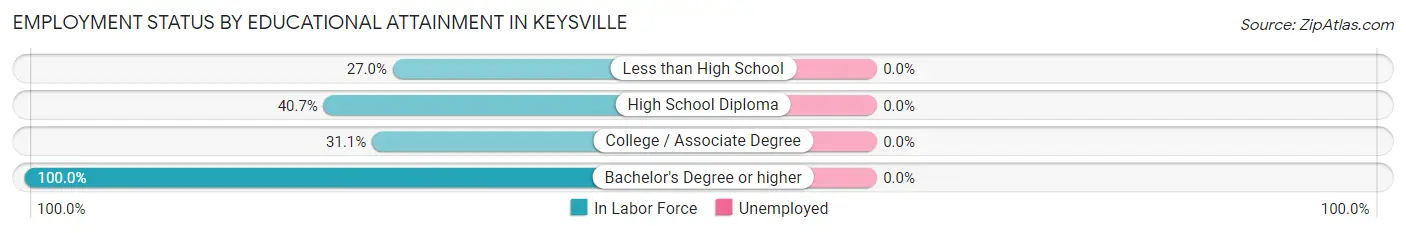
| Educational Attainment | In Labor Force | Unemployed |
| Less than High School | 10 (27.0%) | 0 (0.0%) |
| High School Diploma | 37 (40.7%) | 0 (0.0%) |
| College / Associate Degree | 33 (31.1%) | 0 (0.0%) |
| Bachelor's Degree or higher | 4 (100.0%) | 0 (0.0%) |
| Total | 84 (35.3%) | 0 (0.0%) |
Employment Occupations by Sex in Keysville
Management, Business, Science and Arts Occupations
The most common Management, Business, Science and Arts occupations in Keysville are Management (9 | 8.3%), Health Diagnosing & Treating (9 | 8.3%), and Health Technologists (1 | 0.9%).
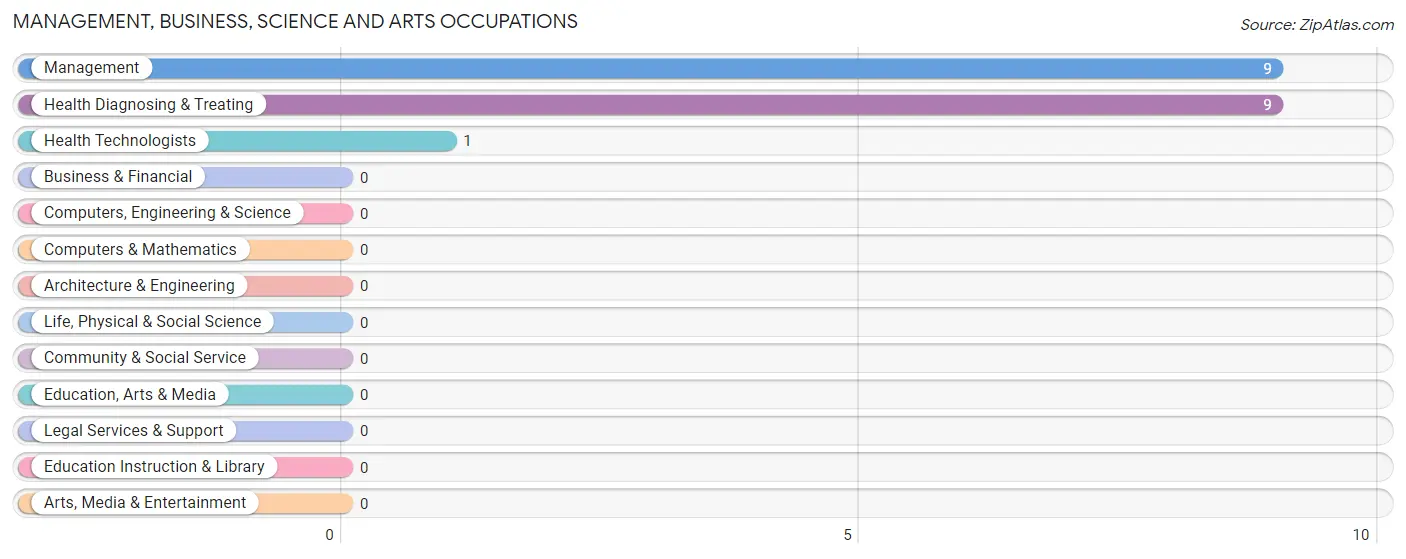
Management, Business, Science and Arts Occupations by Sex
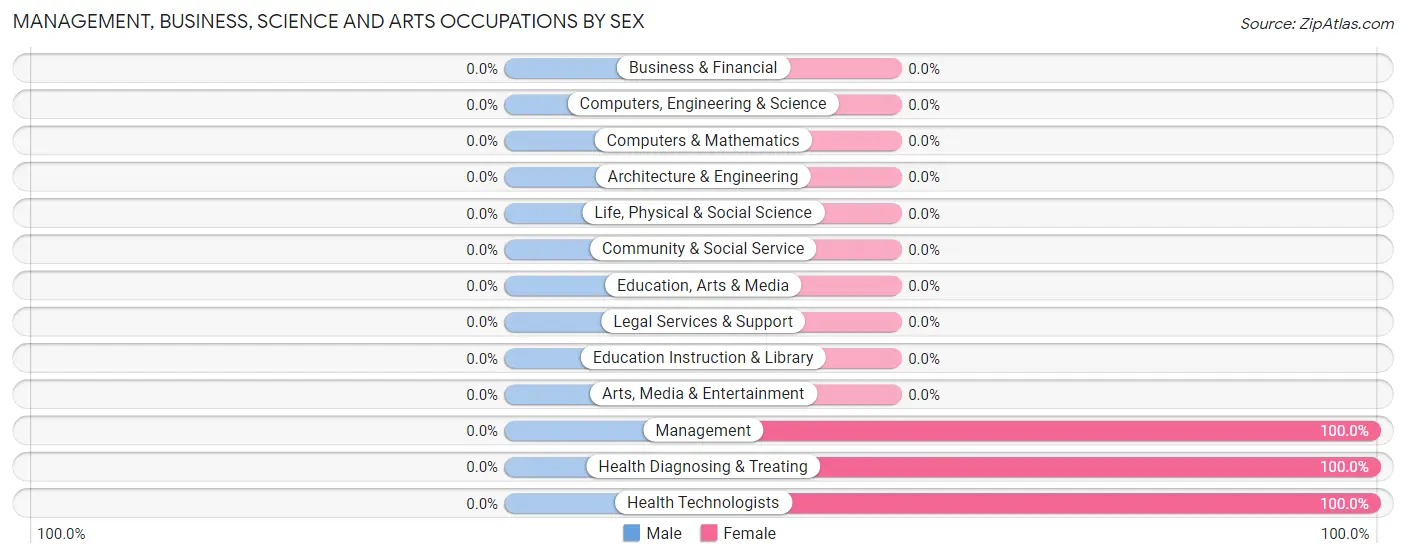
| Occupation | Male | Female |
| Management | 0 (0.0%) | 9 (100.0%) |
| Business & Financial | 0 (0.0%) | 0 (0.0%) |
| Computers, Engineering & Science | 0 (0.0%) | 0 (0.0%) |
| Computers & Mathematics | 0 (0.0%) | 0 (0.0%) |
| Architecture & Engineering | 0 (0.0%) | 0 (0.0%) |
| Life, Physical & Social Science | 0 (0.0%) | 0 (0.0%) |
| Community & Social Service | 0 (0.0%) | 0 (0.0%) |
| Education, Arts & Media | 0 (0.0%) | 0 (0.0%) |
| Legal Services & Support | 0 (0.0%) | 0 (0.0%) |
| Education Instruction & Library | 0 (0.0%) | 0 (0.0%) |
| Arts, Media & Entertainment | 0 (0.0%) | 0 (0.0%) |
| Health Diagnosing & Treating | 0 (0.0%) | 9 (100.0%) |
| Health Technologists | 0 (0.0%) | 1 (100.0%) |
| Total (Category) | 0 (0.0%) | 18 (100.0%) |
| Total (Overall) | 58 (53.2%) | 51 (46.8%) |
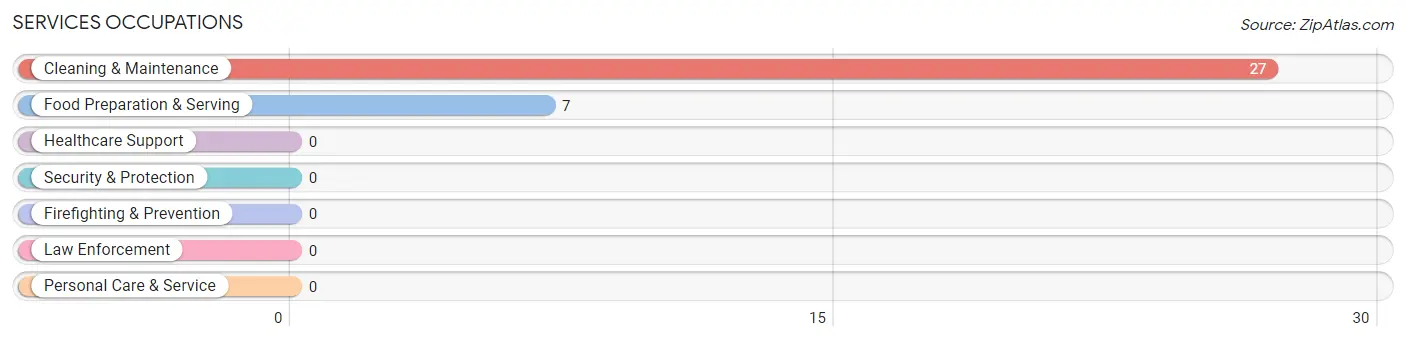
Services Occupations
The most common Services occupations in Keysville are Cleaning & Maintenance (27 | 24.8%), and Food Preparation & Serving (7 | 6.4%).
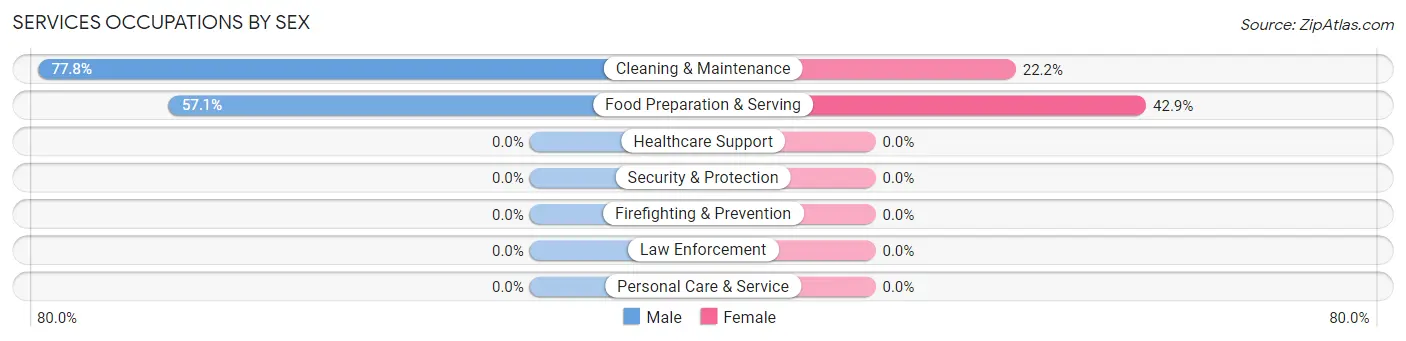
Services Occupations by Sex
Within the Services occupations in Keysville, the most male-oriented occupations are Cleaning & Maintenance (77.8%), and Food Preparation & Serving (57.1%), while the most female-oriented occupations are Food Preparation & Serving (42.9%), and Cleaning & Maintenance (22.2%).
| Occupation | Male | Female |
| Healthcare Support | 0 (0.0%) | 0 (0.0%) |
| Security & Protection | 0 (0.0%) | 0 (0.0%) |
| Firefighting & Prevention | 0 (0.0%) | 0 (0.0%) |
| Law Enforcement | 0 (0.0%) | 0 (0.0%) |
| Food Preparation & Serving | 4 (57.1%) | 3 (42.9%) |
| Cleaning & Maintenance | 21 (77.8%) | 6 (22.2%) |
| Personal Care & Service | 0 (0.0%) | 0 (0.0%) |
| Total (Category) | 25 (73.5%) | 9 (26.5%) |
| Total (Overall) | 58 (53.2%) | 51 (46.8%) |
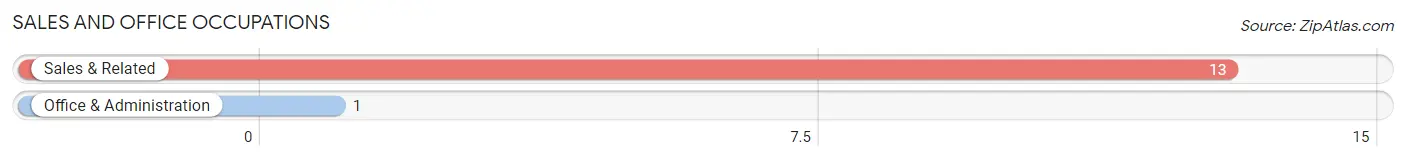
Sales and Office Occupations
The most common Sales and Office occupations in Keysville are Sales & Related (13 | 11.9%), and Office & Administration (1 | 0.9%).
Sales and Office Occupations by Sex

| Occupation | Male | Female |
| Sales & Related | 0 (0.0%) | 13 (100.0%) |
| Office & Administration | 0 (0.0%) | 1 (100.0%) |
| Total (Category) | 0 (0.0%) | 14 (100.0%) |
| Total (Overall) | 58 (53.2%) | 51 (46.8%) |
Natural Resources, Construction and Maintenance Occupations
The most common Natural Resources, Construction and Maintenance occupations in Keysville are Installation, Maintenance & Repair (10 | 9.2%), and Construction & Extraction (1 | 0.9%).

Natural Resources, Construction and Maintenance Occupations by Sex

| Occupation | Male | Female |
| Farming, Fishing & Forestry | 0 (0.0%) | 0 (0.0%) |
| Construction & Extraction | 1 (100.0%) | 0 (0.0%) |
| Installation, Maintenance & Repair | 10 (100.0%) | 0 (0.0%) |
| Total (Category) | 11 (100.0%) | 0 (0.0%) |
| Total (Overall) | 58 (53.2%) | 51 (46.8%) |
Production, Transportation and Moving Occupations
The most common Production, Transportation and Moving occupations in Keysville are Material Moving (13 | 11.9%), Transportation (12 | 11.0%), and Production (7 | 6.4%).
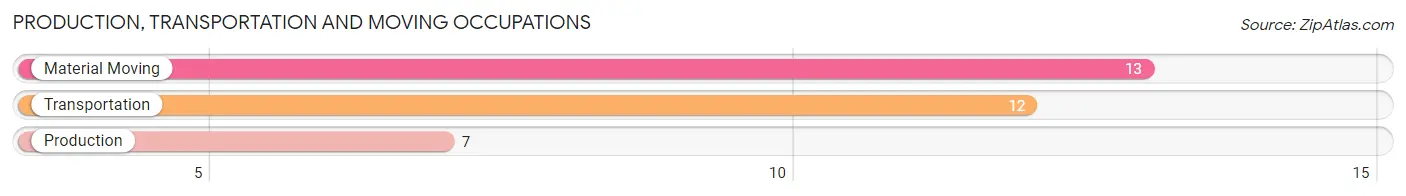
Production, Transportation and Moving Occupations by Sex
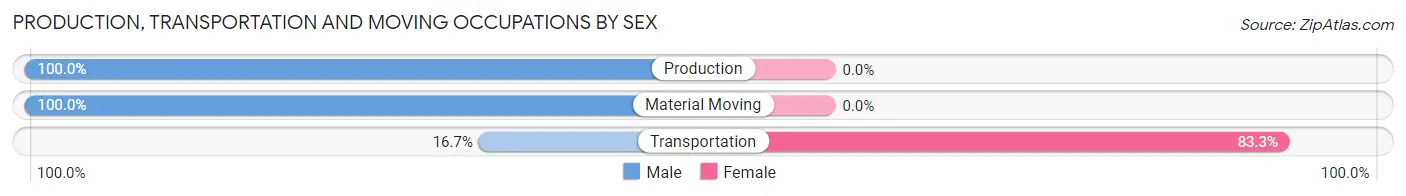
| Occupation | Male | Female |
| Production | 7 (100.0%) | 0 (0.0%) |
| Transportation | 2 (16.7%) | 10 (83.3%) |
| Material Moving | 13 (100.0%) | 0 (0.0%) |
| Total (Category) | 22 (68.8%) | 10 (31.2%) |
| Total (Overall) | 58 (53.2%) | 51 (46.8%) |
Employment Industries by Sex in Keysville
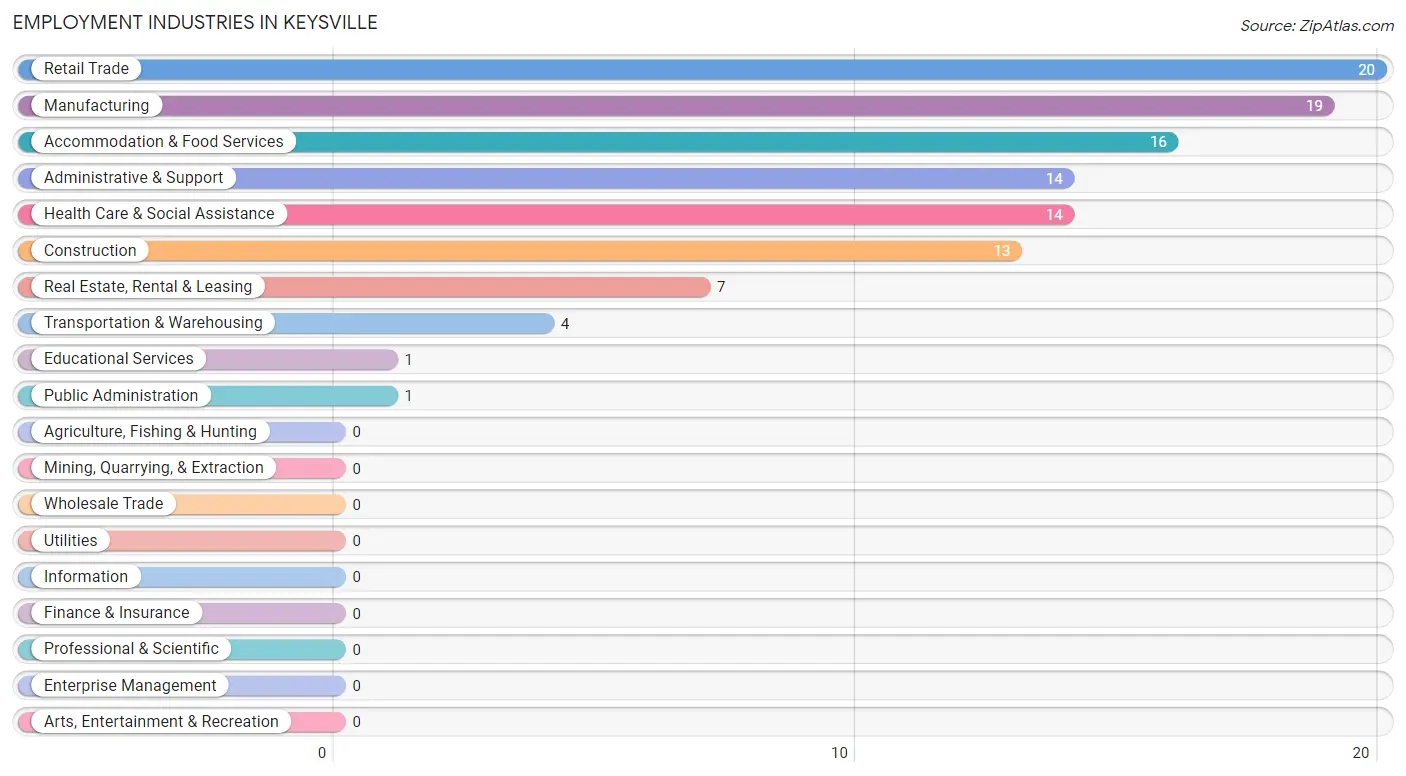
Employment Industries in Keysville
The major employment industries in Keysville include Retail Trade (20 | 18.3%), Manufacturing (19 | 17.4%), Accommodation & Food Services (16 | 14.7%), Administrative & Support (14 | 12.8%), and Health Care & Social Assistance (14 | 12.8%).
Employment Industries by Sex in Keysville
The Keysville industries that see more men than women are Construction (100.0%), Manufacturing (100.0%), and Real Estate, Rental & Leasing (100.0%), whereas the industries that tend to have a higher number of women are Transportation & Warehousing (100.0%), Educational Services (100.0%), and Health Care & Social Assistance (100.0%).
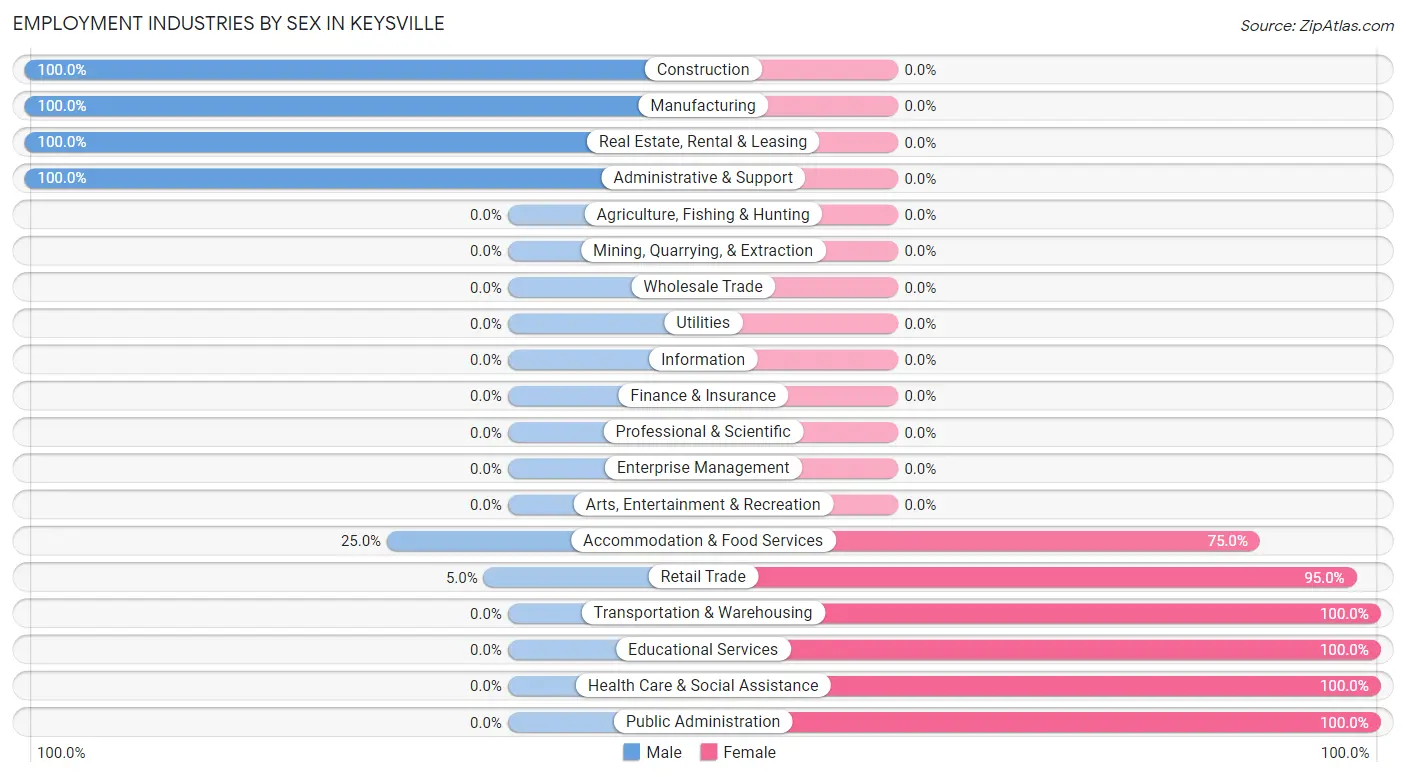
| Industry | Male | Female |
| Agriculture, Fishing & Hunting | 0 (0.0%) | 0 (0.0%) |
| Mining, Quarrying, & Extraction | 0 (0.0%) | 0 (0.0%) |
| Construction | 13 (100.0%) | 0 (0.0%) |
| Manufacturing | 19 (100.0%) | 0 (0.0%) |
| Wholesale Trade | 0 (0.0%) | 0 (0.0%) |
| Retail Trade | 1 (5.0%) | 19 (95.0%) |
| Transportation & Warehousing | 0 (0.0%) | 4 (100.0%) |
| Utilities | 0 (0.0%) | 0 (0.0%) |
| Information | 0 (0.0%) | 0 (0.0%) |
| Finance & Insurance | 0 (0.0%) | 0 (0.0%) |
| Real Estate, Rental & Leasing | 7 (100.0%) | 0 (0.0%) |
| Professional & Scientific | 0 (0.0%) | 0 (0.0%) |
| Enterprise Management | 0 (0.0%) | 0 (0.0%) |
| Administrative & Support | 14 (100.0%) | 0 (0.0%) |
| Educational Services | 0 (0.0%) | 1 (100.0%) |
| Health Care & Social Assistance | 0 (0.0%) | 14 (100.0%) |
| Arts, Entertainment & Recreation | 0 (0.0%) | 0 (0.0%) |
| Accommodation & Food Services | 4 (25.0%) | 12 (75.0%) |
| Public Administration | 0 (0.0%) | 1 (100.0%) |
| Total | 58 (53.2%) | 51 (46.8%) |
Education in Keysville
School Enrollment in Keysville
The most common levels of schooling among the 62 students in Keysville are middle school (38 | 61.3%), elementary school (18 | 29.0%), and high school (5 | 8.1%).
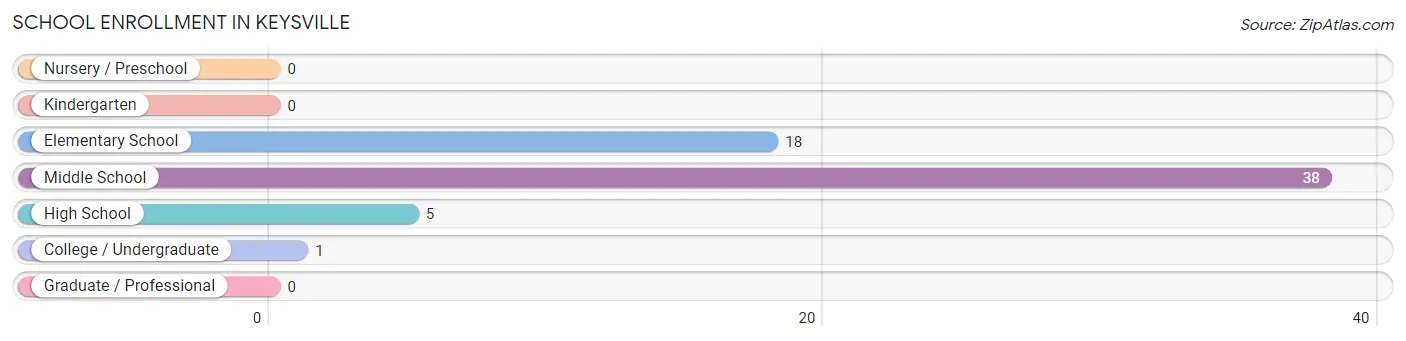
| School Level | # Students | % Students |
| Nursery / Preschool | 0 | 0.0% |
| Kindergarten | 0 | 0.0% |
| Elementary School | 18 | 29.0% |
| Middle School | 38 | 61.3% |
| High School | 5 | 8.1% |
| College / Undergraduate | 1 | 1.6% |
| Graduate / Professional | 0 | 0.0% |
| Total | 62 | 100.0% |
School Enrollment by Age by Funding Source in Keysville
Out of a total of 62 students who are enrolled in schools in Keysville, 21 (33.9%) attend a private institution, while the remaining 41 (66.1%) are enrolled in public schools. The age group of 15 to 17 year olds has the highest likelihood of being enrolled in private schools, with 9 (100.0% in the age bracket) enrolled. Conversely, the age group of 10 to 14 year olds has the lowest likelihood of being enrolled in a private school, with 28 (82.4% in the age bracket) attending a public institution.
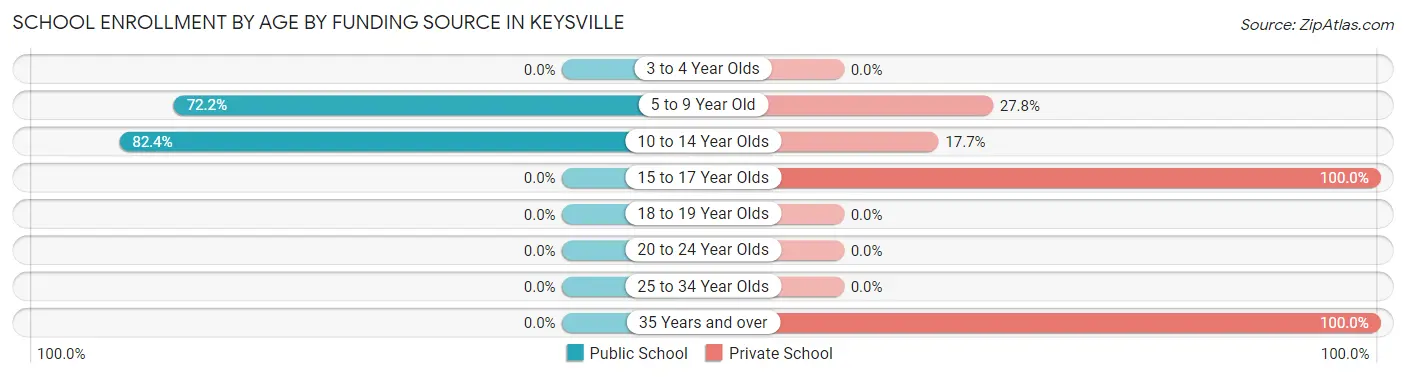
| Age Bracket | Public School | Private School |
| 3 to 4 Year Olds | 0 (0.0%) | 0 (0.0%) |
| 5 to 9 Year Old | 13 (72.2%) | 5 (27.8%) |
| 10 to 14 Year Olds | 28 (82.4%) | 6 (17.6%) |
| 15 to 17 Year Olds | 0 (0.0%) | 9 (100.0%) |
| 18 to 19 Year Olds | 0 (0.0%) | 0 (0.0%) |
| 20 to 24 Year Olds | 0 (0.0%) | 0 (0.0%) |
| 25 to 34 Year Olds | 0 (0.0%) | 0 (0.0%) |
| 35 Years and over | 0 (0.0%) | 1 (100.0%) |
| Total | 41 (66.1%) | 21 (33.9%) |
Educational Attainment by Field of Study in Keysville
Liberal arts & history (11 | 35.5%), education (10 | 32.3%), science & technology (6 | 19.4%), and bio, nature & agricultural (4 | 12.9%) are the most common fields of study among 31 individuals in Keysville who have obtained a bachelor's degree or higher.
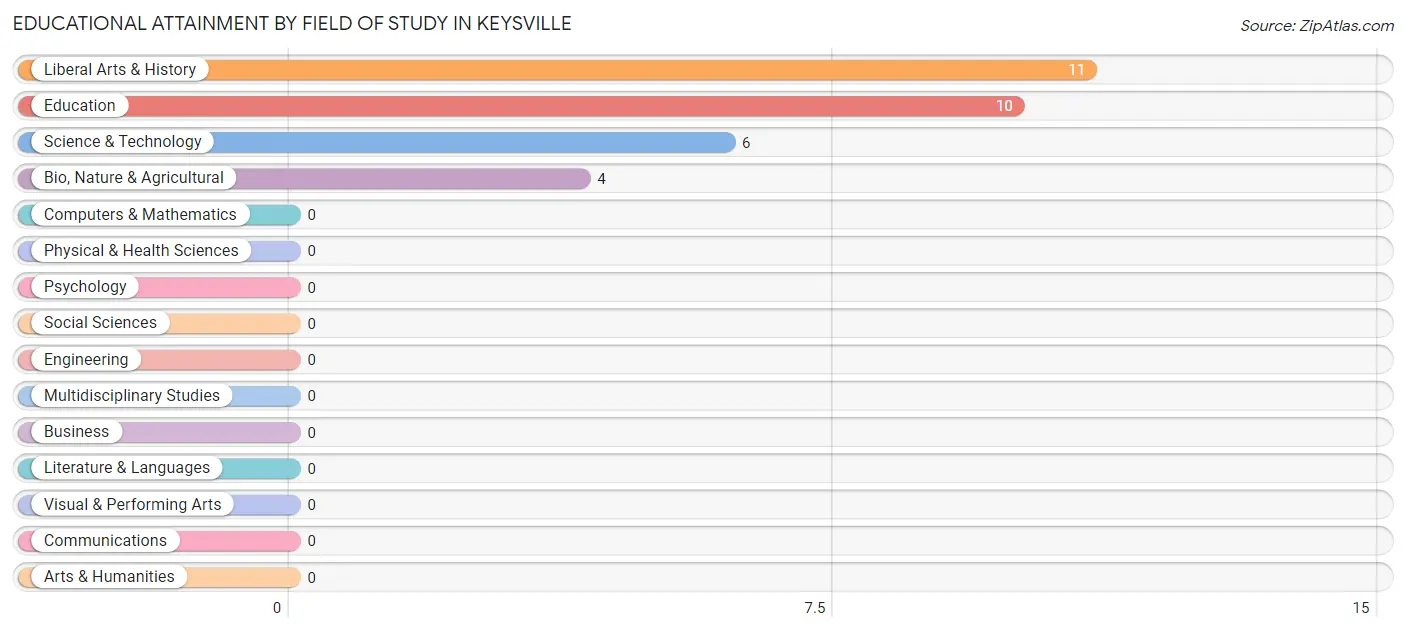
| Field of Study | # Graduates | % Graduates |
| Computers & Mathematics | 0 | 0.0% |
| Bio, Nature & Agricultural | 4 | 12.9% |
| Physical & Health Sciences | 0 | 0.0% |
| Psychology | 0 | 0.0% |
| Social Sciences | 0 | 0.0% |
| Engineering | 0 | 0.0% |
| Multidisciplinary Studies | 0 | 0.0% |
| Science & Technology | 6 | 19.4% |
| Business | 0 | 0.0% |
| Education | 10 | 32.3% |
| Literature & Languages | 0 | 0.0% |
| Liberal Arts & History | 11 | 35.5% |
| Visual & Performing Arts | 0 | 0.0% |
| Communications | 0 | 0.0% |
| Arts & Humanities | 0 | 0.0% |
| Total | 31 | 100.0% |
Transportation & Commute in Keysville
Vehicle Availability by Sex in Keysville
The most prevalent vehicle ownership categories in Keysville are males with 2 vehicles (24, accounting for 41.4%) and females with 2 vehicles (10, making up 47.1%).
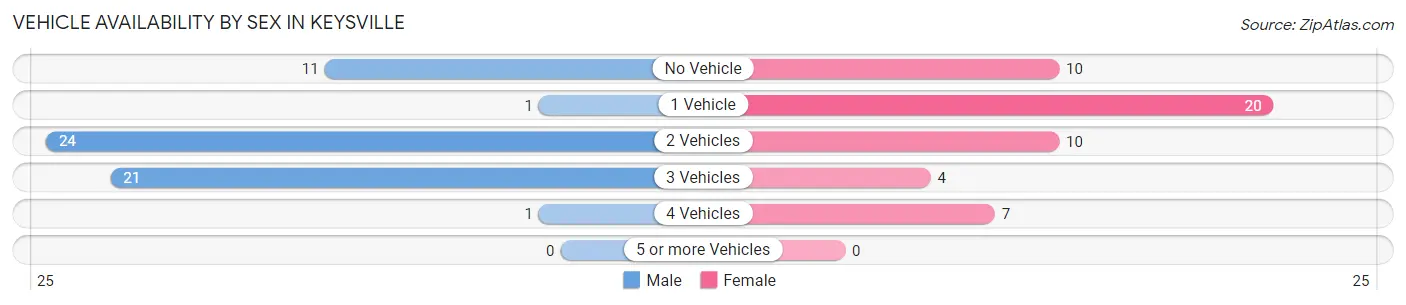
| Vehicles Available | Male | Female |
| No Vehicle | 11 (19.0%) | 10 (19.6%) |
| 1 Vehicle | 1 (1.7%) | 20 (39.2%) |
| 2 Vehicles | 24 (41.4%) | 10 (19.6%) |
| 3 Vehicles | 21 (36.2%) | 4 (7.8%) |
| 4 Vehicles | 1 (1.7%) | 7 (13.7%) |
| 5 or more Vehicles | 0 (0.0%) | 0 (0.0%) |
| Total | 58 (100.0%) | 51 (100.0%) |
Commute Time in Keysville
The most frequently occuring commute durations in Keysville are 30 to 34 minutes (25 commuters, 22.9%), 35 to 39 minutes (21 commuters, 19.3%), and 45 to 59 minutes (20 commuters, 18.3%).
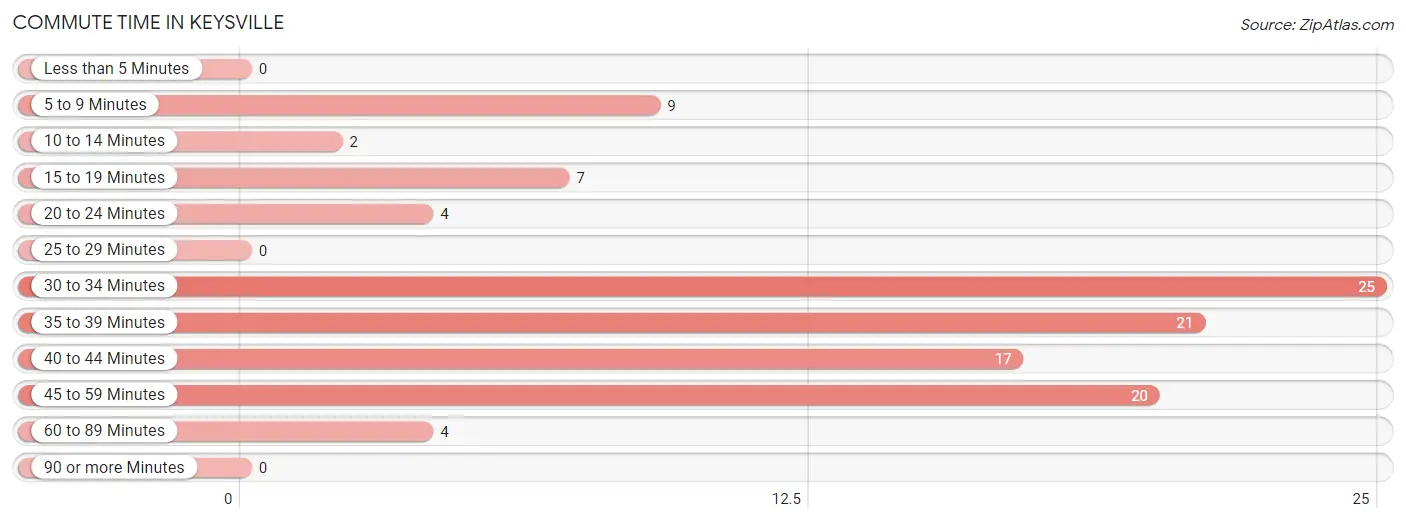
| Commute Time | # Commuters | % Commuters |
| Less than 5 Minutes | 0 | 0.0% |
| 5 to 9 Minutes | 9 | 8.3% |
| 10 to 14 Minutes | 2 | 1.8% |
| 15 to 19 Minutes | 7 | 6.4% |
| 20 to 24 Minutes | 4 | 3.7% |
| 25 to 29 Minutes | 0 | 0.0% |
| 30 to 34 Minutes | 25 | 22.9% |
| 35 to 39 Minutes | 21 | 19.3% |
| 40 to 44 Minutes | 17 | 15.6% |
| 45 to 59 Minutes | 20 | 18.3% |
| 60 to 89 Minutes | 4 | 3.7% |
| 90 or more Minutes | 0 | 0.0% |
Commute Time by Sex in Keysville
The most common commute times in Keysville are 45 to 59 minutes (20 commuters, 34.5%) for males and 40 to 44 minutes (13 commuters, 25.5%) for females.
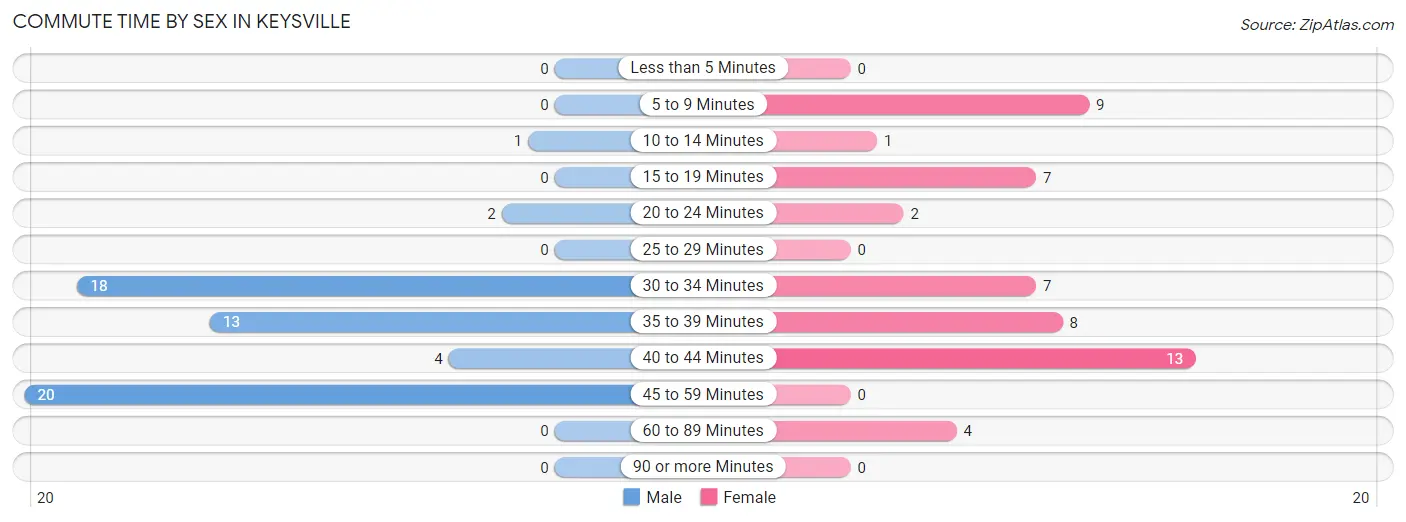
| Commute Time | Male | Female |
| Less than 5 Minutes | 0 (0.0%) | 0 (0.0%) |
| 5 to 9 Minutes | 0 (0.0%) | 9 (17.6%) |
| 10 to 14 Minutes | 1 (1.7%) | 1 (2.0%) |
| 15 to 19 Minutes | 0 (0.0%) | 7 (13.7%) |
| 20 to 24 Minutes | 2 (3.5%) | 2 (3.9%) |
| 25 to 29 Minutes | 0 (0.0%) | 0 (0.0%) |
| 30 to 34 Minutes | 18 (31.0%) | 7 (13.7%) |
| 35 to 39 Minutes | 13 (22.4%) | 8 (15.7%) |
| 40 to 44 Minutes | 4 (6.9%) | 13 (25.5%) |
| 45 to 59 Minutes | 20 (34.5%) | 0 (0.0%) |
| 60 to 89 Minutes | 0 (0.0%) | 4 (7.8%) |
| 90 or more Minutes | 0 (0.0%) | 0 (0.0%) |
Time of Departure to Work by Sex in Keysville
The most frequent times of departure to work in Keysville are 12:00 AM to 4:59 AM (20, 34.5%) for males and 6:00 AM to 6:29 AM (24, 47.1%) for females.
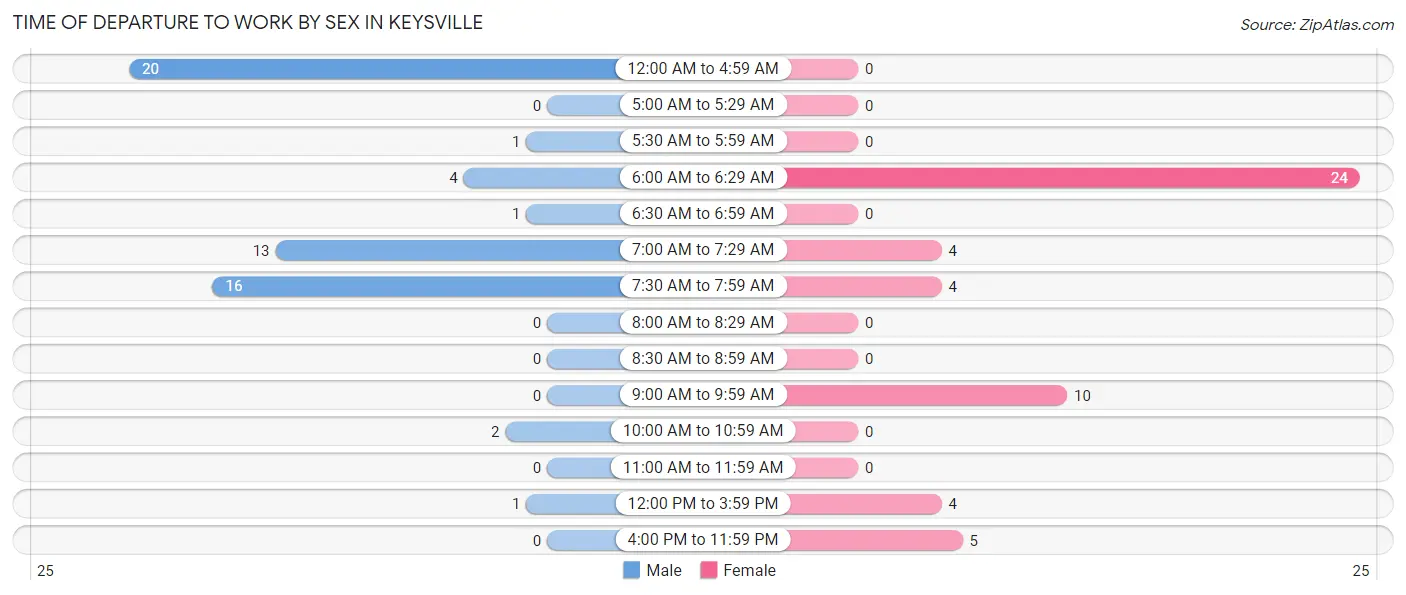
| Time of Departure | Male | Female |
| 12:00 AM to 4:59 AM | 20 (34.5%) | 0 (0.0%) |
| 5:00 AM to 5:29 AM | 0 (0.0%) | 0 (0.0%) |
| 5:30 AM to 5:59 AM | 1 (1.7%) | 0 (0.0%) |
| 6:00 AM to 6:29 AM | 4 (6.9%) | 24 (47.1%) |
| 6:30 AM to 6:59 AM | 1 (1.7%) | 0 (0.0%) |
| 7:00 AM to 7:29 AM | 13 (22.4%) | 4 (7.8%) |
| 7:30 AM to 7:59 AM | 16 (27.6%) | 4 (7.8%) |
| 8:00 AM to 8:29 AM | 0 (0.0%) | 0 (0.0%) |
| 8:30 AM to 8:59 AM | 0 (0.0%) | 0 (0.0%) |
| 9:00 AM to 9:59 AM | 0 (0.0%) | 10 (19.6%) |
| 10:00 AM to 10:59 AM | 2 (3.5%) | 0 (0.0%) |
| 11:00 AM to 11:59 AM | 0 (0.0%) | 0 (0.0%) |
| 12:00 PM to 3:59 PM | 1 (1.7%) | 4 (7.8%) |
| 4:00 PM to 11:59 PM | 0 (0.0%) | 5 (9.8%) |
| Total | 58 (100.0%) | 51 (100.0%) |
Housing Occupancy in Keysville
Occupancy by Ownership in Keysville
Of the total 111 dwellings in Keysville, owner-occupied units account for 83 (74.8%), while renter-occupied units make up 28 (25.2%).
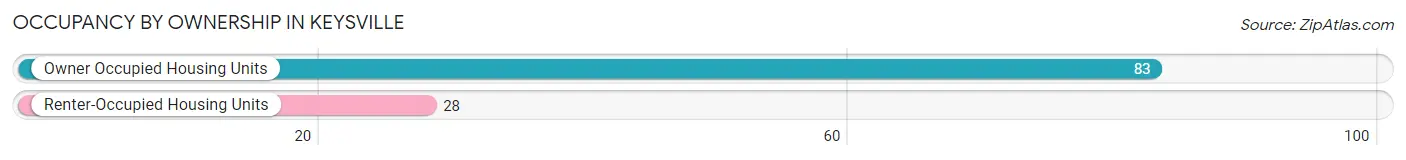
| Occupancy | # Housing Units | % Housing Units |
| Owner Occupied Housing Units | 83 | 74.8% |
| Renter-Occupied Housing Units | 28 | 25.2% |
| Total Occupied Housing Units | 111 | 100.0% |
Occupancy by Household Size in Keysville
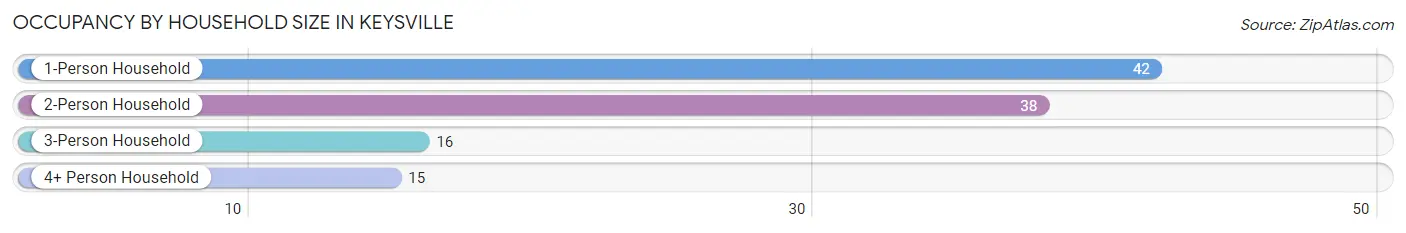
| Household Size | # Housing Units | % Housing Units |
| 1-Person Household | 42 | 37.8% |
| 2-Person Household | 38 | 34.2% |
| 3-Person Household | 16 | 14.4% |
| 4+ Person Household | 15 | 13.5% |
| Total Housing Units | 111 | 100.0% |
Occupancy by Ownership by Household Size in Keysville
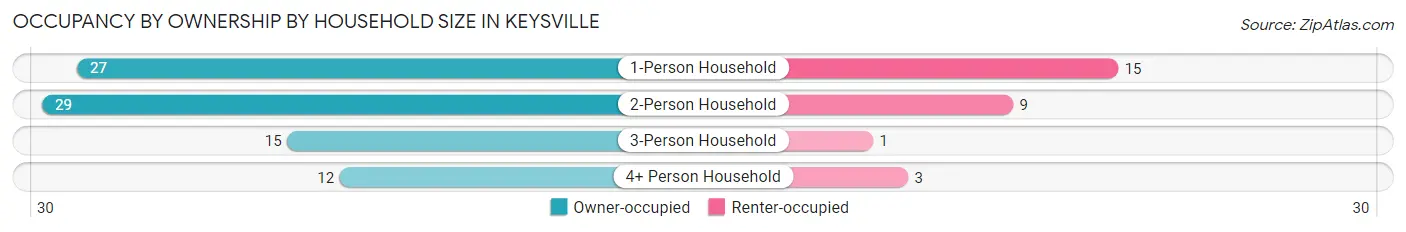
| Household Size | Owner-occupied | Renter-occupied |
| 1-Person Household | 27 (64.3%) | 15 (35.7%) |
| 2-Person Household | 29 (76.3%) | 9 (23.7%) |
| 3-Person Household | 15 (93.8%) | 1 (6.2%) |
| 4+ Person Household | 12 (80.0%) | 3 (20.0%) |
| Total Housing Units | 83 (74.8%) | 28 (25.2%) |
Occupancy by Educational Attainment in Keysville
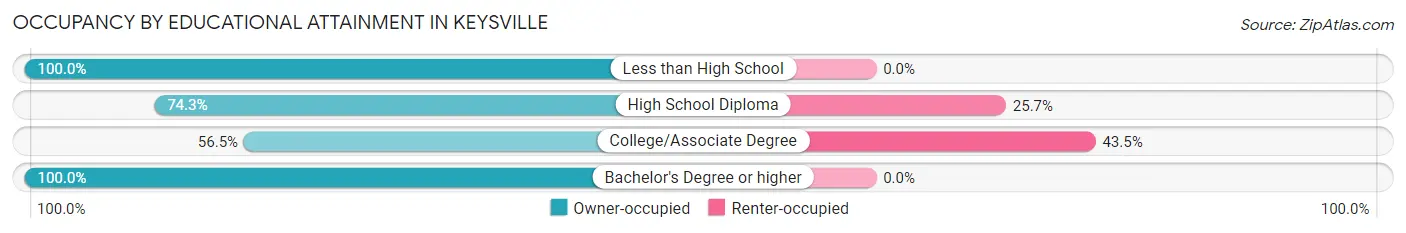
| Household Size | Owner-occupied | Renter-occupied |
| Less than High School | 13 (100.0%) | 0 (0.0%) |
| High School Diploma | 52 (74.3%) | 18 (25.7%) |
| College/Associate Degree | 13 (56.5%) | 10 (43.5%) |
| Bachelor's Degree or higher | 5 (100.0%) | 0 (0.0%) |
Occupancy by Age of Householder in Keysville
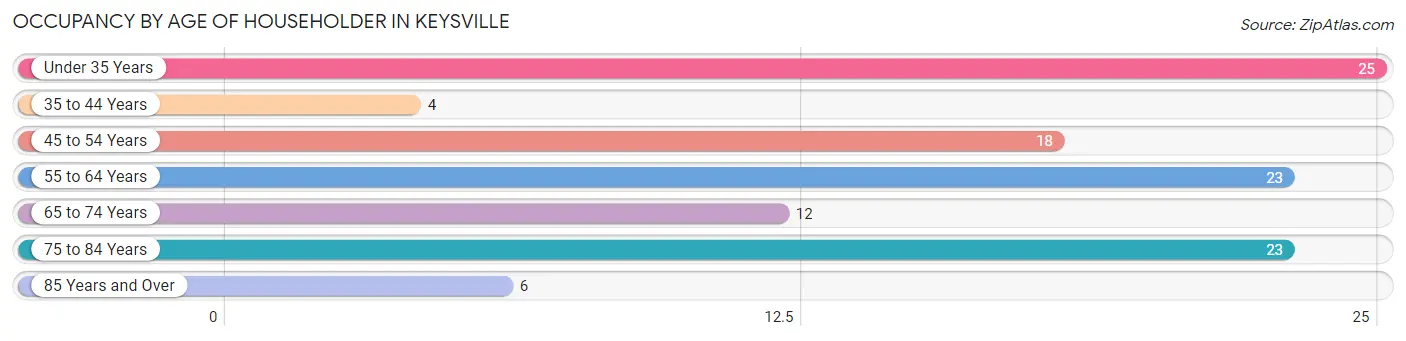
| Age Bracket | # Households | % Households |
| Under 35 Years | 25 | 22.5% |
| 35 to 44 Years | 4 | 3.6% |
| 45 to 54 Years | 18 | 16.2% |
| 55 to 64 Years | 23 | 20.7% |
| 65 to 74 Years | 12 | 10.8% |
| 75 to 84 Years | 23 | 20.7% |
| 85 Years and Over | 6 | 5.4% |
| Total | 111 | 100.0% |
Housing Finances in Keysville
Median Income by Occupancy in Keysville
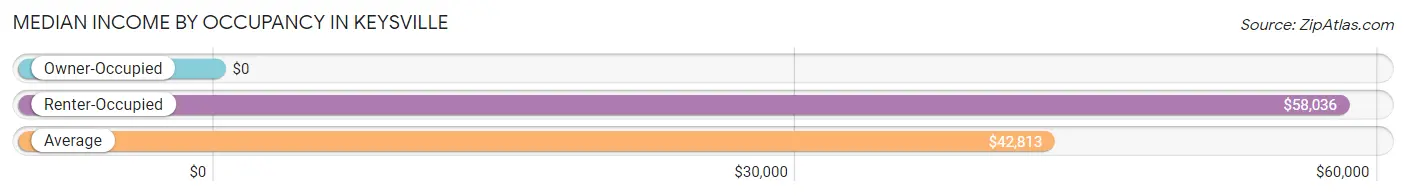
| Occupancy Type | # Households | Median Income |
| Owner-Occupied | 83 (74.8%) | $0 |
| Renter-Occupied | 28 (25.2%) | $58,036 |
| Average | 111 (100.0%) | $42,813 |
Occupancy by Householder Income Bracket in Keysville
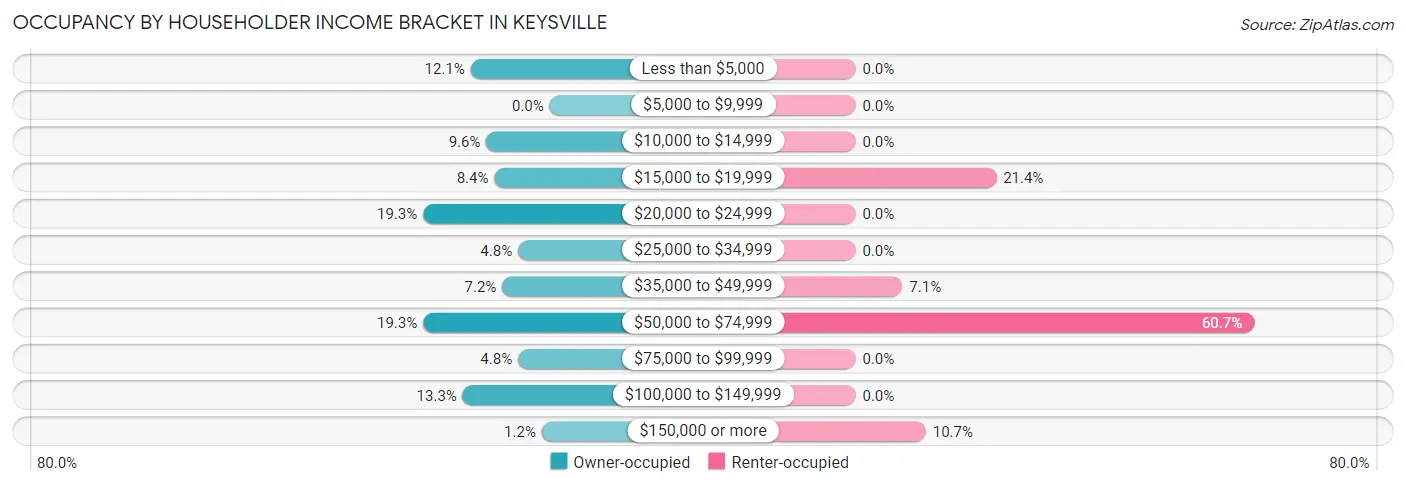
| Income Bracket | Owner-occupied | Renter-occupied |
| Less than $5,000 | 10 (12.0%) | 0 (0.0%) |
| $5,000 to $9,999 | 0 (0.0%) | 0 (0.0%) |
| $10,000 to $14,999 | 8 (9.6%) | 0 (0.0%) |
| $15,000 to $19,999 | 7 (8.4%) | 6 (21.4%) |
| $20,000 to $24,999 | 16 (19.3%) | 0 (0.0%) |
| $25,000 to $34,999 | 4 (4.8%) | 0 (0.0%) |
| $35,000 to $49,999 | 6 (7.2%) | 2 (7.1%) |
| $50,000 to $74,999 | 16 (19.3%) | 17 (60.7%) |
| $75,000 to $99,999 | 4 (4.8%) | 0 (0.0%) |
| $100,000 to $149,999 | 11 (13.3%) | 0 (0.0%) |
| $150,000 or more | 1 (1.2%) | 3 (10.7%) |
| Total | 83 (100.0%) | 28 (100.0%) |
Monthly Housing Cost Tiers in Keysville
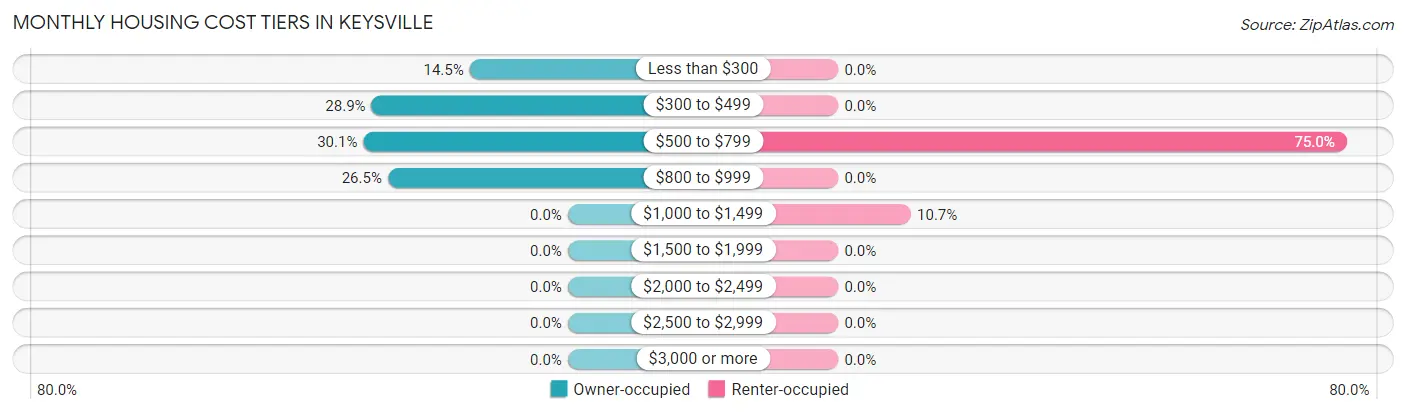
| Monthly Cost | Owner-occupied | Renter-occupied |
| Less than $300 | 12 (14.5%) | 0 (0.0%) |
| $300 to $499 | 24 (28.9%) | 0 (0.0%) |
| $500 to $799 | 25 (30.1%) | 21 (75.0%) |
| $800 to $999 | 22 (26.5%) | 0 (0.0%) |
| $1,000 to $1,499 | 0 (0.0%) | 3 (10.7%) |
| $1,500 to $1,999 | 0 (0.0%) | 0 (0.0%) |
| $2,000 to $2,499 | 0 (0.0%) | 0 (0.0%) |
| $2,500 to $2,999 | 0 (0.0%) | 0 (0.0%) |
| $3,000 or more | 0 (0.0%) | 0 (0.0%) |
| Total | 83 (100.0%) | 28 (100.0%) |
Physical Housing Characteristics in Keysville
Housing Structures in Keysville
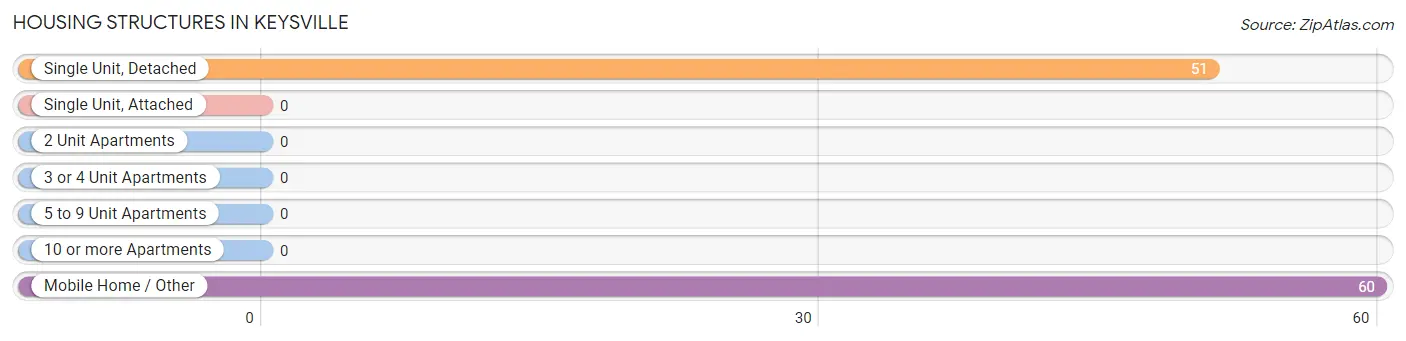
| Structure Type | # Housing Units | % Housing Units |
| Single Unit, Detached | 51 | 46.0% |
| Single Unit, Attached | 0 | 0.0% |
| 2 Unit Apartments | 0 | 0.0% |
| 3 or 4 Unit Apartments | 0 | 0.0% |
| 5 to 9 Unit Apartments | 0 | 0.0% |
| 10 or more Apartments | 0 | 0.0% |
| Mobile Home / Other | 60 | 54.0% |
| Total | 111 | 100.0% |
Housing Structures by Occupancy in Keysville
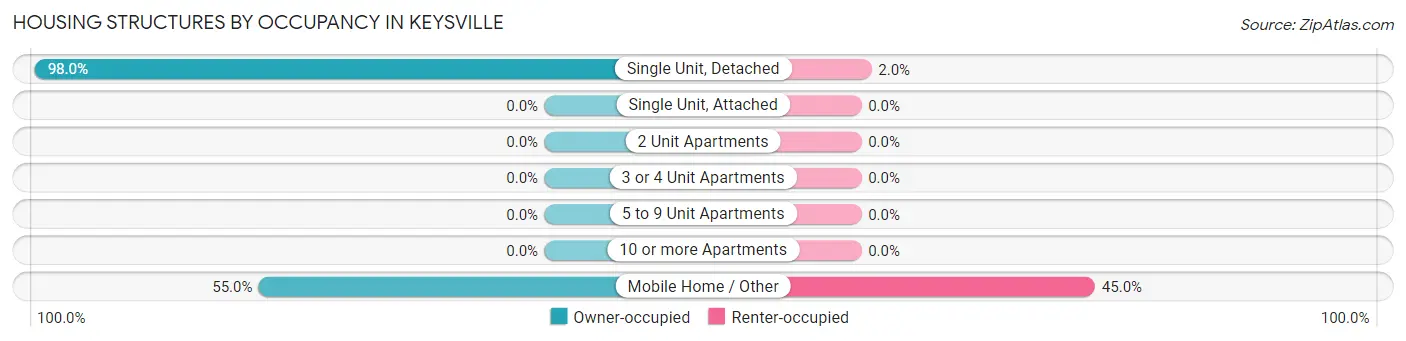
| Structure Type | Owner-occupied | Renter-occupied |
| Single Unit, Detached | 50 (98.0%) | 1 (2.0%) |
| Single Unit, Attached | 0 (0.0%) | 0 (0.0%) |
| 2 Unit Apartments | 0 (0.0%) | 0 (0.0%) |
| 3 or 4 Unit Apartments | 0 (0.0%) | 0 (0.0%) |
| 5 to 9 Unit Apartments | 0 (0.0%) | 0 (0.0%) |
| 10 or more Apartments | 0 (0.0%) | 0 (0.0%) |
| Mobile Home / Other | 33 (55.0%) | 27 (45.0%) |
| Total | 83 (74.8%) | 28 (25.2%) |
Housing Structures by Number of Rooms in Keysville
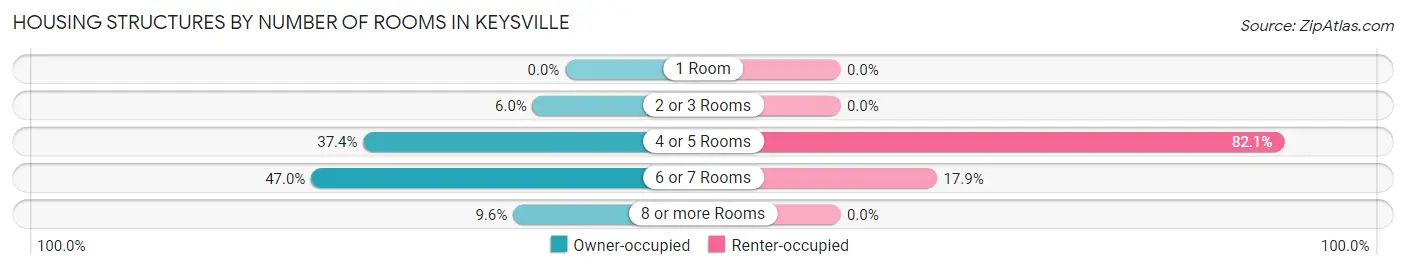
| Number of Rooms | Owner-occupied | Renter-occupied |
| 1 Room | 0 (0.0%) | 0 (0.0%) |
| 2 or 3 Rooms | 5 (6.0%) | 0 (0.0%) |
| 4 or 5 Rooms | 31 (37.3%) | 23 (82.1%) |
| 6 or 7 Rooms | 39 (47.0%) | 5 (17.9%) |
| 8 or more Rooms | 8 (9.6%) | 0 (0.0%) |
| Total | 83 (100.0%) | 28 (100.0%) |
Housing Structure by Heating Type in Keysville
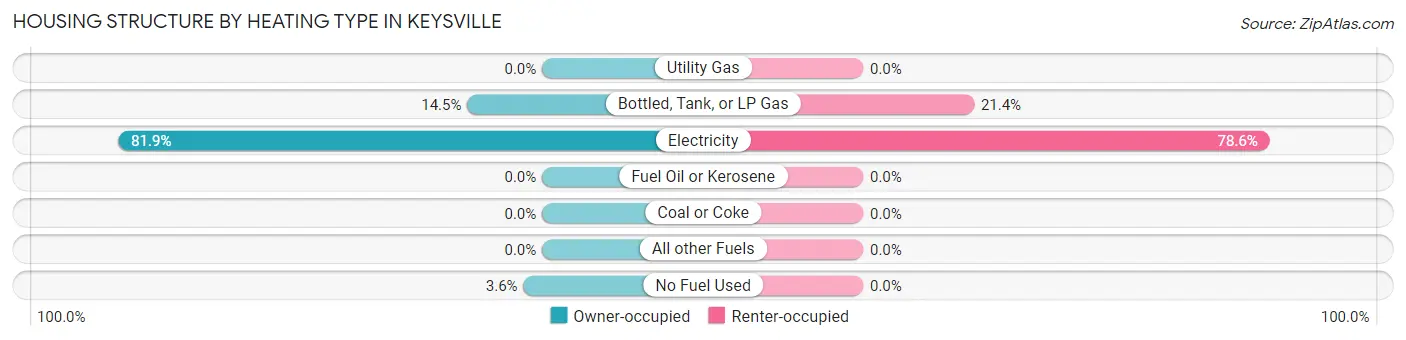
| Heating Type | Owner-occupied | Renter-occupied |
| Utility Gas | 0 (0.0%) | 0 (0.0%) |
| Bottled, Tank, or LP Gas | 12 (14.5%) | 6 (21.4%) |
| Electricity | 68 (81.9%) | 22 (78.6%) |
| Fuel Oil or Kerosene | 0 (0.0%) | 0 (0.0%) |
| Coal or Coke | 0 (0.0%) | 0 (0.0%) |
| All other Fuels | 0 (0.0%) | 0 (0.0%) |
| No Fuel Used | 3 (3.6%) | 0 (0.0%) |
| Total | 83 (100.0%) | 28 (100.0%) |
Household Vehicle Usage in Keysville
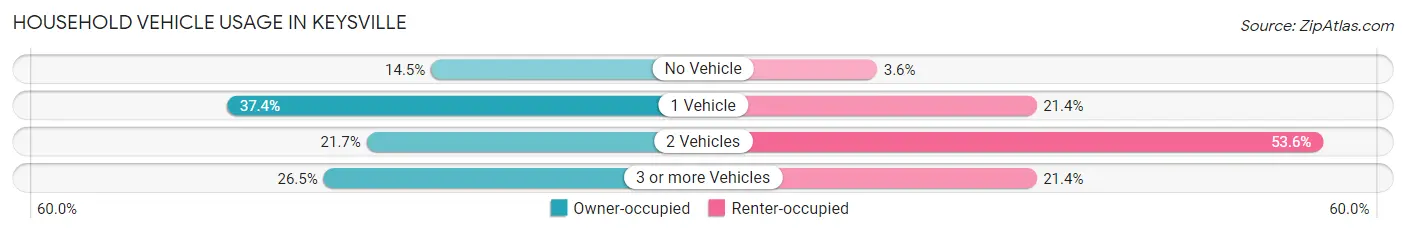
| Vehicles per Household | Owner-occupied | Renter-occupied |
| No Vehicle | 12 (14.5%) | 1 (3.6%) |
| 1 Vehicle | 31 (37.3%) | 6 (21.4%) |
| 2 Vehicles | 18 (21.7%) | 15 (53.6%) |
| 3 or more Vehicles | 22 (26.5%) | 6 (21.4%) |
| Total | 83 (100.0%) | 28 (100.0%) |
Real Estate & Mortgages in Keysville
Real Estate and Mortgage Overview in Keysville
| Characteristic | Without Mortgage | With Mortgage |
| Housing Units | 51 | 32 |
| Median Property Value | $58,800 | $0 |
| Median Household Income | $23,472 | $0 |
| Monthly Housing Costs | $448 | $0 |
| Real Estate Taxes | $383 | $0 |
Property Value by Mortgage Status in Keysville
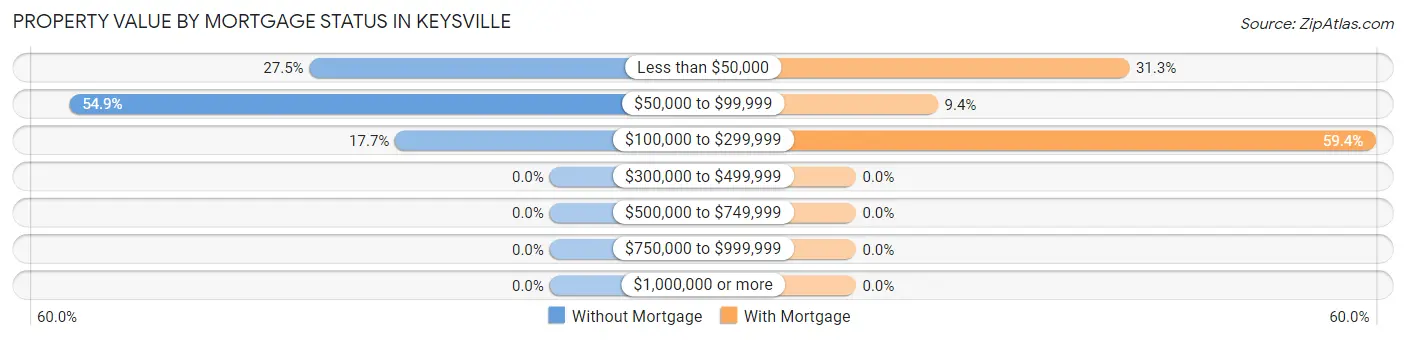
| Property Value | Without Mortgage | With Mortgage |
| Less than $50,000 | 14 (27.5%) | 10 (31.2%) |
| $50,000 to $99,999 | 28 (54.9%) | 3 (9.4%) |
| $100,000 to $299,999 | 9 (17.6%) | 19 (59.4%) |
| $300,000 to $499,999 | 0 (0.0%) | 0 (0.0%) |
| $500,000 to $749,999 | 0 (0.0%) | 0 (0.0%) |
| $750,000 to $999,999 | 0 (0.0%) | 0 (0.0%) |
| $1,000,000 or more | 0 (0.0%) | 0 (0.0%) |
| Total | 51 (100.0%) | 32 (100.0%) |
Household Income by Mortgage Status in Keysville
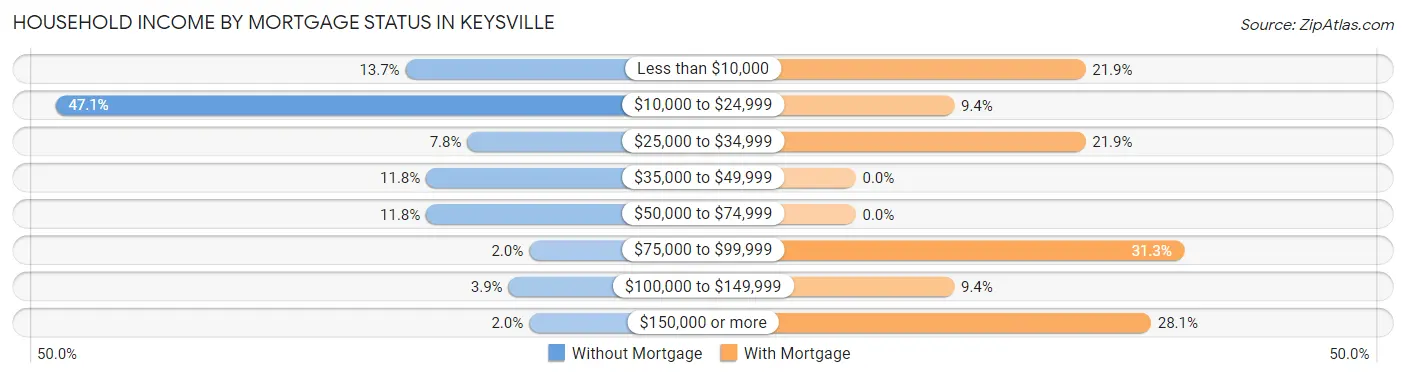
| Household Income | Without Mortgage | With Mortgage |
| Less than $10,000 | 7 (13.7%) | 7 (21.9%) |
| $10,000 to $24,999 | 24 (47.1%) | 3 (9.4%) |
| $25,000 to $34,999 | 4 (7.8%) | 7 (21.9%) |
| $35,000 to $49,999 | 6 (11.8%) | 0 (0.0%) |
| $50,000 to $74,999 | 6 (11.8%) | 0 (0.0%) |
| $75,000 to $99,999 | 1 (2.0%) | 10 (31.2%) |
| $100,000 to $149,999 | 2 (3.9%) | 3 (9.4%) |
| $150,000 or more | 1 (2.0%) | 9 (28.1%) |
| Total | 51 (100.0%) | 32 (100.0%) |
Property Value to Household Income Ratio in Keysville
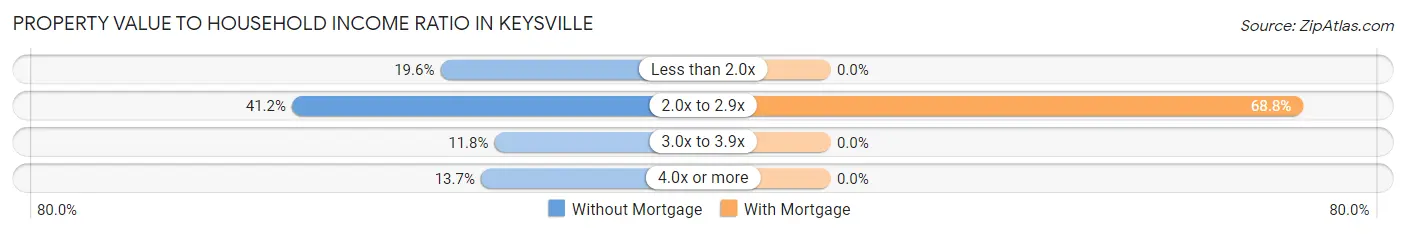
| Value-to-Income Ratio | Without Mortgage | With Mortgage |
| Less than 2.0x | 10 (19.6%) | 0 (0.0%) |
| 2.0x to 2.9x | 21 (41.2%) | 22 (68.8%) |
| 3.0x to 3.9x | 6 (11.8%) | 0 (0.0%) |
| 4.0x or more | 7 (13.7%) | 0 (0.0%) |
| Total | 51 (100.0%) | 32 (100.0%) |
Real Estate Taxes by Mortgage Status in Keysville
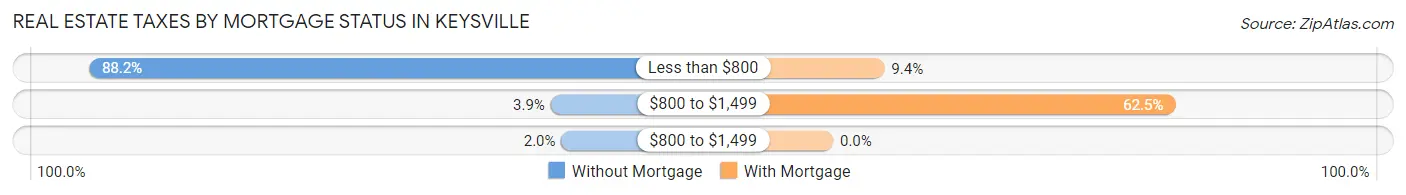
| Property Taxes | Without Mortgage | With Mortgage |
| Less than $800 | 45 (88.2%) | 3 (9.4%) |
| $800 to $1,499 | 2 (3.9%) | 20 (62.5%) |
| $800 to $1,499 | 1 (2.0%) | 0 (0.0%) |
| Total | 51 (100.0%) | 32 (100.0%) |
Health & Disability in Keysville
Health Insurance Coverage by Age in Keysville
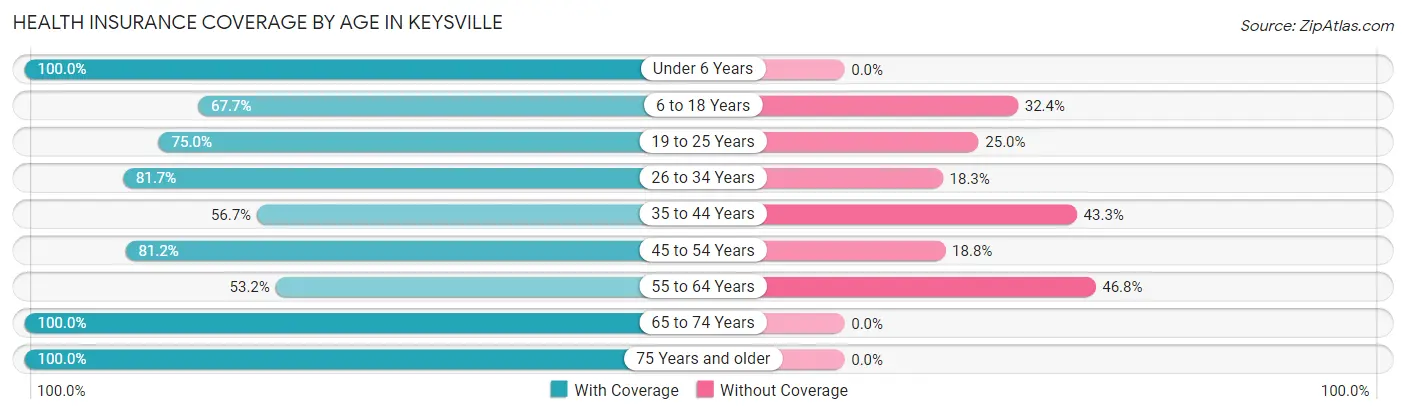
| Age Bracket | With Coverage | Without Coverage |
| Under 6 Years | 4 (100.0%) | 0 (0.0%) |
| 6 to 18 Years | 46 (67.6%) | 22 (32.4%) |
| 19 to 25 Years | 6 (75.0%) | 2 (25.0%) |
| 26 to 34 Years | 49 (81.7%) | 11 (18.3%) |
| 35 to 44 Years | 17 (56.7%) | 13 (43.3%) |
| 45 to 54 Years | 82 (81.2%) | 19 (18.8%) |
| 55 to 64 Years | 25 (53.2%) | 22 (46.8%) |
| 65 to 74 Years | 23 (100.0%) | 0 (0.0%) |
| 75 Years and older | 53 (100.0%) | 0 (0.0%) |
| Total | 305 (77.4%) | 89 (22.6%) |
Health Insurance Coverage by Citizenship Status in Keysville
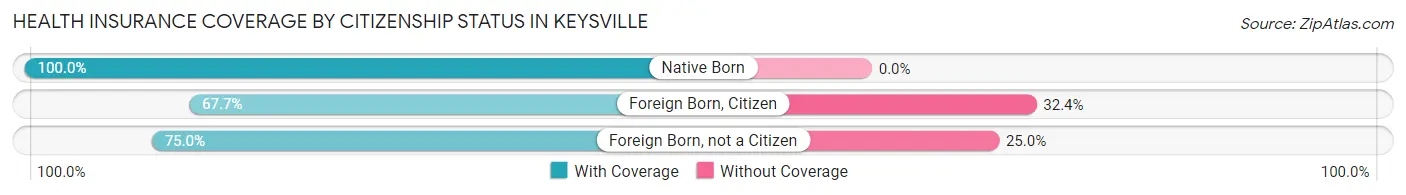
| Citizenship Status | With Coverage | Without Coverage |
| Native Born | 4 (100.0%) | 0 (0.0%) |
| Foreign Born, Citizen | 46 (67.6%) | 22 (32.4%) |
| Foreign Born, not a Citizen | 6 (75.0%) | 2 (25.0%) |
Health Insurance Coverage by Household Income in Keysville
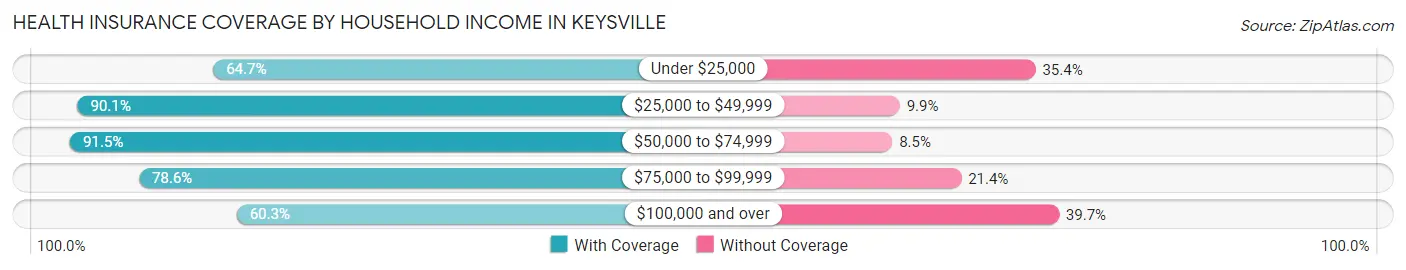
| Household Income | With Coverage | Without Coverage |
| Under $25,000 | 64 (64.6%) | 35 (35.3%) |
| $25,000 to $49,999 | 118 (90.1%) | 13 (9.9%) |
| $50,000 to $74,999 | 43 (91.5%) | 4 (8.5%) |
| $75,000 to $99,999 | 22 (78.6%) | 6 (21.4%) |
| $100,000 and over | 47 (60.3%) | 31 (39.7%) |
Public vs Private Health Insurance Coverage by Age in Keysville
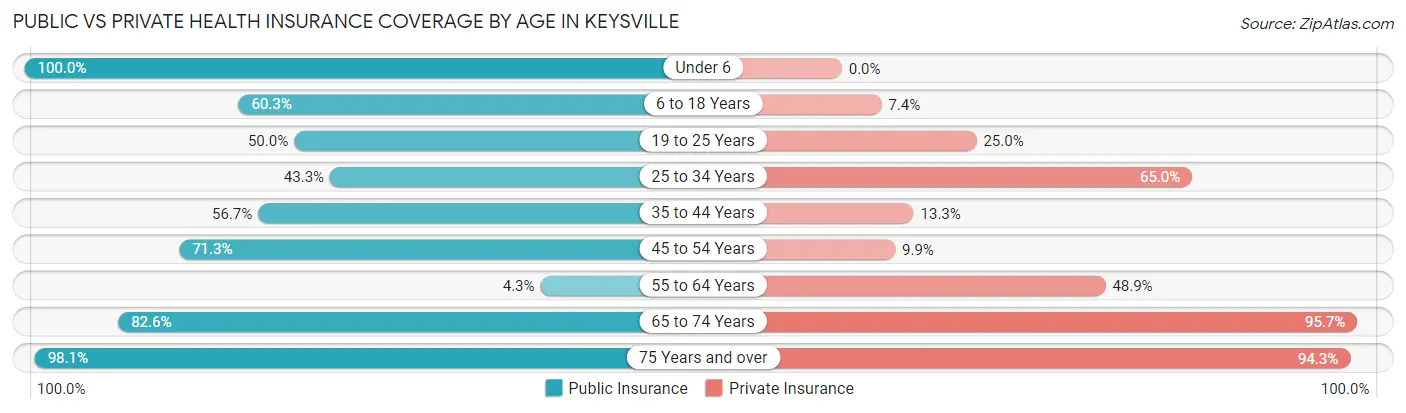
| Age Bracket | Public Insurance | Private Insurance |
| Under 6 | 4 (100.0%) | 0 (0.0%) |
| 6 to 18 Years | 41 (60.3%) | 5 (7.3%) |
| 19 to 25 Years | 4 (50.0%) | 2 (25.0%) |
| 25 to 34 Years | 26 (43.3%) | 39 (65.0%) |
| 35 to 44 Years | 17 (56.7%) | 4 (13.3%) |
| 45 to 54 Years | 72 (71.3%) | 10 (9.9%) |
| 55 to 64 Years | 2 (4.3%) | 23 (48.9%) |
| 65 to 74 Years | 19 (82.6%) | 22 (95.7%) |
| 75 Years and over | 52 (98.1%) | 50 (94.3%) |
| Total | 237 (60.2%) | 155 (39.3%) |
Disability Status by Sex by Age in Keysville
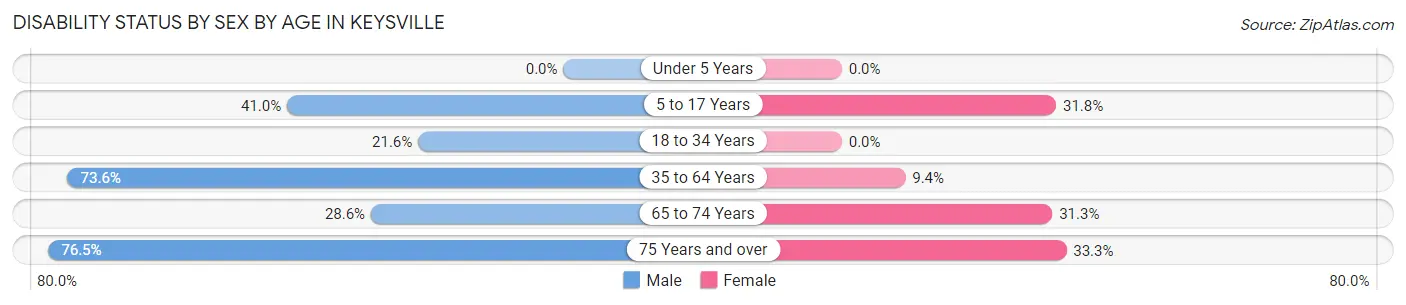
| Age Bracket | Male | Female |
| Under 5 Years | 0 (0.0%) | 0 (0.0%) |
| 5 to 17 Years | 16 (41.0%) | 7 (31.8%) |
| 18 to 34 Years | 11 (21.6%) | 0 (0.0%) |
| 35 to 64 Years | 92 (73.6%) | 5 (9.4%) |
| 65 to 74 Years | 2 (28.6%) | 5 (31.2%) |
| 75 Years and over | 13 (76.5%) | 12 (33.3%) |
Disability Class by Sex by Age in Keysville
Disability Class: Hearing Difficulty
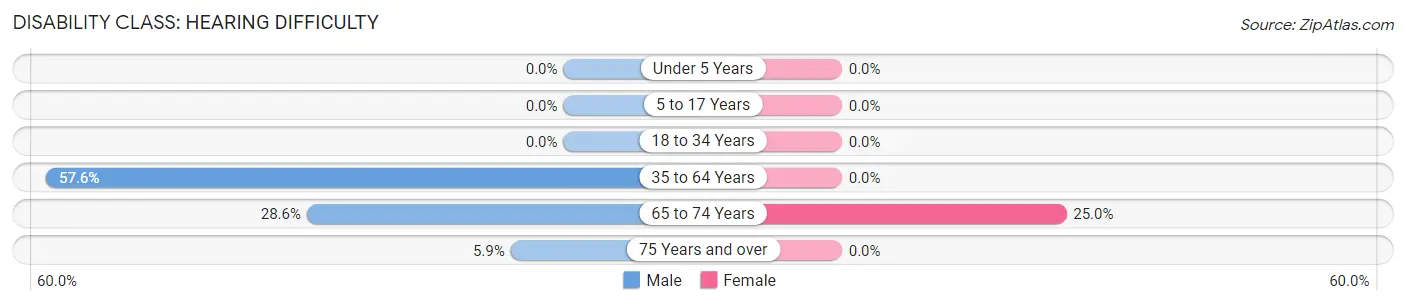
| Age Bracket | Male | Female |
| Under 5 Years | 0 (0.0%) | 0 (0.0%) |
| 5 to 17 Years | 0 (0.0%) | 0 (0.0%) |
| 18 to 34 Years | 0 (0.0%) | 0 (0.0%) |
| 35 to 64 Years | 72 (57.6%) | 0 (0.0%) |
| 65 to 74 Years | 2 (28.6%) | 4 (25.0%) |
| 75 Years and over | 1 (5.9%) | 0 (0.0%) |
Disability Class: Vision Difficulty
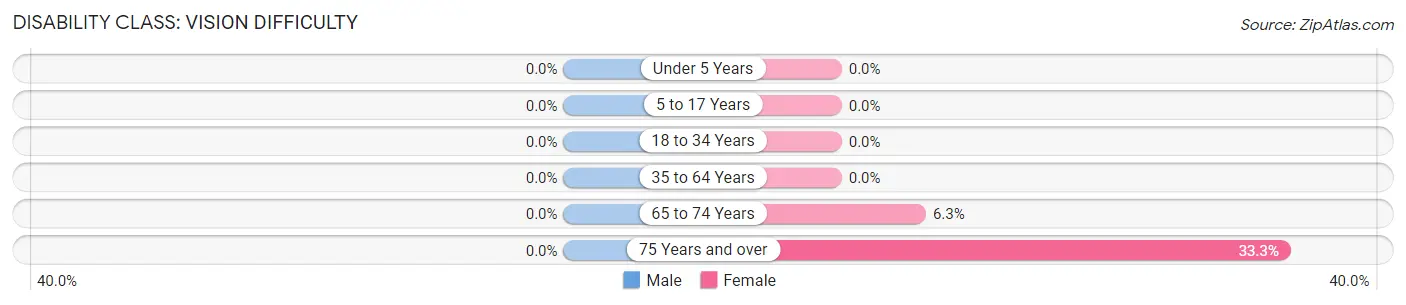
| Age Bracket | Male | Female |
| Under 5 Years | 0 (0.0%) | 0 (0.0%) |
| 5 to 17 Years | 0 (0.0%) | 0 (0.0%) |
| 18 to 34 Years | 0 (0.0%) | 0 (0.0%) |
| 35 to 64 Years | 0 (0.0%) | 0 (0.0%) |
| 65 to 74 Years | 0 (0.0%) | 1 (6.2%) |
| 75 Years and over | 0 (0.0%) | 12 (33.3%) |
Disability Class: Cognitive Difficulty
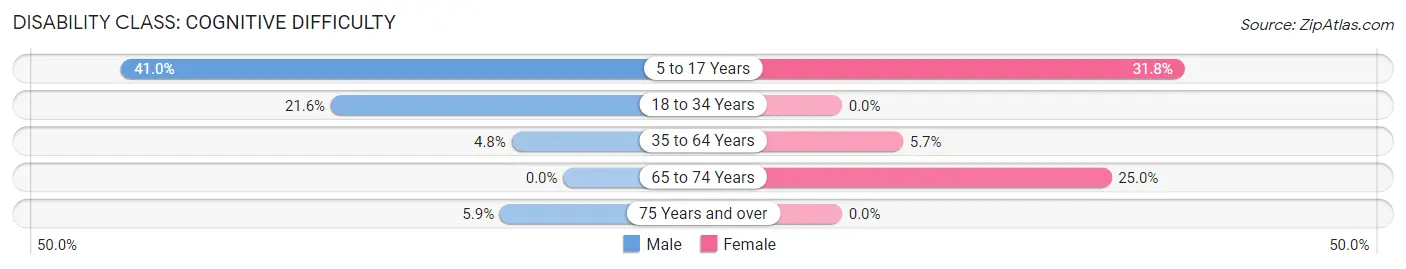
| Age Bracket | Male | Female |
| 5 to 17 Years | 16 (41.0%) | 7 (31.8%) |
| 18 to 34 Years | 11 (21.6%) | 0 (0.0%) |
| 35 to 64 Years | 6 (4.8%) | 3 (5.7%) |
| 65 to 74 Years | 0 (0.0%) | 4 (25.0%) |
| 75 Years and over | 1 (5.9%) | 0 (0.0%) |
Disability Class: Ambulatory Difficulty
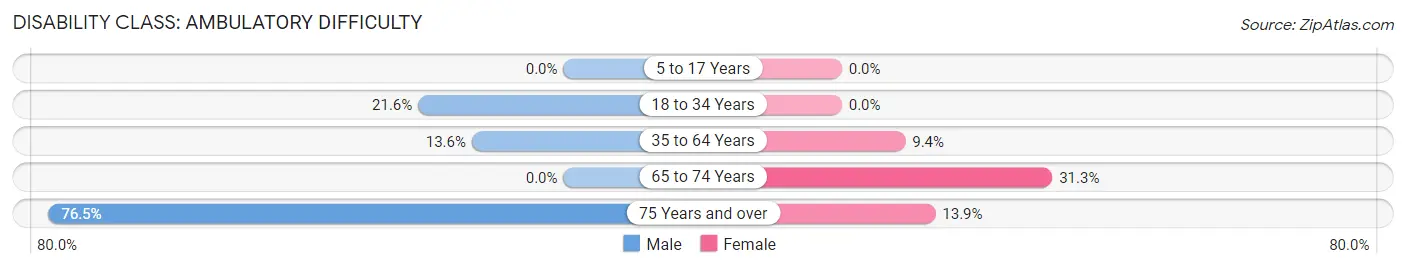
| Age Bracket | Male | Female |
| 5 to 17 Years | 0 (0.0%) | 0 (0.0%) |
| 18 to 34 Years | 11 (21.6%) | 0 (0.0%) |
| 35 to 64 Years | 17 (13.6%) | 5 (9.4%) |
| 65 to 74 Years | 0 (0.0%) | 5 (31.2%) |
| 75 Years and over | 13 (76.5%) | 5 (13.9%) |
Disability Class: Self-Care Difficulty
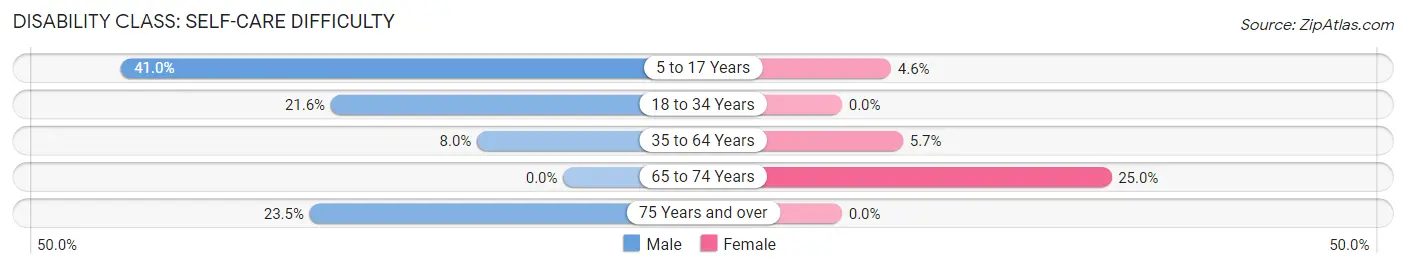
| Age Bracket | Male | Female |
| 5 to 17 Years | 16 (41.0%) | 1 (4.5%) |
| 18 to 34 Years | 11 (21.6%) | 0 (0.0%) |
| 35 to 64 Years | 10 (8.0%) | 3 (5.7%) |
| 65 to 74 Years | 0 (0.0%) | 4 (25.0%) |
| 75 Years and over | 4 (23.5%) | 0 (0.0%) |
Technology Access in Keysville
Computing Device Access in Keysville
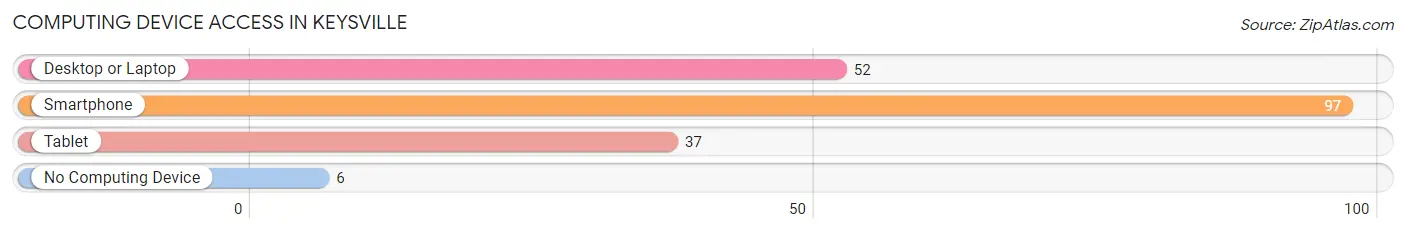
| Device Type | # Households | % Households |
| Desktop or Laptop | 52 | 46.9% |
| Smartphone | 97 | 87.4% |
| Tablet | 37 | 33.3% |
| No Computing Device | 6 | 5.4% |
| Total | 111 | 100.0% |
Internet Access in Keysville
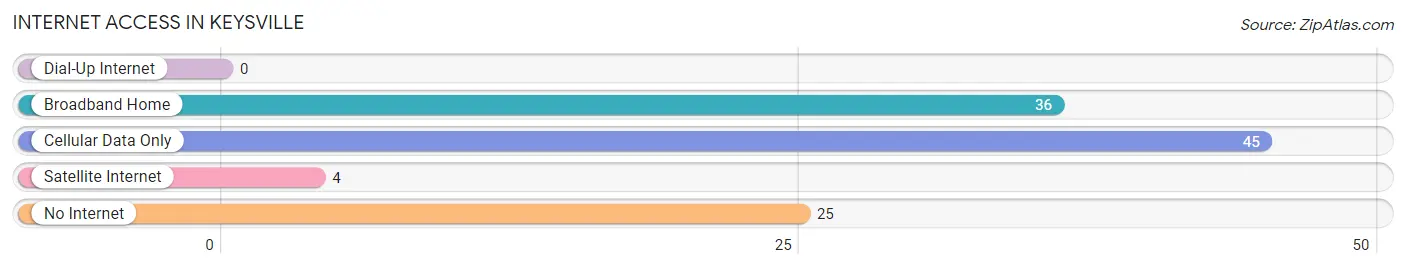
| Internet Type | # Households | % Households |
| Dial-Up Internet | 0 | 0.0% |
| Broadband Home | 36 | 32.4% |
| Cellular Data Only | 45 | 40.5% |
| Satellite Internet | 4 | 3.6% |
| No Internet | 25 | 22.5% |
| Total | 111 | 100.0% |
Keysville Summary
Keyesville, Georgia is a small town located in Burke County, Georgia. It is situated on the banks of the Ogeechee River, about 20 miles south of Augusta. The town was founded in 1820 and was named after the Key family, who were among the first settlers in the area.
History
The area around Keysville was first settled by Native Americans, who lived in the area for thousands of years before the arrival of European settlers. The first Europeans to settle in the area were the Key family, who arrived in 1820. The family established a plantation and built a small village, which they named Keysville.
The town grew slowly over the next few decades, and by the time of the Civil War, it had become a thriving community. During the war, Keysville was the site of several skirmishes between Confederate and Union forces. After the war, the town continued to grow, and by the early 1900s, it had become a bustling center of commerce and industry.
Geography
Keysville is located in Burke County, Georgia, about 20 miles south of Augusta. The town is situated on the banks of the Ogeechee River, and is surrounded by rolling hills and forests. The climate in Keysville is mild, with hot summers and cool winters.
Economy
The economy of Keysville is largely based on agriculture and forestry. The town is home to several farms, which produce a variety of crops, including cotton, corn, soybeans, and peanuts. The town also has several sawmills, which produce lumber for the local market.
In addition to agriculture and forestry, Keysville is also home to several small businesses, including restaurants, shops, and other services. The town is also home to a small manufacturing plant, which produces a variety of products, including furniture and clothing.
Demographics
As of the 2010 census, the population of Keysville was 1,845. The town is predominantly white, with African Americans making up about 20% of the population. The median household income in Keysville is $35,000, and the median home value is $90,000.
Conclusion
Keysville, Georgia is a small town located in Burke County, Georgia. It was founded in 1820 and has a rich history and culture. The town is largely based on agriculture and forestry, and is home to several small businesses. The population of Keysville is predominantly white, with African Americans making up about 20% of the population. The median household income in Keysville is $35,000, and the median home value is $90,000.
Common Questions
What is Per Capita Income in Keysville?
Per Capita income in Keysville is $20,832.
What is the Median Household income in Keysville?
Median Household Income in Keysville is $42,813.
What is Income or Wage Gap in Keysville?
Income or Wage Gap in Keysville is 14.5%.
Women in Keysville earn 85.5 cents for every dollar earned by a man.
What is Inequality or Gini Index in Keysville?
Inequality or Gini Index in Keysville is 0.47.
What is the Total Population of Keysville?
Total Population of Keysville is 403.
What is the Total Male Population of Keysville?
Total Male Population of Keysville is 243.
What is the Total Female Population of Keysville?
Total Female Population of Keysville is 160.
What is the Ratio of Males per 100 Females in Keysville?
There are 151.88 Males per 100 Females in Keysville.
What is the Ratio of Females per 100 Males in Keysville?
There are 65.84 Females per 100 Males in Keysville.
What is the Median Population Age in Keysville?
Median Population Age in Keysville is 52.2 Years.
What is the Average Family Size in Keysville
Average Family Size in Keysville is 4.8 People.
What is the Average Household Size in Keysville
Average Household Size in Keysville is 3.5 People.
How Large is the Labor Force in Keysville?
There are 109 People in the Labor Forcein in Keysville.
What is the Percentage of People in the Labor Force in Keysville?
31.9% of People are in the Labor Force in Keysville.