Zip Codes with the Highest Percentage of Households with Income Above $100,000 in Jesup, GA
RELATED REPORTS & OPTIONS
Household Income | $100k+
Jesup
Compare Zip Codes
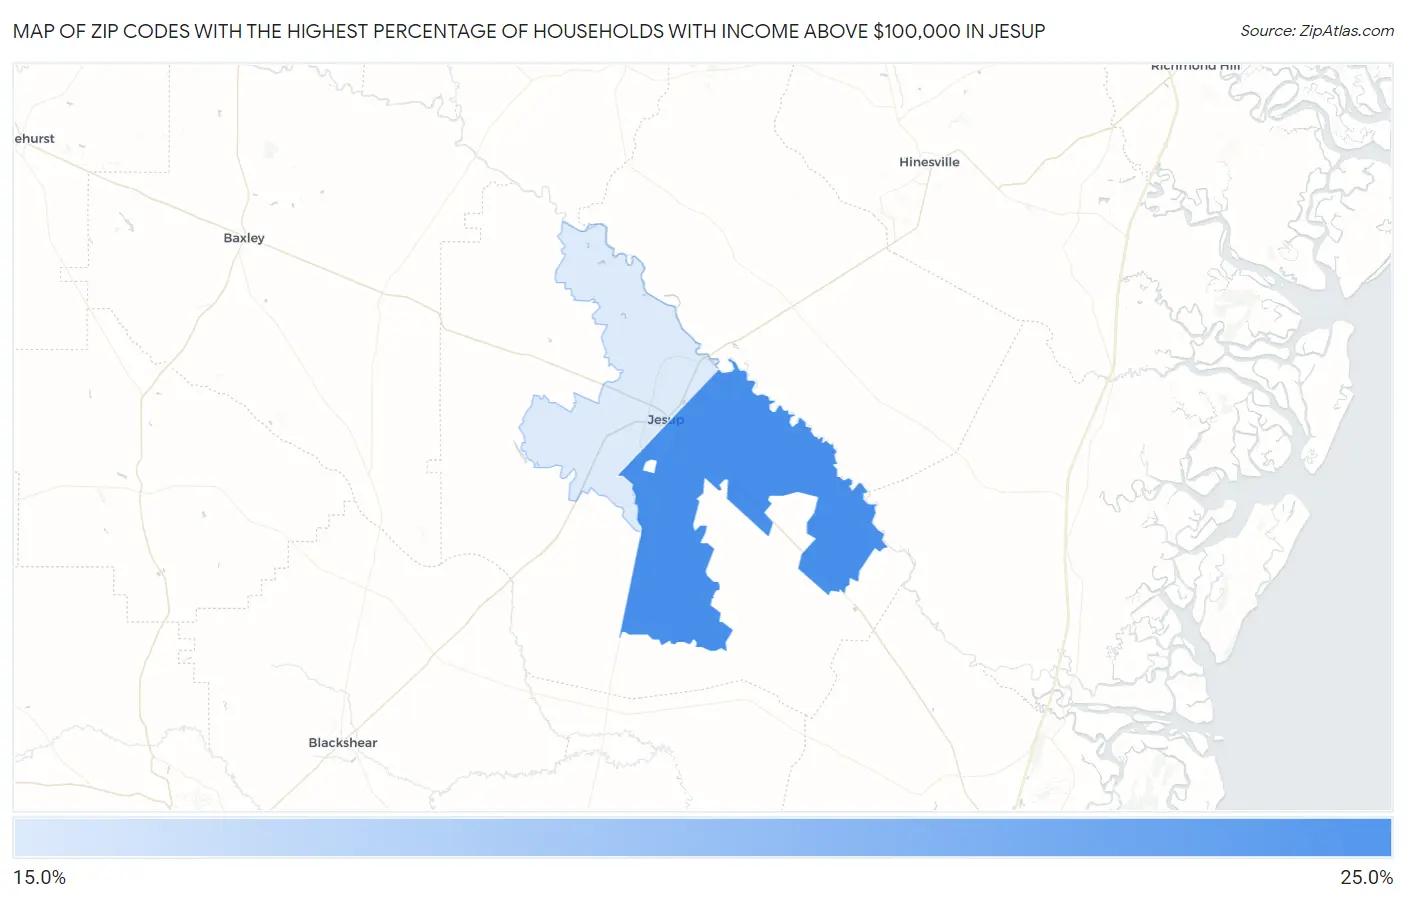
Map of Zip Codes with the Highest Percentage of Households with Income Above $100,000 in Jesup
19.5%
24.9%
Zip Codes with the Highest Percentage of Households with Income Above $100,000 in Jesup, GA
| Zip Code | Households with Income > $100k | vs State | vs National | |
| 1. | 31546 | 24.9% | 34.7%(-9.80)#355 | 37.3%(-12.4)#19,876 |
| 2. | 31545 | 19.5% | 34.7%(-15.2)#496 | 37.3%(-17.8)#24,440 |
1
Common Questions
What are the Top Zip Codes with the Highest Percentage of Households with Income Above $100,000 in Jesup, GA?
Top Zip Codes with the Highest Percentage of Households with Income Above $100,000 in Jesup, GA are:
What zip code has the Highest Percentage of Households with Income Above $100,000 in Jesup, GA?
31546 has the Highest Percentage of Households with Income Above $100,000 in Jesup, GA with 24.9%.
What is the Percentage of Households with Income Above $100,000 in Jesup, GA?
Percentage of Households with Income Above $100,000 in Jesup is 21.3%.
What is the Percentage of Households with Income Above $100,000 in Georgia?
Percentage of Households with Income Above $100,000 in Georgia is 34.7%.
What is the Percentage of Households with Income Above $100,000 in the United States?
Percentage of Households with Income Above $100,000 in the United States is 37.3%.