Jenkinsburg, GA Map & Demographics
Jenkinsburg Map
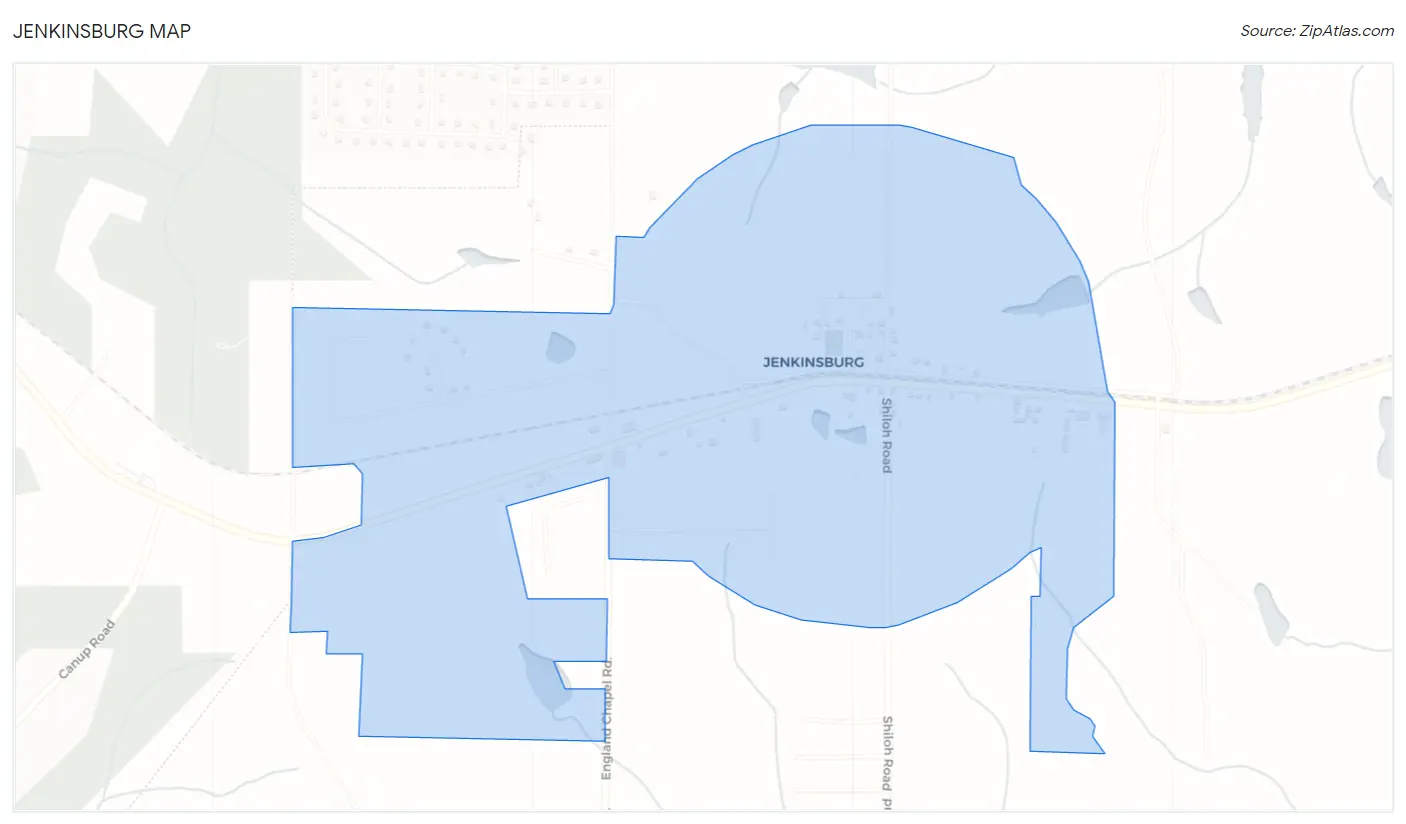
Jenkinsburg Overview
$36,559
PER CAPITA INCOME
$90,313
AVG FAMILY INCOME
$71,912
AVG HOUSEHOLD INCOME
16.8%
WAGE / INCOME GAP [ % ]
83.2¢/ $1
WAGE / INCOME GAP [ $ ]
0.31
INEQUALITY / GINI INDEX
303
TOTAL POPULATION
139
MALE POPULATION
164
FEMALE POPULATION
84.76
MALES / 100 FEMALES
117.99
FEMALES / 100 MALES
47.7
MEDIAN AGE
2.9
AVG FAMILY SIZE
2.3
AVG HOUSEHOLD SIZE
153
LABOR FORCE [ PEOPLE ]
55.8%
PERCENT IN LABOR FORCE
4.6%
UNEMPLOYMENT RATE
Jenkinsburg Zip Codes
Jenkinsburg Area Codes
Income in Jenkinsburg
Income Overview in Jenkinsburg
Per Capita Income in Jenkinsburg is $36,559, while median incomes of families and households are $90,313 and $71,912 respectively.
| Characteristic | Number | Measure |
| Per Capita Income | 303 | $36,559 |
| Median Family Income | 83 | $90,313 |
| Mean Family Income | 83 | $93,522 |
| Median Household Income | 132 | $71,912 |
| Mean Household Income | 132 | $81,605 |
| Income Deficit | 83 | $0 |
| Wage / Income Gap (%) | 303 | 16.82% |
| Wage / Income Gap ($) | 303 | 83.18¢ per $1 |
| Gini / Inequality Index | 303 | 0.31 |
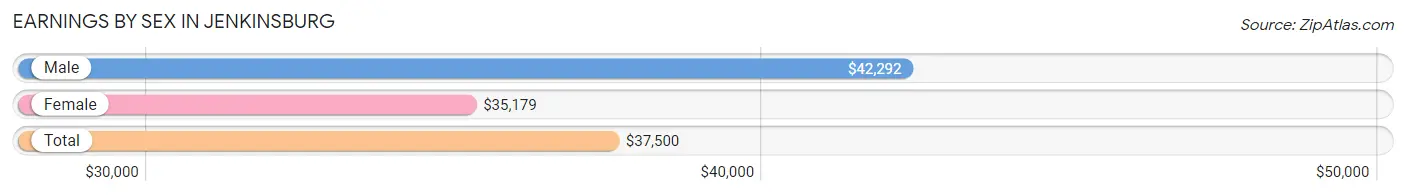
Earnings by Sex in Jenkinsburg
Average Earnings in Jenkinsburg are $37,500, $42,292 for men and $35,179 for women, a difference of 16.8%.
| Sex | Number | Average Earnings |
| Male | 87 (53.0%) | $42,292 |
| Female | 77 (46.9%) | $35,179 |
| Total | 164 (100.0%) | $37,500 |
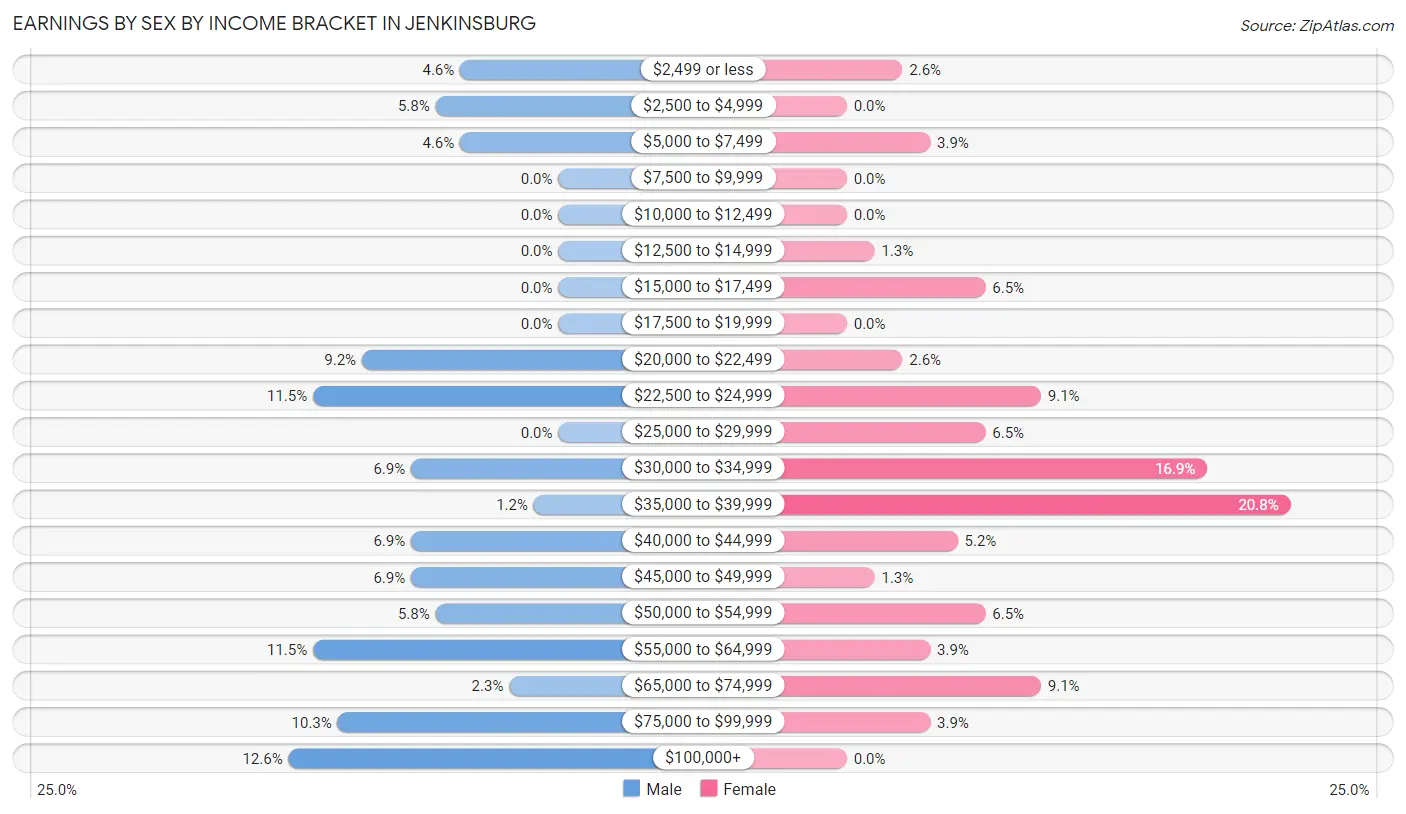
Earnings by Sex by Income Bracket in Jenkinsburg
The most common earnings brackets in Jenkinsburg are $100,000+ for men (11 | 12.6%) and $35,000 to $39,999 for women (16 | 20.8%).
| Income | Male | Female |
| $2,499 or less | 4 (4.6%) | 2 (2.6%) |
| $2,500 to $4,999 | 5 (5.8%) | 0 (0.0%) |
| $5,000 to $7,499 | 4 (4.6%) | 3 (3.9%) |
| $7,500 to $9,999 | 0 (0.0%) | 0 (0.0%) |
| $10,000 to $12,499 | 0 (0.0%) | 0 (0.0%) |
| $12,500 to $14,999 | 0 (0.0%) | 1 (1.3%) |
| $15,000 to $17,499 | 0 (0.0%) | 5 (6.5%) |
| $17,500 to $19,999 | 0 (0.0%) | 0 (0.0%) |
| $20,000 to $22,499 | 8 (9.2%) | 2 (2.6%) |
| $22,500 to $24,999 | 10 (11.5%) | 7 (9.1%) |
| $25,000 to $29,999 | 0 (0.0%) | 5 (6.5%) |
| $30,000 to $34,999 | 6 (6.9%) | 13 (16.9%) |
| $35,000 to $39,999 | 1 (1.1%) | 16 (20.8%) |
| $40,000 to $44,999 | 6 (6.9%) | 4 (5.2%) |
| $45,000 to $49,999 | 6 (6.9%) | 1 (1.3%) |
| $50,000 to $54,999 | 5 (5.8%) | 5 (6.5%) |
| $55,000 to $64,999 | 10 (11.5%) | 3 (3.9%) |
| $65,000 to $74,999 | 2 (2.3%) | 7 (9.1%) |
| $75,000 to $99,999 | 9 (10.3%) | 3 (3.9%) |
| $100,000+ | 11 (12.6%) | 0 (0.0%) |
| Total | 87 (100.0%) | 77 (100.0%) |
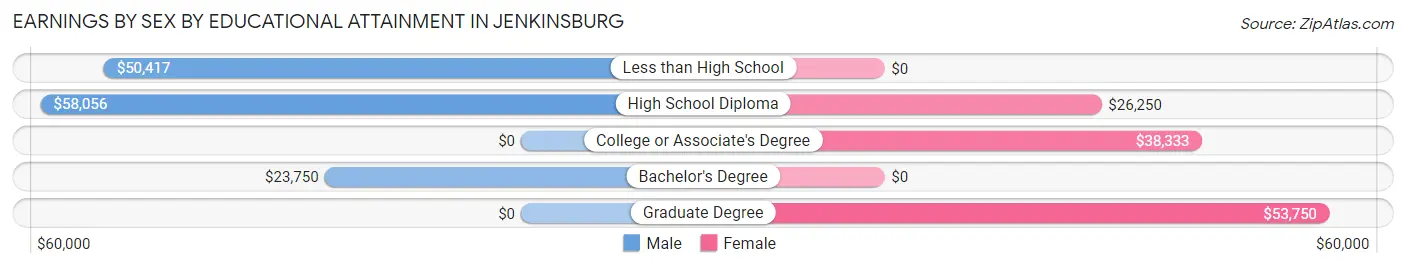
Earnings by Sex by Educational Attainment in Jenkinsburg
Average earnings in Jenkinsburg are $46,875 for men and $34,423 for women, a difference of 26.6%. Men with an educational attainment of high school diploma enjoy the highest average annual earnings of $58,056, while those with bachelor's degree education earn the least with $23,750. Women with an educational attainment of graduate degree earn the most with the average annual earnings of $53,750, while those with high school diploma education have the smallest earnings of $26,250.
| Educational Attainment | Male Income | Female Income |
| Less than High School | $50,417 | $0 |
| High School Diploma | $58,056 | $26,250 |
| College or Associate's Degree | - | - |
| Bachelor's Degree | $23,750 | $0 |
| Graduate Degree | - | - |
| Total | $46,875 | $34,423 |
Family Income in Jenkinsburg
Family Income Brackets in Jenkinsburg
According to the Jenkinsburg family income data, there are 33 families falling into the $50,000 to $74,999 income range, which is the most common income bracket and makes up 39.8% of all families.
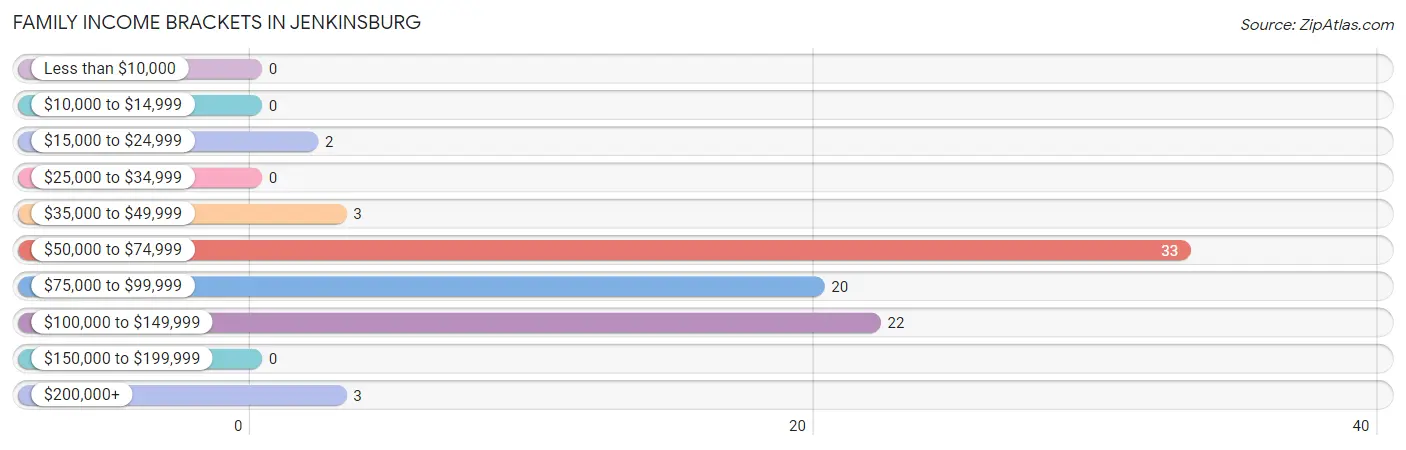
| Income Bracket | # Families | % Families |
| Less than $10,000 | 0 | 0.0% |
| $10,000 to $14,999 | 0 | 0.0% |
| $15,000 to $24,999 | 2 | 2.4% |
| $25,000 to $34,999 | 0 | 0.0% |
| $35,000 to $49,999 | 3 | 3.6% |
| $50,000 to $74,999 | 33 | 39.8% |
| $75,000 to $99,999 | 20 | 24.1% |
| $100,000 to $149,999 | 22 | 26.5% |
| $150,000 to $199,999 | 0 | 0.0% |
| $200,000+ | 3 | 3.6% |
Family Income by Famaliy Size in Jenkinsburg
3-person families (20 | 24.1%) account for the highest median family income in Jenkinsburg with $93,333 per family, while 2-person families (47 | 56.6%) have the highest median income of $39,375 per family member.
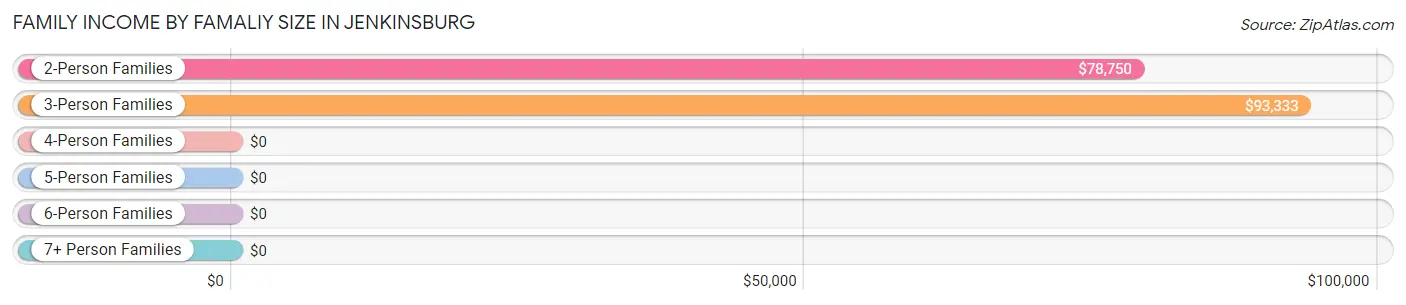
| Income Bracket | # Families | Median Income |
| 2-Person Families | 47 (56.6%) | $78,750 |
| 3-Person Families | 20 (24.1%) | $93,333 |
| 4-Person Families | 4 (4.8%) | $0 |
| 5-Person Families | 11 (13.3%) | $0 |
| 6-Person Families | 1 (1.2%) | $0 |
| 7+ Person Families | 0 (0.0%) | $0 |
| Total | 83 (100.0%) | $90,313 |
Family Income by Number of Earners in Jenkinsburg
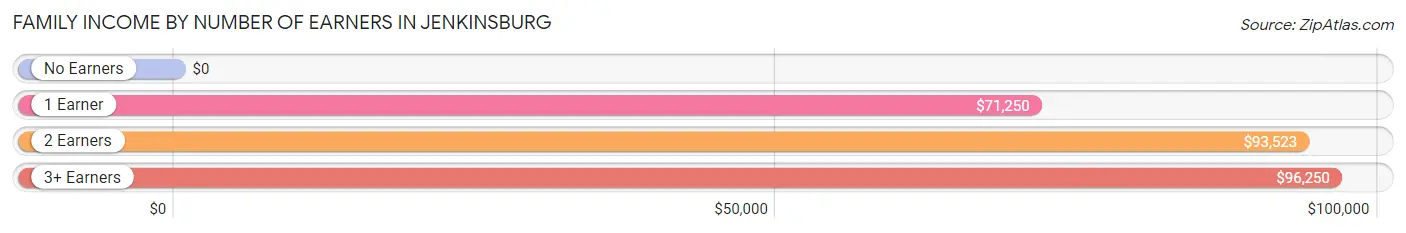
| Number of Earners | # Families | Median Income |
| No Earners | 23 (27.7%) | $0 |
| 1 Earner | 19 (22.9%) | $71,250 |
| 2 Earners | 29 (34.9%) | $93,523 |
| 3+ Earners | 12 (14.5%) | $96,250 |
| Total | 83 (100.0%) | $90,313 |
Household Income in Jenkinsburg
Household Income Brackets in Jenkinsburg
With 41 households falling in the category, the $50,000 to $74,999 income range is the most frequent in Jenkinsburg, accounting for 31.1% of all households. In contrast, only 1 households (0.8%) fall into the $10,000 to $14,999 income bracket, making it the least populous group.
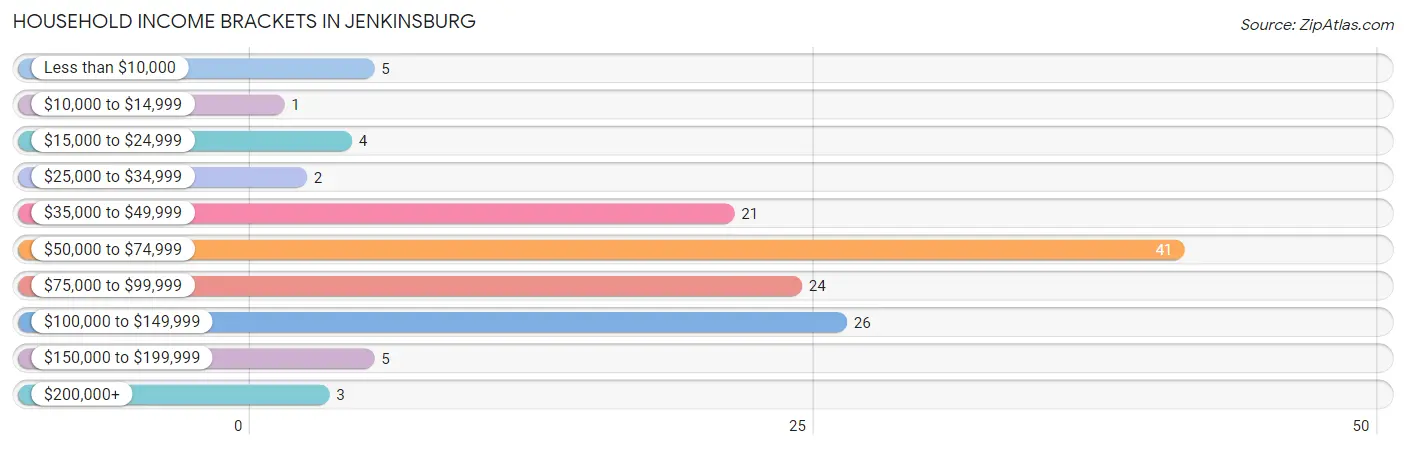
| Income Bracket | # Households | % Households |
| Less than $10,000 | 5 | 3.8% |
| $10,000 to $14,999 | 1 | 0.8% |
| $15,000 to $24,999 | 4 | 3.0% |
| $25,000 to $34,999 | 2 | 1.5% |
| $35,000 to $49,999 | 21 | 15.9% |
| $50,000 to $74,999 | 41 | 31.1% |
| $75,000 to $99,999 | 24 | 18.2% |
| $100,000 to $149,999 | 26 | 19.7% |
| $150,000 to $199,999 | 5 | 3.8% |
| $200,000+ | 3 | 2.3% |
Household Income by Householder Age in Jenkinsburg
The median household income in Jenkinsburg is $71,912, with the highest median household income of $95,000 found in the 25 to 44 years age bracket for the primary householder. A total of 30 households (22.7%) fall into this category. Meanwhile, the 15 to 24 years age bracket for the primary householder has the lowest median household income of $0, with 5 households (3.8%) in this group.
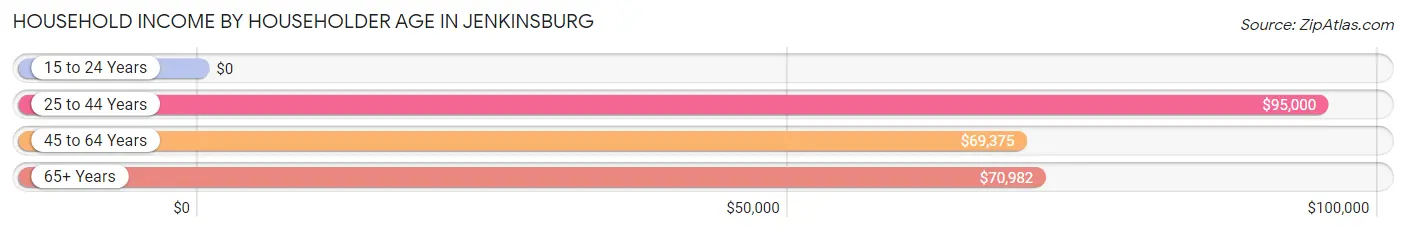
| Income Bracket | # Households | Median Income |
| 15 to 24 Years | 5 (3.8%) | $0 |
| 25 to 44 Years | 30 (22.7%) | $95,000 |
| 45 to 64 Years | 52 (39.4%) | $69,375 |
| 65+ Years | 45 (34.1%) | $70,982 |
| Total | 132 (100.0%) | $71,912 |
Poverty in Jenkinsburg
Income Below Poverty by Sex and Age in Jenkinsburg
With 2.2% poverty level for males and 4.3% for females among the residents of Jenkinsburg, 12 to 14 year old males and 35 to 44 year old females are the most vulnerable to poverty, with 2 males (66.7%) and 2 females (8.3%) in their respective age groups living below the poverty level.
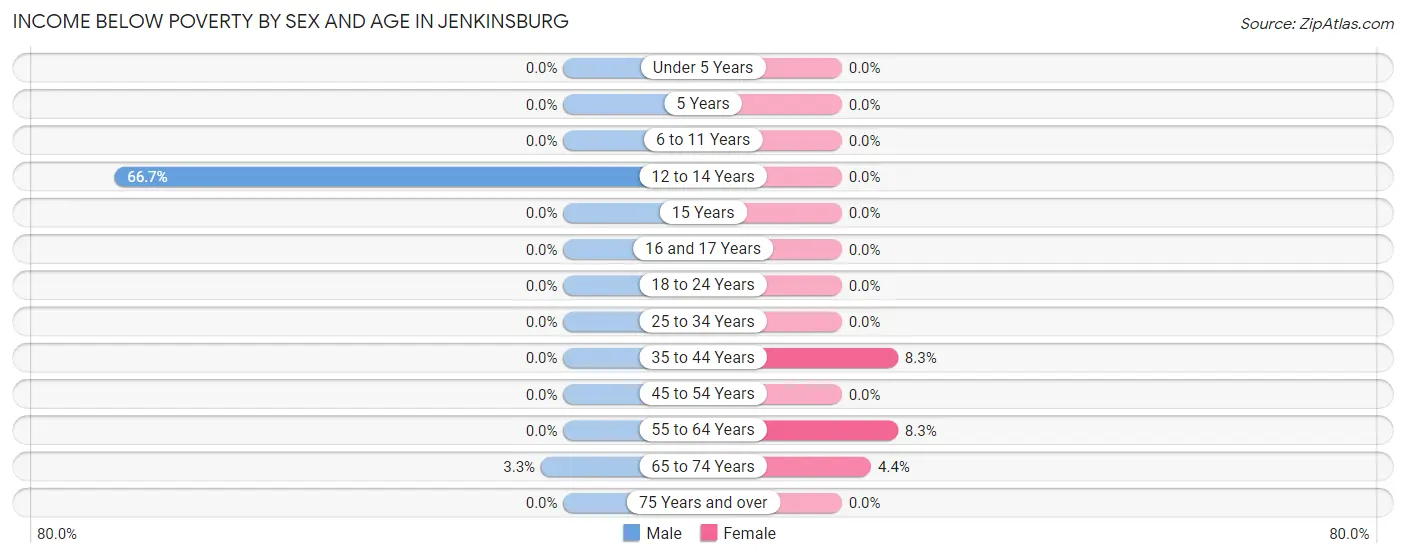
| Age Bracket | Male | Female |
| Under 5 Years | 0 (0.0%) | 0 (0.0%) |
| 5 Years | 0 (0.0%) | 0 (0.0%) |
| 6 to 11 Years | 0 (0.0%) | 0 (0.0%) |
| 12 to 14 Years | 2 (66.7%) | 0 (0.0%) |
| 15 Years | 0 (0.0%) | 0 (0.0%) |
| 16 and 17 Years | 0 (0.0%) | 0 (0.0%) |
| 18 to 24 Years | 0 (0.0%) | 0 (0.0%) |
| 25 to 34 Years | 0 (0.0%) | 0 (0.0%) |
| 35 to 44 Years | 0 (0.0%) | 2 (8.3%) |
| 45 to 54 Years | 0 (0.0%) | 0 (0.0%) |
| 55 to 64 Years | 0 (0.0%) | 4 (8.3%) |
| 65 to 74 Years | 1 (3.3%) | 1 (4.3%) |
| 75 Years and over | 0 (0.0%) | 0 (0.0%) |
| Total | 3 (2.2%) | 7 (4.3%) |
Income Above Poverty by Sex and Age in Jenkinsburg
According to the poverty statistics in Jenkinsburg, males aged 6 to 11 years and females aged under 5 years are the age groups that are most secure financially, with 100.0% of males and 100.0% of females in these age groups living above the poverty line.
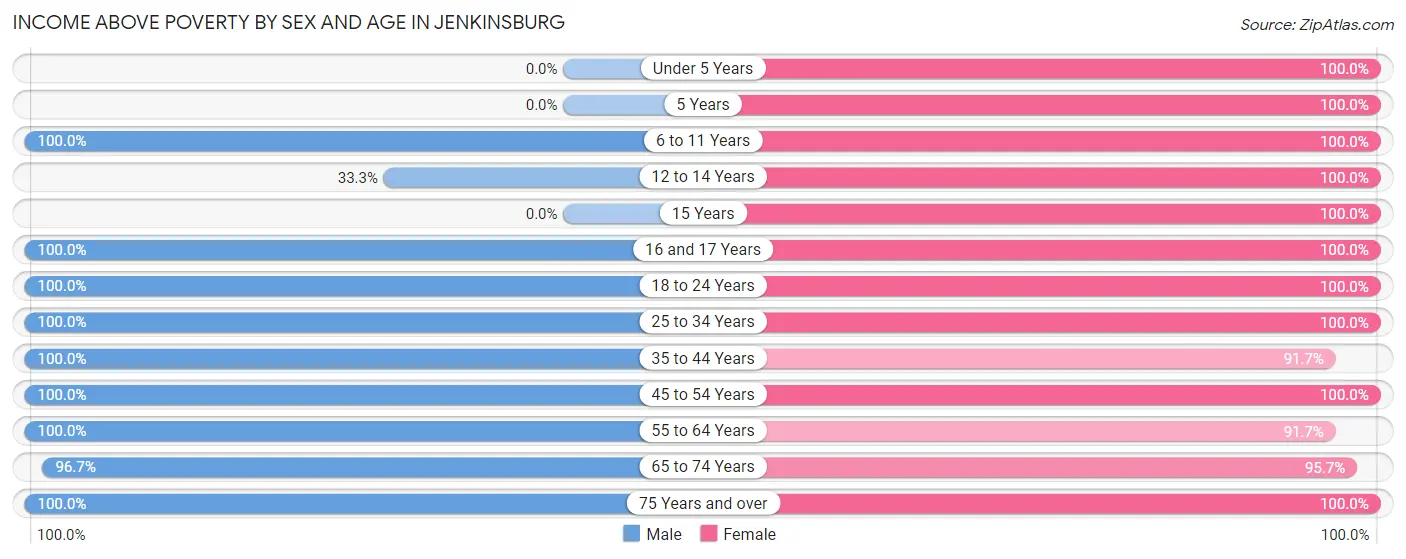
| Age Bracket | Male | Female |
| Under 5 Years | 0 (0.0%) | 4 (100.0%) |
| 5 Years | 0 (0.0%) | 2 (100.0%) |
| 6 to 11 Years | 9 (100.0%) | 4 (100.0%) |
| 12 to 14 Years | 1 (33.3%) | 2 (100.0%) |
| 15 Years | 0 (0.0%) | 5 (100.0%) |
| 16 and 17 Years | 4 (100.0%) | 3 (100.0%) |
| 18 to 24 Years | 8 (100.0%) | 16 (100.0%) |
| 25 to 34 Years | 28 (100.0%) | 5 (100.0%) |
| 35 to 44 Years | 21 (100.0%) | 22 (91.7%) |
| 45 to 54 Years | 21 (100.0%) | 23 (100.0%) |
| 55 to 64 Years | 10 (100.0%) | 44 (91.7%) |
| 65 to 74 Years | 29 (96.7%) | 22 (95.7%) |
| 75 Years and over | 5 (100.0%) | 5 (100.0%) |
| Total | 136 (97.8%) | 157 (95.7%) |
Income Below Poverty Among Married-Couple Families in Jenkinsburg
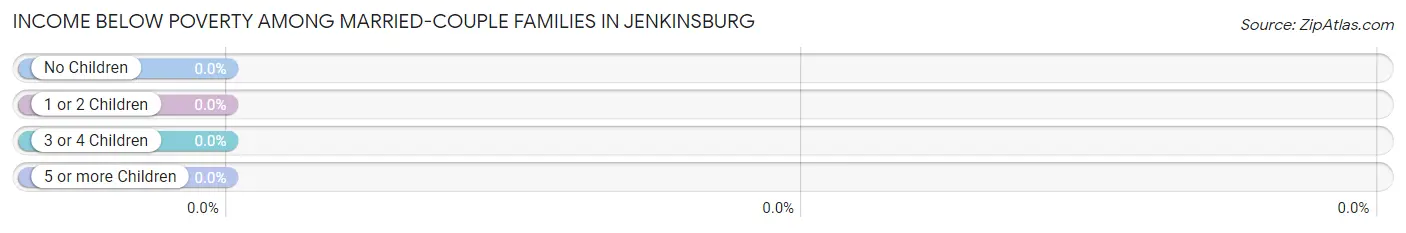
| Children | Above Poverty | Below Poverty |
| No Children | 43 (100.0%) | 0 (0.0%) |
| 1 or 2 Children | 20 (100.0%) | 0 (0.0%) |
| 3 or 4 Children | 1 (100.0%) | 0 (0.0%) |
| 5 or more Children | 0 (0.0%) | 0 (0.0%) |
| Total | 64 (100.0%) | 0 (0.0%) |
Income Below Poverty Among Single-Parent Households in Jenkinsburg

| Children | Single Father | Single Mother |
| No Children | 0 (0.0%) | 0 (0.0%) |
| 1 or 2 Children | 0 (0.0%) | 2 (28.6%) |
| 3 or 4 Children | 0 (0.0%) | 0 (0.0%) |
| 5 or more Children | 0 (0.0%) | 0 (0.0%) |
| Total | 0 (0.0%) | 2 (18.2%) |
Income Below Poverty Among Married-Couple vs Single-Parent Households in Jenkinsburg
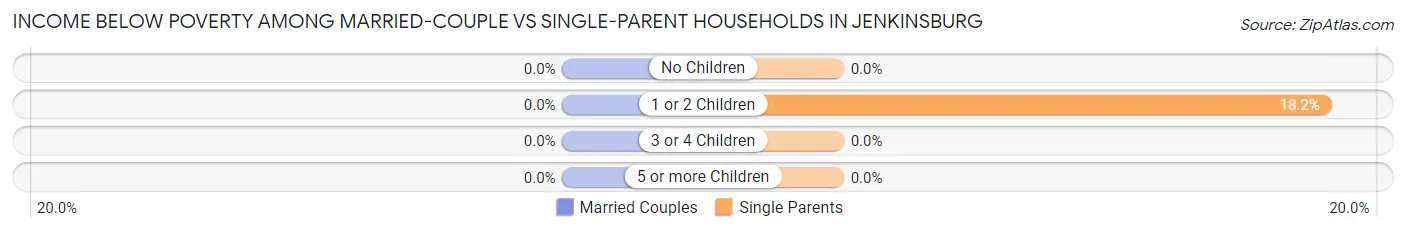
| Children | Married-Couple Families | Single-Parent Households |
| No Children | 0 (0.0%) | 0 (0.0%) |
| 1 or 2 Children | 0 (0.0%) | 2 (18.2%) |
| 3 or 4 Children | 0 (0.0%) | 0 (0.0%) |
| 5 or more Children | 0 (0.0%) | 0 (0.0%) |
| Total | 0 (0.0%) | 2 (10.5%) |
Race in Jenkinsburg
The most populous races in Jenkinsburg are White / Caucasian (248 | 81.9%), Black / African American (42 | 13.9%), and Hispanic or Latino (19 | 6.3%).
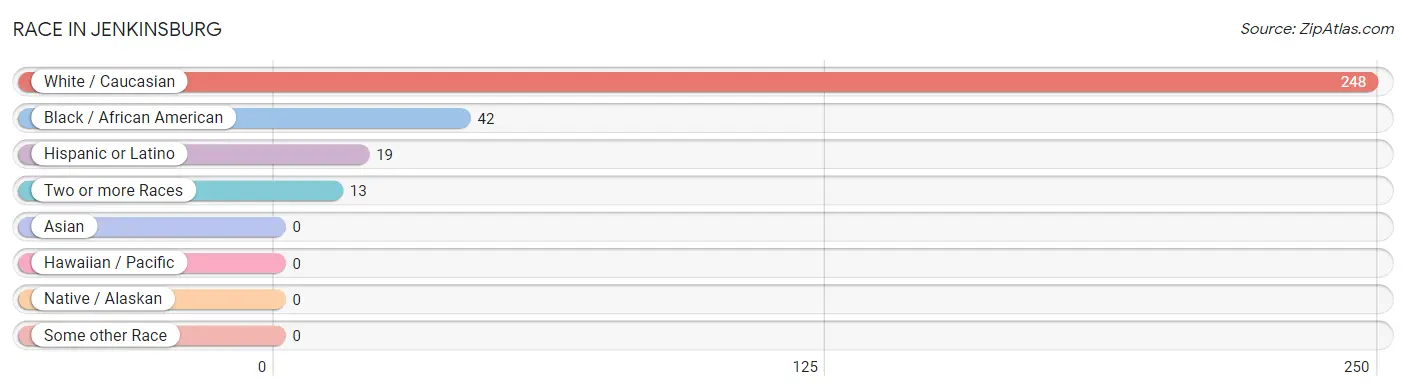
| Race | # Population | % Population |
| Asian | 0 | 0.0% |
| Black / African American | 42 | 13.9% |
| Hawaiian / Pacific | 0 | 0.0% |
| Hispanic or Latino | 19 | 6.3% |
| Native / Alaskan | 0 | 0.0% |
| White / Caucasian | 248 | 81.9% |
| Two or more Races | 13 | 4.3% |
| Some other Race | 0 | 0.0% |
| Total | 303 | 100.0% |
Ancestry in Jenkinsburg
The most populous ancestries reported in Jenkinsburg are American (100 | 33.0%), English (25 | 8.3%), Puerto Rican (16 | 5.3%), Irish (13 | 4.3%), and European (9 | 3.0%), together accounting for 53.8% of all Jenkinsburg residents.
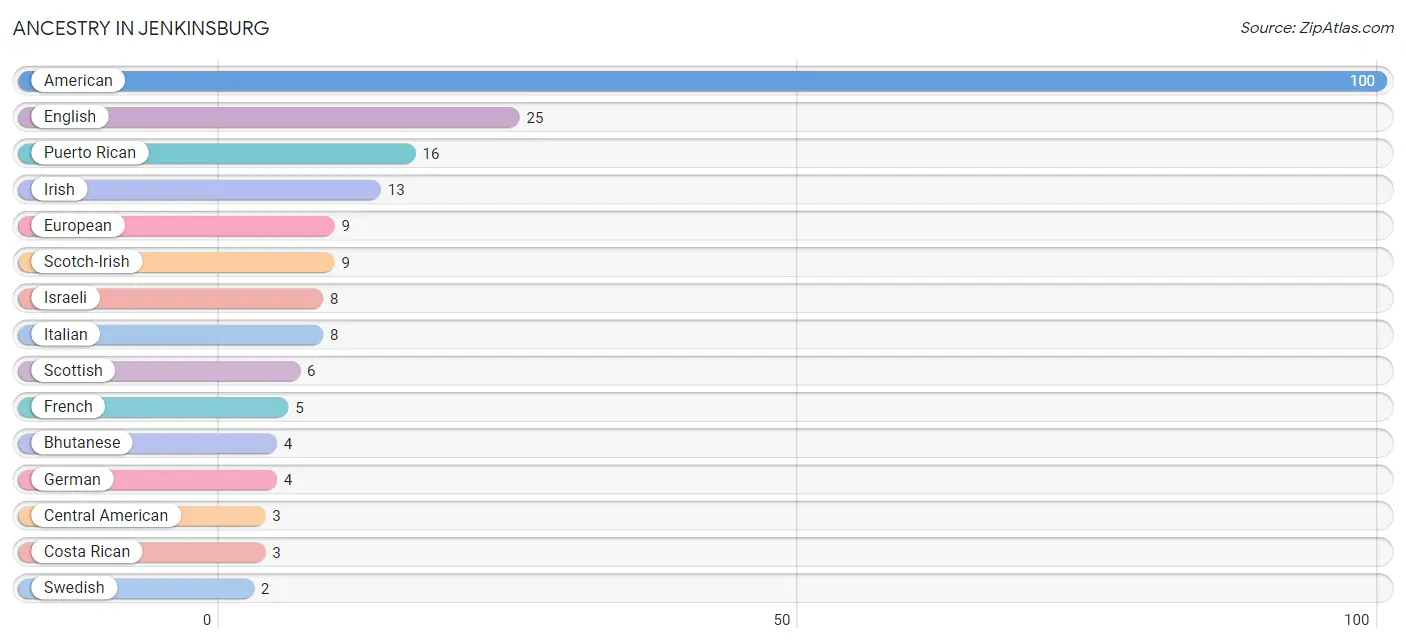
| Ancestry | # Population | % Population |
| American | 100 | 33.0% |
| Bhutanese | 4 | 1.3% |
| Central American | 3 | 1.0% |
| Costa Rican | 3 | 1.0% |
| English | 25 | 8.3% |
| European | 9 | 3.0% |
| French | 5 | 1.7% |
| German | 4 | 1.3% |
| Irish | 13 | 4.3% |
| Israeli | 8 | 2.6% |
| Italian | 8 | 2.6% |
| Puerto Rican | 16 | 5.3% |
| Scotch-Irish | 9 | 3.0% |
| Scottish | 6 | 2.0% |
| Swedish | 2 | 0.7% | View All 15 Rows |
Immigrants in Jenkinsburg
The most numerous immigrant groups reported in Jenkinsburg came from Europe (1 | 0.3%), Germany (1 | 0.3%), and Western Europe (1 | 0.3%), together accounting for 1.0% of all Jenkinsburg residents.
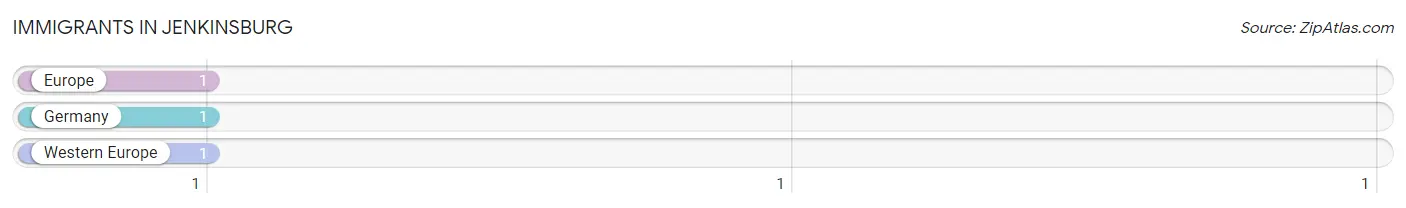
| Immigration Origin | # Population | % Population |
| Europe | 1 | 0.3% |
| Germany | 1 | 0.3% |
| Western Europe | 1 | 0.3% | View All 3 Rows |
Sex and Age in Jenkinsburg
Sex and Age in Jenkinsburg
The most populous age groups in Jenkinsburg are 65 to 69 Years (20 | 14.4%) for men and 60 to 64 Years (39 | 23.8%) for women.
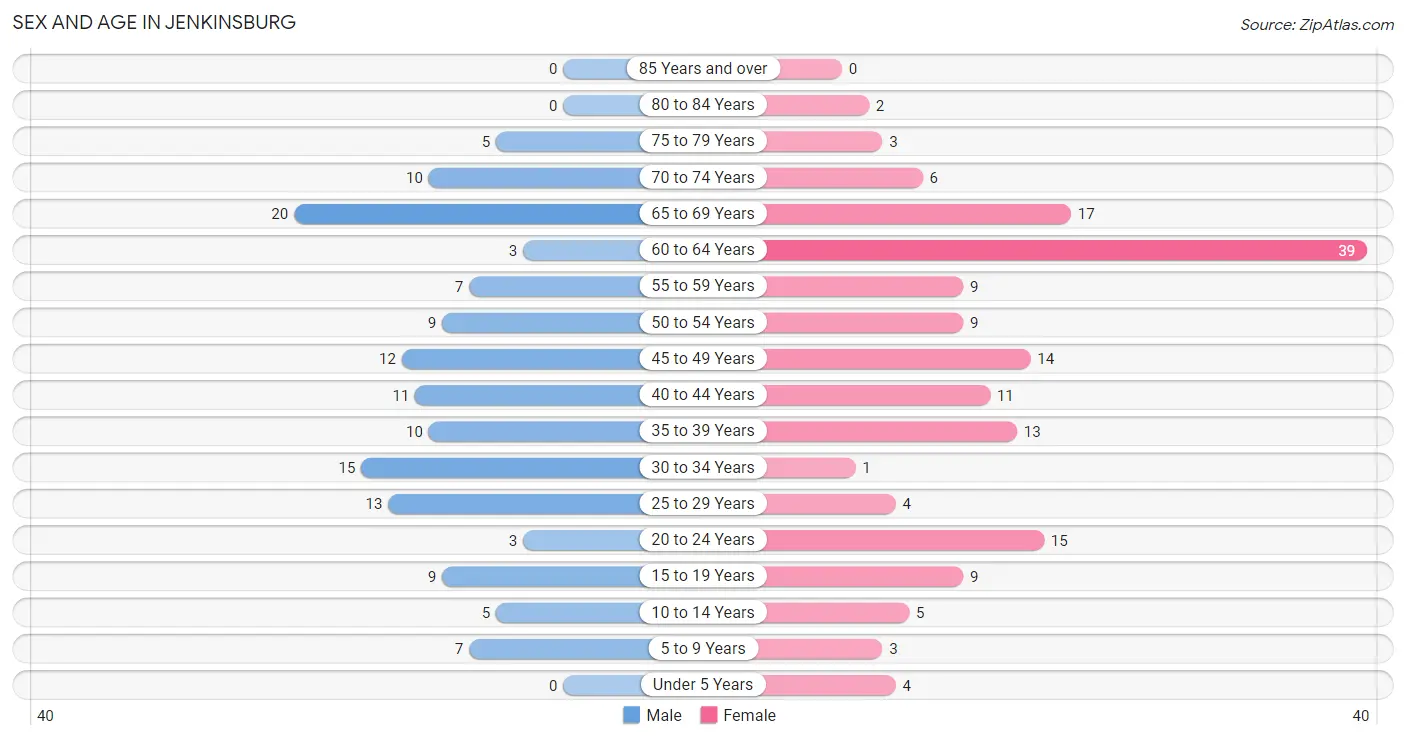
| Age Bracket | Male | Female |
| Under 5 Years | 0 (0.0%) | 4 (2.4%) |
| 5 to 9 Years | 7 (5.0%) | 3 (1.8%) |
| 10 to 14 Years | 5 (3.6%) | 5 (3.0%) |
| 15 to 19 Years | 9 (6.5%) | 9 (5.5%) |
| 20 to 24 Years | 3 (2.2%) | 15 (9.1%) |
| 25 to 29 Years | 13 (9.3%) | 4 (2.4%) |
| 30 to 34 Years | 15 (10.8%) | 1 (0.6%) |
| 35 to 39 Years | 10 (7.2%) | 13 (7.9%) |
| 40 to 44 Years | 11 (7.9%) | 11 (6.7%) |
| 45 to 49 Years | 12 (8.6%) | 14 (8.5%) |
| 50 to 54 Years | 9 (6.5%) | 9 (5.5%) |
| 55 to 59 Years | 7 (5.0%) | 9 (5.5%) |
| 60 to 64 Years | 3 (2.2%) | 39 (23.8%) |
| 65 to 69 Years | 20 (14.4%) | 17 (10.4%) |
| 70 to 74 Years | 10 (7.2%) | 6 (3.7%) |
| 75 to 79 Years | 5 (3.6%) | 3 (1.8%) |
| 80 to 84 Years | 0 (0.0%) | 2 (1.2%) |
| 85 Years and over | 0 (0.0%) | 0 (0.0%) |
| Total | 139 (100.0%) | 164 (100.0%) |
Families and Households in Jenkinsburg
Median Family Size in Jenkinsburg
The median family size in Jenkinsburg is 2.89 persons per family, with married-couple families (64 | 77.1%) accounting for the largest median family size of 2.95 persons per family. On the other hand, single female/mother families (11 | 13.3%) represent the smallest median family size with 2.64 persons per family.
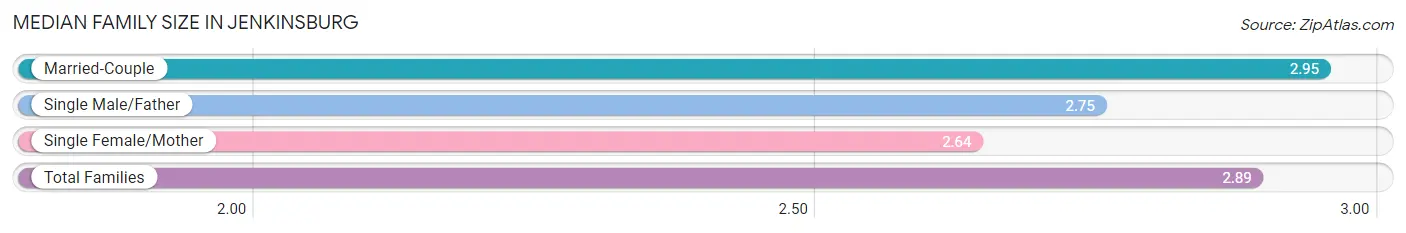
| Family Type | # Families | Family Size |
| Married-Couple | 64 (77.1%) | 2.95 |
| Single Male/Father | 8 (9.6%) | 2.75 |
| Single Female/Mother | 11 (13.3%) | 2.64 |
| Total Families | 83 (100.0%) | 2.89 |
Median Household Size in Jenkinsburg
The median household size in Jenkinsburg is 2.30 persons per household, with single male/father households (8 | 6.1%) accounting for the largest median household size of 3.13 persons per household. non-family households (49 | 37.1%) represent the smallest median household size with 1.18 persons per household.
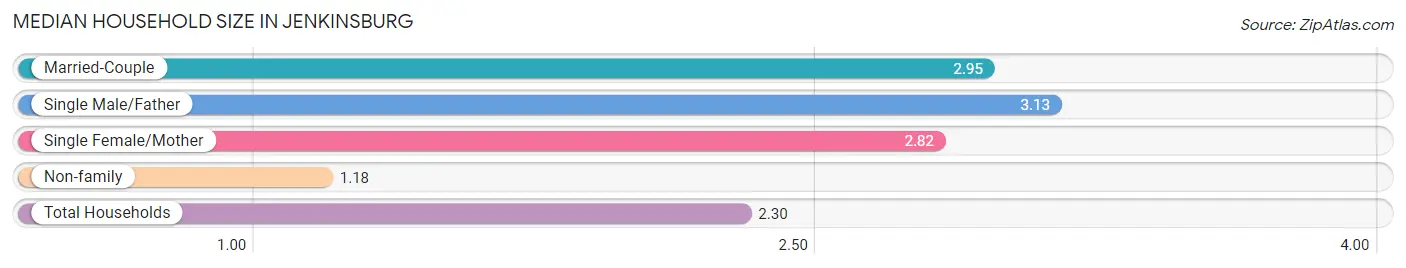
| Household Type | # Households | Household Size |
| Married-Couple | 64 (48.5%) | 2.95 |
| Single Male/Father | 8 (6.1%) | 3.13 |
| Single Female/Mother | 11 (8.3%) | 2.82 |
| Non-family | 49 (37.1%) | 1.18 |
| Total Households | 132 (100.0%) | 2.30 |
Household Size by Marriage Status in Jenkinsburg
Out of a total of 132 households in Jenkinsburg, 83 (62.9%) are family households, while 49 (37.1%) are nonfamily households. The most numerous type of family households are 2-person households, comprising 45, and the most common type of nonfamily households are 1-person households, comprising 43.
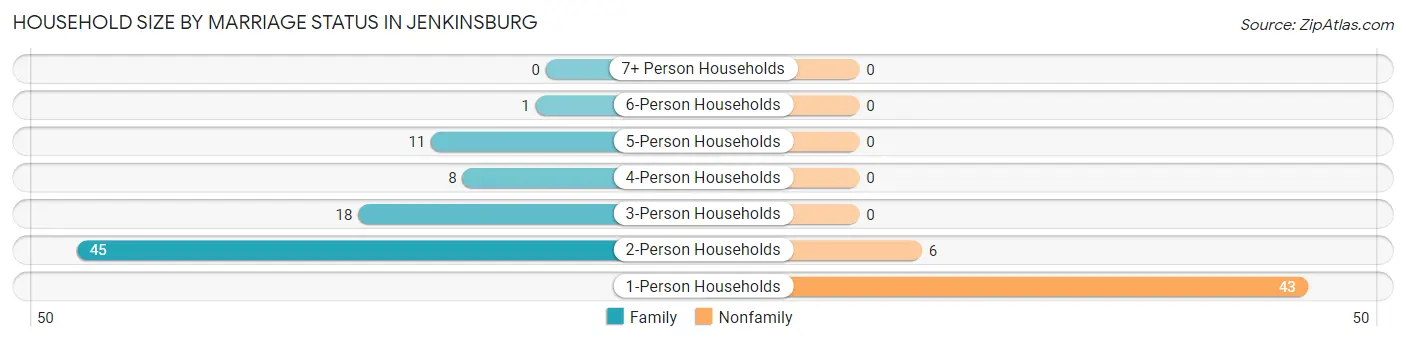
| Household Size | Family Households | Nonfamily Households |
| 1-Person Households | - | 43 (32.6%) |
| 2-Person Households | 45 (34.1%) | 6 (4.5%) |
| 3-Person Households | 18 (13.6%) | 0 (0.0%) |
| 4-Person Households | 8 (6.1%) | 0 (0.0%) |
| 5-Person Households | 11 (8.3%) | 0 (0.0%) |
| 6-Person Households | 1 (0.8%) | 0 (0.0%) |
| 7+ Person Households | 0 (0.0%) | 0 (0.0%) |
| Total | 83 (62.9%) | 49 (37.1%) |
Female Fertility in Jenkinsburg
Fertility by Age in Jenkinsburg
| Age Bracket | Women with Births | Births / 1,000 Women |
| 15 to 19 years | 0 (0.0%) | 0.0 |
| 20 to 34 years | 0 (0.0%) | 0.0 |
| 35 to 50 years | 0 (0.0%) | 0.0 |
| Total | 0 (0.0%) | 0.0 |
Fertility by Age by Marriage Status in Jenkinsburg
| Age Bracket | Married | Unmarried |
| 15 to 19 years | 0 (0.0%) | 0 (0.0%) |
| 20 to 34 years | 0 (0.0%) | 0 (0.0%) |
| 35 to 50 years | 0 (0.0%) | 0 (0.0%) |
| Total | 0 (0.0%) | 0 (0.0%) |
Fertility by Education in Jenkinsburg
| Educational Attainment | Women with Births | Births / 1,000 Women |
| Less than High School | 0 (0.0%) | 0.0 |
| High School Diploma | 0 (0.0%) | 0.0 |
| College or Associate's Degree | 0 (0.0%) | 0.0 |
| Bachelor's Degree | 0 (0.0%) | 0.0 |
| Graduate Degree | 0 (0.0%) | 0.0 |
| Total | 0 (0.0%) | 0.0 |
Fertility by Education by Marriage Status in Jenkinsburg

| Educational Attainment | Married | Unmarried |
| Less than High School | 0 (0.0%) | 0 (0.0%) |
| High School Diploma | 0 (0.0%) | 0 (0.0%) |
| College or Associate's Degree | 0 (0.0%) | 0 (0.0%) |
| Bachelor's Degree | 0 (0.0%) | 0 (0.0%) |
| Graduate Degree | 0 (0.0%) | 0 (0.0%) |
| Total | 0 (0.0%) | 0 (0.0%) |
Employment Characteristics in Jenkinsburg
Employment by Class of Employer in Jenkinsburg
Among the 141 employed individuals in Jenkinsburg, private company employees (102 | 72.3%), local government employees (23 | 16.3%), and self-employed (incorporated) (6 | 4.3%) make up the most common classes of employment.
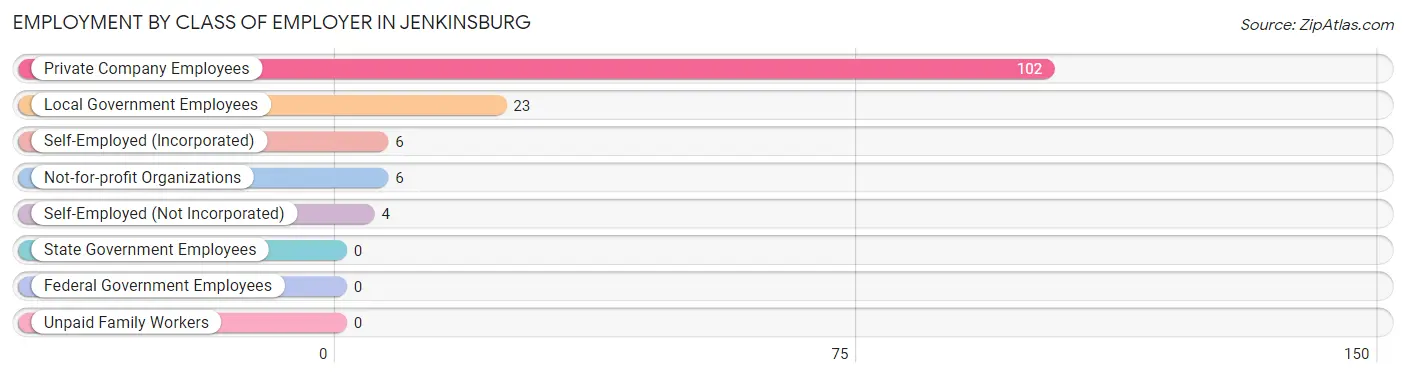
| Employer Class | # Employees | % Employees |
| Private Company Employees | 102 | 72.3% |
| Self-Employed (Incorporated) | 6 | 4.3% |
| Self-Employed (Not Incorporated) | 4 | 2.8% |
| Not-for-profit Organizations | 6 | 4.3% |
| Local Government Employees | 23 | 16.3% |
| State Government Employees | 0 | 0.0% |
| Federal Government Employees | 0 | 0.0% |
| Unpaid Family Workers | 0 | 0.0% |
| Total | 141 | 100.0% |
Employment Status by Age in Jenkinsburg
According to the labor force statistics for Jenkinsburg, out of the total population over 16 years of age (274), 55.8% or 153 individuals are in the labor force, with 4.6% or 7 of them unemployed. The age group with the highest labor force participation rate is 45 to 54 years, with 100.0% or 44 individuals in the labor force. Within the labor force, the 35 to 44 years age range has the highest percentage of unemployed individuals, with 17.1% or 7 of them being unemployed.
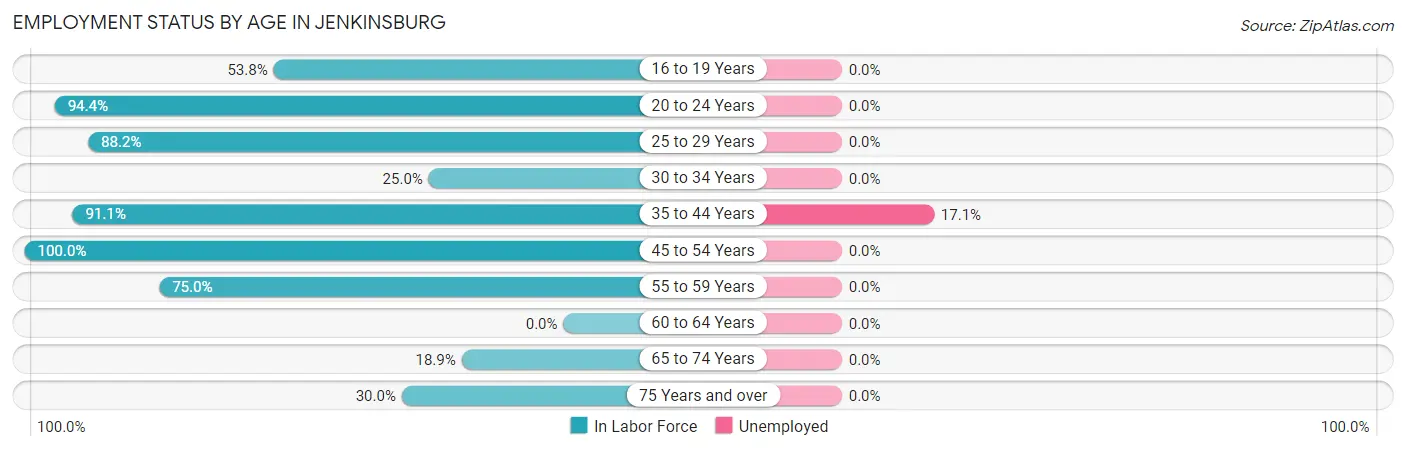
| Age Bracket | In Labor Force | Unemployed |
| 16 to 19 Years | 7 (53.8%) | 0 (0.0%) |
| 20 to 24 Years | 17 (94.4%) | 0 (0.0%) |
| 25 to 29 Years | 15 (88.2%) | 0 (0.0%) |
| 30 to 34 Years | 4 (25.0%) | 0 (0.0%) |
| 35 to 44 Years | 41 (91.1%) | 7 (17.1%) |
| 45 to 54 Years | 44 (100.0%) | 0 (0.0%) |
| 55 to 59 Years | 12 (75.0%) | 0 (0.0%) |
| 60 to 64 Years | 0 (0.0%) | 0 (0.0%) |
| 65 to 74 Years | 10 (18.9%) | 0 (0.0%) |
| 75 Years and over | 3 (30.0%) | 0 (0.0%) |
| Total | 153 (55.8%) | 7 (4.6%) |
Employment Status by Educational Attainment in Jenkinsburg
According to labor force statistics for Jenkinsburg, 64.4% of individuals (116) out of the total population between 25 and 64 years of age (180) are in the labor force, with 6.0% or 7 of them being unemployed. The group with the highest labor force participation rate are those with the educational attainment of high school diploma, with 83.9% or 52 individuals in the labor force. Within the labor force, individuals with high school diploma education have the highest percentage of unemployment, with 9.6% or 5 of them being unemployed.
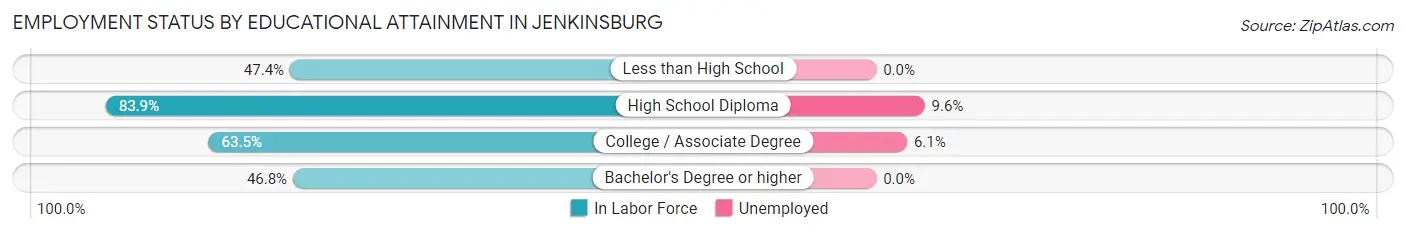
| Educational Attainment | In Labor Force | Unemployed |
| Less than High School | 9 (47.4%) | 0 (0.0%) |
| High School Diploma | 52 (83.9%) | 6 (9.6%) |
| College / Associate Degree | 33 (63.5%) | 3 (6.1%) |
| Bachelor's Degree or higher | 22 (46.8%) | 0 (0.0%) |
| Total | 116 (64.4%) | 11 (6.0%) |
Employment Occupations by Sex in Jenkinsburg
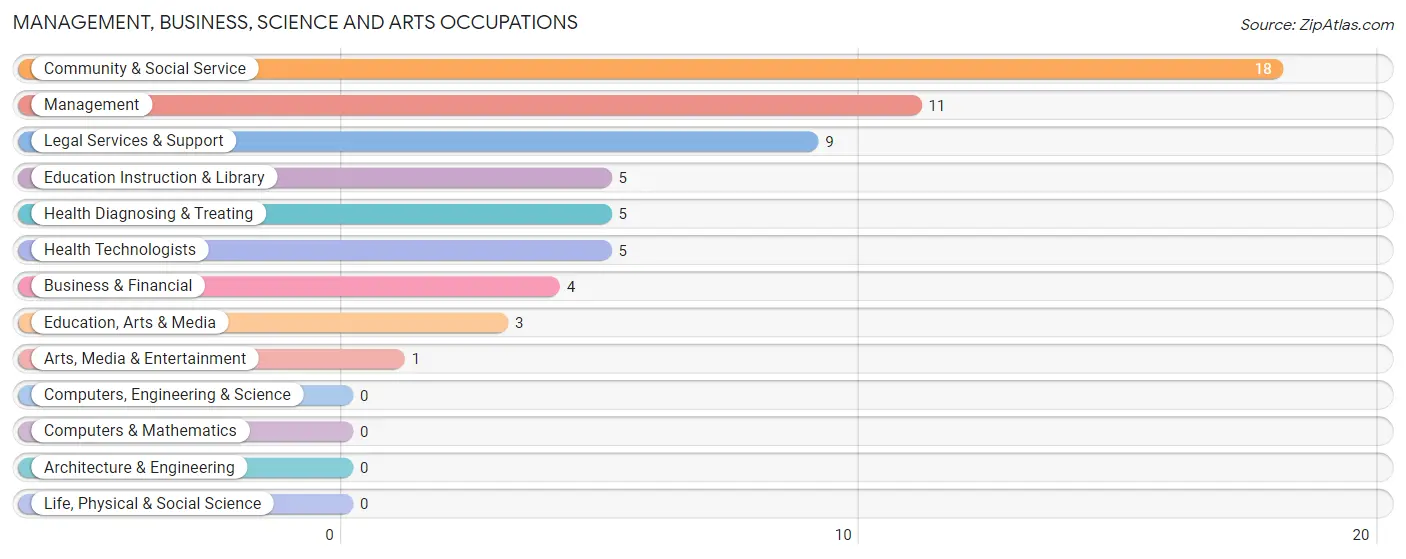
Management, Business, Science and Arts Occupations
The most common Management, Business, Science and Arts occupations in Jenkinsburg are Community & Social Service (18 | 12.3%), Management (11 | 7.5%), Legal Services & Support (9 | 6.2%), Education Instruction & Library (5 | 3.4%), and Health Diagnosing & Treating (5 | 3.4%).
Management, Business, Science and Arts Occupations by Sex
Within the Management, Business, Science and Arts occupations in Jenkinsburg, the most male-oriented occupations are Education, Arts & Media (100.0%), Arts, Media & Entertainment (100.0%), and Management (90.9%), while the most female-oriented occupations are Legal Services & Support (100.0%), Education Instruction & Library (100.0%), and Health Diagnosing & Treating (100.0%).
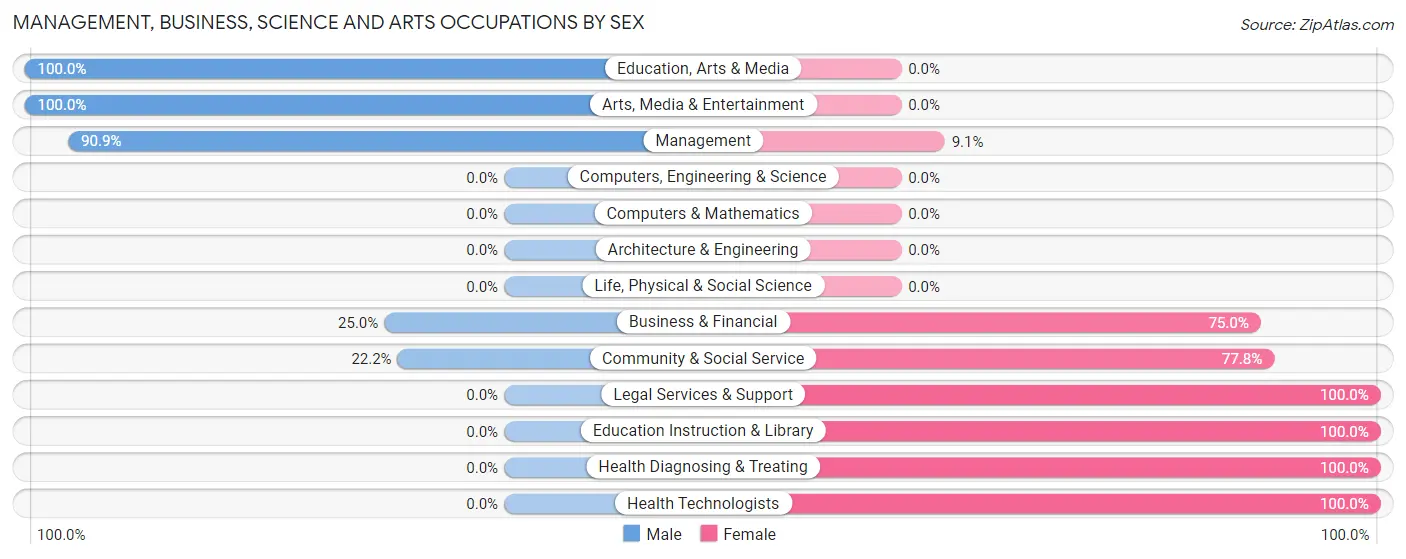
| Occupation | Male | Female |
| Management | 10 (90.9%) | 1 (9.1%) |
| Business & Financial | 1 (25.0%) | 3 (75.0%) |
| Computers, Engineering & Science | 0 (0.0%) | 0 (0.0%) |
| Computers & Mathematics | 0 (0.0%) | 0 (0.0%) |
| Architecture & Engineering | 0 (0.0%) | 0 (0.0%) |
| Life, Physical & Social Science | 0 (0.0%) | 0 (0.0%) |
| Community & Social Service | 4 (22.2%) | 14 (77.8%) |
| Education, Arts & Media | 3 (100.0%) | 0 (0.0%) |
| Legal Services & Support | 0 (0.0%) | 9 (100.0%) |
| Education Instruction & Library | 0 (0.0%) | 5 (100.0%) |
| Arts, Media & Entertainment | 1 (100.0%) | 0 (0.0%) |
| Health Diagnosing & Treating | 0 (0.0%) | 5 (100.0%) |
| Health Technologists | 0 (0.0%) | 5 (100.0%) |
| Total (Category) | 15 (39.5%) | 23 (60.5%) |
| Total (Overall) | 73 (50.0%) | 73 (50.0%) |
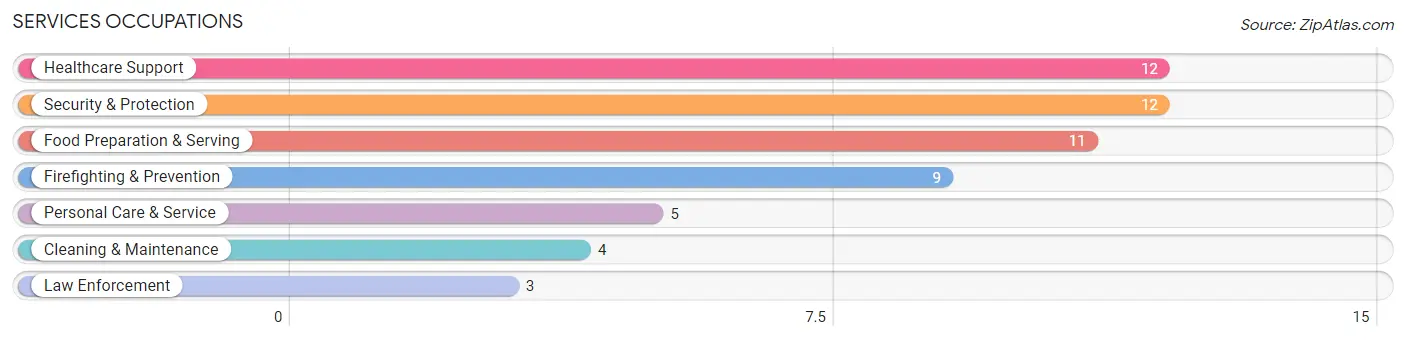
Services Occupations
The most common Services occupations in Jenkinsburg are Healthcare Support (12 | 8.2%), Security & Protection (12 | 8.2%), Food Preparation & Serving (11 | 7.5%), Firefighting & Prevention (9 | 6.2%), and Personal Care & Service (5 | 3.4%).
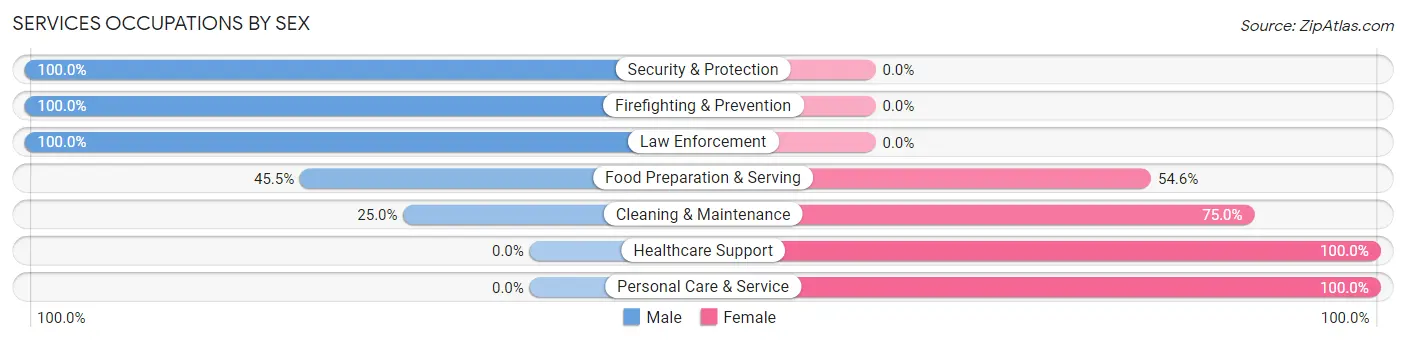
Services Occupations by Sex
Within the Services occupations in Jenkinsburg, the most male-oriented occupations are Security & Protection (100.0%), Firefighting & Prevention (100.0%), and Law Enforcement (100.0%), while the most female-oriented occupations are Healthcare Support (100.0%), Personal Care & Service (100.0%), and Cleaning & Maintenance (75.0%).
| Occupation | Male | Female |
| Healthcare Support | 0 (0.0%) | 12 (100.0%) |
| Security & Protection | 12 (100.0%) | 0 (0.0%) |
| Firefighting & Prevention | 9 (100.0%) | 0 (0.0%) |
| Law Enforcement | 3 (100.0%) | 0 (0.0%) |
| Food Preparation & Serving | 5 (45.5%) | 6 (54.5%) |
| Cleaning & Maintenance | 1 (25.0%) | 3 (75.0%) |
| Personal Care & Service | 0 (0.0%) | 5 (100.0%) |
| Total (Category) | 18 (40.9%) | 26 (59.1%) |
| Total (Overall) | 73 (50.0%) | 73 (50.0%) |
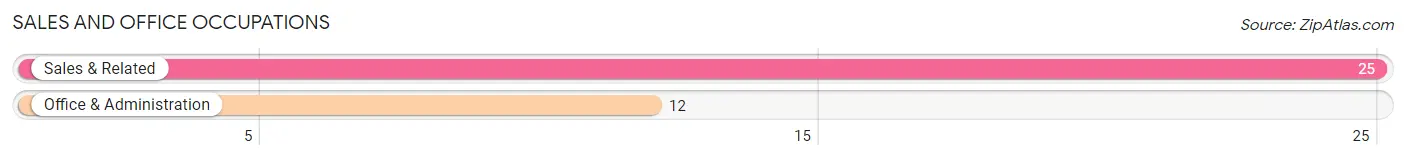
Sales and Office Occupations
The most common Sales and Office occupations in Jenkinsburg are Sales & Related (25 | 17.1%), and Office & Administration (12 | 8.2%).
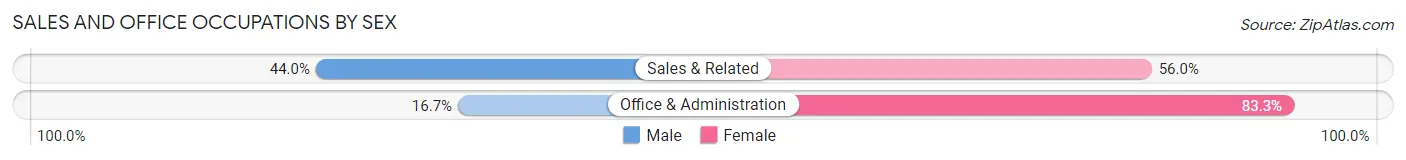
Sales and Office Occupations by Sex
| Occupation | Male | Female |
| Sales & Related | 11 (44.0%) | 14 (56.0%) |
| Office & Administration | 2 (16.7%) | 10 (83.3%) |
| Total (Category) | 13 (35.1%) | 24 (64.9%) |
| Total (Overall) | 73 (50.0%) | 73 (50.0%) |
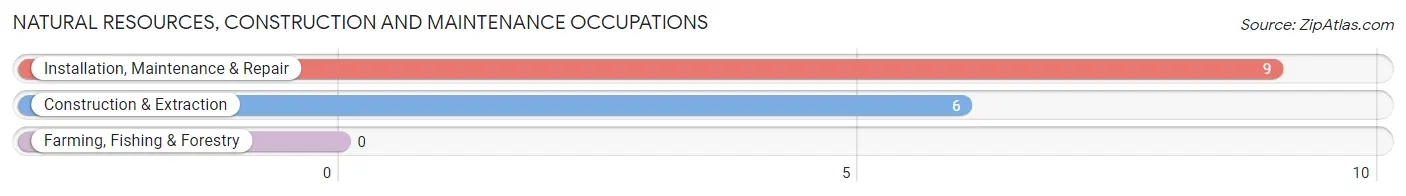
Natural Resources, Construction and Maintenance Occupations
The most common Natural Resources, Construction and Maintenance occupations in Jenkinsburg are Installation, Maintenance & Repair (9 | 6.2%), and Construction & Extraction (6 | 4.1%).
Natural Resources, Construction and Maintenance Occupations by Sex
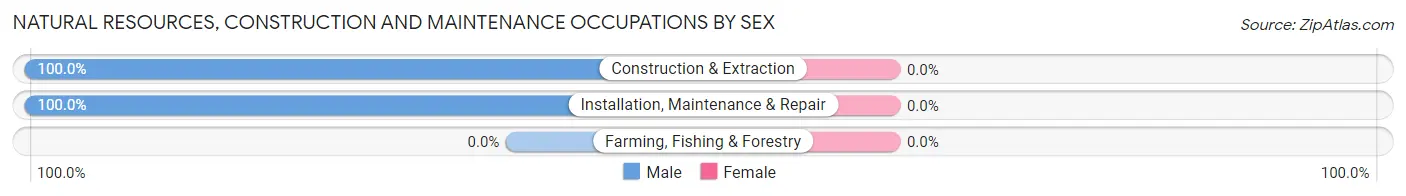
| Occupation | Male | Female |
| Farming, Fishing & Forestry | 0 (0.0%) | 0 (0.0%) |
| Construction & Extraction | 6 (100.0%) | 0 (0.0%) |
| Installation, Maintenance & Repair | 9 (100.0%) | 0 (0.0%) |
| Total (Category) | 15 (100.0%) | 0 (0.0%) |
| Total (Overall) | 73 (50.0%) | 73 (50.0%) |
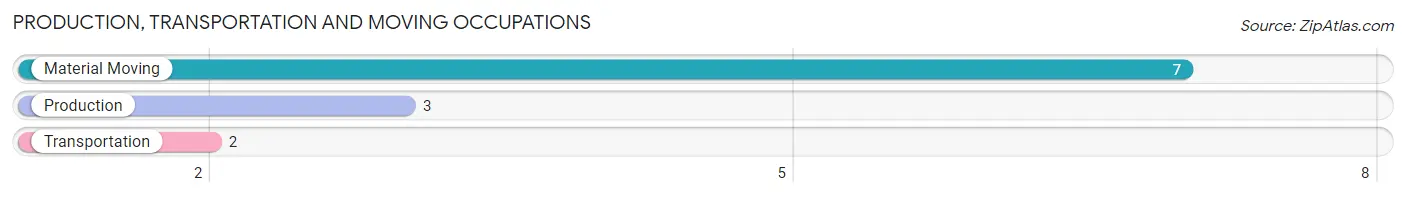
Production, Transportation and Moving Occupations
The most common Production, Transportation and Moving occupations in Jenkinsburg are Material Moving (7 | 4.8%), Production (3 | 2.1%), and Transportation (2 | 1.4%).
Production, Transportation and Moving Occupations by Sex
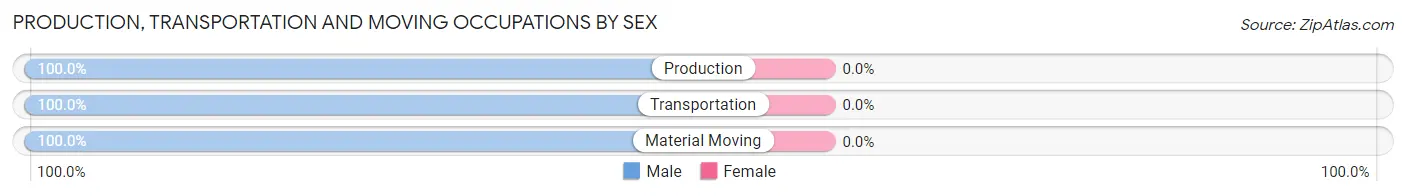
| Occupation | Male | Female |
| Production | 3 (100.0%) | 0 (0.0%) |
| Transportation | 2 (100.0%) | 0 (0.0%) |
| Material Moving | 7 (100.0%) | 0 (0.0%) |
| Total (Category) | 12 (100.0%) | 0 (0.0%) |
| Total (Overall) | 73 (50.0%) | 73 (50.0%) |
Employment Industries by Sex in Jenkinsburg
Employment Industries in Jenkinsburg
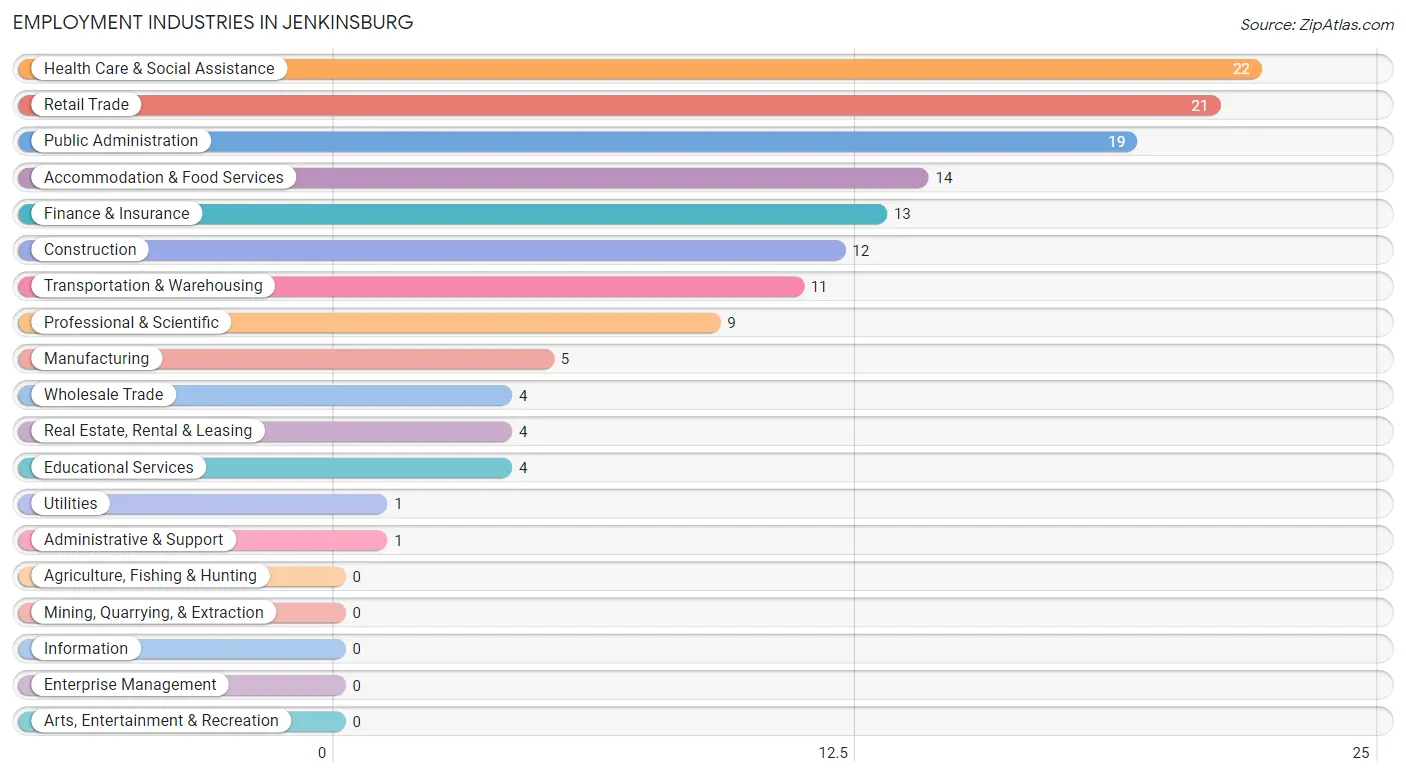
The major employment industries in Jenkinsburg include Health Care & Social Assistance (22 | 15.1%), Retail Trade (21 | 14.4%), Public Administration (19 | 13.0%), Accommodation & Food Services (14 | 9.6%), and Finance & Insurance (13 | 8.9%).
Employment Industries by Sex in Jenkinsburg
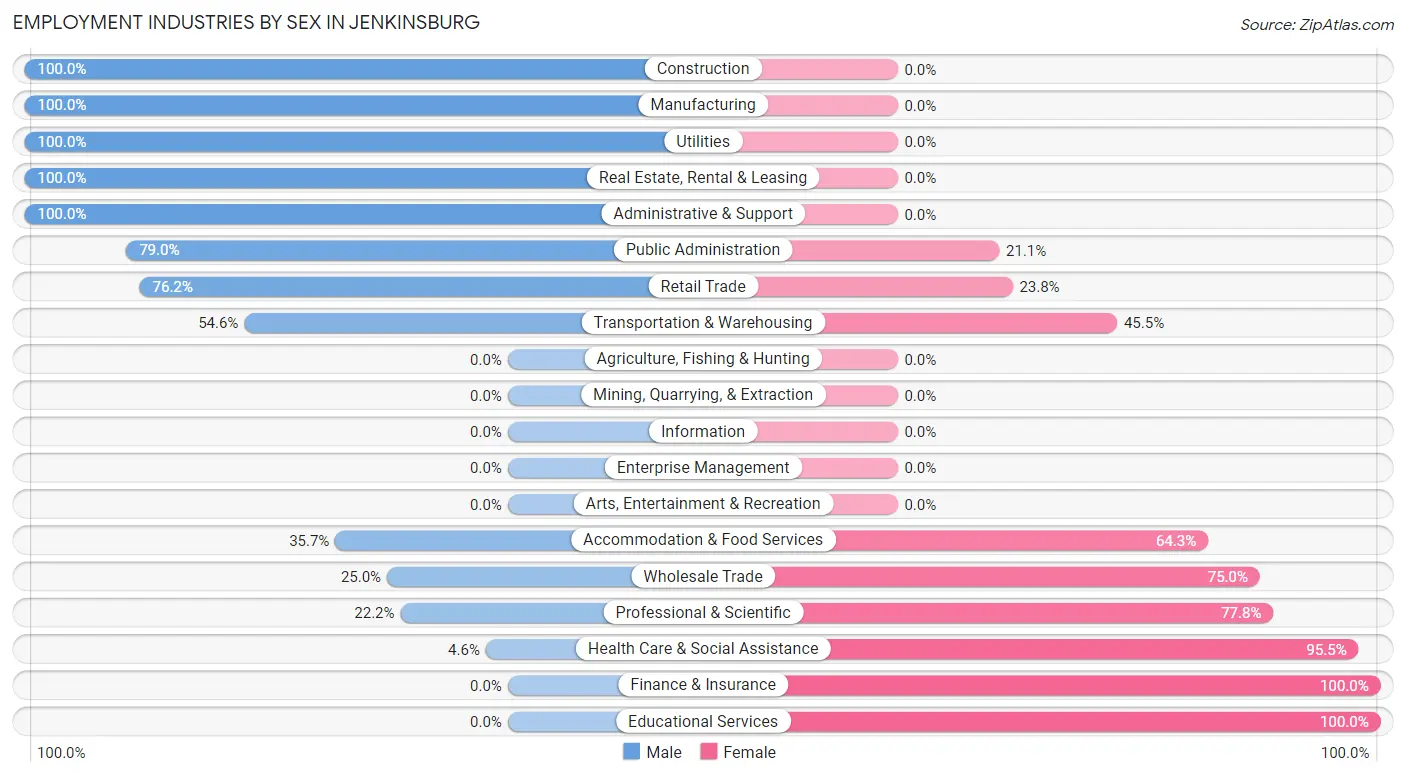
The Jenkinsburg industries that see more men than women are Construction (100.0%), Manufacturing (100.0%), and Utilities (100.0%), whereas the industries that tend to have a higher number of women are Finance & Insurance (100.0%), Educational Services (100.0%), and Health Care & Social Assistance (95.5%).
| Industry | Male | Female |
| Agriculture, Fishing & Hunting | 0 (0.0%) | 0 (0.0%) |
| Mining, Quarrying, & Extraction | 0 (0.0%) | 0 (0.0%) |
| Construction | 12 (100.0%) | 0 (0.0%) |
| Manufacturing | 5 (100.0%) | 0 (0.0%) |
| Wholesale Trade | 1 (25.0%) | 3 (75.0%) |
| Retail Trade | 16 (76.2%) | 5 (23.8%) |
| Transportation & Warehousing | 6 (54.5%) | 5 (45.5%) |
| Utilities | 1 (100.0%) | 0 (0.0%) |
| Information | 0 (0.0%) | 0 (0.0%) |
| Finance & Insurance | 0 (0.0%) | 13 (100.0%) |
| Real Estate, Rental & Leasing | 4 (100.0%) | 0 (0.0%) |
| Professional & Scientific | 2 (22.2%) | 7 (77.8%) |
| Enterprise Management | 0 (0.0%) | 0 (0.0%) |
| Administrative & Support | 1 (100.0%) | 0 (0.0%) |
| Educational Services | 0 (0.0%) | 4 (100.0%) |
| Health Care & Social Assistance | 1 (4.5%) | 21 (95.5%) |
| Arts, Entertainment & Recreation | 0 (0.0%) | 0 (0.0%) |
| Accommodation & Food Services | 5 (35.7%) | 9 (64.3%) |
| Public Administration | 15 (78.9%) | 4 (21.0%) |
| Total | 73 (50.0%) | 73 (50.0%) |
Education in Jenkinsburg
School Enrollment in Jenkinsburg
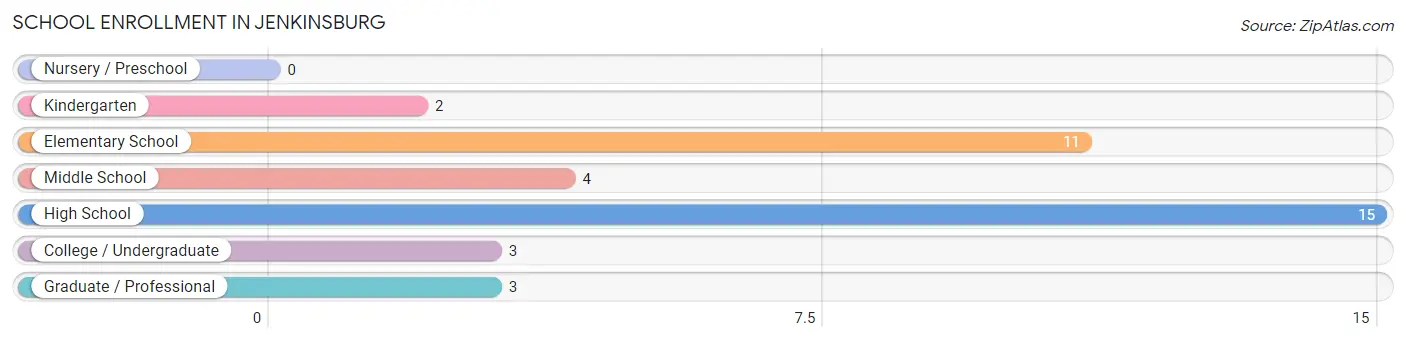
The most common levels of schooling among the 38 students in Jenkinsburg are high school (15 | 39.5%), elementary school (11 | 28.9%), and middle school (4 | 10.5%).
| School Level | # Students | % Students |
| Nursery / Preschool | 0 | 0.0% |
| Kindergarten | 2 | 5.3% |
| Elementary School | 11 | 28.9% |
| Middle School | 4 | 10.5% |
| High School | 15 | 39.5% |
| College / Undergraduate | 3 | 7.9% |
| Graduate / Professional | 3 | 7.9% |
| Total | 38 | 100.0% |
School Enrollment by Age by Funding Source in Jenkinsburg
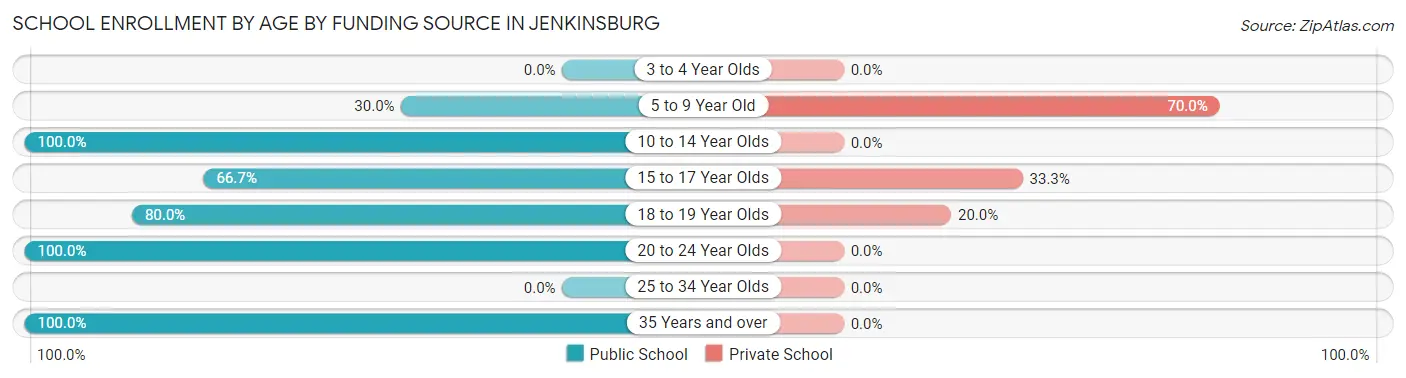
Out of a total of 38 students who are enrolled in schools in Jenkinsburg, 11 (28.9%) attend a private institution, while the remaining 27 (71.1%) are enrolled in public schools. The age group of 5 to 9 year old has the highest likelihood of being enrolled in private schools, with 7 (70.0% in the age bracket) enrolled. Conversely, the age group of 10 to 14 year olds has the lowest likelihood of being enrolled in a private school, with 8 (100.0% in the age bracket) attending a public institution.
| Age Bracket | Public School | Private School |
| 3 to 4 Year Olds | 0 (0.0%) | 0 (0.0%) |
| 5 to 9 Year Old | 3 (30.0%) | 7 (70.0%) |
| 10 to 14 Year Olds | 8 (100.0%) | 0 (0.0%) |
| 15 to 17 Year Olds | 6 (66.7%) | 3 (33.3%) |
| 18 to 19 Year Olds | 4 (80.0%) | 1 (20.0%) |
| 20 to 24 Year Olds | 3 (100.0%) | 0 (0.0%) |
| 25 to 34 Year Olds | 0 (0.0%) | 0 (0.0%) |
| 35 Years and over | 3 (100.0%) | 0 (0.0%) |
| Total | 27 (71.1%) | 11 (28.9%) |
Educational Attainment by Field of Study in Jenkinsburg
Business (30 | 48.4%), science & technology (10 | 16.1%), bio, nature & agricultural (8 | 12.9%), education (6 | 9.7%), and liberal arts & history (3 | 4.8%) are the most common fields of study among 62 individuals in Jenkinsburg who have obtained a bachelor's degree or higher.
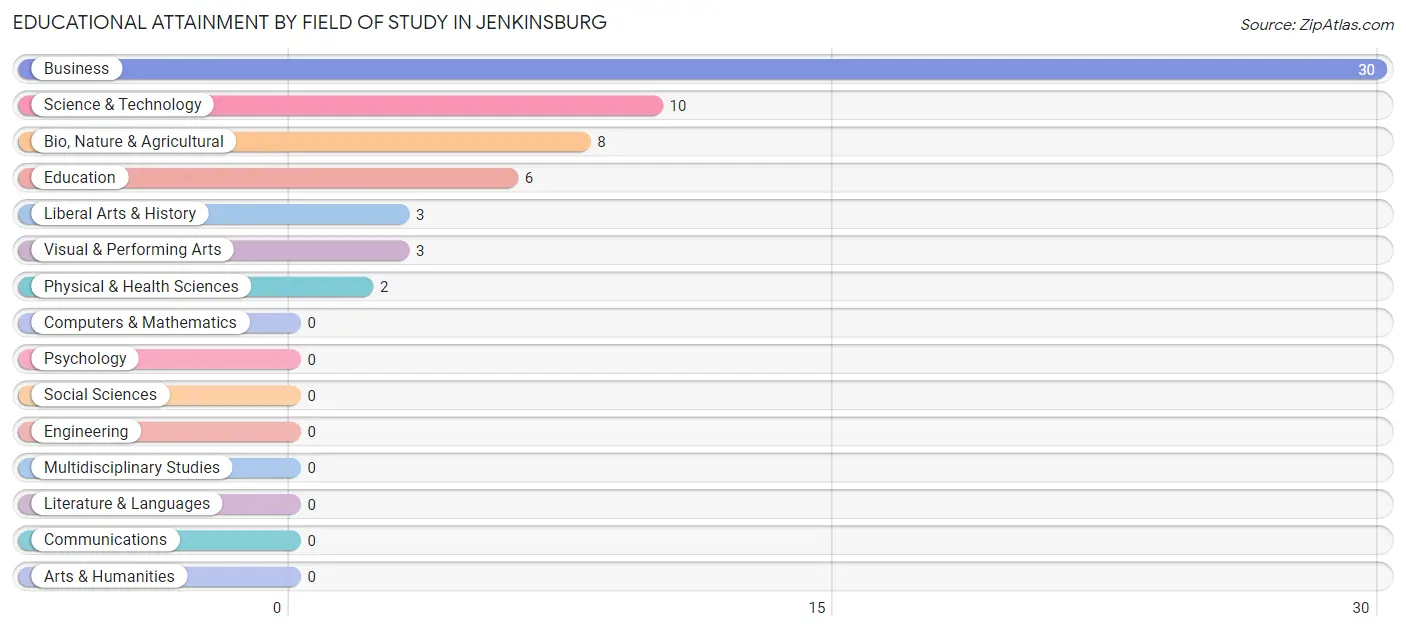
| Field of Study | # Graduates | % Graduates |
| Computers & Mathematics | 0 | 0.0% |
| Bio, Nature & Agricultural | 8 | 12.9% |
| Physical & Health Sciences | 2 | 3.2% |
| Psychology | 0 | 0.0% |
| Social Sciences | 0 | 0.0% |
| Engineering | 0 | 0.0% |
| Multidisciplinary Studies | 0 | 0.0% |
| Science & Technology | 10 | 16.1% |
| Business | 30 | 48.4% |
| Education | 6 | 9.7% |
| Literature & Languages | 0 | 0.0% |
| Liberal Arts & History | 3 | 4.8% |
| Visual & Performing Arts | 3 | 4.8% |
| Communications | 0 | 0.0% |
| Arts & Humanities | 0 | 0.0% |
| Total | 62 | 100.0% |
Transportation & Commute in Jenkinsburg
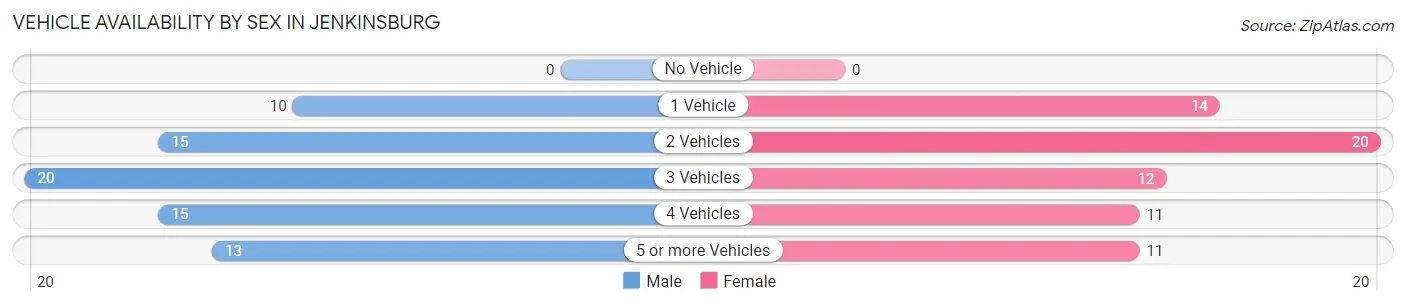
Vehicle Availability by Sex in Jenkinsburg
The most prevalent vehicle ownership categories in Jenkinsburg are males with 3 vehicles (20, accounting for 27.4%) and females with 3 vehicles (12, making up 29.4%).
| Vehicles Available | Male | Female |
| No Vehicle | 0 (0.0%) | 0 (0.0%) |
| 1 Vehicle | 10 (13.7%) | 14 (20.6%) |
| 2 Vehicles | 15 (20.5%) | 20 (29.4%) |
| 3 Vehicles | 20 (27.4%) | 12 (17.6%) |
| 4 Vehicles | 15 (20.5%) | 11 (16.2%) |
| 5 or more Vehicles | 13 (17.8%) | 11 (16.2%) |
| Total | 73 (100.0%) | 68 (100.0%) |
Commute Time in Jenkinsburg
The most frequently occuring commute durations in Jenkinsburg are 60 to 89 minutes (28 commuters, 20.4%), 40 to 44 minutes (24 commuters, 17.5%), and 10 to 14 minutes (19 commuters, 13.9%).
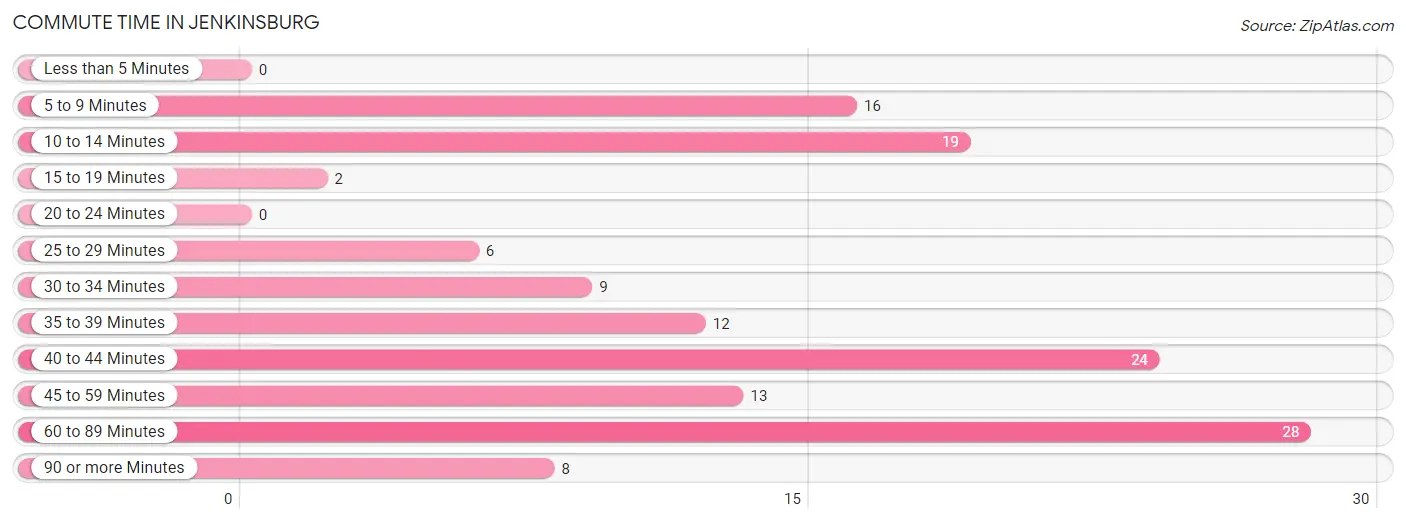
| Commute Time | # Commuters | % Commuters |
| Less than 5 Minutes | 0 | 0.0% |
| 5 to 9 Minutes | 16 | 11.7% |
| 10 to 14 Minutes | 19 | 13.9% |
| 15 to 19 Minutes | 2 | 1.5% |
| 20 to 24 Minutes | 0 | 0.0% |
| 25 to 29 Minutes | 6 | 4.4% |
| 30 to 34 Minutes | 9 | 6.6% |
| 35 to 39 Minutes | 12 | 8.8% |
| 40 to 44 Minutes | 24 | 17.5% |
| 45 to 59 Minutes | 13 | 9.5% |
| 60 to 89 Minutes | 28 | 20.4% |
| 90 or more Minutes | 8 | 5.8% |
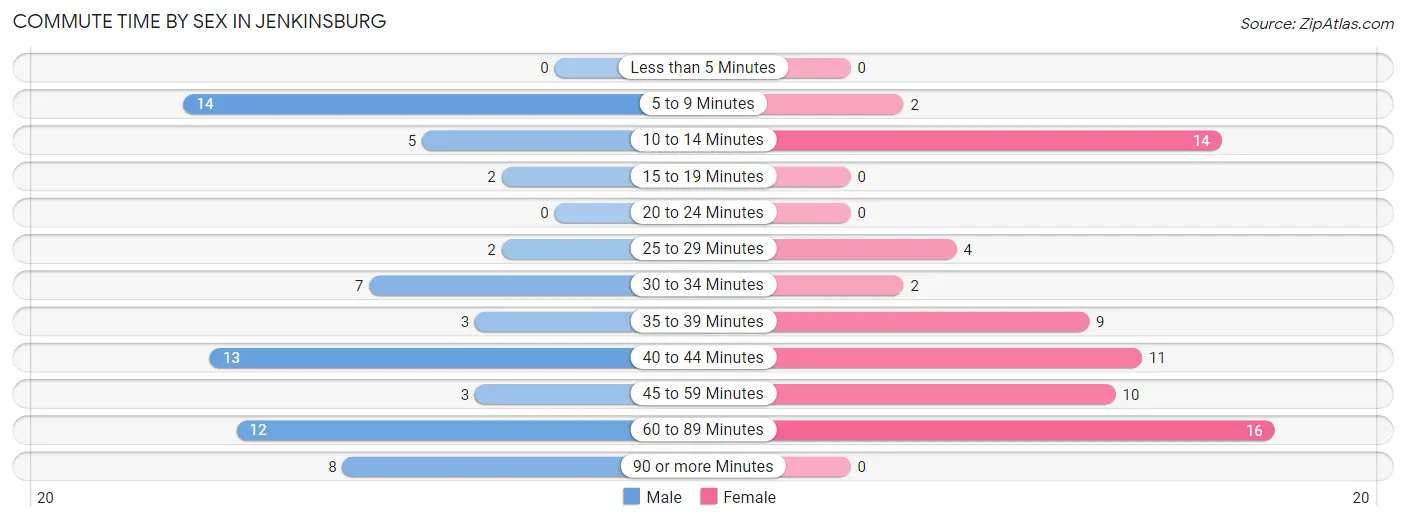
Commute Time by Sex in Jenkinsburg
The most common commute times in Jenkinsburg are 5 to 9 minutes (14 commuters, 20.3%) for males and 60 to 89 minutes (16 commuters, 23.5%) for females.
| Commute Time | Male | Female |
| Less than 5 Minutes | 0 (0.0%) | 0 (0.0%) |
| 5 to 9 Minutes | 14 (20.3%) | 2 (2.9%) |
| 10 to 14 Minutes | 5 (7.2%) | 14 (20.6%) |
| 15 to 19 Minutes | 2 (2.9%) | 0 (0.0%) |
| 20 to 24 Minutes | 0 (0.0%) | 0 (0.0%) |
| 25 to 29 Minutes | 2 (2.9%) | 4 (5.9%) |
| 30 to 34 Minutes | 7 (10.1%) | 2 (2.9%) |
| 35 to 39 Minutes | 3 (4.3%) | 9 (13.2%) |
| 40 to 44 Minutes | 13 (18.8%) | 11 (16.2%) |
| 45 to 59 Minutes | 3 (4.3%) | 10 (14.7%) |
| 60 to 89 Minutes | 12 (17.4%) | 16 (23.5%) |
| 90 or more Minutes | 8 (11.6%) | 0 (0.0%) |
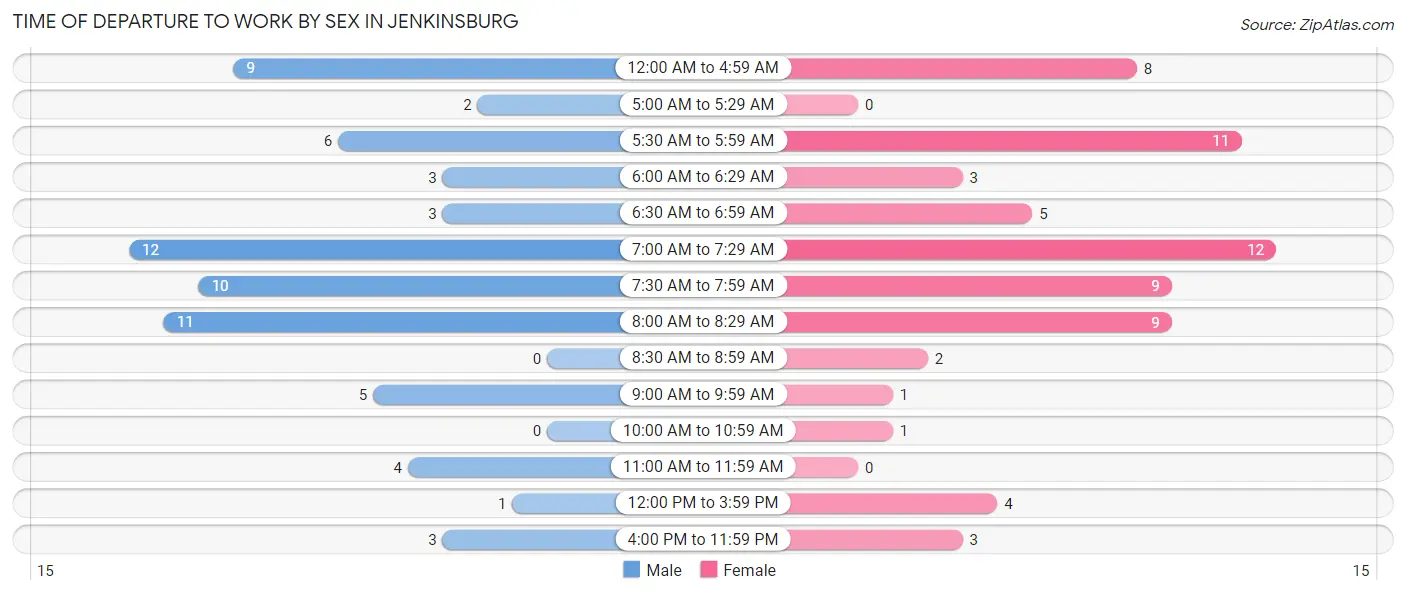
Time of Departure to Work by Sex in Jenkinsburg
The most frequent times of departure to work in Jenkinsburg are 7:00 AM to 7:29 AM (12, 17.4%) for males and 7:00 AM to 7:29 AM (12, 17.6%) for females.
| Time of Departure | Male | Female |
| 12:00 AM to 4:59 AM | 9 (13.0%) | 8 (11.8%) |
| 5:00 AM to 5:29 AM | 2 (2.9%) | 0 (0.0%) |
| 5:30 AM to 5:59 AM | 6 (8.7%) | 11 (16.2%) |
| 6:00 AM to 6:29 AM | 3 (4.3%) | 3 (4.4%) |
| 6:30 AM to 6:59 AM | 3 (4.3%) | 5 (7.3%) |
| 7:00 AM to 7:29 AM | 12 (17.4%) | 12 (17.6%) |
| 7:30 AM to 7:59 AM | 10 (14.5%) | 9 (13.2%) |
| 8:00 AM to 8:29 AM | 11 (15.9%) | 9 (13.2%) |
| 8:30 AM to 8:59 AM | 0 (0.0%) | 2 (2.9%) |
| 9:00 AM to 9:59 AM | 5 (7.2%) | 1 (1.5%) |
| 10:00 AM to 10:59 AM | 0 (0.0%) | 1 (1.5%) |
| 11:00 AM to 11:59 AM | 4 (5.8%) | 0 (0.0%) |
| 12:00 PM to 3:59 PM | 1 (1.5%) | 4 (5.9%) |
| 4:00 PM to 11:59 PM | 3 (4.3%) | 3 (4.4%) |
| Total | 69 (100.0%) | 68 (100.0%) |
Housing Occupancy in Jenkinsburg
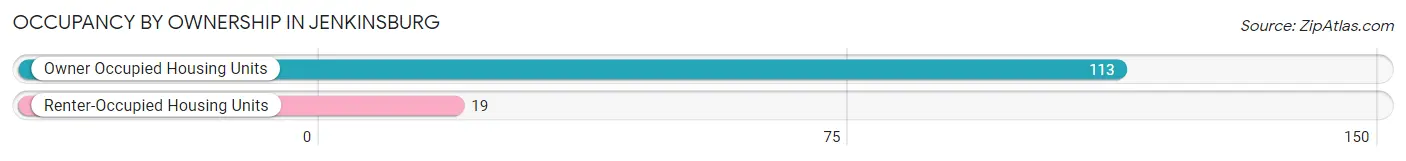
Occupancy by Ownership in Jenkinsburg
Of the total 132 dwellings in Jenkinsburg, owner-occupied units account for 113 (85.6%), while renter-occupied units make up 19 (14.4%).
| Occupancy | # Housing Units | % Housing Units |
| Owner Occupied Housing Units | 113 | 85.6% |
| Renter-Occupied Housing Units | 19 | 14.4% |
| Total Occupied Housing Units | 132 | 100.0% |
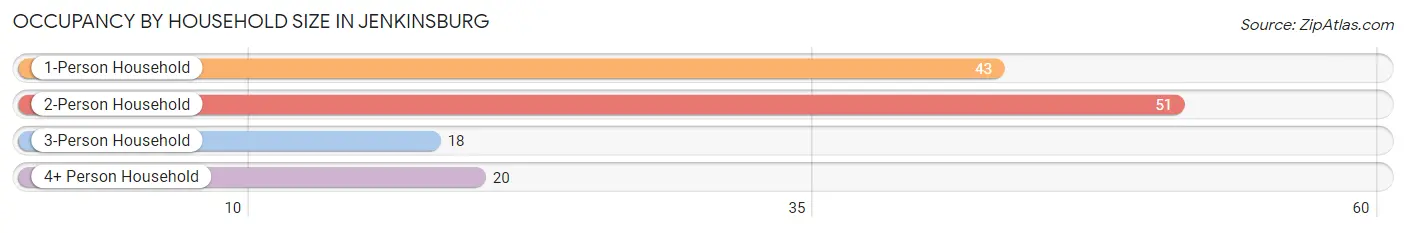
Occupancy by Household Size in Jenkinsburg
| Household Size | # Housing Units | % Housing Units |
| 1-Person Household | 43 | 32.6% |
| 2-Person Household | 51 | 38.6% |
| 3-Person Household | 18 | 13.6% |
| 4+ Person Household | 20 | 15.1% |
| Total Housing Units | 132 | 100.0% |
Occupancy by Ownership by Household Size in Jenkinsburg
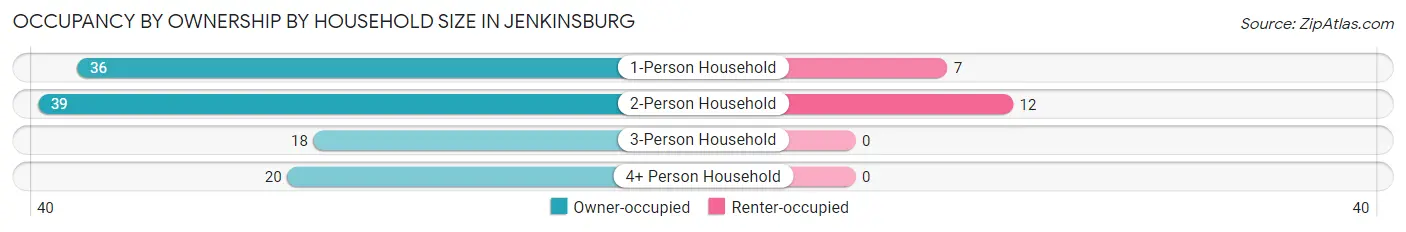
| Household Size | Owner-occupied | Renter-occupied |
| 1-Person Household | 36 (83.7%) | 7 (16.3%) |
| 2-Person Household | 39 (76.5%) | 12 (23.5%) |
| 3-Person Household | 18 (100.0%) | 0 (0.0%) |
| 4+ Person Household | 20 (100.0%) | 0 (0.0%) |
| Total Housing Units | 113 (85.6%) | 19 (14.4%) |
Occupancy by Educational Attainment in Jenkinsburg
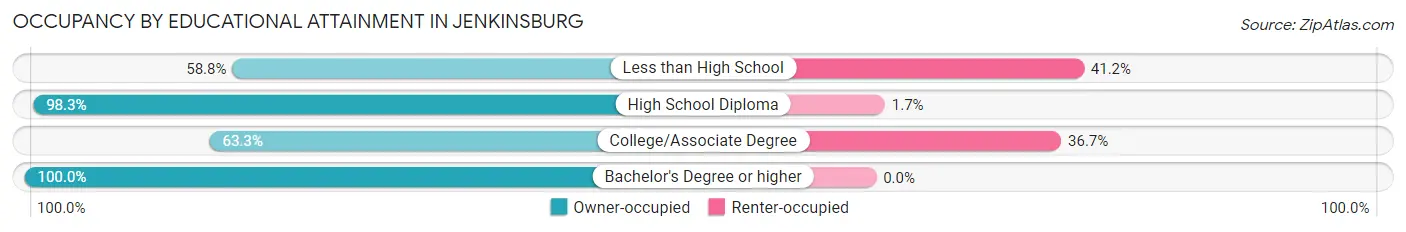
| Household Size | Owner-occupied | Renter-occupied |
| Less than High School | 10 (58.8%) | 7 (41.2%) |
| High School Diploma | 57 (98.3%) | 1 (1.7%) |
| College/Associate Degree | 19 (63.3%) | 11 (36.7%) |
| Bachelor's Degree or higher | 27 (100.0%) | 0 (0.0%) |
Occupancy by Age of Householder in Jenkinsburg
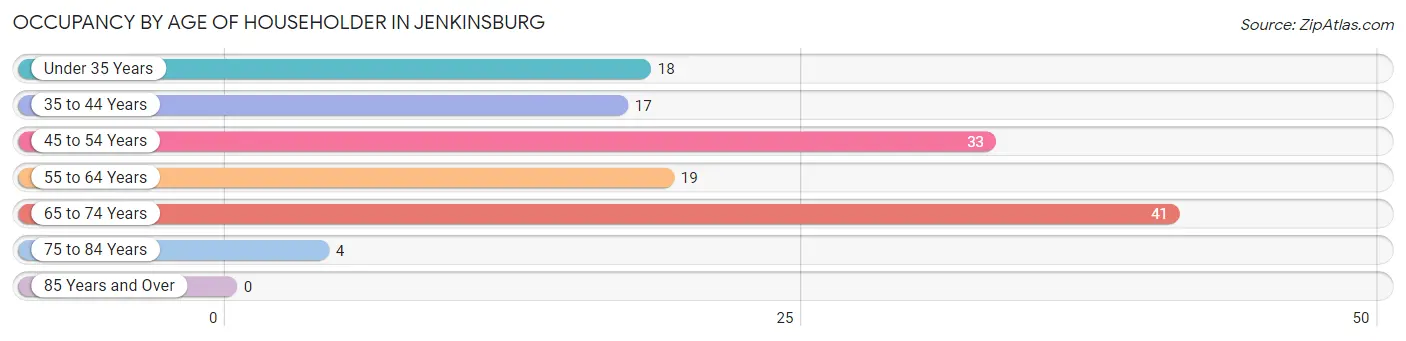
| Age Bracket | # Households | % Households |
| Under 35 Years | 18 | 13.6% |
| 35 to 44 Years | 17 | 12.9% |
| 45 to 54 Years | 33 | 25.0% |
| 55 to 64 Years | 19 | 14.4% |
| 65 to 74 Years | 41 | 31.1% |
| 75 to 84 Years | 4 | 3.0% |
| 85 Years and Over | 0 | 0.0% |
| Total | 132 | 100.0% |
Housing Finances in Jenkinsburg
Median Income by Occupancy in Jenkinsburg
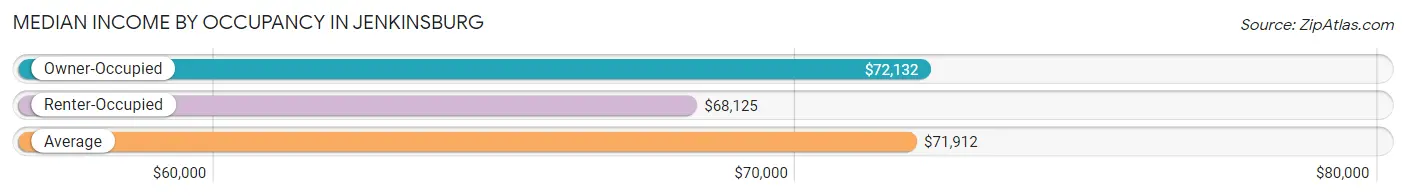
| Occupancy Type | # Households | Median Income |
| Owner-Occupied | 113 (85.6%) | $72,132 |
| Renter-Occupied | 19 (14.4%) | $68,125 |
| Average | 132 (100.0%) | $71,912 |
Occupancy by Householder Income Bracket in Jenkinsburg
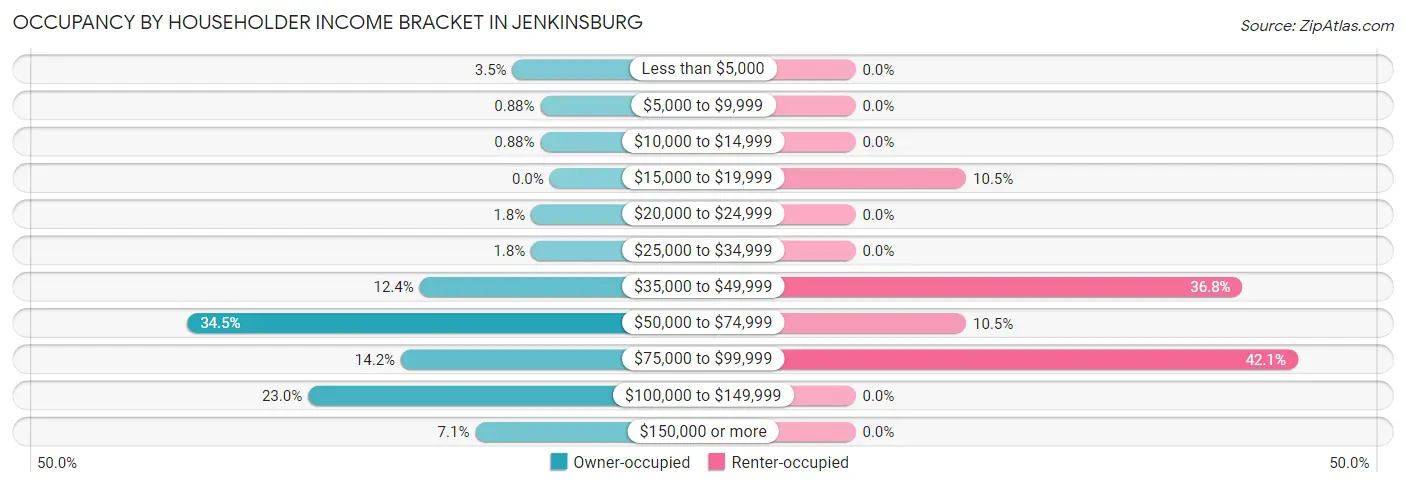
| Income Bracket | Owner-occupied | Renter-occupied |
| Less than $5,000 | 4 (3.5%) | 0 (0.0%) |
| $5,000 to $9,999 | 1 (0.9%) | 0 (0.0%) |
| $10,000 to $14,999 | 1 (0.9%) | 0 (0.0%) |
| $15,000 to $19,999 | 0 (0.0%) | 2 (10.5%) |
| $20,000 to $24,999 | 2 (1.8%) | 0 (0.0%) |
| $25,000 to $34,999 | 2 (1.8%) | 0 (0.0%) |
| $35,000 to $49,999 | 14 (12.4%) | 7 (36.8%) |
| $50,000 to $74,999 | 39 (34.5%) | 2 (10.5%) |
| $75,000 to $99,999 | 16 (14.2%) | 8 (42.1%) |
| $100,000 to $149,999 | 26 (23.0%) | 0 (0.0%) |
| $150,000 or more | 8 (7.1%) | 0 (0.0%) |
| Total | 113 (100.0%) | 19 (100.0%) |
Monthly Housing Cost Tiers in Jenkinsburg
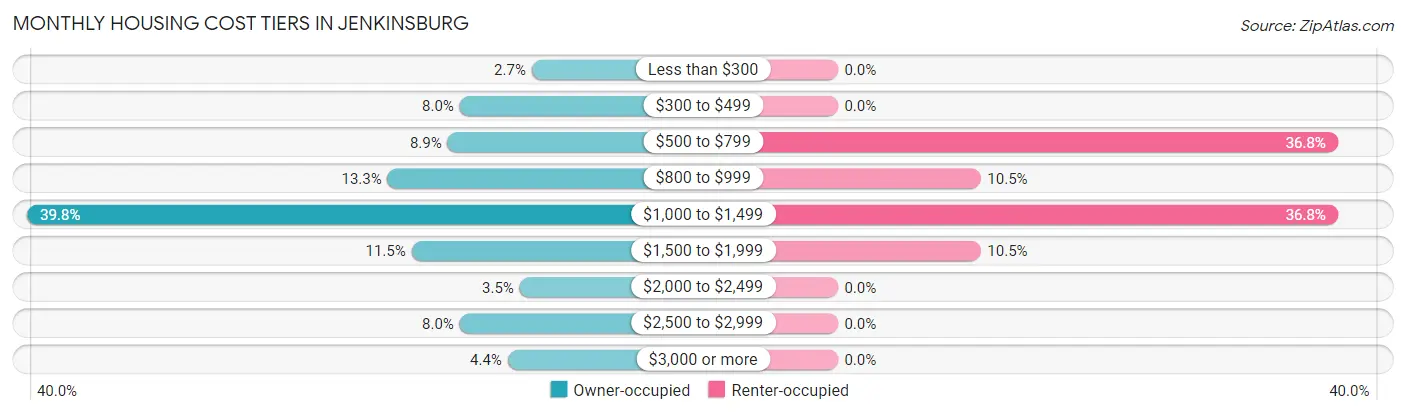
| Monthly Cost | Owner-occupied | Renter-occupied |
| Less than $300 | 3 (2.6%) | 0 (0.0%) |
| $300 to $499 | 9 (8.0%) | 0 (0.0%) |
| $500 to $799 | 10 (8.8%) | 7 (36.8%) |
| $800 to $999 | 15 (13.3%) | 2 (10.5%) |
| $1,000 to $1,499 | 45 (39.8%) | 7 (36.8%) |
| $1,500 to $1,999 | 13 (11.5%) | 2 (10.5%) |
| $2,000 to $2,499 | 4 (3.5%) | 0 (0.0%) |
| $2,500 to $2,999 | 9 (8.0%) | 0 (0.0%) |
| $3,000 or more | 5 (4.4%) | 0 (0.0%) |
| Total | 113 (100.0%) | 19 (100.0%) |
Physical Housing Characteristics in Jenkinsburg
Housing Structures in Jenkinsburg
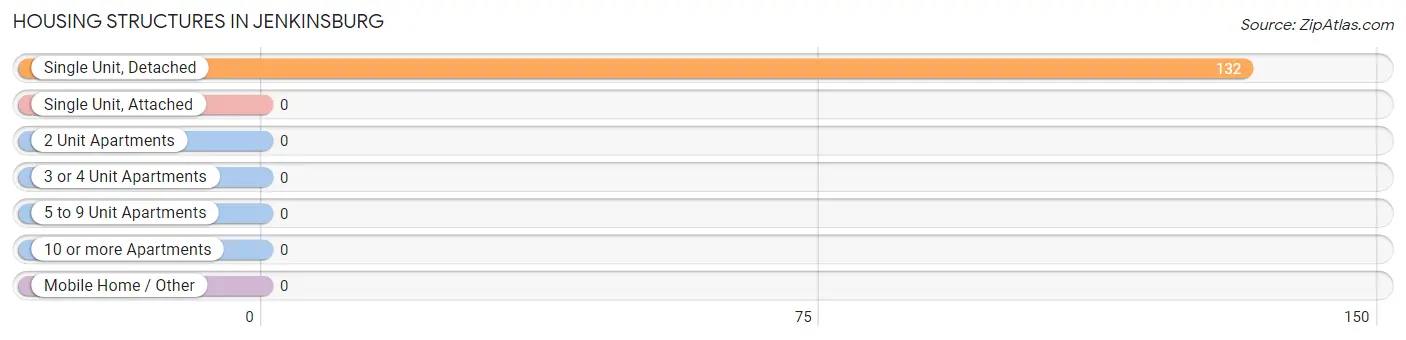
| Structure Type | # Housing Units | % Housing Units |
| Single Unit, Detached | 132 | 100.0% |
| Single Unit, Attached | 0 | 0.0% |
| 2 Unit Apartments | 0 | 0.0% |
| 3 or 4 Unit Apartments | 0 | 0.0% |
| 5 to 9 Unit Apartments | 0 | 0.0% |
| 10 or more Apartments | 0 | 0.0% |
| Mobile Home / Other | 0 | 0.0% |
| Total | 132 | 100.0% |
Housing Structures by Occupancy in Jenkinsburg
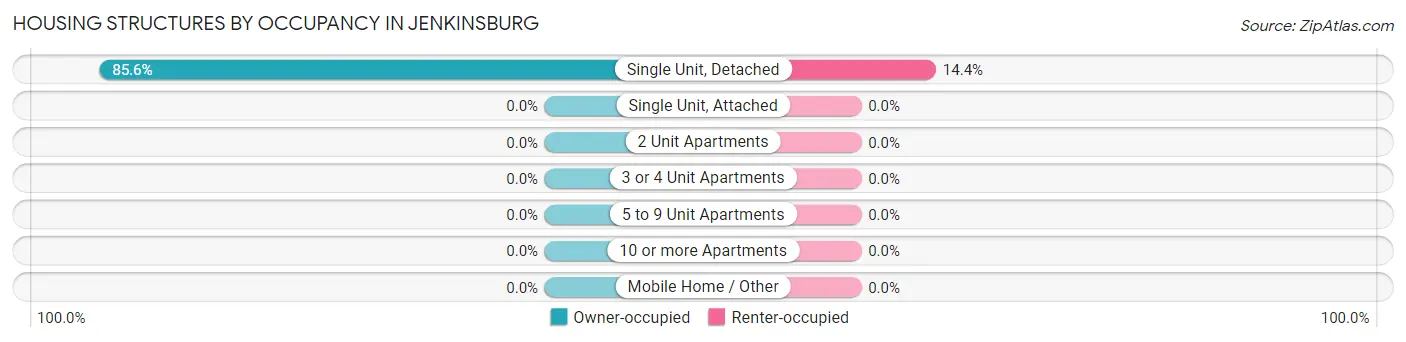
| Structure Type | Owner-occupied | Renter-occupied |
| Single Unit, Detached | 113 (85.6%) | 19 (14.4%) |
| Single Unit, Attached | 0 (0.0%) | 0 (0.0%) |
| 2 Unit Apartments | 0 (0.0%) | 0 (0.0%) |
| 3 or 4 Unit Apartments | 0 (0.0%) | 0 (0.0%) |
| 5 to 9 Unit Apartments | 0 (0.0%) | 0 (0.0%) |
| 10 or more Apartments | 0 (0.0%) | 0 (0.0%) |
| Mobile Home / Other | 0 (0.0%) | 0 (0.0%) |
| Total | 113 (85.6%) | 19 (14.4%) |
Housing Structures by Number of Rooms in Jenkinsburg
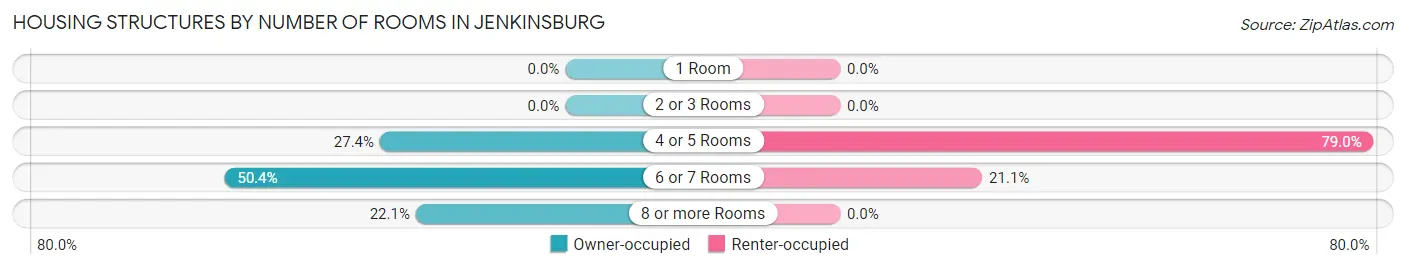
| Number of Rooms | Owner-occupied | Renter-occupied |
| 1 Room | 0 (0.0%) | 0 (0.0%) |
| 2 or 3 Rooms | 0 (0.0%) | 0 (0.0%) |
| 4 or 5 Rooms | 31 (27.4%) | 15 (78.9%) |
| 6 or 7 Rooms | 57 (50.4%) | 4 (21.0%) |
| 8 or more Rooms | 25 (22.1%) | 0 (0.0%) |
| Total | 113 (100.0%) | 19 (100.0%) |
Housing Structure by Heating Type in Jenkinsburg
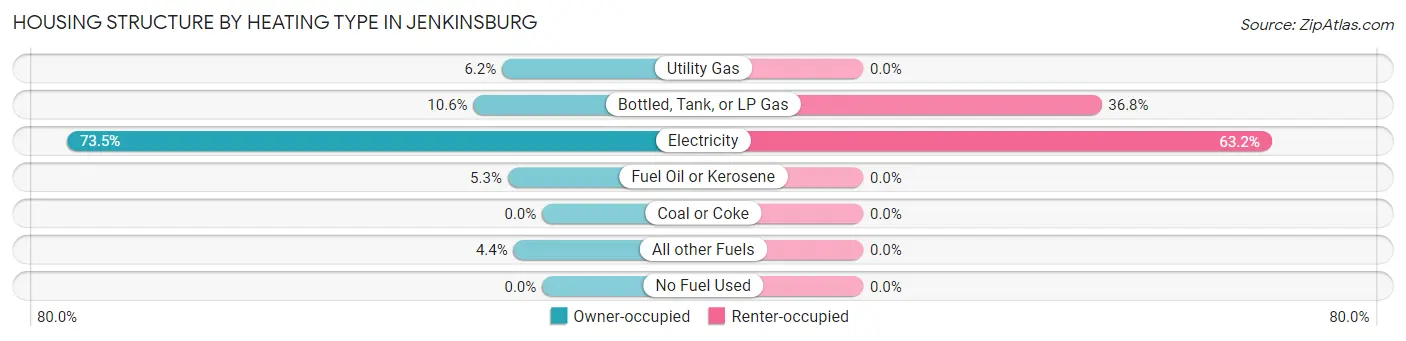
| Heating Type | Owner-occupied | Renter-occupied |
| Utility Gas | 7 (6.2%) | 0 (0.0%) |
| Bottled, Tank, or LP Gas | 12 (10.6%) | 7 (36.8%) |
| Electricity | 83 (73.5%) | 12 (63.2%) |
| Fuel Oil or Kerosene | 6 (5.3%) | 0 (0.0%) |
| Coal or Coke | 0 (0.0%) | 0 (0.0%) |
| All other Fuels | 5 (4.4%) | 0 (0.0%) |
| No Fuel Used | 0 (0.0%) | 0 (0.0%) |
| Total | 113 (100.0%) | 19 (100.0%) |
Household Vehicle Usage in Jenkinsburg
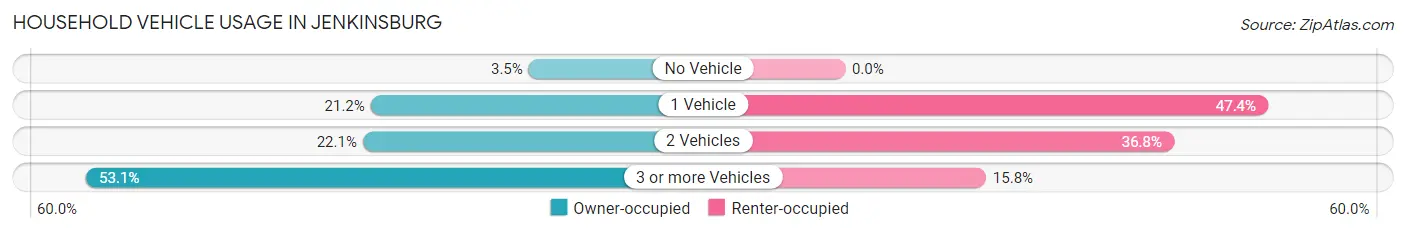
| Vehicles per Household | Owner-occupied | Renter-occupied |
| No Vehicle | 4 (3.5%) | 0 (0.0%) |
| 1 Vehicle | 24 (21.2%) | 9 (47.4%) |
| 2 Vehicles | 25 (22.1%) | 7 (36.8%) |
| 3 or more Vehicles | 60 (53.1%) | 3 (15.8%) |
| Total | 113 (100.0%) | 19 (100.0%) |
Real Estate & Mortgages in Jenkinsburg
Real Estate and Mortgage Overview in Jenkinsburg
| Characteristic | Without Mortgage | With Mortgage |
| Housing Units | 22 | 91 |
| Median Property Value | $150,000 | $201,000 |
| Median Household Income | $103,750 | $8 |
| Monthly Housing Costs | $480 | $5 |
| Real Estate Taxes | $1,450 | $3 |
Property Value by Mortgage Status in Jenkinsburg
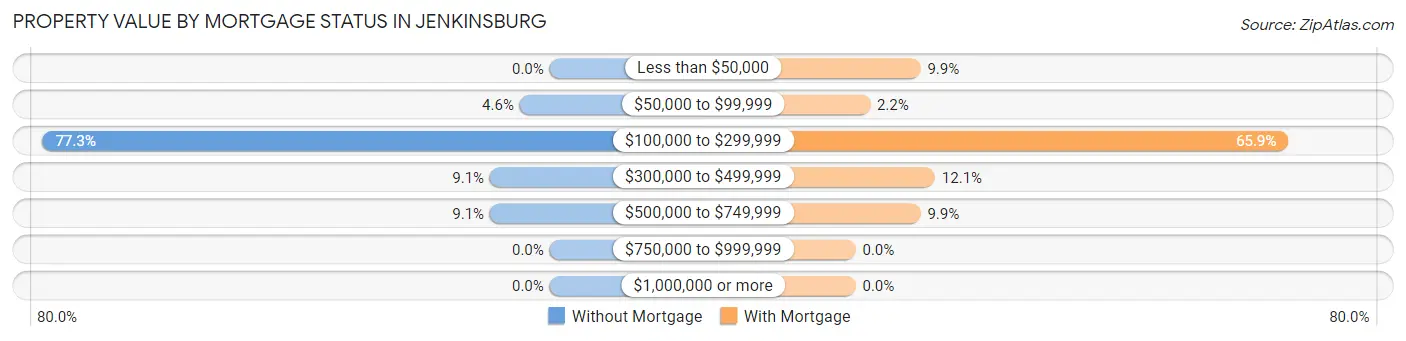
| Property Value | Without Mortgage | With Mortgage |
| Less than $50,000 | 0 (0.0%) | 9 (9.9%) |
| $50,000 to $99,999 | 1 (4.5%) | 2 (2.2%) |
| $100,000 to $299,999 | 17 (77.3%) | 60 (65.9%) |
| $300,000 to $499,999 | 2 (9.1%) | 11 (12.1%) |
| $500,000 to $749,999 | 2 (9.1%) | 9 (9.9%) |
| $750,000 to $999,999 | 0 (0.0%) | 0 (0.0%) |
| $1,000,000 or more | 0 (0.0%) | 0 (0.0%) |
| Total | 22 (100.0%) | 91 (100.0%) |
Household Income by Mortgage Status in Jenkinsburg
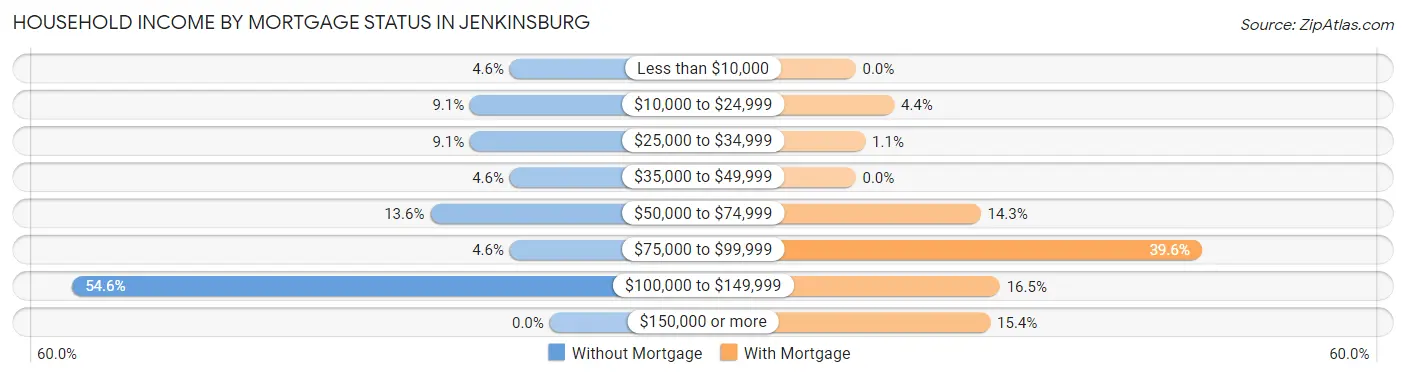
| Household Income | Without Mortgage | With Mortgage |
| Less than $10,000 | 1 (4.5%) | 0 (0.0%) |
| $10,000 to $24,999 | 2 (9.1%) | 4 (4.4%) |
| $25,000 to $34,999 | 2 (9.1%) | 1 (1.1%) |
| $35,000 to $49,999 | 1 (4.5%) | 0 (0.0%) |
| $50,000 to $74,999 | 3 (13.6%) | 13 (14.3%) |
| $75,000 to $99,999 | 1 (4.5%) | 36 (39.6%) |
| $100,000 to $149,999 | 12 (54.5%) | 15 (16.5%) |
| $150,000 or more | 0 (0.0%) | 14 (15.4%) |
| Total | 22 (100.0%) | 91 (100.0%) |
Property Value to Household Income Ratio in Jenkinsburg
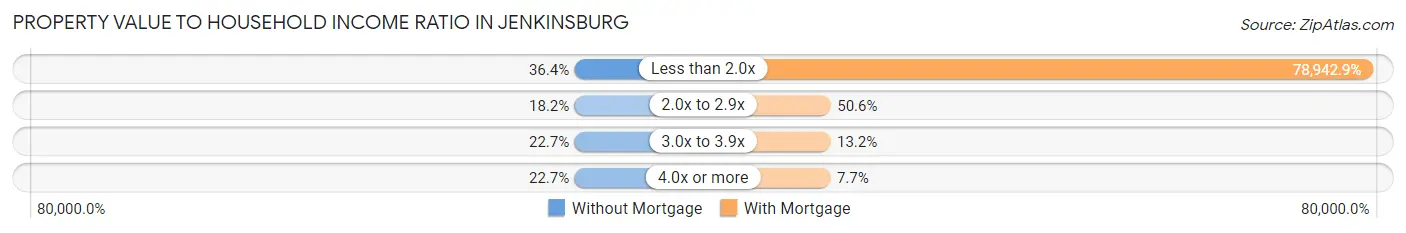
| Value-to-Income Ratio | Without Mortgage | With Mortgage |
| Less than 2.0x | 8 (36.4%) | 71,838 (78,942.9%) |
| 2.0x to 2.9x | 4 (18.2%) | 46 (50.5%) |
| 3.0x to 3.9x | 5 (22.7%) | 12 (13.2%) |
| 4.0x or more | 5 (22.7%) | 7 (7.7%) |
| Total | 22 (100.0%) | 91 (100.0%) |
Real Estate Taxes by Mortgage Status in Jenkinsburg
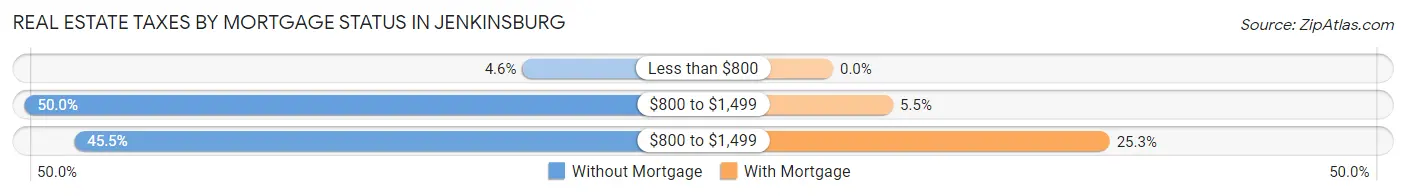
| Property Taxes | Without Mortgage | With Mortgage |
| Less than $800 | 1 (4.5%) | 0 (0.0%) |
| $800 to $1,499 | 11 (50.0%) | 5 (5.5%) |
| $800 to $1,499 | 10 (45.5%) | 23 (25.3%) |
| Total | 22 (100.0%) | 91 (100.0%) |
Health & Disability in Jenkinsburg
Health Insurance Coverage by Age in Jenkinsburg
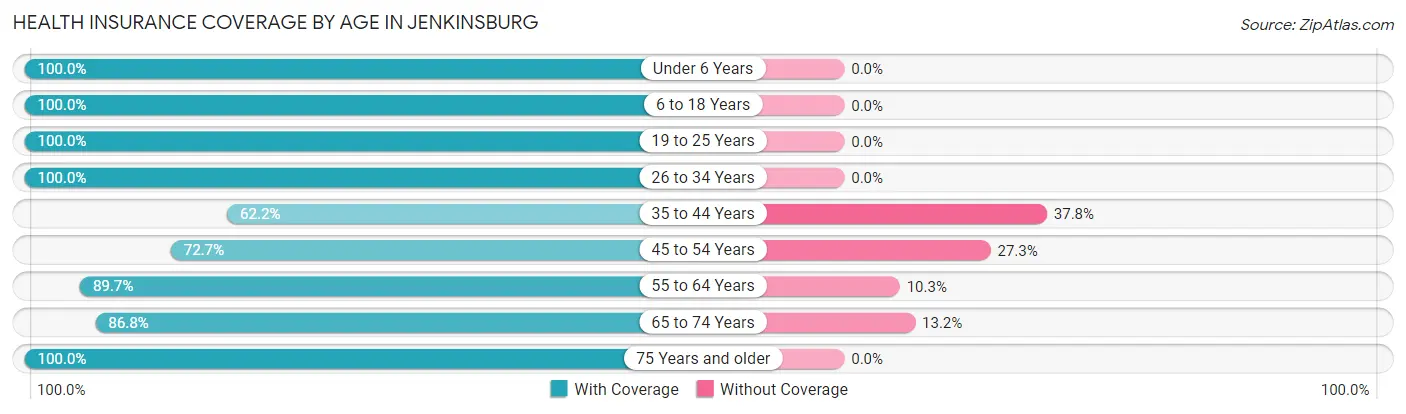
| Age Bracket | With Coverage | Without Coverage |
| Under 6 Years | 6 (100.0%) | 0 (0.0%) |
| 6 to 18 Years | 35 (100.0%) | 0 (0.0%) |
| 19 to 25 Years | 22 (100.0%) | 0 (0.0%) |
| 26 to 34 Years | 30 (100.0%) | 0 (0.0%) |
| 35 to 44 Years | 28 (62.2%) | 17 (37.8%) |
| 45 to 54 Years | 32 (72.7%) | 12 (27.3%) |
| 55 to 64 Years | 52 (89.7%) | 6 (10.3%) |
| 65 to 74 Years | 46 (86.8%) | 7 (13.2%) |
| 75 Years and older | 10 (100.0%) | 0 (0.0%) |
| Total | 261 (86.1%) | 42 (13.9%) |
Health Insurance Coverage by Citizenship Status in Jenkinsburg
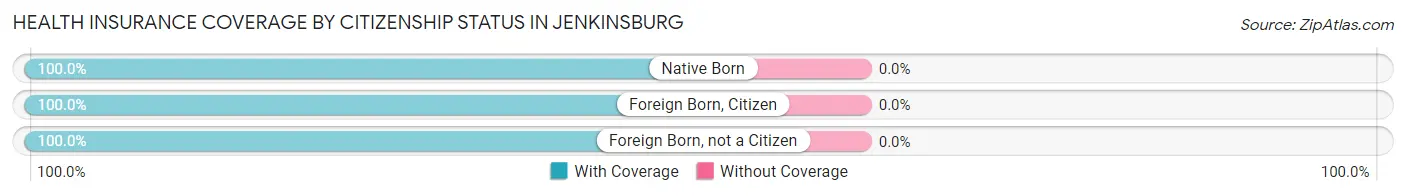
| Citizenship Status | With Coverage | Without Coverage |
| Native Born | 6 (100.0%) | 0 (0.0%) |
| Foreign Born, Citizen | 35 (100.0%) | 0 (0.0%) |
| Foreign Born, not a Citizen | 22 (100.0%) | 0 (0.0%) |
Health Insurance Coverage by Household Income in Jenkinsburg
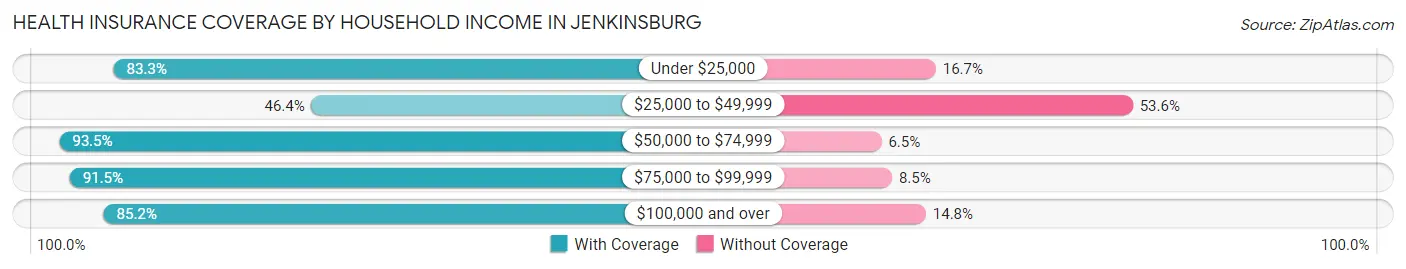
| Household Income | With Coverage | Without Coverage |
| Under $25,000 | 10 (83.3%) | 2 (16.7%) |
| $25,000 to $49,999 | 13 (46.4%) | 15 (53.6%) |
| $50,000 to $74,999 | 115 (93.5%) | 8 (6.5%) |
| $75,000 to $99,999 | 54 (91.5%) | 5 (8.5%) |
| $100,000 and over | 69 (85.2%) | 12 (14.8%) |
Public vs Private Health Insurance Coverage by Age in Jenkinsburg
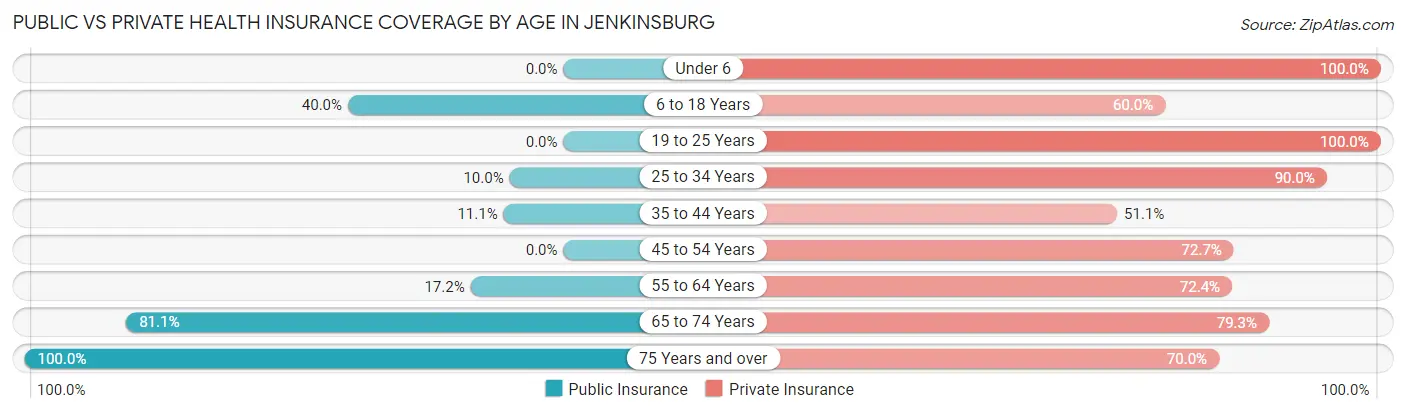
| Age Bracket | Public Insurance | Private Insurance |
| Under 6 | 0 (0.0%) | 6 (100.0%) |
| 6 to 18 Years | 14 (40.0%) | 21 (60.0%) |
| 19 to 25 Years | 0 (0.0%) | 22 (100.0%) |
| 25 to 34 Years | 3 (10.0%) | 27 (90.0%) |
| 35 to 44 Years | 5 (11.1%) | 23 (51.1%) |
| 45 to 54 Years | 0 (0.0%) | 32 (72.7%) |
| 55 to 64 Years | 10 (17.2%) | 42 (72.4%) |
| 65 to 74 Years | 43 (81.1%) | 42 (79.2%) |
| 75 Years and over | 10 (100.0%) | 7 (70.0%) |
| Total | 85 (28.1%) | 222 (73.3%) |
Disability Status by Sex by Age in Jenkinsburg
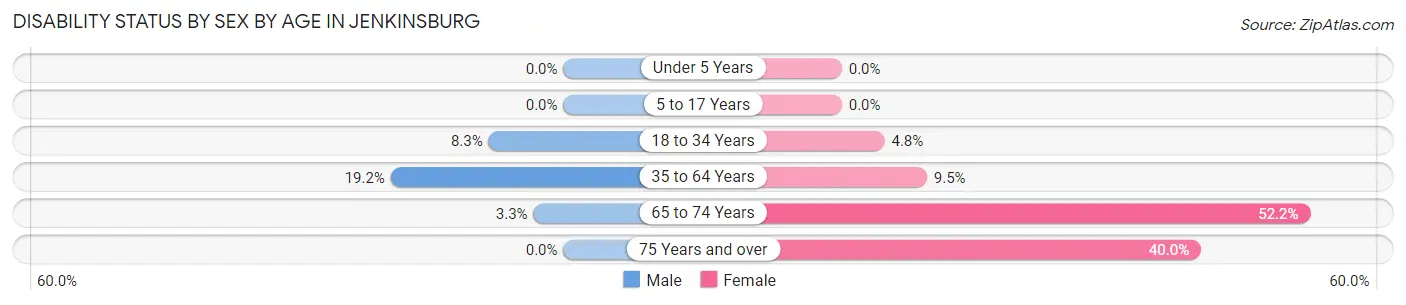
| Age Bracket | Male | Female |
| Under 5 Years | 0 (0.0%) | 0 (0.0%) |
| 5 to 17 Years | 0 (0.0%) | 0 (0.0%) |
| 18 to 34 Years | 3 (8.3%) | 1 (4.8%) |
| 35 to 64 Years | 10 (19.2%) | 9 (9.5%) |
| 65 to 74 Years | 1 (3.3%) | 12 (52.2%) |
| 75 Years and over | 0 (0.0%) | 2 (40.0%) |
Disability Class by Sex by Age in Jenkinsburg
Disability Class: Hearing Difficulty
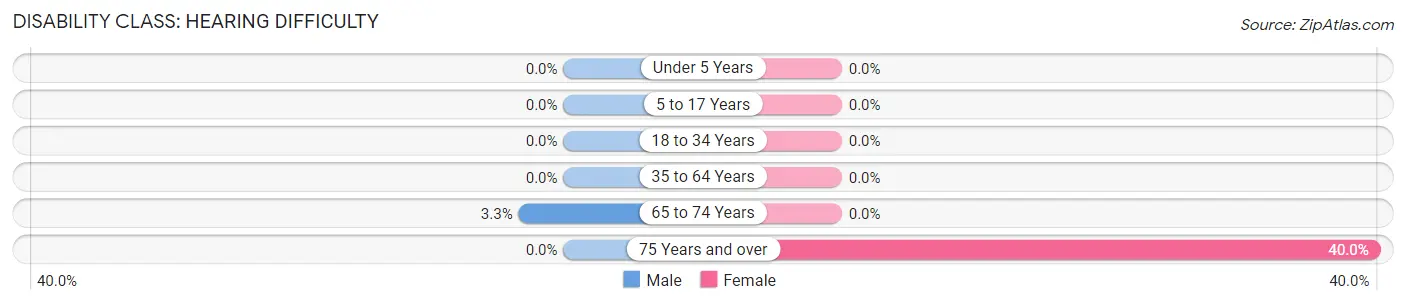
| Age Bracket | Male | Female |
| Under 5 Years | 0 (0.0%) | 0 (0.0%) |
| 5 to 17 Years | 0 (0.0%) | 0 (0.0%) |
| 18 to 34 Years | 0 (0.0%) | 0 (0.0%) |
| 35 to 64 Years | 0 (0.0%) | 0 (0.0%) |
| 65 to 74 Years | 1 (3.3%) | 0 (0.0%) |
| 75 Years and over | 0 (0.0%) | 2 (40.0%) |
Disability Class: Vision Difficulty
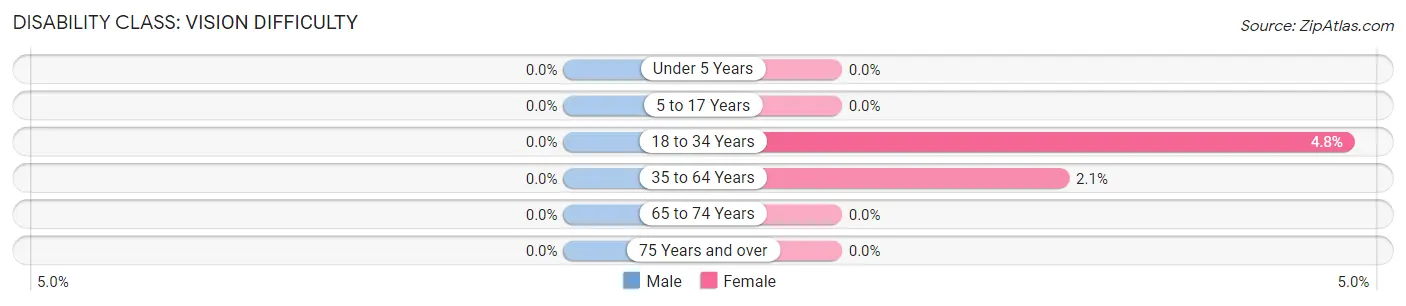
| Age Bracket | Male | Female |
| Under 5 Years | 0 (0.0%) | 0 (0.0%) |
| 5 to 17 Years | 0 (0.0%) | 0 (0.0%) |
| 18 to 34 Years | 0 (0.0%) | 1 (4.8%) |
| 35 to 64 Years | 0 (0.0%) | 2 (2.1%) |
| 65 to 74 Years | 0 (0.0%) | 0 (0.0%) |
| 75 Years and over | 0 (0.0%) | 0 (0.0%) |
Disability Class: Cognitive Difficulty
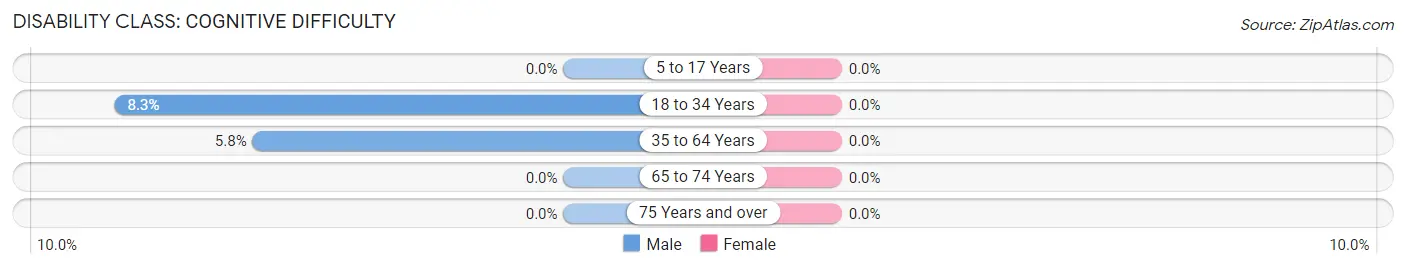
| Age Bracket | Male | Female |
| 5 to 17 Years | 0 (0.0%) | 0 (0.0%) |
| 18 to 34 Years | 3 (8.3%) | 0 (0.0%) |
| 35 to 64 Years | 3 (5.8%) | 0 (0.0%) |
| 65 to 74 Years | 0 (0.0%) | 0 (0.0%) |
| 75 Years and over | 0 (0.0%) | 0 (0.0%) |
Disability Class: Ambulatory Difficulty
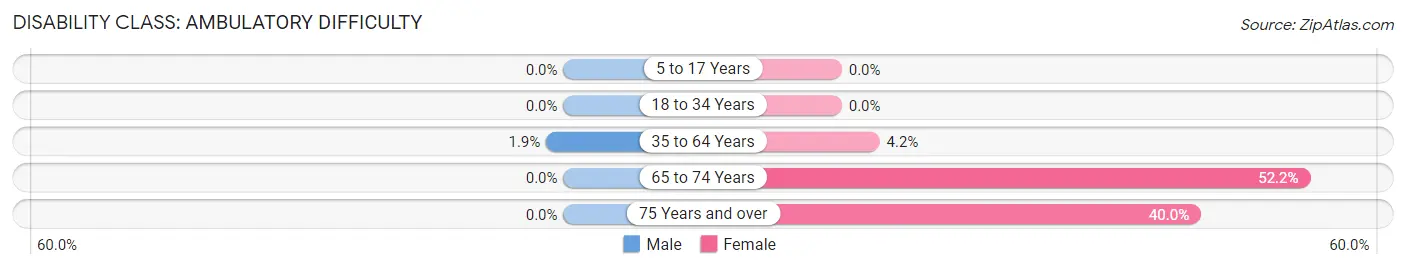
| Age Bracket | Male | Female |
| 5 to 17 Years | 0 (0.0%) | 0 (0.0%) |
| 18 to 34 Years | 0 (0.0%) | 0 (0.0%) |
| 35 to 64 Years | 1 (1.9%) | 4 (4.2%) |
| 65 to 74 Years | 0 (0.0%) | 12 (52.2%) |
| 75 Years and over | 0 (0.0%) | 2 (40.0%) |
Disability Class: Self-Care Difficulty
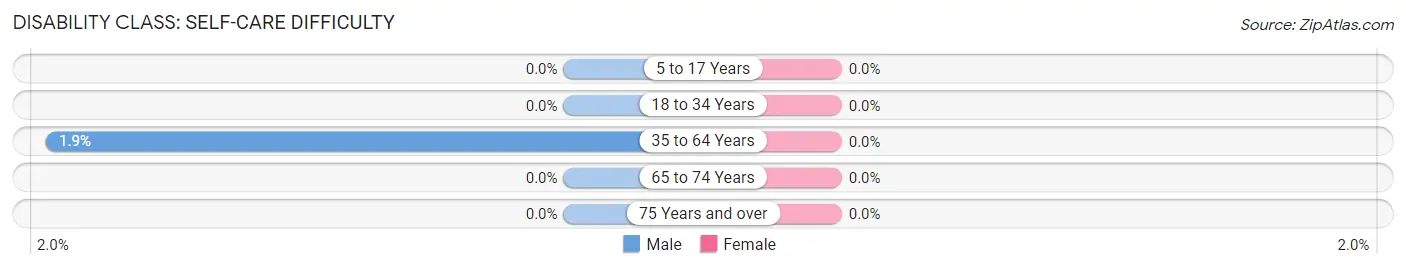
| Age Bracket | Male | Female |
| 5 to 17 Years | 0 (0.0%) | 0 (0.0%) |
| 18 to 34 Years | 0 (0.0%) | 0 (0.0%) |
| 35 to 64 Years | 1 (1.9%) | 0 (0.0%) |
| 65 to 74 Years | 0 (0.0%) | 0 (0.0%) |
| 75 Years and over | 0 (0.0%) | 0 (0.0%) |
Technology Access in Jenkinsburg
Computing Device Access in Jenkinsburg
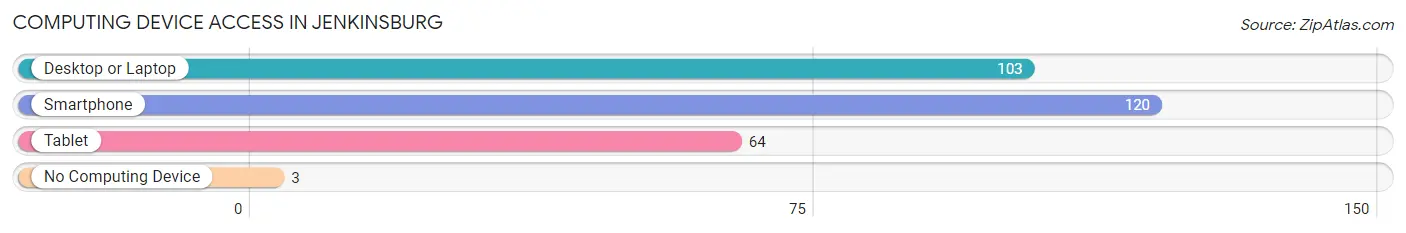
| Device Type | # Households | % Households |
| Desktop or Laptop | 103 | 78.0% |
| Smartphone | 120 | 90.9% |
| Tablet | 64 | 48.5% |
| No Computing Device | 3 | 2.3% |
| Total | 132 | 100.0% |
Internet Access in Jenkinsburg
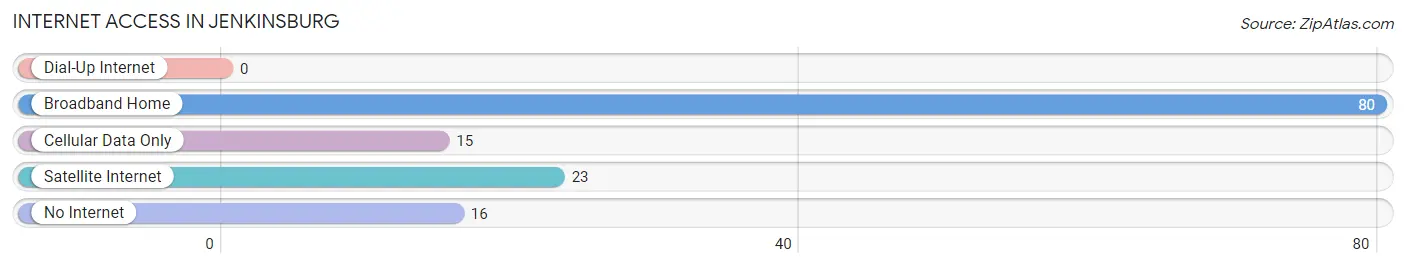
| Internet Type | # Households | % Households |
| Dial-Up Internet | 0 | 0.0% |
| Broadband Home | 80 | 60.6% |
| Cellular Data Only | 15 | 11.4% |
| Satellite Internet | 23 | 17.4% |
| No Internet | 16 | 12.1% |
| Total | 132 | 100.0% |
Jenkinsburg Summary
Jenkinsburg, Georgia is a small town located in Butts County, Georgia, United States. It is situated about 40 miles south of Atlanta and is part of the Atlanta metropolitan area. The population of Jenkinsburg was estimated to be 1,093 in 2019.
History
Jenkinsburg was founded in 1845 by William Jenkins, a former slave who had purchased his freedom. He named the town after himself and it quickly became a thriving community. The town was incorporated in 1891 and was home to a variety of businesses, including a cotton gin, a grist mill, a sawmill, and a blacksmith shop.
In the early 1900s, Jenkinsburg was a major stop on the Seaboard Air Line Railroad. The railroad brought many new people to the area, and the town grew rapidly. By the 1920s, Jenkinsburg had a population of over 1,000 people.
Geography
Jenkinsburg is located in Butts County, Georgia, about 40 miles south of Atlanta. The town is situated in the Piedmont region of the state, and the terrain is mostly flat. The town is located on the banks of the Towaliga River, which flows through the area.
The climate in Jenkinsburg is humid subtropical, with hot, humid summers and mild winters. The average annual temperature is around 70 degrees Fahrenheit, and the average annual precipitation is around 50 inches.
Economy
The economy of Jenkinsburg is largely based on agriculture. The town is home to several farms, which produce a variety of crops, including cotton, corn, soybeans, and peanuts. The town is also home to several manufacturing companies, which produce a variety of products, including furniture, textiles, and automotive parts.
In addition to agriculture and manufacturing, Jenkinsburg is home to several small businesses, including restaurants, retail stores, and service providers. The town is also home to several churches, which provide a variety of services to the community.
Demographics
As of 2019, the population of Jenkinsburg was estimated to be 1,093. The population is predominantly white, with African Americans making up about 20% of the population. The median household income in Jenkinsburg is around $45,000, and the median home value is around $150,000.
The town is served by the Butts County School District, which includes two elementary schools, one middle school, and one high school. The town is also home to several churches, which provide a variety of services to the community.
Conclusion
Jenkinsburg, Georgia is a small town located in Butts County, Georgia, United States. It is situated about 40 miles south of Atlanta and is part of the Atlanta metropolitan area. The population of Jenkinsburg was estimated to be 1,093 in 2019. The town is situated in the Piedmont region of the state, and the terrain is mostly flat. The economy of Jenkinsburg is largely based on agriculture, manufacturing, and small businesses. The population is predominantly white, with African Americans making up about 20% of the population. The town is served by the Butts County School District, and is home to several churches, which provide a variety of services to the community.
Common Questions
What is Per Capita Income in Jenkinsburg?
Per Capita income in Jenkinsburg is $36,559.
What is the Median Family Income in Jenkinsburg?
Median Family Income in Jenkinsburg is $90,313.
What is the Median Household income in Jenkinsburg?
Median Household Income in Jenkinsburg is $71,912.
What is Income or Wage Gap in Jenkinsburg?
Income or Wage Gap in Jenkinsburg is 16.8%.
Women in Jenkinsburg earn 83.2 cents for every dollar earned by a man.
What is Inequality or Gini Index in Jenkinsburg?
Inequality or Gini Index in Jenkinsburg is 0.31.
What is the Total Population of Jenkinsburg?
Total Population of Jenkinsburg is 303.
What is the Total Male Population of Jenkinsburg?
Total Male Population of Jenkinsburg is 139.
What is the Total Female Population of Jenkinsburg?
Total Female Population of Jenkinsburg is 164.
What is the Ratio of Males per 100 Females in Jenkinsburg?
There are 84.76 Males per 100 Females in Jenkinsburg.
What is the Ratio of Females per 100 Males in Jenkinsburg?
There are 117.99 Females per 100 Males in Jenkinsburg.
What is the Median Population Age in Jenkinsburg?
Median Population Age in Jenkinsburg is 47.7 Years.
What is the Average Family Size in Jenkinsburg
Average Family Size in Jenkinsburg is 2.9 People.
What is the Average Household Size in Jenkinsburg
Average Household Size in Jenkinsburg is 2.3 People.
How Large is the Labor Force in Jenkinsburg?
There are 153 People in the Labor Forcein in Jenkinsburg.
What is the Percentage of People in the Labor Force in Jenkinsburg?
55.8% of People are in the Labor Force in Jenkinsburg.
What is the Unemployment Rate in Jenkinsburg?
Unemployment Rate in Jenkinsburg is 4.6%.