Jasper, GA Map & Demographics
Jasper Map
Jasper Overview
$29,023
PER CAPITA INCOME
$43,301
AVG FAMILY INCOME
$43,192
AVG HOUSEHOLD INCOME
6.2%
WAGE / INCOME GAP [ % ]
93.8¢/ $1
WAGE / INCOME GAP [ $ ]
0.50
INEQUALITY / GINI INDEX
4,177
TOTAL POPULATION
2,034
MALE POPULATION
2,143
FEMALE POPULATION
94.91
MALES / 100 FEMALES
105.36
FEMALES / 100 MALES
28.5
MEDIAN AGE
3.1
AVG FAMILY SIZE
2.6
AVG HOUSEHOLD SIZE
1,592
LABOR FORCE [ PEOPLE ]
52.0%
PERCENT IN LABOR FORCE
1.1%
UNEMPLOYMENT RATE
Jasper Zip Codes
Income in Jasper
Income Overview in Jasper
Per Capita Income in Jasper is $29,023, while median incomes of families and households are $43,301 and $43,192 respectively.
| Characteristic | Number | Measure |
| Per Capita Income | 4,177 | $29,023 |
| Median Family Income | 1,062 | $43,301 |
| Mean Family Income | 1,062 | $84,546 |
| Median Household Income | 1,552 | $43,192 |
| Mean Household Income | 1,552 | $74,586 |
| Income Deficit | 1,062 | $0 |
| Wage / Income Gap (%) | 4,177 | 6.19% |
| Wage / Income Gap ($) | 4,177 | 93.81¢ per $1 |
| Gini / Inequality Index | 4,177 | 0.50 |
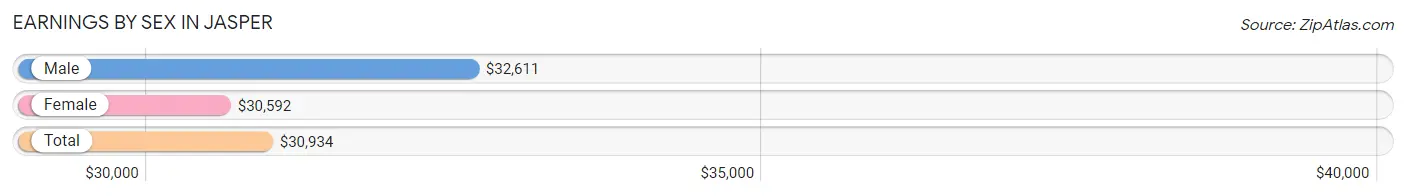
Earnings by Sex in Jasper
Average Earnings in Jasper are $30,934, $32,611 for men and $30,592 for women, a difference of 6.2%.
| Sex | Number | Average Earnings |
| Male | 997 (50.4%) | $32,611 |
| Female | 980 (49.6%) | $30,592 |
| Total | 1,977 (100.0%) | $30,934 |
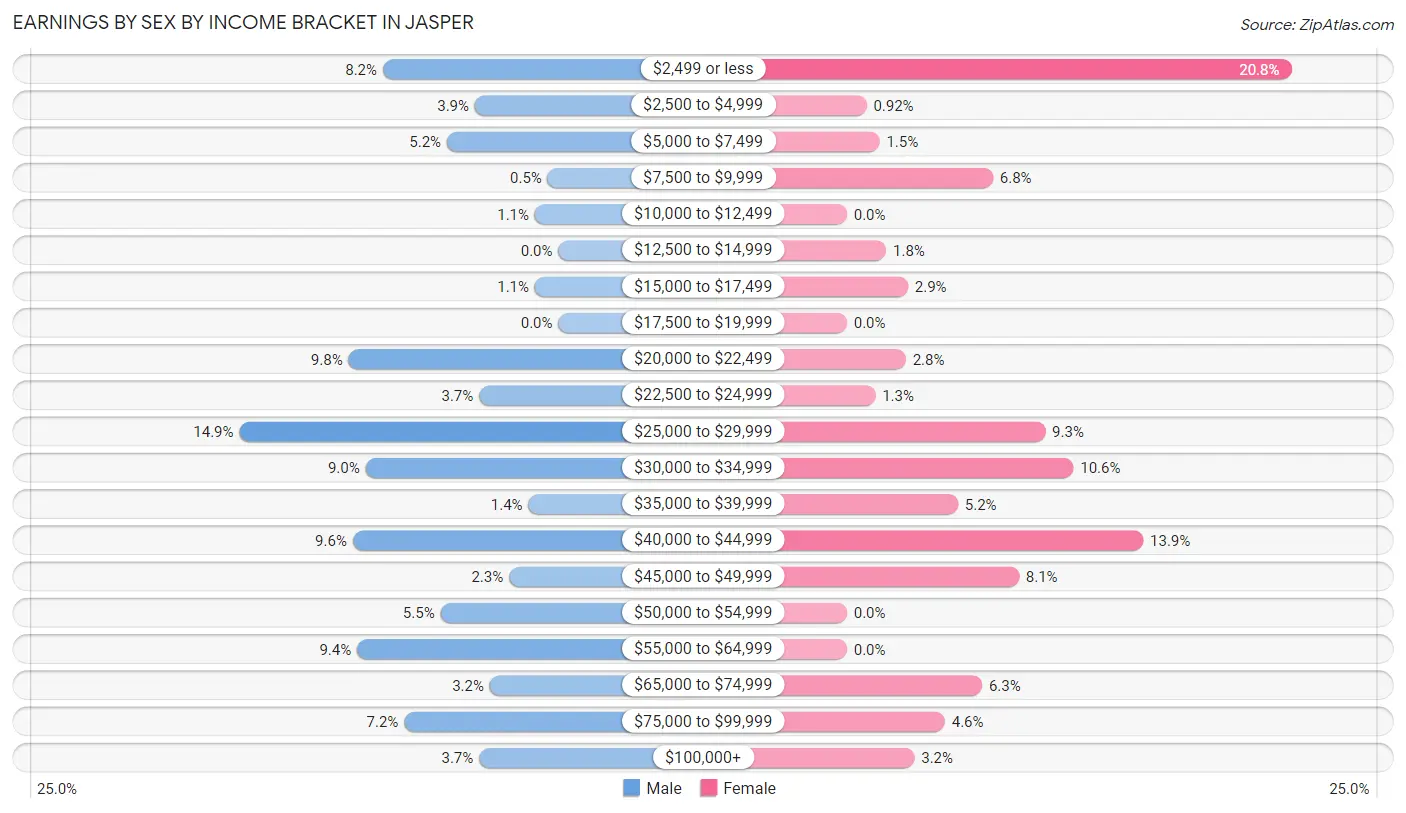
Earnings by Sex by Income Bracket in Jasper
The most common earnings brackets in Jasper are $25,000 to $29,999 for men (149 | 14.9%) and $2,499 or less for women (204 | 20.8%).
| Income | Male | Female |
| $2,499 or less | 82 (8.2%) | 204 (20.8%) |
| $2,500 to $4,999 | 39 (3.9%) | 9 (0.9%) |
| $5,000 to $7,499 | 52 (5.2%) | 15 (1.5%) |
| $7,500 to $9,999 | 5 (0.5%) | 67 (6.8%) |
| $10,000 to $12,499 | 11 (1.1%) | 0 (0.0%) |
| $12,500 to $14,999 | 0 (0.0%) | 18 (1.8%) |
| $15,000 to $17,499 | 11 (1.1%) | 28 (2.9%) |
| $17,500 to $19,999 | 0 (0.0%) | 0 (0.0%) |
| $20,000 to $22,499 | 98 (9.8%) | 27 (2.8%) |
| $22,500 to $24,999 | 37 (3.7%) | 13 (1.3%) |
| $25,000 to $29,999 | 149 (14.9%) | 91 (9.3%) |
| $30,000 to $34,999 | 90 (9.0%) | 104 (10.6%) |
| $35,000 to $39,999 | 14 (1.4%) | 51 (5.2%) |
| $40,000 to $44,999 | 96 (9.6%) | 136 (13.9%) |
| $45,000 to $49,999 | 23 (2.3%) | 79 (8.1%) |
| $50,000 to $54,999 | 55 (5.5%) | 0 (0.0%) |
| $55,000 to $64,999 | 94 (9.4%) | 0 (0.0%) |
| $65,000 to $74,999 | 32 (3.2%) | 62 (6.3%) |
| $75,000 to $99,999 | 72 (7.2%) | 45 (4.6%) |
| $100,000+ | 37 (3.7%) | 31 (3.2%) |
| Total | 997 (100.0%) | 980 (100.0%) |
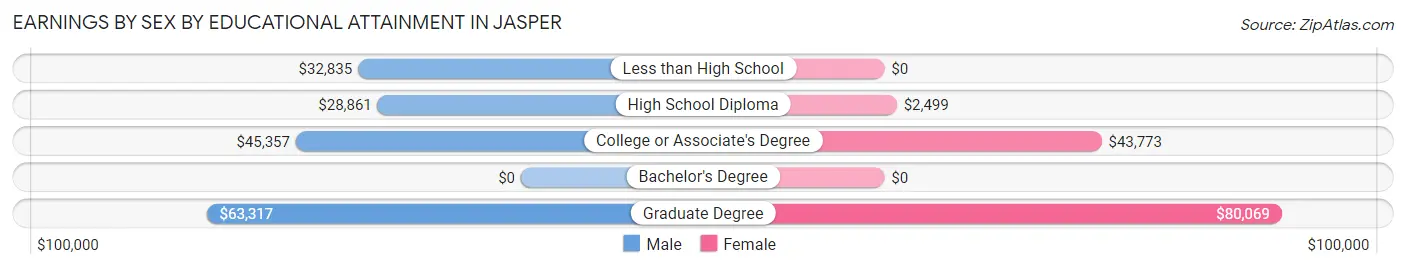
Earnings by Sex by Educational Attainment in Jasper
Average earnings in Jasper are $33,766 for men and $31,020 for women, a difference of 8.1%. Men with an educational attainment of graduate degree enjoy the highest average annual earnings of $63,317, while those with high school diploma education earn the least with $28,861. Women with an educational attainment of graduate degree earn the most with the average annual earnings of $80,069, while those with high school diploma education have the smallest earnings of $2,499.
| Educational Attainment | Male Income | Female Income |
| Less than High School | $32,835 | $0 |
| High School Diploma | $28,861 | $2,499 |
| College or Associate's Degree | $45,357 | $43,773 |
| Bachelor's Degree | - | - |
| Graduate Degree | $63,317 | $80,069 |
| Total | $33,766 | $31,020 |
Family Income in Jasper
Family Income Brackets in Jasper
According to the Jasper family income data, there are 322 families falling into the $25,000 to $34,999 income range, which is the most common income bracket and makes up 30.3% of all families.
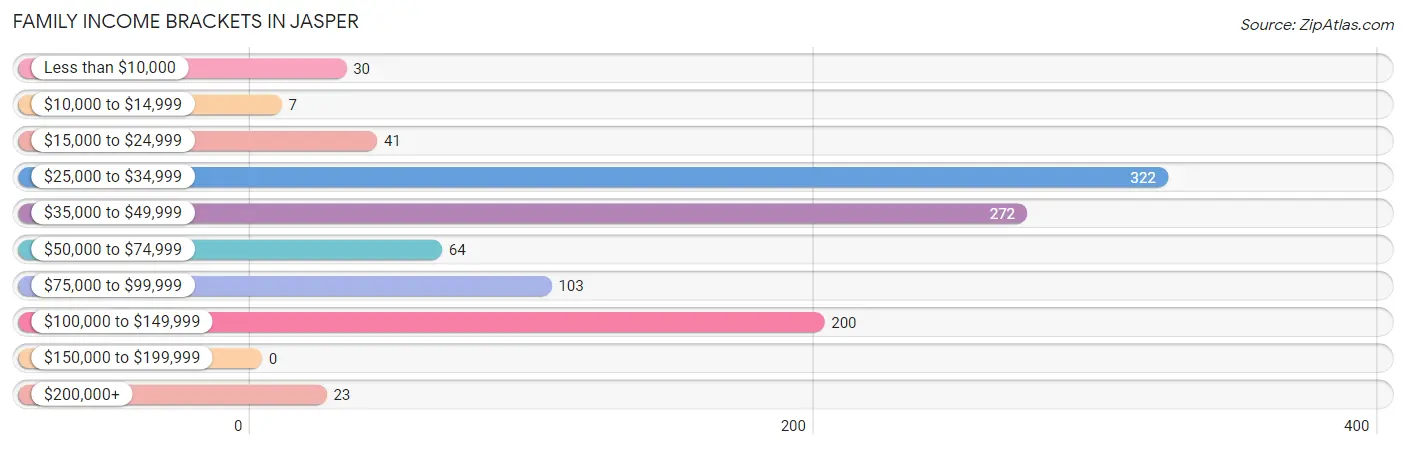
| Income Bracket | # Families | % Families |
| Less than $10,000 | 30 | 2.8% |
| $10,000 to $14,999 | 7 | 0.7% |
| $15,000 to $24,999 | 41 | 3.9% |
| $25,000 to $34,999 | 322 | 30.3% |
| $35,000 to $49,999 | 272 | 25.6% |
| $50,000 to $74,999 | 64 | 6.0% |
| $75,000 to $99,999 | 103 | 9.7% |
| $100,000 to $149,999 | 200 | 18.8% |
| $150,000 to $199,999 | 0 | 0.0% |
| $200,000+ | 23 | 2.2% |
Family Income by Famaliy Size in Jasper
4-person families (121 | 11.4%) account for the highest median family income in Jasper with $46,875 per family, while 2-person families (473 | 44.5%) have the highest median income of $22,112 per family member.
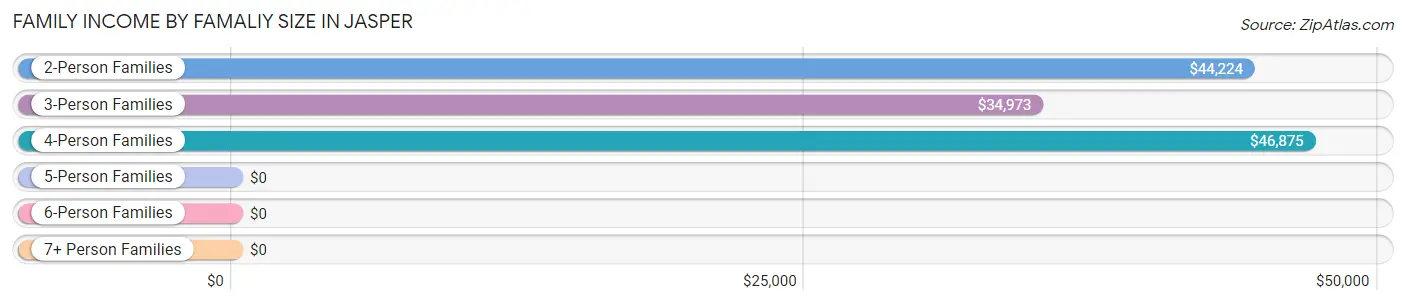
| Income Bracket | # Families | Median Income |
| 2-Person Families | 473 (44.5%) | $44,224 |
| 3-Person Families | 229 (21.6%) | $34,973 |
| 4-Person Families | 121 (11.4%) | $46,875 |
| 5-Person Families | 185 (17.4%) | $0 |
| 6-Person Families | 22 (2.1%) | $0 |
| 7+ Person Families | 32 (3.0%) | $0 |
| Total | 1,062 (100.0%) | $43,301 |
Family Income by Number of Earners in Jasper
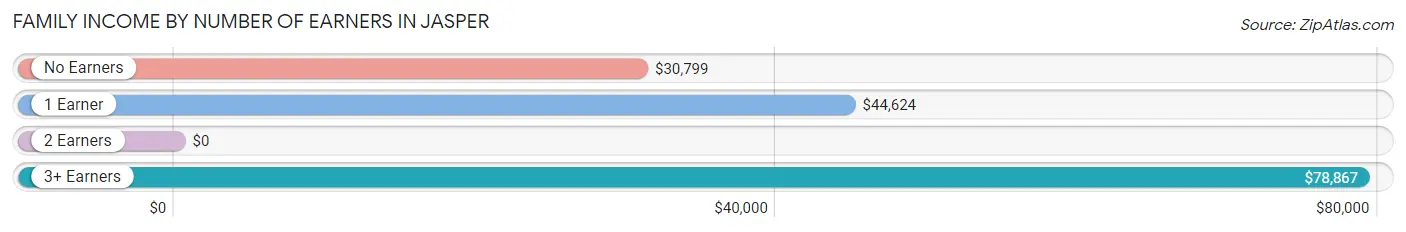
| Number of Earners | # Families | Median Income |
| No Earners | 183 (17.2%) | $30,799 |
| 1 Earner | 388 (36.5%) | $44,624 |
| 2 Earners | 418 (39.4%) | $0 |
| 3+ Earners | 73 (6.9%) | $78,867 |
| Total | 1,062 (100.0%) | $43,301 |
Household Income in Jasper
Household Income Brackets in Jasper
With 419 households falling in the category, the $25,000 to $34,999 income range is the most frequent in Jasper, accounting for 27.0% of all households.
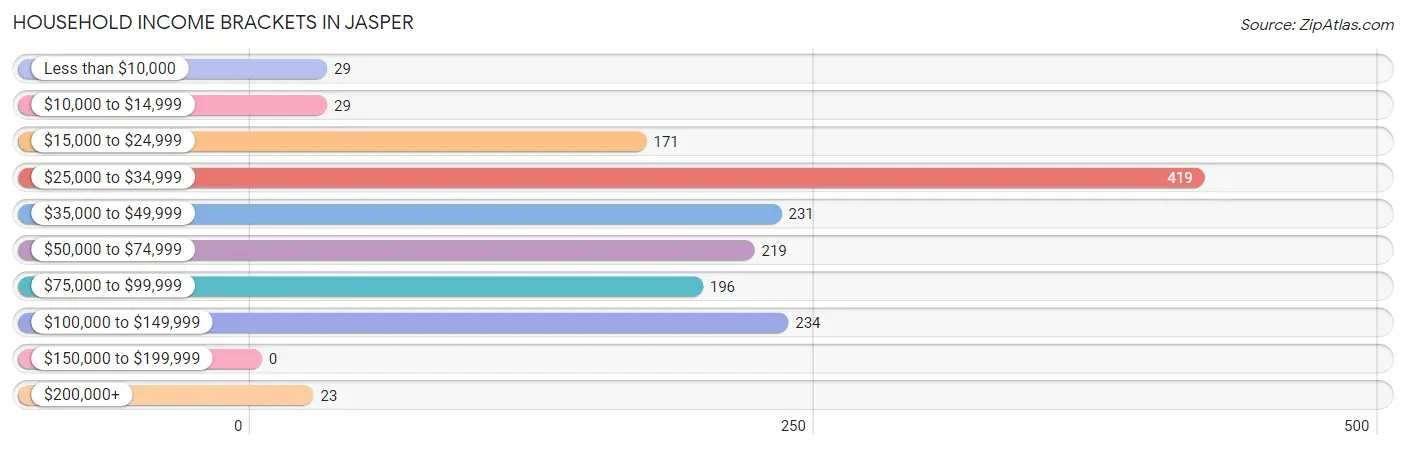
| Income Bracket | # Households | % Households |
| Less than $10,000 | 29 | 1.9% |
| $10,000 to $14,999 | 29 | 1.9% |
| $15,000 to $24,999 | 171 | 11.0% |
| $25,000 to $34,999 | 419 | 27.0% |
| $35,000 to $49,999 | 231 | 14.9% |
| $50,000 to $74,999 | 219 | 14.1% |
| $75,000 to $99,999 | 196 | 12.6% |
| $100,000 to $149,999 | 234 | 15.1% |
| $150,000 to $199,999 | 0 | 0.0% |
| $200,000+ | 23 | 1.5% |
Household Income by Householder Age in Jasper
The median household income in Jasper is $43,192, with the highest median household income of $44,628 found in the 25 to 44 years age bracket for the primary householder. A total of 697 households (44.9%) fall into this category. Meanwhile, the 15 to 24 years age bracket for the primary householder has the lowest median household income of $0, with 113 households (7.3%) in this group.
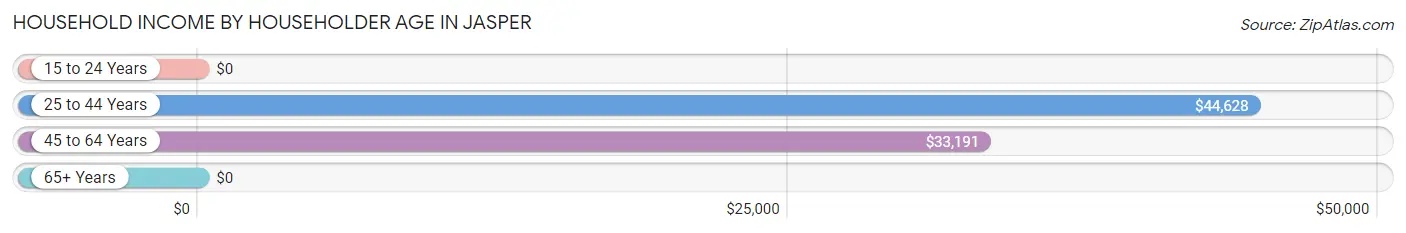
| Income Bracket | # Households | Median Income |
| 15 to 24 Years | 113 (7.3%) | $0 |
| 25 to 44 Years | 697 (44.9%) | $44,628 |
| 45 to 64 Years | 366 (23.6%) | $33,191 |
| 65+ Years | 376 (24.2%) | $0 |
| Total | 1,552 (100.0%) | $43,192 |
Poverty in Jasper
Income Below Poverty by Sex and Age in Jasper
With 24.8% poverty level for males and 27.2% for females among the residents of Jasper, under 5 year old males and 6 to 11 year old females are the most vulnerable to poverty, with 283 males (78.8%) and 259 females (86.1%) in their respective age groups living below the poverty level.
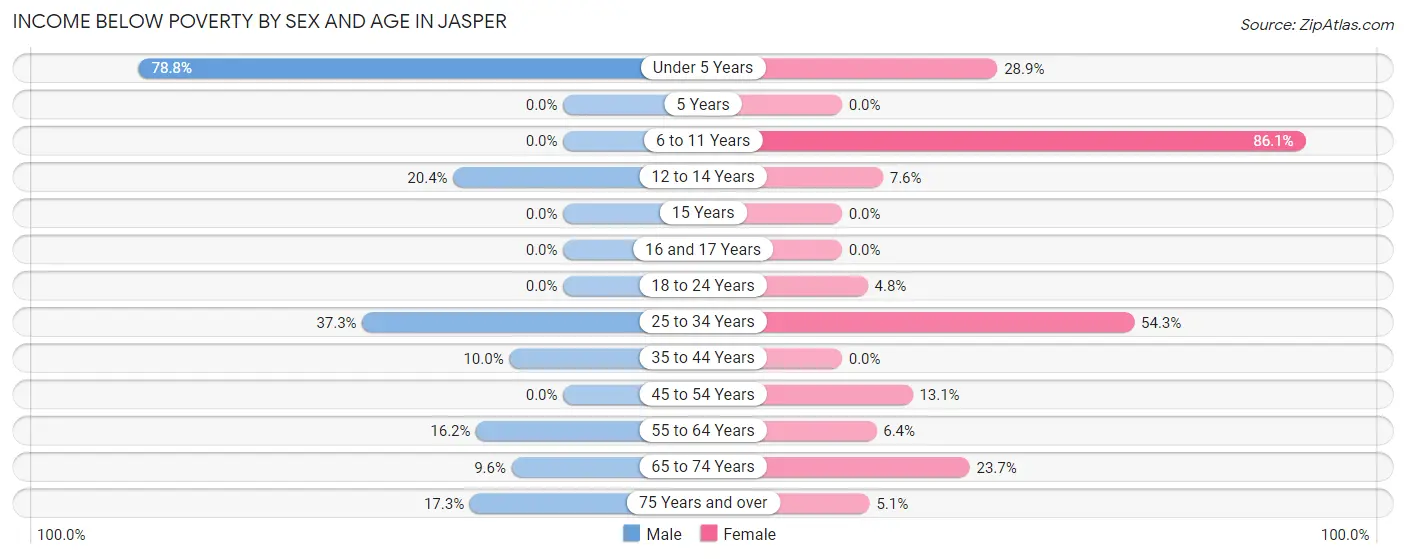
| Age Bracket | Male | Female |
| Under 5 Years | 283 (78.8%) | 15 (28.8%) |
| 5 Years | 0 (0.0%) | 0 (0.0%) |
| 6 to 11 Years | 0 (0.0%) | 259 (86.1%) |
| 12 to 14 Years | 10 (20.4%) | 7 (7.6%) |
| 15 Years | 0 (0.0%) | 0 (0.0%) |
| 16 and 17 Years | 0 (0.0%) | 0 (0.0%) |
| 18 to 24 Years | 0 (0.0%) | 9 (4.8%) |
| 25 to 34 Years | 135 (37.3%) | 191 (54.3%) |
| 35 to 44 Years | 24 (10.0%) | 0 (0.0%) |
| 45 to 54 Years | 0 (0.0%) | 16 (13.1%) |
| 55 to 64 Years | 26 (16.2%) | 21 (6.4%) |
| 65 to 74 Years | 11 (9.6%) | 37 (23.7%) |
| 75 Years and over | 13 (17.3%) | 11 (5.1%) |
| Total | 502 (24.8%) | 566 (27.2%) |
Income Above Poverty by Sex and Age in Jasper
According to the poverty statistics in Jasper, males aged 5 years and females aged 16 and 17 years are the age groups that are most secure financially, with 100.0% of males and 100.0% of females in these age groups living above the poverty line.
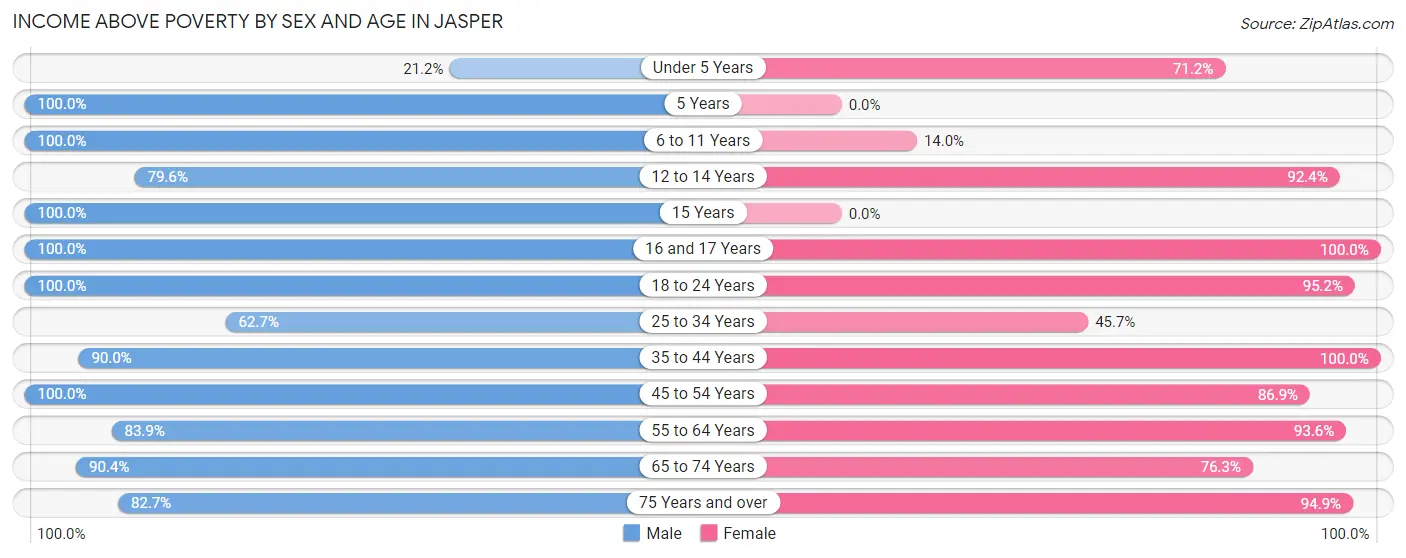
| Age Bracket | Male | Female |
| Under 5 Years | 76 (21.2%) | 37 (71.2%) |
| 5 Years | 86 (100.0%) | 0 (0.0%) |
| 6 to 11 Years | 118 (100.0%) | 42 (14.0%) |
| 12 to 14 Years | 39 (79.6%) | 85 (92.4%) |
| 15 Years | 59 (100.0%) | 0 (0.0%) |
| 16 and 17 Years | 49 (100.0%) | 5 (100.0%) |
| 18 to 24 Years | 205 (100.0%) | 179 (95.2%) |
| 25 to 34 Years | 227 (62.7%) | 161 (45.7%) |
| 35 to 44 Years | 216 (90.0%) | 269 (100.0%) |
| 45 to 54 Years | 146 (100.0%) | 106 (86.9%) |
| 55 to 64 Years | 135 (83.9%) | 307 (93.6%) |
| 65 to 74 Years | 104 (90.4%) | 119 (76.3%) |
| 75 Years and over | 62 (82.7%) | 203 (94.9%) |
| Total | 1,522 (75.2%) | 1,513 (72.8%) |
Income Below Poverty Among Married-Couple Families in Jasper
The poverty statistics for married-couple families in Jasper show that 25.1% or 183 of the total 730 families live below the poverty line. Families with 3 or 4 children have the highest poverty rate of 92.0%, comprising of 172 families. On the other hand, families with 1 or 2 children have the lowest poverty rate of 0.0%, which includes 0 families.
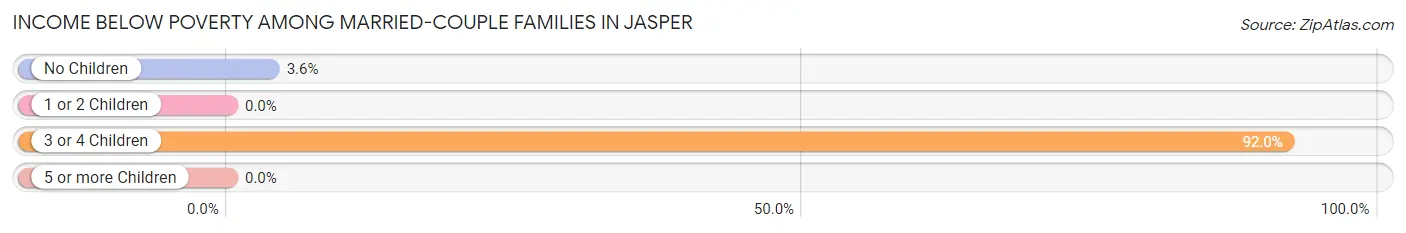
| Children | Above Poverty | Below Poverty |
| No Children | 292 (96.4%) | 11 (3.6%) |
| 1 or 2 Children | 240 (100.0%) | 0 (0.0%) |
| 3 or 4 Children | 15 (8.0%) | 172 (92.0%) |
| 5 or more Children | 0 (0.0%) | 0 (0.0%) |
| Total | 547 (74.9%) | 183 (25.1%) |
Income Below Poverty Among Single-Parent Households in Jasper
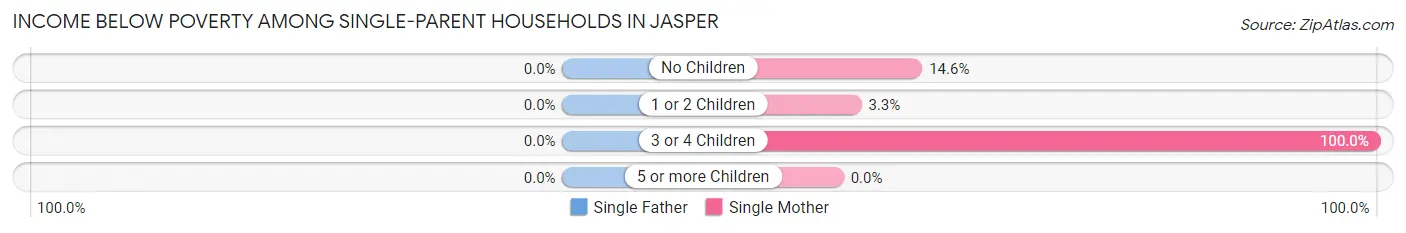
| Children | Single Father | Single Mother |
| No Children | 0 (0.0%) | 6 (14.6%) |
| 1 or 2 Children | 0 (0.0%) | 7 (3.3%) |
| 3 or 4 Children | 0 (0.0%) | 19 (100.0%) |
| 5 or more Children | 0 (0.0%) | 0 (0.0%) |
| Total | 0 (0.0%) | 32 (11.8%) |
Income Below Poverty Among Married-Couple vs Single-Parent Households in Jasper
The poverty data for Jasper shows that 183 of the married-couple family households (25.1%) and 32 of the single-parent households (9.6%) are living below the poverty level. Within the married-couple family households, those with 3 or 4 children have the highest poverty rate, with 172 households (92.0%) falling below the poverty line. Among the single-parent households, those with 3 or 4 children have the highest poverty rate, with 19 household (100.0%) living below poverty.
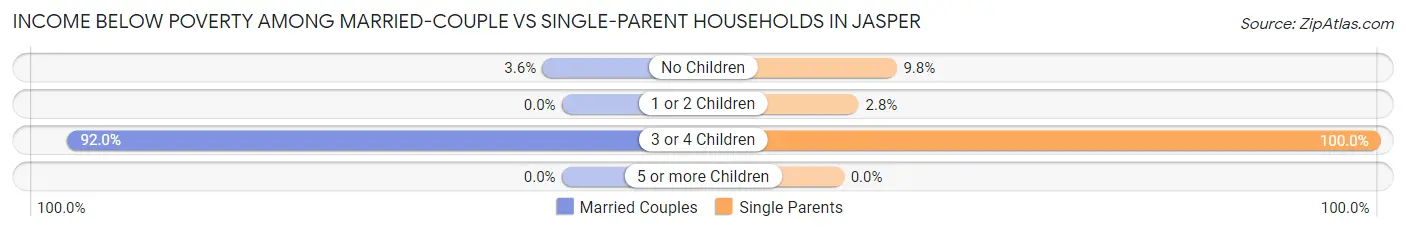
| Children | Married-Couple Families | Single-Parent Households |
| No Children | 11 (3.6%) | 6 (9.8%) |
| 1 or 2 Children | 0 (0.0%) | 7 (2.8%) |
| 3 or 4 Children | 172 (92.0%) | 19 (100.0%) |
| 5 or more Children | 0 (0.0%) | 0 (0.0%) |
| Total | 183 (25.1%) | 32 (9.6%) |
Race in Jasper
The most populous races in Jasper are White / Caucasian (3,766 | 90.2%), Two or more Races (284 | 6.8%), and Hispanic or Latino (134 | 3.2%).
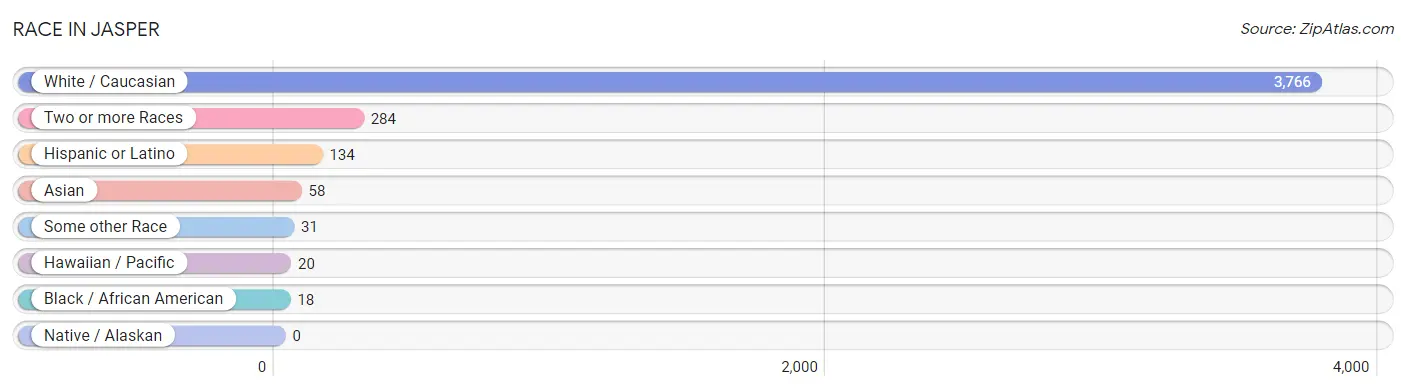
| Race | # Population | % Population |
| Asian | 58 | 1.4% |
| Black / African American | 18 | 0.4% |
| Hawaiian / Pacific | 20 | 0.5% |
| Hispanic or Latino | 134 | 3.2% |
| Native / Alaskan | 0 | 0.0% |
| White / Caucasian | 3,766 | 90.2% |
| Two or more Races | 284 | 6.8% |
| Some other Race | 31 | 0.7% |
| Total | 4,177 | 100.0% |
Ancestry in Jasper
The most populous ancestries reported in Jasper are American (638 | 15.3%), English (607 | 14.5%), Irish (443 | 10.6%), German (265 | 6.3%), and Italian (171 | 4.1%), together accounting for 50.8% of all Jasper residents.
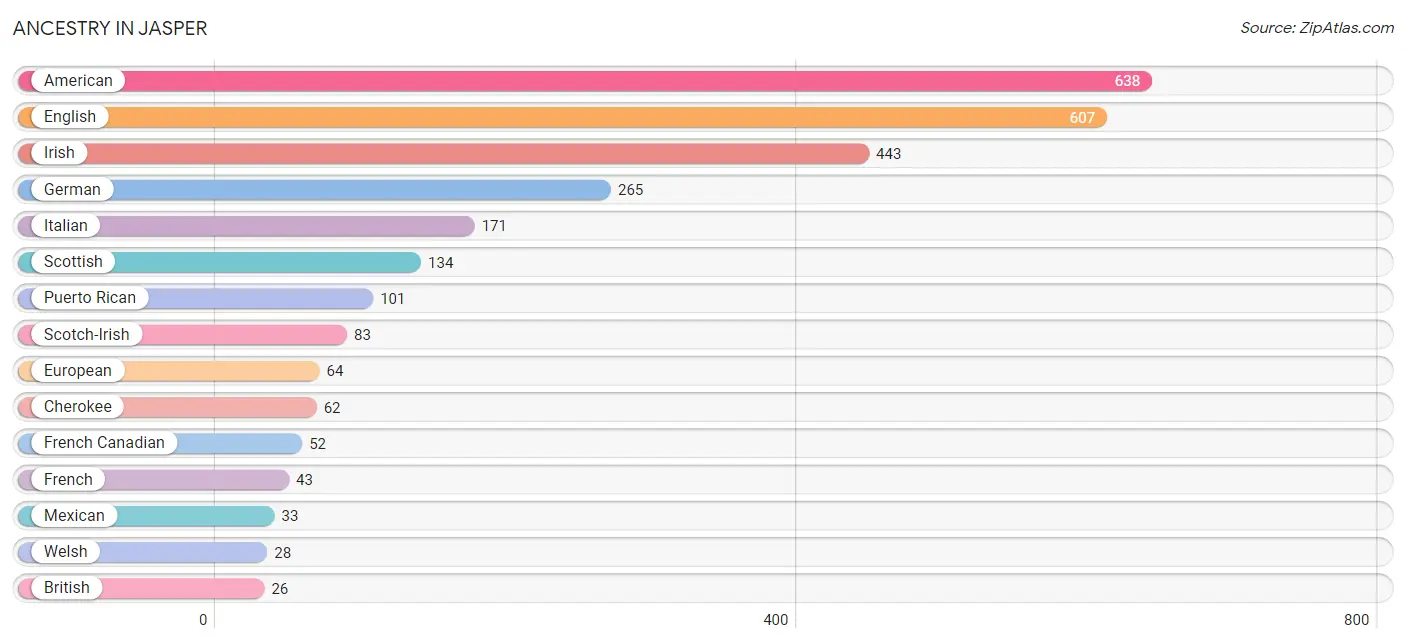
| Ancestry | # Population | % Population |
| American | 638 | 15.3% |
| British | 26 | 0.6% |
| Cherokee | 62 | 1.5% |
| Dutch | 18 | 0.4% |
| English | 607 | 14.5% |
| European | 64 | 1.5% |
| French | 43 | 1.0% |
| French Canadian | 52 | 1.2% |
| German | 265 | 6.3% |
| Irish | 443 | 10.6% |
| Italian | 171 | 4.1% |
| Korean | 15 | 0.4% |
| Mexican | 33 | 0.8% |
| Polish | 15 | 0.4% |
| Pueblo | 4 | 0.1% |
| Puerto Rican | 101 | 2.4% |
| Russian | 14 | 0.3% |
| Samoan | 20 | 0.5% |
| Scandinavian | 9 | 0.2% |
| Scotch-Irish | 83 | 2.0% |
| Scottish | 134 | 3.2% |
| Slavic | 5 | 0.1% |
| Slovak | 16 | 0.4% |
| Sri Lankan | 14 | 0.3% |
| Swedish | 10 | 0.2% |
| Ukrainian | 6 | 0.1% |
| Welsh | 28 | 0.7% | View All 27 Rows |
Immigrants in Jasper
The most numerous immigrant groups reported in Jasper came from Asia (58 | 1.4%), Pakistan (29 | 0.7%), South Central Asia (29 | 0.7%), South Eastern Asia (29 | 0.7%), and Philippines (15 | 0.4%), together accounting for 3.8% of all Jasper residents.
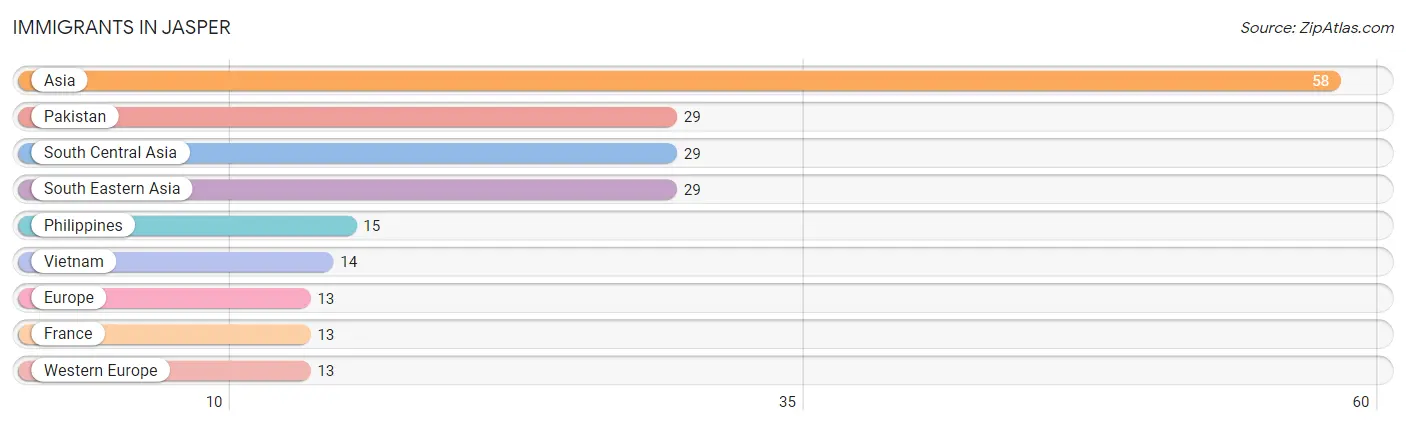
| Immigration Origin | # Population | % Population |
| Asia | 58 | 1.4% |
| Europe | 13 | 0.3% |
| France | 13 | 0.3% |
| Pakistan | 29 | 0.7% |
| Philippines | 15 | 0.4% |
| South Central Asia | 29 | 0.7% |
| South Eastern Asia | 29 | 0.7% |
| Vietnam | 14 | 0.3% |
| Western Europe | 13 | 0.3% | View All 9 Rows |
Sex and Age in Jasper
Sex and Age in Jasper
The most populous age groups in Jasper are Under 5 Years (359 | 17.6%) for men and 5 to 9 Years (285 | 13.3%) for women.
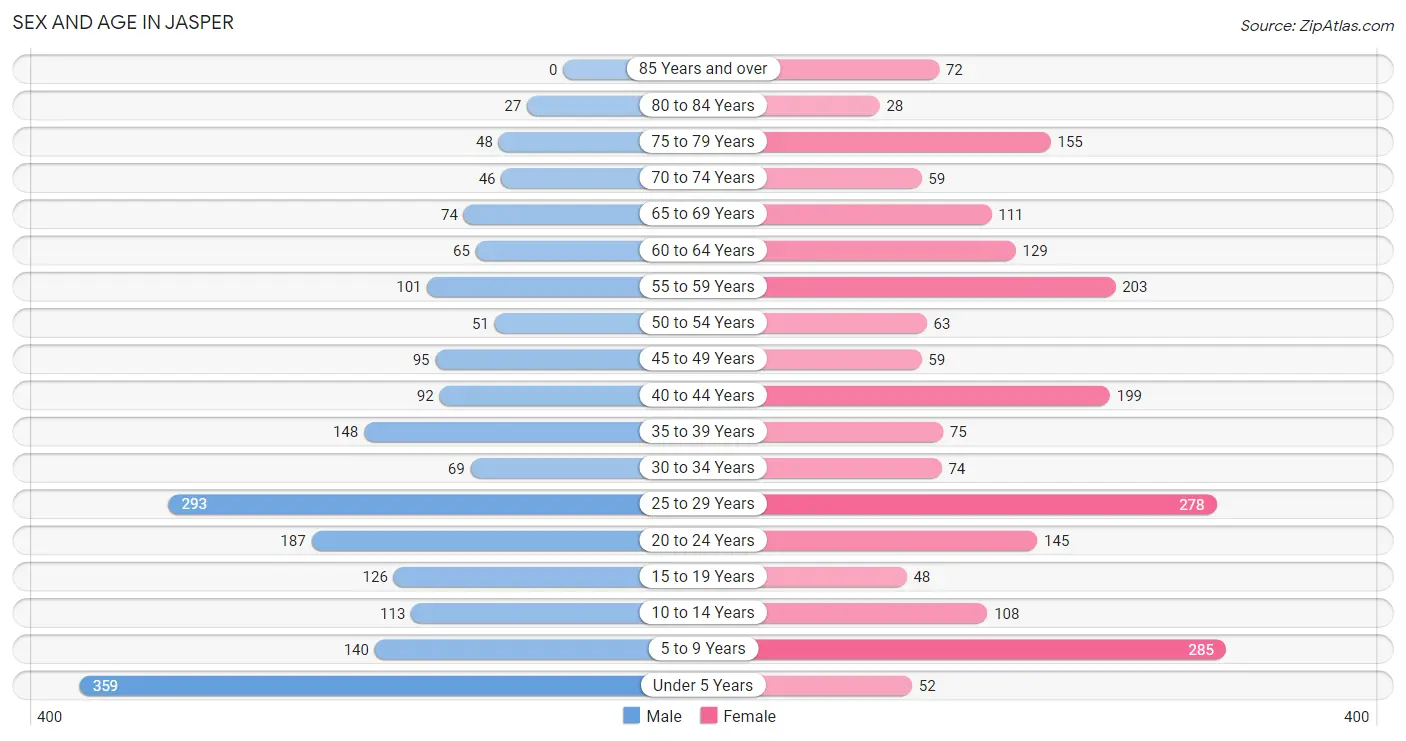
| Age Bracket | Male | Female |
| Under 5 Years | 359 (17.6%) | 52 (2.4%) |
| 5 to 9 Years | 140 (6.9%) | 285 (13.3%) |
| 10 to 14 Years | 113 (5.6%) | 108 (5.0%) |
| 15 to 19 Years | 126 (6.2%) | 48 (2.2%) |
| 20 to 24 Years | 187 (9.2%) | 145 (6.8%) |
| 25 to 29 Years | 293 (14.4%) | 278 (13.0%) |
| 30 to 34 Years | 69 (3.4%) | 74 (3.5%) |
| 35 to 39 Years | 148 (7.3%) | 75 (3.5%) |
| 40 to 44 Years | 92 (4.5%) | 199 (9.3%) |
| 45 to 49 Years | 95 (4.7%) | 59 (2.8%) |
| 50 to 54 Years | 51 (2.5%) | 63 (2.9%) |
| 55 to 59 Years | 101 (5.0%) | 203 (9.5%) |
| 60 to 64 Years | 65 (3.2%) | 129 (6.0%) |
| 65 to 69 Years | 74 (3.6%) | 111 (5.2%) |
| 70 to 74 Years | 46 (2.3%) | 59 (2.8%) |
| 75 to 79 Years | 48 (2.4%) | 155 (7.2%) |
| 80 to 84 Years | 27 (1.3%) | 28 (1.3%) |
| 85 Years and over | 0 (0.0%) | 72 (3.4%) |
| Total | 2,034 (100.0%) | 2,143 (100.0%) |
Families and Households in Jasper
Median Family Size in Jasper
The median family size in Jasper is 3.15 persons per family, with married-couple families (730 | 68.7%) accounting for the largest median family size of 3.55 persons per family. On the other hand, single female/mother families (270 | 25.4%) represent the smallest median family size with 2.12 persons per family.
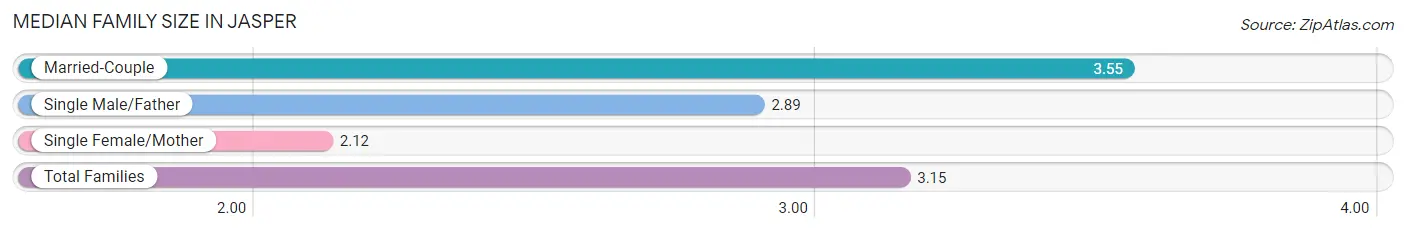
| Family Type | # Families | Family Size |
| Married-Couple | 730 (68.7%) | 3.55 |
| Single Male/Father | 62 (5.8%) | 2.89 |
| Single Female/Mother | 270 (25.4%) | 2.12 |
| Total Families | 1,062 (100.0%) | 3.15 |
Median Household Size in Jasper
The median household size in Jasper is 2.60 persons per household, with single male/father households (62 | 4.0%) accounting for the largest median household size of 3.97 persons per household. non-family households (490 | 31.6%) represent the smallest median household size with 1.26 persons per household.
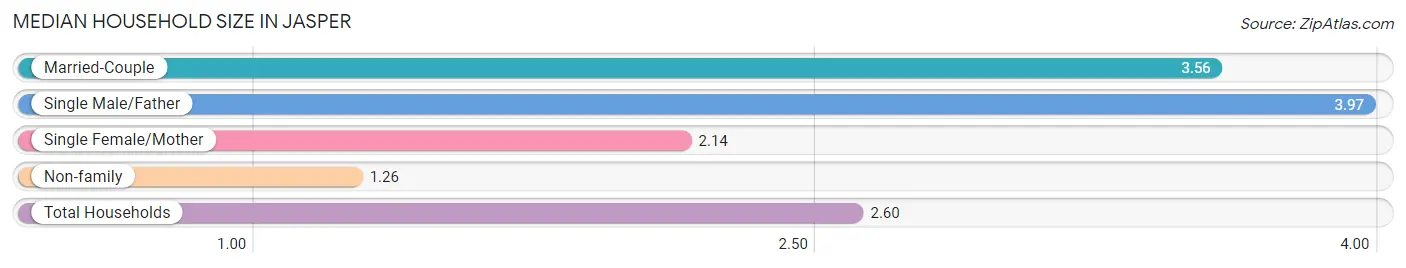
| Household Type | # Households | Household Size |
| Married-Couple | 730 (47.0%) | 3.56 |
| Single Male/Father | 62 (4.0%) | 3.97 |
| Single Female/Mother | 270 (17.4%) | 2.14 |
| Non-family | 490 (31.6%) | 1.26 |
| Total Households | 1,552 (100.0%) | 2.60 |
Household Size by Marriage Status in Jasper
Out of a total of 1,552 households in Jasper, 1,062 (68.4%) are family households, while 490 (31.6%) are nonfamily households. The most numerous type of family households are 2-person households, comprising 431, and the most common type of nonfamily households are 1-person households, comprising 385.
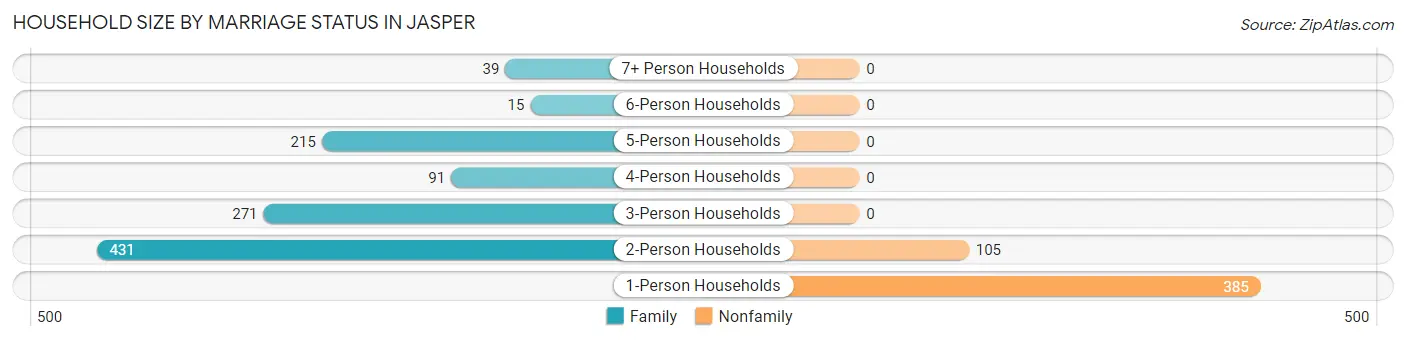
| Household Size | Family Households | Nonfamily Households |
| 1-Person Households | - | 385 (24.8%) |
| 2-Person Households | 431 (27.8%) | 105 (6.8%) |
| 3-Person Households | 271 (17.5%) | 0 (0.0%) |
| 4-Person Households | 91 (5.9%) | 0 (0.0%) |
| 5-Person Households | 215 (13.9%) | 0 (0.0%) |
| 6-Person Households | 15 (1.0%) | 0 (0.0%) |
| 7+ Person Households | 39 (2.5%) | 0 (0.0%) |
| Total | 1,062 (68.4%) | 490 (31.6%) |
Female Fertility in Jasper
Fertility by Age in Jasper
Average fertility rate in Jasper is 114.0 births per 1,000 women. Women in the age bracket of 20 to 34 years have the highest fertility rate with 201.0 births per 1,000 women. Women in the age bracket of 20 to 34 years acount for 100.0% of all women with births.
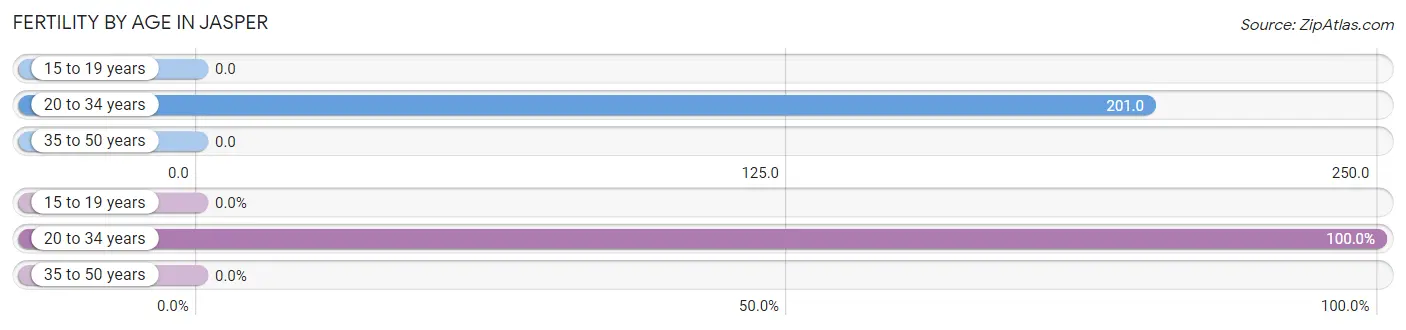
| Age Bracket | Women with Births | Births / 1,000 Women |
| 15 to 19 years | 0 (0.0%) | 0.0 |
| 20 to 34 years | 100 (100.0%) | 201.0 |
| 35 to 50 years | 0 (0.0%) | 0.0 |
| Total | 100 (100.0%) | 114.0 |
Fertility by Age by Marriage Status in Jasper
81.0% of women with births (100) in Jasper are married. The highest percentage of unmarried women with births falls into 20 to 34 years age bracket with 19.0% of them unmarried at the time of birth, while the lowest percentage of unmarried women with births belong to 20 to 34 years age bracket with 19.0% of them unmarried.
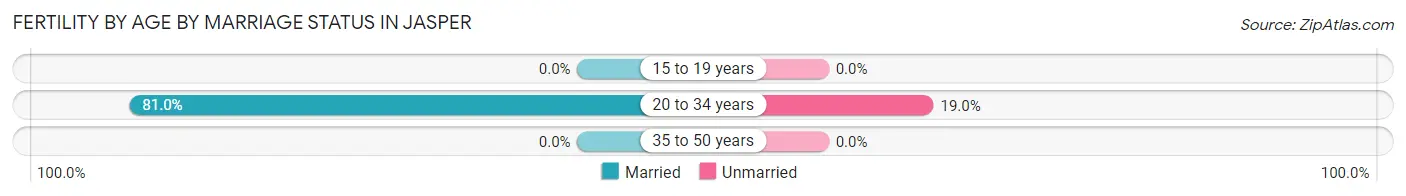
| Age Bracket | Married | Unmarried |
| 15 to 19 years | 0 (0.0%) | 0 (0.0%) |
| 20 to 34 years | 81 (81.0%) | 19 (19.0%) |
| 35 to 50 years | 0 (0.0%) | 0 (0.0%) |
| Total | 81 (81.0%) | 19 (19.0%) |
Fertility by Education in Jasper
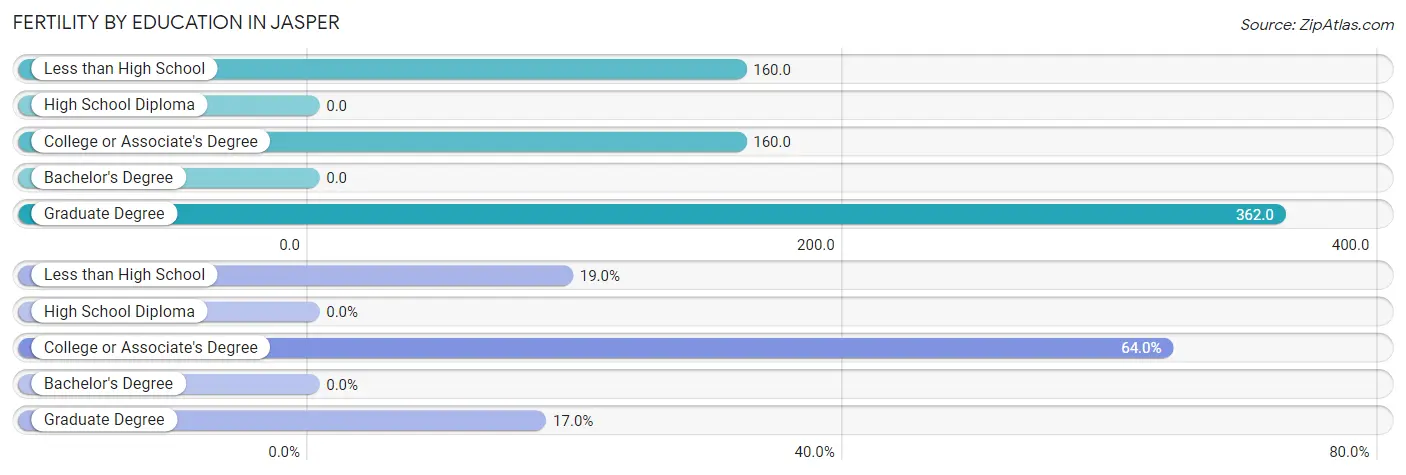
| Educational Attainment | Women with Births | Births / 1,000 Women |
| Less than High School | 19 (19.0%) | 160.0 |
| High School Diploma | 0 (0.0%) | 0.0 |
| College or Associate's Degree | 64 (64.0%) | 160.0 |
| Bachelor's Degree | 0 (0.0%) | 0.0 |
| Graduate Degree | 17 (17.0%) | 362.0 |
| Total | 100 (100.0%) | 114.0 |
Fertility by Education by Marriage Status in Jasper
19.0% of women with births in Jasper are unmarried. Women with the educational attainment of college or associate's degree are most likely to be married with 100.0% of them married at childbirth, while women with the educational attainment of less than high school are least likely to be married with 100.0% of them unmarried at childbirth.
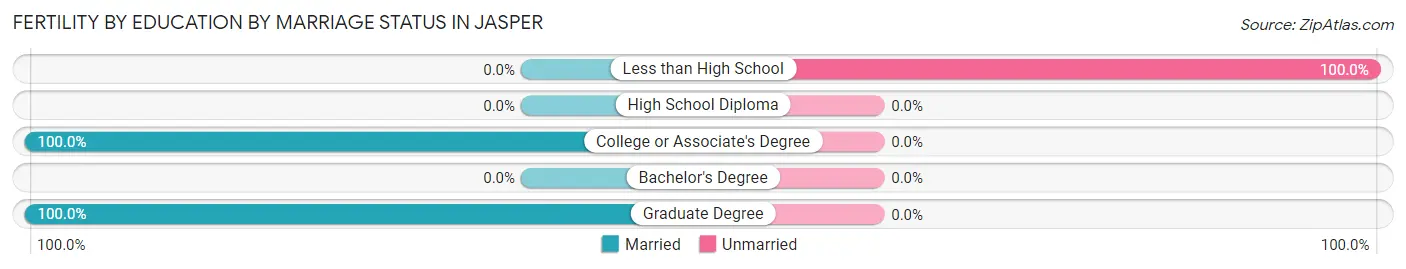
| Educational Attainment | Married | Unmarried |
| Less than High School | 0 (0.0%) | 19 (100.0%) |
| High School Diploma | 0 (0.0%) | 0 (0.0%) |
| College or Associate's Degree | 64 (100.0%) | 0 (0.0%) |
| Bachelor's Degree | 0 (0.0%) | 0 (0.0%) |
| Graduate Degree | 17 (100.0%) | 0 (0.0%) |
| Total | 81 (81.0%) | 19 (19.0%) |
Employment Characteristics in Jasper
Employment by Class of Employer in Jasper
Among the 1,567 employed individuals in Jasper, private company employees (1,151 | 73.5%), local government employees (150 | 9.6%), and not-for-profit organizations (105 | 6.7%) make up the most common classes of employment.
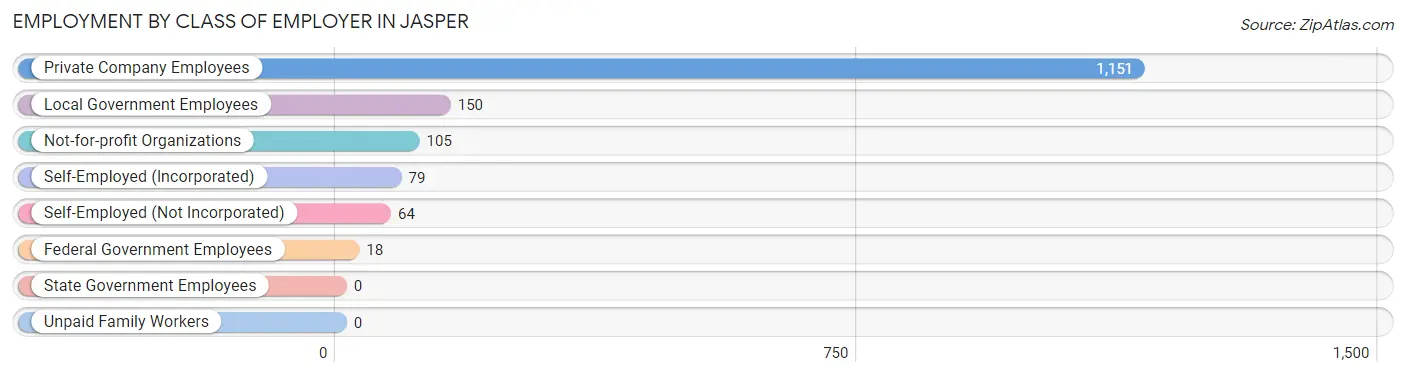
| Employer Class | # Employees | % Employees |
| Private Company Employees | 1,151 | 73.5% |
| Self-Employed (Incorporated) | 79 | 5.0% |
| Self-Employed (Not Incorporated) | 64 | 4.1% |
| Not-for-profit Organizations | 105 | 6.7% |
| Local Government Employees | 150 | 9.6% |
| State Government Employees | 0 | 0.0% |
| Federal Government Employees | 18 | 1.1% |
| Unpaid Family Workers | 0 | 0.0% |
| Total | 1,567 | 100.0% |
Employment Status by Age in Jasper
According to the labor force statistics for Jasper, out of the total population over 16 years of age (3,061), 52.0% or 1,592 individuals are in the labor force, with 1.1% or 18 of them unemployed. The age group with the highest labor force participation rate is 35 to 44 years, with 90.5% or 465 individuals in the labor force. Within the labor force, the 25 to 29 years age range has the highest percentage of unemployed individuals, with 5.5% or 17 of them being unemployed.
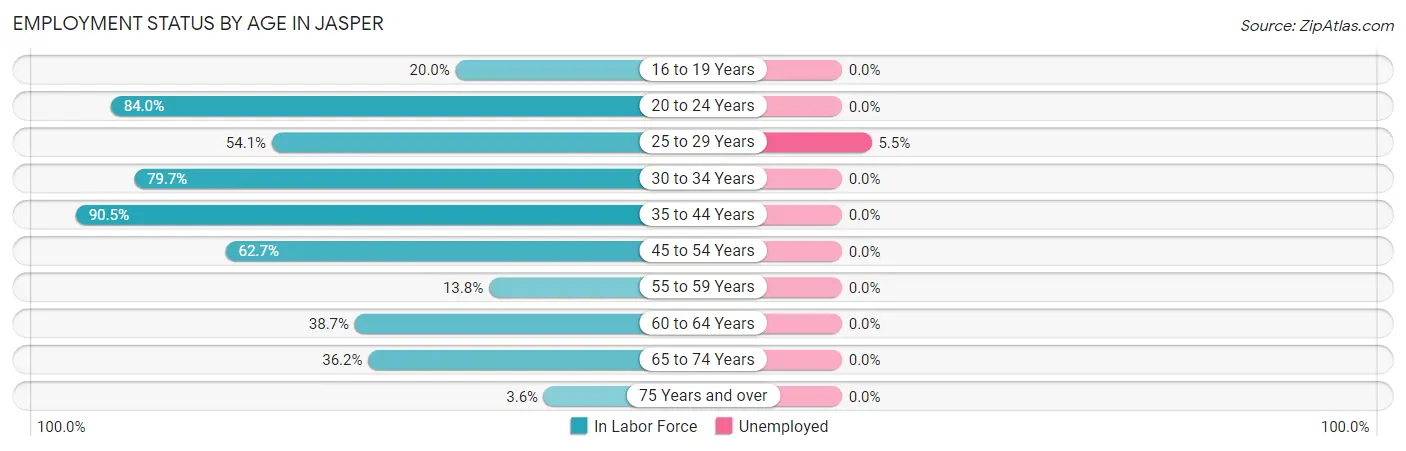
| Age Bracket | In Labor Force | Unemployed |
| 16 to 19 Years | 23 (20.0%) | 0 (0.0%) |
| 20 to 24 Years | 279 (84.0%) | 0 (0.0%) |
| 25 to 29 Years | 309 (54.1%) | 17 (5.5%) |
| 30 to 34 Years | 114 (79.7%) | 0 (0.0%) |
| 35 to 44 Years | 465 (90.5%) | 0 (0.0%) |
| 45 to 54 Years | 168 (62.7%) | 0 (0.0%) |
| 55 to 59 Years | 42 (13.8%) | 0 (0.0%) |
| 60 to 64 Years | 75 (38.7%) | 0 (0.0%) |
| 65 to 74 Years | 105 (36.2%) | 0 (0.0%) |
| 75 Years and over | 12 (3.6%) | 0 (0.0%) |
| Total | 1,592 (52.0%) | 18 (1.1%) |
Employment Status by Educational Attainment in Jasper
According to labor force statistics for Jasper, 58.8% of individuals (1,172) out of the total population between 25 and 64 years of age (1,994) are in the labor force, with 1.4% or 16 of them being unemployed. The group with the highest labor force participation rate are those with the educational attainment of college / associate degree, with 83.6% or 526 individuals in the labor force. Within the labor force, individuals with less than high school education have the highest percentage of unemployment, with 6.9% or 17 of them being unemployed.
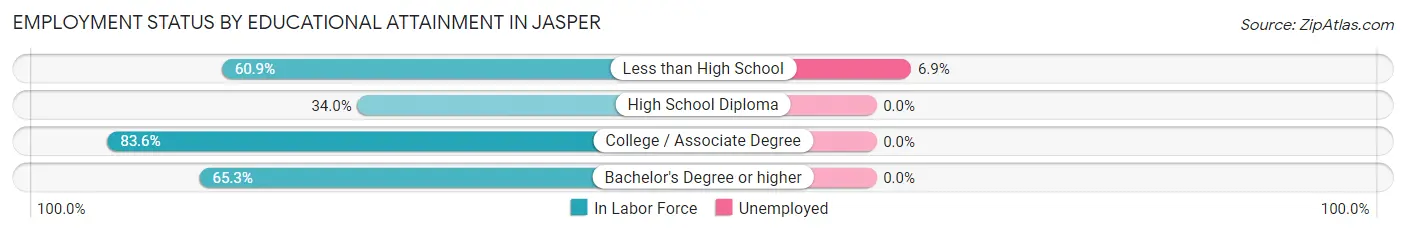
| Educational Attainment | In Labor Force | Unemployed |
| Less than High School | 245 (60.9%) | 28 (6.9%) |
| High School Diploma | 246 (34.0%) | 0 (0.0%) |
| College / Associate Degree | 526 (83.6%) | 0 (0.0%) |
| Bachelor's Degree or higher | 156 (65.3%) | 0 (0.0%) |
| Total | 1,172 (58.8%) | 28 (1.4%) |
Employment Occupations by Sex in Jasper
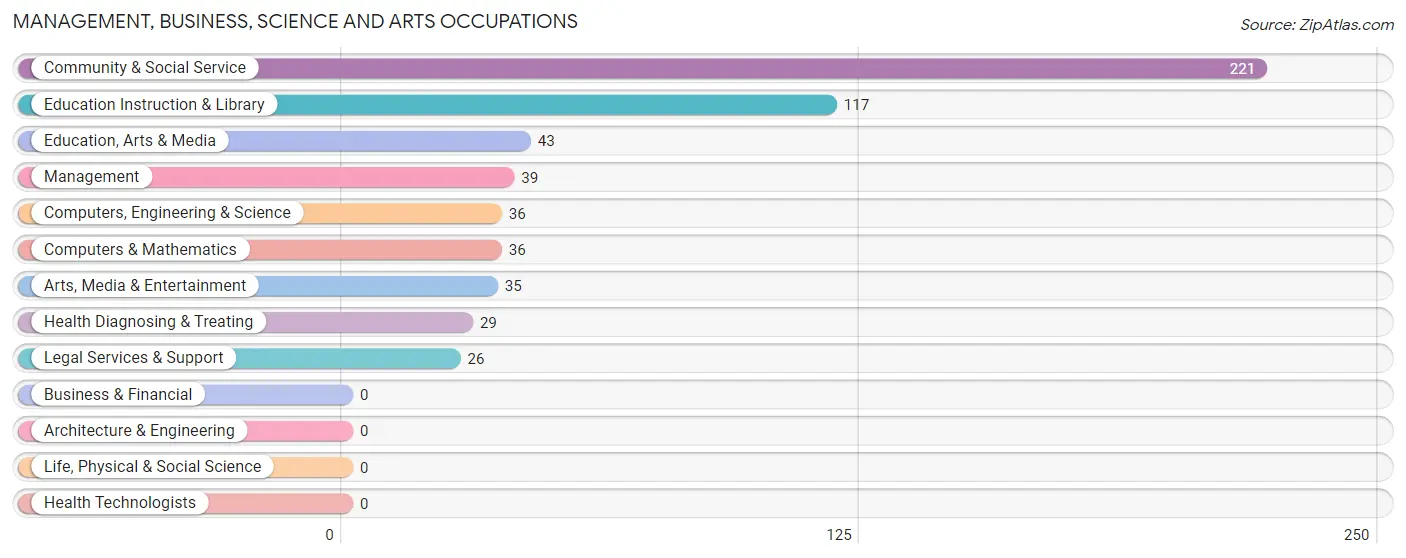
Management, Business, Science and Arts Occupations
The most common Management, Business, Science and Arts occupations in Jasper are Community & Social Service (221 | 14.0%), Education Instruction & Library (117 | 7.4%), Education, Arts & Media (43 | 2.7%), Management (39 | 2.5%), and Computers, Engineering & Science (36 | 2.3%).
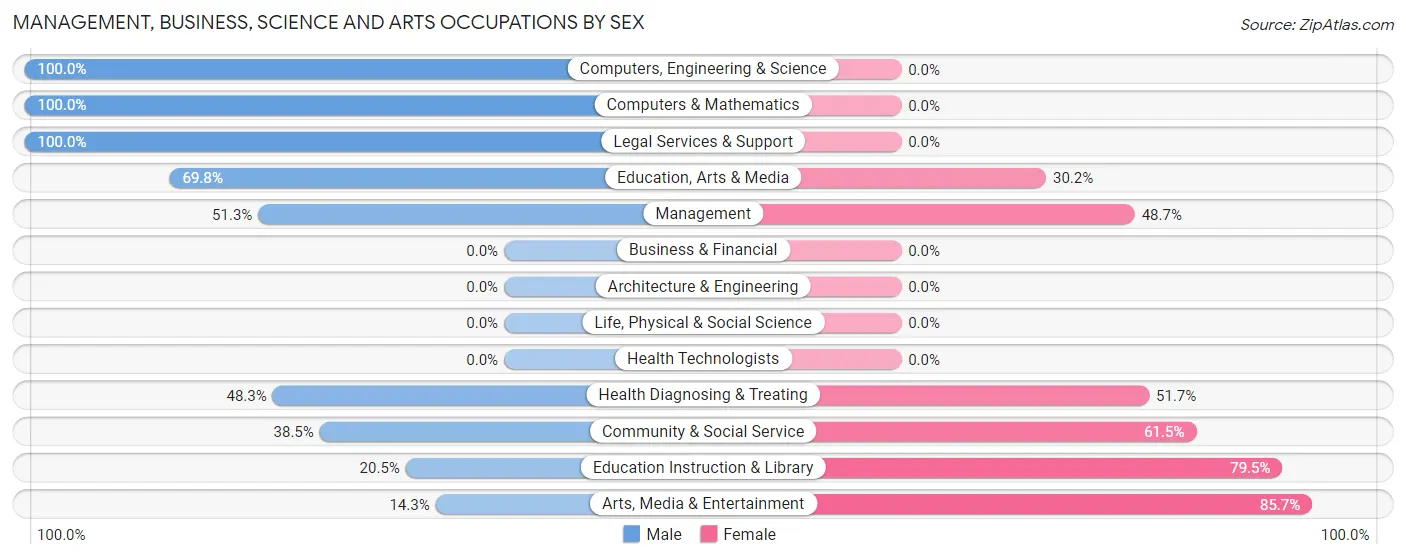
Management, Business, Science and Arts Occupations by Sex
Within the Management, Business, Science and Arts occupations in Jasper, the most male-oriented occupations are Computers, Engineering & Science (100.0%), Computers & Mathematics (100.0%), and Legal Services & Support (100.0%), while the most female-oriented occupations are Arts, Media & Entertainment (85.7%), Education Instruction & Library (79.5%), and Community & Social Service (61.5%).
| Occupation | Male | Female |
| Management | 20 (51.3%) | 19 (48.7%) |
| Business & Financial | 0 (0.0%) | 0 (0.0%) |
| Computers, Engineering & Science | 36 (100.0%) | 0 (0.0%) |
| Computers & Mathematics | 36 (100.0%) | 0 (0.0%) |
| Architecture & Engineering | 0 (0.0%) | 0 (0.0%) |
| Life, Physical & Social Science | 0 (0.0%) | 0 (0.0%) |
| Community & Social Service | 85 (38.5%) | 136 (61.5%) |
| Education, Arts & Media | 30 (69.8%) | 13 (30.2%) |
| Legal Services & Support | 26 (100.0%) | 0 (0.0%) |
| Education Instruction & Library | 24 (20.5%) | 93 (79.5%) |
| Arts, Media & Entertainment | 5 (14.3%) | 30 (85.7%) |
| Health Diagnosing & Treating | 14 (48.3%) | 15 (51.7%) |
| Health Technologists | 0 (0.0%) | 0 (0.0%) |
| Total (Category) | 155 (47.7%) | 170 (52.3%) |
| Total (Overall) | 903 (57.3%) | 672 (42.7%) |
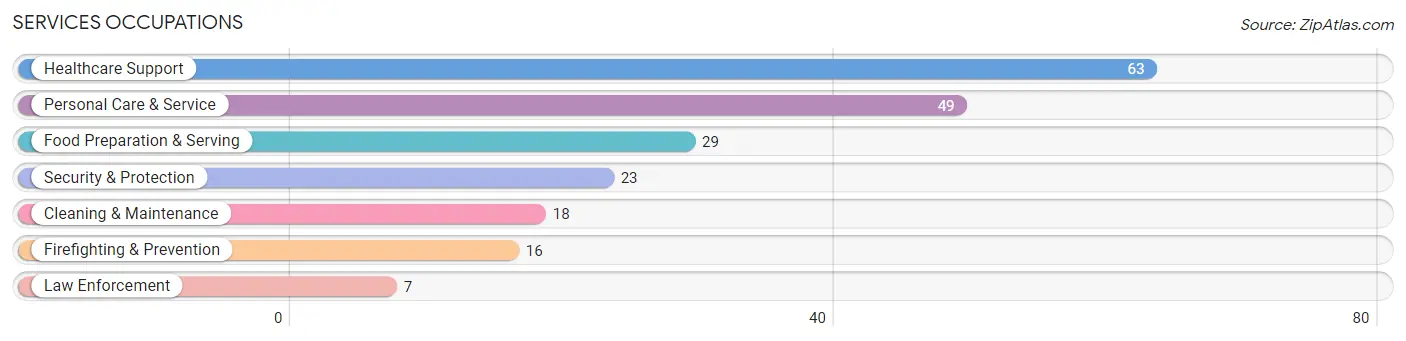
Services Occupations
The most common Services occupations in Jasper are Healthcare Support (63 | 4.0%), Personal Care & Service (49 | 3.1%), Food Preparation & Serving (29 | 1.8%), Security & Protection (23 | 1.5%), and Cleaning & Maintenance (18 | 1.1%).
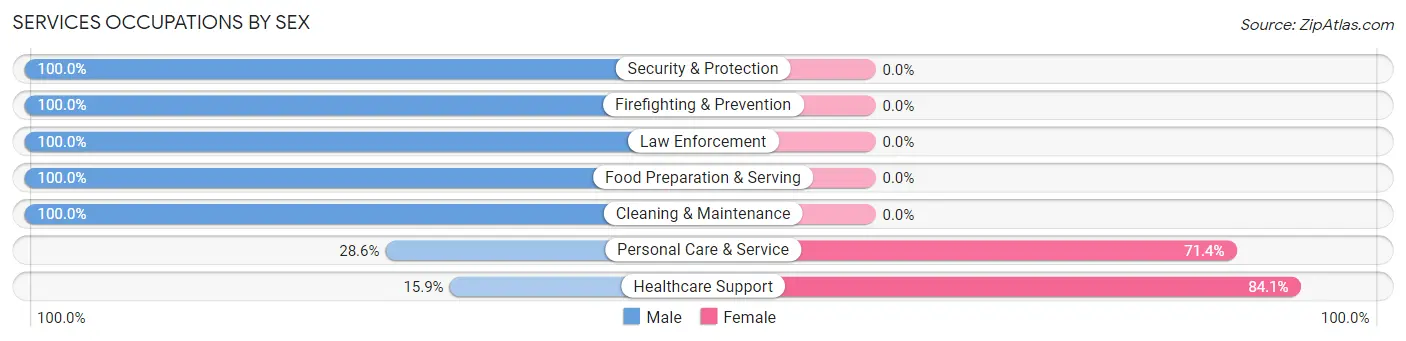
Services Occupations by Sex
Within the Services occupations in Jasper, the most male-oriented occupations are Security & Protection (100.0%), Firefighting & Prevention (100.0%), and Law Enforcement (100.0%), while the most female-oriented occupations are Healthcare Support (84.1%), and Personal Care & Service (71.4%).
| Occupation | Male | Female |
| Healthcare Support | 10 (15.9%) | 53 (84.1%) |
| Security & Protection | 23 (100.0%) | 0 (0.0%) |
| Firefighting & Prevention | 16 (100.0%) | 0 (0.0%) |
| Law Enforcement | 7 (100.0%) | 0 (0.0%) |
| Food Preparation & Serving | 29 (100.0%) | 0 (0.0%) |
| Cleaning & Maintenance | 18 (100.0%) | 0 (0.0%) |
| Personal Care & Service | 14 (28.6%) | 35 (71.4%) |
| Total (Category) | 94 (51.6%) | 88 (48.3%) |
| Total (Overall) | 903 (57.3%) | 672 (42.7%) |
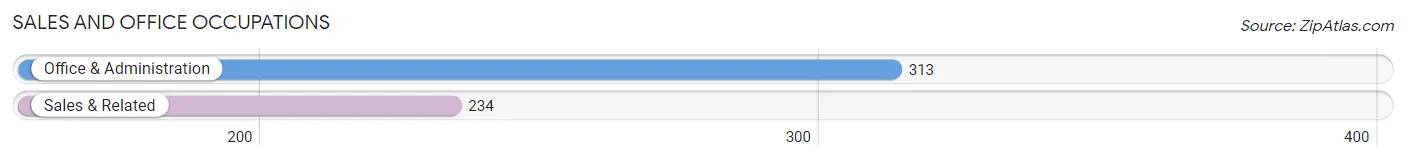
Sales and Office Occupations
The most common Sales and Office occupations in Jasper are Office & Administration (313 | 19.9%), and Sales & Related (234 | 14.9%).
Sales and Office Occupations by Sex
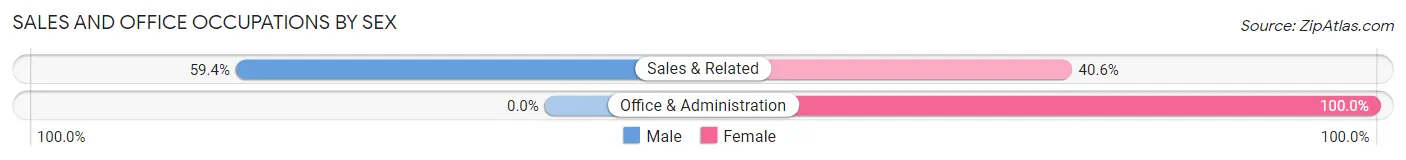
| Occupation | Male | Female |
| Sales & Related | 139 (59.4%) | 95 (40.6%) |
| Office & Administration | 0 (0.0%) | 313 (100.0%) |
| Total (Category) | 139 (25.4%) | 408 (74.6%) |
| Total (Overall) | 903 (57.3%) | 672 (42.7%) |
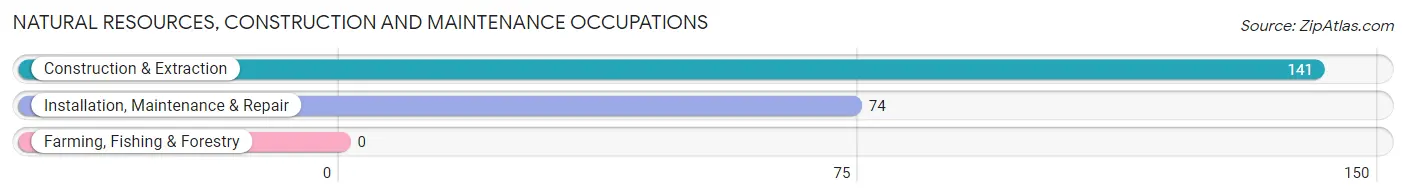
Natural Resources, Construction and Maintenance Occupations
The most common Natural Resources, Construction and Maintenance occupations in Jasper are Construction & Extraction (141 | 8.9%), and Installation, Maintenance & Repair (74 | 4.7%).
Natural Resources, Construction and Maintenance Occupations by Sex
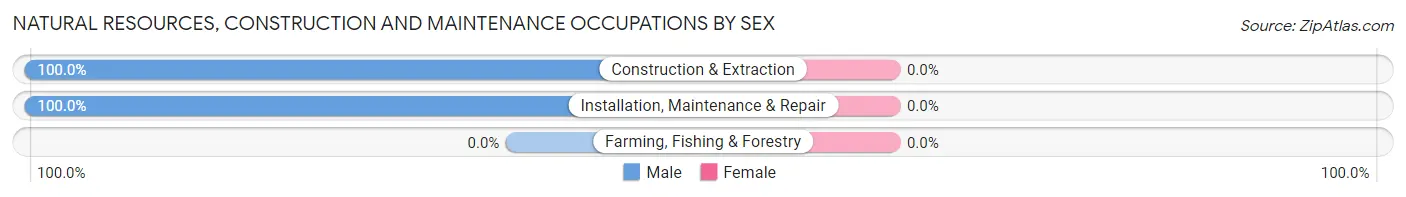
| Occupation | Male | Female |
| Farming, Fishing & Forestry | 0 (0.0%) | 0 (0.0%) |
| Construction & Extraction | 141 (100.0%) | 0 (0.0%) |
| Installation, Maintenance & Repair | 74 (100.0%) | 0 (0.0%) |
| Total (Category) | 215 (100.0%) | 0 (0.0%) |
| Total (Overall) | 903 (57.3%) | 672 (42.7%) |
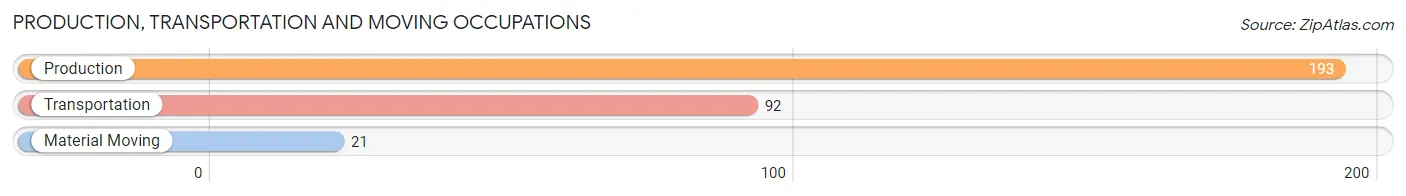
Production, Transportation and Moving Occupations
The most common Production, Transportation and Moving occupations in Jasper are Production (193 | 12.2%), Transportation (92 | 5.8%), and Material Moving (21 | 1.3%).
Production, Transportation and Moving Occupations by Sex
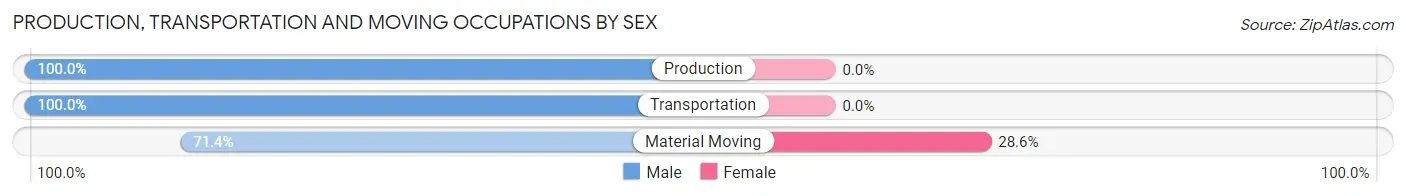
| Occupation | Male | Female |
| Production | 193 (100.0%) | 0 (0.0%) |
| Transportation | 92 (100.0%) | 0 (0.0%) |
| Material Moving | 15 (71.4%) | 6 (28.6%) |
| Total (Category) | 300 (98.0%) | 6 (2.0%) |
| Total (Overall) | 903 (57.3%) | 672 (42.7%) |
Employment Industries by Sex in Jasper
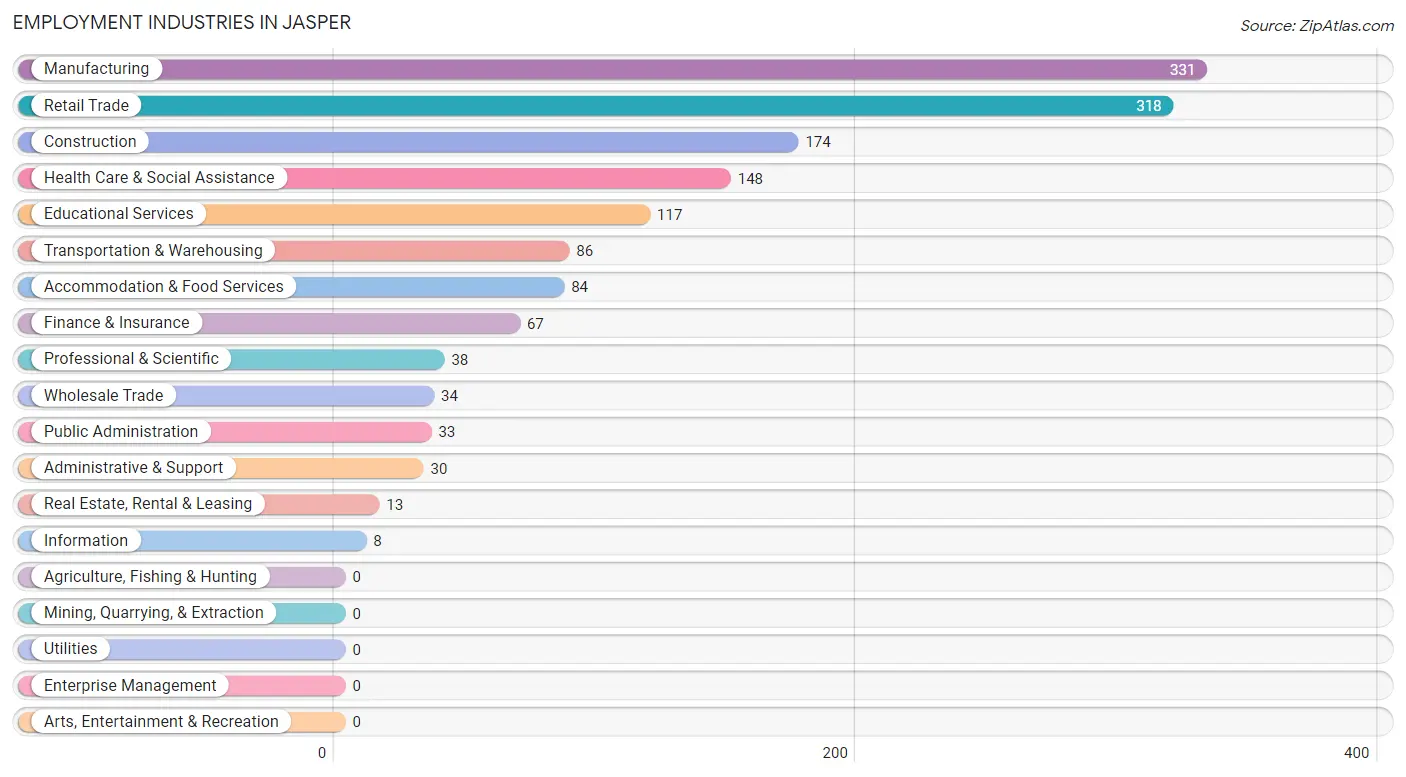
Employment Industries in Jasper
The major employment industries in Jasper include Manufacturing (331 | 21.0%), Retail Trade (318 | 20.2%), Construction (174 | 11.1%), Health Care & Social Assistance (148 | 9.4%), and Educational Services (117 | 7.4%).
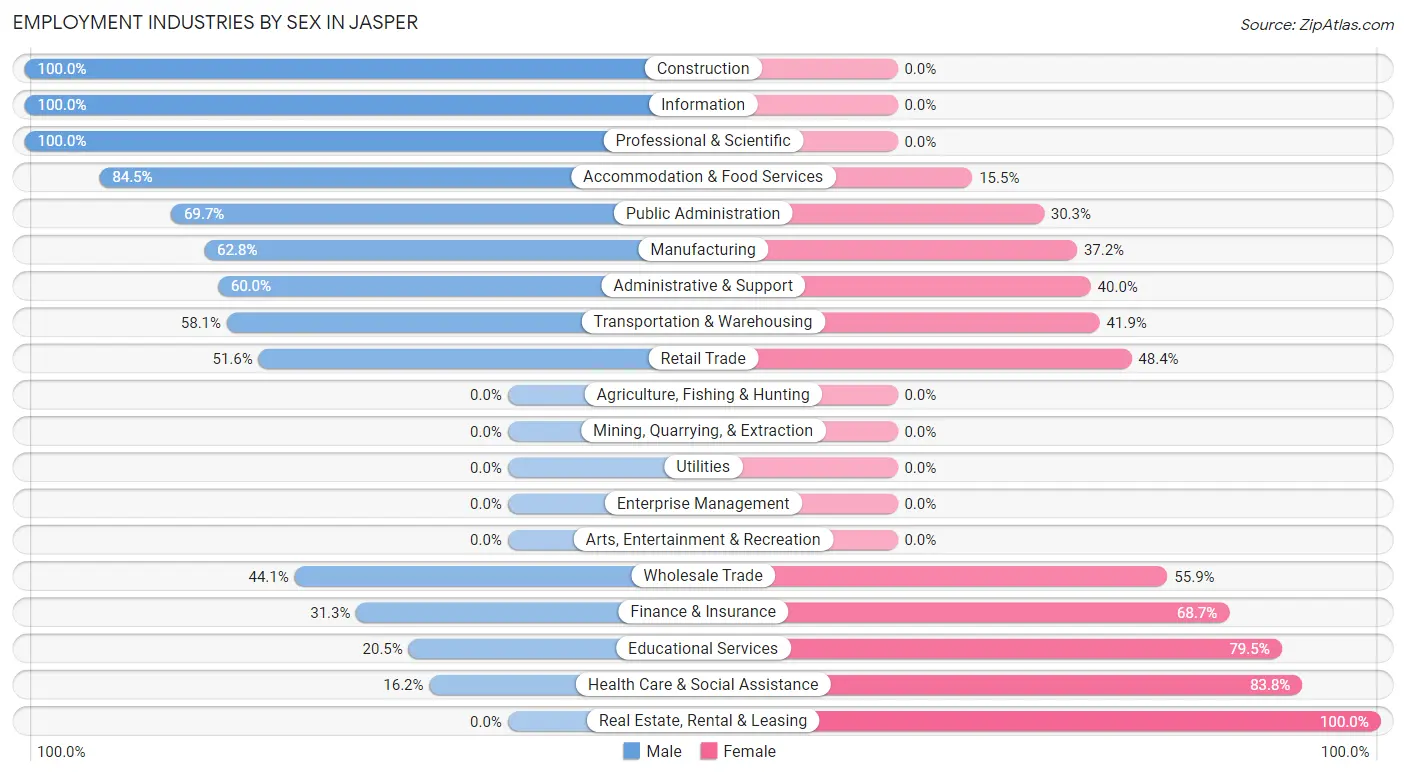
Employment Industries by Sex in Jasper
The Jasper industries that see more men than women are Construction (100.0%), Information (100.0%), and Professional & Scientific (100.0%), whereas the industries that tend to have a higher number of women are Real Estate, Rental & Leasing (100.0%), Health Care & Social Assistance (83.8%), and Educational Services (79.5%).
| Industry | Male | Female |
| Agriculture, Fishing & Hunting | 0 (0.0%) | 0 (0.0%) |
| Mining, Quarrying, & Extraction | 0 (0.0%) | 0 (0.0%) |
| Construction | 174 (100.0%) | 0 (0.0%) |
| Manufacturing | 208 (62.8%) | 123 (37.2%) |
| Wholesale Trade | 15 (44.1%) | 19 (55.9%) |
| Retail Trade | 164 (51.6%) | 154 (48.4%) |
| Transportation & Warehousing | 50 (58.1%) | 36 (41.9%) |
| Utilities | 0 (0.0%) | 0 (0.0%) |
| Information | 8 (100.0%) | 0 (0.0%) |
| Finance & Insurance | 21 (31.3%) | 46 (68.7%) |
| Real Estate, Rental & Leasing | 0 (0.0%) | 13 (100.0%) |
| Professional & Scientific | 38 (100.0%) | 0 (0.0%) |
| Enterprise Management | 0 (0.0%) | 0 (0.0%) |
| Administrative & Support | 18 (60.0%) | 12 (40.0%) |
| Educational Services | 24 (20.5%) | 93 (79.5%) |
| Health Care & Social Assistance | 24 (16.2%) | 124 (83.8%) |
| Arts, Entertainment & Recreation | 0 (0.0%) | 0 (0.0%) |
| Accommodation & Food Services | 71 (84.5%) | 13 (15.5%) |
| Public Administration | 23 (69.7%) | 10 (30.3%) |
| Total | 903 (57.3%) | 672 (42.7%) |
Education in Jasper
School Enrollment in Jasper
The most common levels of schooling among the 973 students in Jasper are elementary school (234 | 24.0%), kindergarten (229 | 23.5%), and college / undergraduate (178 | 18.3%).
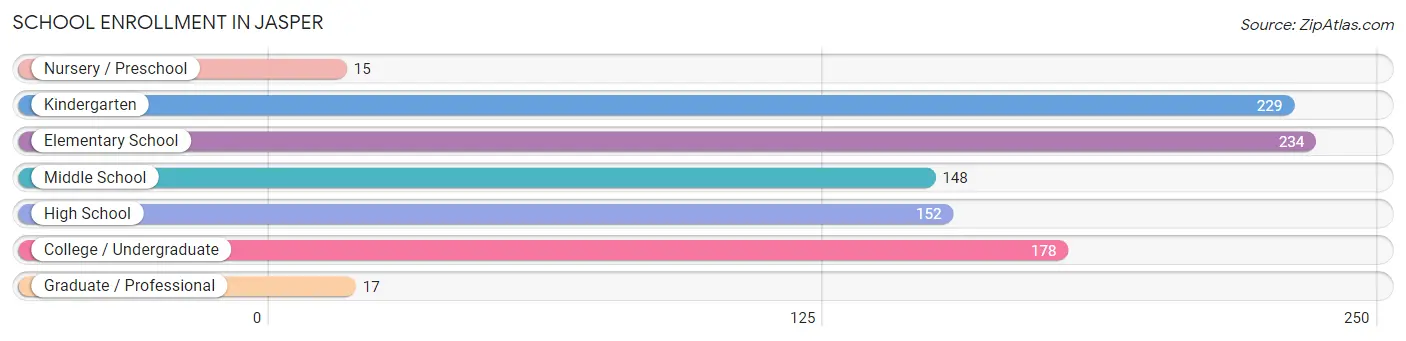
| School Level | # Students | % Students |
| Nursery / Preschool | 15 | 1.5% |
| Kindergarten | 229 | 23.5% |
| Elementary School | 234 | 24.0% |
| Middle School | 148 | 15.2% |
| High School | 152 | 15.6% |
| College / Undergraduate | 178 | 18.3% |
| Graduate / Professional | 17 | 1.8% |
| Total | 973 | 100.0% |
School Enrollment by Age by Funding Source in Jasper
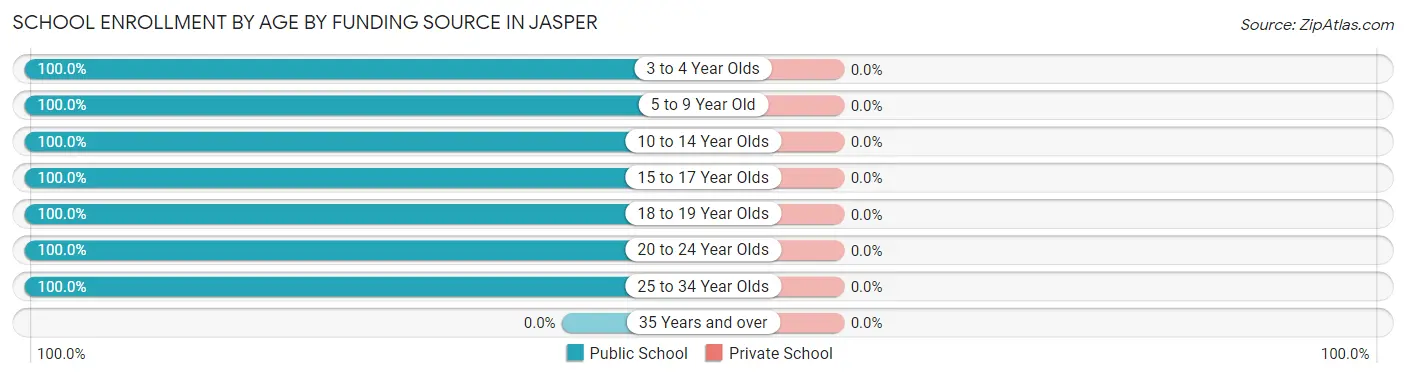
| Age Bracket | Public School | Private School |
| 3 to 4 Year Olds | 15 (100.0%) | 0 (0.0%) |
| 5 to 9 Year Old | 425 (100.0%) | 0 (0.0%) |
| 10 to 14 Year Olds | 221 (100.0%) | 0 (0.0%) |
| 15 to 17 Year Olds | 108 (100.0%) | 0 (0.0%) |
| 18 to 19 Year Olds | 43 (100.0%) | 0 (0.0%) |
| 20 to 24 Year Olds | 84 (100.0%) | 0 (0.0%) |
| 25 to 34 Year Olds | 77 (100.0%) | 0 (0.0%) |
| 35 Years and over | 0 (0.0%) | 0 (0.0%) |
| Total | 973 (100.0%) | 0 (0.0%) |
Educational Attainment by Field of Study in Jasper
Education (144 | 33.6%), business (114 | 26.6%), arts & humanities (60 | 14.0%), social sciences (46 | 10.7%), and engineering (27 | 6.3%) are the most common fields of study among 429 individuals in Jasper who have obtained a bachelor's degree or higher.
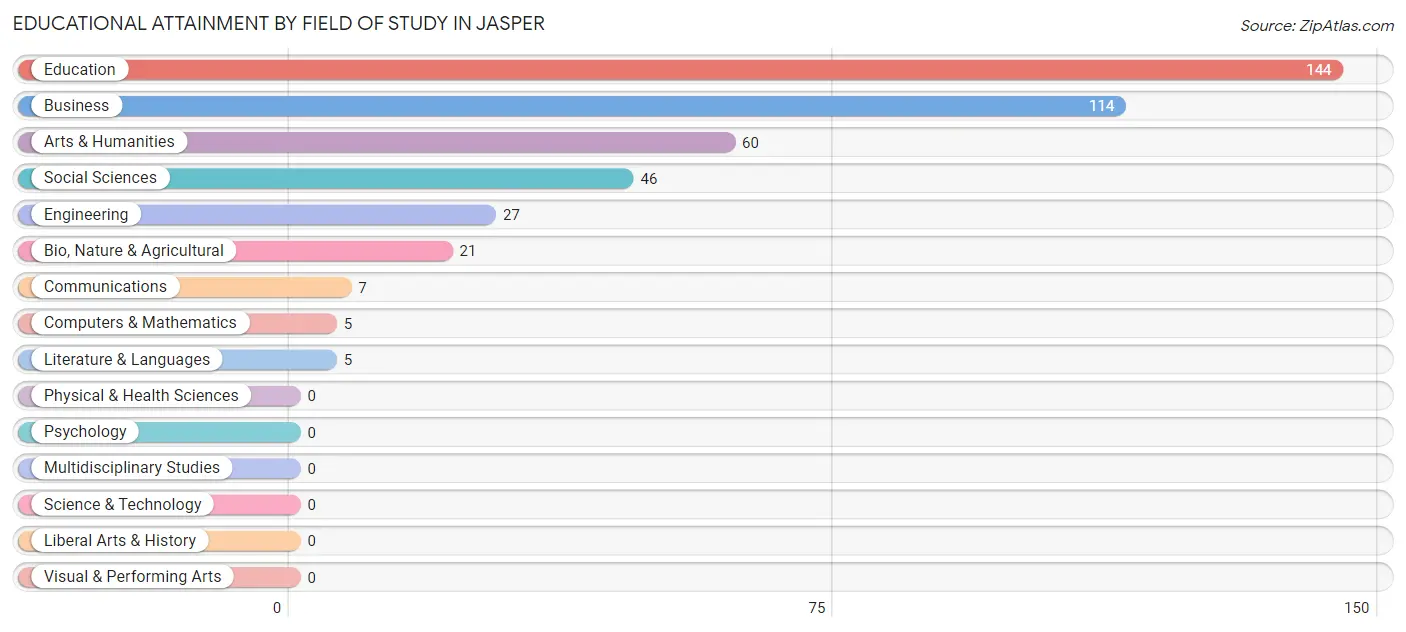
| Field of Study | # Graduates | % Graduates |
| Computers & Mathematics | 5 | 1.2% |
| Bio, Nature & Agricultural | 21 | 4.9% |
| Physical & Health Sciences | 0 | 0.0% |
| Psychology | 0 | 0.0% |
| Social Sciences | 46 | 10.7% |
| Engineering | 27 | 6.3% |
| Multidisciplinary Studies | 0 | 0.0% |
| Science & Technology | 0 | 0.0% |
| Business | 114 | 26.6% |
| Education | 144 | 33.6% |
| Literature & Languages | 5 | 1.2% |
| Liberal Arts & History | 0 | 0.0% |
| Visual & Performing Arts | 0 | 0.0% |
| Communications | 7 | 1.6% |
| Arts & Humanities | 60 | 14.0% |
| Total | 429 | 100.0% |
Transportation & Commute in Jasper
Vehicle Availability by Sex in Jasper
The most prevalent vehicle ownership categories in Jasper are males with 1 vehicle (333, accounting for 37.2%) and females with 1 vehicle (213, making up 49.5%).
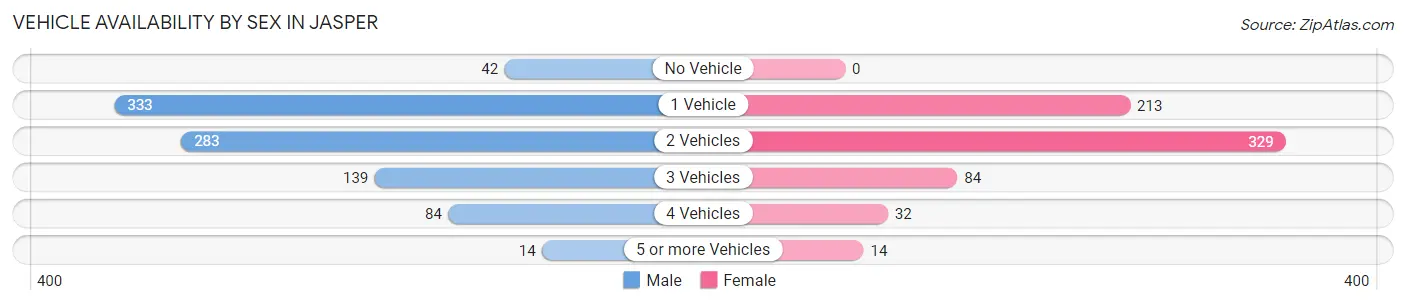
| Vehicles Available | Male | Female |
| No Vehicle | 42 (4.7%) | 0 (0.0%) |
| 1 Vehicle | 333 (37.2%) | 213 (31.7%) |
| 2 Vehicles | 283 (31.6%) | 329 (49.0%) |
| 3 Vehicles | 139 (15.5%) | 84 (12.5%) |
| 4 Vehicles | 84 (9.4%) | 32 (4.8%) |
| 5 or more Vehicles | 14 (1.6%) | 14 (2.1%) |
| Total | 895 (100.0%) | 672 (100.0%) |
Commute Time in Jasper
The most frequently occuring commute durations in Jasper are 10 to 14 minutes (241 commuters, 16.2%), 5 to 9 minutes (219 commuters, 14.7%), and 45 to 59 minutes (212 commuters, 14.3%).
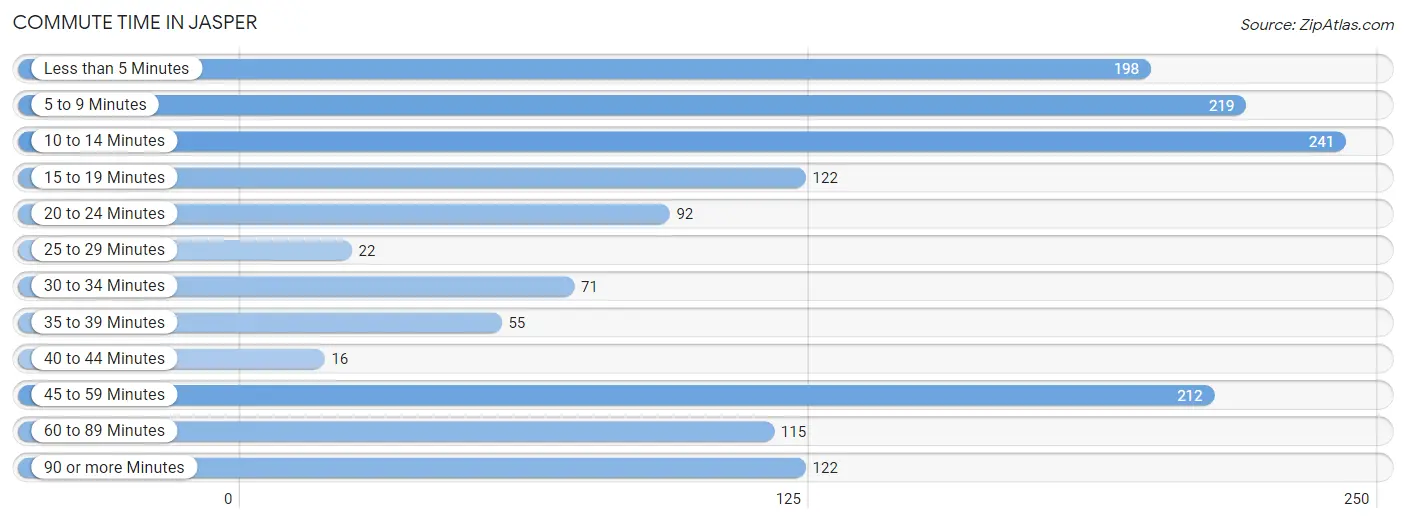
| Commute Time | # Commuters | % Commuters |
| Less than 5 Minutes | 198 | 13.3% |
| 5 to 9 Minutes | 219 | 14.7% |
| 10 to 14 Minutes | 241 | 16.2% |
| 15 to 19 Minutes | 122 | 8.2% |
| 20 to 24 Minutes | 92 | 6.2% |
| 25 to 29 Minutes | 22 | 1.5% |
| 30 to 34 Minutes | 71 | 4.8% |
| 35 to 39 Minutes | 55 | 3.7% |
| 40 to 44 Minutes | 16 | 1.1% |
| 45 to 59 Minutes | 212 | 14.3% |
| 60 to 89 Minutes | 115 | 7.7% |
| 90 or more Minutes | 122 | 8.2% |
Commute Time by Sex in Jasper
The most common commute times in Jasper are less than 5 minutes (198 commuters, 22.9%) for males and 45 to 59 minutes (161 commuters, 26.0%) for females.
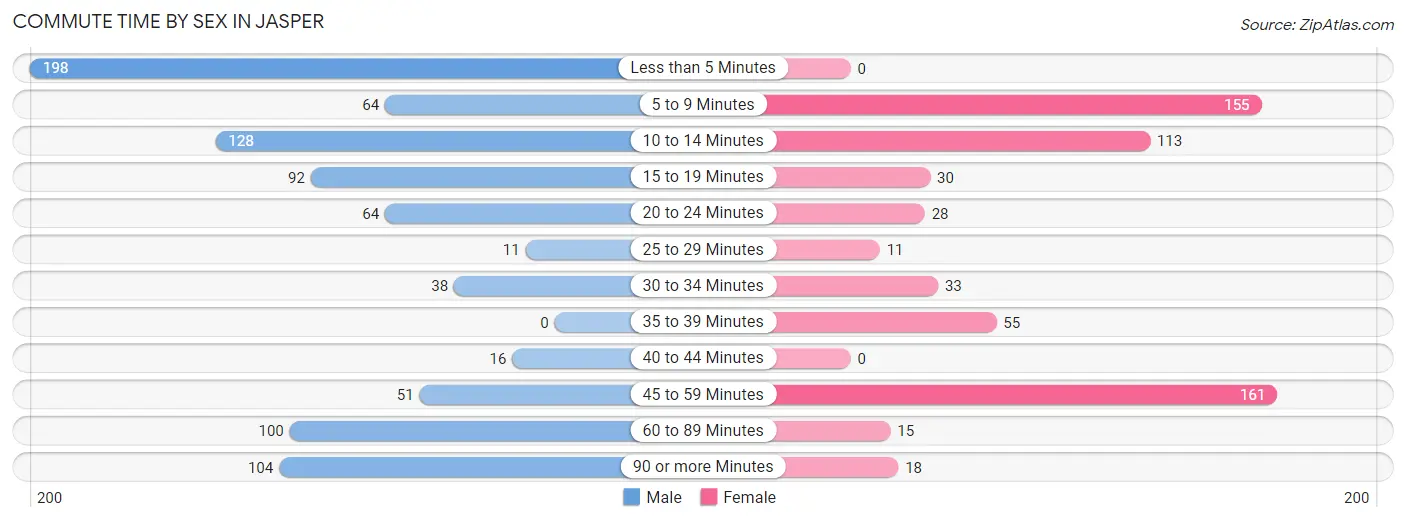
| Commute Time | Male | Female |
| Less than 5 Minutes | 198 (22.9%) | 0 (0.0%) |
| 5 to 9 Minutes | 64 (7.4%) | 155 (25.0%) |
| 10 to 14 Minutes | 128 (14.8%) | 113 (18.3%) |
| 15 to 19 Minutes | 92 (10.6%) | 30 (4.9%) |
| 20 to 24 Minutes | 64 (7.4%) | 28 (4.5%) |
| 25 to 29 Minutes | 11 (1.3%) | 11 (1.8%) |
| 30 to 34 Minutes | 38 (4.4%) | 33 (5.3%) |
| 35 to 39 Minutes | 0 (0.0%) | 55 (8.9%) |
| 40 to 44 Minutes | 16 (1.8%) | 0 (0.0%) |
| 45 to 59 Minutes | 51 (5.9%) | 161 (26.0%) |
| 60 to 89 Minutes | 100 (11.6%) | 15 (2.4%) |
| 90 or more Minutes | 104 (12.0%) | 18 (2.9%) |
Time of Departure to Work by Sex in Jasper
The most frequent times of departure to work in Jasper are 12:00 PM to 3:59 PM (206, 23.8%) for males and 6:30 AM to 6:59 AM (177, 28.6%) for females.
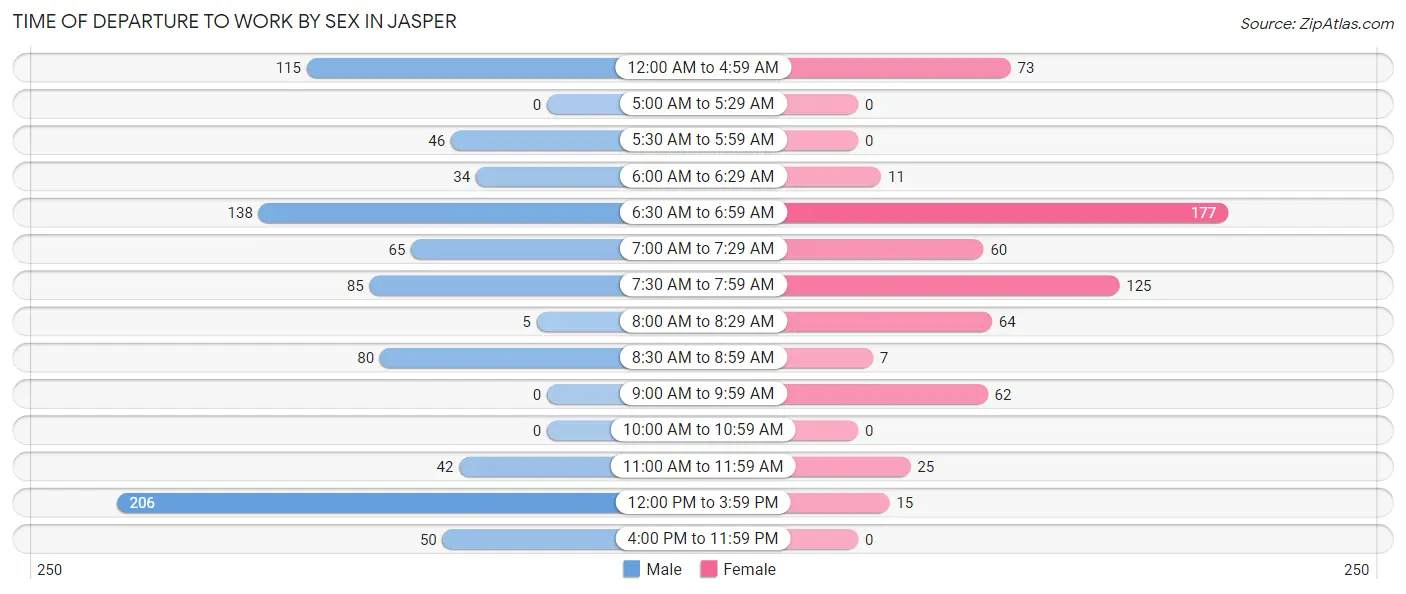
| Time of Departure | Male | Female |
| 12:00 AM to 4:59 AM | 115 (13.3%) | 73 (11.8%) |
| 5:00 AM to 5:29 AM | 0 (0.0%) | 0 (0.0%) |
| 5:30 AM to 5:59 AM | 46 (5.3%) | 0 (0.0%) |
| 6:00 AM to 6:29 AM | 34 (3.9%) | 11 (1.8%) |
| 6:30 AM to 6:59 AM | 138 (15.9%) | 177 (28.6%) |
| 7:00 AM to 7:29 AM | 65 (7.5%) | 60 (9.7%) |
| 7:30 AM to 7:59 AM | 85 (9.8%) | 125 (20.2%) |
| 8:00 AM to 8:29 AM | 5 (0.6%) | 64 (10.3%) |
| 8:30 AM to 8:59 AM | 80 (9.2%) | 7 (1.1%) |
| 9:00 AM to 9:59 AM | 0 (0.0%) | 62 (10.0%) |
| 10:00 AM to 10:59 AM | 0 (0.0%) | 0 (0.0%) |
| 11:00 AM to 11:59 AM | 42 (4.9%) | 25 (4.0%) |
| 12:00 PM to 3:59 PM | 206 (23.8%) | 15 (2.4%) |
| 4:00 PM to 11:59 PM | 50 (5.8%) | 0 (0.0%) |
| Total | 866 (100.0%) | 619 (100.0%) |
Housing Occupancy in Jasper
Occupancy by Ownership in Jasper
Of the total 1,552 dwellings in Jasper, owner-occupied units account for 693 (44.7%), while renter-occupied units make up 859 (55.3%).
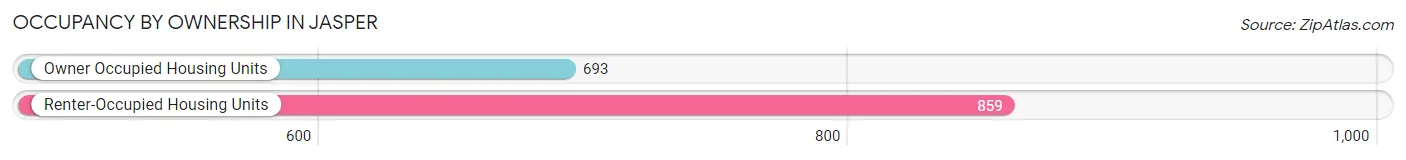
| Occupancy | # Housing Units | % Housing Units |
| Owner Occupied Housing Units | 693 | 44.7% |
| Renter-Occupied Housing Units | 859 | 55.3% |
| Total Occupied Housing Units | 1,552 | 100.0% |
Occupancy by Household Size in Jasper
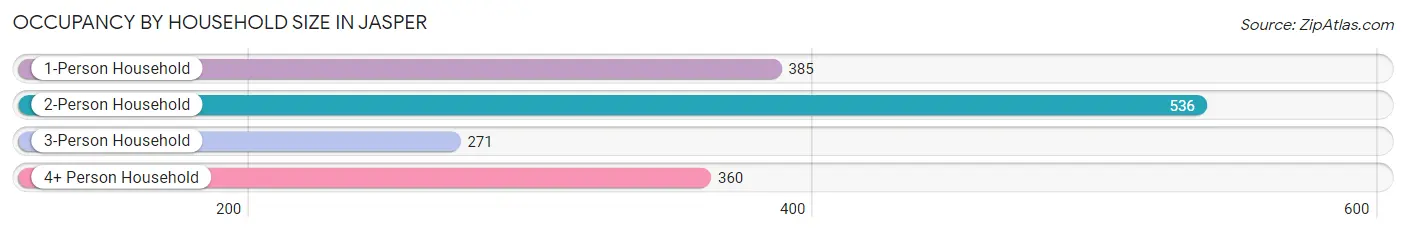
| Household Size | # Housing Units | % Housing Units |
| 1-Person Household | 385 | 24.8% |
| 2-Person Household | 536 | 34.5% |
| 3-Person Household | 271 | 17.5% |
| 4+ Person Household | 360 | 23.2% |
| Total Housing Units | 1,552 | 100.0% |
Occupancy by Ownership by Household Size in Jasper
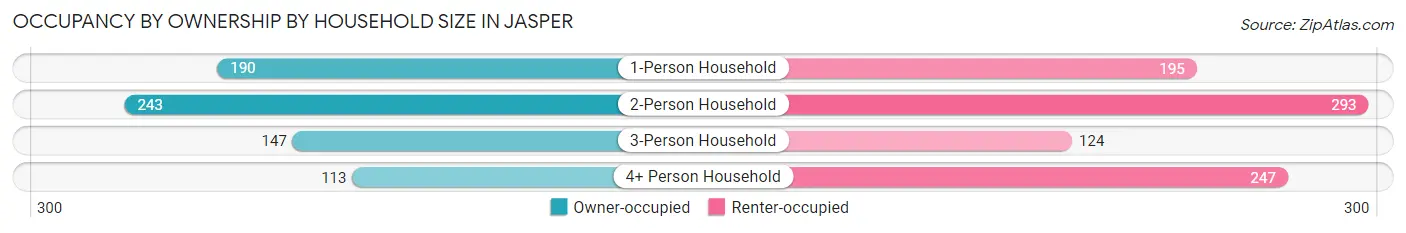
| Household Size | Owner-occupied | Renter-occupied |
| 1-Person Household | 190 (49.3%) | 195 (50.6%) |
| 2-Person Household | 243 (45.3%) | 293 (54.7%) |
| 3-Person Household | 147 (54.2%) | 124 (45.8%) |
| 4+ Person Household | 113 (31.4%) | 247 (68.6%) |
| Total Housing Units | 693 (44.7%) | 859 (55.3%) |
Occupancy by Educational Attainment in Jasper
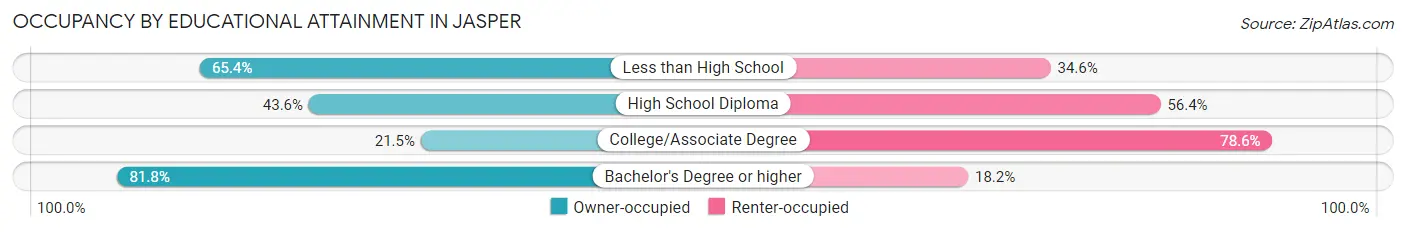
| Household Size | Owner-occupied | Renter-occupied |
| Less than High School | 140 (65.4%) | 74 (34.6%) |
| High School Diploma | 230 (43.6%) | 297 (56.4%) |
| College/Associate Degree | 121 (21.4%) | 443 (78.5%) |
| Bachelor's Degree or higher | 202 (81.8%) | 45 (18.2%) |
Occupancy by Age of Householder in Jasper
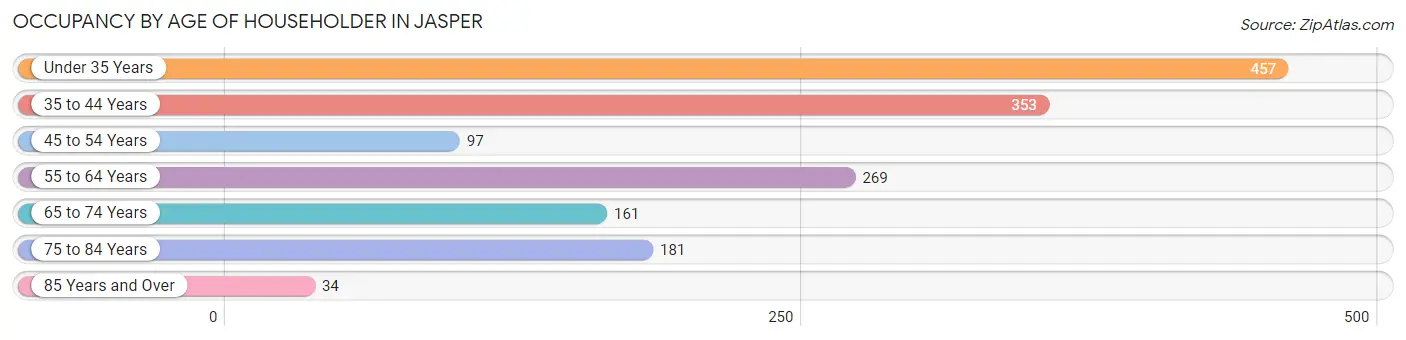
| Age Bracket | # Households | % Households |
| Under 35 Years | 457 | 29.4% |
| 35 to 44 Years | 353 | 22.7% |
| 45 to 54 Years | 97 | 6.2% |
| 55 to 64 Years | 269 | 17.3% |
| 65 to 74 Years | 161 | 10.4% |
| 75 to 84 Years | 181 | 11.7% |
| 85 Years and Over | 34 | 2.2% |
| Total | 1,552 | 100.0% |
Housing Finances in Jasper
Median Income by Occupancy in Jasper
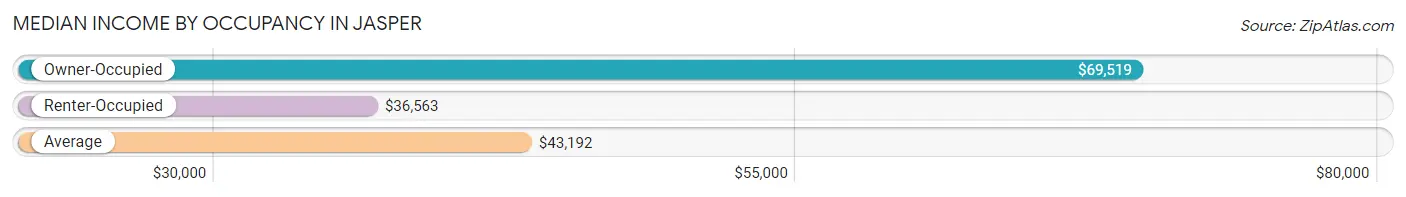
| Occupancy Type | # Households | Median Income |
| Owner-Occupied | 693 (44.7%) | $69,519 |
| Renter-Occupied | 859 (55.3%) | $36,563 |
| Average | 1,552 (100.0%) | $43,192 |
Occupancy by Householder Income Bracket in Jasper
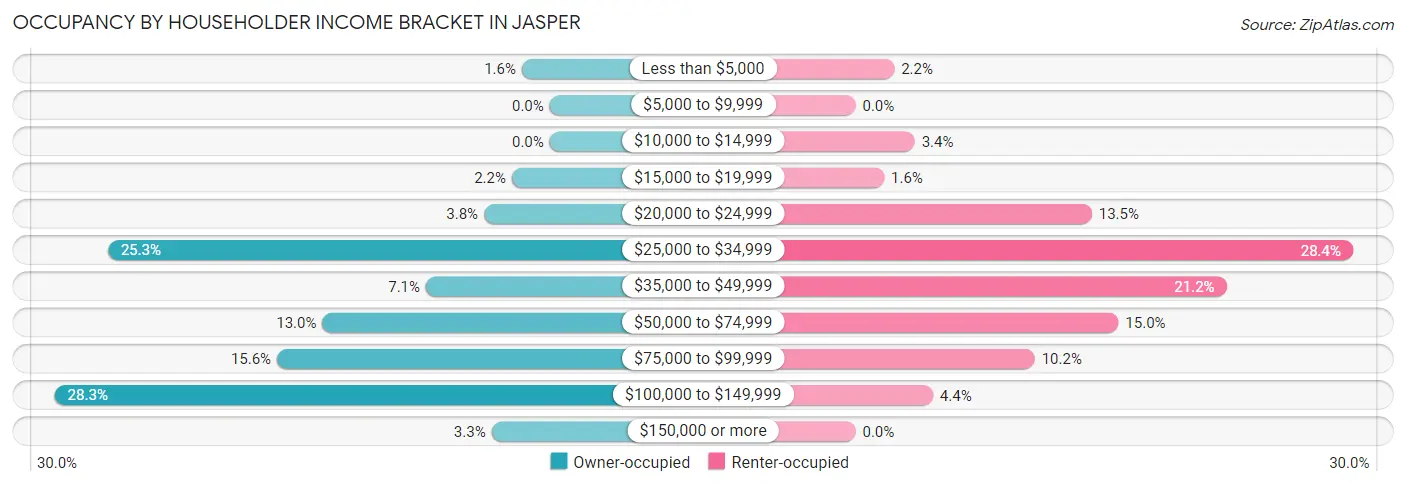
| Income Bracket | Owner-occupied | Renter-occupied |
| Less than $5,000 | 11 (1.6%) | 19 (2.2%) |
| $5,000 to $9,999 | 0 (0.0%) | 0 (0.0%) |
| $10,000 to $14,999 | 0 (0.0%) | 29 (3.4%) |
| $15,000 to $19,999 | 15 (2.2%) | 14 (1.6%) |
| $20,000 to $24,999 | 26 (3.7%) | 116 (13.5%) |
| $25,000 to $34,999 | 175 (25.3%) | 244 (28.4%) |
| $35,000 to $49,999 | 49 (7.1%) | 182 (21.2%) |
| $50,000 to $74,999 | 90 (13.0%) | 129 (15.0%) |
| $75,000 to $99,999 | 108 (15.6%) | 88 (10.2%) |
| $100,000 to $149,999 | 196 (28.3%) | 38 (4.4%) |
| $150,000 or more | 23 (3.3%) | 0 (0.0%) |
| Total | 693 (100.0%) | 859 (100.0%) |
Monthly Housing Cost Tiers in Jasper
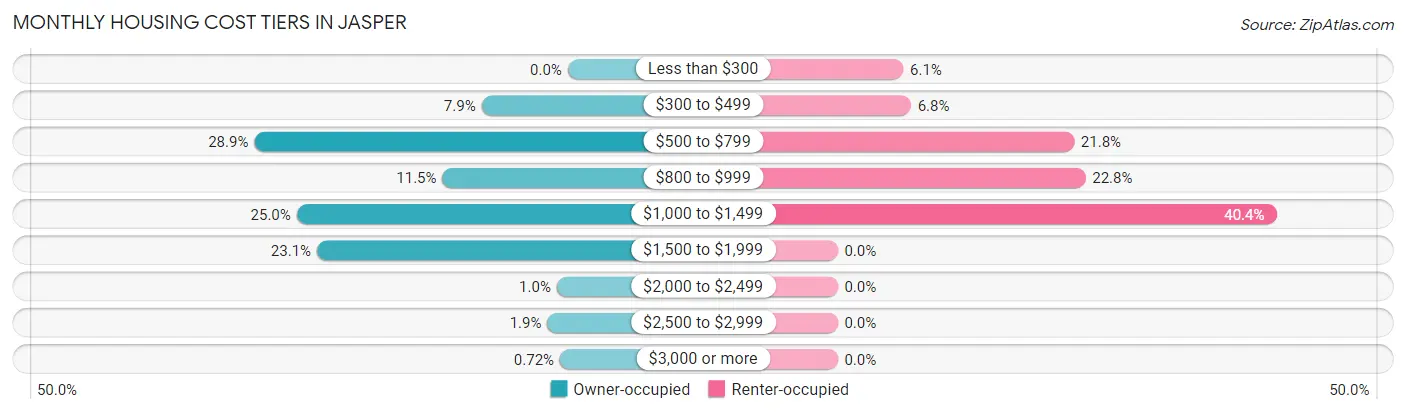
| Monthly Cost | Owner-occupied | Renter-occupied |
| Less than $300 | 0 (0.0%) | 52 (6.0%) |
| $300 to $499 | 55 (7.9%) | 58 (6.8%) |
| $500 to $799 | 200 (28.9%) | 187 (21.8%) |
| $800 to $999 | 80 (11.5%) | 196 (22.8%) |
| $1,000 to $1,499 | 173 (25.0%) | 347 (40.4%) |
| $1,500 to $1,999 | 160 (23.1%) | 0 (0.0%) |
| $2,000 to $2,499 | 7 (1.0%) | 0 (0.0%) |
| $2,500 to $2,999 | 13 (1.9%) | 0 (0.0%) |
| $3,000 or more | 5 (0.7%) | 0 (0.0%) |
| Total | 693 (100.0%) | 859 (100.0%) |
Physical Housing Characteristics in Jasper
Housing Structures in Jasper
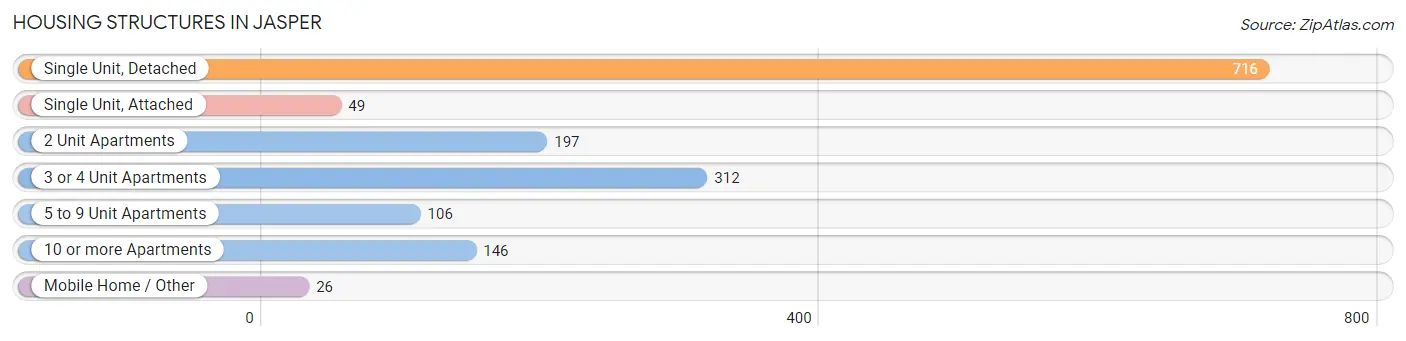
| Structure Type | # Housing Units | % Housing Units |
| Single Unit, Detached | 716 | 46.1% |
| Single Unit, Attached | 49 | 3.2% |
| 2 Unit Apartments | 197 | 12.7% |
| 3 or 4 Unit Apartments | 312 | 20.1% |
| 5 to 9 Unit Apartments | 106 | 6.8% |
| 10 or more Apartments | 146 | 9.4% |
| Mobile Home / Other | 26 | 1.7% |
| Total | 1,552 | 100.0% |
Housing Structures by Occupancy in Jasper
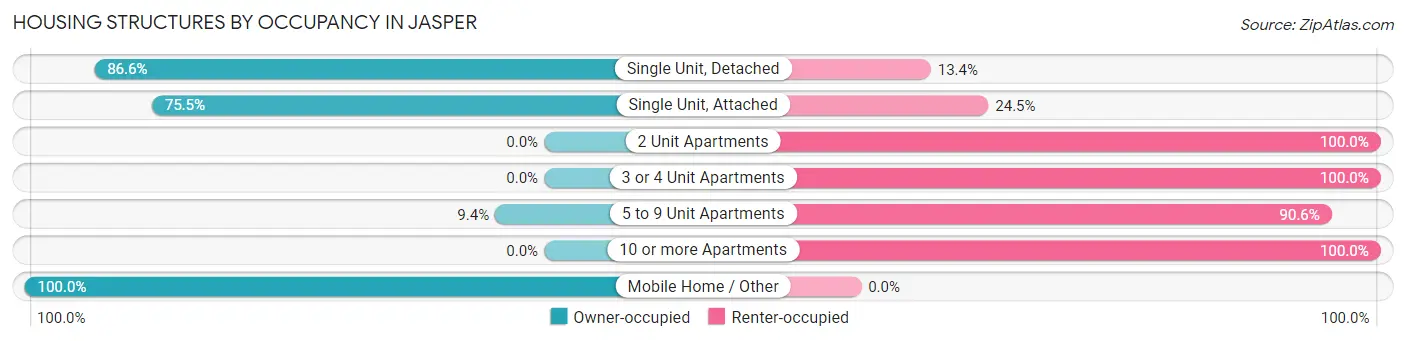
| Structure Type | Owner-occupied | Renter-occupied |
| Single Unit, Detached | 620 (86.6%) | 96 (13.4%) |
| Single Unit, Attached | 37 (75.5%) | 12 (24.5%) |
| 2 Unit Apartments | 0 (0.0%) | 197 (100.0%) |
| 3 or 4 Unit Apartments | 0 (0.0%) | 312 (100.0%) |
| 5 to 9 Unit Apartments | 10 (9.4%) | 96 (90.6%) |
| 10 or more Apartments | 0 (0.0%) | 146 (100.0%) |
| Mobile Home / Other | 26 (100.0%) | 0 (0.0%) |
| Total | 693 (44.7%) | 859 (55.3%) |
Housing Structures by Number of Rooms in Jasper
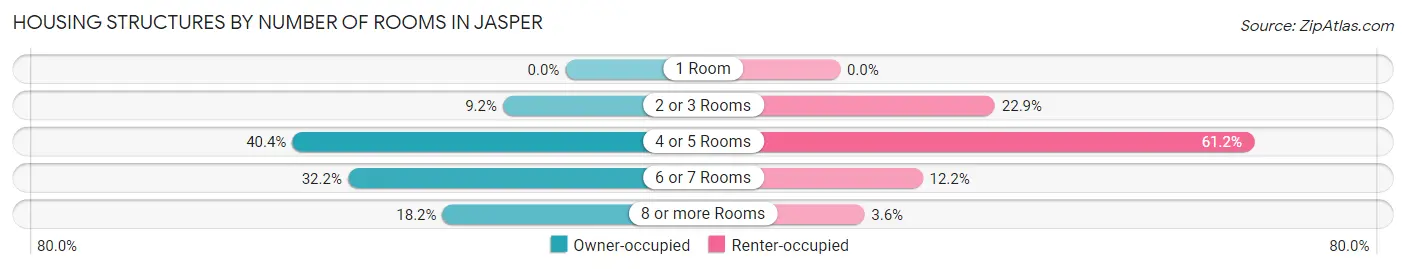
| Number of Rooms | Owner-occupied | Renter-occupied |
| 1 Room | 0 (0.0%) | 0 (0.0%) |
| 2 or 3 Rooms | 64 (9.2%) | 197 (22.9%) |
| 4 or 5 Rooms | 280 (40.4%) | 526 (61.2%) |
| 6 or 7 Rooms | 223 (32.2%) | 105 (12.2%) |
| 8 or more Rooms | 126 (18.2%) | 31 (3.6%) |
| Total | 693 (100.0%) | 859 (100.0%) |
Housing Structure by Heating Type in Jasper
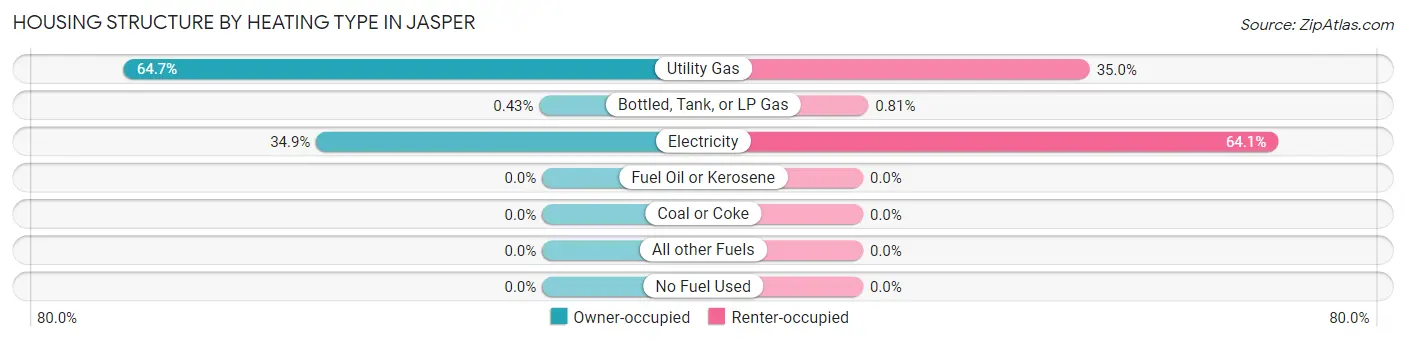
| Heating Type | Owner-occupied | Renter-occupied |
| Utility Gas | 448 (64.6%) | 301 (35.0%) |
| Bottled, Tank, or LP Gas | 3 (0.4%) | 7 (0.8%) |
| Electricity | 242 (34.9%) | 551 (64.1%) |
| Fuel Oil or Kerosene | 0 (0.0%) | 0 (0.0%) |
| Coal or Coke | 0 (0.0%) | 0 (0.0%) |
| All other Fuels | 0 (0.0%) | 0 (0.0%) |
| No Fuel Used | 0 (0.0%) | 0 (0.0%) |
| Total | 693 (100.0%) | 859 (100.0%) |
Household Vehicle Usage in Jasper
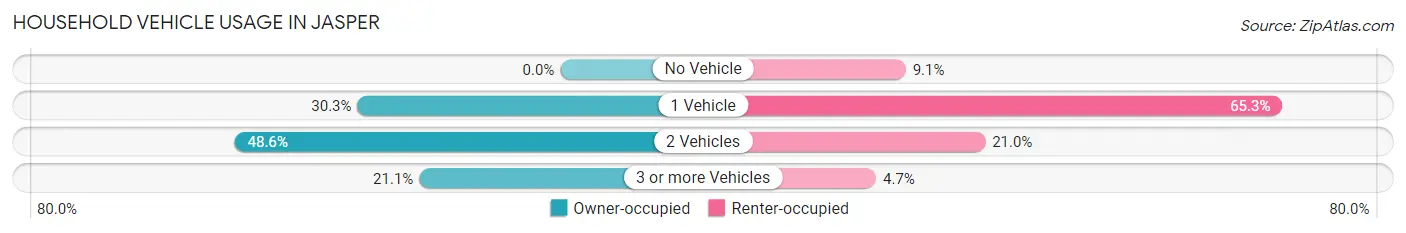
| Vehicles per Household | Owner-occupied | Renter-occupied |
| No Vehicle | 0 (0.0%) | 78 (9.1%) |
| 1 Vehicle | 210 (30.3%) | 561 (65.3%) |
| 2 Vehicles | 337 (48.6%) | 180 (20.9%) |
| 3 or more Vehicles | 146 (21.1%) | 40 (4.7%) |
| Total | 693 (100.0%) | 859 (100.0%) |
Real Estate & Mortgages in Jasper
Real Estate and Mortgage Overview in Jasper
| Characteristic | Without Mortgage | With Mortgage |
| Housing Units | 246 | 447 |
| Median Property Value | $341,700 | $207,600 |
| Median Household Income | - | - |
| Monthly Housing Costs | $595 | $5 |
| Real Estate Taxes | $2,675 | $16 |
Property Value by Mortgage Status in Jasper
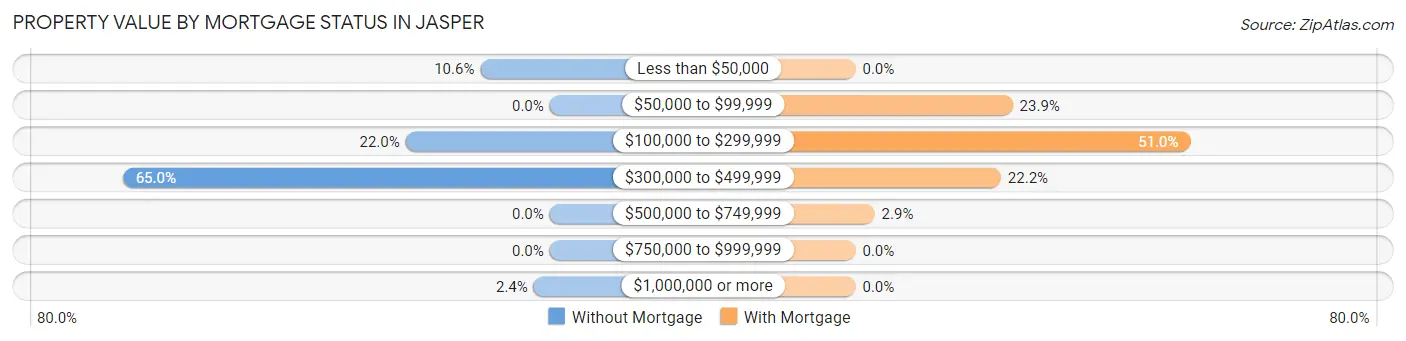
| Property Value | Without Mortgage | With Mortgage |
| Less than $50,000 | 26 (10.6%) | 0 (0.0%) |
| $50,000 to $99,999 | 0 (0.0%) | 107 (23.9%) |
| $100,000 to $299,999 | 54 (22.0%) | 228 (51.0%) |
| $300,000 to $499,999 | 160 (65.0%) | 99 (22.2%) |
| $500,000 to $749,999 | 0 (0.0%) | 13 (2.9%) |
| $750,000 to $999,999 | 0 (0.0%) | 0 (0.0%) |
| $1,000,000 or more | 6 (2.4%) | 0 (0.0%) |
| Total | 246 (100.0%) | 447 (100.0%) |
Household Income by Mortgage Status in Jasper
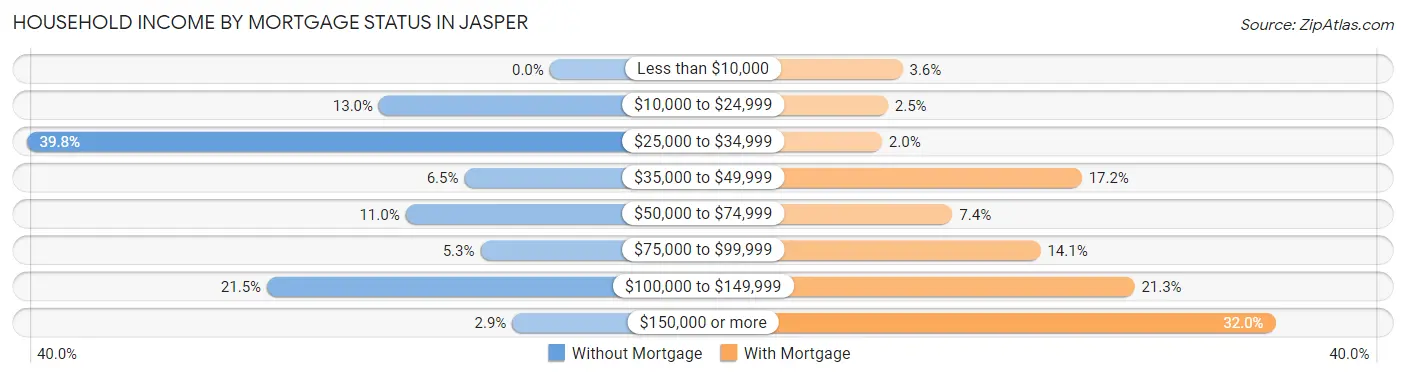
| Household Income | Without Mortgage | With Mortgage |
| Less than $10,000 | 0 (0.0%) | 16 (3.6%) |
| $10,000 to $24,999 | 32 (13.0%) | 11 (2.5%) |
| $25,000 to $34,999 | 98 (39.8%) | 9 (2.0%) |
| $35,000 to $49,999 | 16 (6.5%) | 77 (17.2%) |
| $50,000 to $74,999 | 27 (11.0%) | 33 (7.4%) |
| $75,000 to $99,999 | 13 (5.3%) | 63 (14.1%) |
| $100,000 to $149,999 | 53 (21.5%) | 95 (21.2%) |
| $150,000 or more | 7 (2.9%) | 143 (32.0%) |
| Total | 246 (100.0%) | 447 (100.0%) |
Property Value to Household Income Ratio in Jasper
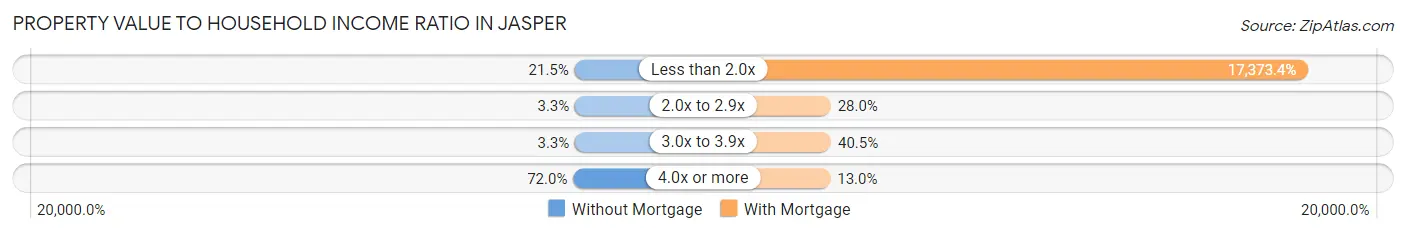
| Value-to-Income Ratio | Without Mortgage | With Mortgage |
| Less than 2.0x | 53 (21.5%) | 77,659 (17,373.4%) |
| 2.0x to 2.9x | 8 (3.3%) | 125 (28.0%) |
| 3.0x to 3.9x | 8 (3.3%) | 181 (40.5%) |
| 4.0x or more | 177 (72.0%) | 58 (13.0%) |
| Total | 246 (100.0%) | 447 (100.0%) |
Real Estate Taxes by Mortgage Status in Jasper
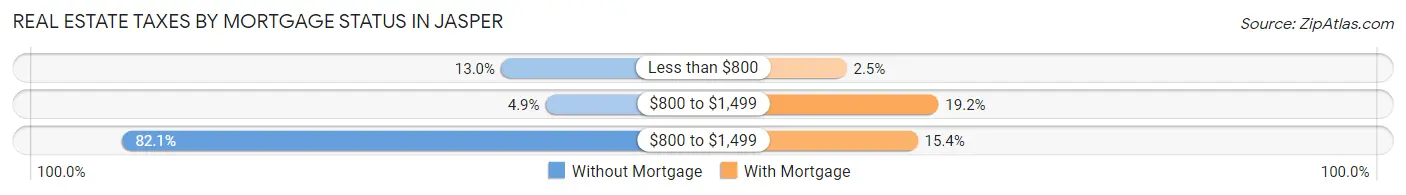
| Property Taxes | Without Mortgage | With Mortgage |
| Less than $800 | 32 (13.0%) | 11 (2.5%) |
| $800 to $1,499 | 12 (4.9%) | 86 (19.2%) |
| $800 to $1,499 | 202 (82.1%) | 69 (15.4%) |
| Total | 246 (100.0%) | 447 (100.0%) |
Health & Disability in Jasper
Health Insurance Coverage by Age in Jasper
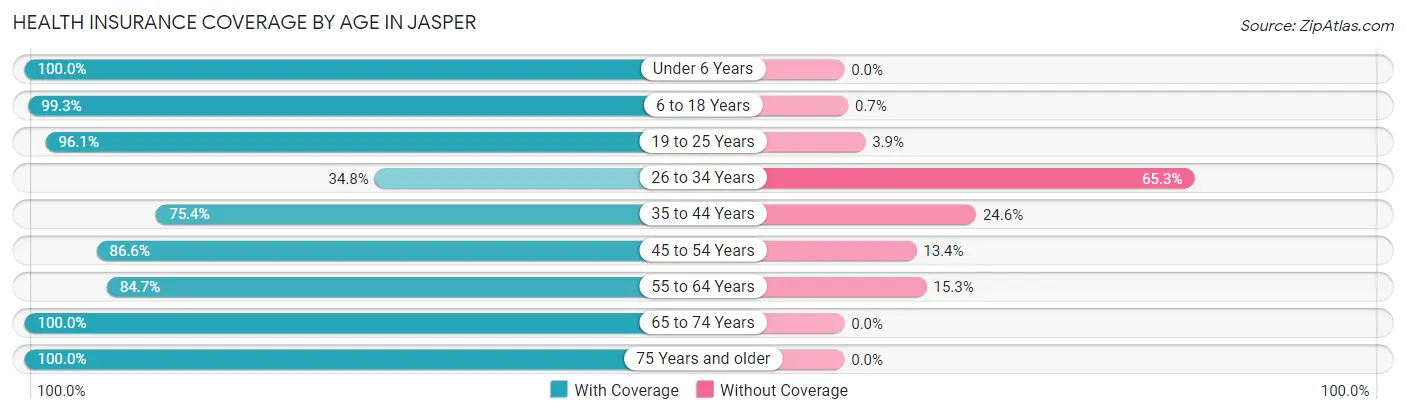
| Age Bracket | With Coverage | Without Coverage |
| Under 6 Years | 497 (100.0%) | 0 (0.0%) |
| 6 to 18 Years | 711 (99.3%) | 5 (0.7%) |
| 19 to 25 Years | 345 (96.1%) | 14 (3.9%) |
| 26 to 34 Years | 245 (34.7%) | 460 (65.2%) |
| 35 to 44 Years | 384 (75.4%) | 125 (24.6%) |
| 45 to 54 Years | 232 (86.6%) | 36 (13.4%) |
| 55 to 64 Years | 414 (84.7%) | 75 (15.3%) |
| 65 to 74 Years | 271 (100.0%) | 0 (0.0%) |
| 75 Years and older | 289 (100.0%) | 0 (0.0%) |
| Total | 3,388 (82.6%) | 715 (17.4%) |
Health Insurance Coverage by Citizenship Status in Jasper
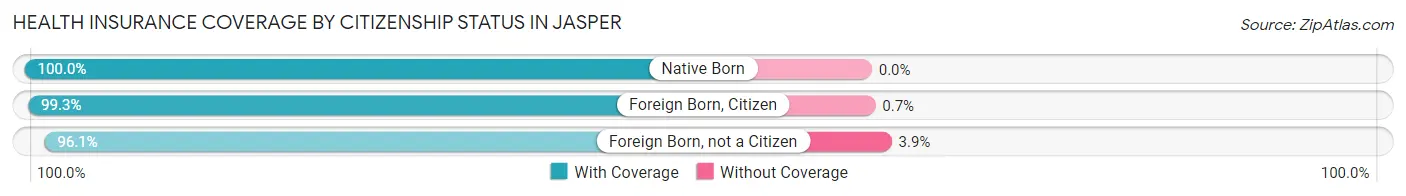
| Citizenship Status | With Coverage | Without Coverage |
| Native Born | 497 (100.0%) | 0 (0.0%) |
| Foreign Born, Citizen | 711 (99.3%) | 5 (0.7%) |
| Foreign Born, not a Citizen | 345 (96.1%) | 14 (3.9%) |
Health Insurance Coverage by Household Income in Jasper
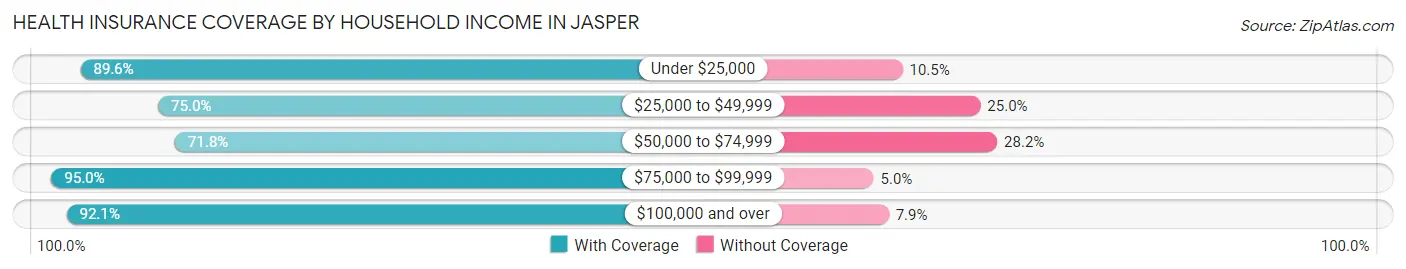
| Household Income | With Coverage | Without Coverage |
| Under $25,000 | 360 (89.5%) | 42 (10.4%) |
| $25,000 to $49,999 | 1,264 (75.0%) | 422 (25.0%) |
| $50,000 to $74,999 | 408 (71.8%) | 160 (28.2%) |
| $75,000 to $99,999 | 662 (95.0%) | 35 (5.0%) |
| $100,000 and over | 633 (92.1%) | 54 (7.9%) |
Public vs Private Health Insurance Coverage by Age in Jasper
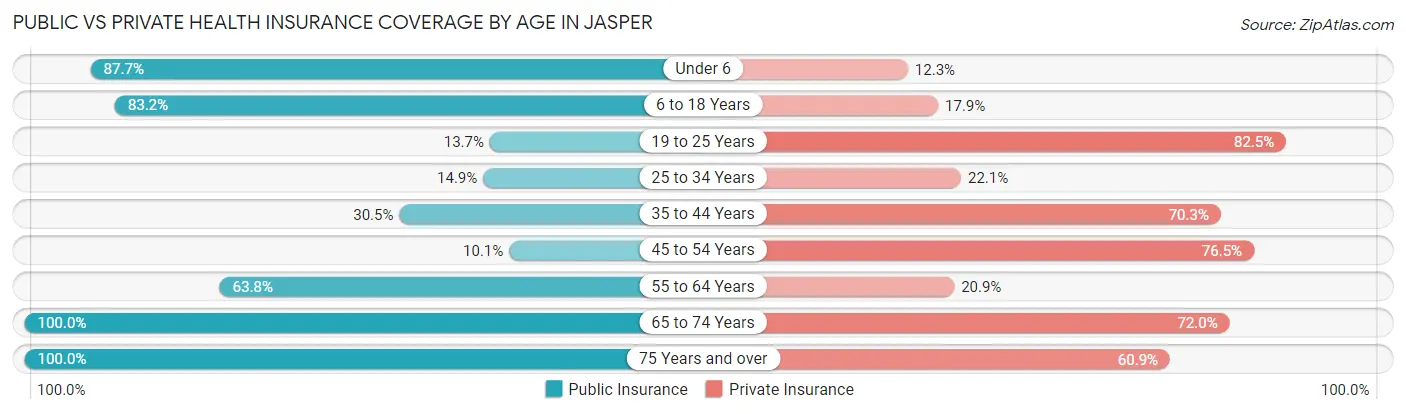
| Age Bracket | Public Insurance | Private Insurance |
| Under 6 | 436 (87.7%) | 61 (12.3%) |
| 6 to 18 Years | 596 (83.2%) | 128 (17.9%) |
| 19 to 25 Years | 49 (13.7%) | 296 (82.5%) |
| 25 to 34 Years | 105 (14.9%) | 156 (22.1%) |
| 35 to 44 Years | 155 (30.4%) | 358 (70.3%) |
| 45 to 54 Years | 27 (10.1%) | 205 (76.5%) |
| 55 to 64 Years | 312 (63.8%) | 102 (20.9%) |
| 65 to 74 Years | 271 (100.0%) | 195 (72.0%) |
| 75 Years and over | 289 (100.0%) | 176 (60.9%) |
| Total | 2,240 (54.6%) | 1,677 (40.9%) |
Disability Status by Sex by Age in Jasper
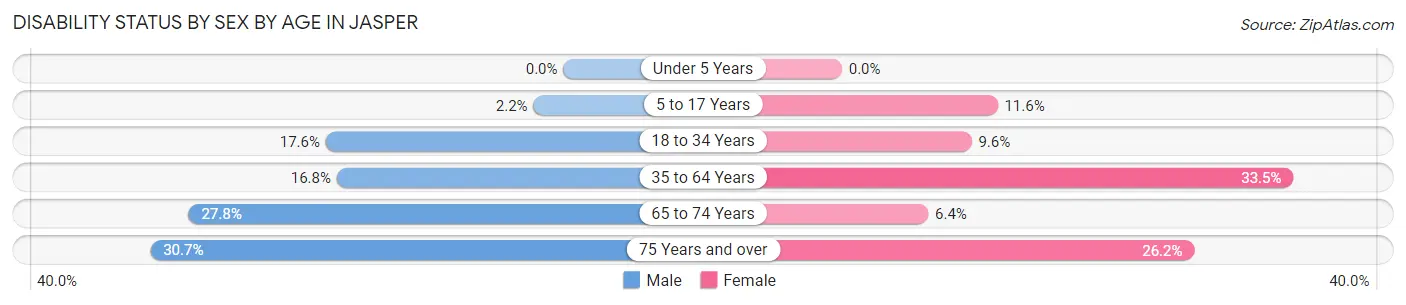
| Age Bracket | Male | Female |
| Under 5 Years | 0 (0.0%) | 0 (0.0%) |
| 5 to 17 Years | 8 (2.2%) | 46 (11.6%) |
| 18 to 34 Years | 100 (17.6%) | 52 (9.6%) |
| 35 to 64 Years | 92 (16.8%) | 241 (33.5%) |
| 65 to 74 Years | 32 (27.8%) | 10 (6.4%) |
| 75 Years and over | 23 (30.7%) | 56 (26.2%) |
Disability Class by Sex by Age in Jasper
Disability Class: Hearing Difficulty
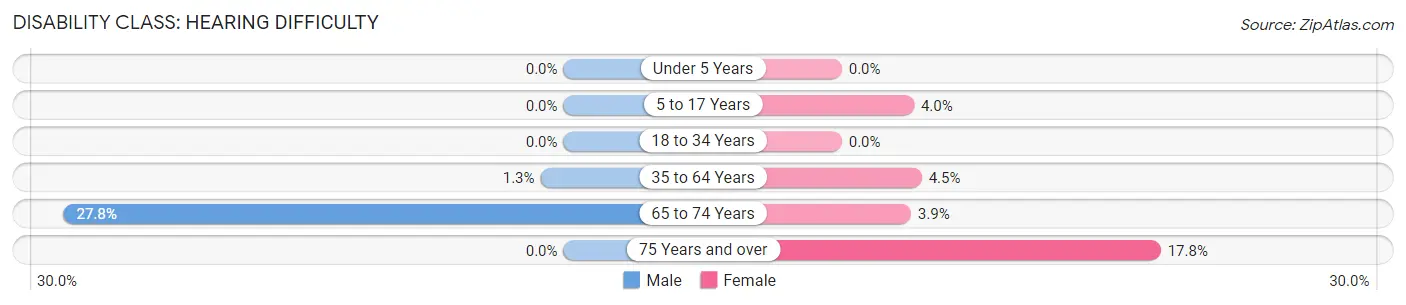
| Age Bracket | Male | Female |
| Under 5 Years | 0 (0.0%) | 0 (0.0%) |
| 5 to 17 Years | 0 (0.0%) | 16 (4.0%) |
| 18 to 34 Years | 0 (0.0%) | 0 (0.0%) |
| 35 to 64 Years | 7 (1.3%) | 32 (4.4%) |
| 65 to 74 Years | 32 (27.8%) | 6 (3.8%) |
| 75 Years and over | 0 (0.0%) | 38 (17.8%) |
Disability Class: Vision Difficulty
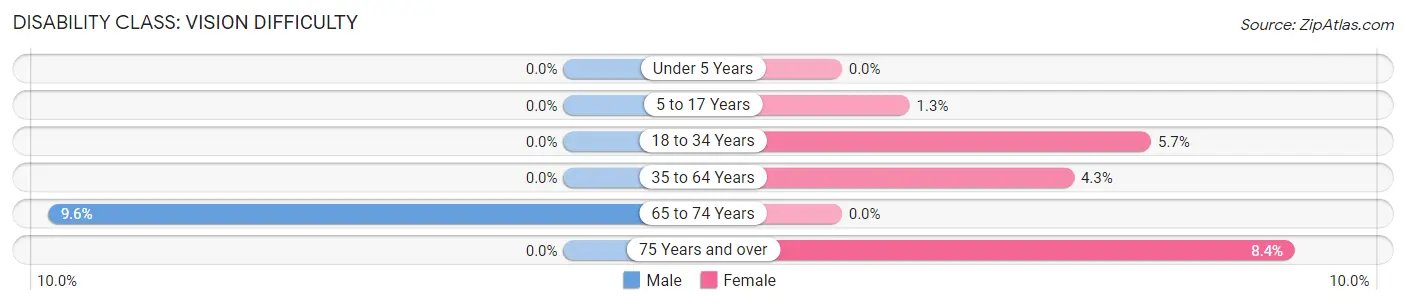
| Age Bracket | Male | Female |
| Under 5 Years | 0 (0.0%) | 0 (0.0%) |
| 5 to 17 Years | 0 (0.0%) | 5 (1.3%) |
| 18 to 34 Years | 0 (0.0%) | 31 (5.7%) |
| 35 to 64 Years | 0 (0.0%) | 31 (4.3%) |
| 65 to 74 Years | 11 (9.6%) | 0 (0.0%) |
| 75 Years and over | 0 (0.0%) | 18 (8.4%) |
Disability Class: Cognitive Difficulty
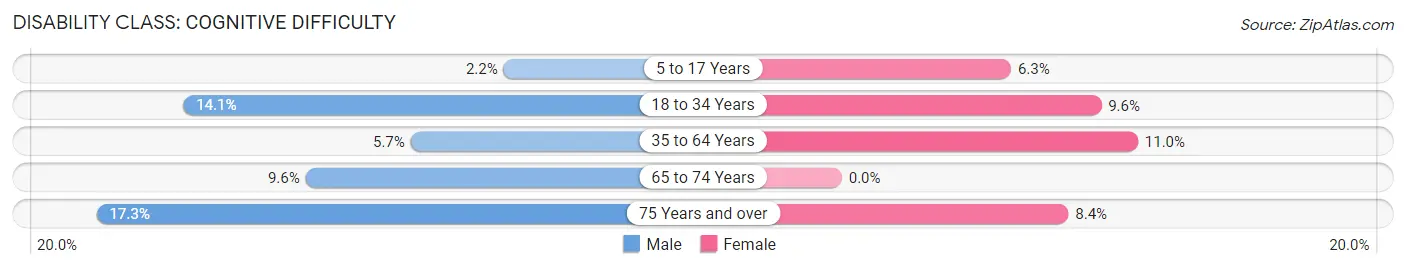
| Age Bracket | Male | Female |
| 5 to 17 Years | 8 (2.2%) | 25 (6.3%) |
| 18 to 34 Years | 80 (14.1%) | 52 (9.6%) |
| 35 to 64 Years | 31 (5.7%) | 79 (11.0%) |
| 65 to 74 Years | 11 (9.6%) | 0 (0.0%) |
| 75 Years and over | 13 (17.3%) | 18 (8.4%) |
Disability Class: Ambulatory Difficulty
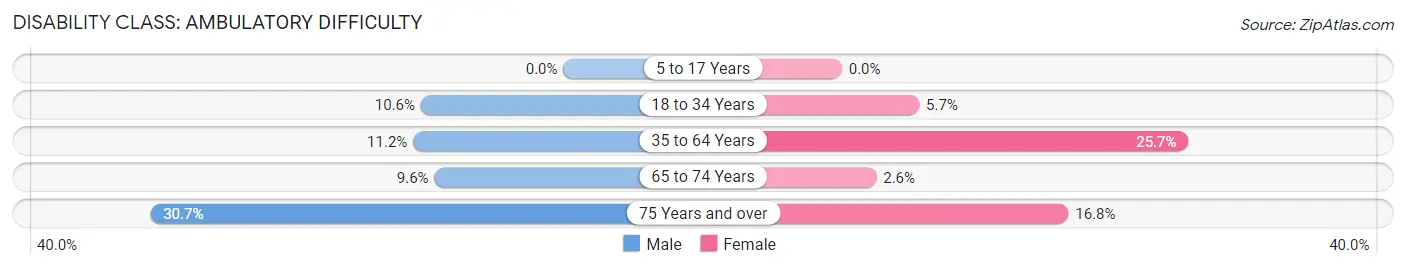
| Age Bracket | Male | Female |
| 5 to 17 Years | 0 (0.0%) | 0 (0.0%) |
| 18 to 34 Years | 60 (10.6%) | 31 (5.7%) |
| 35 to 64 Years | 61 (11.2%) | 185 (25.7%) |
| 65 to 74 Years | 11 (9.6%) | 4 (2.6%) |
| 75 Years and over | 23 (30.7%) | 36 (16.8%) |
Disability Class: Self-Care Difficulty
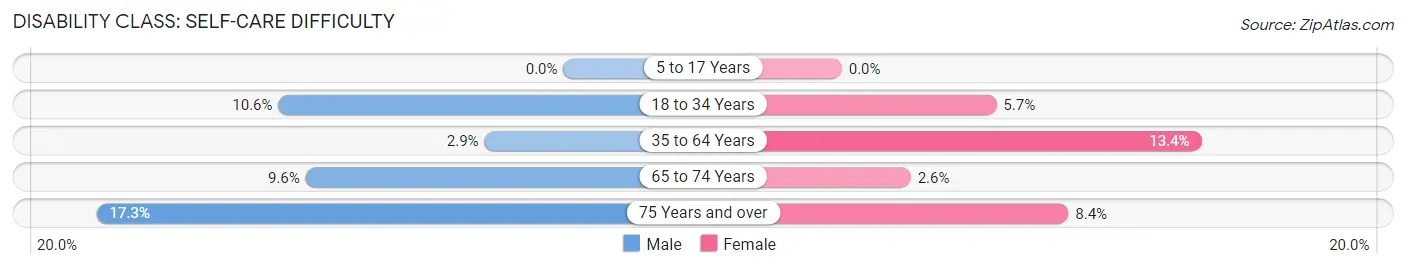
| Age Bracket | Male | Female |
| 5 to 17 Years | 0 (0.0%) | 0 (0.0%) |
| 18 to 34 Years | 60 (10.6%) | 31 (5.7%) |
| 35 to 64 Years | 16 (2.9%) | 96 (13.4%) |
| 65 to 74 Years | 11 (9.6%) | 4 (2.6%) |
| 75 Years and over | 13 (17.3%) | 18 (8.4%) |
Technology Access in Jasper
Computing Device Access in Jasper
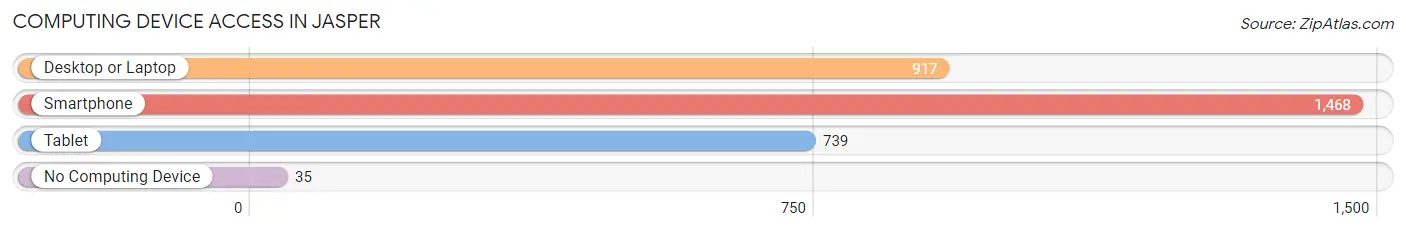
| Device Type | # Households | % Households |
| Desktop or Laptop | 917 | 59.1% |
| Smartphone | 1,468 | 94.6% |
| Tablet | 739 | 47.6% |
| No Computing Device | 35 | 2.3% |
| Total | 1,552 | 100.0% |
Internet Access in Jasper
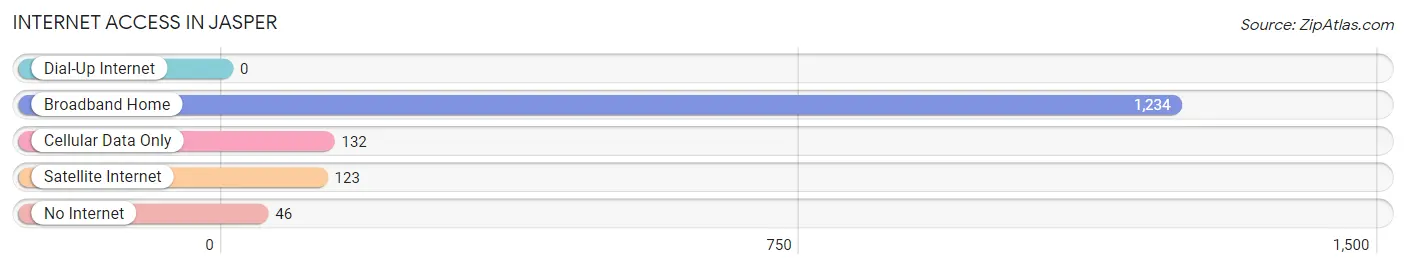
| Internet Type | # Households | % Households |
| Dial-Up Internet | 0 | 0.0% |
| Broadband Home | 1,234 | 79.5% |
| Cellular Data Only | 132 | 8.5% |
| Satellite Internet | 123 | 7.9% |
| No Internet | 46 | 3.0% |
| Total | 1,552 | 100.0% |
Jasper Summary
Jasper is a city located in Pickens County, Georgia, United States. The population was 3,684 at the 2010 census. It is the county seat of Pickens County. Jasper is part of the Atlanta metropolitan area.
Geography
Jasper is located at 34°27'17" North, 84°25'17" West (34.454722, -84.421389). According to the United States Census Bureau, the city has a total area of 4.2 square miles (10.8 km2), all land.
History
Jasper was founded in 1853 as seat of the newly formed Pickens County. The city was named after William Jasper, a Revolutionary War hero. The city was incorporated in 1857.
In the late 19th century, Jasper was a center of the marble industry. The Georgia Marble Company was founded in Jasper in 1884 and operated until the 1930s.
Economy
Jasper is home to several businesses, including a manufacturing plant for the carpet company Shaw Industries, a distribution center for the home improvement retailer Lowe's, and a manufacturing plant for the automotive parts supplier Tenneco.
Demographics
As of the census of 2010, there were 3,684 people, 1,521 households, and 990 families residing in the city. The population density was 877.6 people per square mile (339.2/km2). There were 1,717 housing units at an average density of 409.5 per square mile (158.2/km2). The racial makeup of the city was 79.2% White, 15.2% African American, 0.3% Native American, 0.7% Asian, 0.1% Pacific Islander, 2.7% from other races, and 1.8% from two or more races. Hispanic or Latino of any race were 5.2% of the population.
There were 1,521 households, out of which 28.2% had children under the age of 18 living with them, 44.2% were married couples living together, 16.2% had a female householder with no husband present, and 34.7% were non-families. 29.7% of all households were made up of individuals, and 11.7% had someone living alone who was 65 years of age or older. The average household size was 2.41 and the average family size was 2.97.
In the city, the population was spread out, with 24.2% under the age of 18, 8.7% from 18 to 24, 28.2% from 25 to 44, 23.2% from 45 to 64, and 15.7% who were 65 years of age or older. The median age was 37 years. For every 100 females, there were 91.2 males. For every 100 females age 18 and over, there were 87.3 males.
The median income for a household in the city was $33,958, and the median income for a family was $41,944. Males had a median income of $30,917 versus $22,917 for females. The per capita income for the city was $17,945. About 11.2% of families and 14.2% of the population were below the poverty line, including 19.2% of those under age 18 and 11.2% of those age 65 or over.
Common Questions
What is Per Capita Income in Jasper?
Per Capita income in Jasper is $29,023.
What is the Median Family Income in Jasper?
Median Family Income in Jasper is $43,301.
What is the Median Household income in Jasper?
Median Household Income in Jasper is $43,192.
What is Income or Wage Gap in Jasper?
Income or Wage Gap in Jasper is 6.2%.
Women in Jasper earn 93.8 cents for every dollar earned by a man.
What is Inequality or Gini Index in Jasper?
Inequality or Gini Index in Jasper is 0.50.
What is the Total Population of Jasper?
Total Population of Jasper is 4,177.
What is the Total Male Population of Jasper?
Total Male Population of Jasper is 2,034.
What is the Total Female Population of Jasper?
Total Female Population of Jasper is 2,143.
What is the Ratio of Males per 100 Females in Jasper?
There are 94.91 Males per 100 Females in Jasper.
What is the Ratio of Females per 100 Males in Jasper?
There are 105.36 Females per 100 Males in Jasper.
What is the Median Population Age in Jasper?
Median Population Age in Jasper is 28.5 Years.
What is the Average Family Size in Jasper
Average Family Size in Jasper is 3.1 People.
What is the Average Household Size in Jasper
Average Household Size in Jasper is 2.6 People.
How Large is the Labor Force in Jasper?
There are 1,592 People in the Labor Forcein in Jasper.
What is the Percentage of People in the Labor Force in Jasper?
52.0% of People are in the Labor Force in Jasper.
What is the Unemployment Rate in Jasper?
Unemployment Rate in Jasper is 1.1%.